Keyser 1980 Auftreten und Konstanz von Poren und Borsten auf der Schale von Podocopa
Upload
khangminh22Category
view
0download
0
Aus dem Institut für Tierernährung Rainer Schubert Gerhard Flachowsky Gerhard Jahreis Roland Bitsch (Eds.) Vitamine und Zusatzstoffe in der Ernährung von Mensch und Tier : 9. Symposium 24. und 25. September 2003 Jena/Thüringen Manuskript, zu finden in www.fal.de Braunschweig Bundesforschungsanstalt für Landwirtschaft (FAL) 2003

Vitamine und Zusatzstoffe in der Ernährung von
Mensch und Tier
9. Symposium 24. und 25. September 2003
Jena/Thüringen
Herausgeber:
Rainer Schubert Gerhard Flachowsky
Gerhard Jahreis Roland Bitsch
________________________________________________________________
Friedrich-Schiller-Universität Jena Biologisch-Pharmazeutische Fakultät Institut für Ernährungswissenschaften
und
Bundesforschungsanstalt für Landwirtschaft Institut für Tierernährung Braunschweig

Bibliografische Information der Deutschen Bibliothek Die Deutsche Bibliothek verzeichnet diese Publikation in der Deutschen Nationalbibliografie; detaillierte bibliografische Daten sind im Internet über http://dnb.ddb.de abrufbar. 2003 ISBN 3-933140-85-4 Technische Bearbeitung: Heike Brandt Anschrift: Friedrich-Schiller-Universität Biologisch-Pharmazeutische Fakultät Institut für Ernährungswissenschaften Lehrstuhl für Ernährungsphysiologie Dornburger Str. 24, D-07743 Jena Tel.: 03641 949610 Fax: 03641 949612 e-Mail: [email protected] http://www.uni-jena.de/biologie/ieu/ew/ Gesamtherstellung: Bundesforschungsanstalt für Landwirtschaft (FAL) Informations- und Datenzentrum (IDZ) Bundesallee 50 D-38116 Braunschweig

Eröffnung des 9. Symposiums durch den Präsidenten der Bundesforschungsanstalt für Landwirtschaft (FAL), Braunschweig Prof. Dr. Gerhard Flachowsky Sehr geehrte Damen und Herren, Im Auftrag des Institutes für Ernährungswissenschaften der Friedrich-Schiller-Universität Jena und des Institutes für Tierernährung der Bundesforschungsanstalt für Landwirtschaft (FAL) Braunschweig möchte ich Sie zum 9. Symposium über „Vitamine und Zusatzstoffe in der Ernährung von Mensch und Tier“ ganz herzlich begrüßen. Obwohl das 9. Symposium formal kein Jubiläum erwarten lässt, können wir in diesem Jahr zwei kleine Jubiläen begehen: 1) Vor 20 Jahren fand das erste Symposium in dieser Reihe statt (Hennig 1983) 2) Vor 10 Jahren fand erstmals die Veranstaltung in Jena statt (Flachowsky und Schubert 1993). In den ersten Jahren wurde die Veranstaltung alle vier Jahre organisiert (1983: Leipzig; 1987: Reinhardsbrunn, 1991: Stadtroda), danach wurde die Frequenz auf zwei Jahre erhöht. Daraus resultiert, dass nach 20 Jahren erst neun Symposien durchgeführt wurden. Was waren die Motive für die Macher (Arno Hennig, Rainer Schubert, Friedrich Schöne) der Veranstaltung? Nachfolgend sind einige Überlegungen aufgeführt, die zur Etablierung des Symposiums führten:
Spezialgebiet der Ernährungswissenschaften, meist etwas „stiefmütterlich“ auf wissen-schaftlichen Tagungen behandelt
Podium des Austausches zwischen Wissenschaft und Praxis (Human- und Tierernäh-rung, Human- und Tiermedizin, Lebens- und Futtermittelindustrie u.a.)
Gemeinsames Forum von Human- und Tierernährern Podium für Nachwuchswissenschaftler Führende nationale und internationale Wissenschaftler nach Jena holen.
Abgesehen von der letzten Zeile dieser Auflistung haben alle anderen Aspekte auch heute noch Gültigkeit, wenn es um die Motive für das Symposium geht. Sowohl die Inhalte als auch die Proportionen zwischen den überwiegend der Human- bzw. der Tierernährung gewidmeten Beiträge haben sich seit den Anfängen der Symposiumsreihe erheblich verändert. In den letzten Jahren hat sich die Anzahl der angenommenen Beiträge auf ≈ 100 eingepegelt, die der Human- bzw. Tierernährung gewidmeten Beiträge halten sich etwa die Waage (Tab. 1).

Tabelle 1: Übersicht zu den bisherigen Symposien “Vitamine und Zusatzstoffe”
Nr.
Jahr
Ort
AngemeldeteBeiträge
insgesamt
Beiträge zu Themen
Allgemein Mensch Tier 1 1983 Leipzig 31 9 11 11 2 1987 Reinhardsbrunn 60 9 3 48 3 1991 Stadtroda 84 5 6 73 4 1993 Jena 78 15 11 52 5 1995 Jena 103 16 30 57 6 1997 Jena 87 16 26 45 7 1999 Jena 108 18 45 45 8 2001 Jena 106 2 48 56 9 2003 Jena 105 12 40 53
Zu erwähnen ist auch die zunehmende Internationalisierung der Veranstaltung. In den letz-ten Jahren kamen die Referenten aus 10 bis 15 Ländern; die Teilnehmer aus 20 bis 35 Län-dern. Inhaltlich gab es auch erhebliche Verschiebungen. Während es in den Anfangsjahren der Veranstaltung vor allem um die physiologische Bedeutung von Vitaminen in der (Tier)Ernährung ging, dominieren heute Beiträge zur Bedeutung der Vitamine in der Nah-rungskette (Transfer von Futtermittel ins Lebensmittel tierischer Herkunft, Bewertung der gegenwärtigen Versorgungsempfehlungen bei Mensch und Tier sowie Auswirkungen von Hochdosierungen). Noch grundsätzlicher ist der Themenwandel auf dem Gebiet der Zusatzstoffe einzuschätzen. Während zu Beginn der Veranstaltungsreihe u.a. Antibiotika als Futterzusatzstoffe eine be-achtliche Rolle spielten, steht diese Stoffgruppe vor dem EU-weiten Einsatzverbot (voraus-sichtlich 01.01.2006) und spielt gegenwärtig in Tagungsbeiträgen lediglich eine Rolle unter Resistenz- und Umweltaspekten. Mikroorganismen, Enzyme, Kräuter, ätherische Öle und ähnliche Substanzen dominieren heute die Beiträge zu dieser Stoffgruppe. In jüngster Zeit wurde das Beitragsspektrum u.a. durch konjugierte Linolsäuren (CLA) und Spurenelemente erweitert. Es wird darüber nachzudenken sein, ob diese Themenerweite-rung fortgesetzt werden soll oder ob sich die Beiträge des Symposiums nicht auf die ur-sprüngliche Thematik – Vitamine und nichtessentielle Zusatzstoffe – wieder beschränken sollte.

Vor der Forschung auf diesen Gebieten stehen verschiedene neue Entwicklun-gen/Herausforderungen, die sich bereits beim 9. Symposium und hoffentlich in den nächsten Jahren noch stärker in den Themenanmeldungen zur Jenaer Tagung niederschlagen:
Vitamine • Sonder- sowie Langzeiteffekte hoher Dosierungen
(einschl. Langzeitwirkungen; Heseker 2003) • Indikatoren (Referenzwerte) zur Bewertung der Versorgungssituation
Zusatzstoffe • Bewertung von Zusatzstoffen aus Pflanzen (Kräuter, ätherische Öle, Extrakte u.a.;
Wenk 2003) • Bewertung von Detoxifikationsmitteln von Mykotoxinen
Allgemein • Ernährungsphysiologische Bewertung von GVO der 2. Generation mit verändertem
Gehalt an Vitaminen oder Zusatzstoffen (z.B. β-Karotin, Phytase u.a.) • Verhalten von Zusatzstoffen in der Umwelt (Boden, Grundwasser, Oberflächenwasser
u.a.) Das 9. Symposium ist nach dem bewährten Schema strukturiert:
– Übersichtsbeiträge – Kurzbeiträge – Posterpräsentation (einschl. ≈ 2 min. im Hörsaal). Insgesamt werden auf dem 9. Symposium 105 Beiträge präsentiert. Für Anregungen zu Übersichtsbeiträgen für die nächsten Symposien wären wir Ihnen dankbar. Besondere Anerkennung gilt den Organisatoren vor Ort (Mitarbeiter des Institutes für Ernäh-rungswissenschaften der Friedrich-Schiller-Universität Jena). Ihnen wünsche ich eine wissenschaftlich ertragsreiche Tagung, interessante Diskussionen und Gespräche sowie einen angenehmen Aufenthalt in Jena einschl. Gefallen am Gesell-schaftsabend. Bereits heute möchten wir Sie zum 10. Symposium am 28./29.09.2005 nach Jena einladen. Literatur Flachowsky, G. und R. Schubert (1993): Vitamine und weitere Zusatzstoffe bei Mensch und
Tier. Proc. 4. Symp., 30.09./01.10.1993 Jena, 438 S. Hennig, A. (1983): Neue Gesichtspunkte der Vitaminversorgung von Mensch und Tier. Proc.
1. Symposium, 05./0o6.12.1983, Leipzig Heseker, H. (2003): Preventive effects of vitamins and of non-nutrient plant factors. 9. Symp.
“Vitamins and Additives in Nutrition of Man and Animal, 24./25.09.2003, Jena, p. 10 (Ab-stracts)
Wenk, C. (2003): Herbs and botanicals in animal nutrition. 9. Symp. “Vitamins and Additives in Nutrition of Man and Animal, 24./25.09.2003, Jena, p. 5 (Abstracts).

9. Symposium: Vitamins and Additives in the Nutrition of Man and Animal Introduction, by Roland Bitsch, formerly chair of Human Nutrition at the FSU Jena The past 20. century can be designated as the century of vitamins. The discoveries at the
beginning of this century opened a new era of hitherto unknown , but very soon as
essentially active recognized micronutrients. Accompanying to this, knowledges and
attributions carried out - not always parallel - of the likewise vital trace elements. While,
however, the discovery period of newly effective substances of organic origin was finalized
in the middle of the last century - the discovery of vitamin B12 denoted the dead line of
vitamin discoveries - with regard to essential , i.e. vital, trace elements there is an open end
up to now. This is not at least reflected in the present obligatory DACH - Reference values.
From the first beginning and partly until to date vitamins were also regarded as prophylactic
and therapeutic remedies. Corresponding recommendations vary from applications for
general physical and intellectual fitness up to the prophylaxis against atherosclerotic diseaes
and malign tumors. The intermixture of nutritive-essential and drug-like functions has
disregarded since early times, that a priori the objectives of vitamins and drugs are different:
Drugs as therapeuticals shall evolve curative effects, predisposing so a disease. The
healthy man has no needs for them. The essential character of vitamins, on the other hand,
is based on the requirement of healthies, resulting in a life long intake. Any restrictions of the
uptake is thereby leading to a disease, i.e. the deficiency disease.
Much more frequently than the therapeutic is the prophylactic application of vitamins
recommended since longer times, which is also reflected in national and international
Reference values.
Expectances and speculations of a preventive benefit of vitamins were quite recently
disappointed. According to a recent metaanalysis , published in Lancet, no alteration of the
mortality and morbidity rate from cardiovascular or carcinoma diseases could be statistically
estimated in all prospective longitudinal cohort studies so far, which tested the healthy
effect of β-carotene and vitamin E, separately or combined. The missing effects independent
of the dosage, neither in primary nor in secondary prevention, prompted the authors even to
warn against the use of β-carotene and vitamin E supplements and the performance of
studies in future.
In similar way, the US Preventive Services Task Force concluded after a careful analysis of
all valid randomised prospective studies, that from the present available results no
recommendations can be given pro or contra supplements containing the vitamins A, C or E,

multivitamins with folic acid or combinations of antioxidants for the prevention of
cardiovascular or carcinoma diseases. Warning is given against supplements of β-carotene.
In my opinion, nearly no consideration has found up to now, that prior to the implementation
of clinical-epidemiological studies about the efficacy of vitamin supplements
pharmacokinetic or biokinetic data on the invasion, elimination, distribution and metabolic
characteristics of substances should basically be well known. This basic principle, taken for
granted and seen as a precondition of safe dosage recommendations and fixing of limits
and being so a precondition for the admittance or performance of clinical studies,
respectively, had been disregarded for vitamins up to now. To date, only sparse data are
available of some carotenoids and the vitamins C, B1 and B6.
But, nevertheless, despite more or less intense research during the last 80 - 100 years
some basic principles of the metabolism of some vitamins are still unexplained. The role of
calciferols, e. g., is by no means limited only to the healthy development of bones. Actually,
the vitamins D seem also to be involved in the insulin secretion and to represent the
"missing link" in some way for understanding the metabolic syndrome. Immunosuppressive
and carcinostatic effects were recently described this group, too. On the other hand, less
known relations until now between vitamin A and bone health and osteoporosis respectively
are discussed. Additionally, quite recently we begin to understand the specific functions of
vitamin K.
Furthermore, there are analytical problems in some fields, too. This is concerning the exact
quantification of folate active compounds and their bioavailability as well as the clear
identification of physiologically active cobalamins for man. The precise analytical
determination of biotin and pantothenic acid, e. g., arises problems, too.
Irrespective of analytical problems and epidemiological confusions, the confidence into the
benefit of supplements is unbroken. Modern dietary trends aggravate the situation, partly be
recommended by officials. Some recent surveys reveal that neither low carbohydrate nor
low fat diets are able to meet the reference values of vitamin C, folate or calcium. To what
extent a consequent adherence to the 5-a-day rule is able to cover completely the nutrient
requirement of all population groups needs to be proved.
The question to what extent under the present life-style conditions the vitamin and mineral
requirements nation wide is covered can only be evaluated by a comprehensive survey,
which is not planned in the near future.

INHALTSVERZEICHNIS Eröffnung des Symposiums durch den Präsidenten der Bundesforschungs-anstalt für Landwirtschaft (FAL), Braunschweig Prof. Dr. G. Flachowsky Einleitung des 9. Symposium: Vitamins and Additives in the Nutrition of Man and Animal durch den Lehrstuhlinhaber der Humanernährung an der Friedrich-Schiller-Universität Prof. Dr. R. Bitsch Vorträge
Seite Zulassung und Sicherheitsbewertung von Zusatzstoffen in Europa Grossklaus, R., Gürtler, R. ........................................................................................ 1 Zur Bewertung der Spurenelementversorgung in der Tierernährung Pallauf, J. ...............................................................................................................…13 Aspects for Determining the Requirement of B-Vitamins Roth-Maier, Dora A. ..................................................................................................26 Vitamine in der Laktation Schweigert, F.J. .........................................................................................................38 Herbs and Botanicals in the Nutrition of Monogastric Animals Wenk, C. ……..……………………………………………………………………...……...45 Cobalt and vitamin B12 requirement of dairy cows Stemme, K., Meyer, U., Lebzien, P., Flachowsky, G., Scholz, H. .........…….............61 Newer aspects of vitamin and trace element nutrition in turkeys Neuere Aspekte zur Vitamin- und Spurenelementversorgung von Puten Schenkel, H………………………………………………………………………………….68 „Functional foods“ and its legal importance - Perspectives in Ger-man development against International comparison” Güler, M.-Serap……………………………………………………………………………..69 Vitamins and trace elements in milk and cheese – effect of milk spe-cies (cow, goat) and kind of cheese Vitamine und Spurenelemente in Milch und Käse – Einfluss von Milchart (Kuh, Ziege) und Käseart Schöne, F., Leiterer, M., Dornaus, L., Greiling, A., Kinast, C., Jahreis, G., Böhm, V. ....................................................................................................................70 Preventive effects of vitamins and of non-nutrient plant factors Heseker, H. ...............................................................................................................78

Einsatzmöglichkeiten von Zutaten mit funktionellem Wirkstoffspekt-rum am Beispiel von Traubenschalenextraktionsrückständen Meier, J., John, T., Schmidt, C. .................................................................................88 Wirkung unterschiedlicher Futterzusatzstoffe auf Gesundheit und Wachstum von Kaninchen Wesemeier, H.-H., Kurze, S. .....................................................................................94 Effect of a calcium phosphate supplement on cholesterol metabolism in humans Ditscheid, B., Keller, S., Jahreis, G. ........................................................................100 The vitamin B2, B6 and folic acid supplementation influence on poly-unsaturated fatty acids (PUFA) concentration in serum and liver of rats fed the diet restricted in protein Bertrandt, J., Klos, A., Debski, B………………………………………………….…….105 Influence of the vitamin C concentration in the serum on the devel-opment pathological changes in the stomach in patients with hepa-tocirrhosis Kopański, Z., Schlegel-Zawadzka, M., Piekoszewski, W., Czupryna, A., Kilian, T. ..................................................................................................................112 Investigations on vitamin K1 (phylloquinone) and osteocalcin serum levels in healthy subjects Stein, A., Lehmann, G., Müller, A., Stein, G., Bitsch, R., Hein, G. ...........................117 Investigations in pet birds (Agapornis spp.) on tolerance of various dosages of vitamin K3 in complete diets Untersuchungen zur Verträglichkeit unterschiedlich hoher Gehalte an Vi-tamin K3 im Alleinfutter von Ziervögeln (Agapornis spp.) Hupfeld, C., Wolf, P., Dorrestein, G., Kamphues, J. ...............................................123 Daily intake of fat-insoluble vitamins in prospective examinations of opiate dependent patients during methadone maintenance treatment Szpanowska-Wohn, A., Kolarzyk, E., Kamenczak, A., Schlegel-Zawadzka, M……129
Effects of PUFA-rich diets on vitamin E and C content in brain tissue and infarct volume after cerebral ischemia. Auswirkungen von PUFA-reichen Diäten auf den Vitamin E und C -Gehalt im Hingewebe sowie die Infarktgröße nach zerebraler Ischämie Stohrer, M., Stangassinger, M…………………………………….……………………..135 Relative proportion of stereoisomers of alfa-tocopherol in fluids and tissues from rats, pigs, cows and poultry explains different bioactiv-ity of dietary natural and synthetic vitamin E between different animal species. Jensen, S.K, Lauridsen, C. ......................................................................................136

Vergleich unterschiedlicher Parameter des antioxidativen Systems bei gesunden Kühen im peripartalen Zeitraum Sattler, T., Zahn, N., Fürll, M………………………………………………………….....142 Ingestion of a Spätburgunder (Pinot Noir) red wine – in vivo antioxi-dant activity and availability of phenolic compounds Netzel, M., Straß, G., Frank, T., Könitz, R., Christmann, M., Bitsch, R., Bitsch, I. ...................................................................................................................148 Antioxidant activity and polyphenolic content of apple juices pro-duced from eight different cultivars Straß, G., Netzel, M., Rossberg, A., Kranl, K., Thielen, C., Dietrich, H., Bitsch, R., Bitsch, I. .................................................................................................154 Antioxidantien bei häufigen Rinderkrankheiten Fürll, M., Goerres, A. .............................................................................................. 160 Assessment of some macro- and microelements daily intake of two groups of women from silesia region Niedworok, E., Całyniuk, B., Szczepańska, E…………………………………………164 Meeting the young men organism requirements for selected mineral elements by daily food ration Kłos, A., Bertrandt, J., Stężycka, E. ........................................................................168 Investigations on the exchange from anorganic manganese and zinc compounds by amino acid-manganese and amino acid-zinc chelates in dairy cows Dunkel, S., Kluge, H., Spilke, J., Eder, K. ...............................................................173
Kaliumverzehr, Kaliumbilanz und Kaliumbedarf Erwachsener Anke, M., Bergmann, K., Lösch, E., Müller, R. ........................................................174 Rare earth elements as possible alternative growth promoters Wehr, U.A., He, M.L., Rambeck, W.A. …………………………………………………182
Antibiotic residues from pig production in carcass and slurry Freitag, M., Schwarze, D., Vockel, A., Mehlich, A., Grote, M. .................................183 Influence of Cr-yeast supplementation of hens’ diets on quality of eggs Gralak, M.A., Debski, B., Zalewski, W., Niemiec, J. ................................................189 Investigations on the tolerance of lactulose as feed additive in adult healthy horses Zeyner, A., Schrödl, W., Sahm, U., Lengwenat, O., Coenen, M., Krüger, M. .........196 Wirkung NSP-hydrolysierender Enzyme bei Geflügel Richter, G., Lüdke, H., Köhler, H., Arnhold, W. .......................................................202
Effect of supplemented phytase at different Zn- and Cu- feed con-tents in pig nutrition Berk, A., Flachowsky, G. , Fleckenstein, J. .............................................................210 Effects of microbial phytase in corn-soybean meal diets on perform-ance, energy and nutrient utilization in laying hens Htoo, J.K., Liebert, F. ..............................................................................................216 Supplementation of Feed Enzyme Complexes to Broiler Diets with High Lupin Seed Content Paulicks, B.R., Broz, J., Roth-Maier, D.A………………………………………………222 Effects of endo-xylanase supplementation on the nutritive value of wheat-based diets in broiler chickens Francesch, M., Perez-Vendrell, A.M., Brufau, J., Broz, J…………………………….228
Die Wirkung von L-Carnitin auf Milchleistung und Milchinhaltsstoffe bei Sauen und Wachstum der Ferkel während der Säugezeit. Ramanau, A., Kluge, H., Spilke, J., Eder, K……………………………………………234 Influence of conjugated linoleic acid isomers on the metabolism of arachidonic acid in human endothelial cells Schleser, S., Becker, K., Körting, R., Eder, K. ........................................................240 The effect of dietary conjugated linoleic acids on desaturation of α-linolenic acid and the formation of eicosanoids in rats fed a diet con-taining linseed oil Slomma, N., Becker, K., Eder, K. ............................................................................246 Effect of rapeseed, linseed and fish oils on rumen fermentation, bio-hydrogenation of fatty acids and CLA content in postruminal digesta in vitro Szumacher-Strabel, M., Potkański, A., Jalc, D., Zelenak, I., Kowalczyk, J., Cieślak, A…………………………………………………………………………………..252 Einfluss von Vaccensäure auf den Fettsäurenmetabolismus in Ratten Kraft, J., Hoschek, L., Möckel, P., Zimmermann, S., Härtel, A., Jahreis, G. ...............................................................................................................258 The enrichment of fresh alfalfa with different sources of n-3 and n-6 polyunsaturated fatty acids and their effect on rumen fermentation and biohydrogenation in artificial rumen Potkański, A., Szumacher-Strabel, M., Jalc, D., Zelenak, I., Kowalczyk, J., Cieślak, A………………………………………………………………………………..…264 Effect of a lecithin-bounded sitosterol-supplement on blood lipids and sterol in normo- and hypercholesteraemic subjects Keller, S., Doberenz, J., Schubert, I., Till, U., Jahreis, G. .......................................269

Influence of Sangrovit© supplementation on nitrogen balance and feed intake in growing pigs Tschirner, K., Susenbeth, A., Wolffram, S. ..............................................................275 Poster Does dietary intake of vitamin B6 and folate affect homocysteine and CRP levels in patients with heart failure? Makarewicz-Wujec, M., Kozlowska-Wojciechowska, M., Mamcarz, A., Janiszewski, M. ........................................................................................................280 Investigations on the Effects of B-Vitamin Supplementations in Broiler Diets Roth-Maier, D.A., Paulicks, B.R…………………………………………………………285 Influence of the tobacco smoking on the vitamin C concentration changes in the serum of women with breast cancer Kopański, Z., Schlegel-Zawadzka, M., Grygiel, B., Piekoszewski, W., Kilian, T. ..................................................................................................................289 Influence of different dietary vitamin C levels and storage time on vitamin E content and oxidative stability in m. longissimus dorsi of growing pigs Eichenberger, B., Gebert, S., Wenk, C. ..................................................................293 Effect of L-ascorbic acid on the liver antioxidant potential in chicks exposed to cadmium Berzina, N., Apsite, M., Basova, N……………………………………………………...297 Intake of vitamins B1, B2 and C among the adult and children popula-tion of the Chuvash republic (Russia) Khokhlova, H………………………………………………………………………………301 Vitamins intake in daily diet in groups of disabled and healthy schoolchildren attending integration classes Kolarzyk, E., Janik, A., Schlegel-Zawadzka, M. ......................................................302 Dienogest- containing oral contraceptives and serum vitamin levels- A long time study Noack, J., Schubert, K., Winnefeld, K., Klinger, G…………………………………….306 Vitamins A and E in farm-bred polar fox after starvation Ilyina, T. ……………………………………………………………………………………311 Change of vitamin E content in refined sunflowerseed oil during keeping Dimić, V., Dimić, E., Tešanović, D., Romanić, R………………………………………315

The influence of storage conditions on the tocopherols content in the refined oils Kuncewicz, A., Panfil- Kuncewicz, H……………………………………………………319 Tocopherol and β-carotene content in vegetable oils on the Polish market Kuncewicz, A., Żegarska, Z., Rafałowski, R…………………………………………...323 Protective effect of vitamin E and selenium after suckling period of lambs fed with toxic amounts of copper and excess of sulphur (pol-luted regions) Angelow, L., Petrova, I., Ilchev, A……………………………………………………….326 Changes in contents of carotenoids and vitamin E as well as in lipo-philic antioxidant activity in tomato products depending on process-ing effects. Seybold, C., Fröhlich, K., Bitsch, R., Otto, K., Böhm, V. .........................................330 Effect of vitamin E and Selenium Dietary Supplementation on hepato-cyte apoptosis in acute liver damage Shen xiuhua Cheng wufeng Xie liangmin Sunjianqin Lifeng Malin………………….334 Comparison of lipophilic antioxidant activity of isolated lycopene isomers Fröhlich, K., Kaufmann, K., Bitsch, R., Böhm, V. ....................................................335 Zinc and other antioxidants in Polish students’ diet vs. the zinc con-tent in their blood Przysławski, J., Schlegel-Zawadzka, M., Walkowiak, J., Bolesławska, I. ................339 Antioxidativer Status beim klinisch gesunden Schweinen Fürll, M., Röhl, C. ………………………………………………………………………...343 Effect of selenium deficiency and dietary selenium supplementation on oxidative status of porcine liver and muscle Sobajic, S., Miric, M., Mihailovic, M……………………………………………………..347 Evaluation durum wheat semolina of different years by their antioxi-dant activity and contents of carotenoids Burkhardt, S., Kranl, K., Hollmann, J., Lindhauer, M.G., Bitsch, R., Böhm, V. ........351
Reactive oxygen species are involved in chromium (III) and insu-lin inducted glucose uptake in cultured muscle cells. Lipko, M., Kuryl T., Debski, B. .................................................................................355 Vitamin and trace element status of milk from organic production – First investigation results Vitamin- und Spurenelementstatus von Milch aus ökologischer Erzeugung – Erste Untersuchungsergebnisse Schöne, F., Kirchheim, U., Kinast, C., Böhm, V., Hartung, H., Leiterer, M. ............359

Einfluss einer Calciumphosphat-Supplementation auf den Eisensta-tus beim Menschen Fökel, C., Ditscheid, B., Bergmann, H., Jahreis, G. ................................................363 Untersuchungen zu Mineralstoff- und Vitamingehalten in Ergän-zungspräparaten für Ziervögel und kleine Nager Wolf, P., Kamphues, J. ............................................................................................367 Comparative study of some silicate mineral additives on rumen fer-mentation in vitro Baran, M., Váradyová, Z. ........................................................................................372 Untersuchungen zum Einfluss von Seltenen Erden auf das Wachstum und die Ganzkörperzusammensetzung von Broilern Halle, I., Fleckenstein, J., Hu, Zheng Yi, Flachowsky, G., Schnug, E. ....................376 Copper Recommendations for Piglets Kessler J., Lavoyer R., Stoll, P. ...............................................................................380 Effect of selenium and selenium-iodine supplementation on thy-roid metabolism in nitrite fed rats Kostogrys, R.B., Pisulewski, P.M., Pecio, A., Sikora, E. .........................................384
The effect of dietary magnesium oxide supplementation on muscle energetic and calcium metabolism and meat quality of pigs Lahucky, R., Küchenmeister, U., Bahelka, I., Ender, K. ..........................................385
Creatine kinase activity may not always reflect selenium deficiency in laying hens Zuberbuehler, C.A., Messikommer, R.E., Arnold, M.M., Wenk, C…………………..389 The influence of subtherapeutic levels of antibiotics on the absorp-tion of tocopherols in broilers Jensen, S.K, Lauridsen, C., Knarreborg, A., Engberg, R.M. ...................................393 Effect dietary Mannanoligosaccharide in sow diets on Performance of Sows and Suckling Piglets Wirkung von Sauenrationen mit Mannanoligosacchariden auf die Sauen- und Ferkelleistung Spring, P., Geliot, P., Newman, K.E. .......................................................................397 The influence of chromium and fructan enriched diet on β-oxidation activity of fatty acids in rat lymphocytes. Kuryl, T., Krejpcio, Z., Wójciak, R., Lipko, M., Debski, B. .......................................401 Probiotic cultures and their modulating effects on immunological parameters and lipid metabolism Klein, A., Vogelsang, H., Jahreis, G. .......................................................................406

Influence of a synbiotic yoghurt (Lactobacillus acidophilus 74-2, Bi-fido-bacterium species 420 and 1% oligofructose) on the absorption of calcium and magnesium Kuhnt, K., Klein, A., Jahreis, G. ...............................................................................410 Effekte von Probiotika und phytogenen Zusätzen beim Mastschwein Richter, G., Ochrimenko, W., Hartung, H., Arnhold, W. ..........................................416
Probiotic Escherichia coli strain Nissle 1917 in adult horses: Toler-ance and presence of viable bacteria in the faeces Zeyner, A., Albers, N., Schrödl, W., Vallentin, G., Fuhrmann, H., Krüger, M. .........420 Der Einfluss von lebenden Hefezellen auf die Ergebnisse bei Bullen Löhnert, H.-J., Ochrimenko, W I., Lüdke, H. ...........................................................424 Effekte von phytogenen Zusätzen und Lebendhefe bei Ferkeln Richter, G., Bargholz, J., Köhler, H., Arnhold, W. ...................................................428 Yeast extract as a protein source for weaning piglets Hefeextrakt als Proteinquelle für Absetzferkel Maribo, H., Spring, P................................................................................................433 Wirksamkeit NSP-hydrolysierender Enzyme beim Ferkel Richter, G., Heller, E., Schurz, M., Arnhold, W. ......................................................438
Effects of Dietary Phytase Supplementation on Growth Performance and Zinc Availability in Broiler Chickens Fed Low-Zinc Diets Paulicks, B.R., Broz, J., Roth-Maier, D.A. ……………………………………………..442 Effects of two different microbial phytases in plant based diets for Nile tilapia (Oreochromis niloticus) Portz, L., Liebert, F. .................................................................................................446 Effects of the enzyme product RONOZYME® WX on performance and jejunal viscosity of broiler chickens fed wheat-based diets Philipps, P., Aureli, R., Klünter, A.-M……………………………………………………450 Untersuchung zum Einfluss von Kreatin auf das Wachstum von Broilern Halle, I. ....................................................................................................................454 Methoden zur instrumentellen und sensorischen Charakterisierung von Bitterstoffen mit funktionellen Eigenschaften in Eisbergsalat Meier, J., Flick, G., Schulze, D. ...............................................................................457 Bioactive compounds in sea buckthorn juices and nectar – investiga-tion of their stability under standardized storage conditions Netzel, M., Strass, G., Allmann, S., Kranl, K., Böhm, V., Bitsch, I., Bitsch, R. ........461

Anthocyanins and metabolites in human urine after ingestion of a concentrated elderberry juice Netzel, M., Sonntag, S., Straß, G., Bitsch, I., Bitsch, R. ..........................................465
Release characteristics of alginate and chitosan treated alginate beads Scherze, I., Stenzel, J., Lang, S., Muschiolik, G. ....................................................469 Absorption von konjugierten Linolsäuren beim Menschen Kraft, J., Kießling, G., Möckel, P., Jahreis, G. .........................................................473 Plant oils as a source of linoleic acid in sheep diet and their impact on conjugated linoleic acid and fatty acids isomers in milk. Szumacher-Strabel, M., Potkański, A., Cieślak, A…………………………………….478 Essential fatty acids and nutritive value of edible nonrefined linseed oil Dimić, E., Dimić, V.,Romanić, R. .............................................................................480 Influence of a vaccenic-acid mixture on serum lipids and immu-nological parameters in humans Kuhnt, K., Kraft, J., Vogelsang, H., Jahreis, G. .......................................................484 Cholesterol-lowering phytosteryl esters by lipase-catalyzed esterifi-cation and transesterification of phytosterols with fatty acids or fatty acid esters Weber, N., Weitkamp, P., Mukherjee, K.D. .............................................................489 Characteristics of cold pressed pumpkin seed oil Vukša, V., Dimić, E., Dimić, V. ................................................................................493 Muscular tissue lipids of fattened pigs fed nutritive oil additives Tsvetkova, V. ...........................................................................................................496 Effect of substitution of sesame oil as sole in type 2 diabetes on drugs Sankar, D., Ramesh, B., Sambandam, G., Ramakrishna Rao, M., Pugalendi, K.V…………………………………………………………………………….501 Einfluss einer Daidzein-Supplementierung des Futters von tragenden Sauen auf das Wachstum von neu geborenen Ferkeln Kuhn, G., Ren, M.Q., Rehfeldt, C., Nürnberg, K., Kanitz, E., Tuchscherer, M., Stabenow, B., Ender, K. ..............................................................505 Encapsulation of hydrophilic substances in a polysaccharide gel with embedded multiple emulsion Weiß, J., Muschiolik, G., Scherze, I. .......................................................................509

1
Zulassung und Sicherheitsbewertung von Zusatzstoffen in Europa Grossklaus, R., Gürtler, R. Bundesinstitut für Risikobewertung (BfR), Thielallee 88-92, D-14195 Berlin Einleitung Mit ihrem Weißbuch zur Lebensmittelsicherheit vom 12. Januar 2000 hat die Euro-
päische Kommission eine neue Strategie vorgeschlagen, die die Sicherheit der Le-
bensmittel vom Acker oder Stall bis hin zum Verbraucher („from farm to fork“) um-
fasst. Um ein hohes Schutzniveau und das reibungslose Gewähren des Binnen-
marktes zu gewährleisten, sind die Schaffung klarer Begriffsbestimmungen zur Ver-
besserung der Rechtssicherheit einschließlich der Definition des Lebensmittelbegrif-
fes und die Anpassung des Zusatzstoffbegriffes im nationalen Recht erforderlich. Zu
den weiteren Hauptvorgaben gehören auch die Gewährleistung qualifizierter und
transparenter und unabhängiger wissenschaftlicher Beratung durch Risikobewertung,
Risikomanagement (Rechtsetzung und Überwachung) und Risikokommunikation, die
Anwendung des Vorsorgeprinzips, Schutz der Verbraucher vor Täuschung sowie
Gewährleistung des Zugangs zu präzisen Informationen (KOMMISSION, 2000). Von
diesen in dem Anhang zum Weißbuch enthaltenen Maßnahmen ist als eine der we-
sentlichsten am 28. Januar 2002 die Verordnung (EG) Nr. 178/2002 des Europäi-
schen Parlaments und des Rates zur Festlegung der allgemeinen Grundsätze und
Anforderungen des Lebensmittelrechts, zur Errichtung der Europäischen Behörde für
Lebensmittelsicherheit und zur Festlegung von Verfahren zur Lebensmittelsicherheit
(ABl. EG Nr. L 31, S. 1) erlassen worden. Die Zulassung von Lebensmittelzusatz-
stoffen erfolgt einheitlich über die EU-Kommission, wobei nunmehr seit 2003 die
neue Europäische Behörde für Lebensmittelsicherheit (European Food Safety
Authority, EFSA) für die wissenschaftliche Beratung und Informationsanalyse ver-
antwortlich ist. Infolge der zahlreichen Lebensmittelskandale soll hiermit das Ver-
trauen der Verbraucher wieder gewonnen werden. Ohnehin ist die Skepsis in der
Bevölkerung gegenüber Lebensmittelzusatzstoffen sowie damit industriell herge-
stellten Lebensmitteln sehr groß, da sie nicht durchschaut, was sich hinter der Be-
zeichnung von sog. E-Nummern im Zutatenverzeichnis verbirgt, welchen Nutzen sol-
che Zusatzstoffe haben sollen oder wer die wissenschaftliche Basis für die Beurtei-
lung und Zulassung solcher Stoffe festlegt. Häufig werden Zusatzstoffe als Chemie in
Lebensmitteln mit den Schadstoffen gleichgestellt. Lebensmittelzusatzstoffe sind

2
nicht zu verwechseln mit Stoffen wie Düngemittel, Pflanzenschutzmittel, Tierarznei-
mittel oder Substanzen, die aus der Umwelt unbeabsichtigt in ein Lebensmittel ge-
langen können. Zusatzstoffe unterliegen europaweit einem Verbotsprinzip mit Er-
laubnisvorbehalt, d.h. dass nur gesundheitlich unbedenkliche Zusatzstoffe zugelas-
sen werden dürfen und aus diesem Grunde eine E-Nummer („E“ steht für Europa)
erhalten. Dennoch werden immer wieder in zum Teil sach-undienlichen Laienbü-
chern, nicht selten basierend auf nicht abgesicherten wissenschaftlichen Erkenntnis-
sen, spektakulären Publikationen von Außenseitern und unterstützt durch die Medien
gesundheitliche Bedenken geäußert. Eine Überbewertung des Ausmaßes des Risi-
kopotentials bzw. so genannten Restrisikos in der Öffentlichkeit kann letztlich mehr
Ängste und Vorbehalte auslösen, zumal wenig allgemeinverständliche Informationen
zur Aufklärung der Verbraucher existieren. Hier ist mehr Offenheit und Transparenz
gefordert, um das Vertrauen der Verbraucher in die Lebensmittelsicherheit zu ver-
bessern. Dies ist eine wichtige Aufgabe der Risikokommunikation, die sich das Bun-
desinstitut für Risikobewertung (BfR) sowie auch das neue Bundesamt für Verbrau-
cherschutz und Lebensmittelsicherheit (BVL) gestellt haben. Zweifelsohne muss das
Zulassungsverfahren im Rahmen der Risikoanalyse transparent und nachvollziehbar
sein, um einerseits mögliche Risiken aufzuzeigen und andererseits staatliche Ent-
scheidungen zu legitimieren. Zweck der Ausführungen ist es, einen tieferen Einblick
zu geben in die Anforderungen an die Sicherheitsbewertung bei der Zulassung von
Lebensmittelzusatzstoffen in der Europäischen Union (EU) einschließlich der Festle-
gung von ADI-Werten und Höchstmengen, um die oben nur grob skizzierte Diskus-
sion zu versachlichen.
Vorstellungen der Verbraucher über Risiken in Lebensmitteln Der grundlegende Strukturwandel des Lebensmittelsektors wird von Sozial- und
Marktforschern als wesentlicher Grund für die Verunsicherung des Verbrauchers ge-
sehen. Früher wurden durch Gebräuche und Riten gewisse Erfahrungen über die
Sicherheit von Lebensmitteln weitergegeben, zumal Erzeugung und Verbrauch in der
Regel noch vereint waren. Mit der Industrialisierung der Landwirtschaft und zuneh-
mender Verstädterung trat eine räumliche Trennung von Erzeugung, Markt und Ver-
brauch ein. Beim Verbraucher bestehen kaum noch Kenntnisse und Vorstellungen
über die Herkunft der Rohmaterialien, die Zusammensetzung und Herstellung von
Lebensmitteln und Speisen. Dabei hat die Internationalisierung des Marktes diesen

3
Trend noch verstärkt. Außer-Haus-Verpflegung, Fast Food, Convenience-Produkte
und immer zahlreichere exotische Produkte sind vorherrschend (JELSOE et al.,
1992).
Die Forderung von vielen Verbrauchern nach mehr „naturbelassenen“ Produkten
widerspiegelt möglicherweise die weit verbreitete Unsicherheit über industriell
gefertigte Lebensmittel, deren Ausgangsrohstoffe, Zusammensetzung und mögliche
Gefahren, welche man selbst nicht beurteilen kann und deshalb auf Meldungen in
den Medien, den Rat von Ärzten oder von Verbraucherschutzorganisationen ange-
wiesen ist. Keinesfalls kann davon ausgegangen werden, dass zum Beispiel alle
„natürlichen“ Süßungsmittel á priori „gut“ und gesundheitlich unbedenklich sind, wäh-
rend die „künstlichen“ Süßstoffe „schlecht“ bzw. potentiell gesundheitlich schädlich
seien. Der Nachweis der gesundheitlichen Unbedenklichkeit ist deshalb für alle Sü-
ßungsmittel zu fordern (GROSSKLAUS, 1995; WALKER, 1999).
Die Risikobereitschaft ist in der Ernährung, verglichen mit anderen Lebensbereichen
(z.B. Verkehr, Sport, Beruf), gering. Die Risikowahrnehmung der Laien unterscheidet
sich von der Wahrnehmung der Fachwissenschaftler, wobei zeitliche Trends im
„Risk-Ranking“ zu verzeichnen sind. So sehen die meisten Verbraucher in den mög-
lichen Rückständen von Pflanzenschutzmitteln oder Tierarzneimitteln, verschiedenen
Lebensmittelzusatzstoffen oder gentechnisch hergestellten Lebensmitteln das größte
Risiko für ihre Gesundheit (GROSSKLAUS, 2003). Andererseits werden die Konse-
quenzen einer ungesunden Ernährungsweise (zu viel, zu einseitiges Essen oder Al-
kohol) weniger gefährlich eingeschätzt, obwohl die Wissenschaft die Risiken genau
umgekehrt einstuft. Das Risiko durch Lebensmittelzusatzstoffe wird aus der Sicht der
Laien mit dem herkömmlichen Anspruch auf absolute Sicherheit häufig überbewertet.
Mit „Sicherheit“ verbindet der Laie die Freiheit von Risiken. Ein Null-Risiko für Le-
bensmittelzusatzstoffe kann wie auch sonst im täglichen Leben weder versprochen
noch gewährleistet werden (DIEHL, 2003). Der Gebrauch des Wortes "Sicherheit"
beruht bei manchen Laien wahrscheinlich auf einem sprachlichen Missverständnis,
wenn das Wort „safety“ aus dem Englischen mit „absoluter Sicherheit“ übersetzt wird.
Tatsächlich definiert die U.S. amerikanische Food and Drug Administration safety “as
a reasonable certainty … that the substance is not harmful under the intended use.”
Es ist deshalb ratsam, im Deutschen von „Unbedenklichkeit“ zu sprechen. Hier gilt

4
es, diese Missverständnisse auszuräumen, um die Kluft zwischen Experten und Ver-
brauchern zu beseitigen. Dazu gehört eine Verbesserung der Kommunikation über
Risiken im Rahmen einer Risiko/Nutzen-Abwägung. Dabei sollte dem Verbraucher in
verständlicher Sprache klar gemacht werden, welche Risiken nach bestem Stand
des Wissens untersucht werden sollten, um zu einer vernünftigen Abwägung von
Risiko, Kosten und Nutzen zu kommen (HENSCHLER, 1997; KEMPER, 1990).
Eine effektive Risikokommunikation beschränkt sich jedoch nicht auf die Vermittlung
von Information zwischen Experten und Öffentlichkeit (POWELL, 2000;
TRAUTMANN, 2001). Nach der Begriffsdefinition der Verordnung (EG) Nr. 178/2002
bezeichnet die Risikokommunikation im Rahmen der Risikoanalyse vielmehr „den
interaktiven Austausch von Informationen und Meinungen über Gefahren und Risi-
ken, Risikobezogene Faktoren und Risikowahrnehmung zwischen Risikobewertern,
Risikomanagern, Verbrauchern, Lebensmittel- und Futtermittelunternehmen, Wis-
senschaftlern und anderen interessierten Kreisen einschließlich der Erläuterung von
Ergebnissen der Risikobewertung und der Grundlage der Managemententscheidun-
gen“ (VERORDNUNG (EG) Nr. 178/2002).
Definition und Klassifikation der Lebensmittelzusatzstoffe Lebensmittelzusatzstoffe sind ein bedeutender Bestandteil unserer heutigen Ernäh-
rung. Es handelt sich dabei um Stoffe, die Lebensmitteln absichtlich zugesetzt wer-
den, um bestimmte technologische Wirkungen zu erzielen, zum Beispiel um zu fär-
ben, zu süßen oder zu konservieren. Zusatzstoffe werden verwendet, um Haltbarkeit,
Genuss und Aussehen (Farbe, Konsistenz), Herstellung und leichtere Fertigstellung
von Lebensmitteln (Backfähigkeit, Streichfähigkeit) zu sichern oder deren Nährwert
zu verbessern (GROSSKLAUS, 1997). Dementsprechend zählen Antioxidantien,
Süß- und Farbstoffe, Konservierungsstoffe, Emulgatoren, Verdickungsmittel und Ge-
schmacksverstärker zu den am weitesten bekannten Kategorien von Zusatzstoffen
(Tabelle 1).

5
Tabelle 1: Kategorien der Lebensmittelzusatzstoffe
Categories of Food Additives
Acidity regulators Acids Anti-caking agents Anti-foaming agents Antioxidants Bulking agentsl Colours Emulsifiers Emulsifying salts Flavour enhancers Flour treatment agents Firming agents Foaming stabilisers
Gelling agents
Glazing agents and lubricants Humectants Modified starches Packaging gas Propellent gas Raising agents Stabilisers Thickeners Sequestrants Sweeteners
Die einschlägigen Rechtsvorschriften der Europäischen Gemeinschaft definieren Le-
bensmittelzusatzstoffe als "Stoffe mit und ohne Nährwert, die in der Regel weder
selbst als Lebensmittel verzehrt, noch als charakteristische Lebensmittelzutat ver-
wendet werden und einem Lebensmittel aus technologischen Gründen … zugesetzt
werden, wodurch sie selbst oder ihre Nebenprodukte zu einem Bestandteil des Le-
bensmittels werden oder werden können" (RICHTLINIE 89/107/EWG).
Nach dem Gemeinschaftsrecht sind demnach nur solche Stoffe als Zusatzstoffe an-
zusehen, die bestimmten technologischen Zwecken dienen. Demgegenüber umfasst
der Begriff der Zusatzstoffe nach § 2 des Lebensmittel- und Bedarfsgegenständege-
setzes (LMBG) auch solche Stoffe, die ernährungsphysiologischen oder diätetischen
Zwecken zu dienen bestimmt sind (vgl. auch GROSSKLAUS, 2003). Diese Diver-
genz hat in der Vergangenheit oftmals zu Schwierigkeiten geführt, zumal auf Ge-
meinschaftsebene die Regelung von Stoffen, die zu ernährungsphysiologischen oder
diätetischen Zwecken bestimmt sind, jeweils bereichsbezogen (z.B. als Positivliste in
der Richtlinie für Nahrungsergänzungsmittel) und unabhängig vom Zusatzstoffbegriff
der Richtlinie 89/107/EWG erfolgt. Aus diesen Gründen wird nach dem Entwurf eines
Gesetzes zur Neuordnung des Lebensmittel- und des Futtermittelrechts (Stand:
05.08.2003) der Zusatzstoffbegriff an Artikel 1 Abs. 2 der Richtlinie 89/1007/EWG

6
angepasst. Geplant ist, dass an die Stelle des bisherigen Zulassungsverfahrens für
Stoffe, die zu ernährungsphysiologischen oder diätetischen Zwecken dienen, eine
Ermächtigung tritt, derartige Stoffe – im Einklang mit dem Gemeinschaftsrecht in die-
sem Bereich – im Einzelfall regeln zu können.
Allgemeine Kriterien für die Verwendung von Lebensmittelzusatzstoffen Lebensmittelzusatzstoffe sind streng reguliert und sollten Gegenstand regelmäßiger
Sicherheitsprüfungen sein. Seit Ende der 90er Jahre dürfen in allen Mitgliedstaaten
der Europäischen Union dieselben Zusatzstoffe verwendet werden. Die EU-Zusatz-
stoff-Richtlinien wurden in allen Mitgliedstaaten in nationales Recht umgesetzt. Der-
zeit sind in der Europäischen Union etwa 300 Zusatzstoffe zugelassen.
Unabdingbare Voraussetzungen für eine Zulassung sind die Prüfung auf gesundheit-
liche Unbedenklichkeit, technologische Notwendigkeit und dass der Verbraucher
nicht getäuscht werden darf. Dabei besitzt der Nachweis auf Unschädlichkeit hohe
Priorität. Allerdings kann es eine absolute Sicherheit (Nullrisiko) nicht geben. Auch
bei gesundheitlicher Unbedenklichkeit muss die technologische Notwendigkeit gege-
ben sein. Lebensmittelzusatzstoffe dürfen nicht zur Täuschung des Verbrauchers
verwendet werden. Dies bedeutet z.B., dass eine Lebensmittelfärbung zur Schönung
(z.B. roter Farbstoff zur "Auffrischung" von Erdbeeren) prinzipiell verboten ist. Die
Verwendung von Lebensmittelzusatzstoffen kommt nur dann in Betracht, wenn die
vorgeschlagene Verwendung des Zusatzstoffes für den Verbraucher Vorteile bietet,
wie z.B. Erhaltung der ernährungsmäßigen Qualität des Lebensmittels oder Förde-
rung der gleichbleibenden Qualität oder Verbesserung seiner organoleptischen Ei-
genschaften. Um die etwaigen gesundheitsgefährdenden Wirkungen eines Lebens-
mittelzusatzstoffes zu ermitteln, muss dieser geeigneten toxikologischen Untersu-
chungen und einer toxikologischen Bewertung unterzogen werden. Bei Vorliegen
neuer wissenschaftlicher Erkenntnisse ist gegebenenfalls eine Neubewertung erfor-
derlich (RICHTLINIE 89/107/EWG).
Zulassung und Sicherheitsbewertung von Zusatzstoffen Ziel der Anforderungen für die Zulassung von Zusatzstoffen ist es, dass die Lebens-
mittel nicht über den technologisch notwendigen Umfang hinaus mit Zusatzstoffen
versehen werden (Minimierungsgebot). Dadurch soll sichergestellt werden, dass ein

7
Verbraucher diesen Zusatzstoff sein Leben lang täglich quantum satis bzw. in der
maximal zugelassenen Menge bedenkenlos aufnehmen kann. Die Zusatzstoffregulie-
rung zeichnet sich durch ein hohes Schutzniveau aus.
Die in Deutschland und den anderen Mitgliedstaaten der Europäischen Union (EU)
zulässigen Zusatzstoffe sind durch internationale und z.T. auch nationale Experten-
gremien gesundheitlich bewertet und zur Verwendung in Lebensmitteln akzeptiert
worden. Zu diesen Expertengremien zählen der frühere Wissenschaftliche Lebens-
mittelausschuss der EU-Kommission (Scientific Committee on Food, SCF), das Joint
FAO/WHO Expert Committee on Food Additives (JECFA) und zum Beispiel die Se-
natskommission zur Beurteilung der gesundheitlichen Unbedenklichkeit von Le-
bensmitteln (SKLM) der Deutschen Forschungsgemeinschaft. In der EU ist seit 2003
die neue Europäische Behörde für Lebensmittelsicherheit (European Food Safety
Authority, EFSA) für die gesundheitliche Bewertung von Zusatzstoffen zuständig. Sie
wird dabei von einem internationalen Expertengremium, dem Panel on Food Additi-
ves, Flavourings, Processing Aids and Materials in Contact with Food (Panel AFC)
beraten. Es bewertet Zusatzstoffe nun anstelle des im Frühjahr 2003 aufgelösten
SCF. Eine E-Nummer wird an solche Zusatzstoffe vergeben, die der SCF bzw. das
Expertengremium der EFSA bewertet und akzeptiert hat. Wissenschaftler des BfR
arbeiten in entsprechenden Gremien mit und leisten Beiträge für die gesundheitliche
Bewertung neuer Zusatzstoffe wie auch für die Neubewertung bereits zugelassener
Zusatzstoffe (BfR, 2003 a, b). Die Festlegung von Reinheitsanforderungen und
Verwendungsbedingungen erfolgt durch die EU-Kommission mit Zustimmung des
Standing Committee on the Food Chain and Animal Health (SCFCAH) und letztlich
durch das Europäische Parlament und den Rat.
Anträge auf Zulassung neuer Zusatzstoffe sind an die Kommission der EU und par-
allel in Kopie an die EFSA zu richten oder können über das Bundesministerium für
Verbraucherschutz, Ernährung und Landwirtschaft weitergeleitet werden. Hinsichtlich
der Prüfanforderungen gibt es keine zwingend vorgeschriebenen Regelungen. Aller-
dings sollten die Empfehlungen des SCF beachtet werden (SCF, 2001).

8
Tabelle 2: Übersicht der Unterlagen bei der Bewertung der Zusatzstoffe (SCF, 2001)
Process of Evaluation by the SCF of a Submission on a Food Additive
Technical Data
Identity of substance Proposed chemical and microbiological specifications Manufactoring process Methods of analysis in food Reaction and fate in food Case of need and proposed uses Exposure etc.
Toxicological Data Core studies: Metabolism/Toxicokinetics Subchronic toxicity Genotoxicity Chronic toxicity and carcinogenicity
Reproduction and developmental toxicity Other studies on case-by-case basis: Immunotoxicity Allergenicity Intolerance reactions Neurotoxicity Predictive mechanistic studies etc.
Die gesundheitliche Bewertung von Lebensmittelzusatzstoffen erfordert einen hohen
Aufwand. Der Hersteller hat den wissenschaftlich fundierten Nachweis zu erbringen,
dass der Zusatzstoff gesundheitlich unbedenklich ist. Dazu sind vor allem toxikologi-
sche Untersuchungen, in der Regel Tierversuche, und Untersuchungen über das
Verhalten des Zusatzstoffs im menschlichen Körper erforderlich (Tabelle 2).
Ziel der Risikobewertung anhand der chemischen, biologischen, toxikologischen so-
wie sonstigen Daten einschließlich von Beobachtungen am Menschen ist die Fest-
setzung einer annehmbaren täglichen Aufnahmemenge (Acceptable Daily Intake =
ADI) für den Menschen. Darunter versteht man die Menge eines Lebensmittelzusatz-
stoffes, in Milligramm pro Kilogramm Körpergewicht, die ein Mensch täglich über sein
gesamtes Leben hinweg konsumieren kann, ohne dass unerwünschte Wirkungen zu

9
erwarten sind. Der ADI-Wert basiert in der Regel auf Fütterungsversuchen, z.B. mit
Ratten oder Mäusen. Dabei erhalten die Tiere zumeist täglich über einen langen Zeit-
raum eine Diät mit ansteigenden Mengen des zu untersuchenden Stoffes, um die
höchste Dosierung herauszufinden, bei der keine gesundheitsrelevante Wirkung zu
beobachten ist. Dies ist der so genannte "No-adverse-effect-level" (NOAEL). Als
weitere Vorsichtsmaßnahme wird der NOAEL-Wert durch einen Sicherheitsfaktor (in
der Regel 100) geteilt. So können Unsicherheiten bei der Übertragung der Ergeb-
nisse vom Tier auf den Menschen sowie individuelle Verträglichkeitsunterschiede
ausgeglichen werden. Der so berechnete ADI-Wert ermöglicht einen hohen Grad an
Sicherheit.
Zur Klarstellung muss allerdings auch gesagt werden, dass aus Gründen der vor-
handenen Unsicherheitsfaktoren bei der experimentellen Erfassung der biochemi-
schen und toxikologischen Eigenschaften eines solchen Zusatzstoffes der ADI-Wert
niemals als eine Stoffbezogene physikalische Konstante betrachtet werden sollte.
Das beschriebene ADI-Konzept wird international angewendet und hat sich als prak-
tische Leitlinie zur Beurteilung von gesundheitlichen Risiken von Zusatzstoffen, aber
auch von Rückständen und von Verunreinigungen in Lebensmitteln bewährt. Für die
zugelassenen Zusatzstoffe wurden Verwendungshöchstmengen für verschiedene
Lebensmittelkategorien abgeleitet. Mit den Höchstmengen sollte sichergestellt wer-
den, dass die ADI-Werte eingehalten werden. Einige Zusatzstoffe, die für Lebens-
mittel "quantum satis" zugelassen sind, dürfen nach der "Guten Herstellungspraxis"
nur in der Menge verwendet werden, die erforderlich ist, um die gewünschte Wirkung
zu erzielen.
Kennzeichnung von Zusatzstoffen Es besteht eine grundsätzliche Verpflichtung, die zugesetzten Zusatzstoffe kenntlich
zu machen. Dies dient der allgemeinen Information über die Zusammensetzung und
die verwendeten Zutaten. Über die offizielle Fundstellenliste der E-Nummern ist das
Auffinden der Vorschriften über die in Deutschland zugelassenen Zusatzstoffe leicht
möglich, insbesondere, wenn es darum geht, herauszufinden, welche Stoffe bei der
Herstellung bestimmter Lebensmittel eingeschränkt oder verboten sind.

10
Manche Verbraucher müssen bestimmte Zusatzstoffe meiden. Das kann bei über-
empfindlichen Personen der Fall sein, die auf bestimmte Zusatzstoffe "allergisch"
bzw. pseudoallergisch reagieren können, so z.B. auf den auch natürlich vorkommen-
den Konservierungsstoff Benzoesäure (E 210) oder den Farbstoff Tartrazin (E 102).
Derartige Reaktionen können bei 0,03 bis 0,15% der Bevölkerung auftreten. Entge-
gen einzelner veröffentlichter Meinungen spielen Lebensmittelzusatzstoffe – vergli-
chen mit natürlichen Lebensmitteln bzw. -inhaltsstoffen – bei Unverträglichkeitsreak-
tionen nur eine untergeordnete Rolle (DOMKE, 1996; EHLERS et al., 1997; WORM
et al., 2000; WÜTHRICH, 1996).
Kein hinreichendes Beweismaterial besteht für die häufig vertretene Hypothese, dass
ziellose Überaktivität mit Konzentrations- und Lernschwierigkeiten bei Kindern (Hy-
perkinese-Syndrom, sog. "Zappelphilipp") auf Lebensmittelfarbstoffe, Konservie-
rungsstoffe und Phosphate zurückzuführen sind (WENDER, 1986; KIDD, 2000;
SPENCER, 2002).
Schlussfolgerungen Lebensmittelzusatzstoffe sind keine Schadstoffe. Die Anforderungen für die Zulas-
sung von Zusatzstoffen zeichnen sich durch ein hohes Verbraucherschutzniveau
aus. Lebensmittelzusatzstoffe gehören zu den am besten untersuchten Stoffen, de-
ren potentielle gesundheitliche Risiken als sehr gering einzuschätzen sind. Sie si-
chern ein breites Angebot von Lebensmitteln. Die Kennzeichnung von Lebensmittel-
zusatzstoffen dient der Information. Die Verpflichtung zum Monitoring und Forschung
verbessern den vorbeugenden Gesundheitsschutz. Eine effektivere Risikokommuni-
kation ist jedoch erforderlich, um das Vertrauen der Verbraucher in die Lebensmittel-
sicherheit zu stärken.
Summary Authorisation and safety assessment of food additives in Europe Food additives are substances added intentionally to foodstuffs to perform certain technological functions, for example to colour, to sweeten or to preserve. There is much debate about the reasons for including these additives in foods, especially in relation to safety. However, much of it is misplaced. All food additives undergo stringent safety evaluation before being permitted for use in the European Union. Most of them have been assigned an “E-number”. This denotes approval for use throughout the fifteen Member States, as well as Iceland, Liechtenstein and Norway.

11
Community legislation on food additives is based on the principle that only those additives that are explicitly authorised may be used. About 300 food additives are authorised in the EU. Most food additives may be used only in limited quantities in certain foodstuffs. If no quantitative limits are foreseen for the use of a food additive, it must be used according to good manufacturing practice (GMP), i.e. only as much as necessary to achieve the desired technological effect (“quantum satis”). Food additives may only be authorised if there is a technological need for their use, if they do not mislead the consumer and if they present no hazard to the health of the con-sumer. Prior to their authorisation, food additives are evaluated for their safety. This evaluation is now done by the new European Food Safety Authority (EFSA); it was formerly done by the Scientific Committee on Food (SCF). Safety assessments are based on reviews of toxicological data, frequently including observations in humans. The paper will discuss in an open and transparent manner the detailed considera-tions underlying the process of evaluation by the EFSA for food additive submissions to the European Commission, which are based on the new guidance document. This document provides a framework of core tests required for safety evaluation as well as additional tests which might be appropriate. The concept of “Acceptable Daily Intake (ADI)" together with maximum levels of use will also be discussed. Detailed rules on labelling of additives in foodstuffs are important for vulnerable groups and helps these consumers to make an informed choice while purchasing their foods. Literatur BfR (Bundesinstitut für Risikobewertung) (2003 a): Lebensmittelzusatzstoffe (außer
Farbstoffe und Süßungsmittel) – Vorschläge zur Änderung der europäischen Richtlinie. Stellungnahme des BfR vom 13. Februar 2003. http://www.bfr.bund.de/cms/detail.php?template=internet_de_index_js
BfR (Bundesinstitut für Risikobewertung) (2003 b): Bewertung von Süßstoffen. Information des BfR vom 21. August 2003. http://www.bfr.bund.de/cms/detail.php?template=internet_de_index_js
Diehl, J.F. (2003): Von Delaney zu de minimis – die Illusion des Nullrisikos. Deutsche Lebensmittel-Rundschau 99, 359-365
Domke, A. (1996): Zusatzstoffe – eine Gefahr für die Gesundheit: Nahrungsmit-telallergie-Aspekte. Medizin und Ernährung 5 (Suppl), 92-101
Ehlers, I., Sterry, W., Zuberbier, T. (1997): Zusatzstoffe Gesundheitsrisiko – Unver-träglichkeitsreaktionen. In: Gesundheitsrisiko durch Lebensmittelzusatzstoffe. H. Lochs, H. Kleinsorge (Hrsg.), Fachreihe Ernährung/Gastroliga, Johann Ambrosius Barth Verlag, Heidelberg, Leipzig, S. 27-39
Grossklaus, R. (2003): Die Akzeptanz der Gentechnologie in unserer Gesellschaft und die Rolle des Arztes bei der Risikokommunikation. Aktuel Ernaehr Med 28, 252-258
Grossklaus, R. (2002): Lebensmittelzusatzstoffe. In: Ernährungsmedizin in der Pra-xis. Aktuelles Handbuch zu Prophylaxe und Therapie ernährungsabhängiger Er-krankungen. R. Kluthe (Hrsg.), Spitta Verlag, Balingen, Kap. 8/15.3, Stand Au-gust 2002
Grossklaus, R. (1997): Was sind Lebensmittelzusatzstoffe? In: Gesundheitsrisiko durch Lebensmittelzusatzstoffe. H. Lochs, H. Kleinsorge (Hrsg.), Fachreihe Er-nährung/Gastroliga, Johann Ambrosius Barth Verlag, Heidelberg, Leipzig, S. 9-26
Grossklaus, R. (1995): Nutzen-/Risiko-Abschätzung beim Einsatz alternativer Süßungsmittel in der Kariesprophylaxe. Oral-Prophylaxe 17, 39-46

12
Henschler, D. (1997): Untersuchungsmethoden zur Feststellung von toxischen Wir-kungen bei Langzeitexpositionen in niederer Dosis. In: Gesundheitsrisiko durch Lebensmittelzusatzstoffe. H. Lochs, H. Kleinsorge (Hrsg.), Fachreihe Ernährung/Gastroliga, Johann Ambrosius Barth Verlag, Heidelberg, Leipzig, S. 40-48
JECFA (1987): Principles for the Safety Assessment of Food Additives and Con-taminants in Food. Environmental Health Criteria 70. International Programme on Chemical Safety (ICPS) in cooperation with the Joint FAO/WHO Expert Committee on Food Additives (JECFA). World Health Organisation, Geneva, 1987, http://www.who.int/pcs/jecfa/ehc70.html
Jelsoe, E., Land, B., Lassen, J. (1992): Understanding consumer perceptions and priorities with relation to food quality. Research Report No. 24, Dep. of Environ-ment, Technology and Social Studies, Roskilde University Centre, Rokskilde, Denmark
Kemper, F.H. (1990): Gesundheitliche Bewertung von Lebensmittel-Inhalts- und Zu-satzstoffen. Akt Ernähr-Med 15, 275-277
Kidd, P.M. (2000): Attention deficit/hyperactivity disorder (ADHD) in children: Rationale for its integrative management. Altern Med Rev 5, 402-428
Kommission der Europäischen Gemeinschaften (2000): Weißbuch zur Lebensmittel-sicherheit, Brüssel, 12. Januar 2000, KOM (1999) 719 endg.
Powell, D.A. (2000): Food safety and the consumer – perils of poor risk communica-tion. Can J An Sci 80, 393-404
Richtlinie 89/107/EWG des Rates vom 21. Dezember 1988 zur Angleichung der Rechtsvorschriften der Mitgliedstaaten über Zusatzstoffe, die in Lebensmitteln verwendet werden dürfen. ABl. Nr. L 40 vom 11.2. 1989, S. 27, geändert durch die Richtlinie 94/34/EG, ABl. Nr. L 237 vom 10.9. 1994, S. 1
SCF (Scientific Committee on Food) (2001): Guidance on submissions for food addi-tive evaluations by the Scientific Committee on Food (opinion expressed on 11 July 2001). http://europa.eu.int/comm/food/fs/sc/scf/out98_en.pdf
Spencer, T.J. (2002): Attention-Deficit/Hyperactivity Disorder. Arch Neurol 59, 314-316
Trautmann, T.D. (2001): Risk communication – the perceptions and realities. Food Additives and Contaminants 18, 1130-1134
Verordnung (EG) Nr. 178/2002 des Europäischen Parlaments und des Rates vom 28. Januar zur Festlegung der allgemeinen Grundsätze und Anforderungen des Lebensmittelrechts, zur Errichtung der Europäischen Behörde für Lebensmittelsicherheit und zur Festlegung von Verfahren zur Lebensmittelsicherheit. ABl. Nr. L 31 vom 1.2.2002, S. 1
Walker, R. (1999): Natural versus „artificial“ sweeteners: regulatory aspects. World Rev Nutr Diet 85, 117-124
Wender, E.H. (1986): The food additive-free diet in the treatment of behavior disorders: a review. J Dev Behav Pediatr 1, 35-32
Worm, M., Ehlers, I., Sterry, W., and Zuberbier, T. (2000): Clinical relevance of food additives in adult patients with atopic dermatitis. Clinical and Experimental Allergy 30, 407-414
Wüthrich, B. (1996): Clinical aspects, epidemiology, validity of data. Epidemiology of allergies and intolerances caused by foods and food additives: the problem of data validity. Food Allergies and Intolerances. Symposium. Deutsche Forschungsgemeinschaft: 31-39

13
Zur Bewertung der Spurenelementversorgung in der Tierernährung Pallauf, J. Institut für Tierernährung und Ernährungsphysiologie der Justus-Liebig-Universität, Heinrich-Buff-Ring 26-32, 35392 Giessen Bedarf und Versorgungsempfehlung für Spurenelemente Unter dem Begriff Bedarf wird in der Tierernährung jene Menge an einem Nähr- oder
Wirkstoff verstanden, die für ein Tier unter definierten Bedingungen zur Erzielung
bester Gesundheit und optimaler Leistung erforderlich ist. Die experimentelle
Ableitung des Bedarfes erfolgt bei den Spurenelementen auch heute noch über-
wiegend aus Dosis-Wirkungsbeziehungen mit verschiedenen, möglichst sensitiven
Kriterien. Des weiteren werden häufig auch Bilanzstudien, z.B. bei wachsenden oder
laktierenden Tieren, herangezogen. Der faktorielle Ansatz zur Bedarfsableitung, wie
er z.B. vom NRC (2001) für die Ableitung des Spurenelementbedarfs der Milchkuh
teilweise angewandt wurde, ist auf Grund fehlender experimenteller Daten vielfach
noch nicht hinreichend genau möglich. Für die Mengenelemente hingegen ist die
faktorielle Bedarfsableitung längst Standard geworden. Die extremen Schwankungen
innerhalb eines Elementes bei der Absorptionsrate stellen bei den Spurenelementen
ein besonderes Problem dar. Im allgemeinen wird unter Bedarf der Bruttobedarf ver-
standen, der über das Futter zuzuführen ist, während der Nettobedarf eine absorbier-
bare bzw. intermediär erforderliche Größe darstellt.
Aufbauend auf den möglichst präzise definierten Bedarfsangaben wird für die Fütte-
rungspraxis unter Einbeziehung eines Sicherheitszuschlages, u.a. zur Berücksichti-
gung tierindividueller Schwankungen und Unwägbarkeiten der praktischen Bedin-
gungen, eine Versorgungsempfehlung (Recommendation) abgeleitet. Dieser Unter-
schied zwischen Bruttobedarf und Versorgungsempfehlung wird in Wissenschaft und
Praxis leider nicht immer genügend beachtet.
Vergleich internationaler Empfehlungen zur Versorgung mit Spurenelementen am Beispiel Schwein Versorgungsempfehlungen der wichtigsten Spurenelemente für das Schwein sind
aus verschiedenen Ländern in Tabelle 1 zusammengefasst. Für die Tierernährungs-
praxis hat es sich bewährt, die Versorgungsempfehlungen als Konzentration im
Alleinfutter bzw. in der Gesamtration, z.B. in mg/kg, häufig vereinfachend auch als
ppm bezeichnet, anzugeben. Dabei ist zu unterscheiden, ob sich die Angabe auf kg

14
Trockenfutter, z.B. mit 90 % TM wie beim NRC, oder auf absolute Trockenmasse,
wie bei der GfE, bezieht. Grundsätzlich ist dabei unterstellt, dass Energie- und Roh-
proteinkonzentration des Futters sowie Futteraufnahme und Futterverwertung im
Optimalbereich liegen. Wie die Gegenüberstellung vor allem der Empfehlungen der
GfE aus dem Jahre 1987 mit den Empfehlungen des NRC (1998) zeigen, sind die
Zahlen für Eisen sowie für Zink sehr ähnlich. Bezüglich Kupfer und Selen liegt eben-
falls eine relativ gute Übereinstimmung vor. Bei Iod wird dem nach neueren Arbeiten
deutlich erhöhten Bedarf von Zuchtsauen und Zuchtebern in den NRC-Normen
vermutlich nicht genügend Rechnung getragen. Insgesamt ergibt sich, dass die
deutschen Empfehlungen für das Schwein nach derzeitigem Kenntnisstand kaum
einer grundlegenden Änderung bedürfen. Die lediglich in den französischen Empfeh-
lungen aufgeführte Angabe für Cobalt stellt beim Monogaster in erster Linie einen
Bedarf an Vitamin B12 dar. Bei Mangan liegen die NRC-Empfehlungen für Ferkel und
wachsende Schweine, allerdings aufgrund von älteren Untersuchungen, auf deutlich
niedrigerem Niveau als die Empfehlungen anderer Länder. Es erscheint etwas
fraglich, ob 3-4 mg Mangan je kg Futter-TM beim Ferkel bzw. lediglich 2 mg beim
Mastschwein den heutigen hohen Leistungsanforderungen sicher genug gerecht
werden. Die Gehalte in normalen pflanzlichen Futtermitteln sind jedenfalls viel höher.
Dennoch werden derzeit in der Mischfutterindustrie dem Schweinefutter noch ganz
erhebliche Mn-Mengen zugesetzt. Noch massiver sind die Mn-Zusätze allerdings in
INRA ARC AFRC GfE NRC 1989 1981 1990 1987 1998 mg/kg feed mg/kg dietary DM mg/kg dietary DM mg/kg feed (90 % DM)
piglets growing pigs
sows up to x kg live weight
sows growing boars
adult boars
piglets growing pigs
breeding sows and
boars
piglets up to 20 kg
growing pigs
breeding sows and
boars
Fe 100 80 80 60 x=20
- 50 50 80-120a) 50-60a) 80-90 80-100a) 40-60a) 80
Zn 100 100 100 50 x=90
- 100 100 80-100 50-60 50 80-100 50-60 50
Mn 40 40 40 4-16 x=90
10 15 10 15-20 20 20-25 3-4 2 20
Cu 10 10 10 4 x=90
- 4 4 6 4-5 8-10 5-6 3-4 5
I 0.6 0.2 0.6 0.16 x=90
0.5 0.5 0.5 0.15 0.15 0.5-0.6 0.14 0.14 0.14
Se 0.3 0.1 0.1 0.16 x=90
- 0.2 0.2 0.2-0.3 0.2 0.15-0.2 0.25-0.3 0.15 0.15
Co 0.1-0.5 0.1 0.1 - - - - - - - - - - a) the higher values in the column are valid for the animals with the lower live weight
Table 1: Trace element recommendations for pigs according to different committees from France (INRA), Great Britain (ARC, AFRC), Germany (GfE), and USA (NRC)

15
Fig.: 2: Deformed extremities of a young rabbit suckled by a manganese deficient rabbit (0.6 mg Mn/kg diet)
Fig.3: Litter of a manganese deficient rabbit (0.6 mg Mn/kg diet) with 10 stillbirths and 4 live births
der Geflügelfütterung zur Prophylaxe der Perosis, die auch unter der Bezeichnung
„Ständerschwäche“ bekannt ist.
Beispiele von experimentellem Manganmangel bei Schwein und Kaninchen Experimentell ausgelöster Manganmangel bei Ratte, Kaninchen und Schwein kann
dazu dienen, Hinweise auf möglichst empfindliche Bedarfskriterien zu gewinnen. In
der Literatur wurde lange davon ausgegangen, dass der ohnehin sehr niedrige
Mangangehalt der Milch durch Manganmangel kaum verändert wird. Wie Abbildung 1
jedoch zeigt, sinkt der Manganspiegel der Milch beim Kaninchen im schweren
Manganmangel sehr drastisch ab (PALLAUF et al. 1993). Sogar das Colostrum weist
dann extrem niedrige Gehalte auf. Wie sich dies auf die Skelettentwicklung der ge-
säugten Jungtiere auswirkt, zeigt Abbildung 2. Gravierende Missbildungen der
Extremitäten sind die Folgen. Die essentielle Bedeutung des Mangans in der
Chondropoese kommt hier deutlich zum Ausdruck. Seit langem bekannt ist der
0.0
0.2
0.4
0.6
0.8
1.0
1.2
1.4
0 1 2 3 4 5 6 7 8 9 10 11 12 13 14 15 16 17 18 19 20 21
Days of lactation
mg
Mn/
kg m
ilk
Mn deficient rabbit Control rabbit
Fig. 1: Mn concentration in the milk of a Mn deficient rabbit (0.60 mg Mn/kg dietary DM) compared to a control animal (35 mg Mn/kg DM)

16
Fig. 4: Deformed extremities of a growing pig (30 kg live weight) fed a Mn deficient casein diet (1.0 mg Mn/kg) for 44 days
negative Einfluss eines Mangan-mangels auf die Fruchtbarkeit. Ab-bildung 3 zeigt den dritten Wurf einer Häsin nach längerem Manganmangel. Der Wurf weist bei 10 Totgeburten nur vier Lebendgeburten auf und zeigt auffallend große Entwicklungsunter-schiede zwischen den Neugeborenen (HEINEMANN 1991). Die Ver-krümmung der Vorderextremitäten bei einem wachsenden Schwein im
Manganmangel ist in Abbildung 4 dargestellt. Im Stoffwechselversuch bei Einzeltier-haltung zeigte dieses Tier trotz der Skelettschäden allerdings immer noch normale Zunahmen der Lebendmasse bei guter Futterverwertung. Spurenelementversorgung der Milchkuh Ein Vergleich der Versorgungsempfehlungen der GfE (2001) mit den Empfehlungen
des NRC (2001) zeigt, dass die NRC-Empfehlungen sowohl für Färsen als auch für
Milchkühe mit 0,30 mg Se/kg deutlich höher liegen (Tabelle 2). Wissenschaftlich be-
gründete Hinweise, dass die Empfehlungen der GfE (2001) unter Praxisbedingungen
nicht ausreichen, sind bisher jedoch nicht bekannt. Wird bei empfohlener Versor-
gungshöhe mit Spurenelementen und einer hohen täglichen Futteraufnahme
von 25 kg TM eine Milchleistung von 40 kg/Tag unterstellt, so ergibt ein vereinfachtes
Rechenbeispiel die in der letzten Spalte von Tabelle 2 in Prozent der Aufnahme auf-
geführten Exkretionen an Spurenelementen über die Milch. Während bei Mangan
und Cobalt weniger als 1 % der Gesamtaufnahme in der Milch erscheinen, sind es
bei Zink und Selen um die 12 %. Das Nahrungsiod hingegen wird zu mehr als einem
Fünftel in die Milch eingebaut. Unberücksichtigt ist bei dieser Modellrechnung aller-
Table 2: Utilization of trace elements for milk production in dairy cows
* GfE (2001)
1.80.16
12.82.4
22.40.8
12.0
22.02.0
160.06.02.80.040.6
0.550.054.00.150.070.0010.015
12501250125025012.55.05.0
505050100.500.200.20
Iron (Fe)Manganese (Mn)Zinc (Zn)Copper (Cu)Iodine (I)Cobalt (Co)Selenium (Se)
Excretionvia milk
in % of intake
Excretionvia milk at 40 kg milk/d
mg/d
Mean concentrationin milk *
mg/kg
Intake with a ration of 25 kg dietary dry matter
mg/d
Recommendation for dairy cows *
mg/kg dietary DM
Element

17
dings, dass vor allem bei Iod und Selen ein erheblicher Einfluss der Versorgungs-
höhe auf die Konzentration in der Milch besteht.
Ein Vergleich süddeutscher Grundfutteranalysen aus den Jahren 1998 bis 2001 mit
den Versorgungsempfehlungen (Abbildung 5 und 6) zeigt, dass Mangan in Heu und
Grassilage im Mittel reichlich enthalten ist, die Maissilage jedoch ein erhebliches
Defizit aufweist. Für Zink ergibt sich im Mittel nur bei Heu ein Defizit. Ein Problem
stellen natürlich die großen Schwankungen der nativen Gehalte dar, die bei Mittel-
wertvergleichen nicht berücksichtigt sind.
Bei Kupfer ist vor allem für Heu und Maissilage ein Ergänzungsbedarf zu verzeich-
nen. Die Problematik der durch Thiomolybdat-Komplexe evtl. erheblich reduzierten
Bioverfügbarkeit des Kupfers ist dabei noch gar nicht mit berücksichtigt. Das größte
Defizit ergibt sich jedoch bei Selen. Die nativen Gehalte liegen bei der Maissilage
extrem niedrig, aber auch Heu und Grassilage liegen im Mittel mit weniger als 0,05
mg/kg um mindestens 75% unterhalb der Versorgungsempfehlung. Bei Selen ist
somit ein ganz erheblicher Ergänzungsbedarf über das Mineralfutter gegeben.
0
50
100
Con
cent
ratio
n(m
g/kg
DM
)
recommendationfor Zn and Mn
Zn
Mn
Hayfirst cut
Grass silagefirst cut
Maize silage
Zn
Mn
Mn
Zn
Fig.5: Zinc and manganese concentrations in forages (BLT Grub 1998-2001) compared to recommendations for dairy cows (GfE 2001)
0.0
2.5
5.0
7.5
10.0
12.5
15.0
0.0
0.2
0.4
0.6
0.8
1.0
recommendation for Cu
recommendation for Se
Cu Se
Hayfirst cut
Grass silagefirst cut
Hayfirst cut
Grass silagefirst cut
Maize silageMaize silage
Con
cent
ratio
n(m
g/kg
DM
)
Con
cent
ratio
n(m
g/kg
DM
)
0.0
2.5
5.0
7.5
10.0
12.5
15.0
0.0
0.2
0.4
0.6
0.8
1.0
recommendation for Cu
recommendation for Se
Cu Se
Hayfirst cut
Grass silagefirst cut
Hayfirst cut
Grass silagefirst cut
Maize silageMaize silage
Con
cent
ratio
n(m
g/kg
DM
)
Con
cent
ratio
n(m
g/kg
DM
)
Fig. 6: Copper and selenium concentrations in forages (BLT Grub 1998-2001) compared to recommendations for dairy cows (GfE 2001)

18
Empfehlungen zur Versorgung von Geflügel und Ziegen mit Spurenelementen Die Versorgungsempfehlungen der GfE (1999) für Hühnergeflügel sind im Vergleich
zu Schwein und Rind für Eisen, Mangan und Iod teilweise höher (Tabelle 3). Für Iod
und Selen ist zu betonen, dass eine reichliche Versorgung zu in der Humaner-
nährung erwünschten, deutlich erhöhten Gehalten dieser Elemente im Ei führt.
Die jüngsten deutschen Versorgungsempfehlungen (GfE 2003) sind jene für Ziegen
(Tabelle 4). Gewisse Unterschiede zu anderen Wiederkäuern bestehen nach heuti-
ger Kenntnis bei Ziegen im Bedarf an Mangan und Iod. Die Empfindlichkeit gegen-
über erhöhten Kupfergaben ist bei der Ziege etwas geringer ausgeprägt als bei den
meisten Schafrassen. Die Verschlechterung der Iodverwertung bei Gegenwart von
Thyreostatica, z.B. aus Brassicaceaen oder bei hohen Nitratgehalten des Futters,
sollte auch bei der Ziege beachtet werden.
Absenkung der Höchstgehalte für Kupfer und Zink in der Schweinefütterung Nach den jüngst von der EU verabschiedeten neuen Höchstgrenzen für die Spuren-
elemente Zink und Kupfer beim Schwein (Tabelle 5) sind künftig nur noch maximal
150 mg Zn/kg Futter erlaubt. Bei entwöhnten Ferkeln und einer phytatreichen Mais-
Soja-Diät ohne Phytasezusatz ergab ein Zinkgehalt von 80 mg/kg Diät allerdings
Table 3: Trace element recommendations for poultry (GfE1999)
10060507
0.500.15
Broilers
10050507
0.500.15
Layers
7050406
0.400.15
Pullets
10060507
0.500.15
ChickenRecommended concentration (mg/kg dietary DM)
Iron (Fe)Manganese (Mn)Zinc (Zn)Copper (Cu)Iodine (I)Selenium (Se)
Trace element
10060507
0.500.15
Broilers
10050507
0.500.15
Layers
7050406
0.400.15
Pullets
10060507
0.500.15
ChickenRecommended concentration (mg/kg dietary DM)
Iron (Fe)Manganese (Mn)Zinc (Zn)Copper (Cu)Iodine (I)Selenium (Se)
Trace element
Table 4: Recommendation of trace elements in rations for goats (GfE 2003)
60-8050-8040-5010-15
0.30-0.800.15-0.200.10-0.20
Manganese (Mn)Zinc (Zn)Iron (Fe)Copper (Cu)Iodine(I)Cobalt (Co)Selenium (Se)
Recommended concentration*(mg/kg dietary DM)
Trace element
60-8050-8040-5010-15
0.30-0.800.15-0.200.10-0.20
Manganese (Mn)Zinc (Zn)Iron (Fe)Copper (Cu)Iodine(I)Cobalt (Co)Selenium (Se)
Recommended concentration*(mg/kg dietary DM)
Trace element
* The higher values are valid for growing lambs (Zn, Fe, Se), diets high in molybdenum andsulphur (Cu) and for reproductive goats in the presence of goitrogens (I)

19
noch keine optimale Versorgung (HÖHLER und PALLAUF 1994). Die Nutzung der
pharmakologischen Wirkung extrem hoher Zinkgaben von etwa 3000 mg/kg Futter
gegen Ferkeldurchfälle beim Absetzen ist futtermittelrechtlich ohnehin nicht erlaubt.
Bei Kupfer sind künftig für Ferkel bis zum Höchstalter von 12 Wochen (bisher 16
Wochen) noch 170 mg (bisher 175 mg) und für alle älteren Schweine 25 mg (bisher
35 mg) je kg Futter erlaubt. Der wachstumsfördernde Effekt hoher Kupfergaben beim
Schwein kann damit - wenn überhaupt - allenfalls noch bis zum Höchstalter von 12
Wochen ausgeschöpft werden. Im Vorfeld dieser vor allem ökologisch begründeten
Absenkung gab es intensive Diskussionen (SCHENKEL und FLACHOWSKY 2002,
WINDISCH 2002, KTBL 2002). Insgesamt erscheint die neue Regelung angemessen
und aus der Sicht der Tierernährung akzeptabel. Bei reduziertem quantitativen
Spielraum für Spurenelementergänzungen wird jedoch die unterschiedliche Biover-
fügbarkeit verschiedener Verbindungen besonders wichtig.
Aspekte der Bioverfügbarkeit von Spurenelementen Über die unterschiedliche Bioverfügbarkeit von Spurenelementverbindungen ist in
den vergangenen Jahren viel geforscht und publiziert worden. Die Ergebnisse sind
teilweise immer noch widersprüchlich, aber es kristallisierte sich doch bald heraus,
dass organische Komplexe unter bestimmten Bedingungen eine höhere Ver-
fügbarkeit aufweisen können als anorganische Verbindungen. Innerhalb der
anorganischen Spurenelementträger sind die Sulfate in der Regel aufgrund ihrer
hohen Löslichkeit am besten verfügbar. Nach niederländischen Untersuchungen
(Tabelle 6) zeigt Zinksulfat über die wichtigsten Nutztierarten hinweg innerhalb der
vier ausgewählten anorganischen Verbindungen im Mittel die höchste Biover-
fügbarkeit, gemessen an der Zinkeinlagerung in das Schienbein. Das Zink-
Aminosäurechelat jedoch zeigte beim Masthühnchen deutlich bessere Effekte.
Table 5: EU feed regulations for maximum levels of zinc and copper in pig feeds
Zinc (Zn)Copper (Cu)
15025
pigs older than 12 weeks
25035
pigs older than 16 weeks
150170
250175
pigs up to 12 weeks
pigs up to 16 weeks
from 26.1.2004 onwardsuntil 25.1.2004Concentration in mg per kg feed on the basis of 88% DM
Element
Zinc (Zn)Copper (Cu)
15025
pigs older than 12 weeks
25035
pigs older than 16 weeks
150170
250175
pigs up to 12 weeks
pigs up to 16 weeks
from 26.1.2004 onwardsuntil 25.1.2004Concentration in mg per kg feed on the basis of 88% DM
Element

20
Fig. 7: Retarded growth and parakeratosis in a piglet (right) after 32 days on an unsupplemented maize soja diet rich in phytate with 29 mg Zn/kg compared to a control piglet (left) supplemented with 71 mg Zn from Zn SO4 to reach 100 mg Zn/kg diet
Einen besonders negativen Einfluss auf die Verfügbarkeit von Zink und teilweise
auch anderen Spurenelementen bei Monogastriden wie Schwein und Huhn übt die
Phytinsäure in Getreide, Leguminosen und anderen Samen aus.
Den Effekt einer phytatreichen Mais-Soja-Ration mit und ohne Zinkergänzung beim
Ferkel zeigt Abbildung 7.
Das rechte Ferkel weist
schwere Wachstumsstörung-
en und Parakeratose auf,
während eine Zinkergänzung
um rund 70 mg/kg Futter zu
einer optimalen Entwicklung
führte. Durch Zulage des
Enzyms Phytase zu einer
phytatreichen Ration konnte
die scheinbare Zinkabsorp-
tion beim Ferkel von unter
20 % über knapp 25 % auf
über 30 % erhöht werden
(Abbildung 8). Neben der Phosphorverwertung kann durch Phytasezusatz bei Labor-
tieren, Schwein und Huhn auch die Verfügbarkeit von Zink und einigen anderen
Elementen wesentlich verbessert werden (RIMBACH und PALLAUF 1993,
WINDISCH und KIRCHGESSNER 1996, PALLAUF und RIMBACH 1997). Bei
zunehmendem Umweltbewusstsein und dem kritischen Hinterfragen von Spuren-
elementzulagen in der Tierernährung werden Fragen der Verfügbarkeit in Zukunft
noch stärker als bisher in den Vordergrund treten.
Table 6: Relative biological value of zinc sources evaluated by tibia ash content in different species (JONGBLOED et al. 2002)
BroilerRuminantsPigZinc compound
10093
10767
131
100584295
102
10098
92102
Zinc sulphateZinc carbonateZinc chlorideZinc oxideZinc amino acid chelate
SpeciesBroilerRuminantsPig
Zinc compound
10093
10767
131
100584295
102
10098
92102
Zinc sulphateZinc carbonateZinc chlorideZinc oxideZinc amino acid chelate
Species

21
Ernährungsphysiologische Bedeutung des Selens und Studien zur Bedarfs-ableitung bei Kaninchen und Ferkeln Die wichtigsten in der Literatur beschriebenen Mangelerscheinungen der beiden anti-
oxidativen Wirkstoffe Selen und Vitamin E (siehe COMBS und COMBS 1986) sind
Lebernekrose, Nierenversagen, Anämie sowie bei Geflügel Encephalomalacie und
exudative Diathese. Teilweise wirken dabei sowohl Selen als auch Vitamin E
präventiv oder aber auch nur einer der beiden antioxidativen Wirkstoffe.
Weiterhin sind nutritive Muskeldystrophie vieler Tierarten sowie die Maulbeerherz-
krankheit des Schweines zu nennen. Bei Rindern ist Selenmangel eine der mög-
lichen Ursachen für die Retention der Placenta. Neuere Untersuchungen liegen zur
männlichen Sterilität im Selenmangel bei Labornagern, Schweinen und Rindern vor.
Selen erfüllt unter anderem eine wichtige Funktion bei der Spermienreifung
(FORESTA et al. 2002).
Von den vier selenabhängigen Glutathionperoxidasen (BIRRINGER et al. 2002)
reagiert die celluläre GPx, auch als GPx1 bezeichnet, am empfindlichsten auf einen
Selenmangel. Sie erscheint daher als Bedarfskriterium besonders gut geeignet und
zeigt im Selenmangel auch eine drastische Reduktion in der Genexpression bei
Ratten (FISCHER et al. 2001) und Kaninchen (MÜLLER und PALLAUF 2002).
Die Ableitung des Selenbedarfes des wachsenden Kaninchens aus einem Dosis-
Wirkungsversuch aus unserem Institut mit Zulagen von 0,05-0,20 mg Selen/kg Diät
ist in Abbildung 9 dargestellt. Bei Kaninchen gab es bisher für Selen keine
experimentell begründeten Bedarfsangaben. Teilweise wurde die Essentialität des
Selens beim Kaninchen sogar angezweifelt. Allerdings wurden Futteraufnahme,
Zunahmen und Futterverwertung im untersuchten Zeitraum von 13 Wochen durch die
unterschiedlichen Selengehalte noch nicht signifikant beeinflusst. Als Bedarfskriterien
dienten die Selenkonzentration der Leber sowie die Aktivität der GPx1. Im Selen-
0
10
20
30
40
50Ap
pare
nt Zn
abso
rptio
n(%
of in
take)
controls 500 U phytase/kg 1000 U phytase/kg
a
bab
Fig. 8: Effect of microbial phytase supplementation to a maize soya diet (60 mg Zn/kg) on the apparent absorption of Zn in piglets (n = 3 x 8; live weight 12 kg) (PALLAUF, HÖHLER and RIMBACH 1992)

22
mangel zeigten sich schwerwiegende prooxidative Veränderungen zellulärer Lipide
und Proteine. Die GPx1-Aktivität erreichte unter den geprüften Bedingungen bereits
bei einer Zulage von 0,10 mg Selen ein Maximum, während die Selenkonzentration
der Leber bei 0,15 mg Selen noch eine tendenzielle Steigerung erfuhr. Daraus lässt
sich ableiten, dass wachsende Kaninchen mit 0,15 mg Selen ausreichend versorgt
sein dürften. Dies setzt allerdings ein Minimum an Vitamin E im Futter voraus. In
unserem Versuch waren in allen Gruppen 30 mg α-Tocopherol je kg Diät zugesetzt.
Bei Analysen handelsüblicher Mischfutter für Kaninchen stellten wir fest, dass die
Selengehalte meist deutlich überhöht waren, während die Vitamin E-Gehalte vielfach
sehr knapp bemessen waren. Möglicherweise hat dies mit den unterschiedlichen
Kosten für die beiden Zusatzstoffe zu tun.
Die Ergebnisse eines Versuches an frühabgesetzten Ferkeln ab etwa 9 kg Lebend-
masse sind in Abbildung 10 dargestellt. Bei insgesamt hohen mittleren Tageszunah-
men zeigte sich zwischen den Gruppen, wie bei den Kaninchen, auch bei den
Ferkeln während der in diesem Falle 7wöchigen Versuchsperiode kein signifikanter
8.62
227390
79.9
945904725
557
409411
0
200
400
600
800
1000
1200
0 0.05 0.10 0.15 0.20
Selenium supplementation (mg/kg diet)
Sele
nium
conc
entr
atio
n(µ
g/kg
fres
hm
atte
r)G
Px1
activ
ity(m
U/m
gpr
otei
n) Se GPx1 (cd) (d)
(a)(a)
(b)
(b)
(b)
(c)(c) (c)
8.62
227390
79.9
945904725
557
409411
0
200
400
600
800
1000
1200
0 0.05 0.10 0.15 0.20
Selenium supplementation (mg/kg diet)
Sele
nium
conc
entr
atio
n(µ
g/kg
fres
hm
atte
r)G
Px1
activ
ity(m
U/m
gpr
otei
n) Se GPx1
8.62
227390
79.9
945904725
557
409411
0
200
400
600
800
1000
1200
0 0.05 0.10 0.15 0.20
Selenium supplementation (mg/kg diet)
Sele
nium
conc
entr
atio
n(µ
g/kg
fres
hm
atte
r)G
Px1
activ
ity(m
U/m
gpr
otei
n) Se GPx1 (cd) (d)
(a)(a)
(b)
(b)
(b)
(c)(c) (c)
00.05
0.100.15
0.20
GPx1activity
Seconcentration
00.05
0.100.15
0.20
GPx1activity
Seconcentration
Fig. 9: Dietary selenium requirement of growing rabbits determined by liver selenium concentration and activity of liver GPx1
12,4 37,8
220
367 415444
83,9 12693,1 127
0
100
200
300
400
500
0 0.05 0.10 0.20 0.30
Selenium supplementation (mg/kg diet)
Sele
nium
conc
entr
atio
n(µ
g/kg
fres
hm
atte
r)G
Px1
activ
ity(m
U/m
gpr
otei
n)
Se GPx1 (d)
(a)
(b)
(c) (cd)
(a) (b)
(c) (d) (d)
12,4 37,8
220
367 415444
83,9 12693,1 127
0
100
200
300
400
500
0 0.05 0.10 0.20 0.30
Selenium supplementation (mg/kg diet)
Sele
nium
conc
entr
atio
n(µ
g/kg
fres
hm
atte
r)G
Px1
activ
ity(m
U/m
gpr
otei
n)
Se GPx1
12,4 37,8
220
367 415444
83,9 12693,1 127
0
100
200
300
400
500
0 0.05 0.10 0.20 0.30
Selenium supplementation (mg/kg diet)
Sele
nium
conc
entr
atio
n(µ
g/kg
fres
hm
atte
r)G
Px1
activ
ity(m
U/m
gpr
otei
n)
Se GPx1 (d)
(a)
(b)
(c) (cd)
(a) (b)
(c) (d) (d)
00.05
0.100.20
0.30
GPx1activity
Seconcentration
00.05
0.100.20
0.30
GPx1activity
Seconcentration
Fig. 10: Dietary selenium requirement of growing pigs determined by liver selenium concentration and activity of liver GPx1

23
Einfluss auf Futteraufnahme und Futterverwertung. Der Vitamin E-Zusatz von einheit-
lich 10 mg α-Tocopherol je kg Futter wurde bewusst knapp bemessen, deckt aber
nach NRC-Angaben (1998) den Minimalbedarf. Gemessen wiederum an den Krite-
rien Selenkonzentration der Leber und GPx1-Aktivität der Leber zeigt sich hier, dass
sich aus der Dosis-Wirkungskurve ein Bedarf von 0,20 mg Selen/kg Futter ableitet.
Die höhere Zulage von 0,30 mg ergab keine weitere Steigerung der Enzymaktivität
und auch der Selengehalt der Leber stieg nur noch tendenziell. Abschließend ergibt
sich damit, dass für rasch wachsende Ferkel unter den geprüften Bedingungen ein
Selengehalt des Futters von mindestens 0,20 mg/kg erforderlich ist.
Zusammenfassung Der Optimalbedarf an Spurenelementen wird in der Regel von Dosis-Wirkungsver-
suchen anhand sensitiver biochemischer Kriterien abgeleitet, da die faktorielle Ablei-
tung aufgrund lückenhafter Daten häufig nicht möglich ist. Aus dem Bedarf leiten sich
unter Einbeziehung eines Sicherheitszuschlages die Versorgungsempfehlungen ab,
die für Schwein, Rind, Geflügel und Ziegen vorgestellt werden. Jüngste Studien er-
geben einen Selenbedarf von etwa 0,15 mg/kg Diät für wachsende Kaninchen und
von mindestens 0,20 mg/kg für Ferkel. Die Kenntnis des nativen Gehaltes von Futter-
mitteln sowie die präzise Spurenelementergänzung zur Vermeidung von Überdosie-
rungen ist nicht nur aus ökologischen Gründen unabdingbar. Eine hohe Bioverfüg-
barkeit der nativen Gehalte, z.B. durch Einsatz von Phytase in phytatreichen Rati-
onen für Schwein und Geflügel, sowie insbesondere der zugeführten Spurenelement-
träger ist wichtig für die Reduktion der Exkretion ohne Einbußen bei Tiergesundheit
und Leistung.
Summary Assessment of trace element supply in animal nutrition The optimum trace element requirement is normally derived from dose response and
performance studies taking sensitive biochemical parameters into consideration. The
factorial approach is often not possible because of a lack of experimental data. The
recommendation for supply is based on requirement but also normally includes a
safety margin. Current recommendations for trace element supply of pigs, cattle,
poultry and goats are presented. Recent studies show that the requirement of
selenium in growing rabbits is about 0.15 mg Se/kg diet whereas piglets need at least
0.20 mg Se/kg diet. Knowledge of the native content of feedstuffs and fine tuning of

24
trace element supplementation to avoid an oversupply is crucial. Ensuring high
availability of the chemical compounds of trace element supplements and also of the
native content, e.g. by addition of phytase to phytate rich diets for pigs and poultry, is
important to reduce trace element excretion without loss of animal health and
performance.
Literatur AFRC (Agricultural and Food Research Council) (1990): AFRC Technical Committee
on Responses to Nutrients, Report Number 4, Nutrient requirements of sows and boars. Nutr. Abstr. Rev. (Series B) 60 383-406
ARC (Agricultural Research Council) (1981): The Nutrient Requirements of Pigs. Commonwealth Agricultural Bureaux, Slough UK
Birringer M, Pilawa S, Flohé L (2002): Trends in selenium biochemistry. Nat Prod Rep 19, 693-718
BLT Grub (1999-2001): Jahresberichte der Bayer. Landesanstalt für Tierzucht Grub Combs G F, Combs S (1986): The Role of Se in Nutrition. Academic Press, Orlando Fischer A, Pallauf J, Gohil, K, Weber SU, Packer L, Rimbach G (2001): Effect of
selenium and vitamin E deficiency on differential gene expression in rat liver. Biochem Res Commun 285, 470-475
Foresta C, Flohé L, Garolla A, Roveri A, Ursini F, Maiorino M (2002): Male fertility is linked to the selenoprotein phospholipid hydroperoxide glutathione peroxidase. Biol Reprod 67, 967-971
GfE (1987): Empfehlungen zur Energie- und Nährstoffversorgung von Schweinen, DLG- Verlag Frankfurt/M.
GfE (1999): Empfehlungen zur Energie- und Nährstoffversorgung von Legehennen und Masthühnern, DLG-Verlag Frankfurt/M.
GfE (2001): Empfehlungen zur Energie- und Nährstoffversorgung der Milchkühe und Aufzuchtrinder, DLG-Verlag Frankfurt/M.
GfE (2003): Recommendations for the Supply of Energy and Nutrients to Goats, DLG-Verlag Frankfurt/M.
Heinemann V (1991): Einfluss eines alimentären Manganmangels auf die Repro- duktionsleistung weiblicher Kaninchen. Diss. med. vet. Universität Gießen
Höhler D, Pallauf J (1994): Effekt einer abgestuften Zn-Zufuhr und Zulagen von Citronensäure zu einer Mais-Soja-Diät auf Leistungsparameter und Mineralstoffverwertung beim Ferkel. J Anim Physiol Anim Nutr 71, 189-199
INRA (Institut National de la Recherche Agronomique) (1989): L’alimentation des animaux monogastriques: porc, lapin, volailles; 2. ed. Paris
Jongbloed A W, Kemme P A, Groote G, Lippens M, Meschy F (2002): Bioavailability of major and trace minerals. EMFEMA Int. Ass. Europ. (EU) Manufactures of Major, Trace and Specific Feed Mineral Materials, Brussels, zitiert in: European Commission, Directorate C , Opinion of the Scientific Committee for Animal Nutrition on the Use of Zinc in Feedingstuffs 2003
KTBL (2002): Fütterungsstrategien zur Verminderung von Spurenelementen/Schwer- metallen in Wirtschaftsdüngern. KTBL-Schrift 410, Darmstadt
Müller A S, Pallauf J (2002): Downregulation of GPx1 mRNA and the loss of GPx1 activity cause cellular damage in the liver of selenium deficient rabbits. J Anim Physiol Anim Nutr 86, 273-287

25
NRC (National Research Council) (1998): Nutrient Requirements of Swine, 10th ed. National Academy of Sciences, Washington, D.C.
NRC (National Research Council) (2001): Nutrient Requirements of Dairy Cattle 7th ed., National Academy Press Washington D.C.
Pallauf J, Höhler D, Rimbach G (1992): Effekt einer Zulage an mikrobieller Phytase zu einer Mais-Soja-Diät auf die scheinbare Absorption von Mg, Fe, Cu, Mn und Zn sowie auf Parameter des Zinkstatus beim Ferkel. J Anim Physiol Anim Nutr 68, 1-9
Pallauf J, Brandt K, Heinemann V (1993): Extent of manganese depletion in blood, milk and organs of female rabbits fed a Mn deficient diet over four reproductive cycles. p. 296-299 in: Proceedings 8th Int. Symp. Trace Elements in Man and Animals (ANKE et al. eds.) Verlag Media Touristik Gersdorf
Pallauf J, Rimbach G (1997): Nutritional significance of phytic acid and phytase. Arch Anim Nutr 50, 301-319
Rimbach G, Pallauf J (1993): Improvement of zinc availability from soy protein isolate by microbial phytase in growing rats. Proceedings Int Conf Bioavailability 1993, Ettlingen (Schlemmer, U. ed.) Part 1, p. 295-298, Karlsruhe
Schenkel H, Flachowsky G (2002): Zur Spurenelementversorgung landwirtschaft-licher Nutztiere. Kraftfutter/Feed Magazine 9/02, 318-329
Windisch W, Kirchgessner M (1996): Zum Effekt von Phytase auf die scheinbare Verdaulichkeit und Gesamtverwertung von Eisen, Kupfer, Zink und Mangan bei abgestufter Ca-Versorgung in der Ferkelaufzucht und in der Broilermast. Agribiol Res 49, 23-29
Windisch W (2002): Konsequenzen der geplanten Reduzierung der zulässigen Höchstwerte von Zink und Kupfer im Tierfutter für die Schweinefütterung. Lohmann Information 4/2002, 7-12

26
Aspects for Determining the Requirement of B-Vitamins Roth-Maier, D.A. Division of Animal Nutrition, Technical University Munich, Hochfeldweg 6, D-85350 Freising-Weihenstephan, Germany
Introduction In vitamin research the aspects for determining the requirements are the same as in
the field of nutrient research. This means that for the evaluation of the requirements
or of the recommendations for the daily intake, the factorial method instead of merely
dose-response results should be preferred. The factorial model, however, requires
research on the different metabolic processes and their influence and role in the re-
quirement. This knowledge allows also certain influences on specific metabolic pro-
cesses and production criteria and consequently on the requirement. In this context,
a distinction must be made between minimum and optimum requirement. The mini-
mum requirement expresses the amount of vitamin, which prevents grossly apparent
deficiency symptoms. The optimum requirement is defined as the amount, which is
necessary for maximum production. Thus, optimum supply eliminates even those
deficiency symptoms, which are a response to only a slight inadequacy in supply.
The optimum requirement may be assessed by sensitive biochemical criteria, which
are specific only for a particular vitamin. The range between minimum and optimum
requirement defines the suboptimum supply (Kirchgessner and Maier 1968). Many
values given as the level of the requirement of B-vitamins are still minimum require-
ments. In some cases, however, the optimum requirement could nowadays already
be taken into consideration in the recommendations for the dietary intake (GfE 1987,
2000). This is possible on the basis of our intensive research in the previous years. In
the following passages some different aspects are described for elucidating the de-
termination of the optimum requirements of B-vitamins.
1. Availability and absorption
Optimum supply with vitamins begins in a first step with the analysis of the vitamin
contents in foods. Besides the gross contents, the availability or bioavailability of na-
tive B-vitamins is relevant. For the availability the in vivo-determination of the appar-
ent precaecal digestibility with pigs as an animal model is a good and predicative
parameter.

27
This was established in a series of experiments (e.g. Roth-Maier et al. 1998, Wauer
et al. 1999). In Table 1 the results for the availability of thiamin, vitamin B6, pan-
tothenic acid and niacin from selected foods are summarized (Roth-Maier et al. 1999
a, b, 2000, 2002). These data, which can be taken as the quantitative measure for
the absorption of the vitamins, demonstrate that in some cases the native sources
provide only small quantities of their gross contents for the metabolism. This has to
be taken into consideration for the real evaluation of food as B-vitamin supplier.
Tab. 1: Precaecal digestibility of thiamin, vitamin B6, pantothenic acid and niacin
from different food sources
Precaecal digestibility, % Thiamin Vitamin B6 Pantothenic acid Niacin
Eggs, boiled 82 ± 3 67 ± 4 92 ± 2 - Milk powder 88 ± 2 84 ± 2 95 ± 2 17 ± 6 Fish, stewed 73 ± 2 85 ± 1 28 ± 4 94 ± 1 Pork, roasted 96 ± 2 89 ± 3 74 ± 7 65 ± 9 Beef, roasted 79 ± 9 89 ± 2 65 ± 4 69 ± 9 Bananas 77 ± 6 86 ± 4 55 ± 2 62 ± 8 White cabbage 81 ± 3 91 ± 0 45 ± 9 38 ± 8 Potatoes, boiled 85 ± 5 87 ± 2.5 70 ± 16 69 ± 8 Whole-meal bread 89 ± 4 71 ± 2 28 ± 12 40 ± 19 Brown rice, boiled 94 ± 2 16 ± 1 63 ± 3 73 ± 3 Soybeans, boiled 94 ± 2 76 ± 4 32 ± 2 - Corn 81 ± 0 67 ± 1 36 ± 0.3 43 ± 2 Barley 94 ± 2 63 ± 6 - 47 ± 6 Wheat 89 ± 4 69 ± 4 81 ± 4 59 ± 12 Wheat bran 92 ± 2 56 ± 5 58 ± 4 26 ± 9 Rye 84 ± 1 51 ±11 17 ± 18 14 ± 3 Soybean meal 89 ± 4 75 ± 4 44 ± 26 19 ± 1 Brewer’s yeast 91 ± 2 78 ±6 37 ± 20 80 ± 2 Values are means ± SD

28
The mechanism of the absorption for e.g. vitamin B6 is mainly a passive diffusion,
which was demonstrated in studies with isolated everted intestinal sacs (Zinner et al.
1981). The preceding supply status of the animal is of no effect on absorption. On the
other hand also enzymatic reactions in the intestinal wall may favour the passive dif-
fusion of vitamin B6 but mainly in a minimum supply status. Therefore vitamin B6 con-
centration in the blood is in close, linear relation to dietary supply (Fig. 1, Kirchgess-
ner et al. 1996). Accordingly, the estimation of blood concentration reflects mostly
linearly the actual intake and cannot be regarded as useful means for reliable nutri-
tional assessment. This is valid for all vitamins although the mechanism of absorption
is different for the different vitamins (Rucker et al. 2001).
2. Excretion in milk, urine and feces The excretion of B-vitamins was estimated in milk, urine and feces. The influence of
the dietary intake on thiamin, riboflavin and vitamin B6 concentration in milk was de-
termined with rats as an animal model for women and sows. Fig. 1 represents also
the strong but not linear dose-response for vitamin B6 in milk (Kirchgessner et al.
1996). Similar results could be observed for thiamin and riboflavin (Roth-Maier et al.
1997 a, b). The consequence from these observations is that the nutrition of the off-
spring can be ameliorated strongly by the nutrition of the dams.
0
0,2
0,4
0,6
0,8
1
1,2
1,4
0 3 6 9 12 15 18 21 24 27 30 33 36mg Vitamin B6 / kg diet
Vit
amin
B6
con
cen
trat
ion
, µg/
ml
y=0.065+0.02x R=98.5% s=0.03 µg/ml
y=0.019+0.0407x -0.000459x2
R=98.0% s=0.047 µg/ml
y=0.22+0.054x -0.000707x2 R=98.7% s=0.046 µg/ml
Fig.1: Vitamin B6 concentration in blood and milk of rats in response to the dietary vitamin B6 supply
milk 13th day
milk 7th day
blood

29
Tab. 2: Mean daily urinary and fecal vitamin B6 excretion of gravid rats
The fecal and urinary excretion in response to a varying dietary supply was
measuared for vitamin B6 in metabolic trials with gravid rats (Reithmayer et al. 1985,
Tab. 2). Both excretion pathways are significantly influenced by the dietary intake of
vitamin B6. The tremendous increase via urinary excretion on the diet with 10 versus
1 mg vitamin B6/kg demonstrates that excretion in urine is the main excretion path-
way for the not retained vitamin B6 after increasing dietary intake. The mainly ab-
sorbed amount of the vitamin is eliminated between only few hours. Therefore urinary
excretion is very often used in combination with specific functional substances as a
diagnostic parameter for the determination of vitamin B6 supply status (Rucker et al.
2001).
3. Concentration in organs and carcass and vitamin utilization As a further approach to a factorial research the relation between dietary supply of
vitamin B6 and content in organs and carcass of rats was determined (Fig. 2, Roth-
Maier and Kirchgessner 1981). Vitamin B6 concentration in liver and carcass in-
Vitamin B6 in the diet, mg/kg 1 10
Daily fecal excretion, µg 2.4 ± 0.2 3.3 ± 0.2
Daily urinary excretion, µg 1.6 ± 0.4 35.7 ± 12.4
0
1
2
3
4
5
6
7
8
9
10
0 2 4 6 8 10 12 14 16 18 20 22 24mg vitamin B6 / kg diet
Vita
min
B6 c
once
ntra
tion,
µg/
g
Liver y = 8.153 + 1.087 · logx; B = 0.98; s y · x = ± 0.31 (3.8%)
Residual carcass y = 1.46 + 0.28 · logx; B = 0.82; s y · x = ± 0.30 (20.4%)
Fig. 2: Vitamin B6 concentration in liver and residual carcass in response to dietary vitamin B6 supply

30
creased immediately and then remained constant, when dietary vitamin B6 concen-
tration increased from 3 to 6 mg/kg. These findings demonstrating that vitamin B6
utilization is influenced by dietary intake are shown in Fig. 3 (Reithmayer et al. 1985).
With increasing intake of vitamin B6 utilization reaches an almost constant level in
response to the plateaus in vitamin B6 concentration and content in the organs and
total body. This level is not a result of a homeostatic regulation, like it is valid for the
regulation in trace element metabolism (Kirchgessner 1987), but originates mainly
from a limited amount of apoenzyme.
4. Aspects in gravidity and lactation Our research work was extended for thiamin, riboflavin and vitamin B6 to the produc-
tion stages of gravidity and lactation in order to elucidate the specific role of B-vit-
amins for women in these stages. For this purpose several experiments with rats
were designed using an almost vitamin-free semisynthetic diet.
In the experiments dealing with vitamin B6, the diet was supplemented with vitamin B6
up to 48 mg/kg, that means a certainly multiple of the requirement. With 1 mg vitamin
B6/kg diet fetuses, placenta and amniotic fluid contained significantly less vitamin B6
than in the higher supply levels (Fig. 4, Kirchgessner et al. 1985; Reithmayer et al.
0
10
20
30
0 6 12 18 24 30 36 42 48
Fig.3: Vitamin B6 utilization in response to dietary vitamin B6 intake
Vitamin B6 concentration in the diet,mg / kg
Vita
min
B6 u
tiliz
atio
n (%
of i
ntak
e)
y = -1.08 + 14.36*1/x 0.7;B = 0.99; s y· x = 0.77(6.0%)
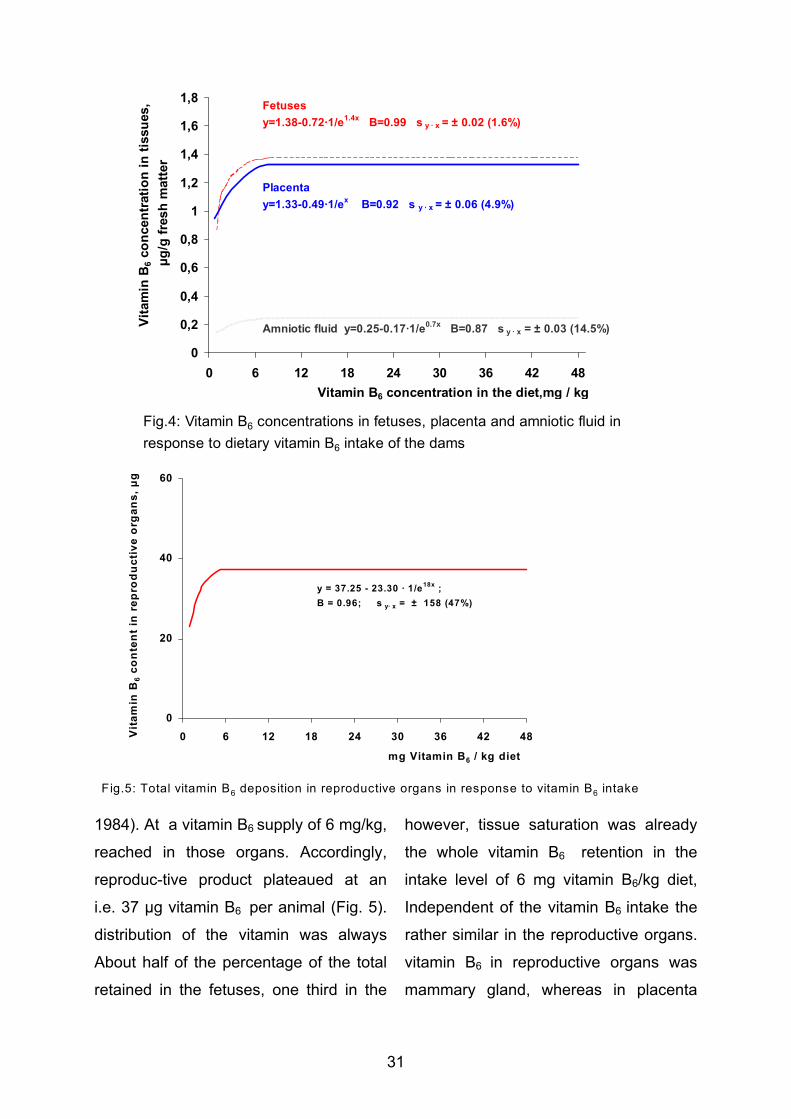
31
1984). At a vitamin B6 supply of 6 mg/kg, however, tissue saturation was already
reached in those organs. Accordingly, the whole vitamin B6 retention in the
reproduc-tive product plateaued at an intake level of 6 mg vitamin B6/kg diet,
i.e. 37 µg vitamin B6 per animal (Fig. 5). Independent of the vitamin B6 intake the
distribution of the vitamin was always rather similar in the reproductive organs.
About half of the percentage of the total vitamin B6 in reproductive organs was
retained in the fetuses, one third in the mammary gland, whereas in placenta
0
0,2
0,4
0,6
0,8
1
1,2
1,4
1,6
1,8
0 6 12 18 24 30 36 42 48 Vitamin B6 concentration in the diet,mg / kg
Vita
min
B6 c
once
ntra
tion
in ti
ssue
s, µ
g/g
fres
h m
atte
r
Amniotic fluid y=0.25-0.17·1/e0.7x B=0.87 s y · x = ± 0.03 (14.5%)
Fetusesy=1.38-0.72·1/e1.4x B=0.99 s y · x = ± 0.02 (1.6%)
Placentay=1.33-0.49·1/ex B=0.92 s y · x = ± 0.06 (4.9%)
Fig.4: Vitamin B6 concentrations in fetuses, placenta and amniotic fluid in response to dietary vitamin B6 intake of the dams
0
20
40
60
0 6 12 18 24 30 36 42 48
Fig.5: Total vitamin B6 deposition in reproductive organs in response to vitamin B6 intake
mg Vitamin B6 / kg diet
Vit
amin
B6
con
ten
t in
rep
rod
uct
ive
org
ans,
µg
y = 37.25 - 23.30 · 1/e18x ; B = 0.96; s y· x = ± 158 (47%)

32
only about 12 % were stored. Less than 10 % of the totally deposited vitamin B 6 are
distributed among the uterus, the amnions and the amniotic fluid.
In human physiology some special characteristics are assumed during gravidity con-
cerning vitamin B6 metabolism. Therefore a two factorial model trial with rats was de-
signed to compare vitamin B6 status of gravid and nongravid animals in response to a
varying dietary vitamin B6 intake. The experiment was finished on day 19 of gravidity
of the pregnant rats (Reithmayer et al. 1985). The vitamin B6 status of the liver, which
contained an average of 8.4 µg vitamin B6/g fresh matter, was not influenced by
pregnancy. In muscle and carcass, however, pregnancy caused a significant reduc-
tion by 6 and 7%, resp., to vitamin B6 concentrations of 4.8 and 2.6 µg/g fresh-matter.
The total vitamin B6 pool in nongravid and gravid rats in response to dietary vitamin
B6 intake is shown in Fig. 6. There was a significant difference only between the
group with 1 mg vitamin B6 and the extremely high supplemented groups with 24 and
48 mg vitamin B6/kg feed. This means that above 6 mg vitamin B6/kg diet there was
no further significant increase. On the other hand the whole vitamin B6 pool of the
maternal organism, except the reproductive product, decreased in pregnancy from an
average of 651 to 596 µg vitamin B6 (minus 8 %) even with optimum supply. Even
the total vitamin B6 content of the gravid rats plus the reproductive product (medium
500
520
540
560
580
600
620
640
660
680
700
0 6 12 18 24 30 36 42 48Vitamin B6 concentration in diet mg / kg
Vit
amin
B6
con
ten
t, µ
g
Vitamin B6 content grav id without reproduction products
y=637.4-76.1· 1/e0.2x B=0.91 sy.x= ±9.27(16%)
Total v itamin B6 content, grav id y=662.14-83.7·1/e0.4x B=0.90 sy.x= ±11.91(1.9%)
Total v itamin B6content, nongrav id y=687.6 -19.5·1/e0.6x B=0.92 sy.x= ±15.01(2.3%)
Fig.6: Total vitamin B6 content (y) of nongravid and gravid rats in response to dietary B6 supply (x)

33
curve) ranged slightly below the nongravid animals. This demonstrates that the
gravid animals cannot retain further vitamin B6 in the reproductive product despite of
the additional vitamin B6 supplements. It is concluded therefore that fetal vitamin B6
supply during gravidity is not a result of an increased vitamin B6 retention but the re-
sult of a reduction in maternal vitamin B6 pool. That means for vitamin B6 in contrast
to the results concerning trace elements (Kirchgessner 1987), that a superretention
could not be proved during gravidity. Moreover, a recommendation for the optimum
vitamin B6 requirement in pregnancy was derived from the present results. Accor-
dingly, a supply of 6 mg vitamin B6/kg diet, equivalent to a daily intake of 80 µg vita-
min B6, is thought to be adequate to ensure an optimal vitamin B6 status in pregnant
rats.
In contrast to vitamin B6 the results for thiamin from experiments with gravid rats
show different reactions (Kirchgessner et al. 1990; Rajtek et al. 1990 a, b; Roth-Maier
et al. 1990). This is shown in Fig. 7. For thiamin a pregnancy anabolism was demon-
strated which amounted in liver 1.4 µg per day or 29 µg during the whole period. In
whole body the anabolism started from 3.3 mg/kg dietary thiamin, plateaued until 100
mg/kg dietary thiamin on a level of 30 µg thiamin or 1.5 µg per day (Roth-Maier et al.
1990). This is in contrast to the gestation anabolism of protein, energy and minerals
which are in close response to the intake.
0
2 0
4 0
6 0
8 0
1 0 0
1 2 0
1 4 0
7
Fig.7: Thiamin anabolism of gravid versus non gravid rats in responseto different dietary thiamin supply
mg thiamin / kg diet
Tiam
in a
nabo
lism
inge
stat
ion,
µg
Non gravid control animals
Anabolism
Whole carcass of gravid rats
Negativeretention
Reproductive product
12000120012032164 81
20
Fig.7: Thiamin anabolism of gravid versus non gravid rats in responseto different dietary thiamin supply
mg thiamin / kg diet
Tiam
in a
nabo
lism
inge
stat
ion,
µg
Non gravid control animals
Anabolism
Whole carcass of gravid rats
Negativeretention
Reproductive product
12000120012032164 81 20
20
0
40
60
80
100
120
140

34
During lactation, the vitamin concentration in milk in response to the dietary supply of
thiamin, riboflavin and vitamin B6 (see Fig. 1) was determined. The concentrations of
these vitamins in rat dams and their offspring were also used to ascertain the supply
status of these vitamins (Tab. 3, Roth-Maier et al. 1997 b). Dietary thiamin concentra-
tions ranging from deficient to excessive supply during lactation were shown to vary
the corresponding vitamin levels in body of rat dams and their offspring and were
also shown to influence the thiamin level in milk markedly. Such a dose-response re-
lationship has also been found for other B-vitamins including pyridoxin and riboflavin
(Kirchgessner et al. 1996, Roth-Maier et al. 1997a). However, in all cases the dose-
dependence between dietary and body or milk thiamin did not show any clear-cut
saturation characteristic. Consequently, this strong variation of the thiamin level in
milk caused by the dose-response relationship between thiamin in food and milk
caused marked differences in thiamin status of the rat pups, where blood and liver
reflected the thiamin level better than the carcass. As a result of these investigations
it could be derived that the most sensitive variables for determining thiamin status are
the thiamin concentration in milk (Roth-Maier et al. 1997b) and the transketolase ac-
tivity in blood (see below).
Table 3: Concentration of thiamin in milk (day 13), liver and carcass of lactating rat dams and their offspring. The dams received different dietary thiamin con- centrations.
Thiamin Thiamin concentration in tissue, mg/kg
in diet Rat dams Offspring
(mg/kg) Milk Liver Carcass Blood Liver Carcass
0 0.10a 0.94a 0.44 a 1.56a 1.20 a 0.34a
2 0.47ab 2.65b 1.03 b 3.19b 2.42b 0,52b
4 1.47abc 4.48c 1.55 c 5.18c 7.71c 1.19c
6 2.49bcd 6.94d 2.07d 8.52d 11.92d 1.55d
7 2.80cd 7.69d 2.16d 11.47e 13.00e 1.81e
40 5.28e 9.36e 2.81e 14.66f 15.14f 2.22f
350 8.02f 12.18f 3.78f 17.04g 16.43g 2.40g
3500 18.90g 16.79g - 1) 23.31h 17.48h 3.37h 1) not analyzed

35
5. Estimation of the requirement by biochemical criteria The knowledge of the metabolic functions of the vitamins is a prerequisite in the
search for specific biochemical criteria suited to diagnose suboptimum states of sup-
ply. The most convenient biochemical criteria are those that could be determined in
easy available sources as e.g. blood, milk or urine which facilitates the assessment
of the requirements significantly. The B-vitamins are constituents of various enzymes
and we have tested the reactions of the activities of transketolase for thiamin (Roth-
Maier et al. 1997), the erythrocyte glutathion reductase for riboflavin (Hirschvogl et al.
1997) and the aspartate-aminotransferase and alanine-aminotransferase for pyri-
doxine (Kirchgessner et al. 1996). According to the newer concepts, also the ideal
biochemical parameter for estimating the optimum requirement would be one that
shows a marked increase or decrease when the vitamin supply rises above the state
of deficiency, but would finally reach a plateau at which there is no further response
to additional increments of supply. For pyridoxine in response to varying vitamin B6
intake we determined besides other criteria e.g. the pyridoxal dependent urinary ex-
cretion of xanthurenic acid in 24h-urine after a tryptophan load in piglets weighing 15-
20 kg (Fig. 8, Kösters and Kirchgessner 1976). For riboflavin the activity coefficient of
the erythrocyte glutathion reductase showed a desired course in response to the
riboflavin supplementation (Fig. 9) in lactating rats (Hirschvogl et al. 1997). Both crite-
ria plateaued and the statistical calculation using the “broken-line” and/or the
“Reading” model confirmed additionally that these criteria could be used. The results
0
5
10
15
20
25
30
0 500 1000 1500 2000 2500 3000 3500 4000 4500
Fig.8: Urinary xanthurenic acid excretion (y) of piglets in response to daily vitamin B6 intake (x)
Vitamin B6 intake, µg
Xant
hure
nic
acid
exc
retio
n,µm
ol/2
4h p
er p
igle
t
A
BC D E F
A = 0.5B = 1,2C = 2.0D = 2.8E = 3.5F = 6.6
Dietary vitamin B6 content in mg/kg

36
indicate for vitamin B6 a dietary requirement of 2.8 mg per kg for piglets with a
liveweight of 10 – 21 kg and for riboflavin a supplementation of 5-6 mg for lactating
rats to a semisynthetic diet.
Summary In modern nutritional vitamin research one of the major concerns is the elucidation of factors which influence the optimum requirement. Also for vitamins the determination of the requirements by means of the factorial method and the knowledge of influ-ences and dependences of each factor is necessary. These are absorption and ex-cretion studies in feces, urine and milk and availability data, determinations of con-centrations and contents of various organs, investigations on gravidity and lactation and their special effects and also biochemical criteria to determine the optimum re-quirement. For this purpose experiments concerning thiamin, riboflavin, vitamin B6, nicotinic acid and pantothenic acid are presented using animal models (rats, pigs). References GfE, Gesellschaft für Ernährungsphysiologie (1987): Empfehlungen zur Energie- und
Nährstoffversorgung von Schweinen. DLG-Verlag Frankfurt (Main) GfE, Gesellschaft für Ernährungsphysiologie (2000): Empfehlungen zur Energie- und
Nährstoffversorgung von Legehennen und Masthühnern (Broiler) 1999. DLG-Verlag Frankfurt (Main)
Hirschvogl G, Roth-Maier D A, Kirchgessner M (1997): Arch.Anim.Nutr. 50, 245-256 Kirchgessner M (1987): Übers.Tiernährg. 15, 153-192 Kirchgessner M, Maier D A (1968): Arch. Tierern. 18, 300-308 Kirchgessner M, Benedikt J, Roth-Maier D A (1996): J.Anim.Physiol.a.Anim.Nutr. 75,
83-95
1,2
1,3
1,4
1,5
1,6
1,7
1,8
1,9
2
0 1 2 3 4 5 6 7 8 9 10 11 12
Fig.9: Derivation of riboflavin requirement by means of the erythrocyte glutathione reductase (EGR)activity coefficient in response to riboflavin supplementation in lactation
Riboflavin supplementation in lactation, mg/kg diet
EG
R a
ctiv
ity
coef
fici
ent „Reading“ model
„broken-line“ model
6,34,2

37
Kirchgessner M, Rajtek S, Roth-Maier D A (1990): J.Anim.Physiol.a.Anim.Nutr. 64, 161-173
Kirchgessner M, Reithmayer F, Roth-Maier D A (1985): Ann.Nutr.Metab. 29, 138-146 Kösters W W, Kirchgessner M (1976): Internat.J.Vit.Nutr.Res. 46, 373-380 Rajtek S, Roth-Maier D A, Kirchgessner M (1990 a): J.Anim.Physiol.a.Anim.Nutr. 64,
181-189 Rajtek S, Roth-Maier D A, Kirchgessner M (1990 b): Arch. Anim. Nutr. Berlin 40, 901-
913 Reithmayer F, Roth-Maier D A, Kirchgessner M (1984): Internat.J.Vit.Nutr.Res. 54,
270-271 Reithmayer F, Roth-Maier D A, Kirchgessner M (1985): Z.Ernährungswiss. 24, 30-43 Roth-Maier D A, Kirchgessner M (1981): Z.Tierphysiol., Tierernährg. u. Futtermittel-
kde. 46, 247-254 Roth-Maier D A, Erhardt W, Henke J, Hennig U, Kirchgessner M (1998): J.Anim.
Physiol.a.Anim.Nutr. 79, 198-209 Roth-Maier D A, Hirschvogl G, Eder K, Kirchgessner M (1997 a): Z.Ernährungswiss.
36, 176-181 Roth-Maier D A, Kettler S I, Kirchgessner M (2002): Internat. J. of Food Sci. and
Nutr. 53, 171-179 Roth-Maier D A, Kirchgessner M, Rajtek S (1990): Internat.J.Vit.Nutr.Res. 60, 343-
350 Roth-Maier D A, Trübswetter N, Stangl G I, Kirchgessner M (1997 b): Z. Ernährungs-
wiss. 36, 169-175 Roth-Maier D A, Wauer A, Stangl G I, Kirchgessner M (2000): Int.J.Vitam.Nutr.Res.
70, 8-13 Roth-Maier D A, Wild S I, Erhard W, Henke J, Kirchgessner M (1999): Eur.J.Nutr. 38,
241-246 Rucker R B, Suttie J W, Mc Cormick D B, Machlin L J (2001): Handbook of vitamins
3rd rev. ed., Marcel Dekker, Inc. New York, Basel Wauer A, Stangl G I, Kirchgessner M., Erhardt W, Henke J, Hennig U, Roth-Maier D
A (1999): J.Anim.Physiol.a.Anim.Nutr. 82, 80-87 Zinner P M, Kirchgessner M, Roth-Maier D A (1981): Internat.J.Vit.Nutr.Res. 51, 132-
138

38
Vitamine in der Laktation Schweigert, Florian J. Institut für Ernährungswissenschaft der Universität Potsdam, Arthur-Scheunert-Allee 114-116, 14558 Bergholz-Rehbrücke, [email protected] (Nachfolgend werden lediglich die Inhalte der Powerpoint-Präsentation dargestellt) Fettlösliche Vitamine und Carotinoide
• hormonähnliche Wirkung (Vitamin D und A) • keine Coenzymfunktion (außer Vitamin K) • Vitamine A, E und D ausschließlich über die Nahrung • Provitamin (Carotinoide) • Speichermöglichkeiten • Gefahr der Intoxikation
Wasserlösliche Vitamine
• Coenzymfunktion • Bedarfsdeckung durch mikrobielle Synthese • kaum Speicher • kaum Intoxikation
Vitamine sind von Bedeutung für
Produktivität • Reproduktion • Milchertrag Gesundheit • Mastitis • Stoffwechselerkrankungen • Kälbergesundheit • Klauenprobleme Produktqualität • Fleisch • Milch
Ursachen für einen gestiegenen Vitaminbedarf bei Milchkühen • Kraftfutterreiche Fütterung • Abnahme des Weideganges • Abnahme des Frischfuttereinsatzes • Zunahme von Maissilage • Änderungen in der Silage- und Mischfutterbehandlung
– Anwelksilage häufiger als Naßsilage – Mehrfachpelletierung
• Ungünstigere Umwelteinflüsse (Streß) • Verbesserung der Produktqualität (Humanernährung)
Bedeutung von Vitaminen die Milchdrüse
• Lokale Modulation von – Zellwachstum und –differenzierung (Retinoide) – Immunsystem (Retinoide, Vitamin E, Vitamin D ?)
• Antioxidative Eigenschaften (Vitamin E, Carotinoide)

39
Bedeutung von Vitaminen für Jungtiere • Versorgung mit Vitaminen
– Aufrechterhaltung von vitaminabhängigen Stoffwechselvorgängen • Auffüllen von Speichern • Lokale Modulation von
– Darmwachstum, Zelldifferenzierung, Immunsystem – mikrobieller Besiedelung
• Systemische Modulation von Metabolismus und Endokrinum – Akute Effekte – Langzeiteffekte
Vitamine in der Milch (nach Schlimme 1992) Mittlerer Gehalt
(µg/g) Bedarfsdeckung (Mensch)
(% im Mittel) Fettlösliche Vitamine Retinoide (A) 0,3 50 Calciferol (D) 0,001 30 Tocopherol (E) 0,9 10 Phyllochinon (K) 0,04 2 Wasserlösliche Vitamine Thiamin (B1) 0,4 30 Ribovlavin (B2) 1,6 100 Nicotinsäureamid 1,0 6 Folsäure 0,05 20 Panthothensäure 3,6 50 Pyridoxol (B6) 0,5 30 Cobalamin (B12) 0,005 110 Ascorbinsäure (C ) 20 30 Biotin 0,04 20 Zusammensetzung des Milchfetts in % (Davies et al., 1983) Triacylglycerol 97,5 Diacylglycerol 0,38 Monoacylglycerol 0,027 Cholesterolester Spuren Cholesterol 0,31 Freie Fettsäuren 0,27 Phospholipide 0,6 Retinoide, Carotinoide, Tocopherole, Vitamin D < 0,001 Bedeutung von Vitaminen der Milch für den Konsumenten
• Vitaminversorgung – Anreicherung über Fütterung – Anreicherung während der Verarbeitung
• Verbesserung der Produktqualität – Stabilität (Vitamin E) – Farbe (ß-Carotin in der Butter)

40
Einflußfaktoren auf die Konzentration von Vitaminen in der Milch • Angebot mit der Nahrung
– Supplementierung – Jahreszeit – Nährstoffinteraktionen
• Laktationsstadium • Eutererkrankungen
– Verminderter Transfer (selektiv oder generell) – Vermehrtet Metabolismus
• Speziesspezifische Unterschiede (Carotinoide) Speziesspezifische Unterschiede im Carotinoidmuster der Milch von Rind und Ziege (Schweigert et al. 2000)
• Verbesserung des Nachweis von polaren Carotinoiden durch zweistufige Extraktion
der polaren (ohne Verseifung) und unpolaren Carotinoide (mit Verseifung) • Wiederfindung für polare Carotinoide von 75% auf 97 %
Verteilung der Vitamine in der Milch
• Milchfettkügelchen (Flotation) – Fettlösliche Vitamine
• Molkefraktion – Wasserlösliche Vitamine
• Caseinfraktion (Säurefällung) Verteilung der fettlöslichen Vitamine im Milchfettkügelchen
• Die Verteilung der fettlöslichen Vitamine im Milchfettkügelchen ist nicht gleichmäßig • Milchfettkügelchenmembran vor allem
– Phospholipide – Vitamin E (effektiver antioxidativer Schutz)
• Fettkern vor allem – Triglyceride – Retinylester – ß-Carotin – (Vitamin E)
Spezifische Bindungsproteine in der Milch
• ß-Lactoglobulin – Carrier of small hydrophobic molecules such as retinoids – Modulator of lymphocyte response – Facilitate the absorption of retinoids ?
• Haptocorrin – Vitamin B12-binding protein; – facilitate its absorption?
• Folate-binding protein – Facilitates the absorption of folate?
Kuh Ziege1-Lutein 1,84+/-0,13 3,68+/-0,92-Zeaxanthin 0,12+/-0,01 0,16+/-0,023-ß-Carotin 63,3+/-9,93 0,15+/-0,03

41
• Lactoferrin – Iron-binding – bacteriostatic/bactericidal; growth factor ?
Changes in Milk Carotene, Vitamin E and Vitamin A during the Progress of Lactation in Cattle and Horse (Schweigert 1989, Schweigert & Gottwald 1999) Cattle Horse Interaktion von fettlöslichen Vitaminen und Proteinen in der Milch Lipide
• Fettsäuren • Vitamine • Carotinoide
Proteine und Peptide Lipocaline
0
0,5
1
1,5
2
2,5
3
3,5
4
Tocopherol Vitamin A ß-Karotin
µg/m
l Kolostrum7 pp42 pp
0,00,10,20,30,40,50,60,70,80,91,0
Tocopherol Vitamin A Cholesterol ß-Carotin
µg/m
l
Kolostrum2 pp4 pp7 pp21 pp42 pp

42
ß-Lactoglobulin als Lipocalin • Große Sequenzhomologie zu Retinol-Bindungsprotein und anderen Lipocalinen
– Spezifische Transportproteine für Lipide – Allergen
• Sehr resistent gegenüber proteolytischen Vorgängen im Magen-Darm-Trakt bei saurem pH – Absorption und Transfer in Muttermilch beim Menschen (Allergen)
• Bindet Retinol und Fettsäuren (nur Wiederkäuer) sowie zahlreiche andere lipophile Liganden
• Funktion: – Verbesserung der Aufnahme von Retinol über intestinale Rezeptoren – Stimulation der prägastrischen Lipase
Bestimmung von Milchproteinen nach selektiver Anreicherung auf Chipoberflächen (SELDI) mittels TOF-MS Caseins A, B, E, F, G, H Α-Lactalbumin C 14200 kDa ß-Lactoglobulin D 18360 kDa Schlußfolgerung
• Zur Beurteilung der Bedeutung von Vitaminen in der Milch müssen berücksichtigt werden: – Physiologische und pathologisch bedingte Veränderungen – Unterschiede in der Verteilung auf die einzelnen Fraktionen innerhalb der Milch – Interaktionen in der Milch zwischen einzelnen Komponenten
• Bei der Sekretion • Im Euter • Im Magen-Darm-Trakt
• Von besonderer Bedeutung sind möglicherweise spezifische Bindungsproteine für die Verfügbarkeit von einzelnen Vitaminen
• Vitamine in der Milch sind von Bedeutung für – das Euter
• Lokale Differenzierung, • Abwehr
– das Jungtier • lokale Modulation des Darms (Absorption, Sekretion) • systemische Modulation (Endokrinum, Immunsystem, Nervensystem) • langfristige Prägung des Jungtiers ?
– den Konsumenten • Vitaminversorgung • Produktqualität
• Anreicherung zur Modulation der – Euterfunktion, – der Gesundheit von Jungtieren und als – funktionelle Lebensmittel beim Menschen
• Nutzung selektiver Carotinoide in der Milch oder im Plasma als Biomarker für Haltungsbedingungen

43
Schweigert et al., 2003 Abbildung 1: Humanmilch Abbildung 2 Säuglingsanfangsnahrung Abbildung 3: Kuhmilch (Schweigert et al. 2003)
10.00 15.00 20.00 25.00 30.00
0
25
50
75
0
20
40
60
0
10
20
A
CD E F GH
0
25
50
75 a
0
5
10 b
0
5
10 c
AB
C
D
E H
0
25
50
75 a
0
10
20
30 b
0
10
20
30 cAB
C
DEF
GH
B
a
b
c
10.00 15.00 20.00 25.00 30.00 10.00 15.00 20.00 25.00 30.00
10.00 15.00 20.00 25.00 30.00 10.00 15.00020.00 25.00 30.00 10.00 15.00 20.00 25.00 30.00

44
Abstract Vitamins and lactation Milk and milk products are important sources of vitamins for the new borne and the human as consumer. Both, fat- and water-soluble vitamins can be found at varying concentrations in milk. Primarily the vitamins serve the new-borne. The vitamins serve the new-borne to fill up its storage pools in the body and might modulate not only systemic but also local function of the gastro-intestinal tract. In addition to this, vitamins in milk might as well be of importance for the mammary gland itself during lactation and involution and vitamins are influencing the metabolism related to lactation. Vitamins in milk are mostly derived from the circulating body pool but can also be locally synthesized or activated. Within the milk, vitamins are distributed according to their physico-chemical characteristics. Fat-soluble vitamins are associated with the milk fat globule and are located in both the core and the membrane of the milk fat globule. Water-soluble vitamins are found in aqueous fraction of milk. The concentration of specific vitamins is dependent on the nutritional supply of the animal and thus seasonal variations can be observed. Additionally, the stage of lactation is greatly affecting the concentrations of vitamins in milk. The colostrum is generally a riche source of fat-soluble vitamins.

45
Herbs and Botanicals in the Nutrition of Monogastric Animals Wenk, C. Institute of Animal Sciences, ETH Zürich, Universitätstr. 2, 8092 Zürich, Switzerland
Introduction: Herbs and botanicals as alternatives for antibiotics The way in which human food is produced today is intensively discussed and
questioned in modern society. We expect food from plants, farm animals and
microorganisms to be of good quality, healthy and inexpensive. But we are
increasingly concerned about environmental matters and look for low energy input
production systems. In addition, arguments for food that is produced as naturally as
possible (organic farming) come primarily from consumers organizations.
In highly developed countries we do not always feel the impact of the steady growth
of world population. In twenty five years from now there will be almost 9 billion
inhabitants (FAOSTAT, 1998) on earth who expect to get enough food to meet their
nutritional needs. The goal to produce sufficient food for everybody can only be
achieved in future if the world food production increases by about 2 % per year. It is
expected that world animal production will follow this trend. According to IFPRI
(1999) world production will grow about 2 % for pigs and chicken, respectively in the
next 20 years, mainly in the developing countries with an annual growth between 2½
and 3 %. World food production must grow without increasing the environmental
waste load. This precondition demands the efficient use of all available resources of
traditional and modern technologies also of feed additives in a responsible way!
There is no doubt that today’s worldwide agriculture productivity must be increased.
A ban of antibiotics as feed additives in animal nutrition was realized in 1986 in
Sweden and in 1999 in Switzerland. Today in the European Union only three anti-
biotics are still permitted as growth promoters (Salinomycin-Na, Flavophospholipol,
Avilamycin) but a general ban is foreseen in some years from now, because of the
increased occurrence of pathogens resistant against therapeutical antibiotics used in
animals and humans.
With the restricted use or ban of dietary antimicrobial agents we must explore new
ways to improve and protect the health status of farm animals, to guarantee animal

46
performance and to increase nutrient availability. This goal can be attained by good
housing or climate conditions as well as by the best possible combination of the so
called pronutrients (Rosen, 1996) available including pro- or prebiotics, organic acids,
dietary fibers, highly available nutrients, herbs and botanicals. Rosen defined the
pronutrients as “microfeedingstuffs used orally in a relatively small amount to improve
the intrinsic value of the nutrient mix in an animal diet”.
Even at low levels pronutrients can contribute to the nutrient requirements. The main
activities are expected in the feed intake regulation, processes in the digestive tract
(Eubiosis) or after the absorption of the active substances in the intermediate
metabolism. The effect of a pronutrient on the performance of farm animals can vary
over a wide range. Many reasons can be considered. Generally it is more effective in
animals with a low performance, diets with a low nutritive value, at low health
conditions, with an unfavorable environment, under stress and a bad management of
the animals.
What are herbs, botanicals or essentialoils, what’s that? Beside the feed enzymes, probiotics (for monogastric animals mainly lactobacilly),
prebiotics (oligosaccharides), organic acids, the herbs and botanicals can be used as
feed additives. In the last years the modern western world has been learning what
many Asians and native Americans (Bye and Linares, 1999) have known for
centuries, namely that plant extracts and spices can play a significant role in health
and nutrition.
A definition can be derived from Webster’s Encyclopedic Unabridged Dictionary of
the English Language (1989):
Herb: A flowering plant whose stem above ground does not become woody
and persistent. A plant when valued for its medical properties, flavor,
scent, or the like.
Botanical A drug made from part of a plant, as from roots, leaves, bark etc.
Essential oils Are any of a class of volatile oils obtained from plants, possessing
the odor and other characteristic properties of the plant, used chiefly

47
in the manufacture of perfumes, flavors and pharmaceuticals.
(Extracts after hydro - distillation)
Plants have evolved a wide range of low-molecular-weight secondary metabolites.
Generally these compounds enable the plants to interact with the environment and
may act in a defense system against physiological and environmental stress as well
as predators or pathogens. Beside compounds with toxic properties, several of these
secondary plant metabolites have been reported to show beneficial effects in food
products and also in mammalian metabolism. They are of main relevance in herbs
and are specifically enriched and eventually standardized in botanicals.
In the last years the number of studies with herbs or botanicals has significantly
increased especially in Europe. At the annual meeting of the German “Society of
Nutrition Physiology” in 2002 almost 50 % of the papers on feed additives referred to
herbs in relation to growth performance and carcass characteristics. In one of the
paper the effect of herbs on coccidiosis in poultry was evaluated. In 2003 almost ¾
of the papers covered the field of pro-, prebiotics and herbs.
Modes of action of herbs and botanicals Beneficial effects of herbs or botanicals in farm animals may arise from activation of
feed intake and secretion of digestive secretions, immune stimulation, anti-bacterial,
coccidiostatic, anthelmintic, antiviral or anti-inflammatory activity and inhibition or –
particularly – antioxidant properties. Most of these active secondary plant metabolites
belong to the classes of isoprene derivatives, flavonoides and glucosinolates, and a
large number of these compounds has been suggested to act as antibiotics or as
antioxidants in vivo as well as in food. Several authors have given some overview on
physiologically active secondary plant metabolites (e.g. Rhodes, 1996 or Hirasa and
Takemasa, 1998) and their principles of antioxidative characteristics (e.g. Halliwell et
al., 1995). In other reviews the possible use of herbs or botanicals as feed
supplements is critically recognized (e.g. Rodehutscord et al. 2002).
Herbs develop their initial activity in the feed of farm animals as flavor and can
therefore influence the eating pattern, secretion of digestive fluids and total feed

48
intake. A main activity takes place in the digestive tract. Herbs or the phytochemicals
can influence selectively the micro organisms by an anti-microbial activity or by a
favorable stimulation of the eubiosis of the microflora. The consequence can be a
better nutrient utilization and absorption or the stimulation of the immune system.
Finally herbs can contribute to the nutrient requirements of the animal and stimulate
the endocrine system and intermediate nutrient metabolism.
During the growth period of the animal the diverse activities of herbs or other feed
additives have a variable relevance. In the very young animal metabolism and
nutrient digestion are not yet functioning optimally. Furthermore the immune system
and a stable, beneficial microflora (Eubiosis) must be build up. For that a regular
intake of feed and water is of a high priority. Later the digestion processes can be
optimized and adapted to the available feedstuffs. Only in the later stages of growth
processes that are in relation with the product quality play a major role.
Often the desired activity of herbs is not constant. Conflicting results may arise from
the natural variability of the composition of plant secondary metabolites. Variety and
environmental growth conditions, harvesting time and state of maturity, method and
duration of conservation and storing, contamination with undesired substances like
heavy metals, extraction method of the plants, as well as possible synergistic or
antagonistic effects, anti-nutritional factors or microbial contamination are factors
which may substantially affect the results of in vivo experiments. For example,
rosemary and sage from different geographical locations and types of processing
(dried herbs and essential oils) or from different suppliers (Wenk et al., 1998) showed
significant differences in antioxidative capacity. Furthermore, several secondary plant
metabolites are showing strong flavors, which may affect sensory characteristics of
the feed and, therefore, feed intake. Additionally, antibacterial properties and –
probably concentration dependent – effects on feed intake and on digestion of
nutrients can be expected and should be taken into consideration when conducting in
vivo experiments with phytochemicals using farm animals.

49
0
0,25
0,5
0,75
1
1,25
0 0.10 0.25 0.50 1.00
piglet 1piglet 2piglet 3piglet 4apiglet 4b piglet 4cbroiler 1broiler 2
p1
b2b1
p4cp4bp4a
p3
p2
% rhubarb
rela
tive
chan
ge o
f fee
d in
take
Influence of herbs or botanicals on feed intake After the ban of antibiotics in practical pig production more and more herbs are used
as feed additives for a better growth condition. A product from rhizomes of
Sanguinaria canadensis is frequently used in Europe for pigs and poultry. With other
herb mixtures or botanicals effects on feed intake as well as growth performance in
piglets and growing finishing pigs as well as poultry could be achieved. In an
experiment with piglets after weaning we have studied the influence of five single
Chinese herbs and two mixtures on feed intake and growth performance in doses of
0.5 % (Gebert et al., 1999 a). The basal diet corresponded to a practical diet based
on barley, wheat, oats, corn, soybean meal, potato protein, fish meal, fat, amino
acids and a mineral / vitamin premix.
The supplementation of the basal diet with the seven different herbs or herb mixtures
had partly a significant effect on feed intake. Especially Rhubarb root caused a 18 %
reduction of overall daily feed intake, probably caused by anthrachinone derivatives.
As a consequence, performance was negatively influenced. The influence of rhubarb
root on daily feed intake was therefore studied in piglets and broilers in a series of
further growth experiments. In Figure 1 the results of these experiments are
summarized. It has to be noted, that the herb preparations and therefore effects of
active substances like anthrachinones were different between experiments.
Figure 1: Effect of Rhubarb root on feed intake relative to control of piglets and broilers (Gebert et al. 1999 b, Straub et al., 2002)

50
There was a big variation in the effect of rhubarb root on feed intake in relation of the
amount of supplementation between experiments. But in both species (piglet and
broiler) a slight increase in feed intake could be observed at least partly at low levels
and then a dramatic decrease occurred at higher levels.
Similar observations concerning feed intake regulation were made in laying hens with
turmeric, a powder of the rhizome of Curcuma longa, a spice that is frequently used
in the south Asian kitchen (Wenk and Messikommer, 2002). 0.25 % Turmeric
improved feed intake. At higher levels up to 1 % feed intake returned to the control
treatment without supplementation. Samarasinghe and Wenk (2002) did not find an
influence of Turmeric on feed intake in broilers, but on nutrient utilization,
performance and carcass characteristics.
Antimicrobial and coccidiostatic activity of herbs and botanicals The antimicrobial activity of herbs and botanicals has been studied in many different
in-vitro essays (Huang K.C., 1999, Baratta et al., 1998, Lis–Balchin and Deans,
1998, Deans and Richie, 1987). In Tab. 3 (Spring et al., 1998) some examples for
Chinese herbs are presented. Some of the tested herbs had a wide anti-microbial
activity against gram+ and gram- bacteria. Others were mainly active against gram+.
Table 3: Antimicrobial activity of Chinese herbs in comparison to garlic (Spring et al., 1998)
Goldhead Rhizome gram + gram –
Scullap Root gram + gram – Arnefia Root gram +
Barberry Root gram + Cassia Seed gram + gram –
Flavecent Sophora Root gram +
Forsythia Fruit gram + Honeysuckle Fruit gram +
Honeysuckle Stem gram +
Houttuynia gram + gram –
Oriental Wormwood gram +

51
mouth stomach small intestine large intestine
products
digestion
Anti-oxidants
feed
intermediatemetabolism
musclesother tissues
Phellodendron Bark gram +
Quad Leaf gram +
Tibet Bitterroot gram + gram – Ash Bark gram + gram –
Garlic (positive control) gram + gram –
Results of in-vitro tests as shown in Tab. 3 indicate that herbs can have a specific
antimicrobial activity. But these results depend largely on the methods applied during
extraction and the microorganisms applied.
The transformation of such results into the in vivo situation in the digestive tract of an
animal is not easy. Herbs or botanicals which are added to a diet have to compete
with the major nutrients as well as with other possible secondary plant constituents
that are present in the diet. Furthermore the microbial situation in the digestive tract
is well balanced (Eubiosis) and depends on many factors like animal species and
age, feed composition and technological treatment, pH, transit time, nutrient density,
absorption rate etc.
Herbs and botanicals as antioxidants The antioxidative status of an animal depends on many different factors. The animal
itself represents a homöostatic system with the available enzymes. With the feed it
ingests nutrients with a variable potential for oxidation, the poly unsaturated fatty
acids (PUFA) representing the highest risk. With the feed it also ingests substances
like iron, copper or phytase that can catalyze the nutrient oxidation (Gebert et al.,
1999 c). Finally antioxidants like tocopherols, carothenes, flavonoids etc. protect the
sensible substances (see Fig. 2).
Figure 2: Activity of antioxidants in monogastric animals

52
The different antioxidants can have a variable activity. This depends on the polarity
and solubility, but also the place of activity. Some antioxidants are used to protect the
nutrients in the feed during storage. Others have their main activity in the digestive
tract where they may also help that the substances sensible for oxidation can be
absorbed. In the intermediate metabolism antioxidants are responsible for many
functions like reduced aging or the protection of intact membranes. In farm animals
antioxidants can have a direct influence on the product quality.
The antioxidative activity of herbs can be detected by different methods as in the
Rancimat test (in our studies Metrohm, Herisau, CH) or the microsome peroxidation
test. In the Rancimat test herbs or botanicals are supplemented to an oil that is
heated and ventilated by an air stream for accelerated oxidation. The results are
expressed as an antioxidative factor (AF) which is corresponding to the induction
time of oxidation relative to the untreated oil. Thus high values indicate high oxidative
stability. In Fig. 3 the antioxidative capacity of Rosemary and it’s extract (Oxyless U),
olive oil and olive leaf extract as well as different tea samples is given with the
Rancimat test using olein fraction from lard as carrier.
Figure 3: Antioxidative capacity of Rosemary and it’s extract (Oxyless U), olive oil and olive leaf extract as well as different tea samples measured with the Rancimat system (Scheeder, 2000)
Rosemary and it’s extracts are well known as a potent antioxidant especially in
countries around the Mediterranean Sea. But extracts from olive leafs or olive oil as
0 25 50 75 100 125
Olein
worst green tea
best green tea
best olive oil
green tea extr.
best rosemary
olive leaf extr.
OxylessU II
antioxidative factor (AF)[70 mg / 2.5 g olein fraction (pig fat)]

53
0 1 2 3 4 5
Corte x Eucom m iae
Folium Gink go
Her ba Cis tanches des e rticolae
He rba Epim e dii
Magnoliavine fr uit
Radix Ange licae s ine ns is
Radix e t Rhizom a Rhei
Radix Notogins e ng
Radix Paeonia albae
Radix Salviae M iltior rhiz ae
Rhizom a Chuanxiong
Rose m ar y
[AF]
Ra ncim a t, 30 m g drug / gole ic a cidMicrosom e pe rox ida tion (90m in), cold w a te r-e x tra ct
∞ (AF = 47)
such as well as different tea preparations can also be effective antioxidants.
Scheeder, M.R.L. (2000) tested also different Chinese herbs as antioxidants. In
comparison to Rosemary only Radix et Rhizoma Rhei showed similar effects on AF.
The ethanol extracts of Herba Epimedii, Magnoliavine fruit, Radix Puerariae and
Ramulus Taxilii had also some antioxidative activity.
The Rancimat test used as described selects primarily for lipid soluble antioxidative
substances. But it is of interest to know whether other constituents that are water
soluble also have an antioxidative activity. Therefore in a further study the rancimat
test was compared with the microsome peroxidation assay in which thiobarbituric
acid reactive substances were measured after starting oxidation of rate liver
microsomes using FeCl2/H2O2 as catalyser. In the microsome peroxidation test mainly water soluble antioxidants are detected. The values given are relative to
control, low values indicating delayed oxidation. In the Rancimat test oleic acid was
used.
Figure 4: Antioxidative capacity of different herbs in the Rancimat as well as microsome peroxidation test (Scheeder, M.R.L. et al., 1999)
In the Rancimat test Cortex Eucommiae and Magnoliavine fruit were the most
effective antioxidatives. But also other Chinese herbs showed a significant activity.
Cortex Eucommiae did not react at all. But other herbs like Herba Epimedii or Radix
et Rhizoma Rhei had an excellent antioxidative activity in the water soluble fraction.
Again we conclude that in vitro tests for selection will not be able to characterize the
in vivo antioxidative activities of a herb properly.

54
Deans et al (1993) studied the antioxidative activity of essential oils from different
herbs in detail. Some of the results are shown in Tab. 4.
Table 4: Anti- and pro-oxidative properties of essential oils (examples)
Antioxidative prooxidative no effect
Almond bitter Cardamom Almond sweet Clove Coriander Anise Cinnamon Estragon Fennel Laurel Eucalyptus Ginger Mint Lime Lemon Nutmeg Sage Marjoram Pepper Verbena Melissa Peppermint Rosemary Thyme Deans et al. (1993)
The effects of phytochemical antioxidants on lipid oxidation in meat and meat
products is of major concern. Plant oils used as feedstuffs in monogastric nutrition
may readily alter fatty acid composition of all body lipid fractions by generally
increasing the amount of PUFA and, therefore, their susceptibility to oxidation.
Concomitantly, plant oils usually contain natural antioxidants, which may contribute to
an improved oxidative stability of meat and meat products, compensating for the
increased degree of unsaturation. These antioxidants are mainly tocopherols.
However, phenols present to appreciable amounts in olive oil may serve as examples
for effective non-tocopherol antioxidants (Baldioli et al., 1996). Their antioxidative
capacity (Papadopoulos and Boskou, 1991) and free radical-scavenging properties
(Visioli et al., 1998) have been shown as well as specific antioxidative effects on
biomembranes (Saija et al., 1998) and inhibition of low density lipoprotein oxidation in
vitro (Visioli et al., 1995) and in rabbits (Wiseman et al., 1996).
The effects of herbs or herb extracts used as dietary supplements were examined in
two other studies. Gerber (1997) fed sage as dried herb to pigs and reported a
significant decrease of TBARS in the lard with increasing concentration of sage from
0.6 % to 1.2 % in the diet. In contrast, the Rancimat-test showed no significant effect.
Lopez-Bote et al. (1998) also reported, that they did not find an antioxidative effect in

55
pork when oleoresins of rosemary and sage were fed. However, feeding the same
oleoresins (500 mg/kg) to broilers led to an improved oxidative stability in red (leg)
and white (breast) meat measured as TBARS as well as a lower amount of
cholesterol oxidation products compared to unsupplemented animals (Lopez-Bote et
al., 1998). The oleoresins were not as effective as α-tocopherol acetate (200 mg/kg),
but it may be concluded, that at least part of the ingested antioxidative compounds
were retained in the muscle and that they were still active in the meat. However,
investigations into effects of dietary administered secondary plant metabolites on
muscle and adipose tissues of farm animals are still rare and knowledge about
effects of secondary plant metabolites in feed and guts, their bioavailability by means
of extent of absorption and metabolism, and the extent to which they might be
retained in animal tissues is not readily available.
Conclusions The beneficial effect on wellbeing, growth performance as well as nutrient and
energy utilization are mainly the reasons, why animal feed additives are widely used.
With the trend towards more “natural” animal production systems, anti-microbial
agents are being banned. Therefore agriculture is looking for friendly supplements
with higher acceptance at the consumer. Whether herbs or botanicals (e.g. essential
oils) are appropriate has to be considered in each practical application. The
strategies of alternatives are often discussed. They are essential in veal calve
production and in young pigs, but also relevant in other farm animals. The strategies
must be based primarily on optimal management and housing conditions.
The nutrition of the animals must primarily focus that the animals are supplied with all
essential nutrients and energy in adequate amounts. In big groups adequate feeding
troughs must allow that all animals can get sufficient amounts of food and fresh
water. On the other hand overeating of the heavier animals should be avoided so that
digestive disorders do not occur. With the following measures the risks of digestion

56
problems mainly in the young pig can be minimized:
- low acid binding capacity - reduced mineral content (< 6 g Ca and < 5 g P per kg feed) - adequate protein supply (avoid high protein quantities but essential amino acids according to requirement) - use of organic acids (mainly fumaric and lactic acid)
- use of enzymes, prebiotics and dietary fibers - use of mainly phytases and carbohydrases - use of fructose and mannose oligosaccharides - use of pectins or other soluble dietary fibers
- liquid feeding systems with the possibility of fermentation before feeding - use of herbs, botanicals or essential oils - use of probiotics (lactobacilli) - avoidance of anti-nutritional factors (ANF)
In the concept of the production of healthy farm animals without the use of antibiotics
herbs can be relevant in many different ways. They can regulate feed intake and
stimulate digestive secretions. An optimized digestion capacity and reduced risk of
digestive disorders are the consequence. Several phytochemicals like essential oils
or dietary fibers can contribute to a balanced microflora (eubiosis), an optimal
precondition for an effective protection against pathogenic micro organisms and an
intact immune system. Herbs and botanicals contain many different antioxidants with
a high potential for the protection of nutrients against oxidation in the digestive tract,
in metabolism as well as in the products.
Summary
Kräuter sind nicht verholzte, blühende Pflanzen, die sich durch ihre besonderen
medizinalen Eigenschaften oder ihr Aroma auszeichnen. Ein Präparat, das aus
ganzen oder Teilen von Pflanzen erzeugt wird, bezeichnet man als Pflanzenextrakt
(englisch „botanical“). Pflanzenextrakte oder ätherische Öle (englisch „essential oil“,
die besondere Eigenschaften bezüglich Geruch, Geschmack oder pharmazeutischen
Eigenschaften aufweisen, sind auch in der Tierernährung von grossem Interesse. Im
Vordergrund stehen dabei die Wirkung auf den Verzehr sowie die antimikrobiellen
und antioxidativen Eigenschaften. In vielen Ländern Asiens sowie Südamerikas
fanden solche Präparate schon seit Jahrhunderten regelmässige Anwendung (Bye
und Linares, 1999). In den letzten Jahren fanden Kräuter und Pflanzenextrakte

57
grosses Interesse auch in der modernen Tierproduktion. Als wichtiger Grund für
diese Entwicklung kann erwähnt werden, dass der Konsument und die Konsumentin
im Gegensatz zu den industrietechnologisch erzeugten Futterzusatzstoffen den
Kräutern und Kräuterextrakten wesentlich mehr Vertrauen schenkt.
Mit dem Effekt von Kräutern und Kräuterextrakten auf den Verzehr wird oftmals auch
eine vermehrte Sekretion von Verdauungssäften sowie die Stärkung des
Immunsystems von Tieren beobachtet. Als Folge kann neben den gesundheitlichen
Aspekten auch eine Verbesserung der Nährstoffverwertung und folglich eine höhere
Leistung der Tiere beobachtet werden. Die antimikrobielle, coccidiostatische,
antivirale oder entzündungshemmende Wirkung der Präparate wurde von
verschiedenen Autoren beschrieben. Die antioxidative Wirkung ist neben der
Gesunderhaltung der Tiere auch wegen der Beeinflussung der Produktequalität von
Bedeutung.
Zwischen einzelnen Kräutern besteht ein grosses Wirkungsspektrum. Gewisse
ätherische Öle können sogar eine prooxidative Wirkung aufweisen (Deans et al.,
1993). Deshalb ist eine sorgfältige Auswahl der Kräuter als Alternativen zu den
Antibiotika, Coccidiostatika oder Antioxidantien vorzunehmen. Wegen der
uneinheitlichen Zusammensetzung von Kräuterpräparaten ist bei der Anwendung die
Produktequalität von essentieller Bedeutung.
References Baldioli M, Servili M, Perretti G, Montedoro G F (1996): Antioxidant activity of
tocopherols and phenolic compounds of virgin olive oil. Journal of the American
Oil Chemists' Society 73: 1589-1593.
Baratta M T, Damien Dorman H J, Deans S G, Biondi D M, Ruberto G (1998):
Chemical composition, antimicrobial and antioxidative activity of Laurel, Sage,
Rosemary, Oregano and Coriander Essentials Oils. J. Essentl. Oil. Res., 10: 618-
627.

58
Bye R, Linares E (1999): Medicinal plant diversity in Mexico and its potential for
animal health sciences. In: Proc. Alltech’s 15th Annual Symp. On Biotechnology
in the Feed Industry (Lyons T P, Jacques K A Eds.): 265 – 294.
Deans S G, Ritchie G (1987): Antibacterial properties of plant essential oils.
International Journal of Food Microbiology, 5: 165-180.
Deans S G, Noble R C, Penzes L, Imre S G (1993): Promotional effects of plant
volatile oils on the polyunsaturated fatty acid status during aging. Age, 16: 71-74.
FAOSTAT (1998): Food and Agriculture Organization of the United Nations Data
Base. Faostat.fao.org.
Gebert S, Messikommer R, Wenk C, (1999 a): Chinesische Kräuter im Ferkelfutter.
In: Gesunde Nutztiere: Umdenken in der Tierernährung? (Sutter F, Kreuzer M,
Wenk C, Eds.) :163 - 164.
Gebert S, Stahel F, Messikommer R, Wenk C (1999 b): Rhubarb als Alternative zu
antimikrobiellen Leistungsförderern (AML) im Ferkel- und Broilerfutter. In:
Gesunde Nutztiere: Umdenken in der Tierernährung? (Sutter F, Kreuzer M,
Wenk C, Eds.) p. 165-166.
Gebert S, Bee G, Pfirter H P, Wenk C (1999 c): Growth performance and nutrient
utilisation as influenced in pigs by microbial phytase and vitamin E
supplementation to a diet of high oxidative capacity. Ann.Zootech. 48: 105-115,
1999.
Straub R, Gebert S, Wenk C, Wanner M (2002): Einfluss von chinesischem
Rhabarber im Ferkelfutter auf die Nährstoff- und Energieverwertung wachsender
Schweine. In: Optimale Nutzung der Futterressourcen im Zusammenspiel von
Berg- und Talgebiet. Ein Beitrag zum Internationalen Jahr der Berge
Schriftenreihe aus dem Institut für Nutztierwissenschaften, (Kreuzer M, Wenk C,
Lanzini T Eds.) 23: 130-133.
Gerber A (1997): Salvia Officinalis L. als Futteradditiv in der Schweinemast. Ph.D.
Dissertation, Veterinärmedizinische Universität, Vienna. Gläser K R, Scheeder M R L, Wenk C, (1999): Influence of C 18 - monoenoic- and
polyenoic fatty acids in feedstuff on the fat properties in pigs. In: 5.Tagung
Schweine- und Geflügelernährung (1.-3.12.1998), Martin-Luther-Universität
Halle-Wittenberg (Jeroch H, Nonn H, Eder K, Hrsg), p. 32-35.
Halliwell B, Aeschbach R, Loeliger J, Aruoma O I (1995): The characterization of
antioxidants. Food and Chemical Toxicology 33: 601-617.

59
Hirasa K, Takemasa M (1998): Spice science and technology. Marcel Dekker, New
York, 220 pp.
Huang K C (1999): The pharmacology of Chinese herbs. CRC Press Inc.; Boca
Raton, Florida; USA. 512 pp.
IFPRI, International Food Policy Research Institute (1999): Livestock to 2020. The
next food revolution. Food, Agriculture, and the Environment Discussion Paper
28, by Delgado C, Rosegrant M, Steinfeld H, Ehui S, Courbois C.
Lis-Balchin M, Deans S G (1998): Studies on the potential usage of mixtures of plant
essential oils as synergistic antibacterial agents in foods, Phytotherapy
Research, 12: 472-475.
Lopez-Bote C J, Gray J K, Gomaa E A, Flegal C J (1998): Effect of dietary
administration of oil extracts from rosemary and sage on lipid oxidation in broiler
meat. British Poultry Science, 39: 235-240.
Papadopoulos G, Boskou D (1991): Antioxidant effect of natural phenols on olive oil.
Journal of the American Oil Chemists' Society, 68: 669-671.
Rhodes M C (1996): Physiologically-active compounds in plant foods: an overview.
Proceedings of the Nutrition Society, 55: 371-384.
Rodehutscord M, Abel H J, Friedt W, Wenk C, Flachowsky G, Ahlgrimm H-J, Johnke
B, Kühl R, Breves G (2002): Consequences of the ban of by-products from
terrestrial animals in livestock feeding in Germany and the European Union:
Alternatives, nutrient and energy cycles, plant production, and economic aspects.
Archives of Animal Nutrition/Archiv für Tierernährung 56:67-91.
Rosen G D (1996): Feed additive nomenclature. World’s Poultry Sci.J., 52: 53-56.
Saija A, Trombetta D, Tomaino A, LoCascio R, Princi P, Uccella N, Bonina F, Castelli
F (1998) 'In vitro' evaluation of the antioxidant activity and biomembrane
interaction of the plant phenols oleuropein and hydroxytyrosol. International
Journal of Pharmaceutics, 166: 123-133.
Samarasinghe K, Wenk C (2002): Turmeric (Curcuma longa) and mannan-
oligosaccharides as antibiotic replacers in broiler diets. In: Optimale Nutzung der
Futterressourcen im Zusammenspiel von Berg- und Talgebiet. Ein Beitrag zum
Internationalen Jahr der Berge, Schriftenreihe aus dem Institut für
Nutztierwissenschaften (Kreuzer M, Wenk C, Lanzini T Eds.) 23: 124-125.
Scheeder M R L (2000): Internal research report. Institute of Animal Science.
Nutritionbiologie, ETH-Z Zürich, Switzerland.

60
Scheeder M R L, Gläser K R, Schwörer D, Wenk C (1998): Oxidative Stability and
Texture Properties of Fermented Sausage Produced from Pork Differing in Fatty
Acid Composition. 44st ICoMST, Barcelona, 30.8.-4.9.1998, "Meat Consumption
and Culture".Congress Proceedings, Published by Institute for Food and
Agricultural Research and Technology (IRTA) and EUROCARNE:866-867.
Scheeder M R L, Spleiss C, Bossi H, Wenk C (1999): Screening of chinese herbs as
antioxidants for their use in diets of farm animals. Schweizer Forschung
begegnet Hunger und Armut. 1. Forum für Internationale Landwirtschaft, ETH
Zürich, 30.3. 1999, http://www.sfiar.infoagrar.ch/documents/posters/scheeder.pdf
Spring et al. (1998): Personal communication.
Visioli F, Bellomo G, Montedoro G, Galli C (1995): Low density lipoprotein oxidation
is inhibited in vitro by olive oil constituents. Atherosclerosis, 117: 25-32.
Visioli F, Bellomo G, Galli C (1998): Free radical-scavenging properties of olive oil
polyphenols. Biochemical and Biophysical Research Communications, 247: 60-
64.
Wenk C, Messikommer R (2002): Turmeric (Curcuma longa) als Futterzusatzstoff bei
Legehennen. . In: Optimale Nutzung der Futterressourcen im Zusammenspiel
von Berg- und Talgebiet. Ein Beitrag zum Internationalen Jahr der Berge,
Schriftenreihe aus dem Institut für Nutztierwissenschaften (Kreuzer M, Wenk C,
Lanzini T Eds.) 23 : 121-123.
Wenk C, Scheeder M R L, Spleiss C (1998):. Sind Kräuter Allerheilsmittel? In:
Gesunde Nutztiere: Umdenken in der Tierernährung? (Sutter F, Kreuzer M,
Wenk C Eds.) pp. 95-109.
Webster’s Encyclopedic Cambridge Dictionary of the English Language (1989).
Gramercy Books, New York.
Wiseman S A, Mathot J N, de Fouw N J, Tijburg L B (1996): Dietary non-tocopherol
antioxidants present in extra virgin olive oil increase the resistance of low density
lipoproteins to oxidation in rabbits. Atherosclerosis, 120: 15-23.

61
Cobalt and vitamin B12 requirement of dairy cows Stemme, K.1 , Meyer, U.2, Lebzien, P.2, Flachowsky, G.2, Scholz, H.3
1 Institute of Animal Nutrition, School of Veterinary Medicine, Bischofsholer Damm 15, 30173 Hannover
2 Institute of Animal Nutrition, Federal Agricultural Research Centre, Bundesallee 50, 38116 Braunschweig
3 Clinic for Cattle Diseases, School of Veterinary Medicine, Bischofsholer Damm 15, 30173 Hannover
Vitamin B12 (also called cobalamin) is unique among the vitamins in that it contains an
essential mineral (cobalt) as the central atom and that it is synthesised only by some bacteria,
blue-green algae and yeast. Therefore it is not present in feedstuff of plant origin. Because of
some micro-organisms in their forestomachs (8 strains of cobalamin producing bacteria;
Dryden et al. 1962) ruminants are able to synthesise Vitamin B12. So ruminants do not need a
ration containing vitamin B12, but cobalt. The cobalt requirement of ruminants is actually a
cobalt requirement of the rumen micro-organisms, which incorporate it into vitamin B12
(McDowell 2003). But the ruminant makes extremely inefficient use of its dietary cobalt. The
production of cobalamin from cobalt accounted only for about 3 - 15 % in sheep (Smith and
Marston 1970) and 7.5 - 11 % in dairy cows (Stemme 2002). Higher cobalt intake usually
leads to a higher cobalamin synthesis, as shown in Table 1.
Table 1: Vitamin B12 synthesis (mg/day and mg/kg DM intake) in relation to the Co
supply of adult ruminants vitamin B12 synthesis animals Co-intake
(mg Co/kg DM) mg/animal and day mg/kg DM intake authors
0.01 - 0.05 0.05 - 0.11 no data sheep 1.0 0.4 - 0.7 no data Smith and Marston
(1970) 0.047 0.037 0.07 0.41 1.0 1.72 sheep 0.83 1.5 2.69
Hedrich et al. (1973)
sheep 0.01 - 0.05 no data 0.33 - 1.8 Bigger et al. (1976) cattle no data 9,2 - 10,6 2,2 Zinn et al. (1987)
0.17 2.51 - 4.19 0.19 - 0.31 dairy cows 0.29 6.00 - 11.29 0.44 - 0.84 Stemme (2002)
Beside the cobalt content in the ration there are other influences on the microbial vitamin B12
synthesis in the rumen. Increasing the roughage content in the ration and the dry matter intake
increases the cobalamin production in the rumen (Smith and Marston 1970; Walker and Elliot
1972; Hedrich et al. 1973), while high concentrate contents in the ration lead to a reduced
vitamin B12 synthesis.

62
In contrast to humans there is only little known about cobalamin absorption in ruminants. It is
suggested, that it is the same mechanism as described in humans (Seetharam and Alpers
1982), but cobalamin seems to be less completely absorbed in ruminants than in monogastric
species. In the literature there are different information concerning the efficiency of cobalamin
absorption in the ruminant (1 - 48 % of the produced vitamin B12; Table 2).
Table 2: Vitamin B12 absorption in ruminants
absorption (%) Co supply authors 5 1 mg/sheep and day Smith and Marston (1970)
1-3 no data Girard (1998) 3-38 no data Gruner (2001) 8-38 0.12 - 1.31 mg/kg DM Rickard and Elliot (1978)
up to 20 0.06 – 1.02 mg /kg DM Hedrich et al. (1973) 48 no data Zinn et al. (1987)
Although there are at least 10 different biochemical reactions known, which require cobalamin,
only two enzyme systems (methionin synthase, methyl malonyl CoA mutase) are known in
mammalians (Zagalak 1982; Gruner 2001). In ruminants the most important one is the methyl
malonyl CoA mutase, which is involved in the transformation of methylmalonyl-CoA into
succinyl-CoA. This reaction is particular important for ruminants because of its involvement in
the metabolism of propionic acid, the most important source of energy for ruminants (Gruner
et al. 1998). The other enzyme is an essential part in the transformation of homocystein into
methionin, which is part of the regeneration process of folic acid.
Cobalt deficiency is reported from several regions all over the world (Australia: Marston 1935;
New Zealand: McNaught 1948 ; USA: Ammermann 1969; tropical regions: McDowell et al.
1993). Animals show unspecific clinical symptoms such as an reduced feed intake, retarded
growth, muscular wasting, a rough hair coat and thickening of the skin. Often reproductive
disorders and reduced milk yield are seen in the case of vitamin B12 deficiency.
Cobalt requirement of ruminants The present cobalt recommendations for dairy cows (Table 3) are based on experiments
which were carried out mainly with sheep (Smith and Marston 1970; Hedrich et al. 1973;
Bigger et al. 1976) and beef cattle (Stangl et al. 2000 a and b; Schwarz et al. 2000).
Table 3: Recommended allowances of cobalt for dairy cows (mg/kg DM)
INRA (1988)
ARC (1989)
GfE (2001)
NRC (2001)
0.11 0.11 0.20 0.10
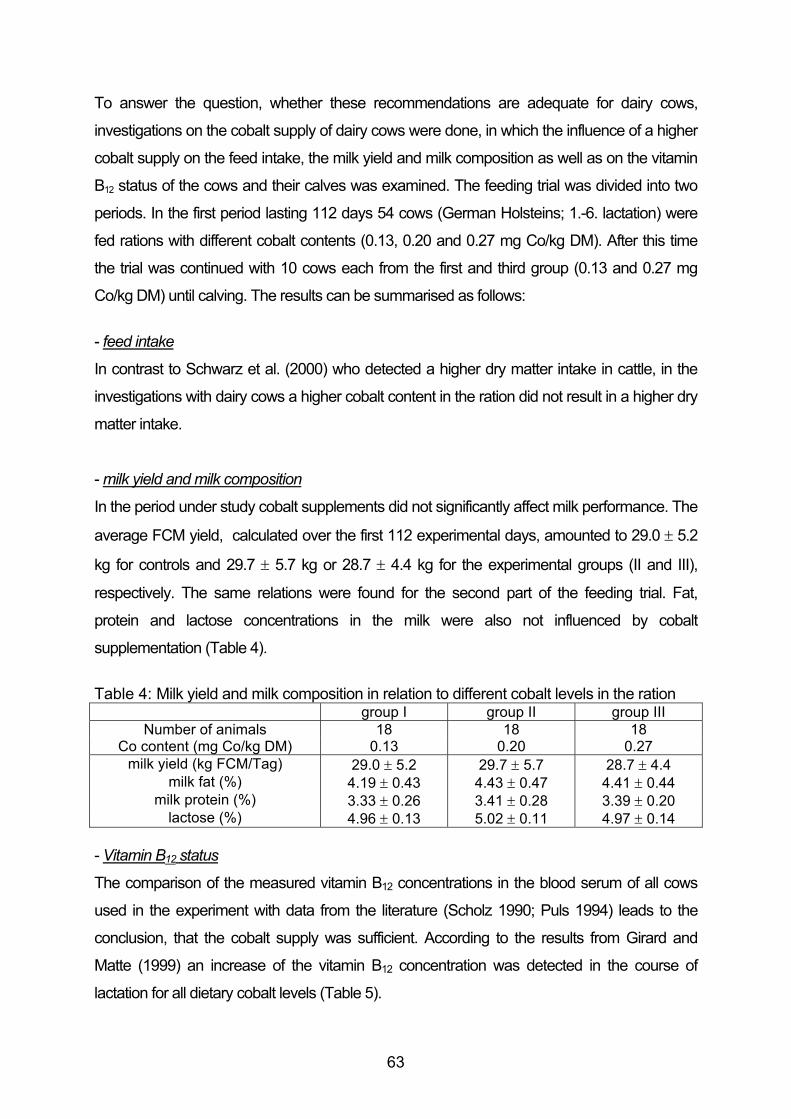
63
To answer the question, whether these recommendations are adequate for dairy cows,
investigations on the cobalt supply of dairy cows were done, in which the influence of a higher
cobalt supply on the feed intake, the milk yield and milk composition as well as on the vitamin
B12 status of the cows and their calves was examined. The feeding trial was divided into two
periods. In the first period lasting 112 days 54 cows (German Holsteins; 1.-6. lactation) were
fed rations with different cobalt contents (0.13, 0.20 and 0.27 mg Co/kg DM). After this time
the trial was continued with 10 cows each from the first and third group (0.13 and 0.27 mg
Co/kg DM) until calving. The results can be summarised as follows:
- feed intake
In contrast to Schwarz et al. (2000) who detected a higher dry matter intake in cattle, in the
investigations with dairy cows a higher cobalt content in the ration did not result in a higher dry
matter intake.
- milk yield and milk composition
In the period under study cobalt supplements did not significantly affect milk performance. The
average FCM yield, calculated over the first 112 experimental days, amounted to 29.0 ± 5.2
kg for controls and 29.7 ± 5.7 kg or 28.7 ± 4.4 kg for the experimental groups (II and III),
respectively. The same relations were found for the second part of the feeding trial. Fat,
protein and lactose concentrations in the milk were also not influenced by cobalt
supplementation (Table 4).
Table 4: Milk yield and milk composition in relation to different cobalt levels in the ration
group I group II group III Number of animals 18 18 18
Co content (mg Co/kg DM) 0.13 0.20 0.27 milk yield (kg FCM/Tag) 29.0 ± 5.2 29.7 ± 5.7 28.7 ± 4.4
milk fat (%) 4.19 ± 0.43 4.43 ± 0.47 4.41 ± 0.44 milk protein (%) 3.33 ± 0.26 3.41 ± 0.28 3.39 ± 0.20
lactose (%) 4.96 ± 0.13 5.02 ± 0.11 4.97 ± 0.14 - Vitamin B12 status
The comparison of the measured vitamin B12 concentrations in the blood serum of all cows
used in the experiment with data from the literature (Scholz 1990; Puls 1994) leads to the
conclusion, that the cobalt supply was sufficient. According to the results from Girard and
Matte (1999) an increase of the vitamin B12 concentration was detected in the course of
lactation for all dietary cobalt levels (Table 5).

64
Table 5: Vitamin B12 concentration (pg/ml) in the serum of dairy cows in relation to the cobalt supply
exp. day 0 28 56 84 112 140 168 196 224 252 calving
group I1) 180 ± 40
194 ± 30
176 ± 23
180 ± 28
213 ± 22
214 ± 28
205 ± 40
231 ± 27
227 ± 39
216 ± 42
276 ± 43
group III2) 155 ± 21
193 ± 18
176 ± 23
181 ± 30
208 ± 20
194 ± 27
218 ± 55
209 ± 32
241 ±43
246 ± 51
315 ± 91
1) Co- supply: group I = 0.13 mg Co/kg DM; group III = 0.27 mg Co/kg DM
Reports from literature, which say that a higher Co supply results in significantly higher
Vitamin B12 concentrations in the serum (Marston 1970; Jones and Anthony 1970) could not
be confirmed, but in those reports the Co supply was much lower than in the own
experiments.
Independent of the cobalt supply the cobalt and vitamin B12 concentration in the liver tissue
decreased in the course of lactation. However, the experimental group showed a tendency
towards higher values on experimental days 100 and 200 due to a higher cobalt supply. On
the day of calving this difference proved to be significant (Table 6).
Cobalamin concentration in the liver tissue of clinically normal cattle ranged from 0.58 to 2.70
mg/kg wet weight (WW; Rammell and Poole 1974). Although vitamin B12 concentrations in the
liver tissue of the cows in the own experiments ranged between 0.64 - 0.75 mg/kg WW in the
experimental group and 0.51 - 0.64 mg/kg WW in controls, it can be concluded, that the cobalt
supply of the cows in the own experiment was sufficient in both groups.
Table 6: Vitamin B12 concentration in the liver tissue (mg/kg WW) of dairy cows in
relation to the cobalt supply
day 100 day 200 day of calving
group I (0.13 mg Co/kg DM) 0.64 Aa ± 0.07 0.61 Aba ± 0.09 0.51 Bb± 0.06
group III (0.27 mg Co/kg DM) 0.75 Aa ± 0.04 0.70 Aa ± 0.05 0.64 Aa ± 0.06
a,b: means within lines with different superscripts are significantly different (p<0.05) A,B: means within columns with different superscripts are significantly different (p<0.05) Dietary cobalt levels did not affect vitamin B12 concentration in milk. Only a marginal increase
was detected in the course of lactation (Table 7). Vitamin B12 concentrations in the colostrum
were detected to be 4 to 6 times higher compared to milk. Colostrum showed a tendency

65
towards a higher Vitamin B12 concentration due to cobalt supplementation, but results failed to
be significant (Table 7).
Table 7: Vitamin B12 concentration (ng/ml) in milk and colostrum of dairy cows in
relation to the cobalt supply milk colostrum exp. day 0 exp. day 220 exp. day 280
group I 3.77 ± 1.41 4.75 ± 3.05 16.7 ± 11.6 group III 3.66 ± 1.03 4.44 ± 0.96 21.0 ± 8.39
1) Co-supply: group I = 0.13 mg Co/kg DM; group III = 0.27 mg Co/kg DM
Extra cobalt supplementation to the ration of pregnant cows did not result in increased vitamin
B12 concentrations in the serum of their calves before they received colostrum. After the intake
of colostrum the cobalamin concentration in the serum of the calves increased in both groups
and decreased afterwards (Table 8).
Table 8: Vitamin B12 concentration (pg/ml) in the serum of the calves in relation to the
cobalt supply of the cows1)
day of birth* 1st day of life 2nd day of life 5th. day of life group I 320 ± 67 342 ± 162 206 ± 56 185 ± 40
group III 319 ± 123 361 ± 186 211 ± 36 187 ± 30 1) Co-supply: group I = 0.13 mg Co/kg DM; group III = 0.27 mg Co/kg DM * prior to colostrum intake
Conclusion: From the results it can be concluded that a cobalt supply of 0.13 mg/kg seems
to be sufficient to cover the requirement of lactating dairy cows fed a ration based on wilted
grass silage. This value is lower than the present recommendation of the GfE (2001). In
Germany the cobalt content in roughage is usually high enough to cover the requirement
(Table 9). Feeding dairy concentrate containing mineral supplements cover the requirement
even in regions with lower Co content in the roughage. Table 9: Average cobalt content in roughage in several regions of Germany
LUFA Bonn (2000 – 2002)
LWK Schleswig-Holstein
(1990/1995)
WEISS und JANSSEN (1992)
Hessen
STEMME (2002)
Braunschweig n=32 n=20 n=11 n=7 grass silage 0.50 0.07 0.39 0.13 <0.10 – 3.58 0.01- 0.2 0.14 – 0.96 0.04 – 0.31 n=9 n=5 n=8 n=1 maize silage 0.11 0.02 0.06 0.18 <0.10 – 0.18 - 0.03 – 0.13 - n=3 n=5 whole crop silage 0.14 0.02 - - <0.10 – 0.22 -

66
Summary: Cobalt (Co) is known to be an essential component in microbial synthesis of vitamin B12 (also called cobalamin) in ruminants, as it is the central atom of the vitamin B12 molecule. As cobalamin is not present in feedstuffs of plant origin, the vitamin B12 supply of ruminants has to be ensured by a sufficient Co supply. In mammalian metabolism vitamin B12 is an essential part of enzyme systems. In ruminants the most important one is the methyl malonyl CoA mutase, which is involved in the metabolism of propionic acid, the most important energy source for ruminants. Co deficient animals show unspecific symptoms such as poor appetite, reduced performance and reproductive disorders. It has been reported that roughage contains in many areas of the world less than 0.1 mg Co/kg DM which is not enough to meet the requirement of ruminants. In Germany the Co content of roughage – with the exception of a few regional differences – is high enough to meet the estimated requirement of lactating dairy cows (0.13 mg Co/kg DM). Feeding a mineral supplement, which has to contain at least 10 mg Co/kg (German feed legislation), usually covers ruminants’ requirement even in regions of Germany with lower Co contents in roughage. Literature Ammerman, C.B. (1969): Recent developments in cobalt and copper in ruminant nutrition : A review.
J. Dairy Sci. 53, 1097-1107 ARC, Agricultural Research Council (1989): The nutrient requirements of ruminant livestock.
Commonwealth Agricultural Bureaux, Slough Bigger, G.W., Elliot, J.M., Rickard, T.R. (1976): Estimated ruminal production of pseudovitamin B12,
factor A and factor B in sheep. J. Anim. Sci. 43, 1077-1081 Dryden, L.P., Hartman, A.M., Bryant, M.P., Robinson, I.M., Moore, L.A. (1962): Production of vitamin
B12 analogues by pure cultures of ruminal bacteria. Nature 195, 201-202 GfE, Gesellschaft für Ernährungsphysiologie (2001): Empfehlungen zur Energie- und
Nährstoffversorgung der Milchkühe und Aufzuchtrinder. DLG-Verlag, Frankfurt/Main Girard, C.L. (1998): B-complex vitamins for dairy cows: A new approach. Can. J. Anim. Sci. 78 (Suppl.),
71-90 Girard, C.L., Matte, J.J. (1999): Changes in serum concentration of folates, pyridoxal, pyridoxal-5-
phosphate and vitamin B12 during lactation of dairy cows fed dietary supplements of folic acid. Can. J. Anim. Sci. 79, 107-113
Gruner, T.M. (2001): Studies of vitamin B12 metabolism in sheep. PhD-Thesis, Lincoln University, New Zealand
Hedrich, M.F., Elliot, J.M., Lowe, J.E. (1973): Response in vitamin B12 production and absorption to increasing cobalt intake in the sheep. J. Nutr. 103, 1646-1651
INRA (1988): Alimantation des bovins, ovins et caprins. Paris Jones, O.C., Anthony, W.B. (1970): Influence of dietary cobalt on fecal vitamin B12 and blood
composition in lambs. J. Anim. Sci. 31, 440-443 Marston, H.R. (1935): Problems associated with ‘coast disease’ in South Australia. J. Council Scient.
Industr. Res.Austr. 8, 111-116 Marston, H.R. (1970): The requirement of sheep for cobalt or for vitamin B12. Br. J. Nutr. 24, 615-633 McDowell, L.R. (2003): Cobalt. In: Minerals in animal and human nutrition. Academic Press, San Diego,
S. 277-303 McDowell, L.R., Conrad, J.H., Hembry, F.G. (1993): Cobalt. In: Minerals for grazing ruminants in
tropical regions. 2nd ed., Anim. Sci. Dep. Center for tropical agriculture, Univ. Florida, S. 26-28 McNaught, K.J. (1948): Cobalt., copper and iron in the liver in relation to cobalt deficiency ailment. N.Z.
J. Sci. Techn. A30, 26-43

67
NRC, National Research Council (2001): Nutrient requirements of dairy cattle. 7th rev. ed. National Academy Press, Washington, D.C.
Puls, R. (1994): Vitamin B12 (Cobalamin). In : Vitamin levels in animal health. Sherpa International, Claerbrook, S. 58-64
Rammell, C.G., Poole, W.S.H. (1974): Vitamin B12 levels in the livers of clinically normal cattle. N.Z. Vet. J. 22, 167-169
Rickard, T.R., Elliot, J.M. (1978): Absorption of vitamin B12 and factor B from the intestine of sheep. J. Anim. Sci. 46, 304-308
Scholz, H. (1990): Beurteilung der Nährstoffversorgung durch Parameter am Tier (Rind). Übers. Tierernährg. 18, 137-164
Schwarz, F.J., Kirchgessner, M., Stangl, G.I. (2000): Cobalt requirement of beef cattle - feed intake and growth at different levels of cobalt supply. J. Anim. Physiol. Anim. Nutr. 88, 121-131
Seetharam, B., Alpers, D.H. (1982): Absorption and transport of cobalamin (vitamin B12). Ann. Rev. Nutr. 2, 343-369
Smith, R.M., Marston, H.R. (1970): Production, absorption, distribution and excretion of vitamin B12 in sheep. Br. J. Nutr. 24, 857-877
Stangl, G.I., Schwarz, F.J., Jahn, B., Kirchgessner, M. (2000a): Cobalt-deficiency-induced hyperhomocysteinaemia and oxidative status of cattle. Br. J. Nutr. 83, 3-6
Stangl, G.I., Schwarz, F.J., Kirchgessner, M. (2000b): Evaluation of the cobalt requirement of beef cattle based on vitamin B12, folate, homocysteine and methylmalonic acid. Br. J. Nutr. 84, 645-653
Stemme, K. (2002): Untersuchungen zur Kobalt-Versorgung von Milchkühen. Diss. Tierärztliche Hochschule Hannover
Walker, C.K., Elliot, J.M. (1972): Lactational trends in Vitamin B12 status on conventional and restricted-roughage rations. J. Dairy Sci. 55, 474-479
Weiss, J., Janssen, E. (1992): Praxiserhebungen zur Mineralstoff- und Spurenelementversorgung bei Milchkühen in nordhessischen Betrieben. VDLUFA Schriftenreihe 35; Kongressband 1992
Zagalak, B. (1982): Vitamin B12 als biologisch aktive Modellsubstanz. Naturwissenschaften 69, 63-74 Zinn, R.A., Owens, F.N., Stuart, R.L., Dunbar, J.R., Norman, B.B. (1987): B-vitamin supplementation of
diets for feedlot calves. J. Anim. Sci. 65, 267-277

68
Newer aspects of vitamin and trace element nutrition in turkeys Neuere Aspekte zur Vitamin- und Spurenelementversorgung von Puten Schenkel, H. Landesanstalt für Landwirtschaftliche Chemie, Universität Hohenheim, Emil-Wolff-Str. 14, 70599 Stuttgart
Newer aspects of vitamin nutrition of turkeys were among others focussed on the effect of
vitamin supply of the eggs on the viability of embryos and poults. For some vitamins like
vitamin E turkey poults showed differences in metabolism compared to other poultry species.
The improvement of oxidative stability of body fat by vitamin E supplementation before
slaughtering was a topic of a series of publications during the last years. Bone mineralization
and bone stability and nutrition (vitamin D active compounds, minerals and trace elements) is
still under discussion. Among water soluble vitamins, biotin supplementation in connection
with foot pad lesions was discussed intensively. Also effect of vitamin supplementation on
infectious diseases was of interest. Finally values for vitamin supplementation disussed by the
GfE were presented in this short review. Trace element supplementation of turkey diets is under discussion for several aspects:
supplementation after avoidance of feedstuffs of animal origin and the use of high phytate
containing ingredients, special effects of organic bound elements, environmental pollution,
discrepancies between recommendations of breeders and scientific organisations.
Several elements like zinc and selenium were reviewed with respects to there interactions
with vitamins and their effects on immunological reactions.
The proposals of the new EU-directive for trace element supplementation implaied no serious
effects on optimal element supply of turkeys. Proposals for recommendations discussed by
GfE are presented.

69
„Functional foods“ and its legal importance - Perspectives in German development against International comparison”
Güler, M.-Serap University of Lüneburg, Institute of Law, Scharnhorststrasse 1, 21335 Lüneburg, GERMANY Functional foods are foods which possess qualities in addition to levels of saturation, nutritional value, and simple pleasure; all of which increase the sense of well-being and overall health maintenance. They are rather a concept than a formally well-defined product group. At this time there is neither a clear and generally accepted definition, nor a clear boundary between functional and conventional foods, nutritional supplements, and homeopathic and pharmaceutical remedies. Studies do conclude that functional foods offer advantages to individual nutritional programs for specific consumer groups and / or lifestyles. Yet, further scientific study is necessary prior to publication of functional foods and their healthful effects. Often times, promotional statements are grossly exaggerated or are outright fraudulent. In order to provide the best possible consumer-protection, actual claims of increased healthfulness must be scientifically verified and a template created which can measure and formulate those claims. The presentation has been designed to benefit and support the consumer’s best interests. It focuses on the political responsibility of the state and, alternatively, on the responsibility of the food manufacturers. First, the legal status of functional foods in Germany (regarding health claims, testing, and labelling of products as much as their valuation) will be shown in an International comparison. Using information compiled via this comparison, as well as systems presently in place in other countries, it will be possible to take steps to develop concrete measures and programs against inflated, misleading claims in Germany. These voluntary commitment programs shall serve as prime examples (METHOD) To provide better consumer protection, the following conditions have to be met:
- The state must ensure that product manufacturers adhere to the laws defining strict separation of food and pharmaceuticals where functional foods are concerned (or: The strict separation of food- and pharmaceutical laws concerning functional foods is to be kept [through legal measures by the state])
- Legal solidification of the notion of functional foods in order to delete obscurities in the German legislation
- The food industry has the opportunity to act on it’s own behalf and partially reduce legal regulations and / or restrictions
- Manufacturers’ voluntary commitment programs should allow for more responsibility to, and the right of input in creating guidelines for the use of health claims. These guidelines can then be used for the promotion and marketing of their own products. This, in return will result in more trust in product information and an overall increase in food quality. (RESULTS)
The international comparison of legal guidelines for functional foods has surpassed those for Germany. Information gleaned from the comparison allows one to conclude which recommendations and / alternatives are best implemented in Germany.

70
Vitamins and trace elements in milk and cheese – Effect of milk species (cow, goat) and kind of cheese (Vitamine und Spurenelemente in Milch und Käse – Einfluss von Milchart (Kuh, Ziege) und Käseart) Schöne, F., Leiterer, M., Dornaus, Lena, Greiling, Andrea, Kinast, Carmen, Jahreis*, G., Böhm*, V. Agricultural Institution of Thuringia, D-07743 Jena, Naumburger Straße 98, Germany, *Friedrich-Schiller-University, Institute of Nutrition, D-07743 Jena, Dornburger Straße 25, Germany
Abstract
In nutrition advise cheese is sometimes characterized as „concentrated milk“ and
according to this the milk nutrients should be concentrated. Twenty-three samples of
raw bulk milk and 21 samples of milk for cheese making, cleaned and pasteurized,
and the corresponding 9 semi-hard cheeses, 6 camemberts (3 of them from goat
milk) and 6 fresh cheeses (3 of them also from goat milk) were investigated in regard
to dry matter, fat, protein and Ca, K, Mg, retinol, "-tocopherol, thiamine and
riboflavin, Zn, Mn, Se, and I. In comparison with the milk in the camembert increased
the concentration of fat, protein, Ca, Zn, Se, Mn, retinol, "-tocopherol, thiamine and
riboflavin whereas in the fresh cheese fat, protein, Se and the investigated vitamins
were concentrated but not the K, Ca, Mg and Zn. In general, there was a high loss of
I in cheese-making processes. As conclusion, in the cheese a concentration increase
of Ca, several trace elements and vitamins particularly in rennet cheeses should be
more pronounced in the advertisement. The I loss has to be counteracted. Further
innovations concern concentration of several fatty acids desired in the nutrition, i.e.
oleic acid or conjugated linoleic acids (CLA) and especially for goat milk products the
short- and middle-chain fatty acids.
Introduction
Over the last decade, German cheese consumption increased by one quarter from
15 to 22 kg per head per year (BMVEL, 2001). Depending on enlargements in the
product range and especially on innovations in the cheese segment, a continuation of
the trend might be possible. In general, new products focus on distinctive sensory
properties however on health benefits, too.

71
In nutritional advice cheese is sometimes described as ‘concentrated milk’ hoping
that in cheese all milk nutrients are accumulated. This simplified statement was used
as a starting theory for investigations of soft cheese and ripened cheese each
compared with the respective milk from which it originated. The analysed relevant
macro- and micronutrients should be compared with the data in current nutrient
tables.
Materials and methods
In the first part of the investigation, nine samples of cheese (semi-hard type, Edamer
and Gouda) from five commercial cheese plants and the respective nine samples of
cleaned pasteurized milk were taken. In addition, 23 raw bulk milk samples from dairy
farms were drawn from tanks of milk trucks by repeated scoping with a stainless steel
container of 150 ml volume on a long stainless stick, making a comparison of nutrient
contents between raw milk and milk for cheese-making possible.
In the second part of the investigation cow and goat milk and the derived camembert
or fresh cheese, all produced in one dairy, were compared. The production of the
camemberts took place in a coagulator (here a 10,000-l-tub) wherein the treated milk
was moved forward in 500-l-segments, from the addition of clotting enzymes until the
cutting of the coagulum.
The production of the fresh cheeses occurred in a 2000-l-tub (named Schulenburg-
Quarkfertiger), in which the whey was pressed off by a precisely fitting strainer tub.
Six samples of camembert and fresh cheese were taken, each three from cow and
goat milk as well as the milk from every line. Beyond the nutrients determined in the
first investigation Mg, K, Na, fatty acids and further parameters, not here mentioned
but in Dornaus (2002), were analysed.
The analyses of dry matter, fat, protein and lactose were performed in the fresh
matter according to the German food and necessaries law (LMBG § 35 and BGVV,
2000). The vitamins A, E, B1 and B2, Ca and selected trace elements were
determined in freeze dried samples as was described (Schöne et al 2003).

72
Results and discussion
Comparison of milk with the respective semi-hard cheese Compared with the raw milk, the cleaned pasteurized milk had – as is technologically
intended - a diminished content of fat and of the fat-soluble vitamins A and E, a lower
dry matter and Zn concentration and a higher protein content (Table 1). Concerning
the further determined constituents, their content in the pasteurized milk was similar
to that of the raw milk.
Table 1. Selected constituents of the milk and semi-hard cheese samples (mean values, standard deviations). Except for iodine, the differences between milk and cheese were significant. Furthermore significant differences for dry matter, fat, protein and Zn existed between raw and dairy milk. Raw milk
(n =23) Cleaned pateurized
milk (n = 9)
Cheese (n = 9)
Total solids g/kg 135 ± 6 124 ± 13 569 ± 42
Fat g/kg 41 ± 2 29 ± 8 254 ± 52
Protein g/kg 33 ± 1 36 ± 1 255 ± 23
Retinol mg/kg 0.42 ± 0.10 0.32 ± 0.18 1.73 ± 0.40
α-Tocopherol mg/kg 0.91 ± 0.24 0.68 ± 0.34 3.29 ± 1.00
Thiamine mg/kg 0.39 ± 0.07 0.35 ± 0.06 0.61 ± 0.11
Riboflavin mg/kg 0.82 ± 0.30 0.76 ± 0.34 2.58 ± 0.36
Calcium g/kg 1.1 ± 0.1 1.1 ± 0.1 8.6 ± 0.8
Zinc mg/kg 3.8 ± 1 2.9 ± 0.8 25.0 ± 4.8
Manganese µg/kg 21 ± 6 28 ± 19 163 ± 50
Copper µg/kg 57 ± 25 56 ± 15 320 ± 140
Iodine µg/kg 94 ± 531 100 ± 471 110 ± 71
Selenium µg/kg 65 ± 22 60 ± 7 394 ± 60 1without one failed result
In comparison to the milk, in the cheese the fat, protein, Ca, Zn, Se, Mn, Cu, thiamine
and riboflavin were concentrated. The concentration of I did not differ between
cheese and milk, indicating a higher I loss in the cheese-making process via the
whey.

73
Comparison of cow milk and goat milk with the respective camemberts and fresh cheeses According to the intended cheese fat levels for the camemberts, cow and goat milk
with natural fat content was used (Table 2), whereas the fat content of the milk for the
fresh cheeses was reduced by nearly one-fourth.
Table 2: Selected constituents of cow and goat milk and camemberts produced from them (mean values, standard deviations, three samples each) Cleaned pasteurized milk Camembert
Cow Goat Cow Goat
Total solids g/kg 132b ± 3 118c ± 3 501a ± 39 509a ± 9
Fat, natural g/kg 44b ± 3 37c ± 4 277a ± 15 266a ± 21
Protein g/kg 33b ± 1 31b ± 2 191a ± 14 188a ± 10
Retinol mg/kg 0.40b ± 0.10 0.26b ± 0.07 1.80a ± 0.17 2.02a ± 0.13
α-Tocopherol mg/kg 0.36b ± 0.03 0.40b ± 0.11 2.25a ± 0.15 2.09a ± 0.22
Thiamine mg/kg 0.46c ± 0.05 0.53bc ± 0.03 0.72a ± 0.04 0.62ab ± 0.08
Riboflavin mg/kg 1.26b ± 0.09 1.12b ± 0.12 2.53a ± 0.24 2.02a ± 0.46
Potassium g/kg 1.5b ± 0.0 1.8a ± 0.1 1.0d ± 0.0 1.1c ± 0.0
Calcium g/kg 1.2c ± 0.0 1.2c ± 0.0 4.4b ± 0.0 6.2a ± 0.3
Magnesium mg/kg 106d ± 9 131c ± 7 179b ± 12 309a ± 27
Zinc mg/kg 4.4b ± 0.1 3.9c ± 0.1 30.0a ± 3.4 31.7a ± 3.0
Iodine µg/kg 192b ± 51 314ab ± 137 252ab ± 95 466a ± 174
Selenium µg/kg 16b ± 3 16b ± 2 90a ± 6 101a ± 7
a, b, c, d Different superscript letters in the same line characterize significant differences.
The goat milk showed lower contents of dry matter, fat, vitamin E and Zn than the
cow milk and contained a little more K and Mg (Table 2, Table 3). The slightly higher
I content in the goat milk may indicate the usage of a more I fortified feed. Despite
the significances between cow and goat milk the demonstrated difference was small,
verifying the relationship between both ruminant species.
The camembert (Table 2) and the fresh cheese (Table 3) differed in their composition
according to the different processing. However, according to above mentioned
similarities between cow and goat milk both kinds of camembert and both kinds of
fresh cheese were relatively similar. The goat milk camembert was slightly higher in
K, Ca and Mg concentration than the cow milk counterpart. The goat-milk fresh
cheese contained one-tenth less Zn than the cow-milk fresh cheese.
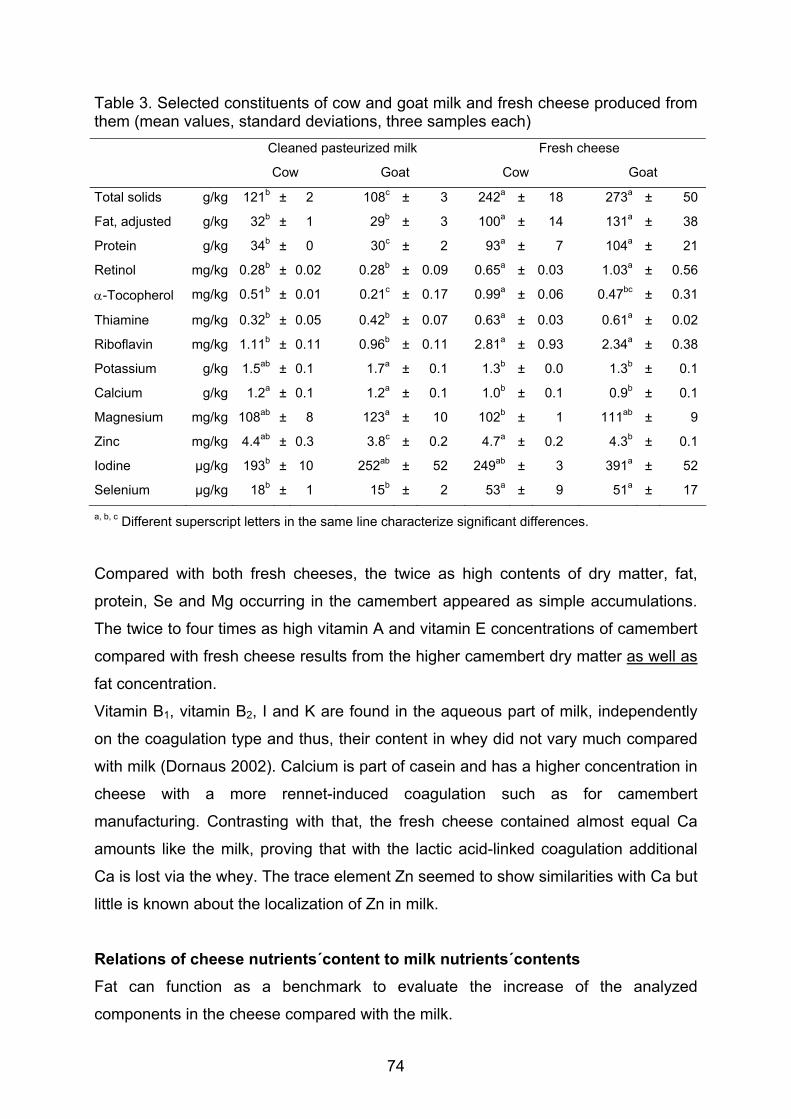
74
Table 3. Selected constituents of cow and goat milk and fresh cheese produced from them (mean values, standard deviations, three samples each) Cleaned pasteurized milk Fresh cheese
Cow Goat Cow Goat
Total solids g/kg 121b ± 2 108c ± 3 242a ± 18 273a ± 50
Fat, adjusted g/kg 32b ± 1 29b ± 3 100a ± 14 131a ± 38
Protein g/kg 34b ± 0 30c ± 2 93a ± 7 104a ± 21
Retinol mg/kg 0.28b ± 0.02 0.28b ± 0.09 0.65a ± 0.03 1.03a ± 0.56
α-Tocopherol mg/kg 0.51b ± 0.01 0.21c ± 0.17 0.99a ± 0.06 0.47bc ± 0.31
Thiamine mg/kg 0.32b ± 0.05 0.42b ± 0.07 0.63a ± 0.03 0.61a ± 0.02
Riboflavin mg/kg 1.11b ± 0.11 0.96b ± 0.11 2.81a ± 0.93 2.34a ± 0.38
Potassium g/kg 1.5ab ± 0.1 1.7a ± 0.1 1.3b ± 0.0 1.3b ± 0.1
Calcium g/kg 1.2a ± 0.1 1.2a ± 0.1 1.0b ± 0.1 0.9b ± 0.1
Magnesium mg/kg 108ab ± 8 123a ± 10 102b ± 1 111ab ± 9
Zinc mg/kg 4.4ab ± 0.3 3.8c ± 0.2 4.7a ± 0.2 4.3b ± 0.1
Iodine µg/kg 193b ± 10 252ab ± 52 249ab ± 3 391a ± 52
Selenium µg/kg 18b ± 1 15b ± 2 53a ± 9 51a ± 17
a, b, c Different superscript letters in the same line characterize significant differences.
Compared with both fresh cheeses, the twice as high contents of dry matter, fat,
protein, Se and Mg occurring in the camembert appeared as simple accumulations.
The twice to four times as high vitamin A and vitamin E concentrations of camembert
compared with fresh cheese results from the higher camembert dry matter as well as
fat concentration.
Vitamin B1, vitamin B2, I and K are found in the aqueous part of milk, independently
on the coagulation type and thus, their content in whey did not vary much compared
with milk (Dornaus 2002). Calcium is part of casein and has a higher concentration in
cheese with a more rennet-induced coagulation such as for camembert
manufacturing. Contrasting with that, the fresh cheese contained almost equal Ca
amounts like the milk, proving that with the lactic acid-linked coagulation additional
Ca is lost via the whey. The trace element Zn seemed to show similarities with Ca but
little is known about the localization of Zn in milk.
Relations of cheese nutrients´content to milk nutrients´contents Fat can function as a benchmark to evaluate the increase of the analyzed
components in the cheese compared with the milk.

75
By taking stock of not only the fresh material stake, but also of the dry matter and the
further components, Dornaus (2002) revealed 44 % of the dry matter in the whey and
52 % in the cheese. There was only a minimal difference of the amount and nutrient
concentration between the unsalted cheese curd and the mature camembert. The
total milk protein and fat split up into 24 and 10 % in the whey and 74 and 88 % in the
cheese or cheese curd, resp.. This confirms the result from part one of the
examination that fat is the most accumulated nutrient in cheese, and justifies its use
as a kind of scale for the other constituents.
Table 4. Amount of milk for semi-hard cheese, camembert and fresh cheese as well as the concentration factors of selected constituents of the cheese in relation to the respective milk Kind of cheese Semi-hard
cheese
Camembert Fresh cheese
Species Cow Cow Goat Cow Goat
Dairy milk/cheese, kg/kg 9 ... 101 7.72 8.02 3.82 5.32
Concentration factors in cheese, the content of milk =1
Total solids 4.6 3.8 4.3 2.0 2.5
Fat 8.8 6.3 7.2 3.1 4.5
Protein 7.1 5.5 6.1 2.7 3.9
Retinol 5.4 4.5 7.8 2.3 3.7
α-Tocopherol 4.8 6.2 5.2 1.9 2.2
Thiamine 1.7 1.6 1.2 2.0 1.5
Riboflavin 3.4 2.0 1.8 2.5 2.4
Potassium Not analysed 0.7 0.6 0.9 0.8
Calcium 7.8 3.7 5.0 0.8 0.8
Magnesium Not analysed 1.7 2.4 0.9 0.9
Zinc 8.6 6.8 8.1 1.1 1.1
Iodine 1.1 1.3 1.5 1.3 1.6
Selenium 6.6 5.6 6.3 2.9 3.4
1Details of the cheese companies 2Derived from Dornaus (2002)
During the production of semi-hard cheese and camembert, concentrations
according to the fat content could be obtained for Zn. Ca came close to the fat
accumulation factor only in the semi-hard cheese. During the camembert-making Ca
goes over in the whey, due to the stronger influence of bacteria cultures producing
lactic acid as clotting agent. Throughout the fresh cheese manufacture with clotting
which was reasoned mainly by lactic acid, calcium ions act similarly to K and Zn,

76
representing an ion balance between the whey and the coagulum. For Mg, the water
soluble vitamins and I existed nearly no difference between their contents in the
whey, the coagulum and in the respective milk.
The behaviour of Se in the fresh cheese was interesting because it increased almost
in the same way as the protein. From all trace elements, Se seems to show the
strongest bond with casein and the whey proteins.
Determined nutrient concentrations compared with that of nutrient tables The analysed Ca content of milk and cheese did confirm the literature (Scherz and
Senser, 2000). The higher Ca content of semi-hard cheese and camembert
compared with fresh cheese is also shown in the nutrient tables.
Similar results were found for Zn, Mg and Se. Cheese as a source of Se, should
receive more attention.
In contrast to that, the determined I concentration exceeded the previous data
significantly. Iodine findings in the milk from 100 µg/l to 400 µg/l are to be assessed
positively, compared with the 30 µg I per litre milk and less in food composition tables
(Scherz and Senser, 2000). The cited very low milk I contents reflect the nutrient
inadequacy of dairy cow’s food in the 1980s and 1990s, compared with today´s I
supplementation in compound feeds and mineral premixes. Even though the high
milk I levels had been confirmed earlier (Kaufmann et al. 1997, Jahreis et al. 2000)
and these informations are not available in current food tables.
Conclusions
The accumulation of Ca, certain vitamins and trace elements during the cheese
manufacture should be more emphasized in consumer´s information and advertising.
The I loss during cheese making should be compensated by using iodized salt.
Further innovative approach concerns the enrichment of certain desired fatty acids
such as oleic acid and CLA.
Acknowledgments
We would like to express the deepest gratitude to Mr Claus Katzenberger, manager of the Käserei Altenburger Land GmbH & Co. KG Lumpzig/OT Hartha for the support and patience.
77
References
Bundesamt für Gesundheitlichen Verbraucherschutz und Veterinärmedizin (BGVV,
Hrsg.) (2000): Amtliche Sammlung von Untersuchungsverfahren nach § 35
LmbG, Beuth Verlag Köln.
BMVEL (2001): Statistisches Jahrbuch über Ernährung, Landwirtschaft und Forsten
der Bundesrepublik Deutschland. Landwirtschaftsverlag GmbH Münster-Hiltrup,
45.
Dornaus, L. (2002): Inhaltsstoffe und sensorische Qualität von Kuh-, Ziegen- und
Schafmilch sowie daraus hergestellten Käses. Diplomarbeit Friedrich-Schiller-
Universität Jena, Biologisch-Pharmazeutische Fakultät, Institut für
Ernährungswissenschaften.
Jahreis, G., M. Leiterer, K. Franke, W. Maichrowitz und F. Schöne (2000):
Untersuchungen zur Jodversorgung bei Schulkindern und zum Iodgehalt der
Milch in Thüringen. Proc. 3. Internationales Iodsymposium, Chemnitz, K. Bauch
(Hrsg.), 89 – 95.
Kaufmann, S.T., W.A. Rambeck, S. Muske, E.R. Elsner, U. Preiß und P.R. Wallnöfer
(1997): Der Einfluss des Jodgehaltes im Futter auf den Milchjodgehalt unter
besonderer Berücksichtigung der Milchqualität. Z. Ernährungswiss. 36, 83
(abstr.).
Scherz, H. und F. Senser (2000): Die Zusammensetzung von Lebensmitteln,
Nährwerttabellen. Begründet von Souci, S.W., Fachmann, W. und Kraut, H.
Medpharm Scientific Publishers Stuttgart.
Schöne, F., M. Leiterer, H. Hartung, C. Kinast, A. Greiling, V. Böhme, G. Jahreis
(2003): Trace elements and further nutrition-related constituents of milk and
cheese. Milchwissenschaften 58, 486-490.

78
Preventive effects of vitamins and of non-nutrient plant factors Heseker, H. Departmert of Sports & Health, Faculty of Natural Sciences, University Paderborn D-33095 Paderborn, e-mail: [email protected]
Introduction
Cardiovascular diseases and cancer are the leading causes of death in Germany and
many other developed countries. Observational studies, conducted in the 1980‘s sug-
gested that people who consume more fruits and vegetables containing vitamin C and
�-carotene have somewhat lower risks of certain cancers and cardiovascular diseases.
From these studies it has long been speculated that vitamin status plays a significant
role in the prevention of these diseases. This hypothesis was strongly supported by ear-
lier basic research providing plausible mechanisms (Hennekens et al, 1996).
Results from basic research
It was hypothesized that oxidative damage to cells contributes to carcinogenesis and
that oxidation of LDL plays a major role in atherogenesis. In in-vivo- and in-vitro studies
the antioxidant vitamins C and E and �-carotene, counteract damage to biological
structures due to oxidants (Evans and Halliwell, 2001). This raised the possibility that
increased intake of these vitamins might prevent cancer. Vitamin A, which acts within
the cell to control gene expression (Hansen et al., 2000), and folic acid, which is in-
volved in DNA methylation and purine and pyrimidine synthesis (Choi and Mason,
2000), may also play a role in preventing cancer.
The biological basis of antioxidant use to prevent atherosclerotic heart disease is based
largely on the oxidative modification hypothesis of atherosclerosis (Morris and Carson,
2003). The hypothesis that lipid peroxidation or oxidative modification of low density
lipoprotein contributes to the progression of atherosclerosis is supported by an impres-
sive body of in-vitro findings and by persuasive results in animal models of atheroscle-
rosis. The hypothesis was originally proposed specifically to account for foam cell for-
mation (Pittman and Steinberg, 1984). But oxidation of LDL has now been shown to
confer on it a long list of new biological properties any one of which could in principle
enhance its atherogenicity (Steinberg, 1995). Therefore antioxidants capable of inhibit-
ing lipid peroxidation should theoretically support primary and secondary prevention and
consequently reduce cardiovascular events, including myocardial infarction (Tribble,
1999).

79
Results from non-intervention studies
These promising results enormously stimulated the research of the possible role of anti-
oxidant vitamins in preventing the development of these diseases during the last 20
years. A large number of case-controll-studies as well as cohort studies (with prospec-
tive or retrospective design) have been conducted, supporting the notion that high blood
concentrations or dietary intake of antioxidant vitamins may have a protective effect (Bi-
esalski 2001).
In these observational studies people with high intake of antioxidant vitamins by regular
diet or as food supplements generally had a lower risk of myocardial infarction, stroke or
cancer than people who are low-consumers of antioxidant vitamins. The associations in
observational studies have been shown for carotene, ascorbic acid as well as toco-
pherol (Asplund 2002).
Therefore, people have thought that taking these vitamins might help to reduce the inci-
dence or progression of atherosclerotic CVD. Similarly, information suggests that these
vitamins might lower a person’s chances of developing cancer and antioxidant supple-
mentation even might protect against cancer. On the basis of these findings and power-
ful marketing strategies, many healthy people are now voluntarily consuming antioxidant
supplements (Maxwell, 1999).
In nutritional epidemiological studies often interesting and sometimes promising asso-
ciations between nutritional parameters and health outcomes are found, leading to new
hypotheses. These hypotheses have to be tested e.g. by in-vitro- and in-vivo-studies, by
more sophisticating population based studies and finally by randomized controlled trials,
before new dietary guidelines can be developed (Fig. 1). From the point of evidence-
based nutrition it is not justified to derive new dietary guidelines only from correlational
data of epidemiological studies, from animal studies or from the data of in-vitro-systems.
It must be differentiated between the mechanistic and the preventive or clinical effects.
It is one thing to know, how a single nutrient influences the metabolism. It is another
thing to know, whether a supplemental dosage of a specific nutrient has a significantly
positive effect for healthy persons or patients compared to a placebo. Therefore, hy-
potheses always have to be tested by the instruments of basic and of clinical research.

80
Fig. 1: From hypothesis to a evidence-based dietary guidelines
Results from randomized controlled trials To test the efficacy of vitamin supplements in the primary and secondary prevention of
malignant neoplasms and cardiovascular diseases several randomized, double blind,
placebo-controlled trials were designed and conducted worldwide. These intervention
trials have examined the effect of vitamin supplements on cancer biomarkers, on the
incidence and progression of precancerous lesions, on the incidence of invasive cancer,
on cancer-specific and all-cause mortality. In other randomized trials the effects of anti-
oxidant vitamins in the primary or secondary prevention of cardiovascular disorders in-
cluding myocardial infarction and stroke or combined cardiovascular events as end-
points were studied. In Europe and the USA more than 110 000 women and men were
involved between 3 and 12 years in these intervention studies. Most of these long term,
prospective, randomised, placebo-controlled trials have now been completed and have
been published in the last decade (Heyden, 2003).
These studies have been carefully evaluated in meta-analyses and have been system-
atically reviewed (Lee 1999; Maxwell 1999; Meyer 2000; Kuller 2001; Asplund 2002;
Heyden 2003; Muntwyler et al, 2002; Morris and Carson 2003; USPSTF 2003; Vivekan-
anthan et al 2003).
The results of the randomized trials and the subsequent meta-analysis have been gen-
erally disappointing and have provided little evidence of the efficacy of a supplementa-
nutritional epidemiology new hypothesis
consistent results testing the hypothesis- biochemistry/molecular biology
- animal studiesconsensus about - in-vitro-studies
the meaning - population-based studiesof the association - randomized controlled trials
dietary reference intake data dietary guidelines(DACH, RDA, DRI) (for consumers)

81
tion with vitamins with antioxidative properties. The authors of the reviews on CVD
found that the highest-quality studies did not show that vitamins consistently or mean-
ingfully decreased CVD. The highest-quality studies assigned people at random to take
either vitamin supplements or a placebo pill. In these types of studies, the groups of
people are similar in all regards except for taking vitamins. A fair number of studies with
weaker designs suggested an association between taking vitamins and less CVD. How-
ever, in the weaker studies, the people who took vitamins may have had healthier be-
havior in general, such as better eating and exercise habits (USPSTF 2003).
The possibility remains of risk reduction among certain subgroups defined by cancer
type or baseline characteristics. The studies that have reported an inverse relationship
between supplementation of vitamins and risk for specific cancers may be affected by
small case numbers and evaluation of multiple endpoints and have yet to be replicated
(USPSTF 2003).
Risk of high dosages of antioxidant vitamins
The clinical trials reviewed do not document any consistent association between vitamin
supplementation and risk for cancer. The authors of the articles on vitamins and cancer
found no convincing evidence that vitamins prevented cancer. Of greater concern, they
have unexpectedly raised concerns that antioxidants, notably �-carotene, might in-
crease the rate of development of cancers in high risk individuals (e.g. smokers or as-
bestos workers). In two high-quality studies, smokers taking �-carotene supplements
developed cancer more often than those who did not take �-carotene (ATBC-Study
Group, 1994; Omnen et al 1996; Virtamo et al 2003). Steinberg, the author of the anti-
oxidant-hypothesis, stated already in 1993 "Are we really sure that 500 or 1000 IU of
vitamin E daily carries no risk over a five-year period? A 20-year period?". The serious
adverse effects of ß-carotene in smokers have led health authorities like the BfR (Fed-
eral Institute for Risk Assessment) to warn the population not to use high dosages of �-
carotene and meanwhile has regulated its dosage in supplements.
Actual recommendations
After the initial enthusiasm for antioxidants in the prevention of cardiovascular disease
and certain cancers, the recommendations on antioxidants and their potential preven-
tive effects had to be revised in the light of the large body of new evidence. Antioxidant
vitamins as food supplements cannot be recommended in the primary or secondary
prevention against cardiovascular disease or cancer (Asplund 2003). The German So-

82
ciety of Nutrition (DGE et al 2000) and many other scientific committees therefore rec-
ommend that people should not take ß-carotene supplements to lower their chances of
developing CVD or cancer. They recommend neither for nor against taking vitamins A,
C, or E; or combinations of these vitamins for the primary purpose of preventing CVD or
cancer. For this reason regular consumption of antioxidant vitamins supplements cannot
yet be advocated as a healthy lifestyle trait. But there may be other reasons that people
choose to take vitamins.
These recommendations do not apply to people who are known to have definite defi-
ciencies of one of the vitamins studied or are risk (DGE, 2003). Without any doubt folate
supplementation is of great importance for women in childbearing age in the prevention
of neural tube defects (Willett and Stampfer 2001; Wald et al., 2001; Fletcher and Fair-
field 2002; Villar et al., 2003) and vitamin D in elderly people in the prevention of osteo-
porosis (Dawson-Hughes et al, 1996; Zittermann 2003). In recent reviews Kuller (2001)
asks "A time to stop prescribing antioxidant vitamins to prevent and treat heart dis-
ease?" and Heyden (2003) announces already "The end of supplementation with anti-
oxidant vitamins".
Explanations for the discrepancies
As shown before observational studies provide fairly consistent data for an inverse as-
sociation between high intake of antioxidant vitamins, especially ß-carotene and vitamin
C, and cancer risk. However, randomized trials generally have not supported the hy-
pothesis. Several explanations are possible for the discrepancy between the different
types of studies (Lee, 1999; Morris and Carson 2003). These include:
1) confounding by other healthy dietary and non-dietary habits in observational studies, which cannot be controlled completely (e.g. supplement use may be a component in a cluster of healthy behaviour)
2) the protective role of a combination of many different nutrients present in fruits and vegetables, rather than the single nutrient or combination of two nutrients that most trials have tested;
3) inadequate duration of follow-up in most randomized trials; 4) inappropriate, suboptimal or overpowered vitamin dosages; 5) misclassification of cardiovascular end-points in secondary prevention studies; 6) heterogeneity of the populations studied (randomized trails are mostly carried out in
high-risk samples, whereas observational studies are conducted in general, broad-risk samples)

83
Reliable epidemiological evidence regarding whether antioxidant vitamins play a role in
preventing cancer will have to come from both observational studies and randomized
trials since these different study designs each have unique strengths and limitations.
Non-nutrient plant factors
In food many bioactive substances are found in minor amounts, which may have signifi-
cant metabolic and/or physiological effects, too. At the moment they are intensively
studied to evaluate their effects on health. These compounds have long time been clas-
sified as antinutritional factors (Champ 2002). Again, the impetus sparking this scientific
inquiry was the result of many observational epidemiologic studies that have shown pro-
tective effects of plant-based diets on cardiovascular disease and cancer. Many bioac-
tive compounds have been discovered. These compounds vary widely in chemical
structure and function and are grouped accordingly. At the moment research is focus-
sing on physiological effects, gene expression and regulation of detoxification enzyme
systems and bioavailability of these non-nutrient plant factors (Finley 2003).
Phenolic compounds, including their subcategory, flavonoids, are present in all plants
and have been studied extensively in cereals, legumes, nuts, olive oil, vegetables, fruits,
tea, and red wine (Kris-Etherton et al 2002). Many phenolic compounds have antioxi-
dant properties and other promising properties. Some studies have demonstrated fa-
vorable effects on thrombosis and tumorogenesis and promotion. Although some epi-
demiologic studies have reported protective associations between flavonoids or other
phenolics and CVD and cancer, other studies have not found these associations
(Steinmetz and Potter 1996). Various phytoestrogens are present in soy, but also whole
grains, fruits, and vegetables. They have antioxidant properties, too, and some studies
demonstrated favorable effects on other CVD risk factors, and in animal and cell culture
models of cancer (Kris-Etherton et al 2002). Resveratrol, found in nuts and red wine,
has antioxidant, antithrombotic, and anti-inflammatory properties, and inhibits carcino-
genesis in-vitro (Cal et al 2003). Lycopene, a potent antioxidant carotenoid in tomatoes
and some fruits, is thought to protect against prostate and other cancers, and inhibits
tumor cell growth in animals (Agarwal and Rao 2000). Organosulfur compounds in gar-
lic and onions, isothiocyanates in cruciferous vegetables, and monoterpenes in citrus
fruits, cherries, and herbs have anticarcinogenic actions in experimental models, as well
as cardioprotective effects (Watzl and Leitzmann 1999).

84
Overall the hypothesis, that non-nutrient plant factors have preventive effects, has
maturated to the level supported by experimental and epidemiological data, but it has
not yet attained the status of a clinically validated hypothesis in the sense of evidence-
based-medicine. Therefore much scientific research needs to be conducted before nu-
trition committees can begin to make science-based dietary recommendations. At the
moment in Key Action 1 „Food, Nutrition & Health“ of the Fifth Framework Programme
of the European Community 12 research projects are funded on non-nutrient plant fac-
tors. Because no randomized, double blind, placebo-controlled trials have been pub-
lished, no assessment of possible health benefits and preventive effects for human can
be made at the moment.
Conclusion
Despite the unexpected results from the ATBC and CARET study that supplementation
with �-carotene increased, rather than decreased, lung cancer incidence, considerable
interest remains in investigating how other compounds in fruits and vegetables may af-
fect cancer risk. A secondary evaluation of the data of the placebo group of the CARET
study provides evidence that plant foods have an important preventive influence in a
population at high risk for lung cancer. However, persons who use ß-carotene supple-
ments do not benefit from the protective compounds in plant foods - they should stop
smoking (Neuhouser et al 2003).
Fig. 2: Diet and Health Guidelines for Cancer Prevention (American Institute for Cancer Research)
• Choose a diet rich in a variety of plant-based foods.
• Eat plenty of vegetables and fruit.
• Maintain a healthy weight and be physically active.
• Drink alcohol only in moderation, if at all.
• Select foods low in fat and salt.
• Prepare and store food safely.
• And always remember do not use tobacco in any form!
In view of these findings, the most prudent and scientifically supportable recommenda-
tion for the general population is to consume a balanced diet with emphasis on vitamin-
rich fruits and vegetables (e.g. campaign 5-a-day) and whole grains rather than the
consumption of specific antioxidant vitamin supplements. This advice is consistent with

85
the current dietary guidelines of the German Society of Nutrition and many other nutri-
tion committees.
References Agarwal S, Rao AV: Tomato lycopene and its role in human health and chronic dis-
eases. CMAJ 2000; 63: 739-744 Asplund K: Antioxidant vitamins in the prevention of cardiovascular disease: a system-
atic review. J Intern Med 2002; 251: 372-392
ATBC-Study Group: The effect of vitamin E and beta-carotene on the incidence of lung
cancer and other cancers in male smokers. New Engl J Med 1994; 330: 1029-1035
Biesalski HK: Evidence from intervention studies. In: Walter P, Hornig D, Moser U (eds):
Functions of vitamins beyond recommended dietary allowances. Bibl Nutr Dieta
2001; 55: 92-134
Cal C, Garban H, Jazirehi A, Yeh C, Mizutani Y, Bonavida B: Resveratrol and cancer:
chemoprevention, apoptosis, and chemo-immunosensitizing activities. Curr Med
Chem Anti-Canc Agents 2003; 3: 77-93
Champ MM: Non-nutrient bioactive substances of pulses. Br J Nutr 2002; 88(Suppl 3):
S307-319
Choi SW, Mason JB. Folate and carcinogenesis: an integrated scheme. J Nutr 2000;
130:129-132.
Dawson-Hughes B, Harris SS, Krall EA, Dallal GE: Effect of calcium and vitamin D sup-
plementation on bone density in men and women 65 years of age or older. N Engl J
Med 1997; 337: 670-676
DGE, ÖGE, SGE, SVE (Hrsg.): Referenzwerte für die Nährstoffzufuhr. 1. Auflage. Um-
schau Braus Verlag, Frankfurt (2000)
DGE: Stellungnahme der DGE: Vitaminversorgung in Deutschland. DGE-Info 2003; 5:
68-72
Evans P, Halliwell B: Micronutrients: oxidant/antioxidant status. Br J Nutr 2001;
85(Suppl 2): S67-74
Finley JW: The antioxidant responsive element (ARE) may explain the protective effects
of cruciferous vegetables on cancer. Nutr Rev 2003; 61: 250-254
Fletcher RH, Fairfield KM: Vitamins for chronic disease prevention in adults: clinical ap-
plications. JAMA 2002; 287: 3127-3129
Hansen LA, Sigman CC, Andreola F, Ross SA, Kelloff GJ, De Luca LM: Retinoids in
chemoprevention and differentiation therapy. Carcinogenesis 2000; 21: 1271-1279

86
Hennekens CH, Buring JE, Manson JE, Stampfer M, Rosner B, Cook NR, Belanger C,
LaMotte F, Gaziano JM, Ridker PM, Willett W, Peto R: Lack of effect of long-term
supplementation with beta carotene on the incidence of malignant neoplasms and
cardiovascular disease. N Engl J Med 1996; 334:1145-1149
Heyden S: Das Ende der Supplementierung mit anti-oxidativen Vitaminen.
Akt Ern Med 2003; 28: 113-120
Kris-Etherton PM, Hecker KD, Bonanome A, Coval SM, Binkoski AE, Hilpert KF, Griel
AE, Etherton TD: Bioactive compounds in foods: their role in the prevention of car-
diovascular disease and cancer. Am J Med 2002;113(Suppl 9B): 71S-88S
Kuller LH: A time to stop prescribing antioxidant vitamins to prevent and treat heart dis-
ease?
Arterioscler Thromb Vasc Biol 2001; 21:1253
Lee IM: Antioxidant vitamins in the prevention of cancer. Proc Assoc Am Phys 1999;
111:10-15
Maxwell SR: Antioxidant vitamin supplements: update of their potential benefits and
possible risks. Drug Safety 1999; 21: 253-266
Meyer FP: Multivitaminpräparate: große Hoffnungen - keine Beweise. Dt Ärzteblatt
2000; 97: 2360-2361
Morris CD, Carson S: Routine vitamin supplementation to prevent cardiovascular dis-
ease: a summary of the evidence for the U.S. Preventive Services Task Force. Ann
Intern Med 2003; 139: 56-70
Muntwyler J, Hennekens CH, Manson JE, Buring JE, Gaziano JM: Vitamin supplement
use in a low-risk population of US male physicians and subsequent cardiovascular
mortality.
Arch Intern Med 2002; 162:1472-1476
Neuhouser ML, Patterson RE, Thornquist MD, Omenn GS, King IB, Goodman GE:
Fruits and Vegetables Are Associated with Lower Lung Cancer Risk Only in the
Placebo Arm of the beta-Carotene and Retinol Efficacy Trial (CARET). Cancer Epi-
demiol Biomarkers Prev 2003; 12: 350-358
Omenn GS, Goodman GE, Thornquist MD, Balmes J, Cullen MR, Glass A, Keogh JP,
Meyskens FL, Valanis B, Williams JH, Barnhart S, Hammar S: Effects of a combina-
tion of beta-carotene and vitamin A on lung cancer and cardiovascular disease. N
Engl J Med 1996; 334: 1150-1155

87
Pittman RC, Steinberg D: Sites and mechanisms of uptake and degradation of high
density and low density lipoproteins. J Lipid Res 1984; 25: 1577-1585
Steinberg D: Antioxidant vitamins and coronary heart disease. N Engl J Med 1993; 328:
1487-1489
Steinberg D: Clinical trials of antioxidants in atherosclerosis: are we doing the right
thing? Lancet 1995; 346: 36-38
Steinmetz KA, Potter JD: Vegetables, fruit, and cancer prevention: a review. J Am Die-
tetic Assoc 1996; 96: 1027-1039
Tribble DL: AHA Science Advisory. Antioxidant consumption and risk of coronary heart
disease: emphasison vitamin C, vitamin E, and beta-carotene: A statement for
healthcare professionals from the American Heart Association. Circulation 1999;
99:591-595
USPSTF (U.S. Preventive Services Task Force): Routine vitamin supplementation to
prevent cancer and cardiovascular disease: recommendations and rationale. Ann
Intern Med 2003; 139: 51-55
Villar J, Merialdi M, Gulmezoglu AM, Abalos E, Carroli G, Kulier R, de Onis M: Nutri-
tional interventions during pregnancy for the prevention or treatment of maternal
morbidity and preterm delivery: an overview of randomized controlled trials. J Nutr
2003;133(Suppl 2):1606S-1625S
Virtamo J, Pietinen P, Huttunen JK, Korhonen P, Malila N, Virtanen MJ, Albanes D,
Taylor PR, Albert P; ATBC Study Group: Incidence of cancer and mortality follow-
ing alpha-tocopherol and beta-carotene supplementation: a postintervention follow-
up. JAMA 2003; 290: 476-485
Vivekananthan DP, Penn MS, Sapp SK, Hsu A, Topol EJ: Use of antioxidant vitamins
for the prevention of cardiovascular disease: meta-analysis of randomised trials.
Lancet 2003; 361: 2017-2023
Wald NJ, Law MR, Morris JK, Wald DS: Quantifying the effect of folic acid. Lancet 2001;
358: 2069-2073
Watzl B, Leitzmann C: Bioaktive Substanzen in Lebensmitteln. Hippokrates Stuttgart
(1999)
Willett WC, Stampfer MJ: What vitamins should I be taking, doctor? N Engl J Med 2001;
345: 1819-1824
Zittermann A: Vitamin D in preventive medicine: are we ignoring the evidence? Br J Nutr
2003; 89: 552-572

88
Einsatzmöglichkeiten von Zutaten mit funktionellem Wirkstoffspektrum am Beispiel von Traubenschalenextraktionsrückständen Meier, J., John, T., Schmidt, C. FH Neubrandenburg University of Applied Sciences, Department of Technology, Brodaer Str. 2, 17033 Neubrandenburg, Germany
Einleitung und Zielsetzung
Lebensmittelzutaten mit einem funktionellen Wirkstoffspektrum und damit einem
gesundheitlichen Zusatznutzen bilden seit einiger Zeit einen Schwerpunkt in der
Forschung (Mazza, 1998; Mazza und Oohmah, 2000; Wildman, 2001). Mit der
Diskussion um das „French Paradox“ (Renaud und de Lorgeril, 1992) sind auch die
Inhaltsstoffe des Rotweins in den Fokus dieser Untersuchungen von Inhaltsstoffen
mit funktionellen Wirkstoffspektrum gelangt. Im Rotwein selbst finden sich
Flavonole als wichtigste Gruppe der sekundären Pflanzenstoffe mit gesundheits-
fördernden Eigenschaften. Flavonole werden therapeutisch bei entzündlichen
Erkrankungen mit Bindegewebsschädigung, bei Venenleiden und als Hepato-
protektiva eingesetzt. Flavonole haben antioxidative und Radikalfängereigenschaften
und zeigen präventive Wirkungen zur selektiven Senkung des Blutlipoidspiegels
(Cholesterinspiegels) durch Verhinderung der Oxidation des LDL (Low Density
Lipoprotein). Zugeschrieben werden den Flavonolen ferner antithrombotische
Eigenschaften, die die Aggregation der Blutplättchen herabsetzen und zu einer
kumulativen Prophylaxe von Herz-Kreislauf-Erkrankungen führen. Den Flavonolen
werden weiterhin antiinflammatorische, antiallergische, antivirale und antidiabeto-
gene Wirkungen zugeschrieben. Auch klinische Studien zeigen, dass mäßiger
Weingenuss das Risiko für KHK-Erkrankungen vermindert (Lachtermann et al.,
1999). Aus den während der Pressung der Trauben anfallenden Schalen, lassen
sich durch alkoholische Extraktion noch enthaltene Flavonole gewinnen. Selbst in
dem verbleibendem Extraktionsrückstand sind noch bedeutsame Mengen an
Flavonolen in der Größenordnung von 10 bis 20 g Gallussäureäquivalente (GAE)/kg
nachweisbar.
Ziel des Beitrages ist es zu prüfen, in welcher Weise diese Traubenschalen-
extraktionsrückstände (TSER), die bei der Herstellung von Rotwein anfallen und
Inhaltsstoffe mit funktionellem Wirkstoffspektrum besitzen, als Zutaten in der
Lebensmittelproduktion genutzt werden können. Die Möglichkeit der

89
Ballaststoffanreicherung von Lebensmitteln durch TSER, wie vielfach durch
Zusatz von Getreide- oder sonstigen Pflanzenfasern (Spiller, 2001) realisiert, soll
hier nicht betrachtet werden.
Material und Methoden
Untersuchungsgut
Der TSER wurde von der Firma Protekum (Oranienburg, Deutschland) bereit
gestellt und auf eine Teilchengröße von kleiner 315 µm vermahlen. Vorversuche
zeigten, dass der Gehalt an Gallussäureäquivalenten (GAE) im getrockneten und
vermahlenen TSER bei 12,4 g/kg lag und auch während thermischer Prozesse
(z.B. während des Backens) nur geringfügig abnahm. Um die
Einsatzmöglichkeiten des TSER zu prüfen, wurden drei Lebensmittel als
Untersuchungsmodelle gewählt. Es wurden jeweils Teigwaren, Müsliriegel und
Knabberstangen im Labormaßstab nach üblicher Rezeptur und zusätzlich unter
Hinzufügung definierter Mengen (5 oder 10 %) vermahlenem TSER hergestellt.
Die Produkte wurden instrumentell (Texture Analyser) und mit objektiven
sensorischen Methoden untersucht, die nachfolgend beschrieben werden sollen.
Prüfpersonen und Prüflabor
Die Prüfpersonen wurden einer Reihe von Eingangstests unterzogen und
verfügten über eine Basisausbildung in der sensorischen Untersuchungen analog
DIN 10961. 12 Prüfpersonen wurden in das deskriptive Panel aufgenommen.
Sämtliche Auswahlprozeduren, Schulungen und Produktuntersuchungen fanden
im Sensorikbereich, der mit speziellen Einzelkabinen ausgestattet ist, des
Zentrums für Lebensmitteltechnologie (ZLT) in Neubrandenburg statt. Die
Raumtemperatur (20 ° C) und die relative Luftfeuchtigkeit wurden während der
Prüfung durch Klimatisierung der Räume konstant gehalten. Eine mögliche
Beeinflussung der visuellen Wahrnehmung der Prüfpersonen durch veränderliches
Tageslicht wurde durch Einsatz von Beleuchtungselementen mit standarisierter
Beleuchtungsintensität und gleicher Farbtemperatur ausgeschlossen.

90
Deskriptive Analyse
Die Beschreibung der sensorischen Attribute und deren Intensität kann nur mit
einem objektiven Prüfverfahren geschehen. Daher wurde für diesen Zweck ein
Verfahren gewählt, das Elemente der Profilprüfung, der QDA nach Stone und
Sidel (1993) sowie der Spectrum-Technik (Meilgaard et al., 1999) enthielt. Diese
Form der deskriptiven sensorischen Untersuchung beginnt mit der Entwicklung
einer produktspezifischen Attributliste, die die verschiedenen sensorischen
Merkmale der Produkte repräsentiert. Durch die Verwendung einer Vielzahl von
Referenzproben für die Attribute trainierten die Prüfer nicht nur den eindeutigen
Gebrauch der Attribute, sondern auch die Einordnung der Intensitäten. Nach der
grundlegenden Schulung wurden 8 Sitzungen á 2 Stunden angesetzt, um die
Attributliste aufzustellen und die Erkennung der Intensitätsausprägungen zu
trainieren. Die Proben wurden jeweils in neutralen transparenten Plastikbechern
gereicht, die nur mit einer dreistelligen Zufallsziffer gekennzeichnet waren. Die
Reihenfolge der Probendarreichung wurde randomisiert, um eventuelle
Reihenfolgeeffekte auszuschließen. Für die Eingabe der Daten wurden
Personalcomputer verwendet, die in jeder Prüfkabine installiert waren. Die
Auswertung der Daten wurde mit dem Softwarepaket FIZZ durchgeführt. Nach den
8 Vorbereitungssitzungen wurde die eigentliche Prüfung mit drei Wiederholungen
an unterschiedlichen Wochentagen durchgeführt. Dabei untersuchte jede
Prüfperson jedes Produkt (Complete design).
Mathematische und statistische Verfahren
Zur Auswertung der sensorischen Daten wurde die Varianzanalyse (α ≤ 0,05) mit anschließendem Tukey Test (α ≤ 0,05) angewendet. Zur Reduktion der verwendeten Attribute und möglichen Konzentration auf einzelne Faktoren wurden Korrelationen zwischen den Attributen berechnet und zusätzlich eine Haupt-komponentenanalyse (PCA) durchgeführt. Ergebnisse
Nudelteig
Der Nudelteig entfaltete nach Zusatz von 5 und 10 % TSER Eigenschaften, die
zum Versuchsabbruch in diesem Segment führten. Technologisch waren die mit

91
TSER versehenen Nudeln durch einen rissigen Teig sowie mangelnde
Kochstabilität gekennzeichnet. Sensorisch waren die Produkte durch ein stark
sandiges Mundgefühl charakterisiert.
Müsliriegel
Müsliriegel ohne TSER unterschieden sich in der Ausprägung ihrer sensorischen
Attribute nur in wenigen Punkten von den Proben mit 5 % TSER. Bei Zugabe von
10 % TSER zu der Ausgangsrezeptur war bei den Müsliriegeln ein signifikantes
Ansteigen des Mohnaromas und eine Abnahme des Kokosaromas zu
verzeichnen. In Abbildung 1 werden die Ausprägungen der jeweiligen Attribute
im Detail dargestellt.
Abb. 1: Einfluss des Zusatzes von TSER auf die sensorischen Eigenschaften des
Lebensmittelmodells Müsliriegel (MR)
Knabberstangen
Der Zusatz von 5 und 10 % TSER bei den Knabberstangen führte zu einem
signifikanten Ansteigen des Mohnaromas und zu einer Abnahme der
Flavournoten Sesam, Weißbrot, Salzstange und süßlicher Nachgeschmack.
0
10
20
30
40
50
60
70Dunkle Partikel
Röstaroma
Mohn
Nussig
HonigKokos
Süß
Elastisch
Sandig
MR 0% TSER MR 5% TSER MR 10% TSER

92
Abb. 2: Einfluss des Zusatzes von TSER auf die sensorischen Eigenschaften des
Lebensmittelmodells Knabberstangen (KS)
Bei beiden Modellen stieg das sandige Mundgefühl und die visuelle
Wahrnehmung dunkler Partikel mit Erhöhung der Zugabemenge und
wachsender Partikelgröße des TSER an.
Schlussfolgerung
TSER lässt sich am besten bei der Herstellung solcher Lebensmitteln verwenden,
deren Zutaten ähnliche Partikeleigenschaften wie der TSER besitzen oder die
während eines hydrothermischen Produktionsschritts eine ausreichend stabile
Gerüststruktur ausbilden, die den TSER in diese Matrix einbinden kann. Zusätzlich
ist beim Zusatz von TSER zu beachten, dass einzelne Aromen in Ihrer Intensität
gegenüber Produkten ohne Zutat von TSER variieren können. Je nach
gewünschter Aromaausprägung des Endproduktes, ist dies bei der Rezeptur-
gestaltung zu berücksichtigen.
Aufbauend auf den aktuellen Ergebnissen kann in einem zukünftigen Schritt
mittels hedonischer Testverfahren und Auswertung der Daten mit der Technik des
0
10
20
30
40
50
60
70
80Dunkle Partikel
Sesam
Weißbrot
Röstaroma
Mohn
BitterSalzig
Süß
Mohn
Salzstangen
Sandig
KS 0% TSER KS 5% TSER KS 10% TSER

93
Internal Preference Mappings (Greenhoff und MacFie, 1994) festgestellt werden,
welche Gruppen der Verbraucherschaft den hier untersuchten Produkten
besonders zugeneigt ist.
Summary Food Ingredients with Functional Qualities: Grape Skin Residue This study investigates the potential use of grape skins which are left over after the pressing operation during the production of red wine. This residue contains a considerable spectrum of ingredients with valuable functional properties which may find use as additives in the production of foodstuffs. Three foods (pasta, Müsli bars and snack bars) were chosen to determine possible uses of the grape by-product. The foods were produced using the usual recipes and adding defined quantities of ground grape skin residue. The products were subjected to texture analyzer tests and objective sensory methods. The study shows that grape skin residue can best be used in such foods as have similar particulate qualities as the residue, or which can develop a sufficiently stable matrix during a hydrothermic production step to encapsulate the ingredient. Literatur Greenhoff K, MacFie HJH (1994): Preference mapping in practise. In: MacFie
HJH, Thomson DMH (Ed.): Measurement of Food Preferences. Blackie Academic and Professional, New York, 137-166
Lachtermann E, Turhanova L, Rodicziewicz M, Stein-Hammer C, Schicketanz KH, Nagel D; Franz H; Jung K (1999): Veränderungen des KHK-Risikoprofils durch moderaten Rotwein- im Vergleich zu Weißweinkonsum. Herz/Kreisl, 31, 25-31
Mazza G (Ed.)(1998): Functional Foods: Biochemical and Processing Aspects, 1st Edition Lancaster: Technomic Publishing Company
Mazza G, Oohmah B D (Ed.)(2000):Herbs, Botanicals & Tea, 1st Edition Lancaster: Technomic Publishing Company
Meilgaard M, Civille G, Carr T(1999): Sensory Evaluation Techniques. 3rd Edition Boca Raton: CRC Press
Renaud S, De Lorgeril M (1992): Wine, alcohol, platelets, and the French paradox for coronary heart disease. Lancet, 339, 1523-1525
Spiller G (Ed.)(2001): Dietary Fiber in Human Nutrition. 1st Edition Boca Raton: CRC Press
Stone H, Sidel J (1993): Sensory Evaluation Practises. 2nd Edition San Diego, Academic Press
Wildman R (Ed.) (2001): Handbook of Nutraceuticals and Functional Foods. 1st Edition Boca Raton: CRC Press

94
Wirkung unterschiedlicher Futterzusatzstoffe auf Gesundheit und Wachstum von Kaninchen Wesemeier, H.-H., Kurze, S. Institut für Agrar- und Stadtökologische Projekte an der Humboldt-Universität zu Berlin, Invalidenstraße 42, D-10115 Berlin Wiederholt treten in vielen größeren Kaninchenanlagen erhebliche Verluste durch
Krankheiten - vor allem Durchfälle - unterschiedlicher Ursache auf. Aus diesem
Grund wurde gemeinsam mit einem sächsischen Betrieb, der im Jahr etwa 30000
Kaninchen produziert, die Möglichkeit untersucht, die Tierverluste bei gleichzeitiger
Minimierung der Antibiotikaapplikation zu senken. Zum Einsatz kamen daher
unterschiedliche Futterzusatzstoffe sowie spezifische polyklonale Vollei – Antikör-
per. Nahezu alle Futterzusatzstoffe haben bekanntermaßen einen reduzierenden
Effekt auf unerwünschte Keime, wenn auch in unterschiedlichem Ausmaß. So
wirken z.B. Probiotika mehr indirekt durch Keimkonkurrenz und stärken die
natürliche Keimflora. Sie senken außerdem den pH-Wert und verbessern somit die
Nährstoffverdaulichkeit im Darm . Auch organische Säuren tragen zur Absenkung
des pH-Wertes und damit zu einem günstigen Milieu im Darm bei. Außerdem
werden unerwünschte Keime im Futter reduziert. Präbiotika hemmen vor allem
indirekt pathogene oder fakultativ-pathogene Krankheitserreger durch Stabilisierung
der zur natürlichen Darmflora gehörenden Bakterien. Dadurch kommt es ebenfalls
zu einer erhöhten Nährstoffresorption. Phytogene Futterzusatzstoffe sind wie auch
spezifische Antikörper in der Lage, Krankheitserreger unschädlich zu machen.
Unsere Untersuchungen verfolgten das Ziel, die Möglichkeiten und Wirkungen des
alleinigen oder kombinierten Einsatzes von Futterzusatzstoffen zu ermitteln.
Material und Methode Die Haltung der Tiere der Rasse ZIKA nach dem Absetzen erfolgt in Ställen mit
2-stufigen Käfigen (3 Tiere je Käfig). In den Versuchsstall waren bei Versuchs-
durchführung jeweils bis zu 4800 Mastkaninchen eingestallt worden.
Im Tierbestand fanden 4 Versuchsdurchgänge mit jeweils etwa 300 Tieren je Ver-
suchsgruppe statt. Die Zusatzstoffe wurden generell in die Pellets eingemischt. Die
Zugabe erfolgte vor der Pelletierung ,die bei maximal 80°C vorgenommen wurde.
Insgesamt wurden 1 Probiotikum (Pediococcus acidilactici), 2 Präbiotika (1 Frukto-

95
und 1 Mannanoligosaccarid)), 1 Säurepräparat (Natrium-Butyrat), 1 Kräuterextrakt
(Oregano), 1 Immunmodulator (β-Glukan) sowie Eipulver mit und ohne Antikörper
einzeln oder kombiniert getestet. Einige Stoffe, wie z.B. das antikörperhaltige
Eipulver wurden in allen Versuchen eingesetzt, andere, wie z.B. Kräuterextrakt, nur
in einem. Die entsprechende Fütterung der Tiere unter Zusatz der genannten Stoffe
erfolgte ab 1 Woche vor bis 6 Wochen nach dem Absetzen.
Für die Herstellung der Antikörper mussten zunächst die wichtigsten, die Gesundheit
der Tiere negativ beeinflussenden Erreger isoliert und typisiert werden. Mit den
Immunisierungsantigenen erfolgte die wiederholte Impfung von SPF-Hennen, die die
entsprechenden spezifischen Antikörper mit dem Hühnerei ausschieden. Die Eier
wurden unter sterilen Bedingungen aufgeschlagenen, vorpasteurisiert und im
Sprühturm pulverisiert. Das so gewonnene Eipulver mit bestandsspezifischen
Antikörpern konnte dann in das Futter eingemischt werden.
Die Jungkaninchen wurden zweimal täglich gefüttert, der Gesundheitszustand
dokumentiert, verendete Tiere fortlaufend entfernt und gewogen. Tierwägungen
erfolgten am Tag des Absetzens, nach 4 und nach 8 Wochen. Als Parameter zur
Beurteilung der Wirksamkeit dienten der Gesundheitszustand, Verluste, Futter-
verbrauch und Gewichtsentwicklung. Außerdem wurden Daten zur Futterqualität , zu
Futterinhaltsstoffen und zum Tränkwasser-pH-Wert, Sektionsbefunde verendeter
Tiere sowie Ergebnisse der Schadgas-, Temperatur- und Luftfeuchtigkeitsmessun-
gen erfasst. Die Versuche wurden im laufenden Produktionsbetrieb unter den
üblichen Bedingungen durchgeführt.
Ergebnisse und Diskussion
In allen Versuchen traten trotz der Futtersupplementierung Durchfälle auf, vor allem
bakteriell bedingt, in einem Versuchsdurchgang durch Kokzidien verursacht.
Virologische Untersuchungen wurden nicht durchgeführt, da die pathologischen
Bilder keinen Anlass dafür gaben. Dadurch ist jedoch keine endgültige Aussage über
eine eventuelle Virusbeteiligung möglich.
Die im Unternehmen im Rahmen des Rein-Raus-Prinzips durchgeführten
Reinigungs- und Desinfektionsmaßnahmen vor der Neubelegung der Ställe sind
unseren Untersuchungen zufolge als wirksam zu bezeichnen. Die in zwei Versuchen
zusätzlich vorgenommenen täglichen Reinigungs- und Desinfektionsmaßnahmen in
den Stallgängen und die täglich mehrmalige Reinigung des Kotbandes hatten

96
allerdings keinerlei Auswirkungen auf den Gesundheitszustand der Tiere im
Vergleich zu den anderen Versuchen.
Das Stallklima war zu jeder Zeit relativ gut, insbesondere die Werte für Schadgase
und hierbei wiederum Ammoniak und Kohlendioxid bewegten sich unseren
Untersuchungen zufolge unter den empfohlenen Höchstgrenzen (< 10 ppm für
Ammoniak und < 3.500 ppm für Kohlendioxid). Dagegen lagen Stalltemperaturen in
Zeiten hoher Außentemperaturen (Sommer) trotz verstärkter Lüftung deutlich über
den Empfehlungen. In den Wintermonaten ist der Kaninchenstall beheizt.
Die täglichen Messungen des Tränkwasser-pH erbrachten stets Werte um 8,0.
Der Anteil an Ballaststoffen im Rahmen der Pelletalleinfütterung war relativ niedrig.
In Tabelle 1 ist der Durchschnitt der Ergebnisse aller Versuche dargestellt; die nur in
einem Versuchsdurchgang eingesetzten Additiva erscheinen ebenfalls als
Durchschnitt. Zur Bildung des Koeffizienten und der Gesamtplatzierung wurden nur
die Verluste (Ls) und die Futterverwertung (Fu) herangezogen, da sich die Futter-
verwertung aus der Gewichtzunahme und dem Futterverbrauch errechnet.
Die Tabelle zeigt deutliche Unterschiede zwischen den Gruppen. Die geringsten
Verluste waren in den Gruppen „ Kräuterextrakt“, „IgY- Eipulver“ und „Säureprä-
parat“ zu verzeichnen. Die Anzahl der Krankheitsfälle war in diesen Gruppen eben-
falls günstig. In den Kontrollgruppen und in den Gruppen „Kräuterextrakt + Säure-
präparat" sowie „Volleipulver ohne Antikörper“ verendeten die meisten Kaninchen.
Die beste Futterverwertung hatten die Tiere, die die Kombination „Kräuterextrakt /
Säurepräparat“ erhielten, gefolgt von der Kräuterextrakt - Gruppe und der Kombina-
tion aus Frukto- und Mannanoligosaccariden. Am schlechtesten schnitten die Tiere
mit Zusatz des Immunmodulators, des Säurepräparates sowie die Kontrolltiere ab.
Die in der Summe besten Ergebnisse zeigten die Gruppen „Pflanzenextrakt“, „IgY-
Eipulver“ und „Frukto-/Mannanoligosaccaride“, während die Kontrolltiere sowie die
Gruppen „Eipulver ohne Antikörper“ und „Immunmodulator“ die negativsten
Resultate aufwiesen.
Die Ergebnisse zeigen somit, dass es einerseits unter den vorliegenden Praxisbe-
dingungen nicht möglich war, das Hauptproblem „Durchfall“ und damit den
Antibiotika-Einsatz zu vermeiden. Die Ursachen dafür sind unseres Erachtens vor
allem darin zu suchen, dass das artgerechte Fressverhalten der Kaninchen zu wenig
berücksichtigt wird (keine kontinuierliche Futteraufnahme gewährleistet,

m
eans
of a
ll ex
perim
ents
and
cor
resp
ondi
ng p
ositi
ons
feed
add
itive
s Ls
po
sitio
nFc
po
sitio
nW
g po
sitio
nFu
po
sitio
nto
tal
posi
tion
prob
iotic
18
,50
4 8,
01
5 2,
06
4 3,
91
7 5,
5 4
preb
iotic
fruc
tool
igos
acch
. (F)
20
,67
8 6,
89
9 1,
85
12
3,72
5
6,5
5 pr
ebio
tics
F +
man
nano
ligos
acch
. (M
) 20
,42
7 6,
69
11
1,93
9
3,62
3
5,0
3
prob
iotic
+ p
rebi
otic
F
18,7
0 5
7,30
8
1,93
10
3,
79
6 5,
5 4
acid
-sup
plem
ent
18,2
0 3
9,00
2
2,11
2
4,09
10
6,
5 5
herb
-ext
ract
15
,70
1 7,
48
7 2,
14
1 3,
49
2 1,
5 1
herb
-ext
ract
+ a
cid-
supp
lem
ent
24,0
0 10
6,
88
10
2,05
5
3,36
1
5,5
4 im
mun
resp
onse
mod
ulat
or
20,0
0 6
9,14
1
2,11
2
4,33
11
8,
5 6
IgY
-egg
pow
der
17,1
0 2
7,72
6
1,90
11
3,
68
4 3,
0 2
egg
pow
der
22,8
0 9
8,02
4
2,03
7
3,95
8
8,5
6 co
ntro
l gro
up
26,0
0 11
8,
06
3 2,
04
6 3,
99
9 10
,0
7 Ls
lo
sses
(%)
Fc
feed
con
sum
ptio
n/an
imal
(kg)
W
g w
eigh
t gai
n/an
imal
(kg)
Fu
fe
ed u
tiliz
atio
n
Ta
ble
1: V
alua
tion
adeq
uate
ave
rage
of g
roup
loss
es a
nd fe
ed u
tiliz
atio
n
97

98
Pelletalleinfutter mit hoher Verquellungseigenschaft, Koprophagie), nicht artge-rechte
Futterzusammensetzungen angeboten werden, (z. B. zu niedriger
Ballaststoffgehalt), der Tränkwasser-pH-Wert mit 8,0 für Kaninchen zu hoch ist sowie
im Sommer eine höhere Luftwechselrate im Stall vorliegt (Belastung der Tiere mit
Erregern gegenüber dem Winterhalbjahr ist geringer). Dass diese Faktoren von
erheblicher Bedeutung sind, ergibt sich vor allem aus den biologischen Gegebenhei-
ten der Tierart Kaninchen. In der Literatur ist mehrfach auf entsprechende
Zusammenhänge hingewiesen worden.
Ungeachtet dieser negativen Seite konnte andererseits eine positive Wirkung
bestimmter Futterzusätze auf die Gesundheit der Tiere nachgewiesen werden. In
Verbindung damit ist das schlechte Abschneiden der Kontrolltiere hervorzuheben.
Besonders günstig beeinflussten Zusätze, die Krankheitserreger direkt angreifen, die
Tierverluste. Dabei unterstreicht die Tatsache, dass die stallspezifischen IGY-
Antikörper am zweitbesten abschnitten, dass eine sinnvolle Therapie- und
Prophylaxemethode darin besteht, im Unternehmen aktuell bedeutsame Erreger zu
isolieren und den Tieren mit dem Futter Antikörper gegen diese Erreger zu
verabreichen. In Bezug auf die Ergebnisse ist allerdings einschränkend zu beachten,
dass nicht alle Zusatzstoffe mehrfach getestet wurden und dass das Basisfutter nicht
in allen Versuchsdurchgängen gleich war.
Schlussfolgerungen
1. Bestimmte Zusatzstoffe (einschließlich IgY – Eipulver) wirken zweifellos positiv
auf die Gesundheit und Leistung von Kaninchen und sind daher zu empfehlen.
2. Sie stellen eine gute Alternative zu Antibiotika dar, können jedoch, wie diese
auch, Mängel in der Basisfütterung, in der Haltung und in der Hygiene von Tieren
nicht oder nur kurzzeitig kompensieren und führen somit letztlich nicht bzw. nicht
dauerhaft zur Lösung des Problems hoher Erkrankungs- und Todesfälle.
3. Die beste Prophylaxe zur Erhaltung eines guten Gesundheits- und Leistungssta-
tus von Tieren sind die art- und altersgerechte Fütterung und Haltung,
eingebettet in ein konsequent geführtes Hygieneregime. Darauf aufbauend
können mit Futteradditiva weitere Verbesserungen erreicht werden, die einen
Antibiotikaein-satz weitgehend erübrigen.

99
Summary Effect of different additives on health and growth of rabbits Although the feed-supplementation, diarrhoea occured in all test- and control-groups. Thus, it was not possible to avoid this main problem and hence the application of antibiotics in given practice conditions. But there were clear differences. The groups which were given oregano-extract and IgY-egg powder had the lowest losses, the control-groups and the group with oregano/sodium-butyrate the highest. The group which got oregano/sodium-butyrate were the best in respect of feed utilization, followed by oregano-extract. Here the immunmodulator-group, the sodium-butyrate- and the control-groups had the worst results. Therefore specific additives have a positive effect and are advisable. Generally the application of feeding additives had to be include into good hygiene-management, optimised feeding and keeping.

100
Effect of a calcium phosphate supplement on cholesterol metabolism in humans Ditscheid, B., Keller, S., Jahreis, G.
Friedrich Schiller University, Institute of Nutritional Sciences, Dept. Nutritional Physiology, Dornburger Str. 24, D-07743 Jena
Introduction
Data from the literature show that there is a need for further clarification in the
context of dietary calcium intake and serum lipid and lipoprotein concentrations.
While epidemiological studies suggest a negative association between daily calcium
intake and total cholesterol and LDL cholesterol [JACQMAIN et al. 2003] intervention
studies only partly agree [DENKE et al. 1993; KARANJA et al. 1987].
Calcium phosphate might be a promising kind of calcium supplement: Calcium
phosphates are insoluble at a neutral pH value. During digestion they are solubilised
in the stomach and rebuilt in the small intestine as insoluble amorphous calcium
phosphates (ACP). The ability of insoluble calcium phosphate to bind and precipitate
bile acids has been repeatedly described in the literature [GOVERS et al. 1994; VAN
DER MEER et al. 1985; VAN DER MEER et al. 1990]. Thus, ACP might contribute to
a risk reduction of colon carcinogenesis. This bile acid binding might be further
associated with a coprecipitation of cholesterol and thus may affect cholesterol
metabolism.
Material and methods
To test this hypothesis in vivo we performed a placebo controlled cross over trial with
31 healthy volunteers (16 women, 15 men). The supplement, pentacalciumhydroxy-
triphosphate (Ca5(PO4)3OH), a scentless and tasteless white microfine powder was
given to a wholemeal bread baking mixture (3% of dry matter). The daily portion of
140 g of this bread provided an additional intake of 1060 mg calcium and 490 mg
phosphorus compared to the placebo bread.
In the first week participants were advised to keep their normal nutritional habits, and
they had to make a 7-day dietary protocol. At the same time urine was collected for
three and feces for five days. Blood samples were taken at the end of the week.
Afterwards, the participants were randomly divided into the two supplementation
regimes Calciumphosphate (CaP) → Placebo or Placebo → CaP. Each period (CaP,
Placebo) lasted four weeks. In the last week of each period participants consumed

101
an energy-adjusted defined diet to exclude effects of other food components. Urine,
feces and blood samples were collected similarly to the beginning of the study.
Serum lipids and lipoproteins were determined using an enzymatic testkit. Fecal
neutral sterols were analysed according to the method of KELLER (2003). Briefly,
freeze-dried feces were given into a test tube containing internal standard (5α-
cholestane). After mild alkaline hydrolysis with 1N ethanolic NaOH for 1h at 70°C and
addition of aqua dest, neutral sterols were extracted with cyclohexane. The solvent
was evaporated and the residuum was resolved in decane and injected into the
GC/MS.
Results and discussion
Apart from genetic dispositions serum cholesterol concentration rises as a result of
an increased intake in saturated fatty acids, cholesterol and/or high-energy diets. In
the present study the volunteers consumed a defined diet with an adequate energy
content in the week of sample taking. The food intake and the excretion of nutrients
were calculated. There was no difference in the participants’ fat intake between the
two supplementation periods (Tab. 1).
Table 1: Fat intake
Placebo Calciumphosphat
Total (g/d; n=31) 82.9 ± 23.0 82.9 ± 22.8
Women (g/d; n=16) 65.3 ± 9.8 65.9 ± 10.2
Men (g/d; n=15) 101.6 ± 17.5 101.1 ± 17.9
The range of food components provided to the subjects was qualitatively and
quantitatively the same in each period. This indicates that the intake of fatty acids
and cholesterol did not change during the study.
Serum total cholesterol concentration significantly decreased by 5% in the CaP
period compared with placebo (p<0.01, Tab. 2). This decrease is due to the decrease
in the LDL cholesterol concentration, although there was no significance. Serum
triacylglycerides also showed a tendency towards decreased values after CaP
supplementation. However, significance failed because of the high standard deviation
in the placebo period.

102
Table 2: Serum lipids and lipoproteins
Placebo Calciumphosphat
Total cholesterol (mmol/L) 4.60 ± 1.01 4.36 ± 0.89* Triacylglycerides (mmol/L) 1.09 ± 0.79 0.89 ± 0.33 LDL cholesterol (mmol/L) 2.51 ± 0.91 2.37 ± 0.80 HDL cholesterol (mmol/L) 1.60 ± 0.38 1.60 ± 0.40 LDL/HDL 1.68 ± 0.74 1.59 ± 0.68 * Significantly different compared to the placebo value (p<0.01)
Circa 250 – 500 mg dietary cholesterol and 600 – 1000 mg bilary cholesterol pass
through the human intestine every day. Because of its role in the fat absorption
cholesterol underlies enterohepatic circulation. The remaining cholesterol enters the
large intestine and might be metabolized through anaerobe gram-positive bacteria
(MIDTVEDT et al. 1990). The main transformation product of cholesterol is
coprostanol. There are two pathways in which coprostanol is generated: the direct
reduction and the indirect way via cholestenon and coprostanon. Cholesterol and its
intestinal metabolites were excreted with feces.
The analysis of the fecal samples showed no difference in total neutral sterol
excretion between the periods (Fig. 1). Thus, a reduced dietary cholesterol intake
can not be the reason for the decrease in serum cholesterol concentration.
0
5
10
15
20
25
Total neutralsterols
Cholesterol Coprostanol
Feca
l exc
retio
n [m
g/g
dry
wei
ght]
Placebo CaP
Figure 1: Fecal excretion (total excretion and main components)
* significantly different to the placebo period (p<0.05)
**

103
The constant excretion of total neutral sterols in feces also points to the fact that
there is no inclusion of cholesterol and bacterial cholesterol metabolites in ACP
complexes. However, significant changes in the profile of excreted cholesterol
metabolites were measured (Fig. 1 and 2).
0,0
0,5
1,0
1,5
2,0
2,5
3,0
Copro-stanone
Cholestanol Chole-stanone
Chole-stenone
Feca
l exc
retio
n [m
g/g
dry
wei
ght]
Placebo CaP
Figure 2: Fecal excretion (minor components)
* significantly different to the placebo period (p<0.05)
These results indicate that the decrease in serum cholesterol is not due to a binding
of cholesterol to ACP in the intestine. A possible mechanism might be an increased
excretion of bile acids as a consequence of the binding of these acid sterols to ACP.
This binding leads to a bile acid deprivation in the liver. Thus, bile acids have to be
regenerated from cholesterol and serum LDL cholesterol levels and serum total
cholesterol concentration decrease. In a study investigating the effect of calcium on
serum lipids in obese Zucker rats, VASKONEN et al. [2002] proposed a similar
mechanism, a calcium-induced increase in the fecal excretion of bile acids.
The changing profile of bacterial cholesterol metabolites in feces might be explained
by an effect of the supplement on bacterial colonisation. BOVEE-OUDENHOVEN et
al. [1999] showed an increased number of ileal and fecal lactobacilli in calcium
phosphate supplemented rats. However, the evidence for such an effect in humans
has not been supplied yet.
**

104
The present study shows a beneficial effect of pentacalciumhydroxy-triphosphate
supplementation on serum lipids in healthy volunteers. As a compound in functional
food it might contribute to a risk reduction for coronary diseases.
Summary
We conducted a placebo controlled, double blind, cross over study with penta-calciumhydroxy-triphosphate (Ca5(PO4)3OH) supplementation in 31 healthy volunteers (16 women, 15 men). After four weeks of supplementation serum cholesterol levels were significantly decreased compared to the placebo period (4.36 vs. 4.60 mmol/L; p<0.01) and serum LDL-cholesterol concentration also showed a tendency towards decreased values (2.37 vs. 2.51 mmol/L; p=0.083). The participants’ fat intake was equal in both periods. While the analysis of fecal samples showed no difference in the excretion of total neutral sterols (13.3 vs. 12.7 mg/g dry weight; p>0.05) cholesterol excretion significantly increased (4.6 vs. 2.9 mg/g dry weight; p<0.01) whereas coprostanol excretion significantly decreased (8.0 vs. 7.0 mg/g dry weight; p<0.05) in the calcium phosphate period compared to placebo. References
Bovee-Oudenhoven IM, Wissink ML, Wouters JT, Van der Meer R (1999): Dietary calcium phosphate stimulates intestinal lactobacilli and decreases the severity of salmonella infection in rats. J Nutr, 129, 607-612
Denke MA, Fox MM, Schulte MC (1993): Short-term dietary calcium fortification increases fecal saturated fat content and reduces serum lipids in men. J Nutr, 123, 1047-1053
Govers MJAP, Termont DSML, Van Aken GA, Van der Meer R (1994): Charac-terization of the adsorption of conjugated and unconjugated bile acids to insoluble, amorphous calcium phosphate. J Lipid Res, 35, 741-748
Jacqmain M, Doucet E, Després J-P, Bouchard C, Tremblay A (2003): Calcium intake, body composition, and lipoprotein-lipid concentrations in adults. Am J Clin Nutr, 77, 1448-1452
Karanja N, Morris CD, Illingworth DR, McCarron DA (1987): Plasma lipids and hypertension: response to calcium supplementation. Am J Clin Nutr, 45, 60-65
Keller S (2003): Methodenentwicklung zur gaschromatographisch-massenspektro-metrischen Analyse freier faecaler Sterole und Gallensäuren im Single Ion Monitoring; Einfluß von Nahrungssupplementen auf die Exkretion. Dissertation, Friedrich-Schiller-Universität Jena
Midtvedt T, Lingaas E, Carlstedt-Duke B, Höverstad T, Midtvedt AC, Saxerholt H, Steinbakk M, Norin KE (1990): Intestinal microbial conversion of cholesterol in men. Influence of antibiotics. APMIS, 98, 839-844
Van der Meer R, DeVries HT (1985): Differential binding of glycine- and taurine-conjugated bile acids to insoluble calcium phosphate. Biochem J, 229, 265-268
Van der Meer R, Welberg JWM, Kuipers F, Kleibeuker JH, Mulder NH, Termont DSML, Vonk RJ, DeVries HT, DeVries EGE (1990): Effect of supplemental dietary calcium on the intestinal association of calcium, phosphate and bile acids. Gastroenterol, 99, 1653-1659
Vaskonen T, Mervaala E, Sumuvuori V, Seppänen-Laasko T, Karppanen H (2002): Effects of calcium and plant sterols on serum lipids in obese Zucker rats on a low-fat diet. Br J Nutr, 87, 239-245

105
The vitamin B2, B6 and folic acid supplementation influence on polyunsaturated fatty acids (PUFA) concentration in serum and liver of rats fed the diet restricted in protein
Bertrandt, J.1, Klos, A.1, Debski, B.2 1Military Institute of Hygiene and Epidemiology, 4 Kozielska St., 01-163 Warsaw, Poland; 2Department of Physiological. Sciences, Veterinary Medical Faculty of Agriculture University, Nouoursynowska 159, 02-787 Warsaw, Poland
There are many well-documented studies performed on animals and epidemiological
researches regarding food protein shortage (Gerson, 1974, Hitzeman, 1981,
Yamanaka et al., 1981, Żiboch et al., 2000) influence on lipid metabolism in range of
PUFA. These results show significant lipids metabolic disturbances causing
considerable changes both in content and structure of PUFA in blood serum and
many other tissues and organs.
Vitamin B2 participates in lipid metabolism as coenzyme, which is a part of flavin
adenine dinucleotide (FAD). The presence of this vitamin is necessary in β-oxidation
processes, so for chain’s cutting down and fatty acids dehydrogenation (Olpin et al.,
1982, Sakurai et al., 1982, Veith et al., 1985). Limitation of vitamin B2 intake with the
diet restrains acyloCoA desaturase activity that is one of the enzymes taking part in
fatty acids β-oxidation. Improper fatty acids metabolites occurrence found in the urine
of examined animals testifies disturbances in fatty acids β-oxidation in organism of
rats fed the low-vitamin B2 diets (Gregersen et al., 1982).
Results of many experiments show existence of dependence between vitamin B6
content and polyunsaturated fatty acids metabolism (Goswami et al., 1986,
Kirschman et al., 1961, She et al., 1994, Swell et al., 1961). The results of Witten and
Holman (1952) studies presented, for the first time, possibilities of pyridoxine
influence on essential fatty acids metabolism. Authors assumed that vitamin B6 might
have specific influence on linoleic acid transformation into arachidonic acid, because
its lack in diet caused decrease of arachidonic acid content in rats’ tissues. This
suggestion was proved by results of Goswami (1986) who indicated significant
decrease of linoleic acid content together with polyunsaturated fatty acids content
increase in rats’ testicles. Rats were fed the diet deprived of vitamin B6 at the
beginning and then the diets of different pyridoxine content. Animal’s alimentation
with the diet containing vitamin B6 through 6 days caused significant increase of
arachidonic and docosapentaenoic acids content in phospholipids and
docosapentaenoic acid in triacyloglicerides of the testicles. The results of the study of

106
She (1994) revealed that vitamin B6 deficiency strongly decreased activity of ∆6-
desaturase, an enzyme participating in synthesis of upper polyunsaturated
derivatives of the linoleic acid, as well as many other enzymatic systems. Presented
by authors’ pathway of linoleic acid transformation into arachidonic acid in liver’s
microsomes lipids and phposphatidylcholine fraction were closely related to ∆6-
desaturase activity decrease.
There are experiments showing relation between folic acid content in the diet and its
influence on PUFA metabolism (Durand et al., 1996). Results of the fatty acids
composition in the blood serum and thrombocytes revealed that decrease of folic
acid content in the rats’ diet caused considerable changes of n-3 and n-6 fatty acids
composition. These changes were based on decrease of acids content in blood
serum and thrombocytes, particularly n-3 acids without arachidonic acid content
which concentration in thrombocytes was found to increase. Materials and methods
The growing male Wistar rats initially weighting 150.2±6.4 g were kept in individual
stainless steel cages in room temperature with controlled, humidity and lighting (12h
day cycle). Two experiments were performed to estimate the effect of protein-
restricted diets with concomitant supplementation with folic acid and vitamins B2 and
B6 on the level of selected PUFA in serum and liver of rats.
In these experiments rats were fed ad libitum semisynthetic isocaloric diets of 1466.5
kJ/100g (350kcal/100g) throughout 90 days. In standard diet 20% energy was
provided from protein, 15% from fats, including 2% from essential fatty acids (control
diet). Two diets deficient in protein were also used – in the first 9% and in the second
4.5% of energy were provided from protein utilization. Animals receiving protein
deficient diets were supplemented with folic acid, vitamin B2 and B6 to the level 4-
times higher than in the control diet. Twenty rats were used per treatment. Sunflower
oil was the source of essential fatty acids.
Blood samples were collected in 30, 60 and 90 day. 12 h prior to the end of
experiment food was withheld. At the end of experiment the rats were sacrificed by
cervical displacement while unconscious (general anesthesia using ethylene ether) to
obtain livers.
Contents of linoleic -LA (C18:2, n-6), α-linolenic –ALA (C18:3, n-3), arachidonic -AA
(C20:4, n-6), eicosapentaenoic -EPA (C20:5, n-3) and docosahexaenoic -DHA (22:6,

107
n-3) acids in blood serum were estimated at the 30-, 60- and 90 day of experiment. In
the liver the same analysis were made in 90 day of experimental period.
Serum and hepatic lipids were extracted by Folch (1957) method using mixture of
chloroform and methanol in the v/v ratio 2:1. Extracted lipids were saponificated and
estrificated by the method according to Polish Standard PN-ISO 5509 (1996).
The separation of methyl esters of fatty acids was performed using Hewlett Packard
HP 6890 gas chromatograph with HP 100m capillary column (0.20mm inner
diameter). Total analysis time was 65 min. Results were registrated by Chemstation
HP integrator.
For statistical data ANOVA and median test were used (Sawicki, 1982).
Differences of means at P ≤ 0.05 (n=20) were considered statistically significant.
Results Enrichment the diet, of protein content limited to 9%, with folic acid and vitamins B2
and B6, in amount of 300% their basic content caused significant increase of PUFA
sum value in the 30th day of experiment. It resulted from considerable increase of
linoleic and docosahexsaenoic acids content. In the 60th day of experiment values of
examined indices did not show crucial differences compared to the control group.
The 90 days lasting use of such enriched diet caused increase of PUFA sum value
resulting from considerable increase of arachidonic acid content. Decrease of 18:3 n-
3 acid content was found as well (tab. I).
Enrichment with folic acid and vitamins B2 and B6 the diet of greater protein
deprivation i.e. to 4,5% energy caused not statistically important changes of PUFA
value in the 30th day of experiment. It resulted from decrease of AA and DHA acids
content but these changes were not statistically significant. Decrease of PUFA sum
value was found in the 60th day of experiment. Considerable decrease of LA and
DHA acids content was found as well. Alimentation with such enriched diet through
90 days caused crucial increase of PUFA sum value as a result of significant
increase of AA level while LA and ALA acids content decreased (tab II). Use the diet of protein content limited to 9% and 4,5% energy, enriched with folic
acid and vitamins B2 and B6, through 90 days, did not cause any changes of the
content of examined PUFA in the rats’ livers compared to the control group (tab. III).

108
Discussion Use of controlled rats alimentation with the diets of constant energy content from fat
and PUFA through 3 months allowed keeping on the same level the influence of food
elements on fatty acids composition in animals’ organs and tissues. Hence, changes
of fatty acids, including PUFA, content and composition might depend exclusively on
influence of diets enrichment with vitamins B. Fact that diets used during experiment
were isocaloric and met the requirements for PUFA is worth to notice.
Table I. PUFA content in the blood serum of rats fed the diet of protein content of 9% energy, enriched with folic acid, vit. B2 and vit. B6 through 90 days
30th day 60th day 90th day
Fatty acid
9% energy. from
protein
9% en. from protein +
folic acid + vit B2 + vit
B6
9% energy. from
protein
9% en. from protein + folic acid + vit B2 +
vit B6
9% energy. from
protein
9% en. from protein + folic acid + vit B2 +
vit B6
18:2 9,43 ± 1,99 11,49 ± 1,41 *
9,26 ± 0,75 9,06 ± 1,29 10,76 ± 1,37 11,32 ± 1,84
18:3 n-3 0,02 ± 0,05 0,03 ± 0,05 0,08 ± 0,06 0,10 ± 0,07 0,15 ± 0,02 0,05 ± 0,07 * 20:4 11,58 ± 3,24 14,22 ± 1,77 7,10 ± 3,21 7,21 ± 1,31 7,97 ± 1,43 13,22 ± 1,46 *20:5 0,03 ± 0,08 0,12 ± 0,16 0,15 ± 0,13 0,05 ± 0,06 0,06 ± 0,06 0,14 ± 0,10 22:6 0,89 ± 0,27 1,33 ± 0,21
* 0,59 ± 0,16 0,67 ± 0,14 0,62 ± 0,19 0,85 ± 0,35
Σ WNKT 22,15 ± 3,81 27,19 ± 2,28 *
17,18 ± 3,31 17,09± 1,85 19,56 ± 2,00 25,58 ± 2,38 *
*- statistically important difference between the diet of 9% energy from protein and enriched diets, p ≤ 0,05 Table II. Content of PUFA in the blood serum of rats fed the diet of protein content of 4,5% energy enriched with folic acid, vit. B2 and vit. B6, through 90 days
30th day 60th day 90th day
Fatty acid
4,5% energy. from
protein
4,5% en. from protein + folic acid + vit B2 + vit
B6
4,5% energy from
protein
4,5% en. from protein + folic acid + vit B2 + vit
B6
4,5% energy from
protein
4,5% en. from protein + folic acid + vit B2 +
vit B6
18:2 11,58 ± 1,28 11,95 ± 0,75 11,15 ± 0,96 9,54 ± 0,64 *
9,46 ± 1,06 7,62 ± 0,67 *
18:3 n-3 0,06 ± 0,04 0,10 ± 0,03 0,10 ± 0,05 0,09 ± 0,05 0,08 ± 0,06 0,01 ± 0,01 * 20:4 16,59 ± 2,13 14,68 ± 2,05
* 11,65 ± 3,31 8,39 ± 2,91 9,33 ± 1,93 16,30 ± 3,43 *
20:5 0,49 ± 0,55 0,07 ± 0,05 0,17 ± 0,20 0,08 ± 0,02 0,04 ± 0,04 0,07 ± 0,08 22:6 1,63 ± 0,37 1,14 ± 0,13
* 0,74 ± 0,19 0,48 ± 0,22
* 0,51 ± 0,07 0,69 ± 0,37
Σ PUFA 30,35 ± 2,58 27,97 ± 2,20 23,81 ± 3,40 18,58 ± 3,01 *
19,42± 2,24 24,70 ± 3,52 *
*- statistically important difference between diet of 4,5% energy from protein and enriched diets, p ≤ 0,05

109
Taking into consideration active influence of folic acid and vit. B2 and vit. B6 on
systemic lipid metabolism, in scope of PUFA, and different possible mechanisms of
this activity, both synergistic and antagonistic, it should be stated that low protein-
energy diet’s enrichment with all three vitamins considerably affected PUFA content
in rats’ blood and liver. Enrichment of low-protein diets with vitamins B caused significant increase of LA and
DHA acids content in blood serum in the 30th day of experiment when the diet of
protein limited to 9% energy was used. It seems that increased vitamins intake
considerably influenced on increase of LA acid absorption or its release form the
tissues’ reserves as well as stimulated PUFA metabolism what was confirmed by
PUFA sum value increase. It can be assumed that following 30 days of animals’
alimentation with such diet did not affect PUFA changes because significant
differences in their content were not found. Lasting 90 days animals’ nutrition with
such enriched diet again stimulated PUFA metabolism because significant increase
of AA acid content was found while LA level did not change and LA and ALA level
was decreased. Tab III. Content of fatty acids in the liver of rats fed 90 days the diets which proteins supplied 9% or 4.5% of energy, with or without vitamins B2, B6 and folic acid supplementation (% of total fatty acids)
Fatty Acid
9% energy from
protein
9% energy from protein + vit. B2, B6
and folic acid
4.5% energy from
protein
9% energy from protein + vit. B2, B6 and folic acid
18:2
9.03 ± 1.02
8.38 ± 1.40
7.16 ± 1.27
6.82 ± 0.94
18:3 ω
0.10 ± 0,05
0.16 ± 0.04
0.04 ± 004
0.02 ± 0.02
20:4
17.13 ± 2.60
8.36 ± 2.88
1.58 ± 3.69
14.15 ± 3.98
20:5
0.08 ± 0.01
0.03 ± 0.04
0.04 ± 0.04
0.01 ± 0.1
22:6
3.18 ± 0.52
3.53 ± 0.7
2.18 ± 0.46
2.96 ± 0.85
* - differences between similar diets with and without vitamins supplementation, p ≤ 0.05 It is supposed that increased intake of used vitamins significantly restrained PUFA
metabolism, while protein in the diet was limited to 4,5% during use of such diet for
60 days. This suggestion is confirmed by significant decrease of AA and DHA acids
110
content found in the 30th day, while LA content did not change, compared to the
control group, and showed statistically significant decrease of LA, DHA content and
PUFA sum value in the 60th day. Values of other acids were decreased as well,
however these differences were not statistically important. Enrichment of diets with
vitamins B in case of greater protein deficiency caused total change of metabolism. It
was directed to increase of upper derivatives of LA and ALA acids biosynthesis within
30 days of its use. It is proved by significant decrease of m/a fatty acids content in
blood serum while AA acid and PUFA sum value considerably increases. Indeed
contents of other examined fatty acids were increased as well but differences were
not statistically significant. Significant influence of low- protein diets enriched with folic acid and vitamins B2 and
B6 on examined PUFA content in the livers was not found.
Conclusions
1. Enrichment of low protein diets with folic acid, vitamin B2 and vitamin B6, in
amount of 300% their basic content significantly influences on lipid, especially
PUFA, metabolism in rats’ organism.
2. Supplementation of low-protein diet limited to 9% energy with all m/a vitamins
stimulates PUFA metabolism in the first and the last month, not significantly
influencing on PUFA content in blood serum in 60th day of experiment.
Increased intake of vitamins with the diet of deeper protein deficiency restrains
polyunsaturated fatty acids changes in the first two months.
3. Use, in 90 days lasting alimentation period, the low-protein diets supplemented
with folic acid, vitamin B2 and B6, does not influence on PUFA content in
animals livers.
Summary The aim of this experiment was to study the effect of vit. B2, B6 and folic acid feed
supplementation on serum and liver PUFAs content of rats fed protein deficient diets.
Enrichment of low protein diets with m/a vitamins significantly influences on PUFAs
content in serum but does not change of PUFA content in rats’ liver.

111
References Durand P, Prost M, Blache D (1996): Atherosclerosis, 121, 231-243 Folsch J, Lees M, Stanley GHS (1957): J. Biol. Chem., 266, 497-509 Gerson T (1974): J. Nutr., 104, 701-709 Goswami A, Coniglio JG (1986): J. Nutr., 89, 210-216 Gregersen N, Koluraa S (1982): J. Inter. Metab. Dis., Suppl. 1, 17-18 Hitzeman R (1981): Neurochem. Res., 6, 935-947 Kirschman JC, Coniglio JG (1961): J. Biol. Chem., 236, 2200-2204 Olpin SE, Bates CJ (1982): Br. J. Nutr., 47, 577-596 Polish Standard PN-ISO 5509 (1996) Sakurai T, Miyzakawa S, Furuta S (1982): Lipids, 17, 598-604 Sawicki F (1982): Elementy statystyki dla lekarzy., PZWL, Warszawa She Q, Hayakawa T, Tsuge H (1994): Biosci. Biotech. Biochem., 58, 459-463 Swell L, Law MD, Schools PE (1961): J. Nutr., 74, 148-156 Veith RK, Meredith EJ, Turnbull DM (1985): Biochem. Soc. Trans., 13, 895-896 Witten PW, Holman RT (1952): Arch. Biochem. Biophys., 41, 266-273 Yamanaka WK, Clemans GW, Hutchinson ML (1981): Prog. Lipid Res., 19, 187-215 Żiboch VA, Miller GC, Cho Y (2000): Am. J. Clin. Nutr., Suppl. 71, 361S-366S

112
Influence of the vitamin C concentration in the serum on the development pathological changes in the stomach in patients with hepatocirrhosis
Kopański, Z.1,2, Schlegel-Zawadzka, M.3, Piekoszewski, W.4, Czupryna, A.5, Kilian,
T.6 1Clinical Military Hospital, 1-3 Wroclawska Str., 30-006 Kraków; 2Academy of Physi-cal Education, Al. Jana Pawła II 78, 31-571 Kraków; 3Department of Human Nutrition, Institute of Public Health, Collegium Medicum, Jagiellonian University, 20 Grzegór-zecka Str., 31-531 Kraków; 4Department of Clinical and Industrial Toxicology, Col-legium Medicum Jagiellonian University, Os. Zlotej Jesieni 1; 30-826 Kraków; 5Institute of Forensic Research, 9 Westerplatte Str., 31-033 Kraków; 6Institute of Nursing, Collegium Medicum Jagiellonian University, 25 Kopernika Str., 31-501 Kraków; 6Central Clinical Hospital, Military University School of Medicine, 128 Szaserów Str., 00-903 Warszawa; Poland
Introduction Among the superior animals only the primates and the guinea pig require the supply
of vitamin C in the diet. They do not possess the ability to transform the lactone of the
L-gulonic acid into ascorbic acid (lack of L-gulonolactonic oxidase). Other animals
can synthesize this vitamin from the carbohydrates (Seib and Tolbert, 1982; Ziemlan-
ski and Wartanowicz, 1995). In humans this vitamin comes in the food rations mainly
from vegetables and fruit. Its demand estimated in the food depends on the season,
transport conditions, time and storage conditions, as well as on the preparation of
meals (Hill, 1995).
The vitamin C is well absorbed from the alimentary canal and is quickly caught by the
liver. In the literature are rarely undertaken trials to establish the influence of the vi-
tamin C metabolism when considering the pathological changes present in the stom-
ach. The existing gap on the subject inclined the authors to analyze their own mate-
rial.
The aim of the study was to try to establish the influence of the hepatocirrhosis on the
disturbances of the vitamin C metabolism considering the pathological changes pre-
sent in the stomach.
Material and methods 33 patients (20 men and 13 women) aged 46 to 72 years with hepatocirrhosis were
subjected to the analysis of the vitamin C concentration alterations in the serum, con-
sidering selected morphological changes in the stomach (cardial varices, chronic
113
gastritis peptic ulcer, normal mucosa). Among them 13 were of alcohol and 20 of vi-
rus etiology of disease. The clinical diagnosis was based on: patients’ interview,
physical examination, USG, CT, ERCP, histopathology. The liver state was examined
(except methods mentioned above) using biochemical methods (level of bilirubine,
SGPT, SGOT, cholinesterase, alkaline phosphates, gamma-glutamyltranspherase
and level of immunoglobines A, G and M). In all patients the same control studies
(e.g. gastroscopy, serological diagnostic). The gastroscopy examination allowed for
macroscopic evaluation of oesophagus, stomach, duodenum and collecting the sam-
ples of mucous membrane. Histological examination according Misiewicz (1991) was
applied to the diagnosis of chronic gastritis.
The measurement of vitamin C in the serum was carried out according to the analytic
procedure presented in detail by Levine (1986) and Seib (1982). A range of normal
values of the vit. C concentration in the serum amounting to 0.91+0.18 mg/dl was
established on the basis of the results obtained from the examination of 36 voluntary
blood donors (21 men and 15 women) aged 29 to 59 years (reference group).
The statistical analysis of the results was conducted using the SAS program rel. 6.03.
The hypothesis of the distribution normality was verified with the W test given by
Shapiro-Wilk. To study the differences between the averages for non-normal distribu-
tions the Wilcoxon’s test was used The critical level p<0.05 was adopted as statisti-
cally significant.
Results The average vitamin concentration in patients with hepatic cirrhosis amounted to
0.82+0.21 mg/dl and was comparable with the reference value (p>0.05).
In considering the etiology of the pathological changes of the liver, it was confirmed
that in the groups of patients with post-alcoholic cirrhosis the average vitamin con-
centration amounted to 0.69+0.23 mg/dl, whereas in patients with cirrhosis of viral
origin it amounted to 0.95+0.18 mg/dl (p<0.01).
The frequency and type of pathological changes of the gastric mucosa associated
with the hepatic cirrhosis are presented in table 1.

114
Table 1. Occurrence frequency of specific pathological changes in the stomach of
patients with cirrhosis considering the vit. C concentration in the serum.
Groups of patients with hepatic cirrhosis
Number of persons in the group* N [%]
Vitamin C concentration in the serum Average mean+Standard deviation [mg/dl]
Patients with cardial varices 10 (33.3 1.0+0.222
Patients with chronic gas-tritis 12 (36.4) 0.51+0.171
Patients with peptic ulcer 8 (24.2) 0.58+0.111 Patients with unchanged gastric mucosa 7 (21.2) 1.11+0.262
* - some patients belong to more than one group 1 to 2 – statistically significant references The results obtained testify that the most frequent pathological change of the gastric
mucosa occurring in patients with hepatic cirrhosis is chronic gastritis (36.4%), then
come cardial varices (33.3%) and peptic ulcer (24.8%). These pathological changes
are associated with a differentiated average vit. C concentration in the serum. The
lowest ascorbates concentrations occurred in patients with chronic gastritis and pep-
tic ulcer. A statistically significant higher vit. C concentration was confirmed in pa-
tients with oesophagal varices and in persons with a normal gastric mucosa.
Discussion The vit. C influence on the development of diseases in the upper part of the alimen-
tary canal was studied already long ago. It was shown that in the populations con-
suming small quantities of vegetables and fruit containing vit. C occurred an in-
creased incidence of diseases in the mouth, the laryngx, the oesophagus and in the
stomach (Block, 1991; Henson et al., 1991; Moser and Min, 1996).
Our own studies also underline a statistically significantly lower average vit. C con-
centration in the serum of patients with chronic gastritis and peptic ulcer in compari-
son with the reference values. This tendency is not even disturbed by hepatic cirrho-
sis, i.e. the disease of the organ in which vit. C is metabolized. However, the effects
of the defective disintegration of the ascorbate favouring high vit. C concentrations in
the serum are already observed in other gastric disease associated with the cirrhosis,
such as in oesophagal varices. Also with an unaltered gastric mucosa the developing
hepatic cirrhosis leads to a statistically significant increase of the vit. C concentration

115
in comparison with the reference values. This corresponds to the other authors ob-
servations (Block, 1991; Frei et al., 1989).
Many authors draw the attention to the existence of links between the vit. C concen-
tration and the rise of the pathology of the gastric mucosa (Block, 1991; Henson et
al., 1991; Hill, 1995; Moser and Min, 1996). Not all of them, as e.g. Jarosz et al.
(1996, 1997) confirm such convincing differences between the groups of patients ex-
amined and the reference group. Among the patients with chronic gastritis the men-
tioned authors registered the vit. C concentration in the serum lower than in the ref-
erence group, but without statistically significant characteristics. However, there exist
many authors noting observations similar to ours (Frei et al., 1989; Hill, 1995; Moser
and Min, 1996). There are also confirmed by the results of the cross-sectional popu-
lation studies conducted by the European Cancer Prevention Organisation Intestinal
Metaplasia Study (EOP-EURONT IM Study Group, 1996) underlining that in patients
with atrophic gastritis and intestinal metaplasia the vit. C concentration in the serum
is lower than in the control group.
Our own results underline the differentiated tendency of the changes of the vit. C
concentration in the serum associated with hepatocirrhosis. Attention should be
drawn to the sharp ascorbates deficiency in cirrhosis of the alcoholic origin, also in
chronic gastritis and peptic ulcer. It cannot be excluded that particularly in these
cases the care to compensate the vit. C deficiencies may favour an acceleration of
the cure of the pathological changes of gastritis mucosa.
Conclusions 1. The alcoholic etiology of the cirrhosis statistically significantly decreases the
average vitamin C concentration in comparison with patients with cirrhosis with
viral origin as well as with the reference values,
2. In patients with cirrhosis the development of chronic gastritis and of a stomach
ulcer favours the generation in the serum statistically significantly deep defi-
ciencies of ascorbates in comparison with patients with oesophagus varices as
well as with persons without pathological changes in the stomach also in com-
parison with the reference values.

116
Summary 33 patients (20 men and 13 women) aged 46 to 76 years with hepatic cirrhosis were
analysed for the vitamin C concentration in the serum considering selected morpho-
logical changes of the stomach (cardial varices, chronic gastritis, peptic ulcer, normal
mucosa). It was shown that the alcohol etiology of cirrhosis statistically significantly
decreased the average vit C concentration in comparison with patients with cirrhosis
of viral origin and with the reference values. Moreover it was confirmed that in pa-
tients with cirrhosis development of chronic gastritis and of stomach ulcer favoured
the generation of statistically significantly deep ascorbates deficiency in the serum in
comparison with patients with esophagal varices as well as with persons without gas-
tric pathological changes, and in comparison with the reference values.
Literature Block G (1991): Am J Clin Nutr, 53, 270-82 S EOP-EURONT IM. Study Group: Plasma ascorbic acid concentrations in patients
with intestinal metaplasia and in controls. (1996) Eur J Cancer Prev, 5, 249-57 Frei B, England L, Ames B (1989) Proc Natl Sci, 86, 6377-81 Henson DS, Block G, Levine M (1991) J Natl Cancer Inst, 83, 547-50 Hill MJ (1995) J Cancer Prev, 4 (suppl.2), 3-12 Jarosz M, Dąbrowska-Ufniarz E, Dzieniszewski J (1996) Gastroenterol Pol, 3-5, 73-
77 Jarosz M, Dzieniszewski J, Dąbrowska-Ufniarz E, Wartanowicz M, Ziemlanski S
(1997) Gastroenterol Pol 4-6, 583-87 Levine M (1986) N Engl J Med, 314, 892-902 Misiewicz JJ (1991) J Gastroenterol Hepatol, 6, 207-208 Moser U, Min C (1996) Eur J Cancer Prev, 5 (suppl.2), 95-100 Seib PA, Tolbert BM (1982) Ascorbic Acid: Chemistry, Metabolism, and Uses. Wash-
ington DC. American Chemical Society, 1982 Ziemlanski S, Wartanowicz M (1995) Nowa Medycyna, 11,7-12

117
Investigations on vitamin K1 (phylloquinone) and osteocalcin serum levels in healthy subjects Stein, A., Lehmann, G., Müller, A., Stein, G., Bitsch, R., Hein, G. Friedrich-Schiller-University, Department of Internal Medicine III, Division Rheuma-tology/Osteology/Nephrology, Research Centre of Lobeda, Room 10058, Erlanger Allee 101, 07740 Jena, Germany 1. Introduction Vitamin K occurs naturally in two forms: phylloquinone, which is found in high con-
centrations in leafy green vegetables and certain oils, and the menaquinones, which
are a group of compounds produced in bacteria (Sokoll, 1996; Suttie, 1992). Phyllo-
quinone is the predominant dietary form of the vitamin and is assumed to play a ma-
jor role in supplying vitamin K nutritional requirements. Vitamin K serves as a cofac-
tor for the mammalian microsomal enzyme γ-glutamylcarboxylase (Gijsbers, 1996).
This enzyme catalyses the posttranslational conversion of glutamyl into γ-
carboxylglutamate (Gla) residues at well-defined sites in a limited number of proteins
(Suttie, 1985; Vermeer, 1990). Gla-containing proteins have a regulatory function in
blood coagulation (Furie, 1992), bone metabolism (Hauschka, 1989), and possibly
also in cell growth (Manfioletti, 1993).
Once the classic measure of vitamin K nutritional status were coagulation assays
(Suttie, 1992). More sensitive static and functional markers of vitamin K nutritional
status have been developed and subsequently validated, including plasma/serum
phylloquinone concentrations, serum osteocalcin (OC) [total and the percentage under-
carboxylated (%ucOC)], and urinary γ-carboxyglutamic acid (Booth, 1999; Sokoll, 1996).
However, the relationship between undercarboxylated osteocalcin and other known
indicators of vitamin K status have rarely been explored in a healthy population. A
few examples may be found in studies from the US:
- In 263 healthy subjects Sokoll et al. (1996) found constant vitamin K levels in
men and women to be similar unitl women reached menopause. OC and ucOC in
both sexes decreased from 30 to 50 years, after age 50 levels did not change in men
but increased in women, most likely caused by menopause.
- Booth et al. (1999) investigated 36 healthy subjects and detected significantly
higher levels of serum phylloquinone in elderly subjects than in younger ones.

118
- Binkley et al. (2000) supported these findings and also found higher phyllo-
quinone serum levels in older than in younger subjects. OC and ucOC% were signifi-
cantly higher in younger men than in younger women or older subjects.
2. Aim As of yet no investigations in a German healthy population have been carried out.
Therefore, we evaluated methods for assessing vitamin K nutritional status in a
healthy adult population and explored the reliability of using not only carboxylated or
total osteocalcin but also undercarboxylated osteocalcin as a measure of vitamin K
status. Because vitamin K is a fat soluble vitamin, we included measurements of
blood lipid parameters, such as triglycerides and cholesterol, to investigate interde-
pendencies between serum phylloquinone levels. In addition, the influence of demo-
graphic and biological factors, such as aging, menopause, and sex, on these meas-
ures was established.
3. Subjects The 180 healthy subjects (74 males, 106 females) who participated in this study
ranged in age from 16 to 95 y (average age 48.6 ± 19.3 years) and came primarily
from the Jena area (Thuringia, Germany). This study and the research protocol was
approved by the ethics commission of the University of Jena and written informed
consent was obtained from each subject. None of the subjects had any diseases or
took any medications, including oral anticoagulants, known to affect vitamin K me-
tabolism. In addition, none of these subjects had a history of metabolic bone disease.
Fasting serum samples were collected over a 2-y period and therefore all months of
the year were represented.
The subjects were grouped by age decades and because of the variability of age,
seven subjects under 20 years were included in the 20 – 29 y decade whereas 13
subjects over 80 y, were grouped into the 70 – 79 y category. Further age classifica-
tions were made into younger (n = 84, 44M, 40F, average age: 31.6 ± 9.24 years)
and elderly (n = 96, 30M, 66F, average age: 63.5 ± 12.2 years) subjects. The break
point of 48 y between the younger and the elderly groups was chosen because it was
the average age.

119
For testing the influence of menopause, women were divided into young (n = 45; av-
erage age 34.5 ± 10.9 years) and menopausal women (n = 61; average age 65.5 ±
12.7 years).
4. Methods Phylloquinone was determined in serum by reversed-phase HPLC using postcolumn
chemical reduction of phylloquinone to its hydroquinone followed by fluorometric de-
tection (Haroon, 1986). Serum osteocalcin and undercarboxylated osteocalcin were
measured by ELISA (Takara, Japan). Triglycerides and total cholesterol were deter-
mined by Beckman Coulter kit and HDL-cholesterol by WAKO kit whereas LDL-
cholesterol was calculated by modified Friedewald formula.
5. Results Serum vitamin K1 level correlates with age (Fig. 1) in men and women (Fig. 2).
Fig.1: Positive correlation between phylloquinone Fig.2: Positive correlation between serum levels and age phylloquinone serum levels and age in men (r = 0.3; p = 0.009) and women (r = 0.29; p = 0.004) [ significant changes significant differences]
There was no difference in mean values of phylloquinone in men (0.41 ± 0.29 ng/ml)
and women (0.43 ± 0.28 ng/ml). Significant differences (p = 0.0001) between young
(0.35 ± 0.28 ng/ml) and elderly (0.49 ± 0.28 ng/ml) subjects were found. After separa-
tion into male and female, men showed no difference between young and elderly,
whereas elderly women revealed significantly (p = 0.0001) higher phylloquinone se-
rum levels than young women. There was a positive correlation for vitamin K with
00,10,20,30,40,50,60,70,80,9
1
20 30 40 50 60 70 80
Age (years)
Vita
min
K n
g/m
l
r = 0.28; p = 0.0001
0
0,2
0,4
0,6
0,8
1
1,2
20 30 40 50 60 70 80
Age (years)
Vita
min
K n
g/m
l
Male Female

120
triglycerides, LDL-cholesterol and total cholesterol. Furthermore a positive correlation
was found between age and LDL-cholesterol and total cholesterol.
Total OC, carboxylated OC and ucOC decreased significantly from the 30. to 40.
decade, between 40. and 70. decade the levels were constant and from 70. to 80.
decade total OC and carboxylated OC increased significantly. No age dependent
changes in ucOC% could be observed, however, the broad range of values from 25
up to 65 % has to be considered. Differences for men and women in total OC, car-
boxylated OC, ucOC and ucOC% are shown in Fig. 3 – 6.
Fig.3: Total osteocalcin in men and women Fig.4: Carboxylated osteocalcin in men and women
Fig.5: ucOC in men and women Fig.4: ucOC% in men and women
[ significant changes significant differences]
Mean values of total OC and carboxylated OC are significantly higher in men and
ucOC% in women. Carboxylated OC correlates negatively with age in men (r = -0.27;
p = 0.02) and positively with age in women (r = 0.29; p = 0.003) Fig. 4.
There are no differences between young and elderly subjects in osteocalcin. After
dividing into males and females, elderly women showed higher levels of total OC,
0
5
10
15
20
25
20 30 40 50 60 70 80
Age (years)
tota
l ost
eoca
lcin
ng/
ml
Male Female
02468
10121416
20 30 40 50 60 70 80
Age (years)
carb
ox. O
C n
g/m
l
Males Females
0123456789
20 30 40 50 60 70 80
Age (years)
ucO
C n
g/m
l
Males Females
01020304050607080
20 30 40 50 60 70 80
Age (years)
ucO
C (%
)
Males Females

121
carboxylated OC and ucOC than young women. Young and elderly men did not dif-
fer.
Young males showed higher levels of total OC, carboxylated OC and ucOC than
young women wheras elderly men and elderly women showed similar concentra-
tions.
6. Discussion The reference range of phylloquinone (0.04 - 1.45 ng/ml) shows a very low minimum.
A reason could be the high number of subjects under 30 years because young per-
sons often show serum levels near the detection limit.
The positive correlation between age and phylloquinone could be explained by the
positive correlation of blood lipid parameters with age and the dependence of vitamin
K as a fat soluble vitamin on the plasmatic lipid level.
There were very high levels for ucOC% (40 – 50%) whereas in the US studies levels
are below 10%. The method to measure OC, especially ucOC, is still being dis-
cussed, therefore no `real`values for ucOC% exist but all methods mostly showed
similar correlations or tendencies to other parameters being measured.
The main results from this study are differences between young males and young
females in total OC, carboxylated OC and ucOC% whereas similar phylloquinone
concentrations exist. This implies that men are able to produce more OC with the
same phylloquinone concentration than women.
In contrast, there are no differences between elderly men and elderly women. This
suggests a process in women that compensates for these differences during ageing.
One assumed explanation might be due to menopause but the mechanisms are still
unexplained.
7. Conclusion Menopause seems to influence the vitamin K and OC levels. Therefore different ref-
erence values for young (Tab.1) and elder women (Tab.2) are given, whereas men
only need one reference range (Tab.3). Table1: Young women Table 2: Elder women
51.2 ± 20.0 % ucOC%
3.11 ± 1.62 ng/mlucOC
3.25 ± 2.40 ng/mlOCcarbox
6.36 ± 2.95 ng/mlOCtotal
0.32 ± 0.27 ng/mlVitamin K1
44.9 ± 19.1 % ucOC%
3.91 ± 2.54 ucOC
5.45 ± 4.50 OCcarbox
9.38 ± 6.36 OCtotal
0.50 ± 0.28 Vitamin K1

122
Table 3: Young and elder men
8. Summary As of today no data on vitamin K blood levels and vitamin K dependent parameters
are available in Germany which could cast doubt on current German reference intake
values for this vitamin. Therefore we examined 180 healthy subjects, 74 males and
106 women. Positive correlations between vitamin K blood levels and the age of vol-
unteers were found. Younger persons showed lower vitamin K levels than the elderly,
but no gender related differences could be observed. Osteocalcin was significantly
different between young men and women (higher values in men) but not between
elder men and women. These results allow the assumption that menopause must
have influence on vitamin K and osteocalcin levels. Therefore, different reference
intake values for young and elder women in contrast to men, who show no age de-
pendent changes in both indicators, is suggested.
References Binkley NC, Krueger DC, Engelke JA, Foley AL, Suttie JW (2000): Vitamin K
supplementation reduces serum concentrations of under-γ-carboxylated osteocalcin in healthy young and elderly adults. Am J Clin Nutr, 72, 1523 - 1528
Booth SL, O´Brien-Morse ME, Dallal GE, Davidson KW, Gundberg CM (1999): Response of vitamin K status to different intakes and sources of phylloquinone-rich foods: comparison of younger and older adults. Am J Clin Nutr, 70, 368 - 377
Furie B, Furie BC (1992): Molecular and cellular biology of blood coagulation. New Eng J Med, 326, 800 - 806
Gijsbers BLMG, Jie KG, Vermeer C (1996): Effect of food composition on vitamin K absorption in human volunteers. Br J Nutr, 76, 223 – 229
Haroon Y, Bacon DS, Sadowski JA (1986): Liquid-chromatographic determination of vitamin K1 in plasma, with fluorometric detection. Clin Chem, 32, 1925 - 1929
Hauschka PV, Lian JB, Cole DEC, Gundberg CM (1989): Osteocalcin and matrix gla protein: vitamin K dependent proteins in bone. Phys Rev, 69, 990 - 1047
Manfioletti G, Brancolini C, Avanzi G, Schneider C (1993): The protein encoded by a growth arrest-specific gene (gas6) is a new member of the vitamin K-dependent proteins re-lated to proteins S, a negative coregulator in the blood coagulation cascade. Mol Cell Biol, 13, 4976 - 4985
Sokoll LJ, Sadowski JA (1996): Comparison if biochemical indexes for assessing vitamin K nutritional status in a healthy adult population. Am J Clin Nutr, 63, 566 - 573
Suttie JW (1985): Vitamin K-dependent carboxylase. Ann Rev Biochem, 54, 459 – 477
Suttie JW (1992): Vitamin K and human nutrition. J Am Diet Assoc, 92, 585 – 590 Vermeer C (1990): Gamma-carboxyglutamate-containing proteins and the vitamin K-
dependent carboxylase. Biochem J, 266, 625 – 636
40.4 ± 19.2 % ucOC%
3.64 ± 2.33 ng/ml ucOC
5.60 ± 3.22 ng/ml OCcarbox
9.03 ± 4.25 ng/ml OCtotal
0.41 ± 0.29 ng/ml Vitamin K1

123
Investigations in pet birds (Agapornis spp.) on tolerance of various dosages of vitamin K3 in complete diets Untersuchungen zur Verträglichkeit unterschiedlich hoher Gehalte an Vitamin K3 im Alleinfutter von Ziervögeln (Agapornis spp.) Hupfeld, C. 1), Wolf, P.1), Dorrestein, G.2) , Kamphues, J.1)
1) Institut für Tierernährung der Tierärztlichen Hochschule Hannover 2) Universität Utrecht, Abteilung Pathologie
Vitamin K existiert in drei verschiedenen, chemisch ähnlichen Verbindungen: Vitamin
K1 (Phyllochinon), welches in grünen Pflanzenteilen synthetisiert wird, so dass diese
die natürliche Quelle darstellen, Vitamin K2 (Menachinon), das von Mikroorganismen
im Intestinum oder in verdorbenem Futter gebildet wird sowie Vitamin K3 (Menadion),
eine synthetisch hergestellte Verbindung, die insbesondere als Futterzusatzstoff
Bedeutung hat. Für die orale Vitamin K-Applikation über das Futter wurden bisher
überwiegend wasserlösliche Vitamin K3-Derivate verwendet, da nur diese bis dato
zugelassen waren. Seit dem Jahr 2000 ist auch Vitamin K1 futtermittelrechtlich als
Vitamin K-Quelle erlaubt.
In den vergangenen Jahren wurde vor allem in verschiedenen Zeitschriften für
Vogelliebhaber und im Internet, aber auch in tiermedizinischen Fachzeitschriften
wiederholt die Vermutung geäußert, dass die orale Aufnahme von Vitamin K3 in
hohen Dosen ein toxisches Potential für Ziervögel besitzen soll, welches für Vitamin
K1 nicht nachgewiesen werden konnte (VON LÜTTWITZ und SCHULZ 1997,
SCHULZ und VON LÜTTWITZ 2000). Verschiedene der hier geäußerten Meinungen,
Mutmaßungen und Befürchtungen basieren allerdings nicht auf wissenschaftlichen
Untersuchungen an Ziervögeln oder am Geflügel.
Aufgrund dieser Diskussion, die auch bei Tierärzten zu einer Verunsicherung und zu
Anfragen im Institut für Tierernährung führten, schien es notwendig, der Frage der
Toxizität von Vitamin K3 für Ziervögel nachzugehen. Die zentrale Frage dabei war, ob
es bei oraler Applikation von Vitamin K3 über einen längeren Zeitraum zu negativen
Effekten bei Ziervögeln kommt.
In Fallberichten und verschiedenen Studien an Säugetieren wurde von
Schadwirkungen berichtet, die vor allem nach parenteraler Applikation exzessiv
hoher Dosen von Vitamin K3 auftraten. Diese manifestierten sich neben Störungen
des Allgemeinbefindens, Leistungseinbußen und Todesfällen auch in Form von
makroskopisch und mikroskopisch nachweisbaren Organveränderungen,
Abweichungen im Blutbild und Verschiebungen diverser blutchemischer Parameter

124
(MOLITOR und ROBINSON 1940, ANSBACHER et al. 1942, SMITH et al. 1943,
RICHARDS und SHAPIRO 1945, REBHUN et al. 1984, FERNANDEZ et al. 1984).
Einige wenige Studien befassten sich mit der Wirkung bei oraler Supplementierung,
wobei die Konzentrationen im Futter den Bedarf um das 5.000 bis 45.000fache
überschritten (MOLITOR und ROBINSON 1949, ANSBACHER et al. 1942, SUNAGA
et al. 1959, MELGAR et al. 1991, MARCHETTI et al. 2000).
Für das Nutzgeflügel wurden allerdings auch bei den Bedarf um ein Vielfaches
übersteigenden Gehalten von Vitamin K3 im Futter z.T. Leistungseinbußen,
Veränderungen im roten Blutbild, ein erhöhter Anteil spongiöser Knochen sowie
Todesfälle beschrieben (ANSBACHER et al. 1042, FLEMING et al. 1988, ODUHO et
al. 1993).
Methoden: Stellvertretend für hier verbreitet gehaltene Ziervögel wurden je Gruppe
12 adulte Agaporniden (Kleinpapageien) ausgewählt, die hinsichtlich ihrer Ernährung
bzw. den üblichen Futtermitteln sowohl den Großpapageien (Basis: größere fett- und
eiweißreiche Samen und Saaten) als auch den Kanarien und Sittichen (Grundlage:
kleinsämige und stärkereiche Produkte aus der Gruppe der Hirsen) vergleichbar
sind. Den Vögeln wurde ein eigens für diesen Versuch hergestelltes pelletiertes
Alleinfuttermittel (Basis: Getreide) angeboten, welchem unterschiedliche Gehalte an
Vitamin K3 (Menadion-Natrium-Bisulfit) zugesetzt wurden (Kontrollgruppe: ohne K3-
Zulage, Versuchsgruppe 1: 20 mg/kg und Versuchsgruppe 2: 200 mg/kg). Diese
Konzentrationen entsprachen bei Zugrundelegung einer üblicherweise empfohlenen
Dosis von 1 – 2 mg/kg Futter (KOLB und SEEHAWER 2002) einer Überdosierung
um das 12,5 – 25 fache (V1) bzw. 85 – 170 fache (V2; siehe Tabelle 1).
Tab. 1: Zugelegte bzw. analysierte Gehalte an Vitamin K3 in pelletierten Allein-futtermitteln für Agaporniden (im Vergleich zu üblichen Dosierungen)
Gruppe Vitamin K3 (mg/kg)
Zulage Analyse Überdosierung
K* 0 <1
V1* 20 25 12,5 - 25 x
V2* 200 170 85,0 - 170 x * K= Kontrollgruppe, V1 = Versuchsgruppe, V2 = Versuchsgruppe 2

125
Somit lag keine klassische Toxizitätsstudie vor, vielmehr sollten Praxisbedingungen
nachgestellt werden, um eventuell auftretende Schadwirkungen näher prüfen zu
können.
Die Versuche erstreckten sich über einen Zeitraum von 6 Monaten, wobei einzelne
Probanden der Kontrollgruppe und Gruppe V1 noch weitere 4 Monate mit dem
Versuchsfutter versorgt wurden. Neben der täglichen Beobachtung des
Allgemeinbefindens wurde einmal wöchentlich der klinische Gesamteindruck anhand
der Parameter Futter- und Wasseraufnahme, Körpermasse sowie Qualität der
Exkremente verifiziert. Um ein möglichst breites Spektrum der zuvor bei Menschen,
Säugetieren und dem Geflügel beschriebenen Befunde zu erfassen, fanden darüber
hinaus vielfältige Untersuchungen statt: Vor Versuchsbeginn wurden Blutproben der
Probanden hinsichtlich der hämatologischen Parameter (Hämatokrit, Gesamt-
leukozytenbestimmung, Diffentialblutbild, Untersuchung auf Heinz–Innenkörper)
sowie der blutchemischen Parameter und Enzymaktivitäten (Gesamtprotein,
Albumin, Globulin, Glutamatdehydrogenase, Laktatdehydrogenase, Aspartat-Amino-
Transferase, Kreatinkinase, Harnsäure, Kalium, Natrium, Gesamtkalzium sowie
ionisiertes Kalzium) untersucht. Die Ergebnisse der im weiteren Versuchsverlauf
etwa im Abstand von jeweils 8 Wochen untersuchten Blutproben wurden einerseits
mit den vor Versuchsbeginn ermittelten Basiswerten sowie andererseits mit
veröffentlichten Referenzwerten anderer Autoren verglichen.
Nach 26 Wochen erfolgten Sektionen und histopathologische Untersuchungen der
Organe von jeweils 4 zufällig ausgewählten Vögeln einer jeden Gruppe: Die Lebern
dieser Probanden wurden gruppenweise zu einer Sammelprobe vereinigt und
hinsichtlich ihres Gehaltes an Vitamin K3 analysiert.
Ergebnisse: Kein Vogel verstarb während der Versuchsphase, das
Allgemeinbefinden der Probanden war zu keinem Zeitpunkt gestört. Die Vögel aller
drei Gruppen nahmen im Laufe des Versuchs im Mittel zwischen 9 und 14 % an
Körpermasse zu. Die Hämatokritwerte wiesen in der Kontrollgruppe zeitabhängig
teils erhebliche Unterschiede auf, die Werte zwischen den drei Gruppen zeigten
hingegen keinerlei signifikante Differenzen. Es konnte bei keinem Vogel das
Auftreten von Heinz–Innenkörpern beobachtet werden. Im Differentialblutbild zeigten
sich Variationen, die jedoch in allen drei Gruppen auftraten. Die Werte der
blutchemischen Parameter sowie die Enzymaktivitäten variierten in physiologischen

126
Grenzen, einzig die Aktivität der Laktatdehydrogenase reduzierte sich über den
Versuchszeitraum in allen drei Gruppen. Dies ist eventuell darauf zurückzuführen,
dass die Vögel das Handling während der Blutprobenentnahme anfangs nicht
gewöhnt waren und durch Abwehrbewegungen Muskeltraumata provozierten, die zu
einem Anstieg der Laktatdehydrogenase-Aktivität zu Beginn der Versuche geführt
haben können.
Bei den Sektionen konnten keine pathologischen Veränderungen der Organe
diagnostiziert werden, histologisch gab es durchaus von der Norm abweichende
Befunde, die allerdings in allen drei Gruppen auftraten. Ausgewählte Befunde sind in
der nachfolgenden Tabelle 2 aufgeführt.
Tab. 2: Histopathologische Befunde an Organen nach Fütterung pelletierter Alleinfutter mit unterschiedlich hoher Zulage an Vitamin K3 an Agaporniden
Die Analysen der Vitamin K3-Konzentrationen im Lebergewebe der Vögel zeigten
ebenfalls keine signifikanten Unterschiede zwischen den Gruppen, so dass davon
ausgegangen werden kann, dass eine gesteigerte orale Aufnahme von Vitamin K3
nicht zu einer forcierten Einlagerung von Vitamin K3 in der Leber führt (s. Tabelle 3).
Tab. 3: Vitamin K3-Gehalte im Lebergewebe von Agaporniden nach Fütterung pelletierter Diäten mit unterschiedlichen hoher Zulage an Vitamin K3
Gruppe analysierte Konzentration von Vitamin K3 (mg/kg) im Futter im Lebergewebe
K V1 V2
< 1 25 170
0,53 0,54 0,37
K V1 V2 Befunde /Diagnosen Anzahl von je n = 4
Leber (fokale Eisenablagerungen, z. T. granulomatös) 2 1 2
Lunge (Bronchitis) 3 0 0
Niere (fokale Eisenablagerungen) 3 3 3
Milz (fokale Eisenablagerungen) 3 3 3
Schilddrüse (Inaktivität) 0 1 1
Darm (fokale Eisenablagerungen) 2 1 0

127
Schlußfolgerungen: Das Allgemeinbefinden der Vögel wurde durch Fütterung hoher
Dosen von Vitamin K3 nicht negativ beeinflusst, ein systematischer Effekt der K3-
Zulagen hinsichtlich der untersuchten Blutparameter konnte bei keinem Probanden
zu irgendeinem Zeitpunkt ermittelt werden. Weiterhin zeigten die histologisch
nachgewiesenen Abweichungen hinsichtlich der Frequenz oder Intensität in den
Gruppen keine Abhängigkeiten von der aufgenommenen Dosis des Vitamins. Die
Resultate der Vitamin K3-Analysen im Lebergewebe unterstreichen die Vermutung
anderer Autoren, dass aufgenommenes Vitamin K3 im Körper schnell metabolisiert
wird (SUZUKI und OKAMOTO 1997).
Die Applikation einer pelletierten Diät mit einem Zusatz von 20 bzw. 200 mg Vitamin
K3/kg über einen Zeitraum von mehreren Monaten hatte also keinerlei negativen
Effekt auf die Gesundheit von Agaporniden. Zweifel an der Verträglichkeit üblicher
Dosierungen von Vitamin K3 im Futter von Ziervögeln müssen somit als nicht
substantiiert bewertet werden.
Summary: The health of the birds were not influenced in a negative way by feeding
high dosages of vitamin K3. A systematical effect on the examinated blood
parameters could not be observed in any bird or at any point of time. Furthermore the
histological results didn`t show any dependence of the intake of vitamin K3
corresponding to their intensity or frequency in the three groups. The results of the
analyses of vitamin K3 in the livers affirm other authors` suggestion that absorbed
vitamin K3 is metabolized quickly (SUZUKI and OKAMOTO 1997).
The application of a pelleted diet with an addition of 20 rsp. 200 mg vitamin K3/kg
during several months (6 - 10) did not have any adverse effect on lovebirds` health.
These birds were chosen in order to represent other pet bird species. Any doubts
about the compatibility of usual doses of vitamin K3 in diets for pet birds must be
considered as absolutely not substantiated. Literatur: ANSBACHER, S., W. C. CORWIN u. B. G. H. THOMAS (1942) Toxicity of
menadione, menadiol and esters. J. Pharmacol. Exp. Ther. 75, 111-124 FERNANDEZ, F. R., A. P. DAVIES, D. J. TEACUOUT, A. KRAKE, M. M.
CHRISTOPHER u. V. PERMAN (1984) Vitamin K-Induced Heinz Body Formation in Dogs. J. Am. Anim. Hosp. Assoc. 20, 711-720

128
FLEMING, R. H., H. A. MC CORMACK u. C. C. WHITEHEAD (1998 a) Bone
structure and strength at different ages in laying hens and effects of dietary particulate limestone, vitamin K and ascorbic acid. Br. Poult. Sci. 39, 434-440
KOLB, E. u. J. SEEHAWER (2002) Die optimale Versorgung mit Vitaminen Tagungsband des XII. Int. Symposium über Haltung, Zucht und Schutz bedrohter Papageien. Bietigheim-Bissingen, 20.4.2002, S. 43-55
VON LÜTTWITZ, M. u. H. SCHULZ (1997) Wie gefährlich ist Vitamin K3? Geflügel-Börse 12, 16-17
MARCHETTI, M., M. TASSINARI u. S. MARCHETTI (2000) Menadione nicotinamide bisulphite as a source of vitamin K and niacin activities for the growing pig. Anim. Sci. 71, 111-117
MELGAR, MJ., A. ANADON u. J. BELLO (1991) Effects of Menadione on the Cardiovascular System.Vet. Hum. Toxicol. 33 (2), 110-114
MOLITOR, H. U. J. ROBINSON (1940) Oral and parenteral toxicity of vitamin K1, phthiocol and 2-methyl-1,4-Naphtoquinone. Proc. Soc. Exp. Biol. Med. 43, 125
ODUHO, G. W., T. K. CHUNG u. D. H. BAKER (1993) Menadione Nicotinamide Bisulfite is a Bioactive Source of Vitamin K and Niacin Activity for Chicks. J. Nutr. 123, 738-743
REBHUHN, W. C., B. C. TENNANT, S. G. DILL u. J. M. KING (1984) Vitamin K3-induced renal toxicosis in the horse. J. Am. Vet. Med. Assoc. 184 (10), 1237-1239
RICHARDS, R. K. u. S. SHAPIRO (1945) Experimental and clinical studies on the action of high doses of Hykinone and other Menadione derivates. J. Pharmacol. Exp. Ther. 84, 93-194
RYNCA, J. (1984) The evaluation of the usefulness of new forms of vitamin K in veterinary medicine. Ann. Warsaw Agricult. Univ.-SGGW-AR, Vet. Med. 12, 51-57
SCHULZ, H. u. M. VON LÜTTWITZ (2000) Vitamin K3: Keine Alternative zu Vitamin K1! Tierärztl. Umsch. 3, 155-161
SMITH, J. J., A. C. IVY u. R. H. K. FOSTER (1943) The pharmacology of two water-soluble vitamin K-like substances. J. Lab. Clin. Med. 28, 1667
SUNAGA, I., S. TADOKORO u. S. TAKEUCHI (1959) Studies on prolonged administration of Vitamin K3 (Menadion). GUNMA, J. Med. Sci. 8, 357-371
SUZUKI, Y.u. M. OKAMOTO (1997) Production of hen´s eggs rich in vitamin K Nutr. Res. 17, 1607-1615
129
Daily intake of fat-insoluble vitamins in prospective examinations of opiate dependent patients during methadone maintenance treatment
Szpanowska-Wohn, A.1, Kolarzyk, E.1, Kamenczak, A.2, Schlegel-Zawadzka, M.3
1Department of Hygiene and Ecology, Medical College Jagiellonian University, 7 Kopernika Str. 31-034 Krakow; 2Department of Clinical Toxicology, Medical College Jagiellonian University, Os. Zlotej Jesieni 1, 31-826 Krakow, 3Department of Human Nutrition, Medical College Jagiellonian University, 20 Grzegórzecka Str, 31-531 Krakow; Poland.
Introduction Persons being drug abused are the group especially endangered with several health
problems of various etiology (Habrat et al. 2001; Pach et al, 2001). An improper diet,
containing too low nutritional substrates, especially energy, proteins, minerals and
vitamins can be both the reason of serious diseases and may intensify the disease
processes as well. It can also make curing process significantly more difficult. The
aim of our study was to examine the content of fat-insoluble vitamins (vitamin A, B1,
B2, niacin and vitamin C) in the diet.
Materials and methods We examined the content of some fat-insoluble vitamins (vitamin A, B1, B2, niacin
and vitamin C) in the diet of 48 persons group (36 males and 12 females). All
persons were opiate addicted, and have undergone methadone treatment
programme conducted at the Department of Clinical Toxicology of Jagiellonian
University in Cracow. The first examination was performed before treatment and
following examinations within the treatment process respectively after 2 and 6
months. Data about vitamins contained in the diet were collected at 24 hour recall
and finally were processed by specialised PC software. PC software calculation
algorithm took into account vitamins lost ratio caused by technological processes.
Results and discussion The content of vitamins in diet of examined persons is showed in tables 1 and 2.

130
Table 1. The content of vitamins in diets of opiate dependent patients during
methadone maintenance treatment – men’s and women’s diets.
Nutrient X SD Min Max 1/2 1/3 2/3 Men’s diet
Vitamin A Exam. 1 [µg] 816.03 692.46 67.65 2990.03 0.52 0.73 0.59 Vitamin A Exam. 2 707.29 577.02 9.75 2685.98 Vitamin A Exam. 3 767.44 464. 90 54.56 2042.00 Vitamin B1 Exam. 1 [mg] 1.08 0.65 0.01 2.67 0.44 0.43 0.82 Vitamin B1 Exam. 2 0.99 0.45 0.08 2.06 Vitamin B1 Exam. 3 1.00 0.52 0.20 2.29 Vitamin B2 Exam. 1 [mg] 1.63 1.11 0.043 5.64 0.40 0.74 0.48 Vitamin B2 Exam. 2 1.56 0.93 0.14 4.53 Vitamin B2 Exam. 3 1.66 0.94 0.36 5.13 Niacin Exam 1 [mg] 16.61 9.68 2.60 42.36 0.19 0.82 0.25 Niacin Exam 2 14.06 8.74 3.70 35.48 Niacin Exam 3 16.59 11.34 2.03 53.33 Vitamin C Exam. 1 [mg] 47.53 35.04 0.14 120.40 0.50 0.81 0.41 Vitamin C Exam. 2 40.11 34.71 0.05 161.45 Vitamin C Exam. 3 47.07 56.83 1.80 253.63
Women’s diet Vitamin A Exam. 1 [µg] 1151.18 2141.3 82.29 7455.90 0.75 0.67 0.94 Vitamin A Exam. 2 531.86 393.26 110.28 1450.85 Vitamin A Exam. 3 681.47 547.61 130.28 1932.10 Vitamin B1 Exam. 1 [mg] 0.91 0.88 0.22 3.62 0.77 0.85 0.36 Vitamin B1 Exam. 2 0.99 0.59 0.18 1.93 Vitamin B1 Exam. 3 0.85 0.63 0.15 2.29 Vitamin B2 Exam. 1 [mg] 1.37 0.73 0.20 3.31 0.87 0.71 0.86 Vitamin B2 Exam. 2 1.45 1.49 0.21 5.93 Vitamin B2 Exam. 3 1.55 1.32 0.22 5.25 Niacin Exam 1 [mg] 13.89 8.77 3.22 34.10 0.78 0.52 0.31 Niacin Exam 2 14.66 8.85 1.16 30.93 Niacin Exam 3 11.17 10.53 0.63 29.54 Vitamin C Exam. 1 [mg] 50.80 44.83 2.03 159.74 0.54 0.89 0.75 Vitamin C Exam. 2 59.95 81.18 8.24 299.35 Vitamin C Exam. 3 51.59 85.22 6.64 296.87 X – arithmetic mean value, SD - standard deviation

131
Table 2. The content of vitamins in diets of opiate dependent patients during
methadone maintenance treatment – total group. Nutrient X SD Min Max 1/2 1/3 2/3 Vitamin A Exam. 1 [µg] 905.40 1231.87 67.65 7455.90 0.89 0.73 0.85 Vitamin A Exam. 2 662.49 537.64 9.75 2685.98 Vitamin A Exam. 3 745.95 482.23 54.56 2042.00 Vitamin B1 Exam. 1 [mg] 1.04 0.71 0.01 3.62 0.65 0.44 0.87 Vitamin B1 Exam. 2 0.99 0.48 0.08 2.06 Vitamin B1 Exam. 3 0.96 0.55 0.15 2.29 Vitamin B2 Exam. 1 [mg] 1.56 1.03 0.043 5.64 0.63 0.96 0.55 Vitamin B2 Exam. 2 1.54 1.08 0.14 5.93 Vitamin B2 Exam. 3 1.63 1.03 0.22 5.25 Niacin Exam 1 [mg] 15.90 9.43 2.60 42.36 0.30 0.56 0.56 Niacin Exam 2 14.22 8.68 1.16 35.48 Niacin Exam 3 15.24 11.29 0.63 53.33 Vitamin C Exam. 1 [mg] 48.40 37.38 0.14 159.74 0.80 0.93 0.79 Vitamin C Exam. 2 45.18 50.43 0.05 299.35 Vitamin C Exam. 3 48.13 63.56 1.80 296.87 X – arithmetic mean value, SD - standard deviation
As a result of first examination we determined that both male’s and female’s diets
were poor in vit. B1 (mean value of daily intake for men 1.08mg - 67.5% of safe intake
level, for women 0.91mg - 60%). Men and women had diets slightly too poor in niacin
(men 16.61mg - 87.4%, women 13.89mg - 81.7%) and vit. C (men 47.53 mg - 79.2%,
women 50.8mg - 84.6%). Moreover male’s diet was weak in B2 (1.63mg - 74%). We
used recommended allowances of vitamins by Institute of Nutrition in Warsaw
(Ziemlański et al,1993)
3 times repeated examination sequence did not show significant differences between
trials. Low vitamin B1 intake was stated in 39 persons at I exam, 41 at II and 40 at III
exam. Low intake of niacin was stated in 28 persons at I, 32 at II, and 33 at III exam,
and 27 persons at I, 38 at II, and 37 at III exam had lower than safe vitamin C intake.
Insufficient support of nutritional ingredients in the diet of opiate abused persons is
an additional factor that may make their health status worse. This insufficiency comes
out from incorrect every day diet (Skop et al, 2003) and metabolic influence of drugs
on hunger and satiety system.

132
Figure 1. Intake of vitamins below and above safe level among men in first, second
and third examination.
Figure 2. Intake of vitamins below and above safe level among women in first,
second and third examination.
Figure 3. Intake of vitamins below and above safe level for all persons in first, second
and third examination.
females
-15-10
-505
10
vitA
- tes
t1
vitA
- tes
t2
vitA
- tes
t3
vit B
1-te
st1
vit B
1-te
st2
vit B
1-te
st3
wit
B2-te
st1
wit
B2-te
st2
wit
B2-te
st3
niac
in -t
est1
niac
in-te
st2
niac
in-te
st 3
vit C
- tes
t1
vit C
-test
2
vit C
-test
3
num
ber o
f per
sons
below
above
all persons
-60-40-20
02040
vitA
- tes
t1
vitA
- tes
t2
vitA
- tes
t3
vit B
1-te
st1
vit B
1-te
st2
vit B
1-te
st3
wit
B2-te
st1
wit
B2-te
st2
wit
B2-te
st3
niac
in -t
est1
niac
in-te
st2
niac
in-te
st 3
vit C
- tes
t1
vit C
-test
2
vit C
-test
3
num
ber o
f per
sons
below
above
males
-40-30-20-10
01020
vitA
- tes
t1
vitA
- tes
t2
vitA
- tes
t3
vit B
1-te
st1
vit B
1-te
st2
vit B
1-te
st3
wit
B2-te
st1
wit
B2-te
st2
wit
B2-te
st3
niac
in -t
est1
niac
in-te
st2
niac
in-te
st 3
vit C
- tes
t1
vit C
-test
2
vit C
-test
3
num
ber o
f per
sons
below
above

133
An improper life style of opiate abusers, neglecting the care about the health is visible
in incorrect too small number of meals and often having something additional to eat.
It was revealed in during the quality analysis of 24 hour nutritional recalls.
Any drug may have an influence on the number of consumed nutritional ingredients
leading to anorexia or on incorrect carving (Gabera et al, 1973). This is why the diet
of opiate abusers is reach in products with a big amount of carbohydrates instead of
vitamins and mineral ingredients (Morbia et al, 1989; Szpanowska - Wohn et al,
2001; Zador et al, 1996).
The insufficiency of vitamins in the daily diet stated in the examination may cause
many additional medical complications. For example, insufficiency of vit. C enables a
proper synthesis of collagen and in this way it delays the process of wounds curing.
In the same time the skin of opiate abusers injured by many injections is often a
source of inflammatory processes. Insufficiency of vit. C discriminates the migration
of leukocytes that has an influence on immunological system functions (Garrow et al,
1993).
On the other hand insufficiency of niacin may have an influence on central nervous
system breeding or making deeper often seen among opiate abusers depression
(Eastwood et al, 1999).
Three times conducted examination of the diet of opiate abusers in the course of
methadone maintenance program did not reveal any statistically significant
differences in the vitamin intake. Any changes of life style and nutritional habits do
not take place in the course of a few months.
Apart from this the participants of the program are still undergone the treatment of
oral opiod.
Insufficiency of vitamins in daily diet of examined persons is more anxious because it
may be additionally strengthen by decreased absorption of nutritional ingredients
often seen in abused persons (Garrow et al, 1993).
Conclusions 1. Diets of examined persons were poor in some vitamins, mostly vitamin B1, niacin
and vitamin C.
2. During the 9 months of participation in methadone maintenance treatment the
content of fat – insoluble vitamins in the diets of examined persons did not change
significantly.

134
Summary Persons being drug abused are the group especially endangered with several health problems of various etiology. An improper diet, containing too low nutritional substrates be both the reason of serious diseases and may intensify the disease processes as well. The aim of our study was to examine the content of fat-insoluble vitamins in the diet of 48 opiate addicted persons. All have undergone methadone treatment program conducted at the Department of Clinical Toxicology of Jagiellonian University in Cracow. Diets of examined persons were poor in some vitamins, mostly vitamin B1, niacin and vitamin C. During 9 months participation in methadone maintenance treatment the content of fat – insoluble vitamins in the diets of examined persons did not change significantly.
Literature Eastwood M (1999) Principles of Human Nutrition. An Aspen Publication Gamber S E, Clarke J A (1976) Comments on dietary intake of drug-dependent
persons. J Am Diet Assoc, 68, 155-157 Garrow J S, James W P T (1993) Human Nutrition and dietetics. Churchill
Livingstone Habrat B, Chmielewska K, Baran-Furga H (2001) Physical status of opiate dependent
patients before and after one-year participation in methadone maintenance program. Przegl Lek 58, 245-248 (in Polish)
Morbia A, Fabre J, Chee E, Zeger S, Orsat E, Robert A (1989) Diet and opiate addiction: a quantitative assessment of the diet of non-institutionalized opiate addicts. Br J Addict 84, 173-80
Pach J, Kamenczak A, Chrostek Maj J, Foryś Z (2001) Health state evaluation of opiate dependent patients after one year methadone maintenance treatment program in Kraków. Przegl Lek 58, 240-244 (in Polish)
Skop A, Szpanowska-Wohn A, Skorupska A, (2003) Food choice and the frequency of intake individual food products of opiate and alcohol addicted persons. Przegl Lek 60, 20-24 ( in Polish)
Szpanowska-Wohn A, Dłużniewska K, Groszek B, i wsp, (2000) Problemy żywieniowe osób zakwalifikowanych do leczenia substytucyjnego metadonem. Cześć II. Sposób żywienia osób uzależnionych od opiatów. Przegl Lek 54, 544-547 (in Polish)
Zador D, Wall P M L, Webster I (1996) High sugar intake on methadone maintenance in south Western Sydney, Australia. Addiction 91, 1053.
Ziemlański Ś, Bułchak-Jachymczyk B, Budzyńska-Topolowska J, Panczenko-Kresowska B, Wartanowicz M (1994) Normy żywienia dla ludności w Polsce (energia, białko, tłuszcze, witaminy, składniki mineralne). Żyw Człow Metab 21, 303-338 (in Polish)

135
Effects of PUFA-rich diets on vitamin E and C content in brain tissue and infarct volume after cerebral ischemia. Auswirkungen von PUFA-reichen Diäten auf den Vitamin E und C -Gehalt im Hingewebe sowie die Infarktgröße nach zerebraler Ischämie Stohrer, M., Stangassinger, M. Institute of Physiology, Physiological Chemistry and Animal Nutrition, Veterinärstrasse 13, 80539 Munich
This study was designed to test the hypothesis, that augmented intake of
polyunsaturated fatty acids (PUFAs) causes - via their increased incorporation into
brain cell membranes – enlargement of infarct volume after cerebral ischemia by
increasing sensitivity against oxygen radicals.
Rats were fed isocaloric diets over 4 weeks: control, herring oil (5 % herring oil),
and DHA diet (5% docosahexanoic acid enriched fish oil). Stroke was induced by
temporary occlusion of the middle cerebral artery. 24 hours after ischemia, infarct
volumes, fatty acid composition as well as selected antioxidants were measured.
Control Herring oil DHA
DBI/S 4.2 ± 0.6 3.6 ± 0.2 * 3.6 ± 0.2 *
nmol/g brain tissue
Vitamin C 1093 ± 163 916 ± 165 668 ± 261 ***
Vitamin E 22 ± 3 17 ± 2 ** 18 ± 5 **
mm3
Infarct volume 154 ± 54 (14) 242 ± 98 (9) * 253 ± 92 (9) *
Double bond index/saturated fatty acid (DBI/S) was not augmented by PUFA-rich
diets. However due to the weakened antioxidant status (reduced vitamins C and
E) of rats fed PUFA-rich diets, the recognized genesis of oxygen radicals after
cerebral ischemia increased infarct volumes by about 60%. The aggravating effect
of unsaturated fatty acids on stroke volume after cerebral infarction is mainly due
to reduced antioxidant status, confirming the well-known amplified requirement of
antioxidants combined with high PUFA intake.

136
Relative proportion of stereoisomers of alfa-tocopherol in fluids and tissues from rats, pigs, cows and poultry explains different bioactivity of dietary natural and synthetic vitamin E between different animal species Jensen, S.K, Lauridsen, C. Department of Animal Nutrition and Physiology, Research Centre Foulum, Danish Institute of Agricultural Sciences, PO box 50, DK-8830 Tjele, Denmark
Summary
α-Tocopherol has 3 asymmetric carbons and thus 8 possible configurations. Natu-
ral occurring tocopherols from plants and algae do always posses the RRR con-
figuration, while synthetic all-rac-α-tocopheryl acetate, the major commercial
source of α-tocopherol, consists of an equimolar mixture of all 8 stereoisomers.
The official vitamin E activity of all-rac-α-tocopherol is 1.09 international units
(IU)/mg and 1.49 IU/mg for RRR-α-tocopherol giving a ratio of 1:1.36 between
synthetic and natural α-tocopherol. However, in recent years the validity of this test
for other animals has been seriously questioned, and for humans a ratio of 1:2 has
been officially adopted in USA.
Today new analytical methods based on chiral HPLC have greatly improved the
possibilities for analysing the distribution of the different stereoisomers of α-
tocopherol in various fluids and tissues. Pig’s favourite α-tocopherol with 2R con-
figuration and only minor amounts of α-tocopherol with 2S configuration are found
in pigs. In plasma and milk from cows the major isomer is the RRR-α-tocopherol.
In all species, the highest proportion of the 2S isomers is found in liver.
Introduction
The use of natural vitamin E from plants and algae has increased over the last
years. Especially the health food and the nutraceutical industry show great inter-
ests in natural vitamin E. Recently the animal husbandry, as well, has shown in-
creasing interest in the use of natural vitamin E.
Traditionally, the rat-resorption-gestation test (Weiser and Vecchi, 1982) has been
used to rank the vitamin E activity of the different tocopherols, and from these ex-
periments the official vitamin E activities of the different tocopherol molecules has
been established. Thus, the officially vitamin E activity of all-rac-α-tocopherol is
1.09 international unit (IU)/mg and 1.49 IU/mg RRR-α-tocopherol giving a ratio of

137
1:1.36 between synthetic and natural α-tocopherol (Weiser & Vecchi, 1982). How-
ever, in recent years the validity of this test for other animals than the rat itself has
been seriously questioned, and for humans a ratio of 1:2 has been officially
adopted in USA (Food and Nutrition Board, 2000).
The tocopherols has 3 asymmetric carbons, thus each of the tocopherols has 8
possible configurations. Tocopherols isolated from natural sources like plants and
algae do always posses the RRR configuration. The major commercial source of
α-tocopherol, synthetic all-rac-α-tocopherol, consists of an equimolar mixture of all
8 stereoisomers.
The relative biological activity of different stereoisomers of α−tocopherols is differ-
ent according to the rat-resorption-gestation test (Weiser & Vecchi, 1982). The
relatively biological activity of the different stereoisomers of α−tocopherol in rat
resorption assay were: RRR 100%, RRS 90%, RSS 73%, RSR 57%, SSS 60%,
SRS 37%, SRR 31% and SSR 21%. The configuration of the carbon 2 on the
chromanol ring is the most important asymmetric carbon with respect to determin-
ing the biological activity of α−tocopherol, and also has an important role on the
biodiscrimination of the different stereoisomers (Weiser et al., 1996). Thus, 2R
α−tocopherols are preferentially found in the tissues of humans (Traber et al.,
1990), rats (Weiser et al., 1996) and pigs (Lauridsen et al., 2002), as well as in
eggs (Piironen et al., 1991). Traditionally, it is very difficult to quantify the different
stereoisomers in animal fluids and tissues. Therefore, few data is available on the
transfer and deposition of different stereoisomers of α−tocopherol from feed to
plasma, milk and tissues in various farm animals consuming different sources of
vitamin E.
Today new analytical methods based on chiral HPLC have greatly improved the
possibilities for analysing the distribution of the different stereoisomers of α-
tocopherol in various fluids and tissues (Drotleff & Ternes, 2001). Hereby informa-
tions regarding the relative biodiscrimination of the different stereoismers of α-
tocopherol are much easier obtained than previous.
The purpose of the present paper was to determine the relative distribution of the
different stereoisomers of α−tocopherol in farm animals (swine, cows, poultry) fed
different levels and forms of α−tocopherol, and to compare these results with rats.

138
Materials and methods Samples of plasma from rats, pigs and cows, samples of milk from cows and
sows, and of tissues from rats, pigs and broilers were collected from the experi-
mental farm at the Danish Institute of Agricultural Sciences, Research Center Fou-
lum during year 2001 to 2003. All samples were collected from animals, which
were fed a known amount and composition of tocopherols, including the stereoi-
somers composition of α−tocopherol. α−tocopherol from feed, plasma and tissues
were saponified and extracted into heptane as described previously by Jensen et
al. (1999a). Milk samples was analysed as described by Jensen et al., (1999b).
The remaining heptane extract containing approx. 10 µg of α−tocopherol in 10 mL
heptane was evaporated to exact dryness under a nitrogen stream. Then the
α−tocopherol extracted was derivatized to its methyl ether following the method
described by Drotleff and Ternes (2001). The methyl ether derivative was ex-
tracted with 1000 µL heptane. From this heptane extract, 25-100 µL injected into
the HPLC. Chromatographic separation was achieved on a Chiralcel OD-H column
(25 x 0.46 cm, 5 µm particle size, cellulose tris (3,5-dimethylphenylcarbamate)
from Daicel Chemical industries, Ltd. (Tokyo, 100-6077, Japan). HPLC determina-
tion was performed according to the conditions described by Drotleff and Ternes
(2001). This method allows the separation of the eight stereoisomers of
α−tocopherol into five peaks, one peak contains all four 2S forms, peak two con-
tains the 2RSS−α−tocopherol, peak three contains 2RRS−α−tocopherol, peak four
contains 2RRR−α−tocopherol (=natural α−tocopherol) and peak five contains
2RSR−α−tocopherol.
Results
HPLC determination on the chiral column of all-rac−α−tocopheryl methyl ethers
should result in one peak with 50% of the total area for all 2S stereoisomers and
12.5% for the other four peaks each containing one 2R stereoisomer. Sixteen in-
jections of that reference sample gave a mean of 49.4 ± 2.9% of peaks with 2S
stereoisomers and means from 11.6 to 13.4% with standard deviations from 0.8 to
1.4 for the remaining peaks.
The relative distribution of stereoisomers of α−tocopherol in plasma and tissues
from rats fed 25-200 mg all-rac-α−tocopheryl acetate per kg diet is shown in Table

139
1. From Table 1 it is seen that the relative distribution of the different stereoisom-
ers of α−tocopherol varies betweentissues In general, the 2R forms showed a
higher proportion in plasma and tissue than in the feed, while the opposite was the
case for the 2S stereoisomers. Thus, the natural RRR-α−tocopherol isomer occurs
at the highest proportion in adipose tissue and plasma and the lowest proportion
was observed in the liver. The liver, on the other hand, had the highest proportion
of the four 2S forms, while the proportion of 2S forms in both plasma and the other
tissues were considerably lower.
Table 1 Relative distribution of stereoisomers of α−tocopherol in plasma and tis-sues from rats fed 25-200 mg all-rac-α−tocopheryl acetate per kg diet. Values are mean of 20 observations1.
Tocopherol Feed Plasma Liver Lung Spleen Adipose tissue P-value
2RRR 12.5 21.5bc 16.8a 20.4b 18.8ab 24.2c <0.001 2RRS 12.5 25.3c 17.6a 23.3bc 24.4c 21.9b <0.001 2RSR 12.5 23.5c 17.9a 21.1b 20.7b 20.2b <0.001 2RSS 12.5 20.6b 17.0a 22.1c 21.9c 19.5b <0.001 2SR/SR/S 50 9.2a 30.7c 13.1b 14.2b 14.3b <0.001 1Different letter within a row indicate significant differences (P < 0.05)
In Table 2, the relative distribution of the different stereoisomers of α−tocopherol in
fluids and tissues from various animals are shown. It is seen from Table 2 that the
distribution of stereoisomers of α-tocopherol in livers from rats and broilers are
quite similar, while the general impression is that both sows and especially cows
has a much higher proportion of the 2R stereoisomers. Cows favor the natural
RRR form both in plasma and milk.
Discussion
The results show that the 2R stereoisomers are favored in all the investigated
animal species when equal proportions of all eight stereoisomers were supplied,
Table 2 Distribution of stereoisomers of α-tocopherol in tissues and fluids from different animal species fed mainly all-rac-α-tocopheryl acetate as vitamin E source. No statistic comparison is made due to slightly different experimental con-ditions. 2RRR 2RRS 2RSR 2RSS 2SR/SR/S Feed 15 13 12 12 48 Rat Plasma 22 25 23 21 8 Rat Liver 16 18 18 17 31

140
Broiler Liver 19 18 16 17 30 Broiler Thigh 19 23 15 12 31 Sow Plasma 31 26 18 17 8 Sow Milk 35 26 17 17 5 Cows Feed 32 7 7 7 45 Cow Plasma 95.7 0.4 0.7 2.5 0.7 Cow Milk 86.4 5.4 3.7 3.9 0.6
since the ratio 2R:2S was greater than 2 in all fluids and tissues examined. Those
results are in concordance with other studies (Weiser et al., 1996; Traber et al.,
1990), showing that after the administration of all-rac-α−tocopheryl acetate to rats,
tissues were enriched preferentially with 2R forms, and with 2R:2S ratio in studied
livers ranging from 2.3 to 5.6.
Although the numerical differences between proportions of RRR + RRS, RSR, and
RSS, are small, the distribution shows that there is a preferential deposition for
RRR and RRS. With the assumption that the distribution of the stereoisomer forms
indicates their biological activites, our observation is in accordance with Weiser
and Vecchi (1982) who found for the 2R forms, biological potencities of 4R (RRR
and RRS) are higher than those of the 4S stereoisomers (RSR and RSS).
The biodiscrimination of 2R stereoisomers has been described previously in rats,
humans, and pigs (Traber et al., 1990; Weiser et al., 1996; Lauridsen et al., 2002).
and confirms that the configuration at C-2 of the phytyl tail of the α−tocopherol
molecule has a major impact on the favorization of the stereoisomer distribution
within the body fluids and tissues.
Recent studies have shown that the liver plays a critical role in the biodiscrimina-
tion of the stereoisomers, because of the presence of an α−tocopherol transfer
protein (α−TTP). This protein preferentially selects 2R α−tocopherol for secretion
into plasma (Leonard et al., 2002). Thus, our results, in which enrichment in 2R
stereoisomers in fluids and tissues was observed after feeding equal amounts of
all eight stereoisomers, may be explained by the biodiscriminating step excerted
by the liver α−TTP Hosomi et al. (1997) showed that the biological activity of
α−tocopherol steroisomers is related with its relative affinity with α−TTP. Interest-
ingly, cows show a very high proportion of RRR- in the milk, but the eventual pres-
ence of α−TTP in the mammary gland still needs to be shown.

141
In conclusion, the present experiment demonstrates a very variable proportion of
the stereoisomers of α−tocopherol among different animal species, and it may be
concluded that rats and broilers show a considerable lower biodiscriminating ca-
pability when compared to sows and cows.
References Drotleff A.M. & Ternes W. (2001) Determination of RS,E/Z-tocotrienols by HPLC. J. Chromat. A 909: 215-223. Food and Nutrition Board, Institute of Medicine 2000 Dietary reference intakes for vitamin C, vitamin E, selenium and carotenoids, p. 506. National Academy Press, Washington, DC, USA. Hosomi A., Arita M., Sato Y.Kiyose C., Ueda T., Igarashi O., Arai H., & Inoue K. (1997) Affinity for α−tocopherol transfer protein as a determinant of the biological activities of vitamin E analogs. FEBS Lett. 409: 105-108. Jensen S.K., Engberg R.M., Hedermann, & M.S. (1999a) All−rac−α−tocopherol acetate is a better vitamin E source than all−rac−α−tocopherol succinate for broilers. J. Nutr. 129: 1355-1360. Jensen, S.K, Johannsen, A.K.B. & Hermansen, J.E. 1999b Quantitative secretion and maxi-mal secretion capacity of retinol, ß-carotene and α-tocopherol into cow’s milk. Jounal of Dairy Research (66) 511-522. Lauridsen C., Engel H., Jensen S.K., Craig A.M., & Traber M.G. (2002) Lactating sows and suckling preferentially incorporate RRR- over All−rac−α−tocopherol into milk, plasma and tissues. J. Nutr. 132: 1258-1264. Leonard S.W., Terasawa Y., Farese Jr R.V., & Traber M.G. (2002) Incorporation of deuterated RRR- or all−rac−α−tocopherol in plasma and tissues of α−tocopherol transfer protein-null mice. Am. J. Clin. Nutr. 75: 555-560. National Research Council (1994) Nutrient Requirement for Poultry (9th). National Acad-emy Press, Washington, DC. Piironen V.I., Liljeroos A.I., & Koivistoinen P.E. (1991) Transfer of α−tocopherol stereoi-somers from feeds to eggs. J. Agric. Food Chem. 39: 99-101. Weiser H., Riss G., & Kormann A.W. (1996) Biodiscrimination of the eight α−tocopherol stereoisomers results in preferential accumulation of the four 2R forms in tissues and plasma of rats. J. Nutr. 126: 2539-2549. Traber M.G., Burton G.W., Ingold K.U., & Kayden H.J. (1990) RRR- and SRR−α−tocopherols are secreted without discrimination in human chylomicrons, but RRR−α−tocopherol is preferentially secreted in very low density lipoproteins. J. Lipid Res. 31: 675-685. Weiser H. & Vecchi M. (1982) Stereeoisomers of α−tocopheryl acetate. II.Biopotencies of all eight stereoisomers, individually or in mixtures, as determined by rat resorption-gestation tests. Internat. J. Vit. Nutr. Res. 52: 351-370.

142
Vergleich unterschiedlicher Parameter des antioxidativen Systems bei gesun-den Kühen im peripartalen Zeitraum Sattler, T., Zahn, N., Fürll, M. Universität Leipzig, Medizinische Tierklinik, an den Tierklinikne 11, 04103 Leipzig
Einleitung
Es existieren vielfältige Möglichkeiten, den antioxidativen Status eines Tieres zu
messen. Bisher ist jedoch noch keine Methode gefunden worden, die alle Parameter
des antioxidativen Systems erfasst. Die Messmethoden beruhen darauf, jeweils ein
Teilgebiet des gesamten antioxidativen Systems genauer zu beleuchten. So stellen
die Superoxid-Dismutase (SOD) und die Glutathionperoxidase (GPX) repräsentative
Vertreter der intrazellulären enzymatischen Antioxidantien dar (Rice und Blanchflo-
wer 1986, Winnefeld 1996). Die Trolox Equivalent Antioxidative Capacity (TEAC) ist
eine Methode zur Messung der wasserlöslichen extrazellulären Antioxidantien (Stoh-
rer und Stangassinger 2000). Gleiches gilt für die Antioxidative Kapazität von wasser-
löslichen Stoffen (ACW). Die Antioxidative Kapazität von lipidlöslichen Stoffen (ACL)
hingegen berücksichtigt nur die extrazellulären lipidlöslichen Antioxidantien (Winne-
feld 1996).
Ziel der vorliegenden Untersuchung war es, die unterschiedlichen Methoden zur
Messung des antioxidativen Status bei gesunden Kühen im peripartalen Zeitraum
durchzuführen, miteinander zu vergleichen und die Reaktion der einzelnen Parame-
ter an unterschiedlichen Punkten im peripartalen Zeitraum zu prüfen.
Material und Methoden
Es wurden 34 klinisch gesunde Kühe eines Bestandes im peripartalen Zeitraum un-
tersucht. Die Kühe wurden nach Laktationsstadien in folgende Gruppen unterteilt:
Trockensteher (n=7), eine Woche ante partum (n=6), ein bis zwei, vier bzw. acht bis
zwölf Wochen post partum (n jeweils 7).
Die SOD-Aktivität wurde mit zwei unterschiedlichen Verfahren jeweils im Erythrozy-
tenlysat bestimmt. Zum einen wurde die Messung mit Hilfe eines Testsatzes der Fir-
ma Oxis vorgenommen. Dazu wurde ein Spektralfotometer der Firma Beckmann
verwendet. Die Messung erfolgte bei 37°C, wobei die Enzymaktivität rechnerisch er-
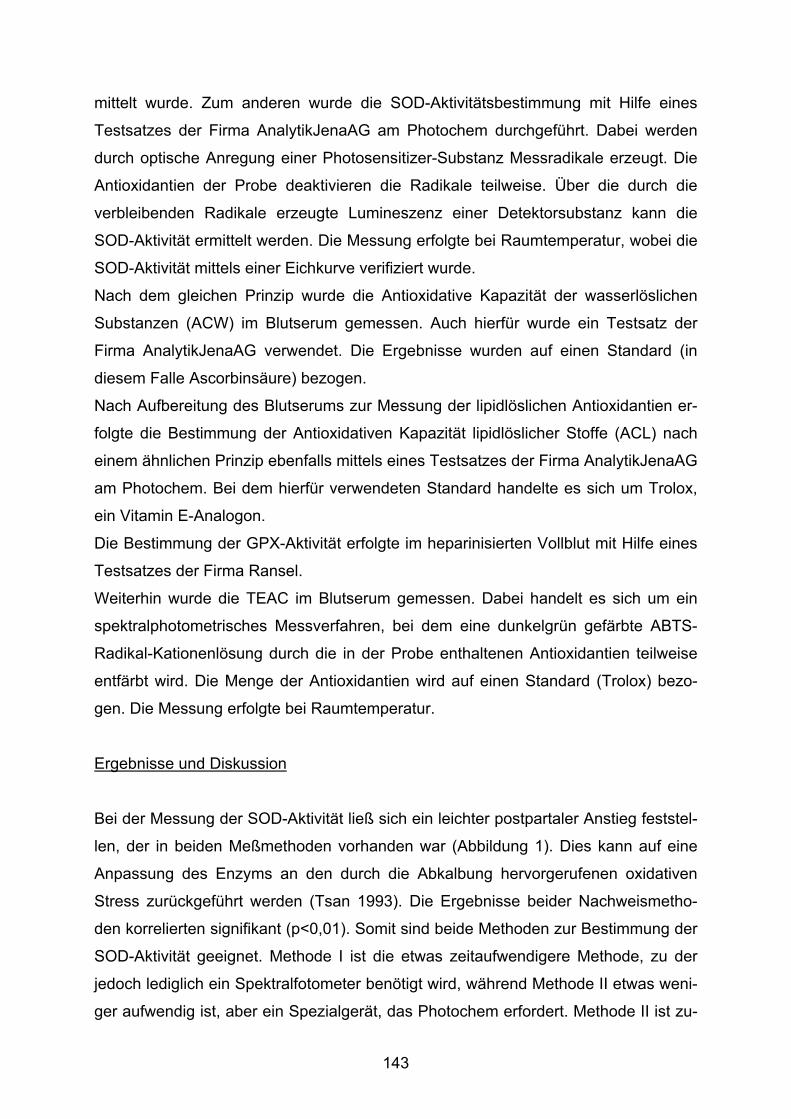
143
mittelt wurde. Zum anderen wurde die SOD-Aktivitätsbestimmung mit Hilfe eines
Testsatzes der Firma AnalytikJenaAG am Photochem durchgeführt. Dabei werden
durch optische Anregung einer Photosensitizer-Substanz Messradikale erzeugt. Die
Antioxidantien der Probe deaktivieren die Radikale teilweise. Über die durch die
verbleibenden Radikale erzeugte Lumineszenz einer Detektorsubstanz kann die
SOD-Aktivität ermittelt werden. Die Messung erfolgte bei Raumtemperatur, wobei die
SOD-Aktivität mittels einer Eichkurve verifiziert wurde.
Nach dem gleichen Prinzip wurde die Antioxidative Kapazität der wasserlöslichen
Substanzen (ACW) im Blutserum gemessen. Auch hierfür wurde ein Testsatz der
Firma AnalytikJenaAG verwendet. Die Ergebnisse wurden auf einen Standard (in
diesem Falle Ascorbinsäure) bezogen.
Nach Aufbereitung des Blutserums zur Messung der lipidlöslichen Antioxidantien er-
folgte die Bestimmung der Antioxidativen Kapazität lipidlöslicher Stoffe (ACL) nach
einem ähnlichen Prinzip ebenfalls mittels eines Testsatzes der Firma AnalytikJenaAG
am Photochem. Bei dem hierfür verwendeten Standard handelte es sich um Trolox,
ein Vitamin E-Analogon.
Die Bestimmung der GPX-Aktivität erfolgte im heparinisierten Vollblut mit Hilfe eines
Testsatzes der Firma Ransel.
Weiterhin wurde die TEAC im Blutserum gemessen. Dabei handelt es sich um ein
spektralphotometrisches Messverfahren, bei dem eine dunkelgrün gefärbte ABTS-
Radikal-Kationenlösung durch die in der Probe enthaltenen Antioxidantien teilweise
entfärbt wird. Die Menge der Antioxidantien wird auf einen Standard (Trolox) bezo-
gen. Die Messung erfolgte bei Raumtemperatur.
Ergebnisse und Diskussion
Bei der Messung der SOD-Aktivität ließ sich ein leichter postpartaler Anstieg feststel-
len, der in beiden Meßmethoden vorhanden war (Abbildung 1). Dies kann auf eine
Anpassung des Enzyms an den durch die Abkalbung hervorgerufenen oxidativen
Stress zurückgeführt werden (Tsan 1993). Die Ergebnisse beider Nachweismetho-
den korrelierten signifikant (p<0,01). Somit sind beide Methoden zur Bestimmung der
SOD-Aktivität geeignet. Methode I ist die etwas zeitaufwendigere Methode, zu der
jedoch lediglich ein Spektralfotometer benötigt wird, während Methode II etwas weni-
ger aufwendig ist, aber ein Spezialgerät, das Photochem erfordert. Methode II ist zu-

144
dem etwas preisgünstiger. Beide Methoden sind zur Routinemessung nicht geeignet,
da sie zeit- und finanzaufwendig sind und jeweils eine bestimmte Probenanzahl er-
fordern.
Abb. 1: SOD-Aktivität bei 34 gesunden Kühen im peripartalen Zeitraum, gemessen
mittels zweier unterschiedlicher Methoden (Median, 1. und 3. Quartil)
Die ACL zeigte zur Geburt hin einen signifikanten (p<0,01) Abfall um nach der Ge-
burt wieder signifikant (p<0,01) anzusteigen (Abbildung 2).
Abb. 2: ACL bei 34 gesunden Kühen im peripartalen Zeitraum (Median, 1. und 3.
Quartil)
Dies wiederspiegelt die Stoffwechselsituation sowie die Futteraufnahmekapazität ge-
sunder Kühe um die Geburt. Der postpartale Anstieg ist durch die gestiegene Futter-
1232 1187 1221 1446 13231780 1840 1785 1765 21850
500
1000
1500
2000
2500
Tro. 1 Wap 1-2 Wpp 4 Wpp 8-12 Wpp
U/m
l Ery
thro
zyte
nlys
at
SOD ISOD II
20,5 9,2 16,3 17,3 33,00
5
10
15
20
25
30
35
40
Tro. 1 Wap 1-2 Wpp 4 Wpp 8-12 Wpp
AC
L m
mol
/l

145
aufnahme und damit die höhere Aufnahme an Antioxidantien über das Futter zu er-
klären (Rust et al. 2000). Auch ist ein peripartal erhöhter Verbrauch an Antioxidantien
zu vermuten.
Anders stellt sich die Situation bei der ACW dar. Hier lag kaum ein Konzentrationsab-
fall zur Geburt hin vor. Nach der Geburt kam es trotz der einsetzenden Laktation zu
einem raschen, signifikanten (p<0,01) Konzentrationsanstieg der ACW ab 1-2 Wo-
chen post partum (Abbildung 3). Dieser wird vermutlich verursacht durch die energie-
reichere Fütterung nach der Geburt, die gleichzeitig höhere Mengen an Antioxidan-
tien enthält.
Im Gegensatz zur ACW verhält sich die TEAC, die ebenfalls die wasserlöslichen An-
tioxidantien repräsentiert. Hier kam es zu einem kontinuierlichen signifikanten
(p<0,05) Konzentrationsabfall ante partum bis 4 Wochen postpartum. Erst ab 12 Wo-
chen postpartum ist ein leichter Anstieg zu verzeichnen (Abbildung 3). Die beiden
Detektoren der wasserlöslichen Antioxidantien ACW und TEAC zeigten keinerlei Kor-
relation zueinander. Es ist anzunehmen, dass mit der jeweiligen Methode verschie-
dene wasserlösliche Antioxidantien in unterschiedlichem Maße erfasst werden, so
dass die beiden Methoden nicht miteinander vergleichbar sind.
Abb. 3: ACW und TEAC bei 34 gesunden Kühen im peripartalen Zeitraum (Median,
1. und 3. Quartil)
Die GPX-Aktivität zeigt einen tendenziellen Abfall zur Geburt hin, um anschließend
wieder etwas anzusteigen (Abbildung 4). Diese Schwankungen sind jedoch nicht
0,0
10,0
20,0
30,0
40,0
50,0
60,0
70,0
80,0
90,0
100,0
Tro. 1 Wap 1-2 Wpp 4 Wpp 8-12 Wpp
AC
W m
mol
/l
0,0
100,0
200,0
300,0
400,0
500,0
600,0
TEAC
µm
ol/l
ACWTEAC

146
signifikant. Da die GPX auch als Indikator für die Selenversorgung gilt (Wolf et al.
1998), ist es möglich, dass die GPX-Aktivität aufgrund eines höheren peripartalen
Selenverbrauchs mit Schwankungen reagiert.
Abb. 4: GPX-Aktivität bei 34 gesunden Kühen im peripartalen Zeitraum (Median, 1.
und 3. Quartil)
Die einzelnen gemessenen Parameter des antioxidativen Status zeigten in der vor-
liegenden Untersuchung keinerlei Korrelationen untereinander. Das bedeutet, dass
die Messung eines der Parameter beim gesunden Rind keine Rückschlüsse auf den
Zustand der anderen Teilgebiete des antioxidativen Systems zulässt. Extrazelluläre,
insbesondere wasserlösliche Komponenten reagieren schneller auf Veränderungen
im proxidativ-antioxidativen Gleichgewicht als beispielsweise enzymatische, intrazel-
luläre Komponenten. Das sollte bei der Wahl des zu messenden Parameters des
antioxidativen Systems beachtet werden. Günstig ist es, wenigstens zwei unter-
schiedliche Parameter zu ermitteln, um aussagekräftige Rückschlüsse auf den antio-
xidativen Status ziehen zu können.
Schlussfolgerungen
Die SOD-Aktivität ist bei gesunden Kühen mit unterschiedlichen Methoden
repräsentativ messbar.
232 202 208 216 2380
50
100
150
200
250
Tro. 1 Wap 1-2 Wpp 4 Wpp 8-12 Wpp
GP
X U
/g H
b

147
Bei allen gemessenen Parametern des antioxidativen Systems wurden periparta-
le Schwankungen bei gesunden Kühen gemessen.
Die gemessenen Parameter des antioxidativen Systems zeigten keine Korrelati-
on untereinander. Die Parameter reagierten zu des einzelnen Zeitpunkten um die
Geburt unterschiedlich und verschieden stark.
Bei der Auswahl der zu messenden Parameter des antioxidativen Systems sollte
beachtet werden, dass verschiedene unterschiedliche Reaktionsmuster der ein-
zelnen Antioxidantien zu erwarten sind. Es sollten immer mehrere Parameter
gemessen werden, um ein möglichst breites Feld des antioxidativen Systems ab-
zudecken.
Summary Comparison of different parameters of the antioxidative system in healthy cows The aim of the study was to compare different methods of verification of the antioxi-dative status in healthy cows at different dates around parturition. We measured SOD (two methods), GPX, ACW, ACL, and TEAC in 34 cows around parturition. The SOD activity showed a tendency of postpartal increase. Both methods of measurement were significant correlated. ACL showed a slightly decrease ante partum and a de-crease postpartum. In ACW the postpartal decrease was faster and higher. The TEAC decreased postpartal. The GPX-activity showed only slightly reaction around parturition. There were no correlations between the parameters to be found. Conclu-sions: There are several methods for measuring the antioxidative status of a cow. However, they turn out to behave varying in healthy cows around the parturition. Literatur Woodford FP, Whitehead TP (1998): Is measuring serum antioxidant capacity clini-
cally useful? Ann Clin Biochem, 35, 48-56 Winnefeld K (1996): Antioxidantien und Radikale: Analytik und klinische Bedeutung.
J Lab Med, 20, 199-204 Rice DA, Blanchflower WJ (1986): Evaluation of a new test kit for measuring whole
blood glutathione peroxidase using cattle blood. Vet Rec, 118, 479-480 Tsan MF (1993): Superoxide dismutase and pulmonary oxigen toxicity. Proc Soc Exp
Biol Med 203, 286-290 Rust, P, Eichler I, Renner S, Elmadfa I (2000): Long-term oral beta-carotene suppe-
mentation in patients with cystic fibrosis – effects on antioxidative status and pulmonary function. Ann Nutr Metab 44, 30-37
Wolf C, Bladt A, Altmann B(1998): Selenversorgung von Kühen – Mangel oder Ü-berschuß? 1. Mitteilung: Diagnostik der Selenversorgung bei Kühen. Prakt Tier-arzt 79, 651-658

148
Ingestion of a Spätburgunder (Pinot Noir) red wine – in vivo antioxidant activity and availability of phenolic compounds Netzel, M.1, Straß, G.1,4, Frank, T.2, Könitz, R.3, Christmann, M.3, Bitsch, R.1, Bitsch, I.4 1Institute of Nutrition, Friedrich-Schiller-University Jena, Dornburger Strasse 29, 07743 Jena, Germany; 2IMFORM GmbH International Clinical Research Darmstadt, Birkenweg 14, 64295 Darmstadt, Germany; 3Institute of Enology and Beverage Research, Forschungsanstalt Geisenheim, Rüdesheimer Strasse 28, 65366 Geisenheim, Germany; 4Institute of Nutrition, Justus-Liebig-University Giessen, Wilhelmstrasse 20, 35392 Giessen, Germany
Introduction: Red grapes and red wines represent a concentrated source of
polyphenolic compounds with strong antioxidant potential. In order to test the in vivo
bioactivity of a polyphenolic-rich German red wine (“Spaetburgunder”/ Pinot Noir),
the availability of its antioxidant components (total polyphenols and anthocyanins;
Figure 1) and the effect of wine consumption on plasma antioxidant capacity were
assessed.
OOH
OH
OR
OHR1
R2
+
3
R1 R2 R3
cyaniding-3-glucoside OH H glucose
delphinidin-3-glucoside OH OH glucose
petunidin-3-glucoside OH OCH3 glucose
peonidin-3-glucoside OCH3 OH glucose
malvidin-3-glucoside OCH3 OCH3 glucose Fig. 1. chemical structures of red grape/ red wine anthocyanins.

149
Material and Methods: 6 healthy volunteers (4 women and 2 men; non-smokers;
with a mean body mass index of 22.0 ± 2.4 kg/m2) received after an overnight
fasting for 12 hours a bolus quantity of 400 ml of a Spaetburgunder red wine
(containing 630 mg total polyphenols/ 207 mg anthocyanins) or tap water as a
polyphenol free control beverage. Plasma samples were collected before (baseline)
and 15, 30, 60, 90, 120 and 180 minutes after beverage ingestion. The plasmatic
antioxidant capacity was assessed by using the Total Radical-Trapping Antioxidant
Parameter (TRAP)-test (Ghiselli et al. 1995), the Trolox Equivalent Antioxidant
Capacity (TEAC)-test (Miller et al. 1993) and the PhotoChemiLuminescence (PCL)-
test (Popov & Lewin 1999). Furthermore, the plasma samples were analysed for
total polyphenols (Serafini et al. 1998), red wine anthocyanins (HPLD-DAD;
Miyazawa et al. 1999; Netzel et al. 2002), ascorbic and uric acid (HPLC-UV; Ross et
al. 1994; Vazquez-Oderiz et al. 1994).
Results and Conclusion: The red wine ingestion resulted in a significantly (p<0.05)
increased plasmatic antioxidant capacity (+17% vs. baseline/ TEAC assay after 30
min.; +19% vs. baseline/ TRAP assay after 60 min.; +38% vs. baseline/ PCL assay
after 60 min.) and a significantly increased total polyphenol content (+25% vs.
baseline after 30 minutes) (Figures 2-5).

150
*
100
200
300
400
500
600
700
0 15 30 45 60 75 90 105 120 135 150 165 180time (min.)
Trol
ox (µ
mol
/l pl
asm
a)
Control Spaetburgunder
Fig. 2. effect of red wine ingestion on plasma TEAC-values. *significantly different (p < 0.05; Wilcoxon Signed-Rank test) from baseline value.
*
500600700800900
100011001200130014001500
0 15 30 45 60 75 90 105 120 135 150 165 180
time (min.)
Trol
ox (µ
mol
/l pl
asm
a)
Control Spaetburgunder
Fig. 3. effect of red wine ingestion on plasma TRAP-values. *significantly different (p < 0.05; Wilcoxon Signed-Rank test) from baseline value.

151
*
100120140160180200220240260280
0 15 30 45 60 75 90 105 120 135 150 165 180time (min.)
Trol
ox (µ
mol
/l pl
asm
a)Control Spaetburgunder
Fig. 4. effect of red wine ingestion on plasma PCL-values. *significantly different (p < 0.05; Wilcoxon Signed-Rank test) from baseline value.
*
02468
1012141618202224
0 15 30 45 60 75 90 105 120 135 150 165 180
time (min.)
GA
E (m
g/l p
lasm
a)
Control Spaetburgunder
Fig. 5. effect of red wine ingestion on plasma total polyphenols. *significantly different (p < 0.05; Wilcoxon Signed-Rank test) from baseline value.

152
Anthocyanins (peonidin-, petunidin- and malvidin-3-glucosid) were detected as
unchanged glucosides in the plasma samples post-ingestion (cmax < 36 µg/l) (Table
1 and Figure 6).
Table 1. summary of the main pharmacokinetic data (antioxidant capacity and polyphenolic compounds).
Fig. 6. typical HPLC-DAD chromatograms of human plasma (subject 5); (a) before red wine consumption; (b) 1 h after red wine consumption. Peak identities are as follows: (3) petunidin-3-glucosid; (4) peonidin-3-glucosid; (5) malvidin-3-glucosid.
0.5 h (0.5 – 1.0)
55.8 ± 26.5 µmol/l
3300 µmol PCL
0.5 h (0.25 – 1.50)
3.8 ± 0.7 mg/l
630 mg GAE total polyphenols
1.0 h (1.0 – 1.0)
278.0 ± 95.9µmol/l
7900 µmol TRAP
1.0 h (0.5 – 3.0)
88.0 ± 31.5 µmol/l
6800 µmol TEAC
tmax median
(min.-max.)
Cmax(mean ±
SD)
pharmacokinetic datadose/ subjectanalysed parameters/ compounds
AUC
(mean ± SD)
74.4 ± 11.8 µg/l*h
1.0 h (1.0 – 1.5)
35.5 ± 4.2 µg/l
197 mg anthocyanins
34
5
b
Abs
orba
nce
at 5
20 n
m
0 5 10 15 20RT (min)
a
mAU

153
No significant influences of red wine drinking on the ascorbic and uric acid
concentrations of plasma were observed. In the control trial (consumption of tap
water), the plasma TEAC, TRAP, PCL, total polyphenol, ascorbic and uric acid
values remained unchanged over the test period. From the present results it can be
concluded that various red grape/ red wine antioxidants are available for humans
and are active as antioxidants in vivo.
Summary: In order to test the in vivo bioactivity of a polyphenolic-rich German red wine (“Spaetburgunder”/ Pinot Noir), the availability of its antioxidant components (total polyphenols and anthocyanins) and the effect of wine consumption on plasma antioxidant capacity were assessed by 6 healthy volunteers. After red wine ingestion (400 ml) the plasma antioxidant capacity and the plasma total polyphenol content were significantly increased. Furthermore, the major red grape anthocyanins (pet-3-gluc, peo-3-gluc and mal-3-gluc) were absorbed in part in their unchanged glucosilated forms. But it is most likely that further polyphenols from the Pinot Noir red wine (including their plasma metabolites) contribute to the observed in vivo antioxidant effect post-intake.
References Ghiselli A, Serafini M, Maiani G, Azzini E, Ferro-Luzzi A (1995): Free Radic Biol Med, 18,
29-36 Miyazawa T, Nakagawa K, Kudo M, Muraishi K, Someya K (1999): J Agric Food Chem, 47,
1083-1091 Miller NJ, Rice-Evans C, Davis MJ, Gopinathan V, Milner A (1993): Clin Science, 84, 407-
412 Netzel M, Strass G, Bitsch I, Könitz R, Christmann M, Bitsch R (2002): Ernährung/Nutrition,
26 (2), 58-63 Popov I, Lewin G (1999): Meth Enzymol, 300, 437-456 Ross MA (1994): J Chromatogr B, 657, 197-200 Serafini M, Maiani G, Ferro-Luzzi A (1998): J Nutr, 128, 1003-1007 Vazquez-Oderiz ML, Vasquez-Blanco ME, Lopez-Hernandez J, Simal-Lozano J, Romero-
Rodriguez MA (1994): JAOAC Int, 77, 1056-1059 Acknowledgement: This research project was supported in part by the Research Assocciation of the German Food Industry, the Federation of Industrial Cooperative Research Associations “Otto von Guericke”, and the Ministry of Economics and Labour (Project No. 12225 B). The human experiments comply with the current laws governing human experimentation in Germany.

154
Antioxidant activity and polyphenolic content of apple juices produced from eight different cultivars Straß, G.1,3, Netzel, M.1, Rossberg, A.1, Kranl, K.1, Thielen, C.2, Dietrich, H.2, Bitsch, R.1, Bitsch, I.3 1Institute of Nutrition, Friedrich-Schiller-University Jena, Dornburger Strasse 29, 07743 Jena, Germany; 2Institute of Enology and Beverage Research, Forschungsanstalt Geisenheim, Rüdesheimer Strasse 28, 65366 Geisenheim, Germany; 3Institute of Nutrition, Justus-Liebig-University Giessen, Wilhelmstrasse 20, 35392 Giessen, Germany
Introduction: Apple juice in Germany is still the most frequently demanded fruit juice
with a per capita consumption of about 12 l/year. Dependent on the “raw material”
(cultivar) apple juice may contain various amounts of bioactive polyphenolics (e.g.
chlorogenic acid, phloridzin and procyanidin B2; Figure 1). Juices are besides fruits
and vegetables suitable food products in terms of ingestion of these health protective
phytochemicals. The objective of the present study therefore was to compare the
antioxidant properties and the polyphenolic content of apple juices produced from
eight different cultivars.
OHOH
O O
OH
gluc
COO
OHOH
OHCOOH
OOH
OH
OH
OH
OH
O
OH
OHOH
OHOH
phloridzin
chlorogenic acid
procyanidin B2[(-)-epicatechin-(4-ß-8)-(-)epicatechin]
Fig. 1. bioactive polyphenolic components in apples and apple juices.
Material and Methods: A suitable amount of apples (Weißer Trierer Weinapfel;
Erbachhofer; Kaiser-Wilhelm; Bohnapfel; Rheinische Schafsnase; Bittenfelder;
Winterrambur; Topaz) was washed and crushed. Immediately after pressing the
juices were stabilised with ascorbic acid (200-250 mg/l) to prevent polyphenol
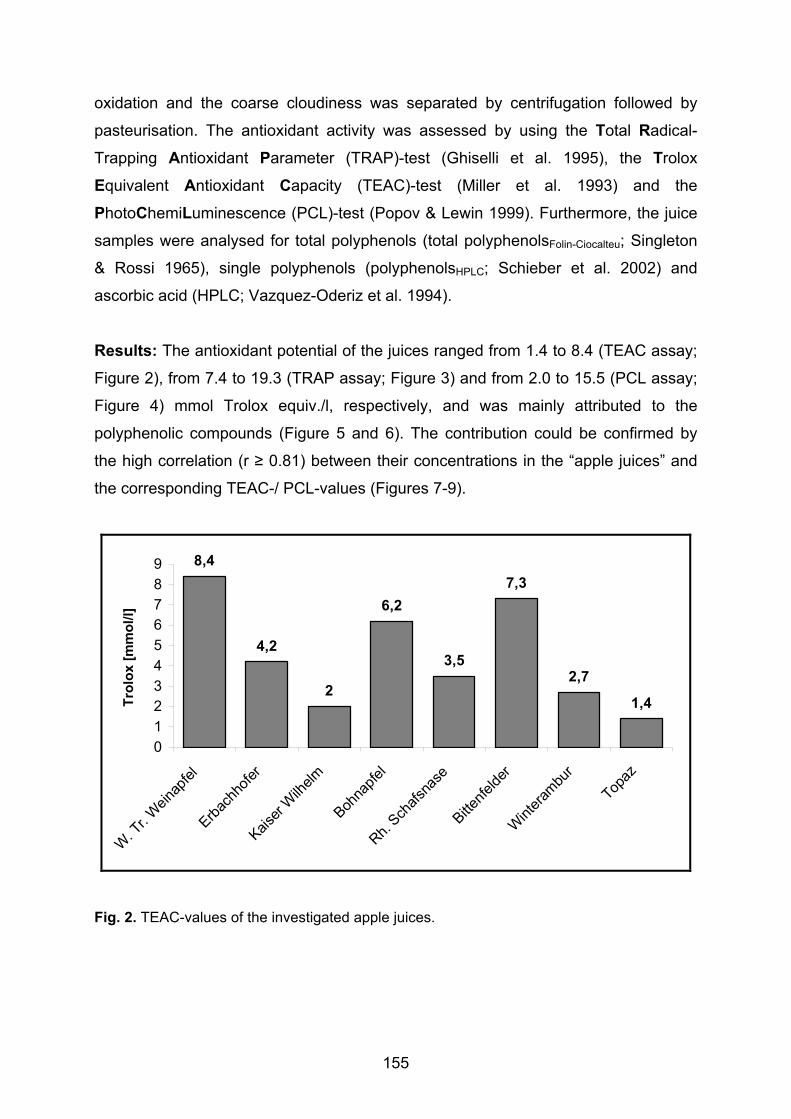
155
oxidation and the coarse cloudiness was separated by centrifugation followed by
pasteurisation. The antioxidant activity was assessed by using the Total Radical-
Trapping Antioxidant Parameter (TRAP)-test (Ghiselli et al. 1995), the Trolox
Equivalent Antioxidant Capacity (TEAC)-test (Miller et al. 1993) and the
PhotoChemiLuminescence (PCL)-test (Popov & Lewin 1999). Furthermore, the juice
samples were analysed for total polyphenols (total polyphenolsFolin-Ciocalteu; Singleton
& Rossi 1965), single polyphenols (polyphenolsHPLC; Schieber et al. 2002) and
ascorbic acid (HPLC; Vazquez-Oderiz et al. 1994).
Results: The antioxidant potential of the juices ranged from 1.4 to 8.4 (TEAC assay;
Figure 2), from 7.4 to 19.3 (TRAP assay; Figure 3) and from 2.0 to 15.5 (PCL assay;
Figure 4) mmol Trolox equiv./l, respectively, and was mainly attributed to the
polyphenolic compounds (Figure 5 and 6). The contribution could be confirmed by
the high correlation (r ≥ 0.81) between their concentrations in the “apple juices” and
the corresponding TEAC-/ PCL-values (Figures 7-9).
8,4
4,2
2
6,2
3,5
7,3
2,7
1,4
0123456789
W. Tr. W
einap
fel
Erbach
hofer
Kaiser
Wilh
elm
Bohna
pfel
Rh. Sch
afsna
se
Bittenfe
lder
Wintera
mbur
Topaz
Trol
ox [m
mol
/l]
Fig. 2. TEAC-values of the investigated apple juices.
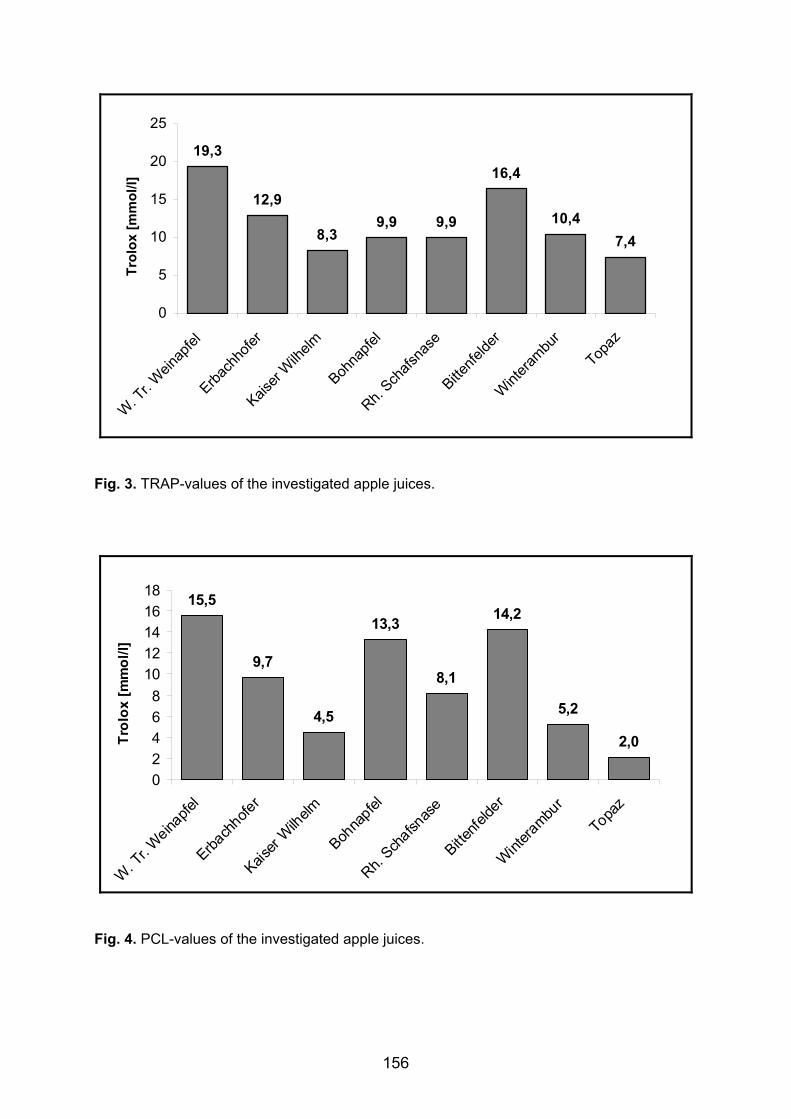
156
19,3
12,9
8,39,9 9,9
16,4
10,47,4
0
5
10
15
20
25
W. T
r. Wein
apfel
Erbach
hofer
Kaiser
Wilh
elm
Bohna
pfel
Rh. Sch
afsna
se
Bittenfe
lder
Wint
erambu
r
Topaz
Trol
ox [m
mol
/l]
Fig. 3. TRAP-values of the investigated apple juices.
15,5
9,7
4,5
13,3
8,1
14,2
5,2
2,0
02468
1012141618
W. Tr. W
einapfe
l
Erbach
hofer
Kaiser
Wilhelm
Bohna
pfel
Rh. Sch
afsnas
e
Bittenfe
lder
Wintera
mbur
Topaz
Trol
ox [m
mol
/l]
Fig. 4. PCL-values of the investigated apple juices.

157
160
85
56
121
75
122
55
31
020406080
100120140160180
W.Tr.Wein
apfel
Erbach
hofer
Kaiser
Wilhelm
Bohna
pfel
Rh. Sch
afsnas
e
Bittenfe
lder
Wintera
mbur
Topaz
Poly
phen
ols/
Folin
-Cio
calte
u [m
g/10
0ml]
Fig. 5. Total polyphenolsFolin-Ciocalteu of the investigated apple juices.
604
478
351464
613
774
312
220
100200300400500600700800900
W. Tr. W
einapfe
l
Erbach
hofer
Kaiser
Wilhelm
Bohna
pfel
Rh. Sch
afsnas
e
Bittenfe
lder
Winterr
ambour
Topaz
Poly
phen
ols/
HPL
C [m
g/L]
Fig. 6. PolyphenolsHPLC of the investigated apple juices.

158
r = 0,9860
500
1000
1500
2000
0 2 4 6 8 10
TEAC [mmol/l]
tota
l pol
yphe
nols
[mg/
l]
r = 0,8130
200
400
600
800
1000
0 2 4 6 8 10
TEAC [mmol/l]
poly
phen
ols/
HP
LC [m
g/l]
Fig. 7. correlation between the total polyphenolsFolin-Ciocalteu/ polyphenolsHPLC and the corresponding TEAC-values.
r = 0,688
0
500
1000
1500
2000
0 2 4 6 8 10 12 14 16 18
TRAP [mmol/l]
tota
l pol
yphe
nols
[mg/
l]
r = 0,6590
200
400
600
800
1000
0 2 4 6 8 10 12 14 16 18
TRAP [mmol/l]
poly
phen
ols/
HP
LC [m
g/l]
Fig. 8. correlation between the total polyphenolsFolin-Ciocalteu/ polyphenolsHPLC and the corresponding TRAP-values.
r = 0,9780
500
1000
1500
2000
0 2 4 6 8 10 12 14 16 18
PCL [mmol/l]
tota
l pol
yphe
nols
[mg/
l]
r = 0,880
0
200
400
600
800
1000
0 2 4 6 8 10 12 14 16 18
PCL [mmol/l]
poly
phen
ols/
HP
LC [m
g/l]
Fig. 9. correlation between the total polyphenolsFolin-Ciocalteu/ polyphenolsHPLC and the corresponding PCL-values.

159
Conclusion: Juices produced from the cultivars Weißer Trierer Weinapfel, Bittenfelder and
Bohnapfel were the “richest” in both – Antioxidant Capacity (AC) and
polyphenolic content (comparable to red wines!).
A high correlation could be observed between the total polyphenolsFolin-Ciocalteu
and the polyphenolsHPLC to their corresponding TEAC-/ PCL-values (r ≥ 0.81),
respectively.
The in vitro estimation of the AC of apple juices does not necessarily reflect
the complex interactions within the organism (in vitro AC ≠ in vivo AC).
Summary: Dependent on the “raw material” (cultivar) apple juice may contain various amounts of bioactive polyphenolics. Juices are besides fruits and vegetables suitable food products in terms of ingestion of these health protective phytochemicals. The objective of the present study therefore was to compare the antioxidant properties and the polyphenolic content of apple juices produced from eight different cultivars. The juices produced from the cultivars Weißer Trierer Weinapfel, Bittenfelder and Bohnapfel were the “richest” in both, antioxidant activity and polyphenolic content. Up to now, apple juices with such a high antioxidant potential have not been described in literature.
References Ghiselli A, Serafini M, Maiani G, Azzini E, Ferro-Luzzi A (1995): Free Radic Biol Med, 18, 29-
36 Miller NJ, Rice-Evans C, Davis MJ, Gopinathan V, Milner A (1993): Clin Science, 84, 407-
412 Popov I, Lewin G (1999): Meth Enzymol, 300, 437-456 Schieber A, Keller P, Streker P, Klaiber I, Carle R (2002): Phytochem Analysis, 13, 87-94 Singleton VL, Rossi JA (1965): Am J Enol Vitic, 16, 144-158 Vazquez-Oderiz ML, Vasquez-Blanco ME, Lopez-Hernandez J, Simal-Lozano J, Romero-
Rodriguez MA (1994) JAOAC Int, 77, 1056-1059 Acknowledgement: This research project was supported in part by the Research Assocciation of the German Food Industry, the Federation of Industrial Cooperative Research Associations “Otto von Guericke”, and the Ministry of Economics and Labour (Project No. 13431 BG). The human experiments comply with the current laws governing human experimentation in Germany.

160
Antioxidantien bei häufigen Rinderkrankheiten Fürll, M., Goerres, A. Medizinische Tierklinik der Veterinärmedizinischen Fakultät Leipzig, An den Tierkli-niken 11, 04103 Leipzig Einleitung und Zielstellung: In der Frühlaktation häufen sich bei Milchkühen die Er-
krankungen, die i.d.R. den Charakter von Faktorenkrankheiten haben. Eine in vier
Betrieben angefertigte Krankheitsstatistik belegt diese Feststellung (Tab. 1). Metzner
et al. (1996) fanden das Vorkommen der Mehrzahl dieser Krankheiten gesichert mit
der Milchleistung korreliert, ausgenommen Genitalkatarrhe (Tab. 2).
Tab. 1:Erkrankungshäufigkeit bei Milchkühen in vier Betrieben innerhalb vier Wochen
nach der Geburt (Fürll et al. 2002)
B e t r i e b : k g F C M / K u h / J a h r
Krankheiten (%) A: ca. 6800 B: ca. 7000 C: ca. 8000 D: ca. 7000 Labmagenverlagerung 6,0 6,0 0 0 Milchfieber 3,2 4,8 7,1 2,0 Schwergeburten 2,4 2,8 k. A k.A. Euterentzündung - leicht 7,6 6,8 8,0 10,0 Euterentzündung -schwer 4,8 5,2 16,0 1,0 Nachgeburtsverhaltung/ Gebärmutterentzündung
8,0 6,8 17,0 23,0
Totgeburten 3,2 4,0 k. A k.A. Klauenkrankheiten 3,2 k. A. 9,0 3,0 k.A. = keine Angaben
Tab. 2: Beziehungen zwischen Milchleistung und Erkrankungsrisiko („Auftrittswahr-scheinlichkeit“ in %) (Metzner et al. 1996)
6000 kg/a 8000 kg/a 10 000 kg/a 12 000 kg/a Nachgeburtsverhaltung 7,0 8,5 12,5 17,0 Genitalkatarrh 18,5 19,5 22,5 25,5 Eierstockszysten 8,5 13,0 19,5 27,0 Euterentzündung 18,0 25,0 34,5 38,5 Klauenerkrankungen 16,5 21,0 26,0 32,0 Milchfieber 2,0 3,0 4,0 5,0 Angesichts der hohen Selektionsrate in der Milchviehhaltung von ca. 35 - 45% drängt
sich die Frage nach den Ursachen für das vorzeitige Ausscheiden vieler Kühe auf.
Antioxidantien beeinflussen wesentlich die Tiergesundheit. So ist z.B. ihre Bedeutung
für die Eutergesundheit gut belegt. Zahlreiche Publikationen beschreiben die positi-
ven Effekte von Selengaben gegen Mastitiden. Deshalb wurden Untersuchungen
durchgeführt, um eine Krankheitsdisposition durch verminderten Antioxidantiengehal-
te zu prüfen.
Material und Methoden: In zwei „1930er MVA“ wurde bei insgesamt 500 Kühen (ca.
8000 kg FCM) ein periodischer Screening vom Trockenstellen bis 2 Wochen post

161
partum durchgeführt. Retrograd erfolgte die Analyse der Blutproben von 45 gesun-
den sowie aller erkrankten 144 Kühe: 27 mit Klauenerkrankungen, 46 mit Mastitiden,
14 mit Gebärparesen, 23 mit Retentio secundinarum, 17 mit Fruchtbarkeitsstörungen
sowie 17 mit Endometritiden. Als Prüfgröße wurde die so genannte TEAC (Trolox
Äquivalent of Antioxidative Capacity) nach Miller verwendet, die summarisch wasser-
lösliche Antioxidantien erfasst und relativ einfach sowie preisgünstig analysierbar ist
(Fürll et al. 2002).
Ergebnisse und Diskussion: In beiden Untersuchungen zeigte sich eine bereits
während der Trockenstehperiode beginnende Reduzierung der TEAC-Konzentratio-
nen bei später erkrankenden Kühen, die wiederum am dritten Tag p.p. das Minimum
erreichte. Besonders deutlich war dies bei Kühen mit späteren Nachgeburtsverhal-
tungen sowie Mastitiden (Abb. 1). Keine Unterschiede waren in dieser Analyse bei
Kühen mit späterer Gebärparese sowie Klauenkrankheiten und Fruchtbarkeitsstö-
rungen nachweisbar. Die ätiologische Bedeutung dieser Differenzen besonders zwi-
schen gesunden sowie an Mastitis erkrankenden Kühen wird daran deutlich, dass bei
keiner anderen Krankheitsgruppe derartig deutliche Unterschiede gegenüber Gesun-
den ermittelt wurden und dass durch Substitution mit Antioxidantien immer wieder
frappierende Effekte zur Verbesserung der Eutergesundheit erzielt werden können
(Ali-Vehmas et al. 1997, Hemingway 1999). Die pathophysiologischen Einflüsse der
Antioxidantien zielen in erster Linie auf eine verbesserte Abwehrleistung im Euter
durch Erhöhung der Phagozytoseleistung der Polymorphkernigen ab (Smith, Hogan
und Weiss 1997).
Zusammenfassung: Die antioxidative Kapazität (AC) beeinflusst wesentlich das Auf-
treten von Mastitiden, Retentio secundinarum u.a. Organkrankheiten. Antioxidantien
wirken dabei z.T. direkt, z.B. auf die Uterusretraktion und Ablösung der Plazenta, z.T.
indirekt durch Entzündungshemmung sowie gesteigerte Phagozytose. Die Reduzie-
rung der AC entwickelt sich bereits während der Trockenstehperiode. Das bietet die
Möglichkeit der gezielten Prophylaxe auch hinsichtlich Fruchtbarkeit durch höhere
AO-Versorgung in der Transitphase Für die Bestandskontrolle bietet sich die „TEAC“-
Bestimmung an. Bezüglich Wertigkeit der AO-Einzelkomponenten sind weitere Un-
tersuchungen nötig.
Literatur: Sie liegt bei den Verfassern vor.

162
TEAC im Serum gesunder und aller erkrankten Kühe
**
* **
50
100
150
200
250
300
8. Woche a.p. 4. Woche a.p. 1 Woche a.p. 3 Tage p.p. 14 Tage p.p.
µmol/l
Krank Gesund
** *
Retentio secundinarum TEAC – Konzentrationen (µmol/l Serum)
100
120
140
160
180
200
220
240
260
280
300
8W o a.p. 4W o a.p. 1W o a.p. 3d p.p. 14d p.p.
**
*
Mastitis TEAC – Konzentrationen (µmol/l) im Serum
100
120
140
160
180
200
220
240
260
280
300
8Wo a.p. 4Wo a.p. 1Wo a.p. 3d p.p. 14d p.p.
*
Abb. 1: TEAC-Konzentrationen während der Trockenstehperiode sowie bis zwei
Wochen post partum bei gesunden Kühen sowie Kühen mit Nachgeburtsverhal-
tungen und Mastitiden in der Frühlaktation
*

163
Gebärparese TEAC - Konzentrationen (µmol/l Serum)
100
120
140
160
180
200
220
240
260
280
300
8Wo a.p. 4Wo a.p. 1Wo a.p. 3d p.p. 14d p.p.
Klauenerkrankungen
TEAC – Konzentrationen (µmol/l) im Serum
100
120
140
160
180
200
220
240
260
280
300
8Wo a.p. 4Wo a.p. 1Wo a.p. 3d p.p. 14d p.p.
Fruchtbarkeitsstörungen TEAC – Konzentrationen (µmol/l Serum)
100
150
200
250
300
350
1Wo a.p. 3d p.p. 14d p.p. Abb. 2: TEAC-Konzentrationen während der Trockenstehperiode sowie bis zwei Wo-chen post partum bei gesunden Kühen sowie Kühen mit Gebärparese sowie Klauen-krankheiten und Fruchtbarkeitsstörungen in der Frühlaktation

164
Assessment of some macro- and microelements daily intake of two groups of women from silesia region Niedworok, E., Całyniuk, B., Szczepańska, E. Departament of Human Nutrition, Faculty of Public Health, Medical University of Silesia ul.Piekarska 18, 41-902 Bytom, Poland INTRODUCTION Inappropriate way of nourishment, connected from excessive or insufficient supply of definite
alimentary components, it leads from rule to metabolic disorders of organism of man [1,2].
It concerns this both intensive period of height and development, period of maturity, as also
aging. Taking this under attention investigations were cut above opinion of level of consump-
tion of choose nutritious components such as magnesium and iron [11,13].
The ubiquitous character of magnesium and the diversity of its physiological functions
explain the multiplicity of the clinical aspects of its deficit [7]. Magnesium status may be
compromised with ageing for two reasons: insufficient intake /magnesium deficiency/ or
alterations in magnesium metabolism /magnesium depletion/ [6,8,9].
The body contains less than 5 mg of iron, but this small amount performs extraordinarily im-
portant functions [16].
In our study we compared magnesium and iron daily intake by two groups of women different
age from Silesia region. Formulated purposes correspond with problem of quality of life and
state of health of persons in aged age too [5].
MATERIAL AND METHODS Investigation 79 women were hugged in compartment 26 - 60 years as well as 68 women in
age above 60 years, which they answered to district information bureau .
Methodology of investigation they hugged opinion of level of consumption of choose nutri-
tions. Women were classified to two aged groups: 26 - 60 years /group A/ as well as above 60
years.
The 24 – hour recall method - nutritional interview, moved in accordance with guiding princi-
ples of Institute of Foods and Nutrition was used [3,4,10].
Intake of magnesium and iron in daily portion of food was estimated on basis of contain datas
in “Album of photo of products about diverse sizes of portion”. To calculations composition
of meals computer programme “Dietetician 2001” was used [12,14,15].

165
RESULTS Table 1 shows obtained results. Tab.1. Intake magnesium and iron by two groups of women different age from Silesia region /the means values/. Group
A
B
Age /years/
26-60
above 60
Number –n
79
68
Magnesium intake (mg) Min. (mg) Max.(mg)
206,34 80,98 497,1
198,46 72,33 377,37
Iron intake (mg) Min. (mg) Max. (mg)
9,99 3,26 32,54
10,41 2,84 29,32
The amount of magnesium and iron in daily consumption was estimated using 24-recall
method. We observed that mean daily magnesium intake was about 206 mg for the women
26-60 years old. For the second group this value was 198mg. There was not statistic differ-
ences between analyzed groups. But these values were lower that values recommended /200-
400 mg per day/[17].
Many authors suggested that only 10% of the iron in the diet was absorbed; however, more
recent knowledge makes it feasible, by careful planning, to increasing the amount of iron ab-
sorbed. The iron in food is divided into two categories: heme /23% is absorbed and not af-
fected by other by other factors in diet/ and nonheme iron /only 3% is absorbed/. The absorp-
tion of nonheme iron can be increased to 8% if the mineral is ingested in a meal that includes
ascorbic acid and/or meat, fish, poultry.
In the case of iron our examinations indicated that daily intake the mean values for the
younger women /group A/ was significantly lower / 9,99 mg/ that recommended amounts /18
mg/. The similar results was observed for group B /10 mg/ and the recommended daily intake
for this group is 13 mg per day [17].

166
CONCLUSIONS Got results permit to propose following conclusions:
1. In both studied groups of women different age shortages of magnesium in comparison
with recommended norms were affirmed in menus.
2. Content of iron in menus of studied two groups of women was lower than recom-
mended norm. For group A /younger women/ consumption of iron was lower about
half time in relation to norm.
REFERENCES
1. Brussaard J.H. et al.: A European food consumption survey method-conclusion and rec-
ommendations. Eur.J.Clin.Nutr. 5,56,2,2002
2. Charrondiere U.R., et. al.: The European Nutrient Database (ENDB) for Nutritional
Epidemiology. Journal of Food Composition and Analysis15,4,8,2002
3. Charzewska J.: Gaps in dietary survey methodology in Estern Europe; Am. J. Clin Nutr.
59, 1994
4. Charzewska J.: Instrukcja przeprowadzania wywiadu o spożyciu z 24 godzin, Zakład
Epidemiologii Żywienia IŻŻ, Warszawa, 1997
5. Composition Calculated According to FRI-FAO Programme "ALIMENTA", Polish Pro-
gramme "FOOD 2" and Results of Chemical Analysis. Journal of Food Composition and
Analysis 13, 4, 2000
6. Hoffan K., et. al.: Estimating the distribution of usual dietary intake by short – term
measurements; German Institute of Human Nutrition, Potsdam – Rehbrucke, Germany,
2002
7. Hernández T.: Use of the Core Food Model to Estimate Mineral Intakes
Part 2. Estimation of Mineral Intakes. Journal of Food Composition
and Analysis14, 3, 2001
8. Lombardi-Boccia G., et. all.: Content of some Trace Elements and Minerals in the Italian
Total-diet. Journal of Food Composition and Analysis 13, 4, 2000
9. Materiały International Scientific Symposium on measurement and assessment food dep-
rivation and undernutrition. Rzym czerwiec 2002
10. Mennen L.I..: The use of computerised 24 h dietary recalls in the French SU.VI.MAX
Study: number of recalls required. Eur.J.Clin.Nutr.7,56, 2002

167
11. Pokorn D., et. all.: Elemental Composition (Ca, Mg, Mn, Cu, Cr, Zn, Se, and I) of Daily
Diet Samples from Some Old People's Homes in Slovenia. Journal of Food Composition
and Analysis 11, 1, 1998
12. Program komputerowy software Jumar: Dietetyk 2001, Poznań 2001
13. Saris N-E, L., et al.: Magnesium. An update on physiological, clinical and analytical as-
pects. Clinica Chimica Acta 2000, 294, 1-26
14. Schaker S.F., et. all.: Procedures for Estimating Nutrient Values for
Food Composition Databases. Journal of Food Composition and Analysis 10, 2, 6, 1997
15. Szostak W.: Album fotografii produktów i potraw, IŻŻ, Warszawa, 2000
16. Weisell R.: The process of determining nutritional requirements. Food, Nutrition and Ag-
riculture 30,2002
17. Ziemlański Ś.: Normy Żywienia Człowieka. Fizjologiczne podstawy, PZWL,
Warszawa 2001

168
Meeting the young men organism requirements for selected mineral elements by daily food ration Kłos, A., Bertrandt, J., Stężycka, E. Military Institute of Hygiene and Epidemiology, 4 Kozielska St. 01-163 Warsaw, Poland
Progressing environment degradation is a result of fast industrial civilization
development, urbanization and agriculture chemisation. Changes in content and
mutual proportions of mineral elements in vegetable and animal origin products can
results from these changes (Gawęcki J., et all 1998). Moreover increase of life pace,
not obeying diet correctness and constant exposure to a stress may cause macro
and microelements deficiencies in human organism (Bertrandt J. et all 2001).
Mineral elements play many different roles in human organism. They are the
fundamental constructive element of bone structure and regulators of enzymes’
activators. Relation between unbalanced mineral elements intake and incidence of
different diseases is well known. It is known that proper magnesium intake decrease
risk of arteriosclerosis development while disturbed relation between zinc and copper
increases risk of ischaemic heart disease occurrence (Kulikowska et all. 1991,
Maniuk K et all 1991).
Proper nutrition is one of the fundamental factors influencing on keeping good
health state. Therefore energy requirements and participation of particular nutritive
elements including mineral ones, in daily food ration of young men doing military
service have to be adjusted to external conditions and consider soldiers physical and
psychical burden related to the kind of service.
AIM OF WORK
The aim of work was theoretical and analytical estimation of magnesium, zinc,
copper and manganese content in daily food rations of young men doing military
service in Air Cavalry Unit.
MATERIAL AND METHODS
Material for researches consisted of decade menus that were the base for
meals preparation and daily food rations given soldiers for consumption. Total of 50

169
daily menus and 50 daily food rations prepared in the canteen and given for
consumption were analysed.
Estimation of magnesium, zinc, copper and manganese content in planned daily
food rations was done based on calculations carried out by calculation software
FOOD 2 (Warsaw 1998). Content of mineral elements in daily food rations given for
consumption was estimated by atomic absorption spectrometry (ASA) using Pay
Unicam SP 9 apparatus. Samples of daily food rations were homogenized and
mineralised before testing (Warsaw 1082).
RESULTS AND DISSCUSION
Average, theoretically calculated, magnesium content in daily food rations
planned for consumption amounted 611.4±86.7 mg, zinc 24,0±3.30 mg, copper
2.59±0.38 mg and manganese 7.98±1.69 mg. Planned value of mineral elements
was higher than recommended by Polish norm for men working very hard (fig. 1).
Fig. 1. Meeting the requirements for selected mineral elements in planned for
consumption daily food ration in %
It is well known that during meals preparation some amount of mineral elements
is lost. It is called technological loss.
Average content of mineral elements in daily food rations given for consumption
0
5 0
1 0 0
1 5 0
2 0 0
%
M a g n e s i u m Z i n c C o p p e r M a n g a n e s e

170
was as follows: magnesium 496.4±78.6 mg, zinc 20.7±2.90 mg, copper
2.08±0.62 mg and manganese 5.71±0.87 mg.
Fig.2. Meeting the requirements for mineral elements (%)
Indicated mineral elements content in daily food ration given for consumption
met the requirements of Polish norm (Ziemlański et all 1995), except copper fig. 2.
Mineral elements content in daily food ration given for soldiers consumption was
compared to the elements content in daily food ration soldiers were fed in the past
years (table 1) (Bertrandt J. 2001, Kłos A. et all 1997).
Food ration given currently for consumption contain bigger amounts of mineral
elements than meals given in the nineties. These changes result from changing food
ration composition that takes into consideration dietary habits of young men and new
products, often richer in m/a elements introduced to the market.
According to Singh & co. (Singht A. 1989) food ration used in US Army
delivered 424 mg magnesium and 16,8 mg zinc.
0
50
100
150Magnesium
Zinc
Manganese
Copper
Food rations
Norm

171
Table 1. Average mineral elements content in daily food ration given for consumption
for soldiers doing military service in the past years.
Mineral
element
1989/90
1991/92
1993/94
2000
2002
Magnesium
382±47
362±42
369±90
-
493±75
Zinc
16.1±4.5
15.4±3.5
14.4±2.5
21.4±4.3
21.1±3.37
Copper
2.26±0.5
1.57±0.6
1.35±0.5
2.03±0.3
2.13±0.4
Manganese
-
5.57±3.5
5.00±0.8
7.46±0.6
5.69±0.9
According to researches carried out by Olejnik & co (8) daily food rations of
teenagers fed in mass nutrition in schools contained lower than recommended
amount of mineral elements. Magnesium met the requirements in 80-107%, zinc in
71-106%, copper in 88-108% of recommended amounts. Schlegel-Zawadzka & co.
(11) testing daily food rations of young men aged 20-24 living in Wielkopolska region
revealed that mean zinc content in food rations amounted 13,5 mg and copper 1,39
mg while mean energy value of analysed meals was 2796 kcal.
CONCLUSION
1. Found mean mineral element content in daily food ration planned for consumption
exceeded requirements of Polish norms.
2. Food ration given for consumption to young men doing military service met the
requirements of the Polish norms, except copper content.
3. Showed bigger mineral elements content in analysed food rations is caused by
high value of ration energy and different assortment of food adjusted to the
service condition.

172
SUMMARY The aim of work was theoretical and analytical estimation of magnesium, zinc,
copper and manganese content in daily food rations of young men doing military service in Air Cavalry Unit. Material for researches consisted of decade menus that were the base for meals preparation and daily food rations given soldiers for consumption. Total of 50 daily menus and 50 daily food rations prepared in the canteen and given for consumption were analysed. Estimation of magnesium, zinc, copper and manganese content in planned daily food rations was done based on calculations carried out by calculation software FOOD 2. Content of mineral elements in daily food rations given for consumption was estimated by atomic absorption spectrometry using Pay Unicam SP 9 apparatus. Average, theoretically calculated, magnesium content in daily food rations planned for cansumption amounted 611,4±86,7 mg, zinc 24,0±3,30 mg, copper 2,59±0,38 mg and manganese 7,98±1,69 mg. Planned value of mineral elements was higher than recommended by Polish norm for men working very hard. Average content of mineral elements in daily food rations given for consumption was as follows: magnesium 496,4±78,6, zinc 20,7±2,90 mg, copper 2,08±0,62 mg and manganese 5,71±0,87 mg. Found mean mineral element content in daily food ration planned for consumption exceeded requirements of Polish norms. Food ration given for consumption to young men doing military service met the requirements of the Polish norms, except copper content.
REFERENCES
1. Bertrandt J., Kłos A., Rozmysł E. (2001).: Zawartość magnezu w racjach
pokarmowych planowanych w żywieniu żołnierzy polskich pełniących służbę w Misjach Pokojowych poza granicami kraju. Biul. Magnezjol. 6, (3), 206 – 2. Bertrandt J., Kłos A., Stężycka E., Gułaj M., Schlegel-Zawadzka M.(2001).: Copper, zinc and manganese content in daily food rations (DFRs) used for soldiers’ alimentation in 1 selected military unit. Trace Elem. and Electro. 18, 4, 172 – 3. Gawęcki J., Hryniewiecki L. (1998).: Żywienie Człowieka. Podstawy Nauki o Żywieniu, PWN Warszawa. – 4. Kłos A., Bertrandt J., Stężycka E.(1997).: Changes of selected mineral elements supply in diet of young men doing military serwice. Mengen und Spurenelementen 17. Arbeitstagung, Friedrich-Schiller-Universitat Jena. – 5. Kulikowska E., Moniuszko-Jakoniuk J., Maniuk K.(1991).: Rola cynku w procesach fizjologicznych i patologicznych organizmu. Pol. Tyg. Lek. 46,470 – 6. Maniuk K., Moniuszko-Jakoniuk J., Kulikowska E.(1991).: Biodostępność oraz stany chorobowe przy niedoborze miedzi. Pol. Tyg. Lek. 46, 476 – 7. Metodyka oznaczania metali w środkach spożywczych. (1982) Praca zbiorowa PZH Warszawa. – 8. Olejnik D., Krejpcio Z., Śmigiel-Papińska D., Wójciak R., Gawęcki J., Wiśniewska J.(1999).: Zawartość wybranych składników mineralnych (Ca, Mg, Zn, Cu, Fe) w całodziennych racjach pokarmowych młodzieży starszej: porównanie wyników analitycznych i obliczeniowych. Roczn. PZH, 4,50, 361 – 9. Program obliczeniowy FOOD 2 (1998). IŻŻ Warszawa. – 10. Singh A., Day B.A., DeBolt J.E.(1989).: Magnesium, zinc and copper status of US Navy SEAL trainers. Am.J. Clin. Nutr. 49, 695.
11. Schlegel-Zawadzka M., Przysławski J., Walkowiak J., Bertrandt J., Kłos A., Piórecka B., Rozmysł E.(2002).: Zinc and copper intake by Polish healthy population. Macro and Trace Elements. 21 Workshop, Jena, 1038 – 12. Ziemlański Ś., Budzyńska-Topolowska J., Panczenko-Kresowska B., Wartanowicz M.(1995).: Normy żywienia dla ludności w Polsce. Nowa Medycyna 2, 5.

173
Investigations on the exchange from anorganic manganese and zinc compounds by amino acid-manganese and amino acid-zinc chelates in dairy cows Dunkel, S.1, Kluge, H.1, Spilke, J.2, Eder, K.1
1Institut für Ernährungswissenschaften und 2Arbeitsgruppe Biometrie und Agrarinformatik, Landwirtschaftliche Fakultät, Martin-Luther-Universität Halle-Wittenberg zurückgezogen

174
Kaliumverzehr, Kaliumbilanz und Kaliumbedarf Erwachsener Anke, M., Bergmann, K., Lösch, E., Müller, R.1 Institut für Ernährung und Umwelt der Friedrich–Schiller–Universität, 07743 Jena 1 Gesellschaft für Ökologie und Umweltchemie mbH, 99091 Erfurt, Germany Einleitung Der prähistorische Mensch, welcher sich vor 3,5 Millionen Jahren zu entwickeln begann, leb-te als Jäger und Sammler. Die von ihm verzehrten Früchte, Knollen, Wurzeln, Nüsse, Körner und Samen lieferten ihm wenig Natrium aber viel Kalium. Im Laufe der Evolution passte sich der Mensch dem reichlichen Kaliumkonsum an. Die Nahrung des historischen Menschen, der ab 10000 vor Christi in Erscheinung trat, ist wesentlich kaliumärmer und natriumreicher und wird in Zusammenhang mit verschiedenen Krankheiten (z.B. Schlaganfall) gebracht, ohne dass die Gesetzmäßigkeiten des Kaliumverzehrs in Abhängigkeit vom Geschlecht, Alter, Körpergewicht, von Leistung, Lebensraum und der Ernährungsform systematisch untersucht sind. Material und Methoden Der Kaliumgehalt wurde nach trockener Veraschung bei 450 °C flammenphotometrisch bei einer Wellenlänge von 763 nm mittels Flapho 4 (Carl Zeiss, Jena) ermittelt. Die Prüfung der Richtigkeit des Kaliumgehaltes erfolgte mittels der Referenzmaterialien GB WO 7602 (Bush branches and leaves), ARC/Cl (Total diet reference material) und APS 1075 (Trace metals in drinking water). Wiederholte Messungen des Kaliumgehaltes zeigten Abweichungen von ± 5%. Der Kaliumverzehr wurde mittels der Duplikatmethode bei insgesamt 20 Testpopulatio-nen Deutschlands und Mexikos über 7 aufeinanderfolgende Tage bei mindestens 7 Frauen und 7 Männern im Alter von 20 bis 69 Jahren untersucht. Die Bilanzstudien erfolgten bei 5 Kollektiven. Ergebnisse 1. Kalium in der Nahrungskette Trotz der Kaliumdüngung landwirtschaftlicher Nutzflächen variiert die geologische Herkunft des Standortes den Kaliumgehalt der Kulturpflanzen (Roggen in der Blüte, Weizen im Schos-sen, Ackerrotklee in der Knospe, Wiesenrotklee in der Blüte) signifikant um etwa 25%. Ver-witterungsböden des Rotliegenden erzeugen in Europa die kaliumreichste, Geschiebelehm, diluviale Sande, Muschelkalkverwitterungsböden und alluviale Auenböden die kaliumärmste Vegetation. Mit zunehmendem Pflanzenalter nimmt der Kaliumgehalt der Flora von Ende April bis Mitte Juni signifikant um 20 bis 40 % ab. Einkeimblättrige Arten speichern im all-gemeinen weniger Kalium als zweikeimblättrige. Der Kaliumtransfer von der Flora zur Fauna erfolgt problemlos. Weichtiere, Insekten und Wirbeltiere enthalten art- und nahrungsspezi-fisch zwischen 8 bis 12 g K/kg Trockenmasse (TM).

175
Der Kaliumgehalt pflanzlicher Lebensmittel (Tab. 1) schwankt im Mittel der verschiedenen Lebensmittelgruppen zwischen 0,06 g/kg TM im Zucker und fast 50 g/kg TM im Gemüse. Arm an Kalium sind alle aus Getreide hergestellten Mehle, Nährmittel und Backwaren. Früchte enthalten zwischen < 10 und 25 g K/kg TM. Tomaten sind mit etwa 50 g K/kg TM wesentlich kaliumreicher. Tabelle 1: Kaliumgehalt der Lebensmittel und Getränke (g/kg TM, mg/l)
Pflanzliche Lebensmittel (n 1288)
Tierische Lebensmittel (n 510)
Getränke (n 364)
Zucker 0,06 Käse 3,3 Trinkwasser 12 Nährmittel 1,7 Wurst 5,6 Weinbrand 12 Keks, Zwieback 2,5 Eier 6,0 Limonade 40 Brot, Brötchen 4,3 Quark 6,2 Bier 550 Früchte 16 Formulas 8,2 Eierlikör 630 Gewürze 21 Fisch 11 Weißwein 815 Küchenkräuter 40 Fleisch 12 Rotwein 900 Gemüse 46 Milch 20 Fruchtsaft 1260 n = Anzahl Tierische Lebensmittel speichern mit Ausnahme der Milch zwischen 3 g/kg TM im Käse und 11 bzw. 12 g/kg in Fleisch und Fisch und liefern damit wesentlich weniger Kalium als Früch-te, Gewürze, Küchenkräuter und Gemüse. Milch akkumuliert in der Trockenmasse mit 20 g/kg mehr Kalium. Bei der Käse- und Quarkbereitung geht die Majorität des Kaliums über die Molke verloren. Der Kaliumgehalt der Getränke schwankt zwischen 12 mg/l im Trinkwasser und 800 bis 1300 mg/l in Weiß- bzw. Rotwein und Fruchtsäften. Der Kaliumgehalt des Mineralwassers kann höher als der des Trinkwassers sein, ohne dass gesundheitliche Probleme beim Menschen auftreten. In Deutschland ist der Kaliumgehalt im Trinkwasser auf 12 mg/l und im Mineral-wasser auf 50 mg/l begrenzt. 2. Kaliumverzehr über verschiedene Lebensmittelgruppen Die höchsten Kaliummengen speichert das Gemüse. Pilze, grüne Erbsen und geschälte Kar-toffeln liefern dem Menschen mit 1 bis 25 g/kg TM relativ wenig Kalium, während Blumen-kohl, Kopfsalat, Kohlrabi, Kürbis, Spinat und Radieschen im Mittel 75 bis 100 g K/kg TM enthalten (Tab. 2). Pflanzliche Lebensmittel liefern erwachsenen Mischköstlern etwa 60 % des konsumierten Kaliums (Tab. 3). Hauptlieferanten sind mit 18 bzw.16 % Kartoffeln und Backwaren. Es fol-gen Gemüse und Früchte mit 14 bzw. 13 %. Die Frauen verzehren signifikant mehr von bei-den Lebensmittelgruppen als die Männer. Über tierische Lebensmittel nehmen Mischköstler etwa 30 % des verzehrten Kaliums auf. Die Getränke liefern 6 % (Frauen) bzw. 10 % (Män-ner) des konsumierten Kaliums.

176
Tabelle 2: Der Kaliumgehalt verschiedener Gemüsearten
Art, Jahr (n) TM mg/100 g FM g/kg TM % x x s
Mischpilze (6) 6,0 8 1,3 0,5 Erbsen, grün (15) 21,8 249 11,4 2,6 Champignon (6) 5,2 101 19,4 5,3
Zwiebeln (26) 12,0 304 25,2 8,2 Kartoffeln, geschält (26) 18,0 468 26,0 5,7
Weißkraut (1988) (9) 9,8 262 26,7 5,1 Sauerkraut (15) 7,8 225 28,9 8,5
Kartoffelschalen (20) 20,0 584 29,2 7,2 Rotkraut (15) 9,2 274 29,8 12,3
Kartoffeln mit Schale (15) 18,3 553 30,2 4,5 Buschbohnen (17) 9,7 293 30,2 9,7
Möhren (48) 7,0 251 35,9 12,2 Sauerkraut im Glas (9) 9,7 436 45,0 21,3
Spargel (12) 4,6 215 46,8 9,8 Buschbohnen im Glas (15) 6,7 360 53,7 36,9
Weißkraut (1992) (6) 8,0 529 66,1 25,3 Blumenkohl (6) 8,0 6,3 75,4 15,0
Kopfsalat (38) 7,3 571 78,2 13,1 Kohlrabi (31) 9,0 726 80,7 24,5
Gurken (43) 5,2 420 80,8 13,2 Spinat (5) 8,4 689 82,0 20,0
Radieschen (82) 5,6 563 100,6 18,8 Milch, Käse und Quark sind mit 13 (Frauen) bzw. 10 % (Männer) an der Kaliumaufnahme beteiligt. Wurst liefert den Mischköstlern 11 % des konsumierten Kaliums, den Mischköstle-rinnen 6,6 %; Bier und Fruchtsäfte bringen den Männern 6,6 bzw. 2,5 % des aufgenommenen Kaliums, den Frauen 0,6 bzw. 4,3 %. Kaffee, Tee, Cola und Limonade tragen mit insgesamt 0,4 % nur unbedeutend zur Kaliumaufnahme bei.
Tabelle 3: Der Anteil pflanzlicher und tierischer Lebensmittel sowie von Getränken an der Kaliumaufnahme erwachsener Mischköstler in Prozent des Kalium-konsums.
Art der Lebensmittel Frauen Männer x Pflanzliche Lebensmittel 65 58 62 Tierische Lebensmittel 29 32 30 Getränke 6 10 8 3. Der Kaliumverzehr Erwachsener Im Mittel nehmen Männer 24 % mehr Kalium als Frauen auf (Tab. 4). Ihr umfangreicher Ka-liumverzehr resultiert aus ihrem um den gleichen Prozentsatz größeren Trockenmassekonsum.

177
Tabelle 4: Die Kaliumaufnahme erwachsener deutscher und mexikanischer Mischköstler und Ovolaktovegetarier in Abhängigkeit von Geschlecht und Zeit (mg/Tag)
Frauen Männer Art der Kost Land Jahr (n;n) s 1) x 2) x s Fp4);p 5) %3) Misch- D* 1988 (196;196) 788 2475 3082 1052 125 kost D 1992 (294;294) 1100 2626 2949 1184 112 (Mk) D 1996 (217;217) 872 2130 2709 1008
< 0,001
127 M** 1996 (98;98) 777 2335 2596 1173 < 0,001 111 Vegetarier(V) (70;70) 900 3195 4577 2304 < 0,001 143
D 1988;1996 86 88 D : M 1996 110 96
%
Mk :V 1996 150 169
-
D* = Deutschland, M** = Mexiko, 1) s = Standardabweichung, 2) x = Arithmetisches Mittel, 3) Frauen = 100 %, Männer= x %, 4)Fp = Signifikanzniveau bei einfaktorieller oder einfach mehrfaktorieller Varianzanalyse, 5) p = Signifikanzniveau beim t-test nach Student. Der Kaliumkonsum deutscher Mischköstler verminderte sich von 1988 bis 1996 signifikant um > 10 % und betrug Ende des vergangenen Jahrhunderts 2,1 bzw. 2,7 g/Tag. Mexikanische Frauen und Männer aßen im Mittel etwa die gleichen Kaliummengen wie deutsche Misch-köstler. Ovolaktovegetarier verzehren etwa 50 bis 70 % mehr Kalium als Mischköstler. Das Alter beeinflusste den Kaliumkonsum der Mischköstler nicht. Auch die Jahreszeit nahm kei-nen Einfluss auf den Kaliumverzehr, wohl aber das Körpergewicht. Gewichtige Mischköstle-rinnen und Mischköstler verzehrten 6 bzw. 15 % mehr Kalium als Normalgewichtige. Ein guter Maßstab für den Kaliumverzehr ist auch der Kaliumgehalt der verzehrten Trocken-masse (Tab. 5), da er den variierenden Einfluss eines unterschiedlichen Trockenmassever-zehrs ausschließt und gleichzeitig auftretende geschlechtsspezifische Bevorzugungen von Lebensmittelgruppen anzeigt. Mischköstlerinnen und Mischköstler verzehren eine Trocken-masse mit dem gleichen Kaliumgehalt (Tab. 5). Tabelle 5: Die Kaliumkonzentration der verzehrten Trockenmasse erwachsener deutscher und
mexikanischer Mischköstler und Ovolaktovegetarier in Abhängigkeit von Ge-schlecht und Kostform (mg/kg TM)
Frauen Männer Art der Kost Land Jahr (n;n) s x) x s Fp;p % Misch- D* 1988 (196;196) 1881 8333 8014 2197 96 kost D 1992 (294;294) 2133 8346 7741 2291 93 (Mk D 1996 (217;217) 2309 7330 7575 2015
< 0,05
103 M** 1996 (98;98) 1730 7843 7600 2512 > 0,05 97 Vegetarier(V) (70;70) 2570 8459 9956 4523 < 0,05 118
D 1988;1996 88 95 D : M 1996 107 100
%
Mk :V 1996 115 131
-
Die Kaliumkonzentration der verzehrten Trockenmasse nahm von 1988 bis 1996 gleicherma-ßen wie der tägliche Kaliumverzehr ab. Die Kaliumkonzentration der von deutschen und me-xikanischen Mischköstlern verzehrten Trockenmasse unterschied sich nicht. Mischköstler und

178
Ovolaktovegetarier nehmen eine im Kaliumgehalt signifikant unterschiedliche Trockenmasse auf (Tab. 5). Der Lebensraum beeinflusste den Kaliumverzehr hochsignifikant (Tab. 6), während die Ge-schlechtsunterschiede im Kaliumverzehr von Frau und Mann bei Bezug auf das Körperge-wicht verschwinden. Der unterschiedliche Kaliumverzehr je Tag resultiert demnach aus dem verschiedenen Körpergewicht von Frau und Mann und der davon abzuleitenden Tockenmas-seaufnahme. Der signifikante Einfluss des Lebensraumes auf Tabelle 6: Der Kaliumverzehr erwachsener Mischköstler Deutschlands in Abhängigkeit vom
Lebensraum und Geschlecht in mg/kg Körpergewicht Frauen Männer Fp % 1) Lebensraum, Jahr
s x x s Freiberg 1992 16 54 42 15 78 Bad Langensalza 1992 14 43 44 14 102 Jena1996 11 43 44 11 102 Chemnitz 1992 27 44 43 21 98 Vetschau 1988 14 47 39 16 83 Wusterhausen 1988 12 31 52 19 168 Jena 1988 12 38 41 12
108 Bad Liebenstein 1992 17 39 35 10 > 0,05 90 Bad Langensalza 1988 12 37 36 12 98 Greifswald 1992 15 40 30 12 75 Wusterhausen 1992 13 33 31 8,5 94 Ronneburg 1996 12 30 32 10 107 Rositz 1996 11 26 31 9,2 119 Steudnitz 1996 12 26 26 14
100 Fp < 0,001 %²) 48 62 -
1) Frauen = 100%, Männer = x %, ²) Freiberg = 100% Steudnitz = x % den Kaliumverzehr ist bei Bezug auf das Körpergewicht besonders deutlich. Frauen und Männer aus Freiberg verzehrten je kg Körpermasse die doppelte Kaliummenge wie die aus Steudnitz, bei Jena und Rositz in Thüringen. Eine eindeutige Erklärung für den signifikanten Einfluss des Lebensraumes, der geringfügig durch die Zeit variiert wird, kann nicht gegeben werden. 4. Kaliumverzehr, Kaliumausscheidung, scheinbare Kaliumabsorption und Kaliumbi-
lanz Erwachsener Mischköstler scheiden im Mittel 15 %, Ovolaktovegetarier > 20 % des verzehrten Kaliums fäkal und 85 % bzw. > 80 % renal aus (Tab. 7). Stillende Mütter exkretieren 10 % des ver-zehrten Kaliums fäkal und 76 % renal. Sie sekretieren im Mittel 14 % des aufgenommenen Kaliums in die Milch.

179
Die scheinbare Absorptionsrate des Kaliums betrug bei den Mischköstlerinnen und Misch-köstlern 85 %, bei Stillenden erreichte sie 88 %, Vegetarier besaßen nur eine scheinbare Ab-sorptionsrate von 80 %. Tabelle 7: Kaliumverzehr, Kaliumausscheidung, scheinbare Kaliumabsorption und Kaliumbi-
lanz erwachsener Mischköstler und Ovolaktovegetarier Parameter Frauen Männer Mischköstler Vegetarier Mischköstler VegetarierAufnahme mg/Tag 2130 3195 2709 4577
Kot mg/ Tag 370 677 456 938 Urin mg/ Tag 2039 2167 2501 3426 Kot % 15 24 15 21
Ex- kretion
Urin % 85 76 85 79 Scheinbare Absorptionsrate, % 83 79 83 80
mg/ Tag +91 +351 -248 213 Bilanz % +4,3 +11 -9,2 +4,7
Die Kaliumbilanzen der Mischköstler und Ovolaktovegetarier waren ausgeglichen. Die Kali-umbilanz der Stillenden war negativ (-20 %). Auch bei laktierenden Tieren ist die Kaliumbilanz regelmäßig. Kalium wird in allen Geweben von Tier und Mensch unabhängig von Alter und Geschlecht gespeichert (Tabelle 8). Der Kaliumgehalt des Skelettes ist im Vergleich zu anderen Körper-teilen niedrig, der der Leber entspricht den Körpermittelwerten, der der Nieren ist vergleichs-weise hoch. Tabelle 8: Der Kaliumgehalt von Rippe, Leber und Nieren des Menschen in Abhängigkeit
von Alter und Geschlecht (g/kg TM) (n 188; 191; 2002) Rippe Leber Nieren Alter in Jahren Frauen Männer Frauen Männer Frauen Männer 0 – 1 Jahr 2,6 3,4 11 11 22 23 1 – 10 Jahre 1,9 3,1 11 11 22 25 11 – 20 Jahre 2,3 2,3 12 10 26 29 21 – 30 Jahre 2,4 2,1 9,1 9,5 28 27 31 – 40 Jahre 2,1 1,9 10 8,6 27 26 41 – 50 Jahre 2,0 2,7 9,7 9,6 29 29 51 – 60 Jahre 2,9 2,3 11 9,7 25 27 61 – 70 Jahre 2,7 2,7 10 8,4 24 25 71 – 80 Jahre 2,7 2,6 9,1 9,2 24 25 81 – 90 Jahre 3,1 2,1 9,8 10 22 22 Mittel 2,5 2,6 10 9,7 25 26

180
5. Der Kaliumverzehr des Menschen nach der Duplikat- und Basketmethode Die Kalkulation des Kaliumverzehrs anhand von Verzehrsprotokollen und Tabellenwerten des Kaliumgehaltes der Lebensmittel und Getränke überschätzte 1996 den Kaliumkonsum um nahezu 50 % (Tab. 9). Der Kaliumverzehr des Menschen sollte nach der Marktkorb- oder Basketmethode nicht mehr geschätzt, sondern mit der Duplikatmethode über 7 aufeinanderfolgende Tage anhand der Tagesduplikate bestimmt werden. Tabelle 9: Der Kaliumverzehr erwachsener Mischköstler nach der Duplikat- und Basket-
methode (mg/Tag und Prozent) Element Frauen mg/Tag Männer mg/Tag %1) Duplikat-
methode Basket- methode
Duplikat-methode
Basket-methode
Frauen Männer
Kalium 2130 3260 2709 3917 153 145 %1) = Duplikatmethode = 100 %, Basketmethode = x % 6. Der Kaliumbedarf Erwachsener Der normative Kaliumbedarf Erwachsener beträgt etwa 20 mg/kg Körpergewicht oder < 1200 bis 1500 mg/Tag für Frauen (65 kg Körpergewicht) und < 1500 bis 1800 mg/Tag für Männer (75 kg Körpergewicht). Die Kaliumbilanz ist bei dieser Kaliumaufnahme ausgeglichen. Etwa 10 % der Frauen und Männer versorgen sich nur marginal mit Kalium (Abb. 1). Sie sollten ihre Kaliumaufnahme verbessern. Die Deutsche Gesellschaft für Ernährung empfiehlt Er-wachsenen den Verzehr von 2 g K/Tag.
Abbildung 1: Der Kaliumverzehr erwachsener Mischköstlerinnen Deutsch-
lands (Wochenmittel)
05
101520
0-300
300-6
00
600-9
00
900-1
200
1200
-1500
1500
-1800
1800
-2100
2100
-2400
2400
-2700
2700
-3000
3000
-3300
3300
-3600
3600
-3900
3900
-4200
4200
-4500
Kaliumverzehr (mg/Tag)
%

181
Summary On an average, men took in 24 % more potassium than women. Their increased consumption of potassium corresponds with their more extensive dry matter intake. The potassium intake of people with mixed diet significantly decreased from 1988 to the end of the century by about 13 %. Ovo-lacto-vegetarians ate 50 to 90 % more potassium than people with mixed diet; Mexicans eat the same amount of potassium as Germans. The age of the probands did not influence the potassium consumption. With increasing body weight, the potassium con-sumption increased by about 6 to 15 %. Season does not influence the potassium intake. The region varies the potassium intake by about 40 %. The potassium consumption of women varies between 26 and 54 and that of men between 26 and 52 mg/kg body weight. People with mixed diet excreted 15 % of the potassium faecally and 85 % renally. Female and male ovo-lacto-vegetarians, respectively, secreted 24 and 22 % of the potassium faecally, and 76 and 78 % renally. Nursing mothers estimated 10, 76 and 14 % of potassium through fae-ces, urine and milk, respectively. The apparent absorption rate of potassium for both sexes and people with mixed diet amounted to 83 %, for ovo-lacto-vegetarians to 79 % and for nursing mothers to 88 %. The normative potassium requirement of adults amounts to 20 mg/kg body weight or >1200 to 1500 mg/day in women (65 kg body weight) and 1500 to 1800 mg/day in men (75 kg body weight). The German Society of Nutrition (DGE) recommended that adults should consume 2.0 g/day of potassium. The calculation of the potassium intake by basket method overestimates the potassium intake by about 50 %. References Anke, M. (2004) Potassium. In: Merian, E., Anke, M., Ihnat, M., Stoeppler, M. (eds): Ele-
ments and their Compounds in the Environment. Occurrence, Analysis and Biological Relevance. 2nd Completedly Revised and Enlarged Edition, 2nd Volume, Chapter 1.3, Wiley-VCH Verlag GmbH & Co. KgaA.

182
Rare earth elements as possible alternative growth promoters Wehr, U.A., He, M.L., Rambeck, W.A. Institute for Animal Physiology, Physiological Chemistry and Animal Nutrition, University of Munich Rare Earth Elements (REE) , which include the 15 elements of lanthanoides and the elements Sc and Y have been successfully used in the Chinese agriculture for about 30 years – as a growth promoter for farm animals like dairy cows, pigs and laying hens as well as a fertilizer for plants. To investigate this performance enhancing effect under European conditions, feeding experiments with pigs and rats were carried out. The pig feeding study was performed with 14 pigs of 17.3 kg body weight. One group was fed 300 mg REE mixture (chlorides of a mixture of cerium, lanthanum and praseodymium) per kg feed, the other group was given a control diet. Eight weeks of ad libitum feeding (throughout the growing period) were followed by four weeks (fattening period) of restrictive feeding. Body weight gain (BWG), feed consumption and feed conversion rate (FCR) were determined. The feeding experiment resulted in up to 11% better FCR and a 19% improved BWG for the group fed with REE supplements. The effect was significant throughout the growing period. The health of the animals was not influenced by supplementation with REE. In a rat feeding experiment, fifty male Wistar rats at four weeks of age, were given mixtures of Lanthanium and Cer chlorides at concentrations up to 150 mg/kg diet. After 18 days body weight gain increased by 9% and FCR improved by 11% as compared to the control. Though it is assumed that REE are only absorbed to a very small degree in the intestine, REE had clear effects on different blood serum parameters. The results suggest that supplementation of REE improves growth performance as described in the Chinese and some very recent nonchinese literature. The accumulation rate of LA and Ce in muscle, liver and kidney were measured by Neutron Activating Analysis (NAA) in the nuclear power plant of the Technical University of Munich in Garching. Accumulation of REE was very low, in the muscle it was close to the limit of detection. Further investigations are necessary to learn more about the effects and doses of REE. References: He, M.L., Ranz, D. and Rambeck W.A. (2001) Study on the performance enhancing
effect of rare earth elements in growing and fattening pigs – J. Anim. Nutr., 85, 263-270
He, M.L. and Rambeck W.A. (2000) Rare Earth Elements – A new generation of growth promoters for pig? – Arch. Anim. Nutr., 53, 323-334.

183
Antibiotic residues from pig production in carcass and slurry Freitag, M.***, Schwarze, D.*, Vockel, A.*/**, Mehlich, A.**, Grote, M.* *University of Paderborn, Faculty of Science, Department of Chemistry, Warburger Str. 100, 33098 Paderborn, Germany **Staatliches Veterinäruntersuchungsamt (SVUA), Westerfeldstr. 1, 32758 Detmold ***University of Applied Sciences Süd-westfalen, Department of Agriculture, Lübecker Ring 2, 59494 Soest
Low antibiotic concentrations, e.g. as excreted after antibiotic medication of humans
and animals may cause microbial resistance and at present increasing populations of
multiple resistant bacteria are observed (Cohen, 1992). Intensive antibiotic use in
human medicine is considered the main source for resistant microbes (Kayser, 1993)
but farm animals seem to be a reservoir for corresponding genes. Little is known
about antibiotic stability in slurry and its effects on soil, water and plants when ap-
plied with liquid manure (for detail see Thiele-Bruhn, 2003).
In contrast to sulphonamides (Boxall et al., 2002) tetracyclines bind to soil compart-
ments and thus accumulate after long term fertilisation with pig slurry (Hamscher et
al., 2000). Tetracyclines are highly persistent in soil but transfer to groundwater has
not been observed (Hamscher et al., 2001). After slurry application tetracycline resis-
tant bacteria increased in soil as well as in ground water but declined again after
cease of manure fertilisation to a level of non slurry fertilized soil within 8 months
(Sengeløv et al., 2002).
To achieve more information on the fate of antibiotics used in animal production an
investigation was carried out to evaluate the transfer of antibiotics and their metabo-
lites to various carcass parts after specific medication and the persistence of antibiot-
ics and their metabolites in slurry during long term storage.
Material and Methods Six male castrated piglets were reared without antibiotic medication1. For the experi-
ment they were individually housed and medicated twice for 10 days at an average
life weight (lw) of 71 kg and 89 kg, respectively. During medication urine and faeces
were sampled daily and afterwards united to slurry. Blood samples were taken at the
beginning and the end of each medication period and plasma and excreta samples
frozen at -30°C until analysis was performed.
1The authors are grateful to the Bundesforschungsanstalt für Landwirtschaft Braunschweig-Völkenrode, Institute of Animal Nutrition, for technical support

184
Application of antibiotics
Chlortetracycline (CTC) (Chlortetracyclin 100, Belapharm, 100 mg / kg lw) and a
combination of sulfadiazine (SD) and trimethoprim (TMP) (Antastmon, Belapharm,
50 mg / kg lw) were orally applied twice daily. To ensure complete uptake antibiotics
were mixed with a small portion of feed and administered at the beginning of each
feeding. Overall uptake of antibiotics was 45.0 and 56.1 g CTC, 112.6 and 161.4 g
SD and 22.5 and 32.3 g TMP for each medication period, respectively.
Sampling and Analysis
Four pigs were slaughtered after a waiting period of 14 days. At slaughter plasma,
liver, kidney, muscle and bone samples were recovered. Slurry was stored in open
plastic barrels and sampled monthly from August to the end of November 2001 and
again in March 2002. Until analysis all samples were frozen at –30°C.
In general, homogenized samples were treated with McIlvain-EDTA-buffer (pH 4) or
dilute HCl (bones). Clean up of the extracts was achieved by solid phase extraction
(Oasis HLB cartridges). The methanolic eluates were analysed for antibiotic residues
by LC-MS/MS (SVUA: Quattro Ultima, Micromass; Univ. Paderborn: LCQ Advantage,
ThermoFinnigan). For detail see Vockel et al. (2003) and Grote et al. (in preparation).
All carcass samples were assessed for their amounts of chlortetracycline (CTC) and
its epimer (e-CTC). In slurry concentrations of CTC and its conversion and degrada-
tion products e-CTC, iso-CTC, e-iso-CTC and anhydro-CTC (a-CTC) as well as TMP,
SD and its metabolite N-4-actety-sulfadiazine (N-4-SD) were determined. Dry matter
and nitrogen content were analysed according to standard procedure (VDLUFA Book
of Methods Vol. II, 11.5.1. and 3.5.2.7).
Results Antibiotic residues in carcass
At the end of the legally required waiting period CTC (sum of CTC and e-CTC) resi-
dues in muscle, liver and kidney were well below MRL levels (tab. 1). However, high
concentrations of CTC were measured in all bone samples.
Antibiotic residues in excreta and slurry
CTC excretion reached peak levels on day 3 to 4 of medication and declined to basal
levels within 11 days after drug application. Dry matter content of slurry varied be-
tween samples because of exposure to environmental weather conditions and diffi-

185
Table 1: Amount of CTC (Σ CTC + e-CTC) in various carcass parts 14 days after medication Carcass Part Animal No
93 94 96 97 mean MRL*Muscle Liver Kidney Plasma Bone
µg/kg µg/kg µg/kg µg/kg mg/kg
4.2 4.2
20.0 3.2
23.9
3.4 7.1
17.0 3.0
27.9
4.06.8
15.64.0
18.5
4.311.626.026.318.7
4.0 7.4
19.79.1
22.3
100 300 600
- -
culty of homogenisation. To exclude the influence of weather conditions antibiotic
concentration was estimated per kg native slurry as well as per kg N.
TMP was only detected in small amounts at the beginning of each storage period
(15.8 mg/kg slurry or 2.5 g/kg N and 8.8 mg/kg slurry or 1.3 g/kg N, respectively).
High amounts of CTC were analysed in slurry of both medication periods (tab. 2) but
declined markedly until the end of the 7 to 8 months storage. Rate of decline differed
between the two sampling periods. While CTC concentration dropped by more than
50 % within 2 months of storage and by 64 % until the end of the 8 months storage
period in the first batch, no decline was observed during the first 4 months and the
overall reduction was only 42 % after 7 months storage in the second batch. Besides
CTC its antibiotic active metabolites e-CTC and a-CTC and the non active iso-CTC
and e-iso-CTC were detected (tab. 2). Concentrations of a-CTC were low but consid-
erable amounts of e-CTC and iso-CTC were analysed in both batches. Rate of e-
CTC decline was less than for CTC (57% and 23% respectively) while amounts of
iso-CTC and e-iso-CTC increased during storage. The weak alkaline milieu of slurry
may favour the formation of iso-CTC and e-iso-CTC during storage resulting in a
change of mass ratio of antibiotically active and non active substances (tab. 3). In
both batches the concentration of CTC and its active metabolites was higher than
that of non active metabolites at the beginning of the storage period while non active
metabolites dominated at the end. High amounts of SD even increased during stor-
age in both batches (tab. 4). Very high N-4-SD concentrations at the beginning of the
sampling period declined after two months.
Discussion
To achieve more information on the potential risk of antibiotic medication to humans
and the environment an experimental study was carried out to evaluate the fate of
antibiotics and their metabolites in pig carcass and animal excreta. Pigs were
*Maximum Residue Level

186
Tab 2. Amounts of CTC and its metabolites in slurry batches of 2 medication periods during long term storage (⎯x, n=2)
Sample mg/kg slurry g/kg N Date No
CTC e-CTC
a-CTC
iso-CTC
e-iso CTC
CTC
e-CTC
a-CTC
iso- CTC
e-iso CTC
02.08. 30.08. 27.09. 31.10. 29.11. 12.03.
1.1 1.2 1.3 1.4 1.5 1.6
53.6 52.9 23.6 28.4 14.9 9.4
29.6 23.1 16.3 17.2 12.1 6.2
4.3 2.6 2.0 1.5 1.4 1.2
19.2 28.3 28.9 26.1 20.8 15.3
7.9 20.1 18.8 21.3 16.4 11.0
8.6 7.1 2.9 3.9 2.0 3.1
4.7 3.1 2.0 2.4 1.7 2.1
0.7 0.4 0.3 0.2 0.2 0.4
3.1 3.8 3.6 3.6 2.9 5.1
1.3 2.7 2.3 2.9 2.3 3.6
30.08. 27.09. 31.10. 29.11. 12.03.
2.1 2.2 2.3 2.4 2.5
41.2 49.3 43.2 45.9 18.5
25.9 29.2 29.6 26.3 15.3
2.0 1.2 0.8 4.1 2.2
22.9 26.6 30.5 37.7 30.1
10.5 16.4 20.0 29.2 22.1
6.1 7.0 8.2 9.4 3.6
3.9 4.1 5.6 5.4 3.0
0.3 0.2 0.2 0.8 0.4
3.4 3.8 5.8 7.8 5.9
1.6 2.3 3.8 6.0 4.3
Tab3: Amount of antibiotically active CTC (CTC, e-CTC a-CTC) and non active residues of CTC (iso-CTC, e-iso-CTC) and their mass ratio in slurry during storage
first medication period second medication period No mg/kg slurry g/kg N active No mg/kg slurry g/kg N active active non
active active non
active to non active
active non active
active non active
to non active
1.1 1.2 1.3 1.4 1.5 1.6
87.5 78.6 41.9 47.1 28.4 16.8
27.1 48.4 47.7 47.4 37.2 26.3
14.0 10.6 5.2 6.5 3.9 5.6
4.4 6.5 5.9 6.5 5.2 8.7
3.18 1.63 0.88 1.00 0.75 0.64
2.1 2.2 2.3 2.4 2.5
69.1 79.7 73.6 76.3 36.0
33.4 43.0 50.5 66.9 52.2
10.3 11.3 14.0 15.6 7.0
5.0 6.1 9.6 13.8 10.2
2.06 1.85 1.45 1.13 0.69
Tab. 4: Amounts of sulfadiazine (SD) and N-4-SD in slurry during long term storage first medication period second medication period mg/kg slurry g/kg N mg/kg slurry g/kg N No
SD N-4-SD
SD N-4-SDNo
SD N-4-SD SD N-4-SD
1.1 1.2 1.3 1.4 1.5 1.6
198.5 364.0 217.4 257.1 234.9 136.4
303.7 68.7 34.8 22.2 17.4 9.6
31.8 48.9 26.9 35.5 32.1 45.0
48.6 9.2 4.3 3.1 2.4 3.2
2.1 2.2 2.3 2.4 2.5
271.0301.2498.9305.1266.1
288.4 111.1 54.6 38.2 12.5
40.4 42.7 94.3 62.8 52.1
42.3 15.8 10.3 7.9 2.5
medicated twice for 10 days according to standard procedure with chlortetracycline,
trimethoprim and sulfadiazine and slaughtered two weeks later. Faeces and urine
were separately collected from each animal, sampled daily and then united to pig
slurry. Slurry was stored for 8 months (first medication period) and 7 months (second
medication period) respectively and sampled monthly. In carcass and excreta antibi-
otic residues and their metabolites were analysed by LC-MS/MS.

187
Carcass: At the end of the legally required waiting period CTC and its metabolite e-
CTC were still traceable in various carcass parts but were well below MRL levels in
all four slaughtered animals. However, high amounts were analysed in bone samples
(ø 22 mg/kg). Bone structure seems to accumulate CTC. This accumulation might be
reversible and thus contamination of other carcass parts may occur after the end of
medication. CTC releases from bone and bone meal under digestive conditions as
has been shown in vitro and in vivo (Kühne and Körner, 2001). Since tetracyclines
are widely used in veterinary medicine (Winckler and Grafe, 2001), bone splinters in
food and bone meal in feed might be a potential source of consistent release of small
amounts of chlortetracyclines which could lead to increased bacterial resistance.
Slurry: As expected no CTC could be detected in animal excreta before oral medica-
tion. High amounts of CTC were maintained in faeces from day 3 to 4 of treatment
until the end of the medication period, but declined rapidly thereafter. This is consis-
tent with prior findings (Winckler and Grafe, 2001).
In comparison to commercial pig farming (Hamscher et al., 2001) slurry CTC concen-
trations were very high in our study. This was expected since only excreta from medi-
cated animals were collected. Rate of degradation of CTC and e-CTC was low during
the first months of storage in both batches. In the following months a marked
decrease in CTC and e-CTC concentration was observed in slurry collected from first
but not from the second medication period even though both batches were treated
exactly alike. In both batches a marked decrease of CTC content was seen at the
end of the 7 to 8 months storage period. During storage considerable amounts of
CTC were converted to the antimicrobial non active substances iso-CTC and e-iso-
CTC. At the end of the storage period concentrations were about 1.5 times higher
than those of the active substances. Conversion of active to non active substance
was higher in the first slurry batch (tab. 3) and this may account for the faster degra-
dation of the active CTC.
Sulfadiazine content was also high. Obviously the degradation of SD proceeded very
slowly during storage in both batches. Sulphonamides are described as rather stable
(Böhm, 1996) but under certain farm conditions the original amount diminished to 40
to 60% within five weeks of storage (Langhammer et al., 1988). In contrast to SD its
metabolite N-4-SD degraded rapidly in both batches. To gain further information on
the environmental impact of antibiotic residues from pig production soil and plants
sampled after fertilization with the slurry batches are analysed for drug residues.

188
Summary To assess the fate of antibiotics from animal production pigs were medicated with
sulfadiazine (SD), trimethoprim (TMP) and chlortetracycline (CTC) and drug concen-
trations measured (LC-MS/MS) in various carcass parts and in the resulting pig slurry
during long term storage. Two weeks after medication muscle and organ concentra-
tions were below MRL-level but bone concentrations were high (ø 22 mg/kg). In
slurry CTC and its antibiotically active metabolites e-CTC and a-CTC were partly pre-
served until the end of storage and partly converted to the non active metabolites iso-
CTC and e-iso-CTC which prevailed at the end of storage. High amounts of SD were
maintained whereas its main metabolite N4-acetyl-SD decreased after 2 months.
Minute amounts of TMP were only traceable at the beginning.
Acknowledgement: Financial support from the Ministerium für Umwelt- und Naturschutz, Landwirtschaft und Verbraucherschutz des Landes NRW (MUNLV) is gratefully acknowl-edged
References Boxall ABA, Blackwell P, Cavallo R, Kay P, Toll J (2002): The sorption and transport of sul-
fonamide antibiotic in soil systems. Toxicol. Letters 131(1-2),19-28 Cohen ML (1992): Epidemiology of drug resistance: implications for a post antimicrobial era.
Sci. 257, 1050-1055 Grote M, Schwarze D, Vockel A, Mehlich A, Freitag M: Investigation on the fate of antibiotics
used in pig farming in food chain and environment. Fresenius Environmental Bulletin (in preparation)
Hamscher G, Höper H, Nau H (2001): Tetracycline zeigen hohe Persistenz in Güllegedüng-ten Ackerböden. Dt. veterninärmed. Gesellschaft, Arbeitsgebiet Lebensmittelhygiene, Garmisch-Partenkirchen, 25.-28.9.2001
Hamscher G, Sczesny S, Abu-Qare A, Höper H, Nau H (2000): Stoffe mit pharmakologischer Wirkung einschließlich hormonell aktiver Substanzen in der Umwelt: Nachweis von Tetra-cyclinen in güllegedüngten Böden. Dt. tierärztl. Wschr. 107(8), 332-334
Kühne M, Körner U (2001): Bound chlortetracycline residues in bones: release under acid conditions. Food Chemistry 72(1), 41-44
Sengeløv G, Agerso Y, Halling-Sorensen B, Baloda SB, Andersen JS, Jensen LB (2002): Bacterial antibiotic resistance levels in Danish farmland as a result of treatment with pig manure slurry. Environment international 28(7), 587-593
Thiele-Bruhn S (2003) : Pharmaceutical antibiotic compounds in soils – a review. J. Plant Nutr. Soil Sci, 166, 145-167
Vockel A, Wagener H-A, Klemm W, Röwer K, Mehlich A, Grote M (2001): Bestimmung von Tetracyclinrückständen mittels LC-MS/MS in lebensmittelliefernden Schweinen, Lebens-mittelchemie 55, 67 - 68
Winckler C, Grafe A (2001): Use of veterinary drugs in intensive animal production; evidence for peristence of tetracycline in pig slurry. J. soils sed. 1(2), 66-70

189
Influence of Cr-yeast supplementation of hens’ diets on quality of eggs Gralak, M.A., Debski, B., Zalewski, W., Niemiec, J.* Department of Physiological Sciences, Faculty of Veterinary Medicine, * Department of Poultry Science, Faculty of Animal Science, Warsaw Agricultural University, Nowoursynowska 159, 02-776 Warszawa, Poland.
Trivalent chromium (Cr3+) has a beneficial physiological role on account of the
strong tendency to form coordination compounds, complexes, and chelates.
Inorganic chromium compounds display little physiological activity but animals and
humans appear to be capable of synthesizing active chromium compounds
(Oberleas et al. 1999). It was shown by Schwartz and Mertz (1959) that trivalent
chromium, as a part of glucose tolerance factor (GTF), is necessary for optimal
insulin function. Hexavalent chromium has been identified as a carcinogen. Since
trivalent chromium was shown to reduce insulin resistance it could therefore have
wide-ranging impact on normalization of high blood pressure and abnormal blood
lipids and decrease of glucose in the blood (Anderson et al. 1997, Briggs 1999). It
was noticed that obese rats given chromium picolinate had lower plasma cholesterol
level and enhanced insulin sensitivity (Cefalu et al. 2002). Dupont et al. (1999)
studied insulin metabolism in genetically lean and fat chickens, and observed
differences in plasma insulin level, its binding to receptors, and post receptor
signaling.
Saccharomyces cerevisiae use Cr3+ ions to produce a metalloprotein
described as GTF (Zetic et al. 2001). Yeast bioactive Cr compound has been
proposed to be low molecular weight protein consisting of glycine, glutamate,
cysteine and nicotinic acid (Toepfer et al. 1977, Vincent 1994). Studies of Davis et al.
(1997) and Sun et al. (1999) performed on rats showed that Cr active compound is
an oligopeptide called low-molecular weight chromium binding substance (LMWCr)
known also as chromodulin. This tetranuclear molecule (1.48 kDa) isolated from
bovine liver consists of aspartate, glutamate, glycine and cysteine in ratio
2.1:4.5:2.5:2.4. Insulin initiates its metabolic activity through tyrosine kinase, trans-
membrane enzyme which phosphorylates several intracellular substrates. LMWCr
stimulates insulin dependent protein tyrosine kinase, which is a part of insulin
receptor (Davis et al. 1997).
Several studies using different sources and concentrations of chromium were
performed on poultry. Early experiments of Steele and Rosebrough (1981) with

190
chromium chloride given to the young turkeys at the very high level (20 ppm Cr),
demonstrated some improvement in growth rate and feed efficiency. It was shown
that in some cases much lower level of chromium supplementation (0.2 to 0.8 ppm)
may result in higher daily gain (Gonzales et al. 1997, Grela 1997, Ward & Southern
1993). In broilers fed diets supplemented with Cr-picolinate supplementation (0.2
ppm Cr) noticed an increase of protein and a decrease of fat percentage in carcass
(Grela 1997, Ward et al. 1993). Lien et al. (1999) noticed changes of broilers
lipoprotein profile in birds receiving diets enriched with Cr3+ supplementation.
Comparing with broilers only limited number of studies concerning Cr3+
supplementation was performed on laying hens. It was suggested that an increase of
dietary chromium results in a decrease of cholesterol concentration in the egg yolk
(Wojtys and Grela 1999).
The aim of this experiment was to study the effect of chromium enriched yeast
(Cr-yeast) added to laying hens’ diet on quality of eggs.
Material and Methods The experiment was performed on 40 ISA Brown laying hens, 3 months old at
the start of the study. Birds were offered (ad libitum) commercial diet containing 17%
of crude protein and 11.5 MJ metabolic energy in 1 kg. The diet was based (85%) on
maize, barley and extracted soybean meals. Hens were randomly assigned to two
groups, control and experimental one. The experimental group was fed diet
supplemented with 0.5 mg Cr3+ per 1 kg diet. Chromium was added in form of
chromium enriched yeast (Cr-yeast) containing 1 g Cr3+ per 1 kg yeast. Fodder yeast
was added to control diet in respective amount. Hens were fed these diets for two
months, and eggs were collected for last four consecutive days.
Sixty eggs collected during experiment from particular groups underwent
individual standard evaluation of morphological egg quality on EQM equipment (Egg
Quality Microprocessor, ver. 3.2). The following parameters were measured: weights
of egg, yolk and shell, albumen hight, shell thickness and shell index. Moreover from
yolks, fat fraction was extracted for lipid analyses (Washburn and Nix 1974).
Concentration of phospholipids, triglycerides and cholesterol was measured using
thin layer chromatography on Silica gel 60G (Sznajderman and Michajlik 1979).
For statistical evaluation one way analysis of variance and Tukey range test
were used (Statgraphics 6.0). Besides, Student test was used for comparison of the
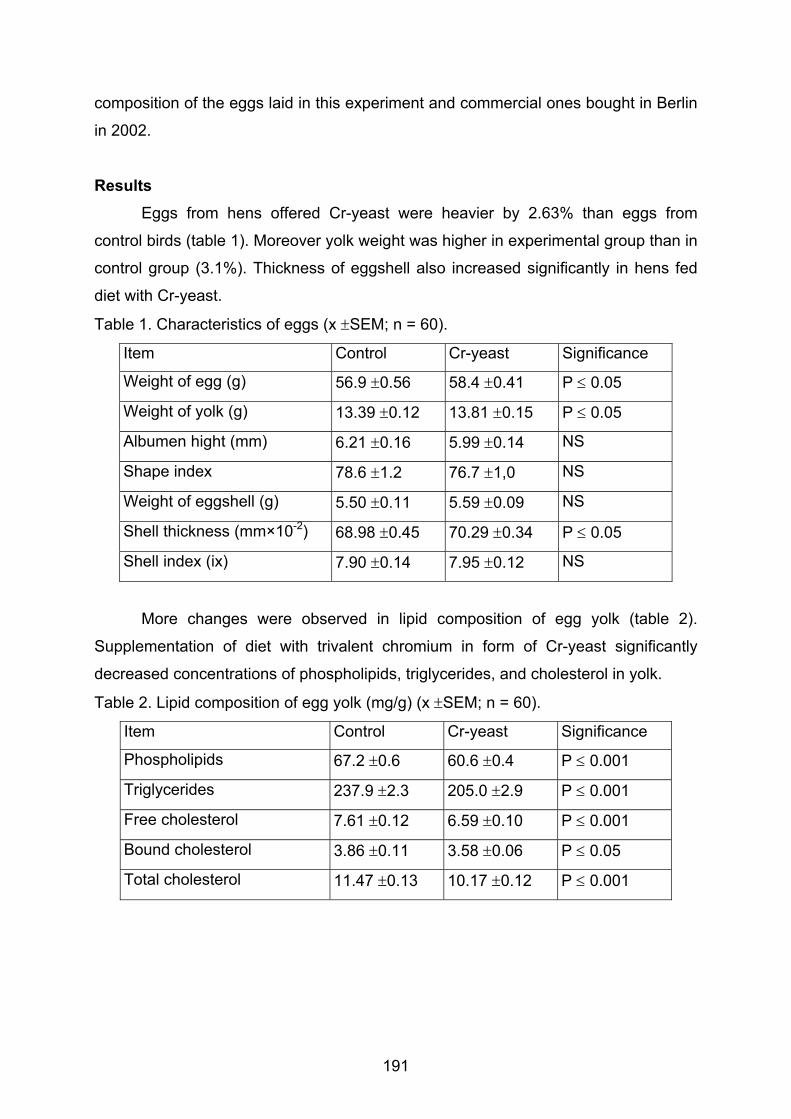
191
composition of the eggs laid in this experiment and commercial ones bought in Berlin
in 2002.
Results
Eggs from hens offered Cr-yeast were heavier by 2.63% than eggs from
control birds (table 1). Moreover yolk weight was higher in experimental group than in
control group (3.1%). Thickness of eggshell also increased significantly in hens fed
diet with Cr-yeast.
Table 1. Characteristics of eggs (x ±SEM; n = 60).
Item Control Cr-yeast Significance
Weight of egg (g) 56.9 ±0.56 58.4 ±0.41 P ≤ 0.05
Weight of yolk (g) 13.39 ±0.12 13.81 ±0.15 P ≤ 0.05
Albumen hight (mm) 6.21 ±0.16 5.99 ±0.14 NS
Shape index 78.6 ±1.2 76.7 ±1,0 NS
Weight of eggshell (g) 5.50 ±0.11 5.59 ±0.09 NS
Shell thickness (mm×10-2) 68.98 ±0.45 70.29 ±0.34 P ≤ 0.05
Shell index (ix) 7.90 ±0.14 7.95 ±0.12 NS
More changes were observed in lipid composition of egg yolk (table 2).
Supplementation of diet with trivalent chromium in form of Cr-yeast significantly
decreased concentrations of phospholipids, triglycerides, and cholesterol in yolk.
Table 2. Lipid composition of egg yolk (mg/g) (x ±SEM; n = 60).
Item Control Cr-yeast Significance
Phospholipids 67.2 ±0.6 60.6 ±0.4 P ≤ 0.001
Triglycerides 237.9 ±2.3 205.0 ±2.9 P ≤ 0.001
Free cholesterol 7.61 ±0.12 6.59 ±0.10 P ≤ 0.001
Bound cholesterol 3.86 ±0.11 3.58 ±0.06 P ≤ 0.05
Total cholesterol 11.47 ±0.13 10.17 ±0.12 P ≤ 0.001

192
Low cholesterol eggs bought in supermarket in Berlin (2002) had very high
yolk phospholipids level, and significantly lower cholesterol concentration (table 3).
Table 3. Comparison of eggs from different sources.
Source of eggs Yolk/egg ratio (%)
Phospholipids in yolk (mg/g)
Total yolk cholesterol (mg/g)
Control group 23.5 ±0.21a 67.2 ±0.6b 11.47 ±0.13b
Cr-yeast group 23.6 ±0.37a 60.6 ±0.4a 10.17 ±0.12a
Commercial eggs (Berlin 2002) 35.9 ±1.3c 61.3 ±6.0a 10.30 ±0.45a
Low cholesterol eggs (Berlin 2002) 33.2 ±1.6b 77,0 ±4.7c 9.76 ±0.52a
Discussion Mean egg weight and shell thickness increased significantly in group
supplemented with Cr, what disagree with results obtained by other authors (Lien et
al. 1996, Uyanik et al. 2002). The other results presented in the table 1 were
consistent with Uyanik et al. (2002).
Generally, nutrients have only a small impact on cholesterol level in yolk
(McNaugton 1978), but some biologically active compounds can reduce it e.g. α-
ketoisocaproic acid (Beyer and Jensen 1992). The dietary fat and cholesterol did not
significantly influence the cholesterol synthesis in ovaries (Garcia and Alba 1998,
Naber 1983). In presented trial, higher consumption of chromium significantly
decreased levels of phospholipids, triglycerides and cholesterol fractions in yolk,
consistent with Uyanik et al. (2002). Grela et al. (1998) in similar experiment
performed on hens offered Cr-yeast supplementation also stated lower yolk
cholesterol level, though insignificant. The lower level of cholesterol as well as other
lipids in egg yolk may be very desired from consumers’ point of view. Uyanik et al.
(2002) stated much higher total cholesterol level than it is presented in tables 2 and
3. They reported that total cholesterol concentration in yolk varied from 12.4 to 18.1
mg/g in control group, and from 12.9 to 16.9 mg/g in chromium supplemented group
(4.1 mg Cr/kg as CrCl3*6H2O), but they performed study on different strain of laying
hens – Hyline White 77. It is possible that there are genetic differences in cholesterol
metabolism between strains. Other authors concluded that genetic differences in rats
can have account for the differential effects of chromium supplementation (Hasten et
al. 1997). Yolk cholesterol content also increases with the age of laying hens (Uyanik

193
et al. 2002). It seems that besides chromium supplementation, strain and age of hens
can also result in different composition of eggs.
Physiologic function of Cr3+ is amplification of insulin action probably by
enhancing its binding to target cell receptors as well as improving post-receptor
action of this hormone. It was shown that Cr addition to the poultry causes lowering
of total fat content in the broilers carcass (Gonzales et al. 1997, Ward et al. 1993)
and in muscles (Debski et al. 2001). In the last cited experiment performed on
broilers supplemented with this essential micronutrient it was stated that birds
receiving chromium had also significantly lower level of total cholesterol and glycogen
in muscles (Debski and Zalewski 1997, Debski et al. 2001). However it was also
noticed that Cr-yeast increased total cholesterol in liver what may suggest increased
cholesterol synthesis in liver. The addition of chromium to low chromium diets
suppresses serum cholesterol levels in rats (Oberleas et al. 1999). However reduced
plasma cholesterol in hens is not always followed by reduction of egg cholesterol
content (Beyer and Jensen 1993). Lower cholesterol level in yolk (this trial) and in
muscles (Debski et al. 2001, Grela 1997) can indicate that chromium decreases
efficiency of cholesterol transportation system from liver to the tissues. There are
three possible ways of chromium action: it decreases efficiency of cholesterol
transportation from liver to circulatory system, and/or strengthens binding of
cholesterol in liver, and/or decreases efficiency of cholesterol transportation from
blood to eggs and other tissues.
All observed in this experiment differences between control animals and these
given Cr supplementation can be caused by increased efficiency of insulin action.
Summary This experiment was performed on 40 ISA Brown laying hens, 3 months old at the start. Hens were fed these diets for two months, and eggs were collected for last four consecutive days. Eggs from hens offered Cr-yeast (1 g Cr3+ per 1 kg yeast) were heavier by 2.63% than eggs from control birds. Moreover yolk weight was higher in experimental group than in control group (3.1%). Thickness of eggshell also increased significantly in hens fed diet with Cr-yeast. More changes were observed in lipid composition of egg yolk. Supplementation of the diet with 0.5 mg Cr3+ per 1 kg diet in form of Cr-yeast significantly decreased concentrations of phospholipids, triglycerides, and cholesterol in yolk. The lower level of cholesterol as well as other lipids in egg yolk may be very much desired from consumers’ point of view.
194
References Anderson RA, Cheng N, Bryden NA, Polansky MM, Cheng N, Chi J, Feng J
(1997): Elevated intakes of supplemental chromium improve glucose and insulin variables in individuals with type 2 diabetes. Diabetes 46, 1786-1791
Beyer RS, Jensen LS (1992) Cholesterol concentretion of egg yolk and blood plasma and performance of laying hens as influenced by dietary alpha-ketoisocaproic acid. Poult Sci 71, 120-127
Beyer RS, Jensen LS (1993) Reduced plasma cholesterol and lipoprotein in laying hens without concomitant reduction of egg cholesterol in response to dietary sorbose. Poult Sci 72, 88-97
Briggs S (1999) Chromium steels the body against diabetes. Nutrition Science News 4 (2), 68-69
Cefalu WT, Wang ZQ, Zhang XH, Baldor LC, Russell JC (2002): Oral chromium picolonate improves carbohydrate and lipid metabolism and enhances skeletal muscle Glut-4 translocation in obese, hyperinsulinemic (JCR-LA Corpulent) rats. J Nutr 132, 1107-1114
Davis CM, Royer AC, Vincent JB (1997): Synthetic multinuclear chromium assembly activates insulin receptor kinase activity: functional model for low-molecular-weight chromium-binding substance. Inorg Chem 36, 5316-20
Debski B, Zalewski W (1997): The influence of chromium-yeast supplementation of broilers on carcass characteristics and cholesterol content. Mengen und Spurelemente. 17th Arbeitstagung, Jena, 832-836
Debski B, Zalewski W, Gralak M (2001): Effect of different dietary chromium sources on broilers glycogen and glucose level. In: Anke, M; Muller, R; Schafer, U (Eds): Mineralstoffe: Mengen-, Spuren- und Ultraspurenelemente in der Pravention; Diagnostik, Ernahrung, Stoffwechsel und Pravention, Intoxikation und Pravention. Wissenschaftliche Verlagsgesellschaft mbH, Stuttgart, 302–308
Dupont J, Derouet M, Simon J, Taouis M (1999): Corticosterone alters insulin signaling in chicken muscle and liver at different steps. J Endocrinol 162, 67-76
Garcia C, Alba C (1998): Lipid composition of eggs from hens fed with marine protein and fat products. Arch Latinoam Nutr 48, 71-76
Gonzales RJ, Jimenez J, Hernandez I, Espinoza J (1997): Effect of chromium picolinate on performance and carcass components of broiler chickens. J Anim Sci 75 (suppl 1), 113
Grela ER, Pisarski RK, Lipiec A, Wojtyś A (1998): The effect of chromium yeast in hens diet on the cholesterol content and fatty acid composition in eggs. Symp. Current problems of breeding, health and production of Poultry, Ceske Budejovice, 50-51
Hasten DL, Hegsted M, Keenan MJ, Morris GS (1997) Dosage effects of chromium picolinate on growth and bodz composition in the rat. Nutr Res 17, 1175-1186
Lien TF, Chen S, Shiau S, Froman D, Hu CY (1996) Chromium picolinate reduces laying hen serum and egg yolk cholesterol. Proffess Anim Scientist 16, 77-80
Lien TF, Horng YM, Yang KH (1999): Performance, serum characteristics, carcase trails and lipid metabolism of broilers as affected by supplement of chromium picolinate. Br Poult Sci 40, 357-363
McNaugton JL (1978): Effect of dietary fiber on egg yolk, liver, and plasma cholesterol concentrations of the laying hen. J Nutr 108, 1842-1848

195
Naber EC (1983): Nutrient and drug effects on cholesterol metabolism in the laying hen. Fed Proc 15, 2486-2493
Oberleas D, Harland BF, Bobilya DJ (1999): Minerale. Nutrition and Metabolism. Ventage Press, New York, pp 244
Sahin K Kucok O, Sahin N, Ozbey O (2001): Effects of dietary chromium picolinate supplementation on egg production, egg quality and serum concentrations of insulin, corticosterone, and some metabolites of Japanese quails. Nutr Res 21, 1315-1321
Schwartz K, Mertz W (1959): Chromium (III) and the glucose tolerance factor. Arch Biochem Biophys 85, 292-295
Steele NC, Rosebrough RW (1981): Effect of trivalent chromium on hepatic lipogenesis by the turkey poult. Poult Sci 60, 617-622
Sun V, Mallya K, Ramirez J, Vincent JB (1999): The biomimetic [Cr3O(O2CCH2CH3)6(H2O)3]+ decreases plasma cholesterol and triglycerides in rats: towards chromium-containing therapeutics. JBIC 4, 838-845
Sznajderman M, Michajlik A (1979): Lipidy i lipoproteidy osocza. PZWL, Warszawa
Toepfer EW, Mertz W, Polansky MM, Roginski EE, Wolfe WR (1977): Preparation of chromium-containing material of glucose tolerance factor activity from Brewers yeast extracts and by synthesis. J Agricul Food Chem 25, 162-166
Uyanik F, Kaya S, Kolsuz AH, Eren M, Sahin N (2002) The effect of chromium supplementation on egg production, egg quality and some serum parameters in laying hens. Turk J Vet Anim Sci 26, 379-387
Vincent JB (1994): Relationship between glucose tolerance factor and low-molecular-weight chromium-binding substance. J Nutr 124, 117-118
Ward TL, Southern LL (1993): Effect of dietary chromium tripicolinate on growth, organ weights, and plasma metabolites and hormones of growing broilers. J Anim Sci (suppl 1), 221
Ward TL, Southern LL, Boleman SL (1993): Effect of dietary chromium picolinate on nitrogen balance and body composition of growing broiler chicks. Poultry Sci 72 (suppl 1), 37
Washburn KW, Nix DF (1974): A rapid technique for extraction of yolk cholesterol. Poultry Sci 53, 1118-1122
Wojtyś A, Grela E (1999): Wpływ dodatku drożdży chromowych w mieszankach dla kur na zawartość cholesterolu i skład kwasów tłuszczowych w żółtku jaj. W: Gralak MA, Zalewski W (Eds) Eologiczne kierunki produkcji żywności. ART Olsztyn, 167-177
Zetic VG, Stehlik-Tomas V, Grba S, Lutilsky L, Kozlek D (2001): Chromium uptake by Saccharomyces cerevisiae and isolation of glucose tolerance factor from yeast biomass. J Biosci 26, 217-23

196
Investigations on the tolerance of lactulose as feed additive in adult healthy horses Zeyner, A.1, Schrödl, W.2, Sahm, U.3, Lengwenat, O.3, Coenen, M.4, Krüger, M.2 1Institute of Animal Nutrition, Nutritional Diseases and Dietetics, Gustav-Kühn-Str. 8, 04159 Leipzig and 2Institute of Bacteriology and Mycology, An den Tierkliniken 29, 04103 Leipzig, University of Leipzig; 3Justus-von-Liebig-School, Heisterbergallee 8, 30453 Hannover; 4Institute of Animal Nutrition, School of Veterinary Medicine Hannover, Bischofsholer Damm 15, 30173 Hannover; Germany
Introduction Lactulose is a semi-synthetic disaccharide (4-O-ß-D-galactopyranosyl-D-fructose)
that is not naturally present in any food. In men, lactulose has been used for 40 years
in the treatment of constipation (Mayerhofer and Petuely 1959) and for more than 30
years for portosystemic encephalopathy (Bircher et al. 1966). Though this history
classifies lactulose as a drug its mode of action can be characterised as mainly
prebiotic. Lactulose can not be split by human intestinal enzymes at the ß-1-4-
glycosidic bond and is mainly metabolised by saccharolytic bacteria in the hind gut. It
constitutes a favourable food for lactic acid bacteria over numerous pathogenic (pro-
teolytic) species (Ballongue et al. 1997). In this way, lactulose supplies energy for
selective bacterial growth. Additionally, the bacterial carbohydrate metabolism roses
while the reduction of proteins declines. This increases the concentration of organic
acids within the large bowel chyme resulting in significant environmental alterations,
e.g. moderate rise of the osmotic pressure, dose-dependent drop of the pH value and
increase of the peristaltic action (Schumann 2002). Lactulose decreases the
resorption of toxic ammonia because of the utilisation of nitrogen containing
compounds for bacterial growth and the conversion into not absorbable ammonium
induced by pH reduction (Clausen and Mortensen 1997). This could be beneficial for
horses, too, provided satisfactory tolerance of lactulose as feed additive. Previously,
Scarratt and Warnick (1997) administered 3 x 0.333 mg lactulose per kg body weight
(BW) and day by mouth to seven healthy mature horses. One of these horses
developed signs of laminitis at day sixth of administration. As yet, it is not known
whether the laminitis was associated to lactulose induced alterations of the caecal
flora, as it was assumed by the authors. However, as a precondition for the use of
the prebiotic potency of the disaccharide that possibly also acts in equines, a safe
amount of lactulose as feed additive for horses has to be find out.

197
Objectives The aim of the study was to investigate how adult healthy horses tolerate lactulose
as feed additive by monitoring the effects of two different amounts of the orally given
disaccharide on feed intake, behaviour, wellbeing, body weight and selected
microbiological, clinical-chemical and immunological parameters.
Material and Methods
Animals: For this study, 6 Warmblood-type stallions (605 ±65.2 kg BW, age 7 ±4
years) were used. The horses were housed and fed individually. They were daily
ridden according to a 60 minutes lasting dressage programme. Additionally, they
gave two ejaculates per week.
Experimental feeding and study design: The horses were fed a control diet consisting
of grass silage (47% dry matter) and mixed feed with 59% oats, 29% barley, 10%
wheat, 1% soybean oil and 1% dried yeast from the brewery (diet ‘C’). Mixed feed
and silage were supplied in three and two meals per day, respectively. In a random
Latin square design 0.33 (diet ‘L’) and 0.67 (diet ‘LL’) g lactulose per kg BW and day
were administered as syrup (66.7% lactulose w/v). For this, the daily amount of
lactulose containing syrup was subdivides into three equal portions and in every case
freshly topped on the mixed feed. Each experimental period lasted 28 days with an
included 7 days adaptation time.
Protocol: The horses’ feed intake, behaviour and wellbeing were permanently
monitored. The BW was measured at the beginning and the end of the study. Faeces
from the Ampulla recti and blood from the V. jugularis were sampled at the beginning
of the study and the end of each week (faeces) or period (blood).
Analyses: In the faeces the dry matter content and counts of selected bacteria (total
aerobic and aerobic gram-negative, Lactobacillus, Bifidobacterium, Bdellovibrio, C.
perfringens) were detected. The faecal water was investigated for the pH value as
well as for concentrations of L-lactate, short chain fatty acids (SCFA: acetate,
propionate, iso- and n-butyrate, iso- and n-valeriate, n-capronate) and ammonia. The
blood sera were analysed for selected clinical-chemical parameters (total protein,
albumin, urea, creatinine, glucose, aspartate aminotransferase [ASAT], alkaline
phosphatase [AP], γ-glutamyl transferase [GGT], glutamic acid dehydrogenase
[GAD]) and immunological variables (C-reactive protein, IgG and IgM anti
lipopolysaccharides [LPS] from E. coli J5, IgG and IgM anti phospholipase C [PLC]

198
from C. perfringens, IgG, IgM and IgA anti Candida - mixed antigen, IgG, IgM and
IgA anti peptidoglycane from S. aureus).
Statistics: Wilcoxon-test was used to investigate whether the initial and final BW as
well as the serum parameters while feeding the individual diets were significantly
different. To assess the effects of ‘diet’, ‘period’ and ‘time within the diet’ and the
appropriate interactions analysis of variance with repeated measurements was
carried out. LSD-test was used as post hoc multiple comparison of means. The level
of statistical significance was pre-set at P<0.05.
Results and discussion General observations and body weight: There was no obvious or clear effect of
lactulose feeding on the horses’ health or wellbeing. In four horses, the eating
behaviour was unaffected by the diet. One additional horse consumed the lactulose-
enriched feed somewhat more slowly, but an other animal obviously preferred the
mixed feed added with lactulose. The horses put on weight by totally 14 kg (P>0.05).
Faecal variables: Not any of the investigated faecal variables revealed detrimental
effects of lactulose-feeding on the horses health. The experimental feeding did not
affect (P>0.05) the dry matter content and counts of the investigated bacteria in the
faeces as well as the pH value and concentrations of total and individual SCFA, L-
lactate and ammonia in the faecal water. Bdellovibrio in counts of 1 x 10² to 3 x 10³
plaque forming units were to be found in 19.4% of faecal samples, irrespective of the
individual animal or the experimental diet. C. perfringens in a count of 1 x 10³ colony
forming units was only present in the faeces of one horse while feeding the diets ‘C’
and ‘L’. Interestingly, feeding lactulose did not influence the pH value in the faecal
water. Previously, Scarratt and Warnick (1997) and Stuke (2003) found in horses and
weaned piglets, respectively, the absence of a lactulose-effect on the faecal pH.
Especially in horses, the bacterial density is already high within the terminal lower gut
(Mackie and Wilkins 1988). Harju (1986) revealed a high lactulose-splitting activity in
the homogenate of mucosa from the lower gut of pigs, contrary to calves and human
subjects. Therefore it seems to be possible that in some species lactulose will be
degraded to a high extent until the end of the ileum and that horses belong to these
species. In the recent study, the patterns of the dependency (P<0.001) of the faecal
pH value (y) from the concentrations of SCFA (x1, in mmol/l) and L-lactate (x2 in
mmol/l) differed between the experimental diets (Fig. 1).

199
Fig. 1.1.a: SCFA and pH (Diet ‘C’) Fig. 1.1.b: L-lactate and pH (Diet ‘C’)
Fig. 1.2.a: SCFA and pH (Diet ‘L’) Fig. 1.2.b: L-lactate and pH (Diet ‘L’)
Fig. 1.3.a: SCFA and pH (Diet ‘LL’) Fig. 1.3.b: L-lactate and pH (Diet ‘LL’) FIGURE 1: Concentrations of SCFA and L-lactate, respectively, and the pH value in
the faecal water of horses fed a control diet ( diet ‘C’) or diets with 0.33 (diet ‘L’) and
0.67 (diet ‘LL’) g lactulose per kg BW and day.
Diet ‘C’: y = 7.45** - 0.022 x1** - 0.199 x2* R2=0.480, SE = ±0.445
Diet ‘L’: y = 6.52** + 0.014 x1n.s. - 0.321 x2*** R2=0.507, SE = ±0.372
Diet ‘LL’: y = 7.91** - 0.042 x1*** - 0.149 x2n.s. R2=0.607, SE = ±0.438
5,0
5,5
6,0
6,5
7,0
7,5
8,0
8,5
0 20 40 60 80
SCFA [mmol/l]
pH v
alue
5,0
5,5
6,0
6,5
7,0
7,5
8,0
8,5
0 1 2 3 4 5 6
L-lactate [mmol/l]
pH v
alue
5,0
5,5
6,0
6,5
7,0
7,5
8,0
8,5
0 20 40 60 80
SCFA [mmol/l]
pH v
alue
5,0
5,5
6,0
6,5
7,0
7,5
8,0
8,5
0 1 2 3 4 5 6
L-lactate [mmol/l]
pH v
alue
5,0
5,5
6,0
6,5
7,0
7,5
8,0
8,5
0 20 40 60 80
SCFA [mmol/l]
pH v
alue
5,0
5,5
6,0
6,5
7,0
7,5
8,0
8,5
0 1 2 3 4 5 6
L-lactate [mmol/l]
pH v
alue

200
Irrespective of the diet and in every case four weeks after the feed was changed, the
count of aerobic gram-negative bacteria and molar percentages of iso- and n-
valeriate as parts of the total SCFA in faeces and faecal water, respectively,
underwent a depression (P<0.05). This indicates an significant and moderately long-
lasting adaptation effect after feed exchange on the large bowel flora.
Blood variables: The measured clinical-chemical blood variables did not indicate any
relevant health problem. The concentrations of total protein, albumin, urea, creatinin
and glucose as well as the activities of ASAT, AP, GGT and GLDH in the blood sera
were not affected (P>0.05) by the diet (Table 1). C-reactive protein and most of the
measured immunoglobulines in the blood sera were not influenced (P>0.05) by the
experimental feeding, except IgM anti LPS from E. coli J5 and IgA anti Candida –
mixed antigen which were lower (P<0.05) with diet ‘L’ compared to diet ‘LL’.
TABLE 1: Mean ±SD clinical-chemical parameters in the blood serum of horses fed a
control diet (diet ‘C’) or diets with 0.33 (diet ‘L’) and 0.67 (diet ‘LL’) g lactulose per kg
BW and day.
Parameter Diet ‘C’ Diet ‘L’ Diet ‘LL’
Total protein [g/l] 64.4 ±6.02 64.5 ±5.28 65.2 ±5.77
Albumin [g/l] 29.2 ±1.00 29.2 ±0.95 29.4 ±1.98
Urea [mmol/l] 4.82 ± 0.80 5.24 ± 0.89 4.94 ± 0.83
Creatinine [µmol/l] 126 ±11.4 130 ±16.2 127 ±13.2
Glucose [mmol/l] 5.27 ±0.36 5.36 ±0.38 5.21 ±0.32
ASAT [U/l] 331 ±196 279 ±118 357 ±149
AP [U/l] 291 ±118 272 ±71.2 274 ±95.6
GGT [U/l] 35 ±34 26 ±16 32 ±18
GLDH [U/l] 13 ±22 8 ±1 17 ±16
Conclusions
Results suggest that lactulose feeding up to 0.67 g per kg BW and day, subdivided
into three meals, induces no apparent adverse effects in healthy horses. Further, a
dose-dependent lactulose effect on the metabolism of gut microbes and possibly on

201
gut associated immunological reactions is assumed. Additional research is need to
investigate this effects and the dose-effect-interaction.
Summary The safety of orally given lactulose as feed additive for adult healthy horses should be monitored. In a Latin square design, 6 adult horses were fed a control diet (‘C’) and the same feed added with 0.33 (‘L’) and 0.67 (‘LL’) g lactulose/kg BW/d, each over 4 weeks. There was no clear diet effect on health, wellbeing, feed intake, BW and the investigated variables in faeces and blood, except serum IgM anti LPS from E. coli J5 and IgA anti Candida which were lower (P<0.05) with diet ‘L’ vs ‘LL’. Patterns of the dependency (P<0.001) of faecal pH (y) from SCFA (x1) and L-lactate (x2) differed between diets. Apparently, no adverse effects of feeding up to 0.67 g lactulose/kg BW/d exist. A dose-dependent lactulose effect on the metabolism of gut microbes and possibly on gut associated immunological reactions is assumed.
Literature Ballongue J, Schumann C, Quignon P (1997): Effects of lactulose and lactitol on
colonic microflora and enzymatic activity. Scand J Gastroenterol 32 (Suppl 222), 41-44
Bircher J, Müller J, Guggenheim P, Haemmerli UP (1966): Treatment of chronic portal systemic encephalopathy with lactulose. Lancet 1, 890-892
Clausen MR, Mortensen PB (1997): Lactulose, disaccharides and colonic flora. Drugs 53, 930-942
Harju M (1986): Lactulose as a substrate for beta-galactosidases. II. Results and discussion. Milchwissenschaft 6, 349-352
Macki RI, Wilkins CA (1988): Enumeration of anaerobic bacterial microflora of equine gastrointestinal tract. Appl Envir Microbiol 54, 2155-2160
Mayerhofer F, Petuely F (1959): Untersuchungen zur Regulation der Darmträgheit des Erwachsenen mit Hilfe der Lactulose (Bifidus-Faktor): Wien Klien Wschr 71, 865-869
Scarratt WK, Warnick LD (1997): Effects of oral administration of lactulose in healthy horses. J Equine Vet Sci 18, 405-408
Schumann C (2002): Medical, nutritional and technological properties of lactulose. An update. Eur J Nutr 41 (Suppl 1), I/17-1/25
Stuke O (2003): Untersuchungen zu möglichen infektionsprophylaktischen Effekten verschiedener Futterzusätze (Ameisen- und Zitronensäure / Lactulose / Pankre-asenzym) unter den Bedingungen einer experimentellen oralen Belastung mit E. coli (Absetzferkel) bzw. mit S. Derby (Mastschwein). Hannover: Tierärztl. Hochschule, Diss.

202
Wirkung NSP-hydrolysierender Enzyme bei Geflügel Richter, G.1, Lüdke, H.1, Köhler, H.1, Arnhold, W.2
1 Thüringer Landesanstalt für Landwirtschaft, 07751 Jena-Remderoda 2 BASU Mineralfutter GmbH, Bergstraße 1, 99518 Bad Sulza Problemstellung Die Nicht-Stärke-Polysaccharide (NSP) der pflanzlichen Futtermittel vermindern die
Verdaulichkeit von Nährstoffen (Käfigeffekt) und führen zu negativen Wirkungen, wie
Erhöhung der Viskosität des Chymus und der Exkremente (Schurz, 2000).
Eine Vielzahl von Untersuchungen zur Wirkung und Effektivität der verschiedenen
Enzymkomplexe wurden bei Küken- und Junghennen (Richter u. a., 1997, 2001), bei
Legehennen (Halle und Braun, 2000), Richter u. a., 1997 a, 1998, 1999, 2001), bei
Broilern (Gruzauskas u. a., 2000, Jamroz u. a., 2002, Richter u. a., 1990, 1994,
Seskeviciene u. a., 1999), bei Mastputen (Richter u. a. 2001) oder bei Enten (Timm-
ler, 2000) mit unterschiedlichem Ergebnis durchgeführt.
Ziel der vorliegenden Fütterungsversuche war die Prüfung verschiedener Enzym-
komplexe zu praxisrelevanten Futtermischungen inklusive Leguminosen bei Lege-
hennen, Küken, Junghennen, Mastputen und Broilern.
Material und Methode In einem Versuch mit 18 x 3 LB-Hennen/Gruppe wurde 1 kg KEMZYME HF/t Misch-
futter supplementiert. Die Futterrezeptur enthielt 9 % Malzkeime oder 9 % Sonnen-
blumenextraktionsschrot (Tab. 1). Die Versuchsdauer betrug 12 x 28 Tage. Die Eier
wurden täglich und die Einzeleimasse an 3 Tagen pro Woche erfasst. Innere und
äußere Eiqualitätsmerkmale sind im Verlaufe des Versuches gemessen worden.
In einem Küken- (0 - 8 Wochen) und Junghennenversuch (9 - 18 Wochen) erfolgte
der Zusatz von 400 g ZY 38 oder 1000 g KEMZYME HF jeweils pro t Futter. Die zwei
Rationstypen Küken- oder Junghennenfutter enthielten Erbsen oder Ackerbohnen
(Tab. 2). Je Gruppe kamen 12 x 7 Tiere in die 18-wöchige Prüfung.
In zwei 17-wöchigen, fünfphasigen Versuchen mit Big 6-Puten wurde der Enzym-
komplex KEMZYME WT Conc. (75 g/t Futter) supplementiert (Tab. 3). Je Versuch
kamen 5 x 15 Puten/Gruppe zur Einstallung.
Enzymergänztes Broilerstarter- und Mastfutter mit 20 % Ackerbohnen wurde in zwei
33- bzw. 34-tägigen Versuchen mit 8 x 28 Cobb-Broilern (Versuch A) bzw. 8 x 25

203
Cobb-Broilern (Versuch B) eingesetzt (Tab. 4). Im Versuch A erfolgte der Zusatz von
250 g ZY 38 und im Versuch B von 1000 g KEMZYME HF, jeweils pro t Futter.
Tabelle 1: Zusammensetzung der eingesetzten Legehennenrationen (g/kg Mischfutter)
Gruppen Komponenten 1/2 3/4 Malzkeime Sonnenblumenex.-schrot Weizen1) Gerste Mais Sojaex.-schrot Soja-Öl Mineralfutter1)
90 -
176,9 200 150
231,3 49,5 102,3
- 90
196,9 200 150
207,9 52,8
102,4 1) ab 57. Lebenswoche + 5 g CaCo3, - 5 g Weizen Tabelle 2: Zusammensetzung des eingesetzten Aufzuchtfutters (g/kg Mischfutter)
Gruppen Kükenfutter Junghennenfutter Komponenten
1 2 1 2 Erbsen Ackerbohnen Mais Weizen Gerste
100 -
50 382 180
- 100 50
390,7 180
300 - -
292,9 230
- 200
- 355,5 230
Sojaex.-schrot 198 188,6 25,5 33,0 Weizengrießkleie Sojaöl Mineralfutter
50 9,2
30,8
50 9,8 30,3
120 5
26,6
150 5
26,5
Die verwendeten Enzymkomplexe enthalten folgende deklarierte Aktivitäten:
KEMZYME HF - Endo – 1,3 (4) – Beta-Glucanase, Endo – 1,4 – Beta –
Glucanase, Alpha-Amylase, Protease, Cellulase
KEMZYME WT - Beta-Glucanase, Xylanase, Alpha-Galactosidase, Cellulase,
Protease
ZY 38 - 50 FBG Endo - 1,3 (4) - Beta-Glucanase/g, Hemicellulase,
Alpha-Galactosidase, Cellulase, Pentosanase.
Die Wägung der Tiere erfolgte einzeln und die Futterverzehrsmessung je Untergrup-
pe. Zur biostatistischem Auswertung der Ergebnisse wurden die Varianzanalyse und
zur Prüfung der Mittelwertdifferenzen der Tukey-Test verwendet (Weber, 1986).

204
Tabelle 3: Zusammensetzung der eingesetzten Puten-Rationen (g/kg Mischfutter) Versuch A Versuch B
Wochen Komponenten 0-2 3-5 6-9 10-13 14-17 0-2 3-5 6-9 10-13 14-17
Erbsen Weizen Mais
100 200
141,6
100 200
162,2
100 200
176,6
100 200 272
100 200
372,5
50 82,6 250
50 92,1 300
50 128 350
50 158,7 400
50 144,5500
Sojaex., 44 150 387,2 335,9 240,5 235,7 246,7 300 259,1 227,4Sojaex., HP 395,8 215,7 300 228,6 89,3 50 Sojabohnen 100 100 50 Pflanzenöl 13,6 22,5 44,1 49,4 46,2 30,1 31,8 38,2 37,7 36,7 Mineralfutter 49 49,6 42,1 42,7 408 51,6 50,8 44,5 44,5 41,4 Tabelle 4: Zusammensetzung der eingesetzten Broiler -Rationen in den Versuchen A und B (g/kg Mischfutter)
Broilerstarterfutter Broilermastfutter Komponenten 1/2 1/2 Ackerbohnen Weizen Mais Sojaextraktionsschrot Sojabohnen Sojaöl Mineralfutter
200 40
319,2 260,9 100 42,5 37,4
200 -
390,0 127 200 53,2 29,8
Ergebnisse - Legehennen
In dem 48-wöchigem Versuch mit zwei Basalrationen führte die Supplementation von
KEMZYME HF zu keiner Veränderung der erfassten Leistungen und Eiqualitäts-
merkmale (Tab. 5). Das Leistungsniveau der Hennen lag mit 88,2 % Legeleistung
sehr hoch.
- Küken- und Junghennen
Sowohl ein erbsen- oder ackerbohnenbetontes Küken- als auch Junghennenfutter
wurden jeweils mit den Enzymkomplexen ZY 38 oder KEMZYME HF ergänzt.
In der Kükenperiode führte der Zusatz von KEMZYME HF zur erbsenbetonten Ration
(Gruppe 1) zu signifikant verminderter Futteraufnahme. Die Körpermasse in der Kü-
kenperiode war in beiden Gruppen mit Enzymzusatz signifikant um 6,5 % bzw. 5,9 %
verbessert (Tab. 6). Daraus ergaben sich auch um 7,6 % bzw. 9,1 % signifikant nied-
rigere Futteraufwandswerte bei Enzymzusatz. In der Junghennenperiode von 9 - 18
Wochen und in der gesamten Aufzuchtperiode nahmen die Tiere bei ZY-Ergänzung
signifikant mehr Futter auf. Die Körpermasse der Junghennen mit 18 Wochen war

205
bei ZY 38- bzw. HF-Zusatz signifikant um 3,9 % bzw. 2,0 % erhöht. Im Futteraufwand
bestanden in der Periode von 9. - 18. Woche keine Unterschiede, in der gesamten
Periode von 0 - 18 Wochen um 2,8 % signifikant günstiger in beiden Versuchsgrup-
pen (Tab. 6). Es gab keine Tierabgänge im Versuch.
Tabelle 5: Leistungen von Legehennen in Abhängigkeit von Enzymzusatz (p > 0,05)
Gruppen 1 2 + HF1) 3 4 + HF1) Parameter
0 s ± 0 s ± 0 s ± 0 s ± Futterverzehr, g/Tier + Tag 121,5 2,6 123,2 6,8 123,5 6,0 122,
0 5,1
Legeleistung, % Einzeleimasse, g tägl. prod. Eimasse, g Futteraufwand, kg/kg Eimasse Körpermassezunahme, g Tierabgänge, %
88,3 68,4 60,4
2,02 280 3,7
4,0 3,2 3,9
0,12 175 10,8
89,3 66,8 59,7
2,07 305 5,6
4,2 2,5 3,5
0,17 274 17,2
87,5 67,0 58,6
2,12 359 5,6
5,8 2,5 3,8
0,18 211 17,2
87,967,459,2
2,07323 9,3
4,7 2,2 3,1
0,15211 22,3
Eiqualität Bruchfestigkeit, N Schalenfarbe, % Reflexion Haugh-Einheiten Blutflecken
40
29,9 79,7 9,6
7
1,9 8,6 6,7
40
28,5 77,6 11,1
9
1,2 9,1 6,7
43
28,5 77,3 9,6
9
1,3 8,6 9,5
43
27,679,912,6
7
1,0 6,9 7,8
1) 1 kg KEMZYME HF/t Mischfutter
Tabelle 6: Leistungen von Küken und Junghennen bei Zusatz von NSP-Enzymen zu erbsenhaltigen Rationen (Gruppen 1)
Gruppen ohne ZY 1) HF 2) Parameter
0 s ± 0 s ± 0 s ± Körpermasse, g/Tier 56. Tag 126. Tag
666 1.434
69 103
709* 1.490*
65 101
705* 1.463*
62 106
Futteraufwand, kg/kg Zunahme 1. - 56. Tag 57. - 126. Tag 1. - 126. Tag
3,09 6,56 5,01
0,16 0,29 0,14
2,86* 6,59 4,87*
0,16 0,30 0,12
2,81* 6,70 4,87*
0,13 0,33 0,14
Tierabgänge, % 0 0 0 * signifikant zur Kontrolle p< 0,05 1) 400 g ZY 38, 2) 1000 g KEMZYME HF jeweils pro t Futter
Bei Verfütterung der ackerbohnenhaltigen Rationen plus Enzyme in der Gruppe 2
bestanden keine signifikanten Unterschiede sowohl in der Küken- als auch Junghen-

206
nenperiode (Tab. 7). In der Kükenperiode war bei Enzymzusatz die Körpermasse im
Mittel um 1,6 % und der Futteraufwand um 2,8 % verbessert.
Tabelle 7: Leistungen von Küken und Junghennen bei Zusatz von NSP-Enzymen zu ackerbohnenhaltigen Rationen (Gruppen 2, p > 0,05)
Gruppen ohne ZY 1) HF 2) Parameter
0 s ± 0 s ± 0 s ± Körpermasse, g/Tier 56. Tag 698 61 709 62 710 58 126. Tag 1.505 124 1.518 96 1.501 90 Futteraufwand, kg/kg Zunahme
1. - 56. Tag 2,94 0,17 2,87 0,16 2,85 0,13 57. - 126. Tag 6,25 0,27 6,31 0,21 6,39 0,42 1. - 126. Tag 4,77 0,12 4,75 0,11 4,76 0,14 Tierabgänge, % 2,4 5,6 0 0 1) 400 g ZY 38, 2) 1000 g KEMZYME HF jeweils pro t Futter
- Mastputen
Die Ergänzung der Weizen-Mais-Soja-Ration mit dem Enzymkomplex KEMZYME
WT nahm Einfluss auf die zootechnischen Leistungen der Mastputen (Tab. 8). Außer
in den ersten zwei Wochen verzehrten die Puten mit Enzymzusatz weniger Futter als
die Kontrolltiere ohne Ergänzung. In der gesamten Mastperiode verbrauchten die
Puten mit Enzym im Mittel der zwei Versuche 5,1 % weniger Futter, im Versuch A mit
6,1 % signifikant. In der Körpermasse bestanden keine wesentlichen Unterschiede
zwischen den Gruppen ohne und mit Enzymsupplementation (Tab. 8). Im Versuch A
erzielten die Puten von der 9. - 17. Woche bei Futter mit Enzymen eine bessere Kör-
permasse, die am Mastende 2,2 % ausmacht. Im Versuch B bestanden kaum Unter-
schiede in der Masttagszunahme. Die Mehrzunahme im Mittel der zwei Versuche
betrug 0,8 % (116 g) bei Puten mit enzymhaltigem Futter. Die geringere Futterauf-
nahme und die etwa gleiche Körpermasseentwicklung der „Enzymputen“ wirkte sich
positiv auf den Futteraufwand der Tiere aus. In beiden Versuchen war die Futterver-
wertung in den ersten fünf Wochen in den Versuchsgruppen signifikant besser als in
den Kontrollgruppen ohne Zusatz. Auch in den übrigen Mastabschnitten lag der Fut-
teraufwand in den Versuchsgruppen günstiger. In der gesamten Mastperiode benö-
tigten die Puten bei Enzymeinsatz mit 2,49 Futteraufwand 5,7 % weniger Futter je kg
Zuwachs (Versuch A signifikant). Die Tierabgänge infolge Mortalität und Selektion
betrugen in den Kontrollgruppen durchschnittlich 11,4 % und in den Versuchsgrup-

207
pen mit Enzymeinsatz 6,7 % (Tab. 8). Ein Zusammenhang zur unterschiedlichen Füt-
terung soll aber nicht konstatiert werden. Bei den Enzymwirkungen wird der positive
Einfluss auf die Exkrementebeschaffenheit beschrieben. Die Beurteilung der Einstreu
zu verschiedenen Terminen ergab aber keine eindeutige Beziehung. Im Versuch A
wurde die Einstreu der Enzymgruppen im Mittel der Bewertungen 14 % besser ein-
geschätzt, dagegen im Versuch B 6 % schlechter. Eine Differenzierung der beein-
flussten Leistungen und Kosten (Körpermasse, Futterverzehr, Enzymeinsatz) ergab
einen höheren Gewinn von 47 Ct pro Pute im Mittel der beiden Versuche.
Tabelle 8: Leistungen von Mastputen in Abhängigkeit vom Enzymzusatz
Versuch A Versuch B
ohne KEMZYME WT1) ohne KEMZYME
WT1) Parameter
0 s ± 0 s ± 0 s ± 0 s ± Körpermasse, g/Tier
35. Tag 1.512 168 1.515 153 1.636 245 1.627 230 63. Tag 4.813 510 4.811 486 5.098 769 5.169 702 119. Tag 14.834 1.591 15.164 1.436 13.733 2.121 13.636 2.073 Futteraufwand, kg/kg Zunahme
1. - 35. Tag 1,79 0,17 1,58* 0,11 1,49 0,03 1,45* 0,02 36. - 63. Tag 2,04 0,15 1,95 0,08 2,03 0,08 1,94 0,07 64. - 119. Tag 2,95 0,25 2,68 0,11 3,11 0,22 3,03 0,20 1. - 119. Tag 2,63 0,13 2,42* 0,09 2,65 0,14 2,56 0,13 Tierabgänge, % 1. - 14. Tag 6,7 9,4 2,7 3,7 10,7 5,9 6,7 9,4 1. - 119. Tag 10,7 11,2 6,7 5,6 12,0 2,3 6,7 9,4 Beurteilung der Einstreu 2,9 0,4 2,5 0,3 3,2 1,3 3,4 1,1 1) 75 g KEMZYME WT conc./t. Futter * signifikanter Unterschied zur Gruppe ohne KEMZYME, p < 0,05
- Broilermast
In der Starterperiode der Broilermast (0 - 2 Wochen) nahmen die getesteten Enzym-
präparate keine Einfluss auf den Futterverzehr, die Körpermasse und den Futterauf-
wand (Tab. 9). In der Periode vom 15. - 33./34. Lebenstag und in der gesamten Mast
verzehrten die Broiler mit ZY-Zusatz mehr Futter und die mit HF-Zusatz signifikant
weniger. Am Ende der Mastperiode erreichten die „Enzym-Broiler“ 3,9 % bzw. 2,7 %
signifikant höhere Körpermasse (Tab. 9). Der Futteraufwand lag bei ZY- bzw. HF-
Supplementation 1,9 % (p > 0,05) bzw. 8,0 % (p < 0,05) günstiger als in der Kontroll-

208
gruppe. Eine Differenzrechnung der beeinflussten Leistungen und Kosten (Körper-
masse, Futterverzehr, Enzymzusatz) ergab einen um 2,9 Ct (Versuch A) bzw. 5,9 Ct
höheren Gewinn pro Broiler.
Tabelle 9: Leistungen von Broilern ohne und mit Enzymzusatz
Versuch A Versuch B 1 2 + ZY1) 1 2 + HF2) Parameter
0 s ± 0 s ± 0 s ± 0 s ± Körpermasse, g/Tier 14. Tag 435 45 423 41 433 44 431 50 33./34. Tag 1.613 216 1.676* 176 1.682 201 1.728* 232 Futteraufwand, kg/kg Zunahme
1. - 14. Tag 1,29 0,05 1,30 0,03 1,23 0,05 1,23 0,03 15. - 33./34. Tag 1,68 0,08 1,63 0,09 1,75 0,26 1,58* 0,07 1. - 33./34. Tag 1,58 0,06 1,55 0,07 1,63 0,20 1,50* 0,05Tierabgänge, % 1. - 33./34. Tag 4,0 3,0 0,4 1,3 4,0 6,4 5,5 4,2 * signifikant zur Gruppe 1 ohne Zusatz, p < 0,05 1) 250 g ZY 38, 2) 1 kg KEMZYME HF jeweils/t Mischfutter Zusammenfassung In einem Legehennenversuch mit zwei Basalrationen führte die Supplementation von KEMZYME HF zu keiner Veränderung der Leistungen und Eiqualität. In der Küken-periode verbesserten sich die Leistungen durch Zusatz von ZY 38 oder KEMZYME HF. Keinen Einfluss auf die Aufzuchtleistungen hatten diese Enzyme in der Jung-hennenperiode. Die Supplementation von KEMZYME WT führte bei BIG 6-Puten zu 0,8 % erhöhter Körpermasse bei 5,7 % niedrigerem Futteraufwand. In zwei Versu-chen mit Cobb-Broilern verbesserte die Supplementation mit ZY 38 bzw. KEMZYME HF die Körpermasse signifikant um 3,9 % bzw. 2,7 % bei 1,9 % bzw. 8,0 % günstige-rem Futteraufwand. Der Einsatz der Enzyme war bei Küken, Mastputen und Broilern ökonomisch und ökologisch sinnvoll. Summary Effect of NSP-hydrolysing enzymes of poultry In an experiment with laying hens the supplementation of two basic diets with KEMZYME HF did not take effect on the parameters of laying performance and egg quality. The raising parameters of the chicken from hatching up to the 8th week of life were improved by the supplementation of the diet with ZY 38 and KEMZYME HF. During the pullets period from the 9th up to the 18th week of life the enzyme supple-ments did not influence the investigated parameters. In two experiments with Big 6-turkeys during 17 weeks the KEMZYME WT supplement increased the mean body mass by 0,8 % and improved the feed efficiency by 5,7 %. The supplementation of the diet of Cobb-broilers with ZY 38 and KEMZYME HF significantly improved the body mass by 3,9 % and 2,7 %, respectively. In the two experiments the feed effi-ciency was improved by 1,9 % and 1,8 %, respectively. However, the supplementa-

209
tion of the diet with the investigated enzymes can be recommended to chicks, fatten-ing turkeys and broiler to the economic and ecologic points of view. Literatur Gruzauskas R, Kapocius M, Seskeviciene J, Sasyte V (2000): 6. Tagung Schweine-
und Geflügelernährung, MLU Halle-Wittenberg, 75 - 77 Halle I, Braun J (2000): 6. Tagung Schweine- und Geflügelernährung, MLU Halle-
Wittenberg, 200 - 203 Jamroz D, Wertelecki T, ŽyÍka (2002): 7. Tagung Schweine- und Geflügelernährung,
MLU Halle-Wittenberg, 183 - 185 Richter G, Ranft U, Petzold A, Schwartze J (1990): Arch. Anim. Nutr., Berlin 40, 951 -
958 Richter G, Cyriaci G, Stölken B (1994): Arch. Anim. Nutr. 47, 11 - 22 Richter G, Ochrimenko W I, Lüdke H, Leiterer M, Rudolph B, Hüller M, Arnhold W
(1997): Z. „Das Wirtschaftseigene Futter“ 43, 97 - 115 Richter G, Bargholz J, Ochrimenko W I, Leiterer M, Rudolph B, Hüller M, Eckstein B
(1997 a): Z. „Das Wirtschaftseigene Futter“ 43, 235 - 262 Richter G, Lüdke H, Rudolph B, Ochrimenko W I, Leiterer M, Hüller M, Schenkel H
(1998): Arch. Geflügelk. 62, 264 - 272 Richter G, Schurz M, Ochrimenko W I, Köhler H (1999): 7. Symp. „Vitamine und Zu-
satzstoffe in der Ernährung von Mensch und Tier“, FSU Jena, 519 - 522 Richter G, Heller E, Köhler H, Schurz M (2001): 8. Sypm. „Vitamine und Zusatzstoffe
in der Ernährung von Mensch und Tier“, FSU Jena, 267 - 272 Timmler R (2000): 6. Tagung Schweine- und Geflügelernährung, MLU Halle-
Wittenberg, 203 - 205 Schurz M (2000): DGS-Magazin 52, Nr. 5, 27 - 30 Seskeviciene J, Jeroch H, Dänicke S, Gruzauskas R, Völker L, Broz J (1999); Arch.
Geflügelk 63, 129 - 132 Weber E (1986): Grundriss der biologischen Statistik, VEB Gustav-Fischer-Verlag,
Jena, 7. Aufl.

210
Effect of supplemented phytase at different Zn- and Cu- feed contents in pig nutrition Berk, A.1, Flachowsky, G. 1, Fleckenstein, J. 2 1 Institute of Animal Nutrition, 2 Institute of Plant Nutrition and Soil Science, Federal Agricultural Research Centre (FAL), Bundesallee 50, 38116 Braunschweig, Germany
Introduction Zinc (Zn) and copper (Cu) are essential trace elements in plants and animals. In
livestock production a deficiency of these elements can decrease animal
performances or/and influence the health of animals (Mc Dowell 2003, Pallauf, 2003).
That’s why these elements are supplemented to all compound feeds. In areas with a
high livestock density the excreted amounts of Zn and Cu let the discussion of
environmental problems (KTBL, 2002). This is the reason for the development of new
upper limits of some trace elements in the EU valid from January 2004.
The German recommendations for the supply of Zn and Cu of pig diets are from
1987 (GfE, 1987) and the correctness concerning the changes in animals
performance and feed processing are also under discussion.
In case of a possible limited supply of trace elements the absorption rate
(bioavailability) is more and more interesting. These bioavailability may be influenced
by the phytate content of feed or/and the binding form of supplemented trace
elements.
These reasons let us create an experiment with growing – finishing pigs to
investigate the following questions:
1. Can the supplementation of phytase, especially in extremely limited Zn- and
Cu supplemented feeds, increase the absorption rate of these elements?
2. Which height of supplementation of Zn and Cu to the native feed content of a
cereals – soy bean meal – ration can influence performance data of pigs?
3. Has a trace element – amino acid – complex a better bioavailability compared
to the sulfat bounded trace elements?
Material and methods A three factorial experiment with 100 pigs from 25 kg to 115 kg live weight (LW) was
designed according Table 1. The sex ratio was 1:1, means in every group were 5
females and 5 castrated males. To influence the enrichment of the Zn- and Cu stores
equal, 130 piglets after weaning (3 weeks of age) were reared in the institutes stable.

211
The high quality feed of piglets was supplemented with 60 mg Zn and 5 mg Cu per
kg feed, half from inorganic and half from organic source of these trace elements,
described later.
The supplementation of phytase of microbial origin should reach at least 750 FTU/kg
feed. The stages of trace elements supplementation were:
- Native content of feed without an additionally supplementation.
- According the GfE (1987) recommendations a supplementation of 35 mg Zn and 2
mg Cu per kg feed.
- According the new EU limits (while planning this experiment these limits were yet
under discussion) a supplementation of 95 mg Zn and 9 mg Cu per kg feed.
The source of these supplementation stages was on the one hand Zn- or CuSO4 or
rather a trace element – amino acid – complex of both elements.
Table 1: Experimental design
Group 1 2 3 4 5 6 7 8 9 10
n 10 10 10 10 10 10 10 10 10 10
Phytase yes yes yes yes yes no no no no no
Supplem. Native GfE GfE EU EU Native GfE GfE EU EU
Source Native Inorg. Org. Inorg. Org. Native Inorg. Org. Inorg. Org.
The animals came from a common breed (BHZP). The aim was to achieve about 900
g daily live weight gain (DLG). While growing – finishing three feeding phases
(prestater, starter and finisher) were used to adapt the nutrients supply to the
requirement of the animals. The feed composition is shown in Table 2.
Table 2: Composition of the feeds (%)
Prestarter Starter Finisher
Cereals 1) 71.0 75.1 81.7
Soy bean meal 21.5 17.5 12.0
Oil 3.5 3.6 3.5
AA/Min./Vit. 4.0 3.8 2.8 1) Wheat, barley and corn
All animals were fed individually according the LW and the calculated DLG twice
daily. The LW was determined once a week by individual weighing of animals.

212
Results and discussion The experiment took a normal course. But two animals must be removed because of
fundamental problems before reaching slaughter weight (groups 1 und 6) and were
slaughtered in the slaughter house of the institute. One further animal was selected
even so because of refuse feed (group 3).
The realised feeding phases on average were 24.9 – 61.2 – 88.5 – 115.3 kg LW. In
this time the realised mean DLG was 887 g (900 g when reaching 110 kg LW) and
the realised mean feed conversion ratio was 2.54 kg/kg gain. The results of the feed
analyses are shown in Table 3.
Table 3: Energy, protein- and lysine content of the feeds
Prestarter Starter Finisher
ME (MJ/kg) 13.8 13.8 13.8
Protein (g/kg) 174 160 141
Lysine (g/kg) 11.6 10.0 8.5
The phytase contents were analysed shown in Table 4.
Table 4: Phytase content of the groups (FTU/kg feed)
Group
1
Group
2
Group
3
Group
4
Group
5
Groups
6 - 10
1310 1650 1890 1860 1180 290
The content of 290 FTU/kg of the unsupplemented feed is normal corresponding to a
wheat, barley and corn based diet (Table 2). The partly extreme high contents of the
supplemented diets are inexplicable but without any influence of the experimental
questions. Table 5 showed the analysed Zn- and Cu contents in the diets.
Table 5: Zn- and Cu contents (mg/kg feed)
Stage: Native GfE EU
Source:
Groups:
Native
1 and 6
Inorganic
2 and 7
Organic
3 and 8
Inorganic
4 and 9
Organic
5 and 10
Zn 35.8 61.4 65.7 119.9 122.4
Cu 8.0 9.6 9.0 15.3 14.2
213
The native Zn- and Cu contents of the diets could be expected under consideration of
the contents of feeds. The supplemented levels could be measured in the mixtures
(Table 5).
The results of performance are shown for the whole period (24.9 kg – 115.3 kg LW)
or divided in the periods 25 kg up to 60 kg LW and 60 kg up to 105 kg LW (Table 6).
The dividing in the two periods can better illustrate if there is a possible influence of
age on the performance data and upper LW of 105 kg LW is more correct then 115
kg LW because the lightest animal was slaughtered reaching 105 kg LW.
In the whole period there are nearly no differences in the DLG between the groups
(Table 6, Figure 1).
0
200
400
600
800
1000
1 2 3 4 5 6 7 8 9 10Groups
DLW
(g/d
ay)
Figure 1: Daily Live Weight Gain (whole period)
Table 6: DLG Daily live weight gain (g) of pigs in various periods
Groups 1 2 3 4 5 6 7 8 9 10
25-60 kg 874 871 892 878 892 860 868 899 866 886
± 53 ± 72 ± 81 ± 55 ± 51 ± 36 ± 52 ± 45 ± 40 ± 52
60-105 kg 944 885 953 941 955 907 909 982 961 961
± 74 ± 97 ± 67 ± 85 ± 49 ± 84 ± 54 ± 89 ± 90 ± 81
25- 115 kg 893 866 911 879 916 871 878 923 903 907
± 56 ± 76 ± 63 ± 69 ± 48 ± 58 ± 37 ± 53 ± 67 ± 59
DLG increased from the first to the second period. Comparing groups 1 and 6 there
seems to be a small influence of phytase supplementation. But the pigs of the
unsupplemented group 1 (phytase added and without trace elements

214
supplementation) shows in both periods higher DLG than groups 2, 6 and 7 (p >
0.05). Looking on energy conversion ratio (ECR) all data were more equal than DLG
data (p > 0.05; Table 7).
Table 7: Energy efficacy (MJ ME/kg live weight gain) of pigs in various periods
Groups 1 2 3 4 5 6 7 8 9 10
25-60 kg 29.1 28.8 27.9 28.7 28.1 28.9 28.6 27.9 28.9 28.5
±2.2 ±2.8 ±2.6 ±1.9 ±1.6 ±1.4 ±1.8 ±1.8 ±1.8 ±2.4
60-105 kg 41.5 42.8 40.6 41.2 40.6 41.7 42.3 40.0 40.5 41.1
±3.5 ±4.2 ±3.1 ±3.5 ±1.9 ±2.9 ±2.7 ±3.3 ±3.5 ±3.7
25- 115 kg 36.7 37.4 35.7 37.6 35.6 36.6 37.2 35.6 36.8 36.5
±2.5 ±3.1 ±2.6 ±3.2 ±1.3 ±2.8 ±2.0 ±1.8 ±3.15 ±2.8
The analyses of variance showed no significant influence of phytase
supplementation. Only in the whole period there is a significant influence of the trace
element source for both parameters (DLG, FCR) and in the second period for the
DLG. No interaction showed any influence of the results. That’s why we pooled the
phytase supplemented groups (1 to 5) and the phytase unsupplemented groups (6 to
10, Table 8).
Table 8: Influence of phytase supplementation on DLG (g) and ECR (MJ/kg)
+ Phytase (n = 48) – Phytase (n = 49)
DLG ECR DLG ECR
25 – 60 kg LW 881 ± 61 28.5 ± 2.2 876 ± 46 28.6 ± 1.8
60 – 105 kg LW 935 ± 78 41.3 ± 3.3 945 ± 83 41.1 ± 3.2
25 – 115 kg LW 893 ± 63 36.6 ± 2.6 897 ± 57 36.5 ± 2.5
t-Test, p < 0.05
There is no significant difference in ECR data by phytase supplementation.
Summery and conclusions The supplementation of phytase to cereals – soy bean meal – based diets did not
significantly influence pig performance of growing – finishing pigs from 25 to 115 kg
LW (p > 0.05). Also the height of supplementation of Zn and Cu showed no
significant effect on performance data of the animals. Animals with only the native
Zn- and Cu- content in feed tends to smaller performances only. But the

215
supplementation of Zn and Cu in form of a trace element – amino acid – complex in
contrast of the sulphate form showed significant differences at least in the whole
period. The German recommendations of (GfE, 1987) concerning Zn and Cu are safe
enough to achieve a high pig performance.
References GfE (1987): Energie- und Nährstoffbedarf landwirtschaftlicher Nutztiere – Nr 4
Schweine. DLG-Verlag Frankfurt/Main
KTBL (2002): Fütterungsstrategien zur Verminderung von Spurenelementen/
Schwermetallen im Wirtschaftsdünger, Proc. KTBL-Workshop, 23./24.
04.2002, Göttingen, KTBL-Schrift 410, 162 S.
McDowell, L.R. (2003): Minerals in animal and human nutrition, 2nd ed., Elsevier,
644 p.
Pallauf, J. (2003): Zur Bewertung der Spurenelementversorgung in der
Tierernährung, Proc. 9. Symp. Vitamine und Zusatzstoffe in der Ernährung
von Mensch und Tier, 23./24. 09.2003, Jena, im Druck

216
Effects of microbial phytase in corn-soybean meal diets on performance, energy and nutrient utilization in laying hens Htoo, J.K., Liebert, F. Institute for Animal Physiology and Animal Nutrition, Kellnerweg 6,D-37077 Göttingen
Although many studies have been conducted to evaluate the effect of microbial
phytase in laying hens, there is only limited agreement on this topic, especially
related to the non-phytate phosphorus (NPP) requirement. Our previous study (Htoo
and Liebert, 2002) had demonstrated that phytase addition to a low-P corn-soybean
meal (CSM) diet had no significant effect on laying performance and P-utilization of
laying hens. The present study was conducted to re-evaluate the effects of microbial
phytase on laying performance, tibia bone ash mineralization, nutrient utilization and
apparent metabolizable energy (AMEn) in hens fed low-P CSM layer diets.
Materials and Methods A low-P CSM basal diet (0.12% NPP) was formulated based on corn (31 FTU/kg)
and soybean meal (22 FTU/kg), having low content of NPP and low native phytase
activity. The basal diet met or exceeded the recommended nutrient requirements
(NRC, 1994), except P. A calcium (Ca) level of 3.1% was maintained for all dietary
treatments. Dietary treatments consisted of the basal diet (C1), supplemented with
300 FTU phytase/kg (C2) or 1.5g inorganic P/kg without phytase (C3). The source of
phytase was the experimental microbial phytase SP1002 (Roche Vitamins Ltd, Basel,
Switzerland) in granulate form. Ingredients and nutrient composition of experimental
diets are given in Table 1. Each of the three diets was fed to 16 laying hens (Lohmann Brown) in a single
feeding performance trial (wk 22-61) and to 8 hens in a balance trial (collection
period starting at wk 26 and 33 for 10 d). The birds were kept individually in cages
(cage size: 0.4m x 0.36m) under environmentally controlled conditions. Feed was
given in mash form. Birds had ad libitum access to feed and water during
performance trial. Controlled feeding was applied during the balance trials. All
animals were exposed to a lighting schedule recommended for Lohmann Brown
(14h/d).

217
Table 1: Composition of experimental diets
Ingredients C1 C2 C3 (g/kg) Corn Soybean meal Soybean oil Wheat starch Ca CO3 NaCl Premix1) DL-Methionine Phytase2) MSP3)
590.0 249.0 32.0 26.0 88.0 4.0
10.0 1.0 - -
590.0 249.0 32.0 25.91 88.0 4.0
10.0 1.0
0.09 -
590.0 249.0 32.0 19.3 88.0 4.0
10.0 1.0 -
6.7 (DM%) CP P-total NPP Ca Lys Met + Cys Thr
17.3 0.39 0.12 3.12 0.96 0.93 0.73
17.8 0.39 0.12 3.12 0.96 0.93 0.73
17.2 0.54 0.26 3.12 0.96 0.93 0.73
AMEn (MJ/kg DM4) 12.8 12.7 12.7 Phytase activity (FTU/kg) 20 352 23
1) Premix (kg-1 diet): 6000 IU A, 1000 IE D3, 18.5 mg E, 1.6 mg B1, 4.8 mg B2, 3 mg B6, 20µg B12, 2 mg K3, 28 mg nicotinic acid, 10 mg Ca-pantothenate, 0.6 mg Folic acid, 100 mg Biotin, 800 mg Choline chloride, 25 mg Se, 80 mg Zn, 80 mg Mn, 16 mg Cu, 25 mg Fe, 1.2 mg J, 0.55 mg Co, 3.5 mg Canthaxanthin, 100 mg BHT. 2) Experimental microbial phytase SP1002 CT (3519 FTU/g) 3) Monosodium phosphate (22% P) 4) N-corrected apparent metabolizable energy (calculated according to WPSA, 1984)
From the performance trial egg production, individual egg weight and egg mass
production (Egg production × egg weight) were recorded daily. Feed consumption
and feed conversion ratio (g of feed/g of egg) for each hen was recorded weekly.
Hens were weighed every 4 wk and mortality was monitored daily. At the end of the
performance trial (at 62 wk of age), left tibiae of 12 hens/treatment were removed.
After removing all adhering tissue, the tibia bones were dried at 105°C for 48 h, dry-
ashed at 550°C overnight and analyzed for P and calcium. During balance trial, total
collections of excreta and eggs were undertaken for 10 d. Samples of diets and
freeze-dried excreta of individual bird were analyzed for gross energy (using a bomb
calorimeter) and N (Dumas method) to estimate the AMEn values. Total-P content of
diets, excreta, egg and tibia of individual bird were analyzed according to VDLUFA
methods (Naumann and Bassler, 1976-1997). The determination of phytate-P was

218
according to AOAC (1990). Determination of Ca in diets and tibia was carried out by
using an atomic absorption spectrophotometer. Alfa-amino-N in excreta was
determined after Pahle et al. (1985). According to Engelen et al. (1994) samples of
diets and microbial phytase were analyzed for phytase activity (Roche Vitamins Ltd,
Basel, Switzerland). N-balance (intake − excretion), N-egg, N-digestibility (α-amino-N
method), N-utilization (balance / intake × 100), P-balance (intake − excretion), P-egg
and P-utilization (balance / intake × 100) were recorded from the balance trials. The
collected data were statistically analyzed as one-way ANOVA using SPSS program
(10.0). Significant differences between treatment means were determined using
Duncan test at P< 0.05.
Results and Discussion
The results of performance trial (22-61 wk) are given in table 2. Performance
parameters were not significantly affected by phytase or inorganic-P (iP)
supplementation to the low-P CSM diets.
Table 2: Effect of phytase supplementation on performance (wk 22-61; n=16)
Feed intake Egg production
Egg weight Egg mass production
FCR Treatment
(g/d) (%) (g) (g/d) (g/g) C1 (NC)
C2 (+300FTU)
C3 (+1.5g iP)
113.6a ± 7.7
110.0a ± 4.9
114.7a ± 7.8
89.7a ± 5.1
89.4a ± 4.4
90.8a ± 3.9
65.5a ± 4.0
65.6a ± 3.3
65.4a ± 4.9
58.6a ± 4.1
58.8a ± 2.9
59.2a ± 5.0
1.98a ± 0.1
1.88a ± 0.2
1.93a ± 0.1
The development of body weight (BW) and mortality rate of laying hens are given in
table 3. The results indicated that BW was not influenced by adding phytase or iP to
the low-P CSM diet (C1) at 62 wk of age.
Table 3: Effect of phytase addition on body weight and mortality (wk 22-61; n=16)
Body weight (g) Body weight gain
Mortality Treatment
at 22 wk at 62 wk (g) (%) C1 (NC)
C2 (+300FTU)
C3 (+1.5g iP)
1889a ± 130
1872a ± 162
1858a ± 142
2112a ± 282
2112a ± 201
2248a ± 308
222a ± 322
241a ± 211
378a ± 321
0.0a ± 0.0
0.4a ± 1.6
0.4a ± 1.6

219
Growth data (from 22 to 61 wk of age) of hens from different treatments were not
significantly different. Mortality was low and not significantly affected by
treatments.These results indicate that the low-P level (0.12% NPP), even in the
absence of supplemental phytase, was sufficient to support normal egg production.
This observation is consistent with other reports (Boling et al., 1997, 2000) that the
dietary P-level of 0.15% available-P for CSM-based diets was sufficient to support
optimum performance and phytase or iP addition had no beneficial effect on these
parameters.
Table 4: Effect of phytase on P, Ca and ash contents in tibia bone (wk 62; n=12)
tibia ash P in tibia Ca in tibia Treatment (% DM) (% DM) (% Ash) (% DM) (% Ash) C1 (NC)
C2 (+300FTU)
C3 (+1.5g iP)
44.7a ± 4.7
44.9a ± 5.4
45.6a ± 4.7
6.4a ± 0.7
6.6a ± 0.8
6.7a ± 0.7
14.4a ± 0.2
14.7b ± 0.2
14.7b ± 0.1
15.2a ± 1.4
15.5a ± 2.2
15.5a ± 1.6
34.1a ± 0.9
34.5a ± 0.9
33.9a ± 0.7
As shown in table 4, P-content in tibia ash was significantly increased by phytase or
iP addition. However, tibia ash, Ca-content in tibia ash, P- and Ca-contents (DM %)
in tibia were not affected by phytase or iP addition. The marginal effect of phytase
supplementation on tibia parameters may be due to the high Ca level (3.1%) of the
layer diets which could form insoluble Ca-phytate in the small intestine, making the
phytate inaccessible to phytase.
The influence of different dietary treatments on N-balance parameters of laying hens
at 26-27 wk (1st trial) and at 33-34 wk (2nd trial) are presented in table 5.
Supplemental phytase had no effects on N-balance parameters and N-utilization in
both balance periods. Similarly, iP supplementation to the CSM diet did not improve
N-balance parameters.
The results of P-balance study with laying hens at 26-27 wk (1st trial) and at 33-34 wk
(2nd trial) of age are presented in table 6. No significant effect of supplemental
phytase on P-balance parameters and P-utilization was observed during both
balance trials. Compared with diets C1 and C2, the higher level of P in diet C3 led to
a significant (P<0.05) increase in P-intake, P-excretion and P-balance during both
balance trials. Based on the results of balance trials, adding phytase (C2) numerically
increased the P-utilization by 4.5 % and 9-12 %, comparing with treatment C1 and

220
C3, respectively. Adding phytase or iP had no significant effect on the AMEn of CSM
layer diets.
Table 5: Results of N-balance experiments
N-intake N-egg N-balance N-digestibility* N-utilization
mg/LWkg0.67/d (%)
1st Balance trial C1
C2
C3
2122a ± 97
2071a ± 123
2144a ± 89
680a ± 63
662a ± 40
691a ± 54
1166a ± 73
1157a ± 68
1149a ± 58
84.3a ± 1.2
85.3a ± 1.1
84.1a ± 2.7
55.0a ± 2.7
55.9a ± 2.2
53.6a ± 2.3
2nd Balance trial C1
C2
C3
1971a ± 160
1922a ± 168
2021a ± 101
669a ± 68
693a ± 65
708a ± 71
1121a ± 129
1095a ± 131
1084a ± 98
85.1a ± 1.4
85.4a ± 1.3
84.1a ± 2.1
56.8b ± 2.5
56.9b ± 3.4
53.6a ± 2.9
*) ∝-amino-N method
Table 6: Results of P-balance experiments and apparent metabolizable energy
P-intake P-egg P-balance P-utilization AMEn
mg/LWkg0.67/d (%) MJ/kg DM
1st Balance trial C1
C2
C3
256a ± 12
251a ± 12
372b ± 13
59a ± 6
57a ± 3
60a ± 4
91a ± 11
94a ± 14
124b ± 15
35.7a ± 4.3
37.3a ± 4.7
33.3a ± 3.8
13.20a ± 0.2
13.39a ± 0.2
13.31a ± 0.3
2nd Balance trial C1
C2
C3
258a ± 21
252a ± 22
390b ± 20
63a ± 8
64a ± 7
65a ± 6
107a ± 15
110a ± 24
154b ± 13
41.5a ± 4.1
43.4a ± 7.2
39.7a ± 3.8
13.61a ± 0.2
13.65a ± 0.2
13.64a ± 0.2
In this study, neither phytase supplementation nor iP addition to CSM layer diets had
beneficial effects on all measured parameters. Based on these results, the dietary P-
content of 0.12% NPP or NPP-intake of 136 mg/d seem to be sufficient to meet the
P-requirement of laying hens, indicating that the dietary P-requirement of laying hens

221
may be even lower than the NRC (1994) recommendation of 250 mg/d. However,
more comprehensive studies are required to confirm these results.
Summary 48 laying hens (Lohmann Brown) in a performance trial (22-61 wk) and 24 hens in two balance trials (collection period at 26 and 33 wk) were randomly assigned to three dietary treatments to study the effects of microbial phytase on performance, tibia ash mineralization, N- and P-utilization and dietary AMEn. Dietary treatments consisted of CSM basal diet (C1; 0.12% NPP, 3.1% Ca), supplemented with 300 U phytase/kg (C2) or 1.5 g iP/kg (C3). Microbial phytase supplementation (300 U/kg) to the low-P (0.12% NPP) CSM diet had no significant effect on performance parameters, tibia bone mineralization, P-balance parameters and P-utilization. Similarly, no significant effect of phytase on N-balance parameters, N-utilization and AMEn was observed. Literature AOAC (1990): 15th Ed., Vol. 1, 800-801. Boling, S.D., Douglas, M.W., Johnson, M.L., Wang, X., Parsons, C.W., Koelkebeck,
K.W., and Zimmerman, R.A. (1997): Poultry Sci. 76 (Suppl. 1), 20 (Abstr.). Boling, S.D., Douglas, M.W., Johnson, M.L., Wang, X., Parsons, C.W., Koelkebeck,
K.W., and Zimmerman, R.A. (2000): Poultry Sci. 79, 224-225. Engelen, A.J., Van Der Heeft, F.C., Randsdorp, P.H. and Smit, E.L. (1994): J. AOAC
Int. 77, 760-764. Htoo, J.K. and Liebert, F. (2002): Proc. Soc. Nutr. Physiol. 11, 118. Naumann, K. and Bassler, R. (1976-1997): Methodenbuch, Bd. III. (Methode 10.6.1). NRC (1994): Nutrient requirements of domestic animals. (9th Rev. Ed.), National
Academy Press, Washington, DC. Pahle, T., Köhler, R., Halle, I., Jeroch, H. and Gebhardt, G. (1985): Arch. Anim. Nutr.
35, 82-87. WPSA (1984): World Poultry Science Journal. 40, 181-182.

222
Supplementation of Feed Enzyme Complexes to Broiler Diets with High Lupin Seed Content Paulicks, B.R. 1), Broz, J. 2), Roth-Maier, D. A. 1) 1) Division of Animal Nutrition, Technical University Munich, Hochfeldweg 6,
D-85350 Freising-Weihenstephan, Germany 2) Roche Vitamins Ltd, CH-4070 Basle, Switzerland
Introduction
The importance of sweet lupin seeds as a component in animal feeds is increasing
with the background of replacing critical or expensive protein sources. Lupin seeds
do not require heat treatment prior to their use as animal feed, which eases the die-
tary inclusion. Especially certified organic farms in Germany are in need for GMO-
free feedstuffs and for farm sources of protein to extend their scale of usable feeds.
By breeding new varieties, now there are lupins available, which are more easy to
plant and harvest in agriculture. However, lupin seed causes special problems in
feeding, as it contains besides certain alkaloids also considerable amounts of specific
carbohydrates (non-starch polysaccharides), which are not digestible for monogastric
animals such as pigs or poultry. Currently, there are several enzyme preparations
available, which probably can improve the polysaccharide digestion in monogastric
animals. In a former experiment (Roth-Maier and Kirchgessner, 1994) the beneficial
effect of such a supplementation to lupin-rich broiler diets could be demonstrated. As
the described efficiency spectrum of these preparations probably fits with the de-
mands of broilers for diets containing lupin seed, a feeding trial was conducted to
examine the efficiency of two commercial enzyme preparations when added to broiler
feeds with a high content of lupin seed.
Materials and Methods
The experiment was conducted over 5 weeks with a total of 360 day-old, male Ross
broiler chickens weighing 41.2 ± 0.3 g on the average. They were randomly distrib-
uted to 6 treatments with 6 replicates of 10 animals each. The animals were housed
in wired cages of a 3-floored battery brooder in a fully air-conditioned room. As blue
lupin seed (Lupinus angustifolius L.) will be that kind of lupins, that will be cultivated
increasingly in the future in Germany, the seed of Lupinus angustifolius var. Bolivio
(cultivated in Mecklenburg-Hither Pomerania, North-Eastern Germany, in 2001) was

223
used for the present experiment. The proximate chemical analysis provided the fol-
lowing results: 928 g dry matter per kg and (per kg dry matter) 35 g ash, 143 g fiber,
68 g fat, 335 g total protein, 419 g nitrogen-free extracts, 123 g starch, 57 g sugar,
and 34 g oligosaccharides. Total alkaloid concentration was determined to be 0.042
%. Calculated energy content was 7.8 MJ AME/kg DM, using the analysed nutrient
concentrations and the metabolizability quotients determined in a former experiment
(Roth-Maier and Paulicks, 2003).
Two basal diets were used with a different composition but with almost equal nutrient
concentrations according to recommendations (GfE 2000). Diet I consisted of 24.3 %
corn, 23.6 % wheat, 35.3 % soybean meal, 7 % oat mill feed, 5.6 % soybean oil, 3.7
% vitamin-mineral premix, and 0.5 % amino acid-premix. For diet II 30 % sweet blue
lupin seed (Lupinus angustifolius var. Bolivio) was included in partial isonutritional
exchange for wheat, soybean meal, and oat mill feed. With 12.3 MJ AME and 210 g
total protein per kg it was in line with the recommendations for broiler chickens (GfE
2000). The diets were isonitrogeneous and isoenergetic. As a result of the high
amount of lupin seed, the energy concentration was at the lowest recommended
level and the fiber content (53 g/kg) was rather high. Diet II was supplemented with
either 200 mg, 400 mg, or 800 mg of enzyme complex A (Ronozyme® VP (CT)) per
kg and coded as diet III, IV, or V, respectively, or with 200 mg of enzyme complex B
(Roxazyme® G2G) for diet VI. Enzyme complex A is derived from Aspergillus acu-
leatus and enzyme complex B from Trichoderma longibrachiatum. Both contain a
broad spectrum of hemicellulase activities, including also some pectinase activity.
Enzyme supplementations were confirmed by analytical determinations. All diets
were offered in mash form ad libitum.
The live weight of each individual bird and the feed consumption in each cage (10
animals) were measured every 7 days. Daily weight gain, daily feed consumption,
and feed-to-gain conversion (kg feed/kg weight gain) were calculated. After 3 ex-
perimental weeks the blockage of the floor mesh of each cage was independently
evaluated by 4 skilled persons using a 4-score evaluation system with 0=no block-
age, 1=slight blockage, 2=mean blockage, and 3=thick blockage.

224
Results
The most important results of the experiment are shown in Table 1.
Table 1: Growth performance and feed consumption of chickens on diets high in lupin seed content and various enzyme supplementation
Treatment I II III IV V VI
Lupins none - - - - - - - - - - - - - 30 % - - - - - - - - - - -
Enzyme complex supplement (mg/kg) none none 200 A 400 A 800 A 200 B
Final body weight (g) 1542 bc 1524 c 1653 ab 1629 abc 1689 a 1594 abc
Weight gain (g/d) 44.2 bc 43.6 c 47.4 ab 46.7 abc 48.5 a 45.7 abc
Feed consumption (g/d) 70.8 70.1 73.6 75.0 75.7 74.0
Feed-to-gain conversion (kg feed/kg weight gain) 1.61 ab 1.61 ab 1.55 b 1.61 ab 1.56ab 1.62 a
Blockage of floor mesh by litter (scores 1)) 0.78 a 1.84 b 2.58 c 2.57 c 2.51 c 2.13 bc
1) scores none = 0; total = 4 a,b,c Means with different superscripts differ significantly (P < 0.05; Duncan’s test)
Body weight and daily weight gain
At the end of the experiment after 5 weeks chickens fed the corn-soybean diet
(treatment I) reached the mean body weight of 1542 g. With 30 % lupins in the feed
(treatment II) this value was not significantly lower (1524 g). In contrast, chickens
with enzyme complex A supplementation (treatments III, IV, V) reached 1657 g on
the average and chickens with enzyme complex B (treatment VI) reached 1594 g.
This means an increase in body weight of more than 8 % with enzyme complex A
and almost 4 % with enzyme complex B. These differences in body weight were the
result of a higher daily weight gain in the chickens with enzyme supplementation.
With enzyme complex A daily weight gain was 47.5 g on the average, whereas
chickens without dietary enzyme supplementation reached less than 44 g weight gain
per day. Also enzyme complex B improved growth rate to nearly 46 g/d, but it was

225
not as effective as enzyme complex A. There were no significant differences between
those treatments having different amounts of enzyme complex A in the diet neither in
body weight nor in daily weight gain. Therefore no dose-related effects could be de-
termined.
Feed consumption
Daily feed consumption during the overall trial averaged 73 g/day/chicken. Although
there were no significant differences between the treatments, there was a tendency
(P<0.08) to higher feed intake in chickens fed diets supplemented with enzymes.
While unsupplemented animals consumed 70.5 g feed per day, chickens with en-
zyme complex A consumed 75 g/d, and chickens with enzyme complex B consumed
74 g feed per day. Although there were again no significant dose-related effects,
higher enzyme complex A supplementation seemed to increase feed intake.
Feed conversion
Feed-to-gain conversion, i.e. the amount of feed needed for one kg weight gain,
averaged 1.59 for the overall experimental period. Although there were no statisti-
cally significant differences, chickens with the enzyme complex A supplementation
needed less feed per kg weight gain (1.57 kg) than birds with the enzyme complex B
supplementation (1.62 kg) or without enzyme addition (1.61 kg). For the whole fat-
tening period this meant a considerable decrease of feed expense by 75-100 g feed
per animal, dependent on the final weight.
Blockage of floor mesh
The inclusion of 30 % lupin seed in the broiler diet caused a significant higher floor
blockage by excreta than the control diet with a similar crude fiber content. The
scores given in the table show that the enzyme supplementation increased this
problem. Therefore the cage floors had to be cleaned manually after 3 experimental
weeks. With enzyme complex A blockage of floor mesh was even higher than with
enzyme complex B.

226
Discussion
The present investigation shows that both products, enzyme complex B and particu-
larly enzyme complex A, are very effective to improve growth performance in broiler
chickens fed with diets containing high proportions of lupin seed. Body weight and
weight gain were increased by 4 % and 8 %, respectively. As there were no clear
dose-related effects for enzyme complex A, a supplementation of 200 mg enzyme
complex A per kg diet seems to be most efficient with regard to practical feeding and
cost factor. The reason for the better growth performance was a higher feed con-
sumption, but also a better feed conversion as the feed consumption per kg weight
gain was up to 50 g lower with the enzyme supplementation.
The problem of wet litter, particularly described for feedstuffs with high contents of
non-starch polysaccharides such as barley, oats, and lupin seed, too, could not be
solved by the present enzyme supplementation, this enzyme supplementation even
seemed to increase this problem. This observation is in contrast to former results
(ROTH-MAIER and KIRCHGESSNER, 1994) with another enzyme preparation in combi-
nation with a white lupin variety, where no effects, neither of lupin seed nor of en-
zyme suppplementation on litter quality were observed.
Summary
In a 5-week feeding trial with 360 male broiler chicks fed with feed mixtures contain-ing 30 % meal of sweet blue lupin seed (Lupinus angustifolius var. Bolivio), the ef-fects of the supplementation of enzyme preparations enzyme complex A (Rono-zyme® VP (CT)) and enzyme complex B (Roxazyme® G2G) on growth parameters were determined. Final body weight and daily weight gain were significantly in-creased (4-8 %) by enzyme supplementation, with Ronozyme® VP (CT) being more efficient than enzyme complex B. Feed intake increased tendentially with enzyme supplementation. Although there were no significant dosage effects a supplementa-tion with 200 mg enzyme complex A per kg feed was the most efficient with regard to feed-to-gain conversion.

227
Literature
GfE – Ausschuss für Bedarfsnormen der Gesellschaft für Ernährungsphysiologie (2000): Empfehlungen zur Energie- und Nährstoffversorgung der Legehennen und Masthühner (Broiler) 1999. DLG-Verlag, Frankfurt/Main, Germany
Roth-Maier D A, Kirchgessner M (1994): Zum Einsatz hoher Anteile weißer Lupinen (Lupinus albus L.) bei Enzymzulagen in der Broilermast. Arch. Geflügelkde. 58, 245-248.
Roth-Maier D A, Paulicks B R (2003): Feeding and nutritional value of sweet blue and yellow lupin seed (Lupinus angustifolius L., Lupinus luteus L.) for broiler chicks. Arch. Geflügelkde. in print.
WPSA – Working Group No. 2 – Nutrition (1984): The prediction of apparent metabo-lizable energy values for poultry in compound feeds. World’s Poult. Sci. J. 40, 181-182.

228
Effects of endo-xylanase supplementation on the nutritive value of wheat-based diets in broiler chickens Francesch Maria 1, Anna M. Perez-Vendrell1, J. Brufau1 and J. Broz2
1IRTA, Department of Animal Nutrition, Apartat 415, E-43280 Reus, Spain; 2Roche Vitamins Ltd, Animal Nutrition and Health R&D, CH-4070 Basel, Switzerland Introduction Feed enzymes capable of hydrolysing non-starch polysaccharides (NSP) are
broadly used in poultry diets in many European countries since more than ten
years. Beneficial effects of these NSP-degrading enzymes on growth
performance of broiler chickens are very well documented in the literature. In the
majority of published trials, multiple enzyme complexes were used, containing
usually a spectrum of various enzyme activities. However, there is still a limited
information about the efficacy of mono-component, GMO-derived enzyme
products, which are now also approved as feed additives. Furthermore, the
effects of such enzyme products on nutrient digestibility and metabolisable
energy of wheat-based broiler diets are not yet well examined.
The objectives of the present two experiments were:
1) To evaluate dose-related effects of a thermostable endo-1,4-β-xylanase
derived from Thermomyces lanuginosus (RONOZYME WX) when added to
wheat-based diets;
2) To study the influence of endo-xylanase supplementation on nutrient
digestibility and metabolisable energy of broiler diets containing different
wheat cultivars.
Material and Methods Growth trial (Trial 1)
A 5-week growth trial was conducted, involving a total of 1920 day-old, male
broiler chicks (Ross 308 strain). Birds were divided into 48 floor-pens (40 birds
per pen) and kept in a windowless facility provided with programmable lights,
automated gas heating and forced ventilation. Temperature inside the facility on
arrival of birds was 33-35°C and was decreased by 3°C each week. During the
trial birds were fed starter and grower diets based on wheat (cultivar Cartaya) as

229
the only grain. The composition and nutrient contents of both basal diets are
summarized in Table 1. Feed was provided ad libitum, in mash form during the
first day and as pellets afterwards. The diets contained anticoccidials; nicarbazin
at 125 ppm (day 1-21) and monensin at 100 ppm (day 21-35). A mono-
component enzyme product was used (RONOZYME WX, CT), containing endo-
1,4-β-xylanase derived from Thermomyces lanuginosus, with a minimum activity
of 1000 FXU/g . Basal diets were supplemented with 0, 100, 150, 200, 400 and
4000 FXU/kg feed and the presence of the added enzyme was checked
analytically after mixing and pelleting. Each of six dietary treatments was
assigned to 8 replicate groups in a complete randomised block design. Body
weight, feed intake, feed to gain ratio and mortality were monitored as
performance parameters. At 22-23 days of age, 2 chickens from each pen were
sacrificed and samples of ileal digesta were collected and kept on ice before the
measurement of viscosity. Samples from 2 birds were pooled to create one
replicate per pen. Digesta samples were centrifuged at 12 000 rpm for 5 minutes
at 15°C and supernatant viscosity was measured by means of a Brookfield digital
viscometer. At the end of trial, a representative sample of litter was collected from
each pen and dried for 24 hours at 90°C to determine dry matter content. Data
were analysed by a two-way analysis of variance, with 6 treatments and 8 blocks,
using the General Linear Model (SAS). Significant differences between treatment
means were determined by Duncan’s multiple range test (P<0.05).
Balance assay (Trial 2)
A short-term balance assay was conducted, involving a total of 96 male broiler
chickens. At day 10 of age, chickens were weighed and distributed into 6 weight
groups. Each weight group was assigned at random to one block location in
battery cages. From day 10 until the end of the study, four experimental diets
containing 70% of wheat were fed in mash form. The other feed ingredients in
these diets were: soybean meal (14.2%), soybean protein isolate (8.1%), swine
lard (3.4%), DL-methionine (0.24%), L-lysine.HCl (0.17%), calcium carbonate
(1.32%), dicalcium phosphate (1.78%), salt (0.3%), as well as choline chloride
and vitamin and mineral premixes. All four basal diets were formulated to contain
21.6% crude protein and 12.76 MJ ME/kg. The study was carried out according to
a 4X2 factorial design, involving four wheat cultivars (Cartaya, Dollar, Babui and

230
English feed wheat) and endo-xylanase at 0 and 200 FXU/kg diet, respectively.
There were eight experimental treatments and each was replicated six times (2
birds per replicate). The European reference method (Bourdillon et al, 1990) was
used, with some minor modifications. The balance period started on day 17. On
day 21, birds were fasted for 16 hours, then fed ad libitum the experimental diets
for 56 hours, followed by 16 hours of fasting. Excreta were totally collected once
daily during the last 3 days and stored at –20°C. Afterwards, the excreta were
lyophilized, weighed, ground and stored in plastic bags prior to analysis. Feed
intakes were corrected for variations in feed dry matter content measured at the
beginning and at the end of the balance period. Live weight of chickens was
determined before and after the balance period, in order to estimate nitrogen gain
from weight gain. Diets and excreta were analysed for their nutrient composition
by usual methods. Gross energy of diets and excreta was determined by an
adiabatic bomb calorimeter (IKA C-400). To separate urinary nitrogen from faecal
N, uric acid was measured according to Marquardt (1983). Dietary apparent
metabolisable energy values (AMEn) were calculated as the difference between
the energy intakes and excretion, and corrected for zero N-retention. The
correction was done by assuming that the energy equivalent was 34.4 kJ/g N
gained. Apparent protein, lipid and dry matter digestibility was expressed as
percentage, calculated by the difference between the ingested and excreted
nutrients. A two-factorial analysis of variance was conducted, by using the GLM
procedures (SAS). Differences were considered as significant at P>0.05.
Table 1: Composition and nutrient contents of wheat-based diets used in trial 1
Feed ingredients (in %) Starter Grower Calculated nutrient composition Starter Grower
Wheat 60.10 63.60 Metabolisable energy (MJ/kg) 12.76 13.18 Soybean meal (48% CP) 19.80 13.80 Crude protein (%) 22.00 20.50
Soybeans, extruded full fat 12.70 14.60 Crude fibre (%) 3.30 3.20
Swine lard 3.00 4.00 Crude fat (%) 6.70 8.10
DL-Methionine 0.29 0.27 Ash (%) 6.20 5.60
L-Lysine. HCl 0.23 0.23 Lysine (%) 1.24 1.12
L-Threonine 0.03 0.02 Methionine + cystine (%) 0.96 0.90
Calcium carbonate 1.03 1.04 Calcium (%) 1.00 0.90
Dicalcium phosphate 2.12 1.72 Non-phytate P (%) 0.45 0.38
Salt 0.30 0.30
Choline chloride - 0.03
Minerals and vitamins 0.40 0.40

231
Results and discussion Effects of endo-xylanase supplementation on performance of chickens during the
whole experimental period are shown in Table 2. No distinct influence of enzyme
supplementation on the final weight and daily weight gain of birds was noted. In
contrast, feed intake was markedly and significantly reduced by xylanase
supplementation and this effect resulted in a significantly improved feed
conversion by 3.1% (at 100 and 150 FXU/kg) to 4.7% (at 400 FXU/kg). Mortality
rate was relatively low (2.2% on average) and no significant differences between
treatments were found, although a numerically higher mortality was noted in the
negative control. When added at ten times the maximum recommended dose (4
000 FXU/kg), this endo-xylanase was well tolerated in broilers and resulted still in
beneficial effects on performance. Table 2: Effects of endo-xylanase supplementation on performance of broiler chickens fed wheat-based diets (Trial 1, day 1-35)
Treatment Ronozyme WX Final live Daily weight Daily feed Feed / gain Mortality
(FXU/kg feed) weight (g) gain (g/bird) intake (g/bird) ratio (%)
T-1 0 1920 53.5 91.4a 1.709a 3.8
T-2 100 1936 54.0 89.4ab 1.656b 2.2
T-3 150 1927 53.7 88.9b 1.655b 1.9
T-4 200 1916 53.4 87.3b 1.633bc 2.2
T-5 400 1933 53.9 87.7b 1.628c 1.6
T-6 4000 1964 54.8 89.4ab 1.631bc 1.5
Anova (Pr> F) 0.2672 0.2647 0.0059 0.0001 0.8660
a,b,c Values within a column not sharing a common superscript are significantly different (P< 0.05)
Effects of graded endo-xylanase supplementation on the viscosity of ileal digesta
are shown in Figure 1. Digesta viscosity was significantly reduced by all enzyme
inclusion levels by 49.6-56.9% and no significant differences between various
doses were observed. Dry matter content of the litter was non-significantly
increased by enzyme addition up to 200 FXU/kg feed, whereas the doses above
200 FXU/kg showed rather an opposite trend.
The effects of wheat cultivars and endo-xylanase supplementation on the
apparent protein, lipid and dry matter digestibilities are summarized in Table 3.
The results of two-factorial analysis of variance confirmed a significant positive

232
effect of enzyme addition on all three parameters. Wheat cultivar also significantly
affected the apparent lipid and dry matter digestibility, but not protein digestibility.
However, a significant interaction between both factors was observed with regard
to lipid digestibility. The results of Duncan’s test comparing all eight dietary
treatments confirmed that endo-xylanase addition significantly improved the
apparent lipid digestibility in diets based on cultivars Cartaya, Dollar and English
wheat, but not in case of Babui cultivar. Table 3: Effects of wheat cultivars and endo-xylanase supplementation on apparent protein, lipid and dry matter digestibility (Trial 2) Wheat cultivar
Endo-xylanase (FXU / kg feed)
Protein digestibility (%)
Lipid digestibility (%)
Dry matter digestibility (%)
Cartaya 0 83.8 77.6cd 70.5 200 85.8 82.6a 72.2 Dollar 0 83.3 76.3d 68.4 200 84.8 79.7bc 70.7 Babui 0 82.4 80.3ab 70.5 200 85.0 79.8bc 71.7 English feed 0 82.9 75.9d 71.1 200 83.5 80.6ab 73.1 Factorial analysis (Pr > F) Wheat cultivar 0.3573 0.0204 0.0001 Enzyme addition 0.0114 0.0001 0.0001 Interaction 0.7313 0.0111 0.5955 a, b, c, d Values within a column not sharing a common superscript are significantly different (P< 0.05)
The effects of both experimental factors on the apparent metabolisable energy of
wheat-based diets are shown in Figure 2. Factorial analysis of variance confirmed
significant effects of both factors, but also the significant interaction between
them. Endo-xylanase addition increased the AMEn values of all four diets, but the
magnitude of the improvement ranged from +1.2% (cultivar Babui) to +4.3%
(cultivar Dollar). It has to be mentioned that initial chemical analyses of all four
wheat cultivars showed that Dollar has the highest protein content (15.5%) and
also the highest level of total pentosans (13.0%), but the lowest proportion of
water-soluble pentosans. As a consequence of enzyme supplementation, the
variability among the AMEn values of the used wheat-based diets has been
markedly reduced (values ranged from 12.88 to 13.11 MJ/kg DM).

233
The results of the growth trial demonstrated that endo-xylanase supplementation
significantly improved feed conversion and this effect was connected with a
significant reduction in the viscosity of ileal digesta by around 50%. These
findings clearly indicated a direct improvement of the nutritive value of the used
wheat-based diets and this assumption was corroborated by the balance study,
which confirmed significant beneficial effects of the added enzyme on both the
digestibillity of protein and lipids and the metabolisability of energy.
3
Figure 1: Effects of endo-xylanase supplementation on the viscosity ofileal digesta in broilers fed wheat-based diets (Trial 1)
5.06
2.552.18 2.20 2.20 2.30
0
1
2
3
4
5
6
0 100 150 200 400 4000
Dig
esta
vis
cosi
ty (c
P)
Endo-xylanase supplementation (FXU/kg feed))
5
Figure 2: Effects of wheat cultivars and endo-xylanase supplementationon apparent metabolisable energy of wheat-based diets (Trial 2)
Wheat cultivar
without enzyme
with enzyme
12.76
12.36
12.78 12.81
13.02
12.8812.93
13.11
12
12.5
13
Cartaya Dollar Babui English feed
AM
En (M
J / k
g D
M)
Summary
Two trials were conducted to evaluate the effects of a thermostable endo-1,4-β-xylanase derived from Thermomyces lanuginosis (RONOZYME WX) on the nutritive value of wheat-based broiler diets. In a 5-week growth trial, the efficacy of xylanase supplementation at 0, 100, 150, 200, 400 and 4000 FXU/kg diet was evaluated. A short-term balance trial was carried out according to a 4x2 factorial design, involving 4 wheat cultivars and endo-xylanase at 0 or 200 FXU/kg. In the growth trial, enzyme supplementation significantly reduced feed intake and improved feed conversion by 3.1-4.7%. All enzyme inclusion levels significantly reduced the viscosity of ileal digesta. In the balance trial, xylanase supplementation resulted in an overall significant improvement of protein, lipid and dry matter digestibility, accompanied by increased dietary AMEn values.
Literature Bourdillon A, Carre B, Conan L, Francesch M, Fuentes M, Huyghebaert G,
Janssen WMMA, Leclercq B, Lessire M, McNab J, Rigoni M, Wiseman J (1990): European reference method of in vivo determination of metabolisable energy in poultry: reproducibilty, effect of age, comparison with predicted values. British Poultry Science, 31, 567-576.
Marquardt RR (1983): A simple spectrophotometric method for the direct determination of uric acid in avian excreta. Poultry Science, 62, 2106-2108.

234
Die Wirkung von L-Carnitin auf Milchleistung und Milchinhaltsstoffe bei Sauen und Wachstum der Ferkel während der Säugezeit. Ramanau, A.1, Kluge, H.1, Spilke, J.2, Eder, K.1 1Institut für Ernährungswissenschaften und 2Arbeitsgruppe Biometrie und Agrarinformatik, Martin-Luther-Universität Halle-Wittenberg, Emil-Abderhalden-Strasse 26, D-06108 Halle/Saale Einleitung In früheren Versuchen führte eine L-Carnitinsupplementierung bei trächtigen und
laktierenden Sauen zu einer Erhöhung der Wurfmasse bei der Geburt und beim
Absetzen (Musser et al.,1997; Eder et al., 2001; Ramanau et al., 2002). Bislang
existieren aber keine Untersuchungen zur Wirkung von L-Carnitinzulagen auf die
Milchleistung der Sauen. Daher wurde ein Versuch durchgeführt, in dem die Wirkung
einer L-Carnitinzulage auf die Milchleistung bei Sauen erfasst werden sollte.
Material und Methoden Der Versuch wurde im Nutztierwissenschaftlichen Zentrum der Martin-Luther-
Universität Halle-Wittenberg in Merbitz durchgeführt.
Für den Versuch wurden 40 Jungsauen (Deutsche Landrasse × Deutsche
Edelschwein) verwendet. Sie wurden vom Zuchtbetrieb Langenbernsdorf (Sachsen)
zugekauft. Dadurch konnte der Einfluß des Alters auf die Leistungsparameter der
Sauen eliminiert werden. Unter Berücksichtigung der Lebendmasse der Sauen vor
der ersten Besamung erfolgte die Einteilung in eine Kontroll- und Versuchsgruppe
mit jeweils 20 Tieren. Um paternale Effekte auf die Aufzuchtleistung der Sauen
auszuschließen, wurden die Sauen der Versuchs- und Kontrollgruppe in jedem
Reproduktionszyklus mit gleichem Ebersperma (Pietrain) besamt.
Die Sauen wurden vom 1. Trächtigkeitstag bis zum Abferkeln ad libitum mit
energiearmen Futter (9,6 MJ/kg, 150 g/kg Rohprotein, 30 g/kg Rohfett, 114 g/kg
Rohfaser, 16,2 mg/kg L-Carnitin) gefüttert. Während der Laktation erfolgte die
Fütterung der Sauen ad libitum mit konventionellem Laktationsfutter (13,1 MJ/kg, 178
g/kg Rohprotein, 61 g/kg Rohfett, 48 g/kg Rohfaser, 3,8 mg/kg L-Carnitin). Als
Zusatzstoff wurde das L-Carnitin-haltige Produkt Carniking 50® (min. 48,5% L-
Carnitin) der Fa. LOHMANN ANIMAL HEALTH GmbH & Co. KG, Cuxhaven,
eingesetzt. Um die tägliche Menge an L-Carnitin exakt zu verabreichen, wurde eine
Vormischung (L-Carnitin, Milchzucker, Traubenzucker) in Tablettenform (62,5 mg L-
Carnitin je 5 g Tablette) hergestellt. Für die Kontrollsauen wurde die gleiche

235
Vormischung ohne L-Carnitin zu Placebo-Tabletten gepresst. Die Sauen der
Versuchsgruppe erhielten während der Güstzeit und vom 1. bis zum 115.
Trächtigkeitstag neben der Tagesration 125 mg L-Carnitin und die laktierenden
Sauen in zwei Gaben 250 mg L-Carnitin täglich. Den Sauen der Kontrollgruppe
wurden in gleicher Weise Placebo-Tabletten verabreicht.
Die Milchleistung der Sau hängt von der Anzahl der säugenden Ferkel ab (Van der
Steen 1985). Um den Einfluß einer unterschiedlichen Wurfgröße auszuschließen,
wurde innerhalb der ersten zwei Tage nach der Geburt die Wurfgröße bei allen
Sauen auf 10 Ferkel standardisiert. Die Umsetzung der Ferkel erfolgte innerhalb der
Kontroll- bzw. innerhalb der Versuchsgruppe. Ferkel, die vor dem 18. Säugetag
ausfielen, wurden umgehend durch gleich schwere Ferkel ersetzt. Die
Milchleistungsprüfung bezieht sich auf eine gleiche Anzahl Kontroll- und
Versuchssauen. Die Messung der Milchleistung erfolgte am 11. und 18.
Laktationstag nach der „wiegen-säugen-wiegen“-Methode (Raeder et al. 1990,
Kirchgessner et al. 1992). Zur Untersuchung der Gehalte an Milchinhaltsstoffen
wurden die Sauen am 11. Tag jeweils eine Stunde nach Beendigung der letzten
Milchmengenerfassung von Hand gemolken. Um die Milchsekretion zu stimulieren,
wurde den Sauen dazu vorher 15 I.E. Oxytocin intramuskulär appliziert. Die
Versuchsauswertung basiert auf Leistungsdaten der Sauen der Kontroll- bzw.
Versuchsgruppe über zwei komplette aufeinanderfolgende Reproduktionszyklen. Die
statistische Auswertung der Leistungsmerkmale der Sauen erfolgte mittels
Statistikprogramm SAS (procedure mixed, Version 8.2, SAS Institute, Cary, NC,
U.S.A.).
Ergebnisse und Diskussion Wie aus Tabelle 1 zu entnehmen ist, war die die Anzahl insgesamt- und
lebendgeborener Ferkel pro Wurf in der Versuchsgruppe um 2,7 höher als in der
Kontrollgruppe. In der Versuchsgruppe war die Wurfmasse am 1.Lebenstag mit 18,2
kg um 2,43 kg höher (p<0,05) als in der Kontrollgruppe. Die Ferkel der
Versuchsgruppe waren am 1. Lebenstag um 0,16 kg leichter (p<0,05) als die der
Kontrollgruppe (Tabelle 2). Der durchschnittliche Ferkel- und Wurfzuwachs während
der Säugeperiode war in der Versuchsgruppe um 0,72 kg und 7,60 kg höher als in
der Kontrollgruppe (Tabelle 3).
236
Die L-Carnitinsupplementierung der Sauen führte zu einer Erhöhung der täglich
produzierten Milchmenge um 1159 g am 11. Laktationstag und um 1070 g am 18.
Laktationstag (Tabelle 4). Der Laktosegehalt in der Milch von Versuchssauen war um
0,16 % höher (p<0,01) als in der Kontrollgruppe. Die Fett- und Eiweissgehalte der
Milch unterschieden sich zwischen den beiden Gruppen nicht. Infolge der höheren
Milchmenge gaben die Versuchssauen täglich höhere Mengen an Laktose, Eiweiß
und Energie über die Milch ab (Tabelle 5).
Tabelle 1: Wurfgröße, Ferkel- und Wurfmasse zur Geburt1
Gruppe Kontrolle
(- L-Carnitin)
Versuch
(+ L-Carnitin)
Ergebnis SAS, p
Faktor2
Anzahl der Würfe (n) 27 27 1 2 1*2
Ferkel geboren (n) 10,5±0,6 13,2±0,6 0,004 0,49 0,98
Lebendgeboren (n) 10,0±0,6 12,7±0,6 0,002 0,39 0,99
Totgeboren (n) 0,5±0,2 0,5±0,2 0,93 0,46 0,93
Ferkelmasse (kg) 1,62±0,05 1,46±0,05 0,02 0,01 0,91
Wurfmasse (kg) 15,8±0,8 18,2±0,7 0,03 0,005 0,84
1Least square means ± standard error aus zwei Reproduktioszyklen 2Faktor SAS: 1=L-Carnitin, 2=Laktationsnummer
Tabelle 2: Tägliche Lebendmassezunahme der Ferkel (nach Wurfstandartisierung)1
Gruppe Kontrolle (- L-Carnitin)
Versuch (+ L-Carnitin)
Ergebnis SAS, p
Faktor2
Anzahl der Würfe (n) 23 23 1 2 1*2
1-11 Säugetag (g) 213±8 243±8 0,01 0,03 0,72
12-18 Säugetag (g) 290±7 311±7 0,04 <0,0001 0,26
19 Säugetag -Absetzen (g) 318±7 331±7 0,23 <0,0001 0,51
Säugezeit, gesammt (g) 271±6 292±6 0,008 <0,0001 0,93
1Least Square Mittel ± Standardfehler, aus zwei Reproduktioszyklen 2Faktor SAS: 1=L-Carnitin, 2=Laktationsnummer,

237
Tabelle 3: Wurfmasseentwicklung (nach Wurfstandartisierung)1
Gruppe Kontrolle
(- L-Carnitin)
Versuch
(+ L-Carnitin)
Ergebnis SAS, p
Faktor2
Anzahl der Würfe 23 23 1 2 1*2
Geburt (kg) 15,8±0,5 14,3±0,5 0,06 0,004 0,98
Absetzen (kg) 91,4±1,9 97,3±2,0 0,04 <0,0001 0,88
LM-Zuwachs/Wurf (kg) 75,5±1,9 83,1±1,9 0,009 <0,0001 0,93
1Least Square Mittel ± Standardfehler, aus zwei Reproduktioszyklen 2Faktor SAS: 1=L-Carnitin, 2= Laktationsnummer
Tabelle 4: Milchleistung der Sauen am11. und 18. Laktationstag1
Gruppe Kontrolle
(- L-Carnitin)
Versuch
(+ L-Carnitin)
Ergebnis SAS, p
Faktor2
Sauen n 23 23 1 2 1*2
Tag 11 (g/Tag) 6191±330 7350±329 0,02 <0,0001 0,57
Tag 18 (g/Tag) 7771±304 8841±305 0,02 <0,0001 0,42 1Least Square Mittel ± Standardfehler, aus zwei Reproduktioszyklen 2Faktor SAS: 1=L-Carnitin, 2=Laktationsnummer

238
Tabelle 5: Milchinhaltsstoffe (11. Laktationstag)1
Gruppe Kontrolle
(- L-Carnitin)
Versuch
(+ L-Carnitin)
Ergebnis SAS, p
Faktor2
Anzahl
der Sauen
n 23 23 1 2 1*2
Fett (%) 7,92±0,22 7,53±0,22 0,21 0,15 0,06
Eiweiß (%) 4,65±0,07 4,68±0,07 0,72 0,98 0,14
Laktose (%) 5,60±0,04 5,76±0,04 0,009 0,33 0,52
Energie (MJ/kg) 5,08±0,09 4,96±0,09 0,35 0,16 0,13
Fett (g/Tag) 497±31 554±31 0,20 <0,0001 0,62
Eiweiß (g/Tag) 285±14 343±14 0,007 <0,0001 0,27
Laktose (g/Tag) 347±19 423±19 0,009 <0,0001 0,44
Energie (MJ/Tag) 31,7±1,8 36,4±1,8 0,07 <0,0001 0,99
1Least Square Mittel ± Standardfehler, aus zwei Reproduktioszyklen 2Faktor SAS: 1=L-Carnitin, 2=Laktationsnummer
Zusammenfassung Es wurde ein Sauenversuch vorgenommen, in dem die Wirkung einer L-
Carnitinsupplementierung auf die Reproduktionsleistung untersucht wurde. 40
Jungsauen wurde in eine Kontroll- und eine Versuchsgruppe eingeteilt. Die Tiere der
Versuchsgruppe erhielten während der Trächtigkeit täglich 125 mg L-Carnitin und
während der Laktation täglich 250 mg L-Carnitin. Die Sauen der Versuchsgruppe
erzeugten pro Wurf 2,7 Ferkel mehr als die der Kontrollgruppe. Nach einer
Wurfstandardisierung nahmen die Ferkel der Versuchsgruppe bis zum Absetzen
durchschnittlich um 21 g/Tag als die der Kontrollgruppe mehr zu. Die höheren
Zunahmen resultieren aus einer höheren Milchleistung der Sau, verbunden mit einer
höheren Nährstoffbereitstellung. Die Wirkungen der Zulage an L-Carnitin auf die
Anzahl geborener Ferkel, Wachstum der Ferkel und die Milchleistung der Sauen
waren statistisch signifikant (P<0.05); sie zeigten sich in beiden
Reproduktionszyklen.

239
Summary This study intended to investigate the effect of L-carnitine supplementation on the
reproductive performance of sows. 40 sows were allotted to two groups, a control
group and an experimental group. Sows of the experimental group were
supplemented with 125 mg L-carnitine per day during pregnancy and with 250 mg L-
carnitine per day during lactation, over two consecutive reproductive cycles. The
number of piglets born was by 2.7 higher in the experimental group than in the
control group. During the suckling period, piglets of sows treated with L-carnitine
gained more weight than those of the control sows. This effect was due to a higher
milk yield in L-carnitine treated sows as compared with control sows. The effects of L-
carnitine on number of piglets born, body weight gains of piglets and milk yield were
statistically significant (P<0.05); they were seen in both reproductive cycles.
Literatur Eder, K., Ramanau, A., Kluge, H., 2001: Effects of L-carnitine supplementation on
performance parameters in gilts and sows. J. Anim. Physiol. Anim. Nutr. 85, 73-
80.
Kirchgessner, M., Schneider,R., Paulicks, B.R., 1992: Milchleistung sowie Milchfett-
und -energiegehalte bei Sauen mit unterschiedlichen Methioninversorgung. 2.
Mitteilung zum Bedarf laktierenden Sauen an schwefelhaltigen Aminosäuren. J.
Animal. Physiol. Anim. Nutr. 68, 244-253.
Musser, R.E., Goodband, R.D., Tokach, M.D., Owen, K.Q., Nelssen, J.l., Blum, S.A.,
Dritz, S.S. und Civis, C.A., 1997: Effects of L-carnitine fed during gestation and
lactation on sow and litter performance. Swine Day (Kansas State University),
57-79.
Räder, G., Roth-Maier, D.A., Kirchgeßner, M., 1990: Untersuchungen zur Erfassung
von Milchleistung und Milchinhaltsstoffe bei Sauen. Agribiol. Res. 43, 191-199.
Ramanau, A., Kluge, H., Spilke, J., Eder, K., 2002: Reproductive performance of
sows supplemented with dietary L-carnitine over three reproductive cycles. J.
Arch. Anim. Nutr. 56, 287-296.
Van der Steen, H. A. M., 1985: Maternal influence mediated by litter size during the
suckling period on reproduction traits in pigs. Livest. Prod. Sci. 13, 147-158.

240
Influence of conjugated linoleic acid isomers on the metabolism of arachidonic acid in human endothelial cells
Schleser, S., Becker, K., Körting, R., Eder, K. Institut für Ernährungswissenschaften, Martin-Luther-Universität Halle-Wittenberg, Emil-Abderhalden-Str. 26, D-06108 Halle/Saale Conjugated linoleic acids (CLA) are a group of positional and geometric isomers of
linoleic acid characterized by the presence of conjugated double bonds. Several
studies have shown that CLA are able to reduce the formation of eicosanoids in
various animal cells and tissues, which are formed in endothelial cells from
arachidonic acid (1-4). The two eicosanoids prostacyclin (PGI2) and thromboxane A2
(TXA2) and their counteracting play a role for maintenance of vascular homeostasis.
Alterations of the arachidonic acid metabolism and therefore the formation of the
eicosanoids (prostaglandins (PG) and thromboxanes (TX)) in endothelial cells
promote injury to vessel walls and the development of atherosclerosis (5, 6).
The aim of this study was to investigate the effects of two different isomers of CLA,
cis-9, trans-11 CLA and trans-10, cis-12 CLA, on the metabolism of arachidonic acid
and especially on the release of eicosanoids in human aortic endothelial cells. In this
respect, we proposed to determine also the amounts of arachidonic acid in
endothelial phospholipids, as well as gene expression or activities of enzymes
included in the production of eicosanoids: ∆5-, ∆6-desaturase, secretory
phospholipase A2 (sPLA2), cyclooxygenase-1 and -2 (COX-1, COX-2).
Materials and Methods Human aortic endothelial cells (PromoCell, Heidelberg) were grown in endothelial cell
growth medium supplemented with 5% fetal calf serum (PromoCell, Heidelberg) and
incubated for 24 h at 37°C with 5 or 50 µmol/L cis-9, trans-11 and trans-10, cis-12
CLA (Cayman Chemical, Ann Arbor, USA), followed by an 1h incubation in Hank`s
Balanced Salt Solution (HBSS). Total lipids were extracted with hexan/isopropanol
(3:2 v/v) (7) and individual lipid fractions were separated by a solid-phase extraction
method as described by Suzuki et al. (8) with modifications. Lipid fractions were
transmethylated and separated by gas chromatography. The release of eicosanoids
(6-keto PGF1α as stable prostacyclin derivate, TXB2 as stable TXA2 derivate, PGF2α
and PGE2) and the activity of sPLA2 were determined in HBSS supernatants by
ELISA and other Assay Kits (Cayman Chemical). Gene expression of ∆5-desaturase,

241
∆6-desaturase, sPLA2 and COX-1 was estimated by quantitative fluoroscence-based
real-time reverse transcriptase-polymerase chain reaction (using MJ Research
Opticon). Gene expression of COX-2 was determined by semiquantitative RT-PCR,
electrophoresis and UV-translumination. The Results are expressed as a ratio of
approximate copy number of the specific PCR products to that of the housekeeping
gene glyceraldehyde-3-phosphatase dehydrogenase (GAPDH).
Statistical analysis. Treatment effects were analyzed using one-way ANOVA. For
statistically significant F-values, means were compared by Fisher`s multiple range
test. Differences with P < 0.05 were considered significant.
Results Concentrations of CLA isomers in lipid fractions of human aortic endothelial cell
lipids. Both CLA isomers were incorporated in a concentration-dependent manner
into endothelial cell lipids. After incubation of cells with 5 µmol/L of both CLA isomers,
the concentrations of either CLA isomer were similar in neutral lipids, phosphatidyl
choline (PC) and phosphatidyl ethanolamine (PE); after incubation with 50 µmol/L of
both CLA isomers the concentrations of either CLA isomer were significantly higher
in PC than in PE or neutral lipids (Data not shown). Concentrations of arachidonic acid in phospholipids of human aortic endothelial cells. The concentration of
arachidonic acid was generally
much higher in PE than in PC
(Fig. 1). Both CLA isomers
reduced the concentration of
arachidonic acid in PE in a
concentration-dependent
manner; the effect was similar
for both CLA isomers. The
concentration of arachidonic
acid in PC was not altered by
treating cells with 5 or 50 µmol/L
of either cis-9, trans-11 CLA or
trans-10, cis-12 CLA.
0
2
4
6
8
10
12
14
g/10
0 g
tota
l fat
ty a
cids
PE PCa
c
b
Control c9,t11,5 µmol/L
c9,t11,50 µmol/L
t10,c12,50 µmol/L
t10,c12,5 µmol/L
b
bc
FIGURE 1 Concentration of AA in PE and PC of control and CLA-incubated human aortic endothelial cells. Values are means ± SD (n=6). Means with different superscript letter differ significantly, P<0.05.

242
Relative mRNA concentrations of ∆5- and ∆6-desaturase. Relative mRNA
concentration of ∆5-desaturase did not differ between control cells and cells treated
with 5 or 50 µmol/L of cis-9, trans-11 CLA or trans-10, cis-12 CLA. Cells treated with
50 µmol/L of trans-10, cis-12 CLA had a significantly lower relative mRNA
concentration of ∆6-desaturase than control cells; cells treated with 50 µmol/L of cis-
9, trans-11 CLA tended (P<0.10) towards a lower mRNA concentration of that
enzyme than control cells. Cells treated with 5 µmol/L of cis-9, trans-11 CLA or trans-
10, cis-12 CLA did not differ from control cells in their relative mRNA of ∆6-
desaturase (Data not shown).
Relative mRNA concentration and activity of sPLA2. Cells treated with 5 µmol/L of
either cis-9, trans-11 CLA or trans-10, cis-12 CLA did not differ from control cells in
the relative mRNA concentration of sPLA2 while cells treated with 50 µmol/L of either
cis-9, trans-11 CLA or trans-10, cis-12 CLA had a lower relative mRNA concentration
of that enzyme than control cells (Fig. 2A). Cells which were treated for 24 h with 5
or 50 µmol/L of cis-9, trans-11 CLA had a significantly lower activity of sPLA2 than
control cells; cells treated with 5 µmol/L or 50 µmol/L of trans-10, cis-12 CLA did not
differ from control cells in the activity of sPLA2 (Fig. 2B).
0
40
80
120
160
200
sPLA
2/GAP
DH
a
b
ab
a
b
A
Control c9,t11,5 µmol/L
c9,t11,50 µmol/L
t10,c12,50 µmol/L
t10,c12,5 µmol/L
0
10
20
30
40
Act
ivity
(pm
ol/m
in/1
06 cel
ls) ab
ab
Control c9,t11,5 µmol/L
c9,t11,50 µmol/L
t10,c12,50 µmol/L
t10,c12,5 µmol/L
a
b
B
b
FIGURE 2 Relative mRNA concentration (A) and activity (B) of sPLA2 in control and CLA-incubated human aortic endothelial cells. Values are means ± SD (n=6). Means with different superscript letter differ significantly, P<0.05.
Release of eicosanoids from endothelial cells. Cells treated with 5 µmol/L of cis-9,
trans-11 CLA did not differ in the release of 6-keto-PGF1α, TXB2, PGF2α and PGE2
into the medium from control cells (Table 1). Cells treated with 5 µmol/L of trans-10,
cis-12 CLA released less 6-keto-PGF1α into the medium than control cells but did not
differ from control cells in the release of TXB2, PGF2α and PGE2 into the medium.

243
Cells treated with 50 µmol/L of either cis-9, trans-11 CLA or trans-10, cis-12 CLA
released less of all of the eicosanoids analysed than control cells. There was no
difference between cells treated with 50 µmol/L of cis-9, trans-11 CLA and those
treated with 50 µmol/L of trans-10, cis-12 CLA in the release of all the eicosanoids
measured. The ratio o6-keto PGF1α/ TXB2 was not altered in cells incubated with 5
or 50 µmol/L of either cis-9, trans-11 CLA or trans-10, cis-12 CLA as compared with
control cells.
TABLE 1 Amounts of eicosanoids released during incubation for 1 h in Hank´s Balanced Salt Solution from human aortic endothelial cells that were preincubated in media without CLA (control) or with 5 or 50 µmol/L of cis-9,trans-11 or trans-10,cis-12 CLA1,2 Treatment Control Cis-9, trans-11 CLA Trans-10, cis-12 CLA
5 µmol/L 50 µmol/L 5 µmol/L 50 µmol/L
fmol/106 cells
6-keto-PGF1α 227 ± 99a 216 ± 88a 48 ± 19b 99 ± 50b 60 ± 17b
TXB2 241 ± 137a 275 ±132a 53 ± 23b 176 ± 89ab 100 ± 49b
PGF2α 1342 ± 236a 1363 ± 409a 654 ± 296c 1111 ± 501ab 694 ± 331bc
PGE2 1218 ± 446a 1022 ± 465a 312 ± 101c 862 ± 563ab 489 ± 227bc
fmol/fmol
6-keto-PGF1α/ TXB2
0.92 ± 0.40 0.82 ± 0.30 1.05 ± 0.51 0.60 ± 0.35 0.86 ± 0.11
1 Values are means, n=6 2 Values within one row without a common superscript differ, P<0.05
Relative mRNA concentrations of
COX-1 and COX-2. Cells treated
with 5 µmol/L of cis-9, trans-11
CLA had a higher relative mRNA
concentration of COX-1 than
control cells; cells treated with 50
µmol/L of cis-9, trans-11 CLA, 5 or
50 µmol/L of trans-10, cis-12 CLA
did not differ from control cells in
the relative mRNA concentration of
that enzyme (Fig. 4). Cells treated
with 50 µmol/L of cis-9, trans-11
CLA had a lower mRNA
0
50
100
150
200
250
CO
X/G
APD
H
COX-1 COX-2
b b
Control c9,t11,5 µmol/L
c9,t11,50 µmol/L
t10,c12,5 µmol/L
a
ab
t10,c12,50 µmol/L
ab
AB
B
A
A
B
FIGURE 3 Relative mRNA of COX-1 and -2 in control and CLA-incubated human aortic endothelial cells. Values are means ± SD (n=6). Means with different superscript letter differ significantly, P<0.05.

244
concentration of COX-2 than control cells; in cells treated with 50 µmol/L of trans-10,
cis-12 CLA, the mRNA concentration of that enzyme tended to be lower (P<0.10)
than in control cells. Cells treated with 5 µmol/L of cis-9, trans-11 CLA or trans-10,
cis-12 CLA did not differ from control cells in the relative mRNA concentration of
COX-2.
Discussion The observation that both CLA isomers used in this study are able to inhibit the
formation of eicosanoids in endothelial cells agrees with a recent study in which cis-
9, trans-11 CLA and trans-10,cis-12 CLA also reduced the release of PGI2 and other
eicosanoids in venous endothelial cells (6, 9). The reduced formation of all
determined eicosanoids by CLA might be the result of a diminished availability of
arachidonic acid, which is rate-limiting in the production of eicosanoids. A decreased
activity of sPLA2 together with a lower concentration of arachidonic acid in PE, the
major substrate of PLA2, might reduce the concentration of arachidonic acid available
for cyclooxygenase reaction. Lower concentrations of arachidonic acid in PE of
endothelial cells treated with the CLA isomers might have been caused by a lower
activity of ∆6-desaturase, the rate-limiting enzyme in the formation of arachidonic
acid from linoleic acid. Previous studies in cells and animals also showed that various
CLA isomers suppress ∆6-desaturation of linoleic acid leading to lower
concentrations of arachidonic acid in cell or tissue lipids (10, 11, 12). A reduced gene
expression of the inducible enzyme COX-2 by various CLA isomers was also
observed in recent studies in murine macrophages and hepatoma cells (13, 14).
Some studies found a correlation between the expression of COX and the formation
of eicosanoids in cells treated with CLA (11, 12, 15).
In conclusion, this study shows that high concentrations of cis-9, trans-11 CLA and
trans-10, cis-12 CLA are able to lower concentration of arachidonic acid and
therefore the release of various eicosanoids from human aortic endothelial cells.
Summary In this study, the effects of 5 or 50 µmol/L cis-9, trans-11 and trans-10, cis-12 CLA on arachidonic acid amounts and therefore the release of eicosanoids in human aortic endothelial cells were determined. Cells treated with 50 µmol/L of cis-9, trans-11 or trans-10, cis-12 CLA moreover, had a lower amount of arachidonic acid in their phosphatidyl ethanolamine fraction and a lower mRNA concentration and activity of secretory phospholipase A2 than control cells (P<0.05). These data suggest that eicosanoid formation was impaired by a reduced availability of arachidonic acid for

245
the cyclooxygenase pathway. The present study shows that cis-9,trans 11-CLA and trans-10, cis-12 CLA lower the concentration and therefore the release of various eicosanoids from human aortic endothelial cells. References (1) Liu K L & Belury M A (1998): Conjugated linoleic acid reduces arachidonic acid content
and PGE2 synthesis in murine keratinocytes. Cancer Lett. 127, 15-22 (2) Whigham L D, Cook E B, Stahl J L, Saban R, Bjorling D E, Pariza M W & Cook M E
(2001): CLA reduces antigen-induced histamine and PGE2 release from sensitized guinea pig tracheae. Am. J. Physiol. Regul. Integr. Comp. Physiol. 280, R908-R912
(3) Kavanaugh C J, Liu K L & Belury M A (1999): Effects of dietary conjugated linoleic acid on phorbol-ester induced PGE2 production and hyperplasia in mouse epidermis. Nutr. Cancer 33, 132-138
(4) Park H S, Ryu J H, Ha Y L, & Park J H Y (2001): Dietary conjugated linoleic acid (CLA) induces apoptosis of colonic mucosa in 1,2-dimethylhydrazine: a possible mechanism of the anticarcinogenic effect of CLA. Br. J. Nutr. 86, 549-555
(5) Vossen R C R M, van Dam-Mieras M C E, Lemmens, P J M R, Hornstra G & Zwaal R F A (1991): Membrane fatty acid composition and endothelial cell functional properties. Biochim. Biophys. Acta 1083, 243-251
(6) Torres-Duarte A P & Vanderhock J Y (2003): Conjugated linoleic acid exhibits stimulatory and inhibitory effects on prostanoid production in human endothelial cells and platelets. Biochim. Biophys. Acta 1640, 69-76
(7) Butte W (1983): Rapid method for the determination of fatty acid profiles from fats and oils using trimethylsulfonium hydroxide for transesterification. J. Chromatogr. 261, 142-145
(8) Suzuki E, Sano A, Kuriki T & Miki T (1997): Improved separation and determination of phospholipids in animal tissues employing solid phase extraction. Biol. Pharm. Bull. 20, 299-303
(9) Urquhart P, Parkin S M, Rogers J S, Bosley J A & Nicoleaou A (2002): The effect of conjugated linoleic acid on arachidonic acid metabolism and eicosanoid production in human saphenous vein endothelial cells. Biochim. Biophys. Acta 1580, 150-160
(10) Eder K, Slomma N & Becker K (2002): Trans-10,cis-12 conjugated linoleic acid suppresses the desaturation of linoleic acid and α-linolenic acid in HepG2 cells. J. Nutr. 132, 1115-1121
(11) Chuang L T, Thurmond J M, Liu J W, Kirchner S J, Mukerji P, Bray T M & Huang Y S (2001): Effect of conjugated linoleic acid on fungal delta-6 desaturase activity in a transformed yeast system. Lipids 36, 139-143
(12) Bretillon L, Chardigny J M, Gregoire S, Berdeaux O & Sebedio J L (1999): Effects of conjugated linoleic acid isomers on the hepatic microsomal desaturation activities in vitro. Lipids 34, 965-969
(13) Yamasaki M, Ikeda A, Hirao A, Tanaka Y, Rikimaru T, Shimada M, Sugimachi K, Tachibana H & Yamada K (2002): Dose-dependent effect of dietary conjugated linoleic acid on the growth of rat hepatoma dRLh-84 cells in vivo. J. Nutr. Sci. Vitaminol. (Tokyo) 48, 505-511.
(14) Yu, Y., Correll, P.H. & Vanden Heuvel, J.P. (2002) Conjugated linoleic acid decreases production of pro-inflammatory products in macrophages: evidence for a PPARγ-dependent mechanism. Biochim. Biophys. Acta 1581: 89-99.
(15) Iwakiri Y, Sampson, D A & Allen K G (2002) Suppression of cyclooxygenase-2 and inducible nitric oxide synthase expression by conjugated linoleic acid in murine macrophages. Prostaglandins Leukot. Essent. Fatty Acids 67, 435-443

246
The effect of dietary conjugated linoleic acids on desaturation of α-linolenic acid and the formation of eicosanoids in rats fed a diet containing linseed oil Slomma, N., Becker, K., Eder, K. Institut für Ernährungswissenschaften der Landwirtschaftlichen Fakultät, Martin-Luther-Universität Halle-Wittenberg, Emil-Abderhalden-Str. 26, 06108 Halle Introduction
Conjugated linoleic acids (CLA) are physiologically highly active compounds which
differ in their physiologic properties in several ways from linoleic acid (Pariza et al.,
2000). Among other physiologic effects, they affect the fatty acid metabolism.
Treatment of animals with CLA reduced the concentrations of arachidonic acid in
tissue lipids (Liu and Belury, 1998; Sebedio et al., 2001). This observation indicated
that CLA impairs the desaturation of linoleic acid. In opposite to arachidonic acid,
tissue concentrations of highly unsaturated (n-3) polyunsaturated fatty acids (PUFA)
such as docosapentaenoic acid and docosahexaenoic acid which are synthesised
from α-linolenic acid by ∆6-, ∆5- and ∆4-desaturases were increased in rats treated
with CLA as compared with control rats (Sebedio et al., 2001). This observation
suggests that CLA influences the desaturation of linoleic acid and α-linolenic acid in
different ways. To our knowledge, the effect of dietary CLA on the desturation of α-
linolenic acid in mammals and the incorporation of long-chain (n-3) PUFA has not yet
been studied in detail. C20-PUFA as constituents of membrane phospholipids are
precursors of eicosanoids; they are released by the action of phospholipase A2
(PLA2) and are substrates for cyclooxygeanses (COX). It has been assumed that
CLA alters the activities of enzymes involved in the formation of eicosanoids
(Urquhart et al., 2002). The objectives of the present study therefore were to
investigate the effect of dietary CLA on the metabolism of α-linolenic acid and to gain
some insight into the effect of CLA on enzymes involved in the formation of
eicosanoids.
Materials and Methods Thirty male Sprague-Dawley rats, supplied by Charles River (Sulzfeld, Germany),
with an initial body weight of 86 (± 2, SD) g were assigned to three groups of ten rats
each. During the first 4 wk of the experiment, rats were fed diets containing 30 g/kg
of either a CLA oil (32.2 cis-9,trans-11 CLA, 33.3 trans-10,cis-12 CLA g/100g fatty
acids) (TrofoCell, Hamburg, Germany), a sunflower oil (SFO) (C. Thywissen, Neuss,

247
Germany) or a high-oleic (HO)-SFO (C. Thywissen). In the 5th wk rats were fed the
corresponding diets supplemented with 50 g linseed oil (Kunella Feinkost, Cottbus,
Germany) per kg diet at the expense of corn starch. Diets were administered in
restricted amounts to standardise the diet intake. Water was freely available from
nipple drinkers. After completion of the feeding periods the rats were starved for 12 h
and killed by decapitation under light anastesia with diethyl ether. Plasma samples
were collected and the liver was excised, immediatly shock frozen in liquid nitrogen.
Plasma and liver samples were stored at –20°C and –80°C. Total lipids of the liver
were extracted, neutral lipids (NL), phosphatidyl choline (PC), - ethanolamine (PE)
were separated and fatty acid methyl esters were prepared as descibed by Eder et
al. (2002). Total RNA was isolated from frozen liver tissue using Trizol reagent
(Invitrogen, Karlsruhe, Germany) and cDNA synthesis employing
Omniscript™Reverse Transcriptase Kit (Qiagen, Hilden, Germany) according to the
manufacturer‘s protocol. Liver mRNA expression of ∆6-desaturase, COX-1 and COX-
2 was estimated by quantitative real time RT-PCR using the Rotor Gene 2000
system (Corbett Research, Mortlake, Australia). Concentrations of 6-keto-
prostaglandin (PG) F1α, PGF2α, PGE2 and thromboxane (TX) B2 were determined in
liver and plasma samples using EIA kits (Cayman Chemical, Ann Arbor, MI, USA). 6-
keto-PGF1α and TXB2 were determined as measure of the unstable PGI2 and TXA2,
respectively. The activity of the secretory (s)PLA2 was measured with a commercially
available kit from Cayman Chemical. The data were analysed by one-way ANOVA.
For statistical significant F values, individual means were compared by Fisher’s
multiple range test. Means were considered significantly different for P<0,05.
Results Final body weights of the rats did not differ between the three groups. Body weight
gains of the rats during the whole feeding period were 275 g, 278 g and 274 g for the
rats fed the diets containing CLA, SFO and HO-SFO, respectively (Pooled SD: 8.4g).
CLA in NL and phospholipids were detected only in rats fed the CLA diets, while the
concentrations of CLA were below the detection limit of 0.1 g per 100 g fatty acids in
rats fed the SFO or HO-SFO diets. In rats fed the CLA diet, the highest CLA
concentrations were detected in the NL fraction; the CLA concentrations in both
phospholipid fractions were markedly lower than those in the NL fraction. In NL and

248
PE, the concentration of cis-9,trans-11 CLA ( 5.71 and 1.69 g/100 g fatty acids, resp.)
was higher than that of the trans-10,cis-12 CLA (2.67 and 1.13 g/100 g fatty acids,
resp.); in PC the concentration of trans-10,cis-12 CLA (0.82 g/100 g) was higher than
that of cis-9,trans-11 CLA (0.56g/100 g fatty acids, resp.). Rats fed the CLA diets had
lower concentrations of total C20 PUFA [20:3(n-6)+20:4(n-6)+20:5(n-3)] (Table 1)
which are precursors of eicosanoids in liver PE and PC and a higher ratio of (n-3)
PUFA with 22 carbon atoms [22:5 (n-3) + 22:6 (n-3)] to 20:5 (n-3) in liver NL, PE and
PC than rats fed the SFO or HO-SFO diets (Figure 1B). Rats fed the CLA diets had
also higher concentrations of total desaturation products derived from α-linolenic acid
[20:5(n-3)+ 22:5(n-3)+22:6(n-3)] in liver NL and PC than rats fed the other two types
of fat (Figure 1A); regarding total desaturation products in PE, rats fed the CLA diet
had higher concentrations than rats fed the SFO diet but did not differ from rats fed
the HO-SFO diet. Rats fed the CLA diet, moreover, had a higher relative mRNA
concentration of ∆6-desaturase in the liver than rats of the other two groups (0.53,
0.20, 0.22% of GAPDH; CLA, SFO, HO-SFO).
Figure 1: A) Sum of total desaturation products derived from α-linolenic acid [20:5 (n-3)+22:5(n-3)+22:6 (n-3)], B) ratio of (n-3) PUFA with 22 carbon atoms [22:5(n-3)+22:6 (n-3)] to 20:5 (n-3) in hepatic NL, PC and PE, from rats fed diets containing 30g of either CLA, SFO or HO-SFO per kg. Results are means ± SD, n=10 for each treatment.
The concentrations of 6-keto-PGF1α, TXB2, PGF2α and PGE2 in liver and plasma were
markedly influenced by the type of dietary fat. Rats fed the SFO diets generally had
the highest concentrations of these eicosanoids whereas rats fed the CLA had the
lowest concentrations; the concentrations in the rats fed the diet containing HO-SFO
were between those of rats fed SFO or CLA (Table 2).
0
1
2
3
4
5
NL PC PE
g/g a
b b
ab
c
a
b
c
B
0
10
20
30
NL PC PE
g/10
0 g
CLA SFO HO-SFO
a b b
a
b
a
b
A
c
a

249
Table 1: C20 PUFA in hepatic PC and PE and activity of sPLA2 in liver of rats fed diets containing 30g of either CLA, SFO or HO-SFO per kg.
Basal dietary fat CLA SFO HO-SFO Pooled SD
[g/100 g fatty acids]
PC C20:3 (n-6) C20:4 (n-6) C20:5 (n-3) Total C20-PUFA
PE C20:3 (n-6) C20:4 (n-6) C20:5 (n-3) Total C20-PUFA
sPLA2 activity [nmol min-1mg-1 protein]
0.13 6.55c 7.09b 13.8c
0.47a 4.18c 5.37b 10.0c
1.93b
0.22 19.6a 3.38c 23.2a
0.33a,b 15.0a 4.48c 19.8a
2.16a
<0.1 11.9b 9.48a 21.6b
0.12b 9.06b 9.46a 18.6b
2.20a
0.36 1.16 0.78 0.94
0.29 1.02 0.70 1.18
0.23
Results are means, n=10 for each treatment. Means in one row without the same superscript letter (a,b,c) are significantly different by Fisher’s multiple range test (P<0.05).
The activity of sPLA2 in the liver was significantly lower in rats fed the CLA diets than
in rats fed the SFO or HO-SFO diets (Table 1). The activity of that enzyme in plasma
was lower in rats fed the CLA diets (33.8 nmol x min-1 x ml-1) than in rats fed the SFO
diets (45.4 nmol x min-1 x ml-1); rats fed the CLA diets and rats fed the HO-SFO diets
(34.0 nmol x min-1 x ml-1) did not differ in the activity of sPLA2 in plasma. The relative
concentrations of COX-1 mRNA in the liver were not different between the three
groups of rats; they were 0.47%, 0.72% and 0.66% of GAPDH (glyceraldehyde-3-
phosphate dehydrogenase) in the rats fed the diets containing CLA, SFO and HO-
SFO, resp. (Pooled SD: 0,26%). COX-2 mRNA was not detectable in livers of all
three groups of rats.
Discussion and Conclusions The finding that rats fed the CLA diets had higher concentrations of total desaturation
products derived from α-linolenic acid in liver NL and PC than rats fed the HO-SFO
diets and higher mRNA concentrations of ∆6-desaturase in the liver than rats of the
other two groups, suggests that dietary CLA stimulated desaturation of α-linolenic
acid. Hence, an increased expression of ∆6-desaturase, which is the rate limiting
enzyme in the desaturation of linoleic acid and α-linolenic acid (Brenner, 1989), might
be responsible for increased concentrations of long-chain (n-3) PUFA in rats fed the

250
CLA diets. The observation that dietary CLA increased hepatic concentrations of
docosahexaenoic acid and ratios of (n-3) PUFA with 22 carbon atoms and
eicosapentatenoic acid into liver lipids, moreover, suggests that dietary CLA
enhanced the elongation of eicosapentaenoic acid and its desaturation by ∆4-
desaturase. The markedly lower concentrations of 2-series eicosanoids in rats fed
CLA diets are in well accordance with other studies which showed that dietary CLA
reduces the formation of eicosanoids in various tissues of animals (Sugano et al.,
1998; Kavanagh et al., 1999). We assume that the formation of 2-series eicosanoids
is restricted by the amount of arachidonic acid released from membrane
phospholipids by the action of PLA2, while COX-1 is present in excess, and available
to convert the released arachidonic acid to the hydroxyendoperoxide PGH2
(Herschman, 1994). According to the results of this study, we assume that the
reduced formation of 2-series eicosanoids was predominantly caused by markedly
reduced amounts of arachidonic acid in phospholipids of rats fed the CLA diets. The
present study also suggests that CLA influences the synthesis of long-chain (n-6)
and (n-3) PUFA in a different manner.
Table 2: Concentrations of various eicosanoids in liver and plasma of rats fed diets containing 30 g/kg of either CLA, SFO or HO-SFO as basal dietary fats
Basal dietary fat CLA SFO HO-SFO Pooled SD
Liver Eicosanoids [ng/g] 6-keto-PGF1α TXB2 PGF2α PGE2
Plasma Eicosanoids [ng/ml] 6-keto-PGF1α TXB2 PGF2α PGE2
1.5b 2.5b 6.8c 2.7c
0.11c 8.76c 0.44c 0.67c
4.5a 8.0a 35.7a 13.8a
0.40a 45.0a 2.91a 3.52a
2.0b 7.2a 18.1b 7.1b
0.21b 32.7b 0.83b 1.30b
0.7 1.1 6.2 3.0
0.09 10.2 0.53 1.12
Results are means, n=10 for each treatment. Means in one row without the same superscript letter (a,b,c) are significantly different by Fisher’s multiple range test (P<0.05). Summary The objective of this study was to investigate the effect of dietary CLA on the metabolism of α-linolenic acid and on enzymes involved in the formation of 2-series eicosanoids in rats. An experiment was performed in which rats were fed diets with

251
30 g/kg of either a CLA oil (containing 32.2g cis-9,trans-11 CLA and 33.3g trans-10,cis-12 CLA per 100g), or SFO or HO-SFO for 4 wk. In the 5th wk, the same diets supplemented with 50g of linseed oil per kg diet as a source of α-linolenic acid were fed. Rats fed the CLA diets had a higher mRNA concentration of ∆6-desaturase in the liver, higher amounts of total desaturation products of α-linolenic acid [20:5(n-3)+22:5(n-3)+22:6(n-3)], a higher ratio of (n-3) PUFA with 22 carbon atoms to eicosapentaenoic acid and lower amounts of total C20-PUFA in liver lipids than rats of the other two groups. Rats fed the CLA diet had also lower concentrations of various eicosanoids in liver and plasma and a lower activity of sPLA2 in the liver than rats of the other two groups whereas the relative mRNA concentrations of COX-1 were not different between the three groups of rats. The study suggests that dietary CLA stimulates the formation and the incorporation of long-chain (n-3) PUFA into liver lipids but reduces the formation of 2-series eicosanoids in rats fed a diet containing α-linolenic acid.
References
Brenner RR (1989): Factors influencing fatty acid chain elongation and desaturation. In: The Role of fats in Human Nutrition. Eds. AJ Vergroesen, Crawford M, Academic Press London, pp 45-79
Eder K, Slomma N, Becker K (2002): Trans-10,cis-12 conjugated linoleic acid inhibits the desaturationof linoleic acid and α-linolenic acid and stimulates the synthesis of prostaglandins in HepG2 cells. J Nutr, 132, 1115-1121
Hara A and Radin NS (1978): Lipid extraction of tissue with a low-toxicity solvent. Anal Biochem, 90, 420-426
Herschman HR (1994): Regulation of prostaglandin synthase-1 and prostaglandin synthase-2. Cancer and Metastasis, 13, 241-256
Kavanagh CJ, Liu KL, Belury MA (1999): Effect of dietary conjugated linoleic acid on phorbol ester-induced PGE2 production and hyperplasis in mouse epidermis. Nutr Cancer, 33, 132-138
Liu KL and Belury MA (1998): Conjugated linoleic acid reduces arachidonic acid content and PGE2 sytnhesis in murine keratinocytes. Cancer Lett, 127, 15-22
Pariza MW, Park, Y, Cook ME (2000): Mechanisms of action of conjugated linoleic acid: evidence and speculation. Proc Soc Exp Biol Med, 223, 8-13
Raes K, Huyghebaert G, DeSmet S, Nollet L, Arnouts S, Demeyer D (2002): The deposition of conjugated linoleic acids in eggs of laying hens fed diets varying in fat level and fatty acid profile. J Nutr, 132, 182-189
Sebedio JL, Angioni E, Cardigny JM, Gregoire S, Juaneda P, Bordeaux O (2001): The effect of conjugated linoleic acid isomers on fatty acid profiles of liver and adipose tissue and their conversion to isomers of 16:2 and 18:3 conjugated fatty acids in rat. Lipids, 36, 575-582
Sugano M, Tsujita A, Yamasaki M, Noguchi M, Yamada K (1998): Conjugated linoleic acid modulates tissue levels of chemical mediators and immunoglobulins in rats. Lipids, 33, 521-527
Suzuki E, Sano A, Kuriki T, Miki T (1997): Improved separation and determination of phospholipids in animal tissue employing solid phase extraction. Biol Pharm Bull, 20, 299-303
Urquhart P, Parkin SM, Rogers JS, Bosley JA, Nicolaou A (2002): The effect of conjugated linleic acid on arachidonic acid metabolism and eicosanoid production in human saphenous vein endothelial cells. Biochim Biophys Acta, 1580, 150-160

252
EFFECT OF RAPESEED, LINSEED AND FISH OILS ON RUMEN FERMENTATION, BIOHYDROGENATION OF FATTY ACIDS AND CLA CONTENT IN POSTRUMINAL DIGESTA IN VITRO Szumacher-Strabel, M.1, Potkański, A. 1, Jalc, D. 2, Zelenak, I.2, Kowalczyk, J.3, Cieślak, A.1 1Department of Animal Nutrition and Feed Management, August Cieszkowski Agricultural
University, Wołyńska 33, 60-637 Poznań, Poland 2Slovak Academy of Science, Institute of Animal Physiology,
040 01 Kosice, Slovak Republik 3The Kielanowski Institute of Animal Physiology and Nutrition,
Polish Academy of Sciences,05-110 Jabłonna, Poland
Three in vitro experiments to examine effect of diets differing in forage level and fat
supplements were carried out. Experimental diets were composed of forage (alfalfa) or forage
(alfalfa) and concentrate (corn): 100% of forage, 60% of forage:40% of concentrate and 40%
of forage:60% of concentrate, respectively in 1st, 2nd and 3rd experiment. The study was
carried out using rumen simulation technique (Rusitec) described by Czerkawski and
Breckenridge (1977). The complete unit consisted of four vessels (V1, V2, V3 and V4,
respectively) with volume 850 mL each. The vessels inoculum was obtained from three
ruminally cannulated Slovak merino sheep (mean body weight 43.6 ± 2.1 kg) fed with
adequate experimental diets in two equal meals. Fermentation inocula (solid and liquid) were
collected through the rumen cannula immediately before the morning feeding and transferred
to artificial rumen. On the first day of each experiment, 450 mL of strained rumen fluid and
400 mL of artificial saliva were dispensed to each vessel. Squeezed particulate rumen
contents (80g) were weighted into a nylon bag (pore size 100µm), which was placed in the
side of the food container in each vessel. After 24h the bag with original solid inoculum was
withdrawn and a bag with the adequate experimental diet was supplied. On subsequent days
the bag that had remained two days in each vessel was replaced by a new bag with the
experimental diet. Therefore two bags were present at any time and one of them was removed
each day to give a 48h of incubation. The diet used as feed for the incubation vessels was the
same as the diet offered to the donor sheep. A continual infusion of artificial saliva (pH 8.4)
at the rate 616-645 mL.day-1 was maintained through each vessel. From the first day of
incubation period each nylon bag in V1, V2, V3 and V4 contained 30g (8,94g DM) of the fresh
alfalfa in the 1st experiment, 18g (5,4g DM of fresh alfalfa and 4,13 (3,6g DM) of crushed
corn in the 2nd experiment and finally 12g (3,6 g DM) of fresh alfalfa and 6,2 (5,4g DM) of

253
crushed corn in the 3rd experiment. In each experiment fermentation vessels –V2 received
daily 5% (wt/wt) addition of linseed oil (LO), V3 received 5% addition of rapeseed oil (RO)
and V4 received 5% addition of fish oil (FO), respectively. The experiment in Rusitec lasted
13 days. To ensure a steady –state within the vessels a 7-day adaptation period followed by a
6-day collection period was carried out. On days 8-13 the samples were collected. The gas
produced was collected in special bags and the volumes of gas were measured by gas-meter
and methane concentrations were analyzed in gas chromatograph (Perkin-Elmer 8500) as
reported by Czerkawski and Clapperton (1968). Liquid effluent was collected in flasks
containing a solution of sodium azide ( 0.1% wt. vol –1) and samples were taken for volatile
fatty acids (VFA), fatty acids (FA) and ammonia nitrogen (NH3 –N). The daily production of
VFA were analyzed by the gas chromatography procedure (Cottyn and Boucque 1968) using
crotonic acid as the internal standard in gas chromatograph. Ammonia nitrogen concentration
was measured by a microdiffussion method (Conway, 1962), fatty acids were analyzed by
Cieslak et al. (2003). Dry matter, ash and nitrogen were determined according to the methods
of the Association of Official Analytical Chemists (AOAC 1995). Neutral detergent fibre
(NDF), acid detergent fibre (ADF) and cellulose analyses in feed and residual feed samples
were carried out according to Goering and Van Soest (1970). Nitrogen (N) incorporated by
the microflora (Nm) was estimated by the difference between total nitrogen –Nt (liquid
overflow + bag feed residue) and NH3N (Nm = Nt –NH3N) mg.day-1 and efficiency of
microbial synthesis (EMS) = Nm / OMF (organic matter fermented)mg.g-1 (Alves de Oliveira
et al., 1979). The other fermentation variables – energetic efficiency of VFA (Orskov et al.,
1968), OMF (Demeyer and Van Nevel, 1979), production, utilization and recovery of
metabolic hydrogen (Demeyer, 1991) were calculated from the stoichiometry of rumen
fermentation.
Means of results from treatments were compared with one-way analysis of variance
(ANOVA). Treatment means were separated using Duncan΄s multiple-range test at the 5%
level of probability.
In the first experiment, addition of oil up to 5% in DM as LO, RO or FO to 100%
fresh alfalfa diet had no effect on some basal parameters of rumen fermentation in vitro. The
rumen degradation of dry matter and organic matter after 48h of incubation in the
fermentation fluid was slightly (not significantly) reduced by each type of oil
supplementation. In the present study, the oils (LO, RO, FO) affected the rumen fermentation
pattern with higher molar proportion of propionate ( +5.7,+1.8, +7.6%) and smaller acetate to
propionate ratio. Our results showed that used oils differentially affected acetate production,

254
but its molar proportion were significantly (LO, FO) or slightly (RO) reduced. Similarly,
reduced butyrate molar proportion was observed after RO and FO supplementation. The
fermentation of oil supplemented diets was characterized by decrease of total gas production
in fermenter. Methane production was reduced by LO and FO about 24% and 23%,
respectively. However, methane production was not reduced by RO supplementation. The
other parameters of rumen fermentation were calculated from the stoichiometric relationships
in the rumen. The energetic efficiency of VFA (E) was significantly increased in V2 , V3 and
V4, respectively. This was evoked by increased proportion (mol%) of propionate and decrease
mol% of butyrate in the diets supplemented with oils. The production and utilization of
metabolic hydrogen (H2) were not affected, but recovery of metabolic H2 was significantly
increased in V2 , V3 and V4.
In the 2nd experiment the oil supplementation up to 5% in DM to feed ration had no
effect on some basal parameters of rumen fermentation in vitro in V2, V3 and V4. The mean
rumen pH was 6.94 and was slightly (not significantly-NS) lower in oil supplemented diets.
The level of ammonia nitrogen was similar in all fermentation vessels. The rumen degradation
of dry matter (DM) and organic matter (OM) after 48h of incubation in the fermentation fluid
was slightly (NS) reduced by each type of oil supplementation. The digestibility’s of
detergent fibre (NDF, ADF), cellulose and hemicellulose were similarly among the groups.
There were not significantly differences between control and oil supplemented diets. We can
state only the tendency of lower values of dietary detergent fibre components (NDF, ADF) in
oil supplemented diets compared to control. Total VFA production as well as the VFA
production expressed as mol VFA/ kg. digested DM were not affected by used oils. The
supplementation of LO significantly (P<0.01) or slightly (FO, RO) but not significantly
decreased the acetate production in the diet consisting fresh alfalfa and corn (60%:40%) in
Rusitec. But molar proportions (moL%) of acetate were significantly reduced by all three oils.
Molar proportions of propionate were significantly higher about 8.8% and 6.7% by LO and
FO supplementation. RO supplementation caused slightly increase (about 1%) moL% of
propionate. Therefore the reduction of acetate to propionate ratio after LO and FO, but not
after RO supplementation was found. Also reduced butyrate production (as well as molar
proportion) was observed after FO supplementation in V4. RO and LO supplementation
slightly (NS) reduced butyrate production and molar proportion of butyrate. The total gas
production was similar in all fermentation vessels. Linseed and fish oil decreased the methane
production about 22% and 5%, rapeseed oil increased the methane production about 6% but
these differences were not significant. The other parameters of rumen fermentation were

255
calculated as in the previous experiment from the stoichiometric relationships in the rumen.
The energetic efficiency of VFA (E) was significantly (P<0.001) increased in V2 and V4 and
slightly (NS) increased in V3, respectively. This is evoked by increased molar proportion of
propionate in V2 and V4. The production of metabolic hydrogen was slightly (NS) decreased
during fermentation in oil supplemented diets. The utilization of metabolic hydrogen was
significantly increased in V2 or unchanged in V3 and V4, respectively. The recovery of
hydrogen was significantly higher in V2 and V4 (P<0.001) and numerically higher in V3. Our
results showed that the numerical increase of microbial N production and efficiency of
microbial synthesis were associated with increase (NS) in organic matter fermented (OMF) in
vessels fed with RO, whilst the inclusion of LO and FO was associated with decrease OMF.
In the 3rd experiment oil supplementation to diets composed mostly of concentrate had
no effect on some basal parameters of rumen fermentation in vitro in V2, V3 and V4. The mean
rumen pH was about 7.0. The level of ammonia nitrogen was significantly lower in V2,
numerically lower in V3 and numerically higher in V4. The rumen degradation of dry matter
and organic matter after 48h of incubation in the fermentation fluid were similar in all diets.
The digestibility’s of detergent fibre (NDF, ADF) and hemicellulose were similarly among
the groups. Consequently, there were not significant differences between control and oil
supplemented diets. We can state only the decrease (P<0.001 in V2 and V4 , P<0.01 in V3 ) of
cellulose digestion in oil supplemented diets. From the three oils used in this study, the fish
oil had no significant, but more depressive effect on fibre digestion. The total VFA production
as well as the VFA production expressed as moL VFA. kg digested DM were not affected by
used oil. The supplementation of LO and FO slightly decreased or RO slightly increased (not
significant-NS) of acetate production in the diet consisting 40% fresh alfalfa and 60% corn in
Rusitec. But molar proportion (moL%) of acetate were significantly (P<0.001) or numerically
decreased after LO and FO supplementation or numerically increased after RO
supplementation. The production of propionate was not affected by different fat sources, only
the tendency of higher values was observed in V2, V3 and V4 when compared to control one.
Molar proportions of propionate were significantly higher (about 6.2%) in V2 or numerically
higher (about 3% and 2.1% ) in V3 and V4. The calculation of data from acetate and
propionate production showed the significant decrease of acetate to propionate ratio in all
experimental diets supplemented with oils. Also reduced n-butyrate production, as well as
molar proportion, was observed after oil supplementation. The total gas production was
similar in all fermentation vessels. Linseed oil decreased the methane production about
12.4%, RO and FO increased the methane production about 26.5% and 0.4%, but these

256
differences were not significant. The energetic efficiency of VFA (E) was significantly
(P<0.001) increased in V2 and numerically (NS) increased in V3 and V4, respectively. This
was evoked by increased molar proportion of propionate in V2.V3 (P<0.01) and V4 (NS). The
production of metabolic hydrogen as well as utilization of metabolic hydrogen were not
affected by different fat sources. The recovery of metabolic hydrogen was significantly
(P<0.001) higher after LO supplementation or numerically (NS) higher after RO and FO
supplementation. We observed statistically significant increase in the level of CLA in all
experiments. Concentration of TVA, the precursor of CLA increased in the 1st and 2nd
experiment respectively with supplementing diets with oils, whereas in 3rd experiment, when
the experimental diet was composed in 40% of alfalfa and 60% of corn, level of TVA
depended on the type of oil supplemented. The highest increase was observed when LO was
added to the ration. RO had lower but also statistically significant effect on TVA level.
Feeding FO no effect was observed. In the 1st experiment when oils were supplemented to
fresh alfalfa we observed statistically significant increase in either saturated fatty acid level
(SFA), or monounsaturated fatty acid (MUFA) and polyunsaturated fatty acid (PUFA) (in
µg/g rumen fluid). Among the oils used, FO had the lowest effect. Statistically significant
increase in SFA, MUFA and PUFA was also observed when diet composed of alfalfa and
concentrate (60:40) was used. In this case the highest increase in beneficial PUFA and MUFA
was observed when FO was supplemented. In the 3rd experiment, when experimental diet was
composed in 60% of crushed corn, only LO increased level of SFA, whereas RO and FO
addition resulted in statistically significant decrease in SFA level. Also LO had the highest
effect on increased MUFA level, though RO increased level of MUFA, too. FO had no effect
on MUFA. LO and FO statistically significant increased level of PUFA in the rumen fluid.
Plant oils as far as fish oils affected fatty acid composition of rumen fluid. We
observed some beneficial changes but the final effect depends on the correlation between the
fatty acid composition of fat supplemented to the diet, and also type of diet fed (forage to
concentrate ratio). Though the fresh forage (e.g. alfalfa) is a rich source of PUFAs, and can
increase level of demanded FAs, the best results were obtained when standard diet composed
of 60% of forage and 40% of concentrate was used.

257
References
Alves de Oliveira, L., Jean-Blain, C., Komisarczuk- Bony, S., Durix, A., Durier, C., 1997. Microbial thiamin metabolism in the rumen simulating fermenter (RUSITEC): The effect of acidogenic conditions, a high sulfur level and added thiamin. Br. J. Nutr., 78,599-613
AOAC: Association of Official Analytical Chemists, International. 1995. Official Method of Analysis. Vol. II. 16th ed. AOAC, Arlington, VA
Conway, E. J., 1962. Microdiffusion Analysis and Volumetric Error. 5th edn., Crosby Lockwood, London, UK
Cieślak A., Machmüller A., Potkański A., Szumacher-Strabel M., Scheeder M.R.L , 2003. Comparison of two extraction methods used to quantify the different C18 fatty acids in digesta of ruminants. Proceedings of the conference: Methodology of the novel evaluation, 24-25 April 2003, Olsztyn, Poland
Cottyn B. G., Boucque, C. V., 1968. Rapid method for the gas chromatographic determination of volatile fatty acids in rumen fluid. J. Agr. Food Chem., 16, 105-107
Czerkawski, J. W., Breckenridge, G., 1977. Design and development of a long term rumen simulation technique (Rusitec). Br. J. Nutr., 38, 371-384
Czerkawski, J. W., Clapperton, J. L., 1968. Analysis of gas produced metabolism of microorganisms. Lab. Pract., 17, 994-996
Demeyer, D.I., 1991. Quantitative aspects of microbial metabolism in the rumen and hindgut. In: Jouany, J.P.(ed): Rumen Microbial Metabolism and Ruminant Digestion , INRA, Paris, France, 217-237
Demeyer, D. I., Van Nevel, C. J., 1979. Effect of defaunation on the metabolism of rumen microorganisms. Br. J. Nutr., 42, 515-524
Goering, H. K., Van Soest, P. J., 1970. Forage Fiber Analysis. Agriculture handbook no. 379,USDA, Washington, DC, USA
Orskov, E. R., Flatt, W. P., Moe, W., 1968. Fermentation balance approach to estimate extent of fermentation and efficiency of VFA fermentations in ruminants. J. Dairy Sci., 51, 1429-1435

258
Einfluss von Vaccensäure auf den Fettsäurenmetabolismus in Ratten Kraft, J., Hoschek, L., Möckel, P., Zimmermann, S., Härtel, A., Jahreis, G. Friedrich-Schiller-Universität, Institut für Ernährungswissenschaften, Lehrstuhl Ernährungs-physiologie, Dornburger Str. 24, D-07743 Jena
Einleitung und Zielstellung Bereits 1980 beschrieben MAHFOUZ et al. und POLLARD et al. die In-vitro-Desaturation
von trans-Vaccensäure (tVA) zu cis,trans-C18:2-Derivaten durch die mikrosomale
∆9-Desaturase der Rattenleber. Erst etwa 20 Jahre später wurde der Metabolismus
der tVA an verschiedenen Tiermodellen (Rind, Maus, Ratte) untersucht (GRIINARI et
al. 2000, SANTORA et al. 1998, 2000, BANNI et al. 2001). Diese Arbeiten haben die
Bildung von konjugierter Linolsäure (CLA) aus tVA eindrucksvoll nachgewiesen. In
der vorliegenden Studie sollte untersucht werden, in welchem Umfang tVA zu CLA
desaturiert wird. Von besonderem Interesse war die Frage, ob sich die Erythrozy-
tenmembran als Biomarker für die Umwandlung von tVA zu CLA eignet. Obwohl zu
erwarten ist, dass tVA in den verschieden Gewebearten einem differenzierten Meta-
bolismus unterliegt, gibt es bisher dazu keine Untersuchungen, so dass dieser Fra-
gestellung nachgegangen werden sollte.
Material und Methoden Wachsende männliche und weibliche Ratten (N = 24) wurden geschlechtsgetrennt
randomisiert in 3 Supplementationsgruppen (0 %, 0,5 % und 1 % Prüfsubstanz) auf-
geteilt. Als Prüfsubstanz wurde ein kommerziell erhältliches Vaccensäure-Präparat
(VA) eingesetzt. Hierbei handelte es sich um ein Fettsäurengemisch, dessen Anteil
an tVA und cis-Vaccensäure (cVA) 31 % bzw. 11 % der Fettsäurenmethylester (FA-
ME) betrug. Um eine isoenergetische Ration mit gleichem Fettgehalt zu erhalten,
wurde bei den Futtermischungen mit 0 % und 0,5 % VA-Anteil die entsprechende
Differenz durch Sojaöl ausgeglichen. Nach einer Adaptationsphase (9 d) folgte eine
Sammelphase, in der über 9 Tage Kot und Harn der Tiere quantitativ gesammelt
wurde. Am Ende der Intervention wurden die Tiere getötet, Blut und verschiedene
Gewebe bzw. Organe zur Analyse der Fettsäuren- und CLA-Isomerenverteilung ent-
nommen. Der Gehalt an einzelnen Fettsäuren in den Lipiden wurde mittels GC-FID,
die CLA-Isomerenverteilung unter Anwendung der Ag+-HPLC gemessen.
259
Ergebnisse Es wurden keine Unterschiede in der durchschnittlichen Futteraufnahme zwischen
den drei Gruppen festgestellt. Die Initialgewichte der Tiere waren nicht signifikant
verschieden. Die VA-Zulage beeinflusste die Wachstumsrate der Ratten zwischen
den Gruppen nicht (Tab. 1).
Tabelle 1: Körpergewicht und Futteraufnahme
0 % VA 0,5 % VA 1 % VA Körpergewicht [g] Beginn 110 ± 12 102 ± 11 106 ± 13 Ende 178 ± 27 173 ± 31 178 ± 35 Futteraufnahme [g/d] 16 ± 2 17 ± 3 17 ± 4
Die Gehalte an tVA und cVA waren im Rattenkörper sowie in den verschiedenen
Geweben und Organen der Zulagegruppen signifikant höher als bei den Kontrolltie-
ren. Die durchschnittliche Netto-Zunahme an tVA lag in Abhängigkeit von der Gewe-
beart zwischen 0,3 und 11,8 mg/g Fett (0,5 % VA) sowie zwischen 0,6 und 26,6 mg/g
Fett (1 % VA). Für die Summe der t11- und c11-Fettsäuren wurde die scheinbare
Wiederfindung in den Rattenkörpern und Geweben ermittelt. Die scheinbare Wieder-
findung der t11-Fettsäuren betrug in Abhängigkeit von der Behandlung durchschnitt-
lich 11 % (0,5 % VA) bzw. 19 % (1 % VA). Die c11-Fettsäuren wurden vergleichswei-
se prozentual effektiver eingebaut (14 % bzw. 20 %). Der CLA-Gesamtgehalt stieg
gewebespezifisch in Abhängigkeit von der Dosis um das 7- bis 14-fache bzw. um das
13- bis 27-fache an (Tab. 2).
Tabelle 2: Gehalte an Gesamt-CLA in den Geweben, Blut und Fäzes [mg/g Fett]
0 % VA 0,5 % VA 1 % VA ♂ ♀ ♂ ♀ ♂ ♀ Muskel 0,40 0,52 2,92 2,47 6,61 5,99 Fettgewebe 0,54 0,65 5,53 5,11 13,18 11,45 Leber 0,23 0,14 3,08 1,48 6,38 3,65 Nieren 0,38 0,39 2,25 3,43 8,57 6,97 Herz 0,26 0,25 1,85 1,00 3,74 2,15 Gonaden 0,53 0,71 4,22 4,26 10,56 10,05 Serum 0,63 0,71 3,86 2,11 6,74 4,65 Erythrozyten 0,09 - 1,42 2,53 2,85 2,96 Fäzes 2,95 2,91 2,20 2,10 2,01 2,01

260
Unter dem VA-Einfluss stiegen die absoluten Gehalte der CLA-Isomeren in den ver-
schiedenen Geweben an. Der Anteil an c/t-Isomeren erhöhte sich konzentrationsab-
hängig bis auf 93 % der Gesamt-CLA, gleichzeitig verminderte sich der Anteil an t,t-
und c,c-Isomeren (Abb. 1). Der Anstieg der absoluten Menge der einzelnen Isomeren
resultiert offenbar aus intramolekularen Isomerisierungsreaktionen. Von der tVA-
Menge, die im Rattenkörper zur Konversion zur Verfügung stand, wurden in Abhän-
gigkeit von der Behandlung im Mittel 25 % bzw. 26 % zu c9,t11-CLA desaturiert. Im
Gegensatz dazu wurde keine Konversion von c9,c11-CLA aus cVA nachgewiesen.
Die Ermittlung der Konversionsrate zeigte darüber hinaus, dass tVA in den einzelnen
Geweben unterschiedlich desaturiert wurde. Die höchste Konversionsrate wurde in
den Nieren, Testes und im weißen Fettgewebe festgestellt. Im Gegensatz dazu wur-
de im Herz und in der Leber, vor allem bei den weiblichen Tieren, weniger tVA desa-
turiert.
Abbildung 1: Prozentuale Verteilung der CLA-Isomerenanteile und c9,t11 in den
Lipiden des Fettgewebes und der Leber in Abhängigkeit von der
Supplementation [in % der Σ-CLA]
In den Fäzes lag der CLA-Gehalt der Kontrollgruppe im Mittel bei 2,9 mg/g Fett. In
den Zulagegruppen wurde signifikant weniger CLA ausgeschieden (P < 0,05;
0 % VA: 2,9 mg/g Fett; 0,5 % VA: 2,2 mg/g Fett; 1 % VA: 2,0 mg/g Fett). Das CLA-
Isomerenmuster der Fäzeslipide (hoher Anteil an t,t-, c/t- und c,c-10,12) unterschied
sich deutlich von dem der Gewebelipide.
0
20
40
60
80
1000% VA 0,5% VA 1% VA
t,t c,t/t,c c,c c9,t11 t,t c,t/t,c c,c c9,t11
% o
f ∑-C
LA
Fettgewebe Leber

261
Diskussion Mit Hilfe der scheinbaren Wiederfindung wird nur der Anteil der aufgenommenen
Fettsäuren betrachtet, welche in die Gewebe eingebaut wurden. Die scheinbare
Wiederfindung der t11- (c9,t11-CLA, tVA) und c11- (c9,c11-CLA, cVA) Fettsäuren
stieg nahezu linear mit der VA-Dosis an. Dabei unterschied sich die scheinbare Wie-
derfindung der Fettsäuren im Fettgewebe nur geringfügig vom Rattenkörper. Dem-
nach wurden diese Fettsäuren hauptsächlich im Fettgewebe eingebaut. Die gefun-
denen Ergebnisse bestätigen frühere Ergebnisse mit Mäusen (PALMQUIST & SANTORA
1999, SANTORA et al. 1998, 2000). Der beobachtete signifikante Anstieg des CLA-
Gesamtgehaltes als Folge der VA-Supplementation deckt sich mit den Angaben aus
der Literatur (PALMQUIST & SANTORA 1999, SANTORA et al. 2000, BANNI et al. 2001,
LOOR et al. 2002). Die Steigerung der CLA-Gehalte wurde unabhängig vom Ge-
schlecht sowohl im Rattenkörper als auch in den einzelnen Geweben, im Serum und
in der Erythrozytenmembran ermittelt. Die Akkumulation der CLA war gewebespezi-
fisch. Die höchsten CLA-Gehalte wurden im Fettgewebe und in den Gonaden festge-
stellt. Ein vergleichbares CLA-Verteilungsmuster nach CLA-Gabe an Ratten ist von
SUGANO et al. (1997) und ALASNIER et al. (2002) beschrieben worden. Die unter-
schiedliche Geweberetention von CLA ist bis heute weitgehend ungeklärt. Eine ver-
stärkte CLA-Akkumulation im Gewebe reflektiert dessen selektive Aufnahme oder
langsamere Metabolisierung. Im Gegensatz dazu deutet eine geringere CLA-
Deposition auf eine selektive Diskriminierung oder auf eine schnelle Metabolisierung
hin (YURAWECZ et al. 1999). CLA werden überwiegend in Neutrallipide und im be-
grenzten Ausmaß in Phospholipide inkorporiert (IP et al. 1996, 1997, 1999). Daraus
ergibt sich, dass CLA bevorzugt in Gewebe eingebaut werden, die einen hohen An-
teil an Neutrallipiden aufweisen (z. B. Fettgewebe).
Entsprechend den Ergebnissen aus dieser Studie besteht eine enge Beziehung zwi-
schen der tVA-Aufnahme und dem c9,t11-CLA-Gehalt im Gewebe. Bei der statisti-
schen Prüfung erwies sich dieser Zusammenhang als hochsignifikant (P < 0,001). Mit
steigender tVA-Aufnahme nahm der Gehalt an c9,t11-CLA im Gewebe linear zu. Die
Korrelationskoeffizienten liegen mit Werten von 0,97 (Fettgewebe, Karkass), 0,95
(Leber) und 0,94 (Rattenkörper) sehr hoch. Die Konversionsrate lässt Rückschlüsse
auf die Desaturation der im Gewebe gespeicherten tVA zu CLA ziehen. In allen Ge-
weben bzw. Organen, mit Ausnahme des Gehirns, wurde eine Konversion von tVA in
c9,t11-CLA nachgewiesen. Die berechnete Konversionsrate im Rattenkörper betrug

262
im Mittel 25 % (0,5 % VA) und 26 % (1 % VA). Bei Mäusen wurde eine
Konversionsrate von durchschnittlich 50 % ermittelt (PALMQUIST & SANTORA 1999,
SANTORA et al. 1998, 2000). Offensichtlich bestehen zwischen den Spezies Unter-
schiede in den Desaturaseaktivitäten. Die Berechnung der Desaturaseaktivität ergab
darüber hinaus, dass vor allem im Fettgewebe und in den Ovarien der Ratte die
Desaturation stattfand. Dieses Ergebnis untermauert die gewebespezifische
Expression der ∆9-Desaturase. An dieser Stelle soll besonders das Ergebnis
hervorgehoben werden, dass innerhalb von 18 Tagen Versuchsdauer der CLA-
Gehalt in den Lipiden der Erythrozytenmembran in Abhängigkeit von der tVA-
Aufnahme nahezu linear anstieg. Dieses Resultat beweist, dass die
Erythrozytenmembran bei der Ratte ein geeigneter Indikator für die Umwandlung von
tVA in CLA ist. tVA wurde als geeigneter Präkursor für c9,t11-CLA bestätigt. Im Gegensatz dazu
sprechen die vorliegenden Ergebnisse dafür, dass c9,c11-CLA nicht direkt aus cVA
gebildet wird.
In den Zulagegruppen wurde über die Fäzeslipide signifikant weniger CLA ausge-
schieden. Der höhere CLA-Gehalt in den Fäzeslipiden der Kontrolltiere ist in erster
Linie durch die im Futter enthaltene hohe Linolsäuremenge bedingt (Futter mit
0 % VA-Anteil: 1 % Sojaöl-Zusatz). Durch einen experimentellen Vergleich von kon-
ventionellen und keimfreien Ratten wurde eindrucksvoll gezeigt, dass Monogastriden
in der Lage sind, über die Darmmikrobenflora aus freier Linolsäure CLA zu bilden
(CHIN et al. 1994). Die direkte Synthese von CLA aus Linolsäure wurde z. B. für das
aus dem Rattenkolon isolierte Bakterium Lactobacillus reuteri nachgewiesen (YANG
1997). Langkettige, ungesättigte Fettsäuren werden im Kolon nicht absorbiert, son-
dern über die Fäzes exkretiert (CAREY et al. 1983). Da die Isomerisierung der Linol-
säure zu CLA im Kolon stattfindet, ist anzunehmen, dass CLA nur marginal resorbiert
werden und somit nicht zur Anreicherung der Körperlipide beitragen. Die Fäzeslipide
der Ratten unterschieden sich deutlich im CLA-Muster von den Gewebelipiden. Auf-
fällig war der dominierende Anteil an t10,c12-, t10,t12- bzw. c10,c12-CLA. Die Er-
gebnisse bestätigen Studien an Hunden und Katzen, in denen die Bildung von 10,12-
CLA bereits beschrieben wurde (FUKUDA et al. 2002). Es ist denkbar, dass das spezi-
fische Isomerenmuster aus der Bakterientätigkeit resultiert.
Die eigene Untersuchung sowie verschiedene tierexperimentelle Studien belegen,
dass tVA auch im Gewebe von Monogastriden als Präkursor für die Bildung von
c9,t11-CLA genutzt wird. Die Ergebnisse sind nicht ohne weiteres auf den Menschen

263
übertragbar; zumindest ist aber eine Abschätzung auf der Grundlage der ermittelten
Werte möglich. Die endogene Synthese von CLA aus tVA sollte vor allem bei der
Schätzung der CLA-Versorgung berücksichtigt werden. Die Aufnahme von tVA be-
trägt etwa 1 g pro Tag und Person, wobei Milch und Milchprodukte die wichtigsten
Quellen sind. Die Fütterung von tVA an Nutztiere - sowohl an Wiederkäuer als auch
an Monogastriden - kann die CLA-Gehalte von Milch und auch Fleisch zusätzlich er-
höhen. Diese Variante hätte gegenüber der Supplementation der Nahrung mit CLA
den Vorteil, dass sich dadurch hauptsächlich das c9,t11-CLA-Isomere anreichert.
Summary (Effect of Dietary Vaccenic Acid on Fatty Acid Metabolism in Rats) Vaccenic acid (VA; cis-11 C18:1 = CVA; trans-11 C18:1 = tVA) was fed to rats to de-
termine their capacity to desaturate VA into CLA as well as to figure out effects of VA
on the fatty acid metabolism. Young growing male and female rats were randomly
assigned to diets containing 0%, 0.5% and 1%VA. The study was divided into two
periods, an adaptation period (9 days) and a collection period (6 days). During the
last period faeces and urine were quantitatively collected. At the end of the study the
rats were killed, blood, carcass and tissues were collected for analyses of fatty acid
composition and CLA-isomer distribution. Food intake and body weight were not af-
fected by the treatment. In general, the contents of VA and CLA were enhanced pro-
portionally with increased VA intake. The highest content of CLA was found in white
adipose tissue and in gonads. Although the absolute amount of all CLA-isomers in-
creased, VA feeding led primarily to a postponement of the isomeric proportion in
favour to c9,t11 CLA. The conversion ratio of stored TVA in the treatment groups was
24.6% (0.5% VA) and 26.1% (1% VA). The faecal excretion of CLA was significantly
reduced in response to VA feeding. Altogether, the results demonstrate that VA is an
effective precursor desaturated to CLA in the majority of tissues. If desaturation of VA
and retention for CLA in humans were similar to the quantitative estimates in rats, VA
intake would contribute to a distinctly higher CLA supply.
Literatur Das Verzeichnis der zitierten Literaturstellen kann bei den Verfassern angefordert
werden.

264
The enrichment of fresh alfalfa with different sources of n-3 and n-6 polyunsaturated fatty acids and their effect on rumen fermentation and biohydrogenation in artificial rumen Potkański, A.1, Szumacher-Strabel, M.1, Jalc, D.2 , Zelenak, I.2, Kowalczyk, J.3, Cieślak, A.1 1Department of Animal Nutrition and Feed Management, August Cieszkowski Agricultural
University, Wołyńska 33, 60-637 Poznań, Poland 2Slovak Academy of Science, Institute of Animal Physiology
040 01 Kosice, Slovak Republik 3The Kielanowski Institute of Animal Physiology and Nutrition,
Polish Academy of Sciences, 05-110 Jabłonna, Poland
It is now recognised that n-3 fatty acids (FAs) are essential for normal growth, and
important for brain development, vision and immunity in infants; these FAs may also play a
vital role in the prevention and treatment of cardiovascular diseases (Williams, 2000). Results
of many experiments suggest that if the amount of fish oil is increased in ruminant diet there
is evidence that transfer and incorporation of the constituent fatty acids into rumen and hence
into milk is improved. Some authors suggest also that blend of different oils (mostly with fish
oil) cause greater than expected increase in trans vaccenic acid (TVA), conjugated linoleic
acid (CLA), eicosapentaenoic acid (EPA), docosahexaenoic acid (DHA) and other beneficial
polyunsaturated fatty acids (PUFAs) without causing metabolic disorders in the rumen.
The design of carried experiment was established on the basis of results obtained from
previous research also presented at the 9th Symposium (see Szumacher-Strabel et al., 2003),
when different type of pure oils were added to different type of diets. In this study the oils
from plants and animals as the sources of n-3 and n-6 fatty acids were used. The oils were
added as 5% supplement to the diet (60% fresh alfalfa and 40% corn) in artificial rumen. The
ratio of n-6 to n-3 fatty acids, which was equal 2, was determined according to the analysis of
PUFA in linseed, rapeseed and fish oil, respectively. Consequently, the aim of this work was
to study the effect of n-3 and n-6 fatty acids in the oils of plant and animal origin on rumen
fermentation and fatty acids level in artificial using rumen simulation technique (Rusitec).
The study was carried out using rumen simulation technique (Rusitec) described by
Czerkawski and Breckenridge (1977). The complete unit consisted of four vessels (V1, V2, V3
and V4, respectively) with volume 850mL each. The vessels inoculum was obtained from the
three ruminally cannulated Slovak Merino sheep (mean body weight 43.5± 2.1 kg) fed with
780g of dry matter (DM) of fresh alfalfa and 520g DM of crushed corn in two equal meals.

265
Fermentation inocula (solid and liquid) were collected through the rumen cannula
immediately before the morning feeding and transferred to artificial rumen. The solid digesta
(80g wet weight) were placed into nylon bags of 100µm pore size in each of the fermentation
vessels. The vessels were filled to overflowing with strained rumen fluid and artificial saliva
(1:1). Including the first day of the experiment, the vessels were supplied at daily intervals
with 5.4g DM of alfalfa (original DM of fresh alfalfa was 30%) and 3.6g of crushed corn. The
fermentation vessel –V2 received also 5% (wt.wt-1) addition of rapeseed oil (the source of n-6
fatty acids) and linseed oil (the source of n-3 fatty acids),V3 received 5% addition (wt.wt-1) of
fish oil (the source of n-6 fatty acids) and linseed oil. Fermentation vessel V4 received total
5% addition of all three oils. A continual infusion of artificial saliva (pH 8.4) at the rate 602-
623mL.day-1 was maintained through each vessel during duration of the experiment. The
experiment in Rusitec system lasted 13 days. To ensure a steady state within the vessels a 7-
day adaptation period followed by a 6-day collection period was carried out. On days 8-13 the
samples were collected. The gas produced was collected in special bags and the volumes of
gas were measured by gas-meter and methane concentrations were analyzed in gas
chromatograph (Perkin-Elmer 8500) as reported by Czerkawski and Clapperton (1968).
Liquid effluent was collected in flasks containing a solution of sodium azide (0.1% wt.vol-1)
and samples were taken for volatile fatty acids (VFA), fatty acids (FA) and ammonia nitrogen
(NH3-N) analyses. The daily productions of VFA were analyzed by gas chromatography
procedure (Cottyn and Boucque, 1968) using crotonic acid as the internal standard in gas
chromatograph. Ammonia nitrogen concentration was measured by a microdifussion method
(Conway,1962) and fatty acids were analyzed by Cieslak et al. (2003).
Dry matter, ash and nitrogen were determined according to the methods of the Association of
Official Analytical Chemists (AOAC, 1995). Neutral detergent fibre (NDF), acid detergent
fibre (ADF) and cellulose analyses in feed and residual feed samples were carried out
according to Goering and Van Soest (1970). Nitrogen (N) incorporated by the microflora
(NM) was estimated by the difference between total nitrogen –NT (liquid overflow + bag feed
residue) and NH3-N (NM= NT-NH3-N) mg.day-1 and efficiency of microbial synthesis (EMS)
= NM/ OMF (organic matter fermented) mg.g-1 (Alves de Oliveira et al., 1997). The other
fermentation variables- energetic efficiency of VFA (Orskov et al., 1968), OMF (Demeyer
and Van Nevel, 1979), production, utilization and recovery of metabolic hydrogen (Demeyer,
1991) were calculated from the stoichiometry of rumen fermentation. Means of results from
treatments were compared with one-way analysis of variance (ANOVA). Treatment means
were separated using Duncan`s multiple-range test at 5% level of probability.
266
In this study, the addition of oils’ blends up to 5% in DM to feed ration had no effect
on some basal parameters of rumen fermentation in vitro in fermentation vessels V2, V3 and
V4. The degradation of dry matter and organic matter after 48h of incubation in the
fermentation fluid was slightly (not significantly-NS) reduced by each type of oil
supplementation. The digestibility of NDF and ADF were differed among the groups. The use
of the oils in V2 and V3 slightly reduced detergent fibre digestibility, but the use all 3 oils
together significantly (P< 0.05) reduced NDF and ADF (P<0.01) digestibility about 7 and 9
units in V4. Cellulose and hemicellulose digestibility’s were slightly (NS) decreased in V2 and
V4 or slightly (NS) increased in V3, respectively. Only the significant decrease (P<0.01) of
cellulose digestibility was observed in V4. The mean rumen pH was 6.9 and was slightly (NS)
higher in all supplemented diets. The level of ammonia-nitrogen was significantly higher in
vessels supplemented with oils. Probably the higher pH resulted from the higher concentration
of ammonia-nitrogen in rumen fluid at a quite constant concentration of total VFA in V2, V3
and V4. Also the other parameter of rumen fermentation - mol VFA/kg digested dry matter
was not affected by used oils. The combination of the oils as the sources of n-3 and n-6 fatty
acids had the various effect on the production and molar proportion of individual VFA in
Rusitec. All used oils caused significantly decrease of the acetate production.. Also, reduced
butyrate production (as well as mol%) was observed after FO and LO supplementation in V3.
Although, the total gas production was similar in all fermentation vessels, the methane
production was significantly (P<0.05) reduced (about 29.5%) in V2, numerically reduced
(about 16.8%, NS) in V3 and slightly increased (about 4.2%, NS) in V4. Consequently, the
combination of plant oils- RO+LO had more suppressive effect, and the combination of
animal and plant oils – FO+LO had less suppressive effect on methane production. The other
parameters of rumen fermentation were calculated from the stoichiometric relationships in the
rumen. The energetic efficiency of VFA (E) was significantly (P<0.001) increased in V2, V3
and slightly (NS) increased in V4, respectively. This was evoked by increased proportion
(moL%) of propionate in V2 and V3 and partially by decreased moL% of butyrate in V3. The
production of metabolic hydrogen was significantly (P<0.01) higher in V2 and numerically
higher in V3 and V4. But, the utilization of metabolic H2 was similar in all fermentation
vessels. The recovery of H2 was significantly increased in V2 and V3 (P<0.001) and slightly
(NS) increased in V4. Relatively few studies have examined the effects of PUFA from oils on
microbial protein synthesis. Our result showed considerable reduction (P<0.001) of microbial
nitrogen production in effluent and residual feed samples in all experimental vessels-V2, V3,
V4. The addition of oils – LO+FO in V3 showed the highest decrease in microbial nitrogen

267
production. Similar findings were observed in efficiency of microbial synthesis (EMS) where
the addition of the oils caused the significant (P<0.001) decrease of EMS in comparison to
control. This is interesting that organic matter fermented (OMF) was similar in all
fermentation vessels. Statistically significant increase in CLA level was observed when FO
was present in the blend. Diet supplemented with either RO or LO had slight, non significant
effect on CLA level. The best results were obtained when all three oils were fed together.
Similar changes were observed in TVA level, no effect when RO and LO were added to the
diet, but (contrary to CLA level) the highest increase when FO and LO were fed. TVA, the
precursor of CLA was probably the source of CLA in the vessel with three oils addition. Oils
blends had no effect on saturated fatty acid level. Blends with FO addition increased level
either of monounsaturated fatty acids or of polyunsaturated fatty acids. Used treatments had
no influence on EPA level, whereas level of DHA was decreased statistically significant when
RO and LO were supplemented and increased when FO and LO were used.
In carried research we used standard diet composed of 60% of forage and 40% of
concentrate supplemented with different blends of plant and fish oils. The most interesting
results were obtained when experimental diet was supplemented with blends including fish
oil. Because fatty acid composition in the rumen may determine fatty acid composition in
products received from ruminants e.g. milk and meat, more research on animals, in production
condition are required.

268
References
Alves de Oliveira, L., Jean-Blain, C., Komisarczuk- Bony, S., Durix, A., Durier, C., 1997. Microbial thiamin metabolism in the rumen simulating fermenter (RUSITEC): The effect of acidogenic conditions, a high sulfur level and added thiamin. Br. J. Nutr., 78,599-613
AOAC: Association of Official Analytical Chemists, International. 1995. Official Method of Analysis. Vol. II. 16th ed. AOAC, Arlington, VA
Conway, E. J., 1962. Microdiffusion Analysis and Volumetric Error. 5th edn., Crosby Lockwood, London, UK
Cieślak A., Machmüller A., Potkański A., Szumacher-Strabel M., Scheeder M.R.L., 2003. Comparison of two extraction methods used to quantify the different C18 fatty acids in digesta of ruminants. Proceedings of the conference: Methodology of the novel evaluation, 24-25 April 2003, Olsztyn, Poland
Cottyn B. G., Boucque, C. V., 1968. Rapid method for the gas chromatographic determination of volatile fatty acids in rumen fluid. J. Agr. Food Chem., 16, 105-107
Czerkawski, J. W., Breckenridge, G., 1977. Design and development of a long term rumen simulation technique (Rusitec). Br. J. Nutr., 38, 371-384
Czerkawski, J. W., Clapperton, J. L., 1968. Analysis of gas produced metabolism of microorganisms. Lab. Pract., 17, 994-996
Demeyer, D.I., 1991. Quantitative aspects of microbial metabolism in the rumen and hindgut. In: Jouany, J.P.(ed): Rumen Microbial Metabolism and Ruminant Digestion , INRA, Paris, France, 217-237
Demeyer, D. I., Van Nevel, C. J., 1979. Effect of defaunation on the metabolism of rumen microorganisms. Br. J. Nutr., 42, 515-524
Goering, H. K., Van Soest, P. J., 1970. Forage Fiber Analysis. Agriculture handbook no. 379,USDA, Washington, DC, USA
Orskov, E. R., Flatt, W. P., Moe, W., 1968. Fermentation balance approach to estimate extent of fermentation and efficiency of VFA fermentations in ruminants. J. Dairy Sci., 51, 1429-1435
Williams M.W., 2000. Dietary fatty acids and human health. Ann. Zootech., 165-180

269
Effect of a lecithin-bounded sitosterol-supplement on blood lipids and sterol in normo- and hypercholesteraemic subjects Keller, S., J. Doberenz, J., Schubert, I., Till, U.1, Jahreis, G. Institute of Nutrition, 1Institute of Pathobiochemistry, Friedrich Schiller University Jena, Dornburger Str. 24, 07743 Jena, Germany Introduction Sitosterol is the main component of the native phytosterols. It has a similar chemical
structure like cholesterol and differs in the substitution of the side chain. Because of
this analogy they are competitors in jejunal absorption via micelles. Allayee et al.
[2000] showed the presence of an ABC-transporter in the enterocyte that is
responsible for the selective return of sitosterol into the gut. For this reason, the
amount of nutritional cholesterol, that enters the body is reduced. Many studies
described a hypocholesteraemic effect of the plant sterols by decreasing serum total
cholesterol and LDL-cholesterol concentrations [Jones et al. 1997].
Ostlund et al. [1999] administered sitostanol packed in lecithin micelles to 6 human
subjects. Because of the high insolubility of sterols in aqueous gut medium, they
chose the lecithin “coat” and could strengthen the reduction of cholesterol absorption.
The aim of this study was to compile the effects of a sitosterol-lecithin-mix on blood
lipids and sterols by a daily intake of a moderate sitosterol dosis of 1 g.
Materials and Methods Sixteen male subjects (8 normocholesteraemics, 8 mildly hypercholesteraemics)
participated in the parallel clinical intervention investigation. The study was structured
in a run-in period (9 d, pre-intervention) and an intervention period (26 d, post-
intervention). During the run-in period the subjects daily consumed 20.3 g of a
hazelnut spread supplemented with breadcrumbs as placebo to exclude matrix
effects. During the intervention period the placebo supplement was replaced with a
sitosterol-lecithin-mix. The mix consisted of 19 % sitosterol and 80 % soy lecithin.
The intake of sitosterol amounted to 1 g per day during the intervention period.
Blood samples, body weight, dietary recall (3 d), and data of bioelectric impedance
analysis were obtained at the end of each period. All the individual stool was
collected in entirety during 3 days at both period-ends from the normocholesteraemic
subjects.

270
Serum samples were obtained centrifuging the whole blood for 10 min and were
used for cholesterol, triacylglycerid, phytosterol analysis and lipoprotein fractionising.
Lipoproteins were fractionated using a self-building gradient within ultra-
centrifugation. The division in VLDL, LDL and HDL was performed by density-
determination using refraction [Plonne et al. 1999]. Plasma and corpuscular
components were separated centrifuging the EDTA-blood samples for the
determination of the sterol content in the erythrocytes.
Total cholesterol and lipoprotein cholesterol as well as the triacylglycerid
concentrations in the serum were analysed enzymatically by commercially available
kits. Serum and lipoprotein sterols were further extracted by a modified Folch
extraction, erythrocyte and faecal sterols were determined in raw material. The lipids
were saponified with ethanolic sodium hydroxide and were completing extracted
exhaustively with four 1 ml portions of cyclohexane. The solvent of the combined
extracts was evaporated under a nitrogen stream. The residues were reconstituted in
200 µl decane and without further derivatisation injected in GC-MS in duplicate.
5α-Cholestane was added as internal standard. Fatty acids were methylated with
tetramethylguanidin and analysed by GC-FID.
Data handling and statistics were performed with computering software SPSS 10.0
for Windows using paired t-test. Food records were evaluated using software Nutri
Science, Prodi 4.5 LE.
Results and Discussion Evaluating food records, no differences were found in the intake of energy and of the
major nutrients fat, proteins, and carbohydrates before and after supplementation of
the phytosterol-phospholipid-mix. But the consumption of cholesterol tended to
decrease, first of all in the normocholesteraemic subgroup.
Considering of all 16 subjects, no hypocholesteraemic effect of sitosterol was
detected. Serum concentrations of total cholesterol, triacylglyceride, LDL-Cholesterol,
and HDL-cholesterol were unchanged (Fig. 1).

271
0
2
4
6
8
TC[mmol/L]
TG[mmol/L]
LDL-Chol[mmol/L]
HDL-Chol[mmol/L]
LDL/HDL
Pre-Intervention Post-Intervention
0
2
4
6
8
NC HC NC HC NC HC NC HC
TC LDL-Chol HDL-Chol LDL/HDL
[mm
ol/L
]
Pre-Intervention Post-Intervention
Fig. 1: Serum cholesterol data of all volunteers (n = 16; TC: Total cholesterol; TG:
Triacylglyceride)
Contrary effects were observed separating the subgroups into normocholesteraemic
and hypercholesteraemic subjects. While normocholesteraemics had increased
serum cholesterol concentrations with significance in LDL-cholesterol, the
hypercholesteraemics tended to lower LDL-cholesterol concentrations and to a
decreased LDL/HDL ratio after sitosterol-lecithin supplementation (Fig. 2).
Fig. 2: Serum cholesterol data in subject to cholesteraemic status (NC: Normochol-
esteraemic subjects; HC: Hypercholesteraemic subjects; TC: Total cholesterol;
significance to Pre-Intervention; p < 0.05)

272
0
20
40
60
Total sterols Plant sterols anddegradation products
Cholesterol anddegradation products
[mg/
g dr
y w
eigh
t] Pre-Intervention Post-Intervention
The elevated LDL-cholesterol and HDL-cholesterol concentrations in the
normocholesteraemic subjects demonstrate a circulation of higher amounts of
cholesterol in the body and further an increased cholesterol pool. These results
suggest a higher absorption rate of cholesterol due to a fortification of the luminal
micelles because of the additional supplementation of lecithin as one main
component in the micelle formation. Lecithin was given to amplify the
hypocholesteraemic effect of sitosterol because of possible higher absorption into
enterocyte as competition to cholesterol absorption. Ostlund et al. [1999] applicated
sitostanol packed directly in a lecithin micelle to subjects and detected a strong
reduction of cholesterol absorption because of better sitostanol solubility in the
presence of bile acids. This difference in the product constitution can cause the
differences between our study and the results of Ostlund et al. [1999] in the reduction
of cholesterol absorption. A further aspect for effects on cholesterol absorption is
given by the composition of the lecithin. The fatty acid composition of the
phosphatidyl choline showed a high portion (69%) of polyunsaturated fatty acids
(PUFA). Jiang et al. [2001] demonstrated in rats an increased cholesterol absorption
by feeding a PUFA-rich diet.
In addition to the serum parameters, a decreased luminal cholesterol turnover should
increase the excreted faecal amounts of cholesterol and their bacterial degradation
products. The analysis of faecal neutral sterols showed significantly higher amounts
of total sterols in the faeces of the normocholesteraemic subjects. But this rise is
caused by the strongly increased phytosterol concentration in the faeces. The
cholesterol and degradation product content was unchanged in faeces (Fig. 3).
Fig. 3: Sterol content in faeces of normocholesteraemic subjects (significance to Pre-
Intervention; p < 0.05)

273
0
5
10
15
All subjects NC HC
[µm
ol/L
Ery
thro
cyte
] Pre-Intervention Post-Intervention
Sitosterol concentrations tended to higher levels in the serum and LDL-fraction in
both cholesteraemic subgroups. In erythrocytes a significantly higher sitosterol
concentration was obtained after supplementation of the sitosterol-lecithin-mix
(Fig. 4).
Fig. 4: Sitosterol concentration in the erythrocytes (NC: Normocholesteraemic
subjects; HC: Hypercholesteraemic subjects; significance to Pre-Intervention;
p < 0.05)
Conclusions The daily intake of 1 g sitosterol mixed with lecithin induced an increase of LDL-
cholesterol in normocholesteraemics due to a possible amplification of cholesterol
absorption. Contrary to this, LDL-cholesterol concentration in hypercholesteraemic
subjects were decreased. Furthermore, a trend for an accumulation of sitosterol was
observed in the serum and in the LDL-fraction in both subgroups and was significant
in the erythrocytes. Thus, the product constitution may influence the
hypocholesteraemic effect of sitosterol and should be taken into consideration by
creating sterol supplemented foods.

274
Summary Serum total cholesterol, triacylglyceride, LDL-Cholesterol, HDL-cholesterol concentrations in 16 males (8 normocholesteraemics, 8 mildly hyper-cholesteraemics) were unchanged by a daily intake of 1 g sitosterol mixed with lecithin during 26 days. But the LDL-cholesterol concentration increased in normocholesteraemic subjects. Contrary to this, LDL-cholesterol concentration hypercholesteraemics were decreased. A trend for an accumulation of sitosterol was observed in the serum and in the LDL-fraction in both subgroups and was significant in the erythrocytes. Thus, the product constitution may influence the hypo-cholesteraemic effect of sitosterol and should be taken into consideration by creating phytosterol supplemented foods. Zusammenfassung Die Serumgesamtcholesterol-, Triacylglycerid-, LDL-Cholesterol-, und HDL-Chol-esterolkonzentrationen waren bei 16 Männern (8 Normocholesterämiker, 8 moderate Hypercholesterämiker) nach einer täglichen Aufnahme von 1 g Sitosterol im Gemisch mit Lecithin über 26 Tage unverändert. Allerdings erhöhten sich die LDL-Cholesterol-konzentrationen der normocholesterämischen Probanden. Im Gegensatz dazu waren die LDL-Cholesterolkonzentrationen der Hypercholesterämiker vermindert. Ein Trend zur Akkumulation von Sitosterol im Serum und in der LDL-Fraktion wurde in beiden Studiengruppen beobachtet und erreichte ein signifikantes Niveau in den Erythrozyten. Aus diesen Gründen ist es möglich, dass die Produktzu-sammensetzung den hypocholesterämischen Effekt von Sitosterol beeinflussen kann und sollte bei der Herstellung von Phytosterol-angereicherten Produkten berücksichtigt werden.
References Allayee H, Lafitte B A, Lusis A J (2000): An absorbing study of cholesterol. Science,
290, 1709-1711 Jiang Y, Noh S K, Koo S I (2001): Egg phosphatidylcholine decreases the lymphatic
absorption of cholesterol in rats. J Nutr, 131, 2358-2363 Jones P J H, MacDougall D E, Ntanios F, Vanstone C A (1997): Dietary phytosterols
as cholesterol-lowering agents in humans. Can J Physiol Pharmacol, 75, 217-227 Ostlund R E, Spilburg C A, Stenson W F (1999): Sitostanol administered in lecithin
micelles potently reduces cholesterol absorption in humans. Am J Clin Nutr, 70, 826-831
Plonne D, Dargel R, Cartwright I, Higgins J A, Graham J M (1999): A novel method for rapid separation of the secretory compartment from rat liver and isolated rat hepatocytes in a single iodixanol gradient. In: News Bulletin for nycomed Pharma density gradient media, Nycomed Amersham, 1, 4-6

275
Influence of Sangrovit© supplementation on nitrogen balance and feed intake in growing pigs Tschirner, K., Susenbeth, A., Wolffram, S. Institut für Tierernährung und Stoffwechselphysiologie, Universität Kiel, D-24098 Kiel Introduction A variety of phytogenic feed additives for farm animals are under practical use to
improve animal health, growth performance and feed intake. Sangrovit©, a
commercially used supplement, is produced from ground rhizomes of Sanguinaria
canadensis. This plant occurs in eastern North America and contains several
alkaloids, predominantly benzophenanthridine alkaloids, in their rhizomes. The major
one in rhizomes and Sangrovit©, too, is sanguinarine. In vitro studies have shown that
sanguinarine has several biological effects, including antimicrobial, antiinflammatory,
immunemodulatory and enzyme inhibitory properties. It has been supposed that
Sangrovit© improves protein retention in farm animals by reducing intestinal
decarboxylation of aromatic amino acids and enhances feed intake through effects
on the tryptophane-serotonin pathway (Mellor, 2001). Therefore the present study
aimed to investigate the effect of Sangrovit© on protein retention (Experiment I) and
voluntary feed intake (Experiment II) in growing pigs. Although plant based feed
additives are widely distributed in animal nutrition, research focusing on their
standardization and traceability is limited. Therefore a sensitive method for the
detection of sanguinarine in feed and blood samples was developed.
Material and Methods Diets. The control diet (C) consisting of 55% corn, 21% barley, 11% soybean meal,
8% fish meal, 6% corn gluten meal, 3% vitamin and mineral premix, 0.24% lysine,
0.18% threonine, 0.07% methionine, and 0.07% tryptophane was formulated to
contain 13.5 MJ ME/kg and 18% protein. This diet was used either without (C) or with
the addition of 30 ppm Sangrovit© (S30).
Experiment I was conducted with 12 castrated male pigs. According to their initial
weight animals were allocated to the dietary treatments and housed individually in
metabolic cages. The 16d experimental period consisted of a 9d adaptation period
and a 7d period for collection of feces and urine. During the adaptation period
animals were fed the diets in two equal meals resulting in a constant feeding of 95

276
g/kg BW0.75d-1 (BW=body weight). Water was supplied for ad libitum intake through
nipple drinkers. Pigs were weighed at the beginning and end of the 7d collection
phase. Nitrogen concentration in feces and urine was determined according to the
Kjeldahl procedure.
For experiment II 12 castrated male pigs were housed in groups of two with separate
feeding troughs. The animals were randomly allocated to either the control or S30
diet. Following a 7d adaptation period voluntary feed intake was measured twice
daily over a 9d period. Water was supplied for ad libitum intake through nipple
drinkers. For calculation of weight gain and feed conversion rate individual body
weights were measured at d8 and d16.
At the end of both experiments blood samples were taken preprandially and
postprandially (one hour after feeding). Blood samples was analysed for glucose,
urea, free amino acids and sanguinarine.
Statistics. The T-Test procedures of SAS version 6.12 (SAS inst. Inc., Cary, NC)
were used for analysis of animal performance, parameter of nitrogen balance and
preprandial blood measurements in experiment I and II. All postprandial blood
measurements were analysed using the GLM procedures for repeated
measurements. Values are presented as means ± SEM; P
-value ≤ 0.05 is considered significant.
Results Sanguinarine was found in Sangrovit© (14.9 ± 0.1 µg/mg) and the supplemented diet
(S30), but not in the control diet (C). The analysed sanguinarine concentration in the
S30 diet was 0.35 ± 0.02 mg/kg.
Experiment I
Mean BW at the beginning of the nitrogen balance period was 37.0 ± 0.6 kg and 36.5
± 0.2 kg in the C and S30 group, respectively. Addition of 30 ppm Sangrovit© to the
basal diet did not influence nitrogen retention, which was on average 22.8 ± 1.9 g/d.
Mean daily BW gain was 834.7 ± 18.0 g and again did not differ between treatment
groups. In accordance to this no differences in serum urea concentration prior to
feeding as well as one hour after feeding were detected. Prior to feeding the
concentration of glucose was significantly higher in the S30 group, however one hour
after feeding no treatment related effect on the glucose level was observed (Table
277
1). The postprandial increase in the plasma tryptophane concentration was
significantly higher in the S30 group (P = 0.02) than in the control group (Table 1),
despite a similar tryptophane content of 2.6 g/kg in the C and S30 diet.
Sanguinarine was not detectable in serum of the control animals. Serum
sanguinarine concentration in the S30 animals was 1.1 ± 0.1 ng/ml prior to feeding
and 2.2 ± 0.3 ng/ml one hour after feeding. This increase due to feed intake was
significant (P < 0.001).
Table 1. Pre- and postprandial glucose, urea and tryptophane concentration in experiment I (means ± SEM, n=6)
Treatment1
preprandial postprandial Item
C S30 C S30
Glucose, mg/dl 87.7 ± 1.7a 94.8b ± 1.3 89.8 ± 7.0 84.3 ± 6.4
Urea, mg/dl 22.8 ± 1.0 23.2 ± 1.2 25.7 ± 1.4 25.8 ± 1.1
Tryptophane, mmol/l 0.025 ± 0.007 0.015 ± 0.004 0.043A ± 0.007 0.065B ± 0.006 1Dietary treatment with C = 0 ppm (control), S30 = 30 ppm Sangrovit©. a,b Means between preprandial column with unlike superscripts differ (P < 0.05) A,B Means between postprandial column with unlike superscripts differ (P < 0.05)
Experiment II
Animal performance in experiment II is shown in Table 2. Daily BW gain and feed
intake in the S30 group was 4% and 3% higher, respectively, compared to the control
group, however this was not significant (P > 0.05).
Table 2. Animal performance in experiment II (means ± SEM, n=6)
Treatment1
Item C S30
Starting weight, kg 35.5 ± 0.8 35.8 ± 1.2
Feed intake, g/d 1779 ± 102 1834 ± 68 Weight gain, g/d 1008 ± 80.2 1047 ± 63 Feed efficiency, kg/kg 1.8 ± 0.1 1.8 ± 0.1
1Dietary treatment with C = 0 ppm (control), S30 = 30 ppm Sangrovit©. No differences between treatment groups for pre- and postprandial glucose, urea and
tryptophane in blood were observed (Table 3). Sanguinarine was not detectable in
serum samples of the control animals, but in the S30 group with 2.4 ± 0.6 ng/ml and

278
3.3 ± 0.5 ng/ml prior and after feeding, respectively. As in experiment I the
postprandial increase in serum sanguinarine was significant (P < 0.05).
Table 3. Pre- and postprandial glucose, urea and tryptophane concentration in experiment II (means ± SEM, n=6)
Treatment1
preprandial postprandial Item
C S30 C S30
Glucose, mg/dl 100.5 ± 4.3 92.0 ± 2.6 97.5 ± 3.5 100.3 ± 8.5
Urea, mg/dl 22.0 ± 2.0 27.7 ± 0.7 25.3 ± 1.8 26.7 ± 1.2
Tryptophane, mmol/l 0.034 ± 0.023 0.032 ± 0.009 0.114 ± 0.031 0.109 ± 0.019 1Dietary treatment with C = 0 ppm (control), S30 = 30 ppm Sangrovit©.
Discussion For this study we used a rapid and simple high-performance liquid chromatographic
method with fluorescence detection for the analyses of the sanguinarine content in
the feed additive Sangrovit© and the supplemented diet. This method was proved for
sanguinarine. The analysed sanguinarine content in the S30 diet is in the range of
the calculated content. Sanguinarine concentration in samples can be usen to
describe the level of Sangrovit© supplementation.
Based on results from in vitro studies, showing an inhibitory effect of sanguinarine on
the enzyme aromatic amino acid decarboxylase (Drsata et al., 1996), it was
supposed that Sangrovit© improves protein retention by reducing the intestinal
decarboxylation of aromatic amino acids (Mellor, 2001). In this experiment we did not
find any influence of the feed additive on nitrogen retention in growing pigs. In
experiment I, however, the postprandial increase in plasma tryptophane
concentration was higher in the S30 than in the control group, indicating a higher
systemic availability of this amino acid. The second experiment was primarily
conducted to investigate the effect of supplemented Sangrovit© on feed intake, which
was 3% higher in the S30 group than in the control group. This effect is in range of
effects of other plant derived feed additives. It has to be pointed out, however, that
these effects seldom reach the level of significance.
The determination of sanguinarine in blood samples of the treated animals clearly
demonstrate that sanguinarine is absorbed by the gastrointestinal tract. Earlier this
was shown by Tandon et al. (1992), who found sanguinarine in the blood of rats. The

279
significant increase in postprandial sanguinarine serum concentration indicates that
serum level responds to the supplementation.
Summary In the present study the effect of the feed additive Sangrovit© (30 ppm) on nitrogen balance and voluntary feed intake was investigated in growing pigs. Under the experimental conditions Sangrovit© had no effect on nitrogen balance in restrictively fed animals, but slightly improved daily feed intake and weight gain when animals had free access to feed. The study indicates that the alkaloid is absorbed by the gastrointestinal tract. Literature Drsata J, Ulrichová J, Walterová D (1996): Sanguinarine and chelerythrine as
inhibitors of aromatic amino acid decarboxylase. Journal of Enzyme Inhibition, 10, 231-237
Mellor S (2001): Natural appetisers from plants. Feed Mix, 9, 29-31 Tandon S, Das M, Khanna SK (1992): Biometabolic elimination and organ retention
profile of argemone alkaloid sanguinarine in rats and guinea pigs. Drug Metabolism and Disposition, 21, 194-197

280
Does dietary intake of vitamin B6 and folate affect homocysteine and CRP levels in patients with heart failure? Makarewicz-Wujec, M.1, Kozlowska-Wojciechowska, M.1, Mamcarz, A.2, Janiszewski, M.2 1 Department of Nutrition Education, National Food and Nutrition Institute, Warsaw, Poland 2 Clinic of Cardiology in the Medical University of Warsaw, Poland INTRODUCTION
Heart failure is the condition characterised by dysfunction of the heart as a pump
which results in reduced blood supply to tissues, insufficient for their metabolic needs. Other
causes of heart failure include arterial hypertension, coronary heart disease, and rheumatic
heart disease. An important role in the development of chronic heart failure is played by so-
called cardiovascular risk factors such as dyslipidaemia (elevated LDL cholesterol level
and/or lowered HDL cholesterol level), cigarette smoking, arterial hypertension, carbohydrate
metabolism disorders (diabetes mellitus), and obesity. The studies conducted in the past few
years provided also much evidence of atherogenic effects of elevated serum homocysteine
levels. Elevated homocysteine levels are found in 3-7% of the general population and in 2%
of patients with vascular disorders. The causes of such high prevalence of such elevation
should be considered the dietary deficiency of folic acid and vitamin B6 with the concurrent
high consumption of methionine originating from animal protein sources (3,6). Moderate
alcohol consumption, recommended fruit and vegetables consumption, regular physical
exercise, and correct supply of folic acid and group B vitamins contribute to the maintenance
of low homocysteine levels.
An important role in the development of atheromatic lesions is played by the
inflammatory process whose marker is CRP (C-reactive protein) whose level corresponds to
vascular endothelial dysfunction (5).
The present study was performed in order to assess the effect of dietary consumption
of vitamin B6 and folic acid on homocysteine level and on CRP in patients with diagnosed
heart failure according to NYHA and in patients without heart failure symptoms.
Material and method
Group A consisted of 31 patients (10 women and 21 men) aged 55.5±7.0, with BMI
30.0±4.68, with heart failure diagnosed on the basis of clinical symptoms and NYHA
classification, in 80% with ischaemic aetiology and in 20% with post-inflammatory aetiology.
All patients underwent prior hospitalisation due to coronary events. The majority of patients
received standard treatment: beta-blockers (94%), ASA (91%), ACE-inhibitors (82%),
nitrates (78%), and statins (67%).

281
Group B consisted of 31 patients (15 women and 16 men) aged 52.2±11.3, without clinical
symptoms of heart failure, with moderate hiperlipidaemia (cholesterol level < 260mg%),
without obesity (BMI 26.2±3.95), who have not been treated for metabolic disorders either
pharmacologically or dietetically.
The consumption levels of energy, nutrients, and vitamin B6 and folic acid were assessed on
the basis of a 24-hour dietary interview and computer program FOOD 2 – IŻŻ. Serum
homocysteine levels were determined by the liquid chromatography method and serum lipid
parameters and CRP were determined by the enzymatic method with the use of Boehringer
Mannhaim test kits. Statistical evaluation of the results was performed with the use of the
Statistica 5.0 PL computer program. The consent of the Bioethics Board at the National Food
and Nutrition Institute was obtained for the conduct of the above studies.
Results
In group A (tested), NYHA class I heart failure was diagnosed in 10 patients, NYHA class II
heart failure was diagnosed in 17 patients, and NYHA class III heart failure was diagnosed in
4 patients. There were no patients with NYHA class IV heart failure in the tested group. None
of the persons studied drank more than 3 cups of coffee per day. Only 6 of the patients with
heart failure smoked cigarettes, and the control group included as much as 50% of smokers.
2 persons in the tested group declared occasional use of B complex vitamin products.
Table 1 Comparison of lipid parameters, homocysteine, and CRP in the tested group and in the control group Tested group
Mean±SD Control group Mean±SD
Total cholesterol (mg/dl) 194.2±47.15 213.7±33.1 HDL-cholesterol (mg/dl) 38.3±8.49* 44.3±11.3 LDL-cholesterol (mg/dl) 118.8±46.06** 155.5±31.51 Triglycerides (mmol/l) 1.5±0.75 1.8±1.29 Homocysteine (mmol/l) 14.6±4.06* 12.1±3.05 CRP (mg/ml) 3.9±3.31* 2.4±2.41 Lp(a) (mg/dl) 25.5±31.19 16.8±18.17 *p<0.05
**p<0.001
The content of nutrients and energy in the diet in both patient groups was calculated on the
basis of 24-hour dietary interviews, with the use of the FOOD 2 program. The results are
presented in Table 2.
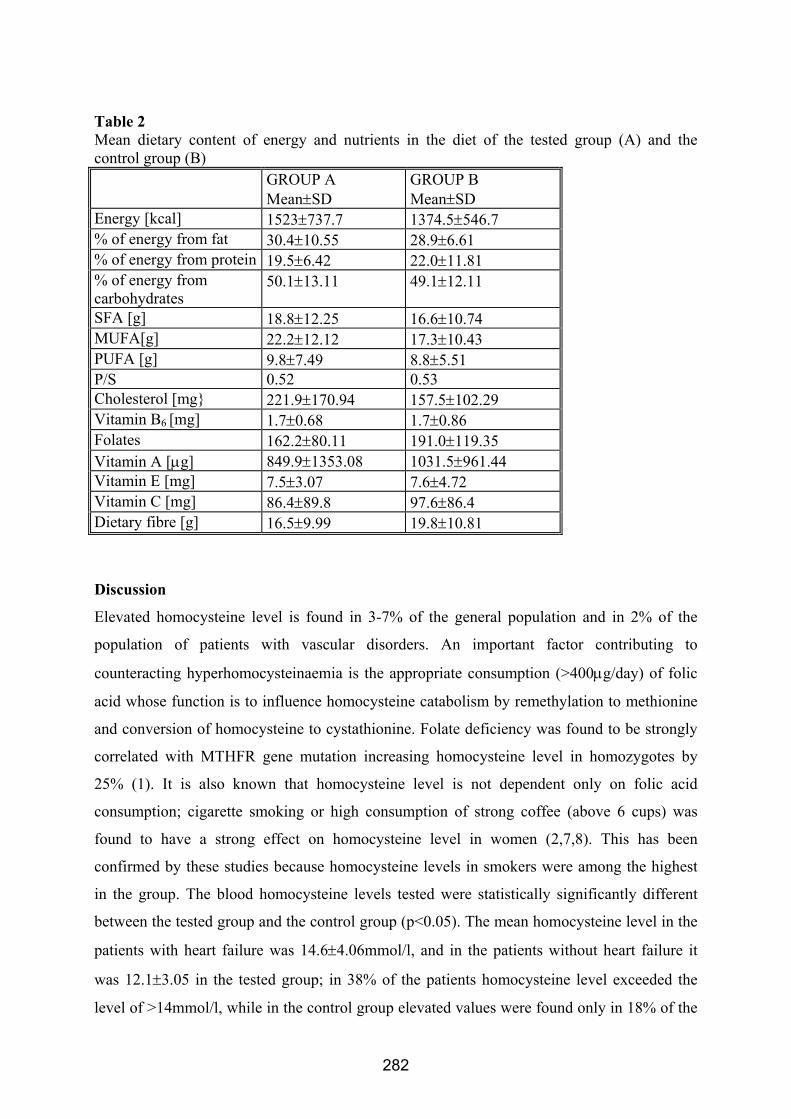
282
Table 2 Mean dietary content of energy and nutrients in the diet of the tested group (A) and the control group (B)
Discussion
Elevated homocysteine level is found in 3-7% of the general population and in 2% of the
population of patients with vascular disorders. An important factor contributing to
counteracting hyperhomocysteinaemia is the appropriate consumption (>400µg/day) of folic
acid whose function is to influence homocysteine catabolism by remethylation to methionine
and conversion of homocysteine to cystathionine. Folate deficiency was found to be strongly
correlated with MTHFR gene mutation increasing homocysteine level in homozygotes by
25% (1). It is also known that homocysteine level is not dependent only on folic acid
consumption; cigarette smoking or high consumption of strong coffee (above 6 cups) was
found to have a strong effect on homocysteine level in women (2,7,8). This has been
confirmed by these studies because homocysteine levels in smokers were among the highest
in the group. The blood homocysteine levels tested were statistically significantly different
between the tested group and the control group (p<0.05). The mean homocysteine level in the
patients with heart failure was 14.6±4.06mmol/l, and in the patients without heart failure it
was 12.1±3.05 in the tested group; in 38% of the patients homocysteine level exceeded the
level of >14mmol/l, while in the control group elevated values were found only in 18% of the
GROUP A Mean±SD
GROUP B Mean±SD
Energy [kcal] 1523±737.7 1374.5±546.7 % of energy from fat 30.4±10.55 28.9±6.61 % of energy from protein 19.5±6.42 22.0±11.81 % of energy from carbohydrates
50.1±13.11 49.1±12.11
SFA [g] 18.8±12.25 16.6±10.74 MUFA[g] 22.2±12.12 17.3±10.43 PUFA [g] 9.8±7.49 8.8±5.51 P/S 0.52 0.53 Cholesterol [mg} 221.9±170.94 157.5±102.29 Vitamin B6 [mg] 1.7±0.68 1.7±0.86 Folates 162.2±80.11 191.0±119.35 Vitamin A [µg] 849.9±1353.08 1031.5±961.44 Vitamin E [mg] 7.5±3.07 7.6±4.72 Vitamin C [mg] 86.4±89.8 97.6±86.4 Dietary fibre [g] 16.5±9.99 19.8±10.81

283
patients tested. Significantly higher homocysteine levels in the tested group may reflect the
15% lower folate consumption in the diet in comparison with the group of patients with HLP;
in both groups folate consumption was much lower than the daily demand. In the case of the
tested group, this corresponded to the compliance with the recommended consumption at the
level of 57%, and in the case of the group with HLP, at the level of 68%. Because vitamin B6
consumption was at the same level in both groups (1.7mg/day, which constituted ca. 85% of
the recommended daily consumption), it presumably did not have a significant effect on
homocysteine level. Experimental studies indicate that homocysteine has the ability to induce
oxidative stress at the vascular endothelial level through the process of auto-oxidation and
lowering anti-oxidative enzyme activity (4). In vivo, epithelial dysfunctions are also induced by infections or a chronic
inflammatory process. The markers of generalised inflammatory state include CRP (C-
reactive protein) which is a prognostic factor for the risk of myocardial infarction and
thromboembolic stroke (9). The CRP level in the patients with heart failure was statistically
significantly higher (p<0.05) than in the patients without heart failure. Significantly higher
CRP levels in the patients with heart failure confirm an existing inflammatory process, they
may reflect atherosclerosis progression as an effect of action of several pro-inflammatory
factors including hyperhomocysteinaemia. Studies searching for a relationship between the
content of selected nutrients in the diet of patients with heart failure and metabolic parameters
of diagnosed atherosclerosis may contribute to the reduction in risk of further complications
and to an improvement of treatment of patients with existing atherosclerosis.
284
Bibliography
1. Clarke R, Lewington S, Landray M. Homocysteine, renal function, and risk of cardiovascular disease. Kidney Int Suppl. 2003 May;(84):S131-3. 2. Grubben MJ, Boers GH, Blom HJ, et al. Unfiltered coffee increases plasma homocysteine concentrations in healthy volunteers: a randomized trial. Am J Clin Nutr 2000;71:480–4 3. Jacobsen DW. Homocysteine and vitamins in cardiovascular disease. Clin Chem. 1998 Aug;44(8 Pt 2):1833-43. 4. Naruszewicz M., Klinke M., Bukowska H.: Elevated homocysteine increase ability of human aortic cells to oxidise LDL. Atherosclerosis 1997, 134, 13-14 5. Ridker PM, Cushman M, Stampfer MJ, Tracy RP, Hennekens CH. Inflammation, aspirin, and the risk of cardiovascular disease in apparently healthy men. N Engl J Med. 1997 Apr 3;336(14):973-9. 6. Selhub J, Jacques PF, Bostom AG, Wilson PW, Rosenberg IH. Relationship between plasma homocysteine and vitamin status in the Framingham study population. Impact of folic acid fortification. Public Health Rev. 2000; 28(1-4):117-45. 7. Stein JH, Bushara M, Bushara K, McBride PE, Jorenby DE, Fiore MC Smoking cessation, but not smoking reduction, reduces plasma homocysteine levels. Clin Cardiol. 2002 Jan; 25(1):23-6. 8. Urgert R, van Vliet T, Zock PL, Katan MB. Heavy coffee consumption and plasma homocysteine: a randomized controlled trial in healthy volunteers. Am J Clin Nutr 2000; 72: 1107–10.

285
Investigations on the Effects of B-Vitamin Supplementations in Broiler Diets Roth-Maier, D.A., Paulicks, B.R. Division of Animal Nutrition, Technical University Munich, Hochfeldweg 6, D-85350 Freising–Weihenstephan, Germany
Introduction
B-vitamins, which cannot be produced or stored by monogastric animals as pigs and
poultry, are very important in metabolism as they are components of many different
enzymes. Deficiency causes varying symptoms, which are often observed as a re-
duced production performance. A continuous supplementation is necessary. There-
fore, commercial feed mixtures are generally supplemented with the complete spec-
trum of vitamins without respect to the native contents, which may often be high
enough to cover the requirements of the animals but in the case of high producing
animals sometimes they may be not. In the present experiment with broiler chickens
this was tested in combination with a confirmation of the recommendations of the
Gesellschaft für Ernährungsphysiologie (GfE, 2000) for B-vitamins.
Materials and Methods
360 day-old, male Ross broiler chicks (39.0 g) were randomly distributed to 6 treat-
ments and housed in groups of 10 in wired cages (10 repetitions for feed intake and
feed-to-gain conversion, 60 repetitions for body weight and weight gain). Over a total
of 35 days they were offered a diet (23 % crude protein, 13.4 MJ MEk/kg) consisting
of 5.0 % barley, 10.0 % corn, 15.1 % wheat, 20.0 % cassava meal, 8.0 % soybean
oil, 30.2 % soybean meal, 7.0 % wheat gluten, 3.4 % minerals, 0.8 % vitamin premix
(no B-vitamins), 0.3 % L-lysine·HCl, and 0.2 % DL-methionine. With the exception of
riboflavin, niacin, vitamin B12, biotin, folic acid, and choline this diet covered the re-
quirements of growing chicken. Animals of treatment I received this diet without any
further supplement. For treatment II it was supplemented with 2.0 mg riboflavin, 16
mg niacin, 1.1 mg pantothenic acid, 0.011 mg vitamin B12, 0.065 mg biotin, 0.25 mg
folic acid, and 330 mg choline per kg and met the recommendations. In treatments
III, IV, V, and VI the supplementations of either niacin or vitamin B12 or biotin or folic
acid were omitted. For more details see Roth-Maier and Paulicks (2002).

286
Results
Treatment I had to be removed after two weeks because of severe deficiency symp-
toms and the death of nearly 80 % of the animals. Growth performance and feed
consumption in treatment I were more than 50 % lower than for the supplemented
animals in treatment II. After 5 weeks, also with biotin deficiency (treatment V), there
were higher losses (17 %) than in the other treatments (8-12 %). Treatment II (com-
pletely supplemented diet) had highest body weight, daily weight gain and feed con-
sumption after two weeks and at the end of the trial, but there were no significant
differences between this and the other treatments (cf. Table). However, with biotin
deficiency weight gain and feed consumption were reduced by 5 % and 8 %, respec-
tively. Feed-to-gain conversion (kg feed/kg weight gain) was equal for all treatments
with the exception of treatment I .
Table: Performance data of the broiler chicken
Treatment I II III IV V VI
Negative
control Positive control
Niacin deficient
Vit. B12 deficient
Biotin deficient
Folic acid deficient
Week 0-2 174 a 446 b 440 b 443 b 412 b 442 b Body weight (g) Final - 2014 2011 2004 1914 1993
Week 0-2 17 a 35 b 34 b 33 b 33 b 34 b
Week 3-5 - 121 115 117 110 114 Feed con-sumption (g/d)
Total - 87 83 84 79 82
Week 0-2 1.8 b 1.2 a 1.2 a 1.2 a 1.2 a 1.2 a
Week 3-5 - 1.6 1.5 1.6 1.6 1.5 Feed-to-gain con-version
Total - 1.5 1.5 1.5 1.5 1.5
a,b significant different means (P<0.05, Student-Newman-Keuls test)
Discussion
The importance of B-vitamins for the growth of broiler chicken became evident in
treatment I without dietary B-vitamin supplementation. With concentrations in feed

287
amounting to only 69 % (riboflavin), 84 % (niacin), 0 % (vitamin B12), 75 % (folic
acid), 80 % (biotin), and 90 % (choline) compared to GfE-recommendations (2000),
growth performance was very low and most chickens died within 2 weeks. Neither in
treatment III without niacin supplementation nor in treatment IV without vitamin B12
supplementation or in treatment VI without folic acid supplementation growth depres-
sions were observed. Therefore either biotin deficiency, which also impaired growth
performance in treatment V, or riboflavin deficiency or the combination of some or all
of tested vitamins must have been the trigger for the severe growth and health prob-
lems. As the obvious symptoms were not specific for the deficiency of only one B-
vitamin (what is generally never the case for obvious symptoms of B-vitamin defi-
ciencies), a final answer to this question must remain unsolved here. However, in a
former investigation (Roth-Maier and Kirchgessner, 1997) a dietary riboflavin content
of 2.7 mg/kg DM, according to a supply of 82 % compared to the actual recommen-
dations, did not impair growth performance of broiler chickens.
Treatment II supplemented with riboflavin, niacin, vitamin B12, biotin, folic acid, pan-
tothenic acid, and choline produced high growth rates, a good feed-to-gain conver-
sion and birds in good health conditions. That proves, that the dietary intake was
adequate. Treatments III and VI with only 84 % of the GfE-recommendations (2000)
for niacin and 75 % for folic acid, resp., had no growth depression, therefore that
supply must have been already sufficient. The good performance data of treatment
IV (no vitamin B12) indicated that a fattening period of 5 weeks can be conducted
without any source of vitamin B12, which is only contained in feedstuffs of animal ori-
gin. Eventually the birds got at least some vitamin B12 by coprophagy (despite the
housing in wired cages) or feather picking from birds of neighbour cages, which were
adequately supplied. However, no such behavioral disorders were observed. In
treatment V (no biotin supplementation) weight gain and feed intake were lower and
animal losses were higher than in the other groups. Available biotin amounted to only
80 % of the GfE-recommendations but total biotin met the NRC-recommendations
(1994) with 170 µg biotin per g DM, which obviously are suboptimal.
The present results demonstrate that the native content of B-vitamins in practical
diets for broilers is not sufficient and supplementations are necessary to avoid severe
health and growth problems. But a supply near the recent recommendations (GfE
2000) produce excellent performance. Even a suboptimal supply of only one vitamin

288
might be tolerated to a certain extent without significant losses in performance. This
refers to certain sparing effects, which are well known for niacin and tryptophan,
vitamin B12 and riboflavin, pantothenic acid, folic acid and choline. Biotin, however,
seems to admit the smallest allowance between optimal and suboptimal supply fol-
lowed by reductions in performance.
Acknowledgement
This work was supported by a grant of the Bayerische Arbeitsgemeinschaft Tierer-nährung (BAT) e.V., Freising-Weihenstephan. Summary
360 male day-old broiler chicks (Ross) in 6 groups were fed for 35 days with diets covering the nutrient requirement with the exception of either niacin or vitamin B12 or biotin or folic acid or all of these B-vitamins. After 2 weeks treatment I without sup-plementation was removed because of 80 % animal losses. Treatment II (complete supplementation) exhibited good performance with 2011 g final body weight, 87 g daily feed consumption and a feed-to gain conversion of 1.5. Treatments III, IV, and VI performed similarly to treatment II. Only with biotin deficiency live weight and feed consumption were lower (5 % and 8 %, resp.). It is concluded that the present Ger-man recommendations are high enough to produce good performance. A deficiency of only one of the tested vitamins (except biotin) obviously was compensated by the birds. Biotin seems to admit the smallest allowance between optimal and suboptimal supply compared to niacin, vitamin B12 and folic acid.
Literature
GfE – Ausschuss für Bedarfsnormen der Gesellschaft für Ernährungsphysiologie (2000): Empfehlungen zur Energie- und Nährstoffversorgung der Legehennen und Masthühner (Broiler) 1999. DLG-Verlag, Frankfurt/Main
NRC - National Research Council (1994): Nutrient Requirement of Domestic Animals 1. Nutrient Requirements of Poultry. National Academic Press, Washington, DC
Roth-Maier D A, Kirchgessner M (1997): Untersuchungen zum Riboflavinbedarf von Mastküken. Arch. Geflügelkde. 61, 14-16
Roth-Maier D A, Paulicks B R (2002): Effects of a suboptimal dietary intake of particular B-vitamins on the growth of fattening chicken. Arch. Geflügelkde. 66, 201-205

289
Influence of the tobacco smoking on the vitamin C concentration changes in the serum of women with breast cancer Kopański, Z.1,2, Schlegel-Zawadzka, M.3, Grygiel, B.4, Piekoszewski, W.5,6, Kilian, T.7
1Clinical Military Hospital, 1-3 Wroclawska Str., 30-006 Kraków; 2Academy of Physical Education, Al. Jana Pawła II 78, 31-571 Kraków; 3Department of Human Nutrition, Institute of Public Health, Collegium Medicum, Jagiellonian University, 20 Grzegórzecka Str., 31-531 Kraków; 4Chair and Department of Bromatology, Medical Academy, 42 Marcelinska, 60-354 Poznan; 5Clinical and Industrial Toxicology, Collegium Medicum Jagiellonian University, Os. Zlotej Jesieni 1, 30-826 Kraków; 6Institute of Forensic Research, 9 Westerplatte Str., 31-033 Kraków; 7Central Clinical Hospital, Military University School of Medicine, 128 Szaserow Str., 00-903 Warszawa; Poland
Introduction Nicotine, the most important and best studied alkaloid in the composition of the
tobacco smoke, undergoes a rapid biotransformation. One of its main metabolites is
cotinine. It is one of the most stable metabolites of nicotine, with a proven biological
action, and as a result it is considered by many authors as the most adequate
biomarker of exposure to nicotine (Bloch and Gartner, 1999; Hansonn,1999; IARC,
1996; Montgomery et al., 1999). However less attention has been brought to the
possibility of interaction of the tobacco smoke components with the chemical
compounds fulfilling the protective role in our organism, including with antioxidants. The aim of the study was to analyse the vitamin C concentration (vit. C) changes in
the serum of women with breast cancer, considering the cotinine concentration
changes in the urine.
Material and methods The analysis included 100 women aged 36 to 71 years (average 48.8 years) treated
for the first time, treated because of breast cancer. Before the intervention, in all the
women examined the concentrations of cotinine in urine and vitamin C in blood
serum were determined.
The measurement of vitamin C in the serum was carried out according to the analytic
procedure presented in detail by Levine (1986). A range of normal values of the vit. C
concentration in the serum amounting to 0.90+0.22 mg/dl was established on the

290
basis of the results obtained from the examination of 40 women voluntary blood
donors aged 29 to 59 years (reference group).
The measurement of the cotinine concentration in the urine was carried out
chromatographically according to the analytic procedure presented by Pach and
Piekoszewski (2000).
The statistical analysis of the results was conducted using the SAS program rel. 6.03.
Wilcoxon’s test was used to study differences between the averages for non-normal
distributions. F-test and Pearson’s correlation coefficient were used to study the
relationship between the changes of the vit. C concentration in the blood serum and
cotinine concentration in the urine. The critical level p<0.05 was adopted as
statistically significant.
Results and discussion The cotinine concentration in the urine among the totality of the women examined
remained within the very wide limits of 23.7 ng/ml to 5382.9 ng/ml (average: 737.3
ng/ml). The women examined were divided in two groups: group actively or passively
exposed to tobacco smoke (63 persons) and group non exposed to tobacco smoke
(37 persons). The vit. C concentration in the women blood serum examined varied
from 0.18 mg/dl to 1.19 mg/dl. The average vit. C concentration amounted to
0.64+0.25mg/dl and was statistically significantly lower in comparison with the
average reference value (p<0.001). Results of the vit. C determinations are
presented in figure 1.
Non-smokers Smokers0.0
0.5
1.0
1.5
0.76+0.26
0.52+0.19
Vita
min
C c
once
ntra
tion
in th
e se
rum
[mg/
dl]
p<0.05
Fig. 1. Vitamin C concentration in the blood serum of women with breast cancer in
relation to the exposure to tobacco smoke.

291
Table 1. Value of Pearson’s correlation coefficient between concentrations of cotinine
and of vitamin C in women with breast cancer exposed to tobacco smoke.
Group examined Investigated factors Correlation coefficient p value
Women with breast cancer exposed to tobacco smoke
Cotinine vs.
Vitamin C -0.3660 0.01
Table 2. Dependence between the vitamin C concentrations in the blood serum and
cotinine concentrations in the urine in the group of women exposed to tobacco
smoke in relation to the clinical progression of the breast cancer.
Progression of cancer according
to TNM Atlas (1992)
Vitamin C concentration in the blood serum
Arithmetic mean+Standard
deviation [mg/dl]
Cotinine concentration in
the urine Arithmetic
mean+Standard deviation [ng/ml]
Statistic value F
I0 II0 III0
0.69+0.21* 0.51+0.18**1
0.36+0.13**2
658.4+89.3* 798.6+111.7 893.8+69.8**
25.87 17.28 6.78
*, ** and 1,2 – differences statistically significant, p<0.05
The results obtained testify that tobacco smoking most strongly influences the
changes of the vit. C concentration in the serum of women with breast cancer being
at the I0 clinical progression. As the cancer progression increases, the role of the
exposure to tobacco smoke in the formation of ascorbates reserves in the serum
gradually diminishes. At the III0 of progression of the breast cancer the influence of
the tobacco smoking on the magnitude of the vit. C deficiency in the serum is already
3.8 times as less as in the I0.
The results we obtained show that up to 63% of women with breast cancer are
tobacco smokers. This fact is saddening but does not surprise considering the
opinions of some authors underlining that tobacco smoking increases the risk of
developing this neoplasm (Bloch and Gartner, 1999; Holleb et al., 1998).

292
Other authors as well point to the unfavorable effect of tobacco smoking on the
systemic ascorbates reserves Oberbeil, 1997; Stadtman and Berlett, 1997).
Conclusions 1. The average vit C in serum of smoking women with breast cancer was statistically
significantly lower in comparison with non-smoking women, as well as with
reference values.
2. The strongest links between the changes in the serum of the vit C and tobacco
smoking occur in the least clinically advanced forms (Io and IIo) of the breast
cancer. As the progression of the neoplasm increases, the participation of the
tobacco smoking in the diminution of the vit. C reserves in the serum is less and
less important.
Summary The analysis included 100 women aged 36 to 71 years, treated because of breast cancer. In all of them the chromatographic determinations were carried out of the cotinine concentration in the urine and of the vit. C in the blood serum. It was shown that in the group of smoking women the average vitamin C concentration in the serum was statistically significantly lower in comparison with the women non-smokers and with the reference values. It was confirmed the changes of the vitamin C concentration in the serum are subject to the influence of the exposure to tobacco smoke at a level of Pearson’s correlation coefficient amounting to -0.3660. Moreover it was established that the strongest links between the changes of the vit. C concentration in the blood serum and tobacco smoking occur in the least clinically advanced forms (I0 and II0) of the breast cancer. As the progression increases of the neoplasm, the participation of tobacco smoking in the diminution of the vitamin C reserves in the serum becomes lesser. Literature Bloch R S, Gartner S (1999): Physiologische Chemie. Aufl. Enke, Stuttgart Hansonn H A (1999): Physiology in health and disease. Saunders, Philadelphia Holleb A I, Fink D J, Murphy G P (1998): Clinical oncology. Browman, Atlanta IARC (1996): Tobacco smoking. IARC Monographs 38, Lyon Levine M (1986): N Engl J Med, 314, 892-902 Montgomery R, Dryer R, Conway T W (1999): Biochemistry. Mosby Co, St Louis Oberbeil K (1997): Fit durch Vitamine. Sudwest Verlag GmbH/Co.KG Pach J, Piekoszewski W (2000): Acta Pol Toxicol, 8, 179-185 Speissl B, Beahrs O H, Hermanek P, Hutter R V P, Scheibe O, Sobin L H et al (1992)
TNM Atlas: illustrated guide to the TNM/p TNM classification of malignant tumours. Springer Verlag, Berlin
Stadtman E R, Berlett B S (1997): Chem Res Toxicol, 10, 485-494
293
Influence of different dietary vitamin C levels and storage time on vitamin E content and oxidative stability in m. longissimus dorsi of growing pigs Eichenberger, B., Gebert, S., Wenk, C. Swiss Federal Institute of Technology (ETH) Zurich, Institute of Animal Sciences, Nu-trition Biology, CH- 8092 Zurich, Switzerland Introduction Both vitamins E and C are strong antioxidants. While the lipid-soluble vitamin E is
essential for pigs and widely used in pig diets, dietary recommendations for the wa-
ter-soluble vitamin C exist only for stress conditions, e. g. after weaning or under un-
satisfying housing systems. The main location of action of vitamin E is in the cell
membranes where it protects phospholipids against oxidation. In contrast, vitamin C
acts as an antioxidant in aqueous environments of cellular components. Both vita-
mins may act synergistically, as vitamin C seems to be an effective way to save vita-
min E. Beside drip loss and colour, the oxidative stability is an important quality factor
of both the consumer and meat industry. Storage under oxygen exposure, e. g. in the
fridge, causes increased lipid oxidation in meat. As shown in earlier studies, dietary
supplementation of vitamin E led to lower susceptibility to oxidation of pork (i. e.
Buckley et al. 1989, Monahan et al. 1992, Hoving-Bolink et al. 1998). The influence
of dietary vitamin C on quality traits is barely investigated.
Therefore, the aim of the present study was to examine different vitamin C supple-
mentations of pig diets and storage time on vitamin E content and oxidative stability
in m. longissimus dorsi.
Materials and Methods Forty Large White barrows were allocated to four feeding treatments based on cere-
als and supplemented with 140 mg/kg dl-α-tocopherylacetate (13.4 MJ/kg DE, 168
g/kg CP). The animals were fed from a mean body mass of 25 ± 2.4 kg (initial) to 105
± 3.0 kg (final) with either the basal diet (treatment B) or the basal diet supplemented
with 100 mg/kg (treatment C100), 200 mg/kg (treatment C200) or 400 mg/kg (treat-
ment C400) vitamin C as crystalline ascorbic acid (Table 1).
At slaughtering samples of m. longissimus dorsi were obtained, homogenised and
stored at – 20 °C until analyses. At day 0, 2, 4 and 8 after thawing, content of dry
matter (DM), vitamin E and thiobarbituric acid reactive substances (TBARS) as a pa-
rameter for lipid peroxidation were determined. During this time samples were kept in

294
darkness at + 4 °C, overwrapped with an oxygen-permeable and moisture-proof PVC
stretch-wrap.
Table 1: Nutrient content (calculated and analysed) of the experimental diets (per kg feed)
Feeding treatment Item B C100 C200 C400
Supplement Crystalline ascorbic acid mg/kg - 100 200 400 dl-α-tocopherylacetate mg/kg 140 140 140 140
Analysed Vitamin E1) mg/kg 118.4 135.7 133.8 139.4
α-tocopherol mg/kg 108.6 124.6 122.8 128.6 β-tocopherol mg/kg 2.03 2.19 2.27 2.31 γ-tocopherol mg/kg 5.94 6.83 6.66 6.64 δ-tocopherol mg/kg 1.89 2.10 2.10 1.88
Vitamin C2) mg/kg 0.50 47 110 265 1) sum of α-, β-, γ- and δ-tocopherol. 2) ascorbic acid.
Results and Discussion Growth performance, carcass characteristics and quality traits (measured at the abat-
toir) were not significantly affected by feeding treatments (Eichenberger 2003). These
findings are in agreement with several investigations of dietary vitamin C and growing
pigs (Mahan et al. 1994, Zhao et al. 2002).
As shown in Tables 2 and 3, neither vitamin E content nor TBARS of m. longissimus
dorsi were affected significantly by feeding treatments. As the lipid-soluble vitamin E
is connected with lipids in tissues, fat content of longissimus dorsi muscle was ana-
lysed by extraction with petrol-ether. Fat content was not affected by treatments and
was between 5.0 % (treatment B) and 7.3 % (treatment C100). Storage time led to
significantly different vitamin E concentration only in samples of treatment B. In gen-
eral, a numerical decrease of total tocopherol concentration from Ø 22.5 mg/kg DM
to Ø 19.3 mg/kg DM over all treatments was observed. At day 0, treatment B tended
to result in a higher vitamin E content (23.5 mg/kg DM) than the vitamin C supple-
mented treatments (Ø 22.2 mg/kg DM). But finally at day 8, vitamin E content was
balanced in all treatments. Whereas samples of treatment C200 showed an almost

295
linear decrease of vitamin E concentration over time, the tocopherol content in the
other treatments was stable (treatment C100) or even increased (treatments B and
C400) between day 2 and 4. Decreasing vitamin E content during storage time is in
good agreement with Berk et al. (1998), but in contrast to findings by Gebert (1998)
who did not find reduced α-tocopherol concentration in m. longissimus dorsi samples.
Table 2: Effect of diets and storage time on vitamin E1) content of m. longissimus dorsi 2) (mg/kg DM)
Feeding treatment Item B C100 C200 C400
Day 0 23.5 ± 2.1a 22.0 ± 2.5 22.1 ± 1.6 22.5 ± 3.1 Day 2 20.3 ± 1.9ab 20.3 ± 2.3 20.9 ± 1.7 20.5 ± 2.3 Day 4 21.3 ± 1.8ab 20.3 ± 2.5 19.8 ± 2.9 20.9 ± 3.9 Day 8 19.3 ± 2.9b 19.6 ± 2.5 19.2 ± 2.2 19.2 ± 2.1 1) sum of α-, β-, γ- and δ-tocopherol. 2) values represent least square means (standard deviation). ab within a column, means without a common superscript letter differ significantly (P<0.05).
The same decreasing trend could be shown for TBARS (Table 3). At day 0, TBARS
spread widely from 1.53 mg MDA/kg DM in treatment B to 1.13 mg MDA/kg DM in
C100. At day 8, all treatments were between 1.01 mg MDA/kg (treatment B) and 1.07
mg MDA/kg DM (treatment C400). Samples of treatment C200 decreased already at
day 2 to the final TBARS level of day 8, whereas the other treatments declined to Ø
1.2 mg MDA/kg DM which was kept constant until day 4.
Table 3: Effect of diets and storage time on TBARS1) of m. longissimus dorsi 2) (mg/kg DM) Feeding treatment
Item B C100 C200 C400
Day 0 1.53 ± 1.3 1.13 ± 0.7 1.35 ± 0.5 1.31 ± 0.4 Day 2 1.25 ± 0.7 1.21 ± 0.8 1.00 ± 0.1 1.23 ± 0.4 Day 4 1.26 ± 0.6 1.24 ± 0.5 0.95 ± 0.2 1.21 ± 0.5 Day 8 1.01 ± 0.4 1.01 ± 0.3 1.06 ± 0.3 1.07 ± 0.5 1) mg malondialdehyde (MDA)/kg. 2) values represent least square means (standard deviation).
In respect to several studies we assumed increasing TBARS during storage time. In
investigations by Gebert (1998) TBARS were higher after 8 and 16 days. The same
result is reported by Asghar et al. (1991), Pfalzgraf et al. (1995), Dirinck et al. (1996)
and Hoving-Bolink et al. (1998) in pork meat as well as by Faustmann et al. (1989) in
Holstein steer beef.

296
Summary The objective of the present study was to examine the influence of different vitamin C supplementations (0, 100, 200 and 400 mg/kg crystalline ascorbic acid) and storage time on vitamin E content and TBARS in m. longissimus dorsi of growing pigs. Nei-ther vitamin E concentration nor TBARS were affected significantly by feeding treat-ments. During storage time both parameters declined with increasing storage time, which leaves the assumption of a better oxidative stability (lower TBARS) with a lower antioxidant content.
References
Asghar A, Gray J I, Booren A M, Gomaa E A, Abouzied M M, Miller E R, Buckley D J (1991): Effects of supranutritional dietary vitamin E levels on subcellular deposition of α-tocopherol in the muscle and on pork quality. J. Sci. Food Agric., 57, 31-41.
Berk A, Rosenbauer H, Mancini V, Vemmer H, Schaarmann G, Flachowsky G (1998): Ein-fluss unterschiedlich hoher Vitamin-E-Gaben an Mastschweine auf die Fleisch- und Speckqualität in Abhängigkeit von der Lagerung. Z. Ernährungs-wiss., 37, 171-177.
Buckley D J, Gray J I, Asghar A, Price J F, Crackel R L, Booren A M, Pearson A M, Miller E R (1989): Effects of dietary antioxidants and oxidized oil on membranal lipid stability and pork product quality. J. Food Sci., 54, 5, 1193-1197.
Dirinck P, De Winne A, Casteels M, Frigg M (1996): Studies on vitamin E and meat quality. 1. Effect of feeding high vitamin E levels on time-related pork quality. J. Agric. Food Chem., 44, 65-68.
Eichenberger B (2003): Vitamin E and C in diets for growing pigs: Impact on performance, quality traits and parameters of oxidative stability in digesta, blood and selected tissues. Diss. ETH No. 15210.
Faustman C, Cassens R G, Schaefer D M, Buege D R, Williams S N, Scheller K K (1989): Improvement of pigment and lipid stability in Holstein steer beef by dietary supplementa-tion with vitamin E. J. Food Sci., 54, 4, 858-862.
Gebert S (1998): Effect of dietary phytase and vitamin E supplementation to a diet high in oxidative capacity on meat and fat quality in pork. In: Effects of microbial phytase and vi-tamin E in fat supplemented diets for growing pigs and laying hens on performance, nu-trient utilization and product stability against oxidative alterations. Diss. ETH No. 12563, 52-63.
Hoving-Bolink A H, Eikelenboom G, van Diepen J Th M, Jongbloed A W, Houben J H (1998): Effect of dietary vitamin E supplementation on pork quality. Meat Sci., 49, 2, 205-212.
Mahan D C, Lepine A J, Dabrowski K (1994): Efficacy of magnesium-L-ascorbyl-2-phosphate as a vitamin C source for weanling and growing-finishing swine. J. Anim. Sci., 72, 2354-2361.
Monahan F J, Buckley D J, Morrissey P A, Lynch P B, Gray J I (1992): Influence of dietary fat and α-tocopherol supplementation on lipid oxidation in pork. Meat Sci., 31, 229-241.
Pfalzgraf A, Frigg M, Steinhart H, Kirchgessner M, Roth F X (1995): Influence of dietary fat and vitamin E on the lipids in pork meat. Fat Sci. Technol. 97, 1, 13-20.
Zhao J, Li D, Piao X, Yang W, Wang F (2002): Effects of vitamin C supplementation on per-formance, iron status and immune function of weaned piglets. Arch. Anim. Nutr., 56, 33-40.
This project is financed by the Commission for Technology and Innovation CTI, CH-Berne, and Roche Vitamins Ltd., CH-Basel

297
Effect of L-ascorbic acid on the liver antioxidant potential in chicks exposed to cadmium Berzina, N., Apsite, M., Basova, N. Institute of Biology, Latvian University, Miera Str. 3, Salaspils, LV-2169, LATVIA Introduction Cadmium is one of the most toxic heavy metal which induces oxidative damage in
different tissues by enhancing lipid peroxidation. Defense against peroxidation in the
organ and tissue cells is provided by the concerted action of range of antioxidant
components. Antioxidant system of cells include fat-soluble (vitamin A, E,
carotenoids) and water-soluble (ascorbic acid, glutathione) natural antioxidants.
Ascorbic acid (AA) is not an essential nutrient for chicks. However, requirement of AA
may be increased under different stress conditions. There are a number of reviews
about the role of AA in poultry metabolism and nutrition (Pardue and Thaxton, 1986;
Whitehead and Keller, 2003).
The aim of this study was to analyze the status of antioxidant components in the liver
and blood of chicks in response to dietary cadmium and ascorbic acid supply.
Material and methods 1-35-days Hybro G cross broiler cockerels were used in this study. All chicks were
divided into four groups. Chicks received full-value combined food based on barley,
wheat, and soybean meal balanced in all nutrients (Control). Cd concentration in this
food was 0.7 mg/kg. The second group of chicks (+Cd) received a diet with elevated
cadmium concentration (75 mg/kg), the third group (+AA) – with ascorbic acid (100
mg/kg) and the fourth group (+Cd+AA) – with cadmium and ascorbic acid in a
manner similar to the second and third group respectively. Cadmium was added to
diet as cadmium chloride, ascorbic acid as crystal Lutavit C (BASF).
The chicks were decapitated on the 35th day.
Cadmium concentration was estimated using a atomic absorption spectrophotometer
Perkin-Elmer. Lipid peroxidation in liver was determined by thiobarbituric acid
reaction. Results were expressed as µmol MDA (malondialdehyde) per gram fresh
liver tissue (Apsite et al., 1999). The glutathione level in the liver was measured
spectrophotometrically by 5.5-ditio-bis-para-nitro-benzoic acid. Vitamin A
concentration in the liver was estimated by thin layer chromatographic analysis
(Valdman et al., 1993). Oxidized and reduced vitamin C in plasma was determined
by HPLC-fluorescence micromethod (Tessier et al., 1995).

298
Statistical analysis was performed by paired samples test using program SPSS (Bühl
and Zöfel, 2002). Data were expressed as the mean±SE. Statistical differences were
analyzed using Student’s t-test. A p value of less than 0.05 was considered to
indicate statistically significant differences.
Results and discussion The addition of cadmium has greatly stimulated the rates of lipid peroxidation in liver
of chicks from the second group (Table 1). Activity of oxidative processes was
determined by measuring the MDA accumulation in liver. The final product of the
oxidation of unsaturated fatty acids MDA is known to be an appropriate marker of
oxidative damage. Its formation in liver of this chicks rose by 43% in comparison with
the control group (P<0.04). The results showed the positive effects of dietary vitamin
C (ascorbic acid) supplementation on oxidative stability and MDA formation in chick
liver (third and fourth groups). The concentration of MDA in the liver of chicks (third
group) was reduced by dietary supplements of vitamin C compared with control, but
not significantly. However, accumulation of MDA in the liver of chicks from fourth
group, which received a diet with elevated cadmium and ascorbic acid concentration,
was not increased. That indicates the oxidative effect of cadmium can be prevented
by the simultaneous administration of ascorbic acid.
Our study has indicate that dietary ascorbic acid supplement led to the accumulation
of cadmium in chick liver (Table 1, third group). However, increase of cadmium level
does not produce changes in oxidative processes in liver. Some studies have
indicated that metallothionein (MT) and other metal-binding proteins synthesis were
induced in the liver and kidney after oral administration of ascorbic acid (Berzina et
al., 2001; Shiraishi et al., 1993).
Table 1. Effect of ascorbic acid and cadmium supplementation on Cd accumulation and MDA formation in broiler chick liver (mean±SE) Group Nr. Groups characteristics Cd, µg/g wet wt MDA, µmol/g wet wt 1. Control 0.42±0.02 24.15±1.62 2. +Cd 34.40±2.05 34.55±1.58 Paired Samples Test P < 0.001 P < 0.04 3. +AA 1.22±0.08 23.00±1.70 4. +Cd+AA 42.80±5.04 23.20±1.69 Paired Samples Test P < 0.001 P > 0.05
The concentration of vitamin A in liver fell sharply 4.01 times in +Cd-chicks. Our
previous study indicated the decrease of level of vitamin E in liver of chick exposed to

299
cadmium (Berzina et al., 2002). The concentrations of fat-soluble vitamins in the liver
by the dietary supplementation of vitamin C were higher (Table 2). Thus the level of
vitamin A in the liver of +Cd+AA-chicks increased by 38.6% compared with the +Cd-
chicks. Therefore, vitamin C seems to be an effective way to save vitamin A.
Table 2. Effect of ascorbic acid and cadmium supplementation on vitamin A concentration and glutathione level in broiler chick liver (mean±SE) Group Nr. Groups
characteristics Vitamin A, µg/g wet wt
Glutathione, µmol/g wet wt
1. Control 128.37±10.57 3.43±0.22 2. +Cd 31.65±4.59 5.38±0.16 Paired Samples Test P < 0.001 P < 0.002 3. +AA 120.18±11.21 3.58±0.26 4. +Cd+AA 43.88±5.27 5.93±0.21 Paired Samples Test P < 0.002 P < 0.008
Nevertheless, the concentration of reduced glutathione has increased 1.6-1.7 times
within the liver of chicks exposed by cadmium. The mean values for liver Cd and
GSH levels are presented in Tables 1 and 2 shown that the concentration of GSH
correlates positively with the concentration of cadmium in the liver. The glutathione
content increased slightly in liver of chicks after ascorbic acid additional consumption
(Table 2).
Dietary vitamin C supplementation had not a significant effect on this vitamin
concentration in the blood plasma (Table 3). The consumption of the diet with
elevated cadmium level resulted in a reduction both L-ascorbic acid and
dehydroascorbic acid (DHA) concentration in blood plasma. However, the fall of L-
ascorbic acid amount in blood of +Cd-chicks was more significant than DHA content.
Table 3. Effect of ascorbic acid and cadmium supplementation on L-ascorbic acid and dehydroascorbic acid concentration in broiler chick blood plasma (mean±SE) Group Nr. Groups
characteristics L-ascorbic acid, µg/ml
DHA, µg /ml
Total, µg /ml
1. Control 2.06±0.32 7.50±1.90 9.56±1.61 2. +Cd 0.64±0.40 4.94±0.31 5.50±0.57 Paired Samples Test P < 0.05 P < 0.001 P < 0.028 3. +AA 1.38±0.63 8.54±0.64 9.92±0.89 4. +Cd+AA 0.14±0.11 6.70±0.88 6.64±1.01 Paired Samples Test P > 0.05 P > 0.05 P < 0.05
In conclusion, the results in this study indicate that receiving an exogenous ascorbic
acid supplement decreases the toxicity of cadmium in chicks. The protective effects
appear to be due to the functioning of ascorbic acid as antioxidant, which can save
300
other natural antioxidants (vitamins A and E, glutathione) on the high level. Moreover
our data showed that no relationship existed between the cadmium concentration in
liver and the degree of liver disturbances of fat-soluble vitamin metabolism and
formation of MDA. The protective effect of vitamin C is associated with an increase of
Cd content in liver. This effect is associated with an increase in Cd-binding to metal-
binding proteins and SH-rich substances.
Summary The present study evaluates the effect of cadmium and ascorbic acid dietary supplementation on lipid peroxidation and antioxidant level in the liver and blood plasma in four groups of 1-35-days chicks. Chickens fed a standard diet (control) and the same diet, but differed: with the elevated Cd content – 75 mg/kg (+Cd); supplemented by ascorbic acid – 100 mg/kg (+AA) and added the same doses of Cd and AA simultaneously (+Cd+AA). Our results have shown that cadmium accelerates destroying of components of the antioxidant defence system. The dietary addition of vitamin C (ascorbic acid) provided with protection of the chicks against oxidative stress and cadmium toxicity by the endogenous MDA formation reduction. The increase concentration of vitamins A, E, glutathione in liver is associated with a reduction in their susceptibility to lipid peroxidation. There is a correlation between the cadmium concentration and glutathione level in broiler chick liver. The possible mechanisms of ascorbic acid defence effect under the cadmium toxicosis are considered. Literature Apsite M., Berzina N., Basova N. (1999): Effects of selenium on the antioxidant system after introduction of cadmium in chicks. Proc. Latvian Acad. Sci., Section B. 53, 16-20 Valdman A., Surai P., Ionov I., Sachackij N. (1993): In: Vitamins in the feeding of animals, Original, Kharkov, pp 341-356 Tessier F., Birlouez-Aragon I., Tjani C., Guilland JC. (1995): Validation of a micromethod for determining oxidised and reduced vitamin C in plasma by HPLC-fluorescence. Anal. Biochem. 229, 329-335 Bühl A., Zöfel P. (2002): In: SPSS Version 10 Einführung in die moderne Datenanalyse unter Windows, Addison-Wesley, München, pp 1-601 Berzina N., Apsite M., Smirnova G., Basova N. (2002): Cadmium disturbances antioxidant defense system in chicks. In: Macro and Trace Elements. 21, Schubert-Verlag Leipzig, 693-698 Berzina N., Smirnova G. (2001): Effect of L-ascorbic acid on renal SH-rich proteins in cadmium treated chicks. In: Vitamine und Zusatzstoffe in der Ernährung von Mensch und Tier. 8, Braunschweig: FAL, 383-386 Pardue S. L., Thaxton J. O. (1986): Ascorbic acid in poultry: a review. World’s Poultry Science Journal 42, 107-123 Whitehead C. C., Keller T. (2003): An update on ascorbic acid in poultry. World’s Poultry Science Journal 59, 161-184 Shiraishi N., Uno H., Waalkes M. P. (1993): Effect of L-ascorbic acid pretreatment on cadmium toxicity in the male Fischer (F344/NCr) rat. Toxicology 85, 85-100

301
Intake of vitamins B1, B2 and C among the adult and children population of the Chuvash republic (Russia) Khokhlova Helen The Preventive Medicine Chair of the Chuvash State University, Moscow Ave-nue - 45, 428045 Cheboksary, Russia The results of investigation of vitamin level in the daily ration of 96 children at the age
of 11-12 and 85 adults in the Chuvash Republic are submitted. The actual nutrition
was estimated by 10-days-food-record method. Vitamins content and dietary energy
were calculated using software “Nutritionist” (lic. № 2002611713, 2002) with data-
base for Russian foodstuff. Dietary energy intake insufficient for the adult ration
(2133±48,7 kcal/day) has been revealed. This dietary energy level is much lower
than it is recommended by Department of Health (DH) of the Russian Federation
(RF) (2550/3150 kcal) for the given group of physical activity. Dietary energy of a
daily diet of schoolboys (2597,1±68,75 kcal/day for boys and 2516,9±73,42 kcal/day
for girls) corresponds to the recommended norms in Russia. Thiamine intake for
adults is 1,5±0,05 mg/day, for children - 1,55±0,07 mg/day, riboflavin intake -
1,23±0,04 mg/day for adults and 1,22±0,06 mg/day for children, ascorbic acid -
52,5±2,17 mg/day and 54,4±3,31 mg/day accordingly. Sixty six per cent of adult and
33 % of children have thiamine level in daily ration lower than DH RF recommenda-
tion. Ninety three per cent of adults and 94% of children (88% of girls and 100 % of
boys) have insufficient level of riboflavin. Vitamin C level below than DH RF recom-
mendation for 97 % of adults and 75 % of children in the daily diet is revealed. Daily
diets for 33 % of children have the quantity of vitamin C below 45 mg. The cause of
the revealed vitamins deficiency can be explained by insufficient intake of dairy prod-
ucts, fresh vegetables and fruits in their diet. Average intake of dairy products is 236
g/day; the use of cottage cheese, sour cream and cheeses is so low, that it isn’t con-
sidered as significant factors in nutrition structure of the diet. The basic sources of
vitamin C in Chuvashia are the potato, cabbage and apples; as for portion of other
vegetables and fruits as important vitamin sources, they quantity are very small. Au-
thentic nutrition differences of the city- and village-dwellers were also revealed.

302
Vitamins intake in daily diet in groups of disabled and healthy schoolchildren attending integration classes
Kolarzyk, E.1, Janik, A.1, Schlegel-Zawadzka, M. 2 1Department of Hygiene and Ecology, Medical College Jagiellonian University, 7 Kopernika Str., 31-034 Krakow; 2Department of Human Nutrition, Medical College Jagiellonian University, 20 Grzegórzecka str., 31-531 Krakow; Poland
Introduction An improper state of nutrition may significantly and negatively influence the growth of
any child, but it especially influences the health state and proper rehabilitation of
disabled children and teenagers. A proper intake of vitamins may support this
processes (Ayyangar, 2002; Cass et al., 1999; Hals et al. 1997).
The aim of this study was to evaluate the nutritional value of daily nutrition ration and
analyse the content of vitamins B1, B2, B6, PP, C, A and E in the diets in the groups
of disabled and healthy schoolchildren.
Material and methods The groups included 36 disabled and 106 healthy children attending two schools in
Cracow, which were the first to create integrated classes in the primary schools in
Krakow. Their age range was between 11 and 15 years and they attended 5th and 8th
grades. The group of disabled children presented various levels of psychosomatic
dysfunction, especially infantile cerebral palsy, mental retardation and mental
deficiency. Anthropometry and bioimpedance measurements were applied for
protein-energy nutritional status assessment and 24-h dietary recall was performed
for consumption pattern evaluation. During the nutritional recall the “Album of
products and meals portions”, created and published by the National Food and
Nutrition Institute was used (Szczygłowa et al., 1991). Data concerning mentally
retarded children were collected from their mothers. The mean intake of basic energy
compounds (protein, fats and carbohydrates) and their percentage as energy
sources (En%) in the daily rations were calculated without taking into account
technological losses.
The level of selected vitamins content (B1, B2, B6, PP, C, A, E) in the menu
was calculated with the use of computer programme FOOD2. The results were
compared with daily norms recommended on the safe level of intake for each gender

303
and age (Ziemlański et al., 1995). The statistical analysis was assessed by Statistica
v.6.0 program. The differences between healthy and disabled children in the aspect
of level of nutrients and vitamins intake in daily diet were estimated by using (2 test.
Results and discussion The disturbances of weight-height proportion were observed in both group: in 20.8%
of healthy and 22.2% of disabled children. However in the healthy group was more
cases of low body weight (<10 percentile) (Fig. 1).
healthy disabled
Figure 1. Body weight / height proportions (the estimation in accordance with percentile diagrams) The energy proportions coming from proteins, fats and carbohydrates were correct in
healthy boys and girls (Tab. 1). The anomalies observed in disabled groups
concerned too big amount of energy coming from fats (girls-35%, boys –32%) and a
rather small percentage of energy coming from carbohydrates (girls-52%). The
energy percentage contributed by proteins was consistent with the recommendations
in both groups examined.
Table 1. Mean level of energy and basic nutrients intake in daily diet of children examined (x – arithmetic mean, SD – standard deviation, En% - % of energy).
Mean values for selected groups Energy [kcal] Proteins [g] Fats [g] Carbohydrates [g]
The groups of children examined x ± SD x ± SD En% x ± SD En% x ± SD En%Healthy girls n=51
2059 ± 639 63 ± 19.9 13 70 ± 29 30 311 ± 103 57
Disabled girls n=15
1945 ± 680 61 ± 20 13 76 ± 31 35 268 ± 102 52
Healthy boys 55
2343 ± 751 75 ± 35 13 79 ± 37 30 353 ± 116 57
Disabled boys n=21
2239 ± 972 74 ± 3.4 13 78 ± 36 32 332 ± 147 55
79,2 %
12,3 %
8,5 %
10 - 90 percentile< 10 percentile> 90 percentile
13,9%
8,3%
77,8 %
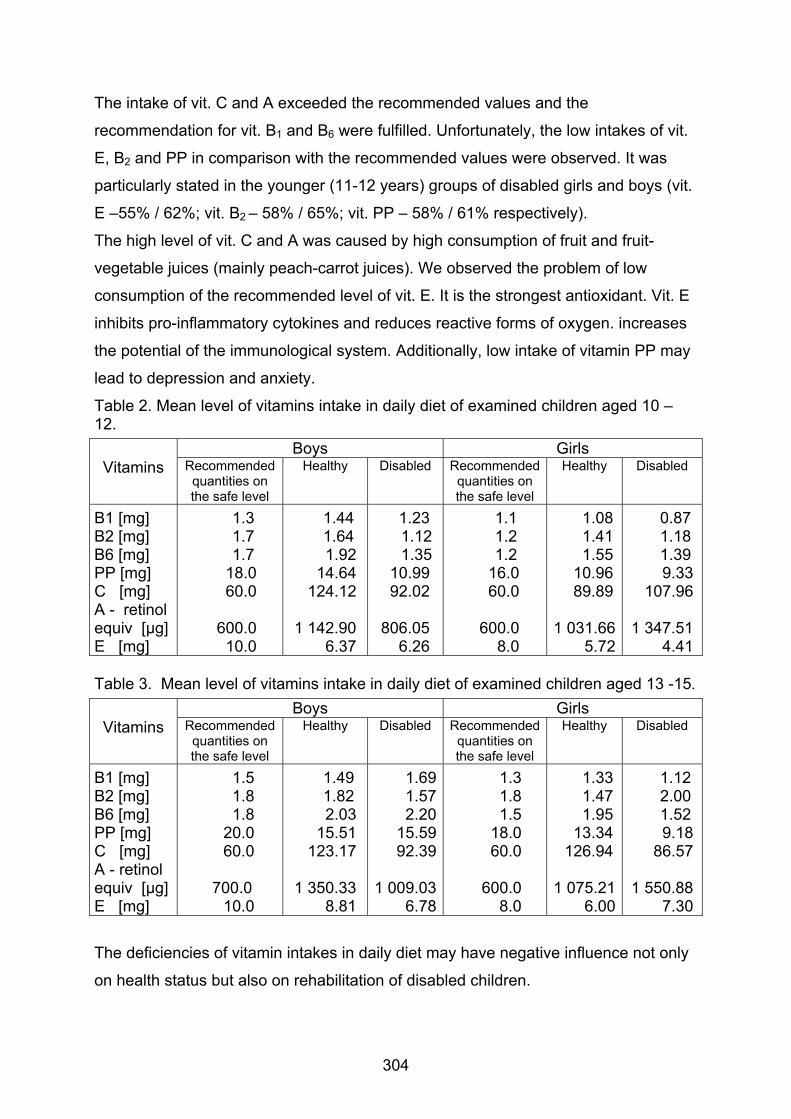
304
The intake of vit. C and A exceeded the recommended values and the
recommendation for vit. B1 and B6 were fulfilled. Unfortunately, the low intakes of vit.
E, B2 and PP in comparison with the recommended values were observed. It was
particularly stated in the younger (11-12 years) groups of disabled girls and boys (vit.
E –55% / 62%; vit. B2 – 58% / 65%; vit. PP – 58% / 61% respectively).
The high level of vit. C and A was caused by high consumption of fruit and fruit-
vegetable juices (mainly peach-carrot juices). We observed the problem of low
consumption of the recommended level of vit. E. It is the strongest antioxidant. Vit. E
inhibits pro-inflammatory cytokines and reduces reactive forms of oxygen. increases
the potential of the immunological system. Additionally, low intake of vitamin PP may
lead to depression and anxiety.
Table 2. Mean level of vitamins intake in daily diet of examined children aged 10 – 12.
Boys Girls Vitamins Recommended
quantities on the safe level
Healthy Disabled Recommended quantities on the safe level
Healthy Disabled
B1 [mg] B2 [mg] B6 [mg] PP [mg] C [mg] A - retinol equiv [µg] E [mg]
1.3 1.7 1.7 18.0 60.0
600.0 10.0
1.44 1.64 1.92 14.64 124.12
1 142.90 6.37
1.23 1.12 1.35 10.99 92.02
806.05 6.26
1.1 1.2 1.2 16.0 60.0
600.0 8.0
1.08 1.41 1.55 10.96 89.89
1 031.66 5.72
0.87 1.18 1.39 9.33 107.96
1 347.51 4.41
Table 3. Mean level of vitamins intake in daily diet of examined children aged 13 -15.
Boys Girls Vitamins Recommended
quantities on the safe level
Healthy Disabled Recommended quantities on the safe level
Healthy Disabled
B1 [mg] B2 [mg] B6 [mg] PP [mg] C [mg] A - retinol equiv [µg] E [mg]
1.5 1.8 1.8 20.0 60.0
700.0 10.0
1.49 1.82 2.03 15.51 123.17
1 350.33 8.81
1.69 1.57 2.20 15.59 92.39
1 009.03 6.78
1.3 1.8 1.5 18.0 60.0
600.0 8.0
1.33 1.47 1.95 13.34 126.94
1 075.21 6.00
1.12 2.00 1.52 9.18 86.57
1 550.88 7.30
The deficiencies of vitamin intakes in daily diet may have negative influence not only
on health status but also on rehabilitation of disabled children.

305
Conclusions The knowledge on rational nutrition and proper vitamins intake should be
disseminated among parents and tutors of disabled children.
Summary The aim of this study was to evaluate the consumption and nutritional value of daily nutrition rations in the groups of 36 disabled children and 106 healthy children (11 -15 year old) attending integration classes in Cracow elementary schools. 24-h dietary recall was performed and the mean intake of the basic energy compounds and selected vitamins (B1, B2, B6, PP, C, A, E) was calculated. These values were compared with recommended intake on the safe level. The intake of vitamin C and A exceeded the recommended values and the recommendation for vitamins B1 and B6 were fully met. Contrary to this, the low intake of vitamin E, B2 and PP was observed. It was particularly stated in the younger (11-12 year old) groups of disabled girls and boys (vit. E–55% / 62%; vit. B2 -58% / 65%; vit.PP – 58% / 61% respectively). Literature Ayyangar R (2002): Phys Med & Rehab Clinics North Am, 13, 793-821 Cass H, Price K, Reilly S, Wisbeach A, McConachie H (1999): Child: Care. Hlth &
Developm, 25, 191-211 Charzewska J, Chwojnowska Z, Rogalska-Niedźwiedź M (1992): Żyw Człow Metab.
19, 17-25 Chwojnowska Z, Charzewska J, Rogalska-Niedźwiedź M, Chabros E (1992): Żyw
Człow Metab, 19, 165-175 Duda G (1992): Żyw Człow Metab, 19, 252-262 Hals J, Ek J, Svalastog A G, Nilsen H (1997): Acta Paed, 85, 670-671 Janik A, Adamska-Skuła M, Miodońska K, Suder Z, Kruczek A (1999): Problemy Hig,
59, 46-54 Kolarzyk E, Janik A (2003): Pol J Food Nutr Sci, 12/53, 73-81 Nadolna I, Kunachowicz H (1994): Żyw Człow Metab, 21, 243-252 Szczygłowa H, Szczepańska A, Neres A, Nowicka L (1991): Album porcji produktów i
potraw. Wyd. IŻŻ., Warszawa Ziemlański Ś, Bułhak-Jachymczyk B, Budzyńska-Topolowska J, Panczenko-
Kresowska B, Wartanowicz M (1995): Nowa Med, 2, 5, 1-27 Ziemlański Ś, Wartanowicz M (1999): Żyw Człow Metab, 26, 320 - 329

306
Dienogest- containing oral contraceptives and serum vitamin levels- A long time study Noack, J., Schubert, K.¹, Winnefeld, K.¹, Klinger, G.¹
¹ Friedrich- Schiller- University, Jena, Germany
Introduction: Valette® of Jenapharm is an one- phase- contraceptive which means
that it contains the same concentration of a gestagen and an estrogen on every day
of use. Valette contains 2 mg of the gestagen Dienogest and 0,03 mg of the estrogen
ethinyl estradiol. It is taken for 21 days of the cycle followed by a gap of 7 days. The
included gestagen Dienogest is a derivative of 19- nortestosterone and offers oral
availability and an increase in gestagenic effectiveness. These is thought to be
caused by the CH2CN- group in position 17 and the double bond in 9(10) – position
of the molecule. Furthermore especially the cyanomethyl- group in the alpha- 17-
position is known to guarantee a high selectivity of receptor- binding, resulting in non-
antiestrogenic, weak estrogenic, non- corticoid, non- anticorticoid and non-
androgenic but anti- androgenic effects. Particularly the last point enlarges the
spectrum of indication of Valette®, offering advantages in the therapy of androgenic
appearances like hirsutism or acne.
Questions: The study about Valette® concerns with possible influences of the
combination of dienogest and ethinylestradiol on the serum levels of various
parameters of metabolism and on the stability of the female cycle. Among other
things it focuses on possible changes of the serum levels of the vitamins A, C and
E and of the antioxidant system. The last point is represented by the determination of
malonic dialdehyde, superoxide dismutase and glutathione peroxidase. It is
examined if there exists a need for oral substitution of vitamins caused by the use of
the Dienogest- containing oral contraceptive Valette®.
Design: The study took place between December 1993 and December 2000 in the
Hospital of Gynecology of Friedrich- Schiller- University in Jena. With a duration of 7
years the first long- time study about the effects of Dienogest occurred. 98 women
between 18 and 50 years of age were involved. 15 of them were active smokers.
Women, who suffered from cardiovascular risk factors like former thrombembolic
events, diabetes mellitus, hyperlipidemia and hypertonia, diseases of the liver or
kidney or hormone- depended tumors, were excluded from the study. The group

307
consisted of both first- time- users of oral contraceptives and women, who used
another oral contraceptive before after a wash- out- cycle.
The first blood specimens were obtained after the first three months of use followed
by regular examinations in time- lag of 6 cycles. The observed cycles ranged
between 3 an 87 per woman, so 3720 cycles could be evaluated at the end of the
study.
Methods: The serum levels of the vitamins A, C and E were determined by HPLC.
The concentrations of the antioxidant parameters were measured by photometry.
The dates were summarized in groups of 6 cycles and demonstrated in point
diagrams. The statistic evaluation of the results included the calculation of the middle
average, the standard deviation and the verification of significance, using the one-
site T- test of student for depended samples on the level of 0,05.
Results: For Vitamin A there could be observed a tendency to increase between the cycles 45
and 87, which was in part significant to the previous cycle.
Serum levels of Vitamin A
0
0,2
0,4
0,6
0,8
1
1,2
1,4
z3 z9 z15 z21 z27 z33 z39 z45 z51 z57 z63 z69 z75 z81 z87
Period of use in cycles
Con
cent
ratio
n in
g/l
MW MW+S MW-S
MW= middle average MW+/- S= middle average +/- standard deviation ° = significance to third cycle of use x = significance to foregoing cycle No significant effects of Valette® on the serum levels of Vitamin C could be
determined.

308
Focusing on Vitamin E there could be observed a tendentious increase between
cycle 51 and cycle 81, partly significant to the previous cycle.
Serum levels of Vitamin E
0
5
10
15
20
25
z3 z9 z15 z21 z27 z33 z39 z45 z51 z57 z63 z69 z75 z81 z87
Period of use in cycles
Con
cent
ratio
n in
g/l
MW MW+S MW-S
MW= middle average MW+/- S= middle average +/- standard deviation ° = significance to third cycle of use x = significance to foregoing cycle Malonic dialdehyde has shown a decrease into the range of the reference borders
between the cycles 3 and 87. There could be verified both a significance to the third
month of use and to the foregoing cycle.
Malonic dialdehyde
02468
101214
z3 z9 z15 z21 z27 z33 z39 z45 z51 z57 z63 z69 z75 z81 z87
Period of use in cycles
Con
cent
ratio
n in
µm
ol/l
MW MW+S MW-S RB-Min RB-Max

309
MW= middle average MW+/- S= middle average +/- standard deviation *= significance to the third and the foregoing cycle RB-Min= minimal border of reference range RB-Max= maximal border of reference range During the 87 observed cycles no changes of activity of superoxide dismutase
occurred.
The results of the antioxidant system include a swaying decrease of glutathione
peroxidase into the reference range, which was in part significant to the third and the
foregoing cycle.
Glutathione peroxidase
75
125
175
225
275
z3 z9 z15 z21 z27 z33 z39 z45 z51 z57 z63 z69 z75 z81 z87
Period of use in cycles
Act
ivity
in U
/l
MW MW+S MW-S RB-Min RB-Max
MW= middle average MW+/- S= middle average +/- standard deviation *= significance to the third and the foregoing cycle RB-Min= minimal border of reference range RB-Max= maximal border of reference range Discussion: The low- dose oral contraceptive Valette® is shown to be nearly free of
influence on the serum levels of the examined vitamins A, C and E. During the past,
a possible need of vitamin substitution under application of oral contraceptives has
been discussed. The results of the study about Valette® seem to implicate that even
under long- time application of the Dienogest- containing combination there is no
need for a substitution of vitamins.
The parameters of the antioxidant system have been determined to give some
information about a possible oxidative stress caused by Valette®. The malonic

310
dialdehyde and glutathione peroxidase are known to be influenced by a lot of factors,
like age, smoking behavior and time of use of oral contraceptives.
The drop of concentration of malonic dialdehyde into the reference range can be
interpreted as a result of the stronger antioxidant effects of synthetic ethinyl estradiol
compared with the natural estrogen and a lack of influence of Dienogest. These
outcomes agree with these of Bremicker [1] and Klinger et al. [2], who also examined
the effects of Dienogest- containing contraceptives and also described a decrease of
malonic dialdehyde.
Glutathione peroxide is an antioxidant enzyme, responsible for the protection of
proteins of oxidant stress by keeping glutathione in his reduced form. It underwent a
decrease into the reference range, which is possible due to an adaptation of the
enzyme activity at the positive radical- neutralization- function of the ethinyl estradiol
molecule. The results of former studies about the interaction between oral
contraceptives and antioxidant status vary, possibly caused by a different duration of
examination and the many influencing factors on the oxidative balance. Bremicker [1]
in a study about the oral contraceptive Valette® observed a significant lower activity
of glutathione peroxidase in serum of users than in non- users of Valette®. Klinger et
al. [2] focused in a comparative study about Valette® and Certostat® and in a study
about Valette® and Lovelle® effects on the antioxidant balance. They described in
both cases an increase in the activity of glutathione peroxidase.
Finally it can be summarized a nearly lacking influence of Valette on the serum
vitamin levels and a decrease of activity of the antioxidant system, which is
interpreted as an outcome of the absent influence of Dienogest and the high
antioxidant potency of the synthetic ethinyl estradiol molecule.
[1] Bremicker J, Langzeitwirkung synthetischer Sexualsteroide oraler Kontrazeptiva auf das oxidative Gleichgewicht des menschlichen Organismus, Dissertation 2002 [2] Klinger G, Winnefeld K, Schubert K, Streck S, Klinger G (1997) Sexualhormone und Antioxidantienstatus, Med Klin 92, Suppl.III S36- 38

311
Vitamins A and E in farm-bred polar fox after starvation Ilyina, T. Institute of Biology, Karelian Research Centre, Russian Academy of Sciences, Pushkinskaya str., 11, Petrozavodsk, 185610, Russia Introduction
Investigation of starvation is of great value not only as biological or medical, but also as
social problem. The endocrine-metabolic adaptation happening under starvation affects work
of all organs and systems of organism (Zaychik, Churilov, 2001). The provision of energy and
nutrients including vitamins is supported from interior sources. However in wild nature
animals are often deprived of opportunity to receive food together with necessary vitamins
(Nordoy et al, 1993; Fuglei et al, 2000). Besides, it is known that there is no vitamins
synthesis in the organism of carnivores, therefore the need for them can be satisfied by the
exogenous inflow. For example, polar foxes can manage without food from 19 days to one
month. Endogenic starvation is observed also in animal’s winter hibernation. That is why the
study of metabolic mechanisms of response to substrate-energy deficit is of significant
interest. The aim of our investigation was to determine the vitamins A and E level in the
organs of polar foxes after short-time starvation.
Materials and Methods
Two groups of female and male polar fox (Alopex lagopus) were used for the experiment. The
control group (n=9) was fed with a standard ranch diet including vitamins. The experimental
group (n=10) was in full starvation diet. All animals had water ad libitum. After 8 days of
experiment the all animals were killed and organs (liver, kidney) were taken and frozen for
investigation. The vitamins A and E concentration in the organs was determined by high
performance liquid chromatography method.
Result and Discussion
The study has shown that under starvation the vitamins A and E concentration changed
differently. The vitamin A concentration in the liver and kidney decreased after starvation
compared with the control group (Fig 1). However, in the males the vitamin A level lowered
rapidly than in the females. The vitamin E concentration in the liver of females was relatively
similar in both groups, but in the experimental males the tocopherol level in the liver was
higher than in the control group. The kidney vitamin E level in the females and males of
experimental group after starvation were significantly higher compared with the control group

312
(Fig 2). Tocopherol stores redistribution has increased its concentration in organs. It was more
intensive in males.
Fig 1. Vitamin A concentration in polar fox liver (A) and kidney (B) after short-time
starvation (Mean±SD).
Thus, it was demonstrated that after starvation period the vitamin A decreased and vitamin E
level increased in organs, which was linked, obviously, with the adaptation of the animal
organism to raised demands the starvation. Under the starvation conditions there takes place
the significant metabolism transformation to raise the organism stability. Cessation of food
consumption results in decrease of the protein synthesis on ribosomes. The protein
mobilization from organs and blood ensures, first of all, brain energy needs.

313
Fig 2. Vitamin E concentration in polar fox liver (A) and kidney (B) after short-time
starvation (Mean±SD).
The decrease in protein metabolism intensity results in lowered vitamin A concentration in
liver and kidneys. However, due to high retinol stores in the organs the rate of decrease was
rather slow. During the first week of starvation the active mobilization of protein from a liver
happens, that characterize an initial period of emergency adaptation. Under starvation the
kidneys save rather well their histological structure and functions. After initial adaptation
period the diurnal protein losses are stabilized, fat utilization goes on at a high rate (Zaychik,
Churilov, 2001). The compensating under starvation is provided by using of somatic fat pool,
and it is well known that adipose tissue is characterized by high vitamin Е stores. Tocopherol
in animals acts not only as a structural antioxidant, but also as a regulator of energy
metabolism. Obviously, after 8-day starvation the compensator period occurs, and in these
conditions endogenous tocopherol mobilization happens. This explains the high tocopherol
level in the liver and kidneys. Vitamins level variation under starvation was more expressed
in males than in females. In human also females possess greater resistance to starvation
(Zaychik, Churilov, 2001).
Thus, the vitamins A and Е level reflects deep endocrine-metabolic reorganizations which
happen in animal organism under starvation and are connected with adaptation to economy
effort.

314
Summary
The aim of investigation was to determine the vitamins A and E concentration in the liver and
kidneys of polar foxes after short-time starvation. The study has shown that the decrease in
protein metabolism intensity results in lowered vitamin A concentration in organs.
Tocopherol stores redistribution has increased its concentration in organs of experimental
animals after starvation. Vitamins level variation under starvation was more expressed in
males than in females.
Acknowledgements
The participation in 9th Symposium “Vitamins and Additives in the Nutrition of Man and
Animals” was financially supported by “Deutsche Forscungsgemeinschaft” of the Federal
Republic of Germany.
References
Fuglei E., Aanestad M., Berg J.P. (2000). Hormones and metabolites of arctic foxes (Alopex
lagopus) in response to season, starvation and re–feeding. //Comp. Biochem. Physiol.,126
A, №2, 287 – 294.
Nordoy E.S., Aakvaag A., Larsen T.S. (1993). Metabolic adaptation to fasting in harp seal
pups. Physiol. Zool., 66, 926 – 945.
Zaychik A. Sh., Churilov L.P. (2001). Osnovi patohimii. “Elbi-SPb”, Sankt-Peterburg, 28-
52 (in Russian).

315
Change of vitamin E content in refined sunflowerseed oil during keeping Dimić, V., Dimić, E., Tešanović, D.1, Romanić, R. University of Novi Sad, Faculty of Technology, 21000 Novi Sad, Bul. Cara Lazara 1, Serbia and Montenegro 1Novi Sad Fair, 21000 Novi Sad, Hajduk Veljkova 11, Serbia and Montenegro Introduction
Tocopherols are the most appreciable minor components of seed oils. Draft standard
for edible sunflower oil, defines the content and composition of tocopherols as the
parameters for identification, giving the range for content 447 to 1.514 ppm (1). The
standard sunflower oil contains about 95% alfa; 3% beta and 2% gama tocopherol,
and delta tocopherol in trace quantities (2). Due to high alfa-tocopherols content,
sunflower oil is the most rich source of natural vitamin E. Seed of sunflower hybrids
produced in Serbia and Montenegro is characterized by especially high tocopherols
content (3), which are preserved in edible oil due to less severy refining conditions,
deodorization in the first place (4). Sunflower oil is very sensitive to oxidation,
followed by significant tocopherol loss, so special attention should be paid to oil
storage conditions.
The aim of the work was to determine the loss of tocopherols in edible refined
sunflower oils during keeping for one year and also to determine the nutritive value.
Materials and methods
Nine samples of refined sunflower oils intended for consuming were used for the
investigations. Classical alkali refining processed eight samples while physical
refining was used for one sample. The samples included oils from all domestic oil
processing factories. Oil samples were kept in the original packagings (1 and 5 l) in
dark, at room temperature, about 22°C. The content of tocopherols was determined
in the initial samples and after 6 e.g. 12 months. Tocopherols were determined with HPLC according to the method: IUPAC 2.432.
The fatty acid composition was determined by GLC according to the AOCS Official
Method CE 1g-96.

316
Results and discussion
The content of total tocopherols in initial, fresh samples, and after 6 and 12 months is
presented in Table 1.
Table 1. Change of total tocopherols content of sunflower oil during 12 months
Keeping time (months) Sample 0 6 12
Toc.* (ppm)
Toc. (ppm)
Loss (%)
Toc. (ppm)
Loss (%)
1a 690 686 0.60 645 6.52 2 688 678 1.45 632 8.14 3 714 675 5.46 663 7.14 4 755 715 5.30 691 8.48 5 721 717 0.55 702 2.64 6 678 650 4.13 619 8.70 7 720 648 10.00 637 11.53 8 697 663 3.91 633 9.18 9 673 634 5.79 589 12.48 a oil obtained by phisical refining *total tocopherol content
The content of total tocopherols in the range 673-775 ppm is in agreement with
literature data. However, during keeping of oil samples a loss of tocopherols was
found. After 6 months, the loss amounted 0.6 – 10%, and after 12 months 2.64 –
12.48%, compared with the initial content.
After 6 months, the composition of tocopherols was determined in 5 samples, and the
results are presented in Table 2. The portion of α-tocopherols is very high, 96-98%,
and this is in agreement and even higher, than the values given in literature (5). De
Greyt and Petrauskaite have found that the portion of α-tocopherols in sunflower oil
samples was below 90% (6).
Table 2. Composition of tocopherols in refined sunflower oil samples
Tocopherols (ppm) Sample α β γ δ Total
Ratio of α-toc. (%)
3 653.98 10.11 1.99 1.90 667.98 97.90 4 676.16 9.44 1.46 0.96 688.03 98.27 5 603.53 10.08 10.23 1.01 624.94 96.57 8 589.88 10.18 10.30 5.73 616.09 95.74 9 638.00 8.03 1.61 2.02 649.65 98.20

317
The ratio of linoleic acid and α-tocopherols is an important factor for the nutritive
value of oil (7). According to literature data, at least 0.79 mg of vitamin E per 1 g of
linoleic acid should be taken daily (8). This ratio is even better in our samples,
namely, the amount of vitamin E per 1 g of linoleic acid is 0.92 to 1.07 mg (Table 3).
So, consuming such oil, the linoleic acid oxidation in the human organism can be
prevented.
Table 3. Content of linoleic acid and α-tocopherols and their ratio
Sample
Linoleic acid (%)
Total toc. (ppm)
α-toc. (ppm)
α-toc./Lin.ac. (mg/g)
3 64.03 668.0 654.0 1.02 4 63.15 688.0 676.2 1.07 5 63.57 624.9 604.0 0.95 8 64.13 616.1 589.9 0.92 9 63.97 649.6 638.0 1.00
The role of sunflowers oil and of other vegetable oils, with optimal content and ratio
of these biologically important compounds in modern nutrition is special.
The fatty acid composition of investigated oils is presented in Table 4. The samples
are not differing very much, all oils are of linoleic type, and the content of the
essential linoleic acid is 63.15 to 66.41%. Trans isomers were not found in any
sample. Small amounts of trans unsaturated fatty acids can be formed during
refining, especially deodorization.
A group of Mexican authors have followed the formation of trans fatty acids in 18
different refined Mexican oils and concluded that the content of trans fatty acids is in
the range 0.9 to 2.93% (9). The demand in the European union is that the trans
isomers content in edible refined oils is below 1%. De Greyt et al. (5) have stated that
2% of linoleic acid can change into trans form during deodorization.
Table 4. Fatty acid composition of sunflower oil samples
S a m p l e Fatty acid 1a 2 3 4 5 6 7 8 9
C16:0 6.88 6.65 6.76 6.78 7.28 6.60 6.63 6.81 6.81 C18:0 4.39 3.92 4.27 4.54 4.44 3.92 4.40 4.53 4.39 C18:1 23.33 21.35 23.14 23.34 23.34 21.22 22.75 22.67 22.60 C18:2 63.32 65.95 64.03 63.15 63.57 66.41 64.13 63.97 64.55

318
Summary The tocopherols content and fatty acid composition of 9 refined sunflowerseed oil samples, obtained in industrial conditions were determined. The oil samples were kept in original, in dark, dry room at temperature up to 22°C. The nutritive value change was followed during one year period e.g. declared shelf-life. The initial samples were investigated as well as after 6 and 12 months. The linoleic acid content of analyzed oils was high, 62 – 65%, whereas even traces of trans fatty acids were not found. The total tocopherols content was 640 to 785 ppm, and the portion of α-tocopherols, vitamin E, was 96 to 98%. Consuming oils of this composition, the organism obtains 0.09 to 1.09 mg of vitamin E per 1 g of linoleic acid, so this polyunsaturated fatty acid can be protected in vivo. The loss of tocopherols during the mentioned period was 2.64 – 13.38%.
Acknowledgment
This work was supported by the Serbian Ministry of Science, Technologies and
Development through the Project: ‘’Cold pressed oleic type sunflower oil with
changed tocopherols composition"- BTN.2.3.1.0402.B
Literature 1. Draft Standard for Edible Refined Sunflower Oil, 15th Session of the Codex
Alimentarius Commission, 1997. 2. Demurin, Ya., Genetickij analiz sastava tokoferolov v semenah podsolnecnika,
Avtoreferat disertacije za KBN: 1-12 1988. 3. Dimić, E., V. Bogdan, N. Keser, Tocopherols and Tocotrienols in Sunflower Seed
(in Serbian) Proceedings of the 41st Oil Industry Conference, pp. 51-55, Miločer, Serbia and Montenegro, 2000.
4. Šmit, K., E. Dimić, V. Bogdan, B. Mojsin, V. Kulić, Quality Change of Sunflower Seed and Oil During Processing with Special Emphasis on Tocopherols (in Serbian), Proceedings of the 42nd Oil Industry Conference, pp. 81-85, Herceg Novi, Serbia and Montenegro, 2001.
5. De Greyt W.F., M. J. Kellens, Effect of Physical Refining on Selected Minor Components in Vegetable Oils, Fett/Lipid 101: 428-432 (1999)
6. De Greyt W.F., V. Petrauskaite, Analysis of Tocopherols by Gas-liquid and High–performance Liquid Chromatography: A comparative study, Fett/Lipid 100: 503-507 (1998).
7. Elmadfa I, E.K. Wagner, Vitamin E und Haltbarkeit von Pflanzenölen, Fett/Lipid, 99: 234-238 (1997)
8. Matijašević, B.O., J.Turkulov,Tehnologija ulja i masti, Tehnološki fakultet, Novi Sad, 1980.
9. Medina-Jauarez L. A., N. Gamez-Meza, Trans Fatty Acid Composition and Tocopherol Content in Vegetable Oils Produced in Mexico, J. Am. Oil Chem. Soc., 77: 721-724 (2000)

319
The influence of storage conditions on the tocopherols content in the refined oils Kuncewicz, A.1, Panfil- Kuncewicz, H. 2
1Chair of Instrumental Analysis, 2Chair of Food Safety University of Warmia and Mazury in Olsztyn, Poland 10 957 Olsztyn, Pl. Cieszyński 1, Poland, e mail: [email protected]
Introduction Edible plant oils are the essential part of human diet because of their fatty acids
composition and the tocopherols content (vit. E). The tocopherols content in the re-
fined plant oils depends on the kind of oil and production and storage conditions (An-
drikopoulos,1989). It is recommended that between the production and consumption
edible oils should be stored in dark and at the temperature below 15oC (PN-92-A-
86932). In practice those conditions are kept neither by retailers nor by households.
Therefore, in the present study we evaluated changes in tocopherols content in the
chosen edible oil stored in different conditions.
Materials and methods Two samples of rapeseed oil, two samples of sunflower oil and two samples of soy-
bean oil from different manufacturers and of different production date were examined.
The samples of fresh oil were divided into three parts and stored in a transparent bot-
tle at 200C in the daylight, in a brown bottle at 200C in the daylight and in a transpar-
ent bottle at 40C in the dark (refrigerator). The tocopherols content in fresh, 2- and 4-
month-stored oils was analysed by HPLC method (Chase et al., 1994).
Preparation of samples for the chromatographic analysis by HPLC.
Approximately 0,8g of oil was accurately weighed and diluted to 10mL in hexane.
Upon mixing, 50µl was injected into the chromatograph. Separation of tocopherols
was carried out with the Hewlett Packard liquid chromatograph HP1050.
HP Lichrosphere Si60 silica column (5µm) l=250mm Ø 4mm was used with a mobile
phase hexane: isopropanol (99,3:0,7) and a flow rate of 1,5mL/min. Fluorescence
detector (λex =295nm, λem =330nm) was used for detection examined compounds.
Qualitative and quantitative interpretation of chromatographic separation of the toco-
pherols was performed by comparing retention time and peak-areas oil samples with
chromatographic separation of quantitative standard solutions of individual toco-
pherols (Merck).

320
Results The applied HPLC method (silicon column and fluorescence detector) allows to ob-
tain good separation of α, β, γ and δ tocopherol without the interfering peaks.
The research proved different content of tocopherols in the analyzed oil samples. The
highest tocopherols content in the fresh oils was observed in the soybean oil (145
and 140 mg/100g), lower in the rapeseed oil (90 and 102 mg/100g) and the lowest in
the sunflower oil (61 and 82 mg/100g)(Tab.1).
Table 1. The tocopherols content in edible oils (mg / 100g oil)
Storage time II months IV months
Kind of oil
Toco- pherol form
The fresh oil samples
Transparent bottle at 40C
Transparent bottle
at 200C
Brown bottle
at 200C
Transparent bottle at 40C
Transparent bottle
at 200C
Brown bottle
at 200C
Rapeseed oil 1
α γ δ
sum
24,52 63,36 2,76 90,64
24,35 56,46 1,58 82,39
16,85 53,30 1,54 71,69
21,15 54,96 1,57 77,68
24,13 54,84 1,48 80,45
12,34 49,46 1,40 63,20
18,74 50,40 1,45 70,59
Rapeseed oil 2
α γ δ
sum
27,23 69,21 5,99
102,43
25,27 67,82 5,58 98,67
18,44 63,61 5,26 87,31
23,14 65,94 5,38 94,46
23,84 65,02 5,48 94,34
14,02 60,42 5,11 79,55
21,10 62,22 5,26 88,58
Sunflower oil 1
α β γ
sum
75,09 4,11 3,48 82,68
72,03 3,85 3,27 79,15
61,52 3,47 2,98 67,97
70,05 3,67 3,10 76,82
69,45 3,66 3,19 76,30
58,61 3,05 2,73 64,39
67,03 3,39 2,94 73,36
Sunflower oil 2
α β γ
sum
57,31 2,79 1,85 61,95
54,16 2,54 1,48 58,18
45,76 2,23 1,24 49,23
51,34 2,39 1,38 55,11
52,89 2,22 1,36 56,47
41,36 1,78 1,02 44,16
50,63 2,16 1,27 54,06
Soybean oil 1
α β γ δ
sum
9,88 2,57 92,24 41,03
145,72
8,08 1,92 88,70 40,61
139,31
6,17 1,78 86,35 38,38
132,68
7,35 1,80 87,56 39,91
136,62
7,37 1,74 87,73 39,05
135,89
4,31 1,55 85,12 37,46
128,44
6,49 1,61 86,40 38,33
132,83
Soybean oil 2
α β γ δ
sum
17,84 3,12 81,60 38,09
140,65
17,50 2,44 77,70 36,41
134,05
15,43 2,11 74,54 35,02
127,10
16,56 2,27 75,79 36,05
130,67
16,69 2,24 76,31 35,91
131,15
13,51 1,44 73,14 34,87
122,96
15,73 1,98 74,87 35,34
127,92
The examined oils were also characterized by the different contents of individual to-
copherols forms. The highest α-tocopherol content was in the sunflower oil (75 and
57 mg/100g), lower in the rapeseed oil (24 and 27 mg/100g) and the lowest in the
soybean oil (10 and 17 mg/100g). β-tocopherol was observed only in the soybean (2
and 3 mg/100g) and sunflower oil (2 and 4 mg/100g). γ−tocopherol content was the

321
highest in the soybean oil (81-92 mg/100g), lower in the rapeseed oil (60-70
mg/100g) and the lowest in the sunflower oil (1-3 mg/100g). δ− tocopherol was
noted only in the rapeseed oil (2-6 gm/100g) and in the soybean oil (40mg/100g).
The storage of the oil samples resulted in the decrease of individual tocopherols con-
tent in examined oils. The highest loss of tocopherols content was observed in oils
stored in transparent bottles in the daylight at temp. 200C. The tocopherols content in
oil samples after 2 months storage amounted in rapeseed oil to 71 and 87mg/100g,
in sunflower oil to 67 and 49mg/100g and in soybean oil to 132 and 127mg/100g.
After 4 months of storage the tocopherols content in all oils decreased further and
amounted in rapeseed oil to 63 and 79mg/100g, in sunflower oil to 64 and
44mg/100g and in soybean oil to 128 and 122mg/100g.
Lower loss of tocopherols content was observed in oil samples stored in brown bot-
tles. The tocopherols content in rapeseed oil samples stored in brown bottles in the
daylight at 200C after 2 months of storage amounted to 77 and 94mg/100g, in sun-
flower oil samples- to 76 and 55mg/100g and in soybean oil samples 136 and
131mg/100g. After 4 months of storage the tocopherols content decreased to: in
rapeseed oil-70 and 88mg/100g, in sunflower oil-73 and 54mg/100g and in soybean
oil-132 and 127mg/100g. The stored oils contained 10-20% lower levels of toco-
pherols than fresh oils. The lowest losses in tocopherols content were observed in oil
samples stored in the dark at 40C. In rapeseed oil samples after 2 months storage
the tocopherols content amounted to 82 and 98mg/100g, in sunflower oil samples to
79 and 58mg/100g and in soybean oil samples 139 and 134mg/100g oil. After 4
months storage the tocopherols content in rapeseed oil samples was 80 and
94mg/100g, in sunflower oil samples 56mg/100g and in soybean oil samples 135 and
131mg/100g. In oils stored this way losses in tocopherols content after 2 months
amounted to 4-10% of their initial level and after 4 months- 7-12%.
The study shows that storage conditions of edible oils significantly influenced the
level of losses in tocopherols content. The most insignificant losses were observed in
oil samples stored in the dark at 40C. After 2 months storage tocopherols content de-
creased on average by 6% and after 4 months by 9% of their initial level. The highest
losses in tocopherols content were in oil samples stored in transparent bottles in the
daylight. After 2 months storage they amounted, on average, to16% and after 4
months to 22% of their initial level.

322
Keeping oil samples in brown bottles, limiting influence of daylight, resulted average
in 10 and 13% decrease of the tocopherols content in comparison with their initial
levels.
Determination of tocopherols content can be useful in the evaluation of edible oils.
Summary The objective of this study was to evaluate the influence of storage conditions on the
tocopherols content (vit. E) in edible oils. The samples of rapeseed, sunflower and
soybean oil were stored in transparent and brown bottles, in the daylight and in the
dark and at 40C and 200C for 2 and 4 months. The tocopherols content was deter-
mined by HPLC. The research showed that the lowest losses in tocopherols content
appeared in oil samples stored in the dark at 40C (6-9%) and the highest in samples
stored in transparent bottles in the daylight (16-22%).
Literature Andrikopoulos N.K.(1989) J.Sci.Food Agric.,46,503-509
Chase G.W. Jr.,Akoh C.C.,Eitenmiller R.R.(1994) JAOCS,71,877-880
PN 92-A-86932 Tłuszcze roślinne jadalne. Pakowanie, przechowywanie, transport.

323
Tocopherol and β-carotene content in vegetable oils on the Polish market Kuncewicz, A., Żegarska, Z., Rafałowski, R. Chair of Instrumental Analysis University of Warmia and Mazury in Olsztyn, Poland 10-957 Olsztyn, Pl. Cieszyński 1, Poland, e-mail: [email protected] Introduction Dietary fat is an essential nutrient for growth, development and health status of hu-mans. Vegetable oils are very important dietary fats. They are a source of polyenoic fatty acids and natural antioxidants: vitamin E and β-carotene. Vitamin E is known as a powerful antioxidant, which prevent autoxidation of unsaturated lipids. β-carotene has the potential to act as a chain breaking antioxidant in a lipid environ-ment at physiological O2 partial pressures. Vitamin E is effective at high oxygen pres-sures [Burton 1988]. There are four different tocopherols that possess vitamin E activity and all or some of these are present in vegetables oils [Shahidi 2000]. The level of nontriacylglycerol constituents in the market edible oils is influenced by envi-ronment factors, post harvest storage conditions of the seeds, technological proc-esses and storage conditions of the oils [Andrikopoulos 1989]. In this study the tocopherol and β-carotene levels were measured in refined and cold pressed commercial oils. Material and methods Materials The study comprised different kind of oils purchased from the local retail stores. The following refined oils were analysed: soybean oil (2 samples), rapeseed oil (8 samples), sunflower oil (3 samples), arachide oil (2 samples), corn oil (1 samples). Also 11 samples of different cold pressed oils were studied. The oils were produced by different producers. Methods The β-carotene and tocopherols were extracted with hexane and separated by HPLC method. Fatty acid composition of oils was determined by GLC method. Sample preparation for HPLC. About 1g of oil was weighed into measuring flask with the 0,0001 g accuracy. The contents of flask was completed with hexane, mixed until the oil was dissolved, left for 12 h in dark, and then centrifuged at 500 g in a labora-tory centrifuge. HPLC separation. HPLC analysis was performed using a Hewlett Packard HP 1050 liquid chromatograph with a spectrometric detector UV-VIS model HP1050 combined with a fluorescence detector model HP 1046A. Column: 250mm x 4 mm with Lichro-spher Si 60 (5µm). Mobile phase: hexane/2-propanol 99,3:0,7, flow:1ml/min. Detec-tion: β-carotene –UV-VIS detector, λ= 450nm, tocopherols – fluorescence detector,

324
λex = 295nm, λ = 330nm. The peaks were identified by comparing the retention times for the samples of oil and standard solution of known concentration of β-carotene and four tocopherols. The content of the examined compounds expressed in mg/100 g oil was computed by comparing the area of peaks after chromatographic separa-tion of reference and examined samples. All samples were analysed in duplicate. Results The data presented in Tab. 1 and 2 indicate that β-carotene was found only in some cold pressed oils. The highest β-carotene content was in the pumpkin seed and the linseed oils (about 15mg/100g) (Tab.2). Table1. The tocopherol content (mg/100g) of refined oils
Tocopherol Sample of oil α β γ δ
Sum of tocopherols (∑ T)
Σ Τ/ΣPEFA*
1 27,90 86,15 - - 114,05 2,2 Soybean 2 28,23 3,81 103,56 43,42 179,02 3,5 1 33,60 - 61,78 - 95,38 3,8 2 28,15 - 52,05 - 80,20 2,9 3 36,20 - 60,14 - 96,34 3,8 4 35,63 - 34,75 - 70,38 2,7 5 28,04 - 47,31 - 75,35 2,8 6 32,32 - 61,18 - 93,50 3,7 7 30,81 - 56,83 - 87,64 3,6
Rapeseed
8 29,62 - 63,49 - 93,11 3,7 1 62,02 3,77 3,67 - 69,46 1,2 2 74,80 - 6,81 - 81,61 1,5
Sunflower
3 64,09 - - - 64,09 1,2 Corn 1 26,15 - 98,46 - 124,61 2,5
1 16,33 - 23,32 - 39,65 2,1 Arachide 2 1,43 - 23,61 - 25,04 1,2 1 47,58 2,74 12,46 - 62,78 7,0 Olive 2 29,29 - - - 29,29 2,6
*The ratio of sum of tocopherols to polyenoic fatty acid content Both refined and cold pressed oils showed wide variation in the tocopherols content. All examined oils with exception linseed oil and coconut fat contained α-tocopherol (Tab. 2).

325
Table 2. The β-carotene and tocopherol contents (mg/100g) of cold pressed oils Tocopherol
Sample of oil β-carotene α β γ δ Sum of to-copherols (∑ Τ)
Σ Τ/Σ PEFA*
Soybean 2,73 24,16 67,70 102,37 10,95 205,18 3,7 Rapeseed 8,09 1,59 - 62,57 2,69 66,85 2,7 Sunflower - 60,68 - - - 60,68 0,9 Corn 3,56 27,22 - 203,93 19,78 250,93 4,6 Arachide 0,37 21,30 65,34 21,03 - 107,67 2,9 Olive 2,61 20,78 - 4,01 - 24,79 4,1 Grapeseed - 19,32 - - - 19,32 0,3 Pumpkin seed 15,01 10,37 99,14 10,89 - 120,40 3,1 Sesame - 207,22 - 448,48 - 655,70 15,4 Linseed 15,01 - - - 66,32 66,32 1,0 Coconut - - - 34,52 - 34,52 22,6 *The ratio of sum of tocopherols to polyenoic fatty acid content Sesame oil was characterised by the highest α-tocopherol content. Most of exam-ined oils contained also γ-tocopherol. β-tocopherol and δ-tocopherol were observed only in some of oils. The highest β-tocopherol level was in the pampkin seed oil (about 99mg/100g) and δ-tocopherol level in the linseed oil (about 66mg/100g). The high content of sum of tocopherols was found in all samples of soybeen oils and corn oils. The highest content of the sum of tocopherols was in the sesame oil. The ratio of the sum of tocopherols (mg/100g) to the polyenoic fatty acid con-tent (wt%) was the lowest in the grapeseed oil – 0,3 (Tab.2). The coconut fat, the sesame oil and one sample of the olive oil were characterised by high ratio of the sum of tocopherols to polyenoic fatty acid content, respectively 22,6, 15,35 and 7,0. Summary The aim of these investigations was to evaluate the level of tocopherols and β-carotene in refined and cold pressed market oils. The examined compounds were determined by the HPLC method. The study showed that only the cold pressed oils contained β-carotene. The proportion of the individual tocopherols and the total amounts of tocopherols in the oils varied much between different kinds of the oils. The same kind of refined oil from different producers also showed variations in the tocopherol contents. Literature Andrikopoulos, N.K. (1989): J. Sci. Food Agric.,46, 503-509. Burton, G.W.(1989): J.Nutr.,119,109-111. Shahidi, F.(2000): Nahrung 3, 158-163.

326
Protective effect of vitamin E and selenium after suckling period of lambs fed with toxic amounts of copper and excess of sulphur (polluted regions) Angelow, L., Petrova, I., Ilchev, A.
Institute of Animal Science, 2232-Kostinbrid, Bulgaria Tracian University, 5600-Stara Zagora, Bulgaria Introduction Vitamin E and trace element selenium belong to the anti-oxidative system and
protect the animal organism against oxidative stress, muscle dystrophy, hepatic
disease and necrosis. Much work in the last several years dealt with the secondary
selenium deficiency due to the fact of imbalanced ecological equilibrium in some
polluted regions in the world (Bertram 1992; Bliefert 1997; Minson 1990). The
industry provided a large number of Se antagonists (S, Cu) which have a negative
influence on its utilization by ruminants. The chemical similarity between Se and S
leads to interactions in the intestinal tract and higher renal excretion of Se. The
supplementation of sulphur (S) to the sheep ration increases the percentage of
newborn lambs with degenerative changes in the heart muscle (Angelow 1994;
Ilchev and Angelow 2003). In the most cases the appearance of hepatic disease due
to the toxic amounts of Cu depends not only on doses and age, but on the animal
species as well. The most sensitive domestic animals against Cu excess are sheep.
The Cu requirement for lambs ranges from 8-10 mgCu/kg forage. Some sheep breed
in Bulgaria reacted even at doses of 12 mg Cu/kg (Petrova 1998; Odjakova 2000).
The aim of the study was to determine the protective effect of Se and vit. E
supplementation on growing lambs, an optimizing the necessary trace element offer
in the diet enriched with copper and sulphur, and restoration the normal status of
animal organism.
Material and methods The investigation was carried out with 36 lambs of Thracian cross breed (initial body
weight 14.5 kg) divided in 3 groups of 12 animals each. The full mixture contained
3.2 g S/kg DM, 25 mg Cu/kg, 40 mg Zn and 0.078 mg Se/kg. The 1st group did not
received any Se (Se-deficiency), the 2nd group was supplemented with 0.15 mg
Se/kg DM and the 3rd group received 0.15 mg Se + 25 mg vit.E /kg DM additionally.
The blood samples were taken at the 1st, 60th and 103rd day and those from internal
organs at the 1st and 103rd day of experiment. Copper and zinc content were
determined by use of AAS. Selenium was analyzed by hydride system.

327
Results and discussion Feed consumption was controlled daily and recalculated each 30 days. Addition of
Se and Se+vit. E to the feed of the 2nd and the 3rd group had a positive effect on the
average daily gain of lambs only up to the 30th day of experiment (Fig. 1)
Figure 1: Cumulative average daily gain of lambs during the experiment (g/day)
6 06 8
1 1 3
8 39 4
1 1 5
8 8
1 0 7 1 0 38 7
0
2 5
5 0
7 5
1 0 0
1 2 5
g / d a y
1 3 0 6 0 1 0 3
S e - d e f i c i e n c y 0 . 1 5 m g S e / k g 0 . 1 5 m g S e + 2 5 m g V i t . E / k g
The high Cu content in the forage led generally to growth depression. The above
results demonstrated that the high levels of copper reduced the animal growth in all
groups, despite of selenium and vitamin E content in the ration. Under normal
condition the average daily gain of Thracian lambs is 50-70% higher (150-200 g/day),
of estimated results. However the addition of vitamin E and its combination with Se
play an important role for the health and longevity of lambs. First visible symptoms of
Cu poisoning were observed between the 50th and the 60th days only in the deficient
group. The toxic amount of Cu caused death of 58% in the unsupplemented lambs.
The addition of 0.15 mg Se/kg reduced the mortality to 16.7%. The protection of
animal organism with 0.25 mg vit. E/kg + 0.15 mg Se/kg decreased high significantly
the mortality to 8.3% (Tab. 1).
Table 1: Mortality rate of deficient and supplemented lambs during the experiment groups number of lambs death %
1. (- Se - vit. E) 12 7 58.3 2. (+0.15 mg Se - vit. E) 12 2 16.7 3. (+0.15mg Se + vit. E) 12 1 8.3
Selenium status > The analyses of Se in blood serum and different internal organs
showed an extremely low Se status at the beginning of experiment, that indicated the
extent of imbalanced nutrition during the suckling period (Tab. 2)
Table 2: Selenium content in blood serum* and internal organs of lambs (µg/kg DM) organ 1st day normal status
* blood serum (µg/l) 35 70 - 100 muscle 65 250 - 350 heart 200 700 - 1200 liver 222 1000 - 1500
kidney 650 3000 - 5000
The concentration of Se in blood serum showed dynamic changes after
supplementation and the rate of restoration to the normal level (Table 3).

328
Table 3: Selenium content in blood serum of growing lambs (µg/l) group 1st day 60th day 103rd day
1. (-Se - vit. E) 15.1 ± 3.6 18.9 ± 2.4 2. (+0.15 mg Se - vit. E) 35.2 ± 2.6 48.7 ± 18.5 77.7 ± 4.6 3. (+0.15 mg Se + vit. E) 79.3 ± 16.4 94.9 ± 9.7
As critical value for the Se in blood serum can be taken concentrations < 50 µg Se/l.
Only the Se+vit. E group reached values considered as normal at the 60th day.
Some indicative organs had to be included in the analyses in order to estimate the
effect of necessary supply. After testing all organs (muscle, heart, liver, kidney the
heart and muscle turned to be the most appropriate for assessment of Se-status. The
organs of animals slaughtered at the beginning contained only 20-30% of the Se
level (muscle - 65µg/kg DM; heart - 200 µg/kg DM) in comparison to the normal
value. The low Se status was a result of their intrauterine depletion (Tab. 4).
Table 4: Selenium in the muscle and heart of growing lambs (103rd day) group muscle heart
1. (-Se - vit. E) 145 ± 19 254 ± 60 2. (+0.15 mg Se - vit. E) 261 ± 9 933 ± 58 3. (+0.15 mg Se + vit. E) 235 ± 25 614 ± 80
Reference value > 250 µg/kg DM > 700 µg/kg DM
Se/vit. E supplementation in the course of 103 days led to significant increasing of
the Se content in internal organs (p< 0.001). Estimated levels indicated that the used
amounts were sufficient for complete restoration of the Se status.
Copper status > Liver is the best indicator for Cu poisoning. The high level of Cu in
the feed combined with Se deficiency increased significantly the Cu accumulation in
the liver and kidney in comparison to the 2nd and 3rd group. Exceeding of critical
concentration in the liver (500 mg Cu/kg DM) is the reason for appearance of
haemolytic crisis. Vitamin E and Se prevented the total accumulation of Cu in the
liver by 47% and sustained the homeostatic control in this organ (Tab.5).
Initial status (1 day of experiment): liver - 180 mg/kg DM kidney - 16 mg/kg DM Table 5: Copper in the liver and kidney of lambs at the end of experiment (103rd day)
group kidney liver 1. (-Se - vit. E) 24.0 ± 6.0 562 ± 52 2. (+0.15 mg Se - vit. E) 20.0 ± 4.0 478 ± 67 3. (+0.15 mg Se + vit. E) 16.8 ± 4.5 298 ± 28
Reference value < 20 mg/kg DM 200-350 mg/kg DM The same results were found in kidney (reduction by 30%). The toxic amounts of Cu
can affect not only accumulation and distribution of Se in the organism, but also the
transfer and accumulation of zinc in some indicative organs and ribs.

329
Zinc status > The content of zinc in the liver changed with the age of the animals.
The copper had a negative influence of the Zn status. These changes were well
pronounced with the Se deficient lambs. The Zn content in the Se-deficient group
was about 50% of that, measured at the beginning of experiment (Tab. 6).
Initial status (1st day of experiment): ribs - 85 mg/kg DM liver - 340 mg/kg DM Table 6: Zinc in the ribs and liver of lambs at the end of experiment (103rd day)
group kidney liver 1. (-Se - vit. E) 45 ± 6 173 ± 16 2. (+0.15 mg Se - vit. E) 66 ± 11 246 ± 17 3. (+0.15 mg Se + vit. E) 88 ± 12 275 ± 22
Reference value > 50 mg/kg DM > 150 mg/kg DM The changes of Zn levels in 2nd and 3rd groups were insignificant. The Zn status was
sustained in the case of secondary Zn deficiency by mobilisation of Zn from main
pool (ribs). The Zn status of lambs fed without Se was below the critical value, which
was considerably lower than the optimum quantity for this animal species (90 mg
Zn/kg DM). The above results demonstrated that the high level of Cu had an adverse
effect on the Zn status.
Summary The protective effect of selenium and its combination with vitamin E on the growth,
mortality and trace element status of lambs has been investigated. Increased
concentrations of Cu and S in the diet had a negative effect on the average daily gain
of lambs and led to high mortality in the unsupplemented group. The addition of Se
and Se+vit. E had a positive effect on the normalisation of mineral status and
decreased significantly the accumulation of Cu in internal organs (liver, kidney). The
high level of Cu in the ration influenced negatively the Zn utilization in the liver and
ribs. Elimination of the native Cu excess in forages demands an additional correction
of the Zn, Se and vit. E offer to the growing lambs.
References Angelow L. (1994): Die Auswertung der Belastung eines Lebensraumes mit
Schwefel, Molybdän, Arsen und Kupfer auf die Nahrungskette von Tier und Mensch. Forschungsbericht, Bonn, 1-33
Bertram H. P. (1992): Spurenelemente. Urban&Schwarzenberg Verlag, 83-85 Bliefert, C. (1997): Umweltschemie. WILEY-VCH Verlagsgesellschaft, 166-175 Ilchev A., Angelow L. (2003): Influence of sulphur on selenium status and
incidence of white muscle disease. J. Ecology & Future (in Press) Minson P. J. (1990): Forage in Ruminant Nutrition. Academic Press Inc. Odjakova Ts. (2000): Trace element offer in nutrition of sheep. Thesis, Acad. Press Petrova I. (1998): Selenium and antagonistic changes, Thesis, Acad. Press

330
Changes in contents of carotenoids and vitamin E as well as in lipophilic antioxi-dant activity in tomato products depending on processing effects. Seybold, C.1, Fröhlich, K.1, Bitsch, R.1, Otto, K.2, Böhm, V.1 1 Institute of Nutrition, Friedrich-Schiller-Universität Jena, Dornburger Str. 25-29, 07743
Jena, Germany 2 Institute of Beverage Technology, University of Applied Sciences Lippe & Höxter,
Liebigstr. 87, 32657 Lemgo, Germany Introduction Intake of tomatoes and tomato-based products has shown epidemiologic evidence in pre-
venting some kinds of cancer in humans. This beneficial effect has been ascribed to the
presence and the synergy of antioxidant constituents of tomato fruit. The most prominent one
of them is lycopene, which represents the dominant carotenoid of tomatoes and gives them
their red colour.
Aim of the presented study was to investigate the effect of processing on contents of lyco-
pene, β-carotene and vitamin E as well as on lipophilic antioxidant activity in common tomato
products.
Materials and methods Fresh tomatoes were washed and cut into slices. A part of them was used for preparing
tomato sauce, tomato soup and baked tomato slices. No spices were added. Samples were
taken at different times during heating. Tomato juice was produced from canned tomatoes at
the Institute of Beverage Technology, University of Applied Sciences Lippe & Höxter, Lemgo,
Germany. Samples were taken after extraction, homogenization, sterilization, filling and
pasteurization.
Contents of carotenoids were evaluated by using C30-HPLC with diode array detection [1]
after three times of extraction with methanol/tetrahydrofurane (1+1, v/v). Contents of vitamin
E were measured by Diol-HPLC with fluorescence detection [2]. Lipophilic antioxidant activity
was analyzed by using the Trolox equivalent antioxidant capacity (TEAC) assay [3, 4].
Results Carotenoids
(all-E)-Lycopene was the most abundant carotenoid in each of the various tomato samples.
Two or three isomers of lycopene were detected, but could not be identified. According to
their retention times they were called lyc (39 min) and lyc (45 min), the latter presumably
representing two isomers which could not always be separated from each other. Besides,
(E)-β-carotene, (9Z)-β-carotene and (13Z)-β-carotene were found in the samples. Continuous thermal treatment led to significant changes in contents of carotenoids. During
preparation of baked tomato slices in the oven (220°C, 45 min), the contents of (E)-lycopene
and of (E)-β-carotene increased by about 28 % on wet weight basis and decreased by about

331
30 % on dry weight basis, respectively. Cooking of tomato sauce for 210 min showed (E)-
lycopene to be more stable than (E)-β-carotene (on dry weight basis). Content of (E)-lyco-
pene after 210 min amounted to 92 % of the content of fresh tomatoes, whereas content of
(E)-β-carotene amounted to 49 % (Fig. 1). Likewise, during production of tomato juice, (E)-
lycopene was more stable and less isomerized. After the last step of production, the relative
content of (E)-lycopene was 91 % of total lycopene in contrast to 94 % after the first step
investigated. The relative content of (E)-β-carotene was 84 % of total β-carotene in contrast
to 100 % after the first step investigated.
Figure 1. Contents of (E)-lycopene (A) and (E)-β-carotene (B) during preparation of tomato sauce. Bars showing the same index are not significantly different (p > 0,05).
Vitamin E
Vitamin E in tomatoes is predominantly represented by DL-α-tocopherol. Homogenization
and sterilization of tomatoes during production of tomato juice resulted in significant losses of
contents of DL-α-tocopherol on wet as well as on dry weight basis. In samples of tomato
sauce, tomato soup and baked tomato slices, contents of DL-α-tocopherol significantly
a, ca, caa, c
a
c
b
a, ca
020406080
100120140160
0 5 30 60 90 120 150 180 210
time [min]
cont
ent o
f (E)
-lyco
pene
[m
g/10
0g d
ry w
eigh
t]
A
aa a
b, cc c, d
b, d b b, d
0
2
4
6
8
10
0 5 30 60 90 120 150 180 210
time [min]
cont
ent o
f (E)
-ß-c
arot
ene
[mg/
100g
dry
wei
ght]
B
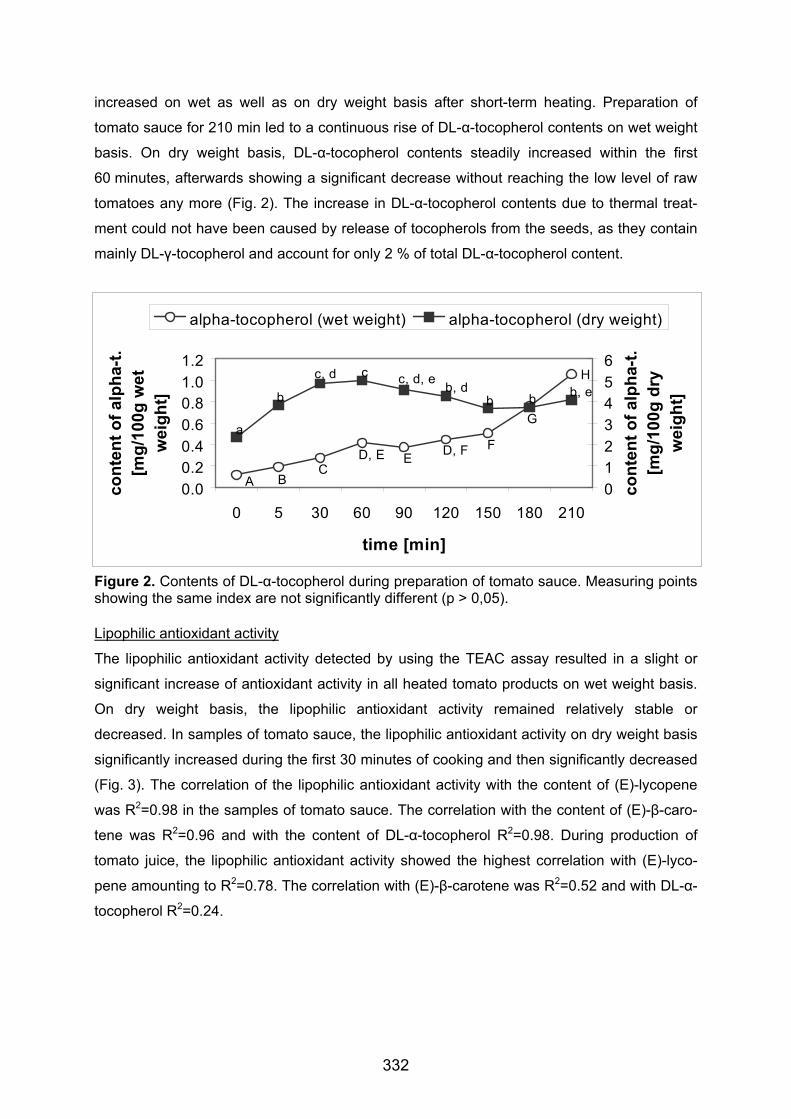
332
increased on wet as well as on dry weight basis after short-term heating. Preparation of
tomato sauce for 210 min led to a continuous rise of DL-α-tocopherol contents on wet weight
basis. On dry weight basis, DL-α-tocopherol contents steadily increased within the first
60 minutes, afterwards showing a significant decrease without reaching the low level of raw
tomatoes any more (Fig. 2). The increase in DL-α-tocopherol contents due to thermal treat-
ment could not have been caused by release of tocopherols from the seeds, as they contain
mainly DL-γ-tocopherol and account for only 2 % of total DL-α-tocopherol content.
Figure 2. Contents of DL-α-tocopherol during preparation of tomato sauce. Measuring points showing the same index are not significantly different (p > 0,05).
Lipophilic antioxidant activity
The lipophilic antioxidant activity detected by using the TEAC assay resulted in a slight or
significant increase of antioxidant activity in all heated tomato products on wet weight basis.
On dry weight basis, the lipophilic antioxidant activity remained relatively stable or
decreased. In samples of tomato sauce, the lipophilic antioxidant activity on dry weight basis
significantly increased during the first 30 minutes of cooking and then significantly decreased
(Fig. 3). The correlation of the lipophilic antioxidant activity with the content of (E)-lycopene
was R2=0.98 in the samples of tomato sauce. The correlation with the content of (E)-β-caro-
tene was R2=0.96 and with the content of DL-α-tocopherol R2=0.98. During production of
tomato juice, the lipophilic antioxidant activity showed the highest correlation with (E)-lyco-
pene amounting to R2=0.78. The correlation with (E)-β-carotene was R2=0.52 and with DL-α-
tocopherol R2=0.24.
G
A BC
D, E E D, F F
H
a
b
c, d c c, d, e b, db
b, eb
0.00.20.40.60.81.01.2
0 5 30 60 90 120 150 180 210
time [min]
cont
ent o
f alp
ha-t.
[m
g/10
0g w
et
wei
ght]
0123456
cont
ent o
f alp
ha-t.
[m
g/10
0g d
ry
wei
ght]
alpha-tocopherol (wet weight) alpha-tocopherol (dry weight)

333
Figure 3. Lipophilic antioxidant activity during preparation of tomato sauce. Bars showing the same index are not significantly different (p > 0,05).
Conclusions Processing of food is often thought to cause losses of micronutrients. Nevertheless, due to
the evaporation of water during cooking, heated tomato products still contained high amounts
of lipophilic antioxidants. This is one reason to recommend the intake of these products.
Considering the dry weight basis of shortly heated tomato products, contents of DL-α-
tocopherol still were significantly higher than in fresh tomatoes. For a better understanding of
possible causes of this effect, further studies are necessary investigating interactions of
tocopherols with other components of tomato fruit and their behaviour during heating.
Summary The effect of processing on contents of carotenoids and vitamin E as well as on lipophilic
antioxidant activity in tomato products was investigated. On fresh weight basis, thermal
treatment of raw tomatoes in most samples resulted in an increase of contents of (E)-lyco-
pene, (E)-β-carotene and DL-α-tocopherol as well as of lipophilic antioxidant activity due to
the loss of water. On dry weight basis, contents of (E)-lycopene and (E)-β-carotene
decreased, while the losses of (E)-β-carotene were significantly higher. Lipophilic antioxidant
activity also decreased or was relatively stable, being highly correlated with contents of (E)-
lycopene and vitamin E. Contents of DL-α-tocopherol significantly increased due to heating
on wet as well as on dry weight basis and on dry weight basis only decreased after long-term
cooking. In samples of tomato juice, also contents of vitamin E significantly decreased due to
processing.
References [1] Böhm V (2001). J Sep Sci 24, 955-959 [2] Balz M, Schulte E, Thier HP (1992). Fat Sci Technol 94, 209-213 [3] Miller NJ, Sampson J, Candeias LP, Bramley PM, Rice-Evans CA (1996). FEBS Letters,
384, 240-242 [4] Böhm V, Puspitasari-Nienaber NL, Ferruzzi MG, Schwartz SJ (2002). J Agric Food
Chem, 50, 221-226
ca, b
bb
a, c c a, c ca, c
0.00.10.20.30.40.50.60.7
0 5 30 60 90 120 150 180 210
time [min]
TEA
C [m
mol
/100
g dr
y w
eigh
t]

334
Effect of vitamin E and Selenium Dietary Supplementation on hepatocyte apoptosis in acute liver damage Shen xiuhua Cheng wufeng Xie liangmin Sunjianqin Lifeng Malin Department of Nutrition ,Shanghai Second Medical University, 200025, Shanghai, China
Effects of dietary supplementation of vitamin E and selenium on apoptosis of dege-
narated hepatocytes were investigated in the rat model of acute liver damage induced
by intraperitoneal injection with CCL4. Hepatocyte apoptosis was determined by the
terminal deoxynucleotidyl transferase UTP nick end labeling (TUNEL) technique.The
results had shown that apoptotic hepatocyte in both pathological group and inter-
vention group was less than in normal control group,meanwhile, apoptotic hepato-
cytes in intervention group was more than in pathological group at the same time point.
Conclusion: Dietary supplement of proper vitamin E and selenium can promote the
apoptosis of degenarate hepatocyte in acute liver damage.

335
Comparison of lipophilic antioxidant activity of isolated lycopene isomers Fröhlich, K. , Kaufmann, K., Bitsch, R. , Böhm, V. Institute of Nutrition, Friedrich-Schiller-University Jena, Dornburger Str. 25-29, 07743 Jena, Germany Introduction
Fat-soluble lycopene (C40H56), the mostly unsaturated acyclic carotenoid with eleven linearly
arranged conjugated double bonds is synthesized by plants and microorganisms. Lycopene is
one of the major carotenoids in Western diets and is found almost exclusively in tomatoes and
tomato products1. Epidemiological studies implicate lycopene in the prevention of cardiovas-
cular diseases and cancer. In tomatoes and tomato products (all-E)-lycopene is dominant with
90-98%. In contrast, up to 58-73% (Z)-isomers of lycopene have been analysed in human
plasma2.
In the presented investigations an intercomparison of the lipophilic antioxidant activity of (all-
E)-lycopene and five lycopene (Z)-isomers using two different methods is demonstrated.
Materials and Methods
A saturated solution of lycopene in cyclohexan/toluene (4+1, v/v) was photo-isomerized
according to the method of Zechmeister3 using iodine and UV light. The resulting mixture of
isomers was stored at –20°C for 3-5 days, after removal of the solvent under a stream of
nitrogen, until fractionation and analysis. Afterwards, the isomers were fractionated on a
semipreparative C30-HPLC column. Mixtures of methanol and methyl tert-butyl ether
(55+45, v/v) were used as mobile phases. Purity of the six separated isomers was checked by
using an analytical C30-HPLC-DAD. In vitro antioxidant activity of all isomers collected was
measured by using two different tests: the lipophilic Trolox equivalent antioxidant capacity
(TEAC) assay6 and the Photochemoluminescence (PCL) assay (ACL-kit).
Results
Figure 1 shows the HPLC chromatogram of the photo-isomerized mixture of lycopene iso-
mers. First (<17 min) oxidative metabolites were eluted followed by the isomers of lycopene.
The relative portion of the oxidative metabolites (10,7–37,2 %) increased dependent on varia-
tion in time of storage of the isomers mixture, but the isomers ratio was approximately unal-
tered: (all-E)-lycopene : (15Z)-lycopene : Σ (Z)-lycopene No. 1-3 : (5Z)-lycopene = 1 : 0,8 :
1,2 : 1,4.

336
Five (Z)-isomers (peaks 1-4 and 6) and the (all-E)-lycopene (peak 5) were isolated by using
semipreparative C30-HPLC. Due to the low stability of the isolated isomers of lycopene all
analytical steps must be accomplished without delay under subdued light. For the measure-
ment of the antioxidant capacities only isomer fractions with a purity of >80% were used.
Figure 1: HPLC chromatogram of the photo-isomerized lycopene. Chromatographic conditions: YMC C30 (300 x 10.0 mm, 5 µm), 4.0 mL/min methanol/methyl tert-butyl ether (55+45 v/v), detection UV 450 nm, 1 = (15Z)-lycopene, 2 = lycopene (Z)-isomer No. 1, 3 = lycopene (Z)-isomer No. 2, 4 = lycopene (Z)-isomer No. 3, 5 = (all-E)-lycopene, 6 = (5Z)-lycopene The antioxidant capacity of (all-E)-lycopene and the five prominent (Z)-isomers were deter-
mined by using two different tests. Figure 2 shows the TEAC- and PCL-results of the six iso-
lated isomers of lycopene.
The TEAC assay demonstrated that (15Z)-lycopene (peak 1) and the three (Z)-isomers of
lycopene No. 1-3 (peak 2-4), which are not yet accurately characterized, had a significantly
higher activity (p<0.05) as the (all-E)-lycopene. The TEAC-value capacity of lycopene (Z)-
isomer No. 1 and (15Z)-lycopene was 1.5 times higher and the antioxidant capacity of lyco-
pene (Z)-isomer No. 2 and 3 exceeded that of (all-E)-lycopene by 1.3 times. (5Z)-lycopene,
eluting shortly after (all-E)-lycopene (peak 6), showed the same efficacy as the (all-E)-lyco-
pene (p>0.05).
TEAC values of lycopene isomers investigated ranged as follows: lycopene (Z)-isomer No. 1
= (15Z)-lycopene > lycopene (Z)-isomer No. 2 = lycopene (Z)-isomer No. 3 > (5Z)-lyocpene
= (all-E)-lycopene. Investigations of Böhm et al.4 characterized similar relations.
0 10 20 30 40 50 60 min

337
The values of the PCL assay were on a lower level compared to the TEAC values. Geometri-
cal isomers of lycopene showed TEAC values over a range of 3,8-5,9 mmol/L and PCL val-
ues over a range on 0,2-2,9 mmol/L. The calculated antioxidant capacity of the isomers No. 1
and 2 was two times higher in the TEAC assay than in the PLC assay, for the (15Z)-isomers
actually ten times higher. The different results may be accountable for the diverse principles
of measurement of both tests. The PCL values showed a similar trend compared to the TEAC
values, but they were not satisfactory reproducible, perhaps due to technical problems (e.g.
fast heating of the measurement device resulting in decreasing signals) with the photochem®.
C
BB
C
AA
DD
D
E
E
D, E
0.00
2.00
4.00
6.00
8.00
(all-E)-lycopene (5Z) lycopene lycopene (Z)-isomer No. 1
lycopene (Z)-isomer No. 2
lycopene (Z)-isomer No. 3
(15Z) lycopene
antio
xida
nt c
apac
ity [m
mol
/l]
.
TEAC PCL
Figure 2: Trolox equivalent antioxidant capacities (TEAC) and Photochemolumineszence (PCL) capacities of five (Z)-isomers compared to (all-E)-lycopene. Bars showing the same index are not significantly different (p>0.05).
Conclusions
This study showed the in vitro antioxidant activity of five lycopene (Z)-isomers compared to
(all-E)-lycopene. (5Z)-lycopene, which is found in high contents in human plasma, had the
same capacity as (all-E)-lycopene. In contrast, the (15Z)-lycopene as well as the three
unknown (Z)-isomers showed a significantly higher antioxidant capacity. These results are
important because, in contrast to tomatoes and tomato based foods with 90-98% (all-E)-lyco-
pene5, serum lycopene consists of 58-73% of lycopene in (Z)-conformation2.

338
References
1 Bramley, P.M. (2000) Phytochem. 54, 233-236 2 Clinton, S.K.; Emenhiser, C.; Schwartz, S.J.; Bostwick, D.G.; Williams, A.W.; Moore,
B.J.; Erdman, J.W. (1996) Cancer Epidemiol. Biomar. Prev. 5, 823-833 3 Zechmeister, L. (1947) Chem. Rev. 34, 267-344 4 Böhm, V.; Puspitasari-Ninaber, N.L.; Feruzzi, M.G.; Schwartz, S.J. (2002) J. Agric. Food
Chem. 50, 221-226 5 Nguyen, M.L., Schwartz, S.J. (1998) Proc. Soc. Exp. Biol. Med. 218, 101-105 6 Miller, N.J.; Sampson, J.; Candeias, L.P.; Bramley, P.M.; Rice-Evans, C.A. (1996) FEBS
Lett. 384, 240-242

339
Zinc and other antioxidants in Polish students’ diet vs. the zinc content in their blood Przysławski, J.1, Schlegel-Zawadzka, M.2, Walkowiak, J.3, Bolesławska, I.1
1Department of Bromatology and Human Nutrition, Medical Academy, 42 Marcelinska Str., 60-354 Poznan; 2Department of Human Nutrition, Jagiellonian University, 20 Grzegorzecka Str., 31-531 Krakow; 3Institute of Pediatrics, Children’s Gastroenterology Clinic, Medical Academy, 27/33 Szpitalna Str., 60-572 Poznan; Poland Introduction Diet has been known for many years to play a key role as a risk factor for chronic
diseases. Furthermore, rapid changes in diets and lifestyles that have occurred with
industrialization, urbanization, economic development and market globalization have
accelerated over the past decade. This has a significant impact on the health and
nutritional status of populations, particularly in developing countries and in countries
in transition (WHO 2003).
The last few years have seen an explosion of information about the role of oxidative
stress in causing, and the potential therapeutic role of antioxidants in preventing, a
number of serious diseases such as certain cancers, cardiovascular diseases and
degenerative diseases associated with ageing. Vitamin C, E, A and trace minerals
Se, and Zn are antioxidant nutrients naturally present in many unprocessed kinds of
food. Vitamins mentioned above are also used as additives in food processing.
The aim of the study was to evaluate zinc, selenium and antioxidant vitamins intake
in daily food rations (DFR’s) of Polish students and their zinc nutritional status.
Material and methods The study was carried out from 2001-2002. The analysis included 77 women (aver-
age age – 22.6 years, BMI=20.8) and 15 men (average age – 22.6 years, BMI=23.1)
from the Mid-West Poland (Wielkopolska Region). The food intake was assessed by
the method of 24 hour recall of 7 days (Charzewska 1997). The qualitative and quan-
titative assessments of food products consumed were based on photocopy models of
various foods of different portion sizes (Szczygłowa et al. 1991). The results of ques-
tionnaire studies were analyzed using computer databases for Microsoft Access 7.0
prepared on the basis of tables for the composition and nutrition value of food prod-
ucts (Kunachowicz et al. 1998, Los-Kuczera and Piekarska 1988; Przysławski and
Schlegel-Zawadzka 2003). The intake recommended by the National Institute of

340
Food and Nutrition in Warszawa was considered to determine the degree to which
the recommended intakes were met (Ziemlanski et al. 1994). Moderate physical ac-
tivity for the examined groups of women and men was assumed. The reduction for
data of vitamin intakes were 25% for vitamin A, 30% for vitamin E and 55% for vita-
min C. Zinc in erythrocytes and serum were analyzed by atomic spectrometry (AAS)
method. Collection of samples (blood serum and erythrocytes preparation procedure)
and zinc determination were according to Schlegel-Zawadzka et al. method (2002).
To conduct these experiments the consent had to be obtained from the Bioethical
Committee Medical Academy in Poznan no. 2413/00.
Because of non-normal distribution data of vitamins and selenium were presented as
median+/- quartile deviation. Zinc data were presented as arithmetic mean + stan-
dard deviation. The hypothesis that the differences between means were significant
was tested at the significance level of p<0.05.
Results The study demonstrated that the average zinc content in serum and erythrocytes in
total group were 0.93±0.15mg/l (0.61-1.42 mg/l) and 10.9±2.15mg/l (5.66-17.40mg/l)
respectively. Statistically significant differences between gender groups were not ob-
served.
Female food rations gave 572±432 µg vit. A, 6.82±2.39 mg vit. E and 40.5±19.1 mg
vit. C. In men the values were as follows: vit. A - 745±274 µg, vit. E – 6.44±2.31 mg,
vit. C – 36.3±21.4 mg. The amount of selenium in DFR’s in women were 54.4±14.0
µg, and in men – 77.7±18.6 µg Se.
The zinc content in the female DFRs was 10.1±1.90mg (nutritional density -
5.03±0.88 mg/1000kcal) and in the male DFRs was 12.8±3.7mg (nutritional density -
4.49±1.05 mg/1000kcal). There was a statistically significant difference between the
female and male zinc nutritional density in the diet (Test U Manna-Whitney,
p=0.0234) and vitamin E nutritional density (3.51±1.06 mg/1000kcal vs. 2.48±1.02
mg/1000kcal; p=0,0418).
Figure 1 presents the degree of the realization of the recommended daily allowances,
and the analysis of these data shows that the recommended intake of above nutri-
ents, apart from Se has not been realized in the DFRs of the study groups.
Table 1. Polish Dietary Standards vs Reference Values for Nutrient Intake of DGE, ÖS, GE, SVE.

341
Polish Dietary Standards (Ziemlański et al. 1994)
DGE, ÖS, GE, SVE (Refer-ence values.., 2000) Nutrient
M F M F Safe level of in-
take/recommended intake Recommended intake
Vitamin A (retionol) [mg-equivalent/ day/person]
0.7/1.0 0.6/0.8 1.0 0.8 Safe level of in-
take/recommended intake Estimated values for ade-
quate intake Vitamin E (tocopherols) [mg-equivalent/day/person]
10.0/10.0 8.0/10.0 15.0 12.0 Safe level of in-
take/recommended intake Recommended intake
Vitamin C [mg/day/person] 60.0/70.0 60.0/70.0 100.0 100.0
Safe level of in-take/recommended intake
Recommended intake Zn [mg/day/person]
14.0/16.0 10.0/13.0 10.0 7.0 Safe level of in-
take/recommended intake Estimated values for ade-
quate intake Se [µg/day/person] 60.0/70.0 50.0/60.0 30.0-70.0
Vit A Vit E Vit C Zn Se0
50
100
150 Male Female
74.5 71.5 64.4 68.251.9 57.9
80.0 77.7
111.090.7
% o
f rec
omm
ende
din
take
Fig. 1. Realization of recommended intake of selected nutrients in daily food rations
of male and female students’ groups.
Conclusions Daily food women and men rations were characterized by the similar nutritional den-
sity of nutrients apart from the zinc and vitamin E contents. Antioxidative vitamin con-
tent and zinc content were below recommendations. The differences between male
and female zinc content in serum were not statistically significant.

342
Summary The analysis included 77 women and 15 men aged about 22 years. The aim of this study was to investigate their zinc status and vitamin C, E, and A, as well as Zn and Se daily intake. The average zinc content in serum and erythrocytes were not differ-ent in female and male groups (in total group 0.93+0.15 mg/l and 10.9+2.15 mg/l re-spectively). Antioxidative (excluding Se) content in daily food rations were below rec-ommendations. There were statistically significant differences between female and male zinc nutritional density in the diet (5.03±0.88 mg/1000kcal; 4.49±1.05 mg/1000kcal; Test U Manna-Whitney, p=0.0234) and vitamin E nutritional density (3.51±1.06 mg/1000kcal vs. 2.48±1.02 mg/1000kcal; p=0,0418).
Acknowledgement The study was partly supported by the State Committee for Scientific Research
4P05E 061 19.
Literature Charzewska J (1997): Instrukcja przeprowadzania wywiadu o spozyciu z 24 godzin.
Zaklad Epidemiologii i Zywienia, IZZ, Warszawa Diet, nutrition and the prevention of chronic diseases. (2003) WHO Technical Report
Series 916, Geneva Kunachowicz H, Nadolan I, Przygoda B, Iwanow K (1998): Tabele wartości
odzywczej produktow spozywczych. IZZ, Warszawa Los-Kuczera M, Piekarska J (1988): Sklad i wartosc odzywcza produktow
spozywczych. Cz. II-VII. PZWL, Warszawa. Przysławski J, Schlegel-Zawadzka M (2003): Trace Elem Electrol, 20, 108-112 Reference values for nutrient intake. German Nutrition Society 2002. Schlegel-Zawadzka M, Zachwieja Z, Huzior-Balajewicz A, Pietrzyk J J (2002): Food
Additv Contam, 19, 963-968 Szczyglowa H, Szczepanska A, Ners A, Nowicka L (1991): Album porcji produktow i
potraw. IZZ, Warszawa Ziemlanski S, Bulhak-Jachymczyk B, Budzynska-Topolowska J, Panczenko-
Kresowska B, Wartanowicz M (1994): Zyw Czlow Metab, 21, 303-338

343
Antioxidativer Status bei klinisch gesunden Schweinen Fürll, M., Röhl, C. Medizinische Tierklinik der Veterinärmedizinischen Fakultät Leipzig, An den Tierkliniken 11, 04103 Leipzig Einleitung und Problemstellung: Die Bedeutung von Radikalen als Elemente oder
Verbindungen mit unpaaren Elektronen auf der einen Seite sowie Antioxidantien
andererseits ist grundsätzlich seit längerem bekannt. Ihre universelle Bedeutung für
Lebensabläufe, Leistungsfähigkeit, Adaptation und immunologische Reaktionen wie
auch für Alterungsprozesse steht in jüngerer Zeit in der Humanmedizin stärker im
Mittelpunkt der Forschung.
Tiere verfügen ebenfalls über komplexe Systeme antioxidativ wirkender Stoffe, um
sich vor der übermäßigen Wirkung von Radikalen zu schützen. Dazu zählen viele
Verbindungen, die z.T. mit der Nahrung aufgenommen werden, wie Carotinoide, Jod,
Selen, Vitamin C und Vitamin E, Folsäure, Flavonoide, Riboflavin, Thiamin, Niacin
und Chelatbildner, oder im Stoffwechsel entstehen, wie z.B. Bilirubin, NADH,
NADPH, Transportproteine und Harnsäure. Des Weiteren hat der Organismus eine
Vielzahl enzymatischer antioxidativer Systeme (SOD, GPX u.a.).
Der antioxidative Status hat besonders bei Schweinen Einfluss auf die
gesundheitliche Stabilität und die Leistung (Zunahme bei Saugferkeln und
Mastläufern, Absetzen von der Mutter, Trächtigkeit, Geburt und folgende
Laktationsperiode). Klassische Störungen, die besonders auf der Lipidperoxidation
beruhen, sind z.B. die Weißmuskelkrankheit, die Maulbeerherzkrankheit und die
Mosaikkrankheit der Leber. Aber auch alle bakteriell oder virologisch bedingten
Krankheiten, Kreislaufstörungen sowie jedwede Entzündungen gehen mit verstärkter
Bildung von Radikalen und damit stärkeren Belastungen der Tiere einher.
Zielstellung: Aufgrund der universellen Bedeutung des antioxidativen Systems
wurden eigene Untersuchungen bei Schweinen mit z.T. neuen Indikatoren
durchgeführt. Sie erfolgten an Saugferkeln, Mastläufern und Sauen in natürlichen
Belastungsperioden für die GPX (Glutathionperoxidase), die CK (Creatinkinase), die
Superoxid-Dismutase und die TEAC (Trolox equivalent antioxidant capacity) für die
Erstellung von Referenzwerten sowie die Charakterisierung von
Belastungssituationen.
Material und Methoden: Die Untersuchungen erfolgten an 5 Sauengruppen (je 15
klinisch gesunde güste, nieder- und hochtragende Sauen; 11 klinisch gesunde

344
Sauen nach der Geburt) sowie an 15 gesunden Mastläufern zwischen 20 und 30 kg,
an 15 klinisch gesunden 14 Tage alten Saugferkeln sowie an 10 Ferkeln 3 Tage vor
dem Absetzen, 1 Tag nach dem Absetzen und 10 Tage nach dem Absetzen.
Neben den o.g. Parametern wurden weiterhin Gesamteiweiß, Albumin, Haptoglobin,
Bilirubin, Harnstoff sowie die Natrium- und Kaliumkonzentrationen, der Hämatokrit,
die Erythrozytenzahl, die Hämoglobinkonzentration und die Leukozytenzahl im
venösen Blut analysiert.
Ergebnisse: Die Konzentration wasserlöslicher Antioxidantien (TEAC) steht in
Beziehung zur Futteraufnahme sowie den darin enthaltenen Inhaltsstoffen.
Wesentlicher Teil dieses Parameters ist das Vitamin C. Die TEAC-Konzentration ist
bei güsten Sauen am niedrigsten (Abb. 1).
Die selenabhängige GPX-Aktivität zeigt eine deutliche Altersabhängigkeit (Abb. 16).
Sie erreicht bei Mastläufern das Niveau der Adulten. Aus der Sicht der
Gesundheitsstabilität ist die niedrige Aktivität bei Ferkeln als ungünstig zu bewerten.
Die SOD-Aktivitäten sind bei Ferkeln und Mastläufern höher als bei Sauen (Abb. 1).
Höhere Aktivitäten sprechen für akute Belastungen und sind ebenso wie die
niedrigen GPX-Aktivitäten für die Gesundheitsstabilität nachteilig. Das zu den
wasserlöslichen Antioxidantien zählende Albumin hat bei Ferkeln die niedrigste
Konzentration und steigt mit zunehmendem Alter kontinuierlich an (Abb. 2).
Schematisch sind in Abb. 2 weiterhin die wesentlichsten Veränderungen sowie die
von den gesunden Sauen abgeleiteten Referenzwerte zusammengestellt.
Zusammenfassung: Bei Ferkeln ist das enzymatische, antioxidative System stärker
belastet, das wasserlösliche (TEAC) hingegen stabiler. Das Absetzen der Ferkel ist
mit einem markanten, relativ kurzfristigen Anstieg der GPX-Aktivität, einer moderaten
Steigerung der TEAC-Konzentration sowie der SOD-Aktivität verbunden. Tragende
Sauen haben sehr niedrige TEAC-Konzentrationen sowie mit zunehmender
Trächtigkeitsdauer steigende SOD-Aktivitäten. Bei säugenden Sauen treten
innerhalb von 10 Tagen nach der Geburt keine wesentlichen Veränderungen des
antioxidativen Systems auf. Die Ergebnisse bieten Ansätze zur weiteren
Stabilisierung des Gesundheitsstatus besonders bei Ferkeln.

345
Abb. 1: Konzentration wasserlöslicher Antioxidantien (TEAC) sowie Aktivitäten
der Gluthationperoxidase (GPX) und Superoxid-Dismutase (SOD) bei Schweinen
unterschiedlicher Altersklassen sowie Belastungssituationen
G P X – A k t i v i t ä t ( U / g H b )G P X – A k t i v i t ä t ( U / g H b )
50
100
150
200
250
300
350
FgF 18
dF 22
dF 32
d Mlg
Sauen
güst
Sauen
NT
Sauen
HT
Sg 1.d
Sg 3.d
Sg 5.d
Sg 10.d
F – F e r k e l M l – M a s t l ä u f e r S – S a u e n g ü s t / t r a g e n d S – S a u e n s ä u g e n d
T E A C ( m m o l / l )T E A C ( m m o l / l )
F – F e r k e l M l – M a s t l ä u f e r S – S a u e n g ü s t / t r a g e n d S – S a u e n s ä u g e n d
0 ,0 5 0
0 ,1 0 0
0 ,1 5 0
0 ,2 0 0
0 ,2 5 0
0 ,3 0 0
0 ,3 5 0
0 ,4 0 0
FgF 18 d
F 22 dF 32 d Mlg
Sauen güst
Sauen
NT
Sauen
HT
S 1.Tag
S 3.Tag
S 5.Tag
S 10.Tag
S O D - A k t i v i t ä t ( U / g H b )S O D - A k t i v i t ä t ( U / g H b )
F – F e r k e l M l – M a s t l ä u f e r S – S a u e n g ü s t / t r a g e n d S – S a u e n s ä u g e n d
1000
1200
1400
1600
1800
2000
2200
2400
2600
FgF 1
8 dF 2
2 dF 3
2 d Mlg
Sauen
güst
Sauen
NT
Sauen
HT
S 1.Ta
g
S 3.Ta
g
S 5.Ta
g
S 10.Ta
g

346
Abb. 2: Albumin-Konzentrationen sowie Übersicht über physiologische Bereiche
und wesentliche Abweichungen von Parametern des antioxidativen Systems bei
Schweinen unterschiedlicher Altersgruppen sowie Belastungssituationen
1 5 ,0
2 0 ,0
2 5 ,0
3 0 ,0
3 5 ,0
4 0 ,0
4 5 ,0
5 0 ,0
5 5 ,0
FgF 18 d
F 22 d
F 3
2 d Mlg
Sauen güst
Sauen NT
Sauen HT
S 1.Tag
S 3.Tag
S 5.Tag
S 10.Tag
A lb u m in (g / l )A lb u m in (g / l )
F – F e r k e l M l – M a s tlä u fe r S – S a u e n g ü s t /t r a g e n d S – S a u e n s ä u g e n d
±±n-ann40 – 50 g/ l
A lbum in
±nH±aH100 – 250 µm ol/l
T E A C
±a±Hn-an180 – 270 U /g Hb
G P X
±n-aHHH1500 – 1700 U /g Hb
S O D
Sauensäugend
Sauen güst /
tragendLäuferAb-
setzerFerkelphysio lo-gischerBereich
Para-meter
Physio logische Bereiche sow ie w esentliche Abw eichungen von Param e-tern des antiox idativen System s bei Schw einen unterschiedlicher A ltersgruppen (H = hoch; n = niedrig; a = ansteigend ; ± = physiologisch)

347
Effect of selenium deficiency and dietary selenium supplementation on oxidative status of porcine liver and muscle Sobajic, S., Miric, M., Mihailovic, M.1 Institute of Bromatology, Faculty of Pharmacy, 450 Vojvode Stepe, 11221 Belgrade, Yugoslavia 1 Institute of Biochemistry, Faculty of Veterinary Medicine, Belgrade, Yugoslavia Introduction Selenium is an essential element for man and animals. Selenium, as a component of the
enzyme glutathione peroxidase has an important role in protecting organisms from cell
injuries mediated by reactive oxygen species (Ursini F, Bindoli A, 1987). Selenium
deficiency in pigs leads to serious pathological disorders (Rice DA and Kennedy S,
1989). Selenium is deficient in nutrition of man and animals in Serbia and is frequently
added to animal feed (Maksimovic et al, 1992). The aim of this study was to determine
the effect of diet low in selenium as well as the effect of selenium supplementation on
selenium content, oxidative stability, and fatty acid profile in porcine muscle and liver.
Materials and Methods 18 weanling piglets (Landrace x Duroc x Yorkshire crossbreeds), 8 weeks old were fed a
basal corn/defatted soybean diet low in selenium (17 µg/kg) for a 4-week depletion
period. After this period the animals were divided into 3 groups and given basal feed,
feed with added 0.3 mg/kg of selenium from sodium-selenite, and feed with added 0.3
mg/kg of selenium from selenized yeast. Three pigs from each group were slaughtered
when reached approximately 75 kg liveweight and Musculus Longissimus dorsi and liver
were removed from the carcasses 2 hours post mortem, kept at +4 oC and analyzed
within the next 12 hours. Water and total lipid contents were determined using standard
AOAC procedures. Selenium concentration was determined in wet-ashed samples using
AAS-HG technique. The oxidative status was measured using 2-thiobarbituric acid test
of Tarladgis et al. (1960) and was expressed in mg of malonaldehyde per kg of tissue.
Surface metmyoglobin (metMb) oxymioglobin (OxyMb), myoglobin (Mb), and total
pigments were determined in muscle by reflectance spectrophotometry (Krzywicki,
K.,1982). Extracted total lipids from muscle samples were separated into polar and
neutral lipid classes according to their different solubility in acetone. Fatty acid

348
composition of total, polar and neutral lipids was analyzed using gas chromatography.
The significances of differences between experimental groups were tested using
nonparametric analyses of variances (Kruscal-Wallis one-way analysis by ranks,
followed by Mann-Whitney test).
Results and discussion No significant differences in lipid and moisture contents of liver and muscle samples
were noticed between experimental groups. Selenium supplementation significantly
increased the level of Se in analyzed tissues (table 1), and selenized yeast had more
pronounced effect upon Se content than sodium-selenite.
Table 1: Selenium content in porcine muscle and liver (mg/kg) Groups Muscle Liver
Control 0.12 ± 0.01 0.66 ± 0.325
Inorganic Se 0.24 ± 0.040 1.10 ± 0.172
Selenized yeast 0.26 ± 0.075 1.34 ± 0.147
Selenium deficiency resulted in higher levels of thiobarbituric acid reactive substances
(TBARS) in muscle and liver samples from the control group. TBARS were significantly
influenced by both forms of dietary selenium supplementation (Fig. 1). Selenized yeast
supplementation resulted in lower TBA values than the selenite supplementation.
Figure 1: TBARS levels in porcine muscle and liver tissues
0
0,2
0,4
0,6
0,8
1
1,2
1,4
Muscle Liver
ControlInorganic SeSe-yeast

349
05
101520253035404550
Control InorganicSe
Selenizedyeast
SFAMFAPUFA
Results of total and individual pigment analysis in muscle samples showed no significant
differences in Mb, OxyMb, and MetMb contents between experimental groups, although
slightly more OxyMb was present in samples of animals supplemented with both
selenium forms.
In liver total lipids stearic, arachidonic, palmitic and oleic acids were the most abundant
fatty acids, and polyunsaturated fatty acids comprised 33-37% of all fatty acids. In
muscle total and polar lipids the most substantial fatty acids were oleic, linoleic, and
palmitic, and PUFAs represented 21-37%. Muscle fatty acid content significantly differed
depending on the dietary regimen of animals: selenium-deficient samples had
significantly lower level of PUFAs in total, polar and neutral lipids in comparison with
both supplemented groups. Muscle samples from selenized yeast-supplemented group
had significantly more PUFAs than sodium-selenite ones. Liver PUFA levels were not
significantly influenced by selenium supplementation.
M u s c l e L i v e r Picture 2: Content of saturated (SFA), monounsaturated (MUFA) and polyunsaturated fatty acids (PUFA) in total muscle and liver lipids
Selenium supplementation of pig diets consequently results in increase of selenium
content in various tissues (Mahan&Kim, 1996). In our study selenized yeast was more
effective in increasing tissue levels of Se in muscle and in liver. Liver Se content was
five times higher than Se content in muscle and this result is in accordance with
Norheim&Froesli, 1986. Due to the high content of PUFAs in porcine tissues lipid
05
1015202530354045
Control InorganicSe
Selenizedyeast

350
peroxidation is the primary chemical cause for meat deterioration. Data presented in
several publications show that dietary antioxidant supplementation suppresses lipid
oxidation in various porcine tissues and pork products but most of the data concerns
vitamin E (Lanari et al, 1995; Hoving-Bolink et al, 1999). Similar effects of simultaneous
dietary vitamin E and selenium supplementation were noticed in our previous study of
porcine muscle (Šobajic et al, 2001). Supplementation of selenium-deficient pig diets
with the Se quantities on the animal requirement level, suppressed lipid oxidation
examined by TBARS tissue level and selenized yeast was shown to be more effective
for these purposes than sodium-selenite. Krska et al (2001) has also found that dietary
organic selenium supplementation resulted in lower TBARS values in pig muscles.
Analysis of fatty acid profiles of porcine muscle and liver lipids showed that long-termed
dietary selenium supplementation can improve PUFAs content of porcine muscles, but
has no effect on liver lipids.
Summary This experiment was aimed to investigate the effects of Se supplementation, both inorganic and organic forms, on selenium status, fatty acid composition, and oxidative status expressed as TBARS in porcine muscle and liver. Dietary Se significantly increased selenium content and improved oxidative stability of porcine tissues. Selenized yeast had significantly more potent protective effect than sodium-selenite on oxidative stability in muscle and liver and also resulted in higher Se content in both tissues. No changes in MetMb content were noted in Se-supplemented groups comparing to the Control group. The content of polyunsaturated fatty acids (PUFAs) in muscle total, polar and neutral lipids was significantly higher in selenium supplemented samples. Literature Hoving-Bolink AH, Eikelenboom G, Van Diepen JTM et al (1998): Meat Sci, 49, 205-212 Krska P, Lahucky R, Kuchemeister U et al (2001): Arch Tierz Dummerstorf, 44, 193-201 Krzywicki K. (1982): Meat Sci, 7, 29-35 Lanari M, Schaefer D, Cassens R, Scheller K (1995): Meat Science, 41, 337-350 Mahan DC, Kim YY (1996): J Anim Sci, 74, 2711-2718 Maksimovic Z, Djujic I, Jovic V, Rsumovic M (1992): Bull Acad Serbe Sci Arts, 33, 65-83 Norheim G, Froeslie A (1986): Acta Pharmacol Toxicol, 59 (suppl), 174-178 Rice DA, Kennedy S (1989): Am J Vet Res, 50, 2101-2104 Šobajić S, Miric M, Mihailović M, (2001): Proceedings from 8th Symposium “Vitamins and Additives in the Nutrition of Man and Animal”, Jena, Germany, 353-356 Tarladgis B, Watts B, Younathan M (1960): J Am Oil Chem Soc, 37, 44-48 Ursini F, Bindoli A (1987): Chem Phys Lip, 44, 255-276

351
Evaluation durum wheat semolina of different years by their antioxidant activity and contents of carotenoids Burkhardt, S.1, Kranl, K.1, Hollmann, J.2, Lindhauer, M.G.2, Bitsch, R.1, Böhm, V.1
1Institute of Nutrition, Friedrich-Schiller-University Jena, Dornburger Str. 25-29, 07743 Jena, Germany 2Federal Centre for Cereal, Potato and Lipid Research, 32756 Detmold, Germany
Introduction The consumption of plant foods rich in phytochemicals is associated with reduced
risk of developing degenerative diseases like certain cancers or coronary heart dis-
ease. This can partly be attributed to their antioxidant activity.
This study investigated the contents of carotenoids and total phenolics as well as the
antioxidant activity of milled durum wheat and pasta products.
Materials and Methods Five different durum wheat samples, one pasta produced of the cultivar Prowidur and
two commercial durum wheat pasta products were analyzed. The total phenolic con-
tent was determined without and with hydrolysis with HCl and NaOH at 37 °C by
using the Folin-Ciocalteu method (Singleton and Rossi 1965). The antioxidant activ-
ity of the hydrophilic fraction was assessed by using the FRAP (ferric reducing anti-
oxidant power) and the TEAC (trolox equivalent antioxidant capacity) assay (Schle-
sier et al. 2002). To determine the lipophilic antioxidant activity, another version of
the TEAC assay was used (Schlesier et al. 2002). Carotenoids were analyzed after
leaving the samples with the solvent for 24 hours by using a method published by
Böhm (2001). The yellow pigment content was measured by using the optimized ICC
standard method 152 with lutein as reference material. Another modification was the
exchange of 1-butanol by methanol/tetrahydrofuran (1+1) + 0,1 % BHT. The chemi-
cal composition of these extracts was also analyzed by using HPLC.
Results The use of different solvents resulted in significantly different yellow pigment contents
(p<0,05). The modified method according to Böhm (2001) showed significantly
higher carotenoid contents for only four of all samples than the analysis of the yellow
pigment extracts by using HPLC (Figure 1). The main carotenoid was lutein,
zeaxanthin was found in traces. Carotenoids amounted to ~ 60-75 % of the yellow

352
pigment of the durum wheats. The two commercial pasta products had significantly
lower contents of carotenoids but not of yellow pigments.
0.0
0.1
0.2
0.3
0.4
0.5
0.6
0.7
0.8
0.9
Heradur1999
Lloyd 2002 Lloyd 2001 Prowidur2002
Prowidur1999
pastaProwidur
1999
commercialpasta A
commercialpasta B
yellow pigment (ICC method) yellow pigment (methanol/THF)HPLC yellow pigment (methanol/THF) HPLC carotenoids
Figure 1: Yellow pigment and carotenoid contents of durum wheat cultivars and pasta products [mg/100g dry weight]
A positive correlation (r = 0,51) was found between the lipophilic antioxidant activity
and the carotenoid content while the yellow pigment content did not correlate with the
antioxidant activity. In general, all pasta products possessed significantly lower lipo-
philic antioxidant activity than the different durum wheat cultivars (Figure 2).
D
E
D
CBBB
A
0,0
0,1
0,2
0,3
0,4
0,5
Heradur1999
Lloyd 2002 Lloyd 2001 Prowidur2002
Prowidur1999
pastaProwidur
1999
commercialpasta A
commercialpasta B
Figure 2: Lipophilic antioxidant activity expressed as TEAC values [mol/l/g dw] bars with same letters are not significantly different (p>0,05)

353
The hydrolysis of the five durum wheat samples and the pasta produced of the culti-
var prowidur resulted in a ~ 3 fold and that of the commercial pasta products in a ~ 5
fold higher phenolic content. Free phenolic compounds accounted for only 20 - 30 %
of the total phenolic content. All pasta products had a significantly lower amount of
phenolic compounds than the milled durum wheats (Figure 3).
KKH
FC
EC
A
050
100150200250300350400450
Heradur1999
Lloyd 2002 Lloyd 2001 Prowidur2002
Prowidur1999
pastaProwidur
1999
commercialpasta A
commercialpasta B
without hydrolysiswith hydrolysis
Figure 3: Total phenolic contents expressed as gallic acid equivalents (GAE) [mg/g dw], bars with same letters are not significantly different (p>0,05)
A strong positive correlation (r = 0,92) was found between the hydrophilic antioxidant
activity of the hydrolysed samples measured by the FRAP assay and the total phe-
nolic content. In the TEAC assay, no antioxidant capacity could be detected for the
samples without hydrolysis. Therefore antioxidant activities could only be calculated
for samples with hydrolysis. These results were also correlated (r = 0,68) with total
phenolic content (Figure 4).
r = 0.92r = 0.68
012345678
0 50 100 150 200 250 300 350 400
GAE [mg/100g dw]
TEAC
[µm
ol/l/
g dw
]
0
10
20
30
40
50
60
70
FRAP
[µm
ol/l/
g dw
]
TEACFRAP
Figure 4: Correlation between total phenolic content and antioxidant activity (after hydrolysis)

354
Conclusion
In general, commercial durum wheat pasta products possessed lower contents of
carotenoids and phenolic compounds and therefore lower antioxidant activities which
suggests a loss of phytochemicals during pasta production. The increase of phenolic
content after hydrolysing the samples indicates the presence of bound phytochemi-
cals which also contribute to the antioxidant activity. The percentage of carotenoids
of the yellow pigment content could be increased from ~ 40 % as published by
Hentschel et al. (2002) to ~ 60-75 % due to longer extraction times. It still remains
unclear which substances further contribute to the yellow pigment.
Summary In the present study, several durum wheat cultivars of different years and three pasta products were analysed for their contents of yellow pigments, carotenoids and phe-nolic compounds as well as for their antioxidant activities. Carotenoids (lutein and zeaxanthin) amounted to 60-75 % of the yellow pigment. Hydrolysing the samples resulted in 3 to 5 fold higher amounts of phenolic compounds. Free phenolic com-pounds accounted for only 20-30 % of the total phenolic content. Positive correlations were found between carotenoid content and lipophilic antioxidant activity and between total phenolic content and hydrophilic antioxidant capacity. Commercial pasta products possessed significantly lower amounts of carotenoids and phenolic compounds and therefore lower antioxidant activities than the durum wheat samples. References Böhm V. (2001): J. Sep. Sci., 24, 955-959 Hentschel V, Kranl K, Hollmann J, Lindhauer M.G., Böhm V, Bitsch R. (2002): J. Agric. Food Chem., 50, 6663-6668 Schlesier K, Harwat M, Böhm V, Bitsch R (2002): Free Radical Research, 36 (2), 177-187 Singleton V L, Rossi Jr. J A (1965): Am. J. Enol. Vitic., 16, 144-158 Standard-Methoden der Internationalen Gesellschaft für Getreidewissenschaft und -Technologie (1991), Vienna, Austria

355
Reactive oxygen species are involved in chromium (III) and insulin inducted glucose uptake in cultured muscle cells. Lipko, M., Kuryl T., Debski, B Faculty of Veterinary Medicine, Div. Anim. Biochemistry, SGGW, ul. Nowoursynowska 159, 02-787 Warsaw, Poland.
Chromium is an essential trace element for animals and humans, known as a potentiator of insulin action (Mertz et al. 1993). Cr3+ ions are necessary for optimal carbohydrate and lipid metabolism. Supplementation results in increased insulin sensitivity and enhanced glucose homeostasis (Anderson 1998, Mowat 1997). In rats treated with 2 ppm of chromium (CrCl3), enhanced glucose and glycogen metabolism, and increased incorporation of amino acids into tissue protein were observed (Roginski 1968). Cr deficiency leads to symptoms associated with adult-onset diabetes and cardiovascular diseases such as impaired glucose tolerance, hyperglycemia, elevated serum cholesterol and triglicerides (Anderson et al. 1991).
Diabetes mellitus is now most common metabolic disorder, affecting persons of all races and age groups. Disease results from autoimmune destruction of insulin-secreting pancreatic β cells (type I), and malfunction in insulin signal transduction (non-insulin dependent diabetes mellitus NIDDM -type II). Over 90% of diabetes mellitus are accounted for II variant, characterised by impaired insulin action in peripheral tissues and fasting hyperglycemia. It is why here is growing basic and clinical interest in agents mimicking the biological action of insulin. In NIDDM people increased excretion of Cr ions was noted, and its supplementation resulted in improvement of insulin resistance (Anderson 1997). This effect was also observed in rats with streptozotocin-inducted diabetes (Yoshimoto et al 1992). Previous years resulted only in studies of deficiency or chromium supplementation. Function and mechanism of action of this microelement are still uncertain. Insulin stimulation of adipocytes leads to increased synthesis of reactive oxygen spices, which are integral part of insulin signaling cascade (Mahadev et al. 2001). Reversible oxidation of protein tyrosine phosphatases (PTPs) by ROS is mechanism of regulation of insulin cell signal transduction (Ostman 2001). There is evidence that Cr3+ stimulation results in elevated ROS synthesis (Balamurugan et al. 2002). In present work we examined role of ROS in chromium and insulin inducted glucose uptake in C2C12 mouse myotubes. Cells were stimulated with chromium or insulin in the presence and absence of antioxidants: N-acetyl cysteine, L-ascorbic acid, or DPI – NADPH oxidase inhibitor, then was assayed glucose uptake. Materials and Methods Cell culture: Experiment was performed in vitro on C2C12 cell culture. Cells were grown in Dulbecco Modified Eagle’s Medium (DMEM) supplemented with 20% fetal bovine serum (FBS) and antibiotics (pen/strept, fungizon) in 5% CO2/95% air at 37 C. Confluent culture was differentiated in DMEM containing 2% horse serum (HS) for four days. Assay of glucose transport: C2C12 myotubes in 24-well plates were incubated in DMEM (serum free) containing Cr3+ ions as CrCl3 (0,01-100 µg/L) or insulin (20-100 nM) in the presence and absence of antioxidants: L-ascorbic acid, N-acetyl cystine (100 µM), or diphenyleneiodonium DPI, NADPH oxidase inhibitor (10 µM). Monolayers were rinsed with HEPES buffer (20 mM

356
HEPES, 140 mM NaCl, 5 mM KCl, 2.5 mM MgSO4, 1 mM CaCl2, pH=7,4), and then assayed for [3H] 2-deoxyglucose uptake (n=3). Uptake of glucose was initiated by the addition of 1ml of HEPES buffer with 1mCi 2-[3H]-deoxy glucose (ICN) and 1mM 2-deoxy glucose for 10 min for each well. Radioactivity was determined after cell lysis in 0.05 M NaOH, followed by scintillation counting, using HiSafe (Pharmacia) liquid scintillation cocktail and Packard TriCarb counter. Results and Discussion
Fig. A. Effect of insulin (20-100 nM) on glucose uptake in C2C12 mouse myotubes. Cells were treated with insulin solutions for 6 hours in the presence and absence of antioxidants: L-ascorbic, N-acetyl cysteine at concentration 100 µM, or 10 µM DPI – inhibitor of NADPH oxidase.
Fig. B. Effect of chromium ions (0,01-100 µg/L) on glucose uptake in C2C12 mouse myotubes. Cells were treated with chromium solutions for 6 hours in the presence and absence of L-ascorbic acid, N-acetyl cysteine at concentration 100 µM, or 10 µM DPI – inhibitor of NADPH oxidase.

357
Insulin improved glucose transport in C2C12 cells and this effect reached maximum at insulin concentration 80 nM, antioxidants and DPI suppressed this effect (Fig. A). Chromium alone enhanced DOG uptake reaching 135% of stimulation at the concentration of Cr3+10 µg/L. Presence of antioxidants (L-ascorbic acid, N-acetyl cysteine 100 µM) or DPI (10 µM) inhibited chromium-inducted glucose transport, but N-acetyl cysteine decreased DOG uptake even below control value (Fig. B).
Trivalent chromium ions are involved in the regulation of carbohydrate and lipid metabolism in mammals. Insulin-like effects of Cr supplementation are well known for over 40 years: enhanced glucose homeostasis and increased insulin sensitivity in peripheral tissues. Organic Cr compounds are better absorbed than inorganic. Complex with picolinic acid (2-carboxypirydyne) is now very popular nutritional supplement. It is also sold as a weight loss agent, in numerous forms.
In the 1980s was found biologically active form of chromium, oligopeptide called chromodulin / low-molecular weight chromium binding substance (LMWCr), but mechanism of its action is still poorly understood. There is evidence that it acts at postreceptor level, after insulin binding with the receptor. Cr stimulation leads to increased synthesis of reactive oxygen species (ROS). They are involved in transduction of insulin signal. In present experiment we examined if ROS are essential for chromium and insulin inducted glucose uptake. Treatment of C2C12 mouse myotubes with chromium and insulin solutions resulted in enhanced glucose transport (Fig. A, B). Antioxidants (N-acetyl cysteine, L-ascorbic acid) and DPI (diphenyleneiodonium-NADPH oxidase inhibitor), present in the culture medium diminished synthesis of ROS, and suppressed this effect. Those data confirm thesis that ROS are integral part of insulin signaling, and they are necessary for optimal metabolic effects of chromium and insulin. Reactive oxygen species generated during Cr stimulation are not harmful (Anderson 1997). Toxic effects of chromium supplementation appears in doses over 1000 times higher than used in physiological studies. References Anderson, R.A., Polansky, M.M., Bryden N.A., Canary J.J. (1991) Supplemental-chromium effects on glucose, insulin, glucagon, and urinary chromium losses in subjects consuming controlled low-chromium diets. Am. J. Clinical Nutrition 54, 909-916. Anderson, R.A., Bryden, N.A., Polansky, M.M. (1997) Lack of toxicity of chromium chloride and chromium picolinate in rats. J. Am. Coll. Nutr. 16, 273-279. Anderson, R.A. (1997) Elevated intakes of supplemental chromium improve glucose and insulin variables in individuals with type 2 diabetes. Diabetes 46, 1786-1791. Anderson, RA. (1998) Chromium, glucose intolerance and diabetes. J. Am. Coll. Nutr. 17, 548-555. Balamurugan, K., Rajaram, R., Ramasami, T., Narayanan, S. (2002) Chromium III inducted apoptosis of lymphocytes: Death decision by ROS and Src-family tyrosine kinases. Free Radic. Biol. Med. 33, 1622-1640. Mahadev, K., Wu, X., Zilbering, A., Zhu, L., Todd, J., Lawrance, R., Goldstein, B.J. (2001) Hydrogen peroxide generated during cellular insulin stimulation is integral to activation of distal insulin signaling cascade in 3T3-L1 adipocytes. J. Biol. Chem. 276, 48662-48669.
358
Mertz, W. (1993) Chromium in human nutrition: a review. J. Nutr. 123, 626-633. Mowat, D. N. (1997) Organic Chromium in animal nutrition. Chromium books, Guelph, ON, Canada. Ostman, A., Bohmer, F-D. (2001) Regulation of receptor tyrosine kinase signaling by protein tyrosine phosphatases. TRENDS in Cell Biology 11(6), 258-266. Roginski, R.R., Mertz, W. (1968) Effects of chromium (III) supplementation on glucose and amino acid metabolism in rats fed a low protein diet. J. Nutrition 97:525-530. Yoshimoto, S. Sakamoto, K Wakabayashi, I. Masui, H. (1992) Effect of chromium administration on glucose tolerance in stroke-prone spontaneously hypertensive rats with streptozotocin-inducted diabetes. Metabolism 41(6), 636-642.
Vitamin and trace element status of milk from organic production – First investigation results Vitamin- und Spurenelementstatus von Milch aus ökologischer Erzeugung – Erste Untersuchungsergebnisse Schöne, F., Kirchheim, U., Kinast, C., Böhm*, V., Hartung, H., Leiterer, M. Agricultural Institution of Thuringia, D-07743 Jena, Naumburger Straße 98, Germany, *Friedrich-Schiller-University, Institute of Nutrition, D-07743 Jena, Dornburger Straße 25, Germany Milk qualities from organic and conventional farms differ hardly in food-safety
relevant constituents. However, there are only a few informations about vitamin
and trace element status of milk from both these farm types.
Material and Methods
A total of 31 raw bulk milk samples - 9 from organic farms, 22 from conventional
farms - was investigated in two periods (June 1999 and April 2001). The lower
number of samples of organically produced milk reflects the lower number of
organic farms.
The milk, as lyophilisate, was analyzed with regard to vitamins A, E, B1, B2, the
zinc, copper, manganese, selenium and iodine and fat, protein, lactose and
calcium (methods by Schöne et al. 2003). Results are given as arithmetic mean ±
standard deviation. Differences between the two random samples of each
investigation period were tested according to Student´s t-test.
Results
In the 1999 sampling the organically produced milk had a significantly lower
content of thiamine, riboflavin and vitamin A, whereas the vitamin E concentration
in milk of both the production types did not differ (Table 1). In the 2001 sampling
there were no differences in the concentrations of these vitamins between the milk
samples from organically and conventionally producing farms.
In both the investigation periods organically produced milk contained less zinc,
copper, manganese and selenium than milk from conventional farms (Table 2). In
the first investigation period no different iodine concentration of milk from both the
production types was determined whereas in the second period the milk from
359

organic farms had a significantly lower iodine concentration than milk from
conventional farms.
Table 1: Selected vitamins of raw bulk milk from Thuringian conventionally and organically producing farms in two investigation periods
Farm type Conventional Organic 1999 (June)
No. of samples 12 5 Thiamine mg/kg 0.40 ± 0.06 0.30* ± 0.05 Riboflavin mg/kg 1.02 ± 0.23 0.55* ± 0.27 Retinol mg/kg 0.48 ± 0.09 0.34* ± 0.11 "-Tocopherol mg/kg 0.90 ± 0.21 1.04 ± 0.36
2001 (April) No. of samples 10 4 Thiamine mg/kg 0.42 ± 0.07 0.43 ± 0.04 Riboflavin mg/kg 0.97 ± 0.13 1.22 ± 0.31 Retinol mg/kg 0.33 ± 0.09 0.29 ± 0.07 "-Tocopherol mg/kg 0.76 ± 0.18 0.68 ± 0.09
*P<0,05
Table 2: Calcium and selected trace elements of raw bulk milk from Thuringian conventionally and organically producing farms
Farm type Conventional Organic 1999 (June)
No. of samples 12 5 Calcium g/kg 1.19 ± 0.08 0.97 ± 0.20 Zinc mg/kg 4.5 ± 0.6 2.9* ± 1.2 Copper µg/kg 63 ± 12 28* ± 12 Manganese µg/kg 24 ± 6 <20* Selenium µg/kg 72 ± 11 38* ± 15 Iodine µg/kg 118 ± 100 115 ± 89
2001 (April) No. of samples 10 4 Calcium mg/kg 1.29 ± 0.06 1.24 ± 0.10 Zinc mg/kg 4.5 ± 0.2 4.0* ± 0.3 Copper µg/kg 65 ± 16 32* ± 9 Manganese µg/kg 24 ± 15 < 20* Selenium µg/kg 16 ± 3 11* ± 2 Iodine µg/kg 137 ± 53 63* ± 31
There was a tendency of lower concentrations of fat (Table 3) and calcium (Table
2, 1999) in organically produced milk. The protein concentration of this milk was
360

significantly lower in both the sampling periods than that of conventionally
produced milk (Table 3).
Table 3: Dry matter, fat, protein and lactose of raw bulk milk from Thuringian conventionally and organically producing farms
Farm type Conventional Organic 1999 (June)
No. of samples 12 5 Dry matter g/kg 136.4 ± 5.9 129.8 ± 10.6 Fat g/kg 41.6 ± 4.1 39.9 ± 1.8 Protein g/kg 34.0 ± 0.7 32.2* ± 0.4 Lactose g/kg 48.2 ± 0.6 47.7 ± 0.6
2001 (April) No. of samples 10 4 Dry matter g/kg 131.1 ± 7.9 122.0 ± 5.3 Fat g/kg 43.4 ± 9.2 38.3 ± 4.2 Protein g/kg 34.3 ± 0.7 32.4* ± 0.7 Lactose g/kg 47.3 ± 0.6 48.0 ± 0.4
Discussion
In conventional feeding as a rule the vitamins A, D and E are added leading to
their middle or high milk concentrations with regard to natural occurrence of these
vitamins in feedstuffs and to the animal depots, too.
An increased risk for lower vitamin concentration of milk from organically
producing farms may result from some impediments of vitamin additions in cow
feeding. The EU commission regulation prohibits the use of synthetic vitamin
additions (EU 1999). Recently this regulation was broadened to include synthetic
nature-identical vitamin additions according to both the following prerequisites:
The responsible veterinarian has to indicate, that animal health and wealth may
not be guaranteed without synthetic vitamins and it needs the permission of
appropriate authorithy. The lowered vitamín A content of organically produced milk
from the sampling 1999 seems to result from a lower vitamin A intake. However,
fresh or preserved grass contains a lot of provitamin A (beta carotene) and it does
not seem so plausible that the vitamin A milk concentration decreased in the
organic farms in pasture period (1st sampling June 1999). On the other hand the
milk vitamin A concentration is affected by the vitamin A release from liver, too,
and in organic farms the liver vitamin A depots could be lower due to the lacking
361

feed-vitamin A additions. The vitamin E stores of animals are not so high and the
grass contains so much vitamin E that in the grass-dominated diets of organic
farms the vitamin E supply is accomplished in all cases.
The lower thiamine and riboflavin content of organically produced milk of the 1999
sampling is difficult to explain. In milk the B vitamins result from their feed content
and from microbial synthesis in rumen. Assuming an inadequate rumen
fermentation a correspondingly inadequate feeding could reduce the rumen B
viamin synthesis of microorganisms and the milk vitamin B concentration. Non-
optimal rumen conditions would be indicated by lower protein concentrations in
milk from organic farms (Table 3).
A reduced concentration of trace elements of organically produced milk indicates a
lacking or a too low administration of mineral feed. Maybe also the lack of mineral
fertilizers leads to a lower trace element content of soils and crop plants in organic
farming. Therefore, the macro- and microelement status should be monitored in
the total chain from soil over the crop plants and animal feed up to the milk as a
human food.
The possibly lower vitamin concentrations of milk from organic farms need not be
interpreted as lack in milk quality per se. Conventionally produced milk does not
act necessarily as a reference food because the vitamin supplementation of feed
and therefore the vitamin milk concentration are very high (this was evidenced by
the high vitamin A concentration of conventionally produced milk at 1999 milk
sampling).
References
Schöne, F., M. Leiterer, H. Hartung, C. Kinast, A. Greiling, V. Böhm, G. Jahreis (2003): Trace elements and further nutrition-related constituents of milk and cheese. Milchwissenschaften 58, 486 - 490 Verordnung (EWG) Nr. 2092/91 des Rates vom 24. Juni 1991 über den ökologischen Landbau / die biologische Landwirtschaft und die entsprechende Kennzeichnung der landwirtschaftlichen Erzeugnisse und Lebensmittel und Folgerecht, besonders Verordnung (EG) Nr. 1804/1999 des Rates vom 19.Juli 1999 zur Einbeziehung der tierischen Erzeugung in den Geltungsbereich der Verordnung (EWG) Nr. 2092/91, Amtsblatt der Europäischen Gemeinschaft, Ausgabe I, Nr. 222 vom 24. August 1999, S. 0001 – 0028.
362

Einfluss einer Calciumphosphat-Supplementation auf den Eisenstatus beim Menschen Fökel, C.1, Ditscheid, B.1, Bergmann, H.2, Jahreis, G.1 Friedrich-Schiller-Universität, Institut für Ernährungswissenschaften 1 Lehrstuhl Ernährungsphysiologie, Dornburger Straße 24, D-07743 Jena 2 Lehrbereich Lebensmittelkunde, Dornburger Straße 24-29, D-07743 Jena Einleitung Mit der steigenden mittleren Lebenserwartung der Bevölkerung nimmt auch die
Osteoporoseinzidenz zu. Um in den ersten drei Lebensdekaden eine maximale
Peak-Bone-Mass zu erreichen und im höheren Lebensalter den physiologischen
Knochenabbau zu verzögern, ist neben einer Reihe von Faktoren eine adäquate
Calciumzufuhr von großer Bedeutung. Obwohl die Zufuhrempfehlungen durch eine
ausgewogene Mischkost erreicht werden können [D-A-CH 2000], werden zahlreiche
mit Calcium angereicherte Lebensmittel sowie nicht rezeptpflichtige Calcium-
präparate angeboten. In diesem Zusammenhang muss jedoch geklärt werden, ob
eine stark erhöhte Calciumzufuhr einen negativen Effekt auf den Stoffwechsel
anderer Mengen- und Spurenelemente hat. In der dazu durchgeführten
Interventionsstudie sollte der Einfluss einer Calciumphosphat-Supplementation auf
verschiedene Parameter des Eisenstoffwechsels untersucht werden. Bislang wurden
zu diesem Sachverhalt sehr kontroverse Ergebnisse veröffentlicht. Während in
Absorptionsstudien ein inhibierender Effekt von Calcium auf die Eisenabsorption
beobachtet werden konnte, zeigten Langzeitstudien mit Calciumsupplementen
keinen signifikanten Einfluss auf den Eisenstatus.
Material und Methode An der Interventionsstudie nahmen 31 gesunde Probanden teil. Bei den 15 Männern
und 16 Frauen handelte es sich um Mischköstler im Alter von 21 bis 29 Jahren. Die
Studie wurde als Placebo-kontrollierte Doppelblindstudie im Cross-over-Design
durchgeführt. Zu Beginn führten alle Probanden sieben Tage ein Ernährungs-
protokoll bei gewohnter Ernährung. Am Morgen des 6. Tages wurde nüchtern Blut
entnommen, um die Ferritin-Ausgangswerte der Studienteilnehmer zu erfassen.
Daran schlossen sich zwei vierwöchige Supplementationsphasen an, in denen die
Probanden in randomisierter Reihenfolge ein Kontrollbrot und ein mit
Calciumphosphat (CaP) supplementiertes Brot bekamen. Die Studienteilnehmer
363
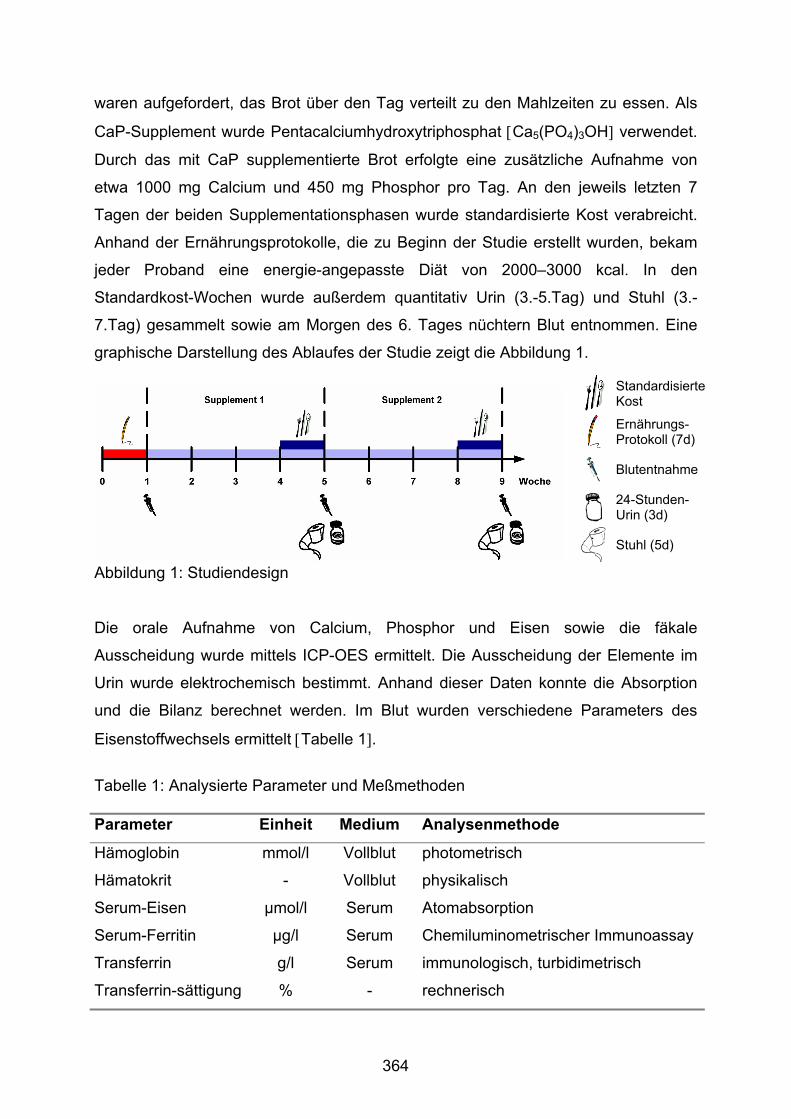
waren aufgefordert, das Brot über den Tag verteilt zu den Mahlzeiten zu essen. Als
CaP-Supplement wurde Pentacalciumhydroxytriphosphat [Ca5(PO4)3OH] verwendet.
Durch das mit CaP supplementierte Brot erfolgte eine zusätzliche Aufnahme von
etwa 1000 mg Calcium und 450 mg Phosphor pro Tag. An den jeweils letzten 7
Tagen der beiden Supplementationsphasen wurde standardisierte Kost verabreicht.
Anhand der Ernährungsprotokolle, die zu Beginn der Studie erstellt wurden, bekam
jeder Proband eine energie-angepasste Diät von 2000–3000 kcal. In den
Standardkost-Wochen wurde außerdem quantitativ Urin (3.-5.Tag) und Stuhl (3.-
7.Tag) gesammelt sowie am Morgen des 6. Tages nüchtern Blut entnommen. Eine
graphische Darstellung des Ablaufes der Studie zeigt die Abbildung 1.
Abbildung 1: Studiendesign
Die orale Aufnahme von Calcium, Phosphor und Eisen sowie die fäkale
Ausscheidung wurde mittels ICP-OES ermittelt. Die Ausscheidung der Elemente im
Urin wurde elektrochemisch bestimmt. Anhand dieser Daten konnte die Absorption
und die Bilanz berechnet werden. Im Blut wurden verschiedene Parameters des
Eisenstoffwechsels ermittelt [Tabelle 1].
Tabelle 1: Analysierte Parameter und Meßmethoden Parameter Einheit Medium Analysenmethode
Hämoglobin mmol/l Vollblut photometrisch
Hämatokrit - Vollblut physikalisch
Serum-Eisen µmol/l Serum Atomabsorption
Serum-Ferritin µg/l Serum Chemiluminometrischer Immunoassay
Transferrin g/l Serum immunologisch, turbidimetrisch
Transferrin-sättigung % - rechnerisch
Standardisierte Kost
Ernährungs-Protokoll (7d)
Blutentnahme
24-Stunden-Urin (3d)
Stuhl (5d)
364

Ergebnisse und Diskussion Durch die Calciumzulage zur Basisdiät betrug die gesamte Calciumaufnahme
während der Supplementation im Mittel etwa 2200 g pro Tag. Die Calciumzufuhr lag
damit weit über den von der DGE empfohlenen 1000 mg/d [D-A-CH 2000]. Zwischen
der Placebo- und der CaP-Phase konnten keine signifikanten Unterschiede
hinsichtlich Hämoglobin, Hämatokrit, Serum-Eisen, Serum-Ferritin, Transferrin und
Transferrin-sättigung ermittelt werden (n = 31). Eine Reihe von Interventionsstudien,
die den Effekt einer Calciumsupplementation untersucht haben, konnten ebenfalls
keinen signifikanten Einfluss von Calcium auf Parameter des Eisenstatus
beobachten [KALKWARF & HARRAST 1998, MINIHANE & FAIRWEATHER-TAIT
1998, ILICH-ERNST et al. 1998, YAN et al. 1996, SOKOLL & DAWSON-HUGHES
1992, SNEDEKER et al. 1981]. Eine Ferritin-Konzentrationen kleiner 15 µg/l gilt
immer als Indikator für einen Eisenmangel mit oder ohne Anämie [THOMAS 2000].
Bei der Betrachtung der Personen (n = 7), die schon zu Beginn der Studie geleerte
Eisenspeicher vorwiesen, konnte eine signifikant niedrigere Serum-Ferritin-
Konzentration in der CaP-Phase (9,90 +/- 4,70 µg/l) im Vergleich zur Kontrollphase
(10,64 +/- 4,93 µg/l) gemessen werden (Abbildung 2).
Abbildung 2: Serum-Ferritin-Konzentration bei Personen mit entleerten und
normalen Eisendepots
∗ signifikant unterschiedlich vom Placebowert (P < 0,05)
Ser
um F
errit
in [µ
g/l]
∗
Basale Ferritin-Konzentration: < 15 µg/l > 15 µg/l (n = 7) (n = 24)
Placebo CaP
365

Es zeigten sich jedoch keine signifikanten Veränderungen in der berechneten
Eisenabsorption dieser Personen. Möglicherweise ist die verwendete Bilanzmethode
nicht hinreichend genau, um diesbezüglich geringe Veränderungen messen zu
können. Um präzise Ergebnisse zu erhalten, müsste man mit radioaktiv-markiertem
Eisen arbeiten.
Bei Personen mit normalen Eisenspeichern (Serum Ferritin > 15 µg/l, n = 24)
konnten infolge der CaP-Supplementation keine signifikanten Veränderungen der
Serum-Ferritin-Konzentration und der Eisenabsorption beobachtet werden.
Summary Influence of a calcium phosphate supplement on iron status in humans The study investigated the effect of a calcium-phosphate supplementation about four weeks on iron status of 31 subjects. The supplement provided an additional intake of 1000 mg calcium and 450 mg phosphorus per day. No significant differences in serum iron, transferrin, transferrin saturation, haemoglobin, haematocrit and serum ferritin could be observed between the calcium-phosphate supplement and the placebo (n = 31). Furthermore, the calcium supplementation had no significant effect on the absorption of iron. However, in subjects (n = 7) depleted in iron stores at the beginning of the study a significant decrease of serum ferritin concentration after calcium-phosphate intake was measured. Literatur D-A-CH: Referenzwerte für die Nährstoffzufuhr. Umschau/Braus 2000, Frankfurt am
Main Ilich-Ernst J Z, McKenna A A, Badenhop N E, Clairmont A C, Andon M B, Nahhas R
W, Goel P, Matkovic V: Iron status, menarche, and calcium supplementation in adolescent girls. Am J Clin Nutr 1998, 68: 880-887
Kalkwarf H J, Harrast S D: Effects of calcium supplementation and lactation on iron status. Am J Clin Nutr 1998, 67: 1244-1249
Minihane A M, Fairweather-Tait S J: Effect of calcium supplementation on daily nonheme-iron absorption and long-term iron status. Am J Clin Nutr 1998, 68: 96-102
Snedeker S M, Smith S A, Greger J L: Effect of dietary calcium and phosphorus levels on the utilization of iron, copper, and zinc by adult males. J Nutr 1982, 112: 136-143
Sokoll L J, Dawson-Hughes B: Calcium supplementation and plasma ferritin concentrations in premenopausal women. Am J Clin Nutr 1992, 56: 1045-1048
Thomas L: Labor und Diagnose: Indikation und Bewertung von Laborbefunden für die medizinische Diagnostik. TH-Books-Verlag-Gesellschaft, Frankfurt am Main 2000, 5., erw. Auflage
Yan L, Prentice A, Dibba B, Jarjou L M A, Stirling D M: The effect of long-term calcium supplementation on indices of iron, zinc, and magnesium status in lactating Gambian woman. Brit J Nutr 1996, 76: 821-831
366

Untersuchungen zu Mineralstoff- und Vitamingehalten in Ergänzungs-präparaten für Ziervögel und kleine Nager Wolf, P., Kamphues, J. Institut für Tierernährung der Tierärztlichen Hochschule Hannover, Bischofsholer Damm 15, D-30173 Hannover Einleitung Ziervögel und „kleine Nager“ haben als Heimtiere und damit als Patienten in der
Kleintierklinik heute eine erhebliche Bedeutung. Die Ernährung dieser Spezies
erfolgt - im Unterschied zu anderen Tierarten, die überwiegend mit Alleinfutter
versorgt werden - in erster Linie mit Mischfuttermitteln, die auf der Basis
originärer Komponenten (z.B. Getreide, Nüsse) konzipiert sind und oftmals
einer Ergänzung bedürfen. Auf diese Situation reagierte die Futtermittelindustrie
mit einer kaum überschaubaren Produktpalette an Ergänzungsfuttermitteln. Per
definitionem geht man bei Ergänzungsfuttermitteln davon aus, dass diese
aufgrund der Konzeption geeignet sind, mögliche Nährstoffdefizite der
„Grund“ration auszugleichen.
Ziel vorliegender Untersuchungen war es, einen Überblick über die Vielfalt der
verschiedenen Ergänzungsfuttermittel zu erhalten und diese unter
ernährungsphysiologischen Aspekten, gerade auch im Hinblick auf mögliche
gesundheitliche Risiken für das Tier, zu beurteilen. Zudem sollte der Frage
nachgegangen werden, ob durch derartige Produkte ein Ausgleich bestehender
Defizite in der Mengen- und Spurenelement- bzw. Vitaminversorgung möglich
ist, oder ob aus der Verabreichung dieser Supplemente eventuell sogar Risiken
für die Gesundheit der Tiere resultieren.
Material und Methoden Untersucht wurden 73 kommerzielle Produkte, die in den Jahren 2001 - 2003
willkürlich aus dem Handel (Zoofachgeschäfte, Lebensmittelmärkte) bezogen
und entsprechend der Auslobung gruppiert wurden. Von den insgesamt
untersuchten Produkten waren 38 als mineralstoffreich ausgelobt. 12 der 73
Ergänzungsfuttermittel sollten laut Deklaration sowohl der Ergänzung mit
367

Mineralstoffen wie auch Vitaminen dienen. Bei 23 handelte es sich um
sogenannte „Multivitamin-Präparate“, welche die Versorgung mit den
verschiedensten Vitaminen sichern sollten.
Die Überprüfung der Deklaration erfolgte entsprechend den Vorgaben der
Futtermittelverordnung (FMVO). Die Analysen von Calcium (Ca), Magnesium
(Mg), Kalium (K), Eisen (Fe), Kupfer (Cu), Zink (Zn), Mangan (Mn) und Selen
(Se) erfolgten atomabsorptionsspektrophotometrisch. Zudem wurde Phosphor
(P) photometrisch (Ammonium-Vanadat-Molybdat-Methode) bestimmt. Die
Bestimmung der Vitamin A (Retinol) bzw. Vitamin E – Gehalte erfolgte mittels
HPLC (unter Verwendung eines UV-Detectors bei 325 nm bei der Vitamin A-
Analyse). Entsprechend wurde bei der Bestimmung des β-Carotins verfahren,
allerdings erfolgte hierbei die Aufnahme des eingeengten Rückstandes in THF
(Tetrahydrofuran).
Ergebnisse
Überprüfung der Deklaration Bei Überprüfung der 73 Ergänzungsfuttermittel – wobei futtermittelrechtliche
Anforderungen berücksichtigt wurden – hätte bei 34 Produkten (dies entspricht
nahezu 44% der untersuchten Futtermittel) die Bezeichnung informativer sein
können. Bezeichnungen auf den Ergänzungsfuttermitteln wie „alles was ihr Tier
braucht“ suggerieren unter Umständen beim Käufer, dass es sich bei diesem
Produkt um ein echtes Alleinfutter handelt. Mehr als 54 % waren bezüglich ihres
Verwendungszwecks (d.h. Fütterungshinweis) wenig aussagekräftig. Dabei
waren einige Angaben äußerst mißverständlich, bei einigen Produkten fehlten
sie auch vollständig. Bei den Zusatzstoffen waren die Angaben teils
widersprüchlich; so ist es beispielsweise fraglich, ob ein bedarfsdeckender
Vitamingehalt ohne entsprechende Zusätze erreichbar ist. Vereinzelt (8,5 %)
konnten auch Unterschiede zwischen deklarierten und analysierten
Mineralstoffgehalten beobachtet werden.
368

Überprüfung der chemischen Zusammensetzung - Produkte zur Ergänzung mit Mineralstoffen
Bei den marginalen Calcium- wie auch Natriumgehalten von
Sämereienmischungen für Ziervögel geht man beispielsweise davon aus,
dass entsprechende Ergänzungsfuttermittel derart konzipiert sind, dass sie
diese Defizite ausgleichen. Der überwiegende Teil der Produkte wies
allerdings derart niedrige Gehalte auf (s. Tabelle 1), dass für einen
sinnvollen Ausgleich dieser Engpässe von diesen Produkten sehr hohe
Anteile in der Ration hätten verwendet werden müssen. Tab. 1: Chemische Zusammensetzung von Ergänzungsfuttern zur
Supplementierung mit Mineralstoffen (Angaben in g bzw. mg/kg TS) MW ± SD min. max.
Ca 9,08 ± 8,89 0,71 18,3 P 5,07 ± 2,63 1,71 12,7
Na 2,48 ± 1,48 0,36 6,32
Cu 21,1 ± 13,6 1,59 59,8
Zn 109 ± 83,5 3,45 389
Se 0,12 ± 0,08 < 0,01 0,32 - Produkte zur Ergänzung mit Mineralstoffen und Vitaminen
Laut Deklaration sollten diese Produkte sowohl ein Mineralstoffdefizit wie
auch gleichzeitig einen Vitaminmangel ausgleichen. Nach Analyse der
tatsächlich enthaltenen Mineralstoffe und Vitamine (s. Tab. 2) zeigte sich
aber, dass beides gleichzeitig vielfach nicht möglich war. Tab. 2: Chemische Zusammensetzung von Produkten (n=12) zur Ergänzung
mit Mineralstoffen und Vitaminen (in g bzw. I.E./kg) Ca Vitamin A Vitamin D3
38,5 - 168 63.000 – 1.500000 85.000 – 200 000 Wurde die Dosierung des Produktes beispielsweise so gewählt, dass ein
bestehendes Calciumdefizit ausgeglichen war, dann lag z.B. bezüglich der
369

Vitamin A-Zufuhr eine absolute Überversorgung vor (Risiko der Vitamin A-
Intoxikation). War die Dosierung hingegen so gestaltet, dass es zu einer
Bedarfsdeckung bezüglich der Vitamin A-Versorgung kam, so war die
Calciumzufuhr vielfach bei weitem nicht bedarfsdeckend.
- Produkte zur Ergänzung mit Vitaminen
Bei Überprüfung der Vitamingehalte in diesen Ergänzungsfuttermitteln
ergaben sich z.T. extrem hohe Gehalte, welche eine exakte Dosierung
mitunter recht schwierig gestalten (Frage der Zuteilung). Aber selbst die
Einhaltung der deklarierten Dosierungsempfehlung führte mitunter zu
Vitamingehalten in der Gesamtration, welche den jeweiligen Bedarf um ein
Vielfaches überschritten (s. Abb. 1).
Abb. 1: Vitamingehalte in der Gesamtration bei Einsatz von Vitaminpräparaten entsprechend der Dosierungsempfehlung
Zusammenfassung Ziel der vorliegenden Arbeit war es, einen Überblick über kommerzielle Ergän-
zungsfuttermittel zu erhalten, wobei aufgrund der großen Vielfalt sicherlich nur
eine kleine Auswahl zur Untersuchung kam. Anhand der chemischen
Zusammensetzung sollte zudem die ausgelobte Indikation für das jeweilige
Produkt („mineralstoffreich“, „vitaminreich“ usw.) überprüft und mögliche
gesundheitliche Risiken bei Einsatz dieser Produkte aufgezeigt werden.
10000
20000
25000
30000
16.510 ± 1210
26.480± 12.630
5000
15000
Empfehlung
20
60
Empfehlung 40
80
100
I.E./kg mg/kg 82,7
± 7,13
69,4± 8,32
NAGER
ZIERVOGEL
Vitamin A Vitamin E
370

Die Deklaration liefert dem Käufer bei der Auswahl bzw. dem Kauf eines
Produktes erste wichtige Informationen. Sie ist zudem – nicht zuletzt zum
„Schutz vor Täuschung“ – ein Werkzeug des Futtermittelrechts und von daher
an bestimmte Regeln gebunden. Ein Defizit bzw. Mängel in der Deklaration
erschweren hingegen eine sinnvolle Rationsgestaltung. So wecken als
„mineralstoffreich“ ausgelobte Produkte die Vorstellung, dass diese die
Mineralstoffversorgung der kleinen Nager und Ziervögel verbessern, was aber
aufgrund der zum Teil nur marginalen Gehalte dieser Produkte (häufig niedriger
als im Alleinfutter) nicht möglich ist. Insgesamt sind die hier untersuchten
Produkte wie folgt zu beurteilen:
- Produkte zur Ergänzung mit Mineralstoffen
Im Gegensatz zu anderen Tierarten, bei denen in der Ration allgemein 2%
Mineralfutter eingesetzt werden, müssten von den hier untersuchten
Produkten aufgrund der niedrigenden Mineralisierung deutlich höhere Anteile
in der Ration verwendet werden (Praktikabilität ?).
- Produkte zur Ergänzung mit Mineralstoffen und Vitaminen
Die Produkte wiesen häufig Imbalanzen auf, die keine entsprechende
Dosierung erlauben: z.B. Mineralstoffe bedarfsdeckend → Überdosierung bei
Vitaminen (und umgekehrt).
- Produkte zur Ergänzung mit Vitaminen
Die z.T. sehr hohen Vitamingehalte erlauben nur bedingt eine sichere
Dosierung. Aus den teilweise hohen Dosierungempfehlungen resultieren
Überversorgungen in der Ration, die bei sporadischem Einsatz als wenig
bedenklich, bei permanenter Gabe aber unnötig bzw. sogar risikoreich sind.
Auch wenn einige Produkte durchaus eine zufriedenstellende chemische
Zusammensetzung aufwiesen und somit eine sinnvolle Ergänzung der Ration
darstellen, muss bei den hier untersuchten Ergänzungsfuttermitteln bei einer
Vielzahl an deren ernährungsphysiologischem Wert gezweifelt werden.
371

Comparative study of some silicate mineral additives on rumen fermentation in vitro Baran, M., Váradyová, Z. Institute of Animal Physiology, Slovak Academy of Sciences, Košice, Slovakia
Introduction
Forages are often deficient in mineral elements. The increasing use of byproducts in ruminant
feeding may also result in a decrease of mineral supply. To achieve their production potential
ruminants must receive all the essential dietary nutrients at optimum amounts. Because of the
ability of bacteria to accumulate minerals, it is often not easy to show clearly the specific
requirement for a given element and large variations in the response to mineral additions are
observed in the fermentation processes. Mineral adsorbents based on the natural zeolite and
bentonite were used in animal diets in order to reduce ruminal ammonia (Stephenson et al.,
1992), to prevent a toxic effect of aflatoxin (Oguz et al., 2000; Abdel-Wahhab et al., 2002),
for their protective effect for rumen microorganism (Wallace and Newbold, 1991) and, also to
improve feed utilization and their potential contribution the trace element contents.
Material and methods
The study was performed in vitro with ruminal fluid inoculum obtained from two rumen
fistulated Merino sheep fed meadow hay ad libitum. Meadow hay, wheat straw, amorphous
cellulose and as well as barley were used as substrates and incubated with buffered rumen
fluid and additives in sealed fermentation bottles. The fermentation process and metering
system of gases and VFA was performed according to Váradyová et al., (1998). Zeolite,
bentonite, kaolin and granite were used as additives. Chemical analyses of individual silicates
were performed by standard analytical method – atomic absorption spectrometry on a Varian
spectrometer AA-30 apparatus (Varian, Australia).
372

Table 1
Production of gas, methane, VFA, A:P ratio and hydrogen recovery of meadow hay and
wheat straw incubated for 72 h with different additives
Meadow hay Control Zeolite Bentonite Kaolin Granite
Total gas (ml) 41.3 41.4 46.0* 38.3 46.2*
Methane (10-2 ml/ml) 4.9 5.5 4.9 5.2 4.3
Total VFA (mM) 54.0 52.2 53.0 52.5 61.3
Acetate (mol%) 65.7 64.7 69.2*** 65.5 67.9***
Propionate (mol%) 20.7 21.3 19.0*** 20.6 18.6***
n-Butyrate (mol%) 9.1 9.2 8.0*** 9.2 8.1***
Iso-Butyrate (mol%) 1.1 1.1 1.1 1.1 2.6
n-Valerate (mol%) 1.7 1.8 1.2*** 1.7 1.1***
Iso-Valerate (mol%) 1.6 1.7 1.5** 1.7 1.9***
n-Caproate (mol%) 0.2 0.1** 0.1** 0.2 0.0***
A:P ratio 3.2 3.1 3.6 3.2 3.6
H2 – recovery (%) 44.1 44.7 40.7*** 45.1 39.4***
Wheat straw
Total gas (ml) 29.7 38.3*** 36.7*** 36.3*** 38.3***
Methane (10-2 ml/ml) 5.1 5.4 4.6 5.0 4.2*
Total VFA (mM) 48.0 47.1 44.5 48.9 55.4
Acetate (mol%) 64.6 65.8* 66.8*** 64.9 66.7***
Propionate (mol%) 22.0 21.5 21.5 22.2 19.3***
n-Butyrate (mol%) 9.3 8.5 8.4** 9.0 8.2***
Iso-Butyrate (mol%) 1.0 1.4 1.0 1.0 3.1***
n-Valerate (mol%) 1.5 1.3 1.0 1.5 0.9
Iso-Valerate (mol%) 1.4 1.5 1.3*** 1.3*** 1.9***
n-Caproate (mol%) 0.1 0.03* 0.1 0.1 0.01*
A:P ratio 2.7 3.1 3.2 3.0 3.5
H2 – recovery (%) 46.2 45.4 42.9*** 45.8 40.1***
*p<0.05; **p<0.01; ***p<0.001 differences from control; acetate:propionate ratio (A:P)
373
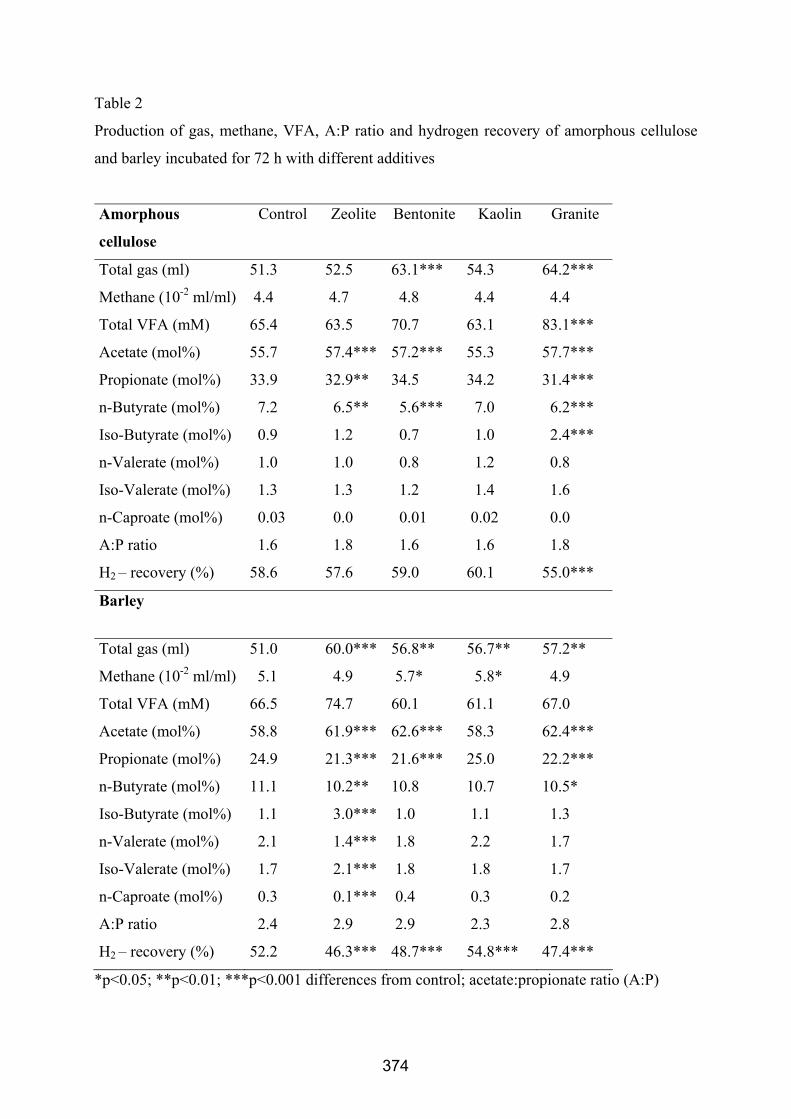
Table 2
Production of gas, methane, VFA, A:P ratio and hydrogen recovery of amorphous cellulose
and barley incubated for 72 h with different additives
Amorphous
cellulose
Control Zeolite Bentonite Kaolin Granite
Total gas (ml) 51.3 52.5 63.1*** 54.3 64.2***
Methane (10-2 ml/ml) 4.4 4.7 4.8 4.4 4.4
Total VFA (mM) 65.4 63.5 70.7 63.1 83.1***
Acetate (mol%) 55.7 57.4*** 57.2*** 55.3 57.7***
Propionate (mol%) 33.9 32.9** 34.5 34.2 31.4***
n-Butyrate (mol%) 7.2 6.5** 5.6*** 7.0 6.2***
Iso-Butyrate (mol%) 0.9 1.2 0.7 1.0 2.4***
n-Valerate (mol%) 1.0 1.0 0.8 1.2 0.8
Iso-Valerate (mol%) 1.3 1.3 1.2 1.4 1.6
n-Caproate (mol%) 0.03 0.0 0.01 0.02 0.0
A:P ratio 1.6 1.8 1.6 1.6 1.8
H2 – recovery (%) 58.6 57.6 59.0 60.1 55.0***
Barley
Total gas (ml) 51.0 60.0*** 56.8** 56.7** 57.2**
Methane (10-2 ml/ml) 5.1 4.9 5.7* 5.8* 4.9
Total VFA (mM) 66.5 74.7 60.1 61.1 67.0
Acetate (mol%) 58.8 61.9*** 62.6*** 58.3 62.4***
Propionate (mol%) 24.9 21.3*** 21.6*** 25.0 22.2***
n-Butyrate (mol%) 11.1 10.2** 10.8 10.7 10.5*
Iso-Butyrate (mol%) 1.1 3.0*** 1.0 1.1 1.3
n-Valerate (mol%) 2.1 1.4*** 1.8 2.2 1.7
Iso-Valerate (mol%) 1.7 2.1*** 1.8 1.8 1.7
n-Caproate (mol%) 0.3 0.1*** 0.4 0.3 0.2
A:P ratio 2.4 2.9 2.9 2.3 2.8
H2 – recovery (%) 52.2 46.3*** 48.7*** 54.8*** 47.4***
*p<0.05; **p<0.01; ***p<0.001 differences from control; acetate:propionate ratio (A:P)
374

Results and discussion
Decrease in the methane production was observed only in wheat straw with granite. The
hydrogen recovery was decreased by silicate additives and yielded no more hydrogen
recovery than 45.7 % for meadow hay with zeolite, 45.8 % for wheat straw with kaolin, 60.1
% for amorphous cellulose with kaolin and 54.8 % for barley with kaolin. The total gas
production was significantly in some cases higher compared to control. Concluding the results
of this study, total and individual VFA, gas production and hydrogen recovery were
significantly influenced by silicate minerals. The results from our in vitro experiment
confirmed that selected silicate minerals cannot be regarded entirely suitable for decreasing of
methane production. It is known that some of them can improve feed utilization, but little
information is known about their mineral factors. From this points of view the using of
silicate additives to support the microbial metabolism by influencing (bentonite, granite) and
slightly influencing (zeolite, kaolin) of the rumen fermentation can be useful in the
agricultural practice.
Summary
The silicate minerals cannot be used to cover the main minerals (e.g. Ca, P, Mg, Mn) in
sheep, but some of them can be used as a potential contributor the trace elements. The
objective of the present experiment was to determine the effects of addition of silicate
minerals, zeolite, bentonite, kaolin, granite on the rumen fermentation parameters sheep in
vitro. According to our results the silicate minerals had no appreciable effect on the methane
production, but they support the microbial metabolism by influencing (bentonite, granite) and
slightly influencing (zeolite, kaoline) the rumen fermentation.
Literature
Abdel-Wahhab, M.A., S.A. Nada, F.A. Khalil (2002): Anim. Feed Sci. Technol. 97, 209-219.
Oguz, H., V. Kurtoglu, B. Coskun (2000): Res. Vet. Sci. 69, 197-201.
Stephenson, R.G.A., J.L. Huff, G. Krebs, C.J. Howitt (1992): Aust. J. Agr. Res. 43, 301-314.
Váradyová, Z., I. Zeleňák, P. Siroka (1998): Arch. Anim. Nutr. 51, 319-326.
Wallace, R.J., C.J. Newbold (1991): Effects of bentonite on fermentation in the rumen
simulation technique (Rusitec) and on rumen ciliate protozoa. J. Agric. Sci. 116, 163-168.
375

Untersuchungen zum Einfluss von Seltenen Erden auf das Wachstum und die Ganzkörperzusammensetzung von Broilern Halle, I.1, Fleckenstein, J. 2, Hu, Zheng Yi2, Flachowsky, G. 1, Schnug, E.2 1Institut für Tierernährung, 2Institut für Pflanzenernährung und Bodenkunde, Bundesforschungsanstalt für Landwirtschaft (FAL) Bundesallee 50, 38116 Braunschweig, Germany Einleitung Die größten Weltvorräte an Seltenerz-Erden liegen mit über 80 % in China. Neben
der Anwendung von Seltenen Erden ("rare earth“ - RE) in der Metallurgie,
Ölindustrie, chemischen Industrie, Glas- und Keramikindustrie und Elektronik werden
sie im Herkunftsland in der Landwirtschaft als Düngerzusatz und als Futterzusatzstoff
für verschiedene Tierarten verwendet (Richter, 1996). In China durchgeführte
Untersuchungen zur Wirkung der Supplementierung von Seltenen Erden zum
Mastfutter bei Schwein und Geflügel sowie zum Futter von Legehenne und
Zuchthenne wiesen wesentliche Leistungssteigerungen nach. Rambeck et al. (1999),
konnte erstmals unter westlichen Haltungs- und Fütterungsbedingungen an
wachsenden Schweinen den leistungsfördernden Effekt der Seltenen Erden zeigen.
Die Wirkung der Seltenen Erden als Leistungsförderer beim Geflügel wurde von
Schuller (2001) an wachsenden Broilern und Wachteln während der Aufzucht und in
der Legeperiode geprüft. In den Untersuchungen konnte kein gesicherter Einfluss auf
die Leistungsmerkmale sowie die Zusammensetzung der Mikroorganismengruppen
des Intestinaltraktes ermittelt werden.
Das Ziel dieser Untersuchungen bestand darin den Einfluss von drei Seltenerd-
Präparaten als Ascorbat, Citrat und Nitrat, die aus dem China Rare Earth Center for
Agriculture stammten, sowie ein gereinigtes Lanthan-Chlorid, als leistungsfördernde
Zusatzstoffe an einer schnell wachsenden Broilerherkunft zu prüfen.
Material und Methoden Für den Versuch 1 wurden 308 und für den Versuch 2 320 männliche Broiler
(Lohmann Meat) als Eintagsküken in eine Käfigmastanlage eingestallt. Die
Prüfperiode umfasste 35 Tage. Im Versuch 1 wurden jeder Versuchsgruppe 6 Käfige
und der Kontrolle 10 Käfige mit je 7 Tieren zugeteilt. Im Versuch 2 gehörten zu jeder
Gruppe 10 Käfige mit 8 Broilerküken. Am Ende des Versuches 1 wurden 10 Broiler
der Kontrolle und 6 Broiler jeder Versuchsgruppe geschlachtet und die Masse an
376

Brust- und Oberschenkelmuskel, Organen, und Abdominalfett ermittelt. Der Gehalt
an Seltenen Erden wurde im Versuch 1 im Abdominalfett, Brusthaut, Brustmuskel,
Leber, Herz ermittelt. Die Zusammensetzung der Futtermischungen und der
Seltenen Erden des Versuches 1 ist aus Tabelle 1 abzulesen. Das Mastfutter jeder
Versuchsgruppe wurde so kalkuliert, dass 100 mg Cer (Ce) plus Lanthan (La) pro kg
Futter enthalten waren. Da die Supplementierung des Zusatzstoffes RE-Nitrat im
Versuch 1 die geprüften Leistungsmerkmale der Broiler im Vergleich zur Kontrolle
nicht wesentlich veränderte, wurde dieses Präparat im Versuch 2 nicht noch einmal
geprüft, sondern als eine weitere Kontrolle Sorbinsäure in einer Konzentration von
0,5 % eingesetzt. Die statistische Auswertung der Merkmale erfolgte unter
Verwendung des Programmpaketes SAS 6.12. Der Mittelwertvergleich wurde mit
dem LSD-Test mit einer Irrtumswahrscheinlichkeit von P<0,05 durchgeführt.
Tabelle 1: Zusammensetzung und wertbestimmende Inhaltsstoffe der
Futtermischungen - Versuch 1 (g/kg)
Gruppe
Zusammensetzung
Kontrolle RE-
Ascorbat
RE-Citrat RE-Nitrat Lanthan-
Chlorid
Weizen/Mais 553 552,6 552,6 552,6 552,6
Sojaöl 29 29 29 29 29
Soja 372,5 372,5 372,5 372,5 372,5
Mineralstoffe/Vitamine 38,9 38,9 38,9 38,9 38,9
Methionin/Lysin 4,1 4,1 4,1 4,1 4,1
RE-Ascorbat - 0,395 - - -
RE-Citrat - - 0,394 - -
RE-Nitrat - - - 0,295 -
Lanthan-Chlorid - - - 0,225
Trockensubstanz 897 897 899 899 896
Rohprotein 213 206 209 206 202
ME (MJ/kg) 12,80 12,80 12,80 12,80 12,80
Ergebnisse Die Ergebnisse der beiden Wachstumsversuche sind aus der Tabelle 2 abzulesen.
Das Leistungsniveau in dem Broilermastversuch 1 war höher als im Versuch 2 und
die Mastendmassen nach 35 Tagen um 5 – 10 % besser. Die Futteraufnahme im
377

Versuch 2 der Broiler, deren Futtermischungen mit Seltenen Erden angereichert
waren, lag im Mittel der 35 Masttage unter der Futteraufnahme der Broiler im
Versuch 1. Resultierend daraus war die tägliche Lebendtagszunahme geringer und
ebenso die Mastendmassen. So verbesserte die Supplementierung von RE-Ascorbat
im Versuch 1 die Mastendmasse der Broiler um 7 % im Vergleich zur Kontrolle,
dagegen im Versuch 2 nur um 3 %. Auch die Anreicherung des Mastfutters mit RE-
Citrat und Lanthan-Chlorid erhöhte im Versuch 1 gesichert (P<0,05) die
Lebendmassen der Broiler am Versuchsende.
Tabelle 2: Ergebnisse der Wachstumsversuche an Broilern über 35 Tage
(Mittelwert +Standardabweichung)
Versuch 1
Kontrolle RE-Ascorbat RE-Citrat RE-Nitrat Lanthan-Chlorid
Futteraufnahme, g/Broiler/Tag
1.-35.Tag 87,6 b +4 92,8 a +2 92,5 a +3 90,1 ab +3 90,0 ab +6
Mastendmasse, g/Broiler
35. Tag 2024 c
+229
2169 a
+163
2157 ab
+159
2074 bc
+246
2124 ab
+184
Futteraufwand, kg/kg
1.-35.Tag 1,480 a
+0,03
1,442 b
+0,03
1,464 ab
+0,02
1,497 a
+0,03
1,472 ab
+0,02
Versuch 2
Kontrolle Kontrolle
Sorbinsäure
RE-
Ascorbat
RE-Citrat Lanthan-Chlorid
Futteraufnahme, g/Broiler/Tag
1.-35.Tag 91,2 a +5 90,9 a +3 88,7 ab +4 86,7 ab +7 86,4 b +5
Mastendmasse, g/Broiler
35. Tag 1909 +270 1999 +230 1964 +221 1943 +243 1915 +279
Futteraufwand, kg/kg
1.-35.Tag 1,694 a
+0,071
1,622 b
+0,064
1,613 b
+0,050
1,588 b
+0,064
1,472 b
+0,020
a; b; c – signifikante Unterschiede zwischen den Gruppen bei einem Merkmal sind durch unterschiedliche kleine Buchstaben gekennzeichnet
378

Die Zugabe von RE-Nitrat verbesserte die Mastendmasse der Broiler im Vergleich
zur Kontrolle nicht. Der Futteraufwand im Versuch 1 war bei der Gruppe RE-Ascorbat
im Futter gesichert niedriger im Vergleich zur Kontrolle und der Versuchsgruppe RE-
Nitrat. Im Wiederholungsversuch war der Futteraufwand aller Versuchsgruppen
günstiger. Die Ausschlachtung der Broiler nach Beendigung des 1. Versuches ergab
nur im Anteil der Leber am Gesamtkörper signifikante Unterschiede zwischen den
Gruppen. Bis zu einer Nachweisgrenze von 10 ppb konnte mit der gewählten
Analysentechnik keine Anreicherung der Seltenen Erden in den tierischen Produkten
nachgewiesen werden.
Schlussfolgerungen Die Ergebnisse lassen die Schlussfolgerung zu, dass insbesondere das Seltene
Erden Präparat RE-Ascorbat das Wachstum von Broilern als auch den
Futteraufwand positiv beeinflussen kann.
Summary Studies on the effect of Rare Earth products on growth performance and on carcass quality of broiler chickens More than 80 % of the world reserves of Rare Earth (RE) are deposited in China. Various Chinese studies showed that products of RE compounds significantly improved the growth of broiler chickens or pigs. The present two studies were focused on the observation of the growth performance of male growing broiler chickens in dependence on RE feeding. In Experiment 1, RE-ascorbate and RE-citrate showed clear growth promoting effects. The broilers’ body weights at 35 days of age were 5 -7 % heavier and the feed conversion 1 - 3 % improved (P<0.05). In Experiment 2 only feed conversion was significantly improved. No effects on the carcass quality of broilers could be shown in Experiment 1. No accumulation of RE elements in muscles and organs was measured. Literatur Rambeck, W. A., He, M. L., Chang, J., Arnold, R., Henkelmann, R. Süß, A., 1999:
Possible role of Rare Earth Elements as growth promoters. In: Vitamine und Zusatzstoffe in der Ernährung von Mensch und Tier, 7. Symposium, Jena, 311-317
Richter, H., 1996: Die industrielle Produktion von Seltenen Erden in China. Erzmetall 49, 134-141
Schuller, S., 2001: Seltene Erden als Leistungsförderer beim Geflügel. Untersuchungen an Broilern und Japanischen Wachteln. Diss. Vet. Med., Tierärztliche Hochschule München
379

Copper Recommendations for Piglets Kessler J., Lavoyer R., Stoll, P. Swiss Federal Research Station for Animal Production, CH-1725 Posieux Switzerland (e-mail: [email protected])
The physiological dietary requirement of copper (Cu) for weaned piglets is of the
order of 6 mg per kg feed (~ 90% dry matter; BOLTSHAUSER et. al. 1993,
KIRCHGESSNER 1997, NRC 1998). A survey of the Cu content of commercial piglet
complete feed in Switzerland, conducted in the year 2000, showed values from 10 to
240 mg/kg. This result can be explained by the fact that the current recommendation
is considered to be too low. Often there is also an exaggerated safety margin. Last
but not least there is the wish to use higher levels in order to gain optimum benefit
from the growth-promoting effects of Cu.
With regard to the maintenance of land fertility as well as to the avoidance of Cu
deposits in the liver, which are undesirable for consumers, the Cu levels in piglet feed
should be oriented towards the physiological dietary requirement. Thus, the aim of
this experiment was to review and state more precisely the recommendation for Cu
for weaned piglets under normal husbandry and feeding conditions.
Materials and Methods 124 female and castrated male piglets of the Swiss large white pig with a live weight
at the beginning of the experiment of 9 kg received complete feed with differing Cu
concentrations for 35 days. The animals were weaned at the age of approximately
five weeks and were allocated in blocks to the following four treatments according to
descent, age, sex and live weight:
CON 5 mg Cu/kg complete feed with 88 % DM (native content) Cu10 10 mg Cu/kg complete feed with 88 % DM
Cu25 25 mg Cu/kg complete feed with 88 % DM
Cu90 90 mg Cu/kg complete feed with 88 % DM
The Cu supplement was given in the form of Cu sulphate. The experimental feed
consisted mainly of barley, wheat, whey powder and casein powder. The average
content of digestible energy was 13.9 MJ, while the protein content was 190 g per kg
380

complete feed with 88 % DM. The Zn content was 120 mg/kg complete feed. Neither
growth promoter nor phytase were used. Parameters for the experiment were the
health condition (judged according to a given scheme), the daily weight gain and the
feed conversion rate. A metabolic profile was also made. At the end of the
experiment, Cu, Fe and Zn in the liver and kidneys of 32 slaughtered piglets were
analysed. The concentrations of crude ash, Ca, P and Cu were measured in the
metacarpal bones. The bone density of the tibia was also determined. A further
parameter was the Cu concentration in the faeces.
Results and discussion The health condition of the 124 piglets in the experiment can be described as very
good. There were no mortalities to be reported. Only six animals needed to be
treated for diarrhoea and one for oedema.
There was no significant difference in the daily weight gain (Tab. 1) between the
piglets of the treatments Cu10, Cu25 and Cu90 (p < 0.05). This result corresponds to
the finding that, if the physiological dietary requirement is met, a growth-promoting
effect can be achieved only with a Cu supply of more than 100 mg/kg (NRC 1998).
The control animals showed a lower daily weight gain in comparison with the
treatments using Cu supplements. This means, that the native content of 5 mg Cu/kg
complete feed does not meet the dietary requirement. As to the feed conversion, no
significant difference between the four treatments could be measured. This result is
somewhat in contradiction to the EC's analysis of the literature (2003), which shows
an improvement in the feed conversion rate with increasing Cu supply.
The Cu supply did not significantly influence the metabolic profile. Therefore, there
were no biologically relevant differences in the blood parameters of haemoglobin,
copper, ceruloplasmin and superoxide dismutase. Compared to the other treatments,
the piglets of the treatment Cu90 had considerably higher concentrations of Cu in the
liver and kidneys (Tab. 1; p < 0.05). The experiments conducted by APGAR et al.
(1995) and JOINDREVILLE et al. (2002) show the same tendencies. The treatment
Cu90 also had the highest concentrations of Zn in the liver (p < 0.05). In contrast to
Cu and Zn, the Fe concentration in the liver of the piglets with 90 mg Cu/kg feed
tended to be lower.
381

A assessment based on the different bone parameters, such as density, content of
crude ash, Ca and P, shows that the quality of the skeleton is not significantly
influenced by different Cu supply (Tab. 1). There were no significant differences in
any of the measured parameters.
With the increase of Cu supply the Cu concentration in the faeces increased
significantly (y = 6.2709x + 20.426; R2=0.9991; Tab. 1). The studies conducted by
PABOEUF et al. (2000, 2001) confirm this result.
CON Cu10 Cu25 Cu90 sξ
Daily weight gain g 455a 491ab 489ab 502b 11
Feed conversion rate kg/kg 1.45 1.42 1.43 1.40 0.02
Liver
Copper mg/kg DM 30a 32a 23a 67b 5
Zinc mg/kg DM 145a 139 a 152 a 194 b 13
Iron mg/kg DM 200 200 157 78 -1
Kidneys
Copper mg/kg DM 12a 12a 14a 19b 1
Zinc mg/kg DM 97 ab 90 a 95 ab 98 b 2
Iron mg/kg DM 100 112 109 90 10
Bone density tibia mg/mm3 585 581 583 601 13
Metacarpus
Crude ash g/kg DM 501 488 479 493 7
Calcium g/kg DM 184 179 177 177 3
Phosphorus g/kg DM 87 85 85 85 1
Cu concentration faeces mg/kg DM 56a 82a 163b 581c 19 1 Not normally distributed parameter
Tab. 1. Results
382

Summary In an experiment with piglets the influence of 5, 10, 25 and 90 mg of Cu per kg complete feed with 88 % DM on health condition, daily weight gain, bone quality and selected metabolic parameters was examined. The results of the experiment show that 10 mg Cu/kg feed meet the Cu requirement of the piglet. The daily weight gain tends to be lower with a value of 5 mg Cu/kg feed. Values of 25 or 90 mg Cu/kg feed improve neither the daily weight gain nor the feed conversion rate. They do however lead to an increased elimination of Cu through the faeces and thus to a higher environmental load. In addition, an increased deposition of Cu and Zn in the liver can be observed when there is a value of 90 mg/kg feed, which is undesirable from the point of view of the consumer. References Apgar G A, Kornegay E T, Lindemann M D, Notter D R (1995): Evaluation of copper
sulfate and a copper lysine complex as growth promoters for weanling swine. J Anim Sci, 73, 2640-2646
Boltshauser M, Jost M, Kessler J, Stoll P (1995): Fütterungsempfehlungen und Nährwerttabellen für Schweine. Verlag LmZ. 129 S
EC (2003): Opinion of the scientific committee for animal nutrition on the use of copper in feedingstuffs. European Commission, Health and consumer protection directorate-general, 41 p.
Kirchgessner M (1997): Tierernährung. Verlags Union Agrar. 582 S Joindreville C, Revy P S, Jaffrezic A, Dourmad J Y (2002): Le cuivre dans
l’alimentation du porc : oligo-élément essentiel, facteur de croissance et risque potentiel pour l’homme et l’environnement. INRA Prod Anim, 15, 247 – 265
NRC (1998): Nutrient requirements of swine. National Academy Press, 189 p Paboeuf F, Nys Y, Corlouër A (2000): Réduction des rejets en cuivre et en zinc chez
le porc charcutier par la diminution de la supplémentation minérale. Journées Rech Porcine en France, 32, 59-66
Paboeuf F, Calvar C, Landrain B, Roy H (2001): Impacte de la réduction des niveaux alimentaires en matière azotée totale, en phosphore, en cuivre et en zinc sur les performances et les rejets des porcs charcutiers. Journées Rech Porcine en France, 33, 49-56
383

Effect of selenium and selenium-iodine supplementation on thyroid metabolism in nitrite fed rats Kostogrys, R. B.1, Pisulewski, P. M.1, Pecio, A.2, Sikora, E.1 1The Agricultural University of Krakow, Faculty of Food Science and Technology, Department of Human Nutrition, 29 Listopada 46, 31-425 Krakow 2The Jagiellonian University of Krakow, The Faculty of Biology and Earth Sciences, Department of Comparative Anatomy, Ingardena 6, 30-060 Krakow
The effect of nitrite (NaNO2), on the growth performance, serum thyroid hormone (fT4)
concentration and thyroid morphology was investigated. Simultaneously, the possible antigoitrogenic
effects of selenium and selenium-iodine supplementation have been studied.
Thirty male rats of Wistar strain, weighing initially 119 g were randomly divided into 5 groups
of 6 rats each and kept in individual digestibility cages. Experimental groups of rats were fed five
diets: I - AIN-93G diet (control), II - AIN-93G + Se (3,59 µg Na2Se04 /100g body mass), III - AIN-
93G + NO2 (25mg NaNO2 /100g body mass), IV - AIN-93G + NO2 (25mg NaNO2 /100g body mass) +
Se (3,59 µg Na2Se04 /100g body mass) and V - AIN-93G + NO2 (25mg NaNO2 /100g body mass) + Se
(3,59 µg Na2Se04 /100g body mass) + I (3,5 µg KIO3 /100g body mass). The feed intake was restricted
to 15g per day per rat.
Body mass of rats was monitored weekly. On d 18, the rats were anaesthetised and killed by
withdrawing blood from the heart by cardiac puncture. Thyroid glands were carefully removed. Serum
fT4 was determined using the LIA method. The thyroid glands were processed by the conventional
paraffin technique, sectioned at approximately 7µm, and stained with hematoxylin and eosin for
histological examination.
Compared to the control animals (I), the growth of rats was not affected by Se (II), NO2 (III),
NO2 + Se (IV) nor NO2 + Se + I (V) intake. Serum fT4 concentrations were reduced by NO2 (I -11,5
pmol/l vs. II-10,9 pmol/l vs. III-9,9 pmol/l, respectively). The histological examination of the thyroid
gland showed a series of morphological alterations resulting from NO2 administration (i.e. tall
follicular epithelial cells and reduced amount of colloid). The rats fed NO2 + Se diet (IV) had lower
fT4 concentrations (9,03 pmol/l). In addition, a series of morphological changes in thyroid glands were
observed. On the other hand, in the rats fed NO2 + Se + I diet (V), fT4 concentrations were comparable
(12,6 pmol/l) to those observed in the rats fed control diet (I). Equally, histological examination of
thyroid glands did not evidence any morfological effects of NO2 + Se + I diet (V).
Experimental results indicate, that dietary nitrite (NO2) impairs thyroid metabolism (fT4
secretion) in rats and leads to thyroid gland hypertrophy. In the nitrite-fed rats, Se has does not
alleviate goitrogenic effects of this ion (diet IV). In contrast, the apparent goitrogenic effects,
observed in the nitrite-fed rats, can be completely alleviated by Se + I diet (V).
384

The effect of dietary magnesium oxide supplementation on muscle energetic and calcium metabolism and meat quality of pigs Lahucky, R.1, Küchenmeister, U.2, Bahelka, I.1, Ender, K.2 1Research Institute of Animal Production, 949 92 Nitra, Slovak Republic 2Research Institute for the Biology of Farm Animals, D-18196 Dummerstorf, Germany Introduction
It was known magnesium directly depresses skeletal muscle activity by antagonism calcium. Using 31P NMR spectroscopy analysis in the biceps femoris, the Mg-fed pigs positively influenced muscle energetic metabolism (Moesgard et al., 1993). Research has shown that Mg-supplementation (alone) may have beneficial effects on the behaviour (Kuhn et al., 1981), stress response (Kaemmerer, Kietzmann, 1984, Ludvigsen, 1985, D’Souza et al., 1998) and meat quality (Schaefer et al., 1993, D’Souza et al., 1999) of swine. Recently published data (Hamilton et al., 2002) suggest an inconsistent effect of short-term feeding of magnesium sulfate on muscle color and drip loss in pigs with both Low (normal) and High GP (glycolytic potential). The current study was carried out to further investigate the impact of short-term magnesium oxide supplementation prior to slaughter on muscle energetic and calcium metabolism and meat quality using heterozygous and normal on malignant hyperthermia (MH) pigs.
Material and methods A total of 24 pigs were used in the study. Barrows and gilts were balanced and tested by DNA probe (Fujii et al., 1991) on MH (mutation in RYR1 gene encoding calcium release chanel of sarcoplasmic reticulum – CRC). The pigs were devided into two groups each group comprising 12 pigs (6 heterozygotes, monomutant-MON and 6 normal, nonmutant-NON on MH). Animals were housed in the environmentally controlled facilities of the institute (RIAP) and penned in pairs. Pigs in Mg-diet treatments were fed 3 kg of control diet supplemented with Magnesium Oxide (80 % MgO, Neuber-Chemika, Biofaktors, Slovakia) at a level to supply 3.6 g additional magnesium per pig per day based on a fixed level of feeding kg per pig per day for 5 days prior to slaughter. The animals were slaughtered at 105 ± 5 kg live weight and stunned electrically. Blood samples (4 ml) were collected at the time of exsanguination in blood collection tubes to determine calcium and magnesium concentrations (atomic absorbtion, Unicam). A sample of 0.5 g taken at 0 h and 45 min post slaughter were immediately homogenized in 9 volumes of ice-cold 100 mM KCl (buffered with 20 mM HEPES, pH 7.2) using a glass/glass homogeniser and then filtered through 2 layers of cloth. Filtrates were frozen in Eppendorf tubes in liquid nitrogen and transported (at –700C) to FBN Dummerstorf, Germany for further analysis.
Ca2+ uptake by homogenates were initiated by addition of 20 µl of the homogenised samples to 0.5 ml of a medium described by Küchenmeister et al. (1999). The Ca2+ uptake was measured at 300C with a selective minielectrode at conditions and the data acquisition system described by Küchenmeister et al. (1999). Ca2+ ATPase activity of the homogenates were measured spectrophotometrically with a coupled enzyme assay at 370C by a modified method as further described by Küchenmeister et al. (1999). Phosphorus nuclear magnetic resonance (31P NMR) spectroscopy measurements of muscle samples taken 15 min post mortem were recorded at 121 MHz on a VXR 300 (Varian).
385

At 45 min after death the pH (portable pH meter, model 3071, Jenway, England) was directly determined in the longissimus dorsi (13th and 14th rib) using a combined glass electrode (P19/BNC). The day after slaughter (24 h) drip loss (Honikel, 1998) were also measured. The levels of the individual phosphorus compounds (sugar phosphate-SP, inorganic phosphate-Pi, phosphocreatine-PCr, adenosinetriphosphate-ATP) were expressed in percentage of the total content of phosphorus compounds. The statistical analyses included the effects MH genotype and treatment. Statistical significance was evaluated using Student’s test.
3. Results and discussion Plasma calcium and magnesium concentrations are presented in Table 1. Plasma magnesium concentrations were higher (P<0.05) in pigs fed the MgO. Increases in plasma magnesium concentrations in pigs fed the diet supplemented with MgO in this experiment (10%) were comparable with results introduced by D‘Souza et al. (1999 Table 1 The effect of dietary magnesium oxide (MgO) supplementation on plasma calcium and magnesium concentration at slaughter Item Control MgO Significance Mean S.D. Mean S.D Calcium, mg/L 24.9 1.268 24.6 1.062 - Magnesium, mg/L 8.5a 1.020 9.4b 0.964 *
Within a row means with different superscript letter differ (P<0.05) Breakdown of PCr (Table 2) was higher in the control group and differences between groups were significant (P<0.05). Reduced PCr break down (slows down PCr decay, higher level of index PCr/Pi – 0.193 vs. 0.101) was found also by Moesgaard et al. (1993) in pigs supplemented with MgO. Table 2. The effect of dietary magnesium oxide (MgO) supplementation on 31P NMR spectroscopy parameters of longissimus dorsi muscle (15 min post mortem)
Item Control MgO Significance MON NON Total MON NON Total Pi Mean 25.43 23.79 24.61 25.57 19.38 22.48 - S.D. 4.41 6.66 5.78 6.56 3.69 5.49 PCr Mean 1.54a 3.46 2.50a 2.89 5.80b 4.34b * S.D. 0.62 1.66 1.39 0.97 2.17 2.12 ATP Mean 8.37 11.16 9.77 10.56 11.03 10.79 - S.D. 2.06 2.65 2.57 2.31 1.37 1.85
Within a row means with different superscript letter differ (P<0.05) The effect of dietary MgO supplementation on the rate of Ca2+ uptake and Ca2+ ATPase activity of longissimus dorsi muscle homogenates (sampled 0 h and 45 min post mortem) of heterozygous and normal on MH pigs is shown in Table 3.
386

Table 3 The effect of dietary magnesium oxide (MgO) supplementation on rate of Ca2+ uptake (nM Ca2+/min x mg homogenate protein) and Ca2+ ATPase activity (nM/min x mg homogenate protein) of longissimus dorsi muscle
Item Control MgO Significance MON NON Total MON NON Total Ca2+ uptake 0 h Mean 79.80 97.30 88.60 82.60 144.10 113.40 - S.D. 21.80 28.80 26.00 52.00 42.90 55.68 45 min Mean 60.20a 70.30a 65.20a 65.30a 145.30b 105.30 * S.D. 28.10 26.00 26.34 40.40 24.20 52.46 Ca2+ ATPase 0 h Mean 97.7 99.1 98.4 90.3 112.8 101.6 - S.D. 31.3 27.9 28.1 31.5 25.1 29.6 45 min Mean 67.8a 108.1 88.0 103.3 129.9b 116.6 * S.D. 43.2 39.4 44.7 37.2 11.9 29.7
Within a row means with different superscript letter differ (P<0.05)
Our results on Ca2+ uptake (Table 3) are in general comparable with results of Küchenmeister et al. (1999, 2000) for basic CRC for MH sensitive and MH resistant pigs but the differences between control and MgO supplemented pigs are evident at 0 h with increasing differences with ongoing time (45 min) especially when compared normal on MH pigs (P<0.05). The activity of the Ca2+ ATPase showed comparable results (Tab 3) but significant differences (P<0.05) were received only between normal on MH with MgO supplemented and heterozygous on MH control pigs in 45 min post mortem homogenates of longissimus dorsi samples. Owen et al. (1997) have provided evidence of an abnormality in the level of Mg2+
inhibition of Ca2+ release in muscle of MHS pigs, and this abnormality seems likely to be also important in the development of the MH syndrome. It seems MgO supplementation positively influenced Ca2+ uptake and partially Ca2+ ATPase in both heterozygous but mainly in normal on MH pigs. Pigs that were fed the MgO supplemented diet (Table 4) had higher muscle pH compared to pigs fed the control diet. Significant differences (P<0.05) were obtained between control heterozygous and both normal (NON) and heterozygous (MON) with MgO supplemented pigs. The LT of pigs fed diets supplemented with magnesium had lower percentage drip loss compared to pigs fed the control diet. Significant differences (P<0.05) were found between heterozygote (MON) and total pigs which is in agreement with other results (Schaefer et al., 1993 and D’Souza et al., 1998, 1999, Hamilton et al., 2002). Reduced drip loss would be beneficial for reducing exudative muscle attributes of PSE pork. Table 4 The effect of dietary magnesium oxide (MgO) supplementation on meat quality traits of longissimus dorsi muscle Item Control MON NON Total
MgO Significance MON NON Total
pH 45 min Mean 6.19a 6.49b 6.34 S.D. 0.02 0.06 0.22 Drip loss 24 h, % Mean 6.22a 4.82bc 5.52ac S.D. 0.75 1.56 0.90
6.42b 6.56b 6.50b * 0.11 0.21 0.18 5.02bc 4.34b 4.68b * 0.43 1.06 0.90
Within a row means with different superscript letter differ (P<0.05)
387

In conclusion this tstudy suggest that a short term diet supplementation with MgO may stabilize or even improve meat quality. Summary The current study was carried out to further investigate the impact of short-term magnesium oxide supplementation prior to slaughter on muscle energetic and calcium metabolism and meat of pigs.Twenty-four crossbred pigs were tested by DNA probe (mutation on ryanodine receptor-RYR1 gene, malignant hyperthermia-MH). The pigs were fed finisher feed (control group) or finisher feed supplemented with magnesium (3.6 g MgO per pig per day) for 5 days prior to slaughter. Pigs fed the diet supplemented with MgO had higher (P<0.05) plasma Mg concentration. Phosphorus nuclear magnetic resonance (31P NMR) measurements on post mortem ( 15 min) muscle (longissimus dorsi) samples showed higher (P<0.05) phosphocreatine in pigs fed with MgO. Significant difference (P<0.05) in Ca2+ uptake and Ca2+ ATPase activity of the homogenised muscle (longissimus dorsi) samples (taken 45 min post mortem) were received between normal on MH pigs supplemented with MgO and heterozygotes control pigs. Pigs that were fed the MgO supplemented diet had higher pH (45 min post mortem) and lower (P<0.05) percentage of drip loss. Reference D´Souza, D. N., Warner, R. D., Leury, B. J., and Dunshea, F. R. (1998). Journal of Animal Science, 76, 104-109. D´Souza, D. N., Warner, R. D., Dunshea, F. R., Leury, B. J. (1999).. Meat Science, 51, 221-225. Fujii, J., Otsu, K., Zorzato, F., De Leon S., Khanna, V. K., Weiler, J., O´Brien, P.J., McLennan, D. H. (1991). Science (Washington DC), 253, 448-451. Hamilton, D. N., Ellis, M., Hemann, M. D., McKeith, F. K., Miller, K. D., Purser, K. W. (2002). Journal of Animal Science, 80, 1586-1592. Honikel, K. O. (1998). Meat Science, 49, (4), 447-457. Kaemmerer, K., Kietzmann, M., Kreizner, M. (1984).. Zentralblatt Veterinär Medezine, 31, 321-333. Küchenmeister, U., Kuhn, G., Wegner, J., Nürnberg, G. and K. Ender (1999). Molecular and Cellular Biochemistry, 195, 37-46. Küchenmeister, U., Kuhn, G., K. Ender (2000). Meat Science, 55, 239-245. Kuhn, G., Nowak, A., Otto, E., Albrecht, V., Gassmann, B., Sandner, E., Przybilski, H., Zahn, L. (1981). Archiv für Tierzucht, Berlin 24, 217-225. Ludvigsen, J. B. (1985).. EAAP publication No. 55 , 106-118. Moesgaard, B., Larsen, E.I., Quistorff, B., Therkelsen, I., Grosfjeld Ch.V., Jorgensen, P.F. (1993). Acta Veterinaria Scandinavica, 34, 397-404. Owen, V. J., Taske, N. L., Lamb, G. D. (1997). American Journal of Physiology, 272, C203-C211.
388

Creatine kinase activity may not always reflect selenium deficiency in laying hens Zuberbuehler, C.A., Messikommer, R.E., Arnold, M.M., Wenk, C. Institute of Animal Sciences, ETH Zentrum, CH-8092 Zurich, Switzerland
Introduction Inadequate selenium (Se) supply in combination with low vitamin E status is known
to cause severe deficiency symptoms including nutritional myopathy (NMP) in many
species. The activity of creatine kinase (CK) is increased in Se-deficient vertebrates
compared to Se-adequate and Se-supplemented animals (1-3). Because CK activity
is highly correlated to muscle damage, a plasma CK activity increase in conjunction
with low selenium and/or low vitamin E status are usually the key elements in the
diagnosis of NMP. In addition, a strong inverse relationship between the activities of
CK and glutathione peroxidase (GPx) has been observed in sheep (4).
The present report discusses two hypotheses explaining the lack of expected
alterations of CK activity in the plasma of laying hens in response to Se-depletion
and Se-repletion by choice-feeding.
Material and Methods Fifty-six laying hens (ISA Brown) were housed individually in wire cages. Three
experimental diets (Low-Se (L): 71 ppb Se, Medium-Se (M): 207 ppb Se, High-Se
(H): 1500 ppb Se) were prepared by adding graded amounts of Se-yeast (Sel-Plex
50, Alltech Inc., Nicholasville, KY) to a basal diet. Diets were offered ad libitum in two
identical feed troughs.
The study consisted of two identical consecutive parts. Part I started when the hens
were 21 weeks old. After six weeks baseline adaptation period with the Medium-Se
diet for all hens, nine weeks depletion period followed during which half the hens
received Low-Se diet whereas the other half continued to receive Medium-Se diet.
Finally, during six weeks choice feeding period both groups were divided into three
subgroups, each of which was offered two different diets simultaneously. These were
either Low-Se and Medium-Se (LM), or Medium-Se and High-Se (MH), or Low-Se
and High-Se (LH). The experiment was repeated immediately (part II) with the same
hens and treatments. In order to avoid as much distress as possible during blood
collection, different holding positions of the hens were tested prior to the study
389

(unpublished data). Hens held by their legs in a dorsal position (Picture 1) were found
to be the least distressed. Blood was collected in week six and every three weeks
thereafter from the main wing vein using a catheter-like construction according to the
“butterfly principle”, consisting of a multiple sampling adapter connected to the tip of
a cannula by an extension tube. Depending on individual blood flow the duration of
the procedure varied between 2 to 4 minutes. The concentration of Se was
determined in blood
serum (SSe) by ICP-
MS. Enzyme activity
was determined photo-
metrically in plasma
after anticoagulating
the blood with EDTA
for CK or heparin for
GPx, respectively
using a COBAS MIRA
autoanalyzer with
commercial test kits. Picture 1: Holding position during the blood collections.
Results and Discussion Hens fed the Low-Se diet during the depletion periods displayed a significant gradual
decrease of both the SSe concentration and plasma GPx activity confirming Se-
deficiency. Moreover, Se-repletion by choice feeding resulted in a significant increase
of both, the SSe concentration and GPx activity with each diet combination except
with LM.
Because the activity of CK is consistently found to be increased in the blood of Se-
deficient vertebrates including chickens, rats, sheep and lambs compared to Se-
adequate and Se-supplemented animals (1-3), we expected a similar CK response in
our study. However, over and above we did not observe a treatment effect on the
plasma activity of CK, neither by Se-depletion nor by Se-repletion (overall mean =
635 +/- 239 U/L, overall coefficient of variation = 38 %). Within group variations in CK
activity were very large.
A strong inverse relationship between the activities of CK and GPx has been
described in sheep (4), which led to the suggestion that a decrease to a critical level
390

in the activity of GPx could cause slight sub-clinical peroxidative damage to muscle
cell membranes increasing their permeability. Consequently CK would leak into the
blood stream resulting in a rise in CK activity. However, cellular dystrophy of any
etiology leads to the release of enzymes from damaged cells into the blood stream.
Although we found impressive treatment effects on the activity of GPx the very large
variations in CK activity possibly concealed a probable response of CK to the
changes in Se status. In line with our observations other researchers have also
noticed considerable variations in the activity of CK in Se-deficient sheep, chicks and
guinea pigs (5 - 8).
Bearing these inconsistent effects in mind, some reservations have been expressed
over the use of CK as an indicator of muscular disorders (5). It has been suggested
that the wide fluctuations of enzyme activities together with the coexistence of
degenerating and regenerating fibers in affected muscles are indications of the
episodic nature of nutritional myopathy in sheep (6). In the situation of marginal Se
deficiency, like in our study, the idea of episodic occurrence of nutritional myopathy,
where self-healing processes may be counteracting the destructive ones
concomitantly, resulting in large individual fluctuations in CK activity (and probably in
other parameters as well) seems a very convincing explanation. Considering the
above, CK activity is expected to cover a much wider range in Se-deficient hens than
in Se-adequate ones reflecting in the former the coexistence of already affected hens
next to healthy ones together with some on the borderline in between. In our study,
however, the variations in CK activity of the hens fed the Low-Se diet were in fact
smaller during the first depletion period but larger during the second allowing no
definite interpretation. In fact, this first hypothesis actually disqualifies CK activity for
monitoring marginal Se-deficiency.
On the other hand it has been reported that routine animal handling procedures can
cause marked changes in blood chemistry in rats (9). It was hypothesized that less
muscle was traumatized when lifting rats by the base of the tail than when holding
them behind the front legs, because the latter handling method caused significantly
higher CK activities with larger variations than the former (9).
At the time when we tested the least distressing position of blood collection we did
not consider that other blood parameters might be affected by animal handling.
However, in the course of the 42 experimental weeks of our study several different
people were involved in holding the hens during the blood collections. In addition, the
391

duration of the procedure was highly variable. Therefore, various degrees of muscle
trauma due to individual grip strengths causing enzyme release varying over a wide
range offer just as plausible an explanation for the large variations seen in CK activity
measured in our study. If this second hypothesis holds true this problem may, in all
probability, occur only when the site of the blood collection is near the body part
where the animal is held. In small animals like hens or rats this cannot be avoided
easily. Consequently this requests modification of the blood collection method in
studies with laying hens because the method applied here may have caused highly
variable muscle cell damage and CK release in close proximity to the site of the
blood collection. In order to verify the validity of this hypothesis the applied method
could be compared to touch-free blood collection using an implanted catheter.
Summary No alterations in plasma CK activity were observed during the course of the
experiment, although Se-depletion with the Low-Se diet and Se-repletion with each
diet combination except with LM has been confirmed by significantly decreasing and
increasing, respectively the Se concentration in serum and GPx activity in plasma.
Within group variations in CK activity were very large. We hypothesize that because
several different people were involved in holding our hens during the blood
collections, various degrees of muscle trauma due to individual grip strengths
causing CK release varying over a wide range, seem very likely. Touch-free blood
collection using an implanted catheter may be used to avoid muscle cell damage and
verify the validity of this hypothesis in hens.
Literature 1. Thompson JN, Scott ML (1970): Journal of Nutrition, 100: 797-809 2. Tong WM, Wang F (1998): Metabolism: Clincal and Experimental, 47: 415-419 3. El-Neweehy TK, Abdel-Rahman HA, Al-Qarawi AA (2001): Small Ruminant Research,
41: 87-89 4. López Alonso M, Miranda M, Hernandez J, Castillo C, Ayala I, Benedito JL (1997):
Journal of Animal and Feed Science, 6: 343-351 5. Allen JG, Steele P, Masters HG, D’Antuono MF (1986): Australian Veterinary Journal,
63: 8–13 6. Smith GM, Fry JM, Allen JG, Costa ND (1994): Australian Veterinary Journal, 71, 12-17 7. Bartholomew A, Latshaw D, Swayne DE (1998): Biological Trace Element Research, 62:
7-16 8. Hill KE, Motley, AK, Li X, May JM, Burk RF (2001): Journal of Nutrition, 131: 1798-1802 9. Yerroum M, Braconnier F, Chariot P (1999): Muscle & Nerve, 22: 1119-112
392
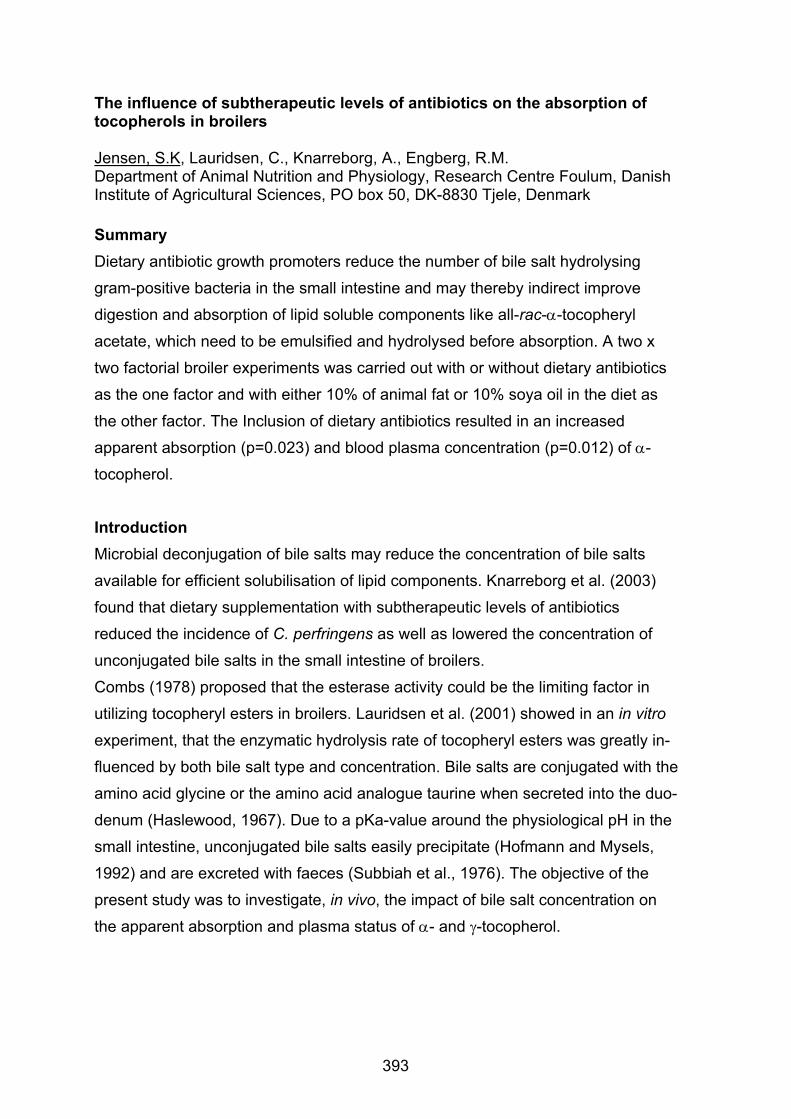
The influence of subtherapeutic levels of antibiotics on the absorption of tocopherols in broilers Jensen, S.K, Lauridsen, C., Knarreborg, A., Engberg, R.M. Department of Animal Nutrition and Physiology, Research Centre Foulum, Danish Institute of Agricultural Sciences, PO box 50, DK-8830 Tjele, Denmark
Summary Dietary antibiotic growth promoters reduce the number of bile salt hydrolysing
gram-positive bacteria in the small intestine and may thereby indirect improve
digestion and absorption of lipid soluble components like all-rac-α-tocopheryl
acetate, which need to be emulsified and hydrolysed before absorption. A two x
two factorial broiler experiments was carried out with or without dietary antibiotics
as the one factor and with either 10% of animal fat or 10% soya oil in the diet as
the other factor. The Inclusion of dietary antibiotics resulted in an increased
apparent absorption (p=0.023) and blood plasma concentration (p=0.012) of α-
tocopherol.
Introduction Microbial deconjugation of bile salts may reduce the concentration of bile salts
available for efficient solubilisation of lipid components. Knarreborg et al. (2003)
found that dietary supplementation with subtherapeutic levels of antibiotics
reduced the incidence of C. perfringens as well as lowered the concentration of
unconjugated bile salts in the small intestine of broilers.
Combs (1978) proposed that the esterase activity could be the limiting factor in
utilizing tocopheryl esters in broilers. Lauridsen et al. (2001) showed in an in vitro
experiment, that the enzymatic hydrolysis rate of tocopheryl esters was greatly in-
fluenced by both bile salt type and concentration. Bile salts are conjugated with the
amino acid glycine or the amino acid analogue taurine when secreted into the duo-
denum (Haslewood, 1967). Due to a pKa-value around the physiological pH in the
small intestine, unconjugated bile salts easily precipitate (Hofmann and Mysels,
1992) and are excreted with faeces (Subbiah et al., 1976). The objective of the
present study was to investigate, in vivo, the impact of bile salt concentration on
the apparent absorption and plasma status of α- and γ-tocopherol.
393

Materials and methods A total of 1600 day-old male broilers (Ross 208) were housed in 32 floor pens (50
animals per pen). The birds were fed a wheat-based mash supplemented with
either 10% of animal fat (A diet), which was a mixture of lard and tallow (1.5:1), or
10% soya oil (S diet). The total concentrations of α-tocopherol (mg/kg) were 56.3
and 58.4 in the ‘A’ and ‘S’diet, respectively. The total concentration of γ-tocopherol
(mg/kg) in the ‘A’diet was 18.2 and 85.3 in the ‘S’diet. Each diet was fed without (-)
or with (+) supplementation of antibiotics (salinomycin, 40 mg/kg feed and
avilamycin, 10 mg/kg feed). From each pen 16, 10, 8, and 6 animals were
randomly selected at d 7, 14, 21, and 35, respectively, and killed by cervical
dislocation. The small intestine was rapidly excised and divided at the Meckel’s
diverticulum. Contents from the proximal (duodenum and jejunum) and distal part
(ileum) were collected separately and pooled from all broilers within each pen at
each sampling time.
Bile salts were quantified by reversed-phase high performance liquid
chromatography (HPLC) with pulsed amperometric detection as outlined by
Dekker et al. (1991). Tocopherols were analysed by HPLC after saponification and
extraction into heptane as described by Jensen et al (1999).
Results The proportion of conjugated bile acids over unconjugated bile acids as well as the
total concentration of bile acids was highest in digesta from broilers fed dietary
antibiotics. The effects of dietary fat source and antibiotic supplementation on the
apparent ileal absorption of tocopherols are shown in Table 1. Regardless of
treatment, the absorption of α-tocopherol was on average higher in 21- and 35-
days old birds as compared to younger chickens. No effect of age was found on
the absorption of γ-tocopherol. The absorption of tocopherols, in particular, γ-
tocopherol, was significantly increased in birds fed soya oil as compared to birds
fed animal fat.
The absorption of α-tocopherol was significantly higher in broilers fed the
antibiotic-supplemented diets than in birds fed the non-supplemented diets. In
contrast, the absorption of γ-tocopherol was unaffected by the dietary
supplementation with antibiotics.
394
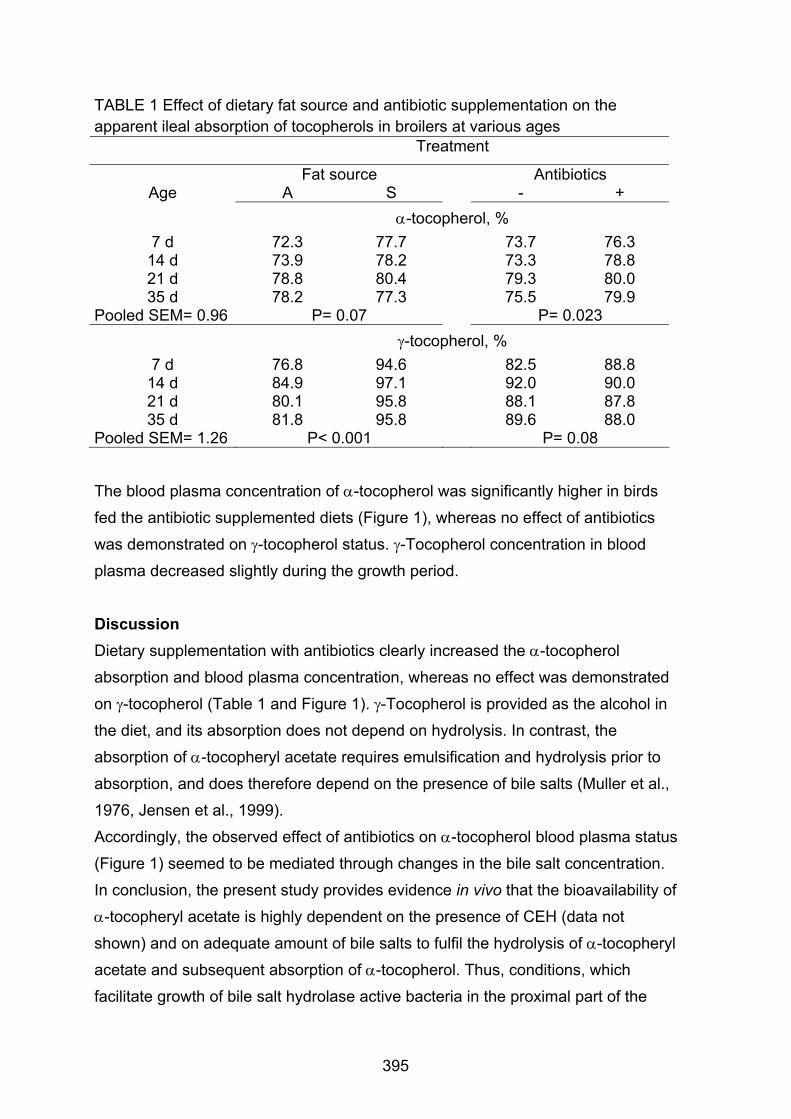
TABLE 1 Effect of dietary fat source and antibiotic supplementation on the apparent ileal absorption of tocopherols in broilers at various ages
Treatment
Fat source Antibiotics Age A S - +
α-tocopherol, % 7 d
14 d 21 d 35 d
72.3 73.9 78.8 78.2
77.7 78.2 80.4 77.3
73.7 73.3 79.3 75.5
76.3 78.8 80.0 79.9
Pooled SEM= 0.96 P= 0.07 P= 0.023 γ-tocopherol, %
7 d 14 d 21 d 35 d
76.8 84.9 80.1 81.8
94.6 97.1 95.8 95.8
82.5 92.0 88.1 89.6
88.8 90.0 87.8 88.0
Pooled SEM= 1.26 P< 0.001 P= 0.08
The blood plasma concentration of α-tocopherol was significantly higher in birds
fed the antibiotic supplemented diets (Figure 1), whereas no effect of antibiotics
was demonstrated on γ-tocopherol status. γ-Tocopherol concentration in blood
plasma decreased slightly during the growth period.
Discussion Dietary supplementation with antibiotics clearly increased the α-tocopherol
absorption and blood plasma concentration, whereas no effect was demonstrated
on γ-tocopherol (Table 1 and Figure 1). γ-Tocopherol is provided as the alcohol in
the diet, and its absorption does not depend on hydrolysis. In contrast, the
absorption of α-tocopheryl acetate requires emulsification and hydrolysis prior to
absorption, and does therefore depend on the presence of bile salts (Muller et al.,
1976, Jensen et al., 1999).
Accordingly, the observed effect of antibiotics on α-tocopherol blood plasma status
(Figure 1) seemed to be mediated through changes in the bile salt concentration.
In conclusion, the present study provides evidence in vivo that the bioavailability of
α-tocopheryl acetate is highly dependent on the presence of CEH (data not
shown) and on adequate amount of bile salts to fulfil the hydrolysis of α-tocopheryl
acetate and subsequent absorption of α-tocopherol. Thus, conditions, which
facilitate growth of bile salt hydrolase active bacteria in the proximal part of the
395

animal or human gut, will have negative influence on the bile salts and thereby on
formation of lipid micelles and activation of CEH. Consequently, the bioavailability
of α-tocopheryl acetate is decreased.
0
5
10
15
20
25
30
35
0 7 14 21 28 35
Toco
pher
ols, µm
ol/L
Age, d
FIGURE 1 Effect of dietary antibiotics on the concentration of α- (P= 0.01) and γ-tocopherol (P= 0.88) in blood plasma from broilers. Square symbols: α-tocopherols, circle symbols: γ-tocopherols. Solid symbols designate birds fed the diet supplemented with antibiotics and open symbols designate birds fed the non-supplemented diet. Values are least square means, n = 8.
References Dekker, R., van der Meer, R., &Olieman, C. (1999) Sensitive pulsed amperometric detection of free and conjugated bile acids in combination with gradient reversed-phase HPLC. Chromatogr 31: 549-553. Haslewood, G. A. D. (1967) In: Haslewood, G. A. D. (ed.) Bile salts, Methuen & CO LTD, London, pp. 82-109. Hofmann, A. F., & Mysels, K. J. (1992) Bile acid solubility and precipitation in vitro and in vivo: the role of conjugation, pH, and Ca2+ ions, J. Lipid Res. 33: 617-626. Jensen, S. K., R. M. Engberg & M. S. Hedemann. (1999) All-rac-α-tocopherol acetate is a better vitamin E source than all-rac-α-tocopherol succinate for broilers. J. Nutr. 129: 1355-1360. Knarreborg, A., Engberg, R. M., Jensen, S. K. & Jensen, B. B. (2002) Quantitative determination of bile salt hydrolase-activity in bacteria isolated from the small intestine of chickens. Appl. Environ. Microbiol. 68: 6425-6428. Knarreborg, A., Jensen, S. K. & Engberg, R. M. (2003) Pancreatic lipase activity as influenced by unconjugated bile acids and pH, measured in vitro and in vivo. J. Nutr. Biochem. 14: 259-265. Lauridsen, C., Hedemann, M.S. & Jensen, S.K. (2001) Hydrolysis of tocopheryl and retinyl esters by porcine carboxyl ester hydrolase is affected by the carboxyl moiety and bile acids. J Nutr. Biochem.12: 219-224. Subbiah, M. T. R., Tyler, N. E., Buscaglia, M. D., & Marai, L. (1976) Estimation of bile acid excretion in man: Comparison of isotopic turnover and fecal excretion methods. J. Lipid Res. 17: 78-84.
396

Effect dietary Mannanoligosaccharide in sow diets on Performance of Sows and Suckling Piglets Wirkung von Sauenrationen mit Mannanoligosacchariden auf die Sauen- und Ferkelleistung Spring, P.1, Geliot, P.2 , Newman, K.E.3 1 Swiss College of Agriculture, Länggasse, 3052 Zollikofen, Switzerland 2 Alltech Italy, Via Malta 2, Bologna, BO 40135, Italy 3 Venture Laboratories, 2301 Maggard Drive 105, Lexington, KY 40511, USA
Abstract Mannanoligosaccharide (MOS) derived from the cell wall of Saccharomyces cerevisiae has
been extensively tested in weaning piglets. However, until recently little information existed on
the use of MOS in sows. The purpose of a series of trials was to evaluate the effect of MOS
added to sow diets on the performance of the sow and its suckling piglets. Globally, five trials
with MOS in sows have been conducted. One trial was conducted under research conditions,
while the other 4 trials were conducted on commercial farms. The comparisons involved a total
of 2067 sows. MOS (Bio-Mos, Alltech Inc.) was fed during late gestation and during lactation at
levels of 5 to 10 g per sow and day. Number of piglets, birth weight, weaning weight and pre-
weaning mortality were determined. In addition, in 4 trials colostrum immunoglobulin (Ig)
concentrations were measured. The parameter means were analyzed statistically as pairs of
observations by the paired T-test.
Mannan oligosaccharide had no effect on litter size. However, MOS did affect birth weight (1.49
vs. 1.53 kg; P<0.05) and tended to improve weaning weight (6.45 vs. 6.96 kg; P=0.08). MOS led
to a significant reduction in pre-weaning mortality (11.79 vs. 10.0 %; P<0.05). In addition, MOS
was shown to enhance Ig concentrations in the colostrum. The exact mechanism of the
improved performance seen in piglets nursing sows receiving MOS is not fully understood, but
improved immune status of the piglets might provide an aid in performance by controlling sub-
clinical problems. Further research is needed to better determine the potential of MOS on sow
performance to determine the exact modes of action involved.
Introduction Mannanoligosaccharide (MOS) derived from the cell wall of Saccharomyces cerevisiae is
successfully used as feed additives in modern animal production. MOS has shown activity in the
digestive tract of several types of animals. The ability of MOS to decrease the prevalence and
prevent colonization of pathogens in the gastrointestinal tract has been well documented over
the last years (Spring et al., 2000). In addition, MOS has been shown to alter the immune
397

function of animals. While the concept has been researched well in young piglets, until recently
little information has been available on the effect of MOS in sows. However, reducing pathogen
load and strengthening the immune system can also be of use to support sow performance. In
2000, the first trial in sows has been conducted looking at the effect of MOS on performance and
immune status. Since then several trials have been completed. The purpose of this article is
present a summary of global sow trials which were looking at the effect of MOS on sow
performance. Materials and Methods Globally 5 trials with MOS in sows have been conducted. One trial was conducted under
research conditions, while the other 4 trials were conducted on commercial farms. Table 1
summarizes some of the trial conditions.
Table1: Location, number of sows and MOS (Bio-Mos, Alltech Inc.) application rate in sow trials
Trial no Location No of sows Bio-Mos
Gestation
Bio-Mos
Lactation
1 USA 22 5 g/hd/d (14d pre-farrowing-farrowing 5 g/hd/d
2 USA 1026 2 kg/t (21d pre-farrowing-farrowing 1 kg/t
3 USA 318 5 g/hd/d (21d pre-farrowing-farrowing 5 g/hd/d
4 Croatia 221 2 kg/t (14d pre-farrowing-farrowing 2 kg/t
5 Italy 480 1.5 kg/t (60d pre-farrowing-farrowing 1.5 kg/t
1: Newman, 2001; 2: O'Quinn et al., 2001, 3: Maxwell, personal communication;
4: Fuchs und Spring unpublished, 5: Geliot. Unpublished
Number of piglets, birth weight, weaning weight and pre-weaning mortality were determined. In
addition, in 4 trial colostrum immuno globulin concentrations were measured. Ig concentrations
were determined using RID kits (Bethyl Laboratories, Montgomery, TX).
The parameter means were analyzed statistically as pairs of observations by the paired T-test
(Statistix for Windows 7.0, 2000. Analytical Software, Tallahassee).
398

Results and Discussion While the initial trial (1) was determined on a small number of sows, trials 2 - 5 were conducted
in the field with relatively large sow numbers. The application of Bio-Mos slightly varied from trial
to trial. Approximately, the different feeding strategies followed the manufacture's
recommendation of feeding 5 g of product per head and day 3 weeks pre-farrowing through
lactation.
Table 1 summarizes the effect of Bio-Mos on different performance parameters. Bio-Mos has no
effect on litter size. This can be expected as the additive was only added a few weeks before
farrowing, at a stage in gestation when litter size is to a great degree determined. However, Bio-
Mos did affect birth and weaning weight and led to a significant reduction in pre-weaning
mortality.
Table 2: Effect of Bio-Mos on sow performance
Trial Birth weight, kg Weaning weight, kg Mortality, % Litter size at birth, n
Control MOS Control MOS Control MOS Control MOS
1 6.37 7.61 9.55 10.78
2 1.66 1.69 5.46 5.79 11.27 9.09 9.96 9.78
3 1.38 1.41 5.63 5.77 15.09 12.73 11 10.76
4 1.36 1.42 6.16 6.91 9.37 8.13 10.53 10.08
5 1.56 1.58 8.61 8.71 11.41 10.08 10.49 10.66
Average 1.49 1.53 6.45 6.96 11.79 10.01 10.31 10.41
P-value 0.03 0.08 0.01 0.74
Trial 1 and 2 also reported a significant increase in concentrations of immuno globulins in the
colostrum. Trial 3 and 4 reported a tendency to increased Ig concentrations. Colostrum
represents the accumulated secreted antibodies of the mammary gland. In pigs the placenta is
epithelichorial, which means that the fetal chorionic epithelium is in contact with intact uterine
epithelium. In this type of placentation, transplacental passage of immunoglobulins is prevented
making the newborn piglet entirely dependent on antibodies in the colostrum. Colostral IgA and
some IgM can bind to secretory component and may prevent the absorption of IgA where S-IgA
(secretory IgA) provides protection from intestinal challenge.
In addition, as in other animals Bio-Mos might also affect the intestinal micro flora of the sow and
with it the microbial environment in the farrowing pen. In fact, trial 5 reported a reduction in
399

Clostridia concentrations. However, as for microbial analysis the farrowing room and not the
individual sow has to be regarded as experimental unit, the number of replicates was not
sufficient for statistical analysis.
The exact mechanism of the improved performance seen in piglets nursing sows receiving Bio-
Mos is not fully understood, but improved immune status of the piglets may provide an aid in
performance by controlling sub-clinical problems.
Conclusions
• Fed to sows MOS has shown to improve piglet weight and reduce pre-weaning piglet
mortality.
Literature Spring, P., C. Wenk, K. A. Dawson, and K. E. Newman. 2000. Effect of mannan
oligosaccharide on different cecal parameters and on cecal concentration on enteric bacteria in challenged broiler chicks. Poult. Sci. 79:205-211.
Newman, K.E. 2001. Effect of mannan oligosaccharide on the microflora and immunoglobulin status of sows and piglet performance. J. Anim. Sci. 79(Suppl. 1):189.
O’Quinn, P.R., D.W. Funderbunke and G.W. Tibbetts. 2001. Effect of dietary supplementation of mannan oligosaccharide on sow and litter performance in a commercial production system. J. Anim. Sci. 79(Suppl. 1):212.
400

The influence of chromium and fructan enriched diet on β-oxidation activity of fatty acids in rat lymphocytes. Kuryl, T., Krejpcio, Z.* Wójciak, R.*, Lipko, M., Debski, B. Dept. Physiol. Sci.,Vet. Med. Fac., Agric. Univ., Nowoursynowska 159, 02-787 Warsaw, Poland * Dept.Human Nutr. Hygiene, Agric. Univ., Wojska Polskiego 31, 60-624 Poznań, Poland. INTRODUCTION
Insulin resistance (diabetes) and obesity in humans are frequently associated with an increase in the hepatic synthesis and production of triacylglycerol (TAG). The addition of nondigestible carbohydrate could reduce the risk of elevated triacylglycerol concentrations and have a cholesterol-lowering action. On the other hand, chromium is an essential nutrient involved in the metabolism of glucose, insulin and blood lipids. Thus insufficient dietary intake of chromium increases risk factors associated with diabetes and cardiovascular diseases including elevated circulating insulin, glucose, TAG and cholesterol (Abraham et al., 1991; Anderson et al., 1994; Anderson 2000). Beneficial effect of chromium in human and animal health was documented for its role as an integral component of the Glucose Tolerance Factor (GTF). In the event of chromium deficiency receptor cannot bind insulin causing rise of glucose concentration in the blood which stimulates release on more insulin to clear the glucose from the blood, but without any effect. Insulin is a key hormone regulating energy production, muscle, tissue deposition, fat metabolism and cholesterol utilization. Davis and Vincent (1997) demonstrated in isolated rat adipocytes that chromium containing low molecular weight oligopeptide stimulates 8-fold activity of tyrosine kinase (a part of insulin receptor). It is possible that Cr+3 ions are also taking a part in insulin signal transduction at postreceptor level. It seems that reactive oxygen species (ROS) are involved in transduction of this signal but still the mechanism of this process is not fully recognized. Chromium was found as a protective factor against heart disease which produces significant regression of cholesterol induced arteriosclerosis in rabbits. It was observed in patients suffering type 2 diabetes mellitus (non-insulin dependent diabetes mellitus) that organic chromium supplementation causes improvement in insulin resistance in those people (Anderson, 1997).
There is evidence that prebiotic fibers (such as inulin or oligofructose) are able to exert systemic effects by modifying the hepatic metabolism of lipids, improve Ca, Mg and Fe absorption and modulate various properties of the immune system in several animal models. In the literature there is no data whether dietary fructans can affect chromium uptake and whether their interaction in the gut can influence glucose and TAG utilization by cells.
The objective of this study, based on three-factorial design, was aimed at evaluating the effect of supplementation with dietary fructans and Cr on biomarkers of carbohydrate and fatty acids utilization by the blood cells in rat. MATERIALS AND METHODS Animals: 63 male adult Wistar rats (150 g) were randomly divided into 9 groups of 7 rats each. The control group received a standard diet (AIN-93) while remaining tested 8 groups were fed diet enriched with combinations of the type of dietary fructans (inulin-IN, oligofructose-OF) and its amount (5% and 10% of the diet) and supplemented Cr(III) complex with propionic acid (0,3 ppm, 5 ppm Cr+3).
401

Chromium concentration in the diets was determined by atomic absorption spectrometry, after dry ashing of samples. Rats had free access to diets and distilled water for 10 weeks. At the end of experimental period, the animals were anesthetized by intraperitional injection of thiopental and blood was drowned by heart puncture and collected in plastic tubes containing standard EDTA as anticoagulant. Methods: β-oxidation activity of fatty acids was estimated according to Manning et al. (1990) in isolated lymphocytes in own modification (Kuryl et al., 2001). Lymphocytes were isolated by centrifugation on FICOLL-HYPAQUE (Sigma), resuspended in PBS (Ca+2 and Mg+2 free) at a final concentration of approximately 1 mg/ml of protein. Lymphocytes (25-50 µg of protein) were incubated in triplicates for 60 minutes at 370C in the presence of 50 µM palmitic acid (PA) in HBSS solution supplemented with l µCi of [9,10]-3H-palmitic acid (Amersham). The amount of liberated tritiated water, separated from remaining radioactive substrate on anion exchange column, depended on the activity of palmitic acid degradation, which was expressed as pmoles of decomposed palmitic acid per 1 min per 1 mg of lymphocytes protein. Statistical analysis: Data are presented as the mean ± SD of 7 experiments. Statistical differences between samples were calculated by ANOVA test with p < 0,05 as the level of significance. RESULTS AND DISCUSSION The characteristics of experimental diets is shown in Table 1. Table 1. Chromium concentration in control (standard) and experimental diets (ppm).
Dietary supplement
Inulin Oligofructose
Indices Standard
5% 10% 5% 10%
Cr+3 0,3 ppm 0,314± 0,037 0,327 ± 0,044 0,336 ± 0,053 0,554 ± 0,152 0,317 ± 0,022
Cr+3 5,0 ppm ----------------- 5,211 ± 0,441 4,855 ± 0,412 4,709 ± 0,196 4,688 ± 1,045
The results of β-oxidation of palmitic acid by rat lymphocytes are presented in Fig. 1. Lymphocytes from control group utilized 5.991 ± 0.348 pmoles of palmitic acid per 1 min per 1 mg of lymphocyte protein. Low chromium supplementation (0.3 ppm) had no stimulatory effect on the activity of β-oxidation of palmitic acid by rat lymphocytes. Slight inhibition of fatty acid degradation was found in group of animals fed with diet with addition of 10% of polyfructans (4.329 ± 0.188 pmoles/min/mg of protein). In groups of animals fed with diet supplemented with 5 ppm of chromium the activity of β-oxidation was higher as compare to those for groups receiving diet with 0.3 ppm supplementation and for control group (Groups 0 - 4). Higher content of sugars at chromium concentration of 5 ppm resulted in higher fatty acid utilization (7.347 ± 0.323 pmoles/min/mg for 5% inulin and 7.207 ± 0.284 for 5% oligofructans and 11.877 ± 0.664 for 10% inulin and 12.356 ± 725 for 10% oligofructans, respectively). Multifactorial ANOVA and Tukey test at p<0.05 (Table 2) well as their interactions. Independently on other factors higher level of dietary fructan (10%) and
402

higher level of supplementary Cr (5 ppm) markedly increased fatty acid utilization by 37.5% and 76.9%, respectively. Also significantly higher stimulatory effect of Cr was detected showed that β-oxidation of fatty acids was significantly affected by experimental factors as in the case of diets enriched with oligofructose alone and generally higher level of fructan (10%). The results of β-oxidation of fatty acids by rat lymphocytes are presented in Fig. 1.
Brighenti et al. (1999) and Letexier et al. (2003) reported that addition of inulin to
high-carbohydrate low-fat diet reduces plasma total cholesterol, triacylglycerols and hepatic lipogenesis in humans. These experiments were done without supplementation of the diet with chromium In our experiments addition of fibrous oligofructans and chromium ions to the standard diet of rats stimulated the activity of the degradation of fatty acids and depended on the oligofructans added (FOS or inulin) as well on the concentration of this additive.
It should, in part, explain the observations of Brighenti et al. and Lexetier et al. Elevated degradation of fatty acids accompanied by decreasing of hepatic lipogenesis should effect in lowering of the level of triacylglycerols in plasma observed by these authors. On the other hand, the addition of chromium ions in the form of complex with propionic acid had additional stimulatory effect of the activity of β-oxidation of fatty acids by lymphocytes. Chromium ion may have an additional effect on the degradation of fatty acids in rat, as we reported earlier for broiler lymphocytes (Kuryl et al., 2002).
Fig 1. Effect of chromium supplementation on the activity of beta-oxidation of fatty acids in rats lymphocyte at different
dietary fructan levels in the diet
ab
b
ab
b
ab
c
b
c
a
0,00
2,00
4,00
6,00
8,00
10,00
12,00
14,00
Cr 0.3 Cr 5.0
Dietary Cr (ppm)
pmol
e PA
/min
Control
5% IN
5%OF
10%IN
10%OF
403

Table 2. Effect of the type of fructan (1) and its amount in the diet (2) and dietary chromium
level (3) on β-oxidation activity of fatty acid in rat lymphocytes.
Experimental
factors
F value
p level
1 3,84 0,056 2 69,09 1,72 x E-10 3 213,70 2,74 x E-18
Interactions of experimental factors 1-2 2,53 0,118 1-3 4,58 0,038 2-3 75,32 5,3 x E-11
1-2-3 3,72 0,060
CONCLUSIONS 1. Consumption of diet enriched with fructans (inulin, oligofructose) increases β-oxidation of fatty acids in rat lymphocytes. 2. Dietary supplementation with chromium (III) increases β-oxidation of fatty acids in rat lymphocytes. 3. Synergistic effect of dietary chromium (III) and the amount as well as the type of dietary fructans on β-oxidation of fatty acids in rat lymphocytes was demonstrated. 4. Both dietary fructans and chromium increase metabolic rate and can be applied in the production of “energy buster” type food supplements. The experiment on animals was an integral part of the research grant KBN Nr 0528/P06/2002/23 financed by the National Committee of Science
REFERENCES 1. Abraham A.S., Brooks B.A., Eylath U, (1991); Chromium and cholesterol-induced atherosclerosis in rabbits, Ann. Nutr. Metabolism. 35, 203 - 207. 2. Anderson R.A., Lyons T.P., Jaques K.A. (1994); Stress effects on chromium nutrition of humans and farm animals. In: Biotechnology in the feed industry: Proceedings of Alltech’s Tenth Annual Symposium, pp. 267 - 274. 3. Anderson R.A. (1997): Elevated intakes of supplemental chromium improve glucose and insulin variables in individuals with type 2 diabetes, Diabetes 46, 1786-1791. 4. Anderson R.A. (2000); Chromium in the prevention and control of diabetes, Diabetes Metab, 26(1), 22 - 27. 5. Brighenti F., Casiraghi M.C., Canzi E., Ferrari A. (1999), Effect of consumption of a ready- to-eat breakfast cereal containing inulin on the intestinal milieu and blood lipids in healthy male volunteers., Eur. J. Clin. Nutr. 53(9), 726-733. 6. Davis C..M., Vincent J.B., (1997), Chromium oligopeptide activates insulin receptor tyrosine kinase activity., Biochemistry 36, 4382-4385.
404

7. Kuryl T., Lipko M., Debski B., (2002), Metabolism of fatty acids in broiler chicken is affected by chromium., METAL IONS IN BIOLOGY AND MEDICINE,., Khassanova L., Collery P., Maymard I., Khassanova Z., Etienne J-C [eds.], vol.7, John Libbey CIC, Roma, Part X, pp. 454 - 459. 8. Kuryl T., Adamowicz M., Debski B., Bertrand J., Martynik K., (2001), Degradation of [9,10] - 3H - myristic acid by lymphocytes. Screening test of inherited disorders of activation, transport and mitochondrial oxidation of fatty acids. Aterosklerosa, 23-26. 9. Letexier D., Diraison F., Beylot M., (2003), Addition of inulin to a moderately high- carbohydrate diet reduces hepatic lipogenesis and plasma triacylglycerol concentrations in human., Am. J. Clin. Nutr. 77(3), 559-564. 10. Manning N.J., Olpin S.E., Pollitt R.J., Webley J., (1990), A comparison of [9,10-3H] myristic acid for the detection of defects of fatty acid oxidation in intact fibroblast., J. Inher. Metab. Dis., 13, 58-68.
405

Probiotic cultures and their modulating effects on immunological parameters and lipid metabolism Klein, A.1, Vogelsang, H.2, Jahreis, G.1
1Institute of Nutrition, Friedrich Schiller University, Dornburger Straße 24, D- 07743 Jena 2Institute of Clinical Chemistry and Laboratory Diagnostics, Friedrich Schiller University Jena Introduction Probiotics are living microorganisms which enter the intestine in sufficient numbers in
an active form to exert positive effects (Klaenhammer, 2000). The bacterial genera
most often used as probiotics are Lactobacilli and Bifidobacteria. Health-promoting
effects of these microorganisms depend on interaction with the gut-associated
lymphoid tissue. The enhancement of immune function is widely described for
different probiotic strains. Furthermore, different strains of Lb. acidophilus have the
ability of lowering cholesterol concentration in vitro (Frey et al., 2001). The purpose of
the present study was to investigate the effect of fermented yoghurt containing
Lactobacillus acidophilus 74-2 and Bifidobacterium species 420 on the lipid
metabolism and the immune system of healthy adult volunteers.
Materials and Methods
The trial was designed as a placebo-controlled, double-blind and cross-over study.
After a first yoghurt-free period (3 weeks), 13 healthy women and 13 healthy men,
aged between 20 and 37 years, were randomly assigned into two groups. In the 2nd
period, they consumed 300 g per day of probiotic or of control yoghurt over 5 weeks
(Tab. 1). At the end of each period, 7 days of defined diet followed (including 300 g
yoghurt per day). During this time all volunteers had to consume the same qualitative
and similar quantitative amount of food and drink. The first 2 days of standardised
diet were used for transition from the individual diet to defined diet. From the 3rd to
the 7th day, 24 - hours urine and faeces samples were collected. Additionally, on the
day 7th venous blood samples were taken after overnight fasting. In the 3rd period
intervention changed. Volunteers consuming probiotic yoghurt in the 2nd period
received control yoghurt and vice versa.
406
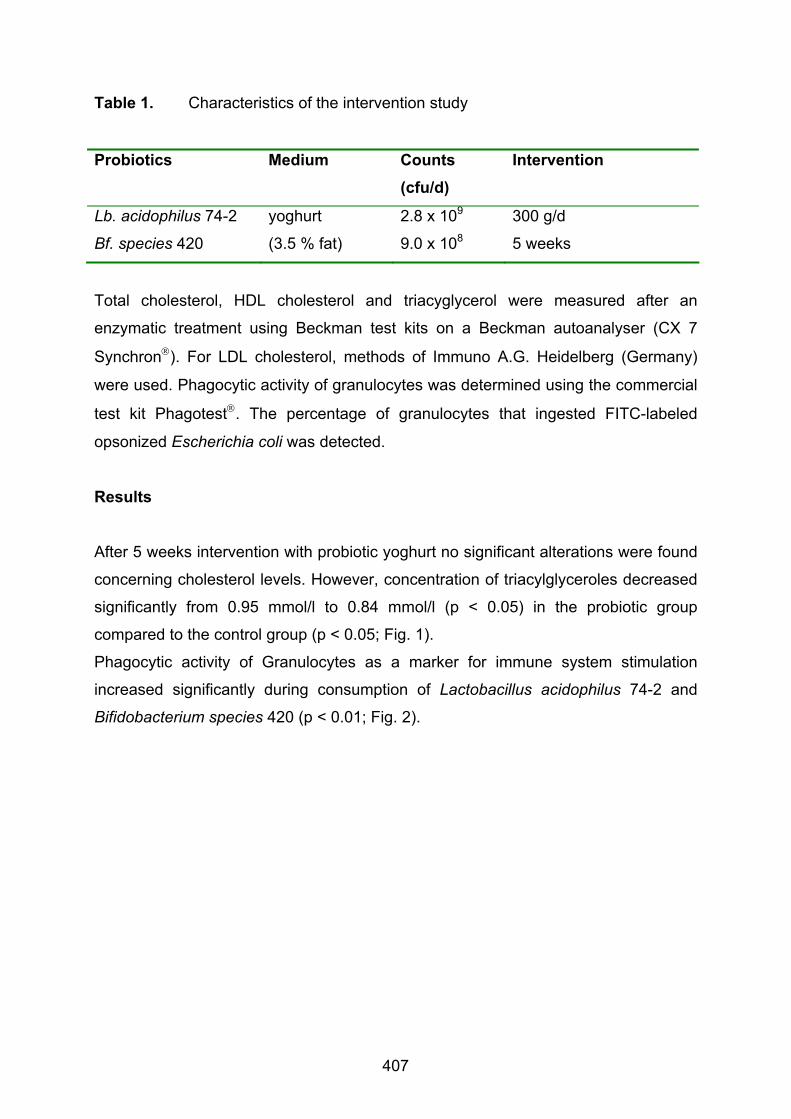
Table 1. Characteristics of the intervention study
Probiotics Medium Counts (cfu/d)
Intervention
Lb. acidophilus 74-2
Bf. species 420
yoghurt
(3.5 % fat)
2.8 x 10⁹
9.0 x 10⁸
300 g/d
5 weeks
Total cholesterol, HDL cholesterol and triacyglycerol were measured after an
enzymatic treatment using Beckman test kits on a Beckman autoanalyser (CX 7
Synchron®). For LDL cholesterol, methods of Immuno A.G. Heidelberg (Germany)
were used. Phagocytic activity of granulocytes was determined using the commercial
test kit Phagotest®. The percentage of granulocytes that ingested FITC-labeled
opsonized Escherichia coli was detected.
Results
After 5 weeks intervention with probiotic yoghurt no significant alterations were found
concerning cholesterol levels. However, concentration of triacylglyceroles decreased
significantly from 0.95 mmol/l to 0.84 mmol/l (p < 0.05) in the probiotic group
compared to the control group (p < 0.05; Fig. 1).
Phagocytic activity of Granulocytes as a marker for immune system stimulation
increased significantly during consumption of Lactobacillus acidophilus 74-2 and
Bifidobacterium species 420 (p < 0.01; Fig. 2).
407

Figure 1. Serum concentration of triacylglycerol (n = 26)
Figure 2. Phagocytic activity of Granulocytes (n = 26)
Summary
Dietary interventions with defined strains of probiotic microorganisms represent an
interesting, non-invasive means to optimize and modulate important physiological
functions. The ability of probiotics to lower serum cholesterol levels is discussed
0.0
0.2
0.4
0.6
0.8
1.0
1.2
1.4
Probiotics Control
mmol/l
a, b = significant differences between mean values of unequal superscripts (p < 0.05)
a b
8486889092949698
100
Start Probiotics Control
% p
hago
cytic
act
ivity
b
a, b = significant differences between mean values of unequal superscripts (p < 0.01)
a
408

controversially (Agerbaek et al., 1995; Richelsen et al., 1996; Schaafsma et al., 1998;
de Roos et al. 1999). Yoghurt enriched with Lb. acidophilus 74-2 and Bf. species 420
had no influence on the concentration of serum total cholesterol and LDL fractions in
normocholesterolaemic men and women. Concentration of serum triacylglycerol
decreased significantly after consumption of probiotics. Possibly, propionate, a short
chain fatty acid, is responsible for this effect. Propionate resulted in studies on
isolated rat-hepatocytes in a decrease of fatty acid and cholesterol synthesis (Frey et
al., 2001).
The increase in phagocytic activity indicates a stimulation of the immune system. In
the existing literature this effect is widely described for different probiotic strains
(Jahreis et al., 2002; Gill et al., 2001; Arunachalam et al., 2000).
References Agerbaek, M.; Gerdes, L. U., Richelsen, B. (1995): Hypocholesterolaemic effect of a new fermented milk product in healthy middle-aged men. Eur. J. Clin. Nutr., 49, 346 – 352 Arunachalam, K., Gill, H. S., Chandra, R. K. (2000): Enhancement of natural immune function by dietary consumption of Bifidobacterium lactis (HN019). Eur. J. Clin. Nutr., 54, 263 – 267 De Roos, N. M., Schouten, G., Katan, M. B. (1999): Yogurt enriched with Lactobacillus acidophilus does not lower blood lipids in healthy men and women with normal to borderline high serum cholesterol levels. Eur. J. Clin. Nutr., 53, 277 – 280 Frey, I., Arrigoni, E., Amadò, R. (2001): Critical examination of pro- and prebiotics by human studies. Nutr., 25, 485 – 501 Gill, H. S., Cross, M. L., Rutherfurd, K. J., Gopal, P. K. (2001): Dietary probiotic supplementation to enhance cellular immunity in the elderly. Br. J. Biomed. Sci., 58, 94 – 96 Jahreis, G., Vogelsang, H., Kiessling, G., Schubert, R., Hammes, W. P. (2002): Influence of probiotic sausage (Lactobacillus paracasei) on blood lipids and immunological parameters of healthy volunteers. Food Res. Int., 35, 133 – 138 Klaenhammer, T. R. (2000): Probiotic bacteria: today and tomorrow. J. Nutr., 30, 415S – 416S Richelsen, B., Kristensen, K., Pedersen, S. B. (1996): Long-term (6 months) effect of a new fermented milk product on the level of plasma lipoproteins – a placebo controlled and double blind study. Eur. J. Clin. Nutr., 50, 811 – 815 Schaafsma, G., Meulig, W. J. A., Van Dokkum, W., Bouley, C. (1998): Effects of a milk product, fermented by Lactobacillus acidophilus and with fructo-oligosaccharides added, on blood lipids in male volunteers. Eur. J. Clin. Nutr., 52, 436 – 440
409

Influence of a synbiotic yoghurt (Lactobacillus acidophilus 74-2, Bifido-bacterium species 420 and 1% oligofructose) on the absorption of calcium and magnesium Kuhnt, K., Klein, A., Jahreis, G. Friedrich Schiller University, Institute of Nutritional Sciences, Dept. Nutritional Physiology, Dornburger Str. 24, D-07743 Jena Introduction: The concept of synbiotics is to combine beneficial health-effects of
probiotics and prebiotics. The term synbiotics should be reserved for products in
which the prebiotic compound selectively favours the probiotic compound, e.g.
oligofructose and bifidobacteria [1]. When combining both probiotics and prebiotics in
a single food product the expected benefits are an improved survival of the probiotic
bacteria during the passage through the upper part of the gastrointestinal tract and a
more efficient implantation in the colonic microbiota together with a selectively
stimulating effect of prebiotics on the growth and/or the activities of both the
exogenous (probiotics) and endogenous bacteria (e.g. bifidobacteria) [2]. Moreover,
the number of surviving probiotic bacteria could increase when they are associated
with prebiotics in the food matrix [3].
Effects on mineral absorption: Prebiotics are not hydrolysed by the human
digestive enzymes and so they are direct metabolic substrates for the fermentation of
the colonic microbiota in the intestinal tract. Thus, they increase the colonic biomass,
particularly bifidobacteria [4]. In rat studies an increased Ca and Mg absorption
following consumption of inulin is published [5, 6, 7, 8, 9]. A formulated hypothesis is
that the effects of prebiotics on mineral absorption occur at the level of the colon
[6, 8, 10]. This represents a new concept, because it was generally accepted that
mineral absorption occurs mainly in the small intestine. There are possible mechanisms to explain the improving effect of prebiotics on
mineral absorption. 1.) The colonic fermentation of prebiotics produces short-chain
fatty acids (SCFA) and other organic acids and results in a lowering of the luminal
pH. This acidification of the colon content could increase the mineral solubility and
the mineral absorption by passive pathway [11]. 2.) The formation of soluble Ca and
Mg salts of these acids, 3.) the osmotic effect of some prebiotics enhancing the
luminal fluid volume and 4.) hyperthrophy of the colon wall [12]. Ohta et al. [13]
reported that fructo-oligosaccharides (FOS) in rats increased the concentration of
calbindin-D9k in the colon and therefore raise the Ca absorption by active pathway.
410

More recently, two human studies showed a positive effect of inulin and FOS on the
absorption of dietary calcium but not of magnesium and other minerals, whereas in a
further study no effect was observed (Tab. 1). Table 1: Comparison with results of other studies in humans
Each probiotic strain and each prebiotic one have different effects and have to be
documented and tested in good clinical studies [17]. To determine whether the
synbiotic yoghurt increases the apparent absorption of calcium and magnesium a
randomised, doubleblind, placebo-controlled intervention study was carried out.
Subjects and methods: There were 13 healthy women and 13 men aged 25 ± 3 y.
The study was divided into three periods. After a 3-week basic period without any
yoghurt, two 5-week intervention periods followed. The conventional yoghurt as well
as the synbiotic yoghurt were given in a cross-over design (300 g/d).
Figure 1: Design of the intervention study
Reference Own Results [2002]
COUDRAY et al. [14]
VAN DEN HEUVEL et al. [15]
VAN DEN HEUVEL et al. [16]
Design
13 men (27 ± 4 y) 13 women (23 ± 2 y) oligofructose 3 g/d 35 d Lactobacillus acido-philus 74-2, Bifido-bacterium species 420
9 men (21 ± 2 y) inulin 40 g/d 28 d
12 men (20 - 30 y) inulin or FOS 15 g/d 21 d
12 boys (14 -16 y) inulin or FOS 15 g/d 9 d
Method of measurement
apparent absorption [%]
apparent absorption [%]
true intestinal absorption [%] moni-tored with stable isotopes (24 h urine collection)
true intestinal absorption [%] (this time with longer urine sampling period of 36 h)
Results
no changes Ca from 21.3 to 33.7 % Mg, Fe, Zn, no effect
no changes increased Ca absorption over 10.8 ± 5.6 %
At the end of each period
the volunteers obtained
a standardised diet over
7 days and during these
days urine and faeces
were quantitatively
collected and on the last
day blood was sampled
(Fig. 1).
Synbiotic
Synbiotic
INTERVENTION PERIOD 5 wk 5 wk
Conventional
Conventional
BASIC PERIOD 3 wk
7 days standardised diet, faeces and urine collection, blood sampling
without yoghurt
411

The conventional yoghurt contained classic yoghurt cultures Streptococcus
thermophilus and Lactobacillus bulgaricus. The synbiotic yoghurt additionally
included the probiotic cultures Lactobacillus acidophilus 74-2 and Bifidobacterium sp.
420. Moreover, it contained 1% oligofructose (Fibrulose® F90).
Results: Table 2 shows the mean daily mineral intake of 5 days of the standardised
diet in the basic period and in both intervention periods. The Ca and Mg intake in
both intervention periods corresponded to the amounts in 300 g yoghurt (100 mg Ca
and 25 mg Mg) only in men. We assume, that men additively consumed the yoghurt
whereas women exchanged other foodstuffs for the yoghurt. Table 2: Daily intake of Ca and Mg in all periods
There were no significant changes of renal and faecal excretions of Ca and Mg
between the conventional and the synbiotic yoghurt intake (Table 3). There was a
tendency of a higher feacal excretion in women referring to the additive Ca and Mg
intake in the intervention periods than in men.
Table 3: Daily faecal and renal excretion of Ca and Mg in all periods
Parameter Basic Conventional Synbiotic
Calcium (mg/d) women a 808 ± 134 a 999 ± 113 b 996 ± 156 b
men b 934 ± 146 a 1210 ± 149 b 1240 ± 201 b
Magnesium (mg/d) women a 200 ± 31 207 ± 26 209 ± 42 men b 251 ± 31 a 275 ± 39 b 279 ± 45 b
values with different letters are significantly different, p ≤ 0.05
Parameter Basic Conventional Synbiotic faecal Calcium (mg/d) women 614 ± 331 a 811 ± 384 b 844 ± 375 b
men 767 ± 169 a 927 ± 238 b 911 ± 351 Magnesium (mg/g) women 122 ± 50 146 ± 65 152 ± 60 men 161 ± 32 167 ± 45 162 ± 48 renal Calcium (mg/d) women 105 ± 46 88 ± 35 96 ± 32 men 99 ± 43 114 ± 43 114 ± 44 Magnesium (mg/g) women 50 ± 14 a 43 ± 12 b 45 ± 11 men 61 ± 20 65 ± 24 58 ± 22 values with different letters are significantly different, p ≤ 0.05
412
In contrast to the faecal excretion of Ca in women the renal excretion was lower in
comparison to the basic period without yoghurt intake. The male subjects excreted
renal on a higher level of Ca in both intervention periods.
The concentration of Ca in the sera was not significantly affected. However, in men
the concentration reached its highest level after synbiotic yoghurt intake.
Discussion: In the present study, there was no significant influence of the absorption
and balance of Ca and Mg found. The apparent absorption and balance of Ca and
Mg slightly increased after synbiotic yoghurt intake in men. In contrast, a decreased
level was observed in women. There are a number of factors which can cause the
differences in metabolism of Ca and Mg of both sexes, e.g. different requirement and
status of these elements, status of hormones and age of the subjects. In the context
of the present study we could not measure them. Furthermore, there were partly high
inter- and intraindividual variances. In COUDRAY et al`s study [14], in most
experiments in rats and in the present study the chemical balance technique was
used to measure the apparent absorption. A disadvantage is that it does not
distinguish between unabsorbed and endogenously secreted minerals, and therefore
true absorption could not be determined. However, an important advantage of this
method is that it measures complete absorption, including that from the colon, which
is important to determine the effect of prebiotics. But in this study the feacal pH has
not decreased and probably the production of SCFA was not high enough to improve
the digestibility of Ca and Mg by solubilising these minerals. Besides, it is possible
that the daily amount of 3 g oligofructose was to low. In human studies [14] the daily
intake of inulin was 40 g and 15 g of inulin or FOS were consumed [15].
Table 3: Daily apparent absorption of Ca and Mg
Parameter Basic Conven-tional Synbiotic
Calcium (%)
women 22 ± 47 19 ± 37 12 ± 46
men 16 ± 21 23 ± 19 26 ± 26
Magnesium (%)
women 37 ± 27 28 ± 37 24 ± 36
men 35 ± 15 38 ± 18 40 ± 21
The apparent absorption of Ca and
Mg in men increased in the synbiotic
period without reaching a significant
level. The apparent absorption in
women decreased without a
significant difference between both
yoghurt periods (Table 3). The
apparent balance was positive and did
not significantly change in both sexes.
413

ROBERFROID [3] reported that the stimulation of growth of bifidobacteria by
prebiotics depends very much on the initial level of the volunteers. To compare the
results of female subjects, no study was available. Generally, it is thought that the
mineral absorption rate is highest during adolescence and that it determines acquired
bone mineral density. Perhaps the absorption via colon does not play a role in older
volunteers with an adequate intake of minerals.
Summary: 26 healthy female and male subjects daily consumed 300 g synbiotic
yoghurt (Lb. acidophilus 74-2, Bifidobacterium sp. 420 and 1% oligofructose) over a
period of 5 weeks. There were no significant effects on the apparent absorption and
balance of Ca and Mg after the consumption of the synbiotic yoghurt. There were
significant differences between women and men. The absorption of Ca and Mg
tended to decrease in women and to increase in men. The serum concentration of
Ca in men reached its highest level after the consumption of synbiotic yoghurt
without significance. There were high intra- and interindividual varieties, probably
caused by differences in age, sex, requirement of these minerals, hormone status,
initial flora of the GIT, and other factors.
References [1] Schrezenmeir J, de Vrese M (2001): Probiotics, prebiotics, and synbiotics -
approaching a definition. Am J Clin Nutr 73 (Suppl), 361S-364S [2] Roberfroid MB (1998): Prebiotics and synbiotics: concepts and nutritional
properties. Brit J Nutr 80 (Suppl 2), S197-S202 [3] Roberfroid MB (2000): Prebiotics and probiotics: are they functional foods? Am J Clin Nutr 71, 1682-1687
[4] Gibson GR, Roberfroid MB (1995): Dietary modulation of the human colonic microbiota. Introducing the concept of prebiotics. J Nutr 125, 1401-1412
[5] Ohta A, Baba S, Adachi T (1994): Effects of fructooligosaccharides on the absorption of magnesium in the magnesium-deficient rat model. J Nutr Sci Vitaminol 40, 171-180
[6] Ohta A, Ohtsuki M, Baba S, Takizawa T, Adachi T, Kimura S (1995 a): Effects of fructooligosaccharides on the absorption of iron, calcium and magnesium in iron-deficient anemic rats. J Nutr Sci Vitaminol 41, 281-291
[7] Ohta A, Ohtsuki M, Baba S, Adachi T, Sakata T, Sakaguchi E (1995 b): Calcium and magnesium absorption from the colon and rectum are increased in rats fed fructooligosaccharides. J Nutr 125, 2417-2424
[8] Delzenne N, Aertssens J, Verplaetse H, Roccaro M, Roberfroid M (1995): Effect of fermentable fructo-oligosaccharides on mineral, nitrogen and energy digestive balance in the rat. Life Sci 57, 1579-1587
414

[9] Scholz-Ahrens KE, Schaafsma G, van den Heuvel E GHM, Schrezenmeir J (2001 a): Effects of prebiotics on mineral metabolism. Am J Clin Nutr 73 (Suppl), 459S-464S
[10] Baba S, Ohta A, Ohtsuki M, Takizawa T, Adachi T, Hara H (1996): Fructooligosaccharides stimulate the absorption of magnesium from the hindgut in rats. Nutr Res 16, 657-666
[11] Rémésy C, Levrat MA, Gamet L, Demigné C (1993) : Cecal fermentations in rats fed oligosaccharides (inulin) are modulated by dietary calcium level. Am J Physiol 264, 855-862
[12] Campell JM, Fahey GC, Wolf BW (1997): Selected indigestible oligosaccharides affect large bowel mass, cecal and fecal short-chain fatty acids, pH and microflora in rats. J Nutr 127, 130-136
[13] Ohta A, Motohashi Y, Ohtsuki M, Hirayama M, Adachi T, Sakuma K (1998): Dietary fructooligosaccharides change the intestinal mucosal concentration of calbindin-D9k in rats. J Nutr 128, 934-939
[14] Coudray C, Bellanger J, Castiglia-Delavaud C, Rémésy C, Vermorel M, Rayssignuier Y (1997): Effect of soluble or partly soluble dietary fibres supplementation on absorption and balance of calcium, magnesium, iron and zinc in healthy young men. Eur J Clin Nutr 51, 375-380
[15] van den Heuvel E GHM, Schaafsma G, Muys T, van Dokkum W (1998): Nondigestible oligosaccharide do not interfere with calcium and nonheme-iron absorption in young, healthy men. Am J Clin Nutr 67, 445-451
[16] van den Heuvel E GHM, Muys T, van Dokkum W, Schaafsma G (1999): Oligofructose stimulates calcium absorption in adolescents. Am J Clin Nutr 69, 544-548
[17] de Vrese M, Schrezenmeir J (1998): Pro- und Präbiotika - Stand der Diskussion. Ernährungs-Umschau 45, Sonderheft, S79-S86
415

Effekte von Probiotika und phytogenen Zusätzen beim Mastschwein Richter, G.1, Ochrimenko, W.1, Hartung, H.1, Arnhold, W.2 1 Thüringer Landesanstalt für Landwirtschaft, 07751 Jena-Remderoda 2 BASU Mineralfutter, Bergstraße 1, 99518 Bad Sulza
Problemstellung Die Akzeptanz von antibiotischen Leistungsförderern im Futter sinkt beim Verbrau-
cher ständig. Schweineproduzenten sind deshalb an leistungsverbessernden und
gesundheitsstabilisierenden Präparaten interessiert, deren Wirkung reproduzierbar
ist, die eine hohe Verbraucherakzeptanz genießen und rentabel sind. Dazu gehören
die Probiotika (ROTH, 2001; SIMON, 2001; SIMON und BREVES, 2000) und zur
Gruppe der aroma- und appetitanregenden Stoffe gehörenden phytogenen Substan-
zen (GOLLNISCH und BERK, 2001; KLUTH u. a., 2003; QUANZ und WEISS, 2001;
WALD, 2002). Die Einsatzwürdigkeit dieser Produkte ist unter verschiedenen Bedin-
gungen zu prüfen.
Material und Methoden In zwei Mastversuchen A und B mit Börgen erfolgte die Testung von zwei Probiotika.
Das Produkt „Biosaf“ ist eine Lebendhefe, 1010 KBE/g von Saccharomyces cerevisi-
ae, Stamm SC 47 und das Produkt „BioPlus 2B“ eine Mischung aus Bac. lichenifor-
mis und Bac. subtilis (3,2 x 10⁹ KBE/g) im Verhältnis 1:1. Biosaf wurde 500 g und
BioPlus 150 g jeweils pro Tonne dosiert. Das Produkt Biosaf ist bei Mastschweinen
nur bis zum Alter von 4 Monaten futtermittelrechtlich zugelassen.
In zwei weiteren Mastversuchen C und D mit Börgen erfolgte die Prüfung der Wirk-
samkeit von je zwei phytogenen Präparaten Das „WG-ROPA-Pulver 7,5 %“ ist ein
Oregano-Produkt mit den Inhaltsstoffen Thymol und Carvacol. Enteroguard-Finisher
enthält 150 g Knoblauchextrakt, 150 g Zimtölextrakt und 700 g Zucker je kg. ROPA
wurde 300 g und Enteroguard 500 g jeweils pro Tonne Futter dosiert. Im Versuch C
erfolgte in den ersten 10 Tagen eine erhöhte Dosierung von ROPA (500 g/t).
Die geprüften Produkte wurden im Vergleich zu einer Kontrollgruppe ohne Leistungs-
förderer in der gesamten Mastperiode oder nur in der Vormast eingesetzt. Die Mast
erfolgte in 2 Phasen, Vormast (VM) von ∼ 24 kg bis 60 kg Körpermasse und die
Endmast (EM) von 60 – 112 kg Körpermasse. Je Versuchsgruppe kamen 10 Börge
416
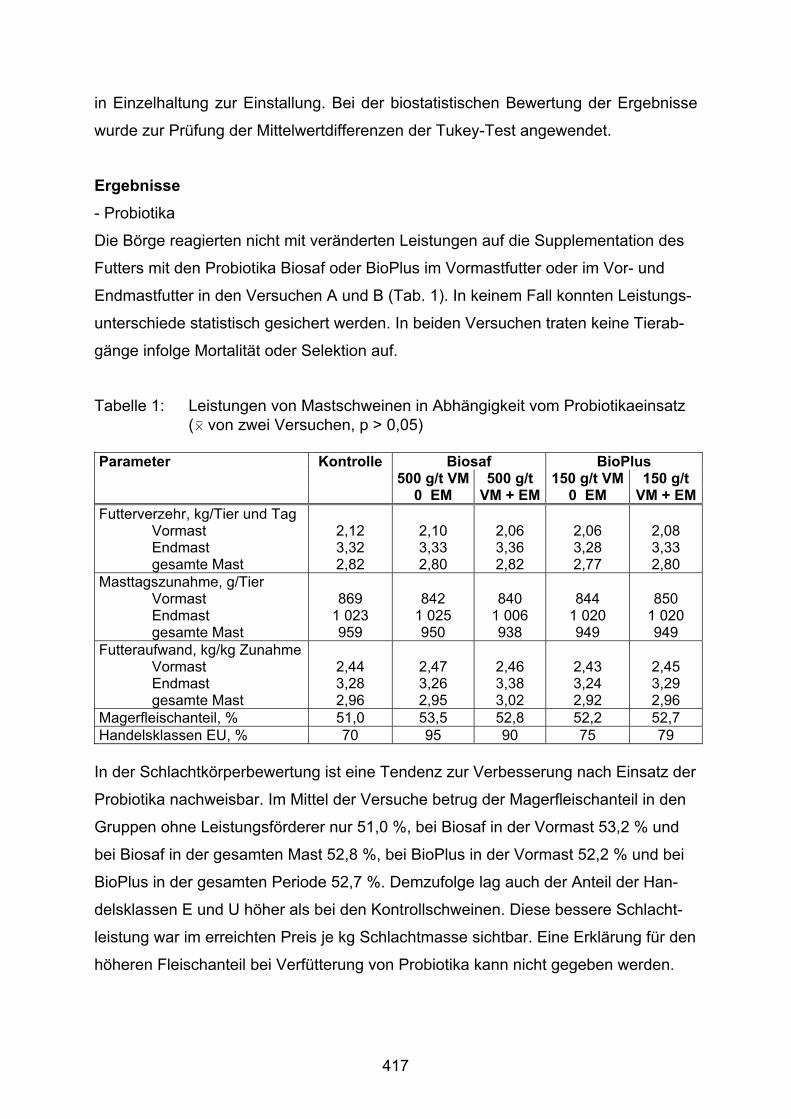
in Einzelhaltung zur Einstallung. Bei der biostatistischen Bewertung der Ergebnisse
wurde zur Prüfung der Mittelwertdifferenzen der Tukey-Test angewendet.
Ergebnisse - Probiotika
Die Börge reagierten nicht mit veränderten Leistungen auf die Supplementation des
Futters mit den Probiotika Biosaf oder BioPlus im Vormastfutter oder im Vor- und
Endmastfutter in den Versuchen A und B (Tab. 1). In keinem Fall konnten Leistungs-
unterschiede statistisch gesichert werden. In beiden Versuchen traten keine Tierab-
gänge infolge Mortalität oder Selektion auf.
Tabelle 1: Leistungen von Mastschweinen in Abhängigkeit vom Probiotikaeinsatz (0 von zwei Versuchen, p > 0,05)
Parameter Kontrolle Biosaf BioPlus 500 g/t VM 500 g/t 150 g/t VM 150 g/t 0 EM VM + EM 0 EM VM + EMFutterverzehr, kg/Tier und Tag Vormast Endmast gesamte Mast
2,12 3,32 2,82
2,10 3,33 2,80
2,06 3,36 2,82
2,06 3,28 2,77
2,08 3,33 2,80
Masttagszunahme, g/Tier Vormast Endmast gesamte Mast
869
1 023 959
842
1 025 950
840
1 006 938
844
1 020 949
850
1 020 949
Futteraufwand, kg/kg Zunahme Vormast Endmast gesamte Mast
2,44 3,28 2,96
2,47 3,26 2,95
2,46 3,38 3,02
2,43 3,24 2,92
2,45 3,29 2,96
Magerfleischanteil, % 51,0 53,5 52,8 52,2 52,7 Handelsklassen EU, % 70 95 90 75 79
In der Schlachtkörperbewertung ist eine Tendenz zur Verbesserung nach Einsatz der
Probiotika nachweisbar. Im Mittel der Versuche betrug der Magerfleischanteil in den
Gruppen ohne Leistungsförderer nur 51,0 %, bei Biosaf in der Vormast 53,2 % und
bei Biosaf in der gesamten Mast 52,8 %, bei BioPlus in der Vormast 52,2 % und bei
BioPlus in der gesamten Periode 52,7 %. Demzufolge lag auch der Anteil der Han-
delsklassen E und U höher als bei den Kontrollschweinen. Diese bessere Schlacht-
leistung war im erreichten Preis je kg Schlachtmasse sichtbar. Eine Erklärung für den
höheren Fleischanteil bei Verfütterung von Probiotika kann nicht gegeben werden.
417

- Phytogene Zusätze
Die Supplementation des Vormast- und Endmastfutters mit den phytogenen Sub-
stanzen ROPA bzw. Enteroguard verbesserte nicht die zootechnischen Leistungen
der Mastschweine in den Versuchen C und D (Tab. 2). Außer die geringe Körper-
massezunahme in der Endmast- und in der gesamten Mastperiode der Schweine in
der Gruppe mit „ROPA-Zusatz in der gesamten Mast“ des Versuches C sind alle Un-
terschiede in den erfassten Kriterien beider Versuche statistisch nicht zu sichern. Im
Mittel der zwei Versuche war die niedrigere Körpermassezunahme der Schweine in
der Gruppe mit ROPA-Zusatz in der Vormast statistisch zu sichern. Gesundheitliche
Probleme bei den Tieren beider Versuche bestanden nicht und nur in Versuch C ver-
endete ein Schwein.
Tabelle 2: Leistungen von Mastschweinen in Abhängigkeit vom Einsatz phytogener Substanzen (0 von zwei Versuchen)
Parameter Kontrolle ROPA Enteroguard 300 g/t VM 300 g/t 500 g/t VM 500 g/t 0 EM VM + EM 0 EM VM + EMFutterverzehr, kg/Tier und Tag Vormast Endmast gesamte Mast
2,20 3,19 2,76
2,12 3,20 2,73
2,13 3,04 2,64
2,10 3,14 2,68
2,14 3,19 2,73
Masttagszunahme, g/Tier Vormast Endmast gesamte Mast
968 944 954
876x 979 934
901 864 880
936 907 920
938 916 925
Futteraufwand, kg/kg Zunahme Vormast Endmast gesamte Mast
2,28 3,38 2,89
2,42 3,27 2,92
2,36 3,51 3,00
2,24 3,46 2,90
2,28 3,49 2,95
Magerfleischanteil, % 53,2 54,0 54,6 54,2 53,4 Handelsklassen EU, % 84 84 100 100 90 x p < 0,05 zur Kontrolle
Die Unterschiede in den ermittelten Kriterien der Schlachtkörperbewertung sind in
Abhängigkeit von den geprüften phytogenen Zusätzen nicht signifikant. Es besteht
wie bei den Probiotika die Tendenz zu höherem Magerfleischanteil, der aber auch
durch die geringere Körpermassezunahme und Schlachtkörpermasse bedingt war.
Demzufolge lag auch der Anteil E- und U-Schweine höher als in den Kontrollgrup-
pen.
418

Zusammenfassung In zwei Versuchen mit 100 Börgen in Einzelhaltung wurden gleiche Basalrationen ohne Leistungsförderer und mit den Probiotika Biosaf (Lebendhefe) oder BioPlus 2B (Bac. licheniformis und Bac. subtilis) geprüft. Die Probiotika führten bei hohem Leis-tungsniveau (949 g Masttagszunahme) zu keiner signifikanten Verbesserung der Mastleistungsparameter. Es bestand der Trend zu höherem Magerfleischanteil bei Supplememtation der Probiotika. In zwei weiteren Versuchen mit 100 Börgen erfolgte die Prüfung der phytogenen Zu-sätze WG ROPA-Pulver 7,5 % (Oregano) oder Enteroguard-Finisher (Knoblauch, Zimt). Eine signifikante Erhöhung der Leistungen wurde nicht ermittelt. Summary Effects of probiotics und phytogenic additives on fattening pigs Two experiments were carried out to investigate the effect of the probiotics “Biosaf” (living yeast) or BioPlus 2B (Bac. licheniformis and Bac. subtilis) on 100 fattening castrates which were kept in single boxes. The animals took in the same basic diet without performance enhancers in the two experiments. The two probiotics did not significantly take effect on the parameters of the fattening pigs at a high level of pro-duction (949 g life weight gain per day during the fattening period). However, there was a tendency of a higher percentage of lean pork when probiotica were supple-mented to the diet. The investigation of two phytogenic additives WG ROPA-Powder 7.5 % (oregano) and Enteroguard-Finisher (garlic, cinnamon) was carried out in two further experi-ments with 100 fattening castrates. No improvement of the zootechnical parameters was registered. Literatur Gollnisch K, Berk A (2001): Forum angewandte Forschung in der Rinder- und
Schweinefütterung, Fulda, 85–87 Kluth H, Schulz E, Halle I, Rodehutscord M (2003): Lohmann Information, Heft 2,
9–14 Quanz G, Weiss J (2001): Forum angewandte Forschung in der Rinder- und Schwei-
nefütterung, Fulda, 127–130 Roth E (2001): Forum angewandte Forschung in der Rinder- und Schweinefütterung,
Fulda, 131–132 Simon O (2001): 8. Symp. Vitamine und Zusatzstoffe in der Ernährung von Mensch
und Tier. FSU Jena, 39–48 Simon O, Breves G (2000): 6. Tagung Schweine- und Geflügelernährung, MLU Hal-
le-Wittenberg, 45–50 Wald C (2002): Untersuchungen zur Wirksamkeit verschiedener ätherischer Öle im
Futter von Aufzuchtferkeln und Broilern. Diss., MLU Halle-Wittenberg
419

Probiotic Escherichia coli strain Nissle 1917 in adult horses: Tolerance and presence of viable bacteria in the faeces Zeyner, A.1, Albers, N.2, Schrödl, W.2, Vallentin, G.3, Fuhrmann, H.3, Krüger, M.2 1Institute of Animal Nutrition, Nutritional Diseases and Dietetics, Gustav-Kühn-Str. 8, 04159 Leipzig; 2Institute of Bacteriology and Mycology, An den Tierkliniken 29, 04103 Leipzig and 3Institute of Physiological Chemistry, An den Tierkliniken 34, 04103 Leipzig, Faculty of Veterinary Medicine, University of Leipzig, Germany
Introduction For about 85 years the non-pathogenic Escherichia coli strain Nissle 1917 (ECN) has
been used in treating different human diseases, e.g. ulcerative colitis, Crohn´s
disease and constipation (Nissle 1918, Fuller 1991, Malchow 1997, Rembacken et al.
1999). In veterinary medicine the strain is registered as a pharmaceutical (Ponsocol®)
for prophylaxis of neonatal calf diarrhoea since 2001 (von Bünau et al. 2003). If ECN
are well tolerated by horses and also able to establish itself in their hind gut, this
could be a promising approach to preventing or treating gastrointestinal disorders. In
this respect, survival of the bowel passage is the first and most essential precondition
for successful colonisation.
Objectives The aim of this study was to investigate (1) the tolerance of orally given ECN in adult
horses via clinical investigation and selected biochemical, immunological and micro-
biological parameters and (2) the ability of viable ECN to survive the gastrointestinal
passage via analysis of faeces.
Materials and Methods
Animals: Twelve adult Warmblood-type horses (8 gelding and 4 mares; 652 ±19.6 kg
body weight [BW]; age 10 ±2.7 years) were blocked by gender and than assigned
randomly to verum or placebo (6 animals each).
Management and experimental feeding: During the study period all horses were
housed and fed individually (except when grazing), but within the same stable.
Animals of the verum-group and placebo-group were kept separated within the stable
by a distance of about 79 metres. Additionally, strictly separated pastures were used
for grazing. The horses were ridden for about one hour per day. The animals were
fed a basal diet consisting of mixed feed, a salt block, meadow hay, pasture grass
420

and straw from the bedding. Probiotic ECN (verum) were given orally in doses of 150
x 108 viable bacteria per horse and day in a salty buffer. The buffer only was used as
placebo. Immediately before the individual horse got its morning meal, verum or
placebo was topped on the concentrate.
Protocol: The experimental period lasted 25 days (d1 to d25). Supplementation of
verum or placebo was continued for the first 10 study days (d1 to d10). The horses
were permanently observed for feed intake, behaviour and wellbeing. The BW was
controlled at the beginning (at d1 prior to the morning meal) and at the end of the
study period. Rectal temperature, heart rate and respiratory rate were monitored
twice a day. Blood from the V. jugularis and faeces from the Ampulla recti were
sampled at d1 (before the first administration = point zero), d11, d16 and d25.
Samples from faeces were additionally taken at d3, d6, d13 and d20, in every case
prior to the morning meal.
Analyses: In the total blood and blood serum, respectively, the following variables
were investigated: red and white blood cells, haemoglobin, haematocrit, total protein,
albumin, urea, creatinine, glucose, bilirubin, alkaline phosphatase (AP), γ-glutamyl
transferase (GGT), aspartate aminotransferase (ASAT), glutamic acid dehydroge-
nase (GAD), creatine kinase, endotoxin, neopterin, C-reactive protein, total IgG, IgM
and IgA and special antibodies anti lipopolysaccharides from E. coli J5 and anti
phospholipase C (PLC) from C. perfringens. Faeces were analysed for dry matter,
total aerobic and aerobic gram-negative bacteria, total E. coli, ECN, C. perfringens,
lactobacilli and yeasts as well as the faecal water for pH, short chain fatty acids
(SCFA: acetate, propionate, iso- and n-butyrate, iso- and n-valeriate, n-capronate), L-
lactate, ammonia, endotoxin and AP. Viable ECN were detected semi-quantitatively
by using the cultural serial dilution technique (48 hours; 37° C; MacConkey-agar,
SIFIN, Berlin), followed by strain-specific polymerase chain reaction (PCR) as
described by Blum-Oehler et al. (2003).
Statistics: Biostatistical examination was performed using the software package
SPSS (version 11.5). Data from analyses of blood and faeces were corrected as to
create a uniform baseline for all horses at d1, transformed according to their
distribution and then subjected to analysis of variance with regard to the main factors
‘treatment’ and ‘sampling day’. SNK-test was performed as post hoc multiple
comparison of means. The level of significance was pre-set at P<0.05.
421

Results Body weight (BW), general and clinical observations: The final BW of the horses (647
±22.3 kg) did not significantly differ (P>0.05) from the initial BW. Feed intake,
behaviour as well as heart and respiratory rate were without significant peculiarities.
During the experimental period, horses of both treatment groups transiently
developed moderate fever. More specific investigations indicated an active infection
with Leptospira grippotyphosa, which was probably caused by the recent epidemic
situation in Saxony. Especially affected were barns and food stocks due to infected
rodents as a result of the summer-flooding 2002.
Blood variables: Taking point zero as baseline, the platelet-counts as well as concen-
trations of urea and endotoxins were lower (P<0.05) within ECN-group compared to
placebo-treated horses. Concentrations of total protein, albumin, glucose, bilirubin,
IgM, IgA and IgG anti PLC from C. perfringens were higher (P<0.05). An interaction
(P<0.05) between ‘treatment’ and ‘sampling time’ was observed in case of
monocytes, staff-cell leukocytes and segmented neutrophil leukocytes. Counts of
leukocytes, segmented neutrophil leukocytes, lymphocytes and monocytes,
concentrations of urea, glucose, bilirubin, creatinine and activities of AP, ASAT and
GGT were affected (P<0.05) from the ‘sampling time’. Starting with d11, horses of
both groups expressed a leukopenia and the activity of liver-associated enzymes
(AP, ASAT, GGT, GAD) in the blood serum was clearly higher than normal.
Faecal variables: Taking point zero as baseline, the faecal water of horses supple-
mented with ECN showed lower concentrations of SCFA (P<0.05) than placebo-
treated horses and the SCFA itself a lower percentage of acetate (P<0.05), but
higher portions of propionate and butyrate (P<0.05). An interaction (P<0.05) between
‘treatment’ and ‘sampling time’ existed only for the count of lactobacilli in the faeces.
The ‘sampling time’ influenced (P<0.05) the concentration of SCFA, acetate,
propionate, n-butyrate, n-capronate and endotoxin and the SCFA’s percentage of
acetate, propionate, n-butyrate, n-valeriate and n-capronate in the faecal water as
well as the dry matter content, the concentration of ammonia, the activity of AP and
the count of total aerobic and aerobic gram-negative bacteria, total E. coli and
lactobacilli in the faeces (P<0.05). To the recent knowledge none of the investigated
variables indicate a relevant health problem. The serious decrease of endotoxins
(P<0.05) in the faecal water of verum- (from d13 to d16) and placebo-group (from
d11 to d13) horses revealed a sudden reduction of gram-negative bacteria.
422

Viable ECN in the faeces: Only at day 11, 24 hours after the last application, viable
ECN in counts of > 5 x 10⁴ colony forming units (CFU) per gram were detected in the
faeces of two ECN-treated horses.
Conclusion In the recent study the health problems observed with horses of both treatment
groups were not related to the administration of viable ECN. On the contrary, orally
given ECN obviously did not induce any adverse effect in adult horses. However, the
results must be carefully discuss with respect to the evident infection with Leptospira
grippotyphosa. Nevertheless, the oral application of probiotic bacteria led to re-
detection of viable ECN in the faeces. Although viable ECN were to be found only at
the first day after the administration had been finished and in two horses only, this
survival must be regarded as a first hint for colonisation. To investigate whether ECN
is able to consistently colonise the gut, further research is need.
Summary The aim of the study was to investigate the tolerance of orally administered E. coli strain Nissle 1917 (ECN) in adult horses and the ability of viable ECN to survive the gastrointestinal passage. 12 adult horses (652 ±19.6 kg BW) were allocated to verum (150x108 viable ECN/d) or placebo, which were given during the first 10 study days (d1-d10). All horses were observed for 25 days (d1-d25). Blood and faeces were sampled at d1 (before the first administration of verum / placebo), d11, d16 and d25. Additionally, faeces were taken at d3, d6, d13 and d20. BW and the microbiological, immunological and biochemical variables in faeces and blood did not indicate any negative ECN-effect. Via cultural serial dilution technique followed by PCR > 5x10⁴ CFU of viable ECN/g faeces were detected in 2 ECN-treated horses at d11.
Literature Blum-Oehler G, Oswald S, Eiteljörge K, Sonnenborn U, Schulze J, Kruis W, Hacker J
(2003): Development of strain-specific PCR reactions for the detection of the probiotic Escherichia coli strain Nissle 1917 in faecal samples. Res Microbiol 154, 59-66
Fuller R (1991): Probiotics in human medicine. Gut 32, 439-442 Malchow HA (1997): Crohn’s Disease and Escherichia coli. J Clin Gastroenterol 25,
653-658 Nissle A (1918): Die antagonistische Behandlung chronischer Darmstörungen mit
Colibakterien. Med Klinik 2, 29-33 Rembacken BJ, Snelling AM, Hawkey PM, Chalmers DM, Axon ATR (1999): Non-
pathogenic Escherichia coli versus mesalazine for the treatment of ulcerative colitis: a randomised trial. Lancet 354, 635-639
von Bünau R, Jäkel L, Schubotz E, Schwarz S, Stroff T, Krüger M (2003): Escherichia coli strain Nissle 1917: Significant reduction of neonatal calf diarrhea. J Dairy Sci (in preparation)
423

Der Einfluss von lebenden Hefezellen auf die Ergebnisse bei Bullen Löhnert, H.-J., Ochrimenko, W I., Lüdke, H. Thüringer Landesanstalt für Landwirtschaft, 07751 Jena-Remderoda Zielstellung Neben verschiedenen anderen Probiotika (z. B. Milchsäurebakterien und Bacillus-
Sporen) gelangen auch Hefezellen in der Bullenmast zum Einsatz. In Versuchen
zeigte sich, dass verschiedene Hefestämme das Wachstum und den Stoffwechsel
von Mikroorganismen im Pansen beeinflussen. Diese Hefestämme könnten somit
das mikrobielle Ökosystem stabilisieren und die Funktion des Pansen optimieren,
besonders in problematischen Situationen durch Hitze, Transport und andere. Bei
Wiederkäuern kann ein ausgewählter Hefestamm große Vorteile bieten, wenn der
Pansen stark beansprucht bzw. die Ration viel Stärke enthält, um Azidose zu redu-
zieren und die Tiergesundheit zu verbessern. Die Wirkungsmechanismen sind teil-
weise unklar und der positive Erfolg des Einsatzes lebender Hefezellen in der Wie-
derkäuerfütterung hängt offenbar von einer Reihe von Faktoren ab. Die Ergebnisse
in der Fütterung sind widersprüchlich. In einem Einzelfütterungsversuch mit 34 Mast-
bullen sollte die Wirkung von lebenden Hefezellen (Saccharomyces cerevisiae;
8 x 10⁹ KBE/g; 4-5 g Biosaf/Tier/Tag) gegenüber einer Kontrollvariante auf Futter-
aufnahme, Lebendmasseentwicklung und ausgewählte Stoffwechsel- und Blutpara-
meter geprüft werden.
Material und Methode Der Einzelfütterungsversuch konnte mit 34 Mastbullen (Schwarzbuntes Rind) mit ei-
ner mittleren Versuchsanfangsmasse von 211 ± 25 kg Tier durchgeführt werden. Die
Tiere wurden in Anbindehaltung auf Teilspaltenboden gehalten. Zu Versuchsbeginn
sind die Tiere entsprechend ihres Alters und der Lebendmasse in die beiden Grup-
pen aufgeteilt worden. Die Ration bestand aus Maissilage ad libitum und einer ent-
sprechend der Körpermasse gestaffelten Konzentratgabe.
150 - 250 kg 1,5 kg Konzentrat/Tier/Tag
250 - 400 kg 2,5 kg Konzentrat/Tier/Tag
400 - 550 kg 3,5 kg Konzentrat/Tier/Tag
424

Die Konzentragmischung hatte folgende Parameter: 891 g T/kg FM, 190 g Rohprote-
in, 12,0 MJ ME/kg T. Die Zusammensetzung der Maissilage war wie folgt: 322 g T/kg
FM, 86 g Rohprotein, 10,90 MJ ME/kg T.
Der Zusatz Biosaf wurde den Prüftieren täglich über eine Vormischung (20 g/Tier und
Tag) auf das Futter verabreicht.
In der Versuchsmitte und zu Ende der Versuchsperiode wurden von je 10 Tieren
Blut- und Harnproben entnommen, um Stoffwechsel- und Blutparameter zu bestim-
men (Tab. 2 und 3).
Nach Erreichen einer Endmasse von ca. 540 kg gelangten die Tiere zur Schlachtung
mit anschließender Ermittlung der Schlachtparameter.
Ergebnisse Der Zusatz von Hefezellen hatte in dem Versuch keinen gerichteten Einfluss auf die
Futteraufnahme zwischen den Gruppen in den einzelnen Versuchsabschnitten bzw.
der gesamten Versuchsperiode (Tab. 1).
Tabelle 1: Mittlere tägliche Aufnahme an Trockenmasse, Rohprotein und Energie der Bullen sowie Aufwandsdaten (1. – 268. Versuchstag; alle Parameter p > 0,05) Gruppe 1 2 Zusatz ohne Biosaf Aufnahme je Tier und Tag Trockenmasse (kg) 7,38 ± 0,43 7,53 ± 0,45 Rohprotein (g) 925 ± 36 939 ± 36 Umsetzbare Energie (MJ) 88,96 ± 4,17 87,63 ± 4,35 Aufwand (je kg LMZ) Trockenmasse (kg) 6,25 ± 0,74 6,24 ± 0,68 Rohprotein (g) 784 ± 65 777 ± 79 Umsetzbare Energie (MJ) 75,45 ± 6,18 72,60 ± 7,80
In den ersten Versuchsperioden (1.- 168. Versuchstag) verzehrten die Tiere der Kon-
trollgruppe 6,76 kg und die mit Biosaf ergänzten Bullen 6,89 kg T/Tier u. Tag
(p>0,05). Innerhalb des Zeitraumes 169. - 268. Versuchstages erhöhten die Tiere der
Gruppen 1 und 2 die Trockenmasseaufnahme um jeweils 0,62 bzw. 0,64 kg/ Tier u.
Tag.
425

Im Mittel des gesamten Versuches (268 Tage) lag die tägliche Aufnahme an umsetz-
barer Energie bei 88,29 MJ/Tier/Tag. Der mittlere Rohproteinverzehr kann mit
932 g/Tier/Tag angegeben werden. Biosaf übte in dem von uns durchgeführten Ver-
such einen nur geringen Einfluss auf die Lebendmassezunahme der Bullen gegen-
über den unbehandelten Tieren aus (Abb. 1).
1221 1179 12071245
500
700
900
1100
1300
1500
1. - 168. Versuchstag 1. - 268. Versuchstag
g/Ti
er/T
ag ohne Biosafmit Biosaf
Abbildung: Mittlere Lebendmassezunahme der Mastbullen (1. – 168. Tag und 1. – 268. Versuchstag; g/Tier/Tag)
Bei der Lebendmassezunahme ergaben sich für den Zeitraum 1. – 168. Versuchstag
eine um 2 % und 1. – 268. Tag ≈ 2,5 % erhöhte Lebendmassezunahme gegenüber
den Kontrolltieren (p > 0,05). Der Energieaufwand kann im Mittel mit 74,02 MJ ME/kg
Lebendmassezunahme angegeben werden (p > 0,05, 1. – 268. Versuchstag, Tab. 1)
und war durch den Zusatz von Biosaf um ca. 4 % gesenkt (p > 0,05).
Tabelle 2: Ausgewählte Stoffwechselparameter im Blutserum von Mastbullen (n = 8; 168. Versuchstag; alle Parameter p > 0,05)
Eiweiß Harnstoff CholesterolAsparat-Amino-
transferaseBilirubin Glukose Gruppe
g/l mmol/l mmol/l nkat/l µmol/l mmol/l
1 ohne
70,8 ± 7,2
2,2 ± 0,9
2,0 ± 0,3
1022 ± 220
1,5 ± 0,4
4,8 ± 0,4
2 Biosaf
68,0 ± 5,3
2,4 ± 0,8
2,1 ± 0,4
908 ± 162
1,5 ± 0,3
4,7 ± 0,4
426

Tabelle 3: Einfluss von Biosaf auf die geprüften Blutbildparameter (n = 12; alle Parameter p > 0,05) Gruppe 1 2 Präparat ohne Biosaf Erythrozyten (x 106/mm³) 6,76 ± 0,79 6,66 ± 0,75 Hämatokrit (%) 38,5 ± 3,5 38,1 ± 2,0 Hämoglobin (g/dl) 11,2 ± 2,3 12,0 ± 1,8 Leukozyten (x 10³/mm³) 8,5 ± 1,4 8,3 ± 1,5 Thrombozyten (x 10³/mm³) 141 ± 36 137 ± 41
Biosaf beeinflusste die untersuchten Stoffwechsel- und Blutbildparameter nicht signi-
fikant (Tab. 2 und 3). Die mitgeteilten Werte entsprechen in beiden Gruppen den in
der Literatur angegebenen Richtwerten für Tiere dieser Altersgruppe und Leistungs-
intensität. Auf die Schlachtkörperkennzahlen übte Biosaf keinen Einfluss aus.
Zusammenfassung In einem Einzelfütterungsversuch mit 34 Mastbullen wurde über einen Zeitraum von 268 Tagen der Einfluss von lebenden Hefezellen (Biosaf, 4 – 5 g/Tier/Tag) auf Fut-teraufnahme, Lebendmasseentwicklung, Tiergesundheit und ausgewählte Stoff-wechsel- und Blutparameter im Vergleich mit unbehandelten Kontrolltieren geprüft. Biosaf übte auf die Futteraufnahme nur einen geringen Effekt aus (p > 0,05). Unter den geprüften Bedingungen konnte über den gesamten Versuchszeitraum bei den mit Biosaf supplementierten Bullen gegenüber den unbehandelten Tieren eine Erhö-hung der Lebendmassezunahme um ca. 2,5 % festgestellt werden. Der Energieauf-wand kann für den gesamten Versuch für die Kontrollgruppe im Mittel mit 74,04 MJ ME/kg Lebendmassezunahme angegeben werden (p > 0,05). Durch die Gabe von Biosaf konnte der Energieaufwand um ca. 4 % gesenkt werden (p > 0,05). Die ge-prüften Stoffwechsel- und Blutparameter lagen für Mastbullen dieser Altersgruppe im Normbereich. Summary In a single feeding trial with 34 fattening bulls over a period of 268 days the influence of supplemented yeast cells (Biosaf; 4 – 5 g/animal/day) on feed consumption, live weight gain, animal health and selected metabolic and blood parameters were tested in comparison with a untreated controlling group. Only a small effect of Biosaf could be observed on feed consumption (p < 0.05). Over the whole tested period as well as at the experimental conditions feeding of Biosaf resulted in an increase of the live weight gain of about 2.5 % comparing with the control group (p > 0.05). The average expenditure of energy of the total experimental period was 74.02 MJ ME/kg live weight gain. It could be reduced by supplementing Biosaf about 4.0 % (p > 0.05). All measured parameters of blood and metabolism were normally for bulls of this age cohort.
427

Effekte von phytogenen Zusätzen und Lebendhefe bei Ferkeln Richter, G.1, Bargholz, J.1, Köhler, H.1, Arnhold, W.2 1 Thüringer Landesanstalt für Landwirtschaft, 07751 Jena-Remderoda 2 BASU Mineralfutter, Bergstraße 1, 99518 Bad Sulza
Problemstellung Im Zuge des geplanten Verbotes der antibiotischen Leistungsförderer nimmt das An-
gebot und die Suche nach alternativen Futterzusätzen stark zu. Neben Probiotika
(LINDERMAYER und PROBSTMEIER,1995; ROTH, 2001), Prebiotika, spezifischen
Antikörpern und Säuren werden in der Ferkelerzeugung Enzyme eingesetzt.
Phytogene Substanzen haben in ihrer Anwendung zugenommen (ALERT u. a., 2002;
HAGEMANN, 2002; HEBELER u. a., 2000; LOGNONE, 2003; RISTIC u. a., 2000;
RODEHUTSCORD und KLUTH, 2002; SCHUMACHER u. a., 2002; WALD, 2002,
2003; WETSCHEREK, 2002).
Für die Produkte werden Vorteile aus ernährungsphysiologischer, tierhygienischer,
ökonomischer und ökologischer Sicht formuliert. Versuche zur Effizienz von Futter-
zusätzen sind unter verschiedenen Bedingungen für die Beratung und Praxis zwin-
gend notwendig.
Material und Methoden In zwei Versuchen mit 108 Börgen im Alter von 21 – 70 Tagen (Versuch A) und 21 –
63 Tagen (Versuch B) in Flatdeck-Haltung mit Spaltenboden wurden die phytogenen
Futterzusätze Biomin P.E.P. 125 und Enteroguard-Starter getestet. Biomin wird als
aromatischer und appetitanregender Futterzusatzstoff, welcher aus multifunktionellen
natürlichen Nährstoffen besteht, beschrieben. Enteroguard-Starter ist eine Kombina-
tion natürlich vorkommender Aromakomponenten. Pro kg Enteroguard-Starter sind
400 g Knoblauchextrakt, 75 g Zimtölextrakt und 525 g Zucker enthalten. Die Ferkel
erhielten Futter mit 125 g Biomin P.E.P. 125 oder 1 000 g Enteroguard jeweils pro
Tonne Mischfutter. Im Versuch A erfolgte auf Empfehlung des Herstellers vom 1. – 5.
Versuchstag die 4-fache (500 g) und vom 6. – 10. Versuchstag die 2-fache Gabe
(250 g) von Biomin.
In zwei Versuchen mit 72 Börgen im Alter von 21 – 63 Tagen (Versuch C) und 28 –
70 Tagen (Versuch D) wurde Biosaf eingesetzt. Biosaf ist eine Lebendhefe, Stamm
SC47, 1010 KBE von Saccharomyces cerevisiae/g Substanz. Im Versuch C wurden
428
dem Futter 1 kg Biosaf/t und im Versuch D dem Ferkelstarterfutter (5. und 6. Le-
benswoche) 1,5 kg und im Ferkelfutter (7. – 10. Lebenswoche) 1 kg Biosaf/t Misch-
futter zugesetzt.
Je Gruppe und Versuch waren 6 Untergruppen á 3 Ferkel verschiedener Genotypen
einbezogen. Die Basalrationen der zweiphasigen Ferkelaufzucht enthielten ein Mine-
ralfutter ohne Leistungsförderer.
Bei der biostatistischen Auswertung der Versuche kam zur Prüfung der Mittelwertdif-
ferenzen der Tukey-Test zur Anwendung.
Ergebnisse - Phytogene Substanzen
Die Supplementation von Ferkelstarter- (21. – 33. Lebenstag) und Ferkelfutter
(33. Lebenstag - Versuchsende) mit den phytogenen Futterzusätzen Biomin und En-
teroguard nahm in beiden Versuchen mit unterschiedlichem Leistungsniveau keinen
gesicherten Einfluss auf die erfassten Leistungs- und Gesundheitsmerkmale unter
den geprüften Bedingungen (Tab. 1 und 2).
Die Ferkel im Versuch A hatten bereits zur Einstallung allgemein eine geringe Vitali-
tät sowie einen unbefriedigenden Gesundheitsstatus (Husten, Augenentzündungen).
Dazu kam mit dem infolge schlechter Sojaqualität ungenügenden Rohprotein- und
Aminosäurengehalt des Futters aller Gruppen ein weiterer nachteiliger Faktor hinzu.
Die Leistungen waren demzufolge unbefriedigend. Aber auch unter diesen ungünsti-
gen Bedingungen brachten die Futterzusätze keine Vorteile. Im Mittel erreichten die
Ferkel 320 g tägliche Zunahme bei einem Futteraufwand von 1,75. Mutmaßlich führte
die vom Hersteller empfohlene höhere Dosis von Biomin in den ersten zehn Tagen
zur ausgeprägten Futterverzehrsminderung, mit t-Test statistisch gesichert. Der Ge-
sundheitsstatus im Laufe des Versuches A wird anhand der Ferkel mit Husten,
Augenentzündungen und Durchfall beschrieben. Ein deutlicher Einfluss der
phytogenen Futterzusätze war allerdings nicht nachweisbar, obwohl bei Enteroguard
tendenziell ein positiver Einfluss auf den Gesundheitsstatus erkennbar war.
429

Tabelle 1: Leistungen von Ferkeln in Abhängigkeit von phytogenen Futterzusätzen
(Versuch A) Kontrolle 125 g
Biomin/t MF 1 000 g Ente- rogurad/t MF
Parameter 0 s " 0 s " 0 s " Körpermassezunahme, g/Tier + Tag 1. - 12. Tag 167 9 116 58 138 38 13. - 28. Tag 226 17 204 39 215 66 29. - 49. Tag 490 41 504 136 491 100 1. - 49. Tag 330 16 311 52 319 53 Futteraufwand, kg/kg Zunahme 1,74 0,10 1,76 0,15 1,76 0,33 Selektion, % 5,6 16,7 5,6 Husten, % der Ferkel 5,6 11,1 0 verklebte Augen, % der Ferkel 16,7 5,6 5,6 Durchfalltiere, % 5,6 0 0 Durchfallbehandlung/beh. Ferkel 3 0 0
Tabelle 2: Leistungen von Ferkeln in Abhängigkeit von phytogenen Futterzusätzen
(Versuch B) Kontrolle 125 g
Biomin/t MF 1 000 g Ente- rogurad/t MF
Parameter 0 s " 0 s " 0 s " Körpermassezunahme, g/Tier + Tag 1. - 12. Tag 257 40 221 111 238 31 13. - 42. Tag 500 55 510 100 480 17 1. - 42. Tag 429 26 424 29 411 15 Futteraufwand, kg/kg Zunahme 1,35 0,10 1,30 0,07 1,36 0,05 Selektion, % 5,6 5,6 0 Durchfalltiere, % 5,6 5,6 5,6 Durchfallbehandlung/beh. Ferkel 1 2 2
- Hefe
In den ersten zwei Versuchwochen verzehrten die Ferkel von dem Ferkelstarterfutter
mit Hefe im Mittel der zwei Versuche 7,4 % weniger Futter. Nach dieser Gewöh-
nungsphase stieg der Futterverbrauch der Ferkel mit hefehaltigem Futter in der drit-
ten bis sechsten Versuchswoche über den der Kontrolltiere (+ 5,3 %). In der sechs-
wöchigen Gesamtperiode verzehrten die Versuchsferkel mit 654 g/Tier und Tag 3,4
% mehr Futter als die Kontrollferkel.
430

Tabelle 3: Leistungen von Ferkeln ohne und mit Biosaf-Zusatz (Versuch C) ohne 1 g Biosaf/
kg Futter Parameter 0 s " 0 s " Körpermassezunahme, g/Tier + Tag 1. - 14. Tag 200 89 174 85 15. - 42. Tag 503 62 543 91 1. - 42. Tag 402 61 420 76 Futteraufwand, kg/kg Zunahme 1,53 0,09 1,45 0,19 Tierabgänge, % 0 0 Durchfalltiere, 1. – 14. Tag, % 0 5,6 Durchfallbehandlung/beh. Ferkel 0 3 Durchfallbehandlung/Gesamttierzahl 0 0,2 Durchfalltage, % der Gesamttage 0 1,2
Tabelle 4: Leistungen von Ferkeln ohne und mit Biosaf-Zusatz (Versuch D)
ohne 1 g Biosaf/ kg Futter
Parameter 0 s " 0 s " Körpermassezunahme, g/Tier + Tag 1. - 14. Tag 214 88 179 84 15. - 42. Tag 599 128 660 91 1. - 42. Tag 470 98 500 69 Futteraufwand, kg/kg Zunahme 1,38 0,04 1,39 0,03 Tierabgänge, % 5,6 13,9 5,6 13,6
In Analogie zur Futteraufnahme erreichten die Ferkel im Mittel der Versuche in der
Starterperiode 14,7 % weniger Körpermasse als die Kontrolltiere. In der dritten bis
sechsten Versuchswoche übertrafen die Zunahmen der „Hefeferkel“ die der Ferkel
mit Standardfutter um 9,1 %. Am Ende de Versuches betrugen die Mehrzunahmen
der „Hefeferkel“ in Versuch C 4,5 % und in Versuch D 6,4 % bei einer mittleren tägli-
chen Zunahme von 448 g/Ferkel (Tab. 3 und 4).
In der gesamten Aufzuchtperiode lag der Futteraufwand der Biosaf-Ferkel bei 1,4, im
Versuch C 5,2 % günstiger und im Versuch D 0,7 % schlechter als bei den Kontroll-
tieren. Der Biosaf-Zusatz beeinflusste nicht nachweislich den Gesundheitsstatus der
Ferkel.
Mittels Differenzrechnung der beeinflussten Leistungen und Kosten (erhöhte Kör-
permassezunahme, veränderter Futterverzehr, Mehrkosten durch Biosaf) ergibt sich
431

durch die Biosaf-Supplementation in den Versuchen C und D ein zusätzlicher Ge-
winn von 1,31 EUR bzw. 1,38 EUR je Ferkel.
Zusammenfassung In zwei Versuchen mit 108 Ferkeln im Alter von 21 – 63 bzw. 70 Tagen nahmen die phytogenen Zusätze „Biomin“ oder „Enteroguard-Starter“ keinen signifikanten Ein-fluss auf die Aufzuchtleistungen und den Gesundheitsstatus der Tiere. Der Zusatz der Lebendhefe „Biosaf“ verbesserte in zwei Versuchen mit 72 Ferkeln im Alter von 21 – 63 bzw. 28 - 70 Tagen die Körpermasse um 5,4 % bei 2,1 % niedrige-rem Futteraufwand. Biosaf erhöhte den Gewinn um 1,34 EUR/Ferkel. Summary Effects of phytogenic additives and living yeast of piglets In two experiments with 108 piglets at the age from the 21st to 63rd day of life and from the 21st to the 70th day of life the supplementation of the diet with phytogenic additives Biomin and Enteroguard-starter did not take a significant effect on the in-vestigated performance and health parameters of the animals. However, in two experiments the supplementation of the diet of 72 piglets at the age from the 21st to 63rd day of life and from the 28th to 70th day of life with the living yeast Biosaf improved the life weight gain by 5.3 % and reduced the feed efficiency by 2.1 %. Biosaf enhanced the profit by 1.34 EUR per piglet. Literatur Alert H-J, Uhlig R, Fröhlich B (2002): Forum angewandte Forschung in der Rinder-
und Schweinefütterung, Fulda, 88–90 Hagemann L (2002): Forum angewandte Forschung in der Rinder- und Schweinefüt-
terung, Fulda, 91 Hebeler D, Möller T, Ewe A, Kamphues J, Amtsberg G (2000): 6. Tagung Schweine-
und Geflügelernährung, MLU Halle-Wittenberg, 64-66 Lindermayer H, Probstmeier G (1995): Kraftfutter, 274–277 Lognone V (2003): Algen in der Tierernährung. Lohmann Information, Heft 3, 13 - 16 Rictic M, Freudenreich P, Dobrowolski A, Branscheid W (2000): 6. Tagung Schwei-
ne- und Geflügelernährung, MLU Halle-Wittenberg, 61–63 Rodehutscord M, Kluth H (2002): Züchtungskunde 74, 445–452 Roth E (2001): Forum angewandte Forschung in der Rinder- und Schweinefütte-
rung, Fulda, 131–132 Schuhmacher A, Hofmann M, Boldt E, Gropp J M (2000): Forum angewandte For
schung in der Rinder- und Schweinefütterung, Fulda, 85–87 Wald C (2002): Untersuchungen zur Wirksamkeit verschiedener ätherischer Öle im
Futter von Aufzuchtferkeln und Broilern. Diss., MLU Halle-Wittenberg Wald C (2003): Gewürze & CO. - eine Übersicht. Lohmann Information, Heft 3, 7 - 11 Wetscherek W (2002): 7. Tagung Schweine- und Geflügelernährung, MLU Halle-
Wittenberg, 60-62
432

Yeast extract as a protein source for weaning piglets Hefeextrakt als Proteinquelle für Absetzferkel Maribo, H.1, Spring, P.2 1The National Committee for Pig Production, Copenhagen, Denmark 2Swiss College of Agriculture, Zollikofen, Switzerland Abstract The aim of the present trial was to evaluate the effect of yeast extract as a protein source for
weaning piglets. The test comprised a total of 545 pigs divided into 33 and 36 replicates per
treatment. The trial lasted from weaning at 4 weeks until 12 weeks of age, but the starter 1 diet
was also offered as creep feed 14 days pre-weaning. The diets were based on wheat, barley,
soy and fishmeal. The diets had the following specifications: Starter 1 (week 4-7): 9.2 MJ NE,
20.8% CP, 1.48% lysine; Starter 2 (week 8-12): 8.9 MJ NE, 19.2% CP, 1.35% lysine. Yeast
extract (Nupro™, Alltech Inc.) was included at 2.5% in the diet replacing fish meal and whey
powder. The production parameters were analyzed as primary parameter and disease
treatments were analyzed as secondary parameter. Data were subjected to an analysis of
variance using the GLM procedures of SAS with the following model: block, housing unit and
group.
Yeast extract led to a significant (P < 0,05) improvement in weight gain (374 g vs. 397 g) and
feed intake. Feed conversion was not affected by diet. Yeast extract significantly reduced
mortality (4.8% vs. 1.4%), however, frequency of medical treatments was not affected by diet.
There was a tendency (P = 0,08) towards an improved production value (gross margin exclusive
product costs).
Yeast extract can help to improve piglet livability and performance when feeding diets without
antimicrobial growth promoters.
Introduction The removal of antibiotic growth promoters from animal production has exacerbated a number of
problems in weaner piglets. Increased post-weaning diarrhoea, increased chronic infections
(Lawsonia intracellularis), increased nutritional overload and reduced utilization of nutrients in
the feed are some of the most critical points which have to be addressed. Experiences from
research trials as well as field observations suggest that multi-factorial approaches are needed.
Aspects of biosecurity, housing, management and nutrition have to be reviewed carefully.
Nutrition, in particularly protein nutrition has to focus on maintaining a well-balanced gastro-
intestinal (GI) microflora. Nutrition has to aim at keeping the amount of indigestible protein low.
433

This is critical for a number of reasons. First, protein acts as a buffer and therefore raises gut
pH, which favors the development of pathogenic bacteria such as E. coli and Clostridia. Second,
protein over load reduces the competition for nitrogen between bacteria. Nutrient competition
has been shown critical in maintaining a well-balanced GI microflora (Rolfe, 1993). Third,
bacterial metabolites from protein fermentation such as ammonia are cytotoxic and can therefore
reduce the health of the gut epithelium (Smulder et al., 2000)
In order to minimize the protein load in the gut the diet has to be formulated with an ideal amino
acid balance using highly digestible ingredients. In addition, restrictive feeding for the first two
weeks after weaning can help to reduce nutrient load in the GI tract.
Animal proteins have a well-balanced amino acid profile and are highly digestible. However, the
ban of some of the animal proteins makes diet formulation more difficult and novel protein
ingredients could be a helpful tool to the nutritionist.
Yeast proteins in particular yeast cell extracts could be used as an alternative to easily digestible
protein sources such as fish meal, milk protein, etc. Yeast extracts are rich in free amino acids
and short chain peptides as the protein is partially hydrolyzed through an autolytic process.
Yeast extract is also rich in nucleotides, which are expected to improve disease resistance by
enhancing gut integrity and the animal's ability to fight viral and bacterial disease (Tibbetts,
2002). During the autolytical process glutamic acid reacts with sodium to form mono-sodium
glutamate. Mono-sodium glutamate is as flavoring agent and might help the piglet to better
overcome the post-weaning lag in feed intake.
The aim of the present trial was to evaluate the effect of yeast extract as a protein source for
weaning piglets.
Material and Methods
Yeast extract was tested in diets fed weaners in the period from weaning at 4 weeks until 12
weeks of age, but the starter 1 diet was also offered as creep feed 14 days pre-weaning. The
test was carried out at one of the Danish National Committee for Pig Production´s experimental
stations Grønhøj (Denmark). The trial included a total of 545 pigs divided into 33 (36) replicates
per treatment. All pens were equipped with slatted floors in two thirds of the pen. Each pen had
one nipple drinker. In the farrowing unit, the sows were divided into two groups and the piglets
were given starter 1 diet from about 14 days of age until weaning. The actual test period was
from weaning (4 weeks) through 12 weeks of age. Starter 1 diet was fed from 4 to 7 weeks of
434

age and starter 2 diet there after (Table 1). Yeast extract (Nupro™, Alltech Inc, Lexington, USA)
was included at 2.5%. In the starter 1 diet yeast extract replaced 2% fishmeal and ~1% whey
powder, in the starter 2 diet ~1.6% fishmeal was replaced by the yeast extract. The diets were
formulated with 5% extra lysine, methionine, cystine, threonine and tryptophan to ensure against
variations in ingredient crude protein content. The rest of the nutrient profile met standards
established in 2000 by the National Committee for Pig Production. Antibiotics or any other
additive were not added to either of the diets. Yeast extract, which is a dry product, was added
directly into the mixer together with vitamins and minerals. Yeast extract was included in the
formulation based on analytical values obtained from Alltech. Treatments of individual pigs for
diarrhoea were according to the guidelines of the herd veterinarian. If more than 50% of the pigs
in a pen suffered from diarrhoea, collective treatments were carried out by giving the pigs
electrolytes in water and antibiotics either through water or feed. The production value was
analysed as primary parameter. Disease treatments were analysed as secondary parameter.
Data were subjected to an analysis of variance using the GLM procedures of SAS with the
following model: block, housing unit and group. Significant differences are stated at 5%. The
results are presented as LS means for each group; and as the pigs were divided in the farrowing
unit, adjustment was not made to the same weight on penning in the calculation. Furthermore,
data were tested for outliers to ensure that no block deviated significantly from the others.
Table 1: Diet composition and calculated nutrient profile of experimental diets
Parameter, % Starter 1 Diet (Week 4-7) Starter 2 Diet (Week 8-12) Control Yeast Extract1 Control Yeast Extract1 Digestive energy (FEs/kg) (MJ NE)
1,19 9,2
1,19 9,2
1,15 8,9
1,15 8,9
Crude protein (%) 20,7 20,9 19,4 19,0 Lysin (g/Kg) 14,8 14,7 13.5 13.5 Wheat 57.88 57.29 58.84 57.64 Barley 7.00 7.12 10.00 10.00 Soyabean, toasted - - 16.13 16.15 Soya protein concentrate 11.61 12.44 - - LT Fishmeal 9.00 7.00 - - Fishmeal - - 7.00 5.37 Whey powder (sweet) 5.00 3.96 - - Yeast extract1 - 2.50 - 2.50 Animal fat 4.24 4.48 3.12 3.25 Molasses, beet 1.80 1.80 1.80 1.80 Vitamins + minerals + AA 3.24 3.41 3.11 3.29 1 Nupro™, Alltech Inc.
435

Results Analytical and calculated nutrient contents differed to some extent. The methionine and
methionine + cystine contents were lower than calculated in all diets, but none exceeded the
latitude of the feedstuff legislation. There was no difference between the two groups in nutritional
content of the diets that could have affect the results of the study.
Yeast extract led to a significant improvement in weight gain (374 g vs. 397 g) and daily feed
intake (Table 2). Hence, feed conversion was not affected by diet. The increase in weight gain
was due to higher feed intake with yeast extract. There was a tendency (p=0,08) towards an
improved production value (gross margin excl. product costs).
Yeast extract significantly reduced mortality (4.8% vs. 1.4%) compared to the control diet
(without antibiotic growth promoter). The causes of death were not investigated in this trial.
There were no differences in the number of days with diarrhoea treatments between the control
group and the test group. The pigs in the test group were treated medically for disease for 2.4
days on average. Of this, 2.0 days constituted treatments for diarrhoea. The majority of the
treatments were carried out in the period before intermediate weighing.
This data indicate that yeast extract can help to improve piglet livability and performance when
feeding diets without antimicrobial growth promoters. More in-depth research will be needed to
define which role the different components of yeast extract play in bringing about the
improvement notices in the present trail. The actuality of the product depends on the price.
Table 2: Effect of yeast extract on piglet performance and livability
Parameter Control Yeast extract P Piglets 261 284 Feed intake (FEs/day) 0,68 0,72 < 0,05 Weight gain 374 397 < 0,05 FCR (FEs/Kg) 1.82 1.82 Ns Production value (DKkr/pig) Index
62,5 100
65,7 105
P=0,08
Mortality, % 4,8 1,4 < 0,05 Treatment, days 2.4 Ns Conclusion Yeast extract can help to improve piglet livability and performance when feeding diets without antimicrobial growth promoters.
436

Literature Smulders,A.C.J.M., A. Veldman and H. Enting, 2000. Effect of antimicrobial growth promoter in
feeds with different levels of indigestible protein on broiler performance. Proceedings of the 12th European Symposium on Poultry Nutrition, WPSA Dutch Branch.
Rolfe, R.D. 1991. Population dynamics of the intestinal tract. In: L.C. Blankenship (Ed.). colonization control of human enteropathogens in poultry. Academic Press, Inc. San Diego CA. Pp. 59-77.
Tibbetts. G.W. 2002. Application of nucleotides from yeast extract. Biotechnology in the Feed and Food Industries, Proceedings of the 18th annual symposium (T.P. Lyons and K.A. Jacques, eds). Nottingham University Press, U.K. pp 435-443.
437

Wirksamkeit NSP-hydrolysierender Enzyme beim Ferkel Richter, G.1, Heller, E.1, Schurz, M.2, Arnhold, W.3
1 Thüringer Landesanstalt für Landwirtschaft, 07751 Jena-Remderoda 2 Lohmann Animal Health, Heinz-Lohmann-Straße 4, 27472 Cuxhaven 3 BASU Mineralfutter GmbH, Bergstraße 1, 99518 Bad Sulza
Problemstellung Die physikalisch-chemischen Eigenschaften der vorrangig in den Zellwänden lokali-
sierten Nicht-Stärke-Polysaccharide (NSP) sind für deren negative Wirkungen bei
Schweinen verantwortlich. Die unlösliche Fraktion der NSP behindert die vollständige
Verdauung von Zellinhaltstoffen (Käfigeffekt), während die lösliche Fraktion in erster
Linie durch eine Erhöhung der Viskosität des Darminhaltes die Verdauung vermin-
dert und letztlich eine ungünstige Veränderung der Exkrementkonsistenz bewirken
kann (BARTELT u. a., 2002; DIEBOLD u. a., 2002; SCHURZ, 2000; SIMON u. a.,
2002). Bei den intensiv wachsenden Ferkeln mit hohem Nährstoffbedarf ist vor allem
bei Gerste und Weizenrationen die Einsatzwürdigkeit der NSP-spaltenden Enzyme
gegeben (HABERER und SCHULZ, 1998; JEROCH u. a., 2000).
Material und Methoden In einem Ferkelversuch mit 6 x 3 Ferkeln (Du x Dän. Hybridsau) je Gruppe wurden in
den Versuchsgruppen 1 bis 3 0, 200 oder 500 g ZY 38/t Mischfutter zugesetzt. Der
verwendete Enzymkomplex ZY 38 enthält Hemicellulase, Pectinase, α-Galactosidase
und β-Glucanase (50 FBG endo-1,3(4)-beta-Glucanase pro Gramm). Das Alter der in
Flat-Deck gehaltenen Ferkel war 21 - 70 Lebenstage. Die Zusammensetzung der
Rationen wird in Tabelle 1 mitgeteilt. Die Ferkel erhielten in der zweiphasigen Auf-
zucht in den ersten 2 Wochen Ferkelstarter (FS) und danach Ferkelfutter (F) in
schrotförmiger Form ad libitum. Der Gehalt an Sonnenblumenextraktionsschrot und
Melasseschnitzel wurde zur Erhöhung des Faseranteiles gewählt.
Zur biostatistischen Verrechnung der Ergebnisse wurden die Varianzanalyse und zur
Prüfung der Mittelwertdifferenzen der Tukey-Test und zusätzlich zwischen den Grup-
pen 1:2 und 1:3 der t-Test verwendet (WEBER, 1986).
438

Tabelle 1: Zusammensetzung der Rationen (g/kg Futter) Komponenten Ferkelstarter Ferkelfutter Weizen Gerste Weizengrießkleie Sojabohnen Sojaex 44 Magermilchpulver Sonnenblumenextraktionsschrot Melasseschnitzel (18 % Zucker) Sojaöl Mineralfutter
435 125 35
120 105 60 40 20 25 35
516 125 50 -
140 -
69 40 25 35
Ergebnisse Die Supplementation des Ferkelstarterfutters mit 500 g ZY 38/t Futter verminderte in
den ersten zwei Wochen die Futteraufnahme um 11,5 % (Tab. 2). Der Unterschied
ist mit dem t-Test statistisch zu sichern. In der dritten und vierten Versuchswoche
betrug der Minderverzehr in dieser Gruppe im Vergleich zur Kontrollgruppe 1 noch
4,9 %. Auch in Gruppe 2 mit 200 g ZY 38/t Futter lag der Futterverzehr etwas niedri-
ger als bei den Kontrollprobanden. In der fünften bis siebten Versuchswoche ver-
zehrten die „Enzymferkel“ mehr Futter als in der Kontrollgruppe. In der gesamten Pe-
riode lag der Minderverzehr in den Gruppen mit 200 bzw. 500 g ZY 38/t Mischfutter
bei 0,2 % bzw. 1,1 %.
Tabelle 2: Futterverzehr und Futteraufwand in Abhängigkeit von der Enzym-
supplementation Gruppen
1 2 3 Enzymzusatz g/t Mischfutter
0 200 500 Parameter 0 s " 0 s " 0 s " Futterverzehr, g/Tier und Tag 1. – 14. Tag 15. – 28. Tag 29. – 49. Tag 1. – 49. Tag
252 530 927 621
27 24 57 29
249 518 936 620
24 11 54 32
223x 504 949 614
10 44 40 27
Futteraufwand, kg/kg Zunahme 1. – 14. Tag 15. – 28. Tag 29. – 49. Tag 1. – 49. Tag
1,43 2,58 2,02 2,03
0,22 0,18 0,14 0,13
1,51 2,45 1,82x 1,89x
0,27 0,33 0,12 0,09
1,43 2,21x 1,92 1,91
0,15 0,16 0,14 0,12
x p < 0,05 zur 0-Gruppe
439

Die eingestallten männlichen Ferkel hatten eine ausgeglichene Körpermasse von
7,30 kg. In den ersten zwei Wochen mit Ferkelstarter erreichten die Ferkel der En-
zymgruppen in Analogie zum Futterverzehr nicht die Körpermassezunahme der Kon-
trolltiere ohne Zusatz (Tab. 3, p > 0,05). Ab dritter Versuchswoche lagen die Zunah-
men der Ferkel in den Gruppen 2 und 3 über denen der Kontrolltiere. In der gesam-
ten siebenwöchigen Aufzuchtperiode betrugen die Mehrzunahmen der Ferkel mit 200
g ZY 38/t Futter 7,2 % und bei 500 g ZY 38/t Futter 5,2 %. Im Mittel des Versuches
erreichten die Ferkel mit 319 g täglicher Zunahme nur ein niedriges Niveau, welches
aber auf die Basalration zurückzuführen war. Darauf weist auch die relativ hohe
Streuung der Einzelwerte hin. In den Enzymgruppen ist die Standardabweichung der
Einzelwerte in der Körpermassezunahme niedriger als in der Kontrollvariante, was
ein gleichmäßiges Wachstum der Ferkel anzeigt.
Tabelle 3: Körpermassezunahme und Diarrhoe von Ferkeln in Abhängigkeit von
der Enzymsupplementation (p > 0,05) Gruppe
1 2 3 Enzymzusatz g/t Mischfutter
0 200 500 Parameter 0 s " 0 s " 0 s " Körpermassezunahme, g/Tier und Tag 1. – 14. Tag 15. – 28. Tag 29. – 49. Tag 1. – 49. Tag relativ
177 206 458 306 100
88 67 138 89
165 211 515 328
107,2
67 69 97 62
157 228 494 322
105,2
61 41 99 55
Tierabgänge, % Durchfalltiere, % Durchfallbehandlung/behandeltes Tier
0 11,1
2
- - -
0 0 0
- - -
0 0 0
- - -
Außer in der Gruppe 2 im ersten Versuchsabschnitt benötigten die „Enzymferkel“ in
allen Versuchsabschnitten weniger Futter zur Körpermassesynthese (Tab. 2). In der
dritten und vierten Versuchswoche lag der Futteraufwand in der Gruppe 3 mit 500 g
ZY 38/t Futter mit 14.4 % signifikant niedriger als bei den Kontrolltieren. Mit dem t-
Test lassen sich die Unterschiede in der 5. – 7. Versuchswoche und in der gesamten
Aufzuchtperiode im Futteraufwand zwischen den Gruppen 1:2 statistisch sichern. In
der gesamten Aufzuchtperiode verbesserte sich der Futteraufwand in den Gruppen
mit 200 bzw. 500 g ZY 38/t Futter um 6,9 % bzw. 5,9 im Vergleich zur Kontrollgruppe
ohne Zusatz.
440

Im siebenwöchigen Versuch mit Ferkeln waren keine Tierabgänge infolge von Morta-
lität oder Selektion nachzuweisen (Tab. 3). Es gab auch keine wesentlichen gesund-
heitlichen Problem bei den Ferkeln. Nur in Gruppe 1 ohne Enzymzusatz hatten 2
Ferkel (11 %) Durchfall, der mit zwei Behandlungen je erkranktes Tier therapiert
werden konnte.
Zusammenfassung In einem Fütterungsversuch mit 54 männlichen Ferkeln im Alter von 21 – 70 Lebens-tagen erfolgte die Prüfung von 0, 200 bzw. 500 g ZY 38/t Mischfutter. Analog dem Futterverzehr nahmen die Ferkel in den ersten zwei Wochen mit enzymergänzten Futter weniger zu als die Kontrolltiere. Ab dritter Versuchswoche erreichten die „En-zymferkel“ höhere Körpermassezunahmen als die Kontrolltiere. In der gesamten Auf-zucht betrugen die Mehrzunahmen bei 200 bzw. 500 g ZY 38/t Futter 7,2 % bzw. 5,2 %. Der Futteraufwand konnte durch Enzymsupplementation um 6,9 % bzw. 5,9 % verbessert werden. Im Versuch gab es keine Tierabgänge. 11 % der Tiere in der Kontrollgruppe wurden gegen Diarrhoe behandelt, bei den „Enzymtieren“ war kein Durchfall nachweisbar. Summary The effect of NSP-hydrolysing enzymes of piglets An experiment was carried out with 54 male piglets at the age from the 21st to 70th day of life to investigate the supplementation with none, 200 and 500 g ZY38/t mixed feed. In accordance to the feed intake the life weight gain was reduced in piglets with enzyme supplementation compared to the control group during the first two weeks. From the 3rd week the life weight gain of the piglets with enzyme supplementation was higher than in the none supplemented group. During the whole raising period the life weight gain was enhanced by 7.2 % in piglets with 200 g ZY38/t feed, and by 5.2 % in piglets with 500 g ZY38/t feed and furthermore, their feed efficiency was im-proved by 6.9 % and 5.9 %. During the experiment neither a loss of piglets caused by mortality or selection nor health problems were detected. However, 11 % of the pig-lets of the control group were treated for diarrhoe whereas no diarrhoe was regis-tered in animals with an enzyme supplemented diet. Literatur Bartelt J, Swiech Eva, Buraczewska Lucyna, Simon O (2002): 7. Tagung Schweine-
und Geflügelernährung, MLU Halle-Wittenberg, 87–89 Diebold G, Mosenthin R, Sauer W C (2002): 7. Tagung Schweine- und Geflügeler-
nährung, MLU Halle-Wittenberg, 177–179 Haberer B, Schulz E (1998): Übers. Tierernährg., 26, 25–64 Jeroch H, Alert H-J, Kluge H (2000): 6. Tagung Schweine- und Geflügelernährung,
MLU Halle-Wittenberg, 206–208 Schurz M (2000): DGS-Magazin, 52, Nr. 5, 27-30 Simon O, Hübener Katrin, Hirsch Kerstin, Beckmann L, Vahjen W (2002): Lohmann
Information, Heft 1, 3–7 Weber E (1986): Grundriss der biologischen Statistik. VEB Gustav-Fischer-Verlag,
Jena, 7. Auflage
441

Effects of Dietary Phytase Supplementation on Growth Performance and Zinc Availability in Broiler Chickens Fed Low-Zinc Diets Paulicks, B.R. 1), Broz, J. 2), Roth-Maier, D.A. 1) 1) Division of Animal Nutrition, Technical University Munich, Hochfeldweg 6,
D-85350 Freising-Weihenstephan, Germany 2) Roche Vitamins Ltd, CH-4070 Basle, Switzerland
Introduction
The supplementation of phytase to broiler diets, generally used to improve the avail-
ability of dietary phosphorus might also improve availability of essential trace ele-
ments like Zn, Mn, Fe, and Cu, which are also bound in indigestible complexes to
phytate. This is of high practical relevance, since the environmental charge with Zn
and Cu is increasing rapidly, probably leading to severe problems in the future.
Therefore, the present study was designed to test the effect of two different phytase
preparations (Roche Vitamins Ltd., Basle, Switzerland), phytase A, a 6-phytase, and
phytase B, a 3-phytase, on the growth performance of broiler chickens and the
bioavailability of Zn from native compounds of broiler feed.
Materials and Methods
The trial was conducted over 5 weeks with 72 male Ross broiler chickens. After 5
days of adaptation they were randomly distributed to 4 treatments (18 replicates) and
were kept individually in wired cages. Zn content of water was less than 1 mg Zn per
liter. The trial comprised four diets consisting of 60.3 % corn, 9.1 % canola meal, 10
% corn gluten meal, 7 % soybean meal, 5 % potato protein, 3.6 % soybean oil, 1 %
amino acid premix, and 3.5 % vitamin-mineral-premix (without Zn); 0.5 % diatoma-
ceous earth (Celite 545, Merck, Germany; 99.4 % acid-insoluble ash) were included
as indicator for Zn metabolizability. This diet was used for treatment I without further
supplementation, for treatment II with 750 U/kg phytase A, for treatment III with 500
U/kg phytase B, and for treatment IV with 100 mg/kg Zn. These phytase supplemen-
tations followed the recommendations of the producer. All nutrients (21.1 % total
protein, 1.3 % lys, 0.96 % met+cys, and 13.1 MJ AME per kg) and minerals (0.9 %
Ca, 0.6 % total P, 0.38 % digestible P) with the exception of zinc were in line with
recommendations (GFE 2000). The native phytase activity of the basal diet was low
(< 50 U/kg). All four diets were pelleted without steam at temperatures below 70 °C.
442

During the final 5 experimental days, samples of excreta were collected from each
animal to calculate Zn metabolizability. Also individual blood samples were collected
from each animal and the left femur was separated. Feed and excreta samples were
analyzed for dry matter, acid–insoluble ash and crude ash according to German
standard methods of feedstuff analysis. Zinc and calcium were measured by atomic
absorption spectrography (AAS). Blood plasma was analyzed for Zn content (AAS)
and for Zn binding capacity. Coefficients of apparent digestibility of dry matter, crude
ash, zinc and calcium were calculated from the accumulation of acid-insoluble ash in
the excreta compared with the feed (indicator method). The complete femur bones
were ashed and Zn content was determined by AAS.
Results
There were no significant differences in growth performance between the treatments
(see Table). However, chickens with Zn supplementation had the highest weight gain
(65 g/d) and highest final body weight (2396 g), which was not reached in the other
treatments (61 g daily weight gain, 2270 g final body weight) even with phytase sup-
plementation. There was no visible depression in feed consumption due to the low
dietary Zn content in treatment I. Feed-to-gain conversion, i. e. kg feed consumption
per kg weight gain, was significantly better with Zn supplement and phytase B sup-
plement than for the basal diet or the phytase A supplement.
Zinc contents in blood plasma and in femur were significantly lower with the low-Zn
diet than with Zn supplementation (treatment IV). Enzyme supplementation resulted
in intermediate values, i.e. a significant increase compared to treatment I without
reaching the level of treatment IV. Zinc binding capacity in blood plasma showed
complementary reactions to Zn concentration and was high with the low-Zn diet, low
with Zn supplementation, and intermediate with enzyme supplementation.
There were no treatment effects on the metabolizability of dry matter, averaging 76
%. For the metabolizability of Zn, negative values were calculated for treatment I and
treatment II (phytase A), a coefficient of almost zero (-3) for treatment III (phytase B)
and a metabolizability of 19 % for treatment IV.
443

Treatment I II III IV Supplement none Phytase A Phytase B Zn P < Dietary Zn (mg/kg) 28 28 28 104 Dietary phytase activity (U/kg) < 30 690 467 < 30 Weight gain (g/d) 61 60 62 65 0.08 Feed-to-gain conversion 1.79 a 1.74 a 1.66 b 1.64 b 0.0001 Zn in blood (µg/ml) 1.21 c 1.51 b 1.54 b 1.93 a 0.0001 Zn in femur (µg/g) 49 c 63 b 63 b 87 a 0.0001 Zn binding capacity (%) 70 a 63 b 62 b 57 c 0.0001 Zn metabolizability (%) -47 b - 49 b - 3 a 19 a 0.0001 a,b,c Means with different superscripts differ significantly (P < 0.05; Student-Newman-Keuls test)
Discussion
In the present experiment the broiler chickens showed no obvious symptoms of Zn
deficiency despite a slightly lower growth performance, although the dietary Zn con-
centration of 28 mg/kg (treatment I, II, and III) provided only about 50 % of the rec-
ommended 50 mg/kg (GfE, 2000). However, these recommendations include some
safety margin and they are established for the whole range of practical diet compo-
nents, which often contain a lot of phytate impairing the availability of P and also of
Zn. The components of the present diet contained low concentrations of Zn, of native
phytase, and of phytate, too. Therefore, the mineral availability probably was higher
than in commercial broiler diets. However, more sensitive parameters, such as Zn
concentrations in blood and femur showed very low values, indicating that the dietary
Zn supply in treatment I was marginal. In that case, phytase supplementations im-
proved Zn availability significantly and increased Zn contents in the organism.
Nevertheless, the level of treatment IV was never reached, what must not be re-
garded as a symptom of deficiency. The Zn contents in blood and bone generally
reflect the level of the Zn supply without indicating the requirement.
So far both phytase preparations revealed comparable efficiency, but with regard to
digestion and bioavailability of Zn, there were significant differences between both
supplements. Zn contents in excreta were much lower with phytase B (136 µg/g DM)
than with phytase A (190 µg/g DM) leading to an equalized Zn-balance with phytase
B. In contrast to the 3-phytase B, the 6-phytase A was apparently not able to make
phytate-bound Zn available for broiler metabolism. Zn excretion exceeded Zn intake
as the birds had to mobilize Zn from tissues (liver, muscle), where Zn had been
444

stored during previous weeks. This indicates, that phytase B has been more potent
than phytase A in the degradation of phytate releasing native dietary Zn from indi-
gestible Zn phytate complexes and transferring insoluble Zn into bioavailable Zn. Ap-
parently these results are in contrast to those of an analogous experiment conducted
with piglets (Windisch et al. 2003), but can be explained with the different kinds of
phytase. The pH-optimum of the used 6-phytase (phytase A) is different from that
one of the used 3-phytase (phytase B).
In conclusion it can be stated, that the addition of phytase to broiler diets in order to
improve phosphorus availability, also enhances the bioavailability of zinc. Supple-
mentations of Zn to broiler feed exceeding the former recommendations of 40 mg/kg
are generally not necessary. As the 3-phytase B moreover improved the economi-
cally relevant feed conversion, phytase supplementation in general should be rec-
ommended for broiler diets. This can be a further contribution to reduce environ-
mental pollution caused by animal production.
Summary
72 male 5-days-old broiler chickens (Ross) were equally distributed to 4 treatments. For treatment I a feed mixture low in Zn was used (per kg: 211 g CP, 13.1 MJ AME, 28 mg Zn). For treatment II, III, and IV this diet was supplemented with either 750 U/kg phytase A (6-phytase), 500 U/kg phytase B (3-phytase) or 100 mg Zn, resp. Animal performance, Zn status parameters, and Zn metabolizability were recorded after 35 experimental days. Growth performance was not affected by the treatments. Both phytases increased Zn contents of blood and bones significantly compared with the low-Zn diet. Phytase B (3-phytase) was more efficient than phytase A (6-phytase) and improved also feed-to-gain conversion and Zn metabolizablity. Summarizing, Zn contents of broiler diets exceeding the recommended 40 mg/kg are not necessary particularly when phytase is added to the diet.
Literature
GfE – Ausschuss für Bedarfsnormen der Gesellschaft für Ernährungsphysiologie (2000): Empfehlungen zur Energie- und Nährstoffversorgung der Legehennen und Masthühner (Broiler) 1999. DLG-Verlag, Frankfurt/Main, Germany
Windisch W, Broz J, Roth F X (2003): Effect of microbial phytase on the bioavail-ability of zinc in piglet diets. Proc. Soc. Nutr. Physiol. 12, 33
445

Effects of two different microbial phytases in plant based diets for Nile tilapia (Oreochromis niloticus) Portz, L., Liebert, F. Institute for Animal Physiology and Animal Nutrition, Kellnerweg 6, D-37077 Göttingen. Tilapia species are used in commercial farming systems in almost 100 countries and are
developed to the most important fish for aquaculture in this century (Fitzsimmons, 2000).
Tilapia are omnivores fishes and they take advantage of plant feedstuffs. However,
about two-thirds of the plant phosphorus is present in the form of phytates (Eeckhout
and Paepe, 1994), which are not available for the fish. Consequently, the poor
degradation of phytates leads to a great amount of phosphorus excretion also in fish
farming systems. Chelating of phytic acid, mainly with divalent mineral cations (such as
Ca2+, Mg2+, Zn2+, Cu2+, Fe2+), reduces mineral availability dramatically (Paratryphon et
al., 1999). In addition, phytates form sparingly digestible phytate-protein complexes are
also reducing the availability of dietary protein and amino acids (Sugiura et al., 2001).
The incorporation of microbial phytase in the diet can compensate the antinutritional
effects to a great extent. The purpose of the present study was to compare the effects of
two different sources of microbial phytase on parameters of performance, nutrient
digestibility and nutrient deposition in plant based diets for Nile tilapia.
Material and Methods The plant based basal diet (0.15% non-phytate P) was supplemented with the microbial
phytases SP 1002 CT and Ronozyme® P5000 CT (Roche Vitamins Ltd, Basel,
Switzerland) at levels of 500, 750, 1000, 1250 FTU/kg (Table 1). A control diet (0.88%
total P) was supplemented with inorganic phosphorus (1.5 g/kg) from mono-sodium-
phosphate (NaH2PO4). As an indigestible marker 0.3% TiO2 was incorporated. The trials
were conducted in indoor facilities with a closed water recirculating system equipped
with totally 48 circular plastic tanks (50 l water volume). Pure male Oreochromis niloticus
juveniles (BW 13.50g) were stocked in 40 tanks (25 fish per tank), four replicate groups
for each treatment were used. During the experimental period (60 d) the feeding was 3
times/day until apparent satiation. Performance and nutrient deposition data were
evaluated based on following parameters: Feed conversion ratio FCR (g/g); Specific
growth rate SGR (%); Protein efficiency ratio PER (%); Protein and energy deposition
446

(% of intake). The apparent nutrient digestibility was measured in 6 sedimentation
systems (0.15m3 per system) according to Fassbender (1990). Triplicate groups of 10
tilapia (BW 110g) were fed 3 times/day and feces collection was conducted 4 hours after
each feeding using an external sedimentation column. Experimental data were analyzed
as one-way completely randomized designs, submitted to ANOVA (P < 0.05) and
Tukey’s test using the SAS (1985) statistical package.
Table 1: Composition of the basal diet*
Ingredients (%) Soybean meal (49,95% protein) 24.50 Wheat gluten 11.50 Corn 22.50 Wheat 32.50 Soybean oil 4.00 Vitamin and mineral mix 1.00 L-Lysine-HCl 1.10 DL-Methionine 0.90 Calcium carbonate 1.00 Carboxy methyl cellulose 1.00 TOTAL 100.00
* 30.23% crude protein; 19.68 MJ/kg GE; 0.41% total phosphorus
Results Growth data (Table 2) show that final body weight, FCR, SGR and PER were
significantly different (P < 0.01) after supplementation of both phytase sources and
inorganic-P. The most pronounced effect on performance was attained with the
incorporation of 750, 1000 and 1250 FTU/kg from phytase SP 1002. However, the effect
of inorganic P addition on performance was not significantly different from
supplementation of 500 FTU/kg phytase SP 1002. The addition of Ronozyme® P5000
resulted in limited effects on growth and FCR, which where significantly different from
supplementation of SP 1002 at similar phytase activity. Protein deposition (% of intake)
was maximized after the diet with inorganic P and supplementation of 750, 1000 and
1250 FTU/kg of phytase SP 1002. Energy deposition (% of intake) was significantly
decreased for negative control diet, 500 FTU/kg SP 1002 and all Ronozyme® P5000
supplemented diets (Table 3).
447

Table 2. Growth parameters of Tilapia fed diets supplemented with microbial phytase
Phytase (FTU/kg) supplemented/analyzed* Parameters (n=4)
Average weight (g) SP 1002 CT Ronozyme P5000 CT Initial Final
FCR SGR PER
500/767 13.3 79.8 bc 1.20 bc 2.98 cd 22.2 bc 750/1107 13.4 92.4 a 1.10 ab 3.21 ab 26.3 a
1000/1438 13.5 93.7 a 1.09 ab 3.22 a 26.7 a 1250/1753 13.5 95.2 a 1.09 ab 3.25 a 27.2 a
500/941 13.6 68.3 d 1.37 e 2.68 ef 18.2 d 750/1080 13.5 69.6 d 1.33 de 2.72 e 18.7 d 1000/1455 13.5 73.6 cd 1.22 cd 2.82 de 20.0 cd 1250/1731 13.6 73.8 cd 1.22 cd 2.81 de 20.1 cd
Negative control (no phytase added) 13.6 60.3 e 1.84 f 2.51 f 15.7 e
Positive control (inorganic P added) 13.3 84.6 b 1.04 a 3.04 bc 23.7 b
Pooled SEM ** 0.02 6.23 0.06 0.03 0.71 ANOVA (Pr > F) 0.0830 0.0001 0.0001 0.0001 0.0001 * Roche Vitamins Ltd **) SEM: standard error of means Table 3. Apparent digestibility and nutrient deposition of Tilapia fed diets supplemented
with microbial phytase.
Phytase (FTU/kg) supplemented/analyzed
Apparent digestibility (1) (%) Nutrient deposition rates (4)
SP 1002 CT Ronozyme P5000 CT DM (2) CP (3) Calcium Phosphorus Protein Energy
500/767 74.6 93.2 d 44.2 ab 60.6 d 40.4 bcd 30.3 b 750/1107 74.1 95.8 a 47.6 a 64.6 cd 44.0 ab 35.4 a 1000/1438 74.4 95.3 ab 48.4 a 70.8 ab 44.1 ab 35.1 a 1250/1753 74.8 95.6 a 49.6 a 75.7 a 42.8 abc 35.3 a
500/941 74.5 93.7 d 37.6 bc 50.0 e 34.6 d 27.7 b 750/1080 74.2 94.9 ab 48.0 a 65.0 cd 36.7 cd 28.3 b 1000/1455 74.5 95.3 ab 49.6 a 67.4 bc 40.4 bcd 30.5 b 1250/1731 74.2 94.6 bcd 50.7 a 73.0 a 40.0 bcd 30.7 b
Negative control (no phytase added) 74.5 91.1 e 31.0 c 43.1 f 25.6 e 19.3 c
Positive control (inorganic P added) 74.4 94.4 bcd 46.7 a 75.6 a 47.0 a 36.8 a
Pooled SEM (5) 0.03 0.56 1.89 1.76 1.32 1.76 ANOVA (Pr > F) 0.2912 0.0001 0.0001 0.0001 0.0001 0.0001 (1) Means (n =3) with same superscripts are not significantly different.(2) Dry Matter. (3) Crude protein. (4) Deposition in (%) of intake. (5) SEM: standard error of means
448

The apparent digestibility of protein, calcium and phosphorus was significantly (P < 0.01)
improved after supplementation of both sources of phytase and inorganic phosphorus
addition (Table 3). The results indicate that the effect of phytase SP 1002 on digestibility
parameters was more pronounced but the differences between the sources of microbial
phytase were mostly numerical.
Conclusion Supplementation of 750 FTU/kg of the microbial phytase SP 1002 in plant based low-P
diets for Tilapia resulted in growth and nutrient utilization similar to supplementation of
inorganic phosphorus. Further investigations are needed to explain discrepancies in the
efficiency of different sources of phytase and to make final conclusions about the
efficient supplementation level for practical applications.
Summary Two experiments were conducted with a plant based diet containing 0.45% P (0.18% NPP). A positive control diet (0.81% P; 0.53% NPP) was supplemented with NaH2PO4. Two different sources of microbial phytase (SP 1002 vs. RONOZYME®5000) with graded levels of supplementation (0, 500, 750, 1000, 1250 FTU/kg) were investigated for 60 days with juvenile Nile Tilapia (average BW 13.50g) in four repetition tanks. A digestibility trial run parallel to the growth trial using 0.3% TiO2 as an indigestible marker. Significant improvements (P<0.01) were found for growth, feed conversion ratio, protein efficiency ratio, specific growth rate and apparent nutrient digestibility. Microbial phytase SP1002 resulted in more pronounced effects on growth and nutrient utilization of Tilapia. References EECKHOUT W, DE PAEPE M, (1994): Total phosphorus, phytate-phosphorus and
phytase activity in plant feedstuffs. Anim. Feed Sci. Technol. 47, 19-29. FASSBENDER U, (1990): Untersuchungen zur Energetischen Futterwertermittelung
beim Fisch. Diss.Univ. Göttingen, Germany. FITZSIMMONS K, (2000): Tilapia: The most important aquaculture species of the 21st
century. In: Fitzsimmons, K. and Filho, J.C. (ed.), Proceedings from the Fifth International Symposium on Tilapia Aquaculture, Rio de Janeiro, Brazil, Vol. 1, 3-8.
PAPATRYPHON E, HOWELL R.A, SOARES JR J H, (1999): Growth and mineral absorption by striped bass Morone saxatilis fed a plant feedstuff based diet supplemented with phytase. J. World Aquac. Soc. 30, 161-173.
SUGIURA S H, GABAUDAN J, DONG F M, HARDY R W, (2001): Dietary microbial phytase supplementation and the utilization of phosphorus, trace minerals and protein by rainbow trout Oncorhynchus mykiss (Walbaum) fed soybean meal-based diets. Aquac. Res. 32, 583-592.
SAS (1985): SAS User’s Guide: Statistics. 5th edition SAS Institute, Cary, NC, USA.
449

Effects of the enzyme product RONOZYME® WX on performance and jejunal viscosity of broiler chickens fed wheat-based diets Philipps, P., Aureli, R., Klünter, A.-M. Roche Vitamines France, Research Centre for Animal Nutrition, B.P. 170, F-68305 Saint-Louis Cedex Introduction The anti-nutritive effects of certain non-starch polysaccharides (NSP) in the
endosperm cell walls of several cereals, such as wheat, rye, barley, triticale, oats,
and their influence on the gut viscosity are documented in the literature (Choct and
Annison 1990; 1992; Annison and Choct, 1991; Choct et al., 1992). The objective of
the present trials was to evaluate the effects of RONOZYME® WX, a granulated
enzyme product containing endo-1,4-ß-xylanase as a main activity, on the growth
performance of broiler chickens fed wheat-based diets. Several dosages of the
enzyme product were tested in a cage trial and in two floor-pen trials.
Materials and methods In the cage trial (day 8-22) 480 broiler chickens ("PM3"), separated by sex, were
divided into groups of 8 birds per cage. In the floor-pen trial A (day 1-36) 800 day-old
broiler chickens were divided into groups of 20 birds per pen. In the floor-pen trial B
(day 1-36) 264 day-old broiler chickens were divided into groups of 22 birds per pen.
In the cage trial and in floor-pen trial B each treatment was replicated with 12 groups,
6 groups of each sex. In floor-pen trial A there were 8 replicates per treatment with 4
groups of each sex. The growth performance of the chickens was determined and at
the end of the experiments, the viscosity of the jejunal content was measured in
selected chickens.
In all trials the basal diets contained about 40 % wheat and 20 % rye (Table 1). The
feed was pelleted at about 70° C. In the cage trial the feed was supplemented with 0,
50, 100, 200 and 400 mg RONOZYME® WX (CT) per kg, in floor-pen trial A with 0,
100, 150 and 200 mg per kg, and in floor-pen trial B with 0 and 200 mg per kg,
respectively. For the statistical evaluation, a two-factorial analysis of variance
(factors: treatment and sex) was carried out. Where significant treatment effects (p <
0.05) were indicated, the differences among treatment means were analyzed with the
Newman-Keuls test.
450

Results and discussion The determined product contents, analyzed on the basis of xylanase-activity, were in
agreement with the target values in both trials. In the control feed, the analyzed
xylanase-activities were below the detection limit (< 20 ppm).
Cage trial
The pooled results of both sexes showed a numerically improved weight gain (2.3 to
4.7 %), a significant effect was obtained for the dosage of 200 ppm (Table 2). The
feed conversion ratio (FCR) in the treatments with 200 and 400 ppm RONOZYME®
WX was significantly improved by about 2 % compared to the control. The treatment
with 100 ppm showed a numerically improved FCR (1.5 %). The jejunal viscosity at
day 22 was in the treatments with enzyme supplementation clearly reduced in a
dose-dependent manner (1.7 to 21.2 %).
Table 1: Feed composition of the experimental diets Ingredients (%) Cage Floor-pen trial A Floor-pen trial B trial Starter Grower Starter Grower Wheat Rye Soybean meal (50 % CP) Bran Fish meal (70 % CP) Soybean oil Lard DL-Methionine L-Lysine DCP, CaCO3, NaCl, Premix
41.0 20.0 23.0 2.4 5.0 2.3 3.0 0.2 0.1 3.0
37.3 20.0 33.8 --- ---
4.5 ---
0.2 0.1 4.1
40.0 20.0 31.6 --- ---
5.0 ---
0.1 ---
3.3
38.0 20.0 32.6 --- ---
5.0 ---
0.2 0.1 4.1
41.9 20.0 29.7 --- ---
5.0 ---
0.1 ---
3.3
Analyzed contents Crude protein (g/kg) Soluble fibres (g/kg) Insoluble fibres (g/kg)
210 9
126
210 17
119
200 21 109
208 28 108
202 20 106
Calculated contents MEN
1 (MJ/kg) Lysine (%) Methionine + Cystine (%)
12.8 1.2 0.9
12.3 1.2 0.9
12.5 1.0 0.8
12.2 1.0 0.8
12.5 1.0 0.8
1 Metabolisable energy N-corr., calculated on the basis of the analyzed crude nutrients Floor pen trial A
The pooled results of both sexes showed a numerical improvement in the weight gain
of the birds supplemented with the enzyme (at 200 ppm: 4.5 %) (Table 3). The feed
conversion ratio was in the treatments with 100 and 200 ppm RONOZYME® WX
451

significantly improved by about 2.7 and 3.9 % compared to the control. The treatment
with 150 ppm showed a numerically improved FCR (1.8 %). The viscosity of the
jejunal content at day 36 was reduced by the supplementation of RONOZYME® WX.
The highest effects were found in the treatments supplemented with 100 ppm (9.9 %)
and 200 ppm (18.1 %). Floor pen trial B
The supplementation with the enzyme improved significantly weight gain (5.9 %),
feed intake (3.2 %) and feed conversion ratio (2.5 %) (Table 4). The viscosity of the
jejunal content at day 36 was reduced by supplementation of RONOZYME® WX by
17.2 %.
Conclusions The supplementation of RONOZYME® WX improved the growth performance,
especially the feed conversation ratio in the trials. A reduced viscosity of the jejunal
content was observed at day 22 (cage trial) and at day 36 (floor-pen trials), which
may at least partly explain the improved growth performance.
Summary In a cage trial (day 8 to day 22) and in two floor-pen trials with broiler chickens (day 1 to day 36) the dose-related effects of the enzyme product RONOZYME® WX (CT) on growth performance were investigated using wheat / rye / soybean meal diets. The product was tested at 0, 50, 100, 200 and 400 ppm in the cage trial, in floor-pen trial A at 0, 100, 150 and 200 mg per kg, and in floor-pen trial B at 0 and 200 mg/kg, respectively. The enzyme supplementation resulted in clear beneficial effects on performance parameters in all trials. RONOZYME® WX (CT) significantly improved the feed conversion ratio at dosages from 100 to 400 ppm. In agreement with the improved performance data RONOZYME® WX also reduced the viscosity of the jejunal content of broiler chickens at day 22 (cage trial) and at day 36 (floor-pen trials). References ANNISON, G. AND CHOCT, M. (1991) Anti-nutritive activities of cereal non starch-
polysaccharides in broiler diets and strategies minimizing their effects, World’s Poultry Science Journal 47, 232-242
CHOCT, M. AND ANNISON, G. (1990) Anti-nutritive activity of wheat pentosans in broiler diets, British Poultry Science 31: 811-821
CHOCT, M. AND ANNISON, G. (1992) Anti-nutritive effect of wheat pentosans in broiler chickens: roles of viscosity and gut microflora, British Poultry Science 33: 821-834
CHOCT, M., ANNISON, G. AND TRIMBLE, R.R. (1992) Soluble wheat pentosans exhibit different anti-nutritive activities in intact and cecectomized broiler chickens, Journal of Nutrition 122: 2457-2465
GRIMMERSOFT (1995) StatBoxPro, Version 5.0, Manuel d'utilisation
452

Table 2: Performance (day 8-22) and jejunal viscosity (at day 22) of broiler chickens in the cage trial (mean of pooled results for both sexes2)
Product Control RONOZYME® WX (CT) Dose (mg/kg)
- 50 100 200 400
Weight gain
(g/bird) 740 B 760 AB 759 AB 775 A 757 AB (%) 100 102.7 102.6 104.7 102.3
Feed intake
(g/bird) 1067 A 1094 A 1077 A 1093 A 1067 A (%) 100 102.5 100.9 102.4 100.0
Feed conversion
(g feed/g gain) 1.442 AB 1.440 AB 1.420 AB 1.411 B 1.410 B
(%) 100 99.9 98.5 97.9 97.8Jejunal viscosity1
(m·Pa·s)
(%)
2.38 A
100
2.34 A
98.3
2.00 B
83.9
1.93 B
81.0
1.88 B
78.8
Table 3: Performance (day 1-36) and jejunal viscosity (at day 36) of broiler chickens in the floor-pen trial A (mean of pooled results for both sexes)
Product Control RONOZYME® WX (CT) Dose (mg/kg) - 100 150 200 Weight gain
(g/bird)
(%)
2166A
100
2220 A
102.5
2204 A
101.7
2263 A
104.5 Feed intake
(g/bird)
(%)
3542 A
100
3533 A
99.7
3541 A
99.9
3554 A
100 Feed conversion
(g feed/g gain)
(%)
1.638 A
100
1.593 B
97.3
1.609 AB
98.2
1.574 B
96.1Jejunal viscosity1
(m·Pa·s)
(%)
2.76 A
100
2.49 AB
90.1
2.62 A
94.7
2.26 B
81.9
Table 4: Performance (day 1-36) and jejunal viscosity (at day 36) of broiler chickens in the floor-pen trial B (mean of pooled results for both sexes)
Product Control RONOZYME® WX (CT) Dose (mg/kg) - 200 Weight gain
(g/bird)
(%)
2163B
100
2292 A
105.9 Feed intake
(g/bird)
(%)
3461 B
100
3572 A
103.2 Feed conversion
(g feed/g gain)
(%)
1.604 A
100
1.564 B
97.5Jejunal viscosity1
(m·Pa·s)
(%)
3.064 A
100
2.536 B
82.8 2 Means within a row, not sharing a common superscript, are significantly different (p < 0.05). 1 Mean of both sexes, three pooled samples per treatment and sex, each sample pooled from three chickens.
453

Untersuchung zum Einfluss von Kreatin auf das Wachstum von Broilern Halle, I. Institut für Tierernährung, Bundesforschungsanstalt für Landwirtschaft (FAL) Bundesallee 50, 38116 Braunschweig, Germany Einleitung Kreatin ist eine körpereigene Substanz, im menschlichen und tierischen Körper. Ein
Teil der täglich benötigten Menge an Kreatin wird durch Eigensynthese gebildet und
der andere Teil kann mit der Nahrung aufgenommen werden. Die hauptsächlichen
Kreatinquellen sind dabei Muskelfleisch und Fisch. Aufgrund der wichtigen Rolle von
Kreatin beim Energietransport in der Skelett-Muskulatur wird die Substanz seit
längerer Zeit im Sport zur Steigerung der Muskelkraft eingesetzt (Mertschenk u. a.,
2001). In der Tierernährung liegen wenige Erfahrungen zur Bedeutung von Kreatin
als Futterbestandteil vor.
Das Ziel dieser Untersuchung bestand deshalb darin den Einfluss von Kreatin im
Mastfutter auf das Wachstum von Broilern zu prüfen.
Material und Methoden Für den Versuch wurden 400 männliche Broiler (Lohmann Meat) als Eintagsküken in
eine Käfigmastanlage eingestallt. Die Prüfperiode umfasste 28 Tage. Jeder
Versuchsgruppe wurden 10 Käfige mit je 8 Tieren zugeteilt. Die Zusammensetzung
der Futtermischung ist aus Tabelle 1 abzulesen.
Tabelle 1: Zusammensetzung und wertbestimmende Inhaltsstoffe (g/kg)
Weizen / Mais 553,0
Sojaöl 29,0
Soja 372,5
Mineralstoffe / Vitamine 41,4
Methionin / Lysin 4,1
Kreatinmonohydrat 0/1/2/5/10
Rohprotein 21,5
ME (MJ/kg) 12,80
Das Kreatinmonohydrat wurde der Futtermischung in einer Menge von 0 / 1 / 2 / 5 /
10 g zugesetzt. Die statistische Auswertung der Merkmale erfolgte unter
Verwendung des Programmpaketes SAS 6.12. Der Mittelwertvergleich wurde mit
454

dem Student-Newman-Keuls-Test mit einer Irrtumswahrscheinlichkeit von P<0,05
durchgeführt.
Ergebnisse Die Ergebnisse des Wachstumsversuches sind aus der Tabelle 2 abzulesen.
Tabelle 2: Ergebnisse des Wachstumsversuches an Broilern
(Mittelwert, +Standardabweichung) (P>0,05)
Versuch 1
Kontrolle 0,1 %
Kreatin
0,2 %
Kreatin
0,5 %
Kreatin
1,0 %
Kreatin
Lebendmasse 1. Tag, g/Broiler
1. Tag 44,0 +2 44,0 +1 43,9 +1 44,2 +1 44,1 +1
Futteraufnahme, g/Broiler/Tag
1.-21.Tag 56,4 +1 56,7 +3 56,1 +3 57,2 +2 56,3 +2
Zunahme, g/Broiler/Tag
1.-21.Tag 43,3 +2 43,5 +3 43,9 +2 43,9 +2 43,3 +2
Lebendmasse 21. Tag, g/Broiler
21. Tag 952 +40 957 +61 965 +48 965 +34 953 +33
Futteraufwand, kg/kg
1.-21.Tag 1,304 +0,04 1,306 +0,03 1,279 +0,04 1,305 +0,04 1,302 +0,02
Futteraufnahme, g/Broiler/Tag
1.-28.Tag 78,6 +3 79,2 +6 77,3 +4 79,7 +4 77,3 +5
Zunahme, g/Broiler/Tag
1.-28.Tag 53,3 +3 53,9 +4 52,3 +3 54,0 +2 52,1 +3
Mastendmasse, g/Broiler
28. Tag 1536 +77 1552 +122 1508 +85 1555 +48 1503 +82
Futteraufwand, kg/kg
1.-28.Tag 1,476 +0,05 1,472 +0,08 1,481 +0,09 1,480 +0,11 1,484 +0,06
Die Broilerküken wiesen am Versuchsbeginn eine ausgeglichene Lebendmasse auf.
Die tägliche Futteraufnahme der Broiler bis zum 21. Lebenstag lag zwischen
56 – 57 g und bis zum 28. Lebenstag zwischen 77 – 80 g und war in allen Gruppen
gleich. Resultierend draus war die tägliche Lebendmassezunahme weder bis zum
455

21. Lebenstag noch bis zum 28. Lebenstag gesichert unterschiedlich zwischen den
Gruppen. Am 21. Lebenstag erreichten die Broiler eine Lebendmasse von
952 – 965 g und am Versuchsabschluss von 1503 – 1555 g. Der Futteraufwand war
sowohl bis zum 21. als auch bis zum 28. Lebenstag gleich. Eine Dosis-
Wirkungsbeziehung zwischen den Kreatingruppen wurde nicht ermittelt.
Schlussfolgerungen Die Supplementierung von Kreatin in vier Stufen führte zu keinen gesicherten
Verbesserungen in der Futteraufnahme, in der täglichen Lebendmassezunahme und
im Futteraufwand bei männlichen Broilern während einer 28tägigen Mastperiode.
Eine Dosis-Wirkungsbeziehung zwischen den Kreatingruppen wurde nicht ermittelt.
Summary Study on the effect of Creatine on growth performance of broiler chickens Creatine is a substance occurring naturally in the animal body. The major proportion of the total Creatine pool is found in skeletal muscle. Creatine supplementation has become very popular in sports among athletes to enhance muscle performance and muscle mass. The present study was focused on the observation of the growth performance of male growing broiler chickens in dependence on Creatine feeding. In the Experiment Creatine supplementation didn’t show clear growth promoting effects. The broilers’ body weights at 21 days of age were 952 – 965 g and at 28 days of age 1503 – 1555 g. No effects on the feed conversion could be shown at 21 days and 28 days of age. Literatur Mertschenk B., Gloxhuber, Ch., Wallimann, T., 2001: Gesundheitliche Bewertung
von Kreatin als Nahrungsergänzungsmittel. Deutsche Lebensmittel-Rundschau, 97, Heft 7, 250-257
456

Methoden zur instrumentellen und sensorischen Charakterisierung von Bitterstoffen mit funktionellen Eigenschaften in Eisbergsalat Meier, J.1, Flick, G.2, Schulze, D.2 Fachhochschule Neubrandenburg University of Applied Sciences, Department of Technology1, Department of Agriculture2, Brodaer Str. 2, 17033 Neubrandenburg, Germany Einleitung und Zielsetzung Blattsalate genießen beim Verbraucher einen wachsenden Zuspruch. Der beim
Konsumenten als angenehm empfundene Geschmack von Salat beruht nach
Vogel (1996) auf dem Gehalt an organischen Säuren einschliesslich Weinsäure
und Bitterstoffen. Hinsichtlich der letztgenannten Stoffgruppe werden vor allem die
Sesquiterpenlactone Lactucin und Lactucopikrin genannt, die auch funktionelle
Eigenschaften besitzen (Mazza und Oohmah, 2000; Wildman, 2001). Teuscher
und Lindequist (1987) beschreiben Lactucin und Lactucopikrin als Ursache für den
Bittergeschmack bei Cichorium intybus (Chicorée) und Lactuca sativa
(Eisbergsalat). Beiden Substanzen werden auch sedative Wirkungen
zugeschrieben (Teuscher und Lindequist, 1987). Nach Vogel (1996) wurde
Gartensalat schon im Altertum als schlaffördernd eingestuft. Erhöhter
Bittergeschmack von Blattsalaten kann aber zu einer negativen Beurteilung durch
die Konsumenten führen und sich damit absatzmindernd auswirken.
Da aus der Literatur Sortenabhängigkeiten bei Asteraceen bekannt sind, sollten im
Rahmen der vorliegenden Untersuchungen die relevanten Bitterstoffe zweier
Blattsalate analytisch bestimmt werden. Ferner war zu prüfen, ob beim
Lebensmittelmodell Eisbergsalat unterschiedliche instrumentell messbare Bitter-
stoffgehalte auch sensorisch wahrgenommen werden können und ob ein
mathematischer Zusammenhang zwischen instrumentellen und sensorischen
Daten ermittelt werden kann.
Material und Methoden Im ersten Teil der Untersuchung sollten Bitterstoffe mittels instrumenteller Analytik
bestimmt werden. Die im Rahmen dieser Untersuchung verwendete Technik zur
Lactucinbestimmung richtet sich in der Probenvorbereitung hauptsächlich nach
der bei Franz und Köhler (1992) beschriebenen Methode. Die Bedingungen für die
457

HPLC wurden von Tamaki et al. (1995) abgeleitet. Folgende HPLC - Parameter
wurden verwendet:
Fließmittel : Methanol / Wasser – Gradient 0 – 17 min linear ansteigend von 10% Methanol und 90% Wasser auf 100% Methanol und 0% Wasser 17 – 20 min 100% Methanol und 0% Wasser 20 – 25 min linear fallend auf 10% Methanol und 90% Wasser
Flussrate : 1 ml/min Säule : RP 18; ODS 2 ; 5µm ; 250 x 4,6 mm Temperatur : 35°C Detektor : UV 244-260 nm (Diodenarray) Probenmenge : 20 µl
Für die Kalibrierung wurden die Substanzen Santonin von der Firma Roth als im
Handel zu beziehende Vergleichssubstanz sowie Lactucin und Lactucopikrin
(dank freundlicher Bereitstellung durch K. H. Gensch, FU Berlin) verwendet. Es
wurden 4 Standards mit jeweils unterschiedlichen Konzentrationen der zu
bestimmenden Substanzen hergestellt und mehrmals gemessen.
Um im zweiten Teil der Untersuchungen Unterschiede der Salate im
Bittergeschmack festzustellen, wurde die Rangordnungsprüfung (Meilgaard et al.,
1999; Stone und Sidel, 1993; DIN 10963) als analytische sensorische Methode
gewählt. Die Produkte wurden von 18 Prüfpersonen untersucht, die bereits eine
sensorische Grundausbildung (vgl. DIN 10961) von 3 Monaten absolviert hatten.
Die Personen waren zusätzlich eingehend auf die Prüfaufgabe und das Prüfgut
geschult worden. Die Untersuchungen fanden in speziellen Sensoriklaboren mit
separaten Kabinen für jede Prüfperson statt (vgl. DIN 10962). Die Temperatur
(20 ° C) und die relative Luftfeuchtigkeit wurden während der Prüfung durch
Klimatisierung der Räume konstant gehalten.
Aufgabe der Prüfpersonen war es, die fünf Proben nach dem Bittergeschmack zu
ordnen. Den Prüfern wurden pro Durchgang fünf jeweils mit einer dreistelligen
Zufallsziffer codierte und mit Salat gefüllte, transparente Kunststoffbecher
gereicht. Der Salat war vorher chargenweise zerkleinert (Streifenbreite: 5 mm) und
durchmischt worden. Somit war gesichert, dass in einer Prüfprobe Außen- wie
Innenblätter einer Salatsorte enthalten waren. Die Reihenfolge der
Probenanordnung je Probensatz wurde randomisiert, um eventuelle
Reihenfolgeeffekte auszuschließen. Die Untersuchungen wurden mit zweifacher
458

Wiederholung durchgeführt. Die Prüfpersonen erhielten bei Bedarf zusätzliche
Mengen der jeweiligen Prüfproben. Zur Neutralisierung des Geschmackseindrucks
zwischen zwei Prüfproben wurde den Prüfern standardisiertes Mineralwasser
ohne Kohlensäure und Knäckebrot gereicht. Die Daten der Rangordnungsprüfung
wurden durch den Friedmann-Test und den Page-Test statistisch untersucht.
Ergebnisse Mit der im ersten Teil der Studie entwickelten Methode wurde Lactucin in
Eisbergsalat und Chicorée bestimmt und die Eignung der Methode festgestellt.
Der Lactucingehalt in Chicorée war erwartungsgemäß höher als im Eisbergsalat.
Die einzelnen Ergebnisse sind in Tabelle 1 dargestellt.
Tab.1: Lactucingehalte von Eisbergsalat- und Chicoreeproben
Probe Trockenmasse in % Lactucingehalt in mg/kg (Frischmasse)
Lactucingehalt in mg/kg (Trockenmasse)
Lactuca sativa (Eisbergsalat)
4,6 0,32 6,98
Cichorium intybus (Chicorée)
5,7 2,63 46,18
Im zweiten Teil der Untersuchung wurde der Lactucingehalt von 5
Eisbergsalatproben (P 1 – P 5) mit der oben beschriebenen HPLC - Analytik
bestimmt und mit den Ergebnissen der sensorischen Rangordnungsuntersuchung
verglichen. In Tabelle 2 werden die Ergebnisse der chemischen und der
sensorischen Untersuchung dargestellt. Der Korrelationskoeffizient (rs) zwischen
beiden Ergebnisreihen beträgt 0,95.
Tab. 2: Lactucingehalt und Bittergeschmack von Lactuca sativa gemessen mit chemischen (HPLC) und sensorischen Methoden (Rangordnungsprüfung)
Probe Lactucingehalt in mg/kg (Trockenmasse)
Bittergeschmack (Rangsumme)
P 1 5,26 118,0 P 2 3,39 87,5 P 3 6,21 133,0 P 4 3,32 69,5 P 5 5,95 117,0
459

Schlussfolgerungen Die mit der HPLC bestimmten Bitterstoffgehalte von Salatpflanzen können als ein
Prognosekriterium für den zu erwartenden Bittergeschmack der untersuchten
Sorten herangezogen werden. Hierdurch wird es möglich, die Sortenwahl positiv
zu beeinflussen und den Verbrauchererwartungen anzupassen.
Summary Instrumental and sensory methods to characterize bitter compounds with functional properties in iceberg lettuce The bitter taste of iceberg lettuce can lead to a negative reaction on the part of the consumer and so have a deleterious effect on marketing. As the literature refers to variations among the varieties of Asteraceen, this study attempts to ascertain whether measurable amounts of bitter substances can also be perceived sensorically. The relevant bitter substances were determined analytically using HPLC; at the same time the sensoric properties of the plants were judged employing objective methods. There was a correlation between bitter substance content as measured by HPLC and sensorically perceived bitterness, particularly for Lactucin. Thus determination of bitter substances can be regarded as a criterion for choosing varieties with a view to the taste of the resultant product. Literatur Franz, G.; Köhler, H.(1992): Drogen und Naturstoffe, Berlin, Heidelberg, New York Mazza, G.; Oohmah, B. D. (Ed.)(2000):Herbs, Botanicals & Tea, 1st Edition
Lancaster: Technomic Publishing Company Meilgaard, M., Civille, G., Carr, T.(1999): Sensory Evaluation Techniques. 3rd
Edition Boca Raton: CRC Press Stone, H., Sidel, J. (1993): Sensory Evaluation Practises. 2nd Edition San Diego,
Academic Press Wildman, R. (Editor) (2001): Handbook of Nutraceuticals and Functional Foods,
1st Edition Boca Raton: CRC Press Tamaki, H.; Robinson, R. W.; Anderson, J. L.; Stoewesand, G.S. (1995):
Sesquiterpene Lactones in Virus-Resistant Lettuce, J Agric Food Chem, 43, 6-8
Teuscher, E.; Lindequist, U.(1987): Biogene Gifte, Stuttgart, New York Vogel, G.(1996): Handbuch des speziellen Gemüsebaus, Stuttgart
460

Bioactive compounds in sea buckthorn juices and nectar – investigation of their stability under standardized storage conditions Netzel, M.1, Strass, G.1,2, Allmann, S.1, Kranl, K.1, Böhm, V.1, Bitsch, I.2, Bitsch, R.1 1Institute of Nutrition, Friedrich-Schiller-University Jena, Dornburgerstrasse 29, 07743 Jena, Germany 2Institute of Nutrition, Justus-Liebig-University Giessen, Wilhelmstrasse 20, 35392 Gießen, Germany Introduction: The strong association between increased fruit and vegetable intake
and the prevention of several diseases (e.g. cancer and coronary heart disease) has
been attributed to the high content of antioxidant phytonutrients in these foods. Sea
buckthorn as well as its products are rich sources of antioxidants both hydrophilic
and lipophilic. The oral administration of sea buckthorn juice decreased the
susceptibility of LDL to oxidation in humans (Kallio et al. 2002). The purpose of the
present study was to determine the effects of different storage conditions on the
antioxidant capacity and the stability of bioactive compounds in sea buckthorn juices
and nectar.
Material and Methods: The commercially produced juices (J1, J2, J3) and the
nectar (N) were stored under the following conditions: AI (opened bottles in the
refrigerator [darkness, 5°C]); AII (opened bottles in the refrigerator including an UV-
light exposure of 10 min/ week); BI (opened bottles at room temperature [darkness,
22°C]); BII (opened bottles at room temperature including an UV-light exposure of
10 min/ week). The hydrophilic antioxidant capacity was measured with the
Trolox Equivalent Antioxidant Capacity (TEAC) assay (Miller et al. 1993) and the
bioactive compounds were determined by HPLC (once a week over a period of 4
weeks): ascorbic acid (AA; Vazquez-Oderiz et al. 1994), isorhamnetin-3-glycosides [glucoside and rutinoside; I-3-Glyc] (Schieber et al. 2002), and
tocopherols [α-, β-, γ- and δ-tocopherol] (Balz et al. 1993). Furthermore, the juice
and nectar samples were analysed for total polyphenols by using the Folin-
Ciocalteu method (Singleton & Rossi 1965). The analytical data of the “study
beverages” were summarized in table 1.
461

Table 1. Antioxidant capacity and bioactive compounds in the investigated sea buckthorn juices and the nectar at time zero (T0-values, beginning of the storage period).
analytical parameters
“beverages” storage conditions TEAC
(mmol/l) Total
Phenols (g/l)
AA (g/l)
I-3-Glyc (g/l)
Tocoph. (mg/l)
J1
AI AII BI BII
40.1 38.3 38.6 39.3
8.1 8.1 7.4 7.8
3.0 3.0 3.1 3.4
2.1 1.9 2.1 2.1
4.4 4.8 4.9 4.7
J2
AI AII BI BII
16.7 15.1 16.4 14.7
3.6 3.7 3.9 3.8
1.6 1.6 1.6 1.6
0.59 0.55 0.56 0.55
22.8 23.6 22.7 21.8
J3
AI AII BI BII
30.3 29.9 32.2 27.1
4.4 4.3 4.8 5.4
2.1 2.0 2.3 2.3
0.55 0.54 0.54 0.52
30.9 29.7 29.5 32.2
N
AI AII BI BII
3.0 2.9 2.8 2.6
0.74 0.76 0.78 0.75
0.12 0.13 0.12 0.12
0.15 0.14 0.14 0.14
8.6 8.7 9.1 9.5
Results: Between 59 % and 91 % of the original hydrophilic antioxidant capacity
remained in the juices/ nectar after 4 weeks of storage under the described
conditions (Fig. 1). The decrease of antioxidant capacity is probably due to the
decreased content of ascorbic acid and total phenols (Fig. 2 and 3). Maximally 81 %
of the ascorbic acid was lost within 4 weeks, but only 28 % of the total phenols. In
contrast to the total phenols, the stabilities of isorhamnetin-3-glucoside and
isorhamnetin-3-rutinoside, as the major flavonoid compounds in sea buckthorn and
sea buckthorn products, were high and in the same order of magnitude (losses
between 1 and 15 % for both flavonoid glycosides).
88 87 91 85 82 82 77 79
59 64 66 72 81 73 76 79
0
20
40
60
80
100
120
J1AI J1AII J1BI J1BII J2AI J2AII J2BI J2BII J3AI J3AII J3BI J3BII NAI NAII NBI NBII
%
Fig. 1. Relative changes in antioxidant capacity (TEAC) in sea buckthorn juices and nectar after a storage period of 4 weeks (conditions described above). T0-values were calculated as 100%.
462

74 72 77 72
101
82 79 84 85 88 83 77
51
19
69
32
0
20
40
60
80
100
120
J1AI J1AII J1BI J1BII J2AI J2AII J2BI J2BII J3AI J3AII J3BI J3BII NAI NAII NBI NBII
%
Fig. 2. Relative changes in ascorbic acid content in sea buckthorn juices and nectar after a storage period of 4 weeks (conditions described above). T0-values were calculated as 100%.
89
72
89 83 92 85 86 82 92 94 92 85 95 84 79 82
0
20
40
60
80
100
120
J1AI J1AII J1BI J1BII J2AI J2AII J2BI J2BII J3AI J3AII J3BI J3BII NAI NAII NBI NBII
%
Fig. 3. Relative changes in total polyphenols in sea buckthorn juices and nectar after a storage period of 4 weeks (conditions described above). T0-values were calculated as 100%.
The antioxidant capacity of the investigated sea buckthorn juices and the nectar was
mainly attributed to the polyphenols and the ascorbic acid, which were present in
the highest amounts. The contribution could be confirmed by the high correlation (>
0.9) between their concentrations in the “beverages” and the corresponding TEAC
values. Regarding the tocopherols, no clear changes could be found in the content
of these lipophilic antioxidants during the 4 weeks of storage of either juices or
nectar (Fig. 4).
463

86 85 82 88 100
100
104
108
87 97 112
106
93 93 86 87
0
20
40
60
80
100
120
J1AI J1AII J1BI J1BII J2AI J2AII J2BI J2BII J3AI J3AII J3BI J3BII NAI NAII NBI NBII
%
Fig. 4. Relative changes in tocopherol content in sea buckthorn juices and nectar after a storage period of 4 weeks (conditions described above). T0-values were calculated as 100%.
Conclusion: In general, no significant differences could be observed in the stability
of the bioactive components of the juices and the nectar as well as between the
different storage conditions. Further studies on storage conditions affecting the
antioxidant capacity and the bioactive compounds in sea buckthorn products are in
preparation. As a “closing remark” it should be mentioned, that the excellent
combination of hydrophilic and lipophilic antioxidants makes the sea buckthorn an
interesting “material” for nutritional investigation as a potential candidate for
functional foods.
Summary: Three Commercially produced sea buckthorn juices and 1 nectar were stored under different conditions (opened bottles in the refrigerator +/- UV-light exposure/ opened bottles at room temperature +/- UV-light exposure) over a period of 4 weeks. The hydrophilic antioxidant capacity (TEAC assay) and the major bioactive compounds (total polyphenols, isorhamnetin-3-glycosides, ascorbic acid and tocopherols) were analysed once a week. In general, no significant differences could be observed in the stability of the investigated bioactive components of the juices and the nectar as well as between the different storage conditions.
References Balz MK, Schulte E, Thier HP (1993): Fat Sci Technol, 95, 215-220 Kallio H, Yang B, Peippo P (2002): J Agric Food Chem, 50, 6136-6142 Miller NJ, Rice-Evans C, Davis MJ, Gopinathan V, Milner A (1993): Clin Science, 84, 407-
412 Schieber A, Keller P, Streker P, Klaiber I, Carle R (2002): Phytochem Analysis, 13, 87-94 Singleton VL, Rossi JA (1965): Am J Enol Vitic, 16, 144-158 Vazquez-Oderiz ML, Vasquez-Blanco ME, Lopez-Hernandez J, Simal-Lozano J, Romero-
Rodriguez MA (1994) JAOAC Int, 77, 1056-1059
464

Anthocyanins and metabolites in human urine after ingestion of a concentrated elderberry juice Netzel, M.1, Sonntag, S.1, Straß, G.1,2, Bitsch, I.2, Bitsch, R.1 1Institute of Nutrition, Friedrich-Schiller-University Jena, Dornburgerstrasse 29, 07743 Jena, Germany 2Institute of Nutrition, Justus-Liebig-University Giessen, Wilhelmstrasse 20, 35392 Gießen, Germany Introduction: Anthocyanins are water-soluble glycosides and acylglycosides of
anthocyanidins, which are polyhydroxyl and polymethoxyl derivatives of 2-
phenylbenzopyrylium or flavylium salts. These flavonoids are mainly distributed
among flowers, fruits and vegetables and are responsible for the bright colours that
occur in flower petals, fruits and other plant organelles. Much attention has been
paid to the antioxidant activity of anthocyanins, since epidemiological surveys and
animal studies showed a close relationship between the consumption of flavonoids
and a reduced incidence of cancer and heart diseases. The anthocyanin
metabolism, however, is still not fully understood. In the present study, the urinary
excretion of anthocyanins and anthocyanin-metabolites of seven healthy subjects
was measured, after ingestion of an concentrate elderberry juice, rich in
anthocyanins (Figure 1).
R1 R2
cya-3-sam-5-gluc Sambubiose Glucose
cya-3,5-digluc Glucose Glucose
cya-3-sam Sambubiose H
cya-3-gluc Glucose H Fig. 1. chemical structures of elderberry anthocyanins.
Material and Methods: After an overnight fasting, seven healthy non-smoking
volunteers (6 women and 1 man with a mean body mass index of 21.5 kg/m2)
consumed a bolus quantity of 150 ml of a concentrated elderberry juice (containing
3.57 g of total anthocyanins), together with white rolls and cheese. HPLC-DAD
analyses of urinary samples (0-5 h post-ingestion) were performed before and after
hydrolysis of glucuronid-conjugates by ß-glucuronidase (Netzel et al. 2001; Bub et
al. 2001; Wu et al. 2002) (Figure 2).
OOH
O
O
OHOH
H
R1R2
+
465
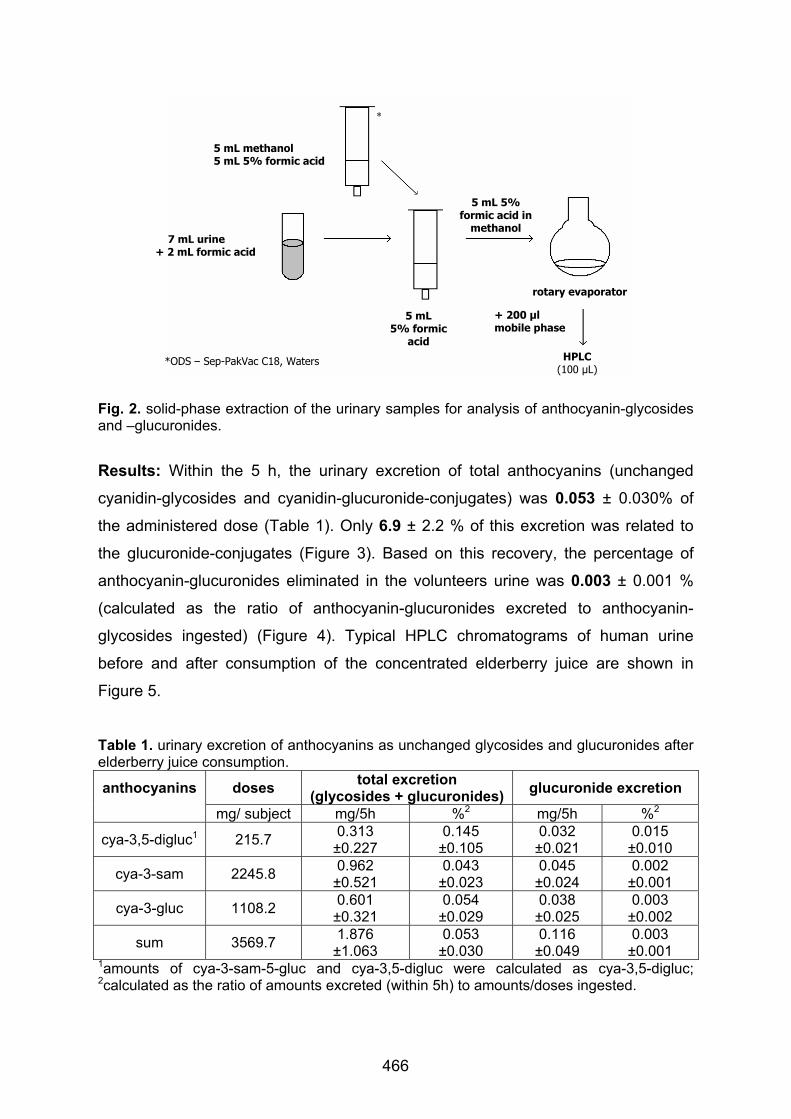
Fig. 2. solid-phase extraction of the urinary samples for analysis of anthocyanin-glycosides and –glucuronides.
Results: Within the 5 h, the urinary excretion of total anthocyanins (unchanged
cyanidin-glycosides and cyanidin-glucuronide-conjugates) was 0.053 ± 0.030% of
the administered dose (Table 1). Only 6.9 ± 2.2 % of this excretion was related to
the glucuronide-conjugates (Figure 3). Based on this recovery, the percentage of
anthocyanin-glucuronides eliminated in the volunteers urine was 0.003 ± 0.001 %
(calculated as the ratio of anthocyanin-glucuronides excreted to anthocyanin-
glycosides ingested) (Figure 4). Typical HPLC chromatograms of human urine
before and after consumption of the concentrated elderberry juice are shown in
Figure 5.
Table 1. urinary excretion of anthocyanins as unchanged glycosides and glucuronides after elderberry juice consumption.
doses total excretion (glycosides + glucuronides) glucuronide excretion anthocyanins
mg/ subject mg/5h %2 mg/5h %2
cya-3,5-digluc1 215.7 0.313 ±0.227
0.145 ±0.105
0.032 ±0.021
0.015 ±0.010
cya-3-sam 2245.8 0.962 ±0.521
0.043 ±0.023
0.045 ±0.024
0.002 ±0.001
cya-3-gluc 1108.2 0.601 ±0.321
0.054 ±0.029
0.038 ±0.025
0.003 ±0.002
sum 3569.7 1.876 ±1.063
0.053 ±0.030
0.116 ±0.049
0.003 ±0.001
1amounts of cya-3-sam-5-gluc and cya-3,5-digluc were calculated as cya-3,5-digluc; 2calculated as the ratio of amounts excreted (within 5h) to amounts/doses ingested.
*
5 mL methanol 5 mL 5% formic acid
7 mL urine + 2 mL formic acid
5 mL 5% formic
acid
5 mL 5% formic acid in
methanol
rotary evaporator
+ 200 µl mobile phase
HPLC (100 µL)
*ODS – Sep-PakVac C18, Waters
466

0
200
400
600
800
1000
1200
1400
0 1 2 3 4 5 6Time [h]
Excr
etio
n ra
te [µ
g/h]
anthocyanins(total)glucuronides
Fig. 3. time-course plots (mean ± SD) of anthocyanins(total) and anthocyanin-glucuronides in human urine following ingestion of 150 ml of elderberry juice; anthocyanins(total): glycosides + glucuronides.
0
500
1000
1500
2000
2500
3000
3500
1 2 3 4 5 6 7Volunteers
Excr
etio
n ra
te (µ
g/5h
)
anthocyanins (total)glucuronides
Fig. 4. Individual urinary excretion rates of anthocyanins(total) and anthocyanin-glucuronides following ingestion of 150 ml of elderberry juice; anthocyanins(total): glycosides + glucuronides.
467

Fig. 5. HPLC chromatograms of human urine (subject 4) collected before (A) and 1 h (B) after the consumption of 150 ml of a concentrated elderberry juice.
Conclusion: These results are in accordance with previous works (Wu et al. 2002),
but completely different with respect to the other flavonoids (like quercetin and
catechin). It will be necessary to perform further studies to determine the exact sites
of conjugation and if possible, to evaluate the antioxidative potential of these in-vivo
metabolites.
Summary: The urinary excretion of anthocyanins and anthocyanin-glucuronides of 7 healthy subjects was determined, after ingestion of 150 ml of a concentrated elderberry juice, rich in anthocyanins (3.57 g anthocyanins/ 150 ml). HPLC-DAD analyses of urinary samples (0-5 h post-ingestion) were performed before and after hydrolysis of glucuronide-conjugates by ß-glucuronidase. Based on the urinary recovery, the percentage of anthocyanins (unchanged glycosides) and anthocyanin-glucuronides eliminated within the 5h was 0.053 ±0.030% and 0.003 ±0.001%, respectively (calculated as the ratio of anthocyanins/glucuronides excreted to anthocyanins ingested).
References Bub A, Watzl B, Heeb D, Rechkemmer G, Briviba K (2001): Eur J Nutr, 40, 113-120 Netzel M, Strass G, Janssen M, Bitsch I, Bitsch R (2001): J Environ Pathol Toxicol Oncol,
20, 89-95 Wu X, Cao G, Prior R (2002): J Nutr, 132, 1865-1871 Acknowledgement: This research project was supported in part by the Research Assocciation of the German Food Industry, the Federation of Industrial Cooperative Research Associations “Otto von Guericke”, and the Ministry of Economics and Labour (Project No. 13431). The human experiments comply with the current laws governing human experimentation in Germany.
cya-3,5-digluc
cya-3-sam
cya-3-gluc
A) B)
468

Release characteristics of alginate and chitosan treated alginate beads Scherze, I., Stenzel, J., Lang, S., Muschiolik, G. Friedrich-Schiller-University of Jena, Institute of Nutrition, Department of Food Technology, Am Steiger 3, D-07743 Jena Introduction During food production it is sometimes desirable to protect special components
against unfavourable environmental conditions, or to entrap them for controlled
release in the gastrointestinal tract. Alginate, a naturally derived polysaccharide
composed of (1-4)-linked β-D-mannuronic acid (M) and α-L-guluronic acid (G) has
been widely used as a gelling and thickening agent, as well as for the entrapment of
enzymes and whole cells. The encapsulation of low molecular weight substances
(LMWS) in the alginate structure is only possible if the alginate matrix is modified in
order to reduce its porosity. The aim of the study was to investigate the effect of
carbohydrate filler on the release characteristics and mechanical properties of
alginate gel beads in liquid food model systems. Furthermore, the complex formation
of alginate with chitosan was used as a model system in order to investigate how the
permeability is reduced by coating.
Materials and Methods Materials: Commercial alginate samples differing in M/G ratio and viscosity (Table 1)
were supplied by Danisco Cultor (Germany) and FMC BioPolymer (Norway). The
chitosan samples (degree of deacetylation 85%) were purchased from Fluka.
Maltodextrin with DE 6.5 (Cerestar, Germany), inulin form chicory root Fibruline®
Standard (Cosucra S.A., Belgium), polyethylene glycol 35000 (Merck) and fructose
were used as additives. Theophylline (Mw = 180 Da, ACROS ORGANICS) was used
for encapsulation.
Table 1: Specification of alginate and chitosan samples
Alginate M/G ratio Viscosity (mPa s)
Chitosan Molecular weight (Da)
Viscosity (mPa s)
A 60/40 180 1 low molecular (LM) 150 000 13.5 1 B 60/40 276 1 high molecular (HM) 600 000 24.1 1 C 47/53 274 1
1 Physica SM (Paar), shear rate 300 s-1, 20 °C, 2 % alginate or 0.35 % chitosan Preparation of gel beads: The sodium alginate solution containing theophylline
(0.5 %) as a water-soluble low-molecular weight hydrophilic model substance,
469

together with optional different carbohydrates (inulin, maltodextrin, fructose) was
dropped through a syringe (internal diameter 0.4 mm) into a gently agitated calcium
chloride solution (0.08 mol/l) with or without 5 % PEG. Chitosan coated alginate
beads were made in a one-stage process, by allowing droplets of an alginate solution
fall into an aqueous chitosan solution (0.35 %) with calcium chloride as the gelling
agent. The pH of the gelling bath was adjusted to 5.5. The beads were allowed to
harden for 30 min before washing and analysis. Then the beads were transferred into
liquid food model systems: (i) milk salt solution pH 4.5 with fructose, (ii) simulated
juice (fructose solution, pH 3.6).
Release of theophylline: The theophylline content in the gel beads, gelling bath and
storage solution was determined spectrophotometrically (λ = 272 nm). The beads
were dissolved in sodium carbonate solution (1.0 mol/l) before analysis. Particle size:
The particle size of the beads was measured using a stereoscopic microscope
(Stemi 1000, Carl Zeiss Jena).
Osmolality: The osmolality of the solutions (alginate, gelling bath, food model
systems) was determined by vapour pressure osmometer K-7000 (Knauer,
Germany) at 40 °C.Mechanical resistance: The compression resistance of the gel
beads were determined as the main force required to generate a 40 % compression
of a sample of beads using a Texture Analyser (Model TA-XT2, Stable Micro
Systems). Scanning electron microscopy (SEM): The surface morphology of the
beads were examined using a JEOL JSM 820 (Japan) scanning electron microscope.
Results and discussion Influence of osmotic gradient, carbohydrate filler in the alginate solution and PEG in
the gelling bath on the properties of alginate gel beads
Adjusting the osmolality of the alginate solution with fructose slightly above that of the
calcium chloride solution (+ 30-70 mOsmol) led to a reduced leakage of theophylline
(Figure 1). The addition of carbohydrate filler (inulin or maltodextrin) further
decreased the release and increased the mechanical strength. Tal et al. (1999)
showed that the addition of starch reduced the porosity of alginate gel. The presence
of PEG (5 %) in the CaCl2 solution during bead preparation had no effect on the
encapsulation efficiencies, but decreased the release during storage significantly
(Figure 2). The addition of PEG led to smaller beads with less mechanical resistance
that showed no shrinkage during storage.
470

80
85
90
95
100
without Frc Frc + Frc +
MD Inu
loss
of t
heop
hylli
ne (%
)
0
5
10
15
20
25
control PEG Frc Frc +PEGth
eoph
yllin
e re
leas
e af
ter
7 d
(%)
Figure 1: Influence of carbohydrate addition on the loss of theophylline during gel preparation (Alginate B). Frc – Fructose, MD - Maltodextrin, Inu - Inulin
Figure 2: Influence of PEG addition on the theophylline release after storage in food model system (i). Alginate B, Frc – Fructose
Influence of chitosan on the properties of gel beads
Alginate beads coated by complex formation with chitosan showed significantly
higher encapsulation efficiencies and retarded release (Figure 3). This confirms the
work of Sezer & Akbuğa (1999) and Simsek-Ege et al. (2002). The effect of chitosan
was more pronounced by using an alginate with higher M content. The uncoated
alginate beads were about 2.1 mm, spherical in shape and had a relatively smooth
surface with few wrinkles. The surface reaction with chitosan led to larger particles
(2.5 mm) with higher mechanical resistance and to modified morphology with a more
rough surface and deeper wrinkles (Figure 4).
05
1015202530
A B C A B C
after preparation after 1 week storageTheo
phyl
line
yiel
d in
bea
ds (%
)
without chitosanLM chitosanHM chitosan
Figure 3: Effect of chitosan and alginate type (A, B, C) on the theophylline yield after preparation and storage in food model system (ii)
471

a) b) Figure 4: Scanning electron micrographs of alginate gel beads. a) non-coated, b) coated with high-molecular weight chitosanConclusions
The presence of carbohydrate filler (maltodextrin, inulin) and surface complex
formation and coating with chitosan, modified the release characteristics of LMWS.
Nevertheless, the leakage of such substances was still too high during gel bead
preparation under the investigated conditions. Further work is necessary to modify
the gel matrix for controlled release of LMWS.
Summary Different osmotic gradient, carbohydrates in the alginate solution (inulin, maltodextrin with DE 6.5) and additives to the calcium chloride gelling bath (polyethylene glycol, chitosan) were tested with regard to their effect on release rate and mechanical properties of the gel beads prepared by droplet formation. Lower release was obtained by adjusting the osmolality of the alginate solution slightly above that of the gelling bath and storage solution as well as with the addition of carbohydrate filler (maltodextrin or inulin). Polyethylene glycol only decreased the release during storage. Chitosan coated alginate beads showed significantly higher encapsulation efficiencies, retarded release and greater firmness especially if an alginate with higher proportion of mannuronic acid was used.
References Tal Y, van Rijn J, Nussinovitch A (1999): Improvement of mechanical and biological
properties of freeze-dried denitrifying alginate beads by using starch as a filler and carbon source. Appl Microbiol Biotechnol, 51, 773-779
Sezer AD, Akbuğa J (1999): Release characteristics of chitosan treated alginate beads: II. Sustained release of a low molecular drug from chitosan treated alginate beads. J Microencapsulation, 16, 687-696
Simsek-Ege FA, Bond GM, Stringer J: Matrix molecular weight cut-off for encapsulation of carbonic anhydrase in polyelectrolyte beads. J Biomat Sci-Polym E, 13, 1175-1187
Acknowledgement This work was supported by the FEI (Forschungskreis der Ernährungsindustrie e.V., Bonn), the AiF and the Ministry of Economics. Project No. 13064 BR.
472

Absorption von konjugierten Linolsäuren beim Menschen Kraft, J., Kießling, G., Möckel, P., Jahreis, G. Friedrich-Schiller-Universität, Institut für Ernährungswissenschaften, Lehrstuhl Ernährungs-physiologie, Dornburger Str. 24, D-07743 Jena
Einleitung und Zielstellung Aufgrund ihrer vielfältigen physiologischen und pharmakologischen Eigenschaften
fanden konjugierte Linolsäuren (CLA) im letzten Dezennium zunehmend wissen-
schaftliches Interesse. In Humaninterventionsstudien wurden häufig CLA-Präparate
eingesetzt, die sich durch eine Vielzahl von Einzelisomeren auszeichneten. Die Stu-
die wurde mit dem Ziel durchgeführt, den Einfluss eines CLA-Isomerengemisches
auf die Absorption zu untersuchen. Dabei sollte geprüft werden, ob die verschiede-
nen Isomeren im Blut wiedergefunden werden und somit zur Anreicherung im Körper
beitragen. Anhand der Fäzeslipide sollte eine Einschätzung zum Metabolismus der
CLA-Isomeren erfolgen. Zum Einfluss von CLA auf die Nährstoffbilanz gibt es keiner-
lei Literaturdaten, so dass dieser Fragestellung nachgegangen werden sollte.
Material und Methoden An der Studie nahmen 8 gesunde männliche Probanden im mittleren Alter von 36
Jahren teil. Die Studie bestand aus zwei Perioden von jeweils einer Woche. Periode I
diente als Kontrollperiode zur Ermittlung der individuellen Ausgangswerte in Blut, Fä-
zes und Urin, in Periode II erfolgte die Intervention. In beiden Versuchsperioden wur-
de den Probanden eine standardisierte Kost bereitgestellt. In der Interventionsperio-
de erhielten die Probanden täglich 3 g eines CLA-Mischisomerenpräparates. Nach
einer zweitägigen Ausschleusphase erfolgte über fünf Tage eine quantitative Urin-
und Fäzessammlung. Jeweils am letzten Tag der Versuchsperioden wurde den Pro-
banden morgens nüchtern Blut abgenommen. In den Lebensmitteln, Urin und Fäzes
erfolgte die Bestimmung der Nährstoffe. Die Fettsäurenverteilung wurde in den Lipi-
den der Lebensmittel, Seren und Fäzes nach zwei unterschiedlichen GC-Verfahren
untersucht. Die Trennung der CLA-Isomeren erfolgte an einer Ag+-HPLC.
Ergebnisse Die zugeführte Menge an Frisch- und Trockensubstanz bzw. Wasser unterschied
sich zwischen den Perioden nicht. Auch hinsichtlich der Nährstoffaufnahme (Lipide,
473

Stickstoff, Protein) war keine Änderung zu verzeichnen. Die Bilanz der Lipide blieb in
beiden Perioden unverändert (Tab. 1). Demgegenüber ergab sich während der Zula-
geperiode eine negative Stickstoffbilanz. Die Kalkulation der Stickstoff-Wiederfindung
spiegelt diese Beobachtung ebenfalls wider (93 % Kontrollperiode vs. 101 % Zulage-
Periode). Beide Ergebnisse resultierten aus der höheren renalen Stickstoffausschei-
dung in der Zulageperiode. Für die scheinbare Verdaulichkeit der Trockensubstanz,
der Lipide und des Stickstoffs ergaben sich keine signifikanten Änderungen zwischen
den Versuchsperioden.
Tabelle 1: Mittlere Bilanz, scheinbare Verdaulichkeit und Wiederfindung der
Nährstoffe pro Person und Tag
Kontroll-Periode CLA-Zulage-Periode Bilanz [g/d]
Lipide 105 ± 26 107 ± 27 Stickstoff 1,0 ± 1,3 -0,1 ± 1,5 *
Scheinbare Verdaulichkeit [%] Trockensubstanz 94 ± 2 94 ± 1 Lipide 94 ± 2 95 ± 1 Stickstoff 88 ± 4 88 ± 3
Wiederfindung [%] Stickstoff 93 ± 10 101 ± 11*
* signifikante Unterschiede (P < 0,05)
Sowohl für den SFA-Gehalt als auch für den PUFA-Gehalt der Serumlipide, nicht je-
doch für den MUFA-Gehalt, konnten signifikante Unterschiede in Abhängigkeit von
der CLA-Zulage nachgewiesen werden. Der Serum-CLA-Gehalt der einzelnen Pro-
banden lag während der Kontrollperiode zwischen 1,9 und 3,7 mg/g Fett. Unter dem
Einfluss der CLA-Zulage stieg der Serum-CLA-Gehalt erwartungsgemäß an
(7,34 ± 1,38 mg/g Fett). Zwischen der CLA-Aufnahme und der Serumkonzentration
an CLA bestand ein enger linearer Zusammenhang (Abb. 1).
Während der Zulageperiode stieg die fäkale Ausscheidung an CLA signifikant an. Die
CLA-Exkretion variierte infolge individueller Unterschiede stark (0,36 und 2,06 mg/g
T). Die Verteilung der CLA-Isomeren unterschied sich in den Fäzeslipiden deutlich
von der im Serum.
474

r = 0,91
0
2
4
6
8
10
0 1 2 3
CLA-Aufnahme [g/d]
CLA
-Geh
alt i
m S
erum
[mg/
g Fe
tt]
Abbildung 1: Zusammenhang zwischen CLA-Aufnahme und CLA-Gehalt im
Serum (N = 8; P < 0,01)
Diskussion Die Ergebnisse der Fettausscheidung, -bilanz bzw. scheinbaren Verdaulichkeit liegen
im Bereich der Referenzwerte. Es wurden keine auf das CLA-Supplement zurück-
führbaren Unterschiede festgestellt. Die N-Ausscheidung (fäkal, renal), N-Bilanz und
Wiederfindung der Ausgangswerte stimmen mit der verfügbaren Literaturangabe
überein (GRIMM 2000). Unerwarteterweise wurde ein Einfluss auf die Stickstoffbilanz
festgestellt. Der signifikante Anstieg der renalen N-Ausscheidung gegenüber den
Basiswerten, resultierte in einer negativen N-Bilanz. Die N-Ausscheidung über den
Urin ist ein Marker für den Proteinanabolismus bzw. -katabolismus. Die signifikant
erhöhte renale N-Ausscheidung führt zur Annahme, dass CLA eine katabole Wirkung
auf den Proteinmetabolismus ausüben.
In der Kontrollperiode wurden CLA-Gehalte im Serum zwischen 1,9 und 3,7 mg/g
Fett ermittelt. Der Anteil an CLA betrug im Mittel 0,30 % der Gesamtfettsäuren. Die
Werte liegen innerhalb der Größenordung der Literaturangaben (FORGERTY et al.
1988, BRITTON et al. 1992, SALMINEN et al. 1998, MOUGIOS et al. 2001, FREMANN et al.
2002). Bei allen Probanden wurde eine stark positive Korrelation zwischen der CLA-
Aufnahme und dem Serum-CLA-Gehalt festgestellt (r = 0,91). Übereinstimmende
Ergebnisse fanden JIANG et al. (1999) und ARO et al. (2000). Die Supplementation
von täglich 2 g CLA (absolut) resultierte in einer Erhöhung des CLA-Serumspiegels
475

im Mittel um das Dreifache. Die CLA-Isomeren im Serum reflektierten die CLA-
Isomeren des Supplements. Dieses Ergebnis zeigt, dass alle CLA-Isomeren, die im
Supplement enthalten waren, im Magen-Darm-Trakt vergleichbar effektiv absorbiert
wurden. Die Zulage an CLA bewirkte eine Änderung der Fettsäurenverteilung in den
Serumlipiden. Der Anteil an SFA stieg schwach signifikant an. Gleichzeitig vermin-
derte sich der Anteil an PUFA signifikant, während die MUFA unbeeinflusst blieben.
Die eigenen Untersuchungen entsprechen den Angaben von BENITO et al. (2001),
SMEDMANN & VESSBY (2001) und NOONE et al. (2002). Durch CLA-Gabe an Ratten
(SZYMCZYK et al. 2000, SISK et al. 2001) und Küken (DU et al. 2001, SZYMCZYK et al.
2001) wurde im Fettgewebe die Summe der SFA bei gleichzeitiger Senkung der
MUFA und PUFA erhöht. Untersuchungen von STANGL (2000) zeigen, dass die Ver-
fütterung von CLA an Ratten ebenfalls einen höheren SFA- und geringeren PUFA-
Anteil in den Karkasslipiden führte. Die Arbeitsgruppe von SEBEDIO et al. (2001)
konstatierte in Versuchen an Ratten, dass CLA die Fettsäurenzusammensetzung der
einzelnen Lipidklassen beeinflussen. Die CLA-Gabe führte in Phospholipiden, Tria-
cylglyceriden und Cholesterolestern der Leber zu einem höheren Sättigungsgrad. Die
Autoren postulieren, dass nicht c9,t11-CLA sondern t10,c12-CLA für diesen Effekt
verantwortlich ist.
Die CLA-Supplementation bewirkte einen Anstieg der CLA-Konzentration in den Fä-
zeslipiden um das Doppelte. Die gemessenen CLA-Gehalte in den Fäzes bewegten
sich zwischen 0,36 und 2,06 mg/g T. Die hohe Varianz in der CLA-Exkretion unter-
streicht die individuellen Unterschiede in der CLA-Absorption bzw. bakteriellen Syn-
these der einzelnen Probanden. Auf Grundlage dieser Ergebnisse kann postuliert
werden, dass die bakterielle Genese bzw. der bakterielle Abbau der CLA zwischen
den Individuen offensichtlich verschieden ist. Das auffällige, sich zu den Serumlipi-
den deutlich unterscheidende CLA-Isomerenmuster der Fäzeslipide spricht für eine
CLA-Synthese durch die Intestinalbakterien. Es ist allerdings unwahrscheinlich, dass
diese synthetisierten CLA zur Anreicherung der Gewebelipide beitragen.
Die vorliegenden Ergebnisse untermauern, dass CLA nahezu vollständig vom In-
testinum absorbiert werden. Dieses Ergebnis ist insofern wichtig, als zahlreiche CLA-
Supplemente auf den Markt (v. a. für Sportler) angeboten werden. Der CLA-
Körperbestand kann mit Hilfe von CLA-Supplementen problemlos erhöht werden. In
weiteren Studien sollte die im Versuch nachgewiesene katabole Wirkung näher un-
tersucht und das für diesen Effekt verantwortliche Isomere identifiziert werden.
476

Summary (Absorption of Conjugated Linoleic Acids in Humans) In human intervention studies commercial CLA preparations with a multitude of iso-
mers were used. Because the CLA isomer-distribution of these preparations are not
equivalent to that in foodstuffs, we conducted a human intervention study to examine
the absorption of different CLA isomers. Furthermore, it was of interest to investigate
the influence of CLA on the nutrient balance. Eight healthy male volunteers partici-
pated in the experiment. The study was divided in a control period and an interven-
tion period in which the volunteers obtained a standardized diet over 7 days. During
the intervention period 3 g of a CLA preparation were supplemented. During both
periods blood samples were taken and faeces and urine were quantitatively col-
lected. The intake of dry matter, water, fat, and protein was not significantly different
between the periods. There were no differences in faecal excretion of dry matter, fat,
and nitrogen. However, during the CLA period the renally excreted nitrogen in-
creased significantly resulting in a negative nitrogen balance. The apparent digestibil-
ity of dry matter, protein, and fat remained constant between both periods. Due to
CLA supplementation serum concentration of CLA increased. There was a positive
correlation between CLA intake and CLA serum level. As a result of CLA supplemen-
tation the sum of SFA in serum increased whereas the sum of PUFA decreased. In
response to the CLA supplementation the faecal excretion of CLA significantly in-
creased and varied due to interindividual differences between 0.36 and 2.06 mg/g
faeces dry matter. In summary, the results suggest that CLA were adequate ab-
sorbed (apparent absorption rate 99%) from the intestine. However, the metabolism
of CLA (-isomers) seems to be different between the individuals.
Literatur Das Verzeichnis der zitierten Literaturstellen kann bei den Verfassern angefordert
werden.
477
Plant oils as a source of linoleic acid in sheep diet and their impact on conjugated linoleic acid and fatty acids isomers in milk. Szumacher-Strabel, M., Potkański, A., Cieślak, A. Department of Animal Nutrition and Feed Management, August Cieszkowski Agricultural University, Wołyńska 33, 60-637 Poznań, Poland
Ruminants’ milk is characterized as the richest dietary source of conjugated linoleic
acid (CLA), which has the potential to inhibit the process of cancerogenesis, and also acts as
an antiatherogenic and antidiabetic factor. It seems to be desirable to increase the level of
CLA and also other polyunsaturated fatty acids in milk. Concentration of CLA in milk fat can
be enhanced by changes in the diet, especially utilization of diets with greater linoleic acid
(LA) content (Griinari et al., 2000). CLA can be produced during incomplete
biohydrogenation and also by endogenous synthesis from trans 11 18:1 (trans vaccenic acid –
TVA) by ∆9 – desaturase (Griinari et al., 1999). Milk fat is one of the main diet components
in human diets. Unfortunately milk became aware of hypercholesterolemic compounds
(mostly C14:0 and C16:0), especially when we compared milk with rich in polyunsaturated
fatty acids PUFAs oils, e.g. fish oil. Because there are many difficulties with changing
composition of human diets, it means increase level of fish and their products consumption,
whereas consumption of milk is still very high, hence instead of changing diet habits it is
imperative to improve level of beneficial, demanded compounds in milk (to replace of
saturated fatty acids in milk fat with unsaturated fatty acids and to enrich in biologically
active components e.g. CLA) and thus change the image of milk. The availability of enriched
milk and dairy products will provide consumers with a greater intake of these essential
nutrients without making any substantial changing in their dietary habits.
The objective of this work was to study changes in the fatty acid profile of sheep’ milk
with emphasis on CLA and TVA level as an effect of different linoleic acid sources in the
diet. Twenty randomly chosen ewes were used to investigate the effect of dietary LA on fatty
acid composition in milk. 5% of soybean (SBO, 50% of LA), sunflower (SFO, 64% of LA)
and low linoleic linseed oil (LSO, 72 % of LA) in dry matter of the diet were used as LA
sources. Sheep were milked twice daily. Fatty acid composition in milk fat was determined
according to Cieslak et al. (2003).
Our studies indicated a significant reduction of fatty acid with < 14 carbon atoms,
what can suggest a depression of de novo synthesis of fatty acids when diet supplemented
with plant oils were fed. SBO and LSO resulted in statistically significant increase in CLA
478

level, whereas SFO addition had no effect. TVA level, the precursor of CLA increased when
diets were supplemented with SBO and SFO.
Milk from animals fed LSO was characterized by the highest level of CLA. In this
group of animals increase of ∆9 desaturase activity was observed (calculated on C14:0:C14:1
ratio according to Lock and Garnsworthy, 2003), what can suggest improved synthesis of
CLA in mammary gland. On the other hand higher level of C18:0 indicate possible higher rate
of biohydrogenation.
SBO as a source of LA resulted in low ∆9 desaturase activity, hence lower, in
comparison to group with LSO, increase of CLA in milk fat. We noticed also statistically
significant increase in TVA level. Low level of CLA and high of TVA suggest that no CLA
occurred from TVA in the rumen, and indicated proper rumens’ environment condition for
bacteria of group A, which are responsible for the first stage of biohydrogenation.
The most difficult to interpret results were obtained when SFO was used as a source of
LA. High activity of ∆9 desaturase points out on high level of CLA but there were no effect of
additional LA on CLA level, whereas high concentrations of TVA and C18:0 were observed.
No response of additional source of LA on EPA level was observed, except for LSO,
which increased level of this beneficial fatty acid in milk. Either SBO or SFO increase
concentration of DHA in milk fat. LSO had no influence on DHA level.
The results of the present in vivo study demonstrate that dietary manipulation can be
used to alter content of desired fatty acid in milk and also confirm the hypothesis that
additional source of LA may enhance CLA production. Because the responses of CLA level
varies depending on LA sources further research is required to determine the most effective
source of LA.
References
Cieślak A., Machmüller A., Potkański A., Szumacher-Strabel M., Scheeder M.R.L , 2003. Comparison of two extraction methods used to quantify the different C18 fatty acids in digesta of ruminants. Proceedings of the conference: Methodology of the novel evaluation, 24-25 April 2003, Olsztyn, Poland
Griinari J.M., Bauman D.E., 1999. Biosynthesis of conjugated linoleic acid and its incorporation into meat and milk in ruminants. Pages 180-220 in Advances in conjugated linoleic acid research. Vol. 1. M.P. Yurawecz, M.M. Mossoba, J.K.G. Kramer M.W. Pariza, C.J. Nelson, eds. Am. Oil Soc. Press, Champaign, IL.
Griinari J.M., Corl B.A., Lacy S.H., Chouinard P.Y., Nurmela K.V.V., Bauman D.E., 2000. Conjugated linoleic acid is synthesized endogenously in lactating dairy cows by ∆ 9 desaturase. J. Nutr. 130: 2285-2291
479

Essential fatty acids and nutritive value of edible nonrefined linseed oil Dimić, E. , Dimić, V.,Romanić, R. University of Novi Sad, Faculty of Technology, Bul. Cara Lazara 1, 21000 Novi Sad, Serbia and Montenegro
Introduction
It is a well known fact that some fatty acids, included in the dietary intake, increase
the level of serum cholesterol and exhibit aterogenic effect and thrombogenic action,
however, the other exhibit an opposite effect. Moreover, it has been proved that
serum cholesterol level is more affected by certain fatty acids than by alimentary
intake of cholesterol itself (1).The polyunsaturated fatty acids of n-3 family of which
the most important, α-linolenic and especially its two metabolites: eicosapentanoic-
EPA (C20:5, n-3) and docosahexaenoic–DHA (C22:6, n-3) are formed in plant
chloroplasts and phytoplanctons.Thanks to this, α-linolenic acid can be found in seed
oils, and together with the derivates in fish meat and oils, especially in sea fishes.
N-3 fatty acids posess hypolipidaemic, anti-hypertensive, anti-inflammatory, anti-
thrombic and antiarrythmic properties. All of these have been implicated in their
health-promoting effects (2). Besides, their beneficial action on blood lipids and
lipoproteins significantly contributes in the prevention of aterosclerosis and cardiac
infarction (3).
Due to changes in nutrition trends e.g. increasing striving for natural nutrition, the
consumers′ interest for the so-called special kinds of oils that can be used in dietetic
therapy is expressed in the contemporary society. Linseed oil is used for technical
purposes (4), however, lately this oil has been introduced at our market as edible
non-refined e.g. cold pressed oil. Currently there is a great interest in dietary n-3 fatty
acids to promote health. Linseed oil is characterized by especially high content of α-
linolenic – n-3 essential fatty acid (2), driving attention in the category of specialty oils
for direct consumption.
The paper presents the nutritive value, sensory and chemical quality as well as the
oxidative stability of three cold pressed, non-refined linseed oil samples.
Material and methods The investigated oil samples were obtained by cold-pressing on screw press, from
the domestic sort linseed »Olin«, containing 40-42% of oil. ISO standard methods
were used to determine of oil characteristics. The sensory characteristics were
480

assessed by a three-member expert group, and the results are descriptive. The total
tocopherols content was determined by spectrophotometric method according to
Emmeri-Engel (5). The oxidative stability was determined using Rancimat 617, at
100°C, and air flow rate 20 l/min, and by Schaal-oven test at 63°C (6).
Results and discussion
The sensory characteristics of cold-pressed linseed oil are specific, however cannot
be described as pleasant ones. The oil samples were clear, light-yellow, of specific
smell and taste, sharp, a little bitter, reminding green grass. Such smell and test are,
most probably, the consequence of high linolenic acid content (Table 1).
α-linolenic, n-3 fatty acid is the dominant one in linseed oil samples. Linoleic, n-6 fatty
acid content was about 15%, while the portion of saturated fatty acids was only about
11%. According to literature data the linolenic acid content of flaxseed oil varies
widely (7).
Table 1. Nutritive value of cold-pressed linseed oil
Parameter Sample 1 2 3 Fatty acid composition* (%) - palmitic C 16:0 - stearic C 18:0 - oleic C 18:1 - linoleic C 18:2, n-6, cis - α-linolenic C 18:3, n-3, cis Saturated fatty acids (%) Unsaturated fatty acids (%)
9.14 2.43 20.87 15.63 51.92
11.57 88.42
7.98 2.55
19.63 14.98 54.85
10.53 89.46
8.58 2.49
20.55 14.35 53.65
11.07 88.55
Total tocopherols content (ppm) 585 638 502 Phosphatides content (%) 0.02 0.06 0.05
*Fatty acid methyl esters Besides such fatty acid profile, the presence of tocopherols, as natural antioxidants,
in the oil is significant. According to Valasco and Goffman (7), γ-tocopherol is mostly
present in flaxseed oil. The samples contain a certain amount of phosphatides, 0.02
and 0.06%, which increase the nutritive value of the oil, although the phosphatides
can act also as synergists (8). Regarding chemical quality (Table 2), the samples fulfil
the demands given in Draft standard for named vegetable oils (1999).
The cold pressed flaxseed oil is present at the market as edible oil for quite a short
time and as such is not included in the Rulebook on quality. So, the presented results
are of special importance for the characterisation of this kind of oil.
481

Table 2. Quality and identification characteristics of cold-pressed flaxseed oils
Characteristic Sample 1 2 3 Moisture (%) 0.19 0.13 0.10 Acid value (mgKOH/g) 1.14 1.06 1.47 Peroxide value (mmol/kg) 2.23 0.29 1.29 Density (20°/water 20°C) 0.931 0.930 - Refraction index (n40
D) 1.467 1.471 - Saponification value (mgKOH/g) 189 190 - Iodine value (g/100g) 184 180 - Nonsaponifiable matters (ppm) 7.10 7.16 -
Oxidation curves of oil at 63°C are presented in Figure 1, while the induction period
values at different temperatures are given in Table 3.
0
5
10
15
20
25
30
35
40
0 50 100 150 200 250 300
Induction period (h)
PV (m
mol
/kg)
Sample 1Sample 2Sample 3
Figure 1. Oxidation curves of linseed oil at 63°C
The oxidative stability of oil samples is very poor, however the difference in their
induction period is significant. The stability of sample 2 is better than of sample 1 and
3. This can be partly explained by lower initial peroxide value, higher tocopherols
content, and by presence of phospholipids. Temperature affects significantly the
oxidation rate. The oxidative instability of oils or products rich in n-3 fatty acids is
mainly due to their high degree of unsaturation.
Table 3. Induction period of flax seed oil at different temperatures
Characteristics Sample 1 2 3 Initial peroxide value (mmol/kg) 2.23 0.29 1.29 Induction period, IP (hours) - Schaal-oven test, 63°C - Rancimat test, 100°C
33
2.25
158 4.00
48 -
482

Peroxides of linolenic acid are particularly unstable due to presence of active
methylene groups. But the effect of temperature on the oxidation of flaxseed oil is
very interesting. Kamal-Eldin and Yanishlieva (2) found that the oxidation at 80°C
was characterised by a long induction period (ca. 18 h). At the intermediate range,
the induction period decreases exponentially with the increase in temperature. There
was no induction period at the high temperatures (>130°C). The vulnerability of these
fatty acids to oxidation therefore deserves special attention.
Summary
Linseed oil is characterized by especially high content of linolenic-ω-3 essential fatty acid. The paper points to the importance and biochemical role of essential fatty acids in the organism. The results of quality and stability investigation of three cold pressed linseed oil samples are presented. The analysis of the samples confirmed that the content of linolenic acid is about 50%, and of linoleic and oleic about 15% and 20%, respectively. Due to this fatty acids profile, the iodine value is 180 – 184. The content of total tocopherols was 585 and 638 ppm. The oil stability is very poor due to especially high level of unsaturation. The induction period at 100°C, determined by Rancimat 617, was 2.25 and 4 hours. A significant difference in stability was found at lower temperatures also. Linseed oil has to be protected from oxidation. Acknowledgment This work was supported by the Serbian Ministry of Science, Technologies and
Development through the Project: ‘’Cold pressed oleic type sunflower oil with
changed tocopherols composition"- BTN.2.3.1.0402.B
Literature 1. Lepšanović, L., Lj. Lepšanović (2000), Clinical Lipidology (Klinička lipidologija),
Savremena administracija, pp 1-335, Beograd 2. Kamal-Eldin, A., N. V. Yanishlieva (2002), N-3 fatty Acids for Human Nutrition:
Stability Considerations, Eur. J. Lipid Sci. Technol. 104: 825-836. 3. Lepšanović, Lj. (2001), Ateroskleroza i masne kiseline iz ishrane, značaj za
prehrambenu industriju, 42. Savetovanje: Proizvodnja i prerada uljarica, Zbornik radova, pp 215-221, Herceg Novi
4. Bailey's Industrial Oil and Fat Products (1965), Edited by D. Swern, J. Wiley &Sons, New York
5. Paqout, C., et al. (1967), Les Methodes Analitiques des Lipides Simples (in serbian), Poslovno udruženje proizvođača biljnih ulja, Beograd
6. Dimić, E., J. Turkulov (2000), Kontrola kvaliteta u tehnologiji jestivih ulja, Tehnološki fakultet, Novi Sad
7. Valasco, L., F. D. Goffman (2000), Tocopherol and Fatty Acid Patterns in the Genus Linum, Plant Syst. Evol. 221: 77-88.
8. Bandarra, N. M., R. M. Campos, J. Batista, M. L. Nunes, J. M. Empis (1999), Antioxidant Synergy of α-tocopherol and Phospholipids, J. Am. Oil Chem. Soc. 76: 905-913.
483
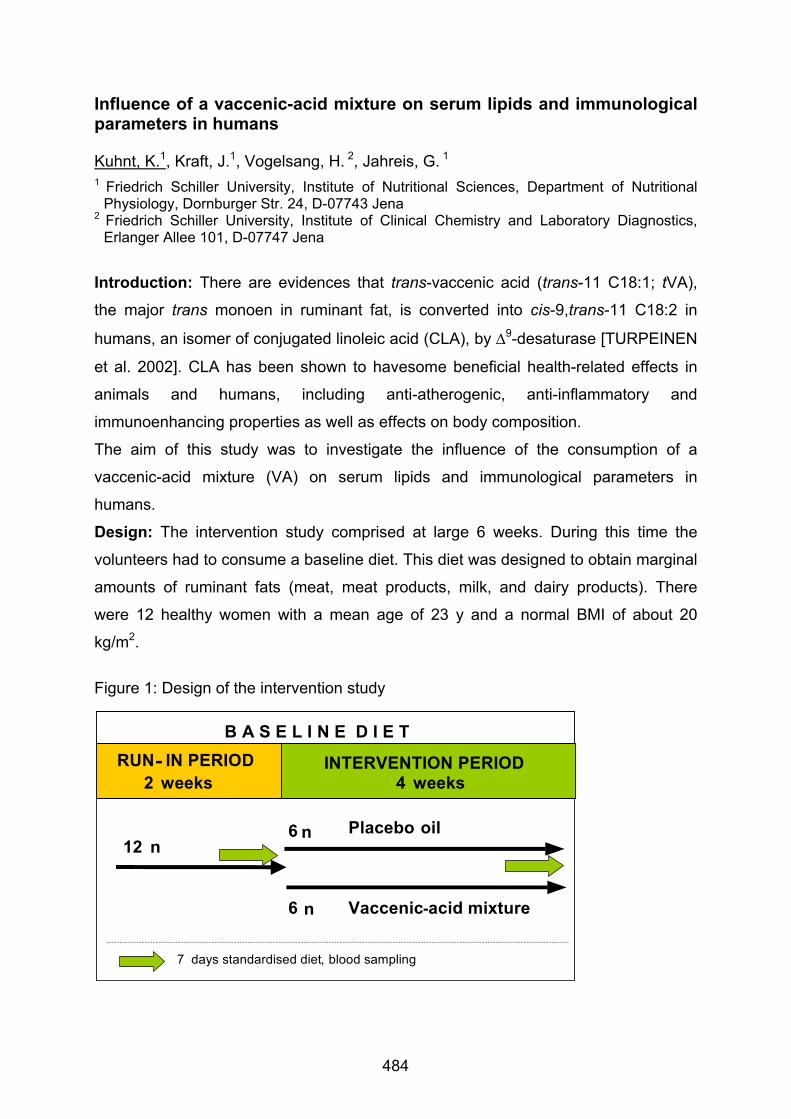
Influence of a vaccenic-acid mixture on serum lipids and immunological parameters in humans Kuhnt, K.1, Kraft, J.1, Vogelsang, H. 2, Jahreis, G. 1 1 Friedrich Schiller University, Institute of Nutritional Sciences, Department of Nutritional
Physiology, Dornburger Str. 24, D-07743 Jena 2 Friedrich Schiller University, Institute of Clinical Chemistry and Laboratory Diagnostics,
Erlanger Allee 101, D-07747 Jena Introduction: There are evidences that trans-vaccenic acid (trans-11 C18:1; tVA),
the major trans monoen in ruminant fat, is converted into cis-9,trans-11 C18:2 in
humans, an isomer of conjugated linoleic acid (CLA), by ∆9-desaturase [TURPEINEN
et al. 2002]. CLA has been shown to havesome beneficial health-related effects in
animals and humans, including anti-atherogenic, anti-inflammatory and
immunoenhancing properties as well as effects on body composition.
The aim of this study was to investigate the influence of the consumption of a
vaccenic-acid mixture (VA) on serum lipids and immunological parameters in
humans.
Design: The intervention study comprised at large 6 weeks. During this time the
volunteers had to consume a baseline diet. This diet was designed to obtain marginal
amounts of ruminant fats (meat, meat products, milk, and dairy products). There
were 12 healthy women with a mean age of 23 y and a normal BMI of about 20
kg/m2.
Figure 1: Design of the intervention study
RUN - IN PERIOD 2 weeks
INTERVENTION PERIOD 4 weeks
B A S E L I N E D I E T
Placebo oil
Vaccenic acid mixture
6 12
6
7 days standardised diet , blood sampling
n n
n
-
484

The study was divided into two periods (Fig. 1). The first period was called run-in
period (two weeks) without supplement. The second period was the intervention
period (4 weeks). In this period 6 women received the VA or the placebo oil,
respectively. The VA was a triacylglycerol containing 29.9% tVA (1.2 g/d for 30 d).
The fats were incorporated into a hazelnut chocolate spread. In the last week of each
period (2nd and 6th wk) the volunteers obtained a standardised diet over 7 days.
During these days urine and faeces were collected and on the last day blood was
sampled (Fig. 1).
Results: No significant changes in body weight and body fat were observed. There
were no significant differences in serum cholesterol, HDL- and LDL-cholesterol, and
the ratio of these after VA or placebo intake (Tab. 1).
Table 1: Serum lipids in subjects having consumed placebo or VA
The quantity of lymphocytes and the quantity of granulocytes were not affected in
placebo and VA subjects. There was a significant decrease of the percentage of
monocytes after VA intake (5% vs. 7%).
There was a significant de-
crease of triacylglycerols in
subjects with VA intake (0.9
mmol/L vs. 0.6 mmol/L). In
placebo subjects no changes
were observed (Figure 2).
Figure 2: Triacylgycerols in serum in both treatments
0.0
0.4
0.8
1.2
Run-in period Intervention period
[mm
ol/L
]
Placebo Vaccenic-acid mixture
*
3.1 ± 1.12.5 ± 0.6
1.9 ± 0.42.0 ± 0.9
5.4 ± 1.54.7 ± 1.4
Interventionperiod
3.1 ± 1.22.4 ± 0.4
LDL-cholesterol [mmol/L] PlaceboVA
1.7 ± 0.31.9 ± 0.7
HDL-cholesterol [mmol/L] PlaceboVA
5.1 ± 1.54.7 ± 0.6
Total cholesterol [mmol/L] PlaceboVA
Run-in periodParameter
3.1 ± 1.12.5 ± 0.6
1.9 ± 0.42.0 ± 0.9
5.4 ± 1.54.7 ± 1.4
Interventionperiod
3.1 ± 1.22.4 ± 0.4
LDL-cholesterol [mmol/L] PlaceboVA
1.7 ± 0.31.9 ± 0.7
HDL-cholesterol [mmol/L] PlaceboVA
5.1 ± 1.54.7 ± 0.6
Total cholesterol [mmol/L] PlaceboVA
Run-in periodParameter
Values with different letters are significantly different (p ≤ 0.05)
485

T cells (CD3) significantly increased in both groups. T helper cells (CD4) and
cytotoxic T cells (CD8) were unaffected after VA intake. VA significantly decreased
natural killer cells (NK). In the placebo group NK also decreased without reaching a
significant level (Tab. 2).
Table 2: Effects on the various subsets of lymphocytes in both treatments
The percentage of granulocytes with phagocytic activity (Phagotest®) and the percentage of granulocytes with oxidative burst activity (Phagoburst®) significantly increased after VA intake, 89% vs. 97%; 92% vs. 98%, respectively (Fig. 3).
Discussion: The bioconversion of tVA into cis-9, trans-11 CLA was shown in mice
[Santora et al. 2000] and in humans [TURPEINEN et al. 2002]. This conversion
increases the amount of CLA available to the body. Only a limited number of CLA
supplementation studies and only one tVA supplementation study have been
conducted in humans. In the present study a decreased serum triacylgylcerol
concentration after VA intake was observed. In a CLA supplementation study in
27 ア 421 ア 7
25 ア 520 ア 6
CD8 (cytotoxic T cells) PlaceboVA
76 ア 5 b73 ア 3 b
69 ア 5 a69 ア 3 a
CD3 (T cells) PlaceboVA
47 ア 7 b46 ア 9
41 ア 4 a44 ア 9
CD4 (T helper cells) PlaceboVA
Intervention period
Run-in periodParameter [%]
13 ア 313 ア 4 b
18 ア 417 ア 4 a
NK (natural killer cells) PlaceboVA
27 ア 421 ア 7
25 ア 520 ア 6
CD8 (cytotoxic T cells) PlaceboVA
76 ア 5 b73 ア 3 b
69 ア 5 a69 ア 3 a
CD3 (T cells) PlaceboVA
47 ア 7 b46 ア 9
41 ア 4 a44 ア 9
CD4 (T helper cells) PlaceboVA
Intervention period
Run-in periodParameter [%]
13 ア 313 ア 4 b
18 ア 417 ア 4 a
NK (natural killer cells) PlaceboVA
Figure 3: Phagotest and Phagoburst after VA intake
80
84
88
92
96
100
104
Phagotest Phagoburst
[%]
Run-in Period Experimental Period
There were no significant changes in the placebo group: Phagotest® 89% vs. 93%; Phagoburst® 94% vs. 86%. The percentage of granulo-cytes with oxidative burst activity was significantly higher in the VA group as in the placebo group, 98% vs. 86%.
Intervention periodRun-in period
* *
Values with different letters are significantly different (p ≤ 0.05)
486

women with a BMI of 23 kg/m2 and an intake of 3.9 g CLA/d over 9 wk, decreased
serum triacylglycerols was also shown (0.9 mmol/L vs. 0.6 mmol/L). Other plasma
lipids were not affected [BENITO et al. 2001]. NOONE et al. [2002] reported also a
lowering of serum triacylglycerols in men and women who consumed 2 g CLA/d over
8 wk. Other studies showed no changes in serum triacyglycerols [MOUGIOS et al.
2001, SMEDMAN et al. 2001].
Results from CLA studies on immune function in animals and humans are also
variable. CLA was reported to increase phagocytosis by chicken and rat macro-
phages and to increase the proliferation of mouse lymphocytes, suggesting
immunoenhancig properties [SEBEDIO et al. 1999]. In further studies in mice no
effects on lymphocyte cytotoxicity and NK cell activities were observed [HAYEK et al.
1999, TURNOCK et al. 2001]. In the present study an increased phagocytosis and an
increased number of monocytes were observed. In a study in female subjects, that
consumed CLA, the number of granulocytes, monocytes, lymphocytes, T
lymphocytes, helper T lymphocytes, cytotoxic T lymphocytes and natural killer cells
were not altered [KELLEY et al. 2000]. In a further study in men that received CLA
NK cell activity and lymphocytes proliferation were also not affected [ALBERS et al.
2003]. The effects of CLA on serum lipids and on immune cell function are variable.
At present we can compare our results only with results of CLA supplementation
studies. It cannot exclude that tVA has also effects on these parameters or that there
are synergistic effects between tVA and the converted CLA. The verifying of the
results of the present study will be in future studies in female and male subjects.
Summary: There are evidences that trans-vaccenic acid (tVA) is converted into cis-
9, trans-11 C18:2 (CLA) in humans by ∆9-desaturase. 12 healthy women consumed a
ruminant-fat free baseline diet during the complete study. After a two-week run-in
period 6 subjects received a placebo-oil or a vaccenic-acid mixture (1,2 g tVA/d),
respectively. The concentration of serum triacylglycerols significantly decreased after
VA intake. The quantity of lymphocytes and granulocytes was not affected, but VA
consumption significantly increased the percentage of monocytes (5% vs. 7%). The
percentage of granulocytes with phagocytic activity and with oxidative burst activity
was significantly increased after the consumption of VA.
487

References Turpeinen AM, Mutanen M, Aro A, Salminen I, Basu S, Palmquist DL, Griinari JM
(2002): Bioconversion of vaccenic acid to conjugated linoleic acid in humans. Am J Clin Nutr 76, 504-510
Santora JE, Palmquist DL, Roehrig KL (2000): Vaccenic acid is desaturated to conjugated linoleic acid in mice. J Nutr 130, 208-215
Mougios V, Matsakas A, Petridou A, Ring S, Sagredos A, Melissopoulou A, Tsigilis N, Nikolaidis M (2001): Effect of supplementation with conjugated linoleic acid on human serum lipids and body fat. J Nutr Biochem 12, 585-594
Benito P, Nelson GJ, Kelley DS, Bartolini G, Schmidt PC, Simon V (2001): The effect of conjugated linoleic acid on plasma lipoproteins and tissue fatty acid composition in humans. Lipids 36, 221-227
Noone EJ, Roche HM, Nugent AP, Gibney MJ (2002): The effect of dietary supplementation using isomeric blends of conjugated linoleic acid on lipid metabolism in healthy human subjects. Brit J Nutr 88, 243-251
Smedman A, Vessby B (2001): Conjugated linoleic acid supplementation in humans-Metabolic effects. Lipids 36, 773-778
Kelley DS, Taylor PC, Rudolph IL, Benito P, Nelson GJ, Mackey BE, Erckson KL (2000): Dietary conjugated linoleic acid did not alter immune status in young healthy women. Lipids 35, 1065-1071
Sebedio JL, Gnaedig S, Chardigny JM (1999): Recent advances in conjugated linoleic acid research. Curr Opin Clin Nutr Metab Care 2, 499-506
Hayek MJ, Han SN, Wu D, Watkins BA, Meydani M, Dorsey JL, Smith DE, Meydani SK (1999): Dietary conjugated linoleic acid influences the immune response of young and old C57BL/6NCrIBR mice. J Nutr 129, 32-38
Turnock L, Cook M, Steinberg H, Czuprynski C (2001): Dietary supplementation with conjugated linoleic acid does not alter resistance of mice to listeria monocytogenes infection. Lipids 36, 135-138
Albers R, van der Wielen, Brink EJ, Hendriks HFJ, Dorovska-Taran VN, Mohede ICM (2003): Effects of cis-9, trans-11 and trans-10, cis-12 conjugated linoleic acid (CLA) isomers on immune function in healthy men. Eur J Clin Nutr 57, 595-603
488

Cholesterol-lowering phytosteryl esters by lipase-catalyzed esterification and transesterification of phytosterols with fatty acids or fatty acid esters Weber, N., Weitkamp, P., Mukherjee, K.D. Institut für Lipidforschung, Bundesanstalt für Getreide-, Kartoffel- und Fettforschung, Piusallee 68-76, D-48147 Münster, Germany Summary Phytosterols and -stanols have been converted in high to near-quantitative yields (>95%) to the corresponding acyl esters via esterification with fatty acids or trans-esterification with methyl esters of fatty acids or triacylglycerols using immobilized lipases from Candida rugosa, Rhizomucor miehei (Lipozyme RM), Thermomyces lanuginosus (Lipozyme TL), Candida antarctica (lipase B, Novozym 435) and papaya (Carica papaya) latex as biocatalysts in vacuo (20-40 hPa) at moderate temperatures (40°C for C. rugosa lipase; 80°C for Lipozyme RM, Lipozyme TL, Novozym 435 and papaya latex). Neither an organic solvent nor a drying agent is required. Highest conversion rates were observed with lipase from C. rugosa as biocatalyst, whereas markedly lower rates were found using other lipases.
Among other factors, increased concentrations in blood of both total cholesterol and
LDL (Low Density Lipoprotein)-cholesterol and reduced concentrations of HDL (High
Density Lipoprotein)-cholesterol are associated with higher risk of cardiovascular
diseases. Each of the concentrations of total, LDL- and HDL-cholesterol can be
affected beneficially by lifestyle and dietary changes as well as by medication
(Hooper et al. 2001; Hu et al. 2001). Numerous studies are known on the cholesterol-
lowering effect of phytosterols and phytostanols added as their fatty acid esters to
margarines such as Benecol™ and Becel pro-aktiv™. Fatty acid esters of phyto-
sterols and phytostanols, rather than the unesterified phytosterols and phytostanols,
are generally used as supplements in fat-containing functional foods, such as marga-
rine, oil, mayonnaise, and salad dressings due to a better solubility of the steryl
esters in fat (Leesen and Flöter 2002). A recent meta-analysis of randomized,
placebo-controlled, double-blind intervention studies has revealed that the daily
ingestion of 2 g of phytosterols, phytostanols or their esters reduces the LDL-chole-
sterol concentration of blood by 9 to 14%, whereas the concentrations of HDL-chole-
sterol and triacylglycerols are not affected (Law 2000).
In food industry, fatty acid esters of sterols and stanols are usually prepared from the
corresponding sterols by chemical esterification with fatty acids or interesterification
with fatty acid methyl esters. Phytosterols and phytostanols are preferentially con-
verted to their fatty acid esters by chemical interesterification with fatty acid methyl
esters (van Amerongen and Lievense 2001; Miettinen et al. 1992) or triacylglycerols
489

(Miettinen et al. 1996) using an alkaline catalyst, such as sodium methylate. –
Lipase-catalyzed esterification and interesterification have been widely used for
bioorganic synthesis and biotransformation of fats and other lipids, however, little is
known so far on the application of such reactions in the preparation of short- and
long-chain acyl esters of sterols, stanols and steroids (Kazlauskas and Bornscheuer
1998). We reported recently that esterification and interesterification reactions,
catalyzed by C. rugosa, Lipozyme RM, Lipozyme TL, Novozym 435 and papaya latex
lipases under vacuum, provide fatty acyl esters of sterols and stanols in near-
quantitative yields (Weber and Mukherjee 2001, 2002). Similarly, short-chain acyl
esters of sterols and steroids are obtained in high yields by transesterification with
short-chain triacylglycerols, catalyzed by C. rugosa lipase in vacuo at moderate
temperature (Weber et al. 2001a). Neither an organic solvent nor water is added to
the reaction mixtures and no drying agent such as molecular sieve is used.
Sterols (sitosterol, cholesterol, stigmasterol, ergosterol and 7-dehydrocholesterol)
and sitostanol are converted in high to near-quantitative yields to the corresponding
long-chain acyl esters via esterification with fatty acids and transesterification with
methyl esters of fatty acids or with triacylglycerols using immobilized lipases from C.
rugosa, Rh. miehei (Lipozyme IM) and C. antarctica (lipase B, Novozym 435) as
biocatalysts in vacuo (20-40 hPa) at 40-80°C (Weber et al. 2001a, 2001b).
Figure 1 shows the formation of sitostanyl oleate after 2h via esterification of 300
µmol oleic acid, transesterificartion of 300 µmol of methyl oleate or 150 µmol of
triolein with 100 µmol of sitostanol in the presence of 50 mg C. rugosa lipase at 40°C
and 30 hPa. The esterification of sitostanol with oleic acid is almost complete well
within 1 h of reaction, whereas the rates of transesterification with either methyl
oleate or triolein are distinctly lower (Figure 1).
Figure 2 shows the time-course of the formation of sitostanyl oleate via esterification
of oleic acid with sitostanol in the presence of C. rugosa lipase at 40°C and Lipozyme
RM at 80°C, both in vacuo. It is obvious from these data that conversion rates
observed with lipase from C. rugosa were by far higher than those obtained using
Lipozyme RM as biocatalyst (Weber et al. 2001a, 2001b).
Corresponding conversions observed with papaya (Carica papaya) latex lipase were
generally lower. Increasing the reaction temperature, molar ratio of fatty acid or alkyl
ester to sterol as well as the amount of the various lipases increased the rate of
conversion. High conversion rates observed in transesterification of sitostanol with
490

methyl oleate at 80 °C using Lipozyme IM was retained even after ten repeated uses
of the biocatalyst indicating its excellent reuse properties.
0
50
100
Con
vers
ion
(%)
Oleic acidTriolein
Methyl oleate
Figure 1. Formation of sitostanyl oleate via esterification of oleic acid, transester-
ificartion of of methyl oleate or triolein with sitostanol in the presence of C. rugosa
lipase after 2h at 40°C in vacuo
0
50
100
0 4 8Time
Con
vers
ion
(%)
Figure 2. Time-course of the formation of sitostanyl oleate via esterification of oleic
acid with sitostanol in the presence of C. rugosa lipase (•) at 40°C and Lipozyme RM
( ) at 80°C in vacuo In addition, phytosterol mixtures present in deodorizer distillates from plant oil refining
and mixtures of phytosterols and phytostanols contained in tall oil from paper
production were converted in situ into the corresponding steryl and stanyl fatty acid
491
esters using immobilized lipase from Candida rugosa under the conditions described
above. (Weber et al. 2002, 2003a and b).
Literatur Hendriks HFJ, Weststrate JA, van Vilet T, Meijer GW (1999): Spreads enriched with
three different levels of vegetable oil sterols and the degree of cholesterol lowering in normocholesterolemic and mildly hypercholesterolemic subjects. Eur J Clin Nutr 53, 319-327
Hooper L, Summerbell CD, Higgins JP, Thompson RL, Capps NE, Smith GD, Riemersma RA, Ebrahim S (2001): Dietary fat intake and prevention of cariovascular disease: systematic review. Br Med J 322, 757-763
Hu FB, Manson JE, Willett WC (2001): Types of dietary fat and risk of coronary heart disease: A critical review. J Am Coll Nutr 20, 5-19
Leesen P, Flöter E (2002): Solidification behaviour of binary sitosteryl esters mixtures. Food Res Int 35, 983-991
Law M (2000): Plant sterol and stanol margarines and health. Br Med J 320, 861-864 Kazlauskas RJ, Bornscheuer UT (1998): Biotransformations with lipases. In
Biotechnology (Rehm H-J, Reed G, Eds) 2nd edition, Vol. 8a: Biotransformations, pp. 37−191, Wiley-VCH, Weinheim
Miettinen T, Vanhanen H, Wester I (1996): Use of stanol fatty acid ester for reducing serum cholesterol level. US Patent 5 502 045
Miettinen TA, Vanhanen H, Wester I (1992): A substance for lowering high chole-sterol level in serum and a method for preparing the same. Patent WO 92/19640
Miettinen TA, Puska P, Gylling H, Vanhanen H, Vartiainen E (1995): Reduction of serum cholesterol with sitostanol-ester margarine in a mildly hyperchole-sterolemic population. New Engl J Med 333, 1308-1312
Van Amerongen M, Lievense LC (2001): Stanol comprising compositions. US Patent 6 231 915 B1
Weber N, Mukherjee KD (2001): Enzymatisches Verfahren zur Herstellung von Carbonsäure-sterylestern. German Offenlegung DE 100 18 787 A1
Weber N, Weitkamp P, Mukherjee KD (2001a): Fatty acid steryl, stanyl and steroid esters by esterification and transesterification in vacuo using Candida rugosa lipase as catalyst. J Agric Food Chem 49, 67-71
Weber N, Weitkamp P, Mukherjee KD (2001b): Steryl and stanyl esters of fatty acids by solvent-free esterification and transesterification in vacuo using lipases from Rhizomucor miehei, Candida antarctica and Carica papaya. J Agric Food Chem 49, 5210-5216
Weber N, Mukherjee KD (2002): Enzymatisches Verfahren zur Herstellung von Fettsäure-sterylestern aus Dämpferdestillaten der Fettraffination und Tallöl. German Offenlegung DE 101 19 972 A1
Weber N, Weitkamp P, Mukherjee KD (2002): Cholesterol-lowering food additives: lipase-catalyzed preparation of phytosterol and phytostanol esters. Food Res Int 35, 177-181
Weber N, Weitkamp P, Mukherjee, KD (2003a): Steryl and stanyl esters by solvent-free lipase-catalyzed esterification and transesterification in vacuo. Fresenius Environ Bull 12, 517-522
Weber N, Weitkamp P, Mukherjee, KD (2003b): Steryl esters by transesterification reactions catalyzed by lipase from Thermomyces lanuginosus. Eur J Lipid Sci Technol (in press)
492

Characteristics of cold pressed pumpkin seed oil
Vukša, V., Dimić, E., Dimić, V. University of Novi Sad, Faculty of Technology, Bul. Cara Lazara 1, 21000 Novi Sad, Serbia and Montenegro Introduction
The number and amount of harmful chemicals is increasing. Unfortunately, the food
also contains different chemical materials, like colouring matters, preservers, artificial
aromatic materials etc. When producing a new food product, the aim should be to
achieve the maximal nutritive value, with minimal addition of artificial materials.
The cold pressed edible oils arouse increasing interest as they are not subjected to
different refining processes and no chemicals are used during the production. Pump-
kinseed oil is one of the earliest representatives of cold pressed oils. This oil is
among the most quality and stable edible oils.
During the cold pressing (the temperature of pressed oil must not exceed 50°C), nei-
ther the seed, nor the natural oil components undergo undesirable changes. The
pressed pumpkin seed oil is rich in unsaturated fatty acids and E-vitamin. In addition,
the oil is a source of natural vitamins and trace elements, and is applied as a fortify-
ing agent. It affects positively the immunity, improves the physical status, alleviates
the symptoms of chronical inflammatory diseases (1, 2).
The technology of cold pressed edible oils obtaining seems to be rather simple (3),
however, in case of pumpkin seed, certain problems arise during pressing. The aim
of this work was to point to several important facts connected with obtaining of
pumpkin seed oil on screw presses, investigate the obtained oil quality and discuss
the possible use of press residue.
Materials and methods
The seed of domestic "Olinka" pumpkin was pressed in laboratory conditions, using
the "KOMET" screw-press.
Standard methods were used for the determination of raw material quality, character-
istics and composition (4, 5): content of iron and copper was determined by AAS
method and the content of pesticides by GC-TLC method.
493

Results and discussion
The quality characteristics of pumpkin seed used for pressing are presented in Table 1.
The seed is of good quality, with low water content, which is necessary for safe storage.
Table 1. Quality characteristics of pumpkin seed
Characteristics Value Moisture content (%) 5,87 Oil content (%) 40,10 Acid value (mg KOH/g) 0,72 Peroxide value (mmol/kg) 1,16 Anisidine value (1001%
350nm) 0,00 Protein content (%) 46,33
Regarding the obtained results, it can be stated that good quality pressed oils could
be obtained from the investigated seed.
The sensory characteristics, colour, odour and taste, of refined and nonrefined oils
are significantly different. Due to these characteristics the nonrefined oils are also
named aromatic, spicy, gourmet etc. It is interesting to mention that during techno-
logical steps the natural sensory characteristics of nonrefined edible oils can be en-
hanced - intensified (6, 7).
The quality of oil obtained by pressing on screw press is rather good (Table 2). Com-
pared with quality characteristic values defined by the official standard (8), only the
moisture content was higher than the prescribed one, as the result of seed humidifi-
cation, which is necessary for the pressing. For this reason, a special attention
should be paid when moistening the seed before pressing in order to prevent too high
moisture content of the oil.
The particular importance of cold-pressed oils is their so-called “bio-value”, meaning
that the oils are of natural origin and that they contain no harmful materials. The iden-
tification of pesticides was performed in the pressed pumpkinseed oil and only two,
out of 11 investigated organochlorinated pesticides were found. The content of pesti-
cides and heavy metals (iron and copper) was determined (Table 3).
The presence e.g. determination of pesticides is of special importance since it has
been found that the organochlorinated pesticides are harmful for human health, they
are toxic and cancerogenic ones and can accumulate in the human organism.
494

Table 2. Quality characteristics, composition and stability of pumpkin seed oil
Parameter Results Serbia and Montenegro (8)
Literature (1, 9)
Quality Content of moisture and evaporable (%)
1.09 0.2* 0.06, 0.09
Content of insoluble matters (%) 0.04 0.05* 0.04 Acid value (mgKOH/g) 3.34 4.00* 1.67, 2.37 Peroxide value (mmol/kg) 2.77 5.0* 2.49 Anisidine value (100 A15
35ö nm) 1.90 - 2.32, 2.94 Composition Saponification value (mgKOH/g) 184 - 187 Iodine value (g/100g) 103 - 102, 117 Nonsaponifiable matters (g/kg) 6.40 - 12 Fatty acid composition (%)
palmitic C16:0 stearic C18:0 oleic C18:1 linoleic C18:2, ω-3 fatty acid
14,15 7,59 34,97 42,97
6,2-15,9 5,2-17,0
20,4-55,0 34,3-55,0
11,86 7,30
40,55 38,61
Tocopherols content (mg/kg) 650 - 603, 680,840 Phosphatides content (%) 0.14 - 0.07
Stability Rancimat test (h) Induction period at t oC
6.5 (t =120)
-
5.1 (t =130) 33.8 (t =100)
*maximal permitted values
Table 3. Content of pesticides and heavy metals in pumpkin seed oil
Characteristics Value Alfa HCH (mg/kg) 0,0860 Lindan (mg/kg) 0,0437 Content of iron (mg/l) 0,27 Copper (mg/l) < 0,03
The pressed pumpkin seed oil fulfils the demands for nonrefined edible oils quality
(8). However, it is important to emphasise that these oils are not refined, so it is of
especial importance that the seed contains no nondesirable materials, like herbi-
cides, insecticides, heavy metals etc., since they will remain in the oil.
The press-residue – cake – contains even 57,88% of proteins, which is by 25%
higher than the initial seed. The cake, as natural biologically nutritive material can be
used for the production of different food products: in the confectionery, dairy industry
etc.
495

Acknowledgment This work was supported by the Serbian Ministry of Science, Technologies and De-
velopment through the Project: ‘’Cold pressed oleic type sunflower oil with changed
tocopherols composition"- BTN.2.3.1.0402.B
Summary Pumpkin seed oil is in the group of high-quality salad oils. The industrial production of pumpkin seed oil includes preparation of seed and pressing on hydraulic presses. The sensory characteristics, quality parameters, characteristics for identification and the stability of cold pressed oil obtained from seeds of naked seeded oil pumpkin on screw press were determined. The seed quality was also investigated. According to the obtained results, the oil is of very good quality and of high nutritive value. The content of essential linoleic acid was 43%, total tocopherols level 650 mg/kg, and the oil contained 0,14% of phosphatides. The stability of oil at 120°C, expressed by induction period determined by Rancimat test, was 6,5 hours. Literature 1. Karlović Dj., Berenji J., Recseg K., Kővári K., (2001): Savremeni pristup uljanoj
tikvi (Cucurbita pepo L.) sa posebnim osvrtom na tikvino ulje (Oleum cucurbitae), 42. Conference of edible oil industry: Production and processing of oilseeds, Proceedings, Herceg-Novi, 177-182.
2. Léder F.-né, Molnár I., (1993): A nagy tápértékű olajtökmag-présmaradék hasznosítási lehetősége, Gabonaipar, 40, 17-18
3. Dimić E., Radoičić J., Lazić V., Vukša V., (2002): Jestiva nerafinisana ulja suncok-reta – Problemi i perspektive, Eko-Konferencija 2002, Zdravstveno bezbedna hrana, Tematski zbornik II, Novi Sad, pp. 153-158.
4. Dimić E., Turkulov J., (2000): Kontrola kvaliteta u tehnologiji jestivih ulja, Tehnološki fakultet, Novi Sad
5. Karlović Dj., Andrić N., (1996): Kontrola kvaliteta semena uljarica, Tehnološki fakultet, Novi Sad, Savezni zavod za standardizaciju, Beograd,
6. Dimić E., Turkulov J., Karlović Dj., Keser N., Vukša V., (1997): Kvalitet jestivih nerafinisanih ulja suncokreta različitog sastava masnih kiselina u zavisnosti od načina dobijanja, 37. Savetovanje: Proizvodnja i prerada uljarica, Zbornik radova, Budva, 23-30
7. Turkulov J., Dimić E., Karlović Dj., Vukša V., (1998): Effect of Hydrothermal Treatment on the Quality of Nonrefined Edible Sunflower Oil, in Emerging Tech-nologies, Current Practices, Quality Control, Technology Transfer and Environ-mental Issues, Eds. S.S. Koseoglu, K.C. Rhee and R.F Wilson, AOCS Press, Champaign, Illinois, 185-187.
8. Pravilnik o kvalitetu i drugim zahtevima za jestivo biljno ulje i masti, margarin i druge masne namaze, majonez i srodne proizvode, Sl. list SRJ br: 54/1999
9. Dimić E., (2000): Kontrola kvaliteta hladno presovanih ulja, Acta Periodica Tech-nologica, 31: part A, 165-174.
496

Muscular tissue lipids of fattened pigs fed nutritive oil additives
Tsvetkova V.
Institute of cryobiology and food technologies, Bulgaria, Kostinbrod 2232
Enriching the pig muscular lipids with some polyunsaturated fatty acids (PUFA) by
feeding has favourable effect on the nutritive value and taste properties of meat. The
accumulation of optimal fatty acids in different tissues depends mainly on their dietary
intake and endogenous synthesis (Cara et al.,1999), but the combination of oils
added seem to be important (Lauridsen et al., 1999). The study has been carried out
to investigate the influence of nutritive oils, added to the diets, on the pig muscular
lipids.
Material and methods: Twelve male castrated pigs (Large White x Landras) are
divided in two groups. The control group is fed with corn-soybean mixture and to the
diet of experimental is added 2% soy and 1% fish oil at the expense of part of the
carbohydrate component. The samples from the m. longissimus dorsi (mld) and m.
triceps brachii (mtb) are taken for analyses after slaughter of the pigs at 100 kg live
weight. The total lipid extracts are obtained after Bligh and Dyer (1959). The
triacylglycerols (Tg), the free fatty acids (FFA, Cunanne et al., 1986) and the
cholesterol are analysed (Sperry and Webb, 1950). The fatty acid composition (FAC)
of phosphatidylcholine (PC) and phosphatidylethanolamine (PE) is studied by
combined application of thin-layer and gas chromatography (Lepage and Roy, 1988).
A capillary column (3 m long, 0.45 mm i.d., 1µm film thickness) with a ECTM - Wax is
used for the separating of fatty acid’methyl esters.
Results and discussion: Supplemented to the experimental diet soy oil is rich of
18:2n-6 (52.2%) and 18:3 (7.3%), and fish oil contains some longchain polyenes -
20:5n-3 (12%), 22:5n-3 (1.9), 22:6n-3 (8.9%). The content of Tg, FFA, total
cholesterol and phospholipids (Table 1) in the studied muscles with different
metabolic activity - mld (glycolytic) and mtb (oxydative) are within the limits,
characteristic for the hybrid (Dimitrov et al. 2002). The cholesterol lowering effect of
the longchain polyenes is not found, which probably results from its quite low initial
level in the two muscles. The fatty acid composition of PC (Table 2), which is quality
497

Table 1. The content of Tg, FFA, phospholipids and cholesterol in mld and mtb in
pigs fed oil additives.
mld mtb
Lipid classes Control Experimental Control Experimental
Triacylglycerols, µM/100g 1368 ± 219 1783 ± 142 1005 ± 126 1566 ± 237*
FFA, nM/100g 419 ± 91 641 ± 123 474 ± 98 334 ± 33 Phospholipids, mg/100g 406 ± 22 401 ± 15 547 ± 25 540 ± 32 Cholesterol, mg/100g 34.2 ± 1.9 42.3 ± 1.0 39.5 ± 3.6 45.1 ± 1.8
Table 2. Fatty acid composition (M%) of PC from mld and mtb in pigs fed oil additives.
mld mtb
Fatty acids Control Experimental Control Experimental
14:0 0.76 ± 0.02 0.60 ± 0.16 0.43 ± 0.07 0.46 ± 0.24
16:0 33.36 ± 0.33 31.51 ± 2.15 33.14 ± 0.85 31.86 ± 1.26
16:1 2.12 ± 0.10 2.28 ± 0.15 2.20 ± 0.44 1.74 ± 0.45
18:0 5.70 ± 0.40 6.04 ± 0.39 5.93 ± 0.66 5.33 ± 0.56
18:1 18.84 ± 0.60 13.11 ± 0.61** 18.19 ± 0.77 13.30 ± 1.28*
18:2n-6 32.42 ± 0.86 40.38 ± 2.68* 33.76 ± 0.66 43.16 ± 1.29**
18:3n-3 0.33 ± 0.07 0.76 ± 0.08* 0.59 ± 0.06 1.15 ± 0.38
20:1 0.25 ± 0.02 0.31 ± 0.07 0.28 ± 0.08 0.16 ± 0.02
20:4n-6 4.10 ± 0.42 2.40 ± 0.25* 2.96 ± 0.25 1.10 ± 0.26**
20:5n-3 0.44 ± 0.04 0.92 ± 0.07** 0.27 ± 0.02 0.48 ± 0.13
22:5n-3 0.75 ± 0.08 1.02 ± 0.17 1.51 ± 0.49 0.71 ± 0.28
22:6n-3 0.95 ± 0.06 0.68 ± 0.07 0.71 ± 0.09 0.55 ± 0.11
MUFA 21.21 ± 0.24 15.70 ± 0.27** 20.67 ± 0.43 15.20 ± 0.58**
PUFA(n-3 + n-6) 38.99 ± 0.26 46.16 ± 0.55** 39.80 ± 0.26 47.15 ± 0.41**
n-3/n-6 PUFA 0.07 0.08 0.08 0.06
*P<0.05; **P<0.01
498

prevailing individual phospholipid in the membrane structures, shows that the oils
added to the experimental diet increase the level of PUFA (18:2n- 6, 18:3n-3, 20:5n-
3) and decrease the content of MUFA, mainly by 18:1, in the two muscles. Raz et al.
(1998), Lauridsen et al. (1999) and Sawozet et al. (1999) observe similar tendencies
as a result of feeding with oils rich in PUFA and suggest that the activity of ∆-9
desaturase may be regulated through the level of PUFA. In the FAC of PE (Table 3)
a raise of the content of 18:2n-6, 18:3n-3, 20:5n-3, 22:6n-3, which resembles PC, is
observed. A higher incorporation of longchain polyens (20:5n-3 and 22:6n-3) into the
Table 3. Fatty acid composition (M%) of PE from mld and mtb in pigs fed oil additives
mld mtb
Fatty acids Control Experimental Control Experimental
14:0 0.66 ± 0.06 0.87 ± 0.17 0.84 ± 0.18 0.50 ± 0.06
16:0 15.74 ± 1.02 13.22 ± 0.46 10.66 ± 0.06 2.98 ± 0.91
16:1 2.83 ± 0.61 2.20 ± 0.32 3.03 ± 0.80 1.38 ± 0.24
18:0 22.08 ± 0.74 24.47 ± 2.06 23.77 ± 1.47 22.88 ± 1.41
18:1 11.74 ± 0.43 10.45 ± 0.70 12.25 ± 1.20 9.17 ± 0.17
18:2n-6 20.04 ± 1.51 26.65 ± 1.13 25.68 ± 1.57 32.09 ± 0.97*
18:3n-3 1.19 ± 0.12 1.02 ± 0.10 0.85 ± 0.04 1.37 ± 0.13*
20:1 0.38 ± 0.06 0.30 ± 0.04 0.31 ± 0.04 0.53 ± 0.03*
20:4n-6 19.45 ± 0.90 11.66 ± 1.35 19.24 ± 1.08 12.93 ± 0.51**
20:5n-3 0.78 ± 0.11 3.54 ± 0.56* 0.62 ± 0.11 4.28 ± 0.32***
22:5n-3 3.55 ± 0.36 3.26 ± 0.29 1.57 ± 0.16 3.11 ± 0.13**
22:6n-3 1.56 ± 0.15 2.35 ± 0.24 1.17 ± 0.06 2.75 ± 0.13***
MUFA 14.95 ± 0.37 12.95 ± 0.35 15.59 ± 0.68 11.08 ± 0.15**
PUFA
(n-3 + n-6) 46.57 ± 0.52 48.48 ± 0.61 49.13 ± 0.50 56.53 ± 0.36***
n-3/n-6 PUFA 0.18 0.26 0.09 0.26
*P<0.05; **P<.0.01; ***P<0.001
muscular PE versus PC in the experimental pigs is found. The significantly lower
concentration of 20:4n-6 in the experimental animals (in PC and PE) may be due to
499
the n-3 PUFA (Wood et al., 2003) present in the fish and soy oils. Probably they
inhibit ∆-5 and ∆-6 desaturases through a feedback mechanism, by inhibiting the
conversion of 18:2n-6 to 20:4n-6. The n-3/n-6 PUFA ratio increases because of
higher inclusion of n-3 PUFA in the muscular PE of the experimental group.
Conclusion: The addition of soy and fish oils to the diet of fattened pigs has
favourable effect on FAC of PC and PE in the mld and mtb. In the muscular tissue
the level of PUFA moderately increases and n-3/n-6 ration changes to the required
direction. In such a way the muscular tissue is enriched by n-3 polyens, which are
most deficient in the diets of animals and human.
Summary: The effect of soy and fish oil added to the diets of fattened pigs on
muscular lipids has been investigated. The results show the possibility to change
FAC of muscular PC and PE in the required direction through adding a small
percentage of fish and soy oils to the diet. The notably low level of total cholesterol in
two muscles the oil supplemented, containing longchain polyenes, do not manifest
cholesterol-lowering effect. Added nutritive oils moderately increase the content of
essential linolic acid in PC and PE of the mld and mtb. Moreover, with respect the
inclusion in the tissue phospholipid molecules a difference between concentration of
18:2n-6 and n-3 polyenes with 20 and 22 C-atoms has been established. The
moderate increase level of longchain PUFA is favourable both to the development of
the animals and to the consumers.
Literature: Bligh E, Dyer W (1959):Can.J Biochem Physiol, 37, 911-917
Cara R, Ruiz C, Lopez C, Martin L, Gracia C, Ventanas J, Antequera T(1997): Meat Sci, 45,263-270 Cunanne S, McDoo K, Prohaska J (1986): J Nutr,116,1248-1256 Dimitrov G, Tsvetkova V, Zlatanov I (2002): BJAS, 8, 307-311 Lauridsen C, Anderson G, Andersson M, Danielsen V, Engberg R, Jakobsen K (1999): J Anim Feed Sci,8,441-456 Lepage G, Roy C (1988): J Lipid Res, 27,114-120 Raz A, Kamin-Belsky N, Przedecki F, Obukowicz M (1998): J Amer Oil Chem Soc, 75, 241-245 Sawoz E, Chachulowa J, Lechowski R, Fiedorowicz S, Kosieradzka I, (1999): J Anim Feed Sci, 8, 95-105 Wood J, Richardson R, Nute G, Fisher A, Compo M, Kasapidou E, Sheard P, Enser M (2003): Meat Sci, in press
500

Effect of substitution of sesame oil as sole in type 2 diabetes on drugs Sankar, D., Ramesh, B., Sambandam, G.*, Ramakrishna Rao, M.**, Pugalendi, K.V. Department of Biochemistry, Annamalai University, Annamalainagar-608 002, Tamilnadu, India * Prof. M.M. Poly Clinic, Chidambaram-608 001, Tamilnadu, India ** Faculty of Medicine, Rajah Muthiah Medical College and Hospital, Annamalai, University,
Annamalainagar-608 002, Tamilnadu, India INTRODUCTION Over the past 20 years many studies and clinical investigations have been carried out on the metabolism of polyunsaturated fatty acids (PUFAs). PUFAs are essential for the normal growth and development and may play an important role in the prevention and treatment of coronary artery disease, hypertension, diabetes, other inflammatory and autoimmune disorders, and cancer. Great progress has taken place in our knowledge of the various fatty acids in health and disease. Specifically, their beneficial effects have been shown in the prevention and management of coronary heart disease, type 2 diabetes, hypertension and renal failure. Reports suggested that high-monounsaturated fatty acid diet improves lipoprotein profile as well as glycemic profile. Sesame oil is a commonly used edible oil in south India. In Tamil it is called as “Nallennai” means “Good oil.” Sesame oil contains 43% polyunsaturated fatty acids and 40% monounsaturated fatty acids along with some powerful antioxidant properties such as sesamin, episesamin and sesamolin. It has been reported in a Tamil sonnet that sesame oil, along with Eclipta alba is capable of alleviating diabetes. Our earlier work we have found that Eclipta alba is capable of reducing blood sugar in diabetic rats. Our previous studies we reported that sesame oil reduced blood pressure, total cholesterol, LDL-C, triglycerides, lipid peroxidation and improves HDL-C, enzymic and non enzymatic antioxidants levels in hypertensive patients. Based on the observations, we proposed to find out the additive effect of sesame oil on diabetic patients who were on antidiabetic medication. MATERIALS AND METHODS Subjects Study group comprised 40 diabetic patients (aged 35-60 years; 22 male; 18 female) on drugs. Antidiabetic medications continued by the patients were glibenclamide (5-10 mg/day). Patients selected were recruited in Rajah Muthiah Medical College and Hospital, Annamalai University and Prof. Maniarasan Memorial Poly Hospital. Chidambaram, Tamilnadu, India. Study was approved by the Ethical Committee of Rajah Muthiah Medical College and Hospital, Annamalai University. Informed consent was obtained from the patients. INCLUSION CRITERIA: Age 45-65 years of both sexes, fasting blood glucose > 126 mg/dL, postprandial blood glucose > 200 mg/dL, patients who were administered with antidiabetic medication. EXCLUSION CRITERIA: Subjects were excluded from the study if the medical history or physical examination at screening revealed any of the following; Chronic alcoholics; Female patients on oral contraceptives; Pregnant females; Lactating mothers; Patients who could not follow the study protocol till the end of the experiment.
501

Study protocol Detailed clinical, physical examinations and routine investigations such as glucose, glycosylated hemoglobin, lipid profile, lipid peroxidation, enzymic and non enzymic antioxidants in blood were carried out at basal. Patients were supplied sesame oil (IDHAYAM GINGELLY OIL) 4-5 kgs of sesame oil for a four member family per month. Patients were instructed to use sesame oil as sole edible oil without mixing with other oils for 45 days as an average intake of 35-40 g / day/ person. Investigations repeated at the end of the 45th day of experimental period. Patients were asked to stop the utilization of sesame oil and were asked to switch over to their original oil whatever they took earlier before the enrollment of the study for another 45 days. Mostly they were using sunflower oil, groundnut oil, palm oil or sesame oil at random. At the end of the switching over period the same investigations were carried out again. Methods Biochemical analysis Glucose Sasaki et al (1972) Glycosylated Hb Sudhakar Nayak et al (1981) Total cholesterol Allain et al(1974) HDL-C Lopes (1977) Triglycerides Faster and Dunn (1973) LDL-C Friedwald calculation(1972) Thiobarbituric acid reactive substances Nichans et al (1968) Superoxide dismutase Kakkar et al(1978) Catalase Sinha KA (1972) Glutathione peroxidase Rotruck et al (1973) Vitamin C Roe et al (1943) Vitamin E Baker et al (1980) β-carotene Bradely et al (1973)] Reduced glutathione Ellman (1959)
RESULTS AND DISCUSSION
Plasma glucose and glycosylated hemoglobin levels significantly reduced upon the substitution of sesame oil and the values increased once the sesame oil substitution was withdrawn. Rasmussen et al and Abhimanyu Garg et al reported that high monounsaturated fatty acid diet is capable reducing blood glucose and glycosylated hemoglobin. Since sesame oil contains
40% monounsaturated fatty acids, may be responsible for the reduction of glycemic profile.
LEVELS OF GLUCOSE AT BASAL, SESAME OIL SUBTITUTION AND WITH DRAWAL OF SESAME OIL
SUBSITUTION.
185.65
112.55144.4
020406080
100120140160180200
BASAL SESAME OILSUBTITUTION
WITH DRAWAL OFSESAME OIL
SUBSITUTION.
502

Plasma levels of total cholesterol, LDL-C and triglycerides reduced significantly in sesame oil substituted periods wile no variation in HDL-C and the values elevated when the patients were switch over to other oils. Studies in humans and animals demonstrated that oils containing saturated fatty acids raise serum total cholesterol (TC), triglycerides (TG) and, in
particular, low density lipoprotein cholesterol (LDL-C) levels, while those enriched in unsaturated fatty acids lower TC, TG and LDL-C. Hence the reduction of these parameters upon sesame oil substitution could be due to the presence of polyunsaturated fatty acids as well as monounsaturated fatty acids. Diets high in monounsaturated fatty acids and poly unsaturated fatty acids have been found to be relatively hypocholesterolemic or hypotriacylglycerolemic, Prior reports show that sesame lignans such as sesamin and episesamin modulate cholesterol metabolism by inhibiting the synthesis and absorption of cholesterol in the stroke-prone spontaneously hypertensive rats. The lignans present in sesame oil may also play a role in the reduction of cholesterol in our study.
Lipid peroxidation (TBARS) shows significant reduction upon sesame oil substitution. Significant increase in reduced glutathione observed. Erythrocyte membrane bound superoxide dismutase(SOD) , glutathione peroxidase(GPX) and plasma levels of catalase (CAT) increased significantly. Significant elevation of vitamin C, vitamin E and β-carotene levels observed. The levels of these parameters elevated once the sesame oil substitution. Lipid peroxidation (thiobarbituric acid reactive substances) decreased significantly upon sesame oil substitution. The reduction may be due to the excessive availability of vitamin E in sesame oil. Earlier study suggested that sesamolin, lignan present in sesame oil reduce lipidperoxiadtion in rats. The lignans (sesamin,episesamin and sesaminol) may potentiate the effect of vitamin E and themselves acts as antioxidants that may also be responsible for the reduction in lipid peroxidation. The increased level of superoxide dismutase, glutathione peroxidase and catalase could be due to the decreased utilization since the lipid peroxidation levels are low.
LEVELS OF GLYCOSY LATED HEMOGLOBIN AT BASAL, SESAME OIL SUBTITUTION AND WITH DRAWAL OF SESAME
OIL SUBSITUTION.
7.45
4.8 5.5
0123456789
10
BASAL SESAME OILSUBTITUTION
WITH DRAWAL OFSESAME OIL
SUBSITUTION.
503

The increased levels of vitamin C may be due to the sparing action of vitamin E and lignans present in sesame oil. Yamashita et al reported that sesame lignans produce marked enhancement of vitamin E activity in rats fed a low alpha-tocopherol diet. In the present study, elevation of vitamin E may be due to the high concentration of vitamin E and lignans in sesame oil. The elevation of b-carotene in our study may be due to the sparing action of vitamin E and sesame lignans.
PERSPECTIVES OF THE STUDY The study has several limitations. Because a cross over design was not used and also the study was not a randomized placebo controlled trial, it cannot address the question of whether normal levels of blood sugar could be reduced even further if the substitution of sesame oil continued. Long- term well-designed interventions are clearly needed, but the study provides substantial evidence for a possible role for sesame oil in the prevention of elevated blood pressure. Further research is needed to elucidate the plasma drug concentration and fatty acids and also fatty acid composition, vitamin E and sesamin content of the sesame oil and also the effect of sesame oil on cytochrome P450 system to be studied. Further studies will be necessary to unravel the exact mechanisms responsible for the reduction of blood sugar and lipids upon sesame oil substitution. Nevertheless, therapy using sesame oil with antidiabetic medication might increase the efficacy of treatment of type 2 diabetes in humans. CONCLUSION Substitution of sesame oil as sole edible oil has additive effect on antidiabetic medication and can be effective in reducing blood sugar in diabetic patients. Sesame oil also influences beneficially the levels of lipid profile, electrolytes, lipid peroxidation and antioxidants. ACKNOWLEDGEMENT Our heartfelt thanks are due to V.V.V & for their cost free supply of IDHAYAM GINGELLY OIL to carry out the research work.
504

Einfluss einer Daidzein-Supplementierung des Futters von tragenden Sauen auf das Wachstum von neu geborenen Ferkeln Kuhn, G.1, Ren, M.Q.2, Rehfeldt, C.1, Nürnberg, K.1, Kanitz, E.1, Tuchscherer, M.1, Stabenow, B.1, Ender, K.1 1 Research Institute for the Biology of Farm Animals,Wilhelm-Stahl-Allee 2, D-18196 Dummerstorf, Germany 2 Nanjing Agricultural University, 210095 Nanjing, China Einleitung
Isoflavone gehören zu den Phytoöstrogenen. Sie besitzen eine Vielzahl von biologi-
schen Eigenschaften und können sowohl estrogene als auch antiestrogene Effekte
auslösen (Ren et al. 2001). Aufgrund ihrer hormonähnlichen Funktionen könnten die
Isoflavone für die Beeinflussung des Wachstums von Schweinen von Bedeutung
sein. Als eine besonders für Estrogeneinwirkungen sensitive Periode gilt die pränata-
le Phase, während der das fetale Wachstum stattfindet (Degen et al. 1999, Setchell
et al. 2000). Eines der bekanntesten Isoflavone ist das Daidzein als Inhaltsstoff der
Sojabohne.
Die Zielstellung der Arbeit bestand in der Untersuchung des Einflusses einer Daid-
zein-Behandlung von tragenden Sauen auf verschiedene Wachstumsmerkmale von
Muttertier und neugeborenen Ferkeln.
Material und Methode
In einem Versuch mit tragenden Sauen (n = 14) wurde die tägliche Futterration wäh-
rend der Endträchtigkeit (85. TT - Abferkelung) mit 8 mg synthetisch hergestelltem
Daidzein/kg Futter supplementiert. Unmittelbar nach der Geburt der Ferkel (n = 194)
wurden 2 männliche Tiere/Wurf für verschiedene Analysen ausgewählt (n = 28). Wei-
terhin erfolgten Probeentnahmen von Blut (Sauen, Ferkel) und Sauenmilch.
Ergebnisse
Neben der Beeinflussung von Merkmalen der Wurfleistung (Tab.1) war das Geburts-
gewicht der Ferkel in der Daidzein-Gruppe erhöht (Abb.1). Der Gewichtsvorteil war
bei den männlichen Tieren deutlicher ausgeprägt als bei den weiblichen Tieren. Die
IGF-1 Konzentrationen im Sauenblut waren durch die Daidzein-Behandlung nicht
beeinflusst, während die Gehaltswerte im Kolostrum höher lagen. Ebenfalls hatten
die neu geborenen Ferkel der mit Daidzein behandelten Sauen ein höheres Konzent-
rationsniveau an IGF-1 im Blut als die entsprechenden Kontrolltiere (Abb.2). Im Mus-
505

kelgewebe der Ferkel wurde in der Daidzein-Gruppe weiterhin ein höherer IGF-1R
mRNA-Gehalt nachgewiesen (Abb.3).
Schlussfolgerungen
Daidzein übt physiologische Effekte auf die maternal/fetale Einheit während der
Trächtigkeit von Sauen aus.
Eine Daidzein-Aufnahme von tragenden Sauen kann für die Beeinflussung von Leis-
tungseigenschaften von Sauen und Nachkommen von Bedeutung sein.
Die Forschungen zur Untersuchung der Effekte von Daidzein auf das Wachstum von
Schweinen und damit in Zusammenhang stehenden physiologisch/metabolischen
Prozessen sollten intensiviert werden.
Zusammenfassung
Die Zielstellung der Arbeit bestand in der Untersuchung des Einflusses einer Be-
handlung von tragenden Sauen mit Daidzein (isoflavones Phytoöstrogen) auf ver-
schiedene Leistungs- und physiologische Eigenschaften von Muttertier und neugebo-
renen Ferkeln. Die Ergebnisse zeigen, dass es mit Hilfe einer Daidzein-Supple-
mentierung des Futters während der Trächtigkeitsperiode möglich ist, physiologische
Effekte und eine Beeinflussung des Wachstums der Nachkommen zu erzielen.
Summary
Effects of Daidzein supplementation to the diet of pregnant sows on neonatal piglet
growth
The objective of this study was to investigate the effects of a daidzein supplement to
the diet of pregnant sows on litter and piglet performance and various physiological
characteristics. The results suggest that daidzein treatment of sows during late ges-
tation is capable of affecting maternal performance and fetal growth.
Literatur Degen G H, Foth H, Kahl R, Kappus H, Neumann H G, Oesch F, Schulte-Hermann R (1999): Forum
der Deutschen Gesellschaft für Experimentelle und Klinische Toxikologie 24, 30-36 Ren M Q, Kuhn G, Wegner J, Chen J (2001): Isoflavones, substances with multi-biological and clinical
properties. Europ J Nutrit 40 , 135-146 Setchell K D (2000): Absorption and metabolism of soy isoflavones – from food to dietary supplements
and adults to infants. J Nutrit 130, 654
506

507

508

Encapsulation of hydrophilic substances in a polysaccharide gel with embed-ded multiple emulsion
Weiß, J., Muschiolik, G., Scherze, I. Friedrich-Schiller-University of Jena, Institute of Nutrition, Department of Food Tech-nology, Am Steiger 3 (Haus 5), D-07743 Jena
Introduction. The entrapment of water-soluble low molecular weight substances often
is very difficult due to their fast leakage out of various systems, especially using food-
grade ingredients to prepare the capsules (Schrooyen et al. 2001).
In order to take advantage of different encapsulation systems, their combination
offers the possibility to create a new encapsulation system with adjustable release
properties and additional protection of the entrapped substance. Alginate gels serve
as a major entrapment system for cells, enzymes and proteins. Multiple emulsions
represent a very promising possibility for encapsulation of bioactive substances with
beneficial effects.
The aim of this study was to create a new encapsulation system based on a Ca2+-
alginate gel with an embedded multiple emulsion, in which the bioactive substance
(model L-tryptophan) is entrapped within the inner aqueous phase of the w/o/w-
emulsion. The effects of different bulking agents (sucrose, maltodextrin and polydex-
trose) within the alginate network, and the modification of the emulsion lipid phase
(MCT-oil and vegetable fat) on the extent of the release of the encapsulated sub-
stance in pure water, were investigated under different environmental temperatures.
Methods. The preparation of the multiple emulsion followed a two-step procedure.
The primary water-in-oil-emulsions were prepared by dispersing the water phase into
the oil phase containing a lipophilic emulsifier (PGPR), by using an Ultra Turrax®
homogeniser (20,500 rpm). This primary emulsion was continuously dispersed into a
whey protein solution. In order to prepare the premix a blade homogeniser was used
with low shear stress (1500 rpm). The final w/o/w emulsion was obtained by ho-
mogenising the premix by means of a laboratory-scale homogeniser with two orifice
valves (operating pressure 1 MPa).
The yield of multiple emulsions was assessed by measuring the amount of trypto-
phan within the outer w2-phase, which had leaked out of the inner water phase fol-
lowing the second stage of emulsification. The droplet size distribution of the primary
509

(w1-droplets) and the final emulsion (multiple oil globules) was measured by using a
laser diffraction particle sizer (Coulter LS 100) with a "microvolume" cell.
Immediately after its preparation, the multiple emulsion was mixed with an alginate
solution containing one polysaccharide filler (sucrose, maltodextrin or polydextrose).
Finally, the gel matrix included 25 % of multiple oil globules.
The released behaviour pattern of the model substance L-tryptophan out of the
emulsion gel matrices with variable composition was studied in pure water at different
environmental temperatures (7 and 23 °C). The rate of release of the encapsulated
tryptophan was determined by the immersion of small gel samples in pure water
during gentle stirring (150 rpm).
Results and discussion. The particle size distribution of the primary w/o and the
w/o/w emulsions differed depending on the type of the lipid phase used in order to
prepare the multiple emulsions. Mean droplet size of 1.3 µm and 0.78 µm for w/o and
12 µm and 7.2 µm for w/o/w were obtained by using MCT-oil or the vegetable fat,
respectively.
The yield of the multiple emulsions immediately after preparation reached nearly
95 % and was independent of the nature of the oil phase. This high value was the
consequence of the presence of sodium chloride in w1, and thus an initially existing
osmotic pressure gradient between w1 and w2 resulting in a water flux from the outer
site to w1.
Release properties of emulsion gels containing multiple MCT-oil globules
During the first two hours of the release experiment, 51-61 % of the encapsulated
tryptophan diffused from the inner w1-phase of the emulsion gels into the surrounding
water depending on the matrix composition. The use of the three examined carbohy-
drate filler, sucrose, maltodextrin and polydextrose, did not result in significant differ-
ences of the diffusion rate of tryptophan. Maltodextrin within the emulsion gels had a
tendency to lead to a lower release rate compared to gels containing sucrose or
polydextrose. For example, after 24 hours, 85 % of the model substance released the
encapsulation matrix (Figure 1).
It was supposed that the release of tryptophan occurred because of the carrier func-
tion of the lipophilic surfactant, which accelerates the transport of hydrophilic com-
pounds across the thin lipid phase (Jager-Lezer et al. 1997). Furthermore, the large
interfaces of the multiple emulsion favour the exchange of small molecules. (Okochi
& Nakano 2000).
510

0
20
40
60
80
100
Su MD PD Su MD PD
oil free with oil
Rel
ease
[%]
2 h 24 h
Figure 1: Release of tryptophan depending on duration of the immersion, the presence of multiple MCT-oil globules and the nature of the filler (Su: sucrose; MD: maltodextrin; PD: polydextrose)
Release properties of emulsion gels containing multiple fat globules
In order to enhance the barrier-function of the non-polar lipid layer within the alginate
matrix, a vegetable fat was used to prepare the emulsion.
The use of the vegetable fat did not lead to a decrease in the release rate of the
encapsulated tryptophan when sucrose was taken as filler and the system was
examined at room temperature (23 °C). This undiminished release rate probably was
due to the slow rate of crystallization of this fat at room temperature. Therefore, the
emulsion gels were allowed to cool down quickly to 7 °C. In these systems a signifi-
cant decrease in the release rate of tryptophan out of the emulsion gels into the
surrounding water was observed during the first two hours of the study compared to
fat containing systems, which were not immediately cooled down (Figure 2). Malto-
dextrin within fat containing systems caused a significant decrease in release rate
during the first two hours of the release study when compared to the use of sucrose.
In comparison to samples containing sucrose, the release rate of tryptophan in these
systems was slowed down at 23 as well as at 7 °C (Figure 3).
Conclusions. Depending on the matrix composition (lipid phase, carbohydrate filler)
and the temperature, the release rate of hydrophilic low molecular weight substances
can be adjusted to a certain degree (69-89 % within 24 hours). Additional work is
necessary in order to control further leakage e.g. by using other surface active
agents or fillers and altering the fat crystallization.
511

0
20
40
60
80
100
no oil fat no oil fat
23 °C 7 °C
Rel
ease
[%]
2 h 24 h
0
20
40
60
80
100
Su MD Su MD
23 °C 7 °C
Rel
ease
[%]
2 h 24 h
Figure 2: Release of tryptophan de-pending on duration of the immersion, the presence and nature of the lipid phase and the environmental tempera-ture
Figure 3: Release of tryptophan depend-ing on duration of immersion, the envi-ronmental temperature and the type of the filler (Su: sucrose; MD: maltodextrin); fat as lipid phase
Summary. Different types of encapsulation matrices were investigated for their en-trapment efficacy. The hydrophilic low molecular weight substance L-tryptophan was enclosed within a multiple w/o/w-emulsion, which was embedded in a Ca2+-alginate network. The varied factors were as follows: the emulsion lipid phase (MCT-oil or vegetable fat), the carbohydrate filler in the alginate matrix (sucrose, maltodextrin with DE 6.5 or polydextrose) and the environmental temperature (7 or 23 °C). Within 24 hours the release ranged between 69 and 89 %. The lowest release rate was observed if the emulsion was prepared with the fat and the release was investigated at 7 °C compared to 23 °C independent on the type of the filler. Among the fillers maltodextrin showed the best results with regard to encapsulation efficiency. Literature Jager-Lezer N, Terrisse I, Bruneau F, Tokgoz S, Ferreira L, Clauss D, Seiller M,
Grossiord J-L (1997): Influence of lipophilic surfactant on the release kinetics of water-soluble molecules entrapped in a W/O/W multiple emulsion. Journal of Controlled Release, 45, 1-13
Okochi H, Nakano M (2000): Preparation and evaluation of w/o/w type emulsions containing vanomycin. Advanced Drug Delivery Reviews, 45, 5-26
Schrooyen PMM, van der Meer R, De Kruif CG (2001): Microencapsulation: its appli-cation in nutrition. Proceedings of the Nutrition Society, 60, 475-479
512

Danksagung Das Symposium wurde freundlicherweise durch folgende Unternehmen bzw. Einrichtungen gefördert: AhrHoff GmbH Futtergut Landhauser Supplemente Robert-Bosch-Str. 5a 59199 Bönen BASU Mineralfutter GmbH Bergstraße 1 99518 Bad Sulza Frisch Frucht Erfurt GmbH Fichtenweg 34 99198 Erfurt/Kerspleben Herzgut Landmolkerei Schwarza eG Blankenburger Straße 18 07407 Rudolstadt-Schwarza Hoffmann-La Roche AG Human Nutrition Research CH-4070 Basel Schweiz H. Wilhelm Schaumann GmbH & Co.KG An der Mühlenau 4 25421 Pinneberg Lohmann Animal Health GmbH & Co.KG
Abt. Marketing Feed Additives Postfach 446 27454 Cuxhaven MINERALBRUNNEN GMBH Thüringer Waldquell Mineralbrunnen GmbH Kasseler Str. 76 98574 Schmalkalden Rekasan GmbH Straße des Aufbaus 37 07338 Kaulsdorf Verband Deutscher Ölmühlen e.V. Am Weidendamm 1A 10117 Berlin Wörwag, Fritz, Dr. WÖRWAG PHARMA GmbH Calwer Str. 7 71034 Böblingen Dipl.-Ing. agr. Kempf. Ottmar ELANCO Animal Health Abt. der Lilly Deutschland GmbH Teichweg 3 35396 Gießen
Dr. Ranft, Uwe Wolfgang Röthel GmbH Postfach 9 34293 Edermünde Chemische Fabrik Budenheim Herrn Dr. Schnee Rheinstr. 27 55227 Budenheim Amino GmbH An der Zuckerraffinerie 10 38373 Frellstedt Das Symposium wurde gefördert durch die Deutsche Forschungsgemeinschaft

AUTORENVERZEICHNIS Seite Albers, N. 419 Allmann, S. 460 Angelow, L. 326 Anke, M. 174 Apsite, M. 297 Arnhold, W. 202, 415, 427, 437 Arnold, M.M. 388 Aureli, R. 449 Bahelka, I. 384 Baran, M. 371 Bargholz, J. 427 Basova, N. 297 Becker, K. 240, 246 Bergmann, H. 362 Bergmann, K. 174 Berk, A. 210 Bertrandt, J. 105, 168 Berzina, N. 297 Bitsch, I. 148, 154, 460, 464 Bitsch, R. Einleitung, 117, 148, 154, 330, 335, 351, 460, 464 Böhm, V. 70, 330, 335, 351, 358, 460 Boleslawska, I. 339 Broz, J. 222, 228, 441 Brufau, J. 228 Burkhardt, S. 351 Calyniuk, B. 164 Cheng wufeng 334 Christmann, M. 148 Cieslak, A. 252, 264, 477 Coenen, M. 196 Czupryna. A. 112 Debski, B. 105, 189, 355, 400 Dietrich, H. 154 Dimic, E 315, 479, 492 Dimic, V. 315, 479, 492 Ditscheid, B. 100, 362 Doberenz, J. 269 Dornaus, L. 70 Dorrestein, G. 123 Dunkel, S. 173 Eder, K. 173, 234, 240, 246 Eichenberger, B. 293 Ender, K. 384, 504 Engberg, R.M. 392 Flachowsky, G. Eröffnung, 61, 210, 375 Fleckenstein, J. 210, 375 Flick, G. 456 Fökel, C. 362,

Francesch, M. 228 Frank, T. 148 Freitag, M. 183 Fröhlich, K. 330, 335 Fürll, M. 142, 160, 343 Fuhrmann, H. 419 Gebert, S. 293 Geliot, P. 396 Goerres. A. 160 Gralak, M.A. 189 Greiling, A. 70 Großklaus, R. 1 Grote, M. 183 Grygiel, B. 289 Güler, M.S. 69, Gürtler, R. 1 Härtel, A. 258 Halle, I. 375, 453 Hartung, H. 358, 415 He, M.L. 182 Hein, G. 117 Heller, E. 437 Heseker, H 78 Hollmann, J. 351 Hoschek, L. 258 Htoo, J.K. 216 Hu, Z.Y. 375 Hupfeld, C. 123 Ilchev, A. 326 Ilyina, T. 311 Jahreis, G. 70, 100, 258, 269, 362, 405, 409, 472, 483 Jalc, D. 252, 264 Janik, A. 302 Janiszewski, M. 280 Jensen, S.K. 136, 392 John, T. 88 Kamenczak, A. 129 Kamphues, J. 123, 366 Kanitz, E. 504 Kaufmann, K. 335 Keller, S. 100, 269 Kessler, J. 379 Khokhlova, H. 301 Kießling, G. 472 Kilian, T. 112, 289 Kinast, C. 70, 358 Kirchheim, U. 358 Klein, A. 405, 409 Klinger, G. 306 Klos, A. 105, 168 Klünter, A.-M. 449
Kluge, H. 173, 234 Knarreborg, A. 392 Köhler, H. 202, 427 Könitz, R. 148 Körting, R. 240 Kolarszyk, E. 129, 302 Kopanski, Z. 112, 289 Kostogrys, R.B. 383 Kowalczyk, J. 252, 264 Kozlowska-Wojciechowska, M. 280 Kraft, J. 258, 472, 483 Kranl, K. 154, 351, 460 Krejpcio, Z. 400 Krüger, M. 196, 419 Küchenmeister, U. 384 Kuhn, G. 504 Kuhnt, K. 409, 483 Kuncewicz, A. 319, 323 Kuryl, T. 355, 400 Kurze, S. 94 Lahucky, R. 384 Lang, S. 468 Lauridsen, C. 136, 392 Lavoyer, R. 379 Lebzien, P. 61 Lehmann, G. 117 Leiterer, M. 70, 358 Lengwenat, O. 196 Liebert, F. 216, 445 Lindhauer, M.G. 351 Lipko, M. 355, 400 Löhnert, H-J. 423 Lösch. E. 174 Lüdke, H. 202, 423 Mamcarz, A. 280 Maribo, H. 432 Markarewicz-Wujec, M. 280 Mehlich, A. 183 Meier, J. 88, 456 Messikommer, R.E. 388 Meyer, U. 61 Mihailovic, M. 347 Miric, M. 347 Möckel, P. 258, 472 Müller, A. 117 Müller, R. 174 Mukherjee, K.D. 488 Muschiolik, G. 468, 508 Netzel, M. 148, 154, 460, 464 Newman, K.E. 396 Niedworok, E. 164

Niemiec, J. 189 Noack, J. 306 Nürnberg, K. 504 Ochrimenko, W.I. 415, 423 Otto, K. 330 Pallauf, J. 13 Panfil-Kuncewicz, H. 319 Paulicks, B.R. 222, 285, 441 Pecio, A. 383 Perez-Vendrell, A.M. 228 Petrova, I. 326 Philipps, P. 449 Piekoszewski, W. 112, 289 Pisulewski, P.M. 383 Portz, L. 445 Potkanski, A. 252, 264, 477 Przslawski, J. 339 Pugalendi, K.V. 500 Rafalowski, R. 323 Ramakrishna Rao, M. 500 Ramanau, A. 234 Rambeck, W.A. 182 Ramesh, B. 500 Rehfeldt, C. 504 Ren, M.Q. 504 Richter, G. 202, 415, 427, 437 Röhl, C. 343 Romanic, R. 315, 479 Rossberg, A. 154 Roth-Maier, D.A. 26, 222, 285, 441 Sahm, U. 196 Sambandam, G. 500 Sankar, D. 500 Sattler, T. 142 Schenkel, H. 68 Scherze, I. 468, 508 Schlegel-Zawadska, M. 112, 129, 289, 302, 339 Schleser, S. 240 Schmidt, C. 88 Schnug, E. 375 Schöne, F. 70, 358 Scholz, H. 61 Schrödl. W. 196, 419 Schubert, I. 269 Schubert, K. 306 Schulze, D. 456 Schurz, M. 437 Schwarze, D. 183 Schweigert, F.J. 38 Seybold, C. 330 Shen xiuhua 334

Sikora, E. 383 Slomma, N. 246 Sobajic, S. 347 Sonntag, S. 464 Spilke, J. 173, 234 Spring, P. 396, 432 Stabenow, B. 504 Stangassinger, M. 135 Stein, A. 117 Stein, G. 117 Stemme, K. 61 Stenzel, J. 468 Stezycka, E. 168 Stohrer, M. 135 Stoll, P. 379 Straß, G. 148, 154, 460, 464 Sunjianqin Lifeng Malin 334 Susenbeth, A. 275 Szczepanska, E. 164 Szpanowska-Wohn, A. 129 Szumacher-Strabel, M. 252, 264, 477 Tesanovic, D. 315 Thielen, C. 154 Till, U. 269 Tschirner, K. 275 Tsvetkova, V. 495 Tuchscherer, M. 504 Vallentin, G. 419 Varadyova, Z. 371 Vockel, A. 183 Vogelsang, H. 405, 483 Vuksa, V. 492 Walkowiak, J 339 Weber, N. 488 Wehr, U.A. 182, Weiß, J. 508 Weitkamp, P. 488 Wenk, C. 45, 293, 388 Wesemeier, H.-H. 94 Winnefeld, K. 306 Wojciak, R. 400 Wolf, P. 123, 366 Wolffram, S. 275 Xie liangmin 334 Zahn, N. 142 Zalewski, W. 189 Zegarska, Z. 323 Zelenak, I. 252, 264 Zeyner, A. 196, 419 Zimmermann, S. 258 Zuberbuehler, C.A. 388

Anmerkung: Die von den Referenten eingesandten Manuskripte wurden im Wortlaut redaktionell nicht bearbeitet, das Layout der Abbildungen und Tabellen wurde weitgehend unverändert übernommen.
Copyright © 2022 FDOKUMEN