Visualizing Street Orientation and Solar Radiation in Relation to Complex Topography
6
Visualizing Street Orientation and Solar Radiation in Relation to Complex Topography N. Mohajeri 1,* , A. Gudmundsson 2 *, J. H. Kämpf 1 , J.-L. Scartezzini 1 1 Solar Energy and Building Physics Laboratory (LESO-PB), Ecole Polytechnique Fédérale de Lausanne (EPFL), CH-1015 Lausanne, Switzerland. 2 Department of Earth Sciences, University of London Royal Holloway, Egham TW20 0EX, UK. * To whom the correspondence should be addressed. E-mail: [email protected] ____________________________________________________________________________________________________ Abstract Street networks can be visualized in various ways depending on the purpose. Here we introduce (in the present context) a new technique for visualizing the orientation of street networks in relation to complex topography. The technique is tested on the city of Sheffield, England, with a current population of about 555,500 (in 2010) and a total street number of 23,500. Using digital elevation maps and unique historical datasets, we show how the street network of Sheffield has expanded in a complex topographical environment for close to three centuries, that is, since 1736. The results demonstrate how the topography has affected the spatial orientation of the evolving network. We quantify the network geometry through entropy analysis; entropy is a measure of dispersion or spreading. The results show that the orientation entropy of the network has gradually increased with time. In 1736 the network was primarily composed of orthogonal streets, and had comparatively low entropy. As the network expanded the topographical constraints have contributed to the street orientation becoming more uniform on the rose, resulting in increasing entropy. The analysis also shows that the entropy of the central part of the present network is lower than that of the outer and younger parts. The potential solar radiation for Sheffield is also calculated, visualized, and compared with the topography model and the street network density. The results show that the network density (number of streets per unit area) correlates solar radiation; high-density parts of the network tend to coincide with high-intensity solar radiation. ___________________________________________________________________________________________________ 1. Introduction The large-scale morphology of street networks, which is partly determined by geographical constraints (e.g. rivers, mountain ranges, hill slopes, and shorelines) and socio- economic developments, varies significantly within and between cities and has been the subject of much research (e.g. [SCLP06], [JIA07], [CDL11], [SNLP*12], [BBBG13], [MSB13], [GM13]). Visualization of those morphological features has also become increasingly important and is facilitated by the availability of the large amount of network datasets [AOTV13], [BAT92]. In order to understand better the development of network structures, their relations with the environment, as well as extract useful information from large datasets, visualization techniques are essential. The large-scale network datasets and the related visualization techniques offer wide-range possibilities for studies of urban complexity and their dynamics. Such visualization also plays an important role in improving our understanding of complex systems whose geometric patterns can be visualized and analyzed on many spatial and temporal scales. It can be difficult to visualize and represent large- scale datasets of urban systems including street networks in a meaningful way. Effective visualization of street networks very much depends on the representation of networks as primal and dual graphs, the type of network data, how the network parts are defined (street segment, named street, and axial lines), and also on which characteristics of the street network are going to be analyzed. Street networks have many different geometric and topologic characteristics such as density, size, spacing, scaling, clustering, centrality, and connectivity. Among the main textural and structural characteristics of street networks, particularly in relation to their geographical location, are street orientations; their visualization on spatial and temporal scales is a primary focus of this paper. To visualize the spatial orientation of street networks, several cities in the United Kingdom (UK) were chosen so as to cover a wide range in street numbers, city areas, city populations, morphological differences, and geographical locations. For visualizing the street orientation changes in an evolving network, the city of Sheffield in England has been chosen. The current street network data were provided by OS MasterMap Integrated Transport Network (ITN) Layer and the historical maps (GeoTIF format) downloaded from EDINA Digimap website (www.edina.ac.uk). The historical maps for each snapshot (points) in time were digitalized through GIS. All the street network datasets presented in this paper consists of intersections, that is, nodes, and the streets are the links between nodes - a primal representation ([JC04], [MFB 13], [MSCB09], [SCLP06]). The data have been treated as an undirected network representation; that is, each pair of nodes can only be connected by, at most, one link. The geometry of a street network can be presented using either curved (real or physical) links or, alternatively, Euclidean Eurographics Workshop on Urban Data Modelling and Visualisation (2014) V. Tourre and G. Besuievsky (Editors) c The Eurographics Association 2014. DOI: 10.2312/udmv.20141070
-
Upload
royalholloway -
Category
Documents
-
view
1 -
download
0
Transcript of Visualizing Street Orientation and Solar Radiation in Relation to Complex Topography
Visualizing Street Orientation and Solar Radiation in Relation to Complex Topography
N. Mohajeri1,*, A. Gudmundsson2*, J. H. Kämpf1 , J.-L. Scartezzini1
1Solar Energy and Building Physics Laboratory (LESO-PB), Ecole Polytechnique Fédérale de Lausanne (EPFL), CH-1015 Lausanne, Switzerland.
2Department of Earth Sciences, University of London Royal Holloway, Egham TW20 0EX, UK. * To whom the correspondence should be addressed. E-mail: [email protected]
____________________________________________________________________________________________________
Abstract
Street networks can be visualized in various ways depending on the purpose. Here we introduce (in the present context) a new technique for visualizing the orientation of street networks in relation to complex topography. The technique is tested on the city of Sheffield, England, with a current population of about 555,500 (in 2010) and a total street number of 23,500. Using digital elevation maps and unique historical datasets, we show how the street network of Sheffield has expanded in a complex topographical environment for close to three centuries, that is, since 1736. The results demonstrate how the topography has affected the spatial orientation of the evolving network. We quantify the network geometry through entropy analysis; entropy is a measure of dispersion or spreading. The results show that the orientation entropy of the network has gradually increased with time. In 1736 the network was primarily composed of orthogonal streets, and had comparatively low entropy. As the network expanded the topographical constraints have contributed to the street orientation becoming more uniform on the rose, resulting in increasing entropy. The analysis also shows that the entropy of the central part of the present network is lower than that of the outer and younger parts. The potential solar radiation for Sheffield is also calculated, visualized, and compared with the topography model and the street network density. The results show that the network density (number of streets per unit area) correlates solar radiation; high-density parts of the network tend to coincide with high-intensity solar radiation.
___________________________________________________________________________________________________
1. Introduction The large-scale morphology of street networks, which is partly determined by geographical constraints (e.g. rivers, mountain ranges, hill slopes, and shorelines) and socio-economic developments, varies significantly within and between cities and has been the subject of much research (e.g. [SCLP06], [JIA07], [CDL11], [SNLP*12], [BBBG13], [MSB13], [GM13]). Visualization of those morphological features has also become increasingly important and is facilitated by the availability of the large amount of network datasets [AOTV13], [BAT92]. In order to understand better the development of network structures, their relations with the environment, as well as extract useful information from large datasets, visualization techniques are essential. The large-scale network datasets and the related visualization techniques offer wide-range possibilities for studies of urban complexity and their dynamics. Such visualization also plays an important role in improving our understanding of complex systems whose geometric patterns can be visualized and analyzed on many spatial and temporal scales.
It can be difficult to visualize and represent large-scale datasets of urban systems including street networks in a meaningful way. Effective visualization of street networks very much depends on the representation of networks as primal and dual graphs, the type of network data, how the network parts are defined (street segment,
named street, and axial lines), and also on which characteristics of the street network are going to be analyzed. Street networks have many different geometric and topologic characteristics such as density, size, spacing, scaling, clustering, centrality, and connectivity. Among the main textural and structural characteristics of street networks, particularly in relation to their geographical location, are street orientations; their visualization on spatial and temporal scales is a primary focus of this paper.
To visualize the spatial orientation of street networks, several cities in the United Kingdom (UK) were chosen so as to cover a wide range in street numbers, city areas, city populations, morphological differences, and geographical locations. For visualizing the street orientation changes in an evolving network, the city of Sheffield in England has been chosen. The current street network data were provided by OS MasterMap Integrated Transport Network (ITN) Layer and the historical maps (GeoTIF format) downloaded from EDINA Digimap website (www.edina.ac.uk). The historical maps for each snapshot (points) in time were digitalized through GIS. All the street network datasets presented in this paper consists of intersections, that is, nodes, and the streets are the links between nodes - a primal representation ([JC04], [MFB 13], [MSCB09], [SCLP06]). The data have been treated as an undirected network representation; that is, each pair of nodes can only be connected by, at most, one link. The geometry of a street network can be presented using either curved (real or physical) links or, alternatively, Euclidean
Eurographics Workshop on Urban Data Modelling and Visualisation (2014)V. Tourre and G. Besuievsky (Editors)
c© The Eurographics Association 2014.
DOI: 10.2312/udmv.20141070
N. Mohajeri et al. / Visualizing Street Orientation and Solar Radiation in Relation to Complex Topography
(straight-line) distances between the starting and end points of each street. For visualizing the street orientations, all links are assumed straight (the Euclidean distance).
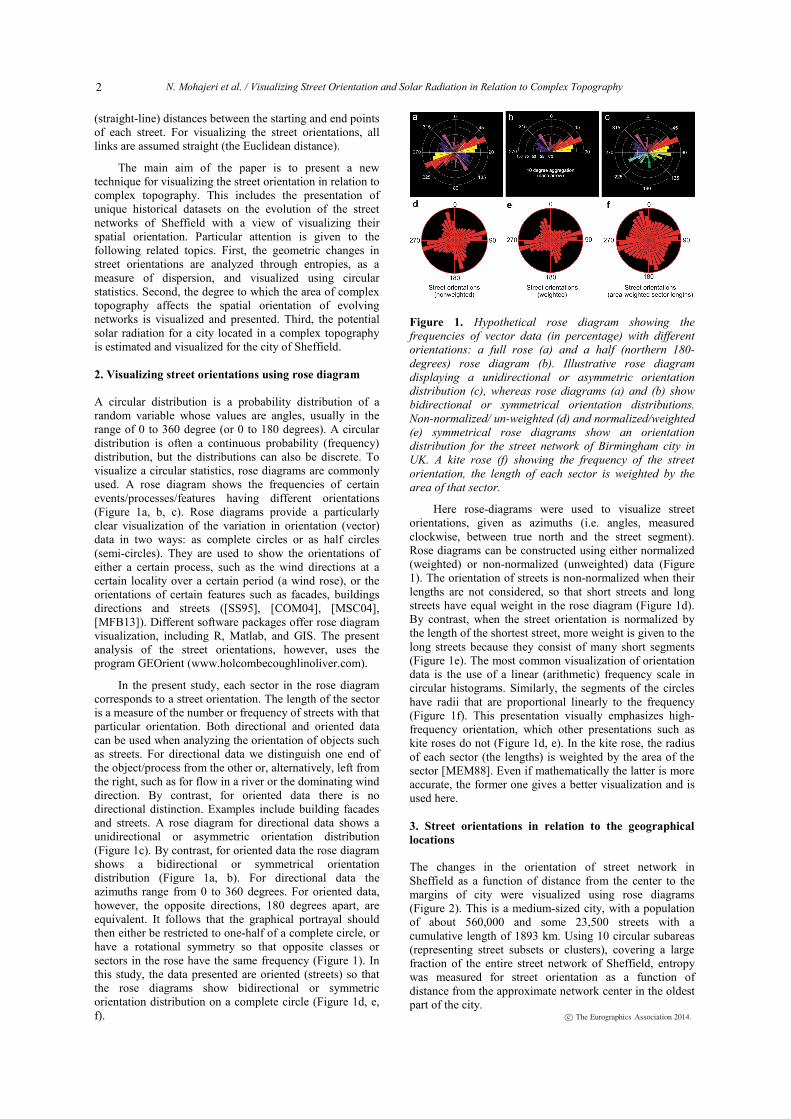
The main aim of the paper is to present a new technique for visualizing the street orientation in relation to complex topography. This includes the presentation of unique historical datasets on the evolution of the street networks of Sheffield with a view of visualizing their spatial orientation. Particular attention is given to the following related topics. First, the geometric changes in street orientations are analyzed through entropies, as a measure of dispersion, and visualized using circular statistics. Second, the degree to which the area of complex topography affects the spatial orientation of evolving networks is visualized and presented. Third, the potential solar radiation for a city located in a complex topography is estimated and visualized for the city of Sheffield. 2. Visualizing street orientations using rose diagram A circular distribution is a probability distribution of a random variable whose values are angles, usually in the range of 0 to 360 degree (or 0 to 180 degrees). A circular distribution is often a continuous probability (frequency) distribution, but the distributions can also be discrete. To visualize a circular statistics, rose diagrams are commonly used. A rose diagram shows the frequencies of certain events/processes/features having different orientations (Figure 1a, b, c). Rose diagrams provide a particularly clear visualization of the variation in orientation (vector) data in two ways: as complete circles or as half circles (semi-circles). They are used to show the orientations of either a certain process, such as the wind directions at a certain locality over a certain period (a wind rose), or the orientations of certain features such as facades, buildings directions and streets ([SS95], [COM04], [MSC04], [MFB13]). Different software packages offer rose diagram visualization, including R, Matlab, and GIS. The present analysis of the street orientations, however, uses the program GEOrient (www.holcombecoughlinoliver.com).
In the present study, each sector in the rose diagram corresponds to a street orientation. The length of the sector is a measure of the number or frequency of streets with that particular orientation. Both directional and oriented data can be used when analyzing the orientation of objects such as streets. For directional data we distinguish one end of the object/process from the other or, alternatively, left from the right, such as for flow in a river or the dominating wind direction. By contrast, for oriented data there is no directional distinction. Examples include building facades and streets. A rose diagram for directional data shows a unidirectional or asymmetric orientation distribution (Figure 1c). By contrast, for oriented data the rose diagram shows a bidirectional or symmetrical orientation distribution (Figure 1a, b). For directional data the azimuths range from 0 to 360 degrees. For oriented data, however, the opposite directions, 180 degrees apart, are equivalent. It follows that the graphical portrayal should then either be restricted to one-half of a complete circle, or have a rotational symmetry so that opposite classes or sectors in the rose have the same frequency (Figure 1). In this study, the data presented are oriented (streets) so that the rose diagrams show bidirectional or symmetric orientation distribution on a complete circle (Figure 1d, e, f).
Figure 1. Hypothetical rose diagram showing the frequencies of vector data (in percentage) with different orientations: a full rose (a) and a half (northern 180-degrees) rose diagram (b). Illustrative rose diagram displaying a unidirectional or asymmetric orientation distribution (c), whereas rose diagrams (a) and (b) show bidirectional or symmetrical orientation distributions. Non-normalized/ un-weighted (d) and normalized/weighted (e) symmetrical rose diagrams show an orientation distribution for the street network of Birmingham city in UK. A kite rose (f) showing the frequency of the street orientation, the length of each sector is weighted by the area of that sector.
Here rose-diagrams were used to visualize street orientations, given as azimuths (i.e. angles, measured clockwise, between true north and the street segment). Rose diagrams can be constructed using either normalized (weighted) or non-normalized (unweighted) data (Figure 1). The orientation of streets is non-normalized when their lengths are not considered, so that short streets and long streets have equal weight in the rose diagram (Figure 1d). By contrast, when the street orientation is normalized by the length of the shortest street, more weight is given to the long streets because they consist of many short segments (Figure 1e). The most common visualization of orientation data is the use of a linear (arithmetic) frequency scale in circular histograms. Similarly, the segments of the circles have radii that are proportional linearly to the frequency (Figure 1f). This presentation visually emphasizes high-frequency orientation, which other presentations such as kite roses do not (Figure 1d, e). In the kite rose, the radius of each sector (the lengths) is weighted by the area of the sector [MEM88]. Even if mathematically the latter is more accurate, the former one gives a better visualization and is used here. 3. Street orientations in relation to the geographical locations The changes in the orientation of street network in Sheffield as a function of distance from the center to the margins of city were visualized using rose diagrams (Figure 2). This is a medium-sized city, with a population of about 560,000 and some 23,500 streets with a cumulative length of 1893 km. Using 10 circular subareas (representing street subsets or clusters), covering a large fraction of the entire street network of Sheffield, entropy was measured for street orientation as a function of distance from the approximate network center in the oldest part of the city. c© The Eurographics Association 2014.
2
N. Mohajeri et al. / Visualizing Street Orientation and Solar Radiation in Relation to Complex Topography
The entropy (S) is a measure of spreading or dispersal. The Gibbs/Shannon entropy (S) for a general probability distribution is given as:
it
i i ppkS ln1
(1)
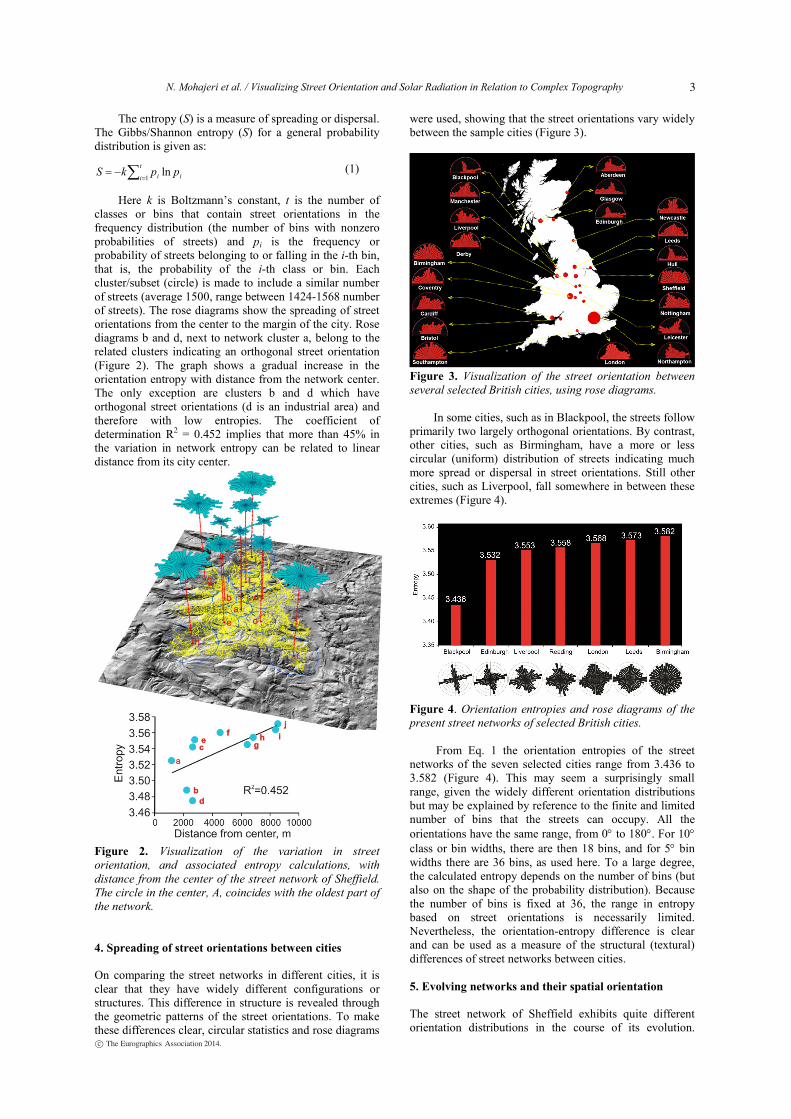
Here k is Boltzmann’s constant, t is the number of classes or bins that contain street orientations in the frequency distribution (the number of bins with nonzero probabilities of streets) and pi is the frequency or probability of streets belonging to or falling in the i-th bin, that is, the probability of the i-th class or bin. Each cluster/subset (circle) is made to include a similar number of streets (average 1500, range between 1424-1568 number of streets). The rose diagrams show the spreading of street orientations from the center to the margin of the city. Rose diagrams b and d, next to network cluster a, belong to the related clusters indicating an orthogonal street orientation (Figure 2). The graph shows a gradual increase in the orientation entropy with distance from the network center. The only exception are clusters b and d which have orthogonal street orientations (d is an industrial area) and therefore with low entropies. The coefficient of determination R2 = 0.452 implies that more than 45% in the variation in network entropy can be related to linear distance from its city center.
Figure 2. Visualization of the variation in street orientation, and associated entropy calculations, with distance from the center of the street network of Sheffield. The circle in the center, A, coincides with the oldest part of the network. 4. Spreading of street orientations between cities On comparing the street networks in different cities, it is clear that they have widely different configurations or structures. This difference in structure is revealed through the geometric patterns of the street orientations. To make these differences clear, circular statistics and rose diagrams
were used, showing that the street orientations vary widely between the sample cities (Figure 3).
Figure 3. Visualization of the street orientation between several selected British cities, using rose diagrams.
In some cities, such as in Blackpool, the streets follow primarily two largely orthogonal orientations. By contrast, other cities, such as Birmingham, have a more or less circular (uniform) distribution of streets indicating much more spread or dispersal in street orientations. Still other cities, such as Liverpool, fall somewhere in between these extremes (Figure 4).
Figure 4. Orientation entropies and rose diagrams of the present street networks of selected British cities.
From Eq. 1 the orientation entropies of the street
networks of the seven selected cities range from 3.436 to 3.582 (Figure 4). This may seem a surprisingly small range, given the widely different orientation distributions but may be explained by reference to the finite and limited number of bins that the streets can occupy. All the orientations have the same range, from 0 to 180. For 10 class or bin widths, there are then 18 bins, and for 5 bin widths there are 36 bins, as used here. To a large degree, the calculated entropy depends on the number of bins (but also on the shape of the probability distribution). Because the number of bins is fixed at 36, the range in entropy based on street orientations is necessarily limited. Nevertheless, the orientation-entropy difference is clear and can be used as a measure of the structural (textural) differences of street networks between cities. 5. Evolving networks and their spatial orientation The street network of Sheffield exhibits quite different orientation distributions in the course of its evolution.
c© The Eurographics Association 2014.
3

N. Mohajeri et al. / Visualizing Street Orientation and Solar Radiation in Relation to Complex Topography
Although the streets initially had clear orthogonal orientations, as the city grew there was an increasing spread in the street orientations, with a maximum at the present time (Figure 5). The gradually increasing spread in street orientations of Sheffield can be partly related to landscape constraints. For Sheffield, the main landscape constraints are the hills and rivers. A Digital Elevation Model (DEM) is used to visualize the complex topography of Sheffield (Figure 5) and Eq. 1 is used to calculate the entropies of the street-orientation distributions of the cities. The results (Figure 5) show that early the entropies were low but as the city grew and expanded the landscape constraints resulted in its street orientations becoming more spread and increasing entropy. The results indicate that as cities with landscape constraints grow, the
constraints tend to increase the variation or spread in street orientation, making the orientation distribution more uniform (Figure 5) and the entropies higher.
The approach to uniformity in bin heights is perhaps better seen in histogram presentations, such as in Figure 5. In Sheffield, the histogram of initial time period show two clear orientation peaks, and very few streets that fall in bins between the main peaks. Figure 5 shows as the cities grow there is a gradual increase in uniformity of orientation distribution, that is, many bins reach similar heights. Thus, a gradual increase in uniformity of orientation distribution from the initial developments of the city to the present time also reflects a gradual increase in the effects of landscape constraints on the street orientations.
Figure 5. Digital Elevation Model (DEM) for the city of Sheffield in England and the street-network evolution from 1736 to 2010 . Rose diagrams and associated histograms are given for each year. Number of streets (N) and orientation entropies (S) are indicated.
The DEMs of Sheffield’s topography overlaid with the street-network evolution maps (Figure 5), show clearly that the geographical locations have strong effects on the city growth. Further entropy analysis suggests that the landscape constraints affect the street orientations as the city grew. More specifically, the orientation entropies are largely controlled by the shape of the landscape features. The orientation entropies show an increase over time (0.171) indicating hills and valleys controls the orientation entropy of Sheffield. 6. Solar radiation model and network density The primary energy source that drives many of the earth’s physical and biological processes is the solar radiation, which is estimated to provide some 99.8% of the energy used for all natural processes [PN08], [HF09]. Modeling the solar radiation is generally very useful for identifying the spatial and temporal heterogeneity of incoming solar energy. The heterogeneity affects many important factors related to natural processes. These include the spatial distribution of the temperature of air and soil as well as the variability of microclimates. Also included are soil
moisture, snow melting patterns, as well as light for photosynthesis. All these factors help us understand better many natural processes and human-related activities. At the landscape scale, topography is the main parameter modifying the distribution of incoming solar radiation (insolation). Changes in elevation, surface orientation and shadow cast by topographic features affect strongly the variation in solar radiation.
For solar-radiation estimates, particularly in areas of complex topography, the use of digital elevation models is very helpful since the models provide high-quality topographic information. Here we use a DEM so as to derive the topographic information and estimate the solar radiation for the city of Sheffield, which is located in a hilly area. A global clear-sky solar radiation map for a whole year, using ArcGIS Spatial Analyst (solar radiation analysis tools), was generated. The solar radiation using ArcGIS can be estimated in two ways: point specific and area based ([FR99], [PN08], [HF09], [CCMI13]). The point-based models estimate the solar radiation for a specific location. They are based on the geometric aspects of the surface orientation (including slope and aspect) and
c© The Eurographics Association 2014.
4
N. Mohajeri et al. / Visualizing Street Orientation and Solar Radiation in Relation to Complex Topography
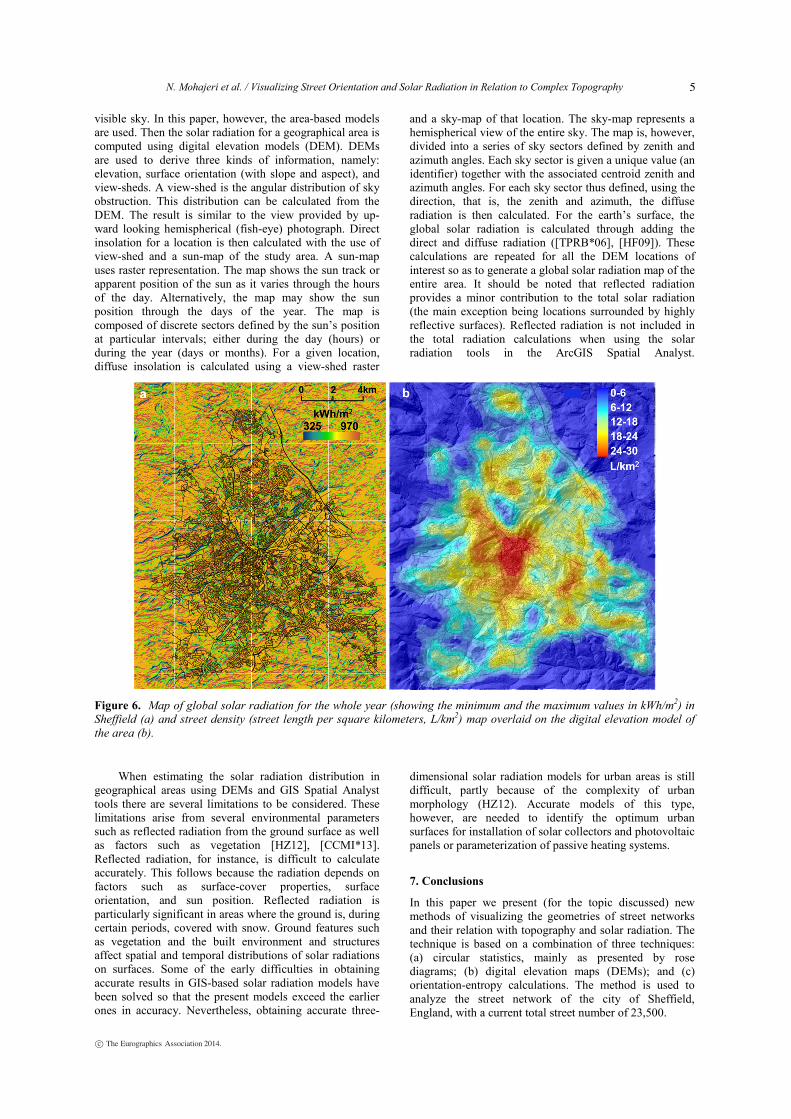
visible sky. In this paper, however, the area-based models are used. Then the solar radiation for a geographical area is computed using digital elevation models (DEM). DEMs are used to derive three kinds of information, namely: elevation, surface orientation (with slope and aspect), and view-sheds. A view-shed is the angular distribution of sky obstruction. This distribution can be calculated from the DEM. The result is similar to the view provided by up-ward looking hemispherical (fish-eye) photograph. Direct insolation for a location is then calculated with the use of view-shed and a sun-map of the study area. A sun-map uses raster representation. The map shows the sun track or apparent position of the sun as it varies through the hours of the day. Alternatively, the map may show the sun position through the days of the year. The map is composed of discrete sectors defined by the sun’s position at particular intervals; either during the day (hours) or during the year (days or months). For a given location, diffuse insolation is calculated using a view-shed raster
and a sky-map of that location. The sky-map represents a hemispherical view of the entire sky. The map is, however, divided into a series of sky sectors defined by zenith and azimuth angles. Each sky sector is given a unique value (an identifier) together with the associated centroid zenith and azimuth angles. For each sky sector thus defined, using the direction, that is, the zenith and azimuth, the diffuse radiation is then calculated. For the earth’s surface, the global solar radiation is calculated through adding the direct and diffuse radiation ([TPRB*06], [HF09]). These calculations are repeated for all the DEM locations of interest so as to generate a global solar radiation map of the entire area. It should be noted that reflected radiation provides a minor contribution to the total solar radiation (the main exception being locations surrounded by highly reflective surfaces). Reflected radiation is not included in the total radiation calculations when using the solar radiation tools in the ArcGIS Spatial Analyst.
Figure 6. Map of global solar radiation for the whole year (showing the minimum and the maximum values in kWh/m2) in Sheffield (a) and street density (street length per square kilometers, L/km2) map overlaid on the digital elevation model of the area (b).
When estimating the solar radiation distribution in geographical areas using DEMs and GIS Spatial Analyst tools there are several limitations to be considered. These limitations arise from several environmental parameters such as reflected radiation from the ground surface as well as factors such as vegetation [HZ12], [CCMI*13]. Reflected radiation, for instance, is difficult to calculate accurately. This follows because the radiation depends on factors such as surface-cover properties, surface orientation, and sun position. Reflected radiation is particularly significant in areas where the ground is, during certain periods, covered with snow. Ground features such as vegetation and the built environment and structures affect spatial and temporal distributions of solar radiations on surfaces. Some of the early difficulties in obtaining accurate results in GIS-based solar radiation models have been solved so that the present models exceed the earlier ones in accuracy. Nevertheless, obtaining accurate three-
dimensional solar radiation models for urban areas is still difficult, partly because of the complexity of urban morphology (HZ12). Accurate models of this type, however, are needed to identify the optimum urban surfaces for installation of solar collectors and photovoltaic panels or parameterization of passive heating systems.
7. Conclusions
In this paper we present (for the topic discussed) new methods of visualizing the geometries of street networks and their relation with topography and solar radiation. The technique is based on a combination of three techniques: (a) circular statistics, mainly as presented by rose diagrams; (b) digital elevation maps (DEMs); and (c) orientation-entropy calculations. The method is used to analyze the street network of the city of Sheffield, England, with a current total street number of 23,500.
c© The Eurographics Association 2014.
5
N. Mohajeri et al. / Visualizing Street Orientation and Solar Radiation in Relation to Complex Topography
Using DEMs and unique historical datasets, we show how the street network of Sheffield has expanded in a complex topographical environment from 1736 (the earliest available street map) to present day (the newest data being from 2010).
The results show that topography has strong effects on the spatial orientation of the evolving network. Quantifying the network geometry through Gibbs/Shannon entropy analysis (entropy is a measure of dispersion or spreading), we show that the orientation entropy of the network has gradually increased with time. In 1736 the network was primarily composed of orthogonal streets, and had comparatively low orientation entropy. As the network expanded the topographical constraints resulted in the street orientation becoming more uniform (more spread) on the rose, resulting in increasing entropy. The analysis also shows that the entropy of the central part of the present network is lower than that of the outer and younger parts.
The potential solar radiation for Sheffield has also been calculated, visualized, and compared with the topography model and the street network density (Figure 6). The results show that the network density (number of streets per unit area) correlates with solar radiation; high-density parts of the network tend to coincide with high-intensity solar radiation. In conclusion, the methods presented here allows for an easy visualization of street networks in relation to the associated topography and, when combined with entropy analysis, a quantitative assessment of complex-network development over time.
References:
[AOTV13] AGRYZKOV, T., OLIVER, J.L., TORTOSA, L., VICENT, J.F. : A Model to visualize information in a complex streets’ network. In: OMATU, S., NEVES, J., SANTANA, J.F.D.P., RODRIGUEZ, J.M.C., GONZALEZ, S.R. (Eds.), Distributed Computing and Artificial Intelligence, Springer, Switzerland, 2013.
[BAT92] BATTY, M.: Urban modeling in computer-graphic and geographic information system environments. Environment and Planning B: Planning and Design 19, (1992), 663-688.
[BBBG13] BARTHELEMY, M., BORDIN, P., BERESTYCKI, H., GRIBAUDI, M:. Self-organization versus top-down planning in the evolution of a city. Scientific Reports 3, 2153 (2013), DOI: 10.1038/srep02153
[CCMI*13] CIOBAN, A., CRIVEANU, H., MATEI, F., POP, I., ROTARU, A.: Aspects of solar radiation analysis using ArcGIS. Bulletin UASVM Horticulture 70, 2 (2013), 437-440.
[CDL11] CHAN, S.H.Y., DONNER, R.V., LAMMER, S.: Urban road networks - spatial networks with universal geometric features? European Physical Journal B 84, (2011), doi:10.1140/epjb/e2011- 10889-3.
[COM04] COMPAGNON, R.: Solar and daylight availability in the urban fabric. Energy and Buildings 36, 4 (2004), 321-328.
[FR99] FU, P., RICH, P. M.: Design and implementation of the Solar Analyst: an ArcView extension for modeling solar radiation at landscape scales. (Proceedings of the Nineteenth Annual ESRI User Conference, 99) http://proceedings.esri.com/library/userconf/proc99/proceed/papers/pap867/p867.htm.
[GM13] GUDMUNDSSON, A., MOHAJERI, N.: Entropy and order in urban street networks. Scientific Reports 3, 3324 (2013), DOI: 10.1038/srep03324.
[HZ12] HOFIERKA, J., ZLOCHA, M:. A new 3-D solar radiation model for 3-D city models. Transactions in GIS 16, (2012), 681–690.
[HF09] HUANG, S., FU, P.: Modeling a small area is a big challenge. (ArcUser Spring 2009) WWW.esri.com.
[JIA07] JIANG, B.: Topological pattern of urban street networks: universality and peculiarity. Physica A: Statistical Mechanics and its Applications 384, (2007), 647 – 655.
[JC04] JIANG, B., CLARAMUNT, C.: A structural approach to the model generalization of an urban street network. GeoInformatica 8, (2004), 157-171.
[MSB13] MASUCCI, A.P., STANILOV, K., BATTY, M.: Limited urban growth: London's street network dynamics since the 18th century. PLOS ONE 8, e69469 (2013). doi:10.1371/journal.pone.0069469.
[MSCB09] MASUCCI, A.P., SMITH, D., CROOKS, A., BATTY, M.: Random planar graphs and the London street network, European Physical Journal B 71, (2009), 259.
[MFB13] MOHAJERI, N., FRENCH, J.R., BATTY, M.: Evolution and entropy in the organization of urban street patterns. Annals of GIS 19, (2013), 1-16.
[MSC04] MONTAVON, M., SCARTEZZINI, J-L., COMPAGNON, R.: Comparison of the solar energy utilisation potential of different urban environments. Plea2004: The 21th Conference on Passive and Low Energy Architecture. (September 2004), pp. 1-6.
[NEM88] NEMEC, W. : The shape of the rose. Geology 59, (1988), 149–152.
[PN08] PONS, X., NINYEROLA, M.: Mapping a topographic global solar radiation model implemented in a GIS and refined with ground data. International Journal of Climatology 28, (2008), 1821–1834.
[SCLP06] SCELLATO, S., CARDILLO, A., LATORA, V., PORTA, S.: The backbone of a city. European Physics Journal B 50, (2006), 221–225.
[SNLP*12] STRANO, E., NICOSIA, V., LATORA, V., PORTA, S., BARTHELEMY, M.: 2012. Elementary processes governing the evolution of road networks. Scientific Reports 2, 296 (2912). DOI: 10.1038/srep00296.
[SS95] SWAN, A.R.H., SANDILANDS, M.: Introduction to Geological Data Analysis. Blackwell, Oxford, 1995.
[TPRB*06] TOVAR-PESCADOR, J., POZO-VAZQUEZ, D., RUIZ-ARIAS, J.A., BATLLES, J., LOPEZ, G., BOSCH, J.L. On the use of the digital elevation model to estimate the solar radiation in areas of complex topography. Meteorological Applications 13 (2006), pp. 279–287.
c© The Eurographics Association 2014.
6