VISN 19 Salt Lake City Market Data Discovery & Findings
245
VISN 19 Salt Lake City Market Data Discovery & Findings Submission to VISN Leadership October 4, 2019
-
Upload
khangminh22 -
Category
Documents
-
view
0 -
download
0
Transcript of VISN 19 Salt Lake City Market Data Discovery & Findings

VISN 19 Salt Lake City Market DataDiscovery & FindingsSubmission to VISN LeadershipOctober 4, 2019

Sec�on Slide Numbers Order
OverviewMarket Geography and DemographicsEs�mated Current and Historic Market Demand – Outpa�entEs�mated Future Market Demand – Outpa�entEs�mated Current and Historic Market Demand – Inpa�entEs�mated Future Market Demand – Inpa�entEs�mated Current Total VA Market SupplyEs�mated Current Total Community Market SupplyCurrent AccessQuality & Sa�sfac�onFacili�esMissionCost
37276884113119133142159176188196
123456789
10111213
VA Market Area Health Systems Op�miza�on
VISN 19: Salt Lake City Market
Table of Contents
2

Overview
3

The Data Discovery & Findings (DD&F) deck is a standardized collec�on of data that will be used across market assessments to understand important aspects of each market. It is similar to the deck that was presented during previous VHA Office of Policy and Planning (OPP) market assessment trainings and will be used to develop key findings and inform the development of opportuni�es to create high-performing networks of care.
Data is pulled from a wide range of VA and commercial sources, and each slide cites the relevant data source.
The DD&F is one piece of the overall market assessment process. The assessments will also be informed by review of local data and site visits to ensure that both qualita�ve and quan�ta�ve data are considered. No single data point will be used as the deciding factor in determining opportuni�es for the market.
VA Market Area Health Systems Op�miza�on
VISN 19: Salt Lake City Market
Overview Document Purpose
4

VA Market Area Health Systems Op�miza�on
VISN 19: Salt Lake City MarketOverview Assump�ons• VA Data & AnalysisüAll VA data was extracted and provided by VA for use in the DD&F.
üWhen there were discrepancies between data obtained from local sources and data obtained from na�onal sources, na�onal sources were used.
üIn various places throughout the deck, there are mappings to translate data between different data types (e.g., HSPC, bed sec�ons, stop codes, specialty, services lines, CPTs, DRGs, etc.). These mappings were provided by the Office of Policy & Planning (OPP) and implemented to aggregate or categorize data for display in the slides. It also allows for a be�er programma�c view of care.
üTrea�ng facili�es that have a parent in a different market are displayed in both the trea�ng facility market and the parent market.
üEnrollee Health Care Projec�on Model (EHCPM) cita�ons include a combina�on of market-based and facility-based projec�ons. These two projec�on model views are different, and the numbers are not intended to match.
üEHCPM data for the year 2017 is pulled from the “Actuals” databases instead of the projected year 2017.
üThe facili�es contained within the DD&F are based on the Facility Hierarchy file provided by OPP. Any data for facili�es not in this file are not included in the DD&F. Addi�onally, the facility market, county, parent, and name are found within this file.
üThe market hierarchy geography used to create the DD&F is from the BY17 EHCPM. All VISN/Market/County mappings are based off of this geography.
üNumeric values of data throughout the DD&F are rounded.
üOffice of Community Care data was obtained using the Program Integrity Tool. This data may have anomalies, gaps, and missing values due to various methods of processing Choice data within the last several years. Any iden�fied gaps were addressed with reasonable logic wherever possible; however, errors may remain.
üFor maps, any site of care deac�vated in VAST a�er July 18, 2019 will not be reflected.
üFor workload trending purposes, slides may contain facili�es that are deac�vated, if they had workload in FY16, FY17 or FY18.
üPlanned sites of care are not included on maps unless specifically requested and jus�fied.
5

VA Market Area Health Systems Op�miza�on
VISN 19: Salt Lake City Market
• Commercial Market Data & AnalysisüThe commercial market capacity assessment considers only reported physical capacity and does not incorporate: 1) ability to staff pa�ent care services or accept VA pa�ents; 2) length of �me to change facili�es to accommodate Veteran demand; and 3) any nego�a�ons for specific rates for care provided in the community.
üPediatric healthcare was not considered.
üIBM Market Expert FTE es�mated demand is based on a median provider produc�vity level by service line.
üThe 10 year commercial workload es�mates are based on the 10 year IBM/Watson Health Market Expert projec�ons straight-lined through 2028.
üCommunity hospitals within a 60 minute drive �me of the VAMC’s zip code were the primary focus for assessment and used as a comparison to each VAMC.
üDue to differences in hospitals’ cost repor�ng periods, FY18 CMS Cost Report data was used when available and FY17 CMS Cost Report data was used when FY18 data was not available.
• QualityüDifferences in quality metrics between VA and widely accepted commercial benchmarks introduce significant subjec�vity.
• Cost Analysis and Recommenda�onsüThis is a high-level cost analysis. It compares three data points: internal VA cost to provide care to Veterans, poten�al cost to acquire the same care in the market at Medicare rates, and exis�ng experience with purchase of Non-VA care as applicable.
üAdjusted total cost by DRG as well as non-VA purchased care paid by DRG was provided by VA.
Assump�ons, cont.Overview
6

Demographics Market Geography and Demographics
7

Exis�ng VA Market and Facility HierarchyDemographics
Note: Mobile sites are not listedSource: 1. BY17 EHCPM 2. FY18Q4 VAST 1.1.V19.SaltLakeCity
VA Market Area Health Systems Op�miza�on
VISN 19: Salt Lake City Market
8

Key Market Sta�s�cs
*Core uniques excludes uniques who have only used telephone triage, pharmacy,
and lab.
Total 2017 Enrollee Popula�on: 67,400
Market OverviewDemographics
Source: 1. BY17 EHCPM 2. VSSC Unique Pa�ents Cube 1.2.V19.SaltLakeCity
VA Market Area Health Systems Op�miza�on
VISN 19: Salt Lake City Market
• Top Coun�es by Enrollee Popula�on: Id
◦ Salt Lake, UT: 20,618◦ Davis, UT: 7,758◦ Weber, UT: 6,654
184185186
• Total Enrollees: 56th of 96 markets
• Es�mated 10-Year Enrollee Change: 4.6%◦ 30th of 96 markets
Total 2017 Eligible Veteran Popula�on: 111,239• -8.5% es�mated 10-Year Eligible Veteran Popula�on Change
Id
◦ (V19) (660) Salt Lake City 1
2018 Core Uniques:* 43,321
VAMC:
Exis�ng VHA System
9

Market Enrollee Demographics
County Sector FY17 FY27 10 Yr. Change FY37 20 Yr. Change DO
Salt Lake, UTSector SubtotalUtah, UTWashington, UTTooele, UTCache, UTElko, NVIron, UTBox Elder, UTSanpete, UTUintah, UTSummit, UTCarbon, UTSevier, UTDuchesne, UTWhite Pine, NVWasatch, UTMorgan, UTKane, UTMillard, UT
19-f-9-A19-f-9-A19-f-9-B19-f-9-B19-f-9-B19-f-9-B19-f-9-B19-f-9-B19-f-9-B19-f-9-B19-f-9-B19-f-9-B19-f-9-B19-f-9-B19-f-9-B19-f-9-B19-f-9-B19-f-9-B19-f-9-B19-f-9-B
20,61820,618
6,4104,3501,7781,4931,4071,2861,035
634685566552532484419356231251248
19,32719,327
6,9874,9072,0371,6981,4261,3441,152
667667619576555487419359298252242
-6.26%-6.26%9.00%
12.82%14.53%13.77%
1.40%4.54%
11.29%5.28%
-2.63%9.43%4.31%4.28%0.72%
-0.11%0.79%
29.10%0.42%
-2.54%
17,64917,649
6,7554,8882,0931,6421,3801,3091,115
628640625565519432393347331254234
-14.40%-14.40%
5.38%12.39%17.68%10.01%-1.89%1.80%7.75%
-0.82%-6.52%10.37%
2.34%-2.45%
-10.78%-6.31%-2.46%43.18%
0.91%-5.64%
123456789
1011121314151617181920
Demographics
Source: BY17 EHCPM VetPop & Enrollment 1.3.V19.SaltLakeCity
Note: Market totals do not exactly match following slides due to rounding by county within EHCPM.
VA Market Area Health Systems Op�miza�on
VISN 19: Salt Lake City Market
County-Based Enrollee Projec�ons
10

Market Enrollee Demographics, cont.
County Sector FY17 FY27 10 Yr. Change FY37 20 Yr. Change DO
Juab, UTEmery, UTGarfield, UTBeaver, UTWayne, UTDagge�, UTPiute, UTRich, UTSector SubtotalDavis, UTWeber, UTSector SubtotalBannock, IDBonneville, IDBingham, IDJefferson, IDMadison, IDFremont, IDFranklin, IDCaribou, ID
19-f-9-B19-f-9-B19-f-9-B19-f-9-B19-f-9-B19-f-9-B19-f-9-B19-f-9-B19-f-9-B19-f-9-D19-f-9-D19-f-9-D19-f-9-E19-f-9-E19-f-9-E19-f-9-E19-f-9-E19-f-9-E19-f-9-E19-f-9-E
221206160145
56534837
23,6427,7586,654
14,4122,7152,5901,101
587352348242185
234198174147
61484634
25,6368,7337,315
16,0492,9612,8761,209
626390364263182
6.07%-3.98%8.91%1.87%8.90%
-9.76%-3.81%-7.29%8.44%
12.57%9.94%
11.36%9.06%
11.04%9.82%6.73%
10.67%4.80%8.59%
-1.90%
225183161143
62524339
25,0588,8987,423
16,3222,8922,7791,162
620363352263173
1.92%-11.40%
0.45%-0.97%9.17%
-2.26%-8.62%6.38%5.99%
14.70%11.57%13.25%
6.53%7.32%5.57%5.71%3.10%1.38%8.78%
-6.67%
2122232425262728293031323334353637383940
Demographics
Source: BY17 EHCPM VetPop & Enrollment 1.3.V19.SaltLakeCity#2
Note: Market totals do not exactly match following slides due to rounding by county within EHCPM.
VA Market Area Health Systems Op�miza�on
VISN 19: Salt Lake City Market
County-Based Enrollee Projec�ons
11

Market Enrollee Demographics, cont.
County Sector FY17 FY27 10 Yr. Change FY37 20 Yr. Change DO
Oneida, IDBear Lake, IDPower, IDTeton, IDClark, IDSector SubtotalMarket Total
19-f-9-E19-f-9-E19-f-9-E19-f-9-E19-f-9-E19-f-9-E19-f
156164138134
168,728
67,400
175170156130
199,520
70,532
12.05%3.71%
13.14%-3.41%16.45%
9.08%4.65%
160157151123
159,212
68,241
2.02%-4.26%9.85%
-8.11%-6.24%5.55%1.25%
41424344454647
Demographics
Source: BY17 EHCPM VetPop & Enrollment 1.3.V19.SaltLakeCity#3
Note: Market totals do not exactly match following slides due to rounding by county within EHCPM.
VA Market Area Health Systems Op�miza�on
VISN 19: Salt Lake City Market
County-Based Enrollee Projec�ons
12
Sectors Counties
Market Projected Enrollee 10-Year Change (FY17-27)Demographics
Source: BY17 EHCPM VetPop & Enrollment 1.5.V19.SaltLakeCity
VA Market Area Health Systems Op�miza�on
VISN 19: Salt Lake City Market
13

Market Enrollee and Eligible Demographics
Geography Measure FY17 FY27 10 Yr. Change FY37 20 Yr. Change DisplayO…
VISNMarketNa�onalVISNMarketNa�onal
EOY EnrolleesEOY EnrolleesEOY Enrollees
Eligible VeteransEligible VeteransEligible Veterans
436,75567,400
8,753,704716,549111,239
14,271,277
469,75170,532
8,896,391675,216101,792
12,265,488
7.6%4.6%1.6%
-5.8%-8.5%
-14.1%
459,59268,241
8,262,997611,823
93,10110,448,365
5.2%1.2%
-5.6%-14.6%-16.3%-26.8%
123456
Market-Based Enrollee and Eligible Projec�ons
Demographics
Source: BY17 EHCPM VetPop & Enrollment 1.6.V19.SaltLakeCity
VA Market Area Health Systems Op�miza�on
VISN 19: Salt Lake City Market
Es�mated Eligible Veterans by Year
0
100,000
FY 2017 FY 2022 FY 2027
111,239 106,312 101,792
FY 2017 FY 2022 FY 2027
-4.4%5 Year Chg in Eligibles
-8.5%10 Year Chg in Eligibles
Es�mated Eligible Veterans by Year
14

Market Enrollee and Eligible Demographics, cont.Demographics
Source: BY17 EHCPM VetPop & Enrollment 1.19.V19.SaltLakeCity
VA Market Area Health Systems Op�miza�on
VISN 19: Salt Lake City Market
Sector Measure FY17 FY27 10 Yr. Change FY37 20 Yr. Change Id
19-f-9-A19-f-9-B19-f-9-D19-f-9-E19-f-9-A19-f-9-B19-f-9-D19-f-9-E
EOY EnrolleesEOY EnrolleesEOY EnrolleesEOY EnrolleesEOY EligiblesEOY EligiblesEOY EligiblesEOY Eligibles
20,61823,64214,412
8,72831,87940,42424,74214,194
19,32725,63616,049
9,52025,15139,32224,37312,945
-6.3%8.4%
11.4%9.1%
-21.1%-2.7%-1.5%-8.8%
17,64925,05816,322
9,21220,57537,44123,47611,610
-14.4%6.0%
13.3%5.5%
-35.5%-7.4%-5.1%
-18.2%
831832833834861862863864
Sector-Based Enrollee and Eligible Projec�ons
15

Demographics
Source: BY17 EHCPM VetPop & Enrollment 1.8.V19.SaltLakeCity
VA Market Area Health Systems Op�miza�on
VISN 19: Salt Lake City Market
2017-2027 Market Enrollee Breakdown by PriorityPriority Enrollees 2017 % Enrollees 2017 Enrollees 2027 % Enrollees 2027 10 Year % Change
12345678
Grand Total
17,0795,7559,2731,686
11,3105,0243,164
14,10967,400
25.3%8.5%
13.8%2.5%
16.8%7.5%4.7%
20.9%100.0%
27,8866,0829,1901,2679,8043,9382,4089,957
70,532
39.5%8.6%
13.0%1.8%
13.9%5.6%3.4%
14.1%100.0%
63.3%5.7%
-0.9%-24.8%-13.3%-21.6%-23.9%-29.4%
4.6%
Market Enrollee Priority Groups
27%
8%
14%2%
20%
6%
4%
19%1
2
3
4
5
6
7
8
31%
10%
16%2%
17%
6%
4%
16%1
2
3
4
5
6
7
8
VISN 19Na�onal
16
2017
26.4%
26.7%
39.0%
7.9%<45
45-64
65-84
85+
24.8%
30.5%
38.9%
<45
45-64
65-84
85+
2017 2027 10 Year % Change
4,453 6,706 50.6%
0
10,000
20,000
30,000
MAL
E
<45 45-64 65-84 85+
-8.1% -13.3%16.3% 0.6%
Female Enrollee Popula�on
2017 Salt Lake City Market Age Breakdown
Market Enrollees and Growth Rates by Age Group
Source: BY17 EHCPM VetPop & Enrollment 1.10.V19.SaltLakeCity
VA Market Area Health Systems Op�miza�on
VISN 19: Salt Lake City Market
Market Enrollee Popula�on — Age and Gender
2017 VISN 19 Age Breakdown
• • 2027
0
1,000
2,000
3,000
FEM
ALE
<45 45-64 65-84 85+
14.5% 9.5%147.9%64.0%
Demographics
17

Category VA FacilityCare
Na�onal VAFacility Care
VA FacilityVariance fromNa�onal
CommunityCare
Na�onalCommunityCare
CommunityCare Variancefrom Na�onal
TotalReliance
Na�onal TotalReliance
Total RelianceVariance fromNa�onal
DO
OP MED
PATHOLOGY
DIALYSIS
OP SURG
AUDIOLOGY
IP MED
IP SURG
IP MH
OP MH
PROSTHETICS
TOTAL
29.6%
50.2%
13.8%
26.1%
58.0%
24.8%
21.1%
31.5%
85.4%
51.8%
29.1%
27.5%
46.3%
7.4%
23.3%
56.7%
18.5%
13.6%
42.7%
81.1%
47.6%
25.1%
2.1%
3.9%
6.4%
2.8%
1.3%
6.3%
7.5%
-11.2%
4.2%
4.3%
3.9%
7.2%
3.5%
36.2%
5.4%
7.9%
7.0%
8.1%
29.8%
4.7%
0.0%
8.3%
6.1%
2.6%
33.4%
5.1%
2.8%
5.5%
7.8%
9.5%
3.0%
0.0%
6.7%
1.0%
0.9%
2.9%
0.2%
5.1%
1.6%
0.3%
20.2%
1.7%
0.0%
1.6%
36.8%
53.7%
50.1%
31.5%
65.9%
31.8%
29.2%
61.2%
90.1%
51.8%
37.4%
33.7%
48.9%
40.8%
28.4%
59.5%
24.0%
21.4%
52.2%
84.2%
47.6%
31.8%
3.1%
4.8%
9.3%
3.0%
6.4%
7.8%
7.8%
9.0%
5.9%
4.3%
5.5%
1
2
3
4
5
6
7
8
9
10
11Projec�ons from the VA Enrollee Health Care Projec�on Model (EHCPM) account for new enrollment based on demographic changes
• Projec�ons therefore account for a different pool of enrollees in the future as the enrollment popula�on changes• Some Veterans who are currently ineligible and unenrolled may become enrollees in the future
Poten�al use of health care in VA is projected for those Veterans who are assumed to be eligible and enrolled at a given point• The EHCPM projects u�liza�on of health care services rather than projec�ng pa�ent/user counts
○ Some pa�ents may use few services and some pa�ents may use many, so projec�ng by u�liza�on of health services providesa be�er picture of the amount of health care VA will need to provide
• Modeled projec�ons accounts for the amount of care enrollees are expected to receive through VA rather than from their othersources of health care
Source: E&F C22-7217ACBY17 2017 Reliance by Service Category 20181025 1.12.V19.SaltLakeCity
VA Market Area Health Systems Op�miza�on
VISN 19: Salt Lake City Market
Market RelianceDemographics
18

Market Current Enrollment Rurality – FY18Demographics
Source: Geocoded Enrollee File FY18Q4 1.14.V19.SaltLakeCity#IMG
* Includes Rural and Highly Rural Loca�ons
VA Market Area Health Systems Op�miza�on
VISN 19: Salt Lake City Market
FY18 Rurality by County
19

County Urban Enrollees Rural Enrollees* % Rural Total Enrollees R
Bannock, ID
Bear Lake, ID
Beaver, UT
Bingham, ID
Bonneville, ID
Box Elder, UT
Cache, UT
Carbon, UT
Caribou, ID
Clark, ID
Dagge�, UT
Davis, UT
Duchesne, UT
Elko, NV
Emery, UT
Franklin, ID
Fremont, ID
Garfield, UT
Iron, UT
Jefferson, ID
2,313
0
0
5
2,466
606
1,377
0
0
0
0
8,048
0
0
0
0
0
0
0
1
376
188
140
1,082
194
457
149
556
146
14
47
0
409
1,432
198
226
331
155
1,307
554
14.0%
100.0%
100.0%
99.5%
7.3%
43.0%
9.8%
100.0%
100.0%
100.0%
100.0%
0.0%
100.0%
100.0%
100.0%
100.0%
100.0%
100.0%
100.0%
99.8%
2,689
188
140
1,087
2,660
1,063
1,526
556
146
14
47
8,048
409
1,432
198
226
331
155
1,307
555
1
2
3
4
5
6
7
8
9
10
11
12
13
14
15
16
17
18
19
20
Market Current Enrollment Rurality — FY18, cont.County
Source: Geocoded Enrollee File FY18Q4 1.13.V19.SaltLakeCity
* Includes Rural and Highly Rural Loca�ons.
VA Market Area Health Systems Op�miza�on
VISN 19: Salt Lake City Market
DemographicsUrban Enrollees Rural Enrollees* % Rural Total Enrollees
20

County Urban Enrollees Rural Enrollees* % Rural Total Enrollees R
Juab, UT
Kane, UT
Madison, ID
Millard, UT
Morgan, UT
Oneida, ID
Piute, UT
Power, ID
Rich, UT
Salt Lake, UT
Sanpete, UT
Sevier, UT
Summit, UT
Teton, ID
Tooele, UT
Uintah, UT
Utah, UT
Wasatch, UT
Washington, UT
Wayne, UT
0
0
0
0
0
0
0
0
0
20,261
0
0
0
0
0
0
6,093
0
3,393
0
222
241
385
236
228
150
50
162
40
9
618
519
535
140
1,830
750
391
434
1,015
55
100.0%
100.0%
100.0%
100.0%
100.0%
100.0%
100.0%
100.0%
100.0%
0.0%
100.0%
100.0%
100.0%
100.0%
100.0%
100.0%
6.0%
100.0%
23.0%
100.0%
222
241
385
236
228
150
50
162
40
20,270
618
519
535
140
1,830
750
6,484
434
4,408
55
21
22
23
24
25
26
27
28
29
30
31
32
33
34
35
36
37
38
39
40
Market Current Enrollment Rurality — FY18, cont.County
Source: Geocoded Enrollee File FY18Q4 1.13.V19.SaltLakeCity#2
* Includes Rural and Highly Rural Loca�ons.
VA Market Area Health Systems Op�miza�on
VISN 19: Salt Lake City Market
DemographicsUrban Enrollees Rural Enrollees* % Rural Total Enrollees
21

County Urban Enrollees Rural Enrollees* % Rural Total Enrollees R
Weber, UT
White Pine, NV
Total
6,335
0
50,898
213
386
16,570
3.3%
100.0%
24.6%
6,548
386
67,468
41
42
43
Market Current Enrollment Rurality — FY18, cont.County
Source: Geocoded Enrollee File FY18Q4 1.13.V19.SaltLakeCity#3
* Includes Rural and Highly Rural Loca�ons.
VA Market Area Health Systems Op�miza�on
VISN 19: Salt Lake City Market
DemographicsUrban Enrollees Rural Enrollees* % Rural Total Enrollees
22

Market RuralityDemographics
Source: 1. Geocoded Enrollee File FY18Q4 2. HRSA Data Warehouse 1.15.V19.SaltLakeCity
VA Market Area Health Systems Op�miza�on
VISN 19: Salt Lake City Market
FQHCs Within Rural Counties (>50% Demographics)
23

Parent Facility Trea�ng Facility Number Trea�ng Facility Name Ini�a�ve Title Approved Funding
(V19) (660) Salt Lake City(V19) (660) Salt Lake City
660660
(V19) (660) Salt Lake City(V19) (660) Salt Lake City
Telemental Health HubTransi�ons Nurse Program
$3,420,615$161,463
Rank: 13 out of 117 Parent Facili�es (ranked by total $ funding)
$0
$2,000,000
$4,000,000
$3,582,078
$1,479,993
Facility Na�onal Average
Medical Center % Na�onal 2019 Total Funding Id
Salt Lake CityNa�onal
2.07%100.00%
$3,582,078$173,159,235
203204
Demographics
Source: VHA Office of Rural Health 1.16.V19.SaltLakeCity.660
Note: The FY19 Funded Project List includes the top ten projects by approved funding.
VA Market Area Health Systems Op�miza�on
VISN 19: Salt Lake City Market — Salt Lake City
Office of Rural Health FY19 Funded Project List
Office of Rural Health Project Funding Alloca�on
FY19 Office of Rural Health Funded Project Alloca�on vs. Average Na�onal Alloca�on*
*111 Parent Facili�es received ORH Funding Alloca�on for FY19
24

* Popula�on projec�ons available through 2023; straight line growth rates applied through 2028.
25%
5%
11%
14%
24%
10%
11%
0-14
15-17
18-24
25-34
33-54
55-64
65+
Label 2018 2028* % Change Dis…
Popula�onMaleFemale
3,539,4821,779,2991,760,183
4,014,4342,013,5392,000,895
13.4%13.2%13.7%
123
Demographic Summary – Salt Lake City
Demographics
Source: IBM Market Expert 1.17.V19.SaltLakeCity
VA Market Area Health Systems Op�miza�on
VISN 19: Salt Lake City Market
Overall Market Popula�on (Veterans and Non-Veterans) — Salt Lake City Market
Popula�on Distribu�on by Age Group
78%
14%
1% 3%White Non-Hispanic
Hispanic
Black Non-Hispanic
Asian & Pacific Is. Non-Hispanic
All Others
8%7%
21%
19%15%
30%<$15K
$15-25K
$25-50K
$50-75K
$75-100K
Over $100K
Popula�on Distribu�on by Race/Ethnicity
Households by Income Group
25

Overall Parent Facility Area Popula�on (Veterans and Non-Veterans) —
* Popula�on projec�ons available through 2023; straight line growth rates applied through 2028. Popula�on based on area
within 60 minute drive from applicable VAMC/HCC.
25%
5%
11%
15%
25%
9%10%
0-14
15-17
18-24
25-34
35-54
55-64
65+
Label 2018 2028* % Change Di…
Popula�onFemaleMale
2,441,6161,214,6301,226,986
2,793,1181,392,4221,400,696
14.4%14.6%14.2%
123
Demographic Summary – Salt Lake City Area
Demographics
Source: IBM Market Expert 1.18.V19.SaltLakeCity.660
VA Market Area Health Systems Op�miza�on
VISN 19: Salt Lake City Market — Salt Lake City
Popula�on Distribu�on by Age Group
76%
15%
1% 3%White Non-Hispanic
Hispanic
Black Non-Hispanic
Asian & Pacific Is. Non-Hispanic
All Others
7%6%
19%
19%15%
33%
<$15K
$15-25K
$25-50K
$50-75K
$75-100K
Over $100K
Popula�on Distribu�on by Race/Ethnicity
Households by Income Group
Salt Lake City Area
Validation of the data for this slide is not required 26

Demand Es�mated Current and Historic Market Demand — Outpa�ent
27

Facility FY13 FY14 FY15 FY16 FY17 FY18 6 Year Change
(V19) (660) Salt Lake City(V19) (660BU) Salt Lake City Domiciliary(V19) (660GA) Pocatello(V19) (660GB) Ogden(V19) (660GC) Ely-Nevada(V19) (660GD) Roosevelt(V19) (660GE) Orem(V19) (660GG) St. George(V19) (660GJ) Western Salt Lake(V19) (660GK) Elko(V19) (660QA) Idaho Falls(V19) (660QB) Price
46,032102
5,0965,099
250765
3,2162,9947,678
584N/AN/A
49,019140
5,1745,189
244741
3,0933,0287,028
614N/AN/A
49,818277
5,4175,583
240755
3,5553,5006,388
618N/AN/A
50,379132
5,6655,886
229714
3,5783,8365,828
605N/AN/A
56,825139
5,6625,706
173739
3,4524,0156,526
579548202
58,557127
5,3825,699
N/A739
3,1573,8846,161
6391,314
407
27.2%24.5%
5.6%11.8%
-100.0%-3.4%-1.8%29.7%
-19.8%9.4%N/AN/A
*Core uniques excludes uniques who have only used telephone triage, pharmacy, and lab.
Demand
Source: VSSC Uniques Cube 2.13.V19.SaltLakeCity
VA Market Area Health Systems Op�miza�on
VISN 19: Salt Lake City Market
Core Uniques Trends by FacilityCore Uniques*
28

Outpa�ent Encounters FY15-18
Facility FY15 FY16 FY17 FY18 FY15 FY16 FY17 FY18 FY15 FY16 FY17 FY18
(V19) (660) Salt Lake City(V19) (660GA) Pocatello(V19) (660GB) Ogden(V19) (660GC) Ely-Nevada(V19) (660GD) Roosevelt(V19) (660GE) Orem(V19) (660GG) St. George(V19) (660GJ) Western Salt Lake(V19) (660GK) Elko(V19) (660QA) Idaho Falls(V19) (660QB) Price(V19) (660) Salt Lake City Total(V19) Salt Lake City Total
58,5144,4055,423
N/A221
2,8911,0272,114
155N/AN/A
74,75074,750
62,7984,5155,160
N/A195
3,5271,2191,895
184N/AN/A
79,49379,493
63,5974,1144,842
N/A227
3,8501,4271,541
1246972
79,86379,863
77,9363,0844,030
N/A293
3,2661,6781,377
177386252
92,47992,479
32,5219,434
10,1091,1802,0585,2296,794
11,2411,516
N/AN/A
80,08280,082
30,90110,353
9,8641,0991,6195,3346,339
11,8731,208
N/AN/A
78,59078,590
32,42910,822
8,688521
1,2914,8526,118
12,546979430138
78,81478,814
39,3219,5459,604
N/A1,3974,0935,891
11,703855
2,005774
85,18885,188
160,182529778N/A
56334
2,5311,250
195N/AN/A
165,855165,855
156,830641
1,143N/A
46854
3,4421,742
166N/AN/A
164,864164,864
156,904631986N/A121
1,3103,7713,092
1316138
167,045167,045
160,1012,210
704N/A103
1,2394,5512,739
129267156
172,199172,199
Mental Health
Demand
Source: VSSC Outpa�ent Encounters Cube 2.20.V19.SaltLakeCity
VA Market Area Health Systems Op�miza�on
VISN 19: Salt Lake City Market
Primary Care Specialty CareFacility
29

Primary Care Encounters – FY15-18Demand
Source: 1. VSSC Encounters Cube 2. Geocoded Enrollee File FY18Q4 2.1.V19.SaltLakeCity#IMG
VA Market Area Health Systems Op�miza�on
VISN 19: Salt Lake City Market
FY15-18 PC Average Encounters by County
30

County FY15-18 AvgEncounters
FY18 Encounters Most Commonly Used Facility % ofEncounters
Bannock,IDBear Lake,IDBeaver,UTBingham,IDBonneville,IDBox Elder,UTCache,UTCarbon,UTCaribou,IDClark,IDDagge�,UTDavis,UTDuchesne,UTElko,NVEmery,UTFranklin,IDFremont,IDGarfield,UTIron,UTJefferson,ID
4,340180
931,4673,0041,0991,124
909235
2084
7,193904
1,996302251379144
1,071701
4,778185
851,5153,3401,1771,242
982232
2181
8,038837
1,838317282407131
1,029773
(660GA) Pocatello(660GA) Pocatello(660GG) St. George(660GA) Pocatello(660GA) Pocatello(660GB) Ogden(660GB) Ogden(660QB) Price(660GA) Pocatello(660QA) Idaho Falls(666GF) Rock Springs(660) Salt Lake City(660GD) Roosevelt(660GK) Elko(660QB) Price(660GA) Pocatello(660GA) Pocatello(660GG) St. George(660GG) St. George(660GA) Pocatello
94.2%69.7%38.8%85.0%46.7%60.0%50.6%59.0%83.6%61.9%49.4%55.8%78.1%43.0%52.1%58.5%45.7%61.1%64.6%51.5%
County
Demand
Source: 1. VSSC Encounters Cube 2. Geocoded Enrollee File FY18Q4 2.1.V19.SaltLakeCity
Note: Yellow cells indicate coun�es going out of Market/VISN for the majority of encounters.
VA Market Area Health Systems Op�miza�on
VISN 19: Salt Lake City Market
Primary Care Encounters – FY15-18, cont.FY18
EncountersFY15-18 Avg Encounters
Most Commonly Used Facility % of Encounters
31

County FY15-18 AvgEncounters
FY18 Encounters Most Commonly Used Facility % ofEncounters
Juab,UTKane,UTMadison,IDMillard,UTMorgan,UTOneida,IDPiute,UTPower,IDRich,UTSalt Lake,UTSanpete,UTSevier,UTSummit,UTTeton,IDTooele,UTUintah,UTUtah,UTWasatch,UTWashington,UTWayne,UT
240298341209209189
39193
4329,239
541407635
982,264
9215,602
3855,391
47
232271384187232197
48194
3931,679
577416688
912,440
8476,085
4385,541
46
(660GE) Orem(660GG) St. George(660GA) Pocatello(660GE) Orem(660GB) Ogden(660GA) Pocatello(660GG) St. George(660GA) Pocatello(660GB) Ogden(660) Salt Lake City(660) Salt Lake City(660) Salt Lake City(660) Salt Lake City(660GA) Pocatello(660) Salt Lake City(660GD) Roosevelt(660GE) Orem(660) Salt Lake City(660GG) St. George(660) Salt Lake City
62.1%51.3%50.3%40.6%59.9%64.0%50.0%94.8%41.0%71.6%43.8%51.9%84.3%50.5%52.3%81.1%51.2%74.2%76.3%32.6%
County
Demand
Source: 1. VSSC Encounters Cube 2. Geocoded Enrollee File FY18Q4 2.1.V19.SaltLakeCity#2
Note: Yellow cells indicate coun�es going out of Market/VISN for the majority of encounters.
VA Market Area Health Systems Op�miza�on
VISN 19: Salt Lake City Market
Primary Care Encounters – FY15-18, cont.FY18
EncountersFY15-18 Avg Encounters
Most Commonly Used Facility % of Encounters
32

County FY15-18 AvgEncounters
FY18 Encounters Most Commonly Used Facility % ofEncounters
Weber,UTWhite Pine,NVTotal
6,870831
80,488
7,416207
85,545
(660GB) Ogden(660) Salt Lake City
67.4%45.9%
County
Demand
Source: 1. VSSC Encounters Cube 2. Geocoded Enrollee File FY18Q4 2.1.V19.SaltLakeCity#3
Note: Yellow cells indicate coun�es going out of Market/VISN for the majority of encounters.
VA Market Area Health Systems Op�miza�on
VISN 19: Salt Lake City Market
Primary Care Encounters – FY15-18, cont.FY18
EncountersFY15-18 Avg Encounters
Most Commonly Used Facility % of Encounters
33

Primary Care Drive Times for FY18 EnrolleesDemand
Source: Geocoded Enrollee File FY18Q4 2.3.V19.SaltLakeCity
VA Market Area Health Systems Op�miza�on
VISN 19: Salt Lake City Market
34

Demand
Source: VSSC Encounters Cube – Public Grouping (Primary Care) 2.4.V19.SaltLakeCity.660
Note: Data limited to workload from pa�ents origina�ng from within the coun�es of Phase Two VISNs in the Market Assessments. * Includes top 3 stop codes, where applicable (some sites reported less than 3).
VA Market Area Health Systems Op�miza�on
VISN 19: Salt Lake City Market — Salt Lake City
Facility Stop Code FY15 FY16 FY17 FY18 4 Yr. Ch FY15 FY16 FY17 FY18 4 Yr. Ch FY15 FY16 FY17 FY18 4 Yr. Ch
(V19) (660) Salt Lake City
(V19) (660) Salt Lake City
(V19) (660) Salt Lake City
(V19) (660GA) Pocatello
(V19) (660GA) Pocatello
(V19) (660GB) Ogden
(V19) (660GB) Ogden
(323) PRIMARYCARE/MEDICINE
(322) ComprehensiveWomen's Primary CareClinic
(350) GeriPACT
(323) PRIMARYCARE/MEDICINE
(322) ComprehensiveWomen's Primary CareClinic
(323) PRIMARYCARE/MEDICINE
(322) ComprehensiveWomen's Primary CareClinic
29,245
2,998
278
9,411
23
9,974
135
26,632
3,449
820
10,266
87
9,715
149
28,494
3,115
820
10,703
119
8,535
153
34,820
3,457
1,044
9,259
286
9,340
264
19.1%
15.3%
275.5%
-1.6%
1143.5%
-6.4%
95.6%
13,389
1,106
225
5,046
23
5,011
119
11,931
1,244
409
5,311
78
5,116
133
11,981
1,204
386
5,267
107
4,713
140
13,241
1,336
484
4,597
229
4,729
223
-1.1%
20.8%
115.1%
-8.9%
895.7%
-5.6%
87.4%
32,321
2,816
491
9,626
29
11,824
261
28,719
3,551
1,493
10,702
127
11,240
308
32,834
4,920
1,505
11,028
207
9,774
265
36,793
5,626
1,780
9,976
441
9,998
456
13.8%
99.8%
262.8%
3.6%
1404.1%
-15.4%
74.9%
CPT Work RVUUnique Pa�entsEncounters
Top Primary Care Stop Code* Trends FY15-FY18 — Salt Lake City
35
Demand
Source: VSSC Encounters Cube – Public Grouping (Primary Care) 2.4.V19.SaltLakeCity.660#2
Note: Data limited to workload from pa�ents origina�ng from within the coun�es of Phase Two VISNs in the Market Assessments. * Includes top 3 stop codes, where applicable (some sites reported less than 3).
VA Market Area Health Systems Op�miza�on
VISN 19: Salt Lake City Market — Salt Lake City
Facility Stop Code FY15 FY16 FY17 FY18 4 Yr. Ch FY15 FY16 FY17 FY18 4 Yr. Ch FY15 FY16 FY17 FY18 4 Yr. Ch
(V19) (660GC) Ely-Nevada
(V19) (660GD) Roosevelt
(V19) (660GE) Orem
(V19) (660GE) Orem
(V19) (660GG) St. George
(V19) (660GG) St. George
(V19) (660GJ) Western SaltLake
(323) PRIMARYCARE/MEDICINE
(323) PRIMARYCARE/MEDICINE
(323) PRIMARYCARE/MEDICINE
(322) ComprehensiveWomen's Primary CareClinic
(323) PRIMARYCARE/MEDICINE
(322) ComprehensiveWomen's Primary CareClinic
(323) PRIMARYCARE/MEDICINE
1,180
2,058
5,193
36
6,717
77
11,145
1,099
1,619
5,148
186
6,246
93
11,812
521
1,291
4,688
164
6,028
90
12,470
N/A
1,397
3,878
215
5,793
98
11,648
-100.0%
-32.1%
-25.3%
497.2%
-13.8%
27.3%
4.5%
240
730
3,111
34
3,048
71
5,678
229
683
2,929
158
3,099
85
5,192
173
694
2,775
128
3,062
85
5,674
N/A
680
2,336
167
2,674
84
5,348
-100.0%
-6.8%
-24.9%
391.2%
-12.3%
18.3%
-5.8%
1,175
2,618
5,620
39
7,092
155
13,475
1,120
2,512
5,180
113
6,913
191
12,817
558
2,179
5,377
160
7,448
193
14,505
N/A
2,214
5,085
239
5,593
184
13,004
-100.0%
-15.5%
-9.5%
507.0%
-21.1%
18.8%
-3.5%
CPT Work RVUUnique Pa�entsEncounters
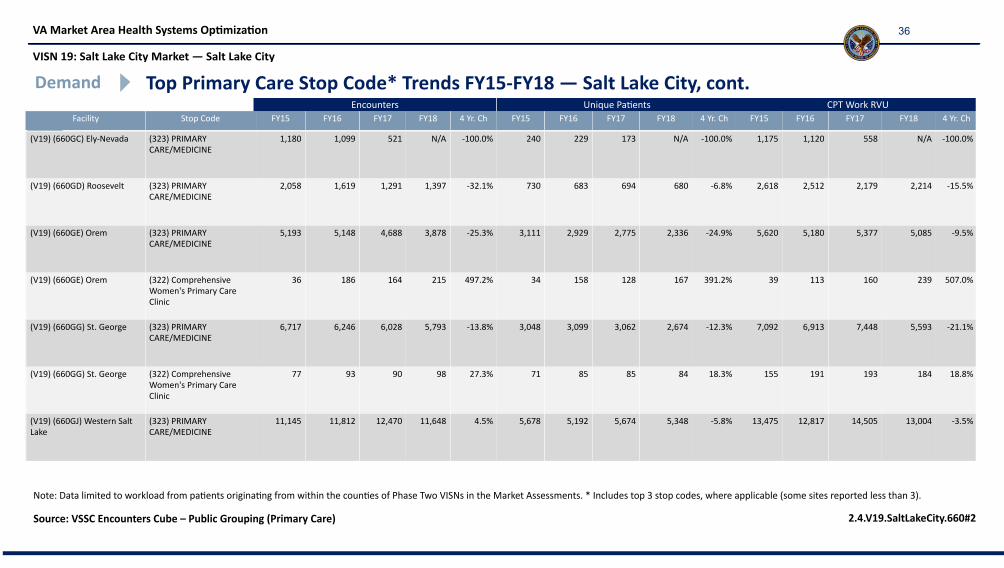
Top Primary Care Stop Code* Trends FY15-FY18 — Salt Lake City, cont.
36

Demand
Source: VSSC Encounters Cube – Public Grouping (Primary Care) 2.4.V19.SaltLakeCity.660#3
Note: Data limited to workload from pa�ents origina�ng from within the coun�es of Phase Two VISNs in the Market Assessments. * Includes top 3 stop codes, where applicable (some sites reported less than 3).
VA Market Area Health Systems Op�miza�on
VISN 19: Salt Lake City Market — Salt Lake City
Facility Stop Code FY15 FY16 FY17 FY18 4 Yr. Ch FY15 FY16 FY17 FY18 4 Yr. Ch FY15 FY16 FY17 FY18 4 Yr. Ch
(V19) (660GJ) Western SaltLake
(V19) (660GK) Elko
(V19) (660QA) Idaho Falls
(V19) (660QB) Price
(322) ComprehensiveWomen's Primary CareClinic
(323) PRIMARYCARE/MEDICINE
(323) PRIMARYCARE/MEDICINE
(323) PRIMARYCARE/MEDICINE
96
1,516
N/A
N/A
61
1,208
N/A
N/A
76
979
430
138
55
855
2,005
774
-42.7%
-43.6%
77
537
N/A
N/A
56
506
N/A
N/A
68
514
353
114
49
533
1,020
369
-36.4%
-0.7%
136
770
N/A
N/A
93
523
N/A
N/A
128
580
337
89
93
525
1,353
452
-31.7%
-31.7%
CPT Work RVUUnique Pa�entsEncounters
Top Primary Care Stop Code* Trends FY15-FY18 — Salt Lake City, cont.
37

Home-Based Primary CareDemand
Source: VSSC Encounters Cube 2.14.V19.SaltLakeCity#IMG
VA Market Area Health Systems Op�miza�on
VISN 19: Salt Lake City Market
FY18 HBPC Encounters by County
38

2_14 Selected Facility FY15 FY16 FY17 FY18 AVGer FY15 FY16 FY17 FY18 AVG
(660) Salt Lake City 290 182 168 167 201 2,665 2,947 3,963 4,024 3,399
FY15-18 HBPC Uniques & Encounter Distribu�on
Demand
Source: VSSC Encounters Cube 2.14.V19.SaltLakeCity
VA Market Area Health Systems Op�miza�on
Home-Based Primary Care, cont.
Facility UniquesFY15 FY16 FY17 FY18 AVG FY15 FY16 FY17 FY18 AVG
Encounters
VISN 19: Salt Lake City Market
39

Demand
Source: VSSC Encounters Cube 2.36.V19.SaltLakeCity
VA Market Area Health Systems Op�miza�on
VISN 19: Salt Lake City Market
Home-Based Primary Care by Provider TypeFY18 HBPC Encounters by Provider Type
Provider Type MD RN SW MH RD Other I
EncountersPercentage
48412.0%
1,58639.4%
46011.4%
3288.2%
2736.8%
89322.2%
11
40

Mental Health Encounters – FY15-18Demand
Source: 1. VSSC Encounters Cube 2. Geocoded Enrollee File FY18Q4 2.5.V19.SaltLakeCity#IMG
VA Market Area Health Systems Op�miza�on
VISN 19: Salt Lake City Market
FY15-18 Average Mental Health Encounters by County
41

Mental Health Encounters — FY15-18, cont.Demand
Source: 1. VSSC Encounters Cube 2. Geocoded Enrollee File FY18Q4 2.5.V19.SaltLakeCity
VA Market Area Health Systems Op�miza�on
VISN 19: Salt Lake City Market
County FY15-18 Avg Encounters FY18 Encounters Most Commonly Used Facility % of Encounters
Bannock,ID
Bear Lake,ID
Bingham,ID
Bonneville,ID
Caribou,ID
Clark,ID
Franklin,ID
Fremont,ID
Jefferson,ID
Madison,ID
Oneida,ID
Power,ID
Teton,ID
Elko,NV
White Pine,NV
Beaver,UT
Box Elder,UT
Cache,UT
2,926
70
856
1,801
172
3
67
159
312
148
75
179
54
946
85
34
826
943
2,725
53
595
1,813
113
73
142
273
116
84
85
39
1,031
93
33
892
837
(V19) (660GA) Pocatello
(V19) (660) Salt Lake City
(V19) (660GA) Pocatello
(V19) (660) Salt Lake City
(V19) (660GA) Pocatello
(V19) (436) Fort Harrison
(V19) (660) Salt Lake City
(V19) (660) Salt Lake City
(V19) (660GA) Pocatello
(V19) (660) Salt Lake City
(V19) (660GA) Pocatello
(V19) (660GA) Pocatello
(V17) (549BY) Fort Worth
(V19) (660) Salt Lake City
(V21) (593) Las Vegas-Nevada
(V19) (660) Salt Lake City
(V19) (660) Salt Lake City
(V19) (660) Salt Lake City
58.6%
35.8%
74.5%
48.6%
90.3%
50.7%
45.8%
40.7%
32.8%
56.0%
81.2%
74.4%
73.3%
38.7%
30.3%
69.4%
54.6%
42

Mental Health Encounters — FY15-18, cont.Demand
Source: 1. VSSC Encounters Cube 2. Geocoded Enrollee File FY18Q4 2.5.V19.SaltLakeCity#2
VA Market Area Health Systems Op�miza�on
VISN 19: Salt Lake City Market
County FY15-18 Avg Encounters FY18 Encounters Most Commonly Used Facility % of Encounters
Carbon,UT
Dagge�,UT
Davis,UT
Duchesne,UT
Emery,UT
Garfield,UT
Iron,UT
Juab,UT
Kane,UT
Millard,UT
Morgan,UT
Piute,UT
Rich,UT
Salt Lake,UT
Sanpete,UT
Sevier,UT
Summit,UT
Tooele,UT
830
25
8,132
488
171
28
872
318
179
156
154
23
10
37,470
447
248
432
2,733
772
11
8,455
588
133
31
923
140
206
127
218
9
39,454
571
289
594
3,068
(V19) (660) Salt Lake City
(V19) (660) Salt Lake City
(V19) (660) Salt Lake City
(V19) (660) Salt Lake City
(V19) (660) Salt Lake City
(V21) (593) Las Vegas-Nevada
(V19) (660) Salt Lake City
(V19) (660GE) Orem
(V19) (660) Salt Lake City
(V19) (660) Salt Lake City
(V19) (660) Salt Lake City
(V19) (660) Salt Lake City
(V19) (660GB) Ogden
(V19) (660) Salt Lake City
(V19) (660) Salt Lake City
(V19) (660) Salt Lake City
(V19) (660) Salt Lake City
(V19) (660) Salt Lake City
69.6%
63.6%
75.2%
47.6%
48.9%
41.9%
23.8%
67.1%
72.3%
74.0%
39.9%
33.3%
91.2%
57.4%
77.9%
93.4%
89.5%
43

Mental Health Encounters — FY15-18, cont.Demand
Source: 1. VSSC Encounters Cube 2. Geocoded Enrollee File FY18Q4 2.5.V19.SaltLakeCity#3
VA Market Area Health Systems Op�miza�on
VISN 19: Salt Lake City Market
County FY15-18 Avg Encounters FY18 Encounters Most Commonly Used Facility % of Encounters
Uintah,UT
Utah,UT
Wasatch,UT
Washington,UT
Wayne,UT
Weber,UT
Total
408
6,343
289
2,382
11
7,179
78,980
570
6,340
297
2,488
18
7,531
81,830
(V19) (660) Salt Lake City
(V19) (660) Salt Lake City
(V19) (660) Salt Lake City
(V19) (660GG) St. George
(V08) (573GF) Tallahassee
(V19) (660) Salt Lake City
43.2%
52.0%
78.1%
49.3%
38.9%
65.8%
44

Top Mental Health Stop Code* Trends FY15-FY18 — Salt Lake CityDemand
Source: VSSC Encounters Cube – Public Grouping (Mental Health) 2.7.V19.SaltLakeCity.660
Note: Data limited to workload from pa�ents origina�ng from within the coun�es of Phase Two VISNs in the Market Assessments *Includes top 3 stop codes, where applicable (some sites reported less than 3)
VA Market Area Health Systems Op�miza�on
VISN 19: Salt Lake City Market — Salt Lake City
Facility Stop Code FY15 FY16 FY17 FY18 4 Yr Ch. FY15 FY16 FY17 FY18 4 Yr. Ch. FY15 FY16 FY17 FY18 4 Yr. Ch. .
(V19) (660) Salt Lake City
(V19) (660) Salt Lake City
(V19) (660) Salt Lake City
(V19) (660GA) Pocatello
(V19) (660GA) Pocatello
(V19) (660GA) Pocatello
(V19) (660GB) Ogden
(V19) (660GB) Ogden
(V19) (660GB) Ogden
(V19) (660GD) Roosevelt
(V19) (660GD) Roosevelt
(V19) (660GD) Roosevelt
(V19) (660GE) Orem
(V19) (660GE) Orem
(V19) (660GE) Orem
(V19) (660GG) St. George
(V19) (660GG) St. George
(V19) (660GG) St. George
(V19) (660GJ) Western Salt Lake
(V19) (660GJ) Western Salt Lake
(502) MH CLINIC IND
(560) SUB USE DISORDER GROUP
(513) SUB USE DISORDER INDIV
(502) MH CLINIC IND
(562) PTSD-INDIV
(550) MH CLINIC GROUP
(502) MH CLINIC IND
(562) PTSD-INDIV
(534) MH INTGRTD CARE IND
(502) MH CLINIC IND
(562) PTSD-INDIV
(540) PCT-PTSD IND
(502) MH CLINIC IND
(562) PTSD-INDIV
(534) MH INTGRTD CARE IND
(502) MH CLINIC IND
(562) PTSD-INDIV
(534) MH INTGRTD CARE IND
(534) MH INTGRTD CARE IND
(502) MH CLINIC IND
28,776
3,736
4,487
3,412
N/A
333
4,597
N/A
N/A
162
N/A
59
1,910
N/A
N/A
886
N/A
6
2,025
89
32,123
6,566
5,839
3,561
309
272
4,242
457
1
166
10
19
2,711
313
N/A
1,068
75
N/A
1,895
N/A
33,796
5,725
6,166
3,219
584
240
3,984
801
1
192
35
N/A
3,014
637
N/A
1,267
160
N/A
1,541
N/A
45,120
9,067
6,716
2,223
393
252
3,243
517
216
243
50
N/A
2,422
665
118
1,491
131
54
1,377
N/A
56.8%
142.7%
49.7%
-34.8%
0.0%
-24.3%
-29.5%
0.0%
0.0%
50.0%
0.0%
-100.0%
26.8%
0.0%
0.0%
68.3%
0.0%
800.0%
-32.0%
-100.0%
5,563
365
802
906
N/A
36
1,331
N/A
N/A
73
N/A
11
659
N/A
N/A
258
N/A
3
632
37
6,252
411
838
939
79
42
1,313
143
1
58
6
4
662
84
N/A
290
33
N/A
578
N/A
7,073
430
830
920
147
34
1,295
168
1
61
9
N/A
694
99
N/A
353
48
N/A
504
N/A
9,606
473
824
772
134
35
1,109
138
184
72
9
N/A
653
167
58
381
29
33
441
N/A
72.7%
29.6%
2.7%
-14.8%
0.0%
-2.8%
-16.7%
0.0%
0.0%
-1.4%
0.0%
-100.0%
-0.9%
0.0%
0.0%
47.7%
0.0%
1000.0%
-30.2%
-100.0%
62,145
2,213
9,125
6,662
N/A
193
8,719
N/A
N/A
15
N/A
10
3,743
N/A
N/A
1,717
N/A
2
3,626
209
72,334
6,911
12,630
6,848
700
171
8,991
1,281
1
15
0
0
6,627
722
N/A
2,695
181
N/A
3,436
N/A
80,193
8,074
13,915
6,851
1,441
143
9,186
2,200
2
22
6
N/A
6,987
1,875
N/A
3,008
399
N/A
3,820
N/A
115,031
13,784
15,400
5,298
1,061
89
7,142
1,432
511
12
0
N/A
6,068
2,092
323
3,145
289
50
3,483
N/A
85.1%
523.0%
68.8%
-20.5%
0.0%
-53.9%
-18.1%
0.0%
0.0%
-20.9%
0.0%
-99.8%
62.1%
0.0%
0.0%
83.2%
0.0%
2851.8%
-3.9%
-100.0%
660-1
660-2
660-3
660GA-1
660GA-2
660GA-3
660GB-1
660GB-2
660GB-3
660GD-1
660GD-2
660GD-3
660GE-1
660GE-2
660GE-3
660GG-1
660GG-2
660GG-3
660GJ-1
660GJ-2
Encounters Unique Pa�ents CPT Work RVU
45

Top Mental Health Stop Code* Trends FY15-FY18 — Salt Lake City, cont.Demand
Source: VSSC Encounters Cube – Public Grouping (Mental Health) 2.7.V19.SaltLakeCity.660#2
Note: Data limited to workload from pa�ents origina�ng from within the coun�es of Phase Two VISNs in the Market Assessments *Includes top 3 stop codes, where applicable (some sites reported less than 3)
VA Market Area Health Systems Op�miza�on
VISN 19: Salt Lake City Market — Salt Lake City
Facility Stop Code FY15 FY16 FY17 FY18 4 Yr Ch. FY15 FY16 FY17 FY18 4 Yr. Ch. FY15 FY16 FY17 FY18 4 Yr. Ch. .
(V19) (660GK) Elko
(V19) (660GK) Elko
(V19) (660GK) Elko
(V19) (660QA) Idaho Falls
(V19) (660QA) Idaho Falls
(V19) (660QA) Idaho Falls
(V19) (660QB) Price
(V19) (660QB) Price
(502) MH CLINIC IND
(562) PTSD-INDIV
(540) PCT-PTSD IND
(502) MH CLINIC IND
(562) PTSD-INDIV
(534) MH INTGRTD CARE IND
(502) MH CLINIC IND
(562) PTSD-INDIV
106
N/A
49
N/A
N/A
N/A
N/A
N/A
126
30
28
N/A
N/A
N/A
N/A
N/A
70
54
N/A
57
10
2
45
27
131
46
N/A
340
38
8
183
69
23.6%
0.0%
-100.0%
0.0%
0.0%
0.0%
0.0%
0.0%
34
N/A
14
N/A
N/A
N/A
N/A
N/A
53
7
8
N/A
N/A
N/A
N/A
N/A
40
11
N/A
46
6
1
27
7
60
18
N/A
154
17
4
51
12
76.5%
0.0%
-100.0%
0.0%
0.0%
0.0%
0.0%
0.0%
2
N/A
0
N/A
N/A
N/A
N/A
N/A
4
0
0
N/A
N/A
N/A
N/A
N/A
3
3
N/A
24
8
4
3
0
12
0
N/A
256
99
16
18
7
732.0%
0.0%
0.0%
0.0%
0.0%
0.0%
0.0%
0.0%
660GK-1
660GK-2
660GK-3
660QA-1
660QA-2
660QA-3
660QB-1
660QB-2
Encounters Unique Pa�ents CPT Work RVU
46

Specialty Encounters – FY15-18Demand
Source: 1. VSSC Encounters Cube 2. Geocoded Enrollee File FY18Q4 2.8.V19.SaltLakeCity#IMG
VA Market Area Health Systems Op�miza�on
VISN 19: Salt Lake City Market
FY15-18 Average Specialty Encounters by County
47

Specialty Encounters — FY15-18, cont.Demand
Source: 1. VSSC Encounters Cube 2. Geocoded Enrollee File FY18Q4 2.8.V19.SaltLakeCity
VA Market Area Health Systems Op�miza�on
VISN 19: Salt Lake City Market
County FY15-18 Avg Encounters FY18 Encounters Most Commonly Used Facility % of Encounters Id
Sanpete,UT
Sevier,UT
Summit,UT
Tooele,UT
Uintah,UT
Utah,UT
Wasatch,UT
Washington,UT
Wayne,UT
Weber,UT
Bannock,ID
Bear Lake,ID
Bingham,ID
Bonneville,ID
Caribou,ID
Clark,ID
Franklin,ID
Fremont,ID
1,380
937
1,481
5,005
1,134
13,335
919
6,645
109
14,828
3,618
187
1,368
2,818
255
12
342
452
1,420
979
1,537
5,350
1,140
14,174
871
8,062
109
15,282
4,310
231
1,423
2,928
263
15
373
422
(V19) (660) Salt Lake City
(V19) (660) Salt Lake City
(V19) (660) Salt Lake City
(V19) (660) Salt Lake City
(V19) (660) Salt Lake City
(V19) (660) Salt Lake City
(V19) (660) Salt Lake City
(V19) (660GG) St. George
(V19) (660) Salt Lake City
(V19) (660) Salt Lake City
(V19) (660) Salt Lake City
(V19) (660) Salt Lake City
(V19) (660) Salt Lake City
(V19) (660) Salt Lake City
(V19) (660) Salt Lake City
(V19) (660) Salt Lake City
(V19) (660) Salt Lake City
(V19) (660) Salt Lake City
92.1%
88.7%
96.0%
93.3%
85.7%
91.7%
95.8%
40.9%
78.9%
95.5%
71.7%
74.9%
73.9%
70.9%
70.7%
73.3%
81.8%
72.3%
…
…
…
…
…
…
…
…
…
…
…
…
…
…
…
…
…
…
48

Specialty Encounters — FY15-18, cont.Demand
Source: 1. VSSC Encounters Cube 2. Geocoded Enrollee File FY18Q4 2.8.V19.SaltLakeCity#2
VA Market Area Health Systems Op�miza�on
VISN 19: Salt Lake City Market
County FY15-18 Avg Encounters FY18 Encounters Most Commonly Used Facility % of Encounters Id
Jefferson,ID
Madison,ID
Oneida,ID
Power,ID
Teton,ID
Iron,UT
Juab,UT
Kane,UT
Millard,UT
Morgan,UT
Piute,UT
Rich,UT
Salt Lake,UT
Beaver,UT
Box Elder,UT
Cache,UT
Carbon,UT
Dagge�,UT
713
402
251
203
84
1,482
599
379
534
555
87
89
71,168
207
2,591
2,369
1,462
142
727
494
264
177
81
1,703
580
417
398
601
124
78
70,859
231
2,623
2,369
1,443
122
(V19) (660) Salt Lake City
(V19) (660) Salt Lake City
(V19) (660) Salt Lake City
(V19) (660) Salt Lake City
(V19) (660) Salt Lake City
(V19) (660) Salt Lake City
(V19) (660) Salt Lake City
(V19) (660) Salt Lake City
(V19) (660) Salt Lake City
(V19) (660) Salt Lake City
(V19) (660) Salt Lake City
(V19) (660) Salt Lake City
(V19) (660) Salt Lake City
(V19) (660) Salt Lake City
(V19) (660) Salt Lake City
(V19) (660) Salt Lake City
(V19) (660) Salt Lake City
(V19) (660) Salt Lake City
71.8%
68.8%
82.6%
45.8%
71.6%
44.2%
90.7%
42.0%
86.7%
96.5%
83.9%
94.9%
95.5%
64.1%
93.7%
91.6%
78.6%
88.5%
…
…
…
…
…
…
…
…
…
…
…
…
…
…
…
…
…
…
49

Specialty Encounters — FY15-18, cont.Demand
Source: 1. VSSC Encounters Cube 2. Geocoded Enrollee File FY18Q4 2.8.V19.SaltLakeCity#3
VA Market Area Health Systems Op�miza�on
VISN 19: Salt Lake City Market
County FY15-18 Avg Encounters FY18 Encounters Most Commonly Used Facility % of Encounters Id
Davis,UT
Duchesne,UT
Emery,UT
Garfield,UT
Elko,NV
White Pine,NV
Total
18,052
1,134
465
250
2,489
769
161,297
18,707
1,188
515
279
2,518
787
166,174
(V19) (660) Salt Lake City
(V19) (660) Salt Lake City
(V19) (660) Salt Lake City
(V19) (660) Salt Lake City
(V19) (660) Salt Lake City
(V19) (660) Salt Lake City
96.3%
89.6%
62.1%
60.6%
75.1%
68.7%
…
…
…
…
…
…
…
50

Specialty Care Stop Code Trends FY15-18
Id
Specialty Title FY15 FY16 FY17 FY18 4 Yr Ch FY15 FY16 FY17 FY18 4 Yr ChA
77797780778177827783778477857786778777887789779077917792779377947795779677977798
(V19) (660) Salt Lake CityAllergy and Immunology
Audiology & Speech PathologyCardiology
Clinical PharmacologyCri�cal Care / Pulmonary Disease
DermatologyEndocrinology
GastroenterologyGeriatric Medicine
Hematology-OncologyInfec�ous DiseaseInternal Medicine
NephrologyNeurological Surgery
NeurologyNutri�on
Obstetrics & GynecologyOphthalmology
Optometry
147,5301,012
21,9437,0491,4211,4697,0302,9222,5841,7453,515
98312,008
1,531968
3,8851,682
59510,346
6,769
144,832928
17,1078,4501,5741,4816,9393,2302,958
2183,777
99511,724
1,6151,1013,9591,961
35910,424
7,875
144,8601,150
17,8559,5661,8401,4627,1943,6503,805
1473,9141,0668,6891,7591,0204,0391,691
37210,192
7,988
147,8291,651
17,9419,7741,3471,5316,9704,4254,008
873,994
9448,2682,0211,4084,2401,716
44710,357
8,310
0.2%63.1%
-18.2%38.7%-5.2%4.2%
-0.9%51.4%55.1%
-95.0%13.6%-4.0%
-31.1%32.0%45.5%
9.1%2.0%
-24.9%0.1%
22.8%
182,165616
13,81711,441
2992,748
12,6913,7424,2422,0214,8201,1888,1192,946
8175,948
7491,096
14,22613,881
196,569626
10,63514,070
2162,766
13,5834,9635,089
1935,1821,2869,7793,1701,0266,7911,454
65812,94122,657
198,257785
10,69516,484
272,894
12,9835,5226,171
645,6391,5345,5483,510
8797,1881,905
73212,71423,640
204,8281,024
10,84517,455
442,880
11,8526,6116,063
786,2571,4525,7993,9851,3077,8272,109
87913,51325,729
12.4%66.2%
-21.5%52.6%
-85.3%4.8%
-6.6%76.7%42.9%
-96.1%29.8%22.3%
-28.6%35.2%60.0%31.6%
181.6%-19.8%
-5.0%85.4%
7799 Orthopaedic Surgery 5,436 5,163 4,865 5,020 -7.7% 6,567 5,628 5,480 5,211 -20.6%
Demand
Source: VSSC Encounters Cube – Public Grouping (Specialty Care) 2.10.V19.SaltLakeCity
VA Market Area Health Systems Op�miza�on
VISN 19: Salt Lake City Market
CPT Work RVU4 Yr. Ch. 4 Yr. Ch.Encounters*
*Special�es were only included if there were greater than 15 encounters in any of the past four years. Note: Data limited to workload from pa�ents origina�ng from within the coun�es of Phase Two VISNs in the Market Assessments
51

Specialty Care Stop Code Trends FY15-18, cont.
Id
Specialty Title FY15 FY16 FY17 FY18 4 Yr Ch FY15 FY16 FY17 FY18 4 Yr ChA
78007801780278037804780578067807780878097810781178127813781478157816781778187819
OtolaryngologyPain Medicine
Physical Medicine & Rehabilita�onPlas�c Surgery
PodiatryPolytrauma
RheumatologySCI
SurgeryThoracic Surgery
UrologyVascular Surgery
(V19) (660GA) PocatelloAudiology & Speech Pathology
Clinical PharmacologyDermatology
GastroenterologyGeriatric MedicineInternal Medicine
Nutri�on
2,9792,974
19,806846
13,016311
2,43179
2,278371
5,7791,767
52814
N/A19
N/A62
274159
3,0243,676
20,713662
12,538254
2,47265
2,077395
5,5821,536
64114
N/A23
N/A53
273278
2,9133,560
20,591728
12,318239
3,61665
1,757324
4,8821,603
62616562344
N/A192295
2,9323,809
23,313718
10,933202
3,22066
1,516369
4,7771,5152,1871,660
896
49N/A
31352
-1.6%28.1%17.7%
-15.1%-16.0%-35.0%32.5%
-16.5%-33.5%
-0.5%-17.3%-14.3%314.2%
11757.1%N/A
-68.4%N/A
-100.0%-88.7%121.4%
6,3155,633
26,020872
10,293490
4,370157
4,072553
9,2282,188
140
N/A0
N/A10
13
6,5767,365
27,789615
11,001445
4,585140
3,726558
9,3201,737
51
N/A1
N/A030
6,7137,654
26,964700
11,985458
5,629130
3,180427
8,3631,662
20000
N/A02
6,2447,511
31,634639
9,810406
5,373122
2,413448
7,8241,4821,304
876210
N/A0
425
-1.1%33.3%21.6%
-26.7%-4.7%
-17.2%22.9%
-22.2%-40.7%-19.0%-15.2%-32.3%
9166.3%N/AN/AN/AN/A
-100.0%-100.0%
14064.7%7820 (V19) (660GB) Ogden 773 1,142 972 687 -11.1% 281 764 469 403 43.4%
Demand
Source: VSSC Encounters Cube – Public Grouping (Specialty Care) 2.10.V19.SaltLakeCity#2
VA Market Area Health Systems Op�miza�on
VISN 19: Salt Lake City Market
CPT Work RVU4 Yr. Ch. 4 Yr. Ch.Encounters*
*Special�es were only included if there were greater than 15 encounters in any of the past four years. Note: Data limited to workload from pa�ents origina�ng from within the coun�es of Phase Two VISNs in the Market Assessments
52

Specialty Care Stop Code Trends FY15-18, cont.
Id
Specialty Title FY15 FY16 FY17 FY18 4 Yr Ch FY15 FY16 FY17 FY18 4 Yr ChA
78217822782378247825782678277828782978307831783278337834783578367837783878397840
Audiology & Speech PathologyDermatology
EndocrinologyInternal Medicine
Nutri�on(V19) (660GD) Roosevelt
Audiology & Speech PathologyInternal Medicine
(V19) (660GE) OremAudiology & Speech Pathology
EndocrinologyInternal Medicine
Nutri�on(V19) (660GG) St. George
Audiology & Speech PathologyClinical Pharmacology
DermatologyGastroenterologyInternal Medicine
Nutri�on
18763
288100135
513120
329123
478376
2,5212,304
244
N/A55
134
12627
263134592
463412
854121
40217476
3,4332,896
1156
N/A50
366
155N/A188101528118
6850
1,299118
31638512
3,7643,119
3088
61538
1486
9745
391836815
1,225150N/A418657
4,5264,007
73872641
292
-20.9%-90.5%-66.3%-55.0%189.6%
62.7%119.4%-25.0%272.3%
22.0%-100.0%403.6%764.5%
79.5%73.9%
204.2%2075.0%
N/A-25.5%117.9%
01
27307000
18020
161,1531,130
40
N/A8
11
01
1350
629000
495002
4921,9981,493
211
N/A9
475
0N/A
40
465000
380000
3801,8541,250
300
12589
0000
403000
5920
N/A4
5891,7671,644
0001
122
-100.0%-100.0%
-99.9%N/A
5888.6%N/AN/AN/A
3207.8%-100.0%-100.0%
N/A3555.2%
53.2%45.6%
-100.0%-100.0%
N/A-87.1%974.9%
7841 (V19) (660GJ) Western Salt Lake 1,247 1,742 3,092 2,739 119.6% 623 870 1,427 1,216 95.2%
Demand
Source: VSSC Encounters Cube – Public Grouping (Specialty Care) 2.10.V19.SaltLakeCity#3
VA Market Area Health Systems Op�miza�on
VISN 19: Salt Lake City Market
CPT Work RVU4 Yr. Ch. 4 Yr. Ch.Encounters*
*Special�es were only included if there were greater than 15 encounters in any of the past four years. Note: Data limited to workload from pa�ents origina�ng from within the coun�es of Phase Two VISNs in the Market Assessments
53

Specialty Care Stop Code Trends FY15-18, cont.
Id
Specialty Title FY15 FY16 FY17 FY18 4 Yr Ch FY15 FY16 FY17 FY18 4 Yr ChA
7842784378447845784678477848784978507851785278537854785578567857785878597860
Audiology & Speech PathologyDermatology
EndocrinologyInternal Medicine
Nutri�on(V19) (660GK) Elko
Audiology & Speech PathologyEndocrinology
Internal MedicineNutri�on
(V19) (660QA) Idaho FallsGastroenterologyInternal Medicine
Nutri�on(V19) (660QB) Price
Audiology & Speech PathologyEndocrinology
Internal MedicineNutri�on
N/A81
63356
477188
42794126
N/AN/AN/AN/AN/AN/AN/AN/AN/A
2532
95494
439166
31694422
N/AN/AN/AN/AN/AN/AN/AN/AN/A
1,474N/A
1,01765
536127
265438
958
7203138
888
14
1,59870
52544
502124
38452516
2393350
156152
22274954
N/A-13.6%-17.1%-21.4%
5.2%-34.0%
-9.5%-43.0%-39.0%-38.5%
N/AN/AN/AN/AN/AN/AN/AN/AN/A
N/A1
5420
8110100
N/AN/AN/AN/AN/AN/AN/AN/AN/A
1550
3530
36200000
N/AN/AN/AN/AN/AN/AN/AN/AN/A
730N/A
260
67120002000000000
7202
130
48200000000020002
N/A108.9%-97.7%
N/A498.1%-86.7%
N/A-100.0%
N/A-100.0%
N/AN/AN/AN/AN/AN/AN/AN/AN/A
Demand
Source: VSSC Encounters Cube – Public Grouping (Specialty Care) 2.10.V19.SaltLakeCity#4
VA Market Area Health Systems Op�miza�on
VISN 19: Salt Lake City Market
CPT Work RVU4 Yr. Ch. 4 Yr. Ch.Encounters*
*Special�es were only included if there were greater than 15 encounters in any of the past four years. Note: Data limited to workload from pa�ents origina�ng from within the coun�es of Phase Two VISNs in the Market Assessments
54

Facility FY15 FY16 FY17 FY18 4 Yr ch. FY15 FY16 FY17 FY18 4 Yr ch. Id
(V19) (660) Salt Lake City 13,272 12,541 13,319 13,174 -0.7% 1,435,723 1,350,646 1,398,508 1,340,125 -6.7% 350
Demand
Source: Office of Den�stry 2.35.V19.SaltLakeCity
*Dental Data is derived from the Office of Den�stry’s dataset and represents Visits, RVU Equivalents, and Unique Pa�ents.
VA Market Area Health Systems Op�miza�on
VISN 19: Salt Lake City Market
Specialty Care Stop Code Trends FY15-18 – Dental
Visits 4 Yr. Ch. RVU Equivalent 4 Yr. Ch.Dental*
55

TelehealthU�liza�on Forma�ed FacilityPerc Na�onalPerc
Telehealth Use (Tele1) Home Telehealth (Tele2) Clinical Video Telehealth (Tele3) Store and Forward Telehealth (Tele4)eConsult (SC10)Video Telehealth to Off Site Pa�ents (Tele9)
31.1%1.3%
13.5%17.1%14.1%
0.5%
13.1%2.3%6.6%5.3%8.3%0.5%
Salt Lake City
Demand
Source: VSSC Telehealth Dashboard - Connected Care 2.15.V19.SaltLakeCity.660
Note: Telehealth u�liza�on is based on percentage of unique pa�ents leveraging telehealth-related tools/technology.
VA Market Area Health Systems Op�miza�on
VISN 19: Salt Lake City Market — Salt Lake City
Telehealth — FY18 Telehealth U�liza�on
Telehealth U�liza�on Na�onal
56

Note: Pa�ent site indicates the clinic loca�on by primary stop code where the pa�ent receives the service
Salt Lake City VAMC & Trea�ng Facility Encounters by Provider Site
Demand
VA Market Area Health Systems Op�miza�on
VISN 19: Salt Lake City Market — Salt Lake City
2.16.V19.SaltLakeCity.660
Pa�ent Site FY15 FY16 FY17 FY18 4 Yr Avg
(V19) (660) Salt Lake City(V19) (660GA) Pocatello(V19) (660GB) Ogden(V19) (660GD) Roosevelt(V19) (660GE) Orem(V19) (660GG) St. George(V19) (660GJ) Western Salt Lake(V19) (660GK) Elko(V19) (660QA) Idaho Falls(V19) (660QB) PriceTotal
1,5501,6741,191
2741,156
261730641
7,477
1,7492,141
529250
1,404410308611
7,402
1,4621,602
583373
1,230290337526201138
6,742
3,095925937417570
1,161346776
1,059530
9,816
1,9641,585
810328
1,090530430638630334
7,859
Provider Site FY15-18 TotalEncounters
% of TotalEncounters
(V19) (660) Salt Lake City(V19) (660GJ) Western Salt Lake(V19) (660GE) Orem(V19) (660GG) St. George(V19) (660GA) Pocatello(V19) (660GB) Ogden(V19) (660GK) Elko(V19) (660QA) Idaho Falls(V19) (660GD) Roosevelt(V19) (660QB) Price
24,3903,0081,8361,214
700127118
191312
77.6%9.6%5.8%3.9%2.2%0.4%0.4%0.1%0.0%0.0%
Telehealth Encounters by Pa�ent and Provider Site* — Salt Lake City
*Includes 4 Types: CVT General (690/692,693,699), CVT Na�onalCenter (644/645), CVT ProviderToHomePa�ent(179), and SF General (694/695,696)
Source: FY15-18 Detailed Telehealth Workload by Pa�ent Site, Provider Site, Stop Codes, and Telehealth Type Report
57

Demand
VA Market Area Health Systems Op�miza�on
VISN 19: Salt Lake City Market — Salt Lake City
Telehealth Encounters by Specialty*
58

Emergency Department Uniques (FY15-18)Demand
Source: HRSA Data Warehouse 2.28.V19.SaltLakeCity#IMG
Note: Map shows acute and cri�cal access hospitals with Emergency Departments and does not include freestanding Emergency Departments
VA Market Area Health Systems Op�miza�on
VISN 19: Salt Lake City Market
Unique Patients by County FY15-18
59

2_28 Data Level Title CPT Code FY15 FY16 FY17 FY18
Encounters
Total EncountersVA Admissions %
% Transfers
9928199282992839928499285TotalTotalTotal
2151,6179,3187,2842,857
21,29116.1%
2.4%
2241,3338,6386,8363,722
20,75315.2%
2.9%
131974
9,0737,1932,807
20,17816.8%
2.9%
190803
7,8148,8422,444
20,09317.5%
3.0%
88.1% of encounters seen between FY15-FY18 occurred between 8 A.M. and 10 P.M.
Emergency Department Encounters FY15-FY18 — Salt Lake City VAMC
Encounters FY15-18
0
2,000
4,000
6,000
8,000
10,000
Enco
unte
rs
1:00 AM2:00 AM
3:00 AM4:00 AM
5:00 AM6:00 AM
7:00 AM8:00 AM
9:00 AM
10:00 AM
11:00 AMNoon
1:00 PM2:00 PM
3:00 PM4:00 PM
5:00 PM6:00 PM
7:00 PM8:00 PM
9:00 PM
10:00 PM
11:00 PM
Midnight
Average
800
678
672
686
828 1,
416
2,70
5
4,26
2
6,46
8
7,75
0
8,00
1
7,20
0
6,74
6
6,49
3
5,89
7
5,22
6
4,21
8
3,69
9
3,48
5
2,95
6
2,60
4
2,05
8
1,51
8
1,09
7
Demand
Source: 1. VSSC Encounters Cube 2. Emergency Medicine Management Tool 2.28.V19.SaltLakeCity.660
VA Market Area Health Systems Op�miza�on
VISN 19: Salt Lake City Market — Salt Lake City
78.3% of encounters seen between FY15-FY18 occurred on weekdays vs. weekends.
60

Emergency Department Opera�onsDemand
Source: Integrated Flow Management Tool (IFMT) 2.31.V19.SaltLakeCity
VA Market Area Health Systems Op�miza�on
VISN 19: Salt Lake City Market
12_5 Measure FY17 FY18 FY17 Na�onal FY18 Na�onal
Salt Lake City ED Door to Inpa�ent Floor (Min)ED Admit Delay (Min)ED % Boarded > 4 HrsDiversion Total Hours
276105
3.8%N/A
275107
4.5%N/A
312126
15.2%N/A
316129
16.2%262,871
12_5 Measure FY17 FY18 FY17 Na�onal FY18 Na�onal
Salt Lake City ED Door to Inpa�ent Floor (Min)ED Admit Delay (Min)ED % Boarded > 4 HrsDiversion Total Hours
276105
3.8%N/A
275107
4.5%N/A
312126
15.2%N/A
316129
16.2%262,871
61

Sector County Name 2017Enrollees
FY16 FY17 FY18 FY16 FY17 FY18 FY16 FY17 FY18 FY16 FY17 FY18 FY16 FY17 FY18 ,
19-f-9-A19-f-9-A19-f-9-B19-f-9-B19-f-9-B19-f-9-B19-f-9-B19-f-9-B19-f-9-B19-f-9-B19-f-9-B19-f-9-B19-f-9-B19-f-9-B19-f-9-B19-f-9-B19-f-9-B19-f-9-B19-f-9-B19-f-9-B
Salt Lake, UTSector SubtotalBeaver, UTBox Elder, UTCache, UTCarbon, UTDagge�, UTDuchesne, UTElko, NVEmery, UTGarfield, UTIron, UTJuab, UTKane, UTMillard, UTMorgan, UTPiute, UTRich, UTSanpete, UTSevier, UT
20,61820,618
1441,0351,492
55252
4831,406
206160
1,285220251248231
4736
633531
1919
41118
2N/AN/A
8N/AN/A
2029
11N/A
3N/A
1735
5519
2931252
N/A17
355
N/A1
N/A1414
34341437
10213
17
1010
5126
101916
N/A6
N/A5965
110110N/A
423
3N/AN/A
61
N/A4
N/AN/AN/AN/AN/AN/A
33
140140N/A
523
4N/AN/A
81
N/A17
N/A1
N/AN/AN/AN/A
24
170170N/A
1043
3N/AN/A
41
N/A25
N/AN/A
211
N/AN/A
10
1,0181,018
10469047
355
1471312
1687
411410
56
6150
1,0501,050
779
12741
674
1162616
15310292111
98
5127
1,8711,871
13156290122
9200215
5526
3423773273120
3132
98
436436
11286830
2175015
371122413
12
N/A3237
456456
5385722
1264413
35011
87511
3418
613613
2076
15047
871893710
1791836151511
N/A6945
122122N/A
527917
21070
91
235
1313
311
1221
158158
2394517
31141
3N/A
197575
N/A2
1714
315315
369
11241
225
12919
476
8111510
21
5837
01000000000000000000
19-f-9-B19-f-9-B19-f-9-B19-f-9-B19-f-9-B19-f-9-B
Summit, UTTooele, UTUintah, UTUtah, UTWasatch, UTWashington, UT
5661,778
6846,409
3554,349
225819
N/A1741
11
23
1717
285
176
21N/A
15
184
19N/A
14
211
532
120
147986
30514
285
1985
106301
15396
57161262570
33759
103018
1068
127
114231
1419
134
1562
105212
12347
111819
1221791
153630
1201373
218843
24921
169
000000
Sector/County Name
Demand
Source: VHA Office of Community Care 2.30.V19.SaltLakeCity
VA Market Area Health Systems Op�miza�on
VISN 19: Salt Lake City Market
Primary Care Mental Health Medicine Surgery Rehab Medicine
Non-VA Community Care (NVCC) FY16-18 – Outpa�ent CPT Authoriza�ons
62

Sector County Name 2017Enrollees
FY16 FY17 FY18 FY16 FY17 FY18 FY16 FY17 FY18 FY16 FY17 FY18 FY16 FY17 FY18 ,
19-f-9-B19-f-9-B19-f-9-B19-f-9-D19-f-9-D19-f-9-D19-f-9-E19-f-9-E19-f-9-E19-f-9-E19-f-9-E19-f-9-E19-f-9-E19-f-9-E19-f-9-E19-f-9-E19-f-9-E19-f-9-E19-f-9-E19-f-9-E
Wayne, UTWhite Pine, NVSector SubtotalDavis, UTWeber, UTSector SubtotalBannock, IDBear Lake, IDBingham, IDBonneville, IDCaribou, IDClark, IDFranklin, IDFremont, IDJefferson, IDMadison, IDOneida, IDPower, IDTeton, IDSector Subtotal
56419
23,6287,7586,653
14,4112,714
1641,1002,589
18515
241347586352156137134
8,720
32
17291
1012
54
4710
N/A52696
N/A7
113
2105242
81220
623
49N/AN/A
44
1711
2N/A
11109
4161791
131629281218
15620
N/A17273724
6N/A
20365
N/A4
101153651
913
371
N/A1247112
69
N/A5
11619496812
17
641
N/A127
10N/AN/A
1106
N/A4
1754159
10026
517
1671
N/A48
3217
4N/A
3284
N/A52
1,620301257558294
10108312
165
16307049
71610
943
N/A39
1,772289264553333
19172439
252
254391751617
81,265
670
3,767599578
1,177571
36287995
645
6598
211113
274135
2,548
321
739131104235
951339
19213
419174627
654
480
225
739128125253120
869
15412
28
163727
588
474
436
1,689176184360198
23104376
352
3348
10556101413
1,017
116
62752
146198241
1195
28817
418248035212211
867
310
53785
148233255
15116291
95
17346435121011
874
519
1,237219261480361
22158542
307
3165
12581101728
1,477
00100100000000000001
Market To… Market Total 67,377 314 376 1,219 331 430 729 4,139 4,640 9,363 1,890 1,922 3,679 1,814 1,802 3,509 2
Sector/County Name
Demand
Source: VHA Office of Community Care 2.30.V19.SaltLakeCity#2
VA Market Area Health Systems Op�miza�on
VISN 19: Salt Lake City Market
Primary Care Mental Health Medicine Surgery Rehab Medicine
Non-VA Community Care (NVCC) FY16-18 – Outpa�ent CPT Authoriza�ons, cont.
63

Primary Care NVCC CPT Authorizations per County Mental Health NVCC CPT Authorizations per County
NVCC Outpa�ent CPT Authoriza�ons (Primary Care and Mental Health)Demand
Source: VHA Office of Community Care 2.32.V19.SaltLakeCity
VA Market Area Health Systems Op�miza�on
VISN 19: Salt Lake City Market
64

Demand
Source: VHA Office of Community Care 2.33.V19.SaltLakeCity
VA Market Area Health Systems Op�miza�on
VISN 19: Salt Lake City Market
NVCC Outpa�ent CPT Authoriza�ons (Medicine and Surgery)Medicine NVCC CPT Authorizations per County Surgery NVCC CPT Authorizations per County
65

Demand
Source: VHA Office of Community Care 2.34.V19.SaltLakeCity
VA Market Area Health Systems Op�miza�on
VISN 19: Salt Lake City Market
NVCC Outpa�ent CPT Authoriza�ons (Physical Medicine)
Physical Medicine NVCC CPT Authorizations per County
66

Top Services Provided by NVCC for Salt Lake City
Category of Care Total Authoriza�ons Total Authoriza�ons Total Authoriza�ons Id
NIC SKILLED NURSINGNIC HOMEMAKER/HOME HEALTH AIDER VISIT/URGENT CARETRANSPORTATIONSLEEP STUDY/POLYSOMNOGRAPHYInpa�entNIC SKILLED HOME CARERADIOLOGY MAMMOGRAMDERMATOLOGY TESTS, PROCEDURES, STUDIESPHYSICAL THERAPYOPTOMETRYLAB AND PATHOLOGYMENTAL HEALTHOPHTHALMOLOGY TESTS, PROCEDURES, STUDIESIV THERAPY/INFUSION, CLINICRADIATION THERAPYRADIOLOGY NOSORTHOPEDIC TESTS, PROCEDURES, STUDIESPRIMARY CARECHIROPRACTIC
2,9383,2581,678
240208
1,358640511544738331922256408312220219
595
42
4,1104,4921,848
321413
1,248901415526470566877353406372185261150129
45
4,0653,6091,8231,4241,3301,261
935840827670550508430412365266240228222201
27552756275727582759276027612762276327642765276627672768276927702771277227732774
CARDIOLOGY TESTS, PROCEDURES, STUDIESAUDIOLOGYORTHOPEDICHEMATOLOGY/ONCOLOGYNEPHROLOGYOtherTotal
62117
8882
1186,165
21,519
85127
93121131
2,56421,209
156151147140135
2,53023,465
2775277627772778277927802781
Demand
VA Market Area Health Systems Op�miza�on
VISN 19: Salt Lake City Market — Salt Lake City
FY18FY17FY16
Commercial*
2.26.V19.SaltLakeCity.660Source: VHA Office of Community Care*Commercial includes authoriza�ons from federally qualified health centers and provider agreements
67

Demand Es�mated Future Market Demand — Outpa�ent
68

l 2017 l 2027
0
2,000,000
4,000,000
6,000,000
8,000,000
0.0T%
0.0T%
0.0T%
0.0T%
RVU
s
Rehab Therapies Dental Clinic Medical Special�es Mental Health Programs Primary Care Surgical Special�es
67.2% 85.4%57.6%77.6%62.2% 62.9%
Total2017 Rvu2027 Percent Change 3_1
Demand
Source: BY17 EHCPM U�liza�on Projec�ons 3.1.V19.SaltLakeCity
VA Market Area Health Systems Op�miza�on
VISN 19: Salt Lake City Market
BY17 Market U�liza�on Projec�ons (Outpa�ent) — Salt Lake City Market
Health Systems Planning Group (HSPGs)
69

Ambulatory Mental Health, Health Systems Planning Categories (HSPCs)
50,000
100,000
0M%
5000M%
10000M%
15000M%
20000M%
Health Systems Planning Categories (HSPCs)
RVU
s
Homeless IntensiveCommunityMental Hlth
Recovery(ICMHR)
Psychiatry Psychology PsychosocialRehabilita�onand Recovery
Centers
MH RRTPOutpa�entEncounters
MH RRTPResiden�alEncounters
Work Therapy Community CareSocial Work
Non Psychiatristand Psychologist
-4.7% 87.3%130.5%-7.6%90.0% 17.0%87.8% 22.6% 12.0%-2.7%
2017 2027 Percent Change
Outpa�ent U�liza�on Projec�ons by Health Systems Planning Category (HSPC) Mental Health RVUs — Salt Lake City Market
Demand
Source: BY17 EHCPM U�liza�on Projec�ons 3.2.V19.SaltLakeCity
VA Market Area Health Systems Op�miza�on
VISN 19: Salt Lake City Market
l 2017 l 2027
70

Ambulatory Surgical Special�es, Health Systems Planning Categories (HSPCs)
10,000
20,000
30,000
40,000
Health Systems Planning Categories (HSPCs)
RVU
s
NeurologicalSurgery
Obstetrics &Gynecology
OrthopaedicSurgery
Otolaryngology Plas�c Surgery Podiatry Surgery Thoracic Surgery Urology Vascular Surgery Ophthalmology
122.4% 100.7% 108.5% 79.2% 88.8% 78.6% 79.5% 100.8% 68.1% 61.9% 82.3%
Rvu2017 Rvu2027 Rvu2027 % difference from Rvu2017
Outpatient Utilization Projections by Health Systems Planning Category (HSPC) Surgical Specialties RVUs — Salt Lake City Market
Demand
Source: BY17 EHCPM U�liza�on Projec�ons 3.3.V19.SaltLakeCity
VA Market Area Health Systems Op�miza�on
VISN 19: Salt Lake City Market
l 2017 l 2027
71

Ambulatory Medical Specialties, Health Systems Planning Categories (HSPCs)
0
20,000
40,000
60,000
5T%
10T%
15T%
Health Systems Planning Category (HSPCs)
RVU
s
Cardiology
Cri�cal Care/Pulmonary Dise
ase
Emergency Medicine
Gastroenterology
Neurology
Optometry
Physical Medicine & Rehabilita
�on
Allergy and Immunology
Chiropracty
Dermatology
Endocrinology
Hematology-Oncology
Infec�ous Dise
ase
Nephrology
Pain Medicine
Rheumatology
63.1% 71.4%112.7%22.1% 40.8%100.1%82.7% 69.2%68.6% 87.5%63.3% 103.1%62.9% 89.1% 45.9%82.9%
2017 2027 Percent Change
Demand
Source: BY17 EHCPM U�liza�on Projec�ons 3.4.V19.SaltLakeCity
VA Market Area Health Systems Op�miza�on
VISN 19: Salt Lake City Market
Outpatient Utilization Projections by Health Systems Planning Category (HSPC) Medical Specialties RVUs —Salt Lake City Market
l 2017 l 2027
72

BY17 Salt Lake City Market In-House LTSS U�liza�on Projec�ons (RVUs).
FY17 FY22 FY27 10 Year Change 10 Year % Change
VA Adult Day Health CareHome-Based Primary CareSCI&D Home CareCommunity Residen�al CareHome Telehealth
06,057
039
16,431
07,210
548
18,125
08,126
544
18,844
02,069
55
2,413
34.2%
12.8%14.7%
Outpa�ent U�liza�on Projec�ons by Health Systems Planning Category (HSPC) Ambulatory Long Term Support Services —
0
50,000
100,000
150,000
200,000
250,000
50,000%
100,000%
150,000%
200,000%
Community AdultDay Health Care
Home Respite Care Purchased SkilledHome Care
Home HospiceCare
Homemaker/HomeHealth AidePrograms
34.2% 58.0%66.0% 16.2%26.6%
Total2017 U�l2027 U�l2027 % difference from Total2017l 2017 l 2027
Salt Lake City Market
0
5,000
10,000
15,000
20,000
0%
50,000%
100,000%
150,000%
200,000%
VA Adult DayHealth Care
Home-BasedPrimary Care
SCI&D HomeCare
CommunityResiden�al Care
HomeTelehealth
34.2% 14.7%12.8%
Total2017 Rvu2027 Rvu2027 % difference from Total2017l 2017 l 2027
BY17 Salt Lake City Market Community LTSS U�liza�on Projec�ons (Procedures).
FY17 FY22 FY27 10 Year Change 10 Year % Change
Community Adult Day Health CareHome Respite CarePurchased Skilled Home CareHome Hospice CareHomemaker/Home Health Aide Programs
4,4661,362
43,758907
150,921
5,4721,895
52,2781,037
210,202
5,9922,261
55,4161,054
238,449
1,526899
11,658147
87,528
34.2%66.0%26.6%16.2%58.0%
Demand
Source: BY17 EHCPM U�liza�on Projec�ons 3.5.V19.SaltLakeCity
VA Market Area Health Systems Op�miza�on
VISN 19: Salt Lake City Market
73

FY18 Primary Care Encounters by County
Demand
Source: 1. VSSC Encounters Cube 2. BY17 EHCPM U�liza�on Projec�ons 3.6.V19.SaltLakeCity#IMG
VA Market Area Health Systems Op�miza�on
VISN 19: Salt Lake City Market
FY17-FY27 Primary Care RVU Growth Rate by Sector
Primary Care Workload – Historic & Projected
74

FY18 Mental Health Encounters by County
Demand
Source: 1. VSSC Encounters Cube 2. BY17 EHCPM U�liza�on Projec�ons 3.7.V19.SaltLakeCity#IMG
VA Market Area Health Systems Op�miza�on
VISN 19: Salt Lake City Market
FY17-FY27 Mental Health RVU Growth Rate by Sector
Mental Health Workload – Historic & Projected
75

FY18 Specialty Care Encounters by County
Demand
Source: 1. VSSC Encounters Cube 2. BY17 EHCPM U�liza�on Projec�ons 3.8.V19.SaltLakeCity#IMG
VA Market Area Health Systems Op�miza�on
VISN 19: Salt Lake City Market
FY17-FY27 Specialty Care RVU Growth Rate by Sector
Specialty Care Workload (Med/Surg Special�es Combined) – Historic & Projected
76

0M
2M
4M
6M
8M
Rehab Therapies Dental Clinic
2017 2022 2027 Order
0.0M
0.1M
0.2M
0.3M
0.4M
Primary Care MedicalSpecial�es
SurgicalSpecial�es
Mental HealthPrograms
2017 2022 2027 Order
. In-House Community Total Total Total .. ... o
Primary CareMedical Special�esSurgical Special�esMental Health ProgramsRehab TherapiesDental Clinic
136,342189,383
96,364197,770
2,993,1921,134,776
12,43949,40429,152
8,9451,167,610
237,186
148,781238,787125,516206,715
4,160,8021,371,962
196,676327,396184,299288,861
5,667,7831,931,360
233,547385,675228,973367,699
6,952,8122,224,473
84,766146,888103,457160,984
2,792,010852,511
57.0%61.5%82.4%77.9%67.1%62.1%
123456
Demand
Source: BY17 EHCPM U�liza�on Projec�ons 3.9.V19.SaltLakeCity.660
VA Market Area Health Systems Op�miza�on
VISN 19: Salt Lake City Market — Salt Lake City
FY17 FY22 FY27
10 Year
Change in
Total
10 Year %
Change in
Total
32.2%57.0% 61.5% 82.4% 77.9%
37.1% 46.8% 39.7%
BY17 Parent Facility U�liza�on Projec�ons (Outpa�ent) – Salt Lake City VAMCBY17 Salt Lake City VAMC U�liza�on Projec�ons (RVUs)
36.2% 40.8%67.1% 62.1%
77

Ambulatory Mental Health, Health Systems Planning Categories (HSPCs)
20,000
40,000
60,000
80,000
100,000
0.0%
5000000000.0%
10000000000.0%
15000000000.0%
20000000000.0%
Health Systems Planning Category (HSPC)
RVU
s
Homeless IntensiveCommunity MH
Recovery (ICMHR)
Psychiatry Psychology PsychosocialRehabilita�on andRecovery Centers
MH RRTP Outpa�entEncounters
MH RRTP Residen�alEncounters
Work Therapy
-5.1% -7.6%89.2% 17.0%87.2% 22.1% 12.3%-3.5%
ActualRvu2017 ProjectedRvu2027 Percent Change
Demand
Source: BY17 EHCPM U�liza�on Projec�ons 3.10.V19.SaltLakeCity.660
VA Market Area Health Systems Op�miza�on
VISN 19: Salt Lake City Market — Salt Lake City
Outpa�ent Parent Facility U�liza�on Projec�ons by Health Systems Planning Category (HSPC)
l 2017 l 2027
Mental Health RVUs — Salt Lake City VAMC
78

Ambulatory Surgical Special�es, Health Systems Planning Categories (HSPCs)
10,000
20,000
30,000
40,000
50,000
2000000000.0%
4000000000.0%
6000000000.0%
8000000000.0%
10000000000.0%
12000000000.0%
14000000000.0%
16000000000.0%
18000000000.0%
20000000000.0%
Health Systems Planning Category (HSPC)
RVU
s
Neurological Obstetrics &Gynecology
Orthopaedic Otolaryngology Plas�c Podiatry Surgery Thoracic Urology Vascular Ophthalmology
114.1% 79.2%58.6%76.6% 81.9%104.2% 88.3% 77.2%99.8% 77.3% 66.1%
ActualRvu2017 ProjectedRvu2027 Percent Change 3_11
Demand
Source: BY17 EHCPM U�liza�on Projec�ons 3.11.V19.SaltLakeCity.660
VA Market Area Health Systems Op�miza�on
VISN 19: Salt Lake City Market — Salt Lake City
Outpa�ent Parent Facility U�liza�on Projec�ons by Health Systems Planning Category (HSPC)
l 2017 l 2027
Surgical Special�es RVUs — Salt Lake City VAMC
79

Ambulatory Medical Special�es, Health Systems Planning Categories (HSPCs)
0
10,000
20,000
30,000
40,000
50,000
60,000
70,000
2T%
4T%
6T%
8T%
10T%
12T%
14T%
16T%
18T%
Health Systems Planning Category
RVU
s
Cardiology Cri�cal Care/PulmonaryDisease
Emergency Medicine Gastroenterology Neurology Optometry Physical Medicine &Rehabilita�on
59.8% 80.9%81.5%22.1%62.9% 67.4%61.0%
2017 2027 Percent Change
Demand
Source: BY17 EHCPM U�liza�on Projec�ons 3.12.V19.SaltLakeCity.660
VA Market Area Health Systems Op�miza�on
VISN 19: Salt Lake City Market — Salt Lake City
Outpa�ent Parent Facility U�liza�on Projec�ons by Health Systems Planning Category (HSPC) Medical Special�es RVUs — Salt Lake City VAMC
l 2017 l 2027
80

0
10,000
0%
500000%
1000000%
TenY
rPer
cDel
taTo
tal
VA Adult Day HealthCare
CommunityResiden�al Care
Home-Based PrimaryCare
Home Telehealth
0.0% 14.4%34.2%10.6%
Actual Projected2027Rvu TenYrPercDeltaTotal
0
100,000
200,000
100000%
200000%
TenY
rPer
cDel
taTo
tal
Community AdultDay Health Care
Home Respite Care Purchased SkilledHome Care
Home HospiceCare
Homemaker/HomeHealth Aide Progr…
34.1% 58.4%66.0% 20.9%26.9%
Actual Projected2027U�liza�on TenYrPercDeltaTotal
* Provided at procedure level given the limited RVU repor�ng for these services
HSPC
FY17 FY22 FY27 10 YearChange
10 Year %Change
Community Adult Day HealthCareHome Respite CarePurchased Skilled Home CareHome Hospice CareHomemaker/Home Health AidePrograms
4,459
1,36044,856
1,082154,560
5,463
1,89253,682
1,286215,598
5,980
2,25856,936
1,308244,824
1,521
89812,080
22690,264
34.1%
66.0%26.9%20.9%58.4%
HSPC
FY17 FY22 FY27 10 YearChange
10 Year %Change
SCI&D Home CareVA Adult Day Health CareCommunity Residen�alCareHome-Based PrimaryCareHome Telehealth
N/A0
39
6,072
16,917
N/AN/A
48
7,229
18,642
N/AN/A
44
8,150
19,361
N/A04
2,077
2,444
N/A0.0%
10.6%
34.2%
14.4%
Source: BY17 EHCPM U�liza�on Projec�ons 3.13.V19.SaltLakeCity.660
VA Market Area Health Systems Op�miza�on
Outpa�ent Parent Facility U�liza�on Projec�ons by Health Systems Planning Category (HSPC)Ambulatory Long Term Support Services — Salt Lake City VAMC
BY17 Salt Lake City VAMC In-HouseLTSS U�liza�on Projec�ons (RVUs)
BY17 Salt Lake City VAMC CommunityLTSS U�liza�on Projec�ons (Procedures)*
Demand
FY17 FY22 FY27 FY17 FY22 FY27
l 2017 l 2027 l 2017 l 2027
VISN 19: Salt Lake City Market — Salt Lake City
Homemaker/Home
Health Aide Programs
81

Demand
Source: IBM Market Expert 3.14.V19.SaltLakeCity.660
VA Market Area Health Systems Op�miza�on
VISN 19: Salt Lake City Market — Salt Lake City
• Overview:
ü Outpa�ent demand es�mates (pa�ent visits)
were also developed to understand current
and future expected commercial outpa�ent
demand
ü Demand es�mates are based on non-Veteran
pa�ent origin within a 60 minute drive �me
from parent VA Medical Center/ Health Care
Center noted
Clinical Service Line 2018 2023 2028 5 Year Chg % Chg 10 Year Chg % Chg
General/Family Prac�ceInternal MedicinePrimary Care TotalAllergy/ImmunologyCardiologyDermatologyEndocrinologyGastroenterologyHematology/OncologyInfec�ous DiseaseNephrologyNeurologyPain ManagementPulmonologyRheumatologyVascularSpecialty Care (Medicine) Sub-TotalCardio/Thoracic SurgeryColorectal SurgeryGeneral Surgery
2,219,1991,118,8553,338,054
81,161283,326358,503
91,289124,782238,635
16,75444,714
113,04354,68870,94571,62317,853
1,567,3158,5468,847
104,019
2,499,3921,298,5873,797,979
91,814346,515412,633105,075145,819291,975
19,57754,679
129,87465,52184,73384,21622,158
1,854,58910,13810,262
120,865
2,848,5761,514,3644,362,940
104,675418,537477,486121,830170,971352,797
22,93466,034
150,07978,102
100,78999,24327,015
2,190,49311,99711,967
140,799
280,194179,732459,925
10,65363,18954,12913,78621,03753,341
2,8239,965
16,83210,83213,78912,594
4,305287,274
1,5921,414
16,846
12.6%16.1%13.8%13.1%22.3%15.1%15.1%16.9%22.4%16.8%22.3%14.9%19.8%19.4%17.6%24.1%18.3%18.6%16.0%16.2%
629,377395,509
1,024,88623,514
135,211118,983
30,54146,189
114,1626,181
21,32137,03623,41429,84527,620
9,162623,178
3,4513,120
36,780
28.4%35.3%30.7%29.0%47.7%33.2%33.5%37.0%47.8%36.9%47.7%32.8%42.8%42.1%38.6%51.3%39.8%40.4%35.3%35.4%
NeurosurgeryOphthalmologyOrthopedic SurgeryOtolaryngologyPlas�c SurgeryUrologySpecialty Care (Surgery) Sub-TotalMedicine/Surgery TotalObstetrics/GynecologyWomen's Health TotalPsychiatryMental Health TotalPhysical Medicine/RehabRehab TotalEmergency/Cri�cal Care
23,434309,254336,400158,229
24,827146,256
1,119,8132,687,128
421,928421,928310,073310,073
78,06578,065
712,286
27,008369,687387,043180,215
28,581173,459
1,307,2583,161,847
466,487466,487343,994343,994
90,70990,709
808,417
31,317439,948447,720206,631
33,087205,348
1,528,8153,719,308
526,053526,053388,418388,418105,833105,833921,177
3,57360,43450,64321,985
3,75427,203
187,445474,719
44,55844,55833,92133,92112,64412,64496,130
15.2%19.5%15.1%13.9%15.1%18.6%16.7%17.7%10.6%10.6%10.9%10.9%16.2%16.2%13.5%
7,883130,694111,321
48,4018,260
59,092409,002
1,032,180104,124104,124
78,34578,34527,76727,767
208,891
33.6%42.3%33.1%30.6%33.3%40.4%36.5%38.4%24.7%24.7%25.3%25.3%35.6%35.6%29.3%
Growth Projec�onsPa�ent Visits
Overall Outpa�ent Commercial Demand – Salt Lake City Area
Validation of the data for this slide is not required 82

Demand
Source: IBM Market Expert 3.14.V19.SaltLakeCity.660#2
VA Market Area Health Systems Op�miza�on
VISN 19: Salt Lake City Market — Salt Lake City
• Overview:
ü Outpa�ent demand es�mates (pa�ent visits)
were also developed to understand current
and future expected commercial outpa�ent
demand
ü Demand es�mates are based on non-Veteran
pa�ent origin within a 60 minute drive �me
from parent VA Medical Center/ Health Care
Center noted
Clinical Service Line 2018 2023 2028 5 Year Chg % Chg 10 Year Chg % Chg
Emergency Services TotalNurse Prac��onerPhysician AssistantOther Services TotalGrand Total
712,286292,455185,480477,935
8,025,470
808,417336,760216,368553,128
9,222,561
921,177389,788252,813642,601
10,666,330
96,13044,30530,88875,193
1,197,091
13.5%15.1%16.7%15.7%14.9%
208,89197,33467,333
164,6672,640,861
29.3%33.3%36.3%34.5%32.9%
Growth Projec�onsPa�ent Visits
Overall Outpa�ent Commercial Demand – Salt Lake City Area, cont.
Validation of the data for this slide is not required 83

Demand Es�mated Current and Historic Market Demand — Inpa�ent
84

Commercial Provider Case Mix Index⁴
Inpa�ent Demand and CMI – Salt Lake City
VAMC Case Mix Index³
Bed Service FY15 FY16 FY17 FY18 Current FY15 FY16 FY17 FY18 FY15-18 Change % DO
MedicalSurgeryTotal Med/SurgMental HealthRRTP*Rehab MedVAMC Total
5030802115
5121
5030803015
5130
5030803015
5130
4731783015
5128
4631773015
5127
31.617.549.119.639.5
3.8112.0
30.113.743.818.112.8
2.877.5
33.612.746.318.513.1
3.781.6
32.711.944.620.413.6
3.482.0
3.5%-32.0%
-9.2%4.1%
-65.6%-10.5%-26.8%
1234567
Facility 2015Unique
2016Unique
2017Unique
2018Unique
2015CMI
2016CMI
2017CMI
2018CMI
MedianCMI*
HighCMI**
Id
(660) Salt Lake City 2,911 2,851 2,739 2,611 1.63 1.59 1.55 1.60 1.76 2.46 …
Demand
4.6.V19.SaltLakeCity.660
*RRTP includes Domiciliary and CWT/TR Bed Services**Market: Within a 60 minute drive �me of the VAMC
VA Market Area Health Systems Op�miza�on
VISN 19: Salt Lake City Market – Salt Lake City
Opera�ng Beds from PTF Cube Average Daily Census (ADC)Opera�ng Beds Reported by Field
Source: 1. Beds reported by the field in GFI submission 2. VSSC Beds Using PTF Cube 3. MCAO Discharge Cube 4. CMI (acute inpatient care) based on Medicare only population from 2018 CMS Cost Reports
85

Medical/Surgical Bed Days of Care (BDOC) – FY15-18Demand
Source: 1. VSSC Trea�ng Specialty Cube 2. Geocoded Enrollee File FY18Q4 4.1.V19.SaltLakeCity#IMG
VA Market Area Health Systems Op�miza�on
VISN 19: Salt Lake City Market
FY15-18 Average Medical/Surgical Bed Days of Care by County
86

Medical/Surgical BDOC — FY15-18, cont.County FY18 BDOC FY18 ADC % ADC FY15-18 AVG BDOC Majority Receiving Facility % BDOC …
Bannock, ID
Bear Lake, ID
Bingham, ID
Bonneville, ID
Caribou, ID
Franklin, ID
Fremont, ID
Jefferson, ID
Madison, ID
Oneida, ID
Power, ID
Teton, ID
Elko, NV
White Pine, NV
Beaver, UT
Box Elder, UT
Cache, UT
Carbon, UT
305
16
74
339
8
5
16
82
42
26
4
6
394
174
24
180
164
79
0.8
0.0
0.2
0.9
0.0
0.0
0.0
0.2
0.1
0.1
0.0
0.0
1.1
0.5
0.1
0.5
0.4
0.2
30.0%
31.4%
18.8%
39.5%
15.7%
5.8%
13.3%
25.9%
23.5%
34.7%
11.1%
27.3%
29.2%
37.8%
34.8%
26.0%
24.3%
16.9%
254
13
98
215
13
22
30
79
45
19
9
6
337
115
17
173
169
117
(V19) (660) Salt Lake City
(V19) (660) Salt Lake City
(V19) (660) Salt Lake City
(V19) (660) Salt Lake City
(V04) (595) Lebanon
(V19) (660) Salt Lake City
(V19) (660) Salt Lake City
(V19) (660) Salt Lake City
(V19) (660) Salt Lake City
(V19) (660) Salt Lake City
(V19) (660) Salt Lake City
(V19) (660) Salt Lake City
(V19) (660) Salt Lake City
(V19) (660) Salt Lake City
(V19) (660) Salt Lake City
(V19) (660) Salt Lake City
(V19) (660) Salt Lake City
(V19) (660) Salt Lake City
84.6%
100.0%
83.8%
71.4%
75.0%
100.0%
75.0%
97.6%
100.0%
88.5%
100.0%
100.0%
71.3%
100.2%
54.2%
97.8%
98.2%
88.6%
…
…
…
…
…
…
…
…
…
…
…
…
…
…
…
…
…
…
Demand
Source: 1. VSSC Trea�ng Specialty Cube 2. Geocoded Enrollee File FY18Q4 4.1.V19.SaltLakeCity
VA Market Area Health Systems Op�miza�on
VISN 19: Salt Lake City Market
87

Medical/Surgical BDOC — FY15-18, cont.County FY18 BDOC FY18 ADC % ADC FY15-18 AVG BDOC Majority Receiving Facility % BDOC …
Dagge�, UT
Davis, UT
Duchesne, UT
Emery, UT
Garfield, UT
Iron, UT
Juab, UT
Kane, UT
Millard, UT
Morgan, UT
Piute, UT
Rich, UT
Salt Lake, UT
Sanpete, UT
Sevier, UT
Summit, UT
Tooele, UT
Uintah, UT
15
1,123
192
28
17
71
63
37
46
34
17
9
7,927
103
141
80
474
157
0.0
3.1
0.5
0.1
0.0
0.2
0.2
0.1
0.1
0.1
0.0
0.0
21.7
0.3
0.4
0.2
1.3
0.4
15.8%
25.5%
29.2%
17.8%
33.3%
17.5%
36.0%
22.4%
32.6%
20.4%
65.4%
34.6%
24.8%
21.3%
34.7%
27.1%
25.8%
30.1%
24
1,100
165
39
13
102
44
41
35
42
7
7
7,991
121
102
74
459
131
(V19) (660) Salt Lake City
(V19) (660) Salt Lake City
(V19) (660) Salt Lake City
(V19) (660) Salt Lake City
(V19) (660) Salt Lake City
(V19) (660) Salt Lake City
(V19) (660) Salt Lake City
(V19) (660) Salt Lake City
(V19) (660) Salt Lake City
(V19) (660) Salt Lake City
(V19) (660) Salt Lake City
(V19) (660) Salt Lake City
(V19) (660) Salt Lake City
(V19) (660) Salt Lake City
(V19) (660) Salt Lake City
(V19) (660) Salt Lake City
(V19) (660) Salt Lake City
(V19) (660) Salt Lake City
100.0%
95.7%
93.8%
75.0%
82.4%
91.5%
81.0%
75.7%
78.3%
100.0%
100.0%
100.0%
95.1%
100.0%
97.2%
100.0%
90.7%
96.8%
…
…
…
…
…
…
…
…
…
…
…
…
…
…
…
…
…
…
Demand
Source: 1. VSSC Trea�ng Specialty Cube 2. Geocoded Enrollee File FY18Q4 4.1.V19.SaltLakeCity#2
VA Market Area Health Systems Op�miza�on
VISN 19: Salt Lake City Market
88

Medical/Surgical BDOC — FY15-18, cont.County FY18 BDOC FY18 ADC % ADC FY15-18 AVG BDOC Majority Receiving Facility % BDOC …
Utah, UT
Wasatch, UT
Washington, UT
Wayne, UT
Wayne, UT
Weber, UT
Total
924
82
175
12
12
793
14,470
2.5
0.2
0.5
0.0
0.0
2.2
39.6
24.5%
25.9%
17.2%
46.2%
46.2%
22.1%
N/A
943
79
255
7
7
897
14,409
(V19) (660) Salt Lake City
(V19) (660) Salt Lake City
(V21) (593) Las Vegas-Nevada
(V19) (575) Grand Junc�on-Colorado
(V19) (660) Salt Lake City
(V19) (660) Salt Lake City
98.1%
95.1%
48.0%
50.0%
50.0%
93.8%
N/A
…
…
…
…
…
…
…
Demand
Source: 1. VSSC Trea�ng Specialty Cube 2. Geocoded Enrollee File FY18Q4 4.1.V19.SaltLakeCity#3
VA Market Area Health Systems Op�miza�on
VISN 19: Salt Lake City Market
89

Demand
Source: VSSC Trea�ng Specialty Cube 4.2.V19.SaltLakeCity
VA Market Area Health Systems Op�miza�on
VISN 19: Salt Lake City Market
Top DRGs for Medicine in FY184_4 Facility DRG In Market
BDOCIn Market BDOC
% of TotalIn and Out ofMarket BDOC
In and Out of Market% of Total BDOC
(V19) (660) Salt Lake City O (871) Sep�cemia W/o Mv 96+ Hours W MccO (291) Heart Failure & Shock W MccO (286) Circulatory Disorders Except Ami, W Card Cath W MccO (292) Heart Failure & Shock W CcO (287) Circulatory Disorders Except Ami, W Card Cath W/o MccO (872) Sep�cemia W/o Mv 96+ Hours W/o MccO (189) Pulmonary Edema & Respiratory FailureO (641) Nutri�onal & Misc Metabolic Disorders W/o MccO (65) Intracranial Hemorrhage Or Cerebral Infarc�on W CcO (190) Chronic Obstruc�ve Pulmonary Disease W MccOtherTotal
721393268429285387360193120120
62449520
7.6%4.1%2.8%4.5%3.0%4.1%3.8%2.0%1.3%1.3%
65.6%100.0%
778572502496494421407209184168
706411295
6.9%5.1%4.4%4.4%4.4%3.7%3.6%1.9%1.6%1.5%
62.5%100.0%
4_4 Facility DRG In MarketBDOC
In Market BDOC% of Total
In and Out ofMarket BDOC
In and Out of Market% of Total BDOC
(V19) (660) Salt Lake City O (871) Sep�cemia W/o Mv 96+ Hours W MccO (291) Heart Failure & Shock W MccO (286) Circulatory Disorders Except Ami, W Card Cath W MccO (292) Heart Failure & Shock W CcO (287) Circulatory Disorders Except Ami, W Card Cath W/o MccO (872) Sep�cemia W/o Mv 96+ Hours W/o MccO (189) Pulmonary Edema & Respiratory FailureO (641) Nutri�onal & Misc Metabolic Disorders W/o MccO (65) Intracranial Hemorrhage Or Cerebral Infarc�on W CcO (190) Chronic Obstruc�ve Pulmonary Disease W MccOtherTotal
721393268429285387360193120120
62449520
7.6%4.1%2.8%4.5%3.0%4.1%3.8%2.0%1.3%1.3%
65.6%100.0%
778572502496494421407209184168
706411295
6.9%5.1%4.4%4.4%4.4%3.7%3.6%1.9%1.6%1.5%
62.5%100.0%
90

Demand
Sources: 1. VSSC Trea�ng Specialty Cube 2. VHA Office of Community Care 4.13.V19.SaltLakeCity
VA Market Area Health Systems Op�miza�on
VISN 19: Salt Lake City Market
Top Medicine DRGs in the Community and Outside of the Market. DRG FY18 BDOC % of Total BDOC
VA Care Outside of the Market
Care in the Community
(57) DEGENERATIVE NERVOUS SYSTEM DISORDERS W/O MCC(189) PULMONARY EDEMA & RESPIRATORY FAILURE(556) SIGNS & SYMPTOMS OF MUSCULOSKELETAL SYSTEM & CONN TISSUE W/O MCC(291) HEART FAILURE & SHOCK W MCC(292) HEART FAILURE & SHOCK W CC(950) AFTERCARE W/O CC/MCC(445) DISORDERS OF THE BILIARY TRACT W CC(871) SEPTICEMIA OR SEVERE SEPSIS W/O MV >96 HOURS W MCC(94) BACTERIAL & TUBERCULOUS INFECTIONS OF NERVOUS SYSTEM W MCC(439) DISORDERS OF PANCREAS EXCEPT MALIGNANCY W CCOtherTotal(871) SEPTICEMIA OR SEVERE SEPSIS W/O MV >96 HOURS W MCC(291) HEART FAILURE & SHOCK W MCC(682) RENAL FAILURE W MCC(834) ACUTE LEUKEMIA W/O MAJOR O.R. PROCEDURE W MCC(208) RESPIRATORY SYSTEM DIAGNOSIS W VENTILATOR SUPPORT <=96 HOURS(189) PULMONARY EDEMA & RESPIRATORY FAILURE(101) SEIZURES W/O MCC(872) SEPTICEMIA OR SEVERE SEPSIS W/O MV >96 HOURS W/O MCC
149684942302828272621
326794228
61604544383633
18.8%8.6%6.2%5.3%3.8%3.5%3.5%3.4%3.3%2.6%
41.1%100.0%
16.9%4.5%4.4%3.3%3.3%2.8%2.7%2.4%
(180) RESPIRATORY NEOPLASMS W MCC(287) CIRCULATORY DISORDERS EXCEPT AMI, W CARD CATH W/O MCCOtherTotal
3230
7461,353
2.4%2.2%
55.1%100.0%
. DRG FY18 BDOC % of Total BDOC
VA Care Outside of the Market
Care in the Community
(57) DEGENERATIVE NERVOUS SYSTEM DISORDERS W/O MCC(189) PULMONARY EDEMA & RESPIRATORY FAILURE(556) SIGNS & SYMPTOMS OF MUSCULOSKELETAL SYSTEM & CONN TISSUE W/O MCC(291) HEART FAILURE & SHOCK W MCC(292) HEART FAILURE & SHOCK W CC(950) AFTERCARE W/O CC/MCC(445) DISORDERS OF THE BILIARY TRACT W CC(871) SEPTICEMIA OR SEVERE SEPSIS W/O MV >96 HOURS W MCC(94) BACTERIAL & TUBERCULOUS INFECTIONS OF NERVOUS SYSTEM W MCC(439) DISORDERS OF PANCREAS EXCEPT MALIGNANCY W CCOtherTotal(871) SEPTICEMIA OR SEVERE SEPSIS W/O MV >96 HOURS W MCC(291) HEART FAILURE & SHOCK W MCC(682) RENAL FAILURE W MCC(834) ACUTE LEUKEMIA W/O MAJOR O.R. PROCEDURE W MCC(208) RESPIRATORY SYSTEM DIAGNOSIS W VENTILATOR SUPPORT <=96 HOURS(189) PULMONARY EDEMA & RESPIRATORY FAILURE(101) SEIZURES W/O MCC(872) SEPTICEMIA OR SEVERE SEPSIS W/O MV >96 HOURS W/O MCC
149684942302828272621
326794228
61604544383633
18.8%8.6%6.2%5.3%3.8%3.5%3.5%3.4%3.3%2.6%
41.1%100.0%
16.9%4.5%4.4%3.3%3.3%2.8%2.7%2.4%
(180) RESPIRATORY NEOPLASMS W MCC(287) CIRCULATORY DISORDERS EXCEPT AMI, W CARD CATH W/O MCCOtherTotal
3230
7461,353
2.4%2.2%
55.1%100.0%
Note: Enrollees enrolled in a market and received care at a facility outside of their market
91

Top DRGs for Surgery in FY18Demand
Source: VSSC Trea�ng Specialty Cube 4.3.V19.SaltLakeCity
VA Market Area Health Systems Op�miza�on
VISN 19: Salt Lake City Market
Id
4_5 Facility DRG In MarketBDOC
In Market BDOC% of Total
In and Out ofMarket BDOC
In and Out of Market% of Total BDOC
………………………………
(V19) (660) Salt Lake City O (470) Major Joint Replacement Or Rea�achment Of Lower Extremity W/o MccO (235) Coronary Bypass W/o Cardiac Cath W MccO (981) Extensive O.r. Procedure Unrelated To Principal Diagnosis W MccO (219) Cardiac Valve & Oth Maj Cardiothoracic Proc W/o Card Cath W MccO (853) Infec�ous & Parasi�c Diseases W O.r. Procedure W MccO (460) Spinal Fusion Except Cervical W/o MccN (264) Other circulatory system O.R. proceduresO (326) Stomach, Esophageal & Duodenal Proc W MccO (252) Other Vascular Procedures W MccO (329) Major Small & Large Bowel Procedures W MccOtherTotal
212171164
85114113
54463285
2,3263,402
6.2%5.0%4.8%2.5%3.4%3.3%1.6%1.4%0.9%2.5%
68.4%100.0%
225220212140128125123107
9494
2,9474,415
5.1%5.0%4.8%3.2%2.9%2.8%2.8%2.4%2.1%2.1%
66.7%100.0%
92

Demand
Source: 1. VSSC Treating Specialty Cube 2. VHA Office of Community Care 4.14.V19.SaltLakeCity
VA Market Area Health Systems Op�miza�on
VISN 19: Salt Lake City Market
Top Surgery DRGs in the Community and Outside of the Market. DRG FY18 BDOC % of Total BDOC
VA Care Outside of the Market
Care in the Community
(988) NON-EXTENSIVE O.R. PROC UNRELATED TO PRINCIPAL DIAGNOSIS W CC(16) AUTOLOGOUS BONE MARROW TRANSPLANT W CC/MCC(824) LYMPHOMA & NON-ACUTE LEUKEMIA W OTHER O.R. PROC W CC(470) MAJOR JOINT REPLACEMENT OR REATTACHMENT OF LOWER EXTREMITY W/O MCC(265) AICD LEAD PROCEDURES(418) LAPAROSCOPIC CHOLECYSTECTOMY W/O C.D.E. W CC(854) INFECTIOUS & PARASITIC DISEASES W O.R. PROCEDURE W CC(621) O.R. PROCEDURES FOR OBESITY W/O CC/MCC(247) PERC CARDIOVASC PROC W DRUG-ELUTING STENT W/O MCC(254) OTHER VASCULAR PROCEDURES W/O CC/MCCOtherTotal(25) CRANIOTOMY & ENDOVASCULAR INTRACRANIAL PROCEDURES W MCC(3) ECMO OR TRACH W MV >96 HRS OR PDX EXC FACE, MOUTH & NECK W MAJ O.R.(14) ALLOGENEIC BONE MARROW TRANSPLANT(470) MAJOR JOINT REPLACEMENT OR REATTACHMENT OF LOWER EXTREMITY W/O MCC(853) INFECTIOUS & PARASITIC DISEASES W O.R. PROCEDURE W MCC(326) STOMACH, ESOPHAGEAL & DUODENAL PROC W MCC(928) FULL THICKNESS BURN W SKIN GRAFT OR INHAL INJ W CC/MCC(709) PENIS PROCEDURES W CC/MCC
27191911101010
876
51178
9292644949363130
15.2%10.7%10.7%
6.2%5.6%5.6%5.6%4.5%3.9%3.4%
28.7%100.0%
7.6%7.6%5.3%4.1%4.1%3.0%2.6%2.5%
(20) INTRACRANIAL VASCULAR PROCEDURES W PDX HEMORRHAGE W MCC(573) SKIN GRAFT FOR SKIN ULCER OR CELLULITIS W MCCOtherTotal
3028
7071,208
2.5%2.3%
58.5%100.0%
. DRG FY18 BDOC % of Total BDOC
VA Care Outside of the Market
Care in the Community
(988) NON-EXTENSIVE O.R. PROC UNRELATED TO PRINCIPAL DIAGNOSIS W CC(16) AUTOLOGOUS BONE MARROW TRANSPLANT W CC/MCC(824) LYMPHOMA & NON-ACUTE LEUKEMIA W OTHER O.R. PROC W CC(470) MAJOR JOINT REPLACEMENT OR REATTACHMENT OF LOWER EXTREMITY W/O MCC(265) AICD LEAD PROCEDURES(418) LAPAROSCOPIC CHOLECYSTECTOMY W/O C.D.E. W CC(854) INFECTIOUS & PARASITIC DISEASES W O.R. PROCEDURE W CC(621) O.R. PROCEDURES FOR OBESITY W/O CC/MCC(247) PERC CARDIOVASC PROC W DRUG-ELUTING STENT W/O MCC(254) OTHER VASCULAR PROCEDURES W/O CC/MCCOtherTotal(25) CRANIOTOMY & ENDOVASCULAR INTRACRANIAL PROCEDURES W MCC(3) ECMO OR TRACH W MV >96 HRS OR PDX EXC FACE, MOUTH & NECK W MAJ O.R.(14) ALLOGENEIC BONE MARROW TRANSPLANT(470) MAJOR JOINT REPLACEMENT OR REATTACHMENT OF LOWER EXTREMITY W/O MCC(853) INFECTIOUS & PARASITIC DISEASES W O.R. PROCEDURE W MCC(326) STOMACH, ESOPHAGEAL & DUODENAL PROC W MCC(928) FULL THICKNESS BURN W SKIN GRAFT OR INHAL INJ W CC/MCC(709) PENIS PROCEDURES W CC/MCC
27191911101010
876
51178
9292644949363130
15.2%10.7%10.7%
6.2%5.6%5.6%5.6%4.5%3.9%3.4%
28.7%100.0%
7.6%7.6%5.3%4.1%4.1%3.0%2.6%2.5%
(20) INTRACRANIAL VASCULAR PROCEDURES W PDX HEMORRHAGE W MCC(573) SKIN GRAFT FOR SKIN ULCER OR CELLULITIS W MCCOtherTotal
3028
7071,208
2.5%2.3%
58.5%100.0%
Note: Enrollees enrolled in a market and received care at a facility outside of their market
93

Mental Health BDOC – FY15-18Demand
Source: 1. VSSC Trea�ng Specialty Cube 2. Geocoded Enrollee File FY18Q4 4.4.V19.SaltLakeCity#IMG
VA Market Area Health Systems Op�miza�on
VISN 19: Salt Lake City Market
FY15-18 Average Mental Health Days of Care by County
94

Mental Health BDOC – FY15-18, cont.County FY18 BDOC FY15-18 AVG BDOC Majority Receiving Facility % BDOC Id
Bannock, IDBear Lake, IDBingham, IDBonneville, IDCaribou, IDFremont, IDJefferson, IDMadison, IDOneida, IDPower, IDTeton, IDElko, NVWhite Pine, NVBeaver, UTBox Elder, UTCache, UTCarbon, UTDavis, UTDuchesne, UTEmery, UT
12332
259N/AN/A
18391612
N/A69
N/AN/A
738138
4475382
1341
10173
727
2420
34
8250
615533
4342622
(V19) (660) Salt Lake City(V21) (570) Fresno(V20) (531) Boise(V22) (691) West Los Angeles(V19) (660) Salt Lake City(V20) (668) Spokane-Washington(V19) (660) Salt Lake City(V19) (660) Salt Lake City(V19) (660) Salt Lake City(V19) (660) Salt Lake City(V19) (660) Salt Lake City(V19) (660) Salt Lake City(V19) (660) Salt Lake City(V08) (573) Gainesville(V19) (660) Salt Lake City(V19) (660) Salt Lake City(V19) (660) Salt Lake City(V19) (660) Salt Lake City(V19) (660) Salt Lake City(V07) (679) Tuscaloosa-Alabama
82.9%100.0%100.0%
61.4%N/AN/A
100.0%87.2%
100.0%100.0%
N/A89.9%
N/AN/A
79.5%93.8%
100.0%88.8%
100.0%100.0%
……………………………………………………
Demand
Source: 1. VSSC Trea�ng Specialty Cube 2. Geocoded Enrollee File FY18Q4 4.4.V19.SaltLakeCity
VA Market Area Health Systems Op�miza�on
VISN 19: Salt Lake City Market
95
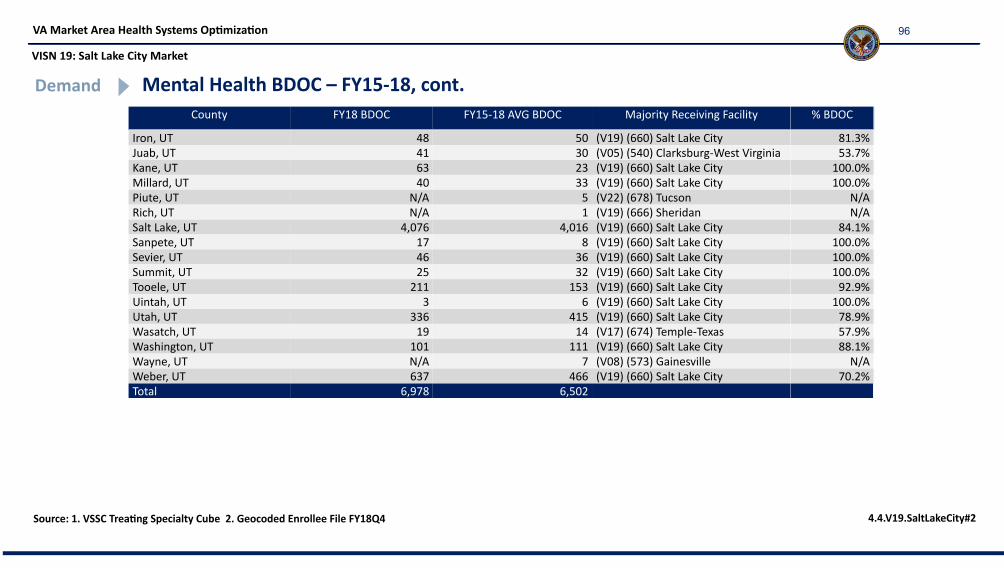
Mental Health BDOC – FY15-18, cont.County FY18 BDOC FY15-18 AVG BDOC Majority Receiving Facility % BDOC Id
Iron, UTJuab, UTKane, UTMillard, UTPiute, UTRich, UTSalt Lake, UTSanpete, UTSevier, UTSummit, UTTooele, UTUintah, UTUtah, UTWasatch, UTWashington, UTWayne, UTWeber, UTTotal
48416340
N/AN/A
4,076174625
2113
33619
101N/A637
6,978
50302333
51
4,0168
3632
1536
41514
1117
4666,502
(V19) (660) Salt Lake City(V05) (540) Clarksburg-West Virginia(V19) (660) Salt Lake City(V19) (660) Salt Lake City(V22) (678) Tucson(V19) (666) Sheridan(V19) (660) Salt Lake City(V19) (660) Salt Lake City(V19) (660) Salt Lake City(V19) (660) Salt Lake City(V19) (660) Salt Lake City(V19) (660) Salt Lake City(V19) (660) Salt Lake City(V17) (674) Temple-Texas(V19) (660) Salt Lake City(V08) (573) Gainesville(V19) (660) Salt Lake City
81.3%53.7%
100.0%100.0%
N/AN/A
84.1%100.0%100.0%100.0%
92.9%100.0%
78.9%57.9%88.1%
N/A70.2%
N/A
………………………………………………
Demand
Source: 1. VSSC Trea�ng Specialty Cube 2. Geocoded Enrollee File FY18Q4 4.4.V19.SaltLakeCity#2
VA Market Area Health Systems Op�miza�on
VISN 19: Salt Lake City Market
96

Demand
Source: VSSC Trea�ng Specialty Cube 4.5.V19.SaltLakeCity
VA Market Area Health Systems Op�miza�on
VISN 19: Salt Lake City Market
Top DRGs for Mental Health in FY184_8 DRG In Market
BDOCIn Market BDOC
% of TotalIn and Out ofMarket BDOC
In and Out of Market% of Total BDOC
(V19) (660) Salt Lake City N (885) PsychosesN (882) Neuroses except depressiveN (881) Depressive neurosesO (884) Organic Disturbances & Mental Retarda�onO (880) Acute Adjustment Reac�on & Psychosocial Dysfunc�onO (883) Disorders Of Personality & Impulse ControlTotal
2232597282153139
373440
64.9%17.4%
8.2%4.4%4.0%1.1%
100.0%
2807760445161139
374349
64.5%17.5%10.2%
3.7%3.2%0.9%
100.0%
4_8 DRG In MarketBDOC
In Market BDOC% of Total
In and Out ofMarket BDOC
In and Out of Market% of Total BDOC
(V19) (660) Salt Lake City N (885) PsychosesN (882) Neuroses except depressiveN (881) Depressive neurosesO (884) Organic Disturbances & Mental Retarda�onO (880) Acute Adjustment Reac�on & Psychosocial Dysfunc�onO (883) Disorders Of Personality & Impulse ControlTotal
2232597282153139
373440
64.9%17.4%
8.2%4.4%4.0%1.1%
100.0%
2807760445161139
374349
64.5%17.5%10.2%
3.7%3.2%0.9%
100.0%
97

Demand
Source: 1. VSSC Treating Specialty Cube 2. VHA Office of Community Care 4.15.V19.SaltLakeCity
VA Market Area Health Systems Op�miza�on
VISN 19: Salt Lake City Market
Top Mental Health DRGs in the Community and Outside of the Market. DRG FY18 BDOC % of Total BDOC
VA Care Outside of the Market
Care in the Community
(885) PSYCHOSES(884) ORGANIC DISTURBANCES & INTELLECTUAL DISABILITY(881) DEPRESSIVE NEUROSES(882) NEUROSES EXCEPT DEPRESSIVE(880) ACUTE ADJUSTMENT REACTION & PSYCHOSOCIAL DYSFUNCTION(883) DISORDERS OF PERSONALITY & IMPULSE CONTROL(886) BEHAVIORAL & DEVELOPMENTAL DISORDERSTotal(885) PSYCHOSES(881) DEPRESSIVE NEUROSES(882) NEUROSES EXCEPT DEPRESSIVE(880) ACUTE ADJUSTMENT REACTION & PSYCHOSOCIAL DYSFUNCTIONTotal
599209
9484633220
1,101310
1076
333
54.4%19.0%
8.5%7.6%5.7%2.9%1.8%
100.0%93.1%
3.0%2.1%1.8%
100.0%
. DRG FY18 BDOC % of Total BDOC
VA Care Outside of the Market
Care in the Community
(885) PSYCHOSES(884) ORGANIC DISTURBANCES & INTELLECTUAL DISABILITY(881) DEPRESSIVE NEUROSES(882) NEUROSES EXCEPT DEPRESSIVE(880) ACUTE ADJUSTMENT REACTION & PSYCHOSOCIAL DYSFUNCTION(883) DISORDERS OF PERSONALITY & IMPULSE CONTROL(886) BEHAVIORAL & DEVELOPMENTAL DISORDERSTotal(885) PSYCHOSES(881) DEPRESSIVE NEUROSES(882) NEUROSES EXCEPT DEPRESSIVE(880) ACUTE ADJUSTMENT REACTION & PSYCHOSOCIAL DYSFUNCTIONTotal
599209
9484633220
1,101310
1076
333
54.4%19.0%
8.5%7.6%5.7%2.9%1.8%
100.0%93.1%
3.0%2.1%1.8%
100.0%
*Enrollees enrolled in a market and received care at a facility outside of their market
98

Demand
Source: 1. Office of Community Care 4.17.V19.SaltLakeCity.660
VA Market Area Health Systems Op�miza�on
VISN 19: Salt Lake City Market – Salt Lake City
Community Care (Inpa�ent)FY16-18 Medicine NVCC (ADC) FY16-18 Surgery NVCC (ADC) FY16-18 Psych NVCC (ADC)
Vendor FY16 FY17 FY18
UNIV OF UT HOSP & CLSINTERMOUNTAIN HLTH CARE INC*POCATELLO HOSP LLCEASTERN IDAHO HLTH SVCSDAVIS HOSP & MED*UNIVERSITY OF UTAH HEALTHJORDAN VALLEY MED CTR LPMADISON MEMORIAL HOSPPIONEER VALLEY HOSPITAL ATIMPANOGOS REG HOSPAll Other VendorsCommunity Total (ADC)
2.50.60.10.10.0
N/AN/A0.0
N/AN/A0.13.5
2.60.70.20.10.00.00.0
N/A0.10.00.23.9
2.80.80.10.10.00.00.00.00.00.00.03.9
Vendor FY16 FY17 FY18
INTERMOUNTAIN HLTH CARE INC*UNIV OF UT HOSP & CLSPOCATELLO HOSP LLCEASTERN IDAHO HLTH SVCSCOLUMBIA OGDEN MC*CRMOUNTAIN VIEW HOSP INCDAVIS HOSP & MED*UINTAH BASIN MED CTRCASTLEVIEW HOSP LLCPHC-ELKO INC*All Other VendorsCommunity Total (ADC)
1.11.00.60.10.20.10.00.00.00.11.64.8
1.70.70.40.20.10.00.10.00.00.00.43.7
1.40.90.40.20.10.10.10.00.00.00.23.4
Vendor FY16 FY17 FY18 .
INTERMOUNTAIN HLTH CARE INC*UNIV OF UT HOSP & CLSSALT LAKE REGL MED CTR*SALT LAKE REGL MED PSYCH*COLUMBIA OGDEN MC*CRPOCATELLO HOSP LLCLAKEVIEW HOSP PSYCHMOUNTAIN VIEW HOSP INCPIONEER VALLEY HOSPITAL AEASTERN IDAHO HLTH SVCSAll Other VendorsCommunity Total (ADC)
N/AN/A0.1
N/AN/AN/A0.10.0
N/A0.01.31.4
0.1N/A0.1
N/AN/A0.0
N/A0.10.00.00.40.7
0.30.30.20.00.00.00.00.00.00.00.00.9
123456789101112
99

NVCC FY16-18 – Inpa�ent BDOCDemand
Source: VHA Office of Community Care 4.12.V19.SaltLakeCity
VA Market Area Health Systems Op�miza�on
VISN 19: Salt Lake City Market
Medicine Mental HealthSurgerySector/ County Name
Sector County Name 2017 Enrollees FY16 FY17 FY18 FY16 FY17 FY18 FY16 FY17 FY18
19-f-9-A19-f-9-A19-f-9-B19-f-9-B19-f-9-B19-f-9-B19-f-9-B19-f-9-B19-f-9-B19-f-9-B19-f-9-B19-f-9-B19-f-9-B19-f-9-B19-f-9-B19-f-9-B19-f-9-B19-f-9-B19-f-9-B19-f-9-B
Salt Lake, UTSector SubtotalBeaver, UTBox Elder, UTCache, UTCarbon, UTDuchesne, UTElko, NVEmery, UTGarfield, UTIron, UTJuab, UTKane, UTMillard, UTMorgan, UTPiute, UTRich, UTSanpete, UTSevier, UTSummit, UT
20,61820,618
1441,0351,492
552483
1,406206160
1,285220251248231
4736
633531566
406406N/A
823132314
N/AN/A
284422
N/AN/A
2975
280280
42
46161327
N/AN/A
263
128
N/A2
N/A53
N/A
301301
13
30331025
N/AN/A
48N/A
346
N/A34
19N/A
379379
3N/A
213
518501216
3N/AN/A
7N/AN/A
917
2
403403N/A
1914
8N/A
242
N/A28
N/AN/AN/AN/AN/AN/A
618
9
353353
215305846
517
N/A18
N/AN/AN/A
2N/AN/A
132320
429429
7N/AN/A
4N/AN/AN/AN/AN/AN/AN/A
1N/AN/AN/A
17N/AN/A
144144N/AN/A
2N/AN/AN/AN/AN/A
2N/AN/AN/AN/AN/AN/AN/A
12N/A
141141N/AN/A
22N/AN/AN/AN/AN/A
14N/AN/AN/AN/AN/AN/AN/AN/AN/A
19-f-9-B19-f-9-B19-f-9-B19-f-9-B19-f-9-B19-f-9-B
Tooele, UTUintah, UTUtah, UTWasatch, UTWashington, UTWayne, UT
1,778684
6,409355
4,34956
22N/A199N/A124N/A
610
1177
250N/A
198
99N/A214N/A
74
82N/A
93N/A
3118510
1843
54
1106
70N/A
5N/A
583
N/A
6N/A
11N/A
13N/A
N/AN/A
70N/A
24N/A
100

NVCC FY16-18 – Inpa�ent BDOC, cont.Demand
Source: VHA Office of Community Care 4.12.V19.SaltLakeCity#2
VA Market Area Health Systems Op�miza�on
VISN 19: Salt Lake City Market
Medicine Mental HealthSurgerySector/ County Name
Sector County Name 2017 Enrollees FY16 FY17 FY18 FY16 FY17 FY18 FY16 FY17 FY18
19-f-9-B19-f-9-B19-f-9-D19-f-9-D19-f-9-D19-f-9-E19-f-9-E19-f-9-E19-f-9-E19-f-9-E19-f-9-E19-f-9-E19-f-9-E19-f-9-E19-f-9-E19-f-9-E19-f-9-E19-f-9-EMarket Total
White Pine, NVSector SubtotalDavis, UTWeber, UTSector SubtotalBannock, IDBear Lake, IDBingham, IDBonneville, IDCaribou, IDFranklin, IDFremont, IDJefferson, IDMadison, IDOneida, IDPower, IDTeton, IDSector SubtotalMarket Total
41923,576
7,7586,653
14,4112,714
1641,1002,589
185241347586352156137134
8,70567,310
12519121258379176N/A
215811
N/A24
N/A76
N/A285
1,589
4561
78190268
825
2097
N/A738442
N/A232
1,341
6535
51209260124N/A
1498
N/A2
N/A93
N/A25
2571,353
N/A343
4775
12240
N/AN/A
332
N/A679
N/A4
N/A101945
N/A424
7068
13894
52030
N/A18
N/A32
82
N/A200
1,165
6450
99145244
4616
344
27
N/A26
N/AN/A
17N/A161
1,208
N/A50261642
5N/AN/AN/AN/AN/AN/AN/A
2N/A
8N/A
15536
N/A46
04949
N/AN/AN/A
8N/AN/AN/AN/AN/AN/AN/AN/A
8247
N/A130
04343
N/AN/AN/A
14N/AN/A
5N/AN/AN/AN/AN/A
19333
101

Demand
Source: VHA Office of Community Care 4.16.V19.SaltLakeCity
VA Market Area Health Systems Op�miza�on
VISN 19: Salt Lake City Market
NVCC FY16-18 – Inpa�ent U�liza�on Pa�ernsFY16-18 Med/Surg Bed Days of Care FY16-18 Mental Health Bed Days of Care
102

Nursing Home BDOC Distribu�onDemand
4.7.V19.SaltLakeCity#IMG
Note: Data is only for fee basis and does not encompass all Community Care
VA Market Area Health Systems Op�miza�on
VISN 19: Salt Lake City Market
Source: 1. VSSC Trea�ng Specialty Cube 2. VSSC NVCC Cube 3. Defini�ve HC
FY15-18 Average BDOC by County
103

County FY18 Non-VA Community Care* FY18 VA FY18 Total BDOC Id
Bannock, IDBear Lake, IDBingham, IDBonneville, IDCaribou, IDClark, IDFranklin, IDFremont, IDJefferson, IDMadison, IDOneida, IDPower, IDTeton, IDElko, NVWhite Pine, NVBeaver, UTBox Elder, UTCache, UTCarbon, UTDagge�, UT
139
2
24
29509
1,50527
99
983
39432
159
23802
98300000
240
29903
320
1,50542
90
23442345234623472348234923502351235223532354235523562357235823592360236123622363
Demand
Source: 1. VSSC Trea�ng Specialty Cube 2. VSSC NVCC Cube 3. Defini�ve HC 4.7.V19.SaltLakeCity
*Data is only for fee basis and does not encompass all Community Care
VA Market Area Health Systems Op�miza�on
VISN 19: Salt Lake City Market
Nursing Home BDOC Distribu�on, cont.
104

County FY18 Non-VA Community Care* FY18 VA FY18 Total BDOC Id
Davis, UTDuchesne, UTEmery, UTGarfield, UTIron, UTJuab, UTKane, UTMillard, UTMorgan, UTPiute, UTRich, UTSalt Lake, UTSanpete, UTSevier, UTSummit, UTTooele, UTUintah, UTUtah, UTWasatch, UTWashington, UT
1,561104
13278
2941255
20,589106112
859424
2,16112
320
9
264
38
1,561104
0132
78294
2155
000
20,853106112
859424
2,16112
358
23642365236623672368236923702371237223732374237523762377237823792380238123822383
Demand
Source: 1. VSSC Trea�ng Specialty Cube 2. VSSC NVCC Cube 3. Defini�ve HC 4.7.V19.SaltLakeCity#2
*Data is only for fee basis and does not encompass all Community Care
VA Market Area Health Systems Op�miza�on
VISN 19: Salt Lake City Market
Nursing Home BDOC Distribu�on, cont.
105

County FY18 Non-VA Community Care* FY18 VA FY18 Total BDOC Id
Wayne, UTWeber, UTTotal
1,94829,922
23984
01,971
30,906
238423852386
Demand
Source: 1. VSSC Trea�ng Specialty Cube 2. VSSC NVCC Cube 3. Defini�ve HC 4.7.V19.SaltLakeCity#3
*Data is only for fee basis and does not encompass all Community Care
VA Market Area Health Systems Op�miza�on
VISN 19: Salt Lake City Market
Nursing Home BDOC Distribu�on, cont.
106

FY10-18 Long Stay BDOC vs. Short Stay BDOC
0
200
400
600
800
Bed
Days
of C
are
FY10 FY11 FY12 FY13 FY14 FY15 FY16 FY17 FY18
24993
607
0
286
160
0
386
0
599891924
186
285 298
490541
384
Long Short
FY10-18 Long Stay BDOC vs. Short Stay BDOC
Stay Age FY10 FY11 FY12 FY13 FY14 FY15 FY16 FY17 FY18 % Change s
Long < 40 0 0 76 0 0 0 0 0 0 0.0%55-64 64 0 0 160 0 77 0 0 16 -75.0%65-79 185 242 237 0 0 0 0 0 0 -100.0%80+ 0 365 0 0 0 209 0 0 0 0.0%
Total Long 249 607 386 160 0 286 0 0 93 -62.7%Short < 40 0 5 0 0 0 0 0 0 0 0.0%
40-54 22 93 82 70 102 0 0 96 17 -22.7%55-64 441 55 126 253 20 11 2 273 495 12.2%65-79 133 388 157 29 136 150 149 518 268 101.5%80+ 3 0 30 32 27 124 35 37 90 2900.0%
Total Short 599 541 490 384 285 298 186 924 891 48.7%
11112333334
Demand
Source: VSSC Trea�ng Specialty Cube 4.8.V19.SaltLakeCity
VA Market Area Health Systems Op�miza�on
VISN 19: Salt Lake City Market
In-House LTSS Short Stays vs. Long Stays BDOC
107

Facility Opera�ng Beds Reported in the PTF Cube Opera�ng Beds Reported by the Field FY18 ADC NVCC, FY18 ADC**
(V19) (660) Salt Lake CityTotal
N/AN/A
N/AN/A
N/AN/A
86.486.4
Demand
Source: 1. VSSC Beds Using PTF Cube 2. VSSC NVCC Cube 3. Defini�ve Healthcare 4.9.V19.SaltLakeCity
VA Market Area Health Systems Op�miza�on
VISN 19: Salt Lake City Market
Community Nursing Home vs. In-House BDOC
Facility Opera�ng Beds FY18 ADC Occupancy Poten�al Available Beds* Id
(V19) (660) Salt Lake City 14,689 10,779.0 73.6% 3,176 …
*Poten�al Available Beds is defined as Opera�ng Beds less ADC based on a 95% occupancy
**Data is only for fee basis and does not encompass all Community Care
***SNFs within a 30 minute drive �me of facility. Does not include SNFs in which the ADC overly exceeded opera�ng beds (>30%) as it indicates a coding issue
VA (In-House)
Community Sta�s�cs***
108

Residen�al Rehab BDOCDemand
4.10.V19.SaltLakeCity#IMG
VA Market Area Health Systems Op�miza�on
VISN 19: Salt Lake City Market
FY15-18 Average Residen�al Rehabilita�on Days by County
Source: VSSC Trea�ng Specialty Cube; Substance Abuse and Mental Health Services Administra�on (SAMHSA) (2018)
109

Top 10 Market Coun�es FY15 BDOC FY16 BDOC FY17 BDOC FY18 BDOC
Salt Lake, UTDavis, UTWeber, UTBonneville, IDUintah, UTBannock, IDTooele, UTWashington, UTUtah, UTElko, NV
9,7311,3081,292
17057
414218274
1,098133
3,592540729145
0231174381260254
3,382298765469
57462
83272522
65
3,535621440381284256255225222194
Care Received in a VAMC/VA Facility(not limited to VA Facili�es in the market)
Demand
Source: VSSC Trea�ng Specialty Cube; Substance Abuse and Mental Health Services Administra�on (SAMHSA) (2018) 4.10.V19.SaltLakeCity
VA Market Area Health Systems Op�miza�on
VISN 19: Salt Lake City Market
Residen�al Rehab BDOC, cont.
110

Demand
Source: VSSC OR Produc�vity Cube 4.11.V19.SaltLakeCity.660
VA Market Area Health Systems Op�miza�on
VISN 19: Salt Lake City Market – Salt Lake City
Facility Se�ng Specialty FY15 FY16 FY17 FY18 FY15-18 % Chg
(V19) (660) Salt Lake City Inpa�ent
Outpa�ent
ANESTHESIOLOGYCARDIAC SURGERYEAR, NOSE, THROAT (ENT)GENERAL SURGERYNEUROSURGERYOB/GYNOPHTHALMOLOGYORAL SURGERYORTHOPEDICSPERIPHERAL VASCULARPLASTIC SURGERYPODIATRYTHORACIC SURGERYUROLOGYInpa�ent TotalANESTHESIOLOGYCARDIAC SURGERYEAR, NOSE, THROAT (ENT)GENERAL SURGERYNEUROSURGERY
16259
19688
811
374109
304722
2301,228
14
203343
35
27826
12181
371
313110
153616
106915
512
184331
58
N/A49178976
N/A33
210130
15341884
72816
9222354
31
N/A6114
11654
N/AN/A
3214144
17372477
7613120
223346
52
-100.0%-1.6%
-76.3%-40.8%-38.6%
-100.0%-100.0%200.0%-42.8%32.1%
-43.3%-21.3%
9.1%-66.5%-38.0%
3000.0%400.0%
9.9%0.9%
48.6%OB/GYNOPHTHALMOLOGY
15947
11775
10666
7795
-53.3%-16.1%
Surgical Cases FY15-18 – Salt Lake City
111

Demand
Source: VSSC OR Produc�vity Cube 4.11.V19.SaltLakeCity.660#2
VA Market Area Health Systems Op�miza�on
VISN 19: Salt Lake City Market – Salt Lake City
Facility Se�ng Specialty FY15 FY16 FY17 FY18 FY15-18 % Chg
(V19) (660) Salt Lake City Outpa�ent ORAL SURGERYORTHOPEDICSPERIPHERAL VASCULARPLASTIC SURGERYPODIATRYTHORACIC SURGERYUROLOGYOutpa�ent Total
2361
96165143
3350
2,6683,896
1367171114157
10386
2,5823,497
2386
93136102
6353
2,3863,114
1409160125137
19562
2,8873,648
-50.0%13.3%66.7%
-24.2%-4.2%
533.3%60.6%
8.2%-6.4%
Facility Se�ng Specialty FY15 FY16 FY17 FY18 FY15-18 % Chg
(V19) (660) Salt Lake City
Facility Total
Outpa�ent ORAL SURGERYORTHOPEDICSPERIPHERAL VASCULARPLASTIC SURGERYPODIATRYTHORACIC SURGERYUROLOGYOutpa�ent Total
2361
96165143
3350
2,6683,896
1367171114157
10386
2,5823,497
2386
93136102
6353
2,3863,114
1409160125137
19562
2,8873,648
-50.0%13.3%66.7%
-24.2%-4.2%
533.3%60.6%
8.2%-6.4%
Surgical Cases FY15-18 – Salt Lake City, cont.
112

Demand Es�mated Future Market Demand — Inpa�ent
113

FY22 FY27
Citc Vw_ph2_5_1_1 Total Bed FY17 Vw_ph2_5_1_1 Total Bed FY22 Vw_ph2_5_1_1 Total Bed FY27
Total Bed Need* 114 120 115
Citc Vw_ph2_5_1_1 Total ADC FY17 Vw_ph2_5_1_1 Total ADC FY22 Vw_ph2_5_1_1 Total ADC FY27
Total ADC 97.0 102.3 97.4
0
5,000
10,000
15,000
20,000
Tota
l BDO
C (In
-Hou
se +
Com
mun
ity)
Med Surg Psych
2017 2022 2027
BY17 Market U�liza�on Projec�ons (Acute Inpa�ent) — Salt Lake City Market
Citc
Med Surg Psych Med Surg Psych Med Surg Psych
In-House BDOCCommunity BDOC
Total BDOCADC By HSPG
11,8113,037
14,84841.0
5,2802,0967,376
20.2
6,6826,498
13,18036.0
12,5863,257
15,84343.0
5,7102,3258,035
22.0
6,7886,661
13,45037.0
12,3033,195
15,49842.0
5,4442,2077,651
21.0
6,1906,218
12,40834.0
Demand
Source: BY17 EHCPM U�liza�on Projec�ons 5.1.V19.SaltLakeCity
VA Market Area Health Systems Op�miza�on
VISN 19: Salt Lake City Market
8.9%
Note: Percent changes are for 5 and 10 years
3.7% -5.9%2.0%6.7% 4.4%
BY17 VISN 19 Salt Lake City Market U�liza�on Projec�ons BDOC
FY17
*Total Bed Need is based on a 85% occupancy rate
114

0
10,000
20,000
30,000
40,000
50,000
Tota
l BDO
C (In
-Hou
se +
Com
mun
ity)
Blind Rehab LTSS Res. Rehab SCI
2017 2022 2027
*Total Bed Need is based on a 95% occupancy for LTSS and 85% occupancy for blind rehab, residen�al rehab, and SCI
BY17 Market U�liza�on Projec�ons (Other Inpa�ent) — Salt Lake City MarketDemand
Source: BY17 EHCPM U�liza�on Projec�ons 5.2.V19.SaltLakeCity
VA Market Area Health Systems Op�miza�on
VISN 19: Salt Lake City Market
FY17 FY22 FY27
Note: Percent changes are for 5 and 10 years
18.8% 30.1%
Citc Total Bed FY17 Total Bed FY22 Total Bed FY27
Total Bed Need* 111 145 167
Citc Vw_ph2_5_2_1 Total ADC FY17 Vw_ph2_5_2_1 Total ADC FY22 Vw_ph2_5_2_1 Total ADC FY27
Total ADC 103.0 135.5 156.7
Citc
BlindRehab
LTSS ResRehab
SCI BlindRehab
LTSS ResRehab
SCI BlindRehab
LTSS ResRehab
SCI
ADC By HSPGTotal BDOC
Community BDOCIn-House BDOC
1.3479
0479
81.129,61628,860
756
19.37,035
07,035
1.3482
0482
1.6569
0569
110.440,28839,697
591
22.28,108
08,108
1.3484
0484
1.7623
0623
133.048,52747,932
595
20.77,573
07,573
1.3457
0457
36.0% 15.3% 0.4% -5.2%7.6%63.9%
BY17 VISN 19 Salt Lake City Market U�liza�on Projec�ons BDOC
115

Demand
Source: BY17 EHCPM U�liza�on Projec�ons 5.3.V19.SaltLakeCity.660
VA Market Area Health Systems Op�miza�on
VISN 19: Salt Lake City Market — Salt Lake City
BY17 Parent Facility U�liza�on Projec�ons (Acute Inpa�ent) — Salt Lake City VAMC
116

0
10,000
20,000
30,000
40,000
50,000
Tota
l BDO
C (In
-Hou
se +
Com
mun
ity)
Blind Rehab LTSS Res. Rehab SCI
2017 2022 2027
*Total bed need is based on a 95% occupancy for LTSS and 85% occupancy for Blind rehab, residen�al rehab, and SCI
BY17 Parent Facility U�liza�on Projec�ons (Other Inpa�ent) — Salt Lake City VAMCDemand
Source: BY17 EHCPM U�liza�on Projec�ons 5.4.V19.SaltLakeCity.660
VA Market Area Health Systems Op�miza�on
VISN 19: Salt Lake City Market — Salt Lake City
Note: Percent changes are for 5 and 10 years
Measure Vw_ph2_5_4_1 Total Beds Needed FY17 Vw_ph2_5_4_1 Total Bed Needed FY22 Vw_ph2_5_4_1 Total Beds Needed FY27
Total Bed Need* 98 129 151
Measure Vw_ph2_5_4_1 Total ADC FY17 Vw_ph2_5_4_1 Total ADC FY22 Vw_ph2_5_4_1 Total ADC FY27
Total ADC 91.1 120.9 142.2
Measure BlindRehab
LTSS ResRehab
SCI BlindRehab
LTSS ResRehab
SCI BlindRehab
LTSS ResRehab
SCI .
In-House BDOCCommunity BDOC
Total BDOCADC By HSPG
N/AN/AN/AN/A
N/A28,45928,459
78.0
4,792N/A
4,79213.1
N/AN/AN/AN/A
N/AN/AN/AN/A
N/A39,23039,230
107.5
4,884N/A
4,88413.4
N/AN/AN/AN/A
N/AN/AN/AN/A
N/A47,35947,359
129.7
4,551N/A
4,55112.5
N/AN/AN/AN/A
1234
37.8% 1.9% -5.0%66.4%
BY17 Salt Lake City VAMC U�liza�on Projec�ons BDOC
FY17 FY22 FY27
117

Growth Projec�ons (#,%)Total Inpa�ent Bed Days of Care (BDOC)
• Overview:
ü Commercial market inpa�ent demand
es�mates were developed to understand
current and future expected inpa�ent
demand trends for non-Veteran
popula�ons
ü Demand es�mates are based on non-
Veteran pa�ent origin within a 60
minute drive �me from parent VA
Medical Center/ Health Care Center
noted
Clinical Service Line 2018 2023 2028 5 Year Chg 5 Year % Chg 10 Year Chg 10 Year % Chg DisplayOrder
General MedicineNephrologyRheumatologyNeurologyGastroenterologyOncology MedicalPulmonaryDermatologyHematologyCardiologyHIVEndocrineMedicine Sub-TotalOrthopedicsNeurosurgeryOpen HeartVascular SurgeryGeneral SurgeryOphthalmologyThoracic Surgery
58,29214,022
1,39534,86627,58811,00436,769
4,1423,300
33,3972
9,132233,909
64,1168,660
10,7783,192
57,640410
15,500
72,76916,149
1,43239,34828,84311,49037,001
4,2423,296
33,2721
8,246256,089
62,8759,060
11,2983,247
60,995400
15,699
88,26218,346
1,43844,15931,06012,15137,028
4,5533,305
32,8851
8,196281,384
60,2609,509
11,9973,327
66,769398
15,987
14,4772,127
374,4821,255
486232100
-4-125
-1-886
22,180-1,241
400520
553,355
-10199
24.8%15.2%
2.7%12.9%
4.5%4.4%0.6%2.4%
-0.1%-0.4%
-50.0%-9.7%9.5%
-1.9%4.6%4.8%1.7%5.8%
-2.4%1.3%
29,9704,324
439,2933,4721,147
259411
5-512
-1-936
47,475-3,856
8491,219
1359,129
-12487
51.4%30.8%
3.1%26.7%12.6%10.4%
0.7%9.9%0.2%
-1.5%-50.0%-10.2%20.3%-6.0%9.8%
11.3%4.2%
15.8%-2.9%3.1%
123456789
1011121314151617181920
TraumaDen�stryUrologyOtolaryngologySurgery Sub-TotalMedicine/Surgery TotalOB/DeliveryOther OBGynecologyWomen's Health TotalPsych/Drug AbuseMental Health TotalAcute RehabRehab TotalOther TotalGrand Total
5,982433
4,7332,459
173,903407,812
71,6973,1022,817
77,61653,18953,189
1,7091,709
340540,666
6,004408
4,4802,111
176,577432,666
69,6872,8771,982
74,54661,11761,117
1,2441,244
374569,947
6,024379
4,6561,872
181,178462,562
69,7612,8061,637
74,20469,72669,726
933933407
607,832
22-25
-253-348
2,67424,854-2,010
-225-835
-3,0707,9287,928-465-465
3429,281
0.4%-5.8%-5.3%
-14.2%1.5%6.1%
-2.8%-7.3%
-29.6%-4.0%14.9%14.9%
-27.2%-27.2%10.0%
5.4%
42-54-77
-5877,275
54,750-1,936
-296-1,180-3,41216,53716,537
-776-776
6767,166
0.7%-12.5%
-1.6%-23.9%
4.2%13.4%-2.7%-9.5%
-41.9%-4.4%31.1%31.1%
-45.4%-45.4%19.7%12.4%
21222324252627282930313233343536
Demand
VA Market Area Health Systems Op�miza�on
VISN 19: Salt Lake City Market — Salt Lake City
5.5.V19.SaltLakeCity.660Source: IBM Market Expert
Overall Inpa�ent Commercial Demand – Salt Lake City Area
Validation of the data for this slide is not required 118

Supply Es�mated Current Total VA Market Supply
119

0
20
40
60
80
100
120
140
160
Tota
l Pro
ject
ed In
-hou
se a
nd C
ITC
Bed
Nee
d
Med/Surg Sub-Total Mental Health Nursing Home Residen�al Rehab
61
36
81
19
63
34
133
21
83
15
0
30
Veteran Inpa�ent Projected Demand and VA Supply
Supply
• 2017
Source: 1. BY17 EHCPM U�liza�on Projec�ons 2. VSSC Beds Using PTF Cube 6.1.V19.SaltLakeCity
VA Market Area Health Systems Op�miza�on
VISN 19: Salt Lake City Market
Comparing Total Market Veteran Demand vs. VA Medical Center Supply — Inpa�ent Services
2027 — FY18 VAMC Beds•
120

Ambulatory Medical (HSPCs)
0K
20K
40K
60K
80K
RVU
s
Allergy & Immunology*
Cardiology
Chiropracty*
Cri�cal Care/Pulmonary Dise
ase
Dermatology
Emergency Medicine
Endocrinology
Gastroenterology
Hematology-Oncology
Infec�ous Dise
ase
Nephrology
Neurology
Optometry
Pain Medicine
Physical Medicine & Rehabilita
�on
Rheumatology
2017 2027 2017 RVU Capacity (FTE x Produc�vity Target)
Supply
6.2.V19.SaltLakeCity
* Reflects service is not provided in-house or there is no VA set produc�vity target
VA Market Area Health Systems Op�miza�on
VISN 19: Salt Lake City Market
Comparing Total Market Veteran Demand vs. VA Medical Center Supply — Outpa�ent Services — Ambulatory Medical Special�es (HSPCs)
Source: 1. BY17 EHCPM U�liza�on Projec�ons 2. OPES Physician Capacity Reports 3. VSSC Physician Produc�vity Cube 4. VSSC MPCR3 Cube
121

Ambulatory Surgical (HSPCs)
0K
10K
20K
30K
40K
50K
RVU
s
NeurologicalSurgery
Obstetrics &Gynecology
Ophthalmology OrthopaedicSurgery
Otolaryngology Plas�c Surgery Podiatry Surgery Thoracic Surgery Urology Vascular Surgery
2017 2027 2017 RVU Capacity (FTE x Produc�vity Target)
Supply
6.3.V19.SaltLakeCity
* Reflects service is not provided in-house or there is no VA set produc�vity target
VA Market Area Health Systems Op�miza�on
VISN 19: Salt Lake City Market
Comparing Total Market Veteran Demand vs. VA Medical Center Supply — Outpa�ent Services — Ambulatory Surgical Special�es (HSPCs)
Source: 1. BY17 EHCPM U�liza�on Projec�ons 2. OPES Physician Capacity Reports 3. VSSC Physician Produc�vity Cube 4. VSSC MPCR3 Cube
122

Ambulatory Rehab (HSPCs)
0.0M
0.5M
1.0M
1.5M
2.0M
2.5M
3.0M
3.5M
RVU
s
Audiology Blind Rehabilita�on Kinesiotherapy Occupa�onal Therapy Physical Therapy Recrea�on Therapy Speech LanguagePathology
2017 2027 2017 RVU Capacity (FTE x Produc�vity Target)
Supply
6.4.V19.SaltLakeCity
* Reflects service is not provided in-house or there is no VA set produc�vity target
VA Market Area Health Systems Op�miza�on
VISN 19: Salt Lake City Market
Comparing Total Market Veteran Demand vs. VA Medical Center Supply — Outpa�ent Services — Ambulatory Rehab Special�es (HSPCs)
Source: 1. BY17 EHCPM U�liza�on Projec�ons 2. OPES Physician Capacity Reports 3. VSSC Rehab Produc�vity Cube 4. VSSC MPCR3 Cube
123

Physician Efficiency — Salt Lake City VAMCSupply
Source: 1. VSSC SPARQ Report 2. VSSC Physician Produc�vity Cube 3. VSSC MPCR3 Cube 6.5.V19.SaltLakeCity.660
VA Market Area Health Systems Op�miza�on
VISN 19: Salt Lake City Market — Salt Lake City
Id
Specialty SPARQ Quadrant2016
SPARQ Quadrant2017
SPARQ Quadrant2018
2016 MDFTEs
2017 MDFTEs
2018 MDFTEs
2016 APPFTEs
2017 APPFTEs
2018 APPFTEs
37543755375637573758375937603761376237633764376537663767376837693770377137723773
Allergy and ImmunologyAnesthesiaAnesthesiologyCardiologyChiropractyCri�cal Care / Pulmonary DiseaseDermatologyEmergency MedicineEndocrinologyGastroenterologyGeriatric MedicineHematology-OncologyInfec�ous DiseaseInternal MedicineMedical Gene�csNephrologyNeurological SurgeryNeurologyObstetrics & GynecologyOphthalmology
2 - Under ResourcedN/AN/A
4 - Over ResourcedN/A
3 - InefficientN/AN/A
3 - Inefficient4 - Over Resourced
N/A4 - Over Resourced4 - Over Resourced
1 - Op�mized Prac�ceN/A
3 - Inefficient3 - Inefficient3 - Inefficient
4 - Over Resourced3 - Inefficient
N/AN/AN/A
4 - Over ResourcedN/A
3 - Inefficient2 - Under Resourced
N/A2 - Under Resourced
4 - Over ResourcedN/A
4 - Over Resourced4 - Over Resourced
N/AN/A
3 - Inefficient3 - Inefficient3 - Inefficient
4 - Over Resourced4 - Over Resourced
3 - InefficientN/AN/A
4 - Over ResourcedN/A
3 - Inefficient2 - Under Resourced
N/A1 - Op�mized Prac�ce
4 - Over ResourcedN/A
4 - Over Resourced3 - Inefficient
N/AN/A
4 - Over Resourced4 - Over Resourced
3 - Inefficient4 - Over Resourced
3 - Inefficient
0.1N/A9.46.11.83.11.1
N/A1.73.71.82.41.9
18.8N/A1.90.92.21.02.7
0.2N/A10.7
5.22.32.11.2
N/A1.33.20.91.81.5
23.80.11.80.82.40.33.1
0.2N/A11.5
5.02.03.31.3
N/A1.42.80.92.21.5
23.10.81.61.32.30.42.9
0.2N/A18.615.7N/A6.11.76.92.74.9
16.05.00.1
84.7N/A3.25.10.70.10.2
0.0N/A19.913.4N/A8.82.48.33.65.7
17.95.40.0
80.1N/A2.92.70.1
N/A0.3
N/A0.0
21.013.3N/A8.75.07.84.44.9
15.52.80.0
76.1N/A2.93.41.30.00.1
124

Physician Efficiency — Salt Lake City VAMC, cont.Supply
Source: 1. VSSC SPARQ Report 2. VSSC Physician Produc�vity Cube 3. VSSC MPCR3 Cube 6.5.V19.SaltLakeCity.660#2
VA Market Area Health Systems Op�miza�on
VISN 19: Salt Lake City Market — Salt Lake City
Id
Specialty SPARQ Quadrant2016
SPARQ Quadrant2017
SPARQ Quadrant2018
2016 MDFTEs
2017 MDFTEs
2018 MDFTEs
2016 APPFTEs
2017 APPFTEs
2018 APPFTEs
3774377537763777377837793780378137823783378437853786378737883789379037913792
OptometryOrthopaedic SurgeryOtolaryngologyPain MedicinePathologyPhysical Medicine & Rehabilita�onPlas�c SurgeryPodiatryPrimary CarePsychiatryPsychiatry/PsychologyPsychologyRadiologyRheumatologySurgeryThoracic SurgeryUrologyVascular SurgeryTotal
2 - Under Resourced2 - Under Resourced
4 - Over Resourced3 - Inefficient
N/AN/A
4 - Over Resourced1 - Op�mized Prac�ce
4 - Over Resourced3 - Inefficient
N/A3 - Inefficient
N/A1 - Op�mized Prac�ce
N/AN/A
1 - Op�mized Prac�ce4 - Over Resourced
N/A
4 - Over Resourced3 - Inefficient
1 - Op�mized Prac�ce3 - Inefficient
N/A3 - Inefficient3 - Inefficient
1 - Op�mized Prac�ce3 - Inefficient3 - Inefficient
N/A3 - Inefficient
N/A2 - Under Resourced
4 - Over ResourcedN/AN/A
4 - Over ResourcedN/A
4 - Over Resourced3 - Inefficient
4 - Over Resourced3 - Inefficient
N/A4 - Over Resourced4 - Over Resourced
1 - Op�mized Prac�ce3 - Inefficient3 - Inefficient
N/A2 - Under Resourced
N/A3 - Inefficient
4 - Over ResourcedN/A
2 - Under Resourced4 - Over Resourced
N/A
6.23.21.41.51.93.20.92.9
N/A19.0N/A28.2
1.01.53.0
N/A2.91.5
138.8
6.24.11.30.62.83.61.03.1
N/A18.9N/A31.2
0.71.23.4
N/A2.41.5
144.6
6.33.91.50.52.74.01.12.3
N/A21.4N/A31.8
1.11.83.0
N/A2.61.4
149.9
0.68.62.66.80.10.10.00.2
N/AN/A58.7
1.00.60.43.10.04.01.9
260.4
1.18.22.25.00.10.10.20.0
N/AN/A46.0
0.00.50.34.10.04.51.7
245.5
0.26.32.53.90.10.10.00.0
N/AN/A61.5
0.10.30.31.70.03.90.4
248.5
125

Poten�al Physician Addi�onal Capacity — Salt Lake City VAMCSupply
Source: OPES Physician Capacity Reports 6.6.V19.SaltLakeCity.660
Poten�al Addi�onal RVU Capacity = (Produc�vity Standard – Produc�vity), N/A = Data Not Available
VA Market Area Health Systems Op�miza�on
VISN 19: Salt Lake City Market — Salt Lake City
Physician Specialty Poten�al Addi�onal RVU Capacity Id
Allergy and ImmunologyCardiologyChiropractyCri�cal Care / Pulmonary DiseaseDermatologyEndocrinologyGastroenterologyGeriatric MedicineHematology-OncologyInfec�ous DiseaseInternal MedicineNephrologyNeurological SurgeryNeurologyObstetrics & GynecologyOphthalmologyOptometryOrthopaedic SurgeryOtolaryngologyPain Medicine
-3,254
-4,553
--
4,099-
2,791762
-2,6152,8501,344
1034,9993,9113,117
5901,862
36813682368336843685368636873688368936903691369236933694369536963697369836993700
126

Poten�al Physician Addi�onal Capacity — Salt Lake City VAMC, cont.Supply
Source: OPES Physician Capacity Reports 6.6.V19.SaltLakeCity.660#2
Poten�al Addi�onal RVU Capacity = (Produc�vity Standard – Produc�vity), N/A = Data Not Available
VA Market Area Health Systems Op�miza�on
VISN 19: Salt Lake City Market — Salt Lake City
Physician Specialty Poten�al Addi�onal RVU Capacity Id
PathologyPhysical Medicine & Rehabilita�onPlas�c SurgeryPodiatryPsychiatryPsychologyRadiologyRheumatologySurgeryThoracic SurgeryUrologyVascular Surgery
5,816371
2,052-
6,306--
344140
---
370137023703370437053706370737083709371037113712
127

VA Facility Primary Care* Specialty Care Emergency Care Mental Health Total
(V19) (660) Salt Lake City(V19) (660BU) Salt Lake City Domiciliary(V19) (660GA) Pocatello(V19) (660GB) Ogden(V19) (660GE) Orem(V19) (660GG) St. George(V19) (660GJ) Western Salt Lake(V19) (660GK) Elko(V19) (660QA) Idaho Falls
16.10.01.72.40.81.51.40.1
N/A
68.80.00.00.00.00.00.10.00.0
0.00.00.00.00.00.00.00.00.0
48.4N/A0.51.21.01.10.80.00.0
133.3N/A2.33.61.82.62.30.1
N/A
FY18 Salt Lake City VAMC & CBOC Physicians by Outpa�ent Clinical Category
Physicians by Outpa�ent Clinical CategorySupply
Source: VSSC Physician Produc�vity Cube 6.7.V19.SaltLakeCity.660
*Primary Care includes Internal Medicine and Geriatric Medicine; Note: Contract clinics do not have FTEs represented.
VA Market Area Health Systems Op�miza�on
VISN 19: Salt Lake City Market — Salt Lake City
128

Occupa�on FY18 FY19* DisplayOrd…
0028Environmental Protec�on Specialist0060 Chaplain0083 Police0086 Security Clerical and Assistance0089Emergency Management0101 Social Science0102 Social Science Aid and Technician0180 Psychology0185 Social Work0201 Human Resources Management0203 Human Resources Assistance0301 Miscellaneous Administra�on and Program0303 Miscellaneous Clerk and Assistant0305 Mail and File0318 Secretary0326Office Automa�on Clerical And Assistance0340 Program Management & 0344 Management and …0341 Administra�ve Officer0343 Management and Program Analysis0346Logis�cs Management
N/A0.01.01.0
N/A2.00.35.0
24.717.8
1.09.0
30.52.03.0
N/A1.01.08.0
N/A
1.0N/A6.01.01.04.01.58.0
20.713.0
2.024.520.5
2.01.01.01.01.07.01.0
123456789
1011121314151617181920
0382Telephone Opera�ng0503 Financial Clerical and Assistance0525 Accoun�ng Technician0530Cash Processing0601 General Health Science
N/AN/A1.0
N/A16.5
1.01.01.01.0
19.6
2122232425
Vacant Posi�onsSupply
Source: VHA Office of Workforce Management 6.8.V19.SaltLakeCity.660
*FY19 vacant posi�ons as of March 2019
VA Market Area Health Systems Op�miza�on
VISN 19: Salt Lake City Market — Salt Lake City
Salt Lake City VAMC Open FTE Posi�ons
129

Occupa�on FY18 FY19* DisplayOrd…
0602 Medical Officer0603 Physician's Assistant0610 Nurse0620 Prac�cal Nurse0621 Nursing Assistant0622 Medical Supply Aide and Technician0630 Die��an and Nutri�onist0631 Occupa�onal Therapist0633 Physical Therapist0640 Health Aid and Technician0644 Medical Technologist0645 Medical Technician0647 Diagnos�c Radiologic Technologist0649 Medical Instrument Technician0660 Pharmacist0661 Pharmacy Technician0665 Speech Pathology and Audiology0667 Ortho�st and Prosthe�st0668 Podiatrist0669Medical Records Administra�on
23.84.0
62.015.513.8
5.03.00.92.06.07.03.59.06.05.09.0
N/A2.00.3
N/A
23.52.0
72.816.415.0
5.0N/AN/A1.69.4
11.06.58.06.07.25.30.6
N/A0.02.0
2627282930313233343536373839404142434445
0671 Health System Specialist0672 Prosthe�c Representa�ve0675 Medical Records Technician0679 Medical Support Assistance0680 Dental Officer
1.02.0
13.091.3
1.0
N/A1.0
11.060.5N/A
4647484950
Vacant Posi�ons, cont.Supply
Source: VHA Office of Workforce Management 6.8.V19.SaltLakeCity.660#2
*FY19 vacant posi�ons as of March 2019
VA Market Area Health Systems Op�miza�on
VISN 19: Salt Lake City Market — Salt Lake City
Salt Lake City VAMC Open FTE Posi�ons
130

Occupa�on FY18 FY19* DisplayOrd…
0681 Dental Assistant0690Industrial Hygiene0801 General Engineering0858 Biomedical Engineering1035Public Affairs1101General Business And Industry1105 Purchasing1412Technical Informa�on Services1601 General Facili�es and Equipment1702Educa�on And Training Technician1715 Voca�onal Rehabilita�on1720Educa�on Program2003 Supply Program Management2005 Supply Clerical and Technician2010 Inventory Management2102Transporta�on Clerk And Assistant2805 Electrician3566 Custodial Worker4102Pain�ng4607Carpentry
2.0N/A3.01.0
N/AN/A2.0
N/AN/AN/A2.0
N/A1.09.09.0
N/AN/A16.0N/AN/A
4.01.03.0
N/A1.02.0
N/A1.01.01.01.01.0
N/A6.01.03.01.0
27.61.01.0
5152535455565758596061626364656667686970
5048Animal Caretaking5306 Air Condi�oning Equipment Mechanic5703 Motor Vehicle Operator5705Tractor Opera�ng6907 Materials Handler
N/A2.01.0
N/AN/A
1.01.02.01.02.0
7172737475
Vacant Posi�ons, cont.Supply
Source: VHA Office of Workforce Management 6.8.V19.SaltLakeCity.660#3
*FY19 vacant posi�ons as of March 2019
VA Market Area Health Systems Op�miza�on
VISN 19: Salt Lake City Market — Salt Lake City
Salt Lake City VAMC Open FTE Posi�ons
131
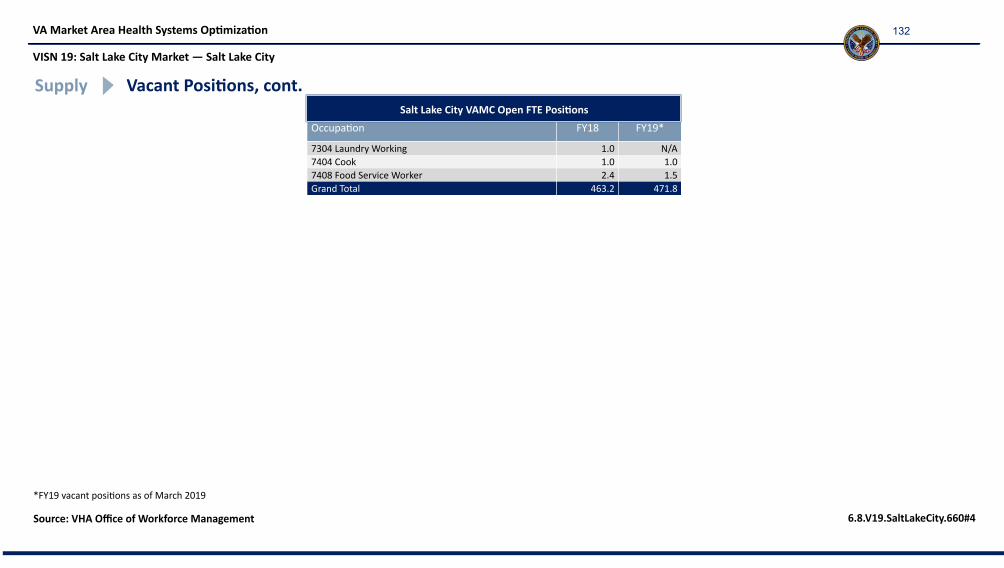
Occupa�on FY18 FY19* DisplayOrd…
7304 Laundry Working7404 Cook7408 Food Service WorkerGrand Total
1.01.02.4
463.2
N/A1.01.5
471.8
76777879
Vacant Posi�ons, cont.Supply
Source: VHA Office of Workforce Management 6.8.V19.SaltLakeCity.660#4
*FY19 vacant posi�ons as of March 2019
VA Market Area Health Systems Op�miza�on
VISN 19: Salt Lake City Market — Salt Lake City
Salt Lake City VAMC Open FTE Posi�ons
132

Supply Es�mated Current Total Community Market Supply
133

Supply
7.1.V19.SaltLakeCity#IMG
VA Market Area Health Systems Op�miza�on
VISN 19: Salt Lake City Market
Exis�ng Federal Facili�es
Source: 1. FQHC – HRSA Data Warehouse 2. IHS – ESRI Meta Data 3. DoD – Federal Prac��oner, 2019 Directory
Federal Facilities
134

Exis�ng Federal Facili�es, cont.Sector Type* Partner Facility Name** Distance From VA POC (x miles, POC Name)
19-f-9-A
19-f-9-A19-f-9-B
19-f-9-B
19-f-9-D19-f-9-D
19-f-9-E
19-f-9-E
FQHC (10)
IHS (1)FQHC (26)
IHS (13)
DOD (1)FQHC (8)
FQHC (12)
IHS (3)
●Copperview Comm Health Center●Vounteers Of America, Utah Women And Childrens Facility●Stephen Ratcliffe Community Hlth Ctr●Indian Walk In Center●Jackpot Community Health Center●Wayne Community Health Center, Inc.●Wendover Community Health Center●Ely Health Sta�on●Newe Medical Clinic●Goshute Health Sta�on●AF-C-75th MEDGRP-HILL●Midtown Chc Davis County Medical Clinic●Midtown Chc - Davis County Dental Clinic●Midtown Community Health Center..●Aberdeen Clinic●Downey Clinic●Upper Valley Community Health Service●Shoshone-Bannock Tribal Health Department●Not-Tsoo Gah-Nee Indian Health Center●NW Band of Shoshone Health & Human Services Administra�on
●17, (V19) (660GJ) Western Salt Lake, UT●11, (V19) (660GJ) Western Salt Lake, UT●10, (V19) (660GJ) Western Salt Lake, UT●4, (V19) (660) Salt Lake City, UT●119, (V19) (660GK) Elko, NV●112, (V19) (660QB) Price, UT●109, (V19) (660GK) Elko, NV●181, (V19) (660GK) Elko, NV●181, (V19) (660GK) Elko, NV●167, (V19) (660GK) Elko, NV●8, (V19) (660QC) Weber County, UT●13, (V19) (660QC) Weber County, UT●9, (V19) (660QC) Weber County, UT●5, (V19) (660GB) Ogden, UT●42, (V19) (660GA) Pocatello, ID●39, (V19) (660GA) Pocatello, ID●38, (V19) (660QA) Idaho Falls, ID●13, (V19) (660GA) Pocatello, ID●12, (V19) (660GA) Pocatello, ID●1, (V19) (660GA) Pocatello, ID
Supply
7.1.V19.SaltLakeCity
VA Market Area Health Systems Op�miza�on
VISN 19: Salt Lake City Market
*FQHC quan�ty in parentheses reflects total number of FQHCs within a sector.
**The three FQHCs listed reflect the three most distant FQHCs from a VA POC.
Source: 1. FQHC – HRSA Data Warehouse 2. IHS – ESRI Meta Data 3. DoD – Federal Prac��oner - 2019 Directory
135

Supply
Source: 1. Defini�ve Healthcare 2. Geocoded Enrollee File FY18Q4 7.2.V19.SaltLakeCity#IMG
VA Market Area Health Systems Op�miza�on
VISN 19: Salt Lake City Market
Market Community Hospital Overview
Note: Map provides context of community hospital density as map scale prevents illustra�on of all hospitals. A Dartmouth Atlas Hospital Service Area (HSA) is a ZIP code-defined geography encompassing the community where the ZIP code’s Medicare residents predominantly receive their hospital care.
Community Hospitals and FY18 Enrollees
136

VAMC Area Hospitals* Total Staffed Beds Total Occupancy**
(660) Salt Lake CityTotal Hospitals in the Market
2963
3,3505,958
50.3%50.0%
Note: The VAMC area is defined as the area within a 60 minute drive �me of VAMC.
*Includes short term acute, cri�cal access, psychiatric, and rehabilita�on hospitals with a CMS Cost Report in FY17 or FY18 (does not include pediatric or DOD hospitals) and can include mul�-campus hospitals repor�ng under a single provider number.
**Occupancy is based on total staffed beds.
Supply
Source: 1. Defini�ve Healthcare 2. Geocoded Enrollee File FY18Q4 7.2.V19.SaltLakeCity
VA Market Area Health Systems Op�miza�on
VISN 19: Salt Lake City Market
Market Community Hospital Overview, cont.Community Hospital Overview
Validation of the data for this slide is not required 137

TopHospitals Beds³ Occupancy⁴ Beds³ Occupancy⁴ Beds³ Occupancy⁴ CMI .
University Hospital, Huntsman Cancer Ins�tute, UU Health Care - UniversityOrthopaedic CenterIntermountain Medical CenterUtah State HospitalUtah Valley HospitalJordan Valley Medical Center, Jordan Valley Medical Center - West ValleyCampusMcKay-Dee HospitalSt Marks HospitalLDS HospitalDavis Hospital and Medical CenterOgden Regional Medical CenterUU Health Care - University Neuropsychiatric Ins�tuteSalt Lake Behavioral HealthTimpanogos Regional HospitalSalt Lake Regional Medical CenterAmerican Fork HospitalOther Hospitals in Area (14)Total
516
484N/A315278
249233204170170N/AN/A117107
91416
3,350
77.0%
62.2%N/A
61.6%27.7%
54.1%55.5%43.3%25.7%45.9%
N/AN/A
34.8%20.8%43.1%33.9%50.3%
24
N/A329
2726
43163925
N/A159118N/A
20N/A167993
61.8%
N/A89.0%73.2%64.1%
87.0%73.8%83.5%49.3%
N/A79.6%52.1%
N/A63.8%
N/A64.4%75.2%
38
24N/A
1710
2014
N/A10
N/AN/AN/AN/A
16N/A124273
88.5%
79.4%N/A
70.8%54.3%
48.5%80.0%
N/A14.2%
N/AN/AN/AN/A
21.6%N/A
34.9%51.0%
2.43
2.26N/A2.061.76
2.061.901.871.681.73N/AN/A1.942.151.581.661.83
1
2345
6789
1011121314151617
Top Hospitals¹᾽²
Supply
Source: 1. CMS Cost Reports 2. IBM Market Expert 7.3.V19.SaltLakeCity.660
VA Market Area Health Systems Op�miza�on
VISN 19: Salt Lake City Market — Salt Lake City
Community Hospital Current and Future Inpa�ent Demand & Supply
Med/Surg/Acute
1. Top hospitals based on number of staffed beds. 2. All beds within acute psychiatric and rehab commercial hospitals were assumed to be psychiatric or rehab beds. 3. Indicates staffed beds 4. Occupancy rate = total Bed Days of Care (BDOC)
divided by staffed opera�ng beds. 5. Applied growth rate and assumes actual beds remains the same. 6. BDOC and Projec�on Rate from IBM Market Expert
* Includes acute rehabilita�on
Mental Health Rehab CMI
Validation of the data for this slide is not required 138

OccupancyType ADC BDOC Actual Beds 2018 ActualOccupancy
75%OccupancyBed Need
80%OccupancyBed Need
Projec�onRate
ADC BDOC Actual Beds 2028Projected
Occupancy
75%OccupancyBed Need
80%OccupancyBed Need
.
Medicine/Surgical*Medicine/Surgical* Conceptual Excess
Mental HealthMental Health Conceptual Excess
1,826
747
666,318
272,553
3,623
993
50.4%
75.2%
2,4341,189
996-3
2,2821,341
93360
13.4%
31.1%
1,989
979
725,901
357,292
3,623
993
54.9%
98.6%
2,652971
1,305-312
2,4861,1371,224-231
1234
1. Top hospitals based on number of staffed beds. 2. All beds within acute psychiatric and rehab commercial hospitals were assumed to be psychiatric or rehab beds. 3. Indicates staffed beds 4. Occupancy rate = total Bed Days of Care (BDOC)
divided by staffed opera ng beds. 5. Applied growth rate and assumes actual beds remains the same. 6. BDOC and Projec on Rate from IBM Market Expert
* Includes acute rehabilita on
2018
Supply
Source: 1. CMS Cost Reports 2. IBM Market Expert 7.4.V19.SaltLakeCity.660
VA Market Area Health Systems Op�miza�on
VISN 19: Salt Lake City Market — Salt Lake City
Community Hospital Current and Future Inpa�ent Demand & Supply, cont.
Es�mated 2028Surplus of beds
Shortage of beds
Future Supply and Demand
Validation of the data for this slide is not required 139

Specialty 2018 FTE Supply 2018 FTE Demand Shortage/Surplus
1. Primary CareGeneral/Family Prac�ceInternal Medicine
2. Specialty Care (Medical)Allergy/ImmunologyCardiologyDermatologyEndocrinologyGastroenterologyHematology/OncologyInfec�ous DiseaseNephrologyNeurologyPulmonologyRheumatology
3. Specialty Care (Surgical)Cardio/Thoracic SurgeryColorectal SurgeryGeneral SurgeryNeurosurgeryOphthalmologyOrthopedic SurgeryOtolaryngologyPlas�c SurgeryUrologyVascular
4. Women's HealthObstetrics/Gynecology
5. Mental HealthPsychiatry
6. RehabPhysical Medicine/Rehab
7. Emergency ServicesEmergency/Cri�cal Care
8. Other ServicesPain Management
767437
25148106
3391843743
1276826
2515
16145
708466
39145
943084
1182343594924
287
12120
59-30
-153
1136
-3415
06818
2
-38
4026
153238
89785920
317
246
96
369
19
89157
61434915
265
320
52
407
17
6380283510
5
53
-74
43
-38
2
2018 FTE Supply and 2018 FTE Demand by Specialty
0
500
FTE
General/Family …
Internal Medicine
Emergency/Cri�cal Care
Obstetric
s/Gynecology
Psychiatry
Orthopedic Surgery
General Surgery
Ophthalmology
Cardiology
Neurology
Dermatology
Physical Medicine/Rehab
Gastroenterology
Otolaryngology
Hematology/Oncology
Plas�c Surgery
PulmonologyUrology
Neurosurgery
Nephrology
Infec�ous Dise
ase
Endocrinology
Rheumatology
Cardio/Thoracic Surgery
Allergy/Immunology
Vascular
Pain Management
Colorectal Surgery
2018 FTE Supply 2018 FTE Demand
Supply
Source: IBM Watson Market ExpertNote: FTE demand based on median produc�vity by specialty
VA Market Area Health Systems Op�miza�on
VISN 19: Salt Lake City Market — Salt Lake City
Community Physician Current Supply & Demand
Provider Surplus/Shortage vs. 2018 FTE Demand*
0%
100%
Surp
lus/
Shor
tage
Neurosurgery
Colorectal Surgery
Neurology
Physical Medicine/Rehab
Plas�c Surgery
Ophthalmology
Infec�ous Dise
ase
Orthopedic Surgery
Otolaryngology
Pulmonology
General Surgery
Vascular
Urology
Obstetric
s/Gynecology
Psychiatry
Hematology/Oncology
Allergy/Immunology
130%
119%
116%
84%
81%
71%
65%
51%
46%
37%
34%
31%
20%
20%
-23%
-29%
-38%
7.5.V19.SaltLakeCity.660
*FTE net percentage of supply for special�es between -15% and 15% are not included given the FTE supply for those special�es are comparable to FTE demand
Validation of the data for this slide is not required 140

Supply
7.6.V19.SaltLakeCity.660
VA Market Area Health Systems Op�miza�on
VISN 19: Salt Lake City Market — Salt Lake City
Known Major Changes in Community Hospitals – Salt Lake City Area
Source: Definitive Healthcare, The Spectrum
141

Access Current Access
142

Facility FY15 FY16 FY17 FY18 FY15 FY16 FY17 FY18 FY15 FY16 FY17 FY18
(V19) (660) Salt Lake City(V19) (660GA) Pocatello(V19) (660GB) Ogden(V19) (660GC) Ely-Nevada(V19) (660GD) Roosevelt(V19) (660GE) Orem(V19) (660GG) St. George(V19) (660GJ) Western Salt Lake(V19) (660GK) Elko(V19) (660QA) Idaho Falls(V19) (660QB) PriceFacility TotalMarket Total
1,725330142N/A
169730
1344
N/AN/A
2,4782,478
1,955291141N/A
7981870
7N/AN/A
2,5872,587
2,591228188N/A
13134
3369
347
3,2703,270
3,682140169N/A
9115
4364
81330
4,2734,273
5,6931,182
8831,036
162710715566
17N/AN/A
10,96410,964
1,3871,258
854835197735620587
8N/AN/A
6,4816,481
1,8211,808
627319125618913701
83615
6,9916,991
1,7761,597
846N/A142457663610
11196104
6,4026,402
13,3382523
N/A4
16375
9213
N/AN/A
13,88613,886
12,1564020
N/A4
43437
842
N/AN/A
12,78612,786
11,4081813
N/A2
281,125
348343
12,95212,952
10,661166
12N/A
722
534504
110
311,92011,920
Same Day Appointment Totals
Access
Source: VSSC Completed Appointments Cube 8.1.V19.SaltLakeCity
N/A: Not Available
VA Market Area Health Systems Op�miza�on
VISN 19: Salt Lake City Market
Same Day Appointments (FY15-18)
Mental Health Primary Care Specialty Care
143

Facility FY15 FY16 FY17 FY18 FY15 FY16 FY17 FY18 FY15 FY16 FY17 FY18
(4V19) (660) Salt Lake City, UT (George E. Wahlen)(4V19) (660GA) Pocatello, ID(4V19) (660GB) Ogden, UT(4V19) (660GC) Ely, NV(4V19) (660GD) Roosevelt, UT(4V19) (660GE) Orem, UT(4V19) (660GG) St. George, UT(4V19) (660GJ) Western Salt Lake, UT(4V19) (660GK) Elko, NV(4V19) (660QA) Idaho Falls, ID(4V19) (660QB) Price, UTNa�onal Average
2.61.63.4
N/A0.94.71.43.20.2
N/AN/A2.9
2.72.45.2
N/A2.93.53.72.23.2
N/AN/A2.7
3.23.46.7
N/A3.02.23.81.44.51.62.02.6
3.45.56.4
N/A7.91.55.23.36.46.34.93.3
7.13.84.10.00.55.52.27.5
11.3N/AN/A4.0
6.42.94.00.02.33.90.52.94.6
N/AN/A4.4
7.23.24.50.00.35.52.33.73.31.58.24.1
7.43.84.1
N/A0.84.45.25.64.11.0
13.74.3
6.39.59.9
N/A3.66.68.34.43.1
N/AN/A4.5
8.59.68.2
N/A4.16.05.14.6
10.4N/AN/A5.3
8.14.97.5
N/A8.85.73.13.65.13.14.55.4
9.211.1
6.5N/A12.4
4.98.93.57.14.8
13.26.3
Established Pa�ent Appointments (FY15-18)Access
Source: VSSC Completed Appointments Cube 8.2.V19.SaltLakeCity
N/A: Not Available
VA Market Area Health Systems Op�miza�on
VISN 19: Salt Lake City Market
Specialty CarePrimary CareMental Health
Average Established Pa�ent Wait (Days) from Preferred Date (PD)
144

Established Pa�ent Percent of Appointments Completed within 30 Days of Clinically Indicated/Pa�ent Preference
Established Pa�ent Appointments (FY15-18), cont.
Facility FY15 FY16 FY17 FY18 FY15 FY16 FY17 FY18 FY15 FY16 FY17 FY18 Id
(V19) (660) Salt Lake City(V19) (660GA) Pocatello(V19) (660GB) Ogden(V19) (660GC) Ely-Nevada(V19) (660GD) Roosevelt(V19) (660GE) Orem(V19) (660GG) St. George(V19) (660GJ) Western Salt Lake(V19) (660GK) Elko(V19) (660QA) Idaho Falls(V19) (660QB) PriceNa�onal Average
98.6%99.1%96.1%
N/A100.0%
94.5%99.2%97.5%
100.0%N/AN/A
97.7%
98.1%98.1%93.0%
N/A96.3%95.8%98.0%99.5%95.4%
N/AN/A
98.2%
97.5%96.5%92.4%
N/A97.0%98.5%97.5%
100.0%93.9%98.3%
100.0%98.5%
98.0%95.4%93.0%
N/A92.6%98.8%96.4%98.9%93.6%92.3%94.4%97.6%
92.5%97.5%97.2%
100.0%99.5%96.7%98.7%93.4%90.6%
N/AN/A
96.8%
94.8%98.7%98.5%99.9%97.5%97.8%99.9%99.7%99.5%
N/AN/A
96.8%
94.7%98.2%98.2%
100.0%99.9%96.0%98.9%99.2%99.8%99.3%86.9%97.4%
94.7%99.5%97.9%
N/A99.2%97.9%97.7%97.9%98.9%99.4%82.8%97.2%
94.4%92.0%90.1%
N/A96.2%95.3%87.7%96.7%96.6%
N/AN/A
96.1%
90.8%87.8%92.6%
N/A95.4%94.4%93.1%96.1%91.2%
N/AN/A
95.3%
92.0%95.0%91.3%
N/A88.5%94.8%98.2%97.7%96.1%95.8%96.9%95.5%
91.8%91.1%95.4%
N/A88.8%95.8%96.7%97.9%93.5%92.4%84.0%94.5%
950951952953954955956957958959960961
Access
Source: VSSC Completed Appointments Cube 8.3.V19.SaltLakeCity
VA Market Area Health Systems Op�miza�on
VISN 19: Salt Lake City Market
Mental Health Primary Care Specialty Care
N/A: Not Available
145

Average New Pa�ent Average Wait (Days) from Create Date (CD)
New Pa�ent Appointments (FY15-18)
Facility FY15 FY16 FY17 FY18 FY15 FY16 FY17 FY18 FY15 FY16 FY17 FY18 Id
(4V19) (660) Salt Lake City, UT (George E. Wahlen)(4V19) (660GA) Pocatello, ID(4V19) (660GB) Ogden, UT(4V19) (660GC) Ely, NV(4V19) (660GD) Roosevelt, UT(4V19) (660GE) Orem, UT(4V19) (660GG) St. George, UT(4V19) (660GJ) Western Salt Lake, UT(4V19) (660GK) Elko, NV(4V19) (660QA) Idaho Falls, ID(4V19) (660QB) Price, UTNa�onal Average
12.28.6
27.5N/A11.915.110.012.7
9.9N/AN/A12.4
13.28.6
37.2N/AN/A16.314.811.718.4N/AN/A12.0
12.810.728.1N/A27.618.916.812.027.815.029.011.3
11.115.420.1N/A14.421.522.2
9.626.717.1
4.311.3
24.752.130.9
0.019.920.317.215.928.8N/AN/A21.2
24.112.825.8
0.024.117.516.4
9.128.4N/AN/A22.7
26.026.147.7
0.027.631.038.211.318.417.033.022.6
24.614.833.3N/A33.214.2
112.510.521.1
6.121.921.2
20.011.022.6N/A29.322.436.213.617.0N/AN/A21.5
20.35.9
18.5N/A0.0
11.726.714.618.4N/AN/A21.2
18.516.225.3N/A28.412.121.417.113.8
8.531.321.0
20.625.011.0N/A47.027.138.211.425.711.0N/A22.5
939940941942943944945946947948949950
Access
Source: VSSC Completed Appointments Cube 8.4.V19.SaltLakeCity
VA Market Area Health Systems Op�miza�on
VISN 19: Salt Lake City Market
Specialty CarePrimary Care
N/A: Not Available
Mental Health
146

New Pa�ent Appointments (FY15-18), cont.
Facility FY15 FY16 FY17 FY18 FY15 FY16 FY17 FY18 FY15 FY16 FY17 FY18 Id
(V19) (660) Salt Lake City(V19) (660GA) Pocatello(V19) (660GB) Ogden(V19) (660GC) Ely-Nevada(V19) (660GD) Roosevelt(V19) (660GE) Orem(V19) (660GG) St. George(V19) (660GJ) Western Salt Lake(V19) (660GK) Elko(V19) (660QA) Idaho Falls(V19) (660QB) PriceNa�onal Average
96.6%97.9%54.9%
N/A87.5%93.9%90.1%88.5%
100.0%N/AN/A
90.1%
93.4%97.8%25.1%
N/AN/A
89.8%93.6%90.0%80.8%
N/AN/A
90.8%
92.3%96.9%58.0%
N/A66.7%87.5%86.8%94.7%53.9%
100.0%50.0%91.2%
91.9%85.0%78.4%
N/A87.5%81.9%81.0%93.8%60.0%85.7%
100.0%N/A
65.9%39.6%61.8%
100.0%73.8%79.9%91.1%83.6%55.4%
N/AN/A
76.4%
71.4%97.0%71.6%
100.0%76.5%86.2%95.1%97.1%70.0%
N/AN/A
73.2%
63.3%62.6%41.9%
100.0%53.6%43.1%46.8%97.0%88.2%
100.0%42.9%73.8%
69.2%94.9%47.7%
N/A48.9%80.0%52.6%97.9%86.5%
100.0%63.2%
N/A
79.2%84.6%68.8%
N/A33.3%77.8%38.2%83.5%77.1%
N/AN/A
75.2%
76.6%93.1%82.6%
N/A100.0%
90.2%65.2%89.6%89.5%
N/AN/A
76.2%
81.8%76.9%61.4%
N/A60.0%92.6%72.1%80.2%95.2%75.0%33.3%76.3%
76.1%60.3%92.9%
N/A25.0%53.5%43.5%91.4%65.4%89.3%
N/AN/A
9…9…9…9…9…9…9…9…9…9…9…9…
Access
Source: VSSC Completed Appointments Cube 8.5.V19.SaltLakeCity
N/A: Not Available
VA Market Area Health Systems Op�miza�on
VISN 19: Salt Lake City Market
Mental Health Primary Care Specialty Care
Percent of New Pa�ent Appointments Completed within 30 Days
147

Rece ReceivingFacility FY18 Consults Avg
S
(349) SLEEP MEDICINE(408) OPTOMETRY(303) CARDIOLOGY(502) MH CLINIC IND(205) PHYSICAL THERAPY(407) OPHTHALMOLOGY(180) DENTAL(718) DIABETIC RETINAL SCREENING(697) CHART CONSULT(107) EKG
(V19) (660) Salt Lake City(V19) (660) Salt Lake City(V19) (660) Salt Lake City(V19) (660) Salt Lake City(V19) (660) Salt Lake City(V19) (660) Salt Lake City(V19) (660) Salt Lake City(V19) (660) Salt Lake City(V19) (660) Salt Lake City(V19) (660) Salt Lake City
6,1867,5279,555
10,60914,858
8,2837,070
12,75523,08817,087
62.638.632.031.830.421.015.8
2.72.62.0
…………………………
Average Wait Time for Top 10 Consults – Salt Lake CityReceiving Service Stop Code
(Top 10 by FY18 Consults)
Access
Source: VSSC Consults Cube V2 8.6.V19.SaltLakeCity.660
VA Market Area Health Systems Op�miza�on
VISN 19: Salt Lake City Market — Salt Lake City
Receiving Facility FY18 ConsultsAverage Days to
Completed Consult
148

ReceivingServiceStopCode Facility FY18 Consults AvergeDaysToCompletedConsult 8_8 Sort
(345) EPILEPSY CENTER OF EXCELLENCE(436) CHIROPRACTIC CARE(159) COMPLEMENTARY AND INTEGRATIVE HEALTH TREATMENT(308) HEMATOLOGY(302) ALLERGY IMMUNOLOGY(109) NUCLEAR MEDICINE(143) SLEEP STUDY(151) MAGNETIC RESONANCE IMAGING/MRI(150) COMPUTERIZED TOMOGRAPHY (CT)(350) GeriPACT
(V19) (660) Salt Lake City(V19) (660) Salt Lake City(V19) (660) Salt Lake City(V19) (660) Salt Lake City(V19) (660) Salt Lake City(V19) (660) Salt Lake City(V19) (660) Salt Lake City(V19) (660) Salt Lake City(V19) (660) Salt Lake City(V19) (660) Salt Lake City
241,1603,699
39327
421,768
310211150
138.5120.0112.7105.7101.2
97.287.384.482.580.6
138.5455120.0179112.7366105.7241101.2277
97.287.341684.409582.459680.6452
Access
Source: VSSC Consults Cube V2 8.7.V19.SaltLakeCity.660
VA Market Area Health Systems Op�miza�on
VISN 19: Salt Lake City Market — Salt Lake City
Longest Wait Time – Top 10 ConsultsAverage Days to
Completed Consult (Top 10 Stop Codes)
FY18 ConsultsReceiving FacilityReceiving Service Stop Code
149

VA Facility
Total Uniq Total Enc Prim Enc Prim Unq Cnt Of Prm Tms Ovr Tms Un Pcp Cap Cap Le� PanelFul
Third
(V19) (660) Salt Lake City(V19) (660GA) Pocatello(V19) (660GB) Ogden(V19) (660GD) Roosevelt(V19) (660GE) Orem(V19) (660GG) St. George(V19) (660GJ) Western Salt Lake(V19) (660GK) Elko(V19) (660QA) Idaho Falls(V19) (660QB) Price
59,8845,4155,894
7473,2874,0256,161
6541,728
424
827,39626,31236,372
2,82521,22724,81327,736
3,6316,8432,185
39,3219,5459,6041,3974,0935,891
11,703855
2,005774
14,4024,7244,859
6802,4202,7235,374
5331,020
369
19251248
N/A1
N/A
4020012
N/A0
N/A
14221235
N/A1
N/A
7,8611,9102,356
126900
2,3863,566
N/A808N/A
559-8
-11054
5439505N/A
13N/A
93.0%100.0%105.0%
57.0%99.0%82.0%86.0%
N/A98.0%
N/A
30.74.35.54.36.66.26.7
14.925.522.1
Primary Care PACT Teams
Es�mated Capacity for Outpa�ent WorkloadAccess
Source: 1.VSSC Encounters Cube 2. VSSC PACT Compass Cube 8.8.V19.SaltLakeCity.660
VA Market Area Health Systems Op�miza�on
VISN 19: Salt Lake City Market — Salt Lake City
VA Facility
FY18 Actual Primary Care (PC) EncountersFY18
Total Uniques UniquesPrimary Care
Encounters
Countof Primary
CarePACT Teams
Number of
Teams at or
over
Capacity
Number of
Teams at or
under
Capacity
Team PCP
Capacity
Total
CapacityLe�
PanelFullness
3rd Next Available
Appt.
FY18 Total
Encounters
150

*Other includes Post Deployment and Homeless Teams
Es�mated Capacity for Outpa�ent Workload, cont.Access
Source: VSSC PACT Compass Cube 8.15.V19.SaltLakeCity
VA Market Area Health Systems Op�miza�on
VISN 19: Salt Lake City Market — Salt Lake City
151

Es�mated 30 Minute Drive Time ZonesAccess
Source: Geocoded Enrollee File FY18Q4 8.9.V19.SaltLakeCity#IMG
VA Market Area Health Systems Op�miza�on
VISN 19: Salt Lake City Market
152

Facility FY15 FY16 FY17 FY18 FY15 FY16 FY17 FY18 FY15 FY16 FY17 FY18 Id
(V19) (660) Salt Lake City(V19) (660GA) Pocatello(V19) (660GB) Ogden(V19) (660GC) Ely-Nevada(V19) (660GD) Roosevelt(V19) (660GE) Orem(V19) (660GG) St. George(V19) (660GJ) Western Salt Lake(V19) (660GK) Elko(V19) (660QA) Idaho Falls(V19) (660QB) Price(V19) (660QC) Weber County
84.0%78.0%92.0%
-92.0%82.0%72.0%86.0%88.0%
---
64.0%75.0%87.0%
-69.0%55.0%69.0%75.0%78.0%
---
63.0%74.0%83.0%
-71.0%50.0%79.0%62.0%69.0%78.0%51.0%
-
48.0%49.0%35.0%
-65.0%44.0%44.0%23.0%53.0%78.0%50.0%32.0%
68.0%69.0%59.0%
100.0%76.0%86.0%55.0%61.0%56.0%
---
66.0%65.0%48.0%
100.0%73.0%76.0%48.0%60.0%58.0%
---
58.0%61.0%38.0%
100.0%69.0%82.0%54.0%58.0%53.0%49.0%99.0%
-
59.0%57.0%38.0%
-71.0%59.0%51.0%54.0%58.0%49.0%98.0%
-
80.0%55.0%54.0%
100.0%74.0%50.0%74.0%57.0%59.0%
---
75.0%66.0%62.0%
100.0%66.0%49.0%83.0%56.0%64.0%
---
75.0%72.0%66.0%
100.0%81.0%58.0%81.0%50.0%62.0%83.0%65.0%
-
75.0%83.0%61.0%
-85.0%74.0%85.0%60.0%80.0%84.0%62.0%
-
874875876877878879880881882883884885
Clinic U�liza�on — Percent Slots Used of Total SlotsAccess
Source: VSSC Clinic U�liza�on Cube 8.10.V19.SaltLakeCity
VA Market Area Health Systems Op�miza�on
VISN 19: Salt Lake City Market
Mental Health Primary Care Specialty Care
153

Cancelled by Clinic Report
Facility FY15 FY16 FY17 FY18 FY15 FY16 FY17 FY18 FY15 FY16 FY17 FY18 Id
(V19) (660) Salt Lake City(V19) (660GA) Pocatello(V19) (660GB) Ogden(V19) (660GC) Ely-Nevada(V19) (660GD) Roosevelt(V19) (660GE) Orem(V19) (660GG) St. George(V19) (660GJ) Western Salt Lake(V19) (660GK) Elko(V19) (660QA) Idaho Falls(V19) (660QB) PriceTotal
3,625282481N/A
30408110243
24N/AN/A
5,203
3,217245376N/A
14362275134
32N/AN/A
4,655
3,864318675N/A
47397297143
322425
5,822
3,443345925N/A
45261221134
399228
5,533
2,073482
1,0859
37489447
1,12274
N/AN/A
5,818
2,048450852
744
464389742
50N/AN/A
5,046
2,523722
1,098N/A100473676
1,122313733
6,815
1,892798
1,787N/A
88275663880
24129
626,598
12,66039
111N/A
870
1938332
N/AN/A
13,196
11,5345578
N/A6
116186131
22N/AN/A
12,128
11,2506085
N/A8
105326242
131611
12,116
9,776138
62N/A
879
163133
187
1510,399
945946947948949950951952953954955956
Access
Source: VSSC No Show and Cancella�on Cube 8.11.V19.SaltLakeCity
Note: Appointments cancelled within 45 days
VA Market Area Health Systems Op�miza�on
VISN 19: Salt Lake City Market
Mental Health Primary Care Specialty Care
154

Market/Parent Facility Exis�ng VA Drive Times AssessmentAccess
Source: 1. Dartmouth Atlas 2. Geocoded Enrollee File FY18Q4 8.12.V19.SaltLakeCity#IMG
VA Market Area Health Systems Op�miza�on
VISN 19: Salt Lake City Market
VA & Commercial Drive Time Measures
Note: A Dartmouth Atlas Hospital Service Area (HSA) is a ZIP code-defined geography encompassing the community where the ZIP code's Medicare residents predominantly receive their hospital care. HSA total enrollees are displayed on map. A Dartmouth Atlas Hospital Referral Region (HRR) is a
ZIP code-defined geography encompassing the community where the ZIP code's Medicare residents predominantly receive their cardiovascular and neurosurgery hospital care.
155

FY 2018 # of TotalEnrollees
# of enrolleeswithin 30
minutes drive�me
% of enrolleeswithin 30minutes
# of enrolleesoutside 30
minutes drive�me
% of enrolleesoutside 30
minutes
# of enrolleeswithin 60
minutes drive�me
% of enrolleeswithin 60minutes
# of enrolleesoutside 60
minutes drive�me
% of enrolleesoutside 60
minutes
Id
(V19) Salt Lake City 70,893 51,879 73.2% 19,014 26.8% 45,488 64.2% 25,405 35.8% 1
Access
8.13.V19.SaltLakeCity
VA Market Area Health Systems Op�miza�on
VISN 19: Salt Lake City Market
Drive Time Summary
Secondary CarePrimary Care
Source: 1. FY2018 Q4 Enrollment 2. FY2018 Q4 VA Site Tracking (VAST) data; VHA OPP Planning Systems Support Group
156

Poten�al Service GapsAccess
Source: 1. Dartmouth Atlas 2. Geocoded Enrollee File FY18Q4 8.14.V19.SaltLakeCity#IMG
VA Market Area Health Systems Op�miza�on
VISN 19: Salt Lake City Market Potential service gaps are areas identified by the Dartmouth Atlas in a Hospital Service Area (HSA). The medical community in these areas provide as
opportunities to consider different tactics to extend the VA network of care. Strategies for expansion might include telehealth, FQHC partnership,
unique rural outreach, contracted provider(s) or a new VA asset. The following page shows the number of Enrollees that reside within a particular HSA.
Planning best practice suggests that 4,800 enrollees are required to justify establishing a new site of care.
Potential Service Gaps
157

Poten�al Service Gaps, cont.Access
Source: 1. Dartmouth Atlas 2. Geocoded Enrollee File FY18Q4 8.14.V19.SaltLakeCity
VA Market Area Health Systems Op�miza�on
VISN 19: Salt Lake City Market Potential service gaps are areas identified by the Dartmouth Atlas in a Hospital Service Area (HSA). The medical community in these areas provides
opportunities to consider different tactics to extend the VA network of care. Strategies for expansion might include telehealth, FQHC partnership,
unique rural outreach, contracted provider(s) or a new VA asset. The table below shows the number of Enrollees that reside within a particular HSA.
Planning best practices suggests that 4,800 enrollees are required to justify establishing a new site of care.
158

Quality & Sa�sfac�on
159

Category Sub-Category Na�onal . ..
Insurance (Reliance) Have Private Insurance PlanPlanned Use of VA as Primary Source of CareUninsured
Sa�sfac�on (Best CareAnywhere)
Appointments are Always/Nearly Always Easy to Get with VAVery Sa�sfied with Respect Given by Health Care ProfessionalsVery Sa�sfied with the Ability to Get Referrals
Access (Choose VA) Believes Care in the Community is Easier to Get to than VA(Answered Yes)Believes Care in the Community Quality is Be�er than VA (AnsweredYes)
Internet Use(Telehealth Poten�al)
Internet Use to Look at Health Informa�on (Answered Yes)Used Internet to Make Medical Appointments (Answered Yes)
27.6 %40.5 %19.2 %45.3 %72.3 %32.4 %66.0 %
43.0 %
76.1 %36.5 %
36.3 %36.0 %17.5 %39.3 %74.5 %44.9 %74.2 %
45.4 %
75.7 %36.9 %
1112223
3
44
1. Sa�sfac�on denominator = enrolled Veterans who said they had used VA since January 1, 20162. Access denominator = enrolled Veterans who said they had used a provider other than VA for some or all of their care since January 1, 20163. The denominator for Internet Use = enrolled Veterans who said they used the internet at least occasionally
Quality & Sa�sfac�on
Source: 2018 Survey of Enrollees Market Profiles 9.1.V19.SaltLakeCity
VA Market Area Health Systems Op�miza�on
VISN 19: Salt Lake City Market
VA Pa�ent Feedback: Survey of Enrollees – Salt Lake City MarketSalt Lake City Market
160

Facility SurveyDate
CareCoord.
Cleanlinessof Hospital
Envt.
CommaboutMeds
Commw/
Doctors
Commw/
Nurses
PainMgmt.
CommaboutPain
QuietnessOf
HospitalEnvt.
Hosp.Staff
Respon-siveness
Recom-mend
Hospital
CareTransi�on
Hosp.Ra�ng
DischargeInfo
SharedDecisionMaking
(V19) (660) Salt Lake City(V19) (660) Salt Lake City(V19) (660) Salt Lake City(V19) (660) Salt Lake CityVISN 19 AverageVISN 19 AverageVISN 19 AverageVISN 19 AverageNa�onal AverageNa�onal AverageNa�onal AverageNa�onal Average
201520162017201820152016201720182015201620172018
58.457.255.761.252.254.751.954.752.053.253.254.2
75.475.676.075.270.572.271.371.669.970.069.670.4
65.168.068.356.463.264.562.461.061.261.962.663.4
73.375.573.674.271.374.171.472.273.874.775.175.7
74.175.573.674.672.574.673.474.772.173.173.574.6
63.065.361.6N/A59.161.360.1N/A60.160.159.5N/A
N/AN/AN/A60.7N/AN/AN/A57.9N/AN/AN/A57.9
48.851.452.950.847.850.649.749.049.349.850.151.4
62.164.459.363.063.665.064.264.958.859.759.761.0
70.871.871.471.063.366.062.663.165.565.866.766.9
53.152.354.854.749.651.150.650.849.750.852.051.9
69.669.668.365.961.465.061.061.664.365.265.466.2
88.386.688.887.784.986.186.986.884.785.385.686.2
78.080.780.078.373.077.275.675.574.075.375.475.5
VA Pa�ent Sa�sfac�on – Inpa�ent% Reported as Always % Definitely Yes
Quality & Sa�sfac�on
Source: VSSC Pa�ent Experiences Survey Reports 9.2.V19.SaltLakeCity
Note: Green cells indicate a score at or above na�onal average. Red cells indicate a score below na�onal average.
VA Market Area Health Systems Op�miza�on
VISN 19: Salt Lake City Market
% Strongly Agree % 9 or 10 % Yes
161

Quality & Sa�sfac�on
Source: SAIL Scorecards 9.3.V19.SaltLakeCity.660
VA Market Area Health Systems Op�miza�on
VISN 19: Salt Lake City Market — Salt Lake City
VA Market Facility Trends – Access/Quality/Pa�ent Sa�sfac�on
162

Quality & Sa�sfac�on
VA Market Area Health Systems Op�miza�on
VISN 19: Salt Lake City Market — Salt Lake City
VA Market Facility Trends – Access/Quality/Pa�ent Sa�sfac�on, cont.
Note: Performance Measures cited above represent composite measures. Some measures havechanged, but appear to be rela�vely close to current measures and therefore are reported forperiods shown (PCMH Timely Appointments, Days Waited for Urgent Appointment).
9.13.V19.SaltLakeCity.660Source: SAIL Scorecards
163

VA Pa�ent Sa�sfac�on – Outpa�ent (PCMH)
Facility Survey Date Access Care Coordina�on Communica�on Office Staff Overall Ra�ng ofProvider
OverallSa�sfac�on
CK
(V19) (660) Salt Lake City(V19) (660) Salt Lake City(V19) (660) Salt Lake City(V19) (660) Salt Lake City(V19) (660GA) Pocatello(V19) (660GA) Pocatello(V19) (660GA) Pocatello(V19) (660GA) Pocatello(V19) (660GB) Ogden(V19) (660GB) Ogden(V19) (660GB) Ogden(V19) (660GB) Ogden(V19) (660GC) Ely-Nevada(V19) (660GC) Ely-Nevada(V19) (660GC) Ely-Nevada(V19) (660GD) Roosevelt(V19) (660GD) Roosevelt(V19) (660GD) Roosevelt(V19) (660GD) Roosevelt(V19) (660GE) Orem
20152016201720182015201620172018201520162017201820152016201720152016201720182015
36.950.449.149.934.048.849.352.733.944.846.052.041.263.548.844.660.863.653.436.1
N/A61.961.066.3N/A68.666.571.5N/A59.760.360.1N/A55.956.3N/A68.465.366.9N/A
75.680.080.384.968.183.984.982.570.677.677.179.157.162.973.476.985.487.186.261.6
65.672.670.876.274.480.080.173.268.864.668.968.264.464.578.081.986.388.777.069.1
67.273.673.081.765.176.173.175.966.371.471.975.648.056.758.170.775.481.782.251.6
N/AN/AN/A81.2N/AN/AN/A81.7N/AN/AN/A84.6N/AN/AN/AN/AN/AN/A85.6N/A
……………………………………………………
% Always
Quality & Sa�sfac�on
Source: VSSC Pa�ent Experiences Survey Reports 9.4.V19.SaltLakeCity
Note: Green cells indicate a score at or above na�onal average. Red cells indicate a score below na�onal average.
VA Market Area Health Systems Op�miza�on
VISN 19: Salt Lake City Market
% 9 or 10
164

VA Pa�ent Sa�sfac�on – Outpa�ent (PCMH), cont.
Facility Survey Date Access Care Coordina�on Communica�on Office Staff Overall Ra�ng ofProvider
OverallSa�sfac�on
CK
(V19) (660GE) Orem(V19) (660GE) Orem(V19) (660GE) Orem(V19) (660GG) St. George(V19) (660GG) St. George(V19) (660GG) St. George(V19) (660GG) St. George(V19) (660GJ) Western Salt Lake(V19) (660GJ) Western Salt Lake(V19) (660GJ) Western Salt Lake(V19) (660GJ) Western Salt Lake(V19) (660GK) Elko(V19) (660GK) Elko(V19) (660GK) Elko(V19) (660GK) ElkoVISN 19 AverageVISN 19 AverageVISN 19 AverageVISN 19 AverageNa�onal Average
20162017201820152016201720182015201620172018201520162017201820152016201720182015
50.646.051.832.549.343.242.433.952.857.249.741.841.950.646.532.144.044.046.837.4
57.756.956.5N/A62.159.150.6N/A62.368.161.8N/A54.962.462.2N/A55.555.257.5N/A
74.774.477.474.479.378.074.772.481.384.181.663.769.880.282.765.672.771.774.770.9
76.475.872.668.369.872.765.072.573.476.171.180.671.882.286.163.567.367.770.966.2
62.259.272.063.473.469.165.066.974.079.375.754.155.573.269.359.664.063.465.665.2
N/AN/A80.2N/AN/AN/A76.4N/AN/AN/A85.6N/AN/AN/A87.8N/AN/AN/A75.8N/A
……………………………………………………
% Always
Quality & Sa�sfac�on
Source: VSSC Pa�ent Experiences Survey Reports 9.4.V19.SaltLakeCity#2
Note: Green cells indicate a score at or above na�onal average. Red cells indicate a score below na�onal average.
VA Market Area Health Systems Op�miza�on
VISN 19: Salt Lake City Market
% 9 or 10
165

VA Pa�ent Sa�sfac�on – Outpa�ent (PCMH), cont.
Facility Survey Date Access Care Coordina�on Communica�on Office Staff Overall Ra�ng ofProvider
OverallSa�sfac�on
CK
Na�onal AverageNa�onal AverageNa�onal Average
201620172018
49.249.851.3
58.458.760.1
75.675.877.1
69.170.071.0
68.168.969.7
N/AN/A80.3
………
% Always
Quality & Sa�sfac�on
Source: VSSC Pa�ent Experiences Survey Reports 9.4.V19.SaltLakeCity#3
Note: Green cells indicate a score at or above na�onal average. Red cells indicate a score below na�onal average.
VA Market Area Health Systems Op�miza�on
VISN 19: Salt Lake City Market
% 9 or 10
166

VA Pa�ent Sa�sfac�on – Outpa�ent (Specialty Care)
Facility Survey Date Access Care Coordina�on Communica�on Office Staff Overall Ra�ng ofProvider
OverallSa�sfac�on
CK
(V19) (660) Salt Lake City(V19) (660) Salt Lake City(V19) (660) Salt Lake City(V19) (660GA) Pocatello(V19) (660GA) Pocatello(V19) (660GA) Pocatello(V19) (660GB) Ogden(V19) (660GB) Ogden(V19) (660GB) Ogden(V19) (660GD) Roosevelt(V19) (660GD) Roosevelt(V19) (660GD) Roosevelt(V19) (660GE) Orem(V19) (660GE) Orem(V19) (660GE) Orem(V19) (660GG) St. George(V19) (660GG) St. George(V19) (660GG) St. George(V19) (660GJ) Western Salt Lake(V19) (660GJ) Western Salt Lake
20162017201820162017201820162017201820162017201820162017201820162017201820162017
42.0%46.9%50.9%42.2%23.6%39.5%70.6%83.2%37.4%
100.0%100.0%
N/A40.0%83.6%24.1%58.0%41.7%50.2%72.4%22.3%
50.5%49.8%56.2%27.3%51.8%52.6%51.7%67.6%54.8%
100.0%100.0%
50.0%59.7%45.6%59.1%60.4%46.3%57.7%62.3%34.0%
70.6%71.1%75.4%69.1%56.7%54.1%65.2%89.0%61.0%
100.0%100.0%100.0%
83.6%94.9%90.0%82.0%82.7%66.2%92.7%45.4%
69.4%64.4%68.2%75.6%68.3%53.0%52.0%83.7%76.2%
100.0%100.0%100.0%
83.6%57.7%94.8%86.7%68.5%61.0%92.7%42.6%
62.6%61.9%66.7%54.7%59.6%47.3%50.6%91.1%65.2%
100.0%100.0%100.0%
61.9%66.5%84.4%65.1%56.5%54.6%
100.0%29.2%
N/AN/A
83.2%N/AN/A
62.2%N/AN/A
77.7%N/AN/A
100.0%N/AN/A
92.7%N/AN/A
67.1%N/AN/A
19…19…19…19…19…19…19…19…19…19…19…19…19…19…19…19…19…19…19…19…
% Always
Quality & Sa�sfac�on
Source: VSSC Pa�ent Experiences Survey Reports 9.5.V19.SaltLakeCity
Note: Green cells indicate a score at or above na�onal average. Red cells indicate a score below na�onal average.
VA Market Area Health Systems Op�miza�on
VISN 19: Salt Lake City Market
% 9 or 10
167

VA Pa�ent Sa�sfac�on – Outpa�ent (Specialty Care), cont.
Facility Survey Date Access Care Coordina�on Communica�on Office Staff Overall Ra�ng ofProvider
OverallSa�sfac�on
CK
(V19) (660GJ) Western Salt Lake(V19) (660GK) Elko(V19) (660GK) Elko(V19) (660GK) ElkoVISN 19 AverageVISN 19 AverageVISN 19 AverageNa�onal AverageNa�onal AverageNa�onal Average
2018201620172018201620172018201620172018
56.5%N/AN/AN/A
41.7%43.3%44.6%47.3%48.7%49.7%
72.2%N/A
100.0%N/A
51.7%51.6%53.1%55.1%56.2%57.1%
88.5%N/A
100.0%N/A
71.5%71.0%73.4%73.2%74.2%75.3%
91.5%N/A
100.0%N/A
67.6%68.2%69.1%69.1%70.4%71.7%
90.1%N/A
100.0%N/A
62.4%62.4%65.0%65.4%66.8%68.4%
87.2%N/AN/AN/AN/AN/A
76.2%N/AN/A
81.0%
19…19…19…19…19…19…19…19…19…19…
% Always
Quality & Sa�sfac�on
Source: VSSC Pa�ent Experiences Survey Reports 9.5.V19.SaltLakeCity#2
Note: Green cells indicate a score at or above na�onal average. Red cells indicate a score below na�onal average.
VA Market Area Health Systems Op�miza�on
VISN 19: Salt Lake City Market
% 9 or 10
168

Facility SurveyDate
ProviderRa�ng
CommunityCare
Received
Commu-nica�on
ProviderAwareHistory
ProviderInformed
VAProviderInformed
Next StepClear
TestFollow-
up
TestResult to
VA
First Appt.Soon asNeeded
First Appt.Easy to Get
OverallSa�sfac�on
(V19) (660) Salt Lake City(V19) (660) Salt Lake City(V19) (660) Salt Lake CityVISN 19 AverageVISN 19 AverageVISN 19 AverageNational AverageNational AverageNational Average
201620172018201620172018201620172018
56.064.366.458.461.465.658.862.164.5
46.552.952.447.850.353.250.454.255.3
63.366.975.063.564.569.563.766.468.0
38.144.054.646.245.953.847.049.251.0
34.147.948.542.544.045.142.244.545.7
30.644.450.139.644.542.841.043.744.8
39.042.549.340.543.346.642.745.247.0
45.762.560.452.754.055.551.653.454.9
60.267.152.761.059.959.059.660.662.5
63.460.760.657.459.561.059.962.166.0
53.255.857.655.957.460.559.862.266.1
78.371.568.770.370.073.071.774.076.9
VA Pa�ent Sa�sfac�on – Community Care
% Always
Quality & Sa�sfac�on
Source: VSSC Pa�ent Experiences Survey Reports 9.12.V19.SaltLakeCity
Note: Green cells indicate a score at or above na�onal average. Red cells indicate a score below na�onal average.
VA Market Area Health Systems Op�miza�on
VISN 19: Salt Lake City Market
% 9 or 10 % Strongly Agree
% Very Sa�sfied
or Sa�sfied
169

Quality of Community Hospitals – Salt Lake City AreaQuality & Sa�sfac�on
Source: 1. Best Care Report 2. Definitive Healthcare 9.6.V19.SaltLakeCity.660
Note: Data is reported by provider number and may includes mul�-campus hospitals repor�ng under a single provider number, N/A = Not Applicable
VA Market Area Health Systems Op�miza�on
VISN 19: Salt Lake City Market — Salt Lake City
Validation of the data for this slide is not required 170

Quality & Sa�sfac�on
Source: 1. US News and World Report Flagship Hospital Rankings 2. Hospital website 9.7.V19.SaltLakeCity.660
VA Market Area Health Systems Op�miza�on
VISN 19: Salt Lake City Market — Salt Lake City
Awards and Recogni�on of Top Five Largest Community Hospitals* – Salt Lake City Area
*As measured by total staffed beds. Excludes rehabilita�on, psychiatric, and long term care facili�es.Note: N/A for High Performing Ranked Special�es/Programs and High Performing Procedures/Condi�ons indicates the hospital did not meet criteria or volume thresholds set by US News and World Report to be eligible for a ra�ng/ranking.N/A in for Notable Awards indicate the hospital did not list any care or service delivery awards website. Reflects informa�on that was available as of July 29th, 2019.
Validation of the data for this slide is not required 171

Quality & Sa�sfac�on
Source: CMS.gov 9.8.V19.SaltLakeCity
VA Market Area Health Systems Op�miza�on
VISN 19: Salt Lake City Market
Quality of Top Community Hospital Outpa�ent ServicesHospital Outpa�ent Quality Repor�ng Program Overview
• The Hospital Outpa�ent Quality Repor�ng Program (Hospital OQR) is a pay for quality data repor�ng program implemented by the Centers for Medicare & Medicaid Services (CMS) for outpa�ent hospital servicesü Mandated by the Tax Relief and Health Care Act of 2006 by the Centers for Medicare & Medicaid Services
to promote higher quality and more efficient health care for Medicare beneficiaries through measurement
• Subsec�on (d) hospitals that meet Hospital OQR Program requirements during a given calendar year receive a full OPPS payment update, also called the Outpa�ent Department (OPD) fee schedule increase factor, for the upcoming calendar year
• Eligible hospitals that do not par�cipate or par�cipate but fail to meet program requirements receive a two percentage point reduc�on of their annual payment update (APU) for the applicable payment year
• Hospitals must submit data for 26 quality measures:ü 5 Cardiac Care Measuresü 3 ED-Throughput Measuresü 1 Pain Management Measuresü 6 Imaging Efficiency Measuresü 1 Stroke Measuresü 9 Submi�ed Via a Web-Based Tool Measuresü 1 Outcome Claims-Based Measuresü Commercial Market Data & Analysis
For more informa�on, including measure specifica�ons and minimum case count requirements, see CMS.gov
172

This analysis is subjec�ve in nature and is only meant to provide a direc�onal opinion as to the current state of VA and non-VA providers in the market.
*ED volume (EDV) is not a Hospital OQR measure, but OP-18 and OP-22 na�onal data are based on ED volumes.
**The first repor�ng period for OP-35 and -36 began January 1, 2018 and goes through December 31, 2018, for the CY 2020 payment determina�on. Data for these 2 measures have not made available by CMS and are not included in this analysis.
Validation of the data for this slide is not required
Acute Myocardial Infarc�on /
Chest Pain Measure Score
Quality & Sa�sfac�on
Source: CMS.gov 9.9.V19.SaltLakeCity
VA Market Area Health Systems Op�miza�on
VISN 19: Salt Lake City Market
Quality of Top Community Hospital Outpa�ent Services, cont.•In order to be�er compare outpa�ent quality between hospitals, the 21 outpa�ent quality measure were grouped into broader categories
•Na�onal outpa�ent data was also grouped following the same methodology and used as a benchmark comparison
• OP-2: Fibrinoly�c Therapy Received Within 30 Minutes of ED arrival (%)
• OP-3: Median Time to Transfer to Another Facility for Acute Coronary Interven�on (mins)
• OP-5: Median Time to ECG (mins
Structural
(Submi�ed Via a
Web-based Tool)
• OP-12: The Ability for Providers with HIT to Receive Laboratory Data Electronically
Directly into their ONC-Cer�fied EHR System as Discrete Searchable Data (Y/N)
• OP-17: Tracking Clinical Results between Visits (Y/N)
• OP-29: Appropriate Follow-up Interval for Normal Colonoscopy in Average Risk Pa�ents
(%)
• OP-30: Colonoscopy Interval for Pa�ents with a History of Adenomatous Polyps –
Avoidance of Inappropriate Use (%)
• OP-31: Cataracts – Improvement in Pa�ent’s Visual Func�on within 90 days Following
Cataract Surgery (survey)
•OP-33 Facility 7-Day Risk-Standardized Hospital Visit Rate a�er Outpa�ent Colonoscopy
• OP-8: MRI Lumbar Spine for Low Back Pain (%)
• OP-9: Mammography Follow-up Rates (%)
• OP-10: Abdomen CT-Use of Contrast Material (%)
• OP-11: Thorax CT-Use of Contrast Material (%)
• OP-13: Cardiac Imaging for Preopera�ve Risk Assessment for Non-Cardiac Low Risk Surgery (%)
• OP-14: Simultaneous Use of Brain Computed Tomography (CT) and Sinus Computed
Tomography (CT) (%)
• OP-32 Facility 7-Day Risk-Standardized Hospital Visit Rate a�er Outpa�ent Colonoscopy
• OP-35: Admissions and Emergency Department (ED) Visits for Pa�ents Receiving Outpa�ent
Chemotherapy**
• OP-36: Hospital Visits a�er Hospital Outpa�ent Surgery**
ED - Throughput • OP-18: Median Time from ED Arrival to ED Departure for Discharged ED Pa�ents (mins)
• OP-22: Le� Without Being Seen (%)
• EDV - Emergency Department Volume
• OP-23: Head CT or MRI Scan Results for Acute Ischemic Stroke or Hemorrhagic Stroke Pa�ents
who Received Head CT or MRI Scan Interpreta�on Within 45 minutes of ED Arrival (%)
Hospital Outpa�ent Quality Repor�ng Groupings
ED - Volume*
Imaging Efficiency
StrokeOutcome Claims-Based
173

Id
Outpa�entQuality Category
Measure Name Preferred Direc�on Hospital1 Hospital2 Hospital3 Hospital4 Hospital5 Na�onalRate
1072
1073107410751076
10771078
1079
1080
10811082
108310841085
1086
1087108810891090
1091
Outpa�entQuality CategoryAMI / Chest Pain
Structural(Submi�ed Via aWeb-Based Tool)
Outcome Claims-BasedED – Throughput
ED – Volume
ImagingEfficiency
Measure Name
OP-2: Fibrinoly�c Therapy Received Within 30 Minutes of ED arrival (%)OP-3: Median Time to Transfer to Another Facility for Acute Coronary Interven�on (mins)OP-5: Median Time to ECG (mins)OP-12: Receive Laboratory Data Electronically Directly as Discrete Searchable Data (Y/N)
OP-17: Tracking Clinical Results between Visits (Y/N)OP-29: Appropriate Follow-up Interval for Normal Colonoscopy in Average Risk Pa�ents(%)OP-30: Colonoscopy Interval for Pa�ents with a History of Adenomatous Polyps ?Avoidance of Inappropriate Use (%)OP-31: Cataracts ? Improvement in Pa�ent?s Visual Func�on within 90 days FollowingCataract Surgery (survey)OP-33: External Beam Radiotherapy for Bone Metastases (%)OP-32: Facility 7-Day Risk-Standardized Hospital Visit Rate a�er Outpa�ent Colonoscopy
OP-18: Median Time from ED Arrival to ED Departure for Discharged ED Pa�ents (mins)OP-22: Le� Without Being Seen (%)EDV: Emergency Department Volume
OP-8: MRI Lumbar Spine for Low Back Pain (%)
OP-9: Mammography Follow-up Rates (%)OP-10: Abdomen CT-Use of Contrast Material (%)OP-11: Thorax CT-Use of Contrast Material (%)OP-13: Cardiac Imaging for Preopera�ve Risk Assessment for Non Cardiac Low RiskSurgery (%)OP-14: Simultaneous Use of Brain Computed Tomography (CT) and Sinus ComputedTomography (CT) (%)
Preferred Direc�on
HighLowLowYes
YesHigh
High
High
HighLow
LowLowN/A
Low
LowLowLowLow
Low
University Hospital
N/AN/AN/AYes
Yes93.0%
98.0%
N/A
90.0%15.1%
2382.0%High (40,000-59,999pa�ents annually)40.3%
4.8%4.5%0.1%6.6%
2.0%
IntermountainMedical CenterN/AN/AN/AYes
Yes95.0%
100.0%
N/A
30.0%15.3%
1841.0%Very High (60,000+pa�ents annually)50.0%
8.7%2.2%0.3%5.7%
1.9%
Utah Valley Hospital
N/AN/AN/AYes
Yes99.0%
98.0%
N/A
N/A13.7%
1601.0%High (40,000-59,999pa�ents annually)47.7%
5.8%3.8%0.4%2.3%
1.2%
Jordan ValleyMedical CenterN/AN/A7Yes
Yes79.0%
74.0%
N/A
N/A14.0%
1460.0%Very High (60,000+pa�ents annually)46.3%
9.7%3.9%1.7%3.2%
1.2%
McKay-DeeHospitalN/AN/AN/AYes
Yes95.0%
97.0%
N/A
88.0%14.0%
1632.0%Very High (60,000+pa�ents annually)43.8%
6.3%1.5%0.5%4.2%
1.0%
Na�onal Rate
59.0%628N/A
N/A88.0%
90.0%
95
86.0%14.8%
1372.0%N/A
39.3%
8.9%7.8%1.5%4.6%
1.1%
1092 OP-23: Head CT or MRI Scan Results Within 45 minutes of ED Arrival (%) High N/A 53.0% N/A 63.0% 44.0% 73.0%
VA Market Area Health Systems Op�miza�on
VISN 19: Salt Lake City Market — Salt Lake City
9.10.V19.SaltLakeCity.660
*As measured by total staffed beds **A rate of 8% - 14% is typically ideal for mammography follow-up rates N/A = Not available/reported Green: at/above Na�onal Rate
Source: 2017 CMS.gov
Quality & Sa�sfac�on Key Quality Metrics of Top Five Largest Community Hospitals* – Salt Lake City Area
174

Id
9… 9_12_1A Output ProcedureType Hospital1 Hospital2 Hospital3 Hospital4 Hospital5
441
442443444445
446447448449450451
1
2345
6789
1011
Outpatient Quality Category
OP Surgical ProcedureVolume
Procedure Type
GastrointestinalEye
Nervous SystemMusculoskeletal
SkinGenitourinaryCardiovascular
RespiratoryOtherTotal
University Hospital
11,6603,982
4741,670
30,8453,3102,2576,097
60360,898
Intermountain MedicalCenter5,3851,809
259784
3,438949
1,896141317
14,978
Utah Valley Hospital
6,642490217
1,513
938071389022
10,012
Jordan Valley MedicalCenter4,239
125206
1,369
5,662594120380
12,353
McKay-Dee Hospital
7,60214
270461
1856708314
1129,411
Hospitals* – Salt Lake City AreaOutpa�ent Procedure Volumes of Top Five Largest CommunityQuality & Sa�sfac�on
Source: 2017 CMS.gov 9.11.V19.SaltLakeCity.660
VA Market Area Health Systems Op�miza�on
VISN 19: Salt Lake City Market — Salt Lake City
N/A = Not available/reported
*As measured by total staffed beds
• Most hospital outpa�ent procedures (99%) fall into one of eight categories: Cardiovascular, Eye, Gastrointes�nal, Genitourinary, Musculoskeletal, Nervous System, Skin, and Other
(CMS.gov; green: at/above Na�onal Rate)
• Research has suggested higher procedure volumes are associated with lower costs and be�er quality (Advisory Board).
Validation of the data for this slide is not required 175

Facili�es
176

1 2
Acres availableMain Pa�ent Care Facility Construc�on DateMost Recent Renova�on Date (Main Hospital Building)BGSF (campus total)DGSF (direct pa�ent care)Property SizeAnnual Opera�ons and Maintenance CostTotal 10-Year Capital Investment*Facili�es Condi�ons Assessment DeficienciesSeismic RiskOpera�onal Leases
0194919881,104,191 sq. �406,512 sq. � 37.0% of BGSF81 acres 0 acres available**$13,393,837$153,526,350$160,668,026 $2,698/UniqueHigh13 Leases $4,569,825 total annual cost 132,942 total NUSF
1 2 3
Facility Complexity Level (2017): High-1A 1
1 2 3
Facility Complexity Level (2017):FY18 Core Facility Uniques (VAMC only):
High-1A59,561
12
REAL PROPERTY OVERVIEW
10.1.V19.SaltLakeCity.660
VA Market Area Health Systems Op�miza�on
VISN 19: Salt Lake City Market — Salt Lake City
Facili�es
Facility Name: Salt Lake City
Inpa�ent Campus Snapshot
Source: CAI Buildings and FCA Condi�on Gaps Reports 9-7-2019, and CAPRES CEOSH Report 1-29-2019
* Sum of Major and Minor Con. and NRM spending** Provides an indica�on of any excess or surplus land, not currently in use and with no plans for future expansion needs that could be used for future development.
177

1. Includes Acute Psych, Medicine, and Surgical Beds
10.2.V19.SaltLakeCity.660
VA Market Area Health Systems Op�miza�on
VISN 19: Salt Lake City Market — Salt Lake City
Facili�es
Source: CAI Buildings, Floor, Leases, and FCA Red Green Reports 9-7-2019; VSSC Core Uniques Cube; CAPRES CEOSH Report 1-29-2019; Locally Provided GFI
Inpa�ent Campus and Outpa�ent Care Loca�ons
2. Includes Spinal Cord, Blind Rehab, CLC, DRRTP, and Intermediate Beds3. Only reflects SF related to VA owned and leased fixed facili�es
178

Major Construc�on Funding
$0
$50,000,000
$100,000,000
FY09 FY10 FY11 FY12 FY13 FY14 FY15 FY16 FY17 FY18
VHA Average Major VISN Average Major Facility Major
Measure Facility VISN Average VHA Average Id
FCA Backlog/SF**Current FCA BacklogInvestment/SF**Total 10-Year Capital Investment*Owned SF
$146$160,668,026
$139$153,526,350
1,104,191
$147$94,123,341
$399$289,616,572
725,580
$139$123,886,618
$155$137,521,745
886,486
2625252525
Investment – Salt Lake City
10.3.V19.SaltLakeCity.660
*Sum of Major and Minor Con. and NRM spending **Total 10-Year Capital Investment and Current FCA Backlog Divided by Owned SF
VA Market Area Health Systems Op�miza�on
VISN 19: Salt Lake City Market — Salt Lake City
Facili�esMinor Construc�on Funding
$0
$20,000,000
FY09 FY10 FY11 FY12 FY13 FY14 FY15 FY16 FY17 FY18
VHA Average Minor VISN Average Minor Facility Minor
NRM Funding
$0
$10,000,000
FY09 FY10 FY11 FY12 FY13 FY14 FY15 FY16 FY17 FY18
VHA Average NRM VISN Average NRM Facility NRM
Total Construc�on Funding
$0
$50,000,000
$100,000,000
FY09 FY10 FY11 FY12 FY13 FY14 FY15 FY16 FY17 FY18
VHA Average Total VISN Average Total Facility Total
Source: CAI Buildings and FCA Red Green Reports 9-7-2019; FMS 830 837, Accounts 110, 111, and 162 (Cost Center 8542, BOC 32XX, (less BOC 3222 and BOC 3224))
179

Site Plan
Source: Locally Provided GFI 10.4.V19.SaltLakeCity.660
VA Market Area Health Systems Op�miza�on
VISN 19: Salt Lake City Market — Salt Lake City
Facili�esSalt Lake City
180

Building Inventory (Owned)
Func�on Title Current Use YearBuilt
BuildingGross Sq.
Ft.
Outpa�entSq. Ft.
Inpa�ent Non-Clinical
Other Vacant Cost of FCADeficiencies*
FullReplacement
Cost
Historical Status SeismicRisk
TotalPa�ent Complex (1)Main Hospital (14)Research/Admin. (2)Psychiatry/Dom (3)Research/Laundry/Warehouse (7)Out Pa�ent Mental Health (16)Recrea�on/Canteen (8)HR/Financial/Admin. (4)Nutri�on & Food (5)Engineering/Boiler Plant/Shops (6)Fisher House (32)Na�onal Media Development (9)Concourse (Red-B.1 to B.3) (C1)Prosthe�cs Temp Lab (47)Misc. (T1)Engineering (38)Concourse (Blue-B.4 to B.2) (C2)Child Care (13)Concourse (Green-B.1 to B.8) (C3)
HospitalHospital
LaboratoriesHospital
LaboratoriesHospital
Ins�tu�onalOffice
ServiceServiceHousing
Ins�tu�onalAll Other
Outpa�ent F…ServiceService
All OtherIns�tu�onal
All Other
1949198119491949194920111949194919491949201119491949199319921987194919491949
1,104,191366,082217,935128,772
75,23050,10039,99335,65335,00030,59022,30014,63113,50011,350
6,4006,3695,8005,6445,6005,507
330,722139,794102,020
8,74026,125
034,923
7,100585
1,10000
2,4200
6,4001,515
0000
75,79051,210
00
24,580000000000000000
314,20228,76731,45495,230
2,84248,975
013,77827,12028,005
4,6300
9,12000
3,0045,000
000
363,233131,827
78,70124,80221,683
1,1255,070
14,7757,2951,485
17,67014,631
1,96011,350
01,850
8005,6445,6005,507
20,24414,484
5,76000000000000000000
$130,325,392$36,234,909$21,512,261$24,817,035$12,569,494
$9,153,901$933,682
$6,150,542$3,837,848$2,964,490$4,076,722
$35,909$1,065,956
$128,143$61,600
$110,637$134,237
$88,420$388,082
$51,787
$761,822,304$258,737,767$151,469,198
$93,328,821$49,148,336$35,468,941$26,374,357$23,108,953$22,192,905$21,994,629$14,129,001
$8,890,564$8,625,172$7,191,218$4,315,808$4,069,796$3,674,808$3,575,968$3,548,090$3,489,166
Not HistoricNot HistoricNot HistoricNot HistoricNot HistoricNot HistoricNot HistoricNot HistoricNot HistoricNot HistoricNot HistoricNot HistoricNot HistoricNot HistoricNot HistoricNot HistoricNot HistoricNot HistoricNot Historic
ExemptExemptExemptExemptExempt
Not ListedExemptExemptExemptExempt
Not ListedExempt
Non-Exe…Not Listed
ExemptExempt
Non-Exe…Exempt
Non-Exe…
Salt Lake City
Source: CAI Buildings & FCA Condi�on Gaps Report 9-7-2019 10.5.V19.SaltLakeCity.660
*Project Costs to remediate FCAs vary significantly, from below assessed value to more than 3 �mes the value **“Non-Contribu�ng” is a non-contribu�ng element of a landmark or listed district
VA Market Area Health Systems Op�miza�on
VISN 19: Salt Lake City Market — Salt Lake City
Facili�es
181

Building Inventory (Owned), cont.
Func�on Title Current Use YearBuilt
BuildingGross Sq.
Ft.
Outpa�entSq. Ft.
Inpa�ent Non-Clinical
Other Vacant Cost of FCADeficiencies*
FullReplacement
Cost
Historical Status SeismicRisk
Credit Union (CU)Emergency Prepardness (18)Research (45)Chiller Plant (27)Research ARF (37)P & H (25)Generator Structure (44)Safety/QA (T2)Research ARF (35)Engineering Trailers (6A-B)Research (30)Engineering (PH)Research (29)Safety (T4)
ServiceAll Other
LaboratoriesService
LaboratoriesWarehouses
All OtherService
LaboratoriesService
LaboratoriesService
LaboratoriesService
19772010198919641986198220101991198219871982198819491992
5,0005,0004,3703,5812,3661,4881,4001,3601,177
700696300177120
00000000000000
00000000000000
05,0004,370
02,3661,288
01,360
0600696300177120
5,00000
3,5810
2001,400
01,177
1000000
00000000000000
$51,500$183,581$341,677
$4,596,445$365,163
$56,506$1,000
$39,514$145,905$132,895
$62,473$19,653$13,425
$0
$3,167,938$3,167,938$3,295,002$2,268,877$1,783,976
$942,778$887,023$861,679$745,732$443,511$524,787$190,076$133,459
$76,031
Not HistoricNot HistoricNot HistoricNot HistoricNot HistoricNot HistoricNot HistoricNot HistoricNot HistoricNot HistoricNot HistoricNot HistoricNot HistoricNot Historic
Non-Exe…Not Listed
ExemptExempt
High RiskExempt
Not ListedExemptExemptExemptExemptExempt
Non-Exe…Exempt
Salt Lake City
Source: CAI Buildings & FCA Condi�on Gaps Report 9-7-2019 10.5.V19.SaltLakeCity.660#2
*Project Costs to remediate FCAs vary significantly, from below assessed value to more than 3 �mes the value **“Non-Contribu�ng” is a non-contribu�ng element of a landmark or listed district
VA Market Area Health Systems Op�miza�on
VISN 19: Salt Lake City Market — Salt Lake City
Facili�es
182

Func�on Title Current Use YearBuilt
BuildingGrossSq. Ft.
Outpa�entSq. Ft.
Inpa�ent Non-Clinical
Other Vacant Lease Termina�on (Hard) Year ofAc�va�on
Annual Rent
TotalSalt Lake Dental, Audilology, PFSWest Salt Lake Valley CBOCPocatello ClinicOgden CBOCBusiness Office Support ServicesSt. George CBOCOrem CBOCIdaho Falls OutreachGenomic Medicine SLCMental Health Tele-HubWeber County Clinic - LicenseElko CBOCPrice Telehealth Clinic
OtherCBOCCBOCCBOCOfficeCBOCCBOCCBOCIndependent OPCMental HealthMental HealthCBOCOutreach Clinic
2006200220061999197719962003200020002001
20162016
132,94245,17517,98015,235
9,1097,2437,1746,3746,1806,1364,7963,0502,6401,850
85,23219,15015,90015,235
9,1090
7,1746,3744,750
00
3,0502,6401,850
00000000000000
25,49911,020
1,10000
7,243000
6,1360000
6,2271000000
1,4300
4,796000
00000000000000
Wednesday, June 20, 2029Wednesday, September 30, 2020Saturday, May 23, 2037Tuesday, October 1, 2024Sunday, January 9, 2028Monday, January 1, 2024Wednesday, September 30, 2020Tuesday, October 31, 2028Thursday, September 30, 2027Friday, June 30, 2023Wednesday, September 30, 2020Thursday, April 29, 2021Tuesday, March 30, 2021
2018200920172014201820142009201820182019201820112011
$4,569,825$1,571,202
$535,804$697,420$358,895$331,717$226,461$213,004$100,958$199,334$120,539
$76,982$94,929$42,580
Source: CAI Leases Report 9-7-2019 10.6.V19.SaltLakeCity.660
VA Market Area Health Systems Op�miza�on
VISN 19: Salt Lake City Market — Salt Lake City
Facili�esSalt Lake City
Building Inventory (Leased)
183

Summary of Architectural and Engineering Challenges – Salt Lake City
Source: Locally Provided GFI 10.7.V19.SaltLakeCity.660
VA Market Area Health Systems Op�miza�on
VISN 19: Salt Lake City Market — Salt Lake City
Facili�es
184

Note: All ac�ve projects have received all levels of approvals and are assumed to be proceeding.
VA Market Area Health Systems Op�miza�on
VISN 19: Salt Lake City Market — Salt Lake City
10.8.V19.SaltLakeCity.660
Facili�es Ac�ve and Planned Projects — Salt Lake City
10_8 Program Project SF/ Count Status Es�matedCost
.
Ac�ve Minor Construc�on¹
Ac�ve NRMs¹
Construct Rehab/Prosthe�cs & Ortho/Neuro/Holis�c Medicine Addi�on (B.01) (660-302)Gait & Prosthe�cs Lab Addi�on (660-337)Genomic Medicine Addi�on (660-801)Parking Garage Expansion, Phase 2 (660-336)Urgent Care and Support Expansion (660-332)AMU Renova�on (660-18-254)B.08 Gait Lab Addi�on (660-CSI-105)B.2 Upgrades / Asbestos Abatement (660-17-228)B.7, B.35, B.37 Research Renova�on (660-17-104)B.9 (HBPC) Home Based Primay Care (660-19-03S)Campus Chilled Water Study (660-18-235)Campus wide Rekey (660-15-35S)Chilled Water and HVAC Upgrade, B.14 (660-15-108)Combined Heat and Power Plant (660-14-130)Consolidate Intensive Care Units (ICUs) (660-18-237)Construct Emergency Water Storage (660-15-112)CT Site Prep (660-CSI-112)Damper/Penetra�on Project (660-18-03S)Demolish Building 1 G Zone (660-18-232)Domes�c Water Study (660-18-241)
23,5008,000
16,84983,00035,130
4,5673,000
2,366
14,600
1,250
Construc�on Awarded 09/28/16Design Awarded 09/04/14
PlannedConstruc�on Awarded 09/28/16Construc�on Awarded 09/28/16Construc�on Awarded 12/28/18Construc�on Awarded 07/17/14
Design Awarded 07/31/18Design Awarded 09/24/18
PlannedDesign Awarded 09/21/18
PlannedDesign Awarded 09/18/18
Construc�on Awarded 07/22/14Design Awarded 11/26/18
PlannedConstruc�on Awarded 06/24/19Construc�on Awarded 06/01/18Construc�on Awarded 07/11/19
Design Awarded 09/19/18
$9,964,000$5,500,000
$15,900,000$9,900,000$9,850,000
$962,500$2,108,105
$853,000$2,825,000
$60,000$534,433
$2,515,000$3,300,000$8,927,137$5,830,000$2,700,000
$825,000$92,500
$800,000$300,000
11111111111111111111
Electrical Study (660-18-236) Design Awarded 09/19/18 $240,000 1
Source: 1. Capital Assets database (PTR as of 9-4-19) 2. Strategic Capital Investment Plan (FY2020 submission) 3. CFM Major Construc�on Monthly Report, ORP Project Repor�ng, CAI Proposed (New) Leases (9-7-19)
185

Note: All ac�ve projects have received all levels of approvals and are assumed to be proceeding.
VA Market Area Health Systems Op�miza�on
VISN 19: Salt Lake City Market — Salt Lake City
10.8.V19.SaltLakeCity.660#2
Facili�es Ac�ve and Planned Projects — Salt Lake City, cont.
10_8 Program Project SF/ Count Status Es�matedCost
.
Ac�ve NRMs¹ Energy Efficiency Building Improvements B.2,4,5,6,9 (660-15-121)Energy Efficiency, Commissioning Correc�ons (660-16-102)Expand Linen Distribu�on Center (660-18-243)Facility Roof Replacements (660-18-239)FY19 Under 25K (660-19-MISC19)Install Mental Health Door Alarms (660-19-105)Interven�onal Radiology Site Prep (660-CSI-111)Legionella - Mixing Valves, Schema�cs, Controls (660-15-111)MRI Site Prep (660-CSI-110)PET Scanner Site Prep (660-CSI-108)Pharmacy - USP 800 (660-19-104)Renovate Inpa�ent Substance Abuse (660-18-100)Replace Boiler #1 (660-17-100)Replace Cri�cal Power UPS and PDUs (660-18-242)Replace DA Tank and Expand Propane Storage (660-17-234)Solar PV Parking Garage (660-16-101)SPEC CT Imaging Site Prep (660-CSI-109)Specialty Clinic Renova�on (660-19-18S)Upgrade Elevators (660-18-231)Upgrade Fire Alarms (660-17-101)
10,000
8,571
700700
9,2001,000
4502,000
Construc�on Awarded 09/18/17Design Awarded 08/28/16Design Awarded 12/31/18
Construc�on Awarded 01/07/19Construc�on Awarded 10/25/18
PlannedDesign Awarded 07/03/18Design Awarded 05/03/18Design Awarded 09/19/18Design Awarded 08/06/18
PlannedConstruc�on Awarded 08/01/19
Design Awarded 08/08/18Construc�on Awarded 06/12/19Construc�on Awarded 05/29/19
PlannedDesign Awarded 07/27/18
Construc�on Awarded 08/01/19Construc�on Awarded 08/14/18
Design Awarded 09/04/18
$988,000$1,376,500$2,280,000$3,000,000
$200,000$200,000
$3,850,000$2,500,000
$209,000$280,000
$1,700,000$3,734,972$3,875,000
$880,000$1,430,000$4,180,000
$130,000$185,000
$3,200,000$1,679,700
11111111111111111111
Upgrade Public Address Mass No�fica�on System (PAMNS) (660-16-122) Design Awarded 12/20/17 $4,800,000 1
Source: 1. Capital Assets database (PTR as of 9-4-19) 2. Strategic Capital Investment Plan (FY2020 submission) 3. CFM Major Construc�on Monthly Report, ORP Project Repor�ng, CAI Proposed (New) Leases (9-7-19)
186

Note: All ac�ve projects have received all levels of approvals and are assumed to be proceeding.
VA Market Area Health Systems Op�miza�on
VISN 19: Salt Lake City Market — Salt Lake City
10.8.V19.SaltLakeCity.660#3
Facili�es Ac�ve and Planned Projects — Salt Lake City, cont.
10_8 Program Project SF/ Count Status Es�matedCost
.
Ac�ve NRMs¹
Ac�ve Projects Total Es�mated Cost (Major, Minor, NRM)¹Minor Leases in Procurement
SCIP FY2020 Submi�ed Projects (10-Year-Plan)
USP 800/797 Upgrade (Terminal HEPA) (660-19-110)Whole Health (660-18-252)Ac�ve Projects Total Es�mated Cost (Major, Minor, NRM)Replacement Lease of Ogden CBOC (Proposed New)Replacement Lease Orem CBOC (Proposed New)Minor Construc�onMinor LeasesNRM-Infrastructure Moderniza�onNRM-SustainmentTotal Es�mated Cost SCIP Projects
2,100
23,2586,578
4392
18
Construc�on Awarded 08/29/19Construc�on Awarded 12/31/18
Proposed New (CAI)Proposed New (CAI)
$119,000$618,000
$125,401,847$794,883$405,894
$44,230,000$11,981,000$36,710,000
$9,285,000$102,206,000
1111111111
Source: 1. Capital Assets database (PTR as of 9-4-19) 2. Strategic Capital Investment Plan (FY2020 submission) 3. CFM Major Construc�on Monthly Report, ORP Project Repor�ng, CAI Proposed (New) Leases (9-7-19)
187

Mission
188

Mission
Source: Facility Summary Report provided by Office of Academic Affiliation 11.1.V19.SaltLakeCity.660
*Base Posi�ons = Training Posi�ons, GME = Graduate Medical Educa�on, VACAA = Addi�onal GME Slots aligned to The Veterans Access, Choice, and Accountability Act of 2014 (VACAA).
VA Market Area Health Systems Op�miza�on
VISN 19: Salt Lake City Market — Salt Lake City
Medical Educa�on/Training – Salt Lake City11_1 Sponsoring Facility Program Type Specialty D
O
Salt Lake City VAMCUniversity of Utah Medical Center
DentalGMEGMEGMEGMEVACAAGMEGMEGMEVACAAGMEGMEGMEGMEGMEVACAAGMEGMEGME
Den�stry - General Prac�ce Residency 12 MonthsAddic�on MedicineAddic�on psychiatryAnesthesiologyCardiovascular diseaseCardiovascular diseaseChief Resident (IM - Quality and Pa�ent Safety)Chief Resident (IM)DermatologyDermatologyEmergency medicineEndocrinology, diabetes, and metabolismFamily medicineGastroenterologyGeriatric medicineGeriatric medicineHematology and OncologyHospice and pallia�ve medicine (mul�disciplinary)Infec�ous Disease
4.00.01.02.06.01.02.03.03.01.02.01.51.04.02.00.32.00.22.0
123456789
10111213141516171819
Sponsoring Facility Program Type Specialty AY 2019 Training Positions (FTEs)*
DO
Salt Lake City VAMCUniversity of Utah Medical Center
DentalGMEGMEGMEGMEVACAAGMEGMEGMEVACAAGMEGMEGMEGMEGMEVACAAGMEGMEGME
Den�stry - General Prac�ce Residency 12 MonthsAddic�on MedicineAddic�on psychiatryAnesthesiologyCardiovascular diseaseCardiovascular diseaseChief Resident (IM - Quality and Pa�ent Safety)Chief Resident (IM)DermatologyDermatologyEmergency medicineEndocrinology, diabetes, and metabolismFamily medicineGastroenterologyGeriatric medicineGeriatric medicineHematology and OncologyHospice and pallia�ve medicine (mul�disciplinary)Infec�ous Disease
4.00.01.02.06.01.02.03.03.01.02.01.51.04.02.00.32.00.22.0
123456789
10111213141516171819
189

Mission
Source: Facility Summary Report provided by Office of Academic Affiliation 11.1.V19.SaltLakeCity.660#2
*Base Posi�ons = Training Posi�ons, GME = Graduate Medical Educa�on, VACAA = Addi�onal GME Slots aligned to The Veterans Access, Choice, and Accountability Act of 2014 (VACAA).
VA Market Area Health Systems Op�miza�on
VISN 19: Salt Lake City Market — Salt Lake City
Medical Educa�on/Training – Salt Lake City, cont.11_1 Sponsoring Facility Program Type Specialty D
O
University of Utah Medical Center GMEVACAAGMEGMEGMEGMEVACAAGMEGMEVACAAGMEGMEGMEGMEGMEGMEVACAAGMEVACAA
Internal medicineInternal medicineInterven�onal cardiologyNephrologyNeurological surgeryNeurologyNeurologyObstetrics and gynecologyOphthalmologyOphthalmologyOrthopaedic surgeryOtherOtolaryngologyPain MedicinePathology-Anatomic and ClinicalPhysical medicine and rehabilita�onPhysical medicine and rehabilita�onPlas�c surgeryPlas�c surgery - integrated
46.49.11.02.01.06.01.00.33.01.05.01.02.00.70.05.02.01.01.0
20212223242526272829303132333435363738
Sponsoring Facility Program Type Specialty AY 2019 Training Positions (FTEs)*
DO
University of Utah Medical Center GMEVACAAGMEGMEGMEGMEVACAAGMEGMEVACAAGMEGMEGMEGMEGMEGMEVACAAGMEVACAA
Internal medicineInternal medicineInterven�onal cardiologyNephrologyNeurological surgeryNeurologyNeurologyObstetrics and gynecologyOphthalmologyOphthalmologyOrthopaedic surgeryOtherOtolaryngologyPain MedicinePathology-Anatomic and ClinicalPhysical medicine and rehabilita�onPhysical medicine and rehabilita�onPlas�c surgeryPlas�c surgery - integrated
46.49.11.02.01.06.01.00.33.01.05.01.02.00.70.05.02.01.01.0
20212223242526272829303132333435363738
190

Mission
Source: Facility Summary Report provided by Office of Academic Affiliation 11.1.V19.SaltLakeCity.660#3
*Base Posi�ons = Training Posi�ons, GME = Graduate Medical Educa�on, VACAA = Addi�onal GME Slots aligned to The Veterans Access, Choice, and Accountability Act of 2014 (VACAA).
VA Market Area Health Systems Op�miza�on
VISN 19: Salt Lake City Market — Salt Lake City
Medical Educa�on/Training – Salt Lake City, cont.11_1 Sponsoring Facility Program Type Specialty D
O
University of Utah Medical Center
Other Training Programs
GMEGMEGMEGMEGMEGMEGMEGMEGMEVACAAGMEAdvanced FellowsAdvanced FellowsAssociated HealthAdvanced FellowsAdvanced FellowsNursingNursingNursing
Preven�ve medicinePsychiatryPulmonary disease and cri�cal care medicineRadiology-diagnos�cRheumatologySleep MedicineSurgery-generalThoracic surgeryUrologyUrologyVascular surgeryAdvanced Geriatrics (GRECC)Advanced Psychology (MIRECC)Audiology Doctoral Extern (4th Year)Medical Informa�cs (MD)Medical Informa�cs (PhD)Nursing - Clinical Nurse SpecialistNursing - Nurse Prac��onerNursing - Nurse Prac��oner (NP)
2.010.2
3.09.02.50.35.30.53.01.01.02.51.01.02.04.20.0
25.06.0
39404142434445464748495051525354555657
Sponsoring Facility Program Type Specialty AY 2019 Training Positions (FTEs)*
DO
University of Utah Medical Center
Other Training Programs
GMEGMEGMEGMEGMEGMEGMEGMEGMEVACAAGMEAdvanced FellowsAdvanced FellowsAssociated HealthAdvanced FellowsAdvanced FellowsNursingNursingNursing
Preven�ve medicinePsychiatryPulmonary disease and cri�cal care medicineRadiology-diagnos�cRheumatologySleep MedicineSurgery-generalThoracic surgeryUrologyUrologyVascular surgeryAdvanced Geriatrics (GRECC)Advanced Psychology (MIRECC)Audiology Doctoral Extern (4th Year)Medical Informa�cs (MD)Medical Informa�cs (PhD)Nursing - Clinical Nurse SpecialistNursing - Nurse Prac��onerNursing - Nurse Prac��oner (NP)
2.010.2
3.09.02.50.35.30.53.01.01.02.51.01.02.04.20.0
25.06.0
39404142434445464748495051525354555657
191

Mission
Source: Facility Summary Report provided by Office of Academic Affiliation 11.1.V19.SaltLakeCity.660#4
*Base Posi�ons = Training Posi�ons, GME = Graduate Medical Educa�on, VACAA = Addi�onal GME Slots aligned to The Veterans Access, Choice, and Accountability Act of 2014 (VACAA).
VA Market Area Health Systems Op�miza�on
VISN 19: Salt Lake City Market — Salt Lake City
Medical Educa�on/Training – Salt Lake City, cont.11_1 Sponsoring Facility Program Type Specialty D
O
Other Training Programs NursingAssociated HealthAssociated HealthAssociated HealthAssociated HealthAssociated HealthAssociated HealthAssociated HealthAssociated HealthAssociated HealthAssociated Health
Nursing - ResidencyNutri�on/Diete�cs InternOccupa�onal TherapyOptometry ResidentPharmacy ResidentPhysical TherapyPhysician Assistant (Masters)Podiatry ResidentPsychologySocial WorkSpeech Pathology Fellow
10.05.07.02.07.0
21.012.0
8.013.015.0
1.0
5859606162636465666768
Sponsoring Facility Program Type Specialty AY 2019 Training Positions (FTEs)*
DO
Other Training Programs NursingAssociated HealthAssociated HealthAssociated HealthAssociated HealthAssociated HealthAssociated HealthAssociated HealthAssociated HealthAssociated HealthAssociated Health
Nursing - ResidencyNutri�on/Diete�cs InternOccupa�onal TherapyOptometry ResidentPharmacy ResidentPhysical TherapyPhysician Assistant (Masters)Podiatry ResidentPsychologySocial WorkSpeech Pathology Fellow
10.05.07.02.07.0
21.012.0
8.013.015.0
1.0
5859606162636465666768
192

Mission
Source: Facility Summary Report provided by Office of Academic Affiliation 11.1.V19.SaltLakeCity.660#4
*Base Positions = Training Positions
VA Market Area Health Systems Op�miza�on
VISN 19: Salt Lake City Market — Salt Lake City
Medical Educa�on/Training – Salt Lake City, cont.
193
talligood001
Stamp

Funding Group Number ofProjects
Reported CostFY17
.
Department of Veterans Affairs (VACO)Other U.S. Federal AgencyPrivate Proprietary CompanyNa�onal Ins�tutes of Health (NIH)Academic Ins�tu�on, Donor, or GovernmentVoluntary Agency or Founda�on
811824171510
$12,329,581$3,547,168$2,442,186$2,061,782
$884,998$353,588
12329581354716824421862061782
884998353588
TOTAL 165 $21,619,303 21619303
Research dollars for the Quality Enhancement Research Ini�a�ve (QUERI) are included in the formula for alloca�ng research support dollars.
Medical Center % Na�onal 2019VERA Alloca�on
Total Research VERAAlloca�on
DisplayOrder
(V19) (660) Salt Lake CityNa�onal Total
2.0%100.0%
$21,619,303$1,067,382,760
12
Source: FY2019 VERA Research Back Up Data and Allocation on file 11.3.V19.SaltLakeCity.660
VA Market Area Health Systems Op�miza�on
VISN 19: Salt Lake City Market — Salt Lake City
Mission
VERA Alloca�on
Total VAMC Supported Research Projects
2019 VERA Alloca�on vs Average Na�onal Alloca�on*
$0
$5,000,000
$10,000,000
$15,000,000
$20,000,000
$25,000,000$21,619,303
$11,411,136
VAMC Na�onal Average
*96 VAMCs received VERA Alloca�on for FY19
Rank: 20 out of 96 research sites (ranked by total funding)
2019 VERA Alloca�on vs Average Na�onal Alloca�on*
Research – Salt Lake City
194

Project Name FY17 Actual Funding¹ .
Veterans Informa�cs and Compu�ng Infrastructure (VINCI): Opera�onal ProtocolDevelopment of highly Func�onal, Neurally Controlled, Skeletally A�ached, andIntelligent Prosthe�c DevicesEpidemiology, Treatment prac�ces and outcomes of malignancies in VHA: Prac�ces,Resource U�liza�on, treatment Effec�veness across CLL Illness trajectory in actualprac�ce Se�ngs in the modern Era with focus on Relapsed/Refractory disease(PRECISE-Salt Lake Informa�cs, Decision-Enhancement and Analy�c Sciences Center (IDEAS2.0) / Center of Innova�on (COIN)Enable NHSN Enrollment of All VA Medical Centers and Report An�microbial Useand Resistance Data.
$1,390,450$874,517
$820,996
$748,200
$517,177
1390450874517
820996
748200
517177
Project Title FY17 Actual Funding¹ .
Veterans Informa�cs and Compu�ng Infrastructure (VINCI): Opera�onal ProtocolSalt Lake Informa�cs, Decision-Enhancement and Analy�c Sciences Center (IDEAS2.0) / Center of Innova�on (COIN)Immune responses in trauma�c RGC deathCollec�ng duct renin regula�on of blood pressure in health and hypertensionVascular Func�on in Health and Disease: Rehabilita�on for Hypertension andAlzheimer's Disease; Excercise and Skeletal Muscle Afferent Feedback; Passive limbmovement: A tool to assess vascular health and guide rehabilita�on.
$1,390,450$748,200
$466,355$418,269$319,946
1390450748200
466355418269319946
Research – Salt Lake City, cont.
Top 5 VACO-Funded Projects by $
Source: FY17 Research Submissions by VISN and Facility 11.4.V19.SaltLakeCity.6601. The project’s actual (non-discounted) grant dollars.
VA Market Area Health Systems Op�miza�on
VISN 19: Salt Lake City Market — Salt Lake City
MissionTop 5 Projects by Funding $
195

Cost
196
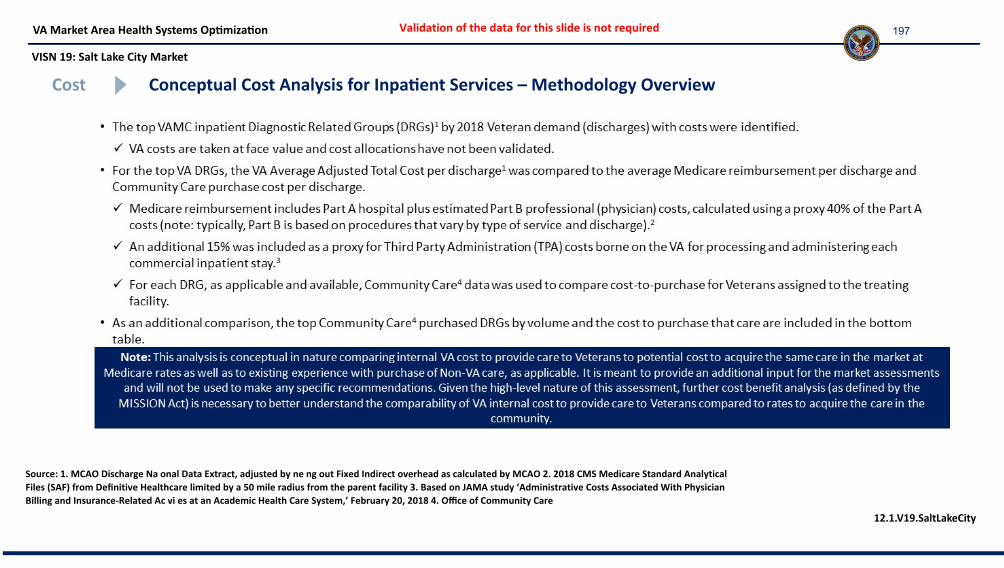
12.1.V19.SaltLakeCity
VA Market Area Health Systems Op�miza�on
VISN 19: Salt Lake City Market
Cost Conceptual Cost Analysis for Inpa�ent Services – Methodology Overview
Source: 1. MCAO Discharge Na onal Data Extract, adjusted by ne ng out Fixed Indirect overhead as calculated by MCAO 2. 2018 CMS Medicare Standard AnalyticalFiles (SAF) from Definitive Healthcare limited by a 50 mile radius from the parent facility 3. Based on JAMA study ‘Administrative Costs Associated With Physician Billing and Insurance-Related Ac vi es at an Academic Health Care System,’ February 20, 2018 4. Office of Community Care
Validation of the data for this slide is not required 197

Conceptual Cost Analysis for Inpa�ent Services – Salt Lake City
12.2.V19.SaltLakeCity.660
VA Market Area Health Systems Op�miza�on
VISN 19: Salt Lake City Market — Salt Lake City
Cost
Validation of the data for this slide is not required 198

VISN 19 Salt Lake City Market Data Discovery & Findings Informational Addendum – Enrollment Proximity Analysis
199

VA Market Area Health Systems Optimization
VISN 19: Salt Lake City Market
Access Enrollment Proximity to VA Site (HSA and HRR Alignment)
2
200

VA Market Area Health Systems Optimization
VISN 19: Salt Lake City Market
Access Enrollment Proximity to VA Site (30- and 60-minute Drive Times)*
3
* VA sites include VAMCs, HCCs, MS CBOCs, CBOCs, and OOS; drive times are not comparable to Primary and Secondary Care Enrollment Access measures as defined by PSSG.
201

VA Market Area Health Systems Optimization
VISN 19: Salt Lake City Market
Access Enrollment Proximity to VA Site* by Facility
4
Facility NameFacility
Classification
Total (Overlapping)** Non-Overlapping***30 min 60 min 30 min 60 min
Enrollees Users Enrollees Users Enrollees Users Enrollees Users(V19) (660) Salt Lake City VAMC 20,132 12,956 43,235 26,002 6,813 4,352 7,123 4,538(V19) (660GA) Pocatello CBOC 3,296 2,355 6,685 4,722 3,296 2,355 3,816 2,746(V19) (660GB) Ogden CBOC 14,770 8,374 38,046 23,166 8,655 5,026 10,560 6,143(V19) (660GD) Roosevelt OOS 509 399 1,121 818 509 399 1,121 818(V19) (660GE) Orem CBOC 10,510 5,986 31,968 19,624 7,600 4,169 8,391 4,662(V19) (660GG) St. George CBOC 4,200 2,834 6,663 4,384 4,200 2,834 6,663 4,384(V19) (660GJ) Western Salt Lake MS-CBOC 24,265 15,447 43,480 26,134 15,343 9,894 15,635 10,080(V19) (660GK) Elko OOS 1,207 728 1,268 770 1,207 728 1,268 770(V19) (660QA) Idaho Falls OOS 3,462 2,399 7,292 5,096 3,462 2,399 4,112 2,829(V19) (660QB) Price OOS 622 433 710 496 622 433 710 496(V19) (660QC) Weber County OOS 14,770 8,374 38,808 23,663 4,708 2,498 4,734 2,514
FY18Q4 Enrollment by ZIP Code. Enrollee population within each Point of Care’s (POC) drive time (30 and 60 minutes) was calculated by intersecting the drive-time area and the ZIP Code Centroid, then aggregating the ZIP code population to the POC.
* VA sites include VAMCs, HCCs, MS CBOCs, CBOCs, and OOS; drive times are not comparable to Primary and Secondary Care Enrollment Access measures as defined by PSSG. ** Drive time polygons overlap and may include ZIP code population assigned to two or more POC.*** Drive time polygons are adjusted to closest facility to eliminate overlap and duplication of ZIP code population assignment to a POC.
202

VA Market Area Health Systems Optimization
VISN 19: Salt Lake City Market
Access Enrollment Proximity to VA Site* by County
5
CountyName
TotalEnrollees
Enrollees Outside of 30-Minute Drive Time
Enrollees Outside of 60-Minute Drive Time
Bannock, ID 2,719 121 0
Bear Lake, ID 160 160 59Beaver, UT 140 140 140Bingham, ID 1,084 93 0Bonneville, ID 2,624 38 0Box Elder, UT 1,053 973 33Cache, UT 1,526 1,526 688Carbon, UT 556 0 0Caribou, ID 177 177 145Clark, ID 14 14 0Daggett, UT 47 47 47Davis, UT 7,868 0 0Duchesne, UT 486 56 38Elko, NV 1,431 224 163Emery, UT 197 131 9Franklin, ID 226 226 226Fremont, ID 343 343 124Garfield, UT 157 157 157Iron, UT 1,303 1,303 178Jefferson, ID 610 27 0Juab, UT 216 216 0Kane, UT 241 241 241Madison, ID 352 352 0Millard, UT 236 236 236Morgan, UT 228 4 0
FY18Q4 Enrollment by ZIP Code. Enrollee population within each Point of Care’s (POC) drive time (30 and 60 minutes) was calculated by intersecting the drive-time area and the ZIP Code Centroid, then aggregating the ZIP code population to the POC.
* VA sites include VAMCs, HCCs, MS CBOCs, CBOCs, and OOS; drive times are not comparable to Primary and Secondary Care Enrollment Access measures as defined by PSSG.
CountyName
TotalEnrollees
Enrollees Outside of 30-Minute Drive Time
Enrollees Outside of 60-Minute Drive Time
Oneida, ID 151 151 5
Piute, UT 47 47 47Power, ID 133 133 0Rich, UT 39 33 21Salt Lake, UT 19,093 1 1Sanpete, UT 621 621 515Sevier, UT 519 519 519Summit, UT 583 333 0Teton, ID 140 140 140Tooele, UT 1,835 457 110Uintah, UT 673 594 0Utah, UT 6,388 47 0Wasatch, UT 379 367 0Washington, UT 4,412 212 0Wayne, UT 55 55 55Weber, UT 6,725 127 0White Pine, NV 391 391 391
203

VISN 19 Data Discovery & Findings Informational Addendum – DOD Data
204

VISN 19-f Salt Lake City
22
205

VA Market Area Health Systems Optimization
VISN 19: Salt Lake City Market
Market OverviewDemographics
Source: 1. BY17 EHCPM 2. VSSC Unique Patients Cube 3. DoD M2 Data System
Existing VHA-DOD Construct
23
Key Market Statistics
Total 2017 VA Enrollee Population: 67,400
• Top Counties by Enrollee Population:
o Salt Lake, UT: 20,618
o Davis, UT: 7,758
o Weber, UT: 6,654
• Total Enrollees: 56thof 96 markets
2018 Core Uniques*: 43,321
VAMC:
• (V19) (660) Salt Lake City
DOD Clinic:
• (119) AF-C-75th MED GRP-HILL
*Core uniques excludes uniques who have only usedtelephone triage, pharmacy, and lab.
206

Click to edit Master title style
Post-DD&F Data Addendum

Data Compendium - General Information
VA Market Area Health Systems Optimization
PurposeThe Data Discovery and Findings (DD&F) data books prepared for each market presented a standardized collection of data used across markets to understand important aspects of each market. Because of the passage of time since the original market assessment phases were conducted, VA has developed an appendix to the DD&F to capture more recent data for key data points. Because the COVID-19 pandemic impacted 2020 and 2021 data, 2019 was the latest fiscal year incorporated for most data elements.
ContentsProjected PopulationRuralityOutpatient DemandOutpatient EncountersSpecialty Care EncountersSurgical CasesInpatient Demand (Facility Level)Market DemandEnrollment ProximityFacilityBuilding FCAAcademic MissionResearch MissionFootnotesSources
Additional InformationThe Footnotes page provides additional details about tables and individual data elements when required. The Sources page provides the relevant data cube or program office sourcing information for each of the data elements.

Projected Veteran Enrollee and Eligible Population (Market)
VA Market Area Health Systems Optimization
Market Group FY19 FY29 10 Year % Growth
(V19) Salt Lake City Eligible Veterans 108,897 98,553 -9.5%
Enrollees 68,864 69,576 1.0%

Market Population Rank (out of 95 markets)
VA Market Area Health Systems Optimization
Market Total Enrollee Rank FY19
Total Enrollee Rank FY29
% Change Rank
(V19) Salt Lake City 54 50 28

County-Based Enrollee Projections
VA Market Area Health Systems Optimization
Market Sector County FY19 Enrollees FY29 Enrollees 10 Year % Change
(V19) Salt Lake City 19-f-9-A (49035) Salt Lake, UT 20,232 18,666 -7.7%
19-f-9-B (32007) Elko, NV 1,433 1,371 -4.3%
(32033) White Pine, NV 389 368 -5.6%
(49001) Beaver, UT 146 146 0.0%
(49003) Box Elder, UT 1,066 1,114 4.5%
(49005) Cache, UT 1,557 1,647 5.8%
(49007) Carbon, UT 568 527 -7.3%
(49009) Daggett, UT 50 41 -17.8%
(49013) Duchesne, UT 488 457 -6.2%
(49015) Emery, UT 211 187 -11.3%
(49017) Garfield, UT 157 151 -3.5%
(49021) Iron, UT 1,387 1,368 -1.4%
(49023) Juab, UT 218 201 -7.9%
(49025) Kane, UT 257 248 -3.5%
(49027) Millard, UT 254 237 -6.9%
(49029) Morgan, UT 243 302 24.5%
(49031) Piute, UT 49 48 -0.1%
(49033) Rich, UT 41 41 -0.7%
(49039) Sanpete, UT 647 636 -1.6%
(49041) Sevier, UT 540 527 -2.4%
(49043) Summit, UT 580 584 0.7%
(49045) Tooele, UT 1,868 1,960 5.0%
(49047) Uintah, UT 678 632 -6.8%
(49049) Utah, UT 6,589 6,781 2.9%
(49051) Wasatch, UT 395 391 -1.3%
(49053) Washington, UT 4,658 4,960 6.5%
(49055) Wayne, UT 61 52 -14.6%
19-f-9-D (49011) Davis, UT 8,053 9,014 11.9%
(49057) Weber, UT 7,052 7,786 10.4%
19-f-9-E (16005) Bannock, ID 2,767 2,803 1.3%
(16007) Bear Lake, ID 174 164 -5.9%
(16011) Bingham, ID 1,111 1,124 1.1%

County-Based Enrollee Projections
VA Market Area Health Systems Optimization
Market Sector County FY19 Enrollees FY29 Enrollees 10 Year % Change
(V19) Salt Lake City 19-f-9-E (16019) Bonneville, ID 2,748 2,835 3.2%
(16029) Caribou, ID 178 167 -6.2%
(16033) Clark, ID 12 14 21.2%
(16041) Franklin, ID 237 249 5.1%
(16043) Fremont, ID 342 332 -2.8%
(16051) Jefferson, ID 642 651 1.5%
(16065) Madison, ID 374 375 0.2%
(16071) Oneida, ID 146 151 2.8%
(16077) Power, ID 140 146 3.9%
(16081) Teton, ID 127 122 -3.8%

Projected Veteran Enrollee and Eligible Population (Demographics)
VA Market Area Health Systems Optimization
Market Group Measure Description
Measure Categories
FY19 FY29 10 Year % Change
(V19) Salt Lake City Eligible Veterans Age <45 31,598 28,266 -10.5%
45-64 27,292 29,834 9.3%
65+ (Combination)
50,007 40,453 -19.1%
65-84 40,111 32,982 -17.8%
85-89 6,180 4,495 -27.3%
90+ 3,716 2,976 -19.9%
Gender Female 8,809 10,967 24.5%
Male 100,088 87,586 -12.5%
Priority Priority 1-6 83,891 79,259 -5.5%
Priority 7-8 25,006 19,294 -22.8%
Enrollees Age <45 18,652 16,517 -11.4%
45-64 18,083 23,189 28.2%
65+ (Combination)
32,129 29,870 -7.0%
65-84 26,780 25,232 -5.8%
85-89 3,393 2,875 -15.3%
90+ 1,956 1,763 -9.9%
Gender Female 4,986 7,311 46.6%
Male 63,878 62,265 -2.5%
Priority Priority 1-6 52,129 58,471 12.2%
Priority 7-8 16,735 11,105 -33.6%

Market Enrollment Rurality (FY19)
VA Market Area Health Systems Optimization
Market Rural Enrollees Total Enrollees % Rurality
(V19) Salt Lake City 16,629 67,055 24.8%

County Enrollment Rurality
VA Market Area Health Systems Optimization
Market County Rural Enrollee Total Enrollees % Rurality
(V19) Salt Lake City Bannock, ID 357 2,677 13.3%
Bear Lake, ID 171 171 100.0%
Beaver, UT 134 134 100.0%
Bingham, ID 1,064 1,069 99.5%
Bonneville, ID 205 2,715 7.6%
Box Elder, UT 458 1,043 43.9%
Cache, UT 148 1,513 9.8%
Carbon, UT 548 548 100.0%
Caribou, ID 167 167 100.0%
Clark, ID 13 13 100.0%
Daggett, UT 49 49 100.0%
Davis, UT 0 8,094 0.0%
Duchesne, UT 439 439 100.0%
Elko, NV 1,432 1,432 100.0%
Emery, UT 200 200 100.0%
Franklin, ID 231 231 100.0%
Fremont, ID 325 325 100.0%
Garfield, UT 154 154 100.0%
Iron, UT 1,387 1,387 100.0%
Jefferson, ID 580 580 100.0%
Juab, UT 245 245 100.0%
Kane, UT 251 251 100.0%
Madison, ID 375 375 100.0%
Millard, UT 234 234 100.0%
Morgan, UT 228 228 100.0%
Oneida, ID 139 139 100.0%
Piute, UT 50 50 100.0%
Power, ID 168 168 100.0%
Rich, UT 41 41 100.0%
Salt Lake, UT 10 19,622 0.1%
Sanpete, UT 624 624 100.0%
Sevier, UT 519 519 100.0%

County Enrollment Rurality
VA Market Area Health Systems Optimization
Market County Rural Enrollee Total Enrollees % Rurality
(V19) Salt Lake City Summit, UT 571 571 100.0%
Teton, ID 134 134 100.0%
Tooele, UT 1,816 1,816 100.0%
Uintah, UT 680 680 100.0%
Utah, UT 405 6,422 6.3%
Wasatch, UT 413 413 100.0%
Washington, UT 1,021 4,493 22.7%
Wayne, UT 59 59 100.0%
Weber, UT 214 6,660 3.2%
White Pine, NV 370 370 100.0%

FY19 Market Core Uniques
VA Market Area Health Systems Optimization
Market Name Core Uniques
(V19) Salt Lake City 44,182

Core Uniques
VA Market Area Health Systems Optimization
Market Facility FY15 FY16 FY17 FY18 FY19 5 Year % Change
(V19) Salt Lake City (V19) (660) George E. Wahlen Department of Veterans Affairs Medical Center
49,818 50,379 56,825 58,557 58,978 18.4%
(V19) (660BU) Salt Lake City Domiciliary 277 132 139 127 119 -57.0%
(V19) (660GB) Ogden VA Clinic 5,583 5,886 5,706 5,699 5,556 -0.5%
(V19) (660GD) Roosevelt VA Clinic 755 714 739 739 744 -1.5%
(V19) (660GE) Orem VA Clinic 3,555 3,578 3,452 3,157 3,278 -7.8%
(V19) (660GG) St. George VA Clinic 3,500 3,836 4,015 3,884 4,447 27.1%
(V19) (660GJ) South Jordan VA Clinic 6,388 5,828 6,526 6,161 6,155 -3.6%
(V19) (660GK) Elko VA Clinic 618 605 579 639 667 7.9%
(V19) (660QA) Idaho Falls VA Clinic 548 1,314 2,270
(V19) (660QB) Price VA Clinic 202 407 487

Emergency Department (ED) Encounters
VA Market Area Health Systems Optimization
Market Facility Measure FY17 FY18 FY19 3 Year % Change
(V19) Salt Lake City (V19) (660) Salt Lake City 99281 131 190 249 90.1%
99282 974 803 1,259 29.3%
99283 9,073 7,814 7,228 -20.3%
99284 7,193 8,842 7,444 3.5%
99285 2,807 2,444 3,150 12.2%
Total Encounters 20,178 20,093 19,330 -4.2%

ED % Transfers & Admissions
VA Market Area Health Systems Optimization
Market Description Facility Measure FY17 FY18 FY19
(V19) Salt Lake City (V19) (660) Salt Lake City % Transfers 2.9% 3.0% 2.2%
VA Admission % 16.8% 17.5% 17.7%

Outpatient Encounters (FY17-19)
VA Market Area Health Systems Optimization
Market Facility Clinic Grouping FY17 FY18 FY19 3 Year % Change
(V19) Salt Lake City (V19) (660) Salt Lake City Mental Health 115,086 133,646 134,626 17.0%
Primary Care 61,275 68,717 75,540 23.3%
Specialty Care 448,825 460,331 461,998 2.9%
(V19) (660GA) Pocatello Mental Health 5,322 4,477 4,611 -13.4%
Primary Care 15,309 14,266 13,655 -10.8%
Specialty Care 7,027 6,526 9,710 38.2%
(V19) (660GB) Ogden Mental Health 8,273 7,432 3,717 -55.1%
Primary Care 18,027 17,659 17,554 -2.6%
Specialty Care 10,337 11,123 11,015 6.6%
(V19) (660GD) Roosevelt Mental Health 224 293 357 59.4%
Primary Care 2,201 2,182 2,707 23.0%
Specialty Care 277 313 413 49.1%
(V19) (660GE) Orem Mental Health 4,510 3,803 3,768 -16.5%
Primary Care 10,205 9,211 9,480 -7.1%
Specialty Care 7,703 7,840 8,108 5.3%
(V19) (660GG) St. George Mental Health 1,746 2,430 2,824 61.7%
Primary Care 10,118 10,472 11,943 18.0%
Specialty Care 10,873 10,985 11,642 7.1%
(V19) (660GJ) Western Salt Lake Mental Health 1,954 1,912 1,930 -1.2%
Primary Care 21,229 20,293 20,236 -4.7%
Specialty Care 4,508 4,054 3,354 -25.6%
(V19) (660GK) Elko Mental Health 122 177 348 185.2%
Primary Care 1,215 2,119 2,352 93.6%
Specialty Care 820 1,293 1,140 39.0%
(V19) (660QA) Idaho Falls Mental Health 69 387 820 1088.4%
Primary Care 646 3,053 5,792 796.6%
Specialty Care 795 3,351 3,617 355.0%
(V19) (660QB) Price Mental Health 72 252 218 202.8%
Primary Care 226 1,049 1,293 472.1%
Specialty Care 236 863 851 260.6%

Specialty Care Encounters (FY17-19)
VA Market Area Health Systems Optimization
Market Facility Specialty FY17 FY18 FY19 3 Year % Change
(V19) Salt Lake City (V19) (660) George E. Wahlen Department of Veterans Affairs Medical Center
Allergy and Immunology
1,145 1,648 1,515 32.3%
Anesthesiology 6,272 7,689 9,375 49.5%
Audiology / Speech Pathology
17,714 17,848 17,549 -0.9%
Blind Rehabilitation 80 85 139 73.8%
Cardiology 25,508 25,313 26,881 5.4%
Critical Care / Pulmonary Disease
12,152 18,477 20,389 67.8%
Dermatology 7,150 6,941 7,195 0.6%
Emergency Medicine 20,483 20,483 19,460 -5.0%
Endocrinology 3,621 4,400 4,677 29.2%
Gastroenterology 7,242 7,293 7,914 9.3%
Geriatric Medicine 9,732 9,773 10,485 7.7%
Hematology-Oncology 5,919 6,179 6,073 2.6%
Infectious Disease 1,054 936 1,019 -3.3%
Nephrology 5,834 6,687 4,167 -28.6%
Neurological Surgery 1,010 1,394 2,146 112.5%
Neurology 5,157 5,493 5,323 3.2%
Nutrition 1,797 1,871 1,964 9.3%
Obstetrics & Gynecology
369 443 489 32.5%
Occupational Health 1,195 858 995 -16.7%
Ophthalmology 10,137 10,306 10,080 -0.6%
Optometry 20,254 19,110 17,942 -11.4%
Orthopaedic Surgery 6,251 6,500 6,182 -1.1%
Otolaryngology 2,894 2,920 2,806 -3.0%
Pain Medicine 3,547 3,796 5,711 61.0%
Pathology 146,794 145,613 142,353 -3.0%
Pharmacy 10,791 15,877 14,839 37.5%
Physical Medicine & Rehabilitation
24,083 26,900 26,466 9.9%
Plastic Surgery 722 716 815 12.9%

Specialty Care Encounters (FY17-19)
VA Market Area Health Systems Optimization
Market Facility Specialty FY17 FY18 FY19 3 Year % Change
(V19) Salt Lake City (V19) (660) George E. Wahlen Department of Veterans Affairs Medical Center
Podiatry 12,214 10,890 11,601 -5.0%
Prosthetics/Orthotics 4,359 2,664 3,691 -15.3%
Radiology 44,837 43,952 44,790 -0.1%
Rheumatology 3,579 3,189 2,876 -19.6%
Sleep Medicine 0 0 175
Surgery 15,401 14,862 14,412 -6.4%
Thoracic Surgery 322 369 438 36.0%
Urology 5,561 5,491 5,823 4.7%
Vascular Surgery 3,645 3,365 3,243 -11.0%
(V19) (660GA) Pocatello VA Clinic Audiology / Speech Pathology
16 1,653 3,848 23950.0%
Cardiology 445 363 333 -25.2%
Dermatology 23 6 5 -78.3%
Gastroenterology 44 48 56 27.3%
Nephrology 0 0 9
Nutrition 292 352 802 174.7%
Optometry 314 244 269 -14.3%
Pathology 5,002 2,854 2,709 -45.8%
Pharmacy 592 678 538 -9.1%
Physical Medicine & Rehabilitation
299 328 1,141 281.6%
(V19) (660GB) Ogden VA Clinic Audiology / Speech Pathology
155 145 144 -7.1%
Cardiology 228 268 221 -3.1%
Endocrinology 188 97 0 -100.0%
Nutrition 570 493 479 -16.0%
Optometry 89 55 22 -75.3%
Pain Medicine 0 0 80
Pathology 7,039 7,422 7,467 6.1%
Pharmacy 833 932 1,086 30.4%
Physical Medicine & Rehabilitation
1,235 1,711 1,516 22.8%
Podiatry 0 0 0

Specialty Care Encounters (FY17-19)
VA Market Area Health Systems Optimization
Market Facility Specialty FY17 FY18 FY19 3 Year % Change
(V19) Salt Lake City (V19) (660GD) Roosevelt VA Clinic Audiology / Speech Pathology
67 68 64 -4.5%
Cardiology 10 17 16 60.0%
Pathology 200 228 333 66.5%
(V19) (660GE) Orem VA Clinic Audiology / Speech Pathology
117 148 125 6.8%
Cardiology 96 160 138 43.8%
Endocrinology 31 0 0 -100.0%
Nutrition 851 664 631 -25.9%
Optometry 83 65 52 -37.3%
Pathology 5,046 4,584 4,521 -10.4%
Pharmacy 608 488 717 17.9%
Physical Medicine & Rehabilitation
871 1,731 1,924 120.9%
(V19) (660GG) St. George VA Clinic Audiology / Speech Pathology
3,052 3,960 4,103 34.4%
Cardiology 512 288 370 -27.7%
Critical Care / Pulmonary Disease
13 15 8 -38.5%
Dermatology 8 85 70 775.0%
Gastroenterology 8 26 15 87.5%
Nutrition 529 290 169 -68.1%
Optometry 106 148 93 -12.3%
Orthopaedic Surgery 76 65 75 -1.3%
Pathology 4,865 4,750 4,890 0.5%
Pharmacy 715 540 790 10.5%
Physical Medicine & Rehabilitation
989 818 1,059 7.1%
(V19) (660GJ) South Jordan VA Clinic Audiology / Speech Pathology
1,468 1,593 1,556 6.0%
Cardiology 284 255 339 19.4%
Dermatology 0 70 0
Endocrinology 1,008 518 0 -100.0%
Nutrition 533 501 523 -1.9%
Optometry 140 144 9 -93.6%

Specialty Care Encounters (FY17-19)
VA Market Area Health Systems Optimization
Market Facility Specialty FY17 FY18 FY19 3 Year % Change
(V19) Salt Lake City (V19) (660GJ) South Jordan VA Clinic Pathology 0 0 0
Pharmacy 398 390 331 -16.8%
Physical Medicine & Rehabilitation
677 583 596 -12.0%
(V19) (660GK) Elko VA Clinic Audiology / Speech Pathology
26 38 30 15.4%
Cardiology 19 28 13 -31.6%
Endocrinology 54 45 0 -100.0%
Nutrition 9 16 18 100.0%
Optometry 23 94 43 87.0%
Pathology 689 1,072 1,036 50.4%
(V19) (660QA) Idaho Falls VA Clinic Cardiology 31 119 213 587.1%
Gastroenterology 7 33 34 385.7%
Nutrition 30 156 138 360.0%
Optometry 32 159 164 412.5%
Pathology 657 2,602 2,742 317.4%
Pharmacy 6 28 26 333.3%
Physical Medicine & Rehabilitation
32 254 300 837.5%
(V19) (660QB) Price VA Clinic Audiology / Speech Pathology
8 22 33 312.5%
Cardiology 4 14 18 350.0%
Endocrinology 8 27 0 -100.0%
Nutrition 14 54 46 228.6%
Optometry 12 20 7 -41.7%
Pathology 185 681 687 271.4%
Pharmacy 0 2 38
Physical Medicine & Rehabilitation
5 43 22 340.0%

Surgical Cases (FY15-19)
VA Market Area Health Systems Optimization
Market Facility Setting FY15 FY16 FY17 FY18 FY19 5 Year % Change
(V19) Salt Lake City (V19) (660) George E. Wahlen Department of Veterans Affairs Medical Center
IP Cases 1,046 918 961 957 915 -12.5%
OP Cases 2,715 2,475 2,112 2,642 2,519 -7.2%
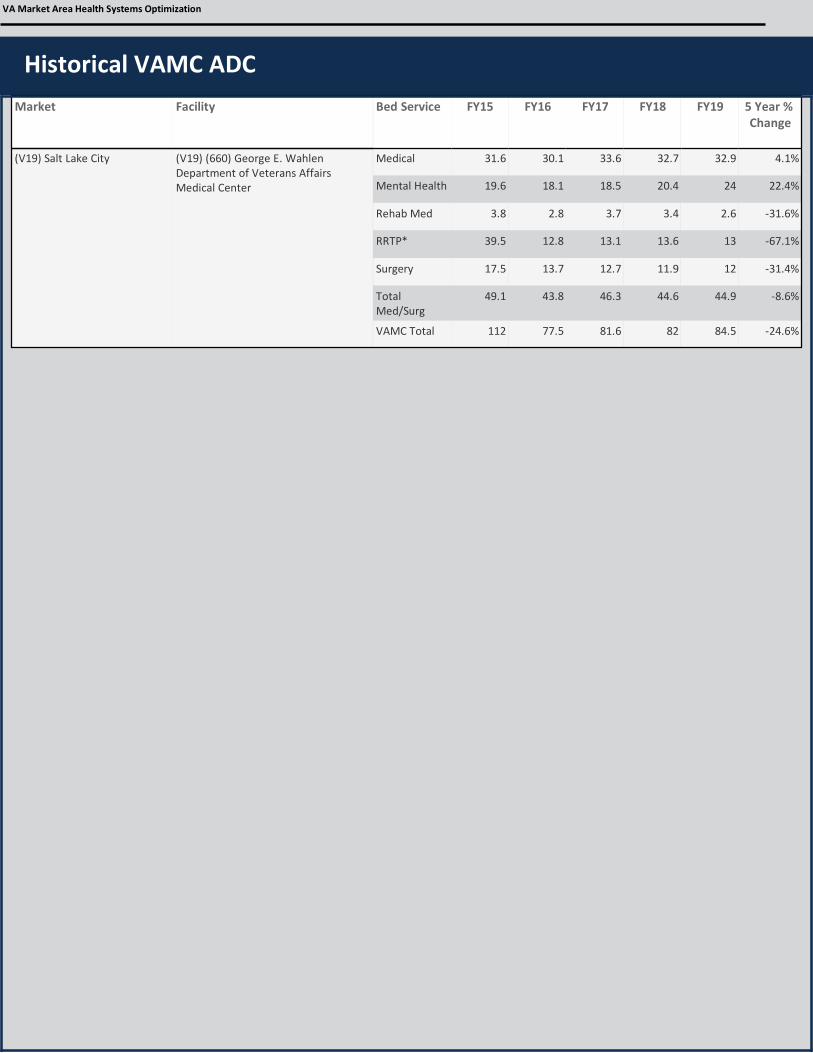
Historical VAMC ADC
VA Market Area Health Systems Optimization
Market Facility Bed Service FY15 FY16 FY17 FY18 FY19 5 Year % Change
(V19) Salt Lake City (V19) (660) George E. Wahlen Department of Veterans Affairs Medical Center
Medical 31.6 30.1 33.6 32.7 32.9 4.1%
Mental Health 19.6 18.1 18.5 20.4 24 22.4%
Rehab Med 3.8 2.8 3.7 3.4 2.6 -31.6%
RRTP* 39.5 12.8 13.1 13.6 13 -67.1%
Surgery 17.5 13.7 12.7 11.9 12 -31.4%
Total Med/Surg
49.1 43.8 46.3 44.6 44.9 -8.6%
VAMC Total 112 77.5 81.6 82 84.5 -24.6%

FY19 RRTP Beds and ADC
VA Market Area Health Systems Optimization
Market Facility RRTP Service FY19 ADC Operational Beds
(V19) Salt Lake City Salt Lake City DOM SA 12.9 15

FY19 Community Capacity
VA Market Area Health Systems Optimization
Market Facility Bed Section Beds Beds Available % Occupancy
(V19) Salt Lake City Salt Lake City Acute 3,658 712 61.2%
Nursing Home 2,789 527 71.7%
Psych 305 8 77.8%
Rehab 115 3 80.7%

BY19 Projected Parent Facility ADC (EHCPM)
VA Market Area Health Systems Optimization
Market Parent Facility Bed Service Funding Source FY19 Actual
FY29 Projected
10 Year % Change
(V19) Salt Lake City Salt Lake City, UT HCS Acute Inpatient Med/Surg Community 15.9 19.8 24.3%
In-House 48.2 38.9 -19.4%
Acute Inpatient Medicine Community 10.9 14.7 34.5%
In-House 30.9 27.4 -11.3%
Acute Inpatient Mental Health Community 13.0 16.1 23.5%
In-House 23.9 23.2 -3.3%
Acute Inpatient Surgery Community 5.0 5.1 2.0%
In-House 17.3 11.5 -33.8%
Inpatient LTSS Community 86.4 125.1 44.8%
Inpatient Residential Rehab In-House 12.9 12.1 -6.1%

BY19 Projected Market ADC (EHCPM)
VA Market Area Health Systems Optimization
Market Planning Category Group Funding Source FY19 ADC Actual
FY29 ADC Projected
10 Year % Change
(V19) Salt Lake City Acute Inpatient Med/Surg Community 17.9 22.9 27.6%
In-House 42.3 33.8 -20.0%
Acute Inpatient Medicine Community 12.2 16.3 33.2%
In-House 27.8 24.3 -12.8%
Acute Inpatient Mental Health
Community 14.0 17.6 25.1%
In-House 21.8 21.0 -3.4%
Acute Inpatient Surgery Community 5.7 6.6 15.7%
In-House 14.5 9.6 -33.9%
Inpatient Blind Rehab Community 0.0 0.0
In-House 1.0 1.1 18.0%
Inpatient LTSS Community 85.7 124.0 44.7%
In-House 2.0 2.1 2.5%
Inpatient Residential Rehab Community 0.0 0.0
In-House 22.5 22.6 0.7%
Inpatient Spinal Cord Injury Community 0.0 0.0
In-House 2.4 1.8 -24.2%

BY18 RRTP Projected Market ADC (3D Model)
VA Market Area Health Systems Optimization
Market Market (BY18) RRTP Bed Section FY28 ADC FY28 Bed Need
(V19) Salt Lake City 19-f All Bed Sections 44.2 52
Dom Homeless 11.0 13
Gen Dom 14.9 17
PTSD 4.7 6
Substance Abuse 13.6 16

BY19 Projected Market RVUs (EHCPM)
VA Market Area Health Systems Optimization
Market Planning Category Group Funding Source FY19 RVUs Actual
FY29 RVUs Projected
10 Year % Change
(V19) Salt Lake City Amb LTSS Home and Community Based In-House 22,748 25,738 13.1%
Amb Medical Specialties Community 89,892 176,284 96.1%
In-House 196,437 300,403 52.9%
Amb Mental Health Programs Community 29,055 52,973 82.3%
In-House 235,013 401,110 70.7%
Amb Pathology Community 1,572 3,982 153.3%
In-House 12,807 19,364 51.2%
Amb Primary Care Community 16,347 46,937 187.1%
In-House 144,414 218,201 51.1%
Amb Radiology Community 24,073 38,022 57.9%
In-House 41,742 65,278 56.4%
Amb Rehab Therapies Community 46,736 83,770 79.2%
In-House 56,827 86,669 52.5%
Amb Surgical Specialties Community 36,226 76,938 112.4%
In-House 94,909 157,183 65.6%
Specialty Care (Amb Med/Surg/Rehab) Community 172,854 336,992 95.0%
In-House 348,174 544,256 56.3%

BY19 Projected Market Dental Procedures (EHCPM)
VA Market Area Health Systems Optimization
Market Funding Source FY19 Procedures
Actual
FY29 Procedures Projected
Projected % Change
(V19) Salt Lake City Community 6,470 9,315 44.0%
In-House 38,720 59,167 52.8%

Enrollment Proximity to Current VA Sites by Market
VA Market Area Health Systems Optimization
Market Market (FY18) Total Enrollees
Primary Care # of Enrollees
within 30 Min Drive Time
Primary Care % of Enrollees
within 30 Min Drive Time
Secondary Care # of Enrollees within 60 Min
Drive Time
Secondary Care % of Enrollees within 60 Min
Drive Time(V19) Salt Lake City 19-f 71,718 55,920 78.0% 45,584 63.6%

Real Property Overview
VA Market Area Health Systems Optimization
Market Facility Acres Available
Property Size
Main Patient Care Facility Construction
Date
Most Recent Renovation Date (Main
Hospital Building)
Estimated Annual
Operations and Maintenance
Cost
FCA Cost Seismic Risk
(V19) Salt Lake City Salt Lake City 0.0 81 1949 1988 $13,393,837 $225,881,300 High

Building FCA
VA Market Area Health Systems Optimization
Market Station Building No Function Title FCA Correction Cost
(V19) Salt Lake City Salt Lake City 1 Main Hospital $52,820,377
13 ChildCare $259,489
14 Main Hospital $38,364,080
16 Out Patient Mental Health $858,987
18 Emergency Prepardness $168,894
2 Research/Admin/Vacant $23,497,357
25 P & H Storage $74,060
27 Chiller Plant $5,366,177
29 Research $14,352
3 Mental Health Hospital $14,136,222
30 Research $35,421
32 Fisher House $17,555
35 Research ARF $60,491
37 Research ARF $261,631
38 Engineering $160,921
4 Vacant $3,164,484
40 Emergency Generator/Primary Switchgear $331,845
41 Emergency Generator/Switchgear $420,994
42 Brine Storage/Emergency Generator $56,001
44 Generator Structure $920
45 Research $685,107
47 Prosthetics Temp Lab $56,672
48 Parking Structure $4,600
5 Nutrition & Food $3,513,881
6 Boiler Plant/Shops $9,733,154
6A-B Engineering Trailers $128,117
7 Laundry/Warehouse/ARF/Engineering $8,291,853
8 RECREATION/CANTEEN $2,598,485
9 National Media Development $1,331,407
C1 Concourse (Red-B.1 to B.3) $136,805
C2 Concourse (Blue-B.4 to B.2) $174,709
C3 Concourse (Green-B.1 to B.8) $142,049

Building FCA
VA Market Area Health Systems Optimization
Market Station Building No Function Title FCA Correction Cost
(V19) Salt Lake City Salt Lake City CU CREDIT UNION $47,380
PH Engineering $19,872
Site Site Utilities $58,803,803
T1 Miscellaneous $78,949
T2 Safety/QA $64,198
T4 Safety Office $0
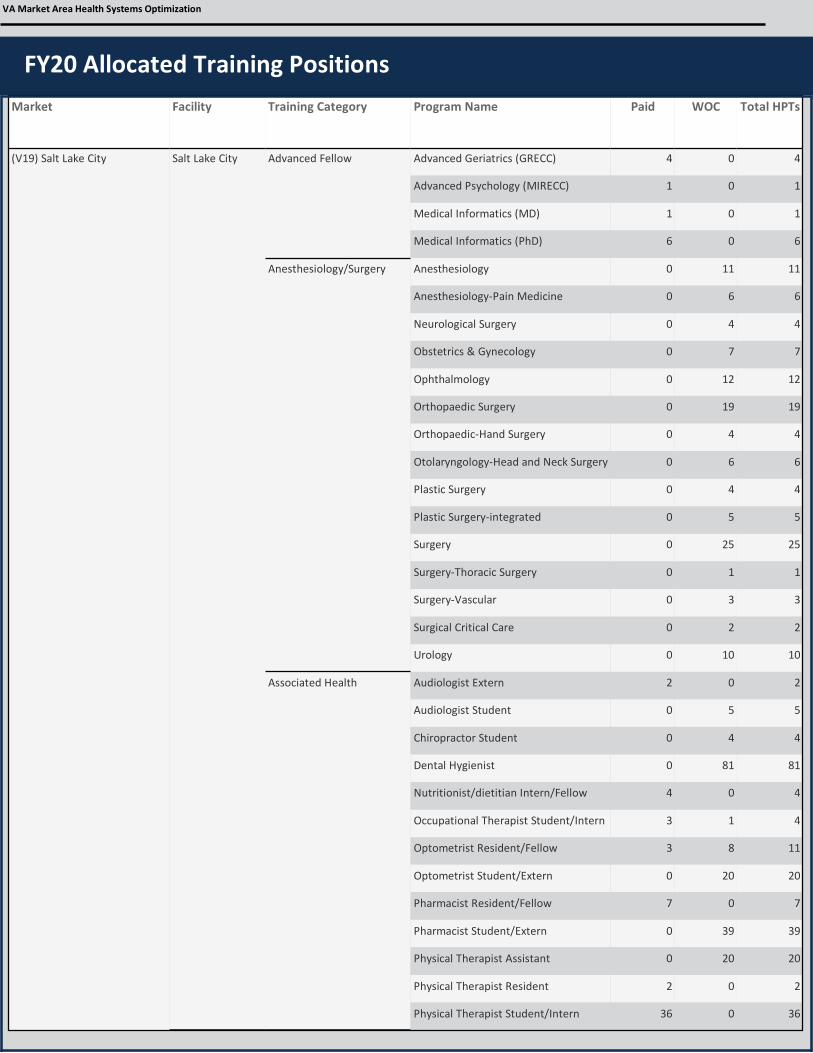
FY20 Allocated Training Positions
VA Market Area Health Systems Optimization
Market Facility Training Category Program Name Paid WOC Total HPTs
(V19) Salt Lake City Salt Lake City Advanced Fellow Advanced Geriatrics (GRECC) 4 0 4
Advanced Psychology (MIRECC) 1 0 1
Medical Informatics (MD) 1 0 1
Medical Informatics (PhD) 6 0 6
Anesthesiology/Surgery Anesthesiology 0 11 11
Anesthesiology-Pain Medicine 0 6 6
Neurological Surgery 0 4 4
Obstetrics & Gynecology 0 7 7
Ophthalmology 0 12 12
Orthopaedic Surgery 0 19 19
Orthopaedic-Hand Surgery 0 4 4
Otolaryngology-Head and Neck Surgery 0 6 6
Plastic Surgery 0 4 4
Plastic Surgery-integrated 0 5 5
Surgery 0 25 25
Surgery-Thoracic Surgery 0 1 1
Surgery-Vascular 0 3 3
Surgical Critical Care 0 2 2
Urology 0 10 10
Associated Health Audiologist Extern 2 0 2
Audiologist Student 0 5 5
Chiropractor Student 0 4 4
Dental Hygienist 0 81 81
Nutritionist/dietitian Intern/Fellow 4 0 4
Occupational Therapist Student/Intern 3 1 4
Optometrist Resident/Fellow 3 8 11
Optometrist Student/Extern 0 20 20
Pharmacist Resident/Fellow 7 0 7
Pharmacist Student/Extern 0 39 39
Physical Therapist Assistant 0 20 20
Physical Therapist Resident 2 0 2
Physical Therapist Student/Intern 36 0 36

FY20 Allocated Training Positions
VA Market Area Health Systems Optimization
Market Facility Training Category Program Name Paid WOC Total HPTs
(V19) Salt Lake City Salt Lake City Associated Health Physician Assistant Student 0 18 18
Podiatrist Resident/Fellow 8 0 8
Podiatrist Student/Extern 0 39 39
Psychologist Intern 7 0 7
Psychologist Resident 3 0 3
Psychologist Student 0 10 10
Social Worker Student/Intern 14 1 15
Speech-Language Pathologist Fellow 1 7 8
Combined Physicians Internal Medicine/Pediatrics 0 7 7
Dental Dentist, General Practice 4 0 4
Medical Dermatology 0 11 11
Emergency Medicine 0 25 25
Family Medicine 0 16 16
Family Medicine-Hospice and Palliative Medicine
0 2 2
Internal Medicine 0 124 124
Internal Medicine-Advanced Heart Failure and Transplant Cardiology
0 3 3
Internal Medicine-Cardiovascular Disease
0 16 16
Internal Medicine-Chief Resident 0 3 3
Internal Medicine-Clinical Cardiac Electrophysiology
0 2 2
Internal Medicine-Endocrinology, Diabetes & Metabolism
0 9 9
Internal Medicine-Gastroenterology 0 9 9
Internal Medicine-Geriatric Medicine 0 3 3
Internal Medicine-Hematology & Medical Oncology
0 9 9
Internal Medicine-Infectious Disease 0 7 7
Internal Medicine-Interventional Cardiology
0 2 2
Internal Medicine-Nephrology 0 4 4
Internal Medicine-Pulmonary Disease and Critical Care Medicine
0 10 10
Internal Medicine-Rheumatology 0 6 6
Internal Medicine-Sleep Medicine 0 2 2
Medical Student 0 124 124
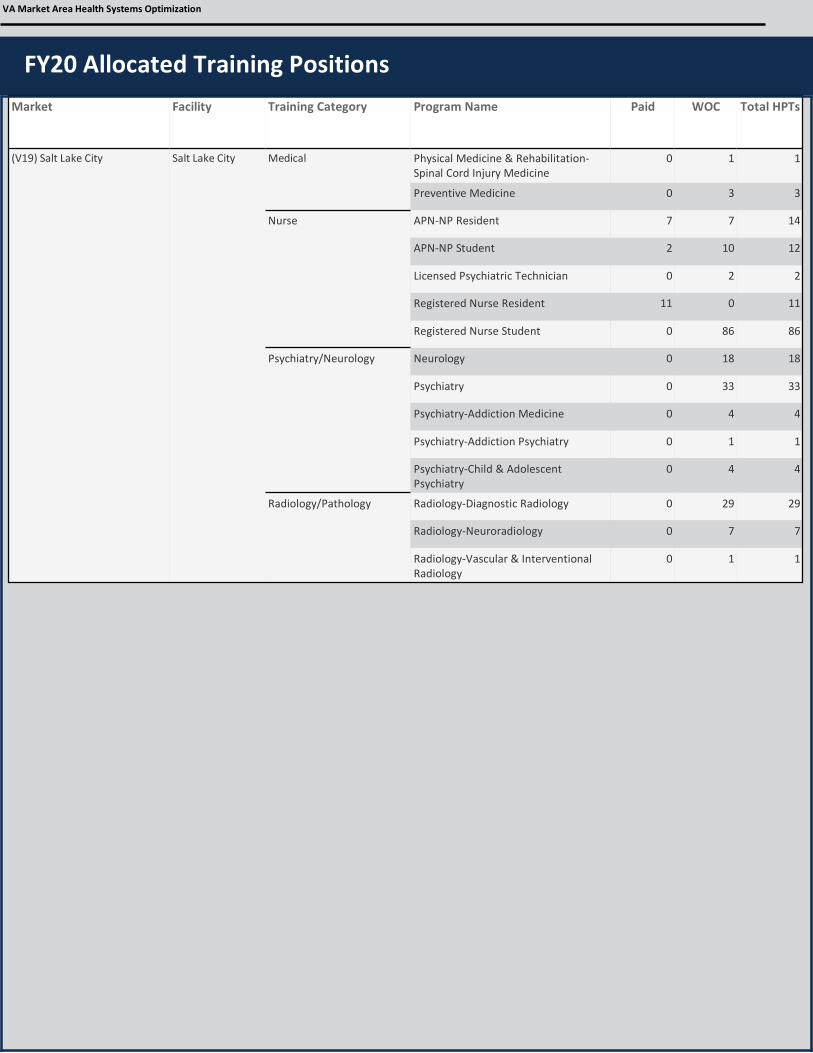
FY20 Allocated Training Positions
VA Market Area Health Systems Optimization
Market Facility Training Category Program Name Paid WOC Total HPTs
(V19) Salt Lake City Salt Lake City Medical Physical Medicine & Rehabilitation-Spinal Cord Injury Medicine
0 1 1
Preventive Medicine 0 3 3
Nurse APN-NP Resident 7 7 14
APN-NP Student 2 10 12
Licensed Psychiatric Technician 0 2 2
Registered Nurse Resident 11 0 11
Registered Nurse Student 0 86 86
Psychiatry/Neurology Neurology 0 18 18
Psychiatry 0 33 33
Psychiatry-Addiction Medicine 0 4 4
Psychiatry-Addiction Psychiatry 0 1 1
Psychiatry-Child & Adolescent Psychiatry
0 4 4
Radiology/Pathology Radiology-Diagnostic Radiology 0 29 29
Radiology-Neuroradiology 0 7 7
Radiology-Vascular & Interventional Radiology
0 1 1

Academic Ranking (by Total HPTs)
VA Market Area Health Systems Optimization
Market Facility Total HPTs National Ranking (out of
154 sites)(V19) Salt Lake City Salt Lake City 1,098 46

FY21 Research Funding
VA Market Area Health Systems Optimization
Market Medical Center Total Funding (VA and Non-VA)
Rank
(V19) Salt Lake City Salt Lake City $41,965,144 5

Footnotes
VA Market Area Health Systems Optimization
Market Population Rank (out of 95 markets)Note: The VISN 02 Finger Lakes and Southern Tier markets merged in 2019 during the market assessments, changing the count of markets assessed from 96 to 95.
County-Based Enrollee ProjectionsNote: Market totals do not exactly match the values in the Rurality tables due to a difference in data sources. Note: Counties with fewer than 10 enrollees were reduced to 0 based on privacy guidelines.
RuralityNote: FY19 enrollees in this data differ from the values shown in the EHCPM (Projected Population). This data is sourced from the Geocoded Enrollee file.Note: Rural enrollees include enrollees residing in rural and highly rural locations.Note: Counties with fewer than 10 enrollees were reduced to 0 based on privacy guidelines.
Core UniquesNote: Core uniques excludes uniques who have only used telephone triage, pharmacy, and lab.
Historical VAMC ADCNote: *RRTP includes Domiciliary and Compensated Work Therapy/Transitional Residence (CWT/TR) bed services.
FY19 Community CapacityNote: Although similar data was incorporated in the DD&F, community capacity in this compendium displays the supply of total community beds, occupancy, and beds available among community providers within 60 minutes of each VAMC or HCC. Each community hospital or nursing home which is not currently included in the Veterans Community Care Program or does not meet the minimum quality criteria established in the Section 203 Criteria analysis is excluded. Additionally, providers at or above target occupancy (80% for short-term acute care hospitals, 90% for nursing homes) are assumed to have no bed availability.
BY19 Projected Market RVUs (EHCPM)Note: Specialty Care includes Medical Specialties, Surgical Specialties, and Rehab Therapies.
OP Encounters & SC EncountersNote: The stop code mapping used in the data compendium is based on a custom stop code mapping created by VA for the market assessments. The Data Discovery and Findings (DD&F) documents used the Public Data Clinic Group stop code mapping.
Enrollment Proximity to Current VA Sites by MarketNote: Primary care sites include VAMCs, HCCs, MS CBOCs, and CBOCs. Secondary care sites include VA facilities providing ambulatory surgery or acute inpatient services.
Real Property OverviewNote: Acres available provides an indication of any excess or surplus land, not currently in use and has no plans for future expansion needs that could be used for future development.
Building FCANote: Project Costs to remediate FCAs vary significantly, from below assessed value to more than 3 times the value.
FY20 Allocated Training PositionsNote: This data displays the number of paid, unpaid (WOC), and total Health Profession Trainees (HPTs) at each facility by training program. This data was acquired from the Office of Academic Affiliations.

Sources
VA Market Area Health Systems Optimization
Facility HierarchyFY21 Q4 VA Site Tracking (VAST)
Enrollee ProjectionsBY19 EHCPM
RuralityGeocoded Enrollee FY19 Q4
Core UniquesVSSC Uniques Cube
ED/UCC EncountersVSSC Encounters Cube
ED Transfers & AdmissionsEmergency Medicine Management Tool
Surgical CasesNational Surgery Office
Outpatient EncountersVSSC Encounters Cube
Historical VAMC ADCMCAO Discharge Cube
Projected DemandBY19 EHCPM
Projected RRTP DemandRRTP 3D Model
FY19 RRTP Beds and ADCRRTP Program Office
FY19 Quality Community Capacity2019 CMS Cost Reports
Enrollment Proximity to Current VA Sites by MarketFY19 Q4 Enrollment; FY19 Q4 VAST data; VHA OPP Planning Systems Support Group
Real Property OverviewCAI Buildings and FCA Condition Gaps Report (November 2021)
Building FCACAI Buildings and FCA Condition Gaps Report (November 2021)
Emergency Preparedness Primary Receiving CentersOffice of Emergency Management
Academic Mission - Allocated Training PositionsOffice of Academic Affiliations
Research Mission - Research FundingOffice of Research and Development