Virtual Reaction Chambers as a tool for DNA sequencing
144
Virtual Reaction Chambers as a tool for DNA sequencing Dissertation zur Erlangung des Grades der Doktorin der Naturwissenschaften der Naturwissenschaftlich-Technischen Fakultät der Universität des Saarlandes von Ana V. Almeida Saarbrücken 2017
-
Upload
khangminh22 -
Category
Documents
-
view
2 -
download
0
Transcript of Virtual Reaction Chambers as a tool for DNA sequencing

Virtual Reaction Chambers as a tool for
DNA sequencing
Dissertation zur Erlangung des Grades
der Doktorin der Naturwissenschaften der Naturwissenschaftlich-Technischen Fakultät
der Universität des Saarlandes
von
Ana V. Almeida
Saarbrücken
2017


II
Tag des Kolloquiums: 16.10.2017
Dekan: Univ.-Prof. Dr. rer. nat. Guido Kickelbick
Mitglieder des Prüfungsausschusses:
- Gutachter (Betreuer): Prof. Dr. Andreas Manz
- Gutachter (nicht Betreuer): Prof. Dr. Ralf Seemann
- Vorsitzenden: Prof. Dr.-Ing. Georg Frey
- Promovierter akad. Mitarbeiter: Dr. Gao Haibin

III
Bitte unterschrieben als Einzelblatt einreichen
und in die Arbeit eingebunden, ebenfalls unterschrieben.
Eidesstattliche Versicherung
Hiermit versichere ich an Eides statt, dass ich die vorliegende Arbeit
selbstständig und ohne Benutzung anderer als der angegebenen Hilfsmittel
angefertigt habe. Die aus anderen Quellen oder indirekt übernommenen
Daten und Konzepte sind unter Angabe der Quelle gekennzeichnet. Die
Arbeit wurde bisher weder im In- noch im Ausland in gleicher oder ähnlicher
Form in einem Verfahren zur Erlangung eines akademischen Grades
vorgelegt.
Ort, Datum
Unterschrift

IV

V
Abstract
The topic of this thesis refers to the contribution of genetic variations, in
which single nucleotide polymorphisms (SNP) can be included, to the
manifestation and cause of disease. The facilitation of the treatment and cure of
such conditions is done through identification and study of the cascade of
biological mechanisms and processes; however the achievement of such goals
is hampered by the formidable complexity and scale of the data sets involved in
nucleic acid and protein analysis and thus the development of faster and
cheaper methods is desirable. An intuitive trajectory for this development is the
miniaturization of analytical methods with the incorporation of microfluidics
which entails the manipulation of fluid analytes through channels and chambers
on the microscale. This young field is projected to be instrumental in the
realization of low temporal and financial cost analytical techniques.
This thesis demonstrates the application of open-surface microfluidics to
sequence DNA with the use of pyrosequencing. This method facilitates a
reduction in instrument complexity and size and thus allows for functional
integration or device disposability. Following incubation of the DNA with
superparamagnetic particles, it was placed on a hydrophobic glass substrate.
The DNA was then moved through microliter-volumes of mineral oil-coated
water droplets via manipulation of the nanoparticles using a magnetic field;
thus, these droplets could then be used either for pyrosequencing or for
washing of the DNA strands. The reaction performance was determined, using
the resequencing protocol with a 34 base pair (bps) of single-stranded DNA, to
be highly linear for all 4 homopolymers events tested. De novo sequencing was
performed with 51 and 81 bps while it was also verified that up to 7
homopolymers could be determined. This method displays full compatibility with
previously demonstrated open surface steps for sample preparation and so
confirms PCR on a flat glass substrate as an integrated sample-to-answer
protocol.
All assays were based on primer extension via DNA polymerase. A
microfluidic device consisting of microliter-volume droplet-to-droplet DNA
transport via manipulation of magnetic particles was used in this work. The

VI
difference in reaction kinetics for matched and mismatched configurations at the
3’-ends of the primer-template complex was employed in sample differentiation.
The assay combined pyrosequencing technology with a sequence-by-synthesis
bioluminometric DNA sequencing probe on one common microfluidic platform.
Base-by-base sequencing was performed to obtain accurate single nucleotide
polymorphism (SNP) scoring data with microliter volumes. The application of
magnetically actuated beads to facilitate virtual chamber reactions for chip
based DNA analysis was presented. Single base incorporation was seen to be
detectable with the use of this pyrosequencing assay.
Keywords: DNA sequencing, single nucleotide polymorphisms,
superparamagnetic particles, open surface microfluidics, magnetic actuation.

VII
Zusammenfassung
Mit Abschluss des Humangenomprojekts verlagert sich der Fokus darauf,
zu verstehen, wie genetische Variationen, wie z. B. Einzelnukleotid-
Polymorphismus (SNP, single nucleotide polymorphism), zu Erkrankungen
führen. Die enorme Menge an Sequenzinformationen müssen mit schnelleren,
wirtschaftlicheren und leistungsfähigeren Technologien für die Analyse von
RNA, DNA und Proteinen analysiert werden, um die die biologischen
Mechanismen lebender Organismen zu verstehen und zu kontrollieren. Ein
Ansatz ist die Miniaturisierung analytischer Methoden durch die Anwendung der
Mikrofluidik, wobei Ströme in Kanälen auf der Mikrometer-Skala manipuliert
werden. Es wird erwartet, dass Fortschritte in der Mikrofluidik-Chip-Technologie
eine wichtige Rolle bei der Entwicklung wirtschaftlicher und schneller DNA-
Analysemethoden spielen werden.
In dieser Doktorarbeit wird die Anwendung von Mikrofluidik an offenen
Oberfläche für die Sequenzierung von DNA mittels Pyrosequenzierung
demonstriert. Dies bietet Vorteile bezüglich der Instrumentengröße, der
Einfachheit, Verfügbarkeit und Funktionsintegration, insbesondere in
Kombination mit den vielfältigen und flexiblen Möglichkeiten der Mikrofluidik an
offenen Oberflächen. Die DNA wurde auf superparamagnetischen Partikeln
inkubiert und auf ein Glassubstrat mit hydrophobischer Schicht platziert. Die
Partikel mit gebundener DNA wurden mithilfe von Magnetkraft über Tropfen in
Mikroliter-Größe, beschichtet mit Mineralöl zur Verhinderung von Verdunstung,
bewegt. Diese Tropfen dienten als Reaktionsstationen für die
Pyrosequenzierung sowie als Waschstationen. Das Sequenzierungsprotokoll
mit 34 Basenpaaren (bps) einzelsträngiger DNA wurde zur Bestimmung der
Reaktionsleistung verwendet und zeigte eine ausgezeichnete Linearität für alle
4 Homopolymere. Diese De-novo-Sequenzierung wurde mit 51 und 81 bps
durchgeführt. Wir haben außerdem geprüft, dass bis zu 7 Homopolymere
bestimmt werden können. Dieses Verfahren ist vollständig mit bisher
verwendeten Schritten zur Probenvorbereitung an offenen Oberflächen
kompatibel. Daher kann eine PCR als vollständig integriertes System von der

VIII
Probe bis zum Ergebnis auf einem flachen Glassubstrat zusammengestellt
werden.
In dieser Doktorarbeit werden Mikrofluidik-Anwendungen für
verschiedene Genotypisierungsassay vorgestellt. Das übergeordnete Ziel ist die
Kombination des Potentials des Chiplabor-Konzepts der Mikrofluidik mit
Biochemie, um Verfahren für die DNA-Analyse zu entwickeln uns derzeit
verfügbare Verfahren zu verbessern. Drei Genotypisierungsassays werden hier
mithilfe von miniaturisierten Mikrofluidik-Methoden überprüft.
Alle Assays basieren auf der Verlängerung von Primeren durch DNA-
Polymerase. Ein Mikrofluidik-Instrument mit Handhabung von Tropfen zu
Tropfen für Magnetpartikel für Volumen im Mikroliterbereich wurde in diesen
Studien verwendet. Das Mikrofluidik-Verfahren nutzt die Vorteile der
unterschiedlichen Reaktionskinetik für komplementäre und nicht-
komplementäre Konfigurationen am 3‘-Ende des Primer-Template-Komplexes.
Insgesamt beinhalteten die Assays die Anpassung der
Pyrosequenzierungstechnologie, eines bioluminometrischen DNA-
Sequenzierungsassays basierend auf Sequenzierung durch Synthese, an
dieselbe Mikrofluidik-Plattform. Basenweise Sequenzierung wurde in einem
Mikrofluidik-Instrument durchgeführt, um genaue SNP-Scoring-Daten für
Volumina im Mikroliterbereich zu erzielen. In dieser Doktorarbeit wird die
Anwendung virtueller Reaktionskammern von Partikel, die magnetisch
ausgelöst werden, für die Chip-basierte DNA-Analyse präsentiert. Die
Inkorporation von einzelnen Basen mithilfe der Pyrosequenzierungsreaktion
wurde auf diesen Partikel beobachtet.
Stichworte: DNA-Sequenzierung, Einzelnukleotid-Polymorphismus,
Superparamagnetischpartikel, offene Mikrofluidik, Mikrosystem, magnetische
Betätigung

IX
Acknowledgments
I would like to thank everyone who has contributed to this thesis and has
made these last few years so enjoyable.
I am especially grateful to:
Andreas Manz for accepting me as a PhD student and for being a true visionary
with a fantastic skill for attracting good people.
Pavel Neuzil, Microfluidics group leader, for his guidance during this scientific
journey.
My colleagues, fellow students and friends not only in KIST-Europe but overall
in Saarbrücken and beyond:
Zeynep and Mark: the shorty-spicy-lady and the tally-gentleman. Wouldn’t think
of better companions to start this journey with. You guys rock!
Matthias: starting off with the labs and kicking off with the projects on a fresh
group and becoming a permanent member of my family…so much to say and
so little space. Because of you, Saarland will always be home to me. Thank you
for all the inspiring and fruitful discussions on microfluidics and life in general,
for being so enthusiastic and, last but not least, for being you.
Jang Mi: my favorite power Frau! Determination and fantastic energy to keep all
of those boys under control.
Jukyung and Seung Jae…such a long jurney! Thank you for being part of it!
Tijmen: my climbing partner and honeybear!
Thomas: no bull**** modus operandi and one of the fairest people I know.
Marc: my chuchu! For life! Let’s keep on growing and getting distracted with
Life.
André and Eric: Perhaps one day I’ll be as cool as you.
Leon Abelmann: To prove me on a daily basis that Science is a playground for
our curious hearts.
Everyone in KIST-europe: for interesting discussions on a variety of subjects
(some of which involved science…) and for the very funny and moments; for
being great and enthusiastic colleagues and friends …
KIST-europe for hosting me for these years, to introduce me to such different
and beautiful culture and enabling me in Science.

X
All collegues, former and present, at KIST-Europe for being so nice and helpful
and for contributing (everyone in his or her own special way) to the fantastic
atmosphere of this place. I feel very privileged to have had the opportunity to
get to know you and to work with you, and even if all names aren’t listed, you
are in my heart.
My friends, in and out of science, for being such great persons and for all the
good times we have shared.
My family for always being there for me with good advice, skype calls full of
affection or whatever will do the trick to keep me motivated
My parents for endless support and encouragement and for believing in me and
wishing me happiness whatever I do. They are my giants (“The reason why I
am seeing so far, it is because I am standing on the shoulders of giants”, Isaac
Newton).
Ferdia, the love of my life, my life-partner, for loving me and being my rock in
stormy weather. We made it!

XI
Table of contents
Eidesstattliche Versicherung III
Abstract V
Zusammenfassung VII
Acknowledgements IX
Table of contents XI
Abbreviations XV
1. Introduction: DNA 1
1.1 Chemical structure of DNA and organization 1
1.2 Genomic variatons 3
1.2.1 Mutations 3
1.2.2 Single nucleotide polymorphisms 7
1.3 DNA sequencing techniques 8
1.3.1 Polymerase chain reaction 9
1.3.2 Dideoxy DNA sequencing by chain termination 11
1.3.3 Non-electrophoretic DNA sequencing methods 14
1.3.4 Pyrosequencing technology 18
1.4 SNP genotyping technologies 22
1.5 Detection 24
1.6 Next stage for DNA sequencing technologies 25
2. Introduction: Microfluidics and micro total systems (TAS) 27
2.1 Microfluidics 27
2.2 Microfabrication 29
2.3 Diffusion 30
2.4 Microparticles 30
2.4.1 Particle handling on chip 32
2.5 Miniaturized platforms for DNA analysis 32
2.5.1 Microarray technologies 33
2.5.2 Microfluidics based technologies 36
2.5.3 Bead-based methods 43
3 Open surface microfluidics (OSM) 45
3.1 Droplets as reaction and transport units 46

XII
3.2 Droplet actuation platform 47
3.3 Droplet manipulation 48
3.4 Important parameters 51
3.5 OSM for DNA analysis 54
4 Overview 59
4.1 Motivation 59
4.2 Objectives 64
5 OSM and virtual reaction chambers 65
5.1 Microfluidic superheating for peptide analysis 65
5.2 Superheating for protein thermal stability analysis 66
5.3 qPCR with VRCs for different applications 67
5.4 My published research 67
5.5 Wrap up 67
6 Materials and Methods 69
6.1 Glass substrate 69
6.2 Droplets 70
6.3 xyz-stage 71
6.4 Detection system 73
6.5 SPP/ssDNA/primer complex preparation 74
6.6 Buffers and solutions preparation 75
6.7 Glass spotting 75
6.7.1 X-design 76
6.7.2 Circle/linear-design 77
6.7.3 Enzymes and substrates design 78
6.8 DNA preparation 78
7 Results Discussion - 81
7.1 Experimental design 81
7.2 First experiments 83
7.3 VRCs placement 87
7.4 Optimization of reagents and buffers 89
7.5 Washing efficiency 91
7.6 Mixing improvement 92
7.7 Effect of DNA concentration 93
7.8 Nucleotide incorporation in homopolymeric stretches 98

XIII
7.9 Resequencing 99
7.10 De novo sequencing 101
7.11 Longer sequencing testing 103
7.12 Comments on methods 105
8 Conclusions and outlook 109
9 References 113

XIV

XV
List of abbreviations
Abbreviation Description
A adenine
AIDS acquired immuno defficiency syndrome
AMASE apyrase-mediated allele-specific extension
ARMS amplification refractory mutation system
ASA allele specific amplification
ASPCR allele-specific PCR
ATP adenosine triphosphate
AuNPs gold nanoparticles
bp base pairs
BSA bovine serum albumin
C cytosine
CBC complete blood count
CCD charge coupled device
CE capillary electrophoresis
COC cyclic olefin copolymer
Cys cysteine
DASH dynamic allele specific hybridization
dATP deoxyadenosine triphosphate
dCTP deoxycytosine triphosphate
ddC dideoxycytosine
ddG dideoxyguanine
ddNTP dideoxynucleotide
ddT dideoxythymine
dGTP deoxyguanine triphosphate
DI deionized
dNTP nucleoside triphosphates
dsDNA double-stranded deoxyribonucleic acid
dTTP deoxythymine triphosphate
EWOD electrowetting on dielectrics

XVI
FRET fluorescence resonance energy transfer
G Guanine
GFP green fluorescent protein
His Histidine
HIV human immuno deficiency virus
Ile Isoleucine
IPA isopropyl alcohol
LCR ligase chain reaction
Leu Leucine
LNA locked nucleic acid
LOC lab-on-a-chip
MEMS Microelectromechanical
Met Methionine
MPs magnetic particles
OLA oligonucleotide ligation assay
OSM open surface microfluidics
PASA PCR amplification of specific alleles
PC poly(carbonate)
PCR polymerase chain reaction
PDMS polydimethylsiloxane
PMMA poly(methyl methacrylate)
POC point-of-care
PPi pyrophosphate
PTFE polytetrafluoroethylene
RCA rolling circle amplification
SBE single base extension
SBH sequencing-by-hybridization
SBS sequencing-by-synthesis
Ser Serine
Ser Serine
SNP single-nucleotide polymorphism
SPP superparamagnetic particles
SSB single-stranded DNA-binding protein
XVII
ssDNA single-stranded deoxyribonucleic acid
SU-8 epoxy-based negative photoresist
T thymine
Thr threonine
TNP triple-nucleotide polymorphisms
Tyr tyrosine
UV ultraviolet
Val valine
µTAS miniaturized total analysis systems

XVIII

1
Chapter 1
Introduction: DNA
The human body consists of approximately 3,72x10¹³ cells[1], most
containing the hereditary information of the genome in the form of 6x10⁹ base
pairs of deoxyribonucleic acid (DNA).[2] DNA molecules are the libraries in living
cells where the information required for building a cell and an organism are
stored.
This subchapter 1.1 briefly describes relevant information over DNA and
corresponding sequencing technologies and the microfluidics field, emphasing
the inter-relation between both topics.
1.1 Chemical structure of DNA and organization
DNA is a linear polymer composed of single chemical units called
nucleotides.[3-4] The number of nucleotides in a cellular DNA molecule can
exceed a hundred million.[2] A nucleotide has three parts: a phosphate group, a
deoxyribose and an organic base. The bases are adenine, guanine, cytosine
and thymine; abbreviated A, G, C and T, respectively.[4] When the nucleotides
polymerize to form DNA, the hydroxyl group attached to the 3’ carbon of the
sugar group of one nucleotide forms an ester bond to the phosphate attached to
the 5’ carbon of another nucleotide. This dictates the extremely important
property of the orientation of the polynucleotide strand.[5] DNA consists of two
associated polynucleotide strands forming a double helix. The sugar-phosphate
backbones are on the outside of the double helix and the bases project into the
interior. The orientation of the two strands is antiparallel and complementary to
each other. The strands are held together by the cooperative energy of many
hydrogen bonds in addition to hydrophobic interactions.[6-7] The opposite
strands are held in precise register by a regular base pairing between the two
strands: A is paired with T by two hydrogen bonds and G is paired with C by
three hydrogen bonds.[7]

2
Figure 1: Chemical structure of DNA. DNA stores and transmits genetic
information in all multicellular life forms. The sequences formed by the bps code
for proteins which execute a wide range of physiological functions. a) The
“backbone” made up of phosphate sugars which support the subunits of the
polymer, each nucleotide consists of a phosphate group, a sugar group and a
base. b) Adenine, thymine, guanine and cytosine are the bases present in DNA.
c) These bases form base pairs (bps) with the second strand in the double
helix; Adenine (A) always pairs with Thymine (T), whilst guanine (G) always
pairs with cytosine (C).

3
1.2 Genomic variations
This DNA is arranged into n chromosomes or in a plasmid depending on
the organism (Figure 2) and the composition of the DNA bases within these
macromolecules determines the genotype and contributes to the phenotype of
an individual[8] (Figure 1). Consequently, alterations in chromosomes may lead
to genetically related diseases (Figure 3). Cells are constantly exposed to
agents and events that can be harmful to the DNA. Depurination, deamination,
oxidation and methylation of bases are endogenous events that can change the
base composition of DNA, while exogenous agents such as UV light, ionizing
radiation and genotoxic substances may damage DNA by creating pyrimidine
dimers, double strand breaks and adducts.[9-14] Several different gatekeeper and
DNA repair systems exist to maintain DNA integrity, but occasionally these
backup systems fail and mutations arise.
1.2.1 Mutations
Mutations can be divided into two classes; gross alterations and subtle
alterations. Gross alterations involve changes in chromosome number, partial
deletions of chromosomes, chromosomal translocations and gene duplications,
while subtle alterations comprise of single base substitutions, insertions and
deletions.[15-16] Mutations are common events in cancer and the ability to
monitor them is therefore of great interest for diagnostic and prognostic
purposes as well as in understanding gene function.[17]
Therefore, detecting genomic variations is fundamental in genetic
research. For example, in cancer research, mutation detection is vital for
diagnosis but also gives insight into gene function[18]. Strains of microorganisms
can also be identified by point variations in their genome, and, in recent years,
the pharmaceutical companies have shown a rising interest in single nucleotide
variations to be able to use “the right drug for the right patient”.[19]

4
Figure 2: DNA configuration. DNA is contained within the cells of every living
thing though its organization varies within different life form. A binary distinction
can be made between the two main DNA organizational conformations with
organisms being either prokaryotes or eukaryotes. a) Prokaryotes. Bacteria are
prokaryotic cells. They do not exhibit membrane-bound nucleus with their DNA,
instead existing freely in the cytoplasm. Their monochromosomal DNA
sequence, which is circular in aspect and located at the center of the cell,
contains the genetic information required to support all cellular functions.
Additional rings of bacterial DNA known as plasmids. Certain genes within
these plasmids can code for antibiotic resistance which increases the probability
of survival. Interbacterial exchange of plasmids is also possible through hair-like
extensions from each cell’s surface known as pili. b) Eukaryotes: animal, plant
and fungi cells are eukaryotes. All contain a membrane-bound nucleus in which
the cell’s chromosomes are linear. Chromosomal DNA is tightly coiled around
special proteins, known as histones, shown below. (adapted from
http://www.bbc.co.uk/education/guides/z36mmp3/revision/2).

5
Figure 3: Figure 3: Mutations: During cell division, the DNA replication process
is stringently controlled in order to preserve the genetic code held within the
sequence of nucleotides. Despite this, encoding errors do evade this
mechanism and exist in the copied genome as mutations, from which no protein
or an altered protein can be expressed. Structure mutations affect the structure
of one or more chromosomes (a) while single gene mutations affect only a small
number of bases (b). Point mutations refer to the substitution of one codon
alone which can result in missense, nonsense or a splice-site mutation (c).
Frame shift mutations occur when insertions or deletions are not corrected
(d).This implies that when nucleotides are grouped in threes to form codons the
reading frame is shifted by one so that completely unrelated amino acids are
outputted resulting in a most commonly junk protein (adapted from
http://www.bbc.co.uk/education/guides/zc499j6/revision/2).

6
Gross alterations involve chromosomal number, chromosomal
translocation, and partial deletion of chromosomes. These types of genomic
alterations can be detected by rather simple techniques, such as microscopy
and fragment analysis of implicated chromosomal regions.[20] Mutation detection
of subtle sequence alterations, however, requires more sensitive techniques,
is time-consuming and is more expensive. This perhaps explains why a wide
range of techniques have been developed for this purpose. The growing
number of methods indicates that a perfect technique which fulfills the required
criteria and is able to detect all possible mutations/variations has yet not been
described.[21]
The techniques for detecting subtle sequence changes can be divided
into three groups. The first is known as scanning methods and is used to search
for unknown mutations in pre-defined sequences.[22] The second group is
known as diagnostic methods and is used to search for analysis of mutations
and variations at defined positions, such as hot-spot sequences and single
nucleotide polymorphisms (SNPs)[23]. Since SNPs are much more frequent than
hot-spot mutations and because most recent efforts have been focused on
detecting single nucleotide variations, the diagnostic techniques will hereafter
be referred to as methods for analysis of SNPs[24]. The third group of method is
sequencing technologies that are used to reveal the exact nature of a mutation,
regardless of being unknown or pre-defined[25].
Some of these techniques and their application fields will briefly be
reviewed here. However, irrespective of the mutation status (known or
unknown), all the techniques have advantages and disadvantages. Some are
simple but do not detect all mutations while others are more complex and detect
almost all mutations. Often, factors such as laboratory and personnel
experience, required accuracy, required throughput, cost and project type have
to be taken into account prior to selection of a method.[26-27]

7
1.2.2 Single nucleotide polymorphisms (SNPs)
The DNA content of one individual is 99.9 percent identical to any other
person’s DNA. Differences in the sequence of DNA among individuals are
called genetic variation. Genetic variation accounts for some of the differences
between individuals, such as eye color, length, and blood group. However,
genetic variation may also predispose some people to disease and explain why
some respond better to certain drugs than to others. Therefore, detecting
genetic differences between individuals and determining their impact on human
health are fundamental in genomic research. The most common genetic
variations are called single-nucleotide polymorphisms (SNPs). SNPs are single
base-pair positions in genomic DNA at which different sequence alternatives,
alleles, exist in normal individuals in a population (Figure 4). By definition, a
position is referred to as a SNP when it exists in at least two variants for which
the least abundant allele is present at or above a frequency of 1% in the tested
population. Variations that occur at lower frequencies are not considered useful
for genetic studies simply because they are not likely to occur in enough
individuals. They are referred to as rare variants of the locus instead of SNPs.
SNPs occur on 3 per 1000 base pairs in the human genome on average [28].
Figure 4. a) SNP position with two alternative DNA sequences (alleles); b) SNP
incidence vs mutation incidence. The percentages shown (6% for SNPs and
0,1% for mutation refer to occurrence in a given population).

8
There has been a large academic and industrial effort to discover and
catalogue SNPs. To date, nearly 10 million SNPs have been catalogued and
entered into public databases, such as the SNP Consortium (TSC) and the
Human Genome Variation database (HGVbase). Recently, the haplotype
mapping (HapMap) project was initiated in a joint effort by leading academic
and commercial teams. A haplotype is defined as a series of closely linked
alleles in a unit on the same chromosome. The haplotypes can contain a large
number of SNPs, but a few SNPs are enough to uniquely identify the
haplotypes in a block. The aim is to characterize the structure of sequence
variation throughout the genome. SNP maps promise to increase significantly
our ability to understand and treat complex diseases such as cancer, diabetes,
asthma, vascular disease, and psychiatric disorders. Furthermore, their high
prevalence of distributions across the genome [29-30] makes SNPs suitable for
serving as genetic markers in linkage studies. Because DNA segments that lie
near each other on a chromosome tend to be inherited together, SNPs can be
used as an indirect way of tracking the inheritance pattern of a gene that has
not yet been identified but whose approximate location is known. Therefore,
pharmaceutical companies may also use SNPs as markers to discover new and
better genes for identifying new drug targets for a number of common and
complex diseases.
As the number of identified SNPs increases, the demand will increase for
efficient methods to score them to fully explore their impact on human health.
Several methods that have been developed to meet the demand are reviewed
in the subchapter 1.4 SNP genotyping technologies.
1.3 DNA sequencing techniques
Despite the wide range of techniques available for mutation detection,
DNA sequencing is the most accurate method to determine the exact nature of
a mutation or a variable position. DNA sequencing is considered to be the
golden standard for mutation and SNPs detection, and for this reason,
mutations and SNPs determined by scanning methods (described in subchapter
1.4) must be confirmed by DNA sequencing. Among DNA sequencing methods,

9
conventional Sanger DNA sequencing has been used extensively, but
techniques, such as sequencing by hybridization, mass spectrometry and
pyrosequencing, have recently gained attention.
In this subchapter, the focus will be aimed at [31] sequencing methods
and technical parameters, such as sequencing speed, read length, and base-
call precision.
1.3.1 Polymerase chain reaction (PCR)
Despite not being a sequencing technique, many of such techniques are
strongly based or dependent on polymerase chain reaction.
The polymerase chain reaction (PCR) is an in vitro molecular biology
technique used to amplify nucleic acids (DNA). It was originally developed by
Kary Mullis (Nobel Prize, Chemistry 1993) during his time working at the Cetus
Corporation in the 1980s. This technique is now standard in the majority of
biology laboratories throughout the world and has been incrementally improved
from its introduction in 1983 [32].
The reaction embodied in the PCR technique is a primer extension with
serves to augment nucleic acid sequences in vitro. Its application in the field of
molecular diagnostics has grown to the degree that its adoption as a tool for
nucleic acid detection is nigh on universal and has made the technique a key
tool in research, development and clinical diagnostics.
Thermostable polymerase (most commonly derived from the thermophilic
bacterium Thermus aquaticus and called Taq) has facilitated the isolation of
freshly synthesized complimentary DNA with negligible reduction in enzymatic
function. As the PCR amplication process is a power function, the increase can
be as high as a billion fold in only a short number of runs which allows for the
rapid determination of qualative and quantitative information about the
sequence of interest. Since its advent, substantial improvements and
modificaitons have been reported, including multiplex PCR[33], asymmetric
PCR[34], hot-start PCR[35], nested PCR[36], RT-PCR[37], touchdown PCR[38], real-
time PCR[39-41], and miniaturization[42-43].

10
The reaction entails the hybridization of the strands of a DNA molecule of
interest to two synthetic oligonucleotides or primer sequences. The hybridized
synthetic sections can then act as a substrate for a DNA polymerase to build a
complimentary strand through sequential incorporation of the appropriate
nucleotide. The whole process can be simplified to three steps (Figure 5) which
are (i) the separation of dsDNA into its two complimentary strands at a
temperature of =/>90ºC, (ii) annealing of the primer occurs at 50-75ºC and (iii)
the extension optimally occurs between 72 and 78ºC [44]. The rate at which the
changes in temperature occur, referred to as the ramp rate, and the duration at
which the reaction remains static at each temperature and the number of times
these cycle runs are repeated are controlled by the thermocycler. The
progression of technological capacity throughout the intervening years have led
to a considerable reduction in the ramp times via the use of electronically
mediated heating blocks or forced convection heat exchangers for rapid
temperature change.
Figure 5: Schematic drawing of the PCR cycle (a) denaturation: DNA strands
separate at temperature of 95ºC; (b) annealing takes places at circa 60ºC when
the primer binds to the complementary bases at the end of the sequence of
each strand; (c) elongation: at 72ºC a heat resistant DNA polymerase forms the
complimentary sequence to the template strand thus forming a new double
stranded DNA molecule. This process can be repeated for 25 – 30 cycles to
amplify the sequence of interest

11
1.3.2. Dideoxy DNA sequencing by chain termination (Sanger DNA
sequencing)
The advent of the Sanger nucleic acid sequencing technique [45] has
cause nothing short of a revolution within the biological sciences. A testament to
the worth of this facile protocol, as already stated above, is the fact that it is still
in use to this day, more than a quarter century after its inception, having
amassed numerous improvements and advancements over this time. The
modulus operandi of this procedure is the termination of enzymatically
synthesized DNA. It is not possible for the dideoxynuleotide (ddNTP) to form a
proceeding bond in a DNA sequence and thus, the synthetic process is disabled
when a ddNTP is inserted into the forming chain. Four separate reactions are
executed, one for each base after which each reaction can then be separated
by molecular weight using electrophoresis. The sequence can be determined
with the combination of the four electrophoretograms with gaps in one being
filled with complimentary bands from the other three reactions. This principal is
shown in Figure 6.
Even with its labor intensive, low throughput tedium, Sanger sequencing
remains in use to this day. One factor which can be attributed to its notable
resilience within the modern laboratory is the technique’s ability to detect
virtually any and all mutations as well as describe the specific nature of the
alteration form the original. Additionally, it has an average read length of 500
bases and is thus applicable to the genome sequencing and re-sequencing.
The demand for long read-length, or the number of bases read per run, a
key necessity for a DNA sequencing technique along with short analysis
duration, low cost and high accuracy has obliged several modifications to the
original technique. Automation in particular has been a key enhancer to the
original method by increasing throughput and freeing up resources to facilitate
the sequencing of extended lengths of DNA.
Within the modern automated sequencing protocol, the electrophoretic
separation of the strand lengths is combined with a fluorescent detection
process via incorporation of a fluorescing moiety into the ddNTP markers and
thus can be observed in real time through excitation of the strands by a laser
beam (Figure 6). The sequencing techniques applied to this setup can

12
incorporate either one dye only or four-dye labeling system. The former
employs one single dye moiety functionalized with one of the four bases
creating, ddA, ddC, ddG and ddT; as each of these molecules have identical
emission spectra, they must be separated in to four lanes for electrophoretic
identification of their locations [46-47] (e.g. the Amersham Pharmacia Biotech’s
A.L.F. DNA sequencer). The latter four-dye labeling system avails of the use of
fluorescent moieties with dissimilar emission wavelengths thus enabling the
simultaneous detection of the location of each base in one lane only [48] (e.g.
Perkin Elmaer’s ABI DNA sequencer) which makes high-through put screening
feasible. It is indeed the development of such a high throughput system that has
facilitated the creation of software tools for the rapid quantification of
polymorphisms and mutations within a sequence. However, the simultaneous
detection of four partially overlapping emission peaks obliges the use of a
computer algorithm to interpret and resolve the raw signal to its associated base
with the accuracy of this sometimes hampering and delaying the identification of
mutations and differences between sequences (Figure 7).
Figure 6: Dideoxynucleotide: Dideoxynucleotides (ddNTPs) lack the 3’-hydroxyl
group necessary for forming a phosphodiester bond. Consequently, ddNTPs
prevent further elongation of a nucleotide chain and effectively terminate
replication. The resulting length of a DNA sequence will reflect the specific
nucleotide position at which the ddNTP was incorporated. For example, if a
ddGTP terminates a sequence after 8 nucleotides, then the 8th nucleotide in the
sequence is a cytosine

13
Figure 7: Sequencing: Dideoxynucleotides can be used to determine DNA
sequence using the Sanger method. Four PCR mixes are set up, each
containing stocks of normal nucleotides plus one dideoxynucleotide (ddA, ddT,
ddC or ddG). As a typical PCR will generate over 1 billion DNA molecules, each
PCR mix should generate all the possible terminating fragments for that
particular base. When the fragments are separated using gel electrophoresis,
the base sequence can be determined by ordering fragments according to
length. If a distinct radioactive or fluorescently labelled primer is included in
each mix, the fragments can be detected by automated sequencing machines.
If the Sanger method is conducted on the coding strand (non-template strand),
the resulting sequence elucidated will be identical to the template strand.

14
There are three different approaches for dye labeling of the sequencing
fragments. The first approach is the use of a 5’-end dye labeled sequencing
primer [46, 48]. The second approach is to label the 3’-ends of the sequencing
fragment by using dye-labeled dideoxy nucleotides (dye-terminators) [47].
Alternatively, fluorescently labeled nucleotides in an extension-labeling step can
internally label the fragments [49].
Acrylamide slab gel electrophoresis has been the most widely adopted
format for Sanger sequencing. Relying merely on slab gel technology was not
sufficient to accomplish the challenges set by the Human Genome Project. The
continual and unrelenting drawbacks of slab gel electrophoresis and the
demand for more rapid sequencing and higher throughput led to the
development of capillary electrophoresis (CE) [50]. The completion of the human
genome was only possible due to several technological advances offered by
CE.
Electrophoresis is performed basically in an approach similar to slab gels
with the advantage that each capillary contains a single DNA sample and
therefore tracking problems are eliminated.
1.3.3. Non-electrophoretic DNA sequencing methods
A few DNA sequencing methods which are not electrophoretic based
have been conceived in the last decades. These techniques have advantages
and disadvantages compared to electrophoretic separation methods, depending
on the type of applications performed and have promising applicability into
miniaturized systems.
Sequencing-by-hybridization
The sequencing-by-hybridization (SBH) technique is in fact based
on the same principle as that of Southern blotting [51] and was simultaneously
described by two independent research groups in 1988 [52]. It key premise was
its ability to facilitate de novo sequencing with the development of hybridization
arrays[53-54]. The technique entails the labeling and subsequent annealing of an
unknown strand of DNA to an array of short length oligonucleotides (e.g. all

15
65,536 combinations of 8-mers) which is followed by the analysis of the
sequence by the pattern formed from its hybridization with the array. For this a
computer assisted assembly program is essential for the ultimate reconstruction
of the correct order and sequence of the original strand (Figure 8).
Because of the sheer scale of the data set from which the sequence is
determined, the SBH technique has been prone to produce ambiguous results
due to repetitive regions within the unknown sequence. Additionally, the
formation of secondary structures within the target also reduces the accuracy of
this technique. False positives are also caused by single base mismatches
resulting from variations within the stability of the duplex of a complete match;
this mostly occurs at the 3’-terminus. The effect of these issues can be
minimized with the use of expression analysis or comparative sequencing
between SBH microarrays though these issues have still not been solved in de
novo sequencing.
Figure 8 Sequencing-by-hybridization (SBH) (i.e. the reverse dot-blot format).
An unknown target is labeled and hybridized with an array of known octamer
oligonucleotides, with the formed hybridization pattern being interpreted to
determine the sequence of the targeted DNA sequence.
Sequencing-by-synthesis
The approach referred to as sequencing-by-synthesis (SBS) was first
described in 1985 by Robert Melamede [55]. This technique consists of the

16
sequential addition and incorporation of nucleotides in an extension reaction
directed by a polymerase primer in such a manner that a strand complementary
to the original forms through interactive addition of the four dNTPs. Figure 9
shows the principle of SBH.
The detection of incorporation of nucleotides in the primed DNA strand
can be done either directly or indirectly. In the direct method, fluorescent labels
are attached to the dNTPs to allow their detection with an appropriate detection
method [56-57]. A draw back to this technique is the low number of bases that can
be added due to the high failure rate of nucleotide incorporation which can in
turn lead to desynchronization of the sequence being copied [57]. The post-
synthesis removal of the fluorophore acts as one further step in the process
during which errors can be introduced.
The indirect approach to detection employs natural nucleotides for the
incorporation process. The pyrophosphate (PPi) released during the
condensation polymerization reaction of the growing chain is then detected as
an indirect indication of successful nucleotide incorporation [58-59]. The principal
advantage of this approach is the ability to use unadulterated, naturally
occurring nucleotides which in turn exhibits superior incorporation efficiency in
the assay. The enzymatic process laid out in the scheme below details is based
on the luminometric detection of ATP through the conversion of PPi molecules
through an enzymatic cascade.
(DNA) + dNTP!"#$%&'()*,-.*/000000000001 2DNA3 45 + $PPi$ (1)
PPi$ + $APS#67$.8'%98,('-.*/0000000000001 ATP$ +$SO:
;< (2)
ATP$ + $luciferin$ +$O<'8=>?*,-.*/000001 AMP$ + $PPi$ + $oxyluciferin$ + CO< + $hv$ (3)

17
Figure 9. An illustration of the underlying principal of sequencing by synthesis
consisting on the primed DNA template being subjected to iterative additions of
nucleotides while in the vicinity of a DNA polymerase molecule, represented in
the schematic as an oval shape. If a complimentary nucleotide is added,
incorporation of it into the sequence can be conducted through a condensation
reaction, releasing a PPi molecule and polymerizing the nucleotide to the chain.
With the addition of dNTP to the reaction mixture, the DNA polymerase
incorporates a complimentary nucleotide onto the 3’terminus of the strand which
releases a PPi molecule into the solution. The free PPi molecule can then be
observed via a coupled enzymatic reaction consisting of the ATP sulfurylase-
mediated conversion of PPi to ATP which is in turn consumed by the firefly
luciferase enzyme to produce detectable fluorescence [58, 60]. Detection of the
signal is done with a photon multiplier or a charge coupled device (CCD)
camera. This method does not, however, lend itself to the robust sequencing of
DNA and thus no further progression of the technique is reported in the
literature.
In progressive stages over the course of time, the sequencing-by-
synthesis method has been developed into a robust, easy-to-use sequencing
method for DNA through improvements in the removal efficiency of nucleotides
and additional modification of the sequencing-by-synthesis principal. The
innovation of the Pyrosequencing technology developed and described by
Nyrén and colleagues is a direct result of this [61-63].

18
1.3.4 Pyrosequencing technology
The negation of unincorporated or excess dNTPs through total removal
or degradation has been a key factor in the application of the sequencing-by-
synthesis technique to DNA sequencing. In the Pyrosequencing method, the
removal of nucleotides is executed in one of two ways (i) the solid-phase
approach uses a three-coupled enzyme-mediated reaction with interspersed
washing steps and (ii) the liquid-phase approach which uses a combination of
four enzymes in a cascade reaction which requires no additional washing step.
Pyrosequencing by the solid-phase approach
The solid-phase approach localizes the sequencing-be-synthesis method
to the surface of a solid-phase. All four nucleotides are added and then
removed in dispensing and washing steps with one additional nucleotide being
added to the sequence each time. There are several solid-phases currently in
use; magnetic beads are on more recent approach [64] where a DNA template
and annealed primer is labeled with biotin and immobilized on a magnetic bead
which is coated with streptavidin. The primed strand of DNA is incubated with
the three enzymes, DNA polymerase, ATP sulfurase and luciferase. Following
the addition of each nucleotide, the DNA template is immobilized through the
application of a magnetic field to the magnetic particles, holding them stationary
while the washing cycle is completed.
There are several drawbacks to this method including the stripping of the
DNA templates during the washing step, repetitive addition of enzymes and
difficulties achieving a steady baseline; in addition, by its technical nature, this
method does not lend itself to facile automation. A more promising approach is
the use of a flow system to detect PPi and ATP on streptavidin coated
substrates on which are biotin-mediated immobilization of ATP sulfurylase and
luciferase. The use of a dynamic fluid flow should result in a more stable base
line and in turn improve the detection of the sequence signal. This modified
method is also more economical as the enzyme mixture does not need to be
replenished after each addition of dNTP; additionally the constant fluid flow

19
serves to remove all inhibitory products in real time, thus rendering the reaction
un-attenuated as well as making the system applicable to a microfluidic format.
The solid phase Pyrosequencing method was successfully applied to the
microfluidic paradigm by 454 Lifesciences (since acquired by Roche) [65].
Pyrosequencing by the liquid-phase approach
The introduction of a nucleotide-degrading enzyme, called apyrase, was
responsible for the breakthrough of liquid-phase Pyrosequencing [60-61, 63]. The
introduction of this enzyme into the Pyrosequencing system negated the use of
solid-phase separation and thus rendered obsolete the additional washing and
enzyme addition steps synonymous with the latter. Apyrase exhibits high
catalytic activity with low amounts of it efficiently degrading unincorporated
nucleoside triphosphates in the reaction system first to nucleoside diphosphates
and then to nucleoside monophosphate. Apyrase also serves to stabilize the
base line with no fluctuations in the procedure as the enzyme catalysis reaction
proceeds.
This liquid-phase Pyrosequencing method utilizes a combination of four
enzymes in a cascade reaction while the sequencing of the DNA strand is
observed in real time. The reaction is begun with the annealing of a primer onto
a single DNA strand serving as the template. Figure 10 presents a schematic
description of the sequencing of a partially amplified DNA strand of the human
papillomavirus (HPV) with Pyrosequencing devices. The four enzyme-catalyzed
cascade reaction is shown whereby APS indicates adenosine 5’-
phosphosulphate and hv is the light photons emitted by the bioluminescent
enzymatic reaction.

20
Figure 10. The liquid-phase Pyrosequencing method is a non-electrophoretic
real-time DNA sequencing method which relies employs the release of light
from the luciferase-luciferin reaction as a detection signal to indicate the
incorporation of a nucleotide onto the target strand of DNA. All four nucleotides
are added in iteration to a mixture of four enzymes (1). The pyrophosphate
(PPi) which is released in the DNA polymerase-catalyzed reaction is converted
quantitatively to ATP by ATP sulfurylase (2); this provides the required energy
to facilitate the oxidation of liciferin by firefly luciferase to generate a light (hu)
(3). This light can be then detected by a photon detection device and observed
in real time through the use of an appropriate piece of computer software (4a).
Apryase then catalyzes the degradation of the unincorporated nucleotides at
which point the cycle is complete and the system is ready for the addition of the
next nucleotide (4b)
In the liquid-phase Pyrosequencing method, the primer is hybridized with
the template strand of DNA and the combined with the reaction enzymes, DNA
polymerase, ATP sulfurylasem luciferase and apyrase, along with the
substrates APS and luciferin. The four dNTPs are then sequentially added to
the reaction. When the appropriate, complimentary, nucleotide is incorporated
by DNA polymerase onto the 3’-end of the DNA template, PPi can then be
released in an equimolar quantity to the incorporated nucleotide.
The conversion of PPi to ATP is done quantitatively in the presence of
APS by ATP sulfurylase. The ATP produced in this reaction the drives the
luciferase-mediated production of oxyluciferin through conversion from luciferin

21
which in turn produces visible light proportionally to the original quantity of ATP.
This light can then be detected by a photon multiplier tube or CCD camera and
displayed as a peak in a pyrogram. Each signal of light is directly proporational
to the number of nucleotides incorporated by the preceding reaction. Apyrase
constantly degrades ATP and the remaining excess of dNTPs. Once the
degradation process is completed, the systematic addition process is begun
again. As this proceeds, a DNA strand complimentary to the template is formed
with the sequence being interpreted through the displayed pyrogram peaks.
The Pyrogram, produced by the Pyrosequencing process is analogous to
the electropherogram in the Sanger sequencing method. A pyrogram can be
read and observed in real-time as the reaction is ongoing and is the de facto
display of all the sequence signal peaks, displaying all nucleotide additions, the
dispensation order of nucleotides and the incorporated and unincorporated
dNTPs which produce the base line.
The modulus operandi of pyrosequencing relies upon the cooperation of
several enzymes to allow the monitoring of the synthesis of DNA. Stability,
fidelity, specificity, sensitivity, KM, and kcat are all critical parameters to the
optimal performance of reaction. The enzyme kinetics can be studied in real-
time and are given in Figure 6. The ascending pyrogram curve displays a slope
indicative of the activity of DNA polymerase and ATP sulfurylase while the
height of the signal is indicative of luciferase activity. The slope at which the
final curve decends indicates the of nucleotide degradation
As described above, apyrase is the catalyst for the degradation of ATP
with unincorporated or excess nucleotides being reduced to form nucleotide
monophosphates and inorganic phosphate; this results in a steady and uniform
decrease in the luminescence of the light signal to an intensity below that of the
baseline of the pyrogram. When this point is reached, there is an additional
internal lasted less than a minute to allow the degradation of the nucleotides to
be completed so that the next dNTP can be added. The addition of the
nucleotides can be repeated several times without any necessity to interrupt the
process with a washing step.
The enzymes employed in the Pyrosequencing technique are naturally
expressed by various organisms. The chemistry standard to Pyrosequencing
employs a modified 3’-5’exonuclease deficient Klenow fragment of E- coli DNA

22
polymerase [66]. The ATP sulfurylase which is used in the technique is a
recombinant version originating from the yeast cell Saccharomyces cerevisiae
[67] while the luciferase enzyme is taken from the American firefly Photinus
pyralis. The apyrase is taken from Solanum tuberosum (Pimpernel variety) [68-
69]. The global time scale for the event from polymerization to light detection is
between 3 and 4 seconds at room temperature.
The conversion of PPi to ATP by ATP sulfurylase occurs in
approximately 1.5 seconds while the generation of light from the production of
luciferase is executed in less than 0.2 seconds [70]. The light generated exhibits
a maximum wavelength of 560 nanometers which can be readily detected by a
photodiode, photon multiplier tube, or a CCD-camera.
There are many unique advantages to the Pyrosequencing technique
amongst contemporary DNA sequencing technologies. One of these
advantages is that mutations, deletions and insertions can be directly observed
in the pyrgram (discussed in the next chapter) and that the order of
dispensation of the nucleotides can be facilely programed. The ability to perform
the sequencing process directly downstream of the primer, beginning with the
first base after the annealed primer makes the design of the primer more
flexible and thus makes this technique highly advantageous. The real-time
production of the pyrogram as the pryosequencing process progresses, allows
nucleotide incorporations and base callings to be immediately and continuously
observed for each sample sequence. The Pyrosequencing method is finally and
most importantly for scalable methods, easily automated for high throughput
screening events.
1.4 SNP genotyping technologies
The first DNA sequencing method was described in 1977 by Sanger and
co-workers [45]. This method, which came to be called Sanger DNA sequencing,
is based on enzymatic chain termination, a set of single-stranded DNA
molecules is generated, that is size-separated by gel electrophoresis. This
method is by far the most common sequencing approach and has been further
developed and optimized. Sanger DNA sequencing was the workhorse in the
genome project and has been widely used in SNP discovery. However, its use

23
in SNP genotyping is limited by its low throughput and relatively high cost per
sample. Pyrosequencing, an alternative to Sanger DNA sequencing, was
developed in 1998 [61]. It is a real-time DNA sequencing method based on a
four-enzyme mixture reaction that uses luciferase-luciferin light release to detect
nucleotide incorporation by DNA polymerase into a target DNA This method will
be described in detail in Chapter 5.
Over the last ten years, significant efforts have been made to improve
SNP analysis with alternative techniques, so a growing number of new
technologies have been introduced. The alleles are distinguished on the basis
of different reaction principles, and the methods are then combined with general
detection methods to reveal the sequence information. With some few
exceptions, the methods require a pre-amplification step by polymerase chain
reaction (PCR) to produce enough DNA for testing. A number of high quality
reviews have been published on the ever increasing number of SNP scoring
technologies [23, 71-72]. Most of the methods can be divided between
hybridization-based-methods [39, 73-76] (Figure 11), ligation-based methods [77-84],
primer extension by DNA polymerase[29, 85-93] and invasive cleavage-based
method [94-95].
Figure 11. The principle of TaqMan
assay. Two fluorescent dyes, a
reporter (R) and a quencher (Q), are
attached to the probes used to allele-
specific hybridize with the target
DNA. When both dyes are attached
to the probe, reporter dye emission is
quenched due to FRET
(fluorescence energy transfer) from
the reporter dye to the quencher dye.
During the PCR reaction cycle, the
exonuclease activity of the
polymerase fragments the probe,
and the reporter molecule (R) is released. The PCR is followed in real time and
an increase in fluorescence indicates the presence of the matching allele.

24
1.5. Detection
A variety of techniques is used to generate signals and determine the
allelic status of SNPs and are combined with general detection methods to
obtain sequence information. The multiplicity of methods currently available is
due in part to the combination of reaction principles with different detection
systems. Figure 12 shows the different combinations used to analyze various
reaction principles.
Most of the common detection methods are based on the detection of
light emission (fluorescence or chemiluminescence) with, in some cases,
separation by gelelectrophoresis or on mass spectrometry. Fluorescence
detection methods have greatly increased the sensitivity and ease of analyzing
DNA. The availability of different fluorescent dyes and the diversity of their
application have made them the most widely applied detection methods today.
Fluorescence resonance energy transfer (FRET), in which energy is transferred
from one molecule to another, is becoming useful in applications such as the
DASH and TaqMan assay. Notable alternatives to fluorescence include
chemiluminescence in the pyrosequencing system and mass spectrometric
detection.
Figure 12. SNP genotyping methods categorized by reaction principles and
detection.

25
1.6 Next stage for DNA sequencing platforms
DNA sequencing is considered the gold standard method for discovering
new SNPs, but many alternative methods have been developed for known
SNPs. Each method has unique ways of distinguishing a particular SNP
position and is coupled with a detection method. There are at least 20 different
SNP genotyping methods currently available [96]. A list of some of these SNP
genotyping technologies is given in Table 1. The list does not cover all the
methods but does give a representative picture of what is offered on the market.
Many of these methods have been commercialized with a 384-well format and
automated, such as the single-base extension based SNPstream, MALDI-TOF
MS based Massarray System and Pyrosequencing’s high-throughput system
[96].
Each SNP genotyping method has advantages and disadvantages and is
suitable for a different range of applications [72]. Ultimately, choosing which
method to use is based on the type of data to be generated, the number of
samples to be processed, and the cost. That there is no single universal method
for all situations promises further development of revolutionary methods. There
is clearly a need for DNA analysis methods that are more specific, sensitive,
fast, simple, automatable, and cost effective than those presently available.
These demands are driving the rapid evolution of a diverse range of new
technologies. Some of these technologies have been developed on miniaturized
platforms, which in themselves offer numerous advantages. Some of these
platforms will be described in the following Chapter 3.

26
Table 1. Selected SNP genotyping methods.
Method Main advantage Company
Hydridization
DASH Inexpensive labelling Dynametrix, Ltd
TaqMan No post-PCR treatment Applied Biosystems
Oligonucleotide Ligation
SNPlex Multiplexing capacity Applied Biosystems
Primer extension
SNPs stream Simple, versatile Orchid Bioscience
SNaPshot Sensitive, no labeling Applied Biosystems
MassArray Sensitive, no labeling Sequenom
Pyrosequencing Informative, denovo
sequencing Biotage
Nuclease cleavage
Invader assay Does not require PCR Third wave technologies

27
Chapter 2
Introduction: Microfluidics and micro total
systems (TAS)
Microfluidics involve the manipulation, transport, and analysis of fluids in
micrometer volumes. The field has bloomed and branched off into many
different areas, for which a number of excellent general reviews are available
(e.g. biological and chemical analysis [97-99], point-of-care testing [100], clinical
and forensic analysis [101], molecular diagnostics [102] and medical diagnostics
[103]). LOC systems are compact, often stand-alone systems featuring full
process integration and automation to perform complex tasks.
This subchapter 2.1 briefly describes relevant information over the
microfluidics field, emphasizing the inter-relation between the chapters 1 and 2.
2.1 Microfluidics
Microfluidics involve the manipulation, transport, and analysis of fluids in
micrometer sized volumes (Figure 13). Microfabrication technology is used to
build microfluidic devices that exploit the inherent properties of liquids and
gases in the microscale domain. These devices can accurately control minute
volumes of fluid on a scale of nanoliters or picoliters. Making explicit use of the
unique microfluidic effects, the microfluidic concept has today evolved towards
the development of promising tools for analyzing biological samples in a way
commonly referred as ”Lab-on-a-chip” (LOC). The concept of LOC or
miniaturized total analysis systems (μTAS) as it is known today was proposed in
early 1990s by Manz et al. [104]. Since that time the field has bloomed and
branched off into many different areas, for which a number of excellent general
reviews are available (e.g. biological and chemical analysis [97-99], point-of-care
testing [100], clinical and forensic analysis [101], molecular diagnostics [102] and
medical diagnostics [103]). LOC systems are compact, often stand-alone systems
featuring full process integration and automation to perform complex tasks.

28
Figure 13 An example of laminar flow in a junction of
microfluidic channels containing flows of blue, yellow and
colorless dyes. The design of the shown chip consists of
500 µm by 100 µm channels with the direction of flow being
from left to right as indicated by the red and blue arrows.
The main advantages of microfluidic systems over conventional systems
include: minimized consumption of reagents, rapid response times (Table 2),
well-controlled reaction conditions, parallel processing, speed of separation,
excellent mass and heat transfer, low dead volumes, small power consumption,
reduced manufacturing costs, portability, and disposability. The concept is still
in its infancy, and significant technical challenges have to be overcome before
the full potential of this technology is realized in biomedical research. Some of
the challenges include fluid transport and the interfaces between the
macroscopic and the microscopic environment, which include sample
introduction and extraction as well as interrogation.
Table 2: Comparison of time and costs for the complete screen using traditional
methods and in microfluidic emulsions.
Robot Microfluidic drops
Total reactions 5 x 10⁷ 5 x 10⁷
Reaction volume 100 µL 6 pL
Total volume 5,000 L 150 µL
Reactions/day 73,000 1 x 10³
Total time ~2 years ~7 h
Number of plates/devices 260,000 2
Cost of plates/devices $520,000 $1.00
Cost of tips $10 million $0.30
Amortized cost of instruments $280,000 $1.70
Substrate $4.75 million $0.25
Total cost $15.81 million $2.50
Adapted from Agresti J. J. et al, Ultrahigh-throughput screening in drop-based
microfluidics for directed evolution, PNAS 2010, 107:4004-4009.

29
With these numerous advantages it is clear why microfluidic devices
have received such interest in recent times, having great potential for
revolutionizing chemical and biological processes.
2.2 Microfabrication
Microfluidic platforms can be fabricated involving different materials, with
the function and ideal properties of the device playing the center role
concerning the choice of substrate. Glass and silicon are usually processed
using a photolithography and wet etching. [105-106] Glass offers advantages in
terms of its optical transparency and stability with strong chemicals. Silicon is
used less commonly than glass due to its lack of transparency but tend to be
easier to mass produce.
Hard polymers have gained attention as substrates, being examples
poly(carbonate) (PC), [107] poly(methyl methacrylate) (PMMA), [108] and cyclic
olefin copolymer (COC). [109-110] Their disadvantages is that they are usually not
as stable to harsh chemicals and reaction conditions as glass, hence their use
in chemical processes is more limited than with glass. [111-112] A big advantage
though is that replication technologies can be applied to polymers enabling cuts
in cost and time of production of disposable systems, important for example for
point-of-care applications. Methods in use for fabrication for polymers
comprehend injection moulding, [110, 113] imprinting, [108] hot embossing, [108, 114],
and laser ablation. [115]
Poly(dimethylsiloxane) (PDMS) [116] is definitely the most used material
for chip fabrication in research environment because of its rapid and simple
fabrication that enables fast prototyping, though it is not so useful for mass
fabrication. PDMS devices can be prepared via soft lithography. [116-117] Shortly,
a “master” is prepared with characteristics from the chip design as positive relief
achieved with a photocurable epoxy. Next, the elastomer precursor and curing
agent are mixed and placed over the master. The device is then left to cure,
then peeled off the master and secured to a cover plate such as glass or
PDMS. If the sealing is well performed, the channel network is then ready to be
used.

30
2.3 Diffusion
In the closed channels and chambers networks of microfluidic systems,
the diffusion of molecules needed for certain reactions can be estimated using
the Einstein-Smoluchowski equation (Equation 1). [118]
= !2"#
Equation 1
where x = distance (m), D = diffusion coefficient (m2.s-1), and t = time (s). This
equation enables the enhancement or reduction of mixing in the microchannels
while designing the chips, depending on the purpose of the system.
Microfluidic systems have been proven to have many advantages over
so called conventional systems and they have been particularly very
successfully in areas such as separations and chemical or biological assays. In
the case of biological assays, the big surface-to-volume ratio of a microchannel
enables surface-based assays, in which for example, antibodies attached to the
channel surface are used to capture antigens, which is overall carried out
efficiently due to the reduced diffusion distances of antigens to the surface. In
addition to these advantages, the surface-to-volume ratio can be even more
increased by using functionalized microparticles, allowing further increases in
reaction efficiency. [119] Subchapter 1.2.4 Microparticles explains how such
particles are incorporated into these devices and the mechanisms by which they
can be manipulated for performing a number of procedures, including bioassays
and separations.
2.4 Microparticles
Polymers, glass, silica, gold, and inorganic crystals, are a few examples
of materials particles can be fabricated from. depending on the, and their
purpose and are available in a wide range of sizes (1 to 100000 nm). [120-121]
Particles with diameters of 1 nm to 1 µm suspended in solution are known as
colloidal suspensions, while particles between 1 µm and 100 µm are commonly
referred to as microparticles, and when in suspension form coarse suspensions.

31
Polymer microparticles, are widely used for many processes because of they
versatility, including bioanalysis and chemical procedures. Kawaguchi et al.
wrote a review describing the fabrication methods of such particles and their
possible applications. [120] Besides their wide range of possible sizes, they have
a broad range of functionalization options from chemical (e.g. amine, carboxylic
acid, epoxy) to biological (e.g. antibodies, antigens, single-stranded DNA)
groups, which allows specificity for binding or reacting (Figure 14). Their small
dimensions and volume causes them to have a large surface-to-volume ratio,
providing a big surface area for reacting and binding on. In addition, the
particles can respond rapidly to different parameters as temperature, pH,
electric fields, and are highly mobile in solution since the viscous drag forces
influencing them are low. Furthermore, some particles that possess soft layers
enable water penetration which reduces the fluid resistance on their mobility.
Figure 14. Microparticles functionalized with different surface groups (orange
header) for different bio- and/or chemical procedures (blue footer).
Given the many possible surface and physical properties of
microparticles, they are widely used as solid supports for several bio and
chemical procedures which include separations, immunoassays, and chemical
reactions. [119-120, 122] Commonly, such procedures are carried out by suspending
the particles into a solution or matrix containing target species or reagents that
can then bind or react to their surface before removing the particles from the
solution or matrix by sedimentation, decantation, centrifugation, or filtration.
Despite of all the benefits of employing microparticles for assays and so on, the
methods of separating them from the solution are quite time-consuming,

32
laborious, and inefficient, especially when the process involves several
repetitions for washing purposes. In the last years, microparticle separation and
assay techniques have been successfully integrated into microfluidic platforms,
decreasing overall diffusion distances while maximizing binding efficiency and
enabling more control over the fluid flow and particle mobility. In the next
chapters, the theory of particle stability will be explained, and the literature
related to the use of microparticles in microfluidic systems will be briefly
mentioned, giving more attention to continuous flow procedures.
2.4.1 Particle handling on-chip
The strategies and advantages of using microparticles in microfluidics
have been reviewed by Verpoorte [119] and Peterson. [123] Further applications
for immunoassays have also been reviewed by Lim and Zhang. [124] In
summary, there are two main methods for particle manipulation in
microchannels: (i) trapping, and (ii) continuous flow.
2.5 Miniaturized platforms for DNA analysis
More traditional sequencing technologies have still disadvantages in
terms of cost, speed, throughput, and sensitivity which results in lack of capacity
to properly address the always increasing demand for more sequencing
information. Therefore, there is a need to combine sequence information
acquisition with faster, cheaper, and better technologies for DNA analysis.
These technologies will most probably involve smaller reaction scales, evolving
into nanotechnology direction. The processes are wished to be robust enough
for general applicability while being simple enough for automation. Cost is a
very important aspect for developing new and high-throughput technologies.
There are two principal strategies behind designing new miniaturized assays
while reducing costs: parallel assays in solid-phase microarray formats and
homogeneous assays carried out in distinct channels of microfluidic devices
[125]. There are many terms present in the literature describing miniaturized
platforms, such as microarrays, microfluidic devices, bio- , DNA- and gene-
chips, and biosensors. A distinction must be made between microfluidic chips,

33
which typically involve fluids in channels, and chip-based microarrays, where
DNA molecules are bound and arrayed on a solid support to investigate target
DNA-probe interactions in parallel. In the following sections, an overview of
miniaturized platforms based on different concepts for DNA analysis is
presented.
2.5.1 Microarray technologies
A microarray is device designed for analysis consisting of an array of
molecules as oligonucleotides, cDNA, PCR products, and others, which are
immobilized at discrete, ordered or non-ordered, in the mM to mM scale solid
substrate, enabling a great number of parallel analyses. In general, there are
four steps involved in a microarray process: DNA immobilization on solid
support, hybridization with a probe, detection, and data analysis. Several
methods for the immobilization of DNA were developed by different research
groups. In the beginning, two types of arrays were reported: synthesized in situ
and pre-synthesized and spotted. Affymetrix Inc. (Santa Clara, CA, USA) and
prepared synthesized oligonucleotide probes on a silicon support by using
photolithography. [126] With suitable masking strategies, oligonucleotide arrays
of known sequence and known location can be fabricated with very high
densities (hundreds two thousands per cM2). The arrays can be created by two
main methods: by pin-based fluid transfer [127], and piezo-based inkjet
dispensers [128]. Several materials can be used as solid support for arrays, being
glass slides the most commonly but other have been reported as well, as nylon
membranes [129], beads [130], polyacrylamide gel pads [131], and activated
dextran. [132]
Once fabricated, these probe arrays are ready for hybridization. The
nucleic acids to be analyzed, i.e., the target, are labeled with a fluorescent dye.
The labeled target DNA is then incubated with the array. The formation of stable
duplexes between the complementary probes and the sample DNA is facilitated
by passive diffusion. The temperature and buffers determine the stringency of
the hybridization condition. When the hybridization reaction is completed, the
slide is inserted into a fluorescent scanner where patterns of hybridization are
detected. The hybridization data are collected as light emitted from the

34
fluorescent-labeled target, which is hybridized to the probes on the array.
Probes that perfectly match the target produce stronger signals than those with
mismatches. Since the sequence and position of each probe on the array are
known, the identity of the target nucleic acid applied to the array can be
interpreted by a computer program.
When the DNA microarray technology was introduced, it promised to be
a massive parallel genotyping method using simple, allele-specific hybridization
detection [133]. However, while DNA microarrays completely revolutionized the
field of RNA expression analysis, microarray-based allele-specific genotyping
has thus far found few applications. In gene analysis, the oligonucleotide (or
cDNA) arrays target sequences with different compositions and hybridization-
based analysis can clearly distinguish between the different sequences
involved. However, unlike gene-expression analysis, it is very difficult to design
a high-density oligonucleotide array in which single-base mismatches can be
resolved using standard hybridization conditions [134]. Thus, additional
treatments and optimizations have been used to increase the specificity.
One of the first strategies used to analyze SNPs in a microarray format
was sequencing by hybridization (SBH) as described by Southern et al. in 1992
[135]. A set of short oligonucleotides covering a large DNA fragment is arrayed
onto a DNA chip. The precise sequence of the oligonucleotide at each location
on the chip is known, and the pattern of hybridization of the fluorescently-
labeled DNA probes can be interpreted using an algorithm to give a sequence.
However, while the method has high throughput capacity, it is not very accurate
due to extremely small differences in the duplex stability between a perfect
match and a mismatch at one base [136]. Alternative approaches involve
hybridization followed by an enzymatic discrimination with DNA polymerases or
DNA ligases, as described in Chapter 3 above. The combination of single-base
extension with solid-phase bound oligonucleotides [137] has been successfully
applied to microarray formats for parallel SNP analysis [137-139]. In this approach,
each oligonucleotide printed on the array is designed complementary to the
sequence immediately next to the 5’end of the target SNP. One version of the
primer extension method involves placing the primer’s 3’end at the allelic
variation instead of immediately 5’end of it and allowing the polymerase to fully
extend the primer. DNA polymerase will only extend those primers that match

35
perfectly at their 3’ends. In this way, only one labelled nucleotide per reaction is
required and higher detection signals can be obtained than with single-base
extension since more fluorophores are incorporated during the primer
elongation process [140]. However, this approach is not as specific as single-
base extension since it gives false positive signals that are twice as high as
single-base extension [140]. The false positive signals are caused by the ability of
DNA polymerase to extend certain mismatches if given sufficient time. In
AMASE (apyrase-mediated allele-specific extension), the nucleotide degrading
enzyme apyrase is used to remove the nucleotides continuously, which
minimizes the risk of mis-incorporation during the extension reaction [141].
Ligation-assisted genotyping on microarrays is performed by ligating the single-
stranded target DNA to a probe hybridized to an immobilized oligonucleotide
[142]. Ligation-based chemistry offers an advantage for multiplexing on
microarray platforms because the interference is less between primers than is
the case with base extension assays.
Microarray technology is being proposed as the future platform for high
throughput genotyping, and an increasing number of companies are active in
this field, either with a whole new microarray platform or with conventional
technology. Affymetrix remains the best known DNA chip-maker and continues
to dominate the market. The Affymetrix GeneChipTM (Figure 15) is a highly
dense array of oligonucleotide probes on a silicon support arrayed by
photolithography. These chips have been used in a number of studies [143]. In
the GeneChip system, each SNP position is composed of a series of
oligonucleotides and complex computer algorithms are used to evaluate the
numerous signals for each SNP. The need for large amounts of
oligonucleotides for each SNP position is due to the difficulties in achieving
hybridization stringency that is capable of differentiating a match and a
mismatch configuration at one base.
Figure 15. The Affymetrix GeneChip (http://www.affymetrix.com).

36
Nanogen Inc. (San Diego, CA) developed a completely different type of
microarray chip that uses an electric fields in a microfabricated semiconductor
device [144], as shown in Figure 16. Through the use of microelectronics,
movement of charged molecules to and from designated test sites is achieved
to obtain concentration at those sites. This allows rapid hybridization, and
unhybridized molecules are removed by reversing the electrical potential. The
active hybridization approach removes many of the limitations of the passive
hybridization processes and can significantly improve the performance of DNA
array analysis for a variety of diagnostic purposes. The incorporation of
microelectronics limits the array density to 400 spots. However, the chip offers
flexibility of design since reactions occur only at individually controlled charged
test sites. Nanogen’s technology is an excellent demonstration of the
applicability of electronics and may ultimately lead to complete automation to
achieve integrated lab-on-a-chip systems.
Figure 16. The NanoChip from Nanogen (http://www.nanogen.com).
2.5.2 Microfluidics-based technologies
The main driving force within microfluidic-based genomic research has
been the need for a quick and easy way to perform DNA analysis. In the
following Section, microfluidic chip-based systems for DNA analysis are
described.
Microchip-based CE for SNP analysis
Electrophoresis is a separation technique used to fractionate and analyze
both DNA and proteins. Traditionally, 1- to 5-mm thick gel slabs of usually

37
cross-linked acrylamide have been the most common format for electrophoretic
separation. Over the past 10 to 15 years, significant efforts have been made to
improve on this separation method and have resulted in the development of
automated, high-throughput DNA sequencing and genotyping technologies.
These efforts have led to the transformation of the platform system from thick
slab gel to thin slab gel to capillaries and currently to a microfabricated chip
format.
In the early 1990s, miniaturized formats for analytical chemistry and
biology in microfabricated chips were critically evaluated by Manz and co-
workers [104]. The first papers demonstrating the potential of microfluidic chip-
based analysis involved the fast separation of fluorescent dyes [145-146] and
fluorescently-labeled amino acids [147] by capillary electrophoresis. Other groups
then used microfabrication technology to further develop such systems. The
advantages of microchip based capillary electrophoresis (CE) over conventional
capillary are reported by a number of reviews in the literature [101-103, 146-149]. In
general, almost all references report an enormous reduction in separation time
when switching to microchip CE. The increase in speed is generally on the
order of 10- to 100-fold relative to capillaries and slab-gel formats, respectively
[101]. Increased dissipation of heat generated by joule heating and the ability to
inject very small and well-defined sample plugs are some of the most important
features of the microchip based systems. In addition, there is the possibility of
integration with sample preparation. Figure 17 is a schematic drawing of a
basic photolithography-defined microchip device for electrophoretic separations.
The channel defined by Points 1 and 2 provides the separation, and the one
defined by 3 and 4 is the sample-introduction channel. At the end of each
channel, there is reservoir. These reservoirs also provide access for the
electrodes. With the introduction of the cross-channel and double-T injector
setup, well-defined sample quantities can be analyzed on electrophoresis
microchips. Samples are typically loaded electrokinetically into the injector
region by applying voltage between Points 3 and 4 and then separated by
applying the electrical field between point 1 and 2. The detector is placed close
to Reservoir 2 and is usually laser-induced fluorescence (LIF), but other
methods such as mass spectroscopy [150] and electrochemical detection [151-152]
have also been described.

38
Figure 17. Illustration of the main sections of a chip-based electrophoresis system with either a (a) cross injection or (b) double-T injection system. The vertical channel 3-4 is used for sample addition and the horizontal channel 1-2 as the separation/reaction portion. The detector is typically located on the far right, near Reservoir 2. Reproduced with permission of ACS
Publications as seen in Anal Chem. 2002 Aug 15; 74(16): 4054–4059. [153]
To increase the throughput even further, arrays of microfluidic devices
have been developed [154-157] to provide parallel analyses. One way to achieve
the necessary separation distance and high-speed analysis without sacrificing
throughput is to fabricate a dense array of long separation channels on a single
device. Systems of 16, 96, and 384 channels have been fabricated on 20-cm
diameter glass wafers [156-158]. In these devices, geometrically optimized turns
[159] were used to provide the necessary separation length. The radial chips in
combination with the innovative high-speed rotary LIF scanner [160-161] and a
high-pressure sieving matrix loader have increased the throughput capability of
these devices.
Chip-based CE for SNP analysis is becoming well-established. For
example, fast analysis of the candidate gene for hereditary hemochromatosis
[156-157], alleles of the D1S80 locus [162], and PCR products of Hepatitis C virus
[163] have been demonstrated. A comprehensive summary table of articles
describing chip-based genotyping using CE is given in the review by Verpoorte
[101]. A number of companies are beginning to commercialize microfluidic DNA
chips for electrophoretic separations. Caliper Life Science was one of the first
companies established in the field of microfluidics and is presently developing
lab-on-a-chip systems for various applications. Caliper’s LabChip system offers
automated SNP interrogation using very small volumes in microchannel
networks. A combination of pneumatic and electrokinetic forces are used to
move fluids and perform separations on chip and to integrate sample

39
pretreatment procedures. The first commercial instrument for microchip-based
DNA analysis was the Agilent 2100 Bioanalyzer, by Agilent Technologies. Since
then, a number of genotyping studies have appeared in the literature based on
the use of this technology [101].
In conclusion, microchip-based CE has recently evolved as a promising
method for genotyping. The more recent development of sequencing
technologies in microfabricated channels may deliver significantly reduced
reagent costs and increase throughput by decreasing reaction volumes and
reducing run times. However, it is important to bear in mind that molecular
diagnostic analysis is a multi-step process of which separation is only one part.
The pre-electrophoresis steps including DNA extraction and PCR amplification
have to be integrated with the separation.
Polymerase chain reaction
DNA amplification by PCR has become a key tool in modern molecular
biology, but PCR is also the rate-limiting step in many genotyping applications.
Therefore, this step needs to be speeded up. Conventionally, PCR is performed
in benchtop instruments, whose large thermal mass limits the speed at which
thermal cycling can be carried out, so the reaction times are on the order of a
couple of hours or more. The benefits of miniaturization come from improved
thermal-energy transfer, which reduces the typical cycling times from several
minutes to 30 seconds or less. A number of groups have investigated
microchip-based PCR systems in both disposable microchambers and
microfluidic formats. Two different concepts have been reported for chip-based
PCR. In the first configuration, the reaction mixture is stationary and entrapped
in a thermocycling chamber that is typically micromachined in silicon or glass.
The first papers dealing with this configuration were presented by Northrup and
co-workers [164] in 1993 and Wilding and co-workers [165] in 1994. The devices
consisted of a reaction chamber with the inlet and the outlet in silicon and
sealed with Pyrex glass. The chamber was then placed on a conventional
thermocycling instrument for heating and cooling. Later on, heaters and
temperature sensors were integrated into the device [166]. The integration of
optical windows in the silicon chamber permitted real-time monitoring of the

40
PCR reaction. The second configuration, which was introduced by Kopp et al.
[43], involved a continuous-flow amplification system. The reaction mixture is
pumped continuously through the chip and flows repeatedly through three
different copper blocks side by side, providing three distinct constant
temperature zones to ensure denaturation, annealing, and extension.
Integrated systems for DNA analysis
The vision of a lab-on-a-chip requires integration of all the steps onto one
chip, in particular the integration of PCR and product analysis. Initially, only
individual steps were performed in the microfluidic chips and only a handful of
integrated genotyping devices have been developed until now. DNA sample
preparation and integrated analysis were first published in 1996 [167-169]. In these
systems, the PCR step was coupled with microchip CE to produce integrated
DNA analysis systems.
An integrated silicon chip that extracted DNA from a sample, separated
fragments, and detected samples with an integrated photodiode [170] has been
described. This impressive chip is capable of moving samples in microchannels
with heaters, temperature sensors, and a fluorescence photodiode detector.
Amplified DNA are mixed with intercalating dye, separated in a cross-linked
polyacrylamide gel, and detected with the photodiode - all on board the
microchip. Quake and co-workers have developed microfluidic systems using
components fabricated with flexible polymer (polydimethylsiloxane) parts with a
variety of microchannels and membrane valves for nanolitre-scale biological
sample processing and analysis [171]. They have managed to integrate a variety
of different biological processing techniques, such as amplification of nucleic
acids and cell sorting in the same system, which allows parallelization [171-174].
2.5.3 Particle-based methods
Nano- to micrometer-size particles are used routinely in molecular
biology. The surface of these microspheres can supply active groups, such as
carboxylic or amino groups, for covalent coupling of biomolecules. The high
degree of flexibility in surface coatings allows them to be used in a wide variety

41
of applications. These applications include immunoassay, affinity assay, DNA
hybridization assay, and protein-protein interactions. Microspheres have many
advantages including a high surface-to-volume ratio, which enables reactions to
be performed in lower volumes, increased diffusion - thereby decreased
analysis time, and easy separation from the bulk of the reaction mixtures.
Beads are mostly used in suspension mixtures and are interrogated individually
by flow cytometry. In microfluidic devices that are not based on suspension
mixtures and cytometric analysis, the beads must be controlled inside the chip.
A number of different methods have been described to control the beads in
confined areas. In this thesis, two different strategies have been used to capture
beads: 1) a flow-through filter-chamber device consisting of grids of pillars and
2) microcontact printing-based immobilization of beads without the use of a
physical barrier.
Bead-based systems have emerged as a promising tool for genomic
applications. Some of the platforms for DNA analysis will be briefly reviewed
below.
Particle-based platforms for SNP analysis
An alternative to DNA microarrays is an approach whereby the solid
phase is composed of beads. Bead-based systems can be combined with most
of the allele-discrimination chemistries used in the microarray format described
earlier. One advantage of beads is that reactants can be added to them before
or after they are immobilized. This opens up many ways to use reaction
multiplexing, since mixtures of different beads and reagents can be integrated
across various time and spatial coordinates. For example, samples from
different individuals could be combined and simultaneously examined on one
micro-surface. Doing this would require prior bead coding by chemical [175],
spectrometric [176], electronic, or physical means [177] so that the results could be
decoded and assigned to appropriate samples or assays.
Luminex Corporation (Austin, TX, USA) has developed a genotyping
platform based on microspheres that are internally dye-labeled with two
spectrally distinct fluorochromes (red and orange) [176]. When the colors are
combined in different ratios, codes of up to approximately 100-color resolution

42
with specific spectral addresses can be achieved. Hence, it is possible to
perform a hundredplex detection reaction in a single tube. A third fluorochrome
(green) is coupled to the DNA immobilized on the microspheres for the
genotyping signal. The microspheres are interrogated individually by flow
cytometry simply by rapidly flowing through two separate lasers, one laser to
excite the two dyes contained within the microsphere and the other to excite the
reporter dye on the immobilized DNA. This combination of encoded
microspheres and flow cytometry is known as suspension array technology
(SAT) and is a very fast detection method. The Luminex bead-based platform
has been shown to work with several assay chemistries for SNP genotyping.
Allele-specific hybridization [178] and the use of enzymatic allele discrimination
by means of single-base extension [179-180] and oligonucleotide ligation assay
[181] have been described. Recently, a microsphere based invasive cleavage
assay has been described for genotyping SNPs directly from human genomic
DNA samples without prior PCR amplification [182]. This assay uses a cleavage
reaction that generates a fluorescent signal on the microsphere surfaces
followed by flow cytometry analysis of the microspheres.
In a different bead-based platform, commercialized by Illumina Inc. (San
Diego, CA), microspheres are randomly assembled on the end of an optical-
fiber substrate [183-184]. The fiber-optic arrays are prepared by fusing together
densely packed fibers into a bundle of about 50 000 individual fibers packed
into a hexagonal matrix. Wells at the ends of each fiber are created by dipping
the fiber-optic bundle into various chemical-etching reagents. Each well is
dimensioned to accommodate a single microsphere and is typically about 3 to 7
μm in diameter. A particular oligonucleotide probe is conjugated to each bead,
which is followed by quantitative pooling of the bead types in a stock solution.
This library of beads is then exposed to the fiber optic bundle and each bead is
captured in a well of the fiber-array surface.
Once the beads are attached to the wells, the concept is very similar to
that of DNA microarray assays. However, oligonucleotides attached to the
microspheres are spectrally registered in function of a random distribution in the
wells rather than fixed surface positions predetermined during array fabrication.
Since the beads are attached randomly, a decoding process is needed to
identify the captured beads. This is accomplished by a series of hybridizations

43
with fluorescently-labeled oligonucleotides that are complementary to the
capture probes on the beads. The combinations of different fluorescent dyes
(with different excitation and emission wavelengths and intensities) allow each
bead to be independently identified. The optical properties of the fiber are used
to detect the fluorescent signal from the beads and the genotyping signal from
the oligonucleotides of interest. The fiber-optic bundle is regenerated after the
reaction by removing the beads. This highly miniaturized platform has
enormous potential in multiplexing capabilities.
Illumina introduced bead-chip arrays in a slide-shaped substrate. Each
region can interrogate separate bead assays and can be configured in different
sizes and densities depending on the application. Today, Illumina uses a library
of 1500 bead types, each with a unique oligonucleotide capture probe ready to
hybridize to a complementary sequence in a multiplexed SNP assay. The
Illumina platform is compatible with most of the SNP assays described earlier.
The platform produces accurate genotyping results with single-base extension
[180, 185], ligation assay [181, 186], and allele-specific extension. Extremely high
throughput is obtained by arranging the fiber-optic bundles to match the layout
of the 96-, 384-, and 1536-well microplates.
The DNA bead arrays described above have smaller feature sizes and
higher packing densities than DNA microarrays. The advantages of this high-
density randomly distributed micrometer-sized bead-based DNA array include
cost effective production of the bead arrays in seconds, high-throughput
analysis, easy replacement with different or additional beads when different
testing is desired, and facile regeneration of the sensor and substrate.
454 Life Sciences developed an innovative approach to sequencing an
entire genome that uses a microfluidic format with beads integrated in all the
steps from the sample preparation, to amplification, and sequence analysis.
They developed a novel platform, PicoTiterPlate, consisting of 44 μm in
diameter microwells which are 50 μm deep for simultaneous amplification and
analysis of over 300 000 beads in parallel [187]. Genomic DNA is fragmented and
single-stranded DNA is captured at one copy per bead with complementary
capture primers. Solid-phase PCR is performed to amplify the entire genome at
one time in a water-in-oil emulsion. The beads are loaded into the
PicoTiterPlate wells, each of which permits only one bead. Solid-phase PCR

44
can also be performed directly in the PicoTiterPlate [187]. Massively parallel
sequencing is performed using bioluminometric sequencing-by-synthesis
method. The reagents flow through the PicoTiterPlate wells and can diffuse
uniformly into and out of the wells. The light generated by the nucleotide
incorporation into the system is detected by a light detector.
In this chapter, I described various miniaturized platforms for DNA
analysis. The best-known example of a miniaturized tool today in this field is the
DNA microarray, which has become increasingly important as a clinical
diagnostic tool and is playing a central role in genomic research. Microarray-
based testing is faster and more convenient than serial testing and has largely
revolutionized gene-expression analysis. In recent years, bead-based platforms
have entered the arena. They are a more cost-effective than the traditional
planar microarray, and beads can be integrated into the sample preparation
steps. Microfluidic systems are more versatile than surface-based microarrays,
and their importance in genomics is growing steadily. These systems promise to
reduce cost and improve performance by integrating several processes that
otherwise require a suite of bulky instruments and manual handling.
These platforms all have both advantages and disadvantages, which
makes it difficult to select a single platform as ideal for all applications. The
meaningful exploration of genome variation for the purposes of
bioscience/biotechnology will require meeting the ultimate goal of defining all
genome variation in an individual at manageable cost and throughput. A
combination of these techniques in conjunction with other innovative
technological development will be necessary.

45
Chapter 3
Open surface microfluidics
Over the last 10 years, a pursuit of an increase in throughput, reduction
in material consumption and function integration to improve the analytical
performance, led to downscaling molecular and cellular analysis by using the
microfluidic format.[188-193] The early development of miniaturized assays greatly
expanded from a limited simple fluidic operations to assays required complex
and more sophisticated fluid handling.
Microfluidics have been widely employed both in chemical and biological
analysis for decades. Microfluidics are based in a variety of micro-
manufacturing techniques, allowing the use of little amount of reagents, giving
access to accelerated reaction rates, process integration and multiplexicity. A
clear disadvantage of such closed systems however includes the flow
confinement which requires complex multilayer structure manufacturing. [194-199]
Further, any gas in a closed microchannel liquid interface (e.g., enclosed air
bubbles) in the operating fluid can lead to unexpected failure, which is another
problem in miniaturization. Surface microfluidics is a new alternative to
conventional microfluidics that solve the obstacles mentioned above, and will
receive more and more attention in the microfluidic community.[200-202]
Automatic microfluidic manipulation is one of the most relevant chores to
be carried out by a lab-on-a-chip device aiming to compact and to integrate
several chemical and biological functions into a microchip. Early microfluidic
platforms, commonly utilizing single-phase fluids in microchannels, have made
tremendous advances in the direction of fully operational instruments for
miniaturized biochemical assays with increasing complexity. [203-207]
Nevertheless, such continuous-fluid systems often require complex micropumps
and microvalves as well as external appliances in order to carry on with liquid
manipulation through the channel network interfering with the miniaturization
development and future commercialization. Recently, droplet-microfluidics have
gathered great interest. micro-droplet-based microfluidic system considerable
attention.[208-209] In comparison to the continuous-flow platforms, the handling of

46
droplets offers more flexibility of operation, reduction of sample and reagents
usage, as well as reduction of fabrication costs, particularly in the case of
droplet-manipulation on an open surface.
3.1 Droplets as reaction and transport units
Many approaches have been adopted for droplet actuation on a surface,
as electrowetting, [210-211], dielectrophoresis, [212] and magnetism. [213-215] Even
though “digital-microfluidics” which mainly involves electrowetting has gathered
popularity, the choice of magnetic actuation for droplet manipulation through
particles present in suspension in the droplets to actuate offers relevant
advantages. The range of magnetic particles ready for use, considering already
the different particles possible to functionalize with many sorts of biomolecules,
provides a strategy for both biomolecular separation and/or reaction. In addition,
magnetic particles and droplets are simple to manipulate which cuts in terms of
cost and size of the equipment involved. Magnetic particles have been already
utilized for small-volumes transportation on miniaturized platforms. Garcia et al.
[216-217] investigated the movement of viscous droplets caused by magnetic
gradients on top of a superhydrophobic surface. Ohashi et al. [218] created a
PCR instrument using droplets and magnetic transport. Nguyen et al. [219-220]
described their work on the effect of planar magnetic coils on ferrofluid-droplets
and respective kinematics, as well as developed a circular closed-loop device
using ferrofluid for fast PCR. [221-222] Magnetic particles actuation on planar
surfaces were also used in combination for bio-separations and -reactions.
Shikida et al. [223-225] developed a system able to handle magnetic particles-
clusters by conducting these from well to well through an interconnect.
Lehmann et al. [213, 226-227] showed an adaptable platform by fabricating an array
of coils placed on a PCB plate to create a magnetic gradient, thus manipulating
magnetic particles in an oil well with a hydrophobic base for extraction and
fusion reactions. Pipper et al. [214] reported a micro-droplet platform for cell lysis,
RNA extraction and purification, and real time RT-PCR, having all steps
integrated in one device by actuating magnetic particles with an external
magnet through an array of micro-droplets. In addition, these researchers
broadened the platform for purification of certain cells with extraction of the

47
respective DNA. [215] In this platform, the particles are not only the support for
biomolecular adsorption but also work as carriers, meaning that droplets are not
only reaction vessels, but also transport units. The potential given by the
flexibility of designing arrays of stationary- and moving- droplets according to
demand and for different applications is enormous.
Generally speaking, the flexibility involving droplet-volumes, obtainable
particle mass in the droplets, speed of the particle motion, settings for droplet
splitting or merging, among other variables, under magnetic actuation is
enormous on an open surface. It is necessary though, that all these conditions
are influenced by particle type, droplet size, surface tension, viscosity and effect
of oil coating on droplet kinetics.
3.2 Droplet actuation platform
A conventional magnetic droplet-actuation platform is depicted in Figure
18. Water-based droplets covered with a layer of mineral oil are placed on an
hydrophobically coated glass substrate (glass slide). Hydrophilic magnetic
particles are suspended in the droplets. An external magnet is placed beneath
the slide holder and is used for droplet manipulation.
Figure 18 Illustrative set-up and basic operations in a magnetically actuated
droplet-system.

48
3.3 Droplet manipulation
Figure 18 shows the fundamental response of droplets and droplet-
contained particles in magnet-actuated droplet handling. It starts with the
attraction of the magnetic particles present in the droplet to the base of this
same droplet by the magnetic force (cause by the approximation of an external
magnet). The particles can be moved by moving the magnet horizontally
underneath the glass slide. The particles will form a cluster by being forced
towards the wall of the droplet (contact line). The magnetic force will move the
magnetic-cluster to the water/oil interface which results in droplet deformation.
From this stage on, two different operations can be carried out. On one hand,
droplet movement can be done if the droplet is fully “dragged” by the magnetic-
cluster. On the other hand, magnetic-cluster extraction can be done by splitting
of a daughter droplet containing the magnetic cluster from the reaction mother
droplet. [228] These two operations correspond to the fundamental ones in
magnetically actuated droplet manipulation platforms.
In preceding bio-separations and -reactions with droplets containing
magnetic particles, the contained magnetic particles were used either as a
droplet driver [216, 218] or as an extractable solid support.[213-214, 229] It is important
to emphasize, that integration of operations in these cases wasn’t easy which
makes crucial taking measures to reduce the conflict betweendroplet motion
and particle extraction. In order to facilitate the bead extraction from the mother
droplet, Shikida et al .[223-225] used a channel that worked simultaneously as a
gate to stop the droplet from being dragged along by the magnet motion while
the magnetic force pulled the magnetic-cluster daughter droplet from it. As
another alternative, Lehmann et al.[213, 226-227] developed hydrophilic and
hydrophobic patterns onto the glass substrate to restrain the droplets on the
base surface. Superhydrophobic surfaces and smaller droplets size are also
commonly used for droplet transport. By designing asnd preparing such
surfaces with special topographies for droplet manipulation increases the
complexity of device fabrication. The work of Pipper et al., is an exception to
this. This was achieved by combining solid phase extraction (droplet splitting)
with clockwork PCR, using droplet transport to cycle the droplet though zones
with the different PCR required temperatures. [215] (Figure 19) They observed
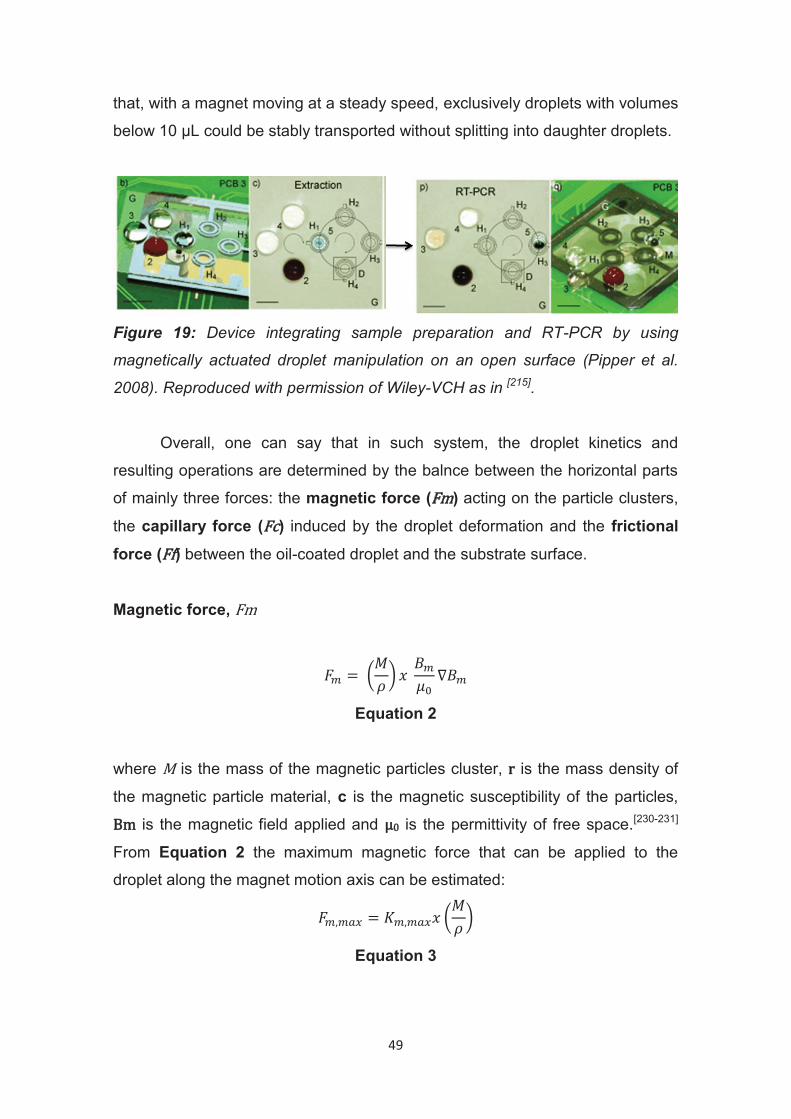
49
that, with a magnet moving at a steady speed, exclusively droplets with volumes
below 10 µL could be stably transported without splitting into daughter droplets.
Figure 19: Device integrating sample preparation and RT-PCR by using
magnetically actuated droplet manipulation on an open surface (Pipper et al.
2008). Reproduced with permission of Wiley-VCH as in [215].
Overall, one can say that in such system, the droplet kinetics and
resulting operations are determined by the balnce between the horizontal parts
of mainly three forces: the magnetic force (Fm) acting on the particle clusters,
the capillary force (Fc) induced by the droplet deformation and the frictional
force (Ff) between the oil-coated droplet and the substrate surface.
Magnetic force, Fm
! ="#$%& '"(!)* +(!
Equation 2
where M is the mass of the magnetic particles cluster, r is the mass density of
the magnetic particle material, c is the magnetic susceptibility of the particles,
Bm is the magnetic field applied and µ0 is the permittivity of free space.[230-231]
From Equation 2 the maximum magnetic force that can be applied to the
droplet along the magnet motion axis can be estimated:
!,!-. = /!,!-.' #$%& Equation 3

50
where Km,max is the maximum value of 0123 4(! that can be achieved for a specific
magnet and device setup.
Frictional force, Ff
5 6"/578)9:;<
Equation 4
where Kf is the friction constant, Rb is the radius of the base contact area
between the oil-coated droplet and the substrate, m is the viscosity of the oil
and U is the velocity of the drop.[220, 232] It is important to emphasize that the
dynamic friction is proportional to the base radius of the oil-coated droplet, and
not its contact area with the substrate, because the viscous drag in the
proximity of the contact line dominates the sliding friction for small drops, whose
radius is of the order of the capillary length, >?@ ="ABCDEFG HIJ , or smaller.[232] Koil is
the surface tension of the neighboring oil phase, r is the fluid density, and K is
the acceleration caused by gravity.
Capillary force, Fc
When a magnet is moved horizontally away from a droplet, magnetic
particles suspended in the droplet will be pressed against the side of the
droplet, deforming it. This deformation generates a capillary force, which keeps
the particles in the droplet. Over a sustainable capillary force, the particle
cluster will detach and a smaller daughter droplet containing the particles will be
extracted from the mother droplet. The capillary force at which this happens
was given by [224] and can be defined by the following Equation 5.
L,!-. ="M@N"OPNQ*?R #$%&
@N
Equation 5
The analysis of the combination of the three forces described above can
be illustrated with the three distinct regions in the operating diagram shown in
Figure 20- The 3 described regions can be defined as follows:

51
- Region 1 – steady transport of the droplet takes place in this region,
which means the magnetic force, Fm, is balanced by the frictional force,
Ff, resulting in both the droplet and the magnet moving at the same
speed.
- Region 2. –magnet detachment happens in this region. Both the
frictional force, Ff, and the maximum capillary force are greater than Fm,
max.
- Region 3. - Fm, max is greater than Fc, max in this region but Fc, max is
smaller than the friction force which means that the magnetic pulling
force acting on the particle cluster conquers the interfacial force and a
particle daughter droplet splits off the mother droplet.
Figure 20 Diagram illustrating the analysis of the combination of the main
forces involved in droplet transport/merging. OB1, OB2 and OB3 represent the
operating boundaries between three distinct operation regions. Reproduced
with the permission from Royal Society of Chemistry as seen in [228].
3.4 Important parameters
Magnetic properties
Equation 2 demonstrates that the magnetic force required for a droplet
operation, motion or split, is influenced by both the magnetic field’s strength and
gradient together with the amount of used magnetic particles and their magnetic

52
properties. Despite existing other ways of creating a magnetic gradient as for
example arrayed coils [213, 219, 227], these do not remove the necessity of having a
strong and homogeneous magnetic field which can be achieved with the use of
a permanent magnet, and overall require a more complex fabrication procedure.
Using this reasoning, a Nd-Fe-B permanent magnet placed on a translation
stage that can be motorized vertically aligned and close to the substrate used
for droplet manipulation can be used. Such setup generates strong magnetic
fields and enables a considerably easy control of the magnet’s movement.
Many types of magnetic particles are commercially available with
different degrees of magnetic susceptibility and sources to answer the demand
for several applications in bioseparation and bioreaction. These particles can be
superparamagnetic, with a wider range of purposes in biosciences because of
their resuspension properties, their greater surface area and slower
sedimentation in solution, when compared to the ferromagnetic particles. The
ferromagnetic particles possess in contrast very strong magnetic properties and
are therefore quite simple to manipulate even in case viscous solutions are
involved.
Droplet size
In summary, the frictional force rises with the increase of droplet volume
and velocity, the maximum magnetic force and the maximum capillary force do
not depend on the droplet volume but exclusively on quantity of magnetic
particles loaded into the droplet. Due to this, the maximum velocities that can be
achieved by a droplet will decrease as the droplet size increases. This tendency
is illustrated in Figure 20, with the operating boundaries OB1 and OB2.
This means, magnetically manipulated droplet systems are capable of
droplet motion with volumes up to hundreds of microliters, while the so called
digital-microfluidics typically involved droplet motion with volumes of few
microliters by using electrowetting. [210-211]
On Figure 20 also illustrates that a large droplet volume enables
splitting, and therefore extraction, while achieving the same with smaller
droplets is difficult. Such challenge can be conquered by readjusting the
smoothness and roughness of the substrate used. These are aspects to

53
consider while designing devices using this strategy for bioassays, since the
volume of the droplet dictates the quantity of reagents and material that can be
analyzed and handled in one droplet.
Surrounding oil layer
So far, the presence of an oil medium has been needed to perform
droplet manipulations. The oil aids the droplet manipulation by firstly, lowering
the interfacial tension existing between the aqueous part of the droplet and the
surrounding medium which makes splitting and extraction considerably easier.
In addition, the oil also averts evaporation of the aqueous droplet and
reduces the risk of contamination. Earlier studies reported that the magnetic-
bead-containing droplets were usually suspended or immersed in a container of
oil,[213, 218, 226-227] which not only involves more complex fabrication process but
causes as well handling and imaging issues. In alternative, as Pipper et al. [214-
215] suggested, the aqueous droplets can be sealed by a layer of silicone oil.
Surface tension and viscosity of the aqueous phase.
The interfacial tension of a droplet depends on the surface tension of
both the aqueous and oil phases which can be altered by using different buffer
solutions. This can influence the magnetic actuation in ways such as, for
example, when the magnet in the proximity of the droplet is moved, not all the
magnetic particles move onto the contact line of the droplet during transport
which means that not all the magnetic particles loaded into the droplet
contribute to the magnetic force. Consequently, the actual magnetic force acting
on the droplet is reduced and the magnet disengagement might occur at a lower
velocity than predicted. Therefore, droplets with higher viscosity should involve
a lower manipulation speeds.
Merging and mixing
The covering oil layer should be thin, since droplet merging always takes
place as soon as the two droplets are brought into contact. However, for

54
droplets covered by a thick oil layer there is a higher challenge to merge both
aqueous droplets, particularly when smaller volume droplets are involved. In
such cases, a double-core emulsion comprehending both aqueous droplets is
formed when the manipulated droplets merge. Because the two aqueous
droplets are covered separated by a thick oil layer, the two droplets are actually
separated and do not merge spontaneously. In some cases the passive droplet
(recipient droplet) moves further away from the active droplet (manipulated
droplet) which prevents merging from happening at all.
3.5 OSM for DNA analysis
Magnetic Manipulation of Droplets via Surface Energy Traps
Zhang et al. [233] reported a surface energy traps (SETs)-based magnetic
droplet manipulation platform for a wide range of fluidic operations. A SET is an
etched area of high surface energy (hydrophilic) on a glass substrate coated
with a low surface energy (hydrophobic) film to make droplet manipulation
easier (Figure 21). Similar designs can also be used to functionalize
superhydrophobically coated surfaces for bio-adhesion in electrowetting-based
microfluidic systems.[234-236] The proposed design enabled a wide range of
possible droplet manipulations, including droplet transport, fusion, particle
extraction, and liquid dispensing.
Figure 21. Droplet handling with SETs. A pattern with SETs is done on a
Teflon-coated glass substrate using lithography. The SETs are patterned
selectively with the aid of a SU8 mask by etching the Teflon film with 02 plasma.
The Teflon film provides a low energy surface (superhidrophobic) for (I) droplet
transport and (II) droplet fusion. These SETs can be used to (III) reference the
contact line for extraction of magnetic particles from a droplet and (IV) to hold

55
volumes of solution to create new daughter droplets. Reproduced with
permission of Wiley-VCH as in [233].
SET-Assisted Magnetic Droplet Manipulation for serial dilution.
Droplet microfluidics can be used for applications as biochemical assays
without the need for complex fluidic networks of pumps and valvut not only. By
using EWOD, an aliquot droplet can be easily created, but the resulting volume
an be difficult to predict and to control, as it is influenced not only by the
handling parameters as driving voltage and signal duration and also other
aspects as surface roughness, surface coating and environmental humidity [237].
In comparison to EWOD, the biggest advantage of magnetic actuation is its
capability to simultaneously manipulate both liquid and magnetic particles (MPs)
at the same time for performing heterogeneous assay that need solid phase
extraction [214-215, 238]. The magnetically manipulated droplets systems have
been studied under various conditions and applied to different demands. [228, 233,
238-239] To address the lack of applications on operations such fluid metering and
dispensing this issue, further research was carried out with SET-assisted
magnetic droplet manipulation technique [233] (Figure 22). SETs provide an
additional mechanism for droplet control. Zhang et al. reported a magnetic
droplet microfluidic platform for facile and rapid generation of serial dilutions
using these SETs that meter and dispense fluid at defined volumes. They did
this by demonstrating an antibiotic susceptibility test (AST) using the developed
platform by preparing droplet-based serial dilutions of antibiotics using the SET
method. [240]
Figure 22. Scheme of SET-enabled magnetic droplet manipulation. (a)
Illustration of droplet operations on the platform where SETs control the size of

56
the resulting daughter droplets. (b) Picture of an actual SET-based platform. (c)
and (d) Side and top views of a SETs device. Reproduced with permission from
Royal Society of Chemistry as in [240].
Biocompatible open-surface droplet manipulation
Since the earlier times of MEMS and microfluidic technologies there was
interest in providing applications biomedical analysis. A few microfluidic devices
for detection and sequencing of nucleic acids have been already developed. [241]
The detection part can be carried out simply in a mere microchannel, which
requires not as many pieces of large-scale equipment and simplifies the
experimental procedure. [242] In one hand, such systems have been tested and
reported with advancements in sensitivity, detection limit and specificity in DNA
bio-sensing. [243] On the other hand, microchannel-based systems can be used
exclusively to hybridization, since detection continues to require other peripheral
instruments as for example a PCR device or a fluorescence reading for SNP
identification. In addition, precision on controlling parameters as temperature
(e.g. exact melting temperature of the DNA) which adds on the cost of a more
complex integrated system. Such systems can be designed to identify SNPs,
however they are unable to effectively detect variations with more than one
consecutive nucleotide. Elghanian et al. reported a colorimetric method for
detecting polynucleotides dependent on the optical properties of AuNP [244]
however, the precise control of the experimental temperature and the sensitive
manual handling was proven to require further improvement. The improvement
of a new platform for multinucleotide polymorphism detection, requiring less
manual handling, no thermal control and with straightforward detection results
readout detection was the next objective to achieve. Therefore a new open-
surface droplet manipulation microfluidic platform was designed, integrating a
module for pneumatic droplet control and a superhydrophobic surface to detect
multinucleotide polymorphisms. This was reported by Huang et al. in 2014 while
adopting a novel colorimetric approach based on the growth of AuNP probes
mediated by DNA hybridization in order to detect DNA present in a sample. [245]
The driving energy in this case was pneumatic suction and the multinucleotide
polymorphism could be detected directly with the naked eye. The proposed

57
platform was used for and found suitable for biological and chemical
applications. (Figure 23)
Figure 23 Illustrated principle of the platform proposed by Huang et al. 2014 [246]. (a) Loading of the droplet containing target DNA and the probe-modified
AuNP; (b) mixing and hybridization step; (c) further mixing and growth steps (d)
shift in the absorption peak which can be detected with the naked eye.
Reproduced with permission of Royal Society of Chemistry.
Digital microfluidics for sequencing
The successful use of electrowetting-based digital microfluidics in DNA
sequencing was demonstrated by Boles et al. 2011 [247] with pyrosequencing
chemistry. (Figure 24). The earlier success of using digital microfluidic
pyrosequencing to picoliter scale was demonstrated by Welch et al. [248] The
premise was that scaling down the amounts and volumes in the processes
would enable not only higher density of reactions, but also faster operation
rates, and simpler fabrication involving lower costs per device.
Most next-generation sequencing technologies available reach high
levels of throughput with the parallelization of large number of solid-phase
reactions within one transport or solution compartments. This results in a
plateau of the cost and time generated by these systems after a few hundred bp
of sequence. Barcoding strategies do in fact reduce the sequencing costs per
sample, however, the initial cost considering the required sample preparation
and library construction is substantial. The use of droplets as single and distinct
transport units for small amounts of reagents in a precised control manner gives
great flexibility to modulate the throughput, cost, or run time according to the
requirements of a specific application. Some clinical applications require just a

58
small sequence, however ideally at a low cost per run and with a rapid
turnaround time. Borman et al. [249] showed that sequencing 35 base pairs
located within the ITS2 region was enough for the correct identification of more
than 40 different pathogenic yeasts. Implementing pyrosequencing as described
above has advantages considering instrument size, complexity, cost,
disposable cost, and obtainable degrees of functional integration. The fluid
control was obtained with electrical switches and the instrument was built quite
compact and inexpensive for portability potential. The disposable cartridge
consisted of a PCB top. With this device, the flexible potential of digital
microfluidics opened possibilities of combining DNA sequencing with upstream
processes such as PCR, sample preparation, or cell-based manipulations within
an integrated device.
Figure 24. (A) Photograph of the multiwell-plate-sized PCB cartridge, (B)
photograph of the full device and (C) illustration of the cartridge with the
mapping and highlighting of different regions and spots. [247] Reproduced with
the permission from American Chemistry Society.
Miniaturization research and development, together with system
integration, is strongly directed by the quest of further costs reduction
while reducing consumables, increasing throughput and promoting
further automation.

59
Chapter 4
Motivation
4.1 DNA, genome and microfluidics
Deoxyribonucleic acid or DNA is a double-stranded molecule inside the
nucleus of a cell and carries the genetic instructions for making living
organisms. The information is carried in the form of a genetic code and is
determined by the sequence of the four bases: adenine (A), thymine (T),
guanine (G), and cytosine (C). The structure of DNA was first described by
James Watson and Francis Crick in 1953 [250] for which they were awarded the
Nobel Prize. In April 2003, 50 years later, one of the most important scientific
achievements in history was announced - the sequence of the human’s 3.2-
gigabase genome [251]. This accomplishment was the work of thousands of
scientists from around the world in the public Human Genome Project [251] and
the private Celera genome project [252]. Although it took about 20 years from
conception to completion, the sequence of the genome itself was produced over
a relatively short period with coverage rising from about 10% to more than 90%
over roughly fifteen months [251]. Crucial factors in achieving the exponential
efficiency of sequence throughput were the automation in the form of
commercial sequencing machines, the process miniaturization, and the
optimization of biochemistry and algorithms for sequence assembly [25] (Figure
25).
With the completion of the draft of the human genome, the challenge now
is to understand how the genes interact with proteins, drugs, metabolites, and
other molecules in the cell to control its functions. Identifying genetic variations
between individuals will increase our understanding of genetically related
diseases and disorders and lead to molecular-level treatment specific to each
individual. Consequently, a great deal of effort is being put into the development
of robust, cost-effective, and high-throughput technologies for genetic-variation
analysis. At the same time, in the past decade, there has been a growing trend
towards downscaling molecular and cellular assays into a microfluidic format to
60
improve assay performance for enhanced throughput, reduced material
consumption, and functional integration (Figure 26 and Figure 27). Thus, the
work described in this thesis focused on developing methods for genetic
variation analysis primarily by system miniaturization based on microfluidic
technologies towards low-cost and accessibility. To put this work in context, the
most common types of genetic variation are described briefly, and the current
technologies involved in genetic-variation analysis are reviewed. An overview of
current miniaturized formats for high throughput analysis is presented. Finally,
my work in this thesis

61
Figure 25: A Timeline of
a few advances resulting
in genome-scale
engineering. Everything
started in 1953 with
Watson and Crick and
the discovery of the DNA
double helix structure. In
1977, Frederick Sanger
developed one of the
first DNA sequencing
methods and since then
the technology has
advanced rapidly,
becoming extremely popular and developing. Afterwards, in 1990 a 13 year-long internationally funded effort was created to decode
the entire human genome. Next generation sequencing technology started to be developed, and the technology advanced and still
advances at a rapid pace. The most recent methods are take nanotechnology to create further faster and more effective readings

62
Figure 26: A flow diagram marking key developments in the microfluidic field from fabrication approaches and functional developments to
a few applications. [1] In the 1960s, technologies using microfluidics were improving both bioanalytical speed and resolution for a few
analytical tools. [2-4] Starting in the 90s, major improvement in fabrication enabled researchers to quite using pulled glass capillaries and
start using micro-fabricated glass or polymer microchannels. [5-7] Functionalization of portions of increasingly complex microfluidic
devices is achieved [8-9]. The increasing availability of fluidic components and number of experts in different areas of the microfluidics
field have opened possibilities of new biological applications including new single cell measurements[10-12], high-throughput monoclonal
antibody screening[13], analysis of dynamic phenomena[12, 14-15] and organ-on-a-chip platforms[16].

63
Figure 27: Microfluidics for point of need testing – roadmap. (Source: Saphire
Applications and Market 2016: LED and Consumer Electronics report,
September 2016, Yole Développement)

64
4.2 Objectives
Summarizing the overall motivation given in the previous chapter, the objectives of this thesis are:
1. To study the potential of droplets as virtual reaction chambers for nucleic acids handling.
2. To investigate virtual reaction chambers as a platform for DNA sequencing.
3. To devise and test the platform for single nucleotide polymorphism analysis.
4. Provide scope and perspective for the research trajectory towards more efficient and stable low cost and simple sequencing platforms.

65
Chapter 5
OSM and Virtual Reaction Chambers
The general aim of the research presented in this thesis is to develop a
miniaturized platform for sequencing nucleic acids and detecting single-base
variations. The study involves the design, microfabrication and application of a
microfluidic platform: a microfluidic approach based on surface droplets (refer to
subchapter 1.3.1) and magnetic actuation (refer to subchapter 1.3.2) is
evaluated to handle nucleic acids, more particularly DNA. The feasibility of
adapting pyrosequencing to a microfluidic platform was also investigated and a
novel approach involving on-chip bead-based DNA analysis was developed for
DNA sequencing and SNP detection.
The choice of platform for the research described in this thesis, besides all
the arguments given already, is also connected with the research line of my
supervisor and colleagues. During the course of my stay in KIST-europe,
University of Saarland, under the guidance of Andreas Manz and supervision of
Pavel Neuzil, our group pushed the boundaries on the use of surface droplets
as reaction units (Virtual Reaction Chambers, VRC).
The stability of these VRCs was tested and reported in several ways by
colleagues, mentioned and cited below to contextualize the research carried out
for this dissertation.
5.1 Microfluidic superheating for peptide analysis
Microfluidic devices provide optimal conditions for superheating and sample
handling without requiring manual labor, being three factors associated with
these conditions the absence of: (i) nucleation sites, (ii) temperature gradients,
and (iii) mechanical disturbances. An application for this microfluidic
superheating was the energy-based fragmentation of polypeptides which
drastically shorten analysis times and simplify sequence identification and
conformation. This was achieved reported by Altmeyer et al. using the VRCs as

66
the suitable vessel to perform successfully thermal peptide cleavage through
superheating. [253]
Figure 28. Two superheating devices: (A) photograph of two VRCs on a glass
slide on top a silicon heater. (B) Drawing of the VRC. (C) Fused-silica capillary
placed in a brass heater. (D) Drawing of the capillary system. [253] Reproduced
with the permission of American Society of Chemistry.
5.2 Superheating for protein thermal stability analyses
A similar approach was applied for a few different proteins, as GFP, BSA
and Taq polymerase for protein stability analysis and reported by Ahrberg et al.
It was demonstrated that thermostable proteins can be easily analyzed using
the capability of VRCs to superheat water to temperatures over 100 degrees
Celsius. While in other methods as scanning calorimetry extensive pressurized
set-ups are require to measure above 100 degrees, the experimental set-up
required for this work is simpler and measurements could be performed within 3
to 5 min. Furthermore, sample consumption is still lower using VRCs with
sample volumes between 100 to 300 nL than for other fluorescence methods
performed with commercial machines. [254]
Figure 29. Photograph of the heating chip with two VRCs on top. It is possible
to perform the parallel heating of up to four samples. [254]. Reproduced with
permission from Royal Society of Chemistry.

67
5.3 qPCR with VRCs for different applications.
Many publications, being the first ones from 2006 with a first
collaboration between Pavel Neuzil and Juergen Pipper, were achieved by
developing platforms for the use of VRCs for PCR and sample preparation [214-
215, 255-258].
The latest progress comprehends application of qPCR in the smallest
instrument up to date[259], improvement of the throughput[260] and for Ebola
detection[261] (Figure 30).
Figure 30. (1) Photo of the handheld real-time PCR device [262] (2)
Representation of the data resulting from the Real-Time PCR [260] (3) Photo of
the device for Ebola detection. [261] Reproduced with permission from both
Springer Nature and Royal Society of Chemistry.
5.4 My published research
- Fast spore breaking by superheating[263]
- Pyrosequencing on a glass surface[264]
5.5 Wrap up
Quoting Neuzil:
“Stationary systems are simple, therefore more trustworthy than dynamic
ones. In addition, complex systems have a much higher chance of failure than
simple ones.”
Therefore, “simplicity” is the keyword behind the goals of this thesis.

68

69
Chapter 6
Materials and Methods
The overall objective of the research presented in this thesis is to
develop an accessible miniaturized technology for sequencing nucleic acids and
detecting single-base variations. The study involves the design and
microfabrication of a microfluidic platform with attention being given to the
biological compatibility of the process and the evaluation of the biological
assays. A microfluidic approach based on surface droplets (refer to subchapter
1.3.1) and magnetic actuation (refer to subchapter 1.3.2) is evaluated to handle
nucleic acids. The feasibility of adapting pyrosequencing to a microfluidic
platform was also investigated and a novel approach involving on-chip bead-
based DNA analysis is was developed for DNA sequencing and SNP detection.
In this chapter more details on the materials and experimental design
approached are described.
6.1 Glass substrate
Recently, maneuvering droplets on an open surface offers an alternate way
of performing bioassays at the micro level [210, 265-267]. Here, sample droplets are
confined by surface tension and function as reaction or transport units (virtual
chambers). In order to actuate these droplets, magnetic force[214-215, 228, 233, 238-
239, 268] has been employed to enable a wide range of droplet operations
including dispensing, moving, splitting and mixing[233, 269-270].
These virtual reaction chambers are prepared on a flat substrate. For this
flat substrate it was decided that the material should be easily accessed (for
potential in point-of-care applications it must be disposable and easily replaced)
and not rise issues with surface modifications. Due to this, and considering
previous platforms using a VRC system [213-215, 228, 253, 256, 271], a microscope
glass cover slip was selected as the flat substrate.

70
The microscope glass cover slip was coated with fluorosilane
(heptadecafluoro-1,1,2,2-tetrahydrodecyl)trimethoxysilane, (tridecafluoro -
1,1,2,2-tetrahydrooctyl)trichlorosilane (FOTS) or 1H, 1H, 2H, 2H-perfluorodecyl-
triethoxysilane (FAS-17), typically by a chemical vapor deposition (CVD)
process at temperature of ≈150°C. This was chosen over
Polytetrafluoroethylene, PTFE (being best known as the commercial brand
Teflon) coating due to materials cost and high similarity of contact angle results
between both coatings.
6.2 Droplets
The water contact angle at the FAS-17 surface was as high as ≈115° and
mineral oil type Sigma M5904 exhibited an angle of ≈65°. These hydrophobic
and oilophobic properties ensured that both liquids did not spread around and
stayed where we dispensed them. The water-based sample was pipetted into
an oil droplet with typically volume 100× smaller than that of the sample.
Surface tension of both liquids with their ratio of 100:1 resulted in self-aligned
system with the water sample covered with a layer of oil. The cross section
through the water-based sample in a VCR-PCR system is shown in Figure 31
where the ratio is 1:3 (sample:oil). On Figure 32 we can see the higher contact
angle with the ratio 100:1
Figure 31: VCR used for a miniaturized PCR device (Neuzil et al, 2006): 2
droplets, one sample droplet (PCR sample) within a mineral oil droplet on an
hydrophobically coated glass surface.
The stability of VRCs was tested in several contexts, having been used
for superheating of spores[263], peptides[253], sample preparation[272] and PCR
[256-259, 273-274] among, possibly, others.

71
Figure 32: Profile photo on the left of a water droplet on an hydrophobically
coated (FAS-17) glass cover slide.exhibiting a contact angle of 104º, and on the
right, of a VRC with ratio of water-sample:oil-layer of 100:1, giving a contact
angle of 94º on the same hydrophobically coated (FAS-17) glass cover slide.
6.3 XYZ stage
Initially, a manual way of magnetically actuating the VRCs was designed. A
xy-translation microscope stage was adapted to a holder, together with a z-
translation platform. A magnet was fixed to this z-translation platform in order to
test the magnetic actuation of the droplets spotted on the glass slide placed in
the center and on top of the xy-translation stage. In order to move the xy-
translation stage, a ratchet-style system was implemented to move the magnet
in increments of 3 mm both on x- and on y-axis. (Figure 33 and Figure 34)
Figure 33: Microscope translation stage on “homemade” setup. The
microscope xy-translation stage is fixed. A precision z-translation platform is
coupled underneath and a magnet is attached to its centre. A glass slide is

72
placed on top and on the centre of the xy-translation stage, having the magnet
placed just beneath.
Figure 34: Manual, incremental steps using ratchet-style system; 3 mm steps
for forward/backward, and left/right motions.
A disc (1/8 in.) neodymium magnet (no. B421, Supermagnetic.de) was
placed 0,6 mm beneath the glass slide, with vertical alignment. This model was
chosen due to the combination of ability of focusing the particles through the
glass slide thickness and availability in the lab.
After the magnetic actuation was concluded and the decision on the magnet
to use was done, there was a need to exchange the manual xyz stage for an
automatic (the movement and positioning of the magnet must be more flexible,
smooth and not done in increments, rather on a continuous movement) (Figure
35).

73
Figure 35: Photograph of the entire set up, where a) corresponds to the
motorized xyz-stage placed in a black box, b) illustrates the PMT placed on top
od the xyz-motorized stage for detection, c) the software to program the xyz-
motorized stage, d) the pre-amplifier for the secondary photodiode that works
as control to the PMT (placed underneath the glass slide.), and e) the recording
oscilloscope.
6.4 Detection system
Luminescent detection was tested and achieved using a 1x1 cm photodiode
placed underneath the glass slide, on top of the z-translation stage with the
magnet attached to it, and a photon-counting photomultiplier tube (PMT)
module (H7155, Hamamatsu, Japan) placed on top of the glass slide holder.
Both the photodiode and the PMT were connected to a current amplifier, and
the signal was recorded with an oscilloscope. Thus, all reactions were
conducted at the sample location with respect to the PMT. With this setup, both
the magnet and the PMT were stationary while the glass was movable. The
stage with the PMT and magnet was placed in a black box to eliminate ambient
light noise. The PMT was equipped with an internal current-to voltage converter,
with its gain adjusted to 0.7 V using a custom made PMT controller setting the
gain value to 105 as interpolated from a graph supplied by the manufacturer.
The PMT output was directly connected to the input of an oscilloscope model
DPO 7054 provided by Tektronix, Inc. (USA) to record optical power as a
function of time (Figure 35).

74
6.5 SPP/ssDNA/primer complex preparation
For pyrosequencing, 100 μL of superparamagnetic particles M280
Dynabeads functionalized with streptavidin from Life Technologies, GmbH
(Germany) was washed three consecutive times and re-suspended in 100 μL of
binding buffer (10 mM Tris buffer pH 7.6, 2 M NaCl, 1 mM EDTA solution and
0.1% Tween 20). All products were acquired from by Sigma-Aldrich, GmbH
(Germany).
DNA has to be extracted from the sample organism/solution, purified,
and amplified by PCR, all prior to pyrosequencing.
An amount of circa 4 μg of biotinylated PCR amplicon suspended in 100
μL of H2O were added to the superparamagnetic particles and incubated at 65
°C for 15 min with intermittent mixing for allowing the DNA binding. The double-
stranded amplicon was denatured by adding the superparamagnetic particles to
denaturation buffer (100 μL of 0.5 M NaOH for 1 min). The superparamagnetic
particles were then washed with NaOH followed by three additional washing
steps in annealing buffer (20 mM Tris acetate, pH 7.6, 5 mM magnesium
acetate) to obtain ssDNA. The superparamagnetic particles were re-suspended
in 100 μL of annealing buffer before adding 5 μL of 10 μM sequencing primer
for hybridization of the primer. The solution was heated to 80°C for 2 min using
a heating block and let cool down to room temperature for the primer to
hybridize. The SPP/ssDNA/primer complex was washed three times in
pyrosequencing wash buffer as described in section 6.6. Afterwards, 15 μg of
single-stranded binding protein (SSB) by Promega, GmbH (Germany) was
added and the mixture incubated at room temperature for 10 min. The
SPP/ssDNA/primer complex was washed with pyrosequencing wash buffer and
re-suspended in 200 μL of this same buffer to achieve a final particle mass
concentration of circa 5 μg μL 1. Considering the manufacturer's given specified
binding capacity for the SPPs, it was estimated that the 5 μL aliquot used in
each sequencing reaction contained between 100 and 500 pmol of template
DNA.

75
6.6 Buffers and solutions preparation
Distinct stock solutions were prepared for performing pyrosequencing:
washing buffer, enzymes, dNTPs, and DNA. Pyrosequencing washing buffer
was prepared by adding 100 mM Tris acetate pH 7.6 with 0.5 mM
ethylenediaminetetraacetic acid (EDTA) pH 8.0, 5 mM magnesium acetate, and
0.01% Tween 20. Enzymatic aliquots were prepared with pyrosequencing
washing buffer by adding 13.5 mU μL 1 ATP sulfurylase by New England
BioLabs Inc. (Germany), 1.5 μg μL 1 luciferase and 1.8 μg μL 1 D-luciferin by
Sigma-Aldrich, GmbH (Germany), 6.9 U μL 1 Klenow (exo-) fragment by
ThermoFisher Scientific, GmbH (Germany), and 0.01% Tween 20, 18 μM stock
solutions of each dNTP by Thermoscientific, GmbH (Germany) were added to
pyrosequencing washing buffer with 15 μM APS by Sigma-Aldrich (Germany), 3
mM dithiothreitol (DTT) by Sigma-Aldrich, GmbH (Germany), 120 ng μL 1 single
stranded binding protein (SSB), and 4.6 U μL 1 Klenow (exo-) fragment.
6.7 Glass spotting
The oil-coated and bead-containing droplets were placed on the
hydrophobic surface of the substrate by precision-pipetting. In our experiments,
the amount of surrounding oil layer, reaction or washing solutions and the
SPPs/ssDNA/primer complex suspension were sequentially added, which
spontaneously formed the droplets. Firstly, the suspended SPP/ssDNA/primer
complex in the aqueous droplet is attracted to the bottom of the droplet by the
magnetic force from the permanent magnet placed below. When the magnet is
moved horizontally and parallel to the glass substrate, the SPPs follow the
magnet until they reach the edge of the aqueous droplet, where they form a
compact cluster. Secondly, the magnetic pulling force acting on the SPP-cluster
is transferred to the water/oil interface and deforms the droplet. Thereafter, and
as explained previously in section 3.3 two distinct operations were achieved:
droplet transport for mixing reagents that need to be separated until the moment
of reaction and SPP extraction for washing steps.

76
With this in mind, a few different designs for spotting of the VRCs were
tested.
6.7.1 X-design
Similarly to the pattern used before in a PCR platform (Figure 36) the
initial idea for an experiment would be having 4 droplets containing all reagents
needed for pyrosequencing and each one of the nucleotides on the chip with
one droplet for washing in the center and make the magnetic particles move
inwards and outwards to fulfil cycles of reaction and washing (Figures 37 and
Figure 38).
Figure 36: Sample preparation and PCR platform using VRC (Pipper et al,
2008).
Figure 37: Droplet-based pyrosequencing. (a) ssDNA bound to magnetic
particles is pulled into the first nucleotide droplet (dATP) where (b) dATP is
incorporated and light is emitted. The particles are then (c) washed, and (d)
dragged into the dTTP droplet, where (e) no light is produced, hence dTTP is

77
not incorporated. The procedure continues to the remaining droplets completing
one cycle. The cycle is repeated until no more light is detected (end of
sequencing or depletion of reagents).
Figure 38: Photograph of the setup, showing the central wash droplet and the
four nucleotide droplets around it a) side view, b) top view. The magnet can be
seen underneath the glass slide. The glass slide was moved via a motorized
translation stage, while the magnet was fixed in position. A PMT was used for
detection and all reactions took place inside a black box. The particles can be
seen as a brown pallet on top of the glass actuated by the magnet beneath it.
6.7.2 Circle/linear design
If contamination would be evident than a washing step before each
reaction droplet could be added (Figure 39).
Figure 39: Droplet-based pyrosequencing. ssDNA bound to magnetic particles
is pulled into the first nucleotide droplet (dATP) where dATP is incorporated and
light is emitted. The particles are then washed, and dragged into the dTTP

78
droplet, where no light is produced, hence dTTP is not incorporated. The
procedure continues to the remaining droplets completing one cycle. The cycle
is repeated until no more light is detected (end of sequencing or depletion of
reagents) and the motion happens in a circular movement of the magnet. In
comparison with the previous design (Figure 37) there are more washing
stations present in order to reduce contamination issues.
6.7.3 Enzymes separated from substrate design
For this design, the enzymes needed for pyrosequencing are separated
from the substrates in different droplets. These two smaller droplets (3 and 2 µL
respectively) are merged only when the SPP/ssDNA/primer complex moves and
drags them into the space between them.
Figure 40: (A) Scheme of a nucleotide addition cycle.(a–c) Three phases of the droplet manipulation being a) extraction from SPP from washing droplet and moving to reaction station, b) merging of enzyme and substrate droplets and c) extraction of SPP towards a fresh washing droplet. (B) Overview of the experiment setup; (W) washing droplets; (E) droplets containing all the needed
enzymes for the pyrosequencing reaction (S + G T C A).
6.8 DNA preparation
Preceding the sequencing, DNA has to be extracted from the sample,
purified, and amplified by PCR.
The DNA used for de novo sequencing was prepared by nested PCR for
biotinylation of the amplicon (221 bps long). A section from the pfcrt 271 region
from human genomic DNA was picked. (Primers: external forward: 5’-GGC TAT
GGT ATC CTT TTT CCA A-3’; external reverse: 5’-CGA CTG TGT TTC TTC
CCA AG-3’; internal forward: B-5’-ATC CTT TTT CCA ATT GTT CAC TTC-3’;
and internal reverse: 5’-CGA AAC CAT TTT TTA TAT TTG TCC-3’.)
Sequencing was carried out with the sequencing primer 5’-TTT CCT AAT TAA

79
TTC TTA CG-3’. The amplification was carried out in a LightCycler®1.0 System
(Roche, Switzerland) and a SYBR Green based kit compatible with the system.
The sequence B-5‘-ATG GGG GGG GGG ATG GGG GGG GGA TGG
GGG GGA TGG GGG GGA TTG GGG GGT TGG GGG ATG GGG TCT GGT
ATG GAT GTA AAC GCC TGG TAT CTT TAT AGT CCA-3‘ was assessed with
the sequencing-primer 5‘-GGA CTA TAA AGA TAC CAG GCG TT-3’ using the
concentrations of DNA 0.315 pmol, 1.25 pmol, 5,pmol, 15 pmol and 20 pmol.
The sequence B-5‘-ATG GGG GGG GGG ATG GGG GGG GGA TGG
GGG GGG ATG GGG GGG ATT GGG GGG TTG GGG GAT GGG GTC TGG
TAT GGA TGT AAA CGC CTG GTA TCT TTA TAG TCC A-3‘ was assessed
with the sequencing-primer 5‘-GGA CTA TAA AGA TAC CAG GCG TT-3’.
The resulting PCR product was cleaned with the PureLink® PCR
Purification Kit (ThermoFisher Scientific, Germany) and the biotinylation was
checked with the Agilent Bioanalyzer 2100 (Agilent, Germany) together with the
DNA 12000 Kit following standard protocols.

80

81
Chapter 7
Results and discussion
The aim of this thesis, as has been stated in the preceding chapters, is to
explore miniaturized technologies for sequencing nucleic acids and detecting
single-base variations. The study involves the design and microfabrication of a
microfluidic platform with attention being given to the biological compatibility of
the process and the evaluation of the biological assays. A microfluidic approach
based on virtual chamber reactions (and magnetic actuation is evaluated to
handle nucleic acids. The feasibility of adapting pyrosequencing to a
microfluidic platform was also investigated and a novel approach involving on-
chip bead-based DNA analysis is was developed for DNA sequencing and SNP
detection.
This chapter is meant to report and discuss all relevant results obtained
on the pursuit of the goals above mentioned.
DISCLAIMER: The results presented on this thesis are published in
Open Access format (A. V. Almeida, A. Manz, P. Neuzil, Lab on a Chip
2016, 16, 1063-1071) [264], with the knowledge and permission of co-
authors and publisher, Royal Society of Chemistry.
7.1 Experimental design
The basic experimental idea can be represented by the workflow
presented in Figure 41. The first step (experimental design) comprises the
knowledge of the nucleic acid sequence to be analyzed and arranging all
resources needed.

82
Figure 41: Diagram expressing the workflow from experimental design to
sequencing step. Design stands for experimental design and comprehends all
thought processes leading to have all the correct PCR and sequencing primers,
adjusting of reagents, preparation of the glass slide and programming the
motorized stage. The PCR is used for biotinylation of the DNA and to make the
sequences more manageable and pure. The check involves the PCR product
purification and the confirmation of its purity by Bioanalyzer. The last two stages
correspond to the preparation of the VRCs responsible for washing and reaction
stations and to perform the magnetic actuation of the system.
Then, the DNA to be sequenced must be extracted, prepared and
checked for biotinylation and purity as mentioned in subchapter 6.8 (Figure
42). This ssDNA must then be bound to streptavidin coated paramagnetic
particles via biotin-streptavidin bond. The sequencing primer must as well be
annealed after this point as described in subchapter 6.5 (Figure 43).
Figure 42: On top of the figure, the target-sequence is analyzed according to
the required primers and where the biotinylation should occur (marked by the
red circle). Red nucleotides and underlining show positions of internal and
external primers used in the nested. In a) we can see the result on the qPCR,
beinfg the highest peak correspondent to the desired product (desired
sequenced to test the sequencing on). b) After proceeding to purification of the
product(to remove the enzymes, excess of primers and other byproducts, the
purified and desired sequence in analyzed for biotinylation success using the
Bioanalyzer and the corresponding kit.

83
Figure 43: Biotinylated DNA from is obtained by PCR and then bound to
streptavidine-functionalized superparamagnetic particles. Further washing and
incubating steps are perfomed until an amount of 0.25-0.5 pmol of template per
µL of paticles is achieved. The exact composition of the buffers and procedures
are described in the table.
7.2 First experiments
Finally, the VRCs must be placed on the flat hydrophobically coated
glass substrate in a pre-determined position and the paramagnetic particles can
then be actuated using the xyz-translation stage (Figure 44).
Figure 44: Scheme and photograph of the setup, showing the central wash
droplet and the four nucleotide droplets around it. The magnet can be seen

84
underneath the glass slide. The hydrophobic glass slide is moved via a
motorized translation stage, while the magnet is fixed in position. A PMT is used
for detection and all reactions took place inside a black box. Five droplets are
spotted in a cross pattern onto the cover slip): a large central droplet (60 µL)
containing only washing solution, and four droplets (20 µL) arranged around it
containing one of the nucleotides together with the necessary pyrosequencing
enzymes. The droplets are each sealed in a layer of mineral oil to prevent
evaporation. On the photograph, the paramagnetic particles can be seen in the
washing droplet forming a brown coloured pellet on top of the magnet.
To test the detection system before performing pyrosequencing and
wasting reagents, luciferin and luciferase were mixed with ATP (the needed
substrate for the luciferin to be oxidized by the luciferase with release of
photons, refer to subchapter 1.3.4 for more details). An intense and sharp peak
was easily detected using the prepared set up (Figure 45) meaning the
detection system is sensitive enough for the goal of this project.
Figure 45: Plot derived from the detection system. Mixture of ATP, luciferin and
luciferase produced photons that could be easily be detected by the photodiode
from the set up. The signal was recorded in intensity (mV) over time (seconds).
In order to see if the motion of the motorized stage for magnetic actuation
would interfere with the detection system, a simple program mimicking the
magnetic actuation through the reaction and the washing VRCs was
programmed. As seen in Figure 46, in fact the motion of the stage can be
detected and it follows a pattern (as expected since the program selected
follows the same movement between 5 different droplets for a number of cycles.

85
Figure 46: Background noise detected with a run of the motorized stage performed without reagents. Here; the pattern of the repeated cycles of the same movements combination can be easily observed.
After the background noise derived from the inevitable motorized stage
motion was determined, the first try for pyrosequencing using the cross design
for VRC spotting was performed. Figure 47 shows the same pattern obtained
for the background check. However, a wide, single peak was detected. As the
“peak” occurs, the noise becomes more prominent making it difficult for
extraction of the background or further interpretation. Nevertheless, more time
was given for the particles to be in a droplet (both reaction and washing) in
order to evaluate differences to the initial try and the results can be seen in
Figure 48.
Figure 47: Failed pyrogram showing the motion pattern with a wide peak not
corresponding to the reaction droplets. Almost like a single reaction event. The
motion noise seems to be sharper within this ”peak” which makes difficult for
background noise removal.

86
Figure 48: Failed pyrogram showing the same motion pattern with a wide peak
not corresponding to the reaction droplets. With more time in a specific droplet it
is more obvious the pattern to be related with the stage motion and not from
light detection.
A longer time for reaction was tested as well and is summarized in
Figure 49.
Figure 49: a) GCTA; b) AGTC and c) ATGC are all tries of sequencing using a
longer reaction time. And d) is the corresponding blank.

87
At this stage it was obvious that major changes and improvement was
needed. and main priorities were established:
- Test different VRC spotting patterns.
- Optimizing the ratio between beads – DNA - droplet size – droplet
distance (kinetics evaluation).
- Investigate Z influence on particles dispersion.
- Test washing efficiency.
- Demonstrate the technique feasibility by detecting a known sequence
7.3 VRCs placement
For testing different VRC spotting designs, the 5 droplet system was put
aside and in order to have more flexibility of rearrangement the 2x2cm glass
slide format was substituted by the 2x6 cm format (Figure 50). As well, washing
efficiency was tested to see if there was any carry over/contamination by the
SPP.
Figure 50: a) was the one tested, the b) is the same as the circle design but
this in linear form which gives more possibilities of cycling more often with fresh
washing droplets (refer to circle design on subchapter 4.7.2. c) represents a
design for incorporation two washing droplets between two reaction.
By using single-use VRCs and extending further the time for each
reaction to happen, the first expected peaks started to appear. Two different
testes, being one having all reagents, with all 4 nucleotides and the complex
SPP/ssDNA/primer letting to react until reaching baseline, and the other all
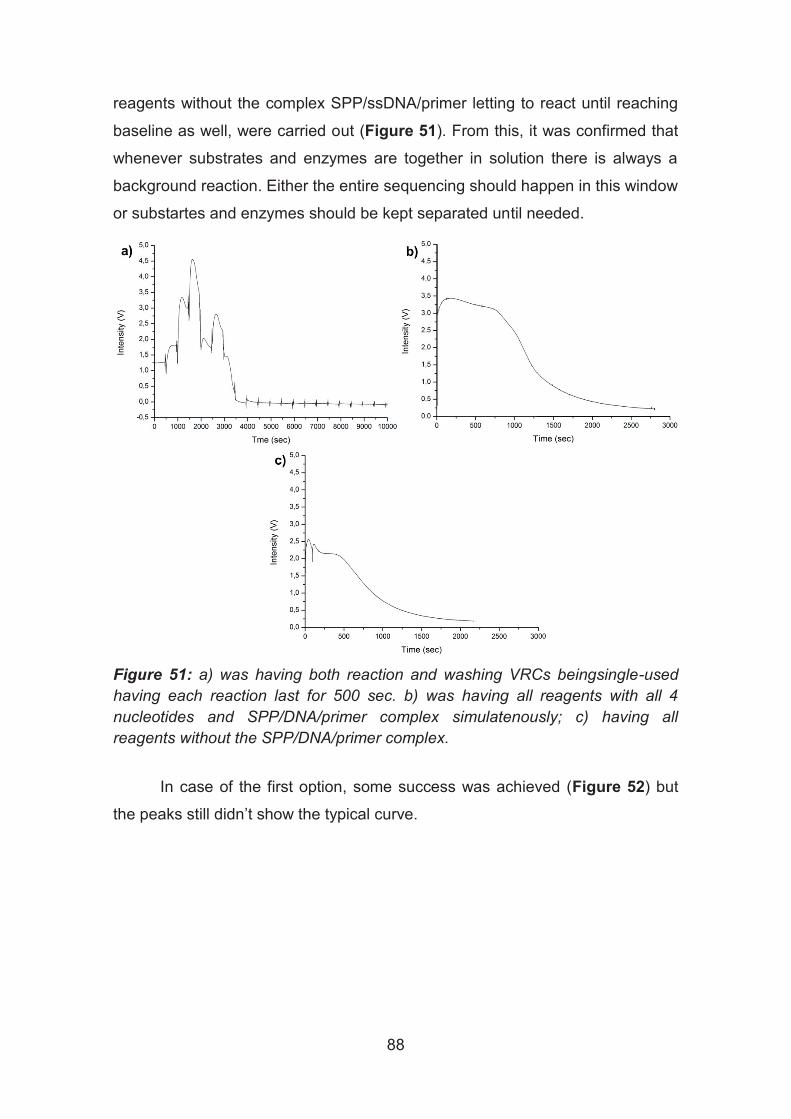
88
reagents without the complex SPP/ssDNA/primer letting to react until reaching
baseline as well, were carried out (Figure 51). From this, it was confirmed that
whenever substrates and enzymes are together in solution there is always a
background reaction. Either the entire sequencing should happen in this window
or substartes and enzymes should be kept separated until needed.
Figure 51: a) was having both reaction and washing VRCs beingsingle-used
having each reaction last for 500 sec. b) was having all reagents with all 4
nucleotides and SPP/DNA/primer complex simulatenously; c) having all
reagents without the SPP/DNA/primer complex.
In case of the first option, some success was achieved (Figure 52) but
the peaks still didn’t show the typical curve.

89
Figure 52: Success 1 with incorporation of better washing…still don’t see
curves and there is still a decrese of signal over time
7.4 Optimization of reagents and buffers
In order to optimize the reaction, an optimization of the content of the
buffers (particularly in regards to oil:sample ratio and Tween in order to improve
the surface tension of the VRCs to allow removing of the SPP complex from the
droplets without and with dragging as wished) was carried out. (Figure 53)
Figure 53: Effect of oil loading on dynamic droplet shape (a) and of Tween
content (b). The white arrows refer to the transport direction. The volume of the
aqueous phase was 5 µL in all cases. A stock suspension (~20 µg/µL) of 0.5
µm diameter SiMAG particles was used for the test.
Due to this, another spotting design was tested where the reaction VRCs
were divided into two VRCs, one containing the substrates and the other one
containing the enzymes, both needed for the pyrosequencing chemistry (Figure
54). With the movement of the complex SPP/ssDNA/primer these two smaller

90
VRCs would merge and the background reaction and reagents depletion
wouldn’t occur before time (Figure 55).
Figure 54: Photograph of the prepared spotted glass. On a) the overall view with the
SPP complex being located on the top left washing droplet. b) the first stage of the
motion. c), d) and e) the SPP complex finds its way via magnetic actuation to the first
enzyme droplet. In f) the enzyme droplet merges with the substrate droplet. g) The
SPP complex will move to the next washing station h). and to merge the next enzyme
and substrate VRCs in i) and j).
Figure 55: Pyrogram showing the order of in which the magnetic particles were pulled
into each nucleotide droplet (lower axis), and the order in which the nucleotides were
successfully incorporated into the DNA chain (upper axis), yielding the final nucleotide
sequence. DNA was sequenced with a read-length of 7 bp which corresponds to first
success.

91
7.5 Washing efficiency
Additionally, an initial series of experiments with the presence and the
absence of a washing step was carried out. Conducting the pyrosequencing
nucleotide additions without the washing step resulted in a 30% carry-over
signal caused by the DNA/primer/SPP complex. Once the washing step was
included, the carry-over signal was eliminated (Figure 56); therefore, each
nucleotide addition reaction was followed with a single washing step. As one
can see from Figure 56, once the washing step was included into the
experiment design, no photons were detected from the sample, which indicates
no significant amount of chemicals were carried over.
Figure 56: Washing efficiency. SPP were moved between two droplets, one
containing inorganic pyrophosphate (PPi), and the other enzymes and
substrates used for pyrosequencing while the luminescence was continuously
monitored by PMT and recorded by an oscilloscope. a) We have merged both,
b) extracted the SSP from one droplet to the next and c) included a washing
step between. Results demonstrated that efficiency of using a washing step
successfully canceled the signal coming from cross-contamination. Peak
amplitude (minus baseline subtraction) dropped from around 4V to around 1.5V
and to practically 0V once the washing step was included.
7.6 Mixing improvement
For each experiment, fresh superhydrophobic glass cover slips were
used to remove possibility of sample-to-sample cross contamination, which is a
benefit of disposable and microfabrication-free platform. The diffusion-

92
dependent rate of the pyrosequencing process was improved upon by moving
the SPPs within the droplet during the reaction for active mixing. The stage
moved by ± 2 mm along both X and Y axes at the speed of 2 mm s 1, which
reduced the reaction time by a factor of almost 2 (Figure 57).
Figure 57 SPP/primer/DNA complex was moved within droplets with enzymes,
substrates and dNTP whilst monitoring with a PMT and recording with an
oscilloscope the resulting luminescence. The resulting luminescence was both
recorded while having the magnet static in position (black squares) and moving
in the reaction droplet with speed of ≈2 mm/s (red circles). This Figure can be
found in the supplementary information of Almeida et al. (2015) [264] and it was
reproduced with permission of Royal Society of Chemistry.
Initially, the signal peak amplitude was 1.00 V and its area was 0.32 mC.
Stimulated by stirring, the peak amplitude increased to 1.99 V and the area
dropped to 0.27 mC. The AUC amplitude dropped to 85% of its original value
while the signal peak amplitude increased by factor of 2. The signal reached the
baseline amplitude at time 275 seconds; thus, we decided that keeping the
reaction under the PMT for 300 seconds should be sufficient. Next, we
performed a set of experiments to determine optimum DNA quantity.
7.7. Effect of DNA concentration
55 μg of SPPs were used in combination with DNA concentrations from
0.3125 pmol to 20 pmol. The DNA concentration of 1.25 pmol seemed to be

93
optimal considering the lowest amount possible to use in order to have a
detectable difference between.
The sequence B-5‘-ATG GGG GGG GGG ATG GGG GGG GGAT GGG
GGG GGA TGG GGG GGA TTG GGG GGT TGG GGG ATG GGG TCT GGT
ATG GAT GTA AAC GCC TGG TAT CTT TAT AGT CCA-3‘ was assessed
using the sequencing-primer 5‘-GGA CTA TAA AGA TAC CAG GCG TT-3’ with
different concentrations of DNA, such as 0.315 pmol (Figure 58), 1.25 pmol
(Figure 59a), 5,pmol (Figure 59b), 15 pmol (Figure 59c) and 20 pmol. (Figure
60).
Figure 58. Effectiveness of using concentration of 0,315 pmol DNA on SPPs for
pyrosequencing on OSM. (A) Pyrogram consisting of 38 reactions performed on
3 glasses with two changes marked by peaks around 15th and 30th reactions.
(B) Extracted peak voltages (mean value) with standard error as function of
reaction number from three measurements to compare with (C) extracted AUC
(mean value) with standard error as function of reaction number from three
measurements. Figure present in Almeida et al (2015) and reproduced with
permission of Royal Society of Chemistry. [264]
By using 0,315 pmol DNA, there was practically no difference between
background reaction noise and the luminescence detected from the
incorporation of 1 nucleotide by DNA molecule which makes it unsuitably low.

94
The same was carried out with the concentrations of 1.25 pmol (Figure
59a), 5 pmol (Figure 59b), 15 pmol (Figure 59c) and 20 pmol (Figure 60).
Figure 59. Effectiveness of using concentrations of 1.25 pmol (a), 5 pmol (b)
and 15 pmol (c) with the peak amplitude (blue) and AUC (red) as function of
number of incorporated nucleotides: a) with slope of (0.969 ± 0.227) V and
(0.147 ± 0.021) mC, both (mean ± standard deviation) for peak voltage and
AUC, respectively; the nonlinearity is significantly smaller than the one for 0.315
pmol concentration of DNA with correlation coefficient of 0.959 and 0.896 for
peak voltage and AUC, respectively; b) with slope of (6.478 ± 0. 242) V and
(0.899 ± 0.025) mC, both (mean ± standard deviation) for peak voltage and
AUC, respectively; the nonlinearity is even smaller than the one for 1.25 pmol
concentration as the correlation coefficient is near unity, 0.997 and 0.998 for
peak voltage and AUC, respectively;. c) with slope of (14.144 ± 0.099) V and
(1.900 ± 0.005) mC, both (mean ± standard deviation) for peak voltage and
AUC, respectively; the nonlinearity is even smaller than the one for 1.25 pmol
concentration as the correlation coefficient is practically unity, 0.999 for
both,peak voltage and the AUC. Adapted from figures published by Almeida et
al. (2015). [264]
The concentrations of 1,25 pmol, 5 pmol and 15 pmol (Figure 59)
resulted in well-distinguished groups for each number of nucleotide
incorporation. Even if the linearity increases with the concentration of DNA, the

95
1,25 pmol concentration results indicated efficient discernment between number
of consecutive incorporations of nucleotides.
When the concentration used was 20 pmol such distinction between the
different numbers of consecutive nucleotide additions was non-existing for
some reactions which makes this concentration unsuitable for the
pyrosequencing purpose (Figure 60).
Figure 60 Effectiveness of using concentration of 20 pmol DNA on SPPs for
pyrosequencing on OSM (A) Pyrogram with 38 reactions carried out on 3
glasses with transitions marked by detected luminescence peaks around
reactions 15 and 30. (B) Peak voltages (mean value) with standard error as
function of reaction number from single measurement. (C) AUCs (mean value)
with standard deviation as function of reaction number from single
measurement. Both (D) frequency count of mean peak values and (E) AUCs do
not distinguish groups by number of incorporated nucleotides as lower

96
concentrations. Additionally, (F) peak amplitude (blue) and AUC (red) as
function of number of incorporated nucleotides confirms that this DNA
concentration is not suitable for pyrosequencing. Reproduced from Almeida et
al. (2015) with permission of Royal Society of Chemistry.[264]
With the 1,25 pmol concentration, the peak voltage and AUC amplitude
were (0.969 ± 0.227) V and (0.147 ± 0.021) mC (mean ± standard deviation)
per single nucleotide incorporation, respectively, with correlation coefficient of
0.959 and 0.896 for peak voltage and AUC, respectively. This peak voltage
signal was 100 times higher than the background noise while requiring
minimum DNA consumption (Figure 61).
Figure 61. Effectiveness of using concentration of 1,25 pmol DNA on SPPs for
pyrosequencing on OSM (A) Pyrogram with 38 reactions carried out on 3

97
glasses with transitions marked by detected luminescence peaks around
reactions 15 and 30. (B) Peak voltages (mean value) with standard error as
function of reaction number from single measurement. (C) AUCs (mean value)
with standard deviation as function of reaction number from single
measurement. Both (D) frequency count of mean peak values and (E) AUCs do
not distinguish groups by number of incorporated nucleotides as lower
concentrations. Additionally, (F) peak amplitude (blue) and AUC (red) as
function of number of incorporated nucleotides confirms that this DNA
concentration is not suitable for pyrosequencing. Reproduced from Almeida et
al. (2015) with permission of Royal Society of Chemistry. [264]
As previously mentioned, each glass cover slip can host up to one-use
16 reaction stations (washing droplets + enzyme and substrate droplets). This
means, sequencing more than 16 nucleotides will require many glass cover
slips and the sample has to be transferred from one glass to the next glass.
These unloading/loading stations were designed not to contain matching
nucleotides, but just to be reference points to determine the background signal
working as additional washing stations. The unloading was performed via
pipetting with a magnet attached to the outside surface of the pippete tip and
the loading by detaching this same magnet. After completion of the
experiments, both the AUC and peak voltage amplitudes were calculated from 5
transfers in unloading and loading stations and compared. The loading PMT
peak and AUC amplitude were (0.79 ± 0.08) V and (0.094 ± 0.005) mC (mean ±
standard deviation), respectively. Unloading PMT and AUC amplitude were
(0.79 ± 0.11) V and (0.098 ± 0.014) mC (mean ± standard deviation),
respectively. The results during loading and unloading are very similar,
demonstrating the transfer efficiency which assures that the SPP/prime/ssDNA
complex can be transferred while keeping the same amplitude of emitted photos
during DNA sequencing.
7.8 Nucleotide incorporation in homopolymeric stretches
The maximum number of homopolymeric nucleotide additions per single
incorporation possible to assess on this platform were also studied (Figure 62).
This was done by using the sequence B-5‘-ATG GGG GGG GGG ATG GGG
GGG GGA TGG GGG GGG ATG GGG GGG ATT GGG GGG TTG GGG GAT

98
GGG GTC TGG TAT GGA TGT AAA CGC CTG GTA TCT TTA TAG TCC A-3‘
in combination with the sequencing-primer 5‘-GGA CTA TAA AGA TAC CAG
GCG TT-3’. This was meant to investigate the limits of the platform by
assessing extreme cases such as 10 identical nucleotides in succession.
Figure 62: (A) Pyrogram showcasing 55 reactions performed on 4 glasses with
three changes marked by high intensity peaks around 17th, 34th and 48th
reactions. (B) Peak voltages (mean value) with standard error as function of
reaction number from two measurements. (C) AUC (value) with standard error
as function of reaction number from two measurements. (D) Frequency count of
mean peak values manifesting grouping by number of incorporated nucleotides
from 0 up to 7 (highlighted by a black arrow). 10 identical incorporated
nucleotides in a row results are highlighted with a red circle. (E) Frequency
count of mean AUC manifesting grouping according to number of incorporated

99
nucleotides from 0 up to 5 showing that the peak values give more consistent
data. (F) Peak amplitude (blue) and AUC (red) as function of number of
incorporated nucleotides. This has proven that the OSM-sequencing can be
used for up to 7 identical serial nucleotides with (1.354 ±0.075) V (mean ±
standard deviation) per incorporated nucleotide. Reproduced from Almeida et
al. (2015) with permission of Royal Society of Chemistry.[264]
The amplitude of emitted light starts was observed to drop after
incorporations of more than seven identical nucleotides in a row. Both peak
voltages and AUCs amplitude were determined with (1.451 ± 0.067) V and
(0.175 ± 0.020) mC (mean ± standard deviation), respectively, per single
nucleotide incorporation. Peak voltage amplitude showed more consistent data
than the AUC amplitude. The signal level after each wash cycle could be
reduced in the reaction complex due to loss or denaturation of either the DNA
template or the sequencing primer.
7.9 Resequencing
The platform and experimental design were tested with DNA
concentration of 1.25 pmol with a re-sequencing experiment (Figure 63). A
hydrophobic glass cover slip was prepared with the dNTPs placed in pre-
determined order, corresponding to the complementary DNA strand, a 34-mer.
The sequence consisted of 21 single, 3 double, 1 triple, and 1 quadruple
nucleotide incorporations, and 4 mismatches. We had to use two glass cover
slips with one sample transfer from the first glass to the second glass. This
system enabled monitoring the emitted photons of the known nucleotide
incorporations and to determine the reaction stability as well as reproducibility
as displayed in Figure 63A. The DNA/primer/SPP complex was moved into a
washing droplet in the end of the experiment. The resequencing was performed
five times to eliminate random errors and to demonstrate repeatability (error
bars in Figure 63B). A mismatched event was performed during the sample
loading and unloading to determine the background emission as highlighted by
the blue ellipses (Figure 63C). It was shown that both peak voltages and AUCs
amplitude can be utilized for determination of the number of incorporated
nucleotides (Figure 63D and E, each containing five groups separated from

100
others). The PMT peak voltage and AUC amplitude are linearly proportional to
the number of incorporated nucleotides which demonstrates feasibility of the
method as well as little or no loss of SPP, DNA, or primer (Figure 63F). The
background peak voltage value and AUC amplitudes were only (0.799 ± 0.079)
AUC and (0.010 ± 0.012) mC (mean ± standard deviation), respectively, well
below the signal for single nucleotide incorporation. The order of reaction
stations for resequencing is designed to match the sequence and incorporate
nucleotides) in each reaction. Presence of a single nucleotide polymorphism
(SNP) is detected as a missing reaction and there will be no nucleotide
incorporation once the SNP occurs. The first and last reactions at each glass
surface are performed with mismatched nucleotides during sample transfer to
detect a background signal and calibrate the system. Once there is a nucleotide
mismatch detected during resequencing, the signal will be either stronger than
expected (in the case of incorporation of an identical nucleotide), or as intense
as the background signal with no incorporation. In the latter case, the
pyrosequencing would stop at this point but the user would know that there is at
least one SNP in the tested sequence.

101
Figure 63 (A) Pyrogram from the resequencing. (B) Mean value of peak voltage
and its standard error as function of reaction number. A mismatched event was
performed in the end of the run to determine the background emission (marked
by blue ellipses). (C) Mean value of AUC and its standard error as the function
of the reaction. Frequency counts of average peak values (D) and AUCs (E)
distinguish five groups according to the number of incorporated nucleotides with
a nearly perfect linear relationship. (F) Peak amplitude (blue circles) and AUC
(red triangles) as a function of the number of incorporated nucleotides with
slope of (1.657 ± 0.140) V and (0.214 ± 0.026) mC for peak voltage and AUC,
respectively. The nonlinearity is small as the correlation coefficients are 0.972
and 0.944 for peak voltage and AUC, respectively. Reproduced from Almeida et
al. (2015) with permission of Royal Society of Chemistry.[264]

102
7.10 de novo sequencing
Proving the feasibility of OSM-sequencing method with unknown
samples was carried out by performing de novo sequencing with a DNA
template with the length of 51 bps. The sequence consisted of 16 single, 9
double, 2 triple, 1 quadruple, and 1 quintuple nucleotide incorporations, and 30
mismatches. We performed the experiment with four nucleotides added in a
repeated cyclical fashion comprehending in total 70 reaction stations. The
experimental apparatus involved five glass cover slips (Figure 64A) and times
to avoid random errors. The detected emitted light was processed the same
way as in the previous experiments (Figure 64B and C). In addition, histograms
of both voltage and AUC values (Figure 64D) show better grouping for the peak
voltage amplitude than that for AUCs (Figure 64E). The peak voltage
amplitudes in each group (number of identical nucleotides incorporated in a
row) are distinct from one another, which should enable an accurate sequence
assessment of all 51 bases (Figure 64F). The value of peak voltage and AUC
amplitude are (1.605 ± 0.068) V and (0.213 ± 0.021) mC (mean ± standard
deviation), respectively. Again, the peak voltage signal shows better stability
than the AUC as highlighted by the blue ellipse at Figure 64F, where the signal
for the four identical incorporated nucleotides is practically identical to the one
for three identical incorporated nucleotides which means the peak signal
amplitude provides more consistent output than the one for AUC.

103
Figure 64 (A) Pyrogram of de novo sequencing. (B) Mean value of peak voltage
and its standard error as function of reaction number. A mismatched event was
performed in the end of the run to determine the background emission (marked
by blue ellipses). (C) Mean value of AUC and its standard error as function of
reaction. Frequency counts of mean peak values (D) distinguish five groups
according to the number of incorporated nucleotides and are better defined as
AUC values (E) as seen with the blue ellipse marked in (F). (F) Peak amplitude
(blue) is linearly proportional to the number of incorporated nucleotides with
correlation coefficient of 0.991 and AUC (red) with the same coefficient of
0.953. Reproduced from Almeida et al. (2015) with permission of Royal Society
of Chemistry. [264]

104
7.11 Longer sequences testing
Furthermore, a sequence with length of 81 nucleotides was carried out
with a total of 104 reactions using de novo sequencing configuration. The
sequence consisted of 35 single, 8 double, 4 triple, 2 quadruple, and 2 quintuple
nucleotide incorporations, and 53 mismatches. The experiment required seven
glass cover slips (Figure 65A). Peak voltage and AUC amplitudes were (1.495
± 0.117) V and (0.182 ± 0.027) mC (mean ± standard deviation), respectively
(Figure 65B and C). The signal per incorporated nucleotide is again well above
the background of (0.794 ± 0.117) V and (0.102 ± 0.021) mC (mean ± standard
deviation) for peak voltage and AUC amplitudes, respectively (Figure 65D). The
OSM-sequencing since was able of 81 nucleotides incorporation and, as the
PMT signal is has consistent amplitude per nucleotide incorporation, a greater
number of nucleotide may be incorporated. The peak amplitude is linearly
proportional to the number of incorporated nucleotides with correlation
coefficient of 0.944. The same coefficient for AUC is 0.927. As seen before,
peak voltage gives more consistent data than AUC (Figure 65E and F).
Overall, it was seen that the peak voltage amplitude gave better data
than AUC. The peak voltage amplitude per nucleotide incorporation varied
between (1.354 ± 0.075) V, (1.657 ± 0.140) V, (1.605 ± 0.068) V and (1.339 ±
0.145) V (mean ± standard deviation) homopolymeric stretches (Figure 61), re-
sequencing (Figure 62), de novo sequencing of 51 (Figure 63), and 81
nucleotides (Figure 64), respectively. The differences are probably caused by
variations in concentration of chemicals due to manual pipetting as well as
temperature and humidity conditions fluctuation since most experiments were
performed on different days.

105
Figure 65 (A) A pyrogram of long de novo sequencing with 104 reactions. (B)
Extracted value of peak voltage as function of reaction number. (C) Extracted
mean value of AUC as function of reaction number. Frequency counts of mean
peak values (D) distinguish six groups according to the number of incorporated
nucleotides. (E) Frequency counts of the AUC are not distinct (arrows). (F)
Peak amplitude (blue) and AUC (red) as function of number of incorporated
nucleotides. Reproduced from Almeida et al. (2015) with permission of Royal
Society of Chemistry.[264]
7.12 Comments on methods
Prior to pyrosequencing, DNA has to be extracted from the sample,
purified, and amplified by PCR. Most of these steps are either labor-intensive or
require complex robotic systems. Except for pyrosequencing, all other
necessary steps have been previously integrated using the OSM concept.[214-
215] The system proposed here is compatible with previous work, thus, it may be

106
included on into a single “sample-to-answer” platform. The pyrosequencing
experiments were conducted on a glass cover slip as shown schematically in
Figure 66. The ssDNA bound to SPP was placed into a first station as shown in
(a), with a magnet underneath it. The particles are then dragged (b) using
magnetic force into the first (E) enzyme-containing droplet. This droplet is close
to the (S + Nt) substrate and nucleotide dNTP-containing droplet, that the
droplets merge and the pyrosequencing reaction is triggered. The particles are
then dragged into the washing droplet. This washing droplet is at a larger
distance from the other droplets, so no merging of droplets occurs. The washing
steps remove unincorporated or in excess nucleotides were designed which
maximizes read length. The washing of SPP/template/primer complex allows
removal of nucleotides as well as other reaction byproducts between nucleotide
additions. Then, the particles are dragged into another reaction station (c) with
two droplets, one with enzyme and the other one with substrate and another
dNTP. A glass containing eight reaction stations is schematically shown in
Figure 66B and a photograph of the setup with 16 stations in Figure 66C as
well as a transfer droplet containing DNA/primer/SPP. The droplets were
colored with ink to increase the contrast. The glass with the dimension of 60×20
mm and thickness of 170 μm was treated with 1H,1H,2H,2H-
perfluorodecyltriethoxysilane (FAS17), making the surface highly hydrophobic,
with a water contact angle of 95°. The glass cover slip was placed on a
computer controlled X–Y stage. A disc-shaped neodymium magnet with a
diameter of 3 mm, model N45 mm by Supermagnetic, GmbH (Germany) was
placed underneath the glass cover slip as previously described in Chapter 6.

107
Figure 66 (A) Representation of a typical nucleotide addition cycle. All droplets
are covered with oil, thereby effectively preventing evaporation of water from
the sample as well as reagent degradation by oxidation. (a–c) Three phases of
pyrosequencing reaction. (B) Components of the experimental setup; (W)
washing droplets; (E) droplets containing all the needed enzymes for the
pyrosequencing reaction (S + dN). (C) Photograph of the setup consisting of the
hydrophobically coated glass cover slip mounted onto a motorized X–Y
translation stage with a neodymium–iron–boron magnet fixed beneath the cover
slip. The droplets contained color ink to increase the contrast. Reproduced from
Almeida et al. (2015) with permission of Royal Society of Chemistry.[264]
The DNA/primer/SPP complex was on moved through the individual
reaction/washing stations in the form of droplets using magnetic force. These
“stations” were formed by pipetting individual droplets onto the glass covered
with mineral oil, thereby preventing water evaporation from reaction droplets.
After a series of experiments, the volumes of stations as well as oil covering
them are summarized in Table 3.

108
Table 3. Ratio between oil and sample volumes stable up to 8 hours (initial and
final volumes measured at 0, 2, 4, 6 and 8h)
Washing droplet Enzyme droplet Substrate and
nucleotide droplet
Droplet volume
(µL) ≈10 ≈3 ≈2
Oil volume (µL) ≈2 ≈1 ≈1
A PMT was placed above the glass aligned with the magnet underneath.
Since the sample was always attracted by the magnet and kept on the glass
above it, it was also directly below the PMT; thus, all reactions were conducted
at the sample location relatively to the PMT. With this setup, both the magnet
and the PMT were stationary while the glass was the moving component. The
stage with the PMT and magnet was placed in a black box to eliminate ambient
light noise. All light emission was recorded and peaks were identified and
individually processed to obtain the values of maximum amplitude as well as
their areas under the curve (AUC). The AUC unit corresponds to the electrical
charge C, as it is time integration of electrical current i from 0 s to t s:
!"# $ const % &d'
!,
where const is a conversion factor. It consists of a gain of PMT and its
transconductance amplifier and PMT efficiency of 105, 1 μA V 1, and 85 mA W
1, respectively for light wavelength of 550 nm.

109
Chapter 8
Conclusions and outlook
Referring to the objectives of this thesis defined on subchapter 4.2.
5. To study the potential of droplets as virtual reaction chambers for nucleic
acids handling.
a) The potential of droplets as virtual reaction chambers for nucleic acids
handling was investigated and confirmed. For this, the droplets were
covered with mineral oil, thereby forming virtual reaction chambers. An
oil layer was able to efficiently suppress water evaporation from the
sample up to 8 hours of deposition on the glass substrate. (Table 3)
b) Magnetic actuation was successful with DNA loaded superparamagnetic
particles, meaning the DNA molecules could be manipulated within and
between the virtual reaction chambers without significant degradation.
Optical detection was used to make sure the particles aren’t being left
behind or trapped by adjusting the speed and the trajectory of the
magnet. (Figure 55)
c) Was possible to move the particles within fixed droplets and to move the
particles with the droplets making possible to merge droplets. (Figure
56)
6. To investigate virtual reaction chambers as a platform for pyrosequencing
chemistry.
a) The usage of only one washing station was considered sufficient and the
active mixing by moving the particles in a VRC increased the speed of
reaction in comparison with just diffusion based mixing. (Figures 58 and
59)

110
7. To investigate the VRC based pyrosequencing platform for DNA
sequencing.
a) DNA sequencing was achieved using pyrosequencing chemistry. The
pyrosequencing was performed by having reagents separated in different
virtual reaction chambers and moving DNA molecules bound to
superparamagnetic particles from droplet to droplet (washing and
nucleotide addition) or dragging the droplets for droplet merging
(enzymes and substrates real-time mixing). This platform successful
determined up to 81 nucleotides long DNA sequences (Figure 68)
(minimal degradation meaning with discernment of homolorymeric
sections).
b) The effect of DNA concentration bound to articles was tested and the 1.25
pmol of DNA was revealed as the ideal one for DNA loading on the SPP
(Figure 61).
c) Base calling in the homopolymeric stretches was studied (u to 6 identical
subsequent units) (Figure 65)
8. To devise and test the platform for single nucleotide polymorphism analysis
which was successful
a) Single nucleotide polymorphisms were detected within the 55 nucleotide
lenght from point 2. (Figure 66)
9. Provide scope and perspective for the research trajectory towards more
efficient and stable low cost and simple sequencing platforms.
We have demonstrated a simple pyrosequencing system for both de novo
(DNA sequencing) and re-sequencing (suitable for SNP detection) using open
surface microfluidics with magnetic force actuation on a microscope glass cover
slip surface without any surface patterning. Future improvements include an

111
automated pipetting station followed by a lyophilization step also would make
this method more user friendly as operators would only require to dispense an
appropriate amount of de-ionized water at pre-defined reaction and washing
locations and cover those droplets with mineral oil. The system presented here
is compatible with previously designed PCR as well as sample preparation
systems. In future, one could create a single complex sample-to-answer system
starting with a raw sample, DNA release, its purification, PCR, and
pyrosequencing.

112

113
Chapter 9
References
[1] E. Bianconi, A. Piovesan, F. Facchin, A. Beraudi, R. Casadei, F. Frabetti, L. Vitale, M. C. Pelleri, S. Tassani, F. Piva, S. Perez-Amodio, P. Strippoli, S. Canaider, Annals of human biology 2013, 40, 463-471.
[2] C. Human Genome Sequencing, Nature 2004, 431, 931-945.
[3] J. D. Watson, F. H. C. Crick, Nature 1953, 171, 737-738.
[4] A. J. Bruce Alberts, Julian Lewis, Martin Raff, Keith Roberts, Peter Walter, Molecular Biology of the Cell, 4th edition ed., Garland Science, New York, 2002.
[5] C. M. G. Reginald H. Garrett, Biochemistry, 4th ed ed., Brooks/Cole, Cengage Learning, Belmont, California, 2007.
[6] M. E. W. Saenger, Principles of Nucleic Acid Structure, 1 ed., Springer-Verlag New York, 1984.
[7] J. D. Watson, Molecular biology of the gene. Watson, Watson, Benjamin-Cummings Publishing Company, Boston, 2014.
[8] E. B. Wilson, 1925.
[9] S. Sharma, S. Javadekar, M. Pandey, M. Srivastava, R. Kumari, S. Raghavan, Cell death & disease 2015, 6, e1697.
[10] J. Chen, B. F. Miller, A. V. Furano, Elife 2014, 3, e02001.
[11] K. Rodgers, M. McVey, Journal of cellular physiology 2016, 231, 15-24.
[12] J. S. Bertram, Molecular aspects of medicine 2000, 21, 167-223.
[13] Y. T. Aminetzach, J. M. Macpherson, D. A. Petrov, Science 2005, 309, 764-767.
[14] V. Burrus, M. K. Waldor, Research in microbiology 2004, 155, 376-386.
[15] M. Long, E. Betrán, K. Thornton, W. Wang, Nature Reviews Genetics 2003, 4, 865-875.
[16] P. Hastings, J. R. Lupski, S. M. Rosenberg, G. Ira, Nature Reviews Genetics 2009, 10, 551-564.
[17] C. Bernstein, A. R. Prasad, V. Nfonsam, H. Bernstein, New Research Directions in DNA Repair. InTech. doi 2013, 10, 53919.
[18] A. M. Goh, C. R. Coffill, D. P. Lane, The Journal of pathology 2011, 223, 116-126.
[19] H. L. Rehm, J. S. Berg, L. D. Brooks, C. D. Bustamante, J. P. Evans, M. J. Landrum, D. H. Ledbetter, D. R. Maglott, C. L. Martin, R. L. Nussbaum, New England Journal of Medicine 2015, 372, 2235-2242.

114
[20] S. G. V. Ivan Y Iourov, Yuri B Yurov, eLS 2012.
[21] R. Cotton, Mutation Research/Fundamental and Molecular Mechanisms of Mutagenesis 1993, 285, 125-144.
[22] R. B. Gasser, International Journal for Parasitology 1997, 27, 1449-1463.
[23] A.-C. Syvänen, Nature Reviews Genetics 2001, 2, 930-942.
[24] L. Wang, R. Luhm, M. Lei, in Microarray Technology and Cancer Gene Profiling, Springer, 2007, pp. 105-116.
[25] J. Shendure, R. D. Mitra, C. Varma, G. M. Church, Nature Reviews Genetics 2004, 5, 335-344.
[26] L. T. Franca, E. Carrilho, T. B. Kist, Quarterly reviews of biophysics 2002, 35, 169-200.
[27] W. J. Ansorge, New biotechnology 2009, 25, 195-203.
[28] L. Kruglyak, D. A. Nickerson, Nature genetics 2001, 27, 234-235.
[29] P. L. Ross, K. Lee, P. Belgrader, Analytical chemistry 1997, 69, 4197-4202.
[30] D. G. Wang, J.-B. Fan, C.-J. Siao, A. Berno, P. Young, R. Sapolsky, G. Ghandour, N. Perkins, E. Winchester, J. Spencer, L. Kruglyak, L. Stein, L. Hsie, T. Topaloglou, E. Hubbell, E. Robinson, M. Mittmann, M. S. Morris, N. Shen, D. Kilburn, J. Rioux, C. Nusbaum, S. Rozen, T. J. Hudson, R. Lipshutz, M. Chee, E. S. Lander, Science 1998, 280, 1077-1082.
[31] H. Klenow, I. Henningsen, Proceedings of the National Academy of Sciences of the United States of America 1970, 65, 168-175.
[32] K. B. Mullis, F. A. Faloona, Methods in enzymology 1987, 155, 335-350.
[33] J. S. Chamberlain, R. A. Gibbs, J. E. Rainer, P. N. Nguyen, C. Thomas, Nucleic acids research 1988, 16, 11141-11156.
[34] V. Shyamala, G. Ames, Journal of bacteriology 1989, 171, 1602-1608.
[35] Q. Chou, M. Russell, D. E. Birch, J. Raymond, W. Bloch, Nucleic Acids Research 1992, 20, 1717-1723.
[36] T. M. Haqqi, G. Sarkar, C. S. David, S. S. Sommer, Nucleic acids research 1988, 16, 11844-11844.
[37] H. A. Erlich, D. Gelfand, J. J. Sninsky, Science 1991, 252, 1643-1651.
[38] R. Don, P. Cox, B. Wainwright, K. Baker, J. Mattick, Nucleic acids research 1991, 19, 4008.
[39] P. M. Holland, R. D. Abramson, R. Watson, D. H. Gelfand, Proceedings of the National Academy of Sciences 1991, 88, 7276-7280.
[40] U. Gibson, C. A. Heid, P. M. Williams, Genome research 1996, 6, 995-1001.
[41] C. A. Heid, J. Stevens, K. J. Livak, P. M. Williams, Genome research 1996, 6, 986-994.

115
[42] C. T. Wittwer, M. G. Herrmann, A. A. Moss, R. P. Rasmussen, Biotechniques 1997, 22, 130-139.
[43] M. U. Kopp, A. J. De Mello, A. Manz, Science 1998, 280, 1046-1048.
[44] I. M. Mackay, K. E. Arden, A. Nitsche, Nucleic acids research 2002, 30, 1292-1305.
[45] F. Sanger, S. Nicklen, A. R. Coulson, Proceedings of the National Academy of Sciences of the United States of America 1977, 74, 5463-5467.
[46] W. Ansorge, B. S. Sproat, J. Stegemann, C. Schwager, Journal of biochemical and biophysical methods 1986, 13, 315-323.
[47] J. M. Prober, G. L. Trainor, R. J. Dam, F. W. Hobbs, C. W. Robertson, R. J. Zagursky, A. J. Cocuzza, M. A. Jensen, K. Baumeister, Science 1987, 238, 336-341.
[48] L. M. Smith, J. Z. Sanders, R. J. Kaiser, P. Hughes, C. Dodd, C. R. Connell, C. Heiner, S. B. Kent, L. E. Hood, Nature 1986, 321, 674-679.
[49] W. Ansorge, H. Voss, S. Wiemann, C. Schwager, B. Sproat, J. Zimmermann, J. Stegemann, H. Erfle, N. Hewitt, T. Rupp, Electrophoresis 1992, 13, 616-619.
[50] X. C. Huang, M. A. Quesada, R. A. Mathies, Analytical chemistry 1992, 64, 967-972.
[51] E. M. Southern, Journal of molecular biology 1975, 98, 503-517.
[52] P. Lysov Iu, V. L. Florent'ev, A. A. Khorlin, K. R. Khrapko, V. V. Shik, Doklady Akademii nauk SSSR 1988, 303, 1508-1511.
[53] R. Drmanac, S. Drmanac, I. Labat, R. Crkvenjakov, A. Vicentic, A. Gemmell, Electrophoresis 1992, 13, 566-573.
[54] R. Drmanac, S. Drmanac, Z. Strezoska, T. Paunesku, I. Labat, M. Zeremski, J. Snoddy, W. Funkhouser, B. Koop, L. Hood, Science 1993, 260, 1649-1652.
[55] R. J. Melamede, U.S. Patent 4863849 1985.
[56] B. Canard, R. S. Sarfati, Gene 1994, 148, 1-6.
[57] M. L. Metzker, R. Raghavachari, S. Richards, S. E. Jacutin, A. Civitello, K. Burgess, R. A. Gibbs, Nucleic Acids Research 1994, 22, 4259-4267.
[58] P. Nyrén, Analytical Biochemistry 1987, 167, 235-238.
[59] E. D. Hyman, Anal Biochem 1988, 174, 423-436.
[60] P. Nyrén, Journal of bioluminescence and chemiluminescence 1994, 9, 29-34.
[61] M. Ronaghi, M. Uhlén, P. Nyrén, Science 1998, 281, 363-365.
[62] P. Nyrén, S. Karamohamed, M. Ronaghi, Analytical biochemistry 1997, 244, 367-373.
[63] P. Nyren, Google Patents, 2001.

116
[64] M. Ronaghi, S. Karamohamed, B. Pettersson, M. Uhlén, P. Nyrén, Analytical Biochemistry 1996, 242, 84-89.
[65]
[66] S. J. Benkovic, C. E. Cameron, Methods in enzymology 1994, 262, 257-269.
[67] S. Karamohamed, J. Nilsson, K. Nourizad, M. Ronaghi, B. Pettersson, P. Nyrén, Protein expression and purification 1999, 15, 381-388.
[68] V. Espinosa, A. M. Kettlun, A. Zanocco, E. Cardemil, M. Valenzuela, Phytochemistry 2003, 63, 7-14.
[69] N. Nourizad, M. Ehn, B. Gharizadeh, S. Hober, P. Nyrén, Protein expression and purification 2003, 27, 229-237.
[70] P. Nyrén, A. Lundin, Analytical biochemistry 1985, 151, 504-509.
[71] A. Ahmadian, J. Lundeberg, Biotechniques 2002, 32, 1122-1124, 1126, 1128 passim.
[72] P.-Y. Kwok, Annual review of genomics and human genetics 2001, 2, 235-258.
[73] R. B. Wallace, J. Shaffer, R. Murphy, J. Bonner, T. Hirose, K. Itakura, Nucleic acids research 1979, 6, 3543-3558.
[74] M. Jobs, Nature Biotechnology 1999, 17, 87-88.
[75] L. G. Lee, C. R. Connell, W. Bloch, Nucleic acids research 1993, 21, 3761-3766.
[76] K. J. Livak, S. Flood, J. Marmaro, W. Giusti, K. Deetz, Genome Research 1995, 4, 357-362.
[77] U. Landegren, R. Kaiser, J. Sanders, L. Hood, Science 1988, 241, 1077-1080.
[78] F. Barany, Proceedings of the National Academy of Sciences 1991, 88, 189-193.
[79] J. Banér, M. Nilsson, M. Mendel-Hartvig, U. Landegren, Nucleic acids research 1998, 26, 5073-5078.
[80] P. M. Lizardi, X. Huang, Z. Zhu, P. Bray-Ward, D. C. Thomas, D. C. Ward, Nature genetics 1998, 19, 225-232.
[81] M. Nilsson, K. Krejci, J. Koch, M. Kwiatkowski, P. Gustavsson, U. Landegren, Nature genetics 1997, 16, 252-255.
[82] M. Nilsson, H. Malmgren, M. Samiotaki, M. Kwiatkowski, B. P. Chowdhary, U. Landegren, Science 1994, 265, 2085-2088.
[83] P. D. Grossman, W. Bloch, E. Brinson, C. C. Chang, F. A. Eggerding, S. Fung, S. Woo, E. S. Winn-Deen, Nucleic acids research 1994, 22, 4527-4534.
[84] D. A. Nickerson, R. Kaiser, S. Lappin, J. Stewart, L. Hood, U. Landegren, Proceedings of the National Academy of Sciences 1990, 87, 8923-8927.

117
[85] A.-C. Syvänen, K. Aalto-Setälä, L. Harju, K. Kontula, H. Söderlund, Genomics 1990, 8, 684-692.
[86] A.-C. Syvänen, Human mutation 1999, 13, 1-10.
[87] K. Mullis, F. Faloona, S. Scharf, R. Saiki, G. Horn, H. Erlich, Cold Spring Harbor symposia on quantitative biology 1986, 51 Pt 1, 263-273.
[88] C. Newton, A. Graham, L. Heptinstall, S. Powell, C. Summers, N. Kalsheker, J. Smith, A. Markham, Nucleic acids research 1989, 17, 2503-2516.
[89] H. Okayama, D. T. Curiel, M. L. Brantly, M. D. Holmes, R. G. Crystal, J Lab Clin Med 1989, 114, 105-113.
[90] D. Y. Wu, L. Ugozzoli, B. K. Pal, R. B. Wallace, Proceedings of the National Academy of Sciences 1989, 86, 2757-2760.
[91] S. S. Sommer, J. D. CASSADY, J. L. SOBELL, C. D. BOTTEMA, in Mayo Clinic Proceedings, Vol. 64, Elsevier, 1989, pp. 1361-1372.
[92] J. P. Day, F. Barany, D. Bergstrom, R. P. Hammer, Nucleic acids research 1999, 27, 1810-1818.
[93] A. Ahmadian, B. Gharizadeh, D. O’Meara, J. Odeberg, J. Lundeberg, Nucleic acids research 2001, 29, e121-e121.
[94] V. Lyamichev, A. L. Mast, J. G. Hall, J. R. Prudent, M. W. Kaiser, T. Takova, R. W. Kwiatkowski, T. J. Sander, M. de Arruda, D. A. Arco, Nature biotechnology 1999, 17, 292-296.
[95] J. G. Hall, P. S. Eis, S. M. Law, L. P. Reynaldo, J. R. Prudent, D. J. Marshall, H. T. Allawi, A. L. Mast, J. E. Dahlberg, R. W. Kwiatkowski, Proceedings of the National Academy of Sciences 2000, 97, 8272-8277.
[96] Z. Tsuchihashi, N. Dracopoli, The pharmacogenomics journal 2002, 2, 103-110.
[97] D. J. Beebe, G. A. Mensing, G. M. Walker, Annual review of biomedical engineering 2002, 4, 261-286.
[98] T. Chován, A. Guttman, TRENDS in Biotechnology 2002, 20, 116-122.
[99] S. C. Jakeway, A. J. de Mello, E. L. Russell, Fresenius' journal of analytical chemistry 2000, 366, 525-539.
[100] A. J. Tüdős, G. A. Besselink, R. B. Schasfoort, Lab on a Chip 2001, 1, 83-95.
[101] E. Verpoorte, Electrophoresis 2002, 23, 677-712.
[102] X. C. Huang, M. A. Quesada, R. A. Mathies, Analytical chemistry 2002, 64, 2149-2154.
[103] T. Vo-Dinh, B. Cullum, Fresenius' journal of analytical chemistry 2000, 366, 540-551.
[104] A. Manz, N. Graber, H. á. Widmer, Sensors and actuators B: Chemical 1990, 1, 244-248.
[105] T. McCreedy, TrAC Trends in Analytical Chemistry 2000, 19, 396-401.

118
[106] T. McCreedy, Analytica chimica acta 2001, 427, 39-43.
[107] H. Shadpour, M. L. Hupert, D. Patterson, C. Liu, M. Galloway, W. Stryjewski, J. Goettert, S. A. Soper, Analytical chemistry 2007, 79, 870-878.
[108] L. Martynova, L. E. Locascio, M. Gaitan, G. W. Kramer, R. G. Christensen, W. A. MacCrehan, Analytical chemistry 1997, 69, 4783-4789.
[109] J. A. Thompson, H. H. Bau, Journal of Chromatography B 2010, 878, 228-236.
[110] J.-M. Mermet, M. Otto, M. Valcarcel Cases, 2004.
[111] H. Becker, L. E. Locascio, Talanta 2002, 56, 267-287.
[112] A. De Mello, Lab on a Chip 2002, 2, 31N-36N.
[113] R. M. McCormick, R. J. Nelson, M. G. Alonso-Amigo, D. J. Benvegnu, H. H. Hooper, Analytical chemistry 1997, 69, 2626-2630.
[114] H. Becker, U. Heim, Sensors and materials 1999, 11, 297-304.
[115] H. Qi, T. Chen, L. Yao, T. Zuo, Optics and Lasers in Engineering 2009, 47, 594-598.
[116] D. C. Duffy, J. C. McDonald, O. J. Schueller, G. M. Whitesides, Analytical chemistry 1998, 70, 4974-4984.
[117] J. R. Anderson, D. T. Chiu, H. Wu, O. Schueller, G. M. Whitesides, Electrophoresis 2000, 21, 27-40.
[118] P. Atkins, Oxford University Press, Oxford 2002.
[119] E. Verpoorte, Lab on a Chip 2003, 3, 60N-68N.
[120] H. Kawaguchi, Progress in Polymer Science 2000, 25, 1171-1210.
[121] M. B. Meza, Drug Discovery Today 2000, 5, 38-41.
[122] L. B. Bangs, Pure and applied chemistry 1996, 68, 1873-1879.
[123] D. S. Peterson, Lab on a Chip 2005, 5, 132-139.
[124] C. Lim, Y. Zhang, Biosensors and Bioelectronics 2007, 22, 1197-1204.
[125] A.-C. Syvänen, G. R. Taylor, Human mutation 2004, 23, 401-405.
[126] L. Directed, Science 1991, 251, 767.
[127] D. Shalon, S. J. Smith, P. O. Brown, Genome research 1996, 6, 639-645.
[128] A. Marshall, J. Hodgson, Nature biotechnology 1998, 16, 27-32.
[129] R. K. Saiki, P. S. Walsh, C. H. Levenson, H. A. Erlich, Proceedings of the National Academy of Sciences 1989, 86, 6230-6234.
[130] T. T. Nikiforov, Y.-H. Rogers, Analytical biochemistry 1995, 227, 201-209.
[131] R. D. Mitra, G. M. Church, Nucleic Acids Research 1999, 27, e34-e39.
[132] A. Oliphant, D. L. Barker, J. R. Stuelpnagel, M. S. Chee, Biotechniques 2002, 32, 56-58.

119
[133] A. C. Pease, D. Solas, E. J. Sullivan, M. T. Cronin, C. P. Holmes, S. Fodor, Proceedings of the National Academy of Sciences 1994, 91, 5022-5026.
[134] J. G. Hacia, Nature genetics 1999, 21, 42-47.
[135] E. Southern, U. Maskos, J. Elder, Genomics 1992, 13, 1008-1017.
[136] N. Tibanyenda, S. H. De Bruin, C. A. Haasnoot, G. A. van der Marel, J. H. van Boom, C. W. Hilbers, European journal of biochemistry / FEBS 1984, 139, 19-27.
[137] T. Pastinen, A. Kurg, A. Metspalu, L. Peltonen, A. C. Syvanen, Genome Res 1997, 7, 606-614.
[138] K. Lindroos, S. Sigurdsson, K. Johansson, L. Rönnblom, A. C. Syvänen, Nucleic acids research 2002, 30, e70-e70.
[139] J. M. Shumaker, A. Metspalu, C. T. Caskey, Human mutation 1996, 7, 346-354.
[140] S. Dubiley, E. Kirillov, A. Mirzabekov, Nucleic Acids Research 1999, 27, e19-i-e19-vi.
[141] D. O’Meara, A. Ahmadian, J. Odeberg, J. Lundeberg, Nucleic acids research 2002, 30, e75-e75.
[142] K. L. Gunderson, X. C. Huang, M. S. Morris, R. J. Lipshutz, D. J. Lockhart, M. S. Chee, Genome research 1998, 8, 1142-1153.
[143] M. Chee, R. Yang, E. Hubbell, A. Berno, X. C. Huang, D. Stern, J. Winkler, D. J. Lockhart, M. S. Morris, S. P. Fodor, Science 1996, 274, 610-614.
[144] C. F. Edman, D. E. Raymond, D. J. Wu, E. Tu, R. G. Sosnowski, W. F. Butler, M. Nerenberg, M. J. Heller, Nucleic Acids Research 1997, 25, 4907-4914.
[145] S. C. Jacobson, R. Hergenroder, L. B. Koutny, J. M. Ramsey, Analytical chemistry 1994, 66, 1114-1118.
[146] A. Manz, D. J. Harrison, E. M. Verpoorte, J. C. Fettinger, A. Paulus, H. Lüdi, H. M. Widmer, Journal of Chromatography A 1992, 593, 253-258.
[147] D. J. Harrison, K. Fluri, K. Seiler, Z. Fan, C. S. Effenhauser, A. Manz, SCIENCE-NEW YORK THEN WASHINGTON- 1993, 261, 895-895.
[148] K. B. Jacobson, H. F. Arlinghaus, M. V. Buchanan, C. Chung-Hsuan, G. L. Glish, R. L. Hettich, S. A. McLuckey, Genetic Analysis: Biomolecular Engineering 1991, 8, 223-229.
[149] V. Dolník, S. Liu, S. Jovanovich, Electrophoresis 2000, 21, 41-54.
[150] J. Li, P. Thibault, N. H. Bings, C. D. Skinner, C. Wang, C. Colyer, J. Harrison, Analytical chemistry 1999, 71, 3036-3045.
[151] P. F. Gavin, A. G. Ewing, Analytical chemistry 1997, 69, 3838-3845.
[152] P. F. Gavin, A. G. Ewing, Journal of Microcolumn Separations 1998, 10, 357-364.

120
[153] U. Backofen, F.-M. Matysik, C. E. Lunte, Analytical chemistry 2002, 74, 4054-4059.
[154] S. Liu, Y. Shi, W. W. Ja, R. A. Mathies, Analytical chemistry 1999, 71, 566-573.
[155] R. A. Mathies, P. C. Simpson, A. T. Woolley, in Micro Total Analysis Systems’ 98, Springer, 1998, pp. 1-6.
[156] P. C. Simpson, D. Roach, A. T. Woolley, T. Thorsen, R. Johnston, G. F. Sensabaugh, R. A. Mathies, Proceedings of the National Academy of Sciences 1998, 95, 2256-2261.
[157] A. T. Woolley, G. F. Sensabaugh, R. A. Mathies, Analytical chemistry 1997, 69, 2181-2186.
[158] B. M. Paegel, C. A. Emrich, G. J. Wedemayer, J. R. Scherer, R. A. Mathies, Proceedings of the National Academy of Sciences 2002, 99, 574-579.
[159] B. M. Paegel, L. D. Hutt, P. C. Simpson, R. A. Mathies, Analytical chemistry 2000, 72, 3030-3037.
[160] I. Kheterpal, J. R. Scherer, S. M. Clark, A. Radhakrishnan, J. Ju, C. L. Ginther, G. F. Sensabaugh, R. A. Mathies, Electrophoresis 1996, 17, 1852-1859.
[161] J. R. Scherer, I. Kheterpal, A. Radhakrishnan, W. W. Ja, R. A. Mathies, Electrophoresis 1999, 20, 1508-1517.
[162] A. P. Sassi, A. Paulus, I. D. Cruzado, T. Bjornson, H. H. Hooper, Journal of Chromatography A 2000, 894, 203-217.
[163] Y.-H. Chen, W.-C. Wang, K.-C. Young, T.-T. Chang, S.-H. Chen, Clinical chemistry 1999, 45, 1938-1943.
[164] M. A. Northrup, M. Ching, R. White, R. Watson, in Transducers, Vol. 93, 1993, pp. 924-926.
[165] P. Wilding, M. A. Shoffner, L. J. Kricka, Clinical Chemistry 1994, 40, 1815-1818.
[166] M. A. Northrup, B. Benett, D. Hadley, P. Landre, S. Lehew, J. Richards, P. Stratton, Analytical chemistry 1998, 70, 918-922.
[167] M. A. Burns, C. H. Mastrangelo, T. S. Sammarco, F. P. Man, J. R. Webster, B. Johnsons, B. Foerster, D. Jones, Y. Fields, A. R. Kaiser, Proceedings of the National Academy of Sciences 1996, 93, 5556-5561.
[168] S. C. Jacobson, J. M. Ramsey, Analytical chemistry 1996, 68, 720-723.
[169] A. T. Woolley, D. Hadley, P. Landre, A. J. deMello, R. A. Mathies, M. A. Northrup, Analytical chemistry 1996, 68, 4081-4086.
[170] M. A. Burns, B. N. Johnson, S. N. Brahmasandra, K. Handique, J. R. Webster, M. Krishnan, T. S. Sammarco, P. M. Man, D. Jones, D. Heldsinger, Science 1998, 282, 484-487.
[171] T. Thorsen, S. J. Maerkl, S. R. Quake, Science 2002, 298, 580-584.

121
[172] A. Y. Fu, H.-P. Chou, C. Spence, F. H. Arnold, S. R. Quake, Analytical chemistry 2002, 74, 2451-2457.
[173] C. L. Hansen, E. Skordalakes, J. M. Berger, S. R. Quake, Proceedings of the National Academy of Sciences 2002, 99, 16531-16536.
[174] S. Quake, Electrophoresis 2002, 23, 1531-1536.
[175] M. C. Needels, D. G. Jones, E. H. Tate, G. L. Heinkel, L. M. Kochersperger, W. J. Dower, R. W. Barrett, M. A. Gallop, Proceedings of the National Academy of Sciences 1993, 90, 10700-10704.
[176] R. J. Fulton, R. L. McDade, P. L. Smith, L. J. Kienker, J. R. Kettman, Clinical chemistry 1997, 43, 1749-1756.
[177] A. W. Czarnik, Current opinion in chemical biology 1997, 1, 60-66.
[178] B. Armstrong, M. Stewart, A. Mazumder, Cytometry 2000, 40, 102-108.
[179] H. Cai, P. S. White, D. Torney, A. Deshpande, Z. Wang, B. Marrone, J. P. Nolan, Genomics 2000, 66, 135-143.
[180] J. Chen, M. A. Iannone, M.-S. Li, J. D. Taylor, P. Rivers, A. J. Nelsen, K. A. Slentz-Kesler, A. Roses, M. P. Weiner, Genome research 2000, 10, 549-557.
[181] M. A. Iannone, J. D. Taylor, J. Chen, M. S. Li, P. Rivers, K. A. Slentz-Kesler, M. P. Weiner, Cytometry 2000, 39, 131-140.
[182] K. V. Rao, P. W. Stevens, J. G. Hall, V. Lyamichev, B. P. Neri, D. M. Kelso, Nucleic acids research 2003, 31, e66-e66.
[183] K. L. Michael, L. C. Taylor, S. L. Schultz, D. R. Walt, Analytical chemistry 1998, 70, 1242-1248.
[184] F. J. Steemers, J. A. Ferguson, D. R. Walt, Nature biotechnology 2000, 18, 91-94.
[185] J.-B. Fan, X. Chen, M. K. Halushka, A. Berno, X. Huang, T. Ryder, R. J. Lipshutz, D. J. Lockhart, A. Chakravarti, Genome Research 2000, 10, 853-860.
[186] D. R. Greaves, R. K. Patient, The EMBO journal 1985, 4, 2617-2626.
[187] J. H. Leamon, W. L. Lee, K. R. Tartaro, J. R. Lanza, G. J. Sarkis, A. D. deWinter, J. Berka, K. L. Lohman, Electrophoresis 2003, 24, 3769-3777.
[188] H. Craighead, Nature 2006, 442, 387-393.
[189] R. Daw, J. Finkelstein, Nature 2006, 442, 367-367.
[190] A. J. deMello, Nature 2006, 442, 394-402.
[191] J. El-Ali, P. K. Sorger, K. F. Jensen, Nature 2006, 442, 403-411.
[192] D. Janasek, J. Franzke, A. Manz, Nature 2006, 442, 374-380.
[193] P. Yager, T. Edwards, E. Fu, K. Helton, K. Nelson, M. R. Tam, B. H. Weigl, Nature 2006, 442, 412-418.
[194] M. J. Swickrath, S. D. Burns, G. E. Wnek, Sensors and Actuators B: Chemical 2009, 140, 656-662.

122
[195] D. S. Kim, S. W. Lee, T. H. Kwon, S. S. Lee, Journal of micromechanics and microengineering 2004, 14, 798.
[196] M. Abdelgawad, M. W. Watson, A. R. Wheeler, Lab on a Chip 2009, 9, 1046-1051.
[197] G. M. Walker, D. J. Beebe, Lab on a Chip 2002, 2, 131-134.
[198] M. Tokeshi, T. Minagawa, K. Uchiyama, A. Hibara, K. Sato, H. Hisamoto, T. Kitamori, Analytical chemistry 2002, 74, 1565-1571.
[199] M. Marques, P. Fernandes, J. Cabral, P. Žnidaršič-Plazl, I. Plazl, Chemical Engineering Journal 2010, 160, 708-714.
[200] B. D. Piorek, S. J. Lee, J. G. Santiago, M. Moskovits, S. Banerjee, C. D. Meinhart, Proceedings of the National Academy of Sciences 2007, 104, 18898-18901.
[201] L. Hong, T. Pan, Lab on a Chip 2010, 10, 3271-3276.
[202] L. Hong, T. Pan, Journal of Microelectromechanical Systems 2010, 19, 246-253.
[203] G. M. Whitesides, Nature 2006, 442, 368-373.
[204] D. R. Reyes, D. Iossifidis, P.-A. Auroux, A. Manz, Analytical chemistry 2002, 74, 2623-2636.
[205] P.-A. Auroux, D. Iossifidis, D. R. Reyes, A. Manz, Analytical chemistry 2002, 74, 2637-2652.
[206] T. Vilkner, D. Janasek, A. Manz, Analytical chemistry 2004, 76, 3373-3386.
[207] J. West, M. Becker, S. Tombrink, A. Manz, Analytical chemistry 2008, 80, 4403-4419.
[208] R. Mukhopadhyay, Analytical chemistry 2006, 78, 1401-1404.
[209] S.-Y. Teh, R. Lin, L.-H. Hung, A. P. Lee, Lab on a Chip 2008, 8, 198-220.
[210] R. B. Fair, Microfluidics and Nanofluidics 2007, 3, 245-281.
[211] V. Srinivasan, V. K. Pamula, R. B. Fair, Lab on a Chip 2004, 4, 310-315.
[212] J. A. Schwartz, J. V. Vykoukal, P. R. Gascoyne, Lab on a Chip 2004, 4, 11-17.
[213] U. Lehmann, C. Vandevyver, V. K. Parashar, M. A. M. Gijs, Angewandte Chemie International Edition 2006, 45, 3062-3067.
[214] J. Pipper, M. Inoue, L. F. P. Ng, P. Neuzil, Y. Zhang, L. Novak, Nat Med 2007, 13, 1259-1263.
[215] J. Pipper, Y. Zhang, P. Neuzil, T.-M. Hsieh, Angewandte Chemie International Edition 2008, 47, 3900-3904.
[216] A. A. Garcia, A. Egatz-Gómez, S. A. Lindsay, P. Dominguez-Garcia, S. Melle, M. Marquez, M. A. Rubio, S. Picraux, D. Yang, P. Aella, Journal of Magnetism and Magnetic Materials 2007, 311, 238-243.

123
[217] J. Schneider, A. Egatz-Gómez, S. Melle, S. Lindsay, P. Dominguez-Garcia, M. Rubio, M. Marquez, A. A. García, Colloids and Surfaces A: Physicochemical and Engineering Aspects 2008, 323, 19-27.
[218] T. Ohashi, H. Kuyama, N. Hanafusa, Y. Togawa, Biomed Microdevices 2007, 9, 695-702.
[219] N.-T. Nguyen, K. M. Ng, X. Huang, Applied Physics Letters 2006, 89, 052509.
[220] N.-T. Nguyen, A. Beyzavi, K. M. Ng, X. Huang, Microfluidics and Nanofluidics 2007, 3, 571-579.
[221] Y. Sun, N.-T. Nguyen, Y. C. Kwok, Analytical chemistry 2008, 80, 6127-6130.
[222] Y. Sun, Y. C. Kwok, N.-T. Nguyen, Lab on a Chip 2007, 7, 1012-1017.
[223] M. Shikida, N. Nagao, R. Imai, H. Honda, M. Okochi, H. Ito, K. Sato, Journal of Micromechanics and Microengineering 2008, 18, 035034.
[224] M. Shikida, K. Takayanagi, H. Honda, H. Ito, K. Sato, Journal of Micromechanics and Microengineering 2006, 16, 1875.
[225] M. Shikida, K. Takayanagi, K. Inouchi, H. Honda, K. Sato, Sensors and Actuators B: Chemical 2006, 113, 563-569.
[226] U. Lehmann, D. de Courten, C. Vandevyver, V. Parashar, M. Gijs, Microelectronic engineering 2007, 84, 1669-1672.
[227] U. Lehmann, S. Hadjidj, V. K. Parashar, C. Vandevyver, A. Rida, M. A. Gijs, Sensors and Actuators B: Chemical 2006, 117, 457-463.
[228] Z. Long, A. M. Shetty, M. J. Solomon, R. G. Larson, Lab on a Chip 2009, 9, 1567-1575.
[229] H. Tsuchiya, M. Okochi, N. Nagao, M. Shikida, H. Honda, Sensors and Actuators B: Chemical 2008, 130, 583-588.
[230] N. Pamme, Lab on a Chip 2006, 6, 24-38.
[231] H.-Y. Kim, H. J. Lee, B. H. Kang, Journal of colloid and interface science 2002, 247, 372-380.
[232] S. Hodges, O. Jensen, J. Rallison, Journal of Fluid Mechanics 2004, 512, 95-131.
[233] Y. Zhang, T.-H. Wang, Advanced Materials 2013, 25, 2903-2908.
[234] I. A. Eydelnant, U. Uddayasankar, M. W. Liao, A. R. Wheeler, Lab on a Chip 2012, 12, 750-757.
[235] L. K. Fiddes, V. N. Luk, S. H. Au, A. H. Ng, V. Luk, E. Kumacheva, A. R. Wheeler, Biomicrofluidics 2012, 6, 014112.
[236] D. Witters, N. Vergauwe, S. Vermeir, F. Ceyssens, S. Liekens, R. Puers, J. Lammertyn, Lab on a Chip 2011, 11, 2790-2794.
[237] J. Gong, Lab on a Chip 2008, 8, 898-906.
[238] Y. Zhang, S. Park, K. Liu, J. Tsuan, S. Yang, T.-H. Wang, Lab on a Chip 2011, 11, 398-406.

124
[239] N.-T. Nguyen, G. Zhu, Y.-C. Chua, V.-N. Phan, S.-H. Tan, Langmuir 2010, 26, 12553-12559.
[240] Y. Zhang, D. J. Shin, T.-H. Wang, Lab on a chip 2013, 13, 4827-4831.
[241] L. Chen, A. Manz, P. J. Day, Lab on a Chip 2007, 7, 1413-1423.
[242] J. K.-K. Ng, H. Feng, W.-T. Liu, Analytica chimica acta 2007, 582, 295-303.
[243] K.-Y. Lien, C.-J. Liu, Y.-C. Lin, P.-L. Kuo, G.-B. Lee, Microfluidics and Nanofluidics 2009, 6, 539-555.
[244] R. Elghanian, J. J. Storhoff, R. C. Mucic, R. L. Letsinger, C. A. Mirkin, Science 1997, 277, 1078-1081.
[245] W.-F. Fang, W.-J. Chen, J.-T. Yang, Sensors and Actuators B: Chemical 2014, 192, 77-82.
[246] C. J. Huang, W. F. Fang, M. S. Ke, H. Y. E. Chou, J. T. Yang, Lab on a Chip 2014, 14, 2057-2062.
[247] D. J. Boles, J. L. Benton, G. J. Siew, M. H. Levy, P. K. Thwar, M. A. Sandahl, J. L. Rouse, L. C. Perkins, A. P. Sudarsan, R. Jalili, V. K. Pamula, V. Srinivasan, R. B. Fair, P. B. Griffin, A. E. Eckhardt, M. G. Pollack, Analytical chemistry 2011, 83, 8439-8447.
[248] E. R. F. Welch, Y.-Y. Lin, A. Madison, R. B. Fair, Biotechnology Journal 2011, 6, 165-176.
[249] A. M. Borman, C. J. Linton, D. Oliver, M. D. Palmer, A. Szekely, E. M. Johnson, Journal of Clinical Microbiology 2010, 48, 3648-3653.
[250] J. D. Watson, F. H. Crick, Annals of the New York Academy of Sciences 1995, 758, 13-14.
[251] E. S. Lander, L. M. Linton, B. Birren, C. Nusbaum, M. C. Zody, J. Baldwin, K. Devon, K. Dewar, M. Doyle, W. FitzHugh, Nature 2001, 409, 860-921.
[252] J. C. Venter, M. D. Adams, E. W. Myers, P. W. Li, R. J. Mural, G. G. Sutton, H. O. Smith, M. Yandell, C. A. Evans, R. A. Holt, science 2001, 291, 1304-1351.
[253] M. O. Altmeyer, A. Manz, P. Neužil, Analytical chemistry 2015, 87, 5997-6003.
[254] C. D. Ahrberg, A. Manz, RSC Advances 2016, 6, 42076-42080.
[255] Z. Guttenberg, H. Müller, H. Habermüller, A. Geisbauer, J. Pipper, J. Felbel, M. Kielpinski, J. Scriba, A. Wixforth, Lab on a Chip 2005, 5, 308-317.
[256] P. Neuzil, J. Pipper, T. M. Hsieh, Molecular bioSystems 2006, 2, 292-298.
[257] P. Neuzil, C. Zhang, J. Pipper, S. Oh, L. Zhuo, Nucleic acids research 2006, 34, e77-e77.
[258] P. Neuzil, L. Novak, J. Pipper, S. Lee, L. F. Ng, C. Zhang, Lab on a Chip 2010, 10, 2632-2634.

125
[259] C. D. Ahrberg, B. R. Ilic, A. Manz, P. Neužil, Lab on a Chip 2016, 16, 586-592.
[260] C. D. Ahrberg, P. Neužil, Scientific Reports 2015, 5, 12595.
[261] C. D. Ahrberg, A. Manz, P. Neužil, Analytical chemistry 2016, 88, 4803-4807.
[262] C. D. Ahrberg, B. R. Ilic, A. Manz, P. Neuzil, Lab on a Chip 2016, 16, 586-592.
[263] A. Přibylka, A. V. Almeida, M. O. Altmeyer, J. Petr, J. Ševčík, A. Manz, P. Neužil, Lab on a Chip 2013, 13, 1695-1698.
[264] A. V. Almeida, A. Manz, P. Neuzil, Lab on a Chip 2016, 16, 1063-1071.
[265] M. Abdelgawad, A. R. Wheeler, Advanced Materials 2009, 21, 920-925.
[266] M. G. Pollack, V. K. Pamula, V. Srinivasan, A. E. Eckhardt, Expert Review of Molecular Diagnostics 2011, 11, 393-407.
[267] S. K. Cho, H. Moon, Biochip Journal 2008, 2, 79-96.
[268] N.-T. Nguyen, Microfluidics and Nanofluidics 2012, 12, 1-16.
[269] S. K. Cho, H. Moon, C.-J. Kim, Journal of microelectromechanical systems 2003, 12, 70-80.
[270] C. Sung Kwon, F. Shih-Kang, M. Hyejin, K. Chang-Jin, in Technical Digest. MEMS 2002 IEEE International Conference. Fifteenth IEEE International Conference on Micro Electro Mechanical Systems (Cat. No.02CH37266), 2002, pp. 32-35.
[271] P. Neužil, W. Sun, T. Karásek, A. Manz, Applied Physics Letters 2015, 106, 024104.
[272] J. Pipper, Y. Zhang, P. Neuzil, T. M. Hsieh, Angewandte Chemie International Edition 2008, 47, 3900-3904.
[273] P. Neužil, W. Sun, T. Karasek, A. Manz, Applied Physics Letters 2015, 106, 024104.
[274] J. Pipper, M. Inoue, L. F. Ng, P. Neuzil, Y. Zhang, L. Novak, Nature medicine 2007, 13, 1259-1263.