
Vietnam: Country on the move - VN – INVESTOR
70
Vietnam: Country on the move Primer II April 2007 Deutsche Bank AG/Hong Kong All prices are those current at the end of the previous trading session unless otherwise indicated Deutsche Bank does and seeks to do business with companies covered in its research reports. Thus, investors should be aware that the firm may have a conflict of interest that could affect the objectivity of this report. Investors should consider this report as only a single factor in making their investment decision. Independent, third-party research (IR) on certain companies covered by DBSI's research is available to customers of DBSI in the United States at no cost. Customers can access this IR at http://gm.db.com, or call 1-877-208-6300 to request that a copy of the IR be sent to them. DISCLOSURES AND ANALYST CERTIFICATIONS ARE LOCATED IN APPENDIX 1
-
Upload
khangminh22 -
Category
Documents
-
view
1 -
download
0
Transcript of Vietnam: Country on the move - VN – INVESTOR

Vietnam: Country on the move
Primer II April 2007
Deutsche Bank AG/Hong Kong All prices are those current at the end of the previous trading session unless otherwise indicated Deutsche Bank does and seeks to do business with companies covered in its research reports. Thus, investors should be aware that the firm may have a conflict of interest that could affect the objectivity of this report. Investors should consider this report as only a single factor in making their investment decision. Independent, third-party research (IR) on certain companies covered by DBSI's research is available to customers of DBSI in the United States at no cost. Customers can access this IR at http://gm.db.com, or call 1-877-208-6300 to request that a copy of the IR be sent to them. DISCLOSURES AND ANALYST CERTIFICATIONS ARE LOCATED IN APPENDIX 1

Table of Contents
Economic update.......................................................................................2
Fiscal policy................................................................................................9
Monetary policy.......................................................................................11
SOCB and SOE reform ............................................................................13
Capital market .........................................................................................17
Sectoral analysis......................................................................................21
Market dynamics .....................................................................................32
FPT Corporation (FPT VN, VND460,000)................................................36
Vietnam Dairy (VNM VN, VND175,000).................................................39
Sacom Bank (STB VN, VND 98,000).......................................................42
PV Drilling (PVD VN, VND292,000) ........................................................45
VSH Hydro (VSH VN, VND82,500)..........................................................47
REE Corporation (REE VN, VND215,000) ...............................................49
Kinh Do Corp (KDC VN, VND220,000)....................................................52
Tan Tao Industrial Park (ITA VN, VND140,000).....................................55
Gemadept (GMD VN, VND181,000) .......................................................58
HCMC Infrastructure (CII VN, VND76,000) ............................................61
Bibliography.............................................................................................64
DB Contact Benjamin Chandler at (852) 2203-6936 or [email protected] (HK) Charles-J Donley at (852) 2203-6918 or [email protected] (HK). Blair Richmond at (212) 250 8802 or [email protected] (NYC) "The author of this report wishes to acknowledge the contribution made by Tariq Aboosally Mohamed, employee of Amba Research Lanka (Private) Ltd a third-party provider to Deutsche Bank of offshore research support services."

GEMS: Asia Vietnam Strategy
12 April 2007
Vietnam Primer Part II Country on the move
Juliana Lee Economist 852 2203 8312 [email protected]
Deutsche Bank AG/Hong Kong
All prices are those current at the end of the previous trading session unless otherwise indicated. Prices are sourced from local exchanges via Reuters, Bloomberg and other vendors. Data is sourced from Deutsche Bank and subject companies.
Deutsche Bank does and seeks to do business with companies covered in its research reports. Thus, investors should be aware that the firm may have a conflict of interest that could affect the objectivity of this report.
Investors should consider this report as only a single factor in making their investment decision.
Independent, third-party research (IR) on certain companies covered by DBSI's research is available to customers of DBSI in the United States at no cost. Customers can access this IR at http://gm.db.com, or call 1-877-208-6300 to request that a copy of the IR be sent to them.
DISCLOSURES AND ANALYST CERTIFICATIONS ARE LOCATED IN APPENDIX 1
Digest
Sustaining strong growth Both domestic and external demand remained robust in 2006, leading to a GDP growth of 8.2%, well above 7.5% in the period of 2001-2005 and one of the highest GDP growth rates in the world. Highlighting its emergence in the international scene, Vietnam became a formal member of the WTO on 13 January 2007. Meanwhile, the US granted Vietnam a permanent normal trade relations (PNTR) status on 12 December 2006. Vietnam’s WTO membership demonstrates its commitment to market liberalization and globalization.
Reform continues Apart from Agribank, which is scheduled to be equitised in 2008, all state-owned commercial banks are to be privatised in 2007. The state will continue to hold the majority of stake of at least 51% in state run commercial banks while limiting foreign ownership to 30% and individual ownership to 10%. Moreover, PM Decision 112 stipulates that the CAR should be no less than 8% and that the banking standards should be fully consistent with Basel I by 2010. As for state-owned enterprises, 1,500 out of 2,100 are to be equitised over the next five years.
Fast-track market development, presenting risks and opportunities Supported by the GoV, the number of listed companies rose to 196 by the end of 2006, up sharply from 44 in 2005, with the market capitalization rising to USD13.9bn, 25% of Vietnam’s GDP. Meanwhile, the VNINDEX rose sharply to 751.8 by end-2006 from 307.5 at end-2005, trading at 74.9x compared to 15.4x in 2005. This sharp increase prompted regulatory measures to shield the banking system from the possible fall-out of market instability. There are, however, concerns that more restrictive measures may be forthcoming.
GDP growth (2006)8.2%yoy
Population84.4 million 0-14 years: 27%15-64 years: 67%65 over: 9%
GDP per capita (2006)USD725
Top exports
Oil, Textile/garments
Top Imports
Machinery/equip, Petro prod
Main trading partnerUSA, JapanChina/Hong KongTaiwan, Singapore
S&P BB Stable
Market capitalization (2006)HSTC USD9.7bnHaSTC USD7.2bn
Avg daily turnoverUSD5.2mn
Top 5 companies by mkt capFinancing and Promoting TechPha Lai Thermal PowerVietnam Dairy Sacom BankPetrovietnam
Form of governmentSocial Republic
Chief of statePresident Nguyen Minh TRIET
Head of governmentPrime Minister Nguyen Tan DUNG
Community Party of VietnamSecretary General Nong Duc MANH

12 April 2007 Strategy Vietnam Primer Part II
Page 2 Deutsche Bank AG/Hong Kong
Economic update I. Strong growth
Both domestic and external demand remained robust in 2006, leading to a GDP growth of 8.2%, well above the 7.5% growth achieved in the 2001-2005 period – one of the highest GDP growth rates in the world. Vietnam’s GDP per capita stood at USD725 in 2006, up from USD413 in 2001.
Figure 1: Growth comparison (2006)
0
2
4
6
8
10
12C
hina
Indi
a
Vie
tnam
Pak
ista
n
Mal
aysi
a
Indo
nesi
a
Phi
lippi
nes
Thai
land
%
Sources: CEIC, DB Global Markets Research
Highlighting its emergence in the international scene, the General Council of the World Trade Organization (WTO) approved Vietnam’s membership after 11 years of negotiations on 7 November 2006 and, following the approval of the National Assembly, Vietnam became a formal member on 13 January 2007. Meanwhile, the US granted Vietnam a permanent normal trade relations (PNTR) status on 12 December 2006.
Industrialization Vietnam’s economy continued to evolve from an agrarian economy to one driven by industry. Last year, the GDP growth was again led by the industry and construction sectors, which grew 10.4% yoy, while the services and agricultural sectors expanded 8.3% and 3.4%, respectively. The industrial and construction sectors’ share of GDP continued to rise, to 41.5% in 2006 from 25.2% in 1990, while the share of the agricultural sector fell to 20.4% from 31.8%. Meanwhile, the share of the services sector stood relatively stable at 38.1% in 2006, down from 43% in 1990.
On the other hand, the agriculture sector remained the top source of employment, accounting for a 57% share of the total, with about three-quarters of the population residing in rural areas. The country’s workforce is estimated at 42mn and is growing at 3.5-4% on average, well above the population growth rate of 1.4%.
Sustaining strong growth
Growth driven by industry

12 April 2007 Strategy Vietnam Primer Part II
Deutsche Bank AG/Hong Kong Page 3
Figure 2: GDP and employment share by sector 1995 Figure 3: GDP and employment share by sector 2006
Share of GDP
32%
17%7%
44%
Employment
70%
10%
3%
17%
Agric'e Industry Const'n Services
Employment
56%
14%
5%
25%
Agric'e Industry Const'n Services
Share of GDP
19%
32%
9%
40%
Sources: GSO, CEIC, DB Global Markets Research Sources: GSO, CEIC, DB Global Markets Research
Sustaining high growth The socioeconomic development plan (SEDP) 2006-2010 aims to bring Vietnam out of its “less” developed condition by 2010, raising per capita income to above USD1,000 by 2010, with emphasis on globalisation and industrialisation of the economy. The Government of Vietnam (GoV) aims to raise the industry/construction share of GDP to 43-44% by 2010, up from 41% in 2001-2005.
The GoV’s GDP growth target for the period 2006-2010 stands at 7.5-8.0%, led by export growth of 16%, slightly higher than the 14.7% growth in imports. The GoV expects the investment share of GDP to rise to 40% in 2010 from 37.5% in 2001-2005, which implies 10-11% annual growth, compared to the consumption growth target of 6-7% for the same period.
Figure 4: SEDP 2006-2010, growth by sector Figure 5: SEDP 2006-2010, share of GDP
4.5 5.53.1
13.1
15.9
10
6.27.6 8
-
5
10
15
20
2001-05planned
2001-05 actual
2006-10 planned
Agriculture Industry Services%yoy
20 21
16
38.541 43.541.5
38 40.5
-
10
20
30
40
50
2001-05planned
2001-05 actual
2006-10 planned
Agriculture Industry Services% of GDP
Sources: MPI, DB Global Markets Research Sources: MPI, DB Global Markets Research
II. Diversifying trade
Vietnam’s economic growth in 2006 was underpinned by strong export growth. Exports rose 22.1% yoy in 2006, down slightly from the 24% in 2005. Although rising relatively modestly in 2006, by 12.9% yoy, oil remained Vietnam’s top export item with its share of total exports at 21%. This was followed closely by textile and garments, whose exports rose 19.9% yoy, accounting for 15% of the total exports in 2006. Meanwhile, exports of coffee and rubber (which together make up about 6% of total exports) rose 51.9% yoy and 61.8% yoy, respectively. Growth in computer exports also remained strong, at 22.8% yoy, although down from the 33.9% in 2005, reflecting the global trend. We expect the importance of computer and electrical components to increase
GoV supporting higher
social investment
Strong export growth

12 April 2007 Strategy Vietnam Primer Part II
Page 4 Deutsche Bank AG/Hong Kong
meaningfully, supported by investments from Intel, Microsoft, Samsung and Canon. Meanwhile, import growth accelerated to 20.4%yoy in 2006 from 17% in 2005, led by imports of machinery and spare parts and textile-related products, leaving the trade deficit at USD4.8bn in 2006, compared to a deficit of USD4.5bn in 2005.
Figure 6: Composition of exports by value (2006) Figure 7: Composition of imports by goods (2006)
Agriproducts
12%
Other31%
Aquaproducts
8% Computer&
Electronics4%
Footwear9%
Textile &garments
15%
Crude oil21%
Other45%
Tools &spare parts
15%
Electronics5%
Petroleum13%
Steel7% Leather
4%
Fabrics7%
Plastics4%
Sources: CEIC, DB Global Markets Research Sources: CEIC, DB Global Markets Research
While we expect the WTO membership will further integrate Vietnam into the global economy, we expect only a limited impact on the net trade as Vietnam liberalises and reduces import barriers. On the other hand, we expect a far greater impact on the economy as a whole as the WTO membership keeps Vietnam on the path of liberalisation and reform.
Figure 8: Export by destination Figure 9: Import by destination
0%
20%
40%
60%
80%
100%
2001 2005
Others
U S
Japan
China + HK
Australia
Singapore
Germany
0%
20%
40%
60%
80%
100%
2001 2005
Others
Thailand
Korea
Japan
Taiwan
Singapore
China + HK
Sources: CEIC, DB Global Markets Research Sources: CEIC, DB Global Markets Research
III. Balance of payment
Remittances, an alternative resource for investment In 2005, despite the trade account deficit of USD2.3bn (BoP), Vietnam recorded a current account surplus of USD0.2bn, supported by large remittance inflows. In contrast to the goods, service and income accounts, which continued to record deficits, the transfer account remained strongly positive, helping to limit the current account deficit.
WTO membership reflects
Vietnam’s commitment to
liberalization and reform
Currenct account deficit
limited by large remittance
inflows

12 April 2007 Strategy Vietnam Primer Part II
Deutsche Bank AG/Hong Kong Page 5
Net transfers stood at USD3.4bn in 2005, up from USD2.5bn in 2004 and higher than the official development assistance (ODA)1 and foreign direct investment combined, which stood at USD2.5bn in 2005. These inflows left the overall balance of payment at USD2.1bn, yielding FX reserves which were higher at USD9.2bn in 2005, up from the USD8.8bn in 2004.
Figure 10: Transfers Figure 11: ODA and FDI
-5-4-3-2-1012345
1995 1997 1999 2001 2003 2005
Trade+Service+Income
Transfers
CA
USD bn
-3
-2
-1
0
1
2
3
4
5
1995 1997 1999 2001 2003 2005
ODA
FDI
CA
USD bn
Sources: CEIC, DB Global Markets Research Sources: CEIC, DB Global Markets Research
Disbursed ODA stood largely unchanged at USD1.4bn in 2005. About 80% of the ODA is collected and allocated by the Development Assistance Fund (DAF), which was restructured in July 2006 as Vietnam Development Bank (VDB), with the rest channeled through state-owned commercial banks. Japan remains the top source of ODA for Vietnam, followed by the World Bank and the Asian Development Bank. ODA remains a significant funding source for infrastructure investment, for transport projects in particular.
Figure 12: ODA by sector (2006) Figure 13: FDI (newly licensed) by sector (2005)
Transport,20.9%
Other,31.0%Water
supply &sanitation,
5.0%
Education,5.7%
Commodity& general
assistance,6.3%
Banking &financial,
6.3%
Agriculture,7.5%
Health,7.1%
Energy,10.2%
Manufactg,64.3%
Other, 8.4%Const, 3.4%
Realestate/rentg& businessactivities ,
8.5%
Health &social work,
4.3%
Transport,storage &communi,
14.5%
Sources: UNDP DAD Vietnam, DB Global Markets Research Sources: UNDP DAD Vietnam, DB Global Markets Research
Vietnam is likely to lose access to the cheapest donor funds by 2010, as it crosses the threshold GNI per capita of USD898 to be eligible for International Development Association (IDA) loans. Vietnam would then have to borrow from Bank for Reconstruction and Development (IBRD), which could raise borrowing costs more than
1 ODA comprises all grants and loans to developing countries, which are undertaken by the official sector and given at concessional financial terms (if loans, have a grant element of at least 25%)
ODA remains a significant
funding source for
infrastructure investment
12 April 2007 Strategy Vietnam Primer Part II
Page 6 Deutsche Bank AG/Hong Kong
twofold.2 Hence, it is vital that Vietnam not only take full advantage while concessional finance is available but also use the opportunity to find and secure alternative financing sources.
The Ministry of Planning and Investment (MPI) is targeting an ODA commitment of USD20-24bn in 2006-2010, USD11-12bn of which is likely to be disbursed. In 2001-2005, the donors pledged USD14.9bn but disbursed less than 50%. According to the MPI estimate, ODA disbursed in 2006 stood at USD1.7bn.
Meanwhile, MPI expects FDI of USD23-25bn in 2006-2010. FDI stood at USD2.0bn in 2005 and MPI estimates it to be USD3.1bn in 2006. South Korea, Singapore, Taiwan Japan and Hong Kong remain Vietnam’s five top investors which account for about 61% of registered capital.
IV. Investment
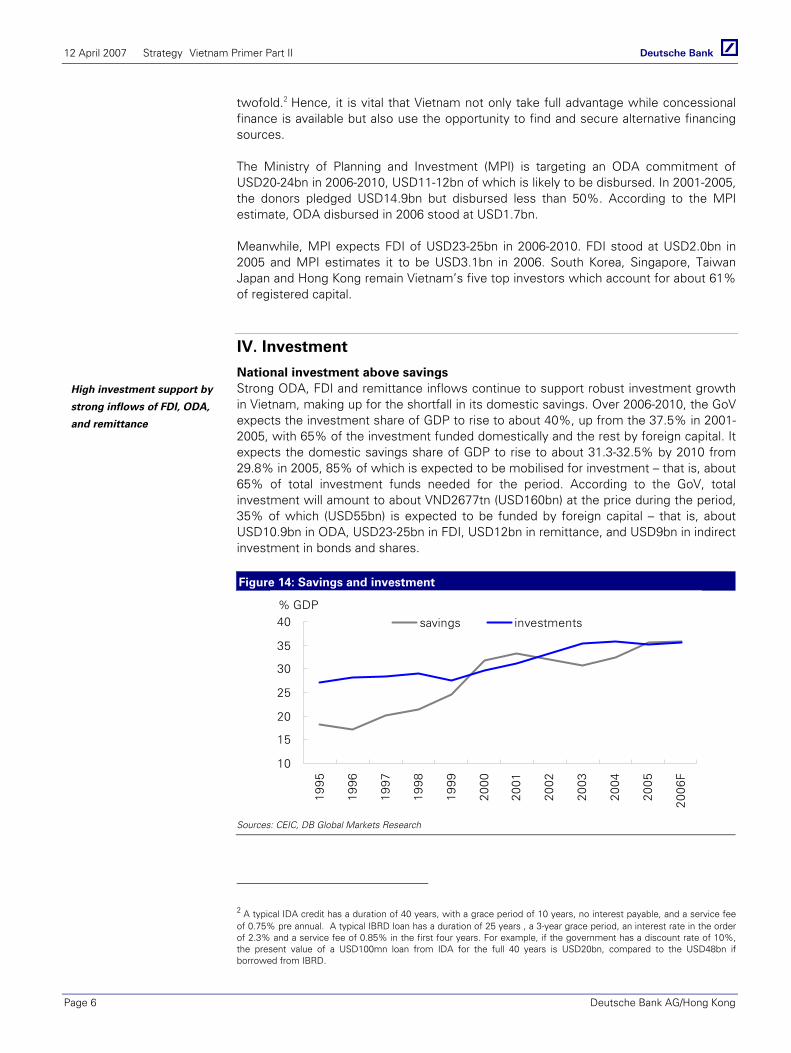
National investment above savings Strong ODA, FDI and remittance inflows continue to support robust investment growth in Vietnam, making up for the shortfall in its domestic savings. Over 2006-2010, the GoV expects the investment share of GDP to rise to about 40%, up from the 37.5% in 2001-2005, with 65% of the investment funded domestically and the rest by foreign capital. It expects the domestic savings share of GDP to rise to about 31.3-32.5% by 2010 from 29.8% in 2005, 85% of which is expected to be mobilised for investment – that is, about 65% of total investment funds needed for the period. According to the GoV, total investment will amount to about VND2677tn (USD160bn) at the price during the period, 35% of which (USD55bn) is expected to be funded by foreign capital – that is, about USD10.9bn in ODA, USD23-25bn in FDI, USD12bn in remittance, and USD9bn in indirect investment in bonds and shares.
Figure 14: Savings and investment
10
15
20
25
30
35
40
1995
1996
1997
1998
1999
2000
2001
2002
2003
2004
2005
2006
F
savings investments% GDP
Sources: CEIC, DB Global Markets Research
2 A typical IDA credit has a duration of 40 years, with a grace period of 10 years, no interest payable, and a service fee of 0.75% pre annual. A typical IBRD loan has a duration of 25 years , a 3-year grace period, an interest rate in the order of 2.3% and a service fee of 0.85% in the first four years. For example, if the government has a discount rate of 10%, the present value of a USD100mn loan from IDA for the full 40 years is USD20bn, compared to the USD48bn if borrowed from IBRD.
High investment support by
strong inflows of FDI, ODA,
and remittance

12 April 2007 Strategy Vietnam Primer Part II
Deutsche Bank AG/Hong Kong Page 7
Infrastructure needs 3 According to the GoV plan, about 25% of the total investment will be dedicated to addressing the infrastructure bottleneck. Infrastructure investment accounted for about 9.4% of GDP in recent years (2002/2003) and the GoV plans to increase it to 11.4% of GDP in 2006-2010.
Figure 15: Infrastructure expenditure by area and source
% GDP Transport Elect Tel Water Total %TotalUsers 0.0 0.9 0.3 0.1 1.3 14ODA 1.7 1.2 0.3 0.3 3.5 37Budget 0.8 0.1 0.0 0.1 1.0 11Govt bonds 1.2 0.0 0.0 0.0 1.2 13SOCBs 0.1 0.0 0.2 0.0 0.3 3Private 0.2 1.2 0.6 0.0 2.0 21Community 0.0 0.0 0.0 0.1 0.1 1Total (2002-2003) 4.0 3.4 1.4 0.6 9.4 100Developt goal 4.1 4.7 1.4 1.2 11.4
Sources: World Bank
In the electricity sector, investments required to meet the Fifth Power Master Plan amount to VND215.1tn (USD13.7bn, 3.9% of GDP) in 2005-2010. This figure is now regarded as an underestimate because of a higher-than-expected demand growth in recent years. The financial model used by EVN to plan future investments suggests that capital expenditure will amount to VND237.3tn (USD16bn), 4.7% of GDP annually in the same period.
Figure 16: Energy overview
Proven Oil Reserves (Jan 1, 2006E) 600 mn barrelsOil Production (2005E) 366,400 barrels per dayOil Consumption (2005E) 259,400 barrels per dayNet Oil Exports 67,000 barrels per dayCrude Oil Distillation Capacity (2006E) None Proven Natural Gas Reserves (Jan 2006E) 6.8 trillion cubic feetNatural Gas Production (2003E) 0.1 trillion cubic feetNatural Gas Consumption (2003E) 95.4 billion cubic feet Recoverable Coal Reserves (2003E) 165.3 million short tonsCoal Production (2003E) 17.6 million short tonsCoal Consumption (2003E) 10.4 million short tons Electricity Installed Capacity (2003E) 8.7 gigawattsElectricity Production (2003E) 39.7 billion kilowatt hoursElectricity Consumption (2003E) 36.9 billion kilowatt hours
Total Energy Consumption (2003E)
1 quadrillion Btus*, of which Oil (46%), Coal(22%), Hydroelectricity (22%), Natural Gas(10%), Nuclear (0%), Other Renewables (0%)
Per Capita Energy Consump'n (2003E) 12.1 million BtusEnergy Intensity (2003E) 5,148.3 Btu per $2000 PPP*
Sources: Energy Information Agency Note: VoV has taken various measures to increase the life of the fields, including cutting production (to about 350,000 in 2005 from 402,000bbl per day in 2004) and promoting exploration efforts. In 2004, new stocks of oil were discovered in Vietsovpetro’s Dragon field and a 100mn barrel was discovered off Vietnam’s northeast coast.
3 Borrowed heavily from World Bank: Vietnam’s Infrastructure Challenge (2006)
Addressing the
infrastructure bottleneck

12 April 2007 Strategy Vietnam Primer Part II
Page 8 Deutsche Bank AG/Hong Kong
According to the Energy Information Agency, much of Vietnam’s rural population relies mainly on non-commercial biomass energy sources such as wood, dung, and rice husks, leaving per capita commercial energy consumption among the lowest in Asia. However, this is expected to change, with rapid growth in the commercial sector, urbanization, and improvement in living standards.
In particular, electricity demand is forecast to grow 15% per year until 2010. Until very recently, Vietnam relied heavily on hydropower for its electricity generation. This dependence on hydropower poses risks to the stable supply of electricity as it is vulnerable to changing weather conditions. In response, the GoV has promoted the construction of thermal power generation plans. In 2004, the share of hydro power generation stood at about 38%, down from 47% in 2002, while that of oil/gas and coal stood at 49% and 13%, respectively, compared to 39% and 14% in 2002.
Capital spending on transportation infrastructure remains the highest. The Ministry of Transport has proposed capital spending of about VND69.2tn (USD4.3bn, 4.2% of GDP per year) in 2006-2008.
In the water and sanitation sector the government has set coverage targets to achieve its 2010 development goals. The targets are 85% coverage for urban water and sanitation, and 75% for rural water and sanitation, which would require investment of VND57.5tn (USD3.62 billion, 1.2% of GDP annually) in 2005-2010.
In the telecommunications sector, in October 2005 the Ministry of Post and Telematics adopted a target of 32-42 total telephone lines per 100 people by 2010. Achieving 35 lines per 100 people would require about VND57tn (USD3.6bn, 1.4% of GDP per year) in 2006-2010.
GoV promoting thermal
power
Capital spending on
transportation infrastructure
remains the highest
GoV targets 85% and 75%
water and sanitation
coverage for the urban and
rural areas, respectively
32-42 telephone lines per
100 people by 2010

12 April 2007 Strategy Vietnam Primer Part II
Deutsche Bank AG/Hong Kong Page 9
Fiscal policy Public debt remains manageable, but risks remain Although public debt remained at a manageable level of 45.5% of GDP in 2006, much better than the average rate of 61% for low-income countries in Asia and about the same rate as ASEAN-4, there are lingering concerns over fiscal sustainability due to continued extensive reliance on government budget and off-budget expenditure to fund investment projects and also due to a high degree of uncertainty regarding the contingent costs of bank reform. While the state’s share of investment has trended downward to 52% in 2005, the budget remained the top source, constituting about 47% of total state investment. Meanwhile, the loan share of state investment rose to 31% in 2005, from 20% in 1995, while the SOE equities’ share stood at 17% in 2005. In response, the GoV has increased its efforts to finance infrastructure investments via equitisation/privatisation of state-owned enterprises (SOEs).
Figure 17: Investment by sector Figure 18: State source of investment
10
15
20
25
30
35
1995 1997 1999 2001 2003 2005
40
45
50
55
60
65
Non-state Foreign invested sectorState (rhs)
% %
0
10
20
30
40
50
1995 1997 1999 2001 2003 2005
LoanEquities of State EnterpriseOtherState Budget
%
Source: GSO Source: GSO
Off-budget items remain a risk to fiscal soundness While the fiscal deficit appears to have remained low in recent years, there are ongoing concerns over the government’s extensive reliance on off-budget expenditures. In particular, according to an IMF estimate, the 2006 official budget balance stood at 1.3% of GDP, but, including off-budget expenditure, the deficit stood at 6.3% of GDP.
Off-budget expenditure includes on-lending for investment projects through DAF (now VDB), which has amounted to about 2-3% of GDP since 2000. DAF has outstanding loans equivalent to about 12% of GDP. Off-budget investment also includes education and infrastructure bonds, SOCB bonds, municipal bonds and extra-budgetary recurrent expenditure.4
4 DAF provided soft loans for the financing of eligible investment projects on a priority list approved by the Prime Minister. DAF operations are funded in part through ODA loans, the issuance of DAF’s own bonds, loans from the Postal Savings Service Company, loans from the Social Security Fund, funds mobilised by DAF branch offices (deposits) and project bonds. Education bonds are typically used to finance improvements in school buildings and related facilities, while infrastructure bonds are used primarily to finance investments in, and maintenance of, transportation and irrigation projects. SOCB recapitalization bonds. In 2001, as a part of the government’s restructuring programme for SOCBs, (State-owned commercial banks) non-performing loans worth VND23tn (5.2% of GDP as of 2000) were identified for resolution. Under this programme, the four largest SOCBs received capital injections totaling
Extensive reliance on
off-budget expenditure to
fund investment projects

12 April 2007 Strategy Vietnam Primer Part II
Page 10 Deutsche Bank AG/Hong Kong
Figure 19: Fiscal balance Figure 20: Revenue by source 2006
-8
-6
-4
-2
0
2
2002 2003 2004 2005E 2006E
Official budget balance
Overall fiscal bal. including off-budget expenditure
% Foreigninvested
enterprises9%
Others18%
Oil31%
SOE's18%
Customs16%
Non stateenterprises
8%
Sources: IMF, MoF, DB Global Markets Research Note: Excludes debt amortization payments and adjusted for carried over revenues and expenditure, which the government definition includes
Sources: MoF, DB Global Markets Research
Oil remains the top source of government revenue Government revenue is highly dependent on oil, tax revenue from state-owned enterprises, and customs duties, with their share of total revenue estimated to be 26.6%, 17.8%, and 16.9%, respectively, in 2006. In 2005, the oil share of total revenue stood at 26.4%, compared to the personal income tax share of around 2.1%. There are concerns over this high dependency on oil and customs taxes due to the volatility in international oil prices and further trade liberalisation with the WTO membership, among other things.
External position also still manageable Vietnam’s external debt remains low by global standards, at 32.2% of GDP – about USD19.3bn in 2006 (IMF estimate). The public share of total external debt (including guarantees) stood at 80% and there are concerns that the country’s large investment needs will translate into a greater debt burden. At the same time, although the private share of total external debt remains relatively small (at 20%), concerns remain over the private sector’s ability to hedge against foreign exchange (FX) risks. Moreover, Vietnam’s official FX reserves stood well below the external debt at USD11.2bn in 2006.
Figure 21: Public debt Figure 22: External debt (% of GDP) 2002 2003 2004 2005 2006 (% of GDP) 2002 2003 2004 2005 2006 Public debt 38.2 40.8 42.7 43.7 45.5 External 35.0 33.8 33.9 32.5 32.6
Domestic 10.1 13.4 15.3 17.1 18.2 Long term 31.3 30.0 30.6 29.5 29.6
Foreign 28.1 27.4 27.4 26.6 27.3 Short term 3.7 3.8 3.3 3.0 3.0
Source: IMF, Ministry of Finance Note: Includes public and publicly guaranteed debt
Source: IMF, Ministry of Finance Note: Includes public and publicly guaranteed debt
VND10.9tn (2.5% of 2000 GDP), of which VND9.7tn was provided in the form of recapitalisation bonds and the remainder in cash. Municipal bonds. Ho Chi Minh City and Hanoi are permitted to issue bonds equivalent to 100% of their annual investment budget (for other cities, the applicable limit is 30%), subject to MOF approval. Extra-budgetary recurrent expenditure by local governments resulting in arrears to the transport and irrigation sectors. The World Bank estimated the arrears to the transportation sector at end-2003 to be about VND14.4tn (2.3% of GDP) and arrears to irrigation as of end-June 2004 of VND1.3tn (0.2% of GDP and equivalent to one-quarter of annual public investment in agriculture). The clearance of these arrears is reportedly being financed through the issuance of government bonds and special budgetary allocations. (IMF)
Heavy reliance on oil
revenue, SOE tax revenue
and customs duties

12 April 2007 Strategy Vietnam Primer Part II
Deutsche Bank AG/Hong Kong Page 11
Monetary policy High inflation and credit growth Inflation rose sharply in 2004 and remained high due to strong growth and supply shocks. Increases in oil prices have translated into higher inflation as the government cut fuel subsidies to reduce its fiscal burden and improve energy efficiency. While the domestic oil prices were increased nine times between end-2003 and August 2006, labour costs continued to increase, resulting in second-round effects on prices. The GoV raised the common minimum wage by 38% in January 2003, 20.7% in October 2005, and 28.6% in October 2006. Average civil service wages were raised by an additional 20% in October 2004 and minimum wages in foreign-invested firms were raised by 42% (on average) in February 2006. Meanwhile, the country also suffered other supply-driven inflation, due to avian influenza and floods. Still, the impact on inflation was limited with administered prices accounting for about 10% of Vietnam’s CPI basket. Meanwhile, credit growth rose sharply to 41.7% yoy in 2004 from 28.4% in 2003, as a result of financial deepening. The ratio of broad money (M2) to GDP continued to rise from 58% in 2001 to 75% in 2004.
In response to a sharp increase in inflation and credit growth, the SBV raised its policy rates5 and reserve requirements. In particular, in July 2004, the SBV raised reserve requirement for corporate deposits with tenor less than one year to 5% (for VND) and 8% (for USD) from 2% and 4%, respectively. Discount and refinancing rates were also raised 50bps to 4.5% and 6.5%, respectively, in December 2005.
In 2006, credit growth fell to 18%, lower than the set target of 20%, while inflation also eased further to 6.6% in 2006 from 8.4% in 2005, although remaining relatively high compared to that of its trading partners, raising concerns over its impact on the nation’s export competitiveness. We expect inflation to remain relatively high, due to the second-round effect of wage hikes and strong demand.
Figure 23: Inflation and monetary policy rates
0
2
4
6
8
10
12
Jan-03 Jul-03 Jan-04 Jul-04 Jan-05 Jul-05 Jan-06 Jul-06 Jan-07
%
Refinancing rate
Discount rate
Base rate
CPI inflation
Sources: State Bank of Vietnam, CEIC, DB Global Markets Research
5 The discount and refinancing facility rates form the lower and upper bands of an interest rate corridor, for Open Market Operation rate. Through the discount facility, credit institutions can access SBV funds subject to quotas, and the maximum term of drawing is 91 days. The refinancing facility is a collateralised lending facility. The SBV also announced a base rate to provide a reference rate for commercial banks’ lending rates, although the relationship between the base rate and other interest rates has been very weak. However, the SBV continues to rely on other monetary instruments such as reserve requirements as it remains the most effective policy instrument. The SBV pays interest on required reserves in dong and on excess reserves in foreign currency. (IMF)
Credit growth and inflation
have fallen but still higher
than trading partners’

12 April 2007 Strategy Vietnam Primer Part II
Page 12 Deutsche Bank AG/Hong Kong
Challenges to the monetary policy transmission The conduct of monetary policy faces various institutional and structural constraints as the SBV faces conflicting policy objectives of fighting inflation and meeting the GoV’s growth target. In particular, state-owned commercial banks (SOCBs) frequently operate on a non-commercial basis to support growth, while increasing internationalisation of the banking system (dollarisation) has complicated monetary policy transmission.
Although there is no comprehensive data on foreign currency circulation in Vietnam, the amount involved is believed to be much larger than what is in the banking system, due to the increasing use of foreign currency as the medium of exchange, with nonresidents in particular, and investment. Although falling from the high of 32% in 2001, the share of foreign currency deposits in broad money remained high at 23% in 2Q2006.
A de facto pegged currency 6 Vietnam officially maintains a managed floating exchange rate regime. Between 1999 and 2000, the SBV had maintained a +/-0.25% trading band on the dong against the US dollar. In 2000 and 2001, however, the dong was allowed to depreciate sharply in response to the depreciation of the currencies of the neighbouring countries as the GoV tried to protect Vietnam’s export competitiveness following the 25% devaluation of the dong in 1997-1998.
Figure 24: Dong vs USD
13000
14000
15000
16000
17000
1999 2000 2001 2002 2003 2004 2005 2006 2007
Source: Bloomberg
The SBV expects the dong to depreciate against the US dollar by 1-2% per year in 2006-2007. However, after the SBV widened the trading band to +/-0.5% on 2 January 2007, the dong fell below 16,000 against the US dollar by mid-February, from 16,066 at the beginning of the year, suggesting that a steady depreciation of the dong is no longer guaranteed, although we expect the annual change to be limited to 1-2%. While we expect Vietnam to remain on the path of liberalisation, broadly abiding by its WTO commitments, we think that the GoV will continue to prioritise the stability of the dong and its export competitiveness.
6 See Vietnam Primer published in August 2006 for FX history
Conflicting goal of SBV
Depreciation of the dong is
no longer guaranteed

12 April 2007 Strategy Vietnam Primer Part II
Deutsche Bank AG/Hong Kong Page 13
SOCB and SOE reform7 SOCBs dominate the banking sector The banking sector is dominated by five SOCBs, which account for more than 78% of the total bank assets, and are segmented by sectoral lines. In order of asset size, the five SOCBs are VBARD (Vietnam Bank for Agriculture and Rural Development), Vietcombank (Bank for Foreign Trade of Vietnam, trade financing bank), BIDV (Bank for Investment & Development of Vietnam, infrastructure bank), ICB (Industrial and Commercial Bank of Vietnam, industrial development bank), and MHB (Mekong Housing Bank, housing development bank). The rest of the banking system is relatively more market oriented. Semi-private joint stock banks (JSBs) operate on a limited local scale, servicing the domestic private sector. They are capitalised by SOCBs, SOEs (state-owned enterprises), private businesses and individuals, including foreign investors. Joint venture banks are 50% owned by a foreign bank and 50% by an SOCB. SOCBs maintained its dominant position in the sector, while the total assets of the banking system rose to 68% of GDP in 2005, from 10% in 1990.
Figure 25: Banking sector Figure 26: Market share of banks in lending
5 State-owned commercial banks
BIDV, Vietcombank, VBARD, ICB, MHBVietnam Bank for Social Policies
34 Joint stock commercial banks
4 Joint venture banks
28 Foreign bank branches
901 People’s credit fund
5 Finance companiesz
8 Leasing companies
Foreign,
8%JVBs, 2%
JSBs,12%
SOCBs,78%
Source: SBV, 2005 Source: Fitch
Reforming SOCBs Banking reform efforts initiated in 2001 centered on restructuring SOCBs, which included recapitalisation, NPL resolution and operational measures (such as improving credit risk management or undertaking of audit based on International Accounting Standards). Note that banks were traditionally not required to maintain a minimum capital adequacy ratio but rather just a minimum amount in Vietnam. For example, minimum capital requirement for SOCBs was VND1100-2200bn. Moreover, SOCBs suffered from the culture of policy directing. Based on the IAS (which includes not only the non-performing amount due but not paid, but also the whole loan balance), the NPL ratio stood as high as 10% (World Bank estimate), not 4% in 2004 as suggested by the Vietnamese Accounting Standards.
According to the Decision 457 issued in April 2005, all credit institutions, except foreign banks, are required to meet a minimum CAR (risk weighted) of 8% by 2008. This decision was followed by the PM Decision 112 (in 2006), which stipulates, among others, that the CAR should be no less than 8% and that the banking standards should be fully consistent with Basel I by 2010. The CAR of SOCBs hovered around 4-5% in 2005 and has yet to meet the minimum requirement. However, other banks are close to
7 Borrowed heavily from World Bank: Taking Stock (June 2006)
Banking sector is dominated
by SOCBs
Equitisation of SOCBs

12 April 2007 Strategy Vietnam Primer Part II
Page 14 Deutsche Bank AG/Hong Kong
meeting (if they have not already met it) the requirement, by raising capital through profit and convertible bond issuance and/or NPLs reduction (by rescheduling).
The financial reform plan also includes the equitization of all SOCBs. The process of equitisation has already begun for two SOCBs. Apart from Agribank (VBARD), which is scheduled to be equitised in 2008, all SOCBs are to be privatised in 2007. The state will continue to hold the 51% majority stake in state-run commercial banks while limiting foreign ownership to 30% and individual ownership to 10%.
Meanwhile, the SBV has submitted a proposal to amend the State Bank Law and the accompanying decree to increase its autonomy in areas of monetary policy and regulation of the banking sector and to free itself from the ownership role of SOCBs. Banking supervision will be enhanced by establishing an independent financial supervision board. The SBV has initiated an assessment of its supervision practices against international standards, the Basel Core Principles.
Figure 27: GDP by ownership
30
35
40
45
50
55
1995 1997 1999 2001 2003 20054
6
8
10
12
14
16
18
StateNon-StateForeign investment sector (rhs)
% %
Sources: CEIC, DB Global Markets Research
SOE reform gaining better traction With Doi Moi, the government embarked on a gradual transformation of ownership structures. This, however, did not lead to a sharp reduction in the state’s share of the economy. Instead, the state focused on the decentralisation of power to state-owned enterprises (SOEs). Meanwhile, the government allowed the entry of foreign invested enterprises (FIEs) into Vietnam, but typically in joint ventures with SOEs.
Figure 28: Completed SOE transformation 2001 2002 2003 2004 2005 2001-05Equitization 198 213 358 643 709 2121Sales/Assignments 59 39 48 44 70 260Liquidation/Bankruptcy 21 24 29 41 40 155Single Member LLCs 0 2 8 34 0 44Subtotal 278 278 443 762 820 2581Mergers 2 60 118 43 6 229Total 280 338 561 805 826 2810
Sources: National Steering Committee for Enterprise Reform and Development (NSCERD) and World Bank
The State pursued a gradual equitisation of non-strategic SOEs, focusing on small- and medium-sized enterprises. The SOE reform plan provided for equitization, liquidation, and merger of a significant number of smaller and medium-sized enterprises. By 2006, the number of SOEs fell to well below what it was in 2001 (5,771) and the amount of bank debt of restructured SOEs has risen, reducing risks to the state’s finances and the banking system.
SBV seeks to increase its
autonomy
Decentralisation of power to
SOEs

12 April 2007 Strategy Vietnam Primer Part II
Deutsche Bank AG/Hong Kong Page 15
Figure 29: Transformed SOEs 2001 2002 2003 2004 2005Avg charter capital (VND bn) 7.7 7.1 8.8 9.9 17.3Avg bank debt (VND bn) 5.4 5.4 8 9.9 21.7Avg number of employees 199 198 195 238 329Share of transformed SOEs withstate holding above 35% 26 27 45 55 57Share of transformed SOEs with noshares sold to outsiders 50 50 52 46 26
Sources: National Steering Committee for Enterprise Reform and Development (NSCERD) and World Bank
There are about 2,100 SOEs at present and about 1,500 to be equitised over the next five years. This suggests that close to 80 corporations and large firms will have to go public, while enterprises in 28 business activities will remain 100% state-owned.
In compliance with the latest decision of the prime minister, on 29 December 2006, 1 state-run group and 52 corporations will have to undergo equitisation in 2007-2010. The list of those groups and state-owned corporations consists of 1 economic conglomerate Vinatex Group, 6 state-run Corporations 91 (the largest SOEs), 6 state-run corporations of the Ministry of Industry, 14 state-run corporations of the Ministry of Construction, 10 state-owned corporations of the Ministry of Public Transport, 3 of the Ministry of Fisheries, 12 state-owned corporations of the Ministry of Agriculture and Rural Development and 1 state-owned corporation under the management of the Ministry of Health.
In 2007, GoV is targeting equitization of 550 SOEs. Those to be listed in HSTC include Vietnam Petroleum Transport Company (Vipco), Tan Tien Plastic Packaging Company (Tapack) and Dry Cell and Storage Battery Co (Pinaco). Under The Ministry of Transport and Telecommunications plans, Civil Engineering Construction Corporation’s eight subsidiaries (Cienco1 to Cienco 8), Thang Long construction Corporation, Vietnam Waterway Construction Corporation (Vinawaco) and Southern Waterborne Transport Corporation (Sowatco) will be equitized. While Saigon Beer-Alcohol-Beverage Corp (Sabeco) and Hanoi Beer-Alcohol-Beverage Corp (Habeco) are to be equitised as early as 2007, Vinatex Group and Vietnam Airlines are scheduled to be equitised in 2008. The other large state-owned corporations, including Vietnam National Chemical Corp (Vinachem), Vietnam National Cement Corp, Song Da Corp, Vietnam Machinery Installation Corp (Lilama) and others, are to be equitised in 2010.
The GoV established the State Capital Investment Corporation (SCIC) in July 2005 to take over and manage state capital. By taking over the ownership rights from ministries and provinces, it is expected to remove the conflict of interest between ownership and regulation. The SCIC reportedly plans to take ownership of VND23tn (USD1.43bn) in state holdings at 1,000 equitised companies by the end of 2007. SCIC has so far taken over state capital at 294 businesses in various sectors, ranging from energy, IT and telecom to health care and consumer goods, with a book value of VND2.96tn, calculated at the time of equitisation. The market value of its portfolio is estimated to be VND29.25tn (SD183mn). In particular, as of 25 January 2007, SCIC held a 7.37% stake in FPT (Corporation for Financing and Promoting Technologies), 91% in Pacific Airlines, 48% in Vinamilk (Vietnam Dairy Products Joint Stock Company), and 63% in Bao Minh, a non-life insurer.
Improvements in legal framework Vietnam has shown a marked improvement in its legal framework in promoting private sector activities. The 2005 Law on Investment was passed to create a level playing field for all investors, domestic and foreign, based on WTO principles. Meanwhile, the 2005 Enterprise Law sought to eliminate discrimination against non-state and foreign-invested
1500 of 2100 SOEs to be
equitized over the next five
years.
550 SOEs to be equitized in
2007
SCIC to remove the conflict
of interest between
ownership and regulation
Upgrading legal framework
based on WTO principles

12 April 2007 Strategy Vietnam Primer Part II
Page 16 Deutsche Bank AG/Hong Kong
enterprises, to reduce non-market interference measures inconsistent with WTO regulations and to encourage private participation in industries that are not specified in a “negative list”. The law is also expected to provide a basis for improvement in corporate governance and performance of enterprises, SOEs in particular.
We expect Vietnam’s WTO membership to keep Vietnam on the path of liberalisation and further institutional and legal reform. In particular, Vietnam is expected to implement TRIPS (intellectual property), TRIMS (investment measures), CVA (Customs Valuation Agreements), TBT (technical barriers to trade), SPS (sanitary and phytosanitary measures), ILP (import licensing provisions), A/D & C/V (antidumping) and ROO (rules of origin).

12 April 2007 Strategy Vietnam Primer Part II
Deutsche Bank AG/Hong Kong Page 17
Capital market Rapid increases in stock market capitalisation8 There are two stock market trading platforms in Vietnam, in Ho Chi Minh City (HSTC, which was set up in July 2000 with two stocks) and Hanoi (HaSTC, set up in March 2005). Although relatively small by regional standards, stock market capitalisation has risen rapidly over the past year due largely to new listings prompted by government initiatives to increase market capitalisation. The GoV not only directed joint-stock companies with dominant stakes held by the state and SOEs to list or auction their shares on the securities trading centers but also provided tax incentives to support development of the capital market.
Figure 30: Market capitalisation (% GDP)
GDP per capita USD
Malaysia
India
Thailand Phillipines
Indonesia Pakistan Sri Lanka
V ietnam
China
-
40
80
120
160
200
0 1,000 2,000 3,000 4,000 5,000 6,000
Mkt cap (% of GDP)
Source: Reuters Note: Vietnam only takes into account HSTC
As a result, the number of companies listed in the HSTC rose to 106 in end-2006 from 38 in end-2005, leading to a market capitalisation of VND161.4tn (USD9.7bn) up from VND8.9tn (USD565m). During the same period, the number of listed stocks in the HaSTC rose to 87 from 6, with the market capitalisation rising to VN70tn (USD4.2bn) from VN2.1tn (USD125m). By end-2006, the market capitalisation of the two stock markets reached USD13.9bn, 25% of Vietnam’s GDP in 2006.
On the demand front, the government (via Decision 238 in September 2005) increased the ceiling on foreign shareholdings in listed companies, from 30% to 49%, with the ceiling on bank ownership maintained at 30%. There are plans to further relax constraints on foreign ownership in some sectors. By some estimates, foreign investors currently own around 20-30% of the shares listed in the stock market. On the domestic side, public interest in the stock market increased as real estate activity slowed down.
Meanwhile, Vietnam has a much more active, bigger informal (unregulated) market, which is not burdened by strict disclosure requirements. By some estimates, the information market is about four to five times the size of the trading centres. Reportedly, there are 6,532 companies trading in the informal market, mostly solid performers and
8 See Vietnam Primer published in August 2006 for regulations
Rapid development of
capital market

12 April 2007 Strategy Vietnam Primer Part II
Page 18 Deutsche Bank AG/Hong Kong
considered more attractive than the listed companies, as the premium is usually low at the early stage of the company’s privatisation.
The Securities Law which took effect on 1 January 2007 seeks to bring many of the companies whose shares are being informally traded under the regulation of the State Securities Commission. Under the law, a company with shares issued to the public, with shares listed on HSTC, or with shares owned by 100 or more investors and the charter capital over VND10bn would be considered “publicly held”. This gives the SSC the authority to regulate. Note that the SSC can regulate the issuer, intermediaries and investors as long as the issuance is a public offering, the securities are publicly traded, and the issuer is a publicly held company. All public companies would be subject to formal standards of disclosure and governance.
The new securities law also stipulated a higher minimum registered capital of VND80bn and VND10bn for the HSTC and HaSTC, respectively, up from VND5bn for both. Meanwhile, the capital requirement for securities companies was raised: to VND25bn from VND2bn for brokerage; to VND100bn from VND12bn for self-trading; and to VND165bn from VND22bn for issue guarantee.
If a securities company wants to do business in all of the five fields (depository, brokerage, investment consultancy, issue guarantee and self-trading), the minimum capital requirement now stands at VND200bn, up from VND43bn previously. In addition, the securities companies will not be allowed to operate in stock investment list management that will be under the charge of fund management companies. Listed firms and securities companies are given a period of time (slated for one or two years) to chalk out a capital-raising roadmap. After this period, if the firms cannot meet the new requirements, they will be removed from HSTC or forced to move to HaSTC.
The law also stipulates that brokers and intermediaries dealing in securities are to be licensed by the SSC. Investors are now allowed only one account in a securities company. The limitation aims to prevent fake transactions to influence share prices in the stock market and cause losses for other investors. The law also laid the ground for the transformation of the Ho Chi Minh City Stock Trading Center into a “privately” owned entity.
Figure 31: VNINDEX
0
200
400
600
800
1000
1200
2001 2002 2003 2004 2005 2006 2007
Source: Reuters
Reigning in the informal
market
Upgrading the securities law
12 April 2007 Strategy Vietnam Primer Part II
Deutsche Bank AG/Hong Kong Page 19
Regulatory risks In response to a sharp rise in stock markets, the Ministry of Finance and State Securities Committee have decided on the following: 1) Temporarily retain the foreign holding cap in listed companies on the stock market. The cap is now still 49% of the shares of a listed company and 30% of the shares of a listed bank. 2) Curb securities investment lending, repo transactions and share mortgage loans and supervise foreign portfolio investment and apply administrative measures on cash withdrawal out of Vietnam by foreign investors. 3) Inspect securities companies facing investor complaints and impose administrative penalties if violations are found. 4) Accelerate the disclosure of information by listed firms on their finances; 5) Re-registration with the SSC by foreign funds, even those licensed by the Ministry of Trade. 6) The SSC to provide investors with analysis and assessment of the stock market, including information on financial indicators.
The prime minister also instructed the Ministry of Finance and SSC to closely work with the SBV and authorized agencies to further strengthen the supervision of operations of the stock market, ensuring compliance with the Securities Law by public companies, foreign investment funds, and institutions and individuals dealing in the stock market. They also called to supervise brokering, investment consulting, and business appraisal activities to boost the high quality of these services for investors and apply suitable management tools to ensure the management of foreign investment capital flows in the stock market in the relationship between the stock market and monetary market, which may calls for revision of the guiding decrees on implementing the Ordinance on FX Administration. The SBV must also enhance the supervision of banks in trading shares, investing and contributing capital as well as transferring shares of joint stock banks aimed at ensuring transparency and security for the banking system. Meanwhile, the Ministry of Finance is mandated to submit to the GoV a plan for establishing one working team to supervise stock market operations.
Bond market Vietnam’s bond market remains relatively underdeveloped and illiquid. Most of bonds are government bonds (85%) and limited corporate bond market due to the absence of rating agencies. As at end-2006, there were over 450 bonds outstanding in the domestic market, with a market value of about VND130tn, 13.3% of GDP. Other papers include municipal bonds (HCMC and Hanoi). DAF bonds, education and infrastructure bonds, SOCB recapitalisation bonds, BIDV bonds, and the Vietcombank convertible bonds.9 In October 2005, the government issued its first international bond since the Brady issues in the 1990s, amounting to USD750mn, with a yield of 7.125%, which was lower than Indonesian and Philippines bonds. Meanwhile, Standard & Poor’s raised Vietnam’s credit rating outlook from BB- positive to BB stable in September 2006.
9 Municipal bonds. Ho Chi Minh City and Hanoi are permitted to issue bonds equivalent to 100% of their annual investment budget (for other cities, the applicable limit is 30%), subject to MOF approval. HCMC has so far issued bonds in the amount of VND2tn (0.2% of GDP), and is to issue another VND2tn in 2005; while Hanoi has not yet issue any municipal bonds, it is expected to issue bonds on the order of VND1.5tn in 2005. DAF bonds The DAF (now VDB) has become one of the largest financial institutions in Vietnam, and has outstanding loans equivalent to about 12 percent of GDP, half of which are financed through ODA. Education and infrastructure bonds The National Assembly has authorized issuance of a total of VND110tn (about USD7 billion, or 15.6% of 2004 GDP) of education and infrastructure bonds for the period 2005–2010. SOCB recapitalization bonds In 2001, as a part of the government’s restructuring program for SOCBs, non-performing loans worth VND23tn (5.2% of GDP as of 2000) were identified for resolution. Under this program, the four largest SOCBs received capital injections totaling VND10.9tn (2.5% of 2000 GDP), of which 9.7tn was provided in the form of recapitalization bonds and the remainder in cash. (IMF)
Strengthening prudential
regulations
Bond market dominated by
government due to the
absence of rating agencies

12 April 2007 Strategy Vietnam Primer Part II
Page 20 Deutsche Bank AG/Hong Kong
Figure 32: Size of debt market
0
20
40
60
80
100
Mal
aysi
a
Thai
land
Chi
na
Phi
lippi
nes
Indo
nesi
a
Vie
tnam
Pak
ista
n
% of GDP
Source: ADB
Although improving, the market remains relatively illiquid as investors hold them until maturity. Long-term (10-15-year) bonds (9.06%), which make up about 40% of the total, are typically purchased by insurance companies and held to maturity, while 60% of 2-3-5-year bonds (mostly 5yr; 7.7%) are held by SOCBs. Reportedly, GoV is expected to adopt various administrative and structural measures (including issuing government bonds with the same maturity date although auctioned at separately) to increase liquidity and depth of its bond market.

12 April 2007 Strategy Vietnam Primer Part II
Deutsche Bank AG/Hong Kong Page 21
Sectoral analysis Vietnam’s 2006 economic growth of 8.2%yoy was led by the manufacturing sector. Meanwhile, the service sector expanded 8.3%, led by growth in the hotel and restaurant sector, while the agricultural sector remained a laggard, growing by only 3.4% yoy in 2006.
Figure 33: Real GDP growth by sector Real GDP VNDbn %yoy % of GDP
2005 2006* 2005 2006*
Agriculture, forestry, fishery 76,874 79,488 3.4 19.6 18.7
Agriculture 64,098 65,918 2.8 16.3 15.5
Fishery 10,141 10,905 7.5 2.6 2.6
Forestry 2,635 2,665 1.1 0.7 0.6 Industry & construction 157,846 174,210 10.4 40.2 41.0
Manufacturing 89,514 100,593 12.4 22.8 23.7
Construction 34,428 38,232 11.0 8.8 9.0
Mining & quarrying 22,663 22,845 0.8 5.8 5.4
Electricity, water supply 11,241 12,540 11.6 2.9 2.9 Services 158,276 171,390 8.3 40.3 40.3
Trade 63,957 69,423 8.5 16.3 16.3
Transport, communication, tourism
15,318 16,871 10.1 3.9 4.0
Real estate business 14,809 15,244 2.9 3.8 3.6
Hotel, restaurant 13,466 15,139 12.4 3.4 3.6
Education & training 13,126 14,231 8.4 3.3 3.3
State management 10,477 11,270 7.6 2.7 2.7
Finance, banking, insurance 8,197 8,867 8.2 2.1 2.1
Other 18,926 20,345 7.5 4.8 4.8 Total 392,996 425,088 8.2
Source: GSO Note: * Provisional
Agriculture
Growth in the agriculture sector slowed to 3.4%yoy in 2006 from 4.0% in 2005, adversely affected by prolonged cold weather in the north, floods in the central area and the Mekong delta, and avian flu.
Rice Vietnam is the world’s fifth largest producer of rice. The Mekong Delta is Vietnam’s largest rice granary, responsible for over 50% of the national output and over 90% of rice exports (in volume). In 2006, rice production remained largely unchanged from the previous year, at 35.8mn tons, while rice exports fell to 4.7mn tons from 5.2mn tons in 2005. In value terms, however, rice exports stood stable at USD1.3bn as prices rose due to subdued supply and strong demand.
Coffee Vietnam is the second largest producer and exporter of coffee in the world, after Brazil, with a market share of 12% in terms of production. Vietnam has more than 500,000ha for coffee production, 450,000ha of which are for Robusta and the remainder for Arabica, with the Mekong Delta and the Central Coast area as the main place of production in the last ten years. Coffee is one of the Vietnam’s top ten export items, with the US and EU as the top two destinations. In 2006, Vietnam exported 897,000 tons of coffee valued at USD1.1bn.
Fifth largest producer of rice
Coffee is one of the
Vietnam’s top ten export
items

12 April 2007 Strategy Vietnam Primer Part II
Page 22 Deutsche Bank AG/Hong Kong
Upon accession to the WTO, Vietnam has pledged to eliminate export subsidies for agricultural products while maintaining 10% subsidies for domestic use. In particular, there will be no more state awards for coffee exports (several dollars for each ton). Moreover, average tariff for agricultural products will be cut to 20.9% from 23.5%, although maintaining the import quota for certain agricultural products such as sugar, eggs, cigarettes and salt.
The Ministry of Agriculture and Rural Development (MARD) drafted the “Vietnamese Rice Development Strategy for the 21st Century” aimed at increasing rice-cultivating areas in the Mekong and Red River Deltas. The strategy includes researching the structure of agricultural products, evaluating the competitive edge of each agricultural product, and mapping out strategies and measures for each period of development. According to the MARD, the agricultural sector has been allocated VND2.1tn (0.7% of the total budget) from the State Budget in 2007. VND1.2tn is for the construction of irrigation plants with VND298bn and VND210bn allocated for agriculture and forestry development, respectively. While the GoV encourages investments in agriculture and food processing, investments in dairy products, production of vegetable oil and cane sugar is subject to the condition that it includes investment in raw material sources. At end-2006, the agriculture sector had attracted 53 FDI projects with a combined registered capital of USD7.5bn.
Market capitalisation The agriculture and food-processing sector commanded 19% (USD2.5bn) of market capitalisation by end-January 2007, compared to 55% (USD947mn) in 1H06. The largest listed players in the industry by market cap were Vietnam Dairy Products (USD1.73bn) and Kinh Do Corp (USD411mn) at end-January 2007.
Fisheries
Vietnam has a relatively favourable environment to support the sector, with its long coastline, a favourable climate and water environment and a large number of experienced workers (more than 4mn). Seafood was ranked fourth among the nine staple items exported from Vietnam in 2006. While the fisheries sector expanded 7.5% yoy in 2006, seafood exports rose 23% yoy to USD3.4bn in 2006, surpassing the Ministry of Fisheries’ forecast of USD2.8bn. The strong growth was due largely to higher global prices for shrimp/fish and increased demand for white fish in European countries, as the latter faced fishing restrictions. The GoV plans to achieve an export target of USD3.5bn in 2007 and USD4.5bn by 2010.
The Ministry of Fisheries is targeting 2.0mn tons from fishing and 1.8mn tons from aquaculture, in 2007. Aquaculture accounted for 50% of the fisheries sector’s total output with 3.7mn tons in 2006. The ministry plans to invest USD222.5mn in 2007-10 in aquatic product processing and trading and invest USD62.5mn to build an information system by 2015 to help fishermen from coastal areas receive pertinent information, including weather forecasts and rescue effort details.
Market capitalisation The fisheries sector contributed to 1% (USD148mn) market capitalisation at end-Jan 07 compared to 2% (USD34mn) as of 1H06. The largest listed companies in the sector were An Giang Fisheries Import Export Co (market capitalisation of USD67mn) and Sao Ta Foods Joint Stock Co (mkt cap USD24mn) at 31 Jan 07.
Aquaculture accounted for
50% of the fisheries sector’s
total output
12 April 2007 Strategy Vietnam Primer Part II
Deutsche Bank AG/Hong Kong Page 23
Mining
The mining sector, which accounts for 5.4% of GDP, rose 0.8%yoy in 2006, down from 1.1% in 2005, due to regulatory constraints on FDI in the sector, protection for natural resources, shortage of equipment, and higher costs (energy and labour). According to the Department of Geology and Minerals of Vietnam, the main identified mineral resources are coal, natural gas, and crude oil. Under the master plan, the GoV has allocated about VND64bn (compared to the total of VND2.7tn) for exploring lead and zinc mines. The GoV expects demand for lead and zinc to rise to 45,000 tons and 165,000 tons in 2005-2010.
Coal Coal dominates Vietnam’s mining industry. Most of the coal produced in Vietnam is anthracite, mined mainly in the province of Quang Ninh in north eastern Vietnam. According to the Vietnam Coal and Mineral Group, Vietnam had 220bn tons of anthracite coal, 78m tons of semi-anthracite coal, 38m tons of coking coal, 96m tons of thermal coal and 306m tons of lignite as of 2006. Coal production increased 18.3%yoy to 37mn tons in 2006 due to an improved mining technology and higher coal prices amid increased energy demand. Meanwhile, coal exports grew 65.6%yoy in 2006 to 29.7m tons. According to the Ministry of Industry, coal mining is expected to increase 9.3% yoy with annual production of 42mn tons by 2010. The key coal producer is the Vietnam National Coal and Mineral Industries Group (Vinacomin) and is targeting production of over 37mn metric tons of coal in 2007. Vinacomin has approximately 30 subsidiaries operating in both strip mines and underground mines, 15 of which are expected to be equitised by 2010, with the process beginning in 2007.
The GoV estimates a requirement of 10.2mn metric tons of coal per annum to meet the projected power demand of 20,000MW by 2010. Vinacomin is constructing several large thermo-electronic power plants, with a combined capacity of 1,100-1,400MW. In addition, Vinacoal, the country largest coal producer is seeking a foreign investment of USD750mn to construct seven coal-fired plants with a total capacity of 1,232MW by 2010.
Vietnam is the largest anthracite coal exporter globally, with 13% of world market share as of 2005. Under the coal export plan for the year 2006-2010, Vietnam is estimated to reduce the coal export volume to 11mn tons in 2007, compared to 18mn tons in 2005. Moreover, during 2006, a new export tax of 10% on coal for 2007 was introduced.
Gas Vietnam extracted about 6.4bn cubic meters (up 1.2% yoy) of natural gas and 3,43,000 tons of liquidised gas in 2006. As per the Socioeconomic Development Plan (2006-2010), natural gas extraction is expected to reach 13.2bn cubic meters by 2010. The much-expected opening of the gasoline retail industry is not covered by the WTO agreements. State-owned enterprises will keep their monopoly in importing and distributing.
Crude Oil Vietnam extracted about 16.6mn tons of oil in 2006, down 10.3% from 18.5mn tons in 2005 and lower than the GoV’s target of 17.3mn tons. Foreign investment is expected to increase annual crude oil extraction to 22mn tons and gas extracted to 13.2bn cubic meters by 2010.
Crude oil is Vietnam's largest foreign exchange earner and the country is Southeast Asia's third largest crude producer. In 2006, crude oil contributed 21% of Vietnam’s total export turnover at USD8.3bn, the same as in 2005. To ensure sufficient supply of crude
The largest anthracite coal
exporter globally
Oil is Vietnam's largest
foreign exchange earner

12 April 2007 Strategy Vietnam Primer Part II
Page 24 Deutsche Bank AG/Hong Kong
for domestic industries, the Ministry of Planning and Investment proposed to lower crude oil exports, to 15.6mn tons by 2010. Meanwhile, to reduce reliance on petroleum imports, the GoV is investing USD2.5bn in constructing its first oil refinery, Dung Quat, in the central Quang Ngai Province with annual processing capacity of 6.5 million tons. The project is scheduled to come onstream in early 2009, meeting about 40% of the domestic demand for petroleum products. A further two oil refineries are scheduled to become productive in 2009. The GoV expects Vietnam to become a net importer of crude oil by 2015, when all three refineries become operational and demand for crude oil rises.
Vietnam’s oil sector is dominated by the state-owned Vietnam oil and gas corporation (Petrovietnam). Established in 1975, Petrovietnam, along with its subsidiaries, covers operations of oil and gas exploration, production, storage, transportation and distribution services in Vietnam. Petrovietnam transported, processed, and delivered 5.6bn cubic meter of dry gas, 107,000 tons of condensate and 338,000 tons of liquid petroleum gas, reporting a revenue of USD906mn in 2006, 20% yoy. Petrovietnam plans to extract 25-30mn tons per year until 2010, of which inland crude oil extraction would account for 60%, natural gas 33% and the rest is to be extracted abroad. Chevron (USA) and Petronas (Malaysia) are active partners of Petrovietnam, operating petroleum contracts in Vietnam. According to management, Petrovietnam is likely to sign two oil exploration contracts in 2007, one in Nigeria and other in Cuba. However, the GoV has plans to privatise this state-owned enterprise by 2008.
Market capitalisation There are three mining companies listed on the HSTC with a combined market capitalisation of USD49m as of 31 Jan 2007, constituting less than 0.5% of the total market cap. In particular, in December 2005, Petrovietnam’s newly equitised subsidiary Petrovietnam Drilling and Well Services (PVD) was listed on the HCSTC with Petrovietnam retaining a 51% stake.
Manufacturing
The manufacturing sector led the industry sector growth, rising 12.4% yoy in 2006, constituting about 23.7% of GDP, up from 22.8% in 2005. According to GSO estimate, IP was 10.2% in 2006, compared to 10.6% in 2005.
Figure 34: Key manufacturing industry subsector growth 2005
-
40,000
80,000
120,000
Food &B
everages
Minerals
Electrical
andelectronic
Chem
icals
Textiles
Rubber andplastic
Leather
Machinery
0
5
10
1520
25
30
351994 price
Growth
VND bn % yoy
Sources: GSO, DB Global Markets Research
On becoming a member of the WTO, industrial subsidies will be scrapped within five years of the accession. Moreover, the import duties would be reduced to 13.6% within

12 April 2007 Strategy Vietnam Primer Part II
Deutsche Bank AG/Hong Kong Page 25
five to seven years (2007-2014) from the date of accession to the WTO from the current average of 17.6%.
Market capitalisation The manufacturing and engineering sector commanded 12% (USD1,9bn) of HSTC market capitalisation at end-January 2007, down from the 24% (USD414mn) at end-1H06. The largest players were Cable And Telecommunications Materials Co (with market capitalisation of USD522mn) and Refrigeration Electrical Engineering (market cap of USD451mn) at end-January 2007.
Steel Steel production increased 4.7% yoy to 3.8mn tons in 2006, the only ASEAN country to record growth in the year. According to the Steel Association, domestic steel manufacturers met 100% of the domestic demand for construction steel, pipe steel and galvanised steel but only 30% of the domestic demand for steel plate. According to the SEDP 2006-2010, the GoV expects the steel industry to grow 7.5-8.0% yoy to reach an annual capacity of 10.2mn tons by 2010. POSCO, a Korean steel maker, plans to set up a cold-rolled steel plant in Vietnam (in October 2007, to be commissioned by end- 2009.
Due to its dependence on imports for steel ingots (over 70% imported), the steel industry faced a loss of VND70bn (USD4.4mn) in 2006. The Steel Association submitted a proposal to the Ministry of Trade to reduce imports of steel ingot to 50% of demand in 2007, down from 70% in 2005 and 2006.
Market capitalisation The VND100bn Vietnam-Italy Steel Joint Stock Company is the only steel company listed on the HCSTC, with a market capitalisation of USD27.3mn at end-January 2007. It was listed on 25 December 2006 at VND45,000 per share. Vietnam Steel Corporation (VSC) is the largest steel maker in Vietnam with a 40% market share but is not listed and remains a 100% state-owned company.
Cement According to Vietnam Economic Times, the Vietnam National Cement Association (VNCA) expects annual demand for cement to reach 50mn tons by 2010, a 10.5-11.5% yoy growth over the next five years. According to the Ministry of Construction, Vietnam requires USD3.4bn worth of cement between now and 2010. The industry expects to produce 60mn tons of cement by 2010, up from the 31mn tons produced in 2006. Cement production in 2006 grew 11.2%yoy in 2006, up from 10% in 2005, supported by infrastructure projects and strong economic growth.
Japanese manufacturer Bim Son Cement Company and Ishikawajima-Harima Heavy Industries Co. has entered into a Joint-Venture to set up a manufacturing facility (annual production capacity 2mn tons), scheduled to be commissioned by end-2008 in the central Thanh Hoa province.
Market capitalisation To date, there is no cement company listed on the HCSTC. Vietnam National Cement Corporation (VNCC), a 100% state-owned company, is the largest cement manufacturer in Vietnam, with a market share of 46%.
Chemicals Chemical production grew 7.9% in 2006, compared to 6.9% in 2005. The chemical industry in Vietnam is highly fragmented with 2,070 individual players. The state sector owns 4% of the companies, foreign investors own 10% and the remaining 86% is owned by Vietnamese domiciles. The state sector contributed to 65% of the total industry output, in value.
Building its steel industry
Strong growth in cement
production
A highly fragmented sector

12 April 2007 Strategy Vietnam Primer Part II
Page 26 Deutsche Bank AG/Hong Kong
According to the Ministry of Industry, the chemicals industry targets a growth of 14% per annum by 2010 in order to satisfy 100% domestic demand for phosphorous and fertilizers and 70% of domestic demand for urea.
Market capitalisation To date, there are no chemical manufacturing companies listed on the HSTC.
Plastics Vietnam’s plastic industry is considered to be in its infancy compared to Malaysia, Singapore, Thailand and China’s and is characterised by under-capitalisation and lack of technology. The output per capita was 25kg per person in 2005. Countries like Singapore and Malaysia had far exceeded this number in 1999 with 94kg per person and 49kg per person, respectively. However, the industry has been growing at 30% p.a. in recent years and the Vietnam Plastics Association (VPA) expects Vietnam’s Plastics output to reach 4.5m tons by 2010 from 1.7m tons in 2006.
According to the Vietnam Plastics Association, the sector expects to earn USD580m (21.3% yoy) from exports in 2007. The Association also expects Vietnam’s Plastics output to reach 3.8mn tons by 2010 from 1.7mn tons in 2006.
The Vietnam South Plastics Association (VSPA) and the Vietnam Plastics Association (VPA), both 100% state-owned, are the two key players in the plastics sub-sector. VPA commanded a 20% share of the total plastics market in Vietnam as of 2006. Vietnam is home to 1,400 plastic manufacturers with c. 80% of them operating in Ho Chi Minh City.
Market capitalisation There are four plastic companies listed on the HCSTC with a combined market cap of US$289.2mn as of 31 Jan 07 constituting c. 2% of the total market cap. Binh Minh Plastics Joint Stock Company is the largest with a market cap of US$60.4m as at that date.
Textile and Garments In 2006, textile and garment production rose 9.9% yoy in 2006, down from 18.2% yoy in 2005. Textile and garment exports rose 22% yoy to USD5.8bn, representing 14.7% of the total exports – second most important export item, after oil.
According to the SEDP 2006-2010, the GoV is targeting production of 1.1bn square meters of fabric and 1.5bn pieces of garments, with an annual export growth of 15%, or USD10bn. The sector continued to attract foreign investment. Teachang corporation of Korea signed a contract with Thein Nam to contribute 60% of the capital in building a denim cloth factory in Vietnam. According to Vinatex, the factory is expected to operate by 2008, with an output capacity of 30mn meters per year. Meanwhile, Taiwan’s Formosa Group injected USD500mn in the garment factory in the Nhon Trach IP and is planning to invest an additional USD400mn into expanding its production capacity. Malaysia’s Parmatex Berhad plans to invest USD100mn in a garment factory in the Chu Lai Economic Zone. In Feb 2007, three projects were launched in the Pho Noi B Textile and Garment industrial Zone. The Pho Noi Knitting centre, The Ha Noi Thread Factory and the Waste Water Treatment centre were newly launched by Vietnam textile and garment group (Vinatex) with a combined capital of VND282bn, aimed at addressing the problem of inadequate infrastructure and water treatment systems. Vinatex management expects these projects to meet the growing demand in the export market. Vinatex is targeting a revenue of USD900mn in 2007 (17% yoy) and an export revenue of USD1.5bn, an 18% yoy increase.
Infant industry
Textile and garments are
Vietnam’s second most
important export item

12 April 2007 Strategy Vietnam Primer Part II
Deutsche Bank AG/Hong Kong Page 27
With accession to the WTO and the expiration of the Multi Fibre Agreement (MFA) in January 2005, this sector is expected to further strengthen, according to the GoV, as Vietnam is no longer bound by textile and apparel quotas. While garments and textiles will have some of the largest tax reductions, its WTO membership requires the GoV to cut government subsidies. Moreover, Vietnam will face increased competition as foreign-made textiles will come into the domestic market.
Market capitalisation The textile and garment industries remained largely unlisted, constituting only 0.5% of the total HSTC market capitalisation at end-January 2007. Saigon Garmext was the largest, with a market capitalisation of USD7.9mn. The Ministry of Trade plans to equitise all textile and apparel units under Vinatex by 2008. Currently, 15 of 23 are in the process of equitisation. Vinatex’s exports amounted to USD1.6bn, representing 28% of the total textile exports in 2006.
Services
In 2006, Vietnam’s service sector grew 8.2% yoy, after expanding 8.5% in 2005, led by the hotel/restaurant sector. The service sector’s share of GDP stood at 40.3%, employing about 25% of the workforce, with wholesale and retail trade constituting 40.5% of service activities. The GoV is targeting a service sector growth of 7.7-8.2%, with 42% of the investments used in supporting the sector in 2006-2010.
Vietnam has made WTO commitments to open up a wide range of services. In a few cases, like accountancy services, there is no limit on foreign ownership (100%) from the first year. Moreover, the distribution of products such as steel and cement will be open to foreign firms within three years of accession, while in express courier services foreign investors are allowed to contribute up to 51% (to be raised to 100% by 2012) in joint ventures with Vietnamese partners. In the telecommunication sector, the maximum limit could be 49%-65% depending on the services provided. Foreign investors are allowed to contribute up to 51% (to be raised to 65% by 2010) in Joint Ventures with Vietnamese partners in the IT and Telecom sectors. On the other hand, Vietnam will not open the distribution service sector for retail sales to foreign companies for goods such as gasoline, pharmaceuticals, magazines, books, DVDs, tobacco, rice, sugar and precious metals; nor will it open the publishing and printing sector.
Market capitalisation The services sector remains largely unlisted. General Forwarding and Agency Corp (GMD) with a market capitalisation of USD392m as of Jan 2007 is the only company listed on HCSTC in the transportation sector. The finance sector commanded 9% (USD1.3bn) of market capitalisation of HCSTC, although up from 0% at end-1H06. Sacombank is the only company listed in the finance sector as of 31 Jan 07. Hoa Binh Construction and Real Estate Corporation (HBC.HM) is the only listed real estate company, with a market capitalisation of USD31.2 as of Jan 2007.
The service sector’s share of
GDP stood at 40.3%,
employing about 25% of the
workforce
Largely unlisted

12 April 2007 Strategy Vietnam Primer Part II
Page 28 Deutsche Bank AG/Hong Kong
Figure 35: Key service subsector growth (2006)
0
20000
40000
60000
80000
Trad
e, R
epai
r
Hot
el &
Res
taur
ant
Tran
spor
t,C
omm
unic
atio
n&
Tou
rism
Fina
ncia
lIn
term
edia
tion
Rea
l Est
ate
&R
entin
gB
usin
ess
Act
ivity
Cul
ture
0
4
8
12
16
1994 priceGrowth
VND bn % yoy
Sources: CEIC, DB Global Markets Research
Retail Trade Wholesale and retail trade activities grew 8.6% yoy in 2006, compared to the 8.4% growth in 2005. While Vietnam’s retail sector is dominated by small businesses (mom and pop stores), several global retailers are reportedly trying to make their way into Vietnam. Vietnam’s first super market chain (Saigon Coop Mart) opened in Ho Chi Minh City in 1994, increasing its operation to 90 branches by 2005. Sales turnover at these stores expanded at 20% yoy, accounting for about 10% of retail sales in 2006. According to the Ministry of Planning and Investments, Wal-Mart (USA), Carrefour (France), and Tesco (UK) are expected to make an entry into the retail sector in Vietnam in 2007, with Asian giants like Dairy Farm (Hong Kong) and South Asia Investment (Singapore) following suite in 2008.
Financial Sector Financial activities rose 8.2% yoy in 2006, down from 9.4% in 2005. Apart from the banking sector reform (see SOCB Reform), the financial sector continued to see an upgrade, in terms of skill and technology. Last year marked the introduction of new technology to the banking services, especially the use of payment cards (ATM Cards). According to management, Sacombank invested USD4mn in upgrading its core banking system with many banks investing in new technology. On the regulatory front, the GoV relaxed the foreign shareholding limit in joint-stock commercial banks, increasing it to 20% in 2007 from 10% in 2006 and allowing foreign credit organisations to open wholly foreign-owned banks in Vietnam from April 2007; on the other hand, Vietnam will allow the establishment of 100% foreign-owned brokerage and branches within five years of WTO accession. Foreign banks are now also allowed to offer credit card services and deposits in foreign currencies.
Real estate With low interest rates and an underdeveloped stock market, activity in the real estate sector experienced rapid growth in 2000-2003. The market was also supported by rapid economic growth and further urbanisation, as well as the implementation of administrative measures (e.g. tax cuts on transfer of land-use) and a rapid rise in infrastructure investment. However, the real estate market peaked in 2003 and began to stagnate in 2004 as alternative investment opportunities emerged: the stock market’s upward movement, in particular, and the government’s decision to raise the cap on foreign investor share to 49% from 30%. Note, however, that different segments of the real estate market recorded different performances. While prices of moderate-grade houses, apartments, small building plots and scattered houses stagnated (in fact, prices fell 20-30%), prices for high-grade property and offices for lease continued to increase.
Dominated by small
businesses
Peaked in 2003, but high-end
market still growing

12 April 2007 Strategy Vietnam Primer Part II
Deutsche Bank AG/Hong Kong Page 29
Tourism According to the Vietnam National Administration of Tourism (VNAT), the country is expected to attract 4.4mn foreign visitors in 2007, up from 3.6mn in 2006, with Australia, China, Korea, Japan, Taiwan and the US remaining the top places of origin. Vietnam invested USD38.8mn in tourism development in 2006 and VNAT signed eight additional tourism cooperation agreements with foreign partners, bringing the total deals to 37.
Transport The transport sector rose 3.9% yoy to GDP in 2006, up from 3.8% in 2005. The demand for passenger transport rose 10% p.a. in 1999-2005. Road remained the dominant mode of transport, with a market share of 65% and 85% for goods and passengers, respectively. The waterway share of goods transport stood at 22% in 2005, down slightly from 26% in 1999. The sector is dominated by SOEs.
Roadways The road network in Vietnam is 210,000km, 17,300 km of which are national roads; 17,450km, provincial roads; 36,400 km, district roads; 7,000km, urban roads; and the remaining 131,500km, rural roads. The GoV proposed a road infrastructure investment of USD23.5bn for the 2002-2010 period and USD34.4bn for 2011-2020.
The Vietnam Expressway Corporation (VEC), SOE, was established in October 2004 to develop Vietnam’s road expressway network. The VEC develops expressway network plans and manages active expressway projects. In 2005, the VEC issued government-guaranteed bonds via the HSTC to raise capital for the construction of a new highway in the north. There are 13 expressway routes, running a total length of 1,354km, planned for construction and expected to be finished by 2015, which the Ministry of Transport (MoT) expects to cost USD6.5bn.
Road transport services are provided by TRANSERCO, another SOE, and private operators. Vietnam has recently made a commitment to the WTO that foreign investor participation in passenger and freight transport will not exceed 49% of the capital.
Ports Vietnam has over 80 sea ports, totaling 22,000m of wharfs with 2.2mn sq meters of quays and 1mn sq meters of docks. The large ports in Vietnam have traditionally been developed by the government through Vietnam Maritime Administration (Vinamarine) and turned over to Vietnam National Shipping Lines (Vinalines) for operation. Both Vinamarines and Vinalines remain SOEs, while 15 Vinalines subsidiaries, including Vietnam Ocean Shipping Agency (VOSA) became SOEs by 1H06. In 1H06, Vinalines invested a total of VND729bn, VND458bn of which was used for fleet expansion while VND217bn was used for infrastructure and equipment. The government plans to rehabilitate and construct 114 ports in 8 port complexes by 2010 and proposed an investment of USD1.6bn in 2002-2010 and USD4.4bn in 2011-2020 for ports and inland waterways.
Railways Railways are operated by Vietnam Railways Corporation (SOE). Vietnam’s rail network consists of seven lines totaling 2,632km and is the least utilised mode of transport in Vietnam due to its high costs, low operating speeds and poor signaling systems. As a result, the market share of railways (goods and passenger transport) fell to 3.7% in 2005 from 5% in 1999. Vietnam Railways Corporation has budgeted USD38.9m for 2007 to upgrade its rail infrastructure. The GoV has proposed an investment of USD17.2bn in 2002-2010 and USD36.7bn in 2011-2020 for the improvement and upgrading of rail infrastructure.
Expected to attract 4.4mn
foreign visitors in 2007
Road remains the dominant
mode of transport
The government plans to
rehabilitate and construct
114 ports in 8 port
complexes by 2010
Least utilised mode of
transport

12 April 2007 Strategy Vietnam Primer Part II
Page 30 Deutsche Bank AG/Hong Kong
Current projects include the upgrading of the Hanoi-Hai Phong rail line (USD380mn), the Hanoi urban rail system (USD710mn), and the construction of an elevated railway system across Ho Chi Minh City (USD990mn). These are funded by Japan's ODA and the GoV. In January 2007 the Vietnam Railways Corporation received an ADB loan, including EUR32mn from the French government and USD12mn from the GoV, to cover 38% of the USD160mn required to upgrade the Yen Vien–Lao Cai railway, which is expected to be finished by 2012.
Aviation The Civil Aviation Administration of Vietnam (CAAV) handles civil aviation and is under direct authority of the government. Vietnam has 21 airports, of which three are international. The Ministry of Transport plans to upgrade and expand the country’s airport networks to meet growing demand. The GoV plans to develop six major international airports and upgrade the quality of airport services. It has proposed to invest USD1.1bn in 2002-2010 and USD2.3bn in 2011-2020 for civil aviation. Construction of a new international terminal in Tan son Nhat is being built with a financial aid of USD212m from Japan Bank for International Co-operation (JBIC). The new Long Thanh international airport is intended to be operational in 2011.
Vietnam Airlines holds more than 80% of the local aviation transport market. Pacific Airlines has 15% and, as per management guidance, plans to become a discount airline. The Civil Aviation Administration of Vietnam finalised the draft decree on aviation transport, in which Vietnam calls for foreign investors to take part in the establishment of new airlines in Vietnam on the condition that their legal representative is a Vietnamese citizen. Specifically, the number of members managing the operation of the new airlines who are foreigners must not exceed one-third of the total. The foreign side can’t hold more than 49% of the chartered capital of the airline or 60% of chartered capital of general aviation business. Moreover, enterprises asking for aviation transport licenses must have legal capital of VND80-480bn and use at least one aircraft within not more than ten years.
Telecommunications According to the World Bank, Vietnam is one of the three fastest-growing communication markets in Asia, with revenue expected to rise to USD5bn in 2010 from USD1.9bn in 2005. The Ministry of Post and Telecommunications (MPT) seeks to achieve a penetration rate of 32-42% for telephone lines and 25-35% for internet users by 2010. The Vietnam Post and Telecommunications (VNPT), an SOE, plans to invest USD12.8mn in 2007 for the development of broadband and internet services across the nation and encourage Joint Ventures with foreign partners. The GoV seeks to encourage new market entrants and increased competition into the telecom industry. Moreover, the VNPT is speeding up the equitisation of SOEs – 26 have finished the related paper work and two mobile telephone service giants, VinaPhone and Mobiphone, are scheduled to become joint-stock companies in 2007.
Power
Vietnam’s rapid and extensive modernisation and industrialisation stress the demand for electricity. Though the Fifth Power Master Development Plan foresaw an annual power generation growth of 13.4% for the 2001-2010 period, the actual growth for 2001-2004 was 14.9% as demand grew faster than expected; reiterating that increased investment in power infrastructure is needed. According to the World Bank, annual power sector investment requirements for 2005-2010 are expected to be USD3bn in order to meet the demand which is expected to grow at 16% per annum for 2006-2010. The main sources of funding for the power projects are Development Assistance Fund (DAF), now VDB, export-credit financing, local commercial bank finance and government assistance,
Vietnam has 21 airports,
three of which are
international
Vietnam is one of the three
fastest-growing
communication markets in
Asia
Annual power sector
investment of USD3bn
required to meet the
demand growth of 16%pa

12 April 2007 Strategy Vietnam Primer Part II
Deutsche Bank AG/Hong Kong Page 31
and Official Development Assistance (such as World Bank, Asian Development Bank, etc).
The GoV has stated the need to reorganise the power transmission sector by 2010 into a single unified power transmission body, by splitting from power generation, and making them accountable for profits. Moreover, the GoV plans to integrate all power transmission companies and dispatch the centre into a single state-owned transmission company to manage transmission lines with a voltage level of 220KV and above. After 2010, the GoV intends to restructure the power sector by applying an hourly pricing mechanism to reduce production costs and selling tariffs, and commercializing the distribution sector
The power sector in Vietnam is solely managed by Electricity of Vietnam (EVN). In 2006 alone, EVN issued bonds worth about VND6tn (USD375mn) to fund new power plants to meet the increasing power demand. Twenty one affiliates of EVN have been listed and it plans to transform 19 others into shareholding companies by end-2008. Reportedly, EVN plans to sell its stakes in the Ninh Binh, Thac Mo and Ba Ria power plants on the HSTC and HaSTC. EVN also plans to become Vietnam’s first issuer of overseas corporate bonds, up to USD500mn in 2008. The issue is to be utilised for the construction of power plants.
Market capitalisation With the listing of Pha Lai Thermal Power and Petrovietnam Drilling & Well Services, the power sector currently constitutes 29% of total capitalisation, up sharply from 1% in June 2006.

12 April 2007 Strategy Vietnam Primer Part II
Page 32 Deutsche Bank AG/Hong Kong
Market dynamics Market capitalisation by sector
As at end-January 2007, 106 stocks were listed on the HSTC with a total market capitalisation of USD14.2bn. As demonstrated in the two charts, with new listings, the sector weight changed dramatically within a period of just six months.
Figure 36: Market sectors – end-Jun 2006 Figure 37: Market sectors – end-2006
Mfg8%
Const6%
Acquatic2%
Power1%
Trading1%
Consumer54%
Engineerg17%
Transport11%
Transport1%
Acquatic1%
IT20%
Consumer21%
Power27%
Trading4%
Pharmace2%
Engineerg8%Mfg
8%
Const8%
Sources: Company data, Reuters, DB estimates Sources: Company data, Reuters, DB estimates
With the listing of Pha Lai Thermal Power and Petrovietnam Drilling & Well Services, the power sector constituted 29% of total capitalisation, up from 1% in June 2006. The Information technology sector also emerged as an important sector, with 17% of market capital with the listing of Corporation for Financing & Promoting technology. In contrast, the agriculture sector’s share of the total fell to 19% at end-January 2007 from 57% in June 2006. Vietnam Dairy Products and Kinh Do Corp remain the largest listed players in the sector. The manufacturing share of total capitalisation also fell, to 13% from 24% in the same period, with the Cables And Telecommunications Materials Co and Refrigeration Electrical Engineering as the largest companies listed in the sector.
Figure 38: Sectoral analysis
Sector Mkt Cap
End-06 (USD mn)
% Mkt PE
(trailing 12 months)
Daily Avg T/O USD'000
Mkt Cap Jan-07
(USDmn) %
Power & energy 2,301 23.8 78.2 957 4,053 28.5Food & consumables 1,850 19.1 29.9 1,683 2,535 17.8Information technology 1,742 18.0 92.8 305 2,442 17.2Banking 937 9.7 63.1 810 1,275 9.0Construction & real estate 713 7.4 21.7 976 984 6.9Manufacturing 679 7.0 8.3 818 869 6.1Engineering 640 6.6 58.0 1,627 994 7.0Trading 403 4.2 31.0 921 528 3.7Pharmaceutical 214 2.2 na 56 303 2.1Aquatic products 135 1.4 17.4 168 148 1.0Transportation 49 0.5 11.8 198 63 0.4Hotels & recreation 12 0.1 19.5 15 14 0.1Telecommunication 5 0.1 7.5 72 18 0.1Total 9,679 100.0 74.9 8,606 14,227 100.0
Source: Reuters, DB estimates Note: PE multiple are of 2005 earnings

12 April 2007 Strategy Vietnam Primer Part II
Deutsche Bank AG/Hong Kong Page 33
Market Liquidity The average daily turnover stood at USD51.5mn in January 2007 compared to USD8.3mn in 2006. By company, Vietnam Dairy Products was the most traded company on HSTC in 4Q06 with a turnover of USD109mn, followed by Sacombank (USD98mn) and Refrigeration Electrical Engineering (USD86mn).
Figure 39: Global indices growth and liquidity
2006
%yoy CAGR 03-05
2006 Avg daily Turnover
USDmn
2006 Annual Turnover:
Market cap(x)
2005 Annual Turnover :
Market cap(x)
HSTC 144.5 21.3 8.3 0.3 0.3Shanghai SE 130.4 (8.2) 3,078.6 0.8 0.8Shenzhen SE 97.5 (13.2) 1,765.4 1.9 1.3Jakarta SE 55.3 44.1 203.5 0.4 0.5Mumbai SE 46.7 42.5 895.9 0.3 0.3National SE India 34.0 33.1 1,767.7 0.5 0.6Hong Kong SE's 43.2 18.7 3,468.3 0.5 0.4Philippine SE 42.3 25.6 46.9 0.2 0.2Colombo SE 41.6 34.3 4.2 0.1 0.2Kuala Lumpur SE 21.8 10.6 314.5 0.3 0.3Karachi SE 5.0 36.3 573.1 2.8 2.9Thailand SE (4.7) 24.5 419.4 0.7 0.8
Source: World Federation of Exchanges, KSE, HCSTC, Reuters, DB
Valuation During the year, the HSTC rose 144.5% yoy, with a standard deviation of 21.2%. This was followed closely by the Shanghai Stock Exchange, which rose 130.4% with a standard deviation of 18.7%. By end-2006, HSTC was trading at 74.9x, compared to 15.4x in 2005.
Figure 40: Risk and return, 2006
Karachi
Mumbai Hong Kong NSEI Colo. Philippines
Jakarta
Shenzhen
Shanghai V ietnam
0
20
40
60
80
100
120
140
160
5 7 9 11 13 15 17 19 21 23
Std Dev %
Return %yoy
Source: Reuters Note: Calculation methodology: Return - Index performance (YoY), Risk - standard deviation of index as % of average
Key players The top 15 companies on the HSTC constituted about 85% of the total market capitalisation, with USD12.0bn. Corporation for Financing & Promoting technology was the largest listed equity with a market capitalisation of USD2.4bn (17.2% of the total), followed by Pha Lai Thermal Power (USD1.8bn, 12.3%) and Vietnam Dairy Products (USD1.7bn, 12.2%).

12 April 2007 Strategy Vietnam Primer Part II
Page 34 Deutsche Bank AG/Hong Kong
Figure 41: Top 15 companies by market capitalisation (January 2007)
Company Reuters Key business sector Mkt cap
(USDmn) %
1. Corporation for Financing & Promoting technology
FPT.HM Information technology 2,442 17.2
2. Pha Lai Thermal Power PPC.HM Utilities-Electrical & Gas 1,751 12.33. Vietnam Dairy Products VNM.HM Food & Household Products 1,732 12.2
4. Saigon Thuong Tin Commercial Bank (Sacombank)
STB.HM Commercial banking 1,275 9.0
5. Petrovietnam Drilling & Well Services PVD.HM Energy sources 1,236 8.76. Vinh Son-Song Hinh Hydropower VSH.HM Utilities-Electrical & Gas 642 4.57. Cable And Telecommunications Materials SAM.HM Industrial components 522 3.78. Refrigeration Electrical Engineering REE.HM Engineering & households 451 3.29. Kinh Do Corp KDC.HM Food & Household Products 411 2.910. Tan Tao Industrial Park Corp ITA.HM Construction & Housing 392 2.811. General Forwarding and Agency Corp GMD.HM Trading 392 2.812. Thu Duc Housing Development Corp TDH.HM Construction & Housing 220 1.5
13. Binh Minh Plastics Joint Stock Co BMP.HM Recreation, Other Consumer Goods
218 1.5
14. Vietnam Petrolium VIP.HM Energy sources 186 1.315. Hoa Binh Rubber Co HRC.HM Manufacturing 145 1.0 Top 15 12,016 84.5
Source: Reuters
Among the top companies, Binh Minh Plastics had the most attractive PER (12 months trailing), at 30.4x, on consensus estimates. Corporation for Financing & Promoting Technology (18% market capitalisation as of end 2006) was trading at a PE multiple of 92.8x. Six of the top twelve companies by market capitalisation were listed during 2H06.
Figure 42: One-year trailing PER of top 12 companies 2003 2004 2005 2006
Petrovietnam Drilling & Well Services Joint Stock Co na na na 216.2
Corporation for Financing & Promoting technology na na na 92.8
Vinh Son-Song Hinh Hydropower Joint Stock Co na na na 69.7
Refrigeration Electrical Engineering 13.2 17.7 17.1 66.1
Saigon Thuong Tin Commercial Joint Stock Bank (Sacombank) na na na 63.1
Cable And Telecommunications Materials Joint Stock Co 10.5 17.6 17.9 53.7
Kinh Do Corp na na 13.8 43.0
General Forwarding and Agency Corp 13.7 18.3 21.3 40.2
Tan Tao Industrial Park Corp na na na 40.2
Vietnam Dairy Products Joint Stock Co na na na 32.8
Binh Minh Plastics Joint Stock Co na na na 30.4
Pha Lai Thermal Power Joint Stock na na na Na
Sources: HSTC, Reuters, Bloomberg, DB research estimates Note: Market PE has been restated based on market weight of each security cf. Vietnam primer - Aug 06, where combined market capitalization was compared with combined earnings for all listed equities. Equities where earnings were not available have been ignored for the market PE estimation
The HSTC and HaSTC closed at 751 and 243 at end-2006, up 146% yoy and 170%, respectively, compared to the 30% gain recorded by the MSCI. Cable and Telecommunications Materials had the highest absolute return of 87% during the last three months of the year, followed by Kinh Do Corp with a 71% return.

12 April 2007 Strategy Vietnam Primer Part II
Deutsche Bank AG/Hong Kong Page 35
Figure 43: Price performance of top companies by market cap (end-2006)
Company RIC Absolute
return 1M
3M 1Y 2Y
Cable And Telecommunications Materials
SAM.HM 16.5 87.3 385.1 498.7
Refrigeration Electrical Engineering REE.HM 26.7 51.7 308.2 521.0
General Forwarding And Agency Corp GMD.HM 9.6 65.9 252.1 389.4
An Giang Fisheries Import Export Co AGF.HM 15.5 41.8 227.8 285.9
Kinh Do Corp KDC.HM 44.9 71.1 221.5 Na
North Kinh Do Food NKD.HM 41.3 64.6 191.6 463.1
Binh Minh Plastics Joint Stock Co BMP.HM 37.7 84.8 na Na
Pha Lai Thermal Power PPC.HM 23.0 58.1 na Na
Vietnam Dairy Products VNM.HM 23.8 50.6 na Na
Vinh Son-Song Hinh Hydropower VSH.HM 18.1 29.2 na Na
Ho Chi Minh City Infrastructure Investment
CII.HM 21.5 28.0 na Na
Saigon Thuong Tin Commercial STB.HM 13.4 12.3 na Na
Tan Tao Industrial Park Corp ITA.HM 8.6 na na Na
Petrolimex Gas PGC.HM -1.7 na na Na
VNINDEX performance VNINDEX 21.9 42.7 146.3 214.2
Source: Reuters Note: Calculations as of 31-12-06, n.a. indicate that the company had not been listed during the relevant period.

12 April 2007 Strategy Vietnam Primer Part II
Page 36 Deutsche Bank AG/Hong Kong
FPT Corporation (FPT VN, VND460,000) Business background
FPT was established in 1988 and is the largest information technology solution provider in Vietnam. FPT provides services in mobile distribution, systems integration, software outsourcing and development, internet and e-media content and computer assembly. FPT currently has partnerships with leading IT and telecom companies including IBM, HP, Microsoft, Toshiba, Cisco, Oracle, Motorola and Samsung. As at 31 Jan 2007, FPT was the largest company by market capitalisation listed on HSTC, with USD2,442mn, representing 17.2% share of the total. FPT is also one of the more recent listings on the HSTC, with trading commencing on 13 December 2006.
Figure 44: Revenue breakdown (2004) Figure 45: Revenue breakdown (2005)
Other27%
Softwareand
services73%
Other15%
Softwareand
services85%
Source: Company data Source: Company data
Management and key shareholders
FPT commenced trading on the HCSTC with 60.9mn shares valued at VND10,000 per share. FPT employees hold 66.6% while the GoV holds 7.3%, the public holding 26.1% and foreign investors 12.2%. Truong Gia Binh is both chairman and CEO of FPT’s management board.
New developments
As per management guidance, FPT buildings are being constructed in Cau Giay Industrial Park and Ho Chi Minh City High-tech Zone, covering an area of over 16,000 sq. meters in each site. Once completed, the site would offer FPT office space as well as accommodate future infrastructure development.
In November 2006, the Vietnam Shipping Industry Corporation (Vinashin) signed a strategic cooperation agreement for the development of Vinashin’s Information Technology Applications project throughout the 2006-2010 period.

12 April 2007 Strategy Vietnam Primer Part II
Deutsche Bank AG/Hong Kong Page 37
Financial summary
Figure 46: Financial summary VND mn 2002 2003 2004 2005
Net revenue 1.5 3.3 5.2 8.3
Operating profit 0.03 0.06 0.2 0.4
Net income 0.02 0.04 0.2 0.3
Operating margin (%) 1.3 1.8 3.8 4.8
Net margin (%) 1.3 1.2 3.8 3.6
Source: Company data.
Figure 47: Financial summary VND mn 3Q06 4Q06
Net revenue 5,452 7,143
Operating profit 106 256
Net income* 93 240
Operating margin (%) 2.0 3.6
Net margin (%) 1.7 3.4
Sources: Company data. Note: All data unaudited. *Net income
Trading Information
Figure 48: Company trading information
2006 2007 YTD
High (VND) 510,000 (12/20/06) 645,000 (1/31/2007)
Low (VND) 400,000 (12/13/06) 440,000 (02/01/2007)
Dividend yield (%) na 0.24
Absolute return (%) 15% 140.2
Relative return (bps) vs. VNINDEX 13.5 -1.7
EPS (VND) 4,956 na
PER (X) trailing 127.1 na
Sources: Company data, Deutsche Bank, Note: *Unaudited

12 April 2007 Strategy Vietnam Primer Part II
Page 38 Deutsche Bank AG/Hong Kong
Price performance
Figure 49: Price performance
365,000
445,000
525,000
605,000
685,000
31-J
an-0
7
24-J
an-0
7
17-J
an-0
7
10-J
an-0
7
3-Ja
n-07
26-D
ec-0
6
19-D
ec-0
6
200
400
600
800
1,000
1,200 FPT (RHS)
VNINDEX (LHS)
Source: Reuters
Figure 50: Relative price performance
31-J
an-0
7
24-J
an-0
7
17-J
an-0
7
10-J
an-0
7
3-Ja
n-07
26-D
ec-0
6
19-D
ec-0
6
75
100
125
150
175FPT
VNINDEX
Source: Reuters

12 April 2007 Strategy Vietnam Primer Part II
Deutsche Bank AG/Hong Kong Page 39
Vietnam Dairy (VNM VN, VND175,000) Business background
Established in 1976, Vietnam Dairy (Vinamilk, VND175,000) is the largest producer of milk and diary products in Vietnam with a distribution network of 1,400 agencies across the country and a market share of 75%. Key export markets remain the US, Canada, Poland, Germany, France and parts of the Middle East. Vinamilk’s products include fresh milk, condensed milk, yogurt, coffee, ice cream and fresh juices. Additionally, Vinamilk deals in real estate and provides warehousing and transport services. Currently, Vinamilk is one of the largest market capitalised firm listed on the HSTC at USD1,871mn as of 19 January 2007, constituting 20.5% of the total.
Figure 51: Revenue by market (1H 2005) Figure52: Revenue by market (1H 2006)
Domestic72%
Exports28%
Domestic86%
Exports14%
Source: Company data Source: Company data
Management and key shareholders
The GoV is Vinamilk’s largest shareholder with a 50% stake. Fraser & Neave of Singapore, the second largest shareholder, acquired an 11% stake by way of government auctions, with the remaining 39% held by other domestic and foreign investors. The board comprises seven members with Ms. Mai Kieu Lien as Managing Director and Chairperson.
New developments
In 2006, Vinamilk maintained a 90% share in the yogurt market, a 40% share in fresh milk, 60% in condensed milk and 45% in the milk powder market. The condensed milk segment grew 10% yoy in 1H06. Fresh milk is the fastest-growing segment, recording 25% yoy growth in 1H06. However, the per capita milk consumption in Vietnam is 8 liters/year compared to 20 liters/year in the South East Asian region and about 40 liters/year in the US and Europe.
Export sales declined by 47.4% yoy to VND405bn and domestic sales increased by 24% to VND2,416bn in 1H06. The drop in export sales was due to the expiry of manufacturing contracts. Vinamilk has formed a joint venture with SAB Miller to produce beer in Vietnam, investing USD45mn in 2006. This project is likely to be commissioned by mid-2007 with an annual capacity of 50mn liters of beer. Vinamilk has also invested in an integrated coffee project with an initial capital of USD20m and will start production by 2008. With these projects in the pipeline, Vinamilk plans to become an integrated food and beverage company.

12 April 2007 Strategy Vietnam Primer Part II
Page 40 Deutsche Bank AG/Hong Kong
Financial summary
Figure 53: Financial summary VND bn 2003 2004 2005 2006*
Net revenue 3,809 4,227 5,639 7,716
Operating profit 639 514 524 714
Net income** 512 518 605 861
Operating margin (%) 16.8 12.2 9.3 9.3
Net margin (%) 13.5 12.2 10.7 11.2
Sources: Company data. Note: * Unaudited. ** Net income reported has significant non- recurring items
Figure 54: Financial summary VND bn 4Q05 1Q06 2Q06 3Q06 4Q06
Net revenue 1,096 1,285 1,537 1,921 1,877
Operating profit 125 158 219 168 43
Net income* 127 195 225 150 163
Operating margin (%)
11.4 12.3 14.3 8.7 2.3
Net margin (%) 11.6 15.2 14.7 7.8 8.7
Sources: Company data, Deutsche Bank, Note: *unaudited
Trading Information
Figure 55: Company trading information 2006 2007 YTD
High (VND) 139,000 (12/14/2006) 194,000 (1/19/2007)
Low (VND) 52,000 (1/24/2006) 125,000 (1/2/2007)
Dividend yield (%) 0.97 na
Absolute return (%) 235.8 140.0
Relative return (bps) vs. VNINDEX -10.4 -0.5
EPS (VND) 3,808 na
PER (X) trailing 32.8 na
Sources: Company data, Deutsche Bank

12 April 2007 Strategy Vietnam Primer Part II
Deutsche Bank AG/Hong Kong Page 41
Price Performance
Figure 56: Price performance
45,000
85,000
125,000
165,000
205,000
31-J
an-0
7
19-D
ec-0
6
7-N
ov-0
6
26-S
ep-0
6
14-A
ug-0
6
3-Ju
l-06
22-M
ay-0
6
6-A
pr-0
6
23-F
eb-0
6200
400
600
800
1,000
1,200 VNINDEX (LHS)
VNM (RHS)
Source: Reuters
Figure 57: Relative price performance
31-J
an-0
7
19-D
ec-0
6
07-N
ov-0
6
26-S
ep-0
6
14-A
ug-0
6
03-J
ul-0
6
22-M
ay-0
6
06-A
pr-0
6
23-F
eb-0
6
50
100
150
200
250
300
350
400 VNM
VNINDEX
Source: Reuters

12 April 2007 Strategy Vietnam Primer Part II
Page 42 Deutsche Bank AG/Hong Kong
Sacom Bank (STB VN, VND 98,000) Business background
STB was established in 1991 with an initial capital of VND3bn. It is the second largest private commercial bank in Vietnam in terms of capital (following Asia Commercial Bank) and became the first bank to be listed on the HSTC in Jul 2006. In terms of value, STB’s loan portfolio comprised 40% individuals and 59% private businesses as of 2005. In FY04, STB became the first commercial bank in Vietnam to receive funding investment from International Financial Corporation (IFC). STB’s market capitalisation was USD989mn as of January 20007.
Figure 58: Loans by industry (2005) Figure 59: Loans by geography (2005)
Trading49%
Const13%
Consultg3%
Mfgprocessing
4%
Edu7%
Agri/Forest12%
Transport6%
Services6%
MekongDelta7%
Central9%
Northern9%
South east12%
Ho ChiMinh63%
Source: Company data Source: Company data
Management and key shareholders
Management and employees of STB collectively form the largest shareholder with 38% holding as of end 2005. Next in line were Australia and New Zealand Banking Group (9.9%), Dragon Financial Holdings Ltd (8.8%) and International Finance Corporation (7.7%). Combined, these three claim 26.4%, marginally below the statutory foreign shareholding limit of 30%. The Board of Directors comprises eight members including Mr. Dang Van Thanh as the chairman.
New developments
The total assets of STB, Vietnam’s sixth largest bank, rose to 72% in 2006, compared to. USD1.54bn in 2005. Gross profit increased 78% to VND544bn by the end of 2006. STB’s loan for the year 2006 was 73% higher at VND14.54tn, while deposits increased 75% to VND21.52tn. In 2006, the small-and-medium-sized enterprises (SMEs) development fund project named STB as the most efficient and effective lender to SMEs in Vietnam. Recently, STB announced that it would issue shares of USD20.6mn in 2007, thus doubling its chartered capital from USD43.1mn in 2006 to c.USD63.7mn. Moreover, STB has plans to issue convertible bonds of USD62.5mn – the 10-month bond will yield a rate of interest of 9%.

12 April 2007 Strategy Vietnam Primer Part II
Deutsche Bank AG/Hong Kong Page 43
Financial summary
Figure 60: Financial summary VND bn 2003 2004 2005
Net revenue 618 836 1,208
Operating profit 493 638 902
Net income 90 151 234
Operating margin (%) 79.7 76.3 74.6
Net margin (%) 14.5 18.0 19.3
Sources: Company data, Saigon Securities Inc
Figure 61: Financial summary VND bn 2003 2004 2005
Total assets 7,304 10,395 14,456
Capital adequacy ratio 10.0 10.4 15.4
ROA (%) 21.4 17.3 11.4
ROE (%) 27.5 28.4 18.6
Net interest income Na 265 434
Sources: Company data, Note: Unaudited.
Trading information
Figure 62: Company trading information
2006 2007 YTD
High (VND) 74,091 - (07/13/2006) 100,000 - (1/30/2007)
Low (VND) 53,182 - (8/02/2006) 71,500 - (1/2/2007)
Dividend yield (%) 0.97 na
Absolute return (%) 1.5 37.1
Relative return (bps) vs. VNINDEX -48.7 -3.4
EPS (VND) 1,234 na
PER (X) trailing 63.1 na
Sources: Company data, Deutsche Bank Note: Unaudited.

12 April 2007 Strategy Vietnam Primer Part II
Page 44 Deutsche Bank AG/Hong Kong
Price performance
Figure 63: Price performance
20,000
40,000
60,000
80,000
100,000
31-J
an-0
7
19-D
ec-0
6
7-N
ov-0
6
26-S
ep-0
6
14-A
ug-0
6
200
410
619
829
1,038
1,248 STB (RHS)
VNINDEX(LHS)
Source: Bloomberg
Figure 64: Relative price performance
31-J
an-0
7
19-D
ec-0
6
7-N
ov-0
6
26-S
ep-0
6
14-A
ug-0
6
0
50
100
150
200
250 STB
VNINDEX
Source: Bloomberg

12 April 2007 Strategy Vietnam Primer Part II
Deutsche Bank AG/Hong Kong Page 45
PV Drilling (PVD VN, VND292,000) Business background
PVD was established in 1994, as PTSC Offshore Services, a company owned by PTSC (Petroleum Technical Services Company), which, in turn was a wholly owned subsidiary of Petrovietnam. Currently, Petrovietnam has a 51% stake in PVD. PVD’s services include drilling, manpower provision, well services, tubular inspection and other offshore drilling-related services. PVD is the fifth largest market-capitalised firm listed on the HSTC with USD1,236mn at end-Jan 2007, constituting 8.7% of the total market capital. PVD commenced trading on 5 December 2006.
New developments
PVD has been expanding overseas operations and in 2H06 won a tender to supply an oil rig to an Algeria-based project invested by Petrovietnam’s investment arm Petrovietnam Investment and Development Company (PIDC). PVD’s USD3.2mn joint venture with US drilling company BJ Services International is currently operating in the southern province of Ba Ria-Vung Tau and offers oil/gas well reinforcement services.
Financial summary
Figure 65: Financial summary VND bn 2004* 2005*
Net revenue 662 1,072
Operating profit 33 65
Net income** 29 53
Operating margin (%) 5.1 6.1
Net margin (%) 4.1 4.9
Source: Company data Note: * Unaudited. ** Net income reported has significant non- recurring items
Figure 66: Financial summary VND bn 3Q06
Net revenue 452
Operating profit 335
Net income* 27
Operating margin (%) 7.7
Net margin (%) 6.0
Source: Company data Note: All data Unaudited. *Net income reported has significant non- recurring items

12 April 2007 Strategy Vietnam Primer Part II
Page 46 Deutsche Bank AG/Hong Kong
Trading information
Figure 67: Company trading information 2006 2007 YTD
High (VND) 167,000 (12/29/2006) 295,000 (1/19/2007)
Low (VND) 113,000 (12/18/2006) 162,000 (01/02/2007)
Dividend yield (%) Na na
Absolute return (%) 28.5 174.9
Relative return (bps) vs. VNINDEX 11.9 36.3
EPS (VND) 773 na
PER (X) trailing 216.2 na
Sources: Company data, Deutsche Bank, Note: Unaudited
Price performance
Figure 68: Price performance
90,000
140,000
190,000
240,000
290,000
340,000
31-J
an-0
7
24-J
an-0
7
17-J
an-0
7
10-J
an-0
7
3-Ja
n-07
26-D
ec-0
6
19-D
ec-0
6
12-D
ec-0
6
5-D
ec-0
6
400
600
800
1,000
1,200PVD (RHS)
VNINDEX (LHS)
Source: Reuters
Figure 69: Relative price performance 31
-Jan
-07
24-J
an-0
7
17-J
an-0
7
10-J
an-0
7
3-Ja
n-07
26-D
ec-0
6
19-D
ec-0
6
12-D
ec-0
6
5-D
ec-0
6
75
100
125
150
175
200
225
250PVD
VNINDEX
Source: Reuters

12 April 2007 Strategy Vietnam Primer Part II
Deutsche Bank AG/Hong Kong Page 47
VSH Hydro (VSH VN, VND82,500) Business background
Vinh Son-Song Hinh Hydropower Joint Stock Company (VSH) is the first hydroelectric plant of Electricity of Vietnam (EVN) to undergo equitisation. In Dec 2004, the Ministry of Industry issued Decision 151/2004/QD-BCN to transform VSH into a joint-stock company and VSH’s first shareholder meeting was held on 4 May 2005. VSH shares were officially listed on the Ho Chi Minh City Securities Trading Center on 18 July 2006. VSH has four turbine groups with a combined design capacity of 136MW and an average production output of 600mn kWh per year. As of end-Jan 2007, it had a market cap of USD642.1mn.
Financial summary
Figure 70: Financial summary
VND bn 2005 2006*
Net revenue 196 409
Operating profit 105 238
Net income** 89 271
Operating margin (%) 53.6 58.2
Net margin (%) 45.4 66.3
Source: Company data. Note: * Unaudited. ** Net income reported has significant non- recurring items
Figure 71: Financial summary VND bn 4Q05 1Q06 2Q06 3Q06 4Q06
Net revenue 137 152 144 45 69
Operating profit 93 116 93 3 26
Net income* 89 114 86 5 65
Operating margin (%)
67.9 76.3 64.6 6.7 37.7
Net margin (%) 64.9 75 59.7 11.1 94.2
Source: Company data,, Note: all data Unaudited. *Net income reported has significant non- recurring items
Trading information
Figure 72: Company trading information 2006 2007 YTD
High (VND) 60,000 (12/19/2006) 86,000 (1/23/2007)
Low (VND) 27,000 (8/1/2006) 49,500 (1/2/2007)
Dividend yield (%) 0.9 na
Absolute return (%) 39.7 66.7
Relative return(%) vs. VNINDEX -0.2 0.3
EPS (VND) 2,168 na
PER (X) trailing 69.7 na
Source: Company data, Note: Unaudited

12 April 2007 Strategy Vietnam Primer Part II
Page 48 Deutsche Bank AG/Hong Kong
Price performance
Figure 73: Price performance
20,000
40,000
60,000
80,000
100,000
31-J
an-0
7
19-D
ec-0
6
7-N
ov-0
6
26-S
ep-0
6
14-A
ug-0
6200
400
600
800
1,000
1,200 VSH (RHS)
VNINDEX (LHS)
Source: Reuters
Figure 74: Relative price performance
31-J
an-0
7
19-D
ec-0
6
7-N
ov-0
6
26-S
ep-0
6
14-A
ug-0
6
50
100
150
200
250 VSH
VNINDEX
Source: Reuters

12 April 2007 Strategy Vietnam Primer Part II
Deutsche Bank AG/Hong Kong Page 49
REE Corporation (REE VN, VND215,000) Business background
REE was established in 1977 and in 1993 became the first SOE to be equitised in Vietnam. In 2000, REE became the first company to be listed on the HCSTC and as at 31 Jan 2007 had a market capitalisation of USD383mn. REE’s operations include investments and carrying out engineering and contracting for industrial, commercial and civil projects, manufacture of air-conditioners, home appliances, as well as developing and operating real estate.
Figure 75: Revenue – Segment (2005) Figure 76: Profit – Segment (2005)
Reetechdivision45%
M&Eengineeringcontracts
29%
Real estate26%
Real estate79%
Reetechdivision16%
M&Eengineeringcontracts
5%
Source: Company data Source: Company data
Management and key shareholders
As at Dec 2006, the Vietnam Opportunity Fund (VOF) was REE’s largest shareholder with a 9.4% stake, followed by the GoV with 8.2%. The third major shareholder is Prudential Vietnam (7.7%) with the remaining shares held by other domestic and foreign shareholders (25%). Its board comprises five members, including Chairperson Ms. Nguyen Thi Mai Thanh.
New developments
REE plans to issue new shares to raise USD19.8mn to invest in real estate and a power plant. The new projects would diversify REE’s operations to include real estate services. According to management, REE has taken up several government-linked projects, including an USD18mn National Convention Centre, USD13mn for the construction of a Vietnam television centre and a USD30mn new airport terminal in Ho Chi Minh City. Additionally, REE has a significant investment portfolio, with its biggest holding being a 5% stake in Sacom Bank.

12 April 2007 Strategy Vietnam Primer Part II
Page 50 Deutsche Bank AG/Hong Kong
Financial summary
Figure 77: Financial summary VND bn 2003 2004 2005 2006
Net revenue 372 363 387 1,039
Operating profit 48 64 87 215
Net income 38 56 68 297
Operating margin (%) 12.9 18.4 20.0 19.7
Net margin (%) 10.5 15.5 17.5 31.6
Source: Company data, Saigon Securities Inc
Figure 78: Financial summary VND bn 4Q05 1Q06 2Q06 3Q06 4Q06
Net revenue 129 181 265 208 385
Operating profit 14 24 37 50 104
Net income* 14 108 34 52 103
Operating margin (%) 11.7 14.0 14.1 24.2 26.7
Net margin (%) 11.6 61.3 13.0 25.5 26.7
Source: Company data, Note:,All data unaudited.
Trading information
Figure 79: Company trading information
2005 2006 2007 YTD
High (VND) 34596-(10/12/05) 145,000 - (12/15/2006) 215,000 - (1/31/2007)
Low (VND) 21,236(01/06/05) 34,117 - (1/24/2006) 128,000 - (1/2/2007)
Dividend yield (%) na 0.60 na
Absolute return (%) 94 280 68
Relative return (bps) vs. VNINDEX 95.5 137.14 27.4
EPS (VND) na 6,344 na
PER (X) trailing 17.1 66.1 na
Sources: Company data, Deutsche Bank, Note: Unaudited

12 April 2007 Strategy Vietnam Primer Part II
Deutsche Bank AG/Hong Kong Page 51
Price performance
Figure 80: Price performance
20,000
70,000
120,000
170,000
220,000
270,000
31-J
an-0
7
19-D
ec-0
6
7-N
ov-0
6
26-S
ep-0
6
14-A
ug-0
6
3-Ju
l-06
22-M
ay-0
6
6-A
pr-0
6
23-F
eb-0
6
4-Ja
n-06
200
400
600
800
1,000
1,200REE(RHS)
VNINDEX (LHS)
Source: Bloomberg
Figure 81: Relative price performance
31-J
an-0
7
7-N
ov-0
6
14-A
ug-0
6
22-M
ay-0
6
23-F
eb-0
6
22-N
ov-0
5
29-A
ug-0
5
6-Ju
n-05
10-M
ar-0
5
9-D
ec-0
4
0
200
400
600
800
1,000REE
VNINDEX
Source: Bloomberg

12 April 2007 Strategy Vietnam Primer Part II
Page 52 Deutsche Bank AG/Hong Kong
Kinh Do Corp (KDC VN, VND220,000) Business background
KDC was founded in 1993 with an investment of USD$125,000, and a workforce of 70. During 1993-96, KDC invested USD5.8mn in snack production and another USD1.2mn in bakery products during 1997-98. In 1998, KDC expanded into Chocolate and Candy production, investing USD0.8mn. In 1999, KDC diversified into the real estate business by starting up its Savico-Kinh Do Shopping Mall. KDC obtained the ISO-9002 accreditation in 1999. "Kinh Do Moon Cake" is a leading brand of KDC. KDC’s current distribution system consists of 150 direct outlets and 40,000 retailed stores as of 2006, growing 15-20% yoy. As of 2006, KDC commanded 40% of Vietnam’s confectionery market share. KDC had a market capitalisation of USD410mn (31 Jan 07) constituting 2.9% of the total market capital of VNINDEX. KDC has nine subsidiary companies, of which seven factories engage in food manufacturing and others are involved in the construction and real estate business. KDC was listed in Jan 05.
Figure 82: Segmental revenue, 2005 Figure 83: Segmental revenue, 2004
Exports20%
Domestic80%
Exports9%Domestic
91%
Source: Company data Source: Company data
Management
The board comprises seven members with Mr.Tran Kim Thanh as the chairman.
New developments
At a press conference, management indicated that KDC’s FY06 sales had reached VND2.0bn and NI’s VND230bn (+200% yoy). KDC had commenced the construction of two new confectionery facilities with plans to build another soft drink factory to cater to the high-end export market (total investment of USD40mn). KDC also plans to open a luxury commercial centre in 2006 in Ho Chi Minh City (investment USD70mn). Moreover, KDC has plans to build the Tribeco soft drink factory in the northern province of Hung Yen (investment VND100bn/USD6.25mn). In Jul 06, KDC inked an agreement with the UK multinational Cadbury Schweppes to have joint sales programmes in marketing KDC products overseas and Cadbury products in the South East Asian region. KDC’s current workforce is 2,500 with a targeted annual 20% revenue growth rate, according to company sources.

12 April 2007 Strategy Vietnam Primer Part II
Deutsche Bank AG/Hong Kong Page 53
Financial summary
Figure 84: Financial summary VND mn 2003 2004 2005
Net revenue 623,070 718,507 798,751
Operating profit 83,343 101,116 115,142
Net income* 76,926 81,026 99,175
Operating margin (%) 13.4 14.1 14.4
Net margin (%) 12.3 11.3 12.4
ROE (%) 34.5 30.1 19.5
Source: Company data. Note: * Unaudited
Figure 85: Financial summary VNS mn 3Q05 4Q05 1Q06 2Q06 3Q06
Net revenue 96,773 232,860 164,798 182,008 379,165
Operating profit 21,299 25,496 13,936 8,353 81,790
Net income* 22,263 26,977 18,855 14,585 92,549
Operating margin (%) 22.0 10.9 8.5 4.6 21.6
Net margin (%) 23.0 11.6 11.4 8.0 24.4
Source: Company data, Note: All data Unaudited.
Trading information
Figure 86: Company trading information 2005 2006 2007 YTD
High (VND) 51,250 (12/13/2005) 173,000 (12/21/2006) 246,000 (1/23/2007)
Low (VND) 44,170 (12/28/2005) 43,750 (1/12/2006) 44,580 (1/3/2007)
Dividend yield (%) na na na
Absolute return 12 months (%) -8.4 221.5 47.6
Relative return (bps) vs. VNINDEX -5.5 75.2 7.1
EPS (VND) na 3,306 na
PER (X) trailing 13.8 43.0 na
Source: Company data, Note: Unaudited

12 April 2007 Strategy Vietnam Primer Part II
Page 54 Deutsche Bank AG/Hong Kong
Price performance
Figure 87: Price performance
-
200
400
600
800
1,000
1,200
3-Ja
n-06
3-M
ar-0
6
3-M
ay-0
6
3-Ju
l-06
3-S
ep-0
6
3-N
ov-0
6
3-Ja
n-07
0
50,000
100,000
150,000
200,000
250,000
300,000VNINDEX (LHS)
KDC (RHS)
Source: Reuters
Figure 88: Relative price performance, KDC vs. VNINDEX [IPO date – 2007 Jan 31]
31-J
an-0
7
19-D
ec-0
6
7-N
ov-0
6
26-S
ep-0
6
14-A
ug-0
6
3-Ju
l-06
22-M
ay-0
6
6-A
pr-0
6
23-F
eb-0
6
4-Ja
n-06
0
100
200
300
400
500KDC
VNINDEX
Source: Reuters

12 April 2007 Strategy Vietnam Primer Part II
Deutsche Bank AG/Hong Kong Page 55
Tan Tao Industrial Park (ITA VN, VND140,000)
Business background
ITA invests in infrastructure and provides infrastructure services for industrial zones including civil/transportation work and the provision of internet services. ITA is also engaged in constructing mini power plants (upto 35KV), and in the development of residential buildings and low-income apartments. ITA has one subsidiary and six affiliates and as at end Jan 2007 had a market capitalisation of USD392mn, constituting 3.6% of the total.
Figure 89: Land available for industrial parks at HCMC Figure 90: Occupancy of land available for IPs at HCMC
Leased toTan Tao
15% Remaining85%
Occupied34%
Notoccupied
66%
Sources: Ho Chi Minh City Export Processing Zone and Industrial Park Authority, 2005
Sources: Ho Chi Minh CityExport Processing Zone and Industrial Park Authority, 2005
Management
The board comprises six members including Thi Hoang Yen Dang, the chairman.
New developments
The first phase of the Tan Tao Park was completed in 2001, and had an occupancy rate of 90% in 2006. ITA was awarded the contract (US$62.5mn) for the development of the 569ha Tan Duc industrial and urban complex. Management expects a net income of VND100bn in 2006 (VND105bn in 2005). Management guidance for 2007-08: Net income growth of 5% yoy and dividend payout of 18%. Further, ITA also plans to develop the 384ha Tan Duc residential area in Long An Province, investing USD81.3mn over 2007-2014.

12 April 2007 Strategy Vietnam Primer Part II
Page 56 Deutsche Bank AG/Hong Kong
Financial summary
Figure 91: Financial summary (VNDm) – Annual 2004 2005
Net revenue 270,358 353,941
Operating profit 103,586 153,763
Net income* 95,252 105,102
Operating margin (%) 38.3 43.4
Net margin (%) 35.2 29.7
ROE (%) 25.9 25.9
Source: Company data. Note * Unaudited
Figure 92: Financial summary (VNDm) – Quarterly 2Q06 3Q06
Net revenue na 35,913
Operating profit na 6,664
Net income* na 18,512
Operating margin (%) na 18.6
Net margin (%) na 51.5
Source: Company data,, Note: All data Unaudited
Trading information
Figure 93: Company trading information 2006 2007 YTD
High (VND) 99,000 - (12/15/2006) 141,000 - (1/30/2007)
Low (VND) 43,750 - (1/12/2006) 88,000 - (3/1/2007)
Dividend yield (%) Na na
Absolute return (%) 100.0 55.5
Relative return (bps) – vs. VNINDEX -45.6 -25.0
EPS (VND) 2,203 na
PER (X) trailing 40.2 na
Source: Company data, Note: Unaudited

12 April 2007 Strategy Vietnam Primer Part II
Deutsche Bank AG/Hong Kong Page 57
Price performance
Figure 94: Price performance
35,000
75,000
115,000
155,000
31-J
an-0
7
19-D
ec-0
6
7-N
ov-0
6
26-S
ep-0
6
14-A
ug-0
6
3-Ju
l-06
22-M
ay-0
6
6-A
pr-0
6
23-F
eb-0
6
4-Ja
n-06
0
200
400
600
800
1,000
1,200 ITA (RHS)
VNINDEX (LHS)
Source: Reuters
Figure 95: Relative price performance
31-J
an-0
7
19-D
ec-0
6
7-N
ov-0
6
26-S
ep-0
6
14-A
ug-0
6
3-Ju
l-06
22-M
ay-0
6
6-A
pr-0
6
23-F
eb-0
6
4-Ja
n-06
50
100
150
200
250
300
350
400ITA
VNINDEX
Source: Reuters
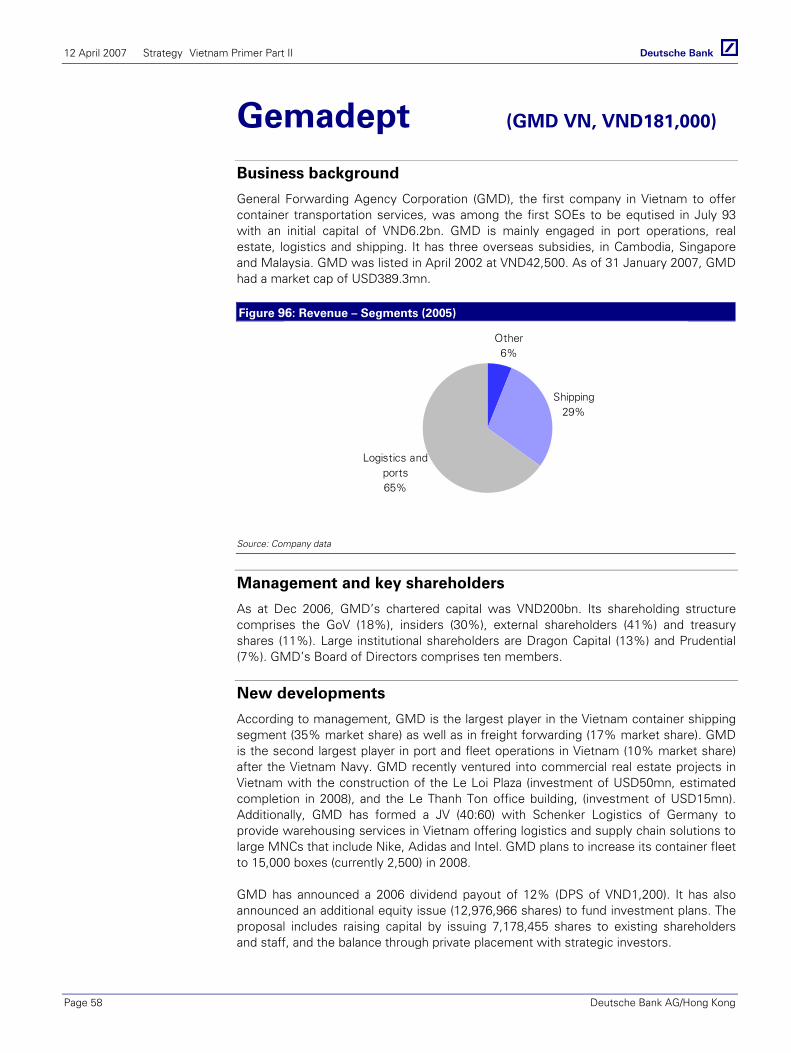
12 April 2007 Strategy Vietnam Primer Part II
Page 58 Deutsche Bank AG/Hong Kong
Gemadept (GMD VN, VND181,000) Business background
General Forwarding Agency Corporation (GMD), the first company in Vietnam to offer container transportation services, was among the first SOEs to be equtised in July 93 with an initial capital of VND6.2bn. GMD is mainly engaged in port operations, real estate, logistics and shipping. It has three overseas subsidies, in Cambodia, Singapore and Malaysia. GMD was listed in April 2002 at VND42,500. As of 31 January 2007, GMD had a market cap of USD389.3mn.
Figure 96: Revenue – Segments (2005)
Other6%
Shipping29%
Logistics andports65%
Source: Company data
Management and key shareholders
As at Dec 2006, GMD’s chartered capital was VND200bn. Its shareholding structure comprises the GoV (18%), insiders (30%), external shareholders (41%) and treasury shares (11%). Large institutional shareholders are Dragon Capital (13%) and Prudential (7%). GMD’s Board of Directors comprises ten members.
New developments
According to management, GMD is the largest player in the Vietnam container shipping segment (35% market share) as well as in freight forwarding (17% market share). GMD is the second largest player in port and fleet operations in Vietnam (10% market share) after the Vietnam Navy. GMD recently ventured into commercial real estate projects in Vietnam with the construction of the Le Loi Plaza (investment of USD50mn, estimated completion in 2008), and the Le Thanh Ton office building, (investment of USD15mn). Additionally, GMD has formed a JV (40:60) with Schenker Logistics of Germany to provide warehousing services in Vietnam offering logistics and supply chain solutions to large MNCs that include Nike, Adidas and Intel. GMD plans to increase its container fleet to 15,000 boxes (currently 2,500) in 2008.
GMD has announced a 2006 dividend payout of 12% (DPS of VND1,200). It has also announced an additional equity issue (12,976,966 shares) to fund investment plans. The proposal includes raising capital by issuing 7,178,455 shares to existing shareholders and staff, and the balance through private placement with strategic investors.

12 April 2007 Strategy Vietnam Primer Part II
Deutsche Bank AG/Hong Kong Page 59
Financial summary
Figure 97: Financial summary (VNDbn) – Annual 2003 2004 2005 2006*
Net revenue 570 824 871 1,152
Operating profit 107 151 153 165
Net income** 101 113 119 174
Operating margin (%) 18.8 18.3 17.5 14.4
Net margin (%) 17.8 13.7 13.6 15.1
Source: Company data. Note: * Unaudited. ** Net income reported has significant non- recurring items
Figure 98: Financial summary (VNDbn) – Quarterly 4Q05 1Q06 2Q06 3Q06 4Q06
Net revenue 261 212 216 239 223
Operating profit 40 45 37 37 6
Net income* 33 36 39 29 36
Operating margin (%) 15.4 21.5 17.0 15.4 2.9
Net margin (%) 12.8 17.2 18.0 12.2 16.3
Source: Company data, Note: all data Unaudited. *Net income reported has significant non- recurring items
Trading information
Figure 99: Company trading information 2005 2006 2007 YTD
High (VND) 42,600 (12/22/2005) 154,000 - (12/18/2006) 190,000 - (1/16/2007)
Low (VND) 28,857 (1/13/2005) 41,400 - (1/4/2006) 136,000 - (1/2/2007)
Dividend yield (%) na na na
Absolute return (%) 40.3 228.5 33.1
Relative return (bps) vs. VNINDEX 10.7 82.3 -7.4
EPS (VND) na 8,700 na
PER (X) trailing 21.3 40.2 na
Source: Company data, Note: Unaudited

12 April 2007 Strategy Vietnam Primer Part II
Page 60 Deutsche Bank AG/Hong Kong
Price performance
Figure 100: Price performance
25,000
75,000
125,000
175,000
225,000
31-J
an-0
7
19-D
ec-0
6
7-N
ov-0
6
26-S
ep-0
6
14-A
ug-0
6
3-Ju
l-06
22-M
ay-0
6
6-A
pr-0
6
23-F
eb-0
6
4-Ja
n-06
200
400
600
800
1,000
1,200 GMD (RHS)
VNINDEX (LHS)
Source: Reuters
Figure 101: Relative price performance
31-J
an-0
7
7-N
ov-0
6
14-A
ug-0
6
22-M
ay-0
6
23-F
eb-0
6
21-N
ov-0
5
26-A
ug-0
5
3-Ju
n-05
9-M
ar-0
5
8-D
ec-0
4
0
100
200
300
400
500
600
700GMD
VNINDEX
Source: Reuters

12 April 2007 Strategy Vietnam Primer Part II
Deutsche Bank AG/Hong Kong Page 61
HCMC Infrastructure (CII VN, VND76,000)
Business background
Established in 2001 as a state-owned company by the Department of Planning and Investment, CII is an infrastructure development company engaging in Build–Operate-Transfer contracts. CII purchases operating rights in key urban infrastructure projects from developers and recoups the initial investment through toll-collection activities. CII was listed in Feb 2006 and started trading by May 2006, and has a current market capitalisation of USD155m as of 31 Jan 2006.
Figure 102: Revenue – Segment (2005) Figure 103: Profit – Segment (2005)
Tollcollection
78%
Investmentactivities
20%
Other2%
Tollcollection
65%
Investmentactivities
34%
Other1%
Source: Company data Source: Company data
Management and key shareholders
As of Dec 2006, state-owned Ho Chi Minh City Investment Fund for Urban Development was CII’s largest shareholder with an 18.3% stake. Ho Chi Minh City Volunteer Youth Production Commercial Trading and Import Export Services is the second largest shareholder with a 5% stake. Total institutional ownership is 72.1% with foreign ownership of 12% as of 2005. Its Board comprises 12 members, including Chairperson Ms. Giao Thi Yen.
Financial summary
Figure 104: Financial summary VND bn 2003 2004 2005 2006
Net revenue 172 172 167 164
Operating profit 57 58 57 69
Net income 48 25 28 45
Operating margin (%) 33.3 34.0 34.6 42.3
Net margin (%) 28.3 14.7 17.0 28.8
Sources: Company data, Saigon Securities Inc

12 April 2007 Strategy Vietnam Primer Part II
Page 62 Deutsche Bank AG/Hong Kong
Figure 105: Financial summary (VNDbn) – Quarterly
1Q06 2Q06 3Q06 4Q06
Net revenue 43 41 41 39
Operating profit 17 17 18 17
Net income* 7 18 9 11
Operating margin (%) 40.3 41.3 43.2 44.7
Net margin (%) 17.6 44.8 23.3 29.5
Source: Company data,, Note: all data Unaudited.
Trading Information
Figure 106: Company trading information
2006 2007 YTD
High (VND) 60,000 - (12/19/2006) 77,000 - (1/23/2007)
Low (VND) 26,200 - (8/2/2006) 49,400 - (1/2/2007)
Dividend yield (%) 0.97 na
Absolute return (%) -4 53.8
Relative return (bps) – vs. VNINDEX -150.2 13.3
EPS (VND) 3,808 na
PER (X) trailing 50.6 na
Sources: Company data, Deutsche Bank, Note: Unaudited
Price performance
Figure 107: Price performance
20,000
35,000
50,000
65,000
80,000
31-J
an-0
7
19-D
ec-0
6
7-N
ov-0
6
26-S
ep-0
6
14-A
ug-0
6
3-Ju
l-06
22-M
ay-0
6
200
400
600
800
1,000
1,200CII (RHS)
VNINDEX (LHS)
Source: Bloomberg

12 April 2007 Strategy Vietnam Primer Part II
Deutsche Bank AG/Hong Kong Page 63
Figure 108: Relative price performance
31-J
an-0
7
19-D
ec-0
6
7-N
ov-0
6
26-S
ep-0
6
14-A
ug-0
6
3-Ju
l-06
22-M
ay-0
6
20
40
60
80
100
120
140
160
180
200 CII
VNINDEX
Source: Bloomberg

12 April 2007 Strategy Vietnam Primer Part II
Page 64 Deutsche Bank AG/Hong Kong
Bibliography 1. Ministry of Finance, Vietnam (http://www.mof.gov.vn)
2. Ministry of Post and Telematics, Vietnam (http://www.mpt.gov.vn)
3. Vietnam Association of exporters and producers (http://www.vasep.com.vn)
4. Vietnam National coal and mineral industry group (http://www.vinacoal.com.vn/)
5. Vietnam steel corporation (http://www.vsc.com.vn/)
6. The Ministry of Finance, Vietnam (http://www.mof.gov.vn/DefaultE.aspx?tabid=197)
7. The Ministry of Foreign Affairs, Vietnam (http://www.mofa.gov.vn/en/)
8. The Asian Development Bank (http://asianbondsonline.adb.org/vietnam/vietnam.php)
9. The Security Exchange Commission of Vietnam (http://www.ssc.gov.vn/ssc/Detaile.aspx?tabid=750)
10. China-ASEAN Business Net (http://www.china-asean.net/asean_biz/vietnam/laws_regulations/asean_vi_law_2.html)
11. The General Statistics Office in Vietnam (http://www.gso.gov.vn/default_en.a.spx?tabid=494&itemid=1595&idmid=1)
12. The Vietnam Trade Office in US (http://www.vietnam-ustrade.org/Eng/about_us.htm)
13. The Vietnam News (http://vietnamnews.vnagency.com.vn/)
14. The Food and Agriculture Organization (http://www.fao.org/)
15. The Vietnam Trade Catalogue (http://www.info.vn/?news=1&id=1&lang=en)
16. Fibre2Fashion (http://www.fibre2fashion.com/index.asp)
17. The Vietnam National Textile and Garment Group (http://www.vinatex.com/main.a.sp?p=aboutus.html)
18. The Thanh Nien News (http://www.thanhniennews.com)
19. The State Bank of Vietnam
20. The Ministry of Planning and Investments, Vietnam (http://www.mpi.gov.vn/default.aspx?Lang=2)
21. The Central Institute for Economic Management, Vietnam
22. World Federation of exchanges (http://www.world-exchanges.org/WFE/home.Asp?nav=ie)
23. Vietnam Chamber of Commerce and Industry (http://vibforum.vcci.com.vn/)
24. Vietnam Economic Times (http://www.vneconomy.vn/eng/)
25. Investment and Trade Promotion Center Ho Chi Minh City (http://www.itpc.hochiminhcity.gov.vn/)
26. Vietnam Net Bridge (http://english.vietnamnet.vn/)
27. American Chamber of Commerce in Vietnam (http://www.amchamvietnam.com/)
28. Vietnam News agency (http://www.vnagency.com.vn/Home/tabid/117/Default.aspx)
29. Vietnam Investment Review (http://www.vir.com.vn/Client/VIR/Default.asp)
30. Vietnam Financials (http://vietnamfinancials.blogspot.com/search/label/Securities)
31. The International Monetary Fund
32. Reuters data source
33. Bloomberg data source

12 April 2007 Strategy Vietnam Primer Part II
Deutsche Bank AG/Hong Kong Page 65
Appendix 1 Important Disclosures
Additional information available upon request
For disclosures pertaining to recommendations or estimates made on a security mentioned in this report, please see the most recently published company report or visit our global disclosure look-up page on our website at http://gm.db.com.
Analyst Certification
The views expressed in this report accurately reflect the personal views of the undersigned lead analyst(s) about the subject issuer and the securities of the issuer. In addition, the undersigned lead analyst(s) has not and will not receive any compensation for providing a specific recommendation or view in this report. Juliana Lee
Equity rating key Equity rating dispersion and banking relationships
Buy: Based on a current 12- month view of total share-holder return (TSR = percentage change in share price from current price to projected target price plus pro-jected dividend yield ) , we recommend that investors buy the stock.
Sell: Based on a current 12-month view of total share-holder return, we recommend that investors sell the stock
Hold: We take a neutral view on the stock 12-months out and, based on this time horizon, do not recommend either a Buy or Sell.
Notes: 1. Newly issued research recommendations and target prices always supersede previously published research.
2. Ratings definitions prior to 27 January, 2007 were:
Buy: Expected total return (including dividends) of 10% or more over a 12-month period
Hold: Expected total return (including dividends) between -10% and 10% over a 12-month period
Sell: Expected total return (including dividends) of -10% or worse over a 12-month period
10%
32%
58%
6%13%10%
0
100
200
300
400
Buy Hold Sell
Asia-Pacific Universe
Companies Covered Cos. w/ Banking Relationship

12 April 2007 Strategy Vietnam Primer Part II
Page 66 Deutsche Bank AG/Hong Kong
Regulatory Disclosures
SOLAR Disclosure
For select companies, Deutsche Bank equity research analysts may identify shorter-term trade opportunities that are consistent or inconsistent with Deutsche Bank's existing longer term ratings. This information is made available only to Deutsche Bank clients, who may access it through the SOLAR stock list, which can be found at http://gm.db.com
Disclosures required by United States laws and regulations
See company-specific disclosures above for any of the following disclosures required for covered companies referred to in this report: acting as a financial advisor, manager or co-manager in a pending transaction; 1% or other ownership; compensation for certain services; types of client relationships; managed/comanaged public offerings in prior periods; directorships; market making and/or specialist role.
The following are additional required disclosures:
Ownership and Material Conflicts of Interest: DBSI prohibits its analysts, persons reporting to analysts and members of their households from owning securities of any company in the analyst's area of coverage. Analyst compensation: Analysts are paid in part based on the profitability of DBSI, which includes investment banking revenues. Analyst as Officer or Director: DBSI policy prohibits its analysts, persons reporting to analysts or members of their households from serving as an officer, director, advisory board member or employee of any company in the analyst's area of coverage. Distribution of ratings: See the distribution of ratings disclosure above. Price Chart: See the price chart, with changes of ratings and price targets in prior periods, above, or, if electronic format or if with respect to multiple companies which are the subject of this report, on the DBSI website at http://gm.db.com.
Additional disclosures required under the laws and regulations of jurisdictions other than the United States
The following disclosures are those required by the jurisdiction indicated, in addition to those already made pursuant to United States laws and regulations. Analyst compensation: Analysts are paid in part based on the profitability of Deutsche Bank AG and its affiliates, which includes investment banking revenues Australia: This research, and any access to it, is intended only for "wholesale clients" within the meaning of the Australian Corporations Act. EU: A general description of how Deutsche Bank AG identifies and manages conflicts of interest in Europe is contained in our public facing policy for managing conflicts of interest in connection with investment research. Germany: See company-specific disclosures above for (i) any net short position, (ii) any trading positions (iii) holdings of five percent or more of the share capital. In order to prevent or deal with conflicts of interests Deutsche Bank AG has implemented the necessary organisational procedures to comply with legal requirements and regulatory decrees. Adherence to these procedures is monitored by the Compliance-Department. Hong Kong: See http://gm.db.com for company-specific disclosures required under Hong Kong regulations in connection with this research report. Disclosure #5 includes an associate of the research analyst. Disclosure #6, satisfies the disclosure of financial interests for the purposes of paragraph 16.5(a) of the SFC's Code of Conduct (the "Code"). The 1% or more interests is calculated as of the previous month end. Disclosures #7 and #8 combined satisfy the SFC requirement under paragraph 16.5(d) of the Code to disclose an investment banking relationship. Japan: See company-specific disclosures as to any applicable disclosures required by Japanese stock exchanges, the Japanese Securities Dealers Association or the Japanese Securities Finance Company. Russia: The information, interpretation and opinions submitted herein are not in the context of, and do not constitute, any appraisal or evaluation activity requiring a licence in the Russian Federation. South Africa: Publisher: Deutsche Securities (Pty) Ltd, 3 Exchange Square, 87 Maude Street, Sandton, 2196, South Africa. Author: As referred to on the front cover. All rights reserved. When quoting, please cite Deutsche Securities Research as the source. Turkey: The information, interpretation and advice submitted herein are not in the context of an investment consultancy service. Investment consultancy services are provided by brokerage firms, portfolio management companies and banks that are not authorized to accept deposits through an investment consultancy agreement to be entered into such corporations and their clients. The interpretation and advices herein are submitted on the basis of personal opinion of the relevant interpreters

12 April 2007 Strategy Vietnam Primer Part II
Deutsche Bank AG/Hong Kong Page 67
and consultants. Such opinion may not fit your financial situation and your profit/risk preferences. Accordingly, investment decisions solely based on the information herein may not result in expected outcomes. United Kingdom: Persons who would be categorized as private customers in the United Kingdom, as such term is defined in the rules of the Financial Services Authority, should read this research in conjunction with prior Deutsche Bank AG research on the companies which are the subject of this research.

Global Disclaimer The information and opinions in this report were prepared by Deutsche Bank AG or one of its affiliates (collectively “Deutsche Bank”). The information herein is believed by Deutsche Bank to be reliable and has been obtained from public sources believed to be reliable. With the exception of information about Deutsche Bank, Deutsche Bank makes no representation as to the accuracy or completeness of such information.
This published research report may be considered by Deutsche Bank when Deutsche Bank is deciding to buy or sell proprietary positions in the securities mentioned in this report.
For select companies, Deutsche Bank equity research analysts may identify shorter-term opportunities that are consistent or inconsistent with Deutsche Bank's existing, longer-term Buy or Sell recommendations. This information is made available on the SOLAR stock list, which can be found at http://gm.db.com.
Deutsche Bank may trade for its own account as a result of the short term trading suggestions of analysts and may also engage in securities transactions in a manner inconsistent with this research report and with respect to securities covered by this report, will sell to or buy from customers on a principal basis. Disclosures of conflicts of interest, if any, are discussed at the end of the text of this report or on the Deutsche Bank website at http://gm.db.com.
Opinions, estimates and projections in this report constitute the current judgement of the author as of the date of this report. They do not necessarily reflect the opinions of Deutsche Bank and are subject to change without notice. Deutsche Bank has no obligation to update, modify or amend this report or to otherwise notify a reader thereof in the event that any matter stated herein, or any opinion, projection, forecast or estimate set forth herein, changes or subsequently becomes inaccurate, except if research on the subject company is withdrawn. Prices and availability of financial instruments also are subject to change without notice. This report is provided for informational purposes only. It is not to be construed as an offer to buy or sell or a solicitation of an offer to buy or sell any financial instruments or to participate in any particular trading strategy in any jurisdiction or as an advertisement of any financial instruments.
Derivative transactions involve numerous risks including, among others, market, counterparty default and illiquidity risk. The appropriateness or otherwise of these products for use by investors is dependent on the investors' own circumstances including their tax position, their regulatory environment and the nature of their other assets and liabilities and as such investors should take expert legal and financial advice before entering into any transaction similar to or inspired by the contents of this publication. Trading in options involves risk and is not suitable for all investors. Prior to buying or selling an option investors must review the "Characteristics and Risks of Standardized Options," at http://www.optionsclearing.com/publications/risks/riskchap1.jsp. If you are unable to access the website please contact Deutsche Bank AG at +1 (212) 250-7994, for a copy of this important document. Furthermore, past performance is not necessarily indicative of future results. Please note that multi-leg options strategies will incur multiple commissions.
The financial instruments discussed in this report may not be suitable for all investors and investors must make their own investment decisions using their own independent advisors as they believe necessary and based upon their specific financial situations and investment objectives. If a financial instrument is denominated in a currency other than an investor’s currency, a change in exchange rates may adversely affect the price or value of, or the income derived from, the financial instrument, and such investor effectively assumes currency risk. In addition, income from an investment may fluctuate and the price or value of financial instruments described in this report, either directly or indirectly, may rise or fall. Furthermore, past performance is not necessarily indicative of future results.
Unless governing law provides otherwise, all transactions should be executed through the Deutsche Bank entity in the investor’s home jurisdiction . In the U.S. this report is approved and/or distributed by Deutsche Bank Securities Inc., a member of the NYSE, the NASD, NFA and SIPC. In Germany this report is approved and/or communicated by Deutsche Bank AG Frankfurt authorised by Bundesanstalt für Finanzdienstleistungsaufsicht. In the United Kingdom this report is approved and/or communicated by Deutsche Bank AG London, a member of the London Stock Exchange and regulated by the Financial Services Authority for the conduct of investment business in the UK and authorised by Bundesanstalt für Finanzdienstleistungsaufsicht (BaFin). This report is distributed in Hong Kong by Deutsche Bank AG, Hong Kong Branch, in Korea by Deutsche Securities Korea Co. and in Singapore by Deutsche Bank AG, Singapore Branch. In Japan this report is approved and/or distributed by Deutsche Securities Inc. The information contained in this report does not constitute the provision of investment advice. In Australia, retail clients should obtain a copy of a Product Disclosure Statement (PDS) relating to any financial product referred to in this report and consider the PDS before making any decision about whether to acquire the product. Deutsche Bank AG Johannesburg is incorporated in the Federal Republic of Germany (Branch Register Number in South Africa: 1998/003298/10) Additional information relative to securities, other financial products or issuers discussed in this report is available upon request. This report may not be reproduced, distributed or published by any person for any purpose without Deutsche Bank's prior written consent. Please cite source when quoting.
Copyright © 2007 Deutsche Bank AG 01/2007
Deutsche Bank AG/Hong Kong
Asia-Pacific locations Deutsche Bank AG Deutsche Bank Place Level 16 Corner of Hunter & Phillip Streets Sydney, NSW 2000 Australia Tel: (61) 2 8258 1234 Fax: (61) 2 8258 1400
Deutsche Bank AG Level 55 Cheung Kong Center 2 Queen’s Road Central Hong Kong Tel: (852) 2203 8888 Fax: (852) 2203 6921
Deutsche Equities India Pte Ltd DB House, Ground Floor Hazarimal Somani Marg Fort, Mumbai 400 001 India Tel: (91) 22 5658 4600 Fax: (91) 22 2201 9094
Deutsche Securities Inc. Level 20, 2-11-1 Nagatacho Sanno Park Tower Chiyoda-ku, Tokyo 100-6171 Japan Tel: (81) 3 5156 6701 Fax: (81) 3 5156 6700
Deutsche Bank (Malaysia) Berhad Level 18-20 Menara IMC 8 Jalan Sultan Ismail Kuala Lumpur 50250 Malaysia Tel: (60) 3 2053 6760 Fax: (60) 3 2026 3906
In association with Deutsche Regis Partners, Inc. Level 23, Tower One Ayala Triangle, Ayala Avenue Makati City, Philippines Tel: (63) 2 894 6600 Fax: (63) 2 894 6638
Deutsche Securities Korea Co. 17th Floor, YoungPoong Bldg., 33 SeoRin-Dong, Chongro-Ku, Seoul (110-752) Republic of Korea Tel: (82) 2 316 8888 Fax: (82) 2 316 8998
Deutsche Securities Asia Ltd. Singapore Branch One Raffles Quay #18-00 South Tower Singapore 048583 Tel: (65) 6423 8001 Fax: (65) 6837 2167
Deutsche Securities Asia Ltd Taiwan Branch Level 6 296 Jen-Ai Road, Sec 4 Taipei 106 Taiwan Tel: (886) 2 2192 2888 Fax: (886) 2 3707 8450
In association with TISCO Securities Co., Ltd TISCO Tower 48/8 North Sathorn Road Bangkok 10500 Thailand Tel: (66) 2 633 6470 Fax: (66) 2 633 6490
In association with PT Deutsche Verdhana Indonesia Deutsche Bank Building, 6th Floor, Jl. Imam Bonjol No.80, Central Jakarta, Indonesia Tel: (62 21) 318 9541 Fax: (62 21) 318 9560
International locations
Deutsche Bank Securities Inc. 60 Wall Street New York, NY 10005 United States of America Tel: (1) 212 250 2500
Deutsche Bank AG London 1 Great Winchester Street London EC2N 2EQ United Kingdom Tel: (44) 20 7545 8000 Fax: (44) 20 7545 6155
Deutsche Bank AG Große Gallusstraße 10-14 60272 Frankfurt am Main Germany Tel: (49) 69 910 41339
Deutsche Bank AG Deutsche Bank Place Level 16 Corner of Hunter & Phillip Streets Sydney, NSW 2000 Australia Tel: (61) 2 8258 1234 Fax: (61) 2 8258 1400
Deutsche Bank AG Level 55 Cheung Kong Center 2 Queen’s Road Central Hong Kong Tel: (852) 2203 8888 Fax: (852) 2203 6921
Deutsche Securities Inc. Level 20, 2-11-1 Nagatacho Sanno Park Tower Chiyoda-ku, Tokyo 100-6171 Japan Tel: (81) 3 5156 6701 Fax: (81) 3 5156 6700


![[123doc vn] - chuong1](https://static.fdokumen.com/doc/165x107/632587b2584e51a9ab0b9fa9/123doc-vn-chuong1.jpg)


![[kenhxaydung vn] - COFFA MAIKHOANAM](https://static.fdokumen.com/doc/165x107/631a6c43bb40f9952b01fff5/kenhxaydung-vn-coffa-maikhoanam.jpg)


![[Zukertort]The Colle Move by Move](https://static.fdokumen.com/doc/165x107/6333618d3108fad7760f05da/zukertortthe-colle-move-by-move.jpg)