Biomedical exploitation of self assembled peptide based nanostructures
Upload
independentCategory
view
6download
0
RSC Advances
PAPER
Publ
ishe
d on
30
Janu
ary
2015
. Dow
nloa
ded
by A
KA
DE
MIA
IM
JA
NA
DL
UG
OSZ
A o
n 09
/02/
2015
12:
47:5
8.
View Article OnlineView Journal | View Issue
Vibrational and e
aInstitute of Physics, Jan Dlugosz University i
42200 Czestochowa, Poland. E-mail: m.makbInstitute of Molecules and Materials of Le M
FrancecCentro de Investigacion y Estudios Avanzad
Cite this: RSC Adv., 2015, 5, 17396
Received 15th December 2014Accepted 30th January 2015
DOI: 10.1039/c4ra16400h
www.rsc.org/advances
17396 | RSC Adv., 2015, 5, 17396–1740
lectronic peculiarities of NiTiO3
nanostructures inferred from first principlecalculations
M. A. Ruiz Preciado,abc A. Kassiba,b A. Morales-Acevedoc and M. Makowska-Janusik*a
Structural, electronic and vibrational properties of nanostructured (NiTiO3)n clusters were calculated by
numerical models based on DFT and semi-empirical quantum chemistry codes. The clusters were built
by using the initial atomic positions of crystalline ilmenite, which were relaxed to ensure stable and
energetically favourable geometries. For the electronic properties, the semi-empirical PM6
parameterisation method was used to evaluate the HOMO–LUMO energy differences versus nanocrystal
sizes. The quantum confinement effect was induced with cluster size reduction. Theoretical UV-Vis
absorption and Raman spectroscopy showed the drastic influence of the surface characteristics on the
electronic and the vibrational properties of the nanoclusters. Theoretically, it was proved that powder
NiTiO3 exhibits a patchwork of the properties of the bulk ilmenite material, amorphous Ni–Ti–O
structures and atoms located at the surface of the investigated cluster.
Introduction
Photocatalytic processes have been intensively discussed andinvestigated in the last two decades, due to their potentialapplications in solving problems of waste in the environment oralternatively in creating new sources of energy.1,2 For example, itcan be mentioned that photocatalytic reactions contribute tothe remediation of environmental pollution by the degradationof organic compounds or to the production of hydrogen by thedissociation of water for renewable energy.3–9 These processesare based on photoinduced charge transfers caused by lightsources (visible or UV) in the semiconducting oxides.
Beyond its applications in photovoltaic devices, titaniumdioxide (TiO2) is one of the most efficient materials for photo-catalytic reactions and possesses the best performance, associ-ated with its good stability, versatile applications, non-toxicityand low cost.10–12 Photocatalytic reactions using TiO2 under UVirradiation have been carried out to remove different types ofimpurities from wastewater.13–16 The kinetics of the reactionsare characterized by short relaxation times to achieve thecomplete removal of pollutants. However, the need for UV toinduce the required charge transfer in the mentioned reactionslimits the performance of TiO2. Therefore, photocatalyticmaterials that operate under visible light irradiation areof interest, since the solar light spectrum can be exploited on
n Czestochowa, Al. Armii Krajowej 13/15,
ans, Universite du Maine, 72085 Le Mans,
os del IPN, Unidad Zacatenco, Mexico
4
a large scale to activate high performance photocatalyticreactions.
The perovskite-type oxides, such as tantalates and titanates,have recently attracted much attention, because of their highphotocatalytic activities under UV irradiation and, moreremarkably, under visible light.17–19 These titanates, such asATiO3 (A ¼ Ca, Bi, Pb, Fe, Co, Mn, Ni, Cu, and Zn) have beenstudied as functional inorganic materials with many applica-tions as electrodes for solid oxide fuel cells, metal–air barriers,gas sensors, solid lubricants, and high-performance cata-lysts.20–22 Among these materials, we consider the transitionmetal titanates, such as FeTiO3, CoTiO3, MnTiO3, NiTiO3, etc.,that crystallize in the ilmenite structure under atmosphericpressure.23–26 They are of particular interest due to their versatileelectrical and magnetic properties, such as their antiferromag-netic behavior.27,28 The related properties of several titanateoxides have been investigated experimentally and theoretically.FeTiO3 is of interest as a natural mineral and a major source oftitanium for the commercial production of TiO2. The electronic,magnetic, structural and elastic properties of bulk FeTiO3 havebeen computed using the density functional theory (DFT)formalism and ab initio calculations.23–25 Within suchapproaches, the electronic ground-state properties and thecharge transfer involved in FeTiO3 were determined by thestrong coupling of the structure with the charge distribution.The quantum-mechanical description of these features is verysensitive to the treatment of electronic exchange and correla-tion energies. This allows us to conclude that the metal tita-nates are strongly correlated systems and therefore the electroncorrelation part should be taken into account sufficiently.
This journal is © The Royal Society of Chemistry 2015

Table 1 Lattice parameters and atomic fractional coordinates of theNiTiO3 crystal structures
Atom name x/a y/b z/c
Ni 0 0 0.3499(1)Ti 0 0 0.1441(1)O 0.3263(7) 0.0214(10) 0.2430(3)Cell parameters a ¼ b ¼ 5.0289(1) A, c ¼ 13.7954(2) A,
a ¼ b ¼ 90�, g ¼ 120�
Space group R�3 (no. 148)
Paper RSC Advances
Publ
ishe
d on
30
Janu
ary
2015
. Dow
nloa
ded
by A
KA
DE
MIA
IM
JA
NA
DL
UG
OSZ
A o
n 09
/02/
2015
12:
47:5
8.
View Article Online
The present work reports theoretical approaches to modelthe nanostructures and simulate the electronic and vibrationalproperties of NiTiO3 nanoclusters. Comparative studies werealso performed by using bulk crystal, with its innite andperiodic structure. Previous theoretical approaches developedby Xin et al.29 were used to compute the electronic properties ofthe bulk and innite NiTiO3 system. However, to the best of ourknowledge no particular models have been developed tocompute and predict the physical properties of the NiTiO3
nanostructures. The study of nanosized systems, with regard tothe critical role of the specic active surface in physicalphenomena, is of great interest. Particularly, because theinterfaces between the active material and the surroundingmedia contribute critically to the efficiency of heterogeneouscatalysis. However, developing theoretical models and numer-ical simulations to predict the electronic, optical, structural,vibrational and related properties of nanoparticles is a chal-lenging task. The numerical approach presented here waspartially used in our former studies devoted to functionalsemiconducting systems.30–32 The nanostructures were builtfrom their native bulk crystals with specied atomic positionsas involved in dened space groups. Also, in this work, themodeling of bulk systems is of primary importance in devel-oping the methodology for establishing the structural, vibra-tional and electronic properties of nanostructures. Thequantum chemical calculations were based on rst-principlescalculations using the ultraso pseudopotential of the plane-wave within the DFT formalism. The generalized gradientapproximation extended by Hubbard parameters was used toevaluate the electronic properties of the NiTiO3 bulk crystal.
The original task in this work consisted of modeling thecrystal structure at the nanoscale, including the relaxation ofthe outermost surface atoms with suitable treatment. Thechanges in their electronic and vibrational properties wereaccurately described as a function of the structural features ofthe investigated nanoclusters. Also the inuence of the surfaceon the physical properties of the clusters was demonstrated.The simulation of electronic band structures claried thecharge transfer characteristics. This approach paves the way toelucidating the mechanisms behind the photocatalytic activityof the nanosized NiTiO3 materials. The theoretical results arecompared to the data obtained by experimental investigationsof the relevant features of NiTiO3 nanostructures.
Fig. 1 The unit cell of crystalline NiTiO3 (left) and the unpassivatednanocrystalline structure made by the formula (NiTiO3)82 (right).
Computational details and clusterbuilding methodology
The crystal structures were computed for two different cong-urations of the material. One of them was considered torepresent the bulk NiTiO3 monocrystal crystallized in theilmenite phase; i.e. space group R3�(no. 148).33 The second waschosen to be a nanocrystalline cluster of varying size, possess-ing the ilmenite structure in the core. Therefore, the unit cell ofilmenite NiTiO3 was built using the cell parameters a ¼ b ¼5.0289 A, c ¼ 13.7954 A and the angular parameters a ¼ b ¼ 90�
and g ¼ 120�. The positions of representative atoms within the
This journal is © The Royal Society of Chemistry 2015
unit cell are summarized in Table 1. The crystal structure ofNiTiO3 was built using the Materials Studio Program Package.The same simulation soware was used to build the (NiTiO3)nnanostructures with diameters from 0.6 nm up to 2.6 nm,associated with clusters composed of (NiTiO3)2 and (NiTiO3)183units, respectively. Consequently, all of the investigated nano-crystals exhibited spherical shapes and stoichiometric compo-sitions. According to our previous work on other classes ofnanocrystalline systems, dangling bonds were not speciallysaturated.31 The unit cell of the monocrystal and themorphology of the (NiTiO3)82 cluster are depicted in Fig. 1.
The electronic properties of the NiTiO3 single crystal werecalculated using the DFT methodology. The quantum chemicalcalculations were performed using the Cambridge Serial TotalEnergy Package (CASTEP);34 i.e. the module of the MaterialsStudio Program. The CASTEP is based on the evaluation andanalysis of the total energy inferred from the plane-wave pseu-dopotential method. The rst task deals with the geometryoptimisation of the investigated crystal structure, which is builtand evaluated with respect to the total energy minimizationwithin the Broyden–Fletcher–Goldfarb–Shanno (BFGS) algo-rithm.35 During the geometry optimisation procedure, thesymmetry of the structure was frozen but the size of the unit cellwas allowed to change. The convergence criteria for the opti-mization procedure were chosen as hereaer outlined. Theconvergence of the total energy during the geometry optimiza-tion procedure cannot be greater than 2� 10�5 eV per atom, theforce on the atom must be less than 0.01 eV A�1, the stress onthe atom less than 0.02 GPa and the maximal atomicdisplacement no more than 5 � 10�4 A. The electron exchange–correlation energy was treated within the framework of thegeneralized gradient approximation (GGA) using Perdew–Burke–Ernzerhof (PBE)36 potential. To accelerate the
RSC Adv., 2015, 5, 17396–17404 | 17397

RSC Advances Paper
Publ
ishe
d on
30
Janu
ary
2015
. Dow
nloa
ded
by A
KA
DE
MIA
IM
JA
NA
DL
UG
OSZ
A o
n 09
/02/
2015
12:
47:5
8.
View Article Online
computational runs, the ultraso pseudopotential formalismwas used. In this frame, calculations were performed for Ti (3d2
4s2), Ni (3d8 4s2) and O (2s2 2p4) electrons. The cut-off energy ofthe plane-wave basis set was chosen to be equal to 500 eV. Theintegration by numerical sampling for specic directions overthe Brillouin zone (BZ) were carried out using the Monkhorst–Pack method with an 8 � 8 � 8 special k-point mesh. The totalenergy convergence criterion was assumed to be fullled whenthe self-consistent eld (SCF) tolerance; i.e. equal to 10�5 eV peratom.
The electronic properties of the NiTiO3 crystal werecomputed using the above-mentioned parameters, as speciedfor the geometry optimization procedure. The calculationswere carried out in spin restricted as well as spin unrestrictedprocedures, applying the GGA/PBE potential and Heyd–Scu-seria–Ernzerhof (HSE06) range-separated hybrid func-tional.37,38 Hummer et al.39 showed that the HSE06 functionalyields the correct electronic band structure for the semi-conductors of group-IV. Also the work of Spiewak et al.40 showsthat the HSE06 potential may better reproduce the electronicproperties of Ge single crystals with defects. Contrary to this,other works indicate that the range-separated functionalsshow improvements for strong charge transfer systems.41,42 Itis generally known that classical DFT potentials do notcorrectly reproduce far-nucleus asymptotic behaviour43,44 andunderestimate the excitation energies, notably for chargetransfer processes.45 The range-separated potentials lead tothe partitioning of the total exchange energy into short-rangeand long-range contributions:
EX ¼ EsrX + Elr
X. (1)
To improve the exchange functional, in terms of calculatingthe long-range electron–electron interactions using the HFexchange integral, the standard error function is used. Therepulsion electron operator is also divided into short-range andlong-range parts and can be dened for two electrons at the rijdistance as:
1
rij¼ 1� �
aþ berf�mrij
��
rijþ aþ berf
�mrij
�
rij: (2)
where the a and b parameters dene the exact exchangepercentages between the short and long-range exchange func-tional. m represents the weighting factor, which controls theseparation between the short-range exchange functional andthe long-range part of the HF exchange integral.
The Kohn–Sham equation was also solved using the GGA/PBE functional extended by the Hubbard parameters. Theintroducedmethodology contributes to precise insights into theelectronic properties of the material. The major drawback of allfunctionals lies in the underestimation of the calculated elec-tronic band gap.46 This is frequently encountered due to theapproximate calculations of the electron self-interaction ener-gies. Also, pure local density approximations (LDA),47 general-ized gradient approximations (GGA)48 and even hybridfunctionals49–51 can lack precision in some instances, due to so-called “strongly correlated” systems.
17398 | RSC Adv., 2015, 5, 17396–17404
One relevant solution for describing correlated electrons insolids concerns the Hubbard model,52 based on an extendedLDA approach, also referred to as LDA + U. It decreases theelectron self-interaction error by selectively adding an energycorrection to localized electron states, such as d or f orbitalswhere the self-interaction is particularly large. To construct anappropriate functional, the LDA + U approach subdivides thecharge density into two subsystems with delocalized andlocalized features. In the multiband Hubbard model the effec-tive LDA + U energy functional is written as:
ELDA+U ¼ ELDA + EHF(nmn) � Edc(nmn) (3)
where ELDA denotes the standard LDA energy functional, EHF isthe Hartree–Fock (HF) functional, Edc is the double countingterm and nmn is one particle density matrix. The HF part can bewritten as follows:
EHFðnmnÞ ¼ 1
2
XðU1324 �U1342Þn12n34 (4)
where the U1324 terms represent the renormalized Coulombintegrals. In the LDA + U approach, the Kohn–Sham equation issupplemented by the non-local potential. On the other hand,the DFT/Hubbard method fails to compute the correct energydifference between systems with localized/correlated anddelocalized/uncorrelated electronic states.53 In such anapproach, the LDA/GGA + Umethodology has successfully beenapplied to compute the electronic properties of different ternaryoxides, such as CuAlO2,54 CuAl2O4,55 Pr2Ti2O7 or Ce2Ti2O7,56 andMnFe2O4.57 Based on the outlined theoretical framework, theinuence of the Hubbard parameter U on the electronic prop-erties of NiTiO3 was investigated for the crystalline structure inbulk material or in nanosized clusters, taking into account thestrong correlation of the d-orbital electrons.
In the present work, the electronic properties of the (NiTiO3)nnanoclusters were also calculated. To our knowledge, it is rsttime that nickel titanate nanostructures have been studiedtheoretically. The methodology requires two different calcula-tion codes to perform the simulations and also to ensure theirstability. Thus, the Gaussian09 and MOPAC (Molecular OrbitalPACkage)58 quantum chemistry programs were used. Withregard to the size of the investigated clusters, semiempiricalsingle point calculations were performed, applying the param-eterized self-consistent restricted HF (SCF RHF) PM6 method.59
The convergence of the SCF procedure was achieved with anenergy uncertainty not greater than 10�6 hartrees and no morethan 150 required iterations. Within such approaches, theelectronic properties of two different cluster families werecomputed. The rst one deals with (NiTiO3)n clusters possess-ing an ilmenite crystal structure without any reconstruction.The second considers the same clusters as specied previously,but their geometries were optimised according to the totalenergy minimization. The geometry of all clusters was speciedin Cartesian coordinates with C1 symmetry. The gradientconvergence tolerance was equal to 10�6 hartrees bohr�1 usingthe quadratic approximation (QA) method,60–62 updating theHessian matrix during the optimization. The Hessian
This journal is © The Royal Society of Chemistry 2015

Paper RSC Advances
Publ
ishe
d on
30
Janu
ary
2015
. Dow
nloa
ded
by A
KA
DE
MIA
IM
JA
NA
DL
UG
OSZ
A o
n 09
/02/
2015
12:
47:5
8.
View Article Online
evaluation was performed to exclude the structures giving riseto negative frequency modes.
Fig. 3 Electron density projection in a selected plane of the NiTiO3
ilmenite structure.
Results and discussionStructure and electronic properties of bulk ilmenite NiTiO3
The GGA/PBE functional was used to build the stable NiTiO3
crystal geometry and to calculate the related physical responses.In the rst step, the geometry optimization of the crystalstructure was performed. The changes to the optimised atomicdistances were less than 5% compared to the starting valuesfrom the dened crystallographic data. It is in agreement withthe former report by Xin et al.29 The noticed departures fromthese values could be attributed to the fact that the presentcalculations were performed at T ¼ 0 K, whereas the experi-mental structural data measurements were generally performedat room temperature. Thus, the relatively low deviation betweenthe optimized values and experimental structural data indicatesthat GGA/PBE is a suitable computational functional for thedescription of the structures of the NiTiO3 crystal. Following theperformed geometry optimization, one may conclude that theilmenite NiTiO3 structure appears as the layered organisationdepicted in Fig. 2 (le-hand panel), where Ti and Ni atoms formthe layers separated by oxygen atoms.
The electronic properties of the NiTiO3 crystal werecomputed within the spin polarized approach for a primitiveunit cell (see Fig. 2). The band structure calculations were per-formed in the k space within the BZ directions shown in Fig. 2(right-hand panel). The DFT/HSE06 functional gives unsatis-factory results. The obtained energy gap is equal to 1.23 eV,whereas the experimental data are within 2.12–2.18 eV.63–65 Also,the DFT/PBE functional was considered with and without theHubbard approximation. Thementioned functional without theHubbard approximation and in the spin polarized regime givesan energy gap equal to 0.77 eV for the NiTiO3 crystal. This showsthat using nonempirically tuned range-separated DFT methodsresults in a signicant improvement over traditional GGAfunctionals but does not give good results for the studiedcrystal. The large discrepancies suggest the presence of stronglycorrelated electrons from the considered (Ti and Ni) ions,leading to the necessity to explore the Hubbard approximationin such systems. Within the approach based on the DFT/PBE
Fig. 2 Primitive unit cell of NiTiO3 (left) and the correspondingreciprocal lattice (right) with the coordinates of the special points ofthe BZ: F (1/2, 1/2, 0); G (0, 0, 0); K (1/4, 1/4, 1/4) and Z (1/2, 1/2, 1/2).
This journal is © The Royal Society of Chemistry 2015
potential, the electron density depicted in Fig. 3 also informsus about the covalent character of the O–Ti, O–Ni and Ti–Nibonds. This behavior indicates the nature of the stronglycorrelated system and the necessity to develop the theoreticalfunctional to reconcile the predicted electronic features withthe experimental ndings.
The functional modied by the Hubbard approximation usesparameters that can be chosen for Ti 3d and Ni 3d valenceelectrons in order to evaluate the energy band gap values. Theinuence of the chosen Hubbard parameter U on the obtainedband gaps is demonstrated in the summary in Table 2. Thecorrect evaluation of the electronic behaviour, in agreementwith experimental ndings, requires xed Hubbard parametersat 3.5 eV and 4.5 eV for Ti 3d and Ni 3d electrons, respectively.Thus, the DFT/PBE + U method may provide a satisfactoryqualitative electronic structure calculation with the correctchoice of the Hubbard parameters. The electronic band struc-ture computed with UTi¼ 3.5 eV and UNi¼ 4.5 eV is presented inFig. 4. This plot indicates that the NiTiO3 structure exhibits adirect semiconducting nature with an energy gap equal to 2.33eV. Its spin polarized character is also included in the predictedelectronic features. Thus, the top of the valence band isconstituted by spin polarized alpha electrons while the bottomof the conduction band is composed of the beta state. Inaddition, the partial density of states depicted in Fig. 5 showsthat the spin polarized alpha electrons with energies at the topof the valence band derive from the hybridization of Ni 3d and O2p orbitals; while hybridization of the Ti 3d and Ni 3d statesdenes the electronic structure at the bottom of the conductionband, in agreement with the previous work of Salvador et al.66
The energy dispersion of the electronic states allows us tocalculate the effective masses of charge carriers. The diagonalelements of the effective mass tensor for electrons and holes arecalculated as the energy derivatives around the K point of theBZ, following the equations:
Table 2 Hubbard U parameter values for the Ti d and Ni d orbitals andthe energy gap value calculated by the DFT/PBE + U methodology
Ti 3d Ni 3d Eg [eV]
0 0 0.772.5 2.5 1.753.5 4.5 2.334.5 3.5 1.944.5 4.5 2.46
RSC Adv., 2015, 5, 17396–17404 | 17399

Fig. 4 Electron band structure calculated by the DFT/PBE functionalwithin the Hubbard approximation U. The energy levels with spinpolarized alpha electrons (black) and energy levels with a beta state(red) are shown.
Fig. 5 Electron density of state (DOS) calculated for the NiTiO3
ilmenite structure by using the DFT/PBE functional augmented by the
RSC Advances Paper
Publ
ishe
d on
30
Janu
ary
2015
. Dow
nloa
ded
by A
KA
DE
MIA
IM
JA
NA
DL
UG
OSZ
A o
n 09
/02/
2015
12:
47:5
8.
View Article Online
1
m*eij
¼ 1
ħ2v2EcðkÞvkivkj
and1
m*hij
¼ 1
ħ2v2EvðkÞvkivkj
(5)
The effective mass of electrons and holes is determined bytting the conduction and valence bands (see Fig. 4), respec-tively, to parabolic functions. One may see that the top of thevalence band and bottom of the conduction band are symmetricaround the K point of the BZ. In this case, the calculatedeffective masses of the electrons and holes are equal to m*
e ¼2.0986me and m*
h ¼ 0.6836me, with the same values in both theK–Z and K–G directions of the BZ. The relatively high values ofthe reported parameters suggest that the mobility of charges inthe investigated NiTiO3 single crystal is relatively low. Thisresult is of particular importance for the very low electricalconductivity (10�9 S m�1) achieved in NiTiO3 at moderatetemperatures up to 200 �C.67 The performed calculationsconrm that in the studied material the electrical conductionobserved at temperatures below 700 K seems to be extrinsic,governed by impurities, interstitial sites, etc. It takes place viathe small polaron hopping mechanism.64
Hubbard approximation: polarized alpha electrons (top) and betaelectrons (bottom).
Nanocrystalline ilmenite NiTiO3 clusters
Structural and electronic features. Structural and electronicproperties of NiTiO3 nanocrystals were investigated for nano-particles made of the ilmenite bulk material. The investigatednanostructures possess a spherical shape with a variablenumber of (NiTiO3)n units, from n ¼ 2 up to 183. The singlepoint DFT/PBE and DFT/HSE06 calculations were performed forclusters with n from 2 up to 20, but the results did not show thecorrect behaviour of the energy difference between the highestunoccupied molecular orbital (HOMO) and lowest unoccupiedmolecular orbital (LUMO) versus the size of the cluster. It isknown that the standard DFT scheme is not useful for nite-sized objects because the asymptotic potential, absent in thebulk material, plays a crucial role in the cluster energy due tothe addition and removal of electrons. This leads to the
17400 | RSC Adv., 2015, 5, 17396–17404
calculated energy gaps for nite-sized objects oen being muchsmaller than the real gaps.68
Contrary to the results obtained by DFT, the PM6 semi-empirical methodology was successfully applied for such clus-ters, leading to the correct estimation of the energy gap innanosized NiTiO3. In Fig. 6, the computed energy differencesDEHOMO–LUMO versus the cluster sizes are depicted. The reportedenergy gap splitting as a function of the (NiTiO3)n unitsdemonstrates the size induced quantum connement effect.This is in agreement with the experimental report69 on NiTiO3
nanoparticles that give rise to a blue shi in the absorptionspectra compared to the bulk material. The DEHOMO–LUMO valuereaches saturation for clusters comprising n $ 50 (NiTiO3)n
This journal is © The Royal Society of Chemistry 2015
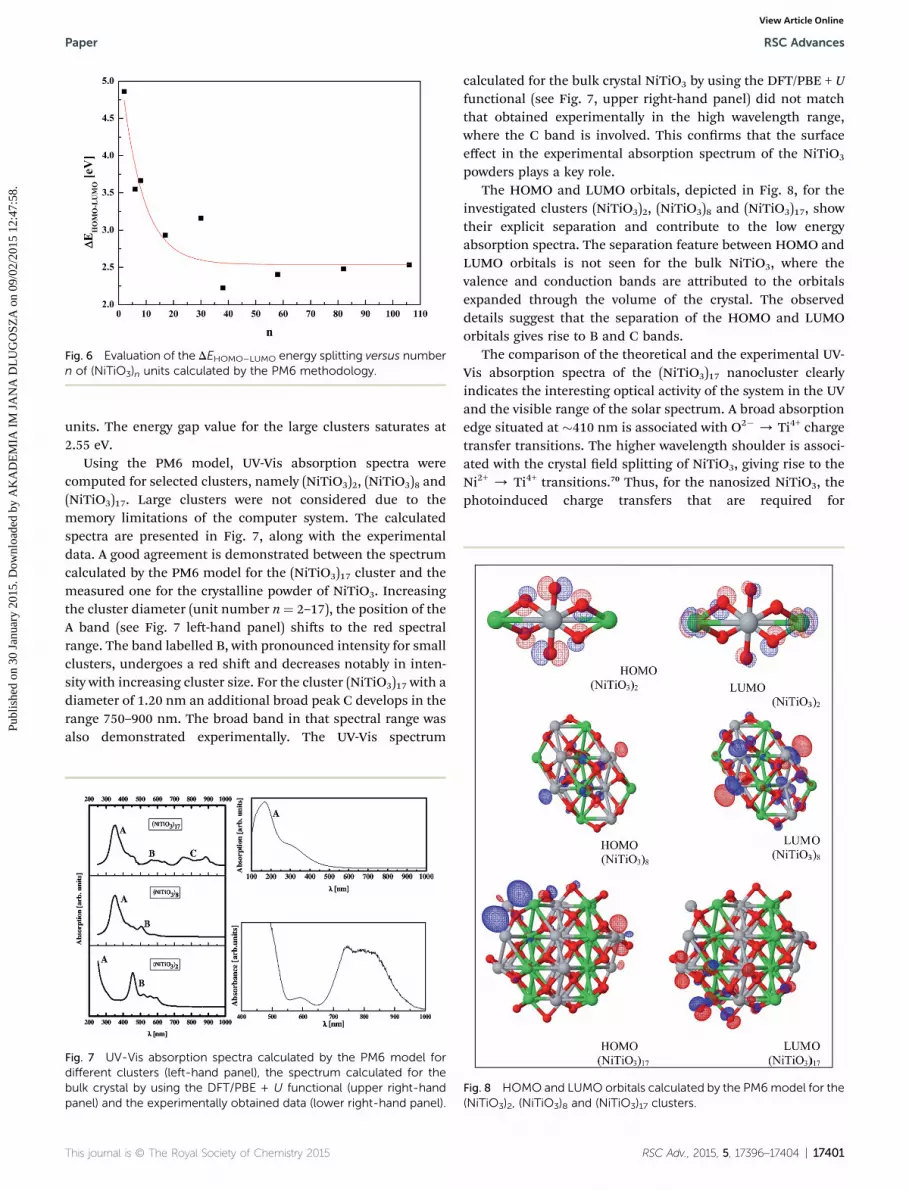
Fig. 6 Evaluation of the DEHOMO–LUMO energy splitting versus numbern of (NiTiO3)n units calculated by the PM6 methodology.
Paper RSC Advances
Publ
ishe
d on
30
Janu
ary
2015
. Dow
nloa
ded
by A
KA
DE
MIA
IM
JA
NA
DL
UG
OSZ
A o
n 09
/02/
2015
12:
47:5
8.
View Article Online
units. The energy gap value for the large clusters saturates at2.55 eV.
Using the PM6 model, UV-Vis absorption spectra werecomputed for selected clusters, namely (NiTiO3)2, (NiTiO3)8 and(NiTiO3)17. Large clusters were not considered due to thememory limitations of the computer system. The calculatedspectra are presented in Fig. 7, along with the experimentaldata. A good agreement is demonstrated between the spectrumcalculated by the PM6 model for the (NiTiO3)17 cluster and themeasured one for the crystalline powder of NiTiO3. Increasingthe cluster diameter (unit number n¼ 2–17), the position of theA band (see Fig. 7 le-hand panel) shis to the red spectralrange. The band labelled B, with pronounced intensity for smallclusters, undergoes a red shi and decreases notably in inten-sity with increasing cluster size. For the cluster (NiTiO3)17 with adiameter of 1.20 nm an additional broad peak C develops in therange 750–900 nm. The broad band in that spectral range wasalso demonstrated experimentally. The UV-Vis spectrum
Fig. 7 UV-Vis absorption spectra calculated by the PM6 model fordifferent clusters (left-hand panel), the spectrum calculated for thebulk crystal by using the DFT/PBE + U functional (upper right-handpanel) and the experimentally obtained data (lower right-hand panel).
This journal is © The Royal Society of Chemistry 2015
calculated for the bulk crystal NiTiO3 by using the DFT/PBE + Ufunctional (see Fig. 7, upper right-hand panel) did not matchthat obtained experimentally in the high wavelength range,where the C band is involved. This conrms that the surfaceeffect in the experimental absorption spectrum of the NiTiO3
powders plays a key role.The HOMO and LUMO orbitals, depicted in Fig. 8, for the
investigated clusters (NiTiO3)2, (NiTiO3)8 and (NiTiO3)17, showtheir explicit separation and contribute to the low energyabsorption spectra. The separation feature between HOMO andLUMO orbitals is not seen for the bulk NiTiO3, where thevalence and conduction bands are attributed to the orbitalsexpanded through the volume of the crystal. The observeddetails suggest that the separation of the HOMO and LUMOorbitals gives rise to B and C bands.
The comparison of the theoretical and the experimental UV-Vis absorption spectra of the (NiTiO3)17 nanocluster clearlyindicates the interesting optical activity of the system in the UVand the visible range of the solar spectrum. A broad absorptionedge situated at �410 nm is associated with O2� / Ti4+ chargetransfer transitions. The higher wavelength shoulder is associ-ated with the crystal eld splitting of NiTiO3, giving rise to theNi2+ / Ti4+ transitions.70 Thus, for the nanosized NiTiO3, thephotoinduced charge transfers that are required for
Fig. 8 HOMO and LUMO orbitals calculated by the PM6model for the(NiTiO3)2, (NiTiO3)8 and (NiTiO3)17 clusters.
RSC Adv., 2015, 5, 17396–17404 | 17401

RSC Advances Paper
Publ
ishe
d on
30
Janu
ary
2015
. Dow
nloa
ded
by A
KA
DE
MIA
IM
JA
NA
DL
UG
OSZ
A o
n 09
/02/
2015
12:
47:5
8.
View Article Online
photocatalytic reactions may be ensured by several electronictransitions covering the UV and visible light range. Thesecontribute to the efficient photocatalytic activity. Finally, it isworth noting that the resolved details on the theoreticalabsorption spectra are induced by calculations performedwithout any inuence from the temperature on the structuralrelaxation of the NiTiO3 clusters. The possibility of reconcilingthe shapes of the absorption bands between the theory andexperiments may be realized through the electron–phononinteractions and the Franck–Condon rule for the optical tran-sition probabilities, as was used in our previous work.71
Raman spectroscopy of nanocrystalline NiTiO3. Taking intoaccount the effect of electron–phonon interactions, the evalu-ation of the Raman spectra related to the selected clusters wereperformed using the PM6 approach. The Raman spectra werecalculated using the standard procedure implemented in theGaussian program package. The calculations were performedon two (NiTiO3)17 clusters. In one of these, the ilmenite crystalstructure was frozen and the other system possessed a surfacereconstructed using the geometry optimization procedureaccording to the total energy minimization criterion. The lastcluster was characterized by a completely amorphous network.The experimental and calculated Raman spectra modeled forthe (NiTiO3)17 nanoclusters and for the NiTiO3 powder aredepicted in Fig. 9.
For the cluster (NiTiO3)17 with a primarily ilmenite structure,the calculations show only a single mode at position C. Theexperimental Raman spectrum shows an intense band with awavenumber position in agreement with the calculated value.The C band is also the most intense detail in the experimentalRaman spectrum. The titanates, such as NiTiO3, CoTiO3 andNa4TiO4, possess hexacoordinated Ti–O–Ti groups and theirRaman modes are associated with the main band, located at705, 688, 737 cm�1, respectively.72–74 Therefore, it was estab-lished that the Ti–O–Ti stretching mode should appear in thevicinity of 700 cm�1. For NiTiO3, the band at 720 cm�1 corre-sponds to the Ti–O–Ti vibration of the crystal structure.
Fig. 9 Raman spectra for the (NiTiO3)17 nanoparticles calculated bythe parametrised PM6 method as well as experimental spectrum.
17402 | RSC Adv., 2015, 5, 17396–17404
The Raman bands named A, B and D, with relatively lowintensities compared to the C band, are associated to the fulloptimization and relaxation of the nanocluster structures. Thisprocedure, which leads to stable amorphous networks, ensuresmolecular bonding distortions, including changes to bondlengths and angles. Such structural changes modify the vibra-tional features and, as shown experimentally and theoretically,cause new Raman bands to appear. A superposition of the mainRaman band (90%) for O–Ti–O stretching and the secondarybands (10%) related to the amorphous structure leads to atheoretical Raman spectrum that reproduces the features of theexperimental one. The slight departures from the experimentalband positions may be explained by the fact that anharmonicvibration terms were not considered in the calculation model.The main origin may be related to bond frequency distributionsdue to amorphization or the occurrence of vacancies or antisitescontributing to the damping and frequency shis of Ramanmodes.75,76 In this frame, it was proved that the bands located at617 and 690 cm�1 originate from the stretching of Ti–O andbending of O–Ti–O bonds, while the contribution at 547 cm�1
results from Ni–O bonds.69
As illustrated from the theoretical analysis and the experi-mental Raman investigations, the organization of the powdermaterial is fully accounted for in the analysis that has beencarried out. The particle core brings the signature features ofthe innite and bulk crystal, while the outermost particlesurface accounts for the amorphous features. This is presum-ably due to the manifestation of surface states with the relaxa-tion and reconstruction of the outermost particle layers.
Conclusions
The electronic, optical and vibrational properties of (NiTiO3)nnanostructures were investigated and compared to those ofbulk ilmenite NiTiO3. The investigated nanostructures possessa spherical shape with the number of (NiTiO3)n units modiedfrom n¼ 2 up to 183. The PM6 semi-empirical methodology wasable to provide a valuable estimation of the energy gap innanosized NiTiO3 structures. The value of the DEHOMO–LUMO
saturates at 2.55 eV for the clusters comprising at least n ¼ 50(NiTiO3)n units. The UV-Vis absorption spectra were calculatedusing the PM6 methodology for nanostructures and comparedwith those obtained experimentally. The obtained spectraconrm that the surface effects in NiTiO3 powders contributewith additional band edges. The comparison of the theoreticaland the experimental UV-Vis absorption spectra obtained forthe (NiTiO3)17 nanocluster clearly indicates the promisingoptical activity of the system in the UV and the visible range ofthe solar spectrum. The NiTiO3 nanoclusters also exhibit otherrelevant properties required for efficient photocatalysis.
The calculated Raman spectra for the NiTiO3 clusters showthe noticeable contribution of the surface to the vibrationalproperties. Among the features of the Raman spectra, thoserelated to active modes of the ilmenite structure and thoseinferred from amorphous NiTiO3 can be distinguished. Thetheoretical superposition of a Raman band that constitutes 90%of the band intensity, and is associated with the O–Ti–O
This journal is © The Royal Society of Chemistry 2015

Paper RSC Advances
Publ
ishe
d on
30
Janu
ary
2015
. Dow
nloa
ded
by A
KA
DE
MIA
IM
JA
NA
DL
UG
OSZ
A o
n 09
/02/
2015
12:
47:5
8.
View Article Online
stretching mode, and secondary less intense bands (10%),related to the amorphous structure, represents the mainfeatures of the experimental spectrum.
Finally, the present work points out the relevant opticalproperties of the NiTiO3 clusters that allow them to harvestvisible light for efficient photocatalytic reactions. However, thelow mobility of charge carriers, demonstrated from the effectivemass estimation, leaves open questions that can be solved usinga doping procedure. This is a matter of current development.
Acknowledgements
Calculations have been carried out in Wroclaw Center forNetworking and Supercomputing <http://www.wcss.wroc.pl>(Grant no. 171). The MATERIALS STUDIO package was usedunder POLAND COUNTRY-WIDE LICENSE. The authorsacknowledge the nancial support of Polonium program 31300TA – 2014 for researchers’ mobility. Marco Ruiz acknowledgesthe doctoral school 3MPL and CONACyT-Mexico for the nan-cial support.
Notes and references
1 L. Linsebigler, G. Lu and J. T. Yates Jr, Chem. Rev., 1995, 95,735.
2 K. Nakata and A. Fujishima, J. Photochem. Photobiol., C, 2012,13, 169.
3 S. Bagwasi, B. Tian, J. Zhang and M. Nasir, Chem. Eng. J.,2013, 217, 108.
4 C. L. Torres-Martinez, R. Kho, O. I. Mian and R. K. Mehra, J.Colloid Interface Sci., 2001, 240, 525.
5 A. Di Paola, E. Garcıa-Lopez, G. Marcı and L. Palmisano, J.Hazard. Mater., 2012, 211–212, 3.
6 Y. Liu, G. Su, B. Zhang, G. Jiang and B. Yan, Analyst, 2011,136, 872.
7 D. Deng, S. T. Martin and S. Ramanathan, Nanoscale, 2010, 2,2685.
8 M. M. Khin, A. Sreekumaran Nair, V. Jagadeesh Babu,R. Murugan and S. Ramakrishna, Energy Environ. Sci.,2012, 5, 8075.
9 K. Ariga, S. Ishihara, H. Abe, M. Lia and J. P. Hill, J. Mater.Chem., 2012, 22, 2369.
10 X. B. Chen, L. Liu, P. Y. Yu and S. S. Mao, Science, 2011, 331,746.
11 J. Thomas, K. P. Kumar and S. Mathew, Sci. Technol. Adv.Mater., 2011, 3, 59.
12 X. J. Xu, X. S. Fang, T. Y. Zhai, H. B. Zeng, B. D. Liu, X. Y. Hu,Y. Bando and D. Golberg, Small, 2011, 7, 445.
13 M. A. Lazar, S. Varghese and S. S. Nair, Catalysts, 2012, 2,572.
14 K. Hashimoto, H. Irie and A. Fuhjishima, Jpn. J. Appl. Phys.,2005, 44, 8269.
15 S. M. Gupta and M. Tripathi, Chin. Sci. Bull., 2011, 56, 1639.16 Y. Ruzmanova, M. Ustundas, M. Stoller and A. Chianese,
Chem. Eng. Transac., 2013, 32, 2233.
This journal is © The Royal Society of Chemistry 2015
17 W. F. Yao, X. H. Xu, H. Wang, J. T. Zhou, X. N. Yang,Y. Zhang, S. Shang and B. B. Huang, Appl. Catal., B, 2004,52, 109.
18 J. Kim, D. W. Hwang, H. G. Kim, S. W. Bae, S. M. Ji andJ. S. Lee, Chem. Commun., 2002, 2488.
19 H. G. Kim, D. W. Hwang and J. S. Lee, J. Am. Chem. Soc., 2004,126, 8912.
20 A. Navrotsky, Chem. Mater., 1998, 10, 2787.21 D. M. Giaquinta and H.-C. zur Loye, Chem. Mater., 1994, 6,
365.22 J. M. Neil, A. Navrotsky and O. J. Kleppa, Inorg. Chem., 1971,
10, 2076.23 N. C. Wilson, J. Muscat, D. Mkhonto, P. E. Ngoepe and
N. M. Harrison, Phys. Rev. B: Condens. Matter Mater. Phys.,2005, 71, 075202.
24 N. C. Wilson, S. P. Russo, J. Muscat and N. M. Harrison, Phys.Rev. B: Condens. Matter Mater. Phys., 2005, 72, 024110.
25 S. W. Chen, M. J. Huang, P. A. Lin, H. T. Jeng, J. M. Lee,S. C. Haw, S. A. Chen, H. J. Lin, K. T. Lu, D. P. Chen,S. X. Dou, X. L. Wang and J. M. Chen, Appl. Phys. Lett.,2013, 102, 042107.
26 F. J. Craig, Phys. Rev. Lett., 2008, 100, 167203.27 P. B. Fabritchnyi, M. V. Korolenko, M. I. Afanasov, M. Danot
and E. Janod, Solid State Commun., 2003, 125, 341.28 P. B. Fabritchnyi, A. Wattiaux, M. V. Korolenko,
M. I. Afanasov and C. Delmas, Solid State Commun., 2009,149, 1535.
29 C. Xin, Y. Wang, Y. Sui, Y. Wang, X. Wang, K. Zhao, Z. Liu,B. Li and X. Liu, J. Alloys Compd., 2014, 613, 401.
30 M. Makowska-Janusik and A. Kassiba, FunctionalNanostructures and Nanocomposites – NumericalModeling Approach and Experiment, in Handbook ofComputational Chemistry, ed. J. Leszczynski, Springer, 2012.
31 M. Makowska-Janusik, O. Gladii, A. Kassiba, J. Boucle andN. Herlin-Boime, J. Phys. Chem. C, 2014, 118, 6009.
32 H. Melhem, P. Simon, J. Wang, C. Di Bin, B. Ratier,Y. Leconte, N. Herlin-Boime, M. Makowska-Janusik,A. Kassiba and J. Boucle, Sol. Energy Mater. Sol. Cells, 2013,117, 624.
33 P. S. Anjana andM. T. Sebastian, J. Am. Ceram. Soc., 2006, 89,2114.
34 S. J. Clark, M. D. Segall, C. J. Pickard, P. J. Hasnip,M. J. Probert, K. Refson and M. C. Payne, Z. Kristallogr.,2005, 220, 567.
35 B. G. Pfrommer, M. Cate, S. G. Louie and M. L. Cohen, J.Comput. Phys., 1997, 131, 233.
36 J. P. Perdew, K. Burke and M. Ernzerhof, Phys. Rev. Lett.,1996, 77, 3865.
37 J. Heyd, G. E. Scuseria and M. Ernzerhof, J. Chem. Phys.,2003, 118, 8207.
38 J. Heyd, G. E. Scuseria and M. Ernzerhof, J. Chem. Phys.,2006, 124, 219906.
39 K. Hummer, J. Harl and G. Kresse, Phys. Rev. B: Condens.Matter Mater. Phys., 2009, 80, 115205.
40 P. Spiewak, J. Vanhellemont and K. J. Kurzydłowski, J. Appl.Phys., 2011, 110, 063534.
RSC Adv., 2015, 5, 17396–17404 | 17403

RSC Advances Paper
Publ
ishe
d on
30
Janu
ary
2015
. Dow
nloa
ded
by A
KA
DE
MIA
IM
JA
NA
DL
UG
OSZ
A o
n 09
/02/
2015
12:
47:5
8.
View Article Online
41 M. E. Foster and B. M. Wong, J. Chem. Theory Comput., 2012,8, 2682.
42 B. W. Wong, M. Piacenza and F. D. Sala, Phys. Chem. Chem.Phys., 2009, 11, 4498.
43 C. O. Almbladh and A. C. Pedroza, Phys. Rev. A, 1984, 29,2322.
44 M. Levy, J. P. Perdew and V. Sahni, Phys. Rev. A, 1984, 30,2745.
45 A. Dreuw, J. L. Weisman and M. Head-Gordon, J. Chem.Phys., 2003, 119, 2943.
46 M. S. Hybertsen and S. G. Louie, Phys. Rev. B: Condens. MatterMater. Phys., 1986, 34, 5390.
47 W. Kohn and L. J. Sham, Phys. Rev. A, 1965, 140, 1133.48 D. C. Langreth and J. P. Perdew, Phys. Rev. B: Condens. Matter
Mater. Phys., 1980, 21, 5469.49 P. J. Stephenset, F. J. Devlin, C. F. Chabalowski and
M. J. Frisch, J. Phys. Chem., 1994, 98, 11623.50 J. P. Perdew, M. Ernzerhof and K. Burke, J. Chem. Phys., 1996,
105, 9982.51 J. Heyd, G. E. Scuseria and M. Ernzerhof, J. Chem. Phys.,
2003, 118, 8207.52 V. I. Anisimov, J. Zaanen and O. K. Andersen, Phys. Rev. B:
Condens. Matter Mater. Phys., 1991, 44, 943.53 A. Jain, G. Hautier, S. P. Ong, C. J. Moore, C. C. Fischer,
K. A. Persson and G. Ceder, Phys. Rev. B: Condens. MatterMater. Phys., 2011, 84, 045115.
54 R. Laskowski, N. E. Christensen, P. Blaha and B. Palanivel,Phys. Rev. B: Condens. Matter Mater. Phys., 2009, 79, 165209.
55 Q. J. Liu and Z. T. Liu, Appl. Phys. Lett., 2011, 99, 091902.56 A. Sayede, R. Khenata, A. Chahed and O. Benhelal, J. Appl.
Phys., 2013, 113, 173501.57 J. R. Huang and C. Cheng, J. Appl. Phys., 2013, 113, 033912.58 MOPAC2012: Stewart, J. J. P. Stewart Computational
Chemistry, Colorado Springs: CO, http://OpenMOPAC.net.59 J. J. P. Stewart, J. Mol. Model., 2007, 13, 1173.
17404 | RSC Adv., 2015, 5, 17396–17404
60 J. Baker, J. Comput. Chem., 1986, 7, 385.61 T. Helgaker, Chem. Phys. Lett., 1991, 182, 503.62 P. Culot, G. Dive, V. H. Nguyen and J. M. Ghuysen, Theor.
Chim. Acta, 1992, 82, 189.63 Y. Qu, W. Zhou, Z. Ren, S. Du, X. Meng, G. Tian, K. Pan,
G. Wanga and H. Fu, J. Mater. Chem., 2012, 22, 16471.64 R. S. Singh, T. H. Ansari, R. A. Singh and B. M. Wanklyn,
Mater. Chem. Phys., 1995, 40, 173.65 J.-L. Wang, Y.-Q. Li, Y.-J. Byon, S.-G. Mei and G.-L. Zhang,
Powder Technol., 2013, 235, 303.66 P. Salvador, C. Gutierrez and J. B. Goodenough, Appl. Phys.
Lett., 1982, 40, 188.67 S. Yuvaraj, V. D. Nithya, K. Saiadali Fathima, C. Sanjeeviraja,
G. Kalai Selvan, S. Arumugam and R. Kalai Selvan, Mater.Res. Bull., 2013, 48, 1110.
68 T. Stein, H. Eisenberg, L. Kronik and R. Baer, Phys. Rev. Lett.,2010, 105, 266802.
69 R. Vijayalakshmi and V. Rajendran, E-J. Chem., 2012, 9, 282.70 K. P. Lopes, L. S. Cavalcante, A. Z. Simoes, J. A. Varela,
E. Longo and E. R. Leite, J. Alloys Compd., 2009, 468, 327.71 A. Kassiba, M. Makowska-Janusik, J. Boucle, J. F. Bardeau,
A. Bulou and N. Herlin-Boime, Phys. Rev. B: Condens.Matter Mater. Phys., 2002, 66, 155317.
72 Y. Su and M. L. Balmer, J. Phys. Chem. B, 2000, 104, 8160;G. Busca, G. Ramis, J. M. Gallardo Amcres, V. SanchezEscribano and P. Piaggio, J. Chem. Soc., Faraday Trans.,1994, 90, 3181.
73 F. X. Llabres i Xamena, A. Damin, S. Bordiga andA. Zecchina, Chem. Commun., 2003, 1514.
74 M. I. Baraton, G. Busca, M. C. Prieto, G. Ricchiardi andV. Sanchez Escribano, J. Solid State Chem., 1994, 112, 9.
75 B. A. Scott and G. Burns, J. Am. Ceram. Soc., 1972, 55, 225.76 J. B. Bellam, M. A. Ruiz-Preciado, M. Edely, J. Szade,
A. Jouanneaux and A. Kassiba, RSC Adv., 2015, 5, 10551.
This journal is © The Royal Society of Chemistry 2015
Copyright © 2022 FDOKUMEN