
Very different performance of the power Doppler modalities of several ultrasound machines...
6
RESEARCH ARTICLE Open Access Very different performance of the power Doppler modalities of several ultrasound machines ascertained by a microvessel flow phantom David F Ten Cate 1* , Jolanda J Luime 1 , Myrthe van der Ven 1 , Johanna MW Hazes 1 , Klazina Kooiman 2 , Nico de Jong 2 and Johannes G Bosch 2 Abstract Introduction: In many patients with rheumatoid arthritis (RA) subclinical disease activity can be detected with ultrasound (US), especially using power Doppler US (PDUS). However, PDUS may be highly dependent on the type of machine. This could create problems both in clinical trials and in daily clinical practice. To clarify how the PDUS signal differs between machines we created a microvessel flow phantom. Methods: The flow phantom contained three microvessels (150, 1000, 2000 microns). A syringe pump was used to generate flows. Five US machines were used. Settings were optimised to assess the lowest detectable flow for each US machine. Results: The minimal detectable flow velocities showed very large differences between the machines. Only two of the machines may be able to detect the very low flows in the capillaries of inflamed joints. There was no clear relation with price. One of the lower-end machines actually performed best in all three vessel sizes. Conclusions: We created a flow phantom to test the sensitivity of US machines to very low flows in small vessels. The sensitivity of the power Doppler modalities of 5 different machines was very different. The differences found between the machines are probably caused by fundamental differences in processing of the PD signal or internal settings inaccessible to users. Machines considered for PDUS assessment of RA patients should be tested using a flow phantom similar to ours. Within studies, only a single machine type should be used. Introduction Rheumatoid arthritis (RA) is a common disease with a prevalence of around 1% worldwide [1]. RA is poten- tially an invalidating disease [2], but early diagnosis in the so-called window of opportunity [3,4] and treatment according to a treat-to-target protocol [5] can optimise the outcome for RA patients. Adding ultrasound (US) to the diagnostic workup and monitoring of treatment may provide even better results. In rheumatological US both greyscale and power Doppler (PD) are used, of which PDUS seems to have the largest value. PDUS has the potential to reclassify patients to a higher joint group according to the 2010 classification criteria for RA, increasing the risk for undifferentiated arthritis to be definite RA [6]. Furthermore, the presence of PDUS inflammation in joints that are not swollen at clinical examination has shown to be clinically relevant in pa- tients in remission of RA, since it predicts occurrence of flare and erosive progression [7-10]. Correct assess- ment of the presence and absence of a PD signal indica- ting the presence of inflammation is therefore vital in rheumatological US. However, PDUS may be highly dependent on the type of US machine used [11,12]. We also observed this in our centre (see Figure 1). If there are indeed large differences in the performance of PDUS per machine, the choice of machine might be essential for a valid detection of inflammation. Using dif- ferent machines within a multi-machine study or during patient treatment could then have a detrimental impact on treatment decisions or study outcome. * Correspondence: [email protected] 1 Department of Rheumatology, Erasmus Medical Center Rotterdam, Dr. Molewaterplein 50-60, Rotterdam 3015 GE, The Netherlands Full list of author information is available at the end of the article © 2013 Ten Cate et al.; licensee BioMed Central Ltd. This is an open access article distributed under the terms of the Creative Commons Attribution License (http://creativecommons.org/licenses/by/2.0), which permits unrestricted use, distribution, and reproduction in any medium, provided the original work is properly cited. Ten Cate et al. Arthritis Research & Therapy 2013, 15:R162 http://arthritis-research.com/content/15/5/R162
Transcript of Very different performance of the power Doppler modalities of several ultrasound machines...

Ten Cate et al. Arthritis Research & Therapy 2013, 15:R162http://arthritis-research.com/content/15/5/R162
RESEARCH ARTICLE Open Access
Very different performance of the power Dopplermodalities of several ultrasound machinesascertained by a microvessel flow phantomDavid F Ten Cate1*, Jolanda J Luime1, Myrthe van der Ven1, Johanna MW Hazes1, Klazina Kooiman2, Nico de Jong2
and Johannes G Bosch2
Abstract
Introduction: In many patients with rheumatoid arthritis (RA) subclinical disease activity can be detected withultrasound (US), especially using power Doppler US (PDUS). However, PDUS may be highly dependent on the typeof machine. This could create problems both in clinical trials and in daily clinical practice. To clarify how the PDUSsignal differs between machines we created a microvessel flow phantom.
Methods: The flow phantom contained three microvessels (150, 1000, 2000 microns). A syringe pump was used togenerate flows. Five US machines were used. Settings were optimised to assess the lowest detectable flow for eachUS machine.
Results: The minimal detectable flow velocities showed very large differences between the machines. Only two ofthe machines may be able to detect the very low flows in the capillaries of inflamed joints. There was no clearrelation with price. One of the lower-end machines actually performed best in all three vessel sizes.
Conclusions: We created a flow phantom to test the sensitivity of US machines to very low flows in small vessels.The sensitivity of the power Doppler modalities of 5 different machines was very different. The differences foundbetween the machines are probably caused by fundamental differences in processing of the PD signal or internalsettings inaccessible to users. Machines considered for PDUS assessment of RA patients should be tested using aflow phantom similar to ours. Within studies, only a single machine type should be used.
IntroductionRheumatoid arthritis (RA) is a common disease with aprevalence of around 1% worldwide [1]. RA is poten-tially an invalidating disease [2], but early diagnosis inthe so-called window of opportunity [3,4] and treatmentaccording to a treat-to-target protocol [5] can optimisethe outcome for RA patients. Adding ultrasound (US)to the diagnostic workup and monitoring of treatmentmay provide even better results. In rheumatological USboth greyscale and power Doppler (PD) are used, ofwhich PDUS seems to have the largest value. PDUS hasthe potential to reclassify patients to a higher jointgroup according to the 2010 classification criteria forRA, increasing the risk for undifferentiated arthritis to
* Correspondence: [email protected] of Rheumatology, Erasmus Medical Center Rotterdam,Dr. Molewaterplein 50-60, Rotterdam 3015 GE, The NetherlandsFull list of author information is available at the end of the article
© 2013 Ten Cate et al.; licensee BioMed CentrCommons Attribution License (http://creativecreproduction in any medium, provided the or
be definite RA [6]. Furthermore, the presence of PDUSinflammation in joints that are not swollen at clinicalexamination has shown to be clinically relevant in pa-tients in remission of RA, since it predicts occurrenceof flare and erosive progression [7-10]. Correct assess-ment of the presence and absence of a PD signal indica-ting the presence of inflammation is therefore vital inrheumatological US.However, PDUS may be highly dependent on the type
of US machine used [11,12]. We also observed this inour centre (see Figure 1).If there are indeed large differences in the performance
of PDUS per machine, the choice of machine might beessential for a valid detection of inflammation. Using dif-ferent machines within a multi-machine study or duringpatient treatment could then have a detrimental impacton treatment decisions or study outcome.
al Ltd. This is an open access article distributed under the terms of the Creativeommons.org/licenses/by/2.0), which permits unrestricted use, distribution, andiginal work is properly cited.

Figure 1 Different performance of the power Dopplerultrasound modality of two machines in one patient.(A) Machine B, presence of a positive power Doppler signal (arrow)within the region of synovial proliferation. (B) Machine A, this signalis absent. Arrowhead, vessel; *noise on cortical surface.
Figure 2 Flow phantom with a fixated probe. BMF,blood-mimicking fluid.
Ten Cate et al. Arthritis Research & Therapy 2013, 15:R162 Page 2 of 6http://arthritis-research.com/content/15/5/R162
To quantify the suspected differences in PD sensitivityof different machines in an objective way, we decided toperform an in vitro experiment. To compare the PDfunction of different US machines one could use a flowphantom. This flow phantom should mimic the tissuethat is scanned by PDUS in rheumatology; that is, verysmall vessels and very low flows. To our knowledge, nostudies have been conducted investigating the size ofcapillaries and the blood flow velocity in an inflamedjoint, but there are data on capillaries in healthy sub-jects’ nailfolds and capillaries in periulcerous regions.These capillaries have a diameter of around 30 μm andthe blood flow velocity can be as low as 0.5 mm/second[13,14]. Flow phantoms previously presented did notcompare US machines [15], used vessels that were con-siderably larger than capillaries, or assessed many capil-laries close to each other at once, making it impossibleto evaluate the flow velocity in the individual vessels[11,12,16,17]. For these reasons, we created a new flowphantom with a very small, single vessel to obtain thelowest detectable flow velocity of five US machines. Twoadditional larger vessels were included in the phantomfor comparison with the literature [11,12].
MethodsPhantomThe flow phantom (Figure 2) consisted of an acrylic(polymethyl methacrylate) container filled with tissue-mimicking material, according to a previously publishedrecipe [18]. In this tissue-mimicking material we placedthree microvessels: 150 μm (inner diameter) vesselmade of polyethylene terephthalate glycol-modified(Paradigm Optics, Vancouver, WA, USA), and 2,000 μmand 1,000 μm (inner diameter) vessels made of silicone
(Eriks bv, Alkmaar, the Netherlands). These two vesselswere included to compare our phantom with alreadypublished studies [11,12]. Initially we used vessels withdiameters of 50 μm and 100 μm also made of polye-thylene terephthalate glycol-modified, but these wereblocked almost instantly. The blood-mimicking fluid(BMF) was based on the recipe by Ramnarine andcolleagues [19]. Briefly, 91.07% (w/w) demineralisedwater, 1.18% (w/w) dextran (average 150 kDa, D4876;Sigma-Aldrich, Zwijndrecht, the Netherlands), 0.90%(w/w) ICI supersonic N surfactant, 5.03% (w/w) glycerol,and 1.82% w/w orgasol particles (5 μm in diameter; ArkemaB.V., Rotterdam, The Netherlands) were mixed using amagnetic stirrer. The BMF was then filtered using a 40 μmsieve (352340; BD, Breda, the Netherlands) and degassedusing a vacuum pump. Compared with the original recipeby Ramnarine and colleagues, our BMF contained half theamount of dextran and glycerol – this made our BMF lessviscous, which was necessary to prevent blockage of thevessels. A syringe pump (Hugo Sachs Elektronik, March-Hugstetten, Germany) was used to generate flows. Thispump can produce regular flows as low as 1.28 pl/minute.For each vessel size, flow settings (ml/hour) were calculatedthat corresponded to average flow velocities ranging from40 to 0.005 mm/second, using the following equation,where Q is flow (m3/second), Vavg is the average flowvelocity (m/second) and R is the radius (m):
Q ¼ Vavg � πR2
The actual volume transported through the vesselswas tested by turning on the pump, and completelyfilling the vessel until drops of BMF came out of thecapillary. A complete number of drops were captured ina container while recording the time. This container was
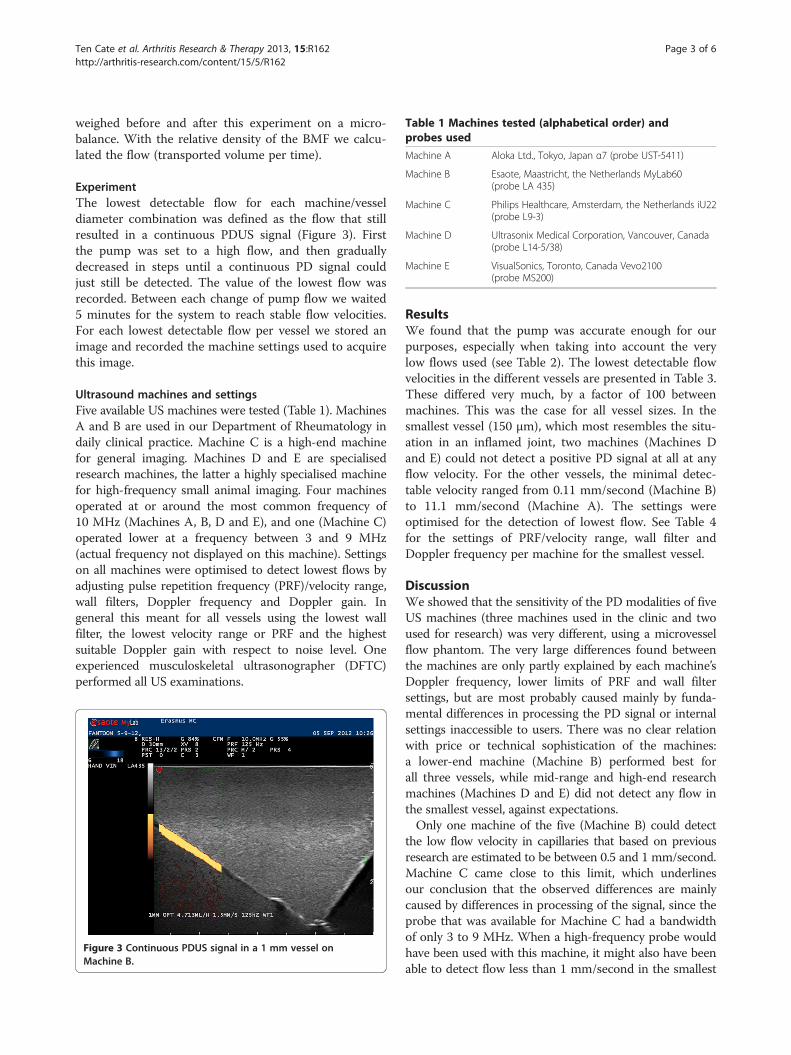
Table 1 Machines tested (alphabetical order) andprobes used
Machine A Aloka Ltd., Tokyo, Japan α7 (probe UST-5411)
Machine B Esaote, Maastricht, the Netherlands MyLab60(probe LA 435)
Machine C Philips Healthcare, Amsterdam, the Netherlands iU22(probe L9-3)
Machine D Ultrasonix Medical Corporation, Vancouver, Canada(probe L14-5/38)
Machine E VisualSonics, Toronto, Canada Vevo2100(probe MS200)
Ten Cate et al. Arthritis Research & Therapy 2013, 15:R162 Page 3 of 6http://arthritis-research.com/content/15/5/R162
weighed before and after this experiment on a micro-balance. With the relative density of the BMF we calcu-lated the flow (transported volume per time).
ExperimentThe lowest detectable flow for each machine/vesseldiameter combination was defined as the flow that stillresulted in a continuous PDUS signal (Figure 3). Firstthe pump was set to a high flow, and then graduallydecreased in steps until a continuous PD signal couldjust still be detected. The value of the lowest flow wasrecorded. Between each change of pump flow we waited5 minutes for the system to reach stable flow velocities.For each lowest detectable flow per vessel we stored animage and recorded the machine settings used to acquirethis image.
Ultrasound machines and settingsFive available US machines were tested (Table 1). MachinesA and B are used in our Department of Rheumatology indaily clinical practice. Machine C is a high-end machinefor general imaging. Machines D and E are specialisedresearch machines, the latter a highly specialised machinefor high-frequency small animal imaging. Four machinesoperated at or around the most common frequency of10 MHz (Machines A, B, D and E), and one (Machine C)operated lower at a frequency between 3 and 9 MHz(actual frequency not displayed on this machine). Settingson all machines were optimised to detect lowest flows byadjusting pulse repetition frequency (PRF)/velocity range,wall filters, Doppler frequency and Doppler gain. Ingeneral this meant for all vessels using the lowest wallfilter, the lowest velocity range or PRF and the highestsuitable Doppler gain with respect to noise level. Oneexperienced musculoskeletal ultrasonographer (DFTC)performed all US examinations.
Figure 3 Continuous PDUS signal in a 1 mm vessel onMachine B.
ResultsWe found that the pump was accurate enough for ourpurposes, especially when taking into account the verylow flows used (see Table 2). The lowest detectable flowvelocities in the different vessels are presented in Table 3.These differed very much, by a factor of 100 betweenmachines. This was the case for all vessel sizes. In thesmallest vessel (150 μm), which most resembles the situ-ation in an inflamed joint, two machines (Machines Dand E) could not detect a positive PD signal at all at anyflow velocity. For the other vessels, the minimal detec-table velocity ranged from 0.11 mm/second (Machine B)to 11.1 mm/second (Machine A). The settings wereoptimised for the detection of lowest flow. See Table 4for the settings of PRF/velocity range, wall filter andDoppler frequency per machine for the smallest vessel.
DiscussionWe showed that the sensitivity of the PD modalities of fiveUS machines (three machines used in the clinic and twoused for research) was very different, using a microvesselflow phantom. The very large differences found betweenthe machines are only partly explained by each machine’sDoppler frequency, lower limits of PRF and wall filtersettings, but are most probably caused mainly by funda-mental differences in processing the PD signal or internalsettings inaccessible to users. There was no clear relationwith price or technical sophistication of the machines:a lower-end machine (Machine B) performed best forall three vessels, while mid-range and high-end researchmachines (Machines D and E) did not detect any flow inthe smallest vessel, against expectations.Only one machine of the five (Machine B) could detect
the low flow velocity in capillaries that based on previousresearch are estimated to be between 0.5 and 1 mm/second.Machine C came close to this limit, which underlinesour conclusion that the observed differences are mainlycaused by differences in processing of the signal, since theprobe that was available for Machine C had a bandwidthof only 3 to 9 MHz. When a high-frequency probe wouldhave been used with this machine, it might also have beenable to detect flow less than 1 mm/second in the smallest

Table 2 Measuring the reliability of the pump
2,000 μm vessel 1,000 μm vessel 150 μm vessel 150 μm vessel 150 μm vessel
Set flow 11.31 3.142 0.141 0.070 0.035
Measured flow 10.68 2.948 0.276 0.108 0.049
Flow (ml/hour).
Ten Cate et al. Arthritis Research & Therapy 2013, 15:R162 Page 4 of 6http://arthritis-research.com/content/15/5/R162
vessel. The other machines did not perform appropriatelyaccording to this limit.As mentioned above, flow phantoms have been published
in the literature before [11,12,15-17]. However, when com-paring the PD modalities of different US machines it is es-sential to use small, individual vessels. A positive PD signaldepends on the total detected Doppler signal power withinthe range gate (the colour Doppler pixel size, typically<1 mm). This power depends on the number of particlesthat have a velocity above a certain threshold. This thresh-old is determined by the wall filter, the PRF/velocity range.Whether a PD signal is actually detected/displayed is alsodependent on the noise level of the system and the system’sability to suppress clutter and signal from stationary targets.If the vessel diameter is larger than the gate size, thevelocity threshold will determine the lowest detectablevelocity. This explains why the minimum velocities foundfor 1 and 2 mm vessels are similar.However, if the velocity is the same but the vessel is
much smaller than the gate size, the number of movingparticles will be lower and more stationary tissue will beinside the gate range. The tissue suppression and noiselevel then become more important and the minimal de-tectable velocity will be raised. This means that a phan-tom with a vessel too large in diameter [11,12] may usea flow velocity similar to that in vessels in an inflamedjoint, but more particles are inside one pixel in thephantom situation (in vitro) compared with the situationin an inflamed joint (in vivo). This can possibly cause apositive PD signal based on the large number of par-ticles. In a flow phantom using a bundle of capillaries[16,17] one can never know for sure the flow velocity ineach vessel. The possibility therefore remains that theflow is very high in a few capillaries, causing a positivePD signal solely based on the high flow velocity of par-ticles in these few capillaries.
Table 3 Lowest detected flow velocity resulting in acontinuous positive power Doppler ultrasound signal
Machine 2,000 μm vessel 1,000 μm vessel 150 μm vessel
A 4 2.22 11.1
B 0.005 0.06 0.11
C 1 0.56 1.68
D 1 0.56 Not detected
E 0.5 0.33 Not detected
Flow velocity (mm/second).
A study comparing Machines A and B (older versionsthan in our study) on a 1,000 μm flow phantom hasbeen published in the past [12]. These older versionsof the machines were ranked regarding sensitivity thesame as in our study. However, in our study Machine Bdetected a considerably lower flow compared with theprevious study: 0.06 mm/second in our study versus1.3 mm/second in the previous. Machine A detected atwofold lower flow in our study: 2.2 mm/second in ourstudy versus 3.9 mm/second in the earlier study.Another study tested an earlier, single-element version of
Machine E (VisualSonics, Toronto, Canada Vevo 770;) on amicrovessel flow phantom with vessel dimensions similarto ours (160 μm) [15]. In this microvessel, the Vevo 770 diddetect flows as low as 0.5 mm/second. In our studyMachine E did not detect any flow in the smallest vessel(150 μm). A possible explanation for this higher sensitivityfor low flows could be that the Vevo 770 uses a mechanic-ally steered probe with a single element, as opposed to thearray probe we used on Machine E in our study. In general,the Doppler processing of a single-element system can bevery different from that of an array system.Some observations raised discussion within our research
group. One of these discussions was about the very lowflows detected by Machine B in the 2,000 μm vessel. Toverify this finding the experiment was repeated severaltimes by two observers (DFTC and MvdV), which resultedin similar findings. When setting the flow slightly lower,the signal disappeared. Therefore, we think the measuredflow is correct. A possible explanation for this low limit isthat the PRF can be set to a very low level and the wallfilter cutoff frequency is probably also very low, in com-bination with a good clutter suppression. However, inin vivo situations, normal tissue or probe motion will pre-vent detecting such extremely low flows.
Table 4 Settings for detection of lowest flow velocityin the 150 μm vessel
Machine Pulse repetitionfrequency/velocity range
Wall filter Doppler frequency
A 1.3 cm/second Level 1 8 MHz
B 125 Hz Level 1 10 MHz
C 150 Hz 15 Hz R1a
Db 200 Hz Level 1 10 MHz
Eb 1,000 Hz Low 12.5 MHzaActual frequency not displayed on this machine. bNo flow detected in this vessel.

Ten Cate et al. Arthritis Research & Therapy 2013, 15:R162 Page 5 of 6http://arthritis-research.com/content/15/5/R162
Another observation that raised discussion is the lowerflow detected in the 1,000 μm vessel as compared withthe 2,000 μm vessel. A reason for this could be that theflow velocity profile in the 1,000 μm vessel is shaped dif-ferently, as compared with the 2,000 μm vessel, resultingin a larger difference between average flow and maxi-mum flow. This may even have been reinforced by com-pression of the smaller vessel by the tissue-mimickingmaterial. This means the average flow velocity is actuallyhigher than estimated, since the calculation is quadra-tically dependent on the microvessel diameter. If themaximum velocity of the peak flow is slightly higherthan the wall filter cutoff, this results in a positive PDsignal. The peak flow may therefore be rather similar inthe 2,000 μm and the 1,000 μm vessels, but due to theshape of the flow profile this corresponds to a loweraverage flow velocity in the 1,000 μm vessel. Whilethe true value for the flow velocities may differ fromthe calculated values, this difference is the same for allmachines, so the comparison between machines is stillvalid per vessel.A drawback of our study is that we have made assump-
tions on the capillary sizes and flow velocities in inflamedjoints based on papers published on healthy subjects andperiulcerous regions. This may not be entirely correct.Therefore, at present it is crucial to ascertain the flowvelocities and capillary sizes in inflamed joints. With thisinformation the minimal flows that rheumatological USmachines need to be able to detect will be known.Nonetheless, for a reliable and reproducible detection of
very low flows in inflamed joints, the choice of the USmachine and its settings seems very important. Cautionshould be exercised when conducting a multi-machinetrial or when making treatment decisions based on PDUS.Our flow phantom could be used to decide which USmachine to use both in clinical practice and in clinicaltrials.
ConclusionsWe created a flow phantom to test the sensitivity of USmachines to very low flows in small vessels. We found thatthe sensitivity of the PD modalities was very differentbetween five US machines. Based on the results of ourstudy it would be advisable to standardise and validate USmachines both for rheumatological clinical practice andfor clinical trials. Our phantom could be used for thispurpose.
AbbreviationsBMF: Blood-mimicking fluid; PD: Power Doppler; PRF: Pulse repetitionfrequency; RA: Rheumatoid arthritis; US: Ultrasound.
Competing interestsThe authors declare that they have no competing interests.
Authors’ contributionsAll authors participated in the conception and design of this study andinterpretation of the data. DFTC, MvdV and JGB performed the dataacquisition. MvdV and KK made the blood mimicking fluid. DFTC, MvdV andJGB performed the data analysis. All authors were involved in drafting thearticle or revising it critically for important intellectual content. JJL, JMWHand NdJ have been focused primarily on the conception and design of thestudy and the interpretation of the data. Of course they were also very muchinvolved in drafting the article and revising it critically. All authors read andapproved the final manuscript.
AcknowledgementsWe thank H.M.M. van Beusekom, PhD, pathobiologist, from the Departmentof Cardiology, Erasmus MC, for providing us with the microbalance andhelping us test the reliability of the pump.
Author details1Department of Rheumatology, Erasmus Medical Center Rotterdam,Dr. Molewaterplein 50-60, Rotterdam 3015 GE, The Netherlands.2Department of Biomedical Engineering, Erasmus Medical CenterRotterdam, Dr. Molewaterplein 50-60, Rotterdam 3015 GE,The Netherlands.
Received: 10 June 2013 Accepted: 2 October 2013Published: 24 October 2013
References1. Silman AJ, Pearson JE: Epidemiology and genetics of rheumatoid arthritis.
Arthritis Res 2002, 4:S265–S272.2. Gordon P, West J, Jones H, Gibson T: A 10 year prospective followup of
patients with rheumatoid arthritis 1986–96. J Rheumatol 2001,28:2409–2415.
3. Mottonen T, Hannonen P, Korpela M, Nissila M, Kautiainen H, Ilonen J,Laasonen L, Kaipiainen-Seppanen O, Franzen P, Helve T, Koski J,Gripenberg-Gahmberg M, Myllykangas-Luosujärvi R, Leirisalo-Repo M,FIN-RACo Trial Group, FINnish Rheumatoid Arthritis Combination therapy:Delay to institution of therapy and induction of remission usingsingle-drug or combination-disease-modifying antirheumatic drugtherapy in early rheumatoid arthritis. Arthritis Rheum 2002, 46:894–898.
4. Quinn MA, Emery P: Window of opportunity in early rheumatoid arthritis:possibility of altering the disease process with early intervention.Clin Exp Rheumatol 2003, 21:S154–S157.
5. Grigor C, Capell H, Stirling A, McMahon AD, Lock P, Vallance R, Kincaid W,Porter D: Effect of a treatment strategy of tight control for rheumatoidarthritis (the TICORA study): a single-blind randomised controlled trial.Lancet 2004, 364:263–269.
6. Filer A, De Pablo P, Allen G, Nightingale P, Jordan A, Jobanputra P,Bowman S, Buckley CD, Raza K: Utility of ultrasound joint counts in theprediction of rheumatoid arthritis in patients with very early synovitis.Ann Rheum Dis 2011, 70:500–507.
7. Brown AK, Conaghan PG, Karim Z, Quinn MA, Ikeda K, Peterfy CG, Hensor E,Wakefield RJ, O'Connor PJ, Emery P: An explanation for the apparentdissociation between clinical remission and continued structuraldeterioration in rheumatoid arthritis. Arthritis Rheum 2008, 58:2958–2967.
8. Foltz V, Gandjbakhch F, Etchepare F, Rosenberg C, Tanguy ML, Rozenberg S,Bourgeois P, Fautrel B: Power Doppler ultrasound, but not low-fieldmagnetic resonance imaging, predicts relapse and radiographic diseaseprogression in rheumatoid arthritis patients with low levels of diseaseactivity. Arthritis Rheum 2012, 64:67–76.
9. Peluso G, Michelutti A, Bosello S, Gremese E, Tolusso B, Ferraccioli G: Clinicaland ultrasonographic remission determines different chances of relapsein early and long standing rheumatoid arthritis. Ann Rheum Dis 2011,70:172–175.
10. Scire CA, Montecucco C, Codullo V, Epis O, Todoerti M, Caporali R:Ultrasonographic evaluation of joint involvement in early rheumatoidarthritis in clinical remission: power Doppler signal predicts short-termrelapse. Rheumatology (Oxford) 2009, 48:1092–1097.
11. Browne JE, Watson AJ, Hoskins PR, Elliott AT: Validation of a sensitivityperformance index test protocol and evaluation of colour Dopplersensitivity for a range of ultrasound scanners. Ultrasound Med Biol 2004,30:1475–1483.
Ten Cate et al. Arthritis Research & Therapy 2013, 15:R162 Page 6 of 6http://arthritis-research.com/content/15/5/R162
12. Koski JM, Saarakkala S, Helle M, Hakulinen U, Heikkinen JO, Hermunen H:Power Doppler ultrasonography and synovitis: correlating ultrasoundimaging with histopathological findings and evaluating the performanceof ultrasound equipments. Ann Rheum Dis 2006, 65:1590–1595.
13. Stucker M, Baier V, Reuther T, Hoffmann K, Kellam K, Altmeyer P: Capillaryblood cell velocity in human skin capillaries located perpendicularly tothe skin surface: measured by a new laser Doppler anemometer.Microvasc Res 1996, 52:188–192.
14. Stucker M, Huntermann C, Bechara FG, Hoffmann K, Altmeyer P: Capillaryblood cell velocity in periulcerous regions of the lower leg measured bylaser Doppler anemometry. Skin Res Technol 2004, 10:174–177.
15. Pinter SZ, Lacefield JC: Detectability of small blood vessels withhigh-frequency power Doppler and selection of wall filter cut-off velocityfor microvascular imaging. Ultrasound Med Biol 2009, 35:1217–1228.
16. Kamishima T, Nishida M, Horie T, Narita A, Sagawa A, Henmi M, Shirato H,Terae S: Power Doppler signal calibration using capillary phantom forpannus vascularity in rheumatoid finger joint. A pilot study.Clin Exp Rheumatol 2011, 29:1057.
17. Veltmann C, Lohmaier S, Schlosser T, Shai S, Ehlgen A, Pohl C, Becher H,Tiemann K: On the design of a capillary flow phantom for the evaluationof ultrasound contrast agents at very low flow velocities. Ultrasound MedBiol 2002, 28:625–634.
18. Teirlinck CJ, Bezemer RA, Kollmann C, Lubbers J, Hoskins PR, Ramnarine KV,Fish P, Fredeldt KE, Schaarschmidt UG: Development of an example flowtest object and comparison of five of these test objects, constructed invarious laboratories. Ultrasonics 1998, 36:653–660.
19. Ramnarine KV, Nassiri DK, Hoskins PR, Lubbers J: Validation of a newblood-mimicking fluid for use in Doppler flow test objects.Ultrasound Med Biol 1998, 24:451–459.
doi:10.1186/ar4345Cite this article as: Ten Cate et al.: Very different performance of thepower Doppler modalities of several ultrasound machines ascertainedby a microvessel flow phantom. Arthritis Research & Therapy 2013 15:R162.
Submit your next manuscript to BioMed Centraland take full advantage of:
• Convenient online submission
• Thorough peer review
• No space constraints or color figure charges
• Immediate publication on acceptance
• Inclusion in PubMed, CAS, Scopus and Google Scholar
• Research which is freely available for redistribution
Submit your manuscript at www.biomedcentral.com/submit

![[Greeting modalities preferred by patients in pediatric ambulatory setting]](https://static.fdokumen.com/doc/165x107/6337af65d102fae1b6077daa/greeting-modalities-preferred-by-patients-in-pediatric-ambulatory-setting.jpg)