Variations in hydrochemistry, trace metal concentration and transport during a rain storm event in a...
11
JOURNALOF GEUCHEMICAL EXPLORATION ELSEVIER Journal of GeochemicalExploration58 (1997) 145-155 Variations in hydrochemistry, trace metal concentration and transport during a rain storm event in a small catchment P. Sand~n *, S. Karlsson, A. Diiker, A. Ledin, L. Lundman Department of Water and Encironmental Studies, LinkiJping Uni~'ersity, S-58183 Linki~ping, Sweden Abstract General hydrochemistry and trace metal concentrations were monitored during a runoff event in a small catchment (0.9 kin:) with an old abandoned copper mine and covered sulphidic waste. Five hours of rising hydrograph was sampled manually every 10 minutes while an automatic sampler was used during the recession phase. The hydrograph started to rise about two hours after the commencement of rain, but the hydrochemistry showed only small changes for yet another hour and a half. At this time the concentration of total organic C (TOC), Cu and Zn decreased rapidly, while most other elements e~hibited a peak in concentration. Different origins and varying hydrological response could explain these observations. Chemical redistribution might, however, be important for some elements, notably A1 and Fe. After this peak the concentrations of most elements decreased, probably because of dilution with precipitation water whereafter a secondary concentration maximum was observed. This behaviour was most evident for K but also for Na, Mg and Ca. A noteworthy e~ception is pH that increased during the event and remained at high levels, while concentrations of Mn and Cd were lowered possibly due to depletion of the mobile pool. Increased pH during the event is probably caused by liming of soils sunounding the creek, in combination with soil buffering processes. The increase of alkaline and alkaline earths (notably K) c.~ncentrations could be explained by transport of accumulated elements as the groundwater level rose. l~eywords: hydrochemistry;trace metals: Cu; Zn: Cd: Fe: Al: runoff event: catchment 1. Introduction A major part of element transport in small catch- ments takes place during events with high flow. It has previously been shown in the study area that about 40% of the annual transport of trace metals occurred during the 10% highest flow days (Sand6n, 1991). The principal reason for this is that the varia- tion in flow is much larger than the coinciding ~ariation in concentration. The previous study was Cooresponding author. Fax: +46 13 133630: E-mail: [email protected] made in a system affected by mine waste effluents, which resulted in much larger variation in metal concentrations than commonly found in unpolluted surface waters. Observations of the variation in ele- ment concentrations during rain storm events is, therefore, essential to get reasonable transport esti- mates. Hydrodynamic influence on the variation in concentration and chemical redistribution processes in a catchment is, for the same reasons best studied during runoff events. Chemical redistribution involve resuspension of sediment material, but also qualita- tive changes that might influence the mobility of trace metals. Formation of colloidal carriers through 0375-6742/97/$17.00 © 1997 Elsevier Science B.V. All rights reserved. t'I1 S0375-6742(96)00078- 7
-
Upload
independent -
Category
Documents
-
view
2 -
download
0
Transcript of Variations in hydrochemistry, trace metal concentration and transport during a rain storm event in a...
JOURNAL OF GEUCHEMICAL EXPLORATION
ELSEVIER Journal of Geochemical Exploration 58 (1997) 145-155
Variations in hydrochemistry, trace metal concentration and transport during a rain storm event in a small catchment
P. Sand~n *, S. Karlsson, A. Diiker, A. Ledin, L. Lundman Department of Water and Encironmental Studies, LinkiJping Uni~'ersity, S-58183 Linki~ping, Sweden
Abstract
General hydrochemistry and trace metal concentrations were monitored during a runoff event in a small catchment (0.9 kin:) with an old abandoned copper mine and covered sulphidic waste. Five hours of rising hydrograph was sampled manually every 10 minutes while an automatic sampler was used during the recession phase. The hydrograph started to rise about two hours after the commencement of rain, but the hydrochemistry showed only small changes for yet another hour and a half. At this time the concentration of total organic C (TOC), Cu and Zn decreased rapidly, while most other elements e~hibited a peak in concentration. Different origins and varying hydrological response could explain these observations. Chemical redistribution might, however, be important for some elements, notably A1 and Fe. After this peak the concentrations of most elements decreased, probably because of dilution with precipitation water whereafter a secondary concentration maximum was observed. This behaviour was most evident for K but also for Na, Mg and Ca. A noteworthy e~ception is pH that increased during the event and remained at high levels, while concentrations of Mn and Cd were lowered possibly due to depletion of the mobile pool. Increased pH during the event is probably caused by liming of soils sunounding the creek, in combination with soil buffering processes. The increase of alkaline and alkaline earths (notably K) c.~ncentrations could be explained by transport of accumulated elements as the groundwater level rose.
l~eywords: hydrochemistry; trace metals: Cu; Zn: Cd: Fe: Al: runoff event: catchment
1. Introduct ion
A major part of element transport in small catch-
ments takes place during events with high flow. It has previously been shown in the study area that
about 40% of the annual transport of trace metals occurred during the 10% highest flow days (Sand6n,
1991). The principal reason for this is that the varia- tion in flow is much larger than the coinciding
~ariation in concentration. The previous study was
Cooresponding author. Fax: +46 13 133630: E-mail: [email protected]
made in a system affected by mine waste effluents, which resulted in much larger variation in metal
concentrations than commonly found in unpolluted surface waters. Observations of the variation in ele-
ment concentrations during rain storm events is, therefore, essential to get reasonable transport esti- mates. Hydrodynamic influence on the variation in
concentration and chemical redistribution processes
in a catchment is, for the same reasons best studied during runoff events. Chemical redistribution involve resuspension of sediment material, but also qualita- tive changes that might influence the mobility of trace metals. Formation of colloidal carriers through
0375-6742/97/$17.00 © 1997 Elsevier Science B.V. All rights reserved. t'I1 S0375-6742(96)00078- 7
1,-1-6 P. Sand~'n et al. / Journal of Geochemical E:~ploration 58 (1997) 145-155
precipitation and agglomeration can be induced by changes in hydrochemical conditions (especially pH and E h) during events. Fundamental knowledge on these processes is still lacking, but needed for better estimates of element transport, formulation of mathe- matical models for forecast and scenario simulations and an improved understanding of biological re- sponses.
The literature on high frequency chemical sam- pling during runoff events is limited. Some studies en general water chemistry during runoff events can, however, be found (e.g., Walling and Foster, 1975; Foster, 1980; Chapman et al , 1993). A few studies on trace metals are also present (e.g., Hart et al., 1982; Harries and Ritchie, 1983).
This paper presents a preliminary investigation of a single runoff event, with the primary aim to discuss changes in concentrations during this type of situa- tion and possible explanations.
2. Field site and methods
The abandoned mining area Bersbo is located in the southeastern Sweden (58°16'N 16°3'E). The most intensive mining for copper was conducted from 1750 to 1902, when the ore ceased. Substantial mine tailings (chalcopyrite, pyrite, sphalerite and galena in a matrix of amphibolite and leptite) remain in the area and were exposed to oxidative weathering until 1987 when an extensive restoration was undertaken. A large part of the solid waste was refilled into the mine shafts and the rest was covered with a sealing layer of clay from the area or cement stabilised coal ash (Lundgren, 1990). Moraine was put on the top of the sealing layer and areas freed of mine waste were limed.
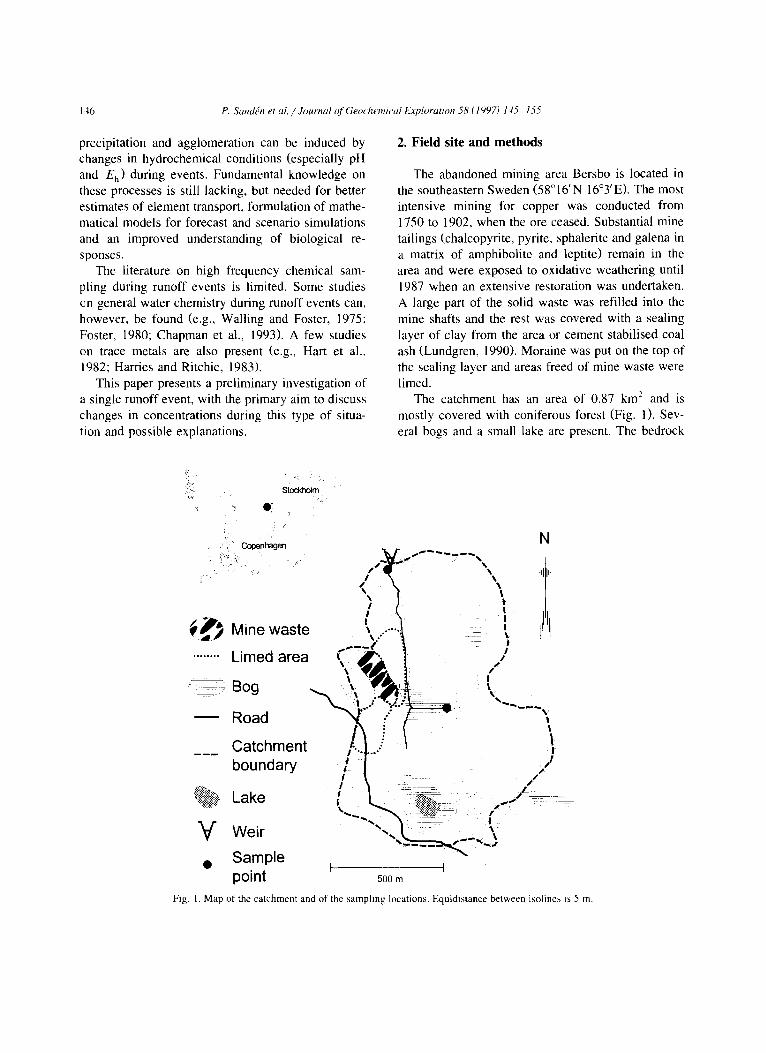
The catchment has an area of 0.87 km 2 and is mostly covered with coniferous forest (Fig. 1). Sev- eral bogs and a small lake are present. The bedrock
Stockholm
D~
~d4
V
Copenhagen
M i n e w a s t e
........ L imed a r e a \
Road " ~ ' ~ ' t~
Catchment ¢.. t boundary
I I
Lake 1
W e i r
t I ! I
t I
I f
!
\
N
I
! /
/
• Sample point 500 m
Fig. 1. Map of the catchment and of the sampling locations. Equidistance between isolines is 5 m.
P. Sanddn et al. / Journal o~ Geochemical E,:ploration 58 (1997) 145-155 147
is covered by moraine and, in the lower part of the catchment, illitic clay. A comprehensive description ot the area and hydrochemistry can be found else- where (Allard et ai., 1987).
Using weather forecasts from the Swedish Meteo- rological and Hydrological Institute, the sampling started with the commencement of the rain on the 9 October 1993. All sampling was made just upstream of a dam constructed for runoff measurements. A firsl sample was taken after about 30 minutes of rain followed by manual grab sampling with a frequency of 10 minutes when the water stage in the dam started to rise. This frequency was maintained for five hours and 20 minutes. This sampling was con- ducted using 500 ml acid washed polypropylene boules. An automatic sampler was used during the recession (from 420 minutes) to collect hourly sam- pies. The data discussed here are therefore divided into three sub sets representing conditions before the event, grab sampling during the event and automatic sampling during the recession.
A precipitation gauge was placed in the area during the sampling. Water stage in the dam was recorded manually and recalculated to runoff.
Concentrations of major ionic constituents (F, CI, S Q , pH, Na, K, Ca, Mg, AI, Fe, Mn) trace metals (Cu, Zn, Cd) total organic carbon (TOC), inorganic carbon (IC), colloid concentration, size distribution of colloids and electrical conductivity were mea- sured. Metal concentrations were also determined after conventional pressure filtration through 400 nm polycarbonate membranes and centrifugation at 20,000 g for 30 minutes (Karlsson et al., 1994). Metal analysis was made on acidified samples (0.03 M HNO 3, Merck, suprapur) with flame or graphite furnace atomic absorption spectrophotometry.
Total organic carbon and inorganic carbon were quantified by catalytic oxidation and IR detection using a Shimadzu TOC analyzer. Principal inorganic anions were determined by capillary zone elec- trophoresis according to Wolrath et al. (1997).
Colloid concentration and size distribution were estimated by laser light scattering in combination with Photon Correlation Spectroscopy (PCS) follow- ing the procedure by Ledin et al. (1993), A Brookhaven BI-90 equipped with a 2 W Ar laser (Lexel) operated at 700 mW, 488 nm and a scatter- ing angle of 90 °. The instrument signal was evalu-
ated with the original software. The samples were prefiltered through 1.2 ~xm polycarbonate mem- branes using a plastic syringe, to reduce bias caused by single large particles. Sample preparation was made in a class 100 clean air flow cabinet to prevent dust contamination. The concentration is presented as count rate (counts per second; cps). The elec- trophoretic mobilities of the colloids were deter- mined in a few samples with a Brookhaven Zeta Sizer.
The grab samples during the event were trans- ported to the laboratory at 21:00 and 00:00 where electrical conductivity, pH, colloid concentration and size distribution as well as electrophoretic mobility were determined immediately. Phase separations and other sample preparations were completed as soon as possible. Automatic samples were transported to the laboratory at 16:00 the day after the manual sam- pling and stored cold before analyses the following day.
3. Result and discussion
3. I. Flow conditions
According to the on site precipitation gauge the rain volume was 15.5 mm between 17:00 and 00:00. No runoff event was observed during 22 days before the day of the study. Pre-event water flow was 0.2 Is -~, which began to increase two hours after the rain started. A flow peak of 23 l s ~ was reached after about seven hours, and 16 hours later the runoff
I had decreased to 6 l s
3.2. Hydrochemistt T during rising hydrograph
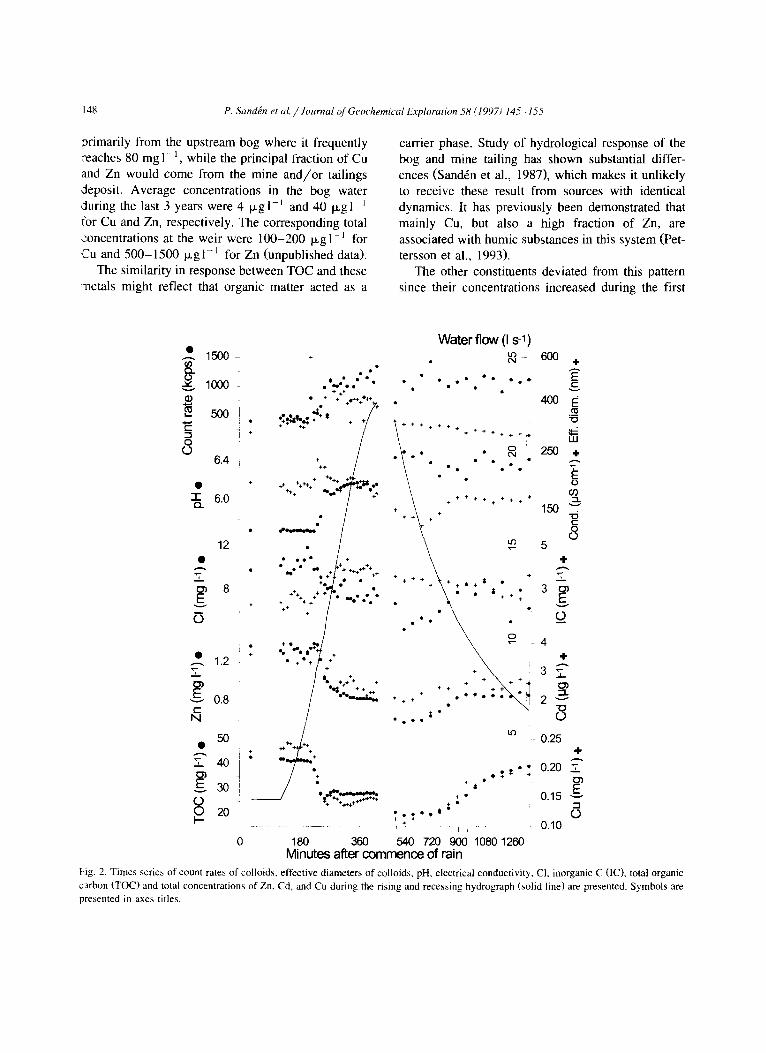
The general pattern for the total concentrations of the studied constituents indicated that only small changes occurred during the first 3.5 hours, where- after they decreased (Figs. 2 and 3). This behaviour suggests that in the first part of the runoff event water already present in the creek or in the immedi- ate vicinity determined the observed composition. After about 90 minutes of rising hydrograph dilution of the original creek water began as indicated by the lowered concentrations of primarily TOC, total Cu and total Zn. Organic carbon in the creek originates
148 P. Sand£n et al. / Journal of Geochemical Exploration 58 (1997) 145-155
primarily from the upstream bog where it frequently reaches 80 mg l- l, while the principal fraction of Cu and Zn would come from the mine and/or tailings deposit. Average concentrations in the bog water ,:luring the last 3 years were 4 Ixgi-~ and 40 Ixgl- for Cu and Zn, respectively. The corresponding total concentrations at the weir were 100-200 ixgl - l for Cu and 500-1500 lxg1-1 for Zn (unpublished data).
The similarity in response between TOC and these metals might reflect that organic matter acted as a
carrier phase. Study of hydrological response of the bog and mine tailing has shown substantial differ- ences (SandEn et al., 1987), which makes it unlikely to receive these result from sources with identical dynamics. It has previously been demonstrated that mainly Cu, but also a high fraction of Zn, are associated with humic substances in this system (Pet- tersson et al., 1993).
The other constituents deviated from this pattern since their concentrations increased during the first
.-... 1500 09 e~
looo - / ~ 5oo
! •
o
6.4 i
• +
1- 6.0 Q.
o~ E
O
,.g_ o') E t -
N
12
8 +
1.2
0.8
Water f low (I s- l) • - ~ - 600 +
• • E • • • • o e e • t -
• : 4 0 0 E
÷ ÷ ÷ ÷ + ÷ , + ~
250 ÷
•
Z ......... ? ÷ , ÷ ! 150
5 8 + + + + + ~ + ÷ ~, + ¢ • + • \ " " '÷.:
" " " " " + . ~ + o ~ ~ - - " ..40,) • ° • •
4 +
÷ + ~
• ÷÷ . o- ~ ! 2 "-~'~
÷
• Il l•eli I I I I l l
• ° ÷ ÷ ÷ l ~ - + e ' l ' + ÷
+ ÷~.÷÷ ÷ ÷÷ ÷÷÷÷+ ~
° °
• o • • ÷ • • ÷ ÷
+ +++++ +++++o oeoLoooee•o•
+÷ +
+ " e+et % " % t l
• + • ÷ ++
/ ~ + ~ + ~ ~ +++÷÷ +
++ ++ m +
180 36O
50 i.o
40 i " , + •
v 3 0 ~ + • ÷ •
20 , . . . s "
0 540 720 900 1080 1260
0.25 +
0.20 "7 03 E 0.15
0 0.1o
Minutes after commence of rain
Fig. 2. Times series of count rates of colloids, effective diameters of colloids, pH, electrical conductivity, CI, inorganic C (IC), total organic carbon (TOC) and total concentrations of Zn. Cd, and Cu during the rising and recessing hydrograph (solid line) are presented. Symbols are presented in axes titles.
P. Sand~n et al. / Journal of Geochemical Exploration 58 (1997) 145-155 149
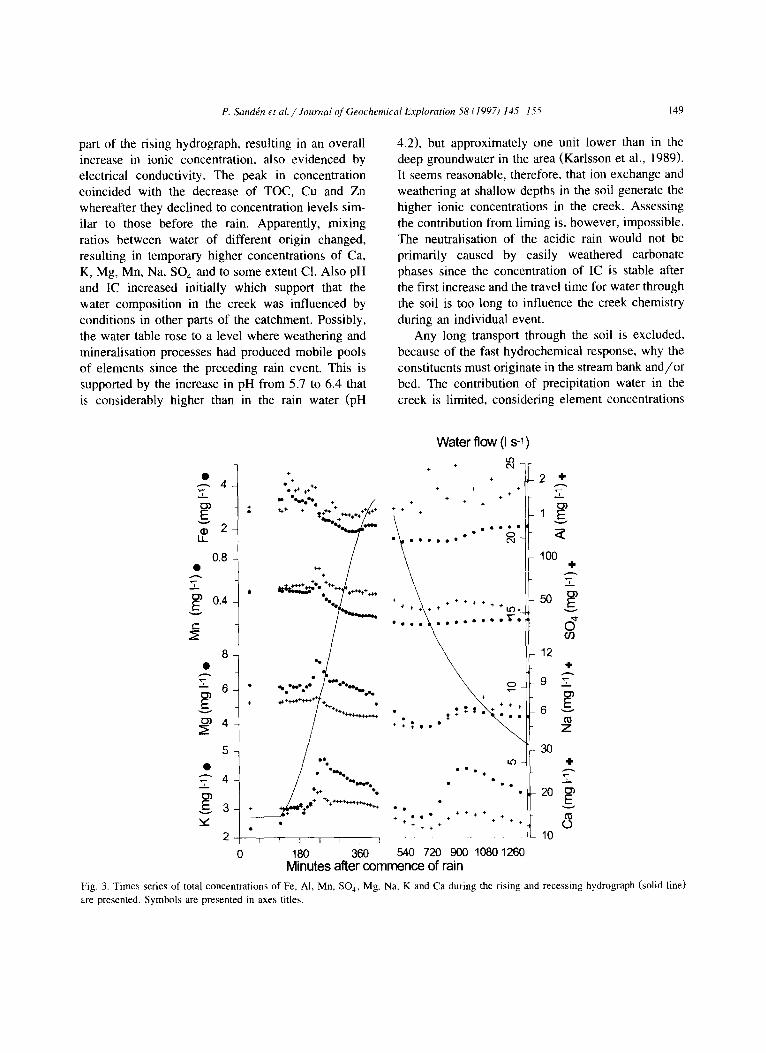
part of the rising hydrograph, resulting in an overall increase in ionic concentration, also evidenced by electrical conductivity. The peak in concentration coincided with the decrease of TOC, Cu and Zn whereafter they declined to concentration levels sim- ilar to those before the rain. Apparently, mixing ratios between water of different origin changed, resulting in temporary higher concentrations of Ca, K, Mg, Mn, Na, SO 4 and to some extent C1. Also pH and IC increased initially which support that the ~ater composition in the creek was influenced by conditions in other parts of the catchment. Possibly, the water table rose to a level where weathering and mineral•sat•on processes had produced mobile pools of elements since the preceding rain event. This is supported by the increase in pH from 5.7 to 6.4 that is considerably higher than in the rain water (pH
4.2), but approximately one unit lower than in the deep groundwater in the area (Karlsson et al., 1989). It seems reasonable, therefore, that ion exchange and weathering at shallow depths in the soil generate the higher ionic concentrations in the creek. Assessing the contribution from liming is, however, impossible. The neutral•sat•on of the acidic rain would not be primarily caused by easily weathered carbonate phases since the concentration of IC is stable after the first increase and the travel time for water through the soil is too long to influence the creek chemistry during an individual event.
Any long transport through the soil is excluded, because of the fast hydrochemical response, why the constituents must originate in the stream bank and/or bed. The contribution of precipitation water in the creek is limited, considering element concentrations
E 2
L1-
0.8
"T
t-
04
8
-- 6 "
v
4
5
E 3 ÷
2
0
+
o +
÷ ÷ ÷ + .
~ + ÷
., ~ . . . " m.....eN•°°
Water flow (I s l) l . {3
4` ¢%1 +
+ + ÷
+ ÷ 4` + +
+ + 4,
....... iiii • e ' ~ •
÷ ~ "
" . . . ~"
• I I I I o i l e o i l ~ l t + ÷ %
I , ÷ 4`÷+ ~'÷' l '~ ~' • H.,%.t. N "
I I J I •
180 360
• •
+ + 4` ÷ +
t O * O o
÷ ÷ 4 ` ÷ 4` 4 ` ÷ 4 ` 4
540 720 900 1080 1260 Minutes after commence of rain
2 4.
1 E v
100 '4"
v
03
12 4"
9 '..2'-
6
Z
30
"7
2o
10
Fig 3. Times series of total concentrations of Fe, A1, Mn, SO 4. Mg, Na, K and Ca during the rising and recessing hydrograph (solid line) are presented. Symbols are presented in axes titles.
150 P. Sandgn et al. / Journal of Geochemical Exploration 58 (1997) 145 155
and pH. It seems therefore likely that the increase of particularly alkaline, alkaline earths and pH in the creek was caused by water from shallow layers in the adjacent soil.
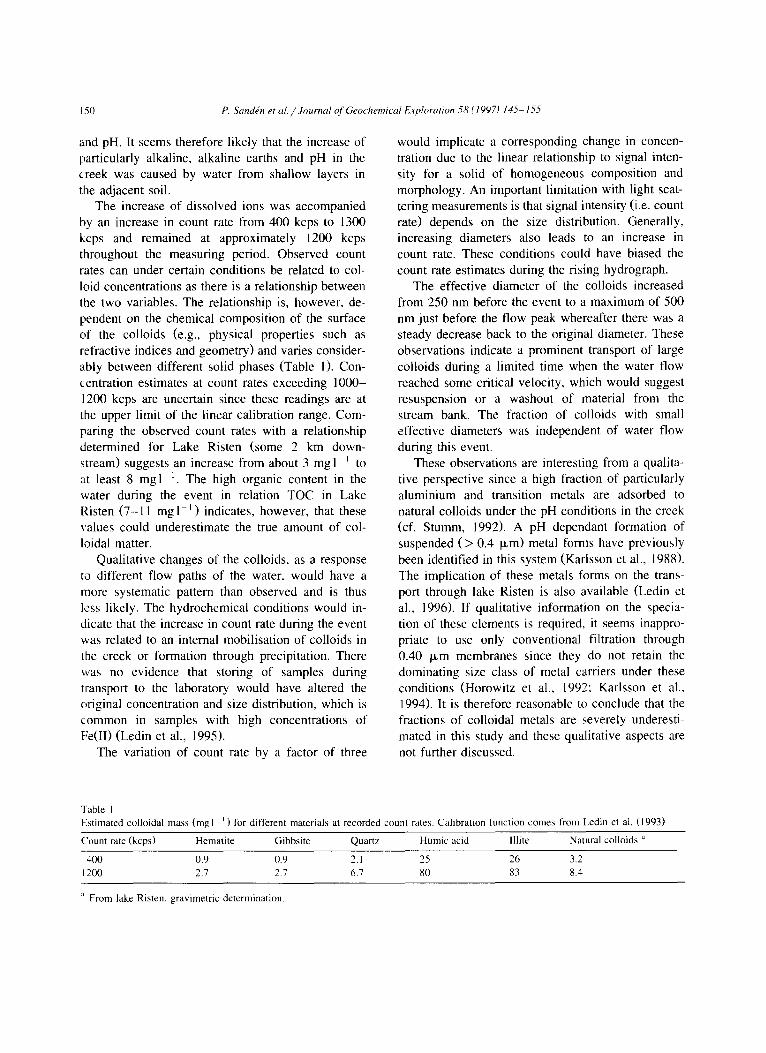
The increase of dissolved ions was accompanied by an increase in count rate from 400 kcps to 1300 kcps and remained at approximately 1200 kcps throughout the measuring period. Observed count rates can under certain conditions be related to col- loid concentrations as there is a relationship between the two variables. The relationship is, however, de- pendent on the chemical composition of the surface of the colloids (e.g., physical properties such as refractive indices and geometry) and varies consider- ably between different solid phases (Table 1). Con- centration estimates at count rates exceeding 1000- 1200 kcps are uncertain since these readings are at the upper limit of the linear calibration range. Com- paring the observed count rates with a relationship determined for Lake Risten (some 2 km down- stream) suggests an increase from about 3 mgl-~ to at least 8 mgl 1. The high organic content in the water during the event in relation TOC in Lake Risten (7-11 mgl ~) indicates, however, that these values could underestimate the true amount of col- loidal matter.
Qualitative changes of the colloids, as a response to different flow paths of the water, would have a more systematic pattern than observed and is thus less likely. The hydrochemical conditions would in- dicate that the increase in count rate during the event was related to an internal mobilisation of colloids in the creek or formation through precipitation. There was no evidence that storing of samples during transport to the laboratory would have altered the original concentration and size distribution, which is common in samples with high concentrations of Fe(II) (Ledin et al., 1995).
The variation of count rate by a factor of three
would implicate a corresponding change in concen- tration due to the linear relationship to signal inten- sity for a solid of homogeneous composition and morphology. An important limitation with light scat- tering measurements is that signal intensity (i.e. count rate) depends on the size distribution. Generally, increasing diameters also leads to an increase in count rate. These conditions could have biased the count rate estimates during the rising hydrograph.
The effective diameter of the colloids increased from 250 nm before the event to a maximum of 500 nm just before the flow peak whereafter there was a steady decrease back to the original diameter. These observations indicate a prominent transport of large colloids during a limited time when the water flow reached some critical velocity, which would suggest resuspension or a washout of material from the stream bank. The fraction of colloids with small effective diameters was independent of water flow during this event.
These observations are interesting from a qualita- tive perspective since a high fraction of particularly aluminium and transition metals are adsorbed to natural colloids under the pH conditions in the creek (cf. Stumm, 1992). A pH dependant formation of suspended ( > 0.4 ~xm) metal forms have previously been identified in this system (Karlsson et al., 1988). The implication of these metals forms on the trans- port through lake Risten is also available (Ledin et al., 1996). If qualitative information on the specia- tion of these elements is required, it seems inappro- priate to use only conventional filtration through 0.40 ~tm membranes since they do not retain the dominating size class of metal carriers under these conditions (Horowitz et al., 1992; Karlsson et al., 1994). It is therefore reasonable to conclude that the fractions of colloidal metals are severely underesti- mated in this study and these qualitative aspects are not further discussed.
Table I Estimated colloidal mass (mgl i ) for different materials at recorded count rates. Calibration function comes from Ledin et al. (1993)
Count rate (kcps) Hematite Gibbsite Quartz Humic acid lllite Natural colloids ~
400 0.9 0.9 2.1 25 26 3.2 1200 2.7 2.7 6.7 80 83 8.4
From lake Risten, gravimetric determination.
P. Sandgn et al. / Journal (~f" Geochemical Exploration 58 (1997) 145-155 151
3.3. Hydrochemistr 3' during recessing hydrograph
Most elements exhibited their lowest concentra- tions during the first part of the recession of the hydrograph (420-650 minutes), after which increas- ing concentrations are observed (Figs. 2 and 3). Several elements show a second decrease in concen- trations. Exceptions from this behaviour were found for pH, IC, count rate and total concentration of aluminium that remained at elevated levels compared with the preevent condition. The secondary maxi- nmm for concentrations of trace metals are less pronounced and is below the preevent level during the studied period.
Noting that the concentration of several elements dropped when the sampling turned from manual to automatic is important. These observations do not necessarily have to be wrong although adsorption to surfaces in the sampler and occlusion in ferric hy- droxide precipitates during the storage can give wrong concentrations. The decrease in Na, K, Ca and Mg indicates, however, another reason for the decrease, as these elements are much less affected by adsorption and occlusion at the present concentra- ttons. Sampling and analytical problems cannot be excluded, why a direct comparison of concentrations, bet0re and after the change in sampling method, should be regarded uncertain. A comparison between individual observations within each period is, how- ever, valid.
The lowered element concentrations in the creek can be explained by the rise of the water table to levels in the soil depleted of these constituents due to previous wash out in relation to weathering rates. The dilution is, however, not constant among the elements and their concentration differences are therefore believed to represent mixing of water from different soil depths or subareas of the catchment. Potassium has a large secondary maximum and this peak is also pronounced for Na, Ca and Mg. The concentrations of Zn, Cu and TOC returns to preevent levels with a less obvious secondary peak. There are several examples in the literature describing increas- ing K concentrations during runoff events in small catchments (Foster, 1980: Chapman et al., 1993). A possible explanation might be accumulation of K in the upper soil layers due to biological uptake and mineralisation processes. In the Bersbo area an addi-
tional source of K could be the illitic clay used as sealing on the deposit. The structure of the clay has been disturbed during the compaction, leading to an increased mobility of the interlayer K.
The pattern presented here is in accordance with other studies of runoff events (e.g., Walling and Foster, 1975; Foster, 1980; Hart et al., 1982; Harries and Ritchie, 1983; Chapman et al., 1993). Several of these studies report important differences between runoff events in the variation pattern of the elements. These differences are primarily attributed to different hydrological conditions in the catchment before the event.
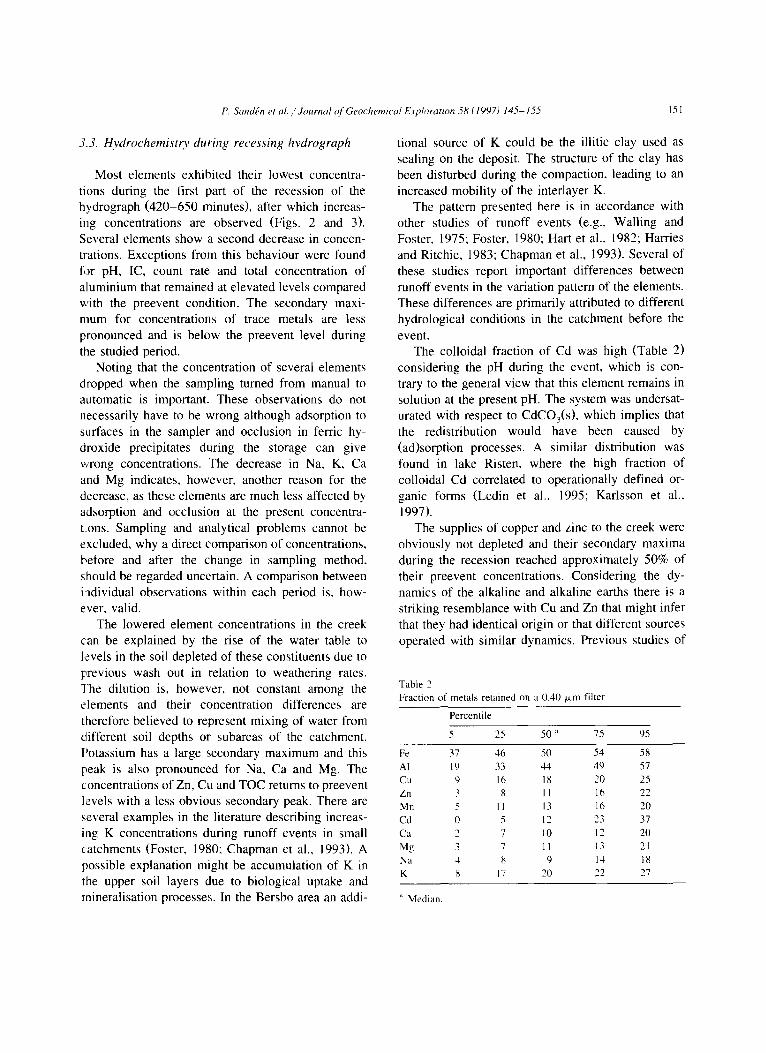
The colloidal fraction of Cd was high (Table 2) considering the pH during the event, which is con- trary to the general view that this element remains in solution at the present pH. The system was undersat- urated with respect to CdCO3(s), which implies that the redistribution would have been caused by (ad)sorption processes. A similar distribution was found in lake Risten, where the high fraction of colloidal Cd correlated to operationally defined or- ganic forms (Ledin et al., 1995; Karlsson et al., 1997 ).
The supplies of copper and zinc to the creek were obviously not depleted and their secondary maxima during the recession reached approximately 50% of their preevent concentrations. Considering the dy- namics of the alkaline and alkaline earths there is a striking resemblance with Cu and Zn that might infer that they had identical origin or that different sources operated with similar dynamics. Previous studies of
Table 2 Fraction of metals retained on a 0.40 Ixm filter
Percentile
5 25 50:' 75 95
Fe 37 46 50 54 58 A1 19 33 44 49 57 Cu 9 16 18 20 25 Zn 3 8 I1 16 22 Mn 5 I1 13 16 20 Cd 0 5 12 23 37 Ca 2 7 10 12 20 Mg 3 7 11 13 21 Na 4 8 9 14 18 K 8 17 20 22 27
" Median.
152 P. Sandgn et a l . / Journal of Geochernical Exploration 58 (1997) 145-155
the groundwater composition (Karlsson et al., 1989) indicated that high concentration of the alkaline and alkaline earths in the creek originated from weather- ing processes in the mine or the covered waste.
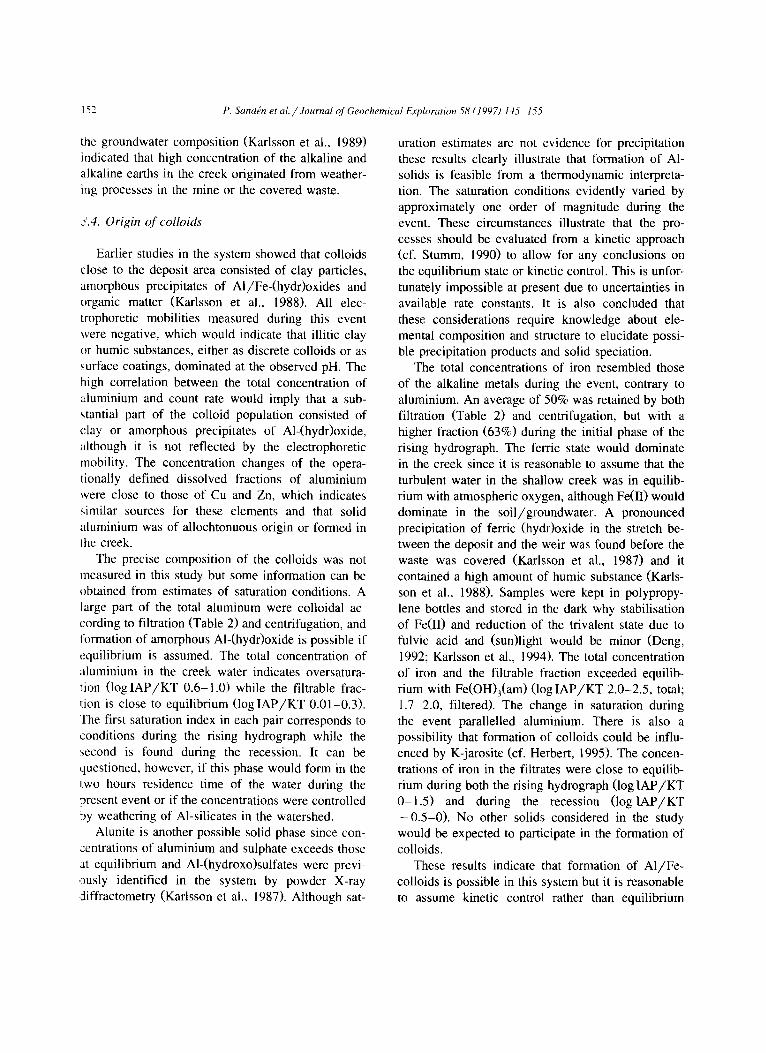
~".4. Origin of colloids
Earlier studies in the system showed that colloids close to the deposit area consisted of clay particles, amorphous precipitates of Ai/Fe-(hydr)oxides and organic matter (Karlsson et al., 1988). All elec- trophoretic mobilities measured during this event were negative, which would indicate that illitic clay or humic substances, either as discrete colloids or as surface coatings, dominated at the observed pH. The high correlation between the total concentration of aluminium and count rate would imply that a sub- stantial part of the colloid population consisted of clay or amorphous precipitates of Al-(hydr)oxide, ~dthough it is not reflected by the electrophoretic mobility. The concentration changes of the opera- tionally defined dissolved fractions of aluminium were close to those of Cu and Zn, which indicates similar sources for these elements and that solid aluminium was of allochtonuous origin or formed in the creek.
The precise composition of the colloids was not measured in this study but some information can be obtained from estimates of saturation conditions. A large part of the total aluminum were colloidal ac- cording to filtration (Table 2) and centrifugation, and formation of amorphous Al-(hydr)oxide is possible if equilibrium is assumed. The total concentration of aluminium in the creek water indicates oversatura- tion (log IAP/KT 0.6-1.0) while the filtrable frac- tion is close to equilibrium (log IAP/KT 0.01-0.3). The first saturation index in each pair corresponds to conditions during the rising hydrograph while the ~econd is found during the recession. It can be questioned, however, if this phase would form in the ~:wo hours residence time of the water during the present event or if the concentrations were controlled by weathering of Al-silicates in the watershed.
Alunite is another possible solid phase since con- centrations of aluminium and sulphate exceeds those at equilibrium and Al-(hydroxo)sulfates were previ- .3usly identified in the system by powder X-ray :liffractometry (Karlsson et al., 1987). Although sat-
uration estimates are not evidence for precipitation these results clearly illustrate that formation of A1- solids is feasible from a thermodynamic interpreta- tion. The saturation conditions evidently varied by approximately one order of magnitude during the event. These circumstances illustrate that the pro- cesses should be evaluated from a kinetic approach (cf. Stumm, 1990) to allow for any conclusions on the equilibrium state or kinetic control. This is unfor- tunately impossible at present due to uncertainties in available rate constants. It is also concluded that these considerations require knowledge about ele- mental composition and structure to elucidate possi- ble precipitation products and solid speciation.
The total concentrations of iron resembled those of the alkaline metals during the event, contrary to aluminium. An average of 50% was retained by both filtration (Table 2) and centrifugation, but with a higher fraction (63%) during the initial phase of the rising hydrograph. The ferric state would dominate in the creek since it is reasonable to assume that the turbulent water in the shallow creek was in equilib- rium with atmospheric oxygen, although Fe(II) would dominate in the soil/groundwater. A pronounced precipitation of ferric (hydr)oxide in the stretch be- tween the deposit and the weir was found before the waste was covered (Karlsson et al., 1987) and it contained a high amount of humic substance (Karls- son et al., 1988). Samples were kept in polypropy- lene bottles and stored in the dark why stabilisation of Fe(II) and reduction of the trivalent state due to fulvic acid and (sun)light would be minor (Deng, 1992; Karlsson et al,, 1994). The total concentration of iron and the filtrable fraction exceeded equilib- rium with Fe(OH)3(am) (log IAP/KT 2.0-2.5, total; 1.7-2.0, filtered). The change in saturation during the event parallelled aluminium. There is also a possibility that formation of colloids could be influ- enced by K-jarosite (cf. Herbert, 1995). The concen- trations of iron in the filtrates were close to equilib- rium during both the rising hydrograph (log IAP/KT 0-1.5) and during the recession (Iog l A P / K T -0 .5 -0 ) . No other solids considered in the study would be expected to participate in the formation of colloids.
These results indicate that formation of Ai/Fe- colloids is possible in this system but it is reasonable to assume kinetic control rather than equilibrium
P, Sand&7 el al. / Journal of Geochemical Exploration 58 (1997) 145-155 153
conditions, once the water has reached the creek. Their surface properties, as reflected by elec- trophoretic mobility, would be influenced by adsorp- tion of substances and /or coprecipitation with humic substances. It seems unlikely that discrete colloids of humic substances would form by flocculation, con- sidering the low ionic strength, although cation- bridging (notably AI(III), Fe(III)) could contribute to such a process. It seems also plausible that debris from decomposition of plant material is found in the colloidal fraction.
The surrounding soil might be another source of colloids. This requires, however, that the mobile pooi of colloid would have a rather homogeneous size distribution in the layers that contributed with water to the creek, which is not supported by the general hydrochemical conditions.
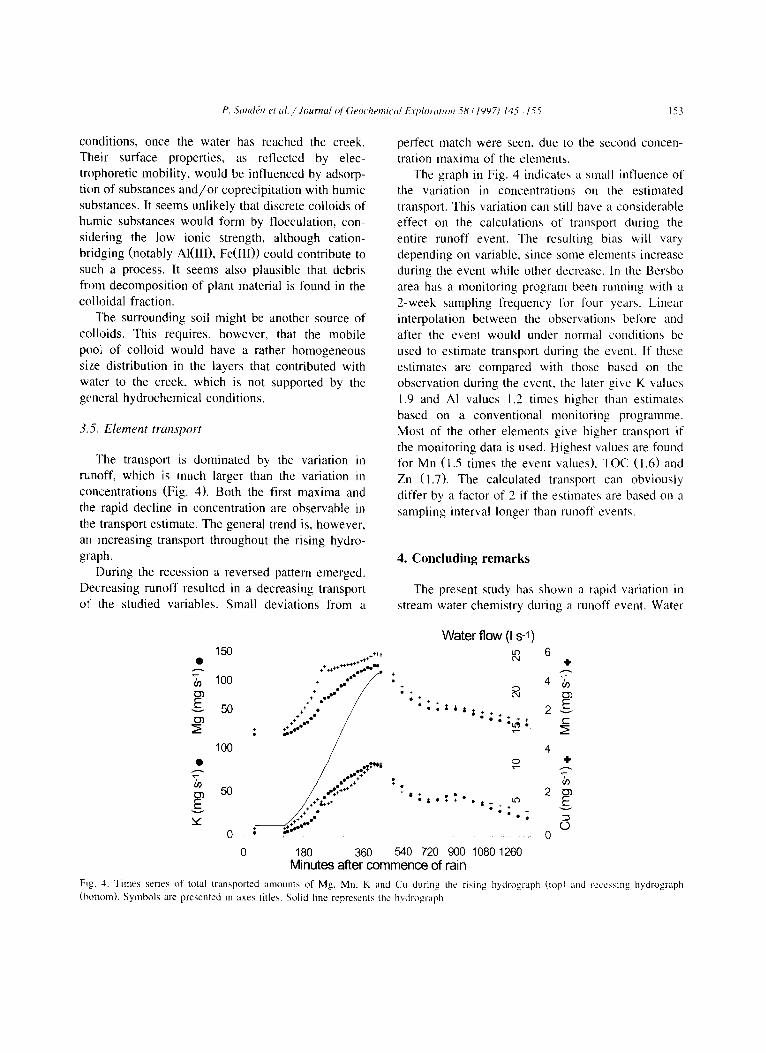
3.5. Element transport
The transport is dominated by the variation in runoff, which is much larger than the variation in concentrations (Fig. 4). Both the first maxima and the rapid decline in concentration are observable in the transport estimate. The general trend is, however, an increasing transport throughout the rising hydro- graph.
During the recession a reversed pattern emerged. Decreasing runoff resulted in a decreasing transport of the studied variables. Small deviations from a
perfect match were seen, due to the second concen- tration maxima of the elements.
The graph in Fig. 4 indicates a small influence of the variation in concentrations on the estimated transport. This variation can still have a considerable effect on the calculations of transport during the entire runoff event. The resulting bias will vary depending on variable, since some elements increase during the event while other decrease. In the Bersbo area has a monitoring program been running with a 2-week sampling frequency for four years. Linear interpolation between the observations before and after the event would under normal conditions be used to estimate transport during the event. If these estimates are compared with those based on the observation during the event, the later give K values 1.9 and At values 1.2 times higher than estimates based on a conventional monitoring programme. Most of the other elements give higher transport if the monitoring data is used. Highest values are found for Mn (1.5 times the event values), TOC (1.6) and Zn (1.7). The calculated transport can obviously differ by a factor of 2 if the estimates are based on a sampling interval longer than runoff events.
4. Concluding remarks
The present study has shown a rapid variation in stream water chemistry during a runoff event. Water
Water f low (I s-l) 150 L~ 6
• ++,,++~+ 04 4"
/ • 4 100 * "°" ; o +÷+ . ~ ° o + 0,1
• ° + + +
vIF 50 ' ' = * = ~ . . . . . + 2 vE O o ~ + r -
+ •
• * o." / +÷ ee ° ~ o
100 4 • ..:~..,,.-~ ~ +
50 .. 't+ "*÷÷ ~ , . 2 G~ E - = . : + ' ' . , ; + Lo EE
++ • • e o °
0 0 ; " ~ " . 0
0 180 360 540 720 900 1080 1260 Minutes after commence of rain
Fig. 4. Times series of total transported amounts of Mg, Mn, K and Cu during the rising hydrograph (topl and rcccssing hydrograph (bottom). Symbols are presented in axes titles. Solid line represents the hydrograph.
I54 P. Sand~n et al. / Journal of Geochemical Exploration 58 (1997) 145--155
of various origin dominates during different stages of the rising hydrograph. One important factor is the travel time for water in the system, but the response of areas with differing hydrological properties is also contributing to the observed pattern. Some variations could be attributed to chemical redistributions.
It is also important to note that after resuspension, during the rising hydrograph there was a high and fairly constant concentration of colloids with an av- erage diameter of 250 nm. Metals associated with this fraction was not included in the study since conventional phase separation was use, with filters having a nominal pore size of 0.4 ixm.
Several runoff events must be monitored, cover- ing different seasons and runoff conditions, to get a thorough understanding of the governing processes. A chemical characterisation of water from different pans of the catchment before and after the event together with the chemistry of rain is needed for a better understanding of the processes involved. A characterisation of the element composition in the colloidal phase is also needed for the interpretation.
Acknowledgements
The authors would like to express their sincere gratitude to Ms. Eva Nordlund and Dr. Christina Krantz-Rfilcker, who were willing to spend a dark, wet and chilly Saturday night taking samples from the creek. Ms. Anna-Karin P~lsson made most of the analysis on the organic material (supervised by Dr. Catharina Pettersson), for which we are also very grateful.
References
Allard, B., Bergstr~Sm, S., Brandt, M., Karlsson, S., Lohm, U. and Sandrn, P., 1987. Environmental impacts of an old mine tailings deposit - - Hydrochemical and hydrological back- ground. Nordic Hydrol., 18: 270-290.
Chapman, P.J., Reynolds, B. and Wheater, H.S., 1993. Hydro- chemical changes along stormflow pathways in a small moor- land headwater catchment in Mid-Wales. UK. J. Hydrol., 151: 241-265.
Deng, Y., 1992. Formation and dissolution of aquatic iron(Ill) (hydr)oxides - - Implication for redox cycling of iron in natural waters. Thesis, Swiss Federal Institute of Technology. Zurich, ETH No. 9724, 117 pp.
Foster, I.D.L., 1980. Chemical yields in runoff, and denudation in
a small arable catchment, East Devon, England. J. Hydrol., 47: 349-368.
Harries, J.R. and Ritchie, A.I.M., 1983. Runoff fraction and pollution levels in runoff from a waste rock dump undergoing pyritic oxidation. Water Air Soil Pollut., 19: 155-170.
Hart, B.T., Davies, S.H.R. and Thomas, P.A., 1982. Transport of Iron, Manganese, Cadmium, Copper and Zinc by Magela Creek, Northern Territory, Australia. Water Res., 16:605-612.
Herbert, R.B., Jr, 1995. The Geochemistry of Groundwater and Soils Contaminated by Acid Mine Leachate (Diss.). Acta Univ. Ups., Comprehensive Summaries of Uppsala Disserta- tions from the Faculty of Science and Technology, 156, Uppsala, 33 pp.
Horowitz, A.J., Elrick, K.A. and Colberg, M.R., 1992. The effect of membrane filtration artifacts on dissolved trace element concentrations. Water Res., 26: 753-763.
Karlsson, S., Sandrn, P. and Allard, B.. 1987. Environmental impacts of an old mine tailings deposit - - Metal adsorption by particulate matter. Nordic Hydrol., 18: 313-324.
Karlsson, S., Allard, B. and H~kansson, K., 1988. Characteriza- tion of suspended solids from a stream receiving acid mine effluents, Bersbo, Sweden. Appl. Geochem., 3: 345-356.
Karlsson, S., H~kansson, K. and Allard, B., 1989. Contamination and background levels of copper, zinc and cadmium in the groundwater of a mining area. In: Proc. Int. Conf. Heavy Metals in the Environment, Geneva, Vol. 1, pp. 296-299.
Karlsson, S., Peterson, A., H~kansson, K. and Ledin, A., 1994. Fractionation of trace metals in surface waters with screen filters. Sci. Total Environ., 149: 215-223.
Karlsson, S., Ledin, A. and Diiker, A., 1997. Temporal changes in concentration and size distribution of colloidal Cu, Zn and Cd in lake Risten, Sweden. To be published.
Ledin. A., Karlsson, S., Diiker, A. and Allard, B., 1993. Applica- bility of photon correlation spectroscopy for measurement of concentration and size distribution of colloids in natural wa- ters. Anal. Chim. Acta, 281: 421-428.
Ledin, A., Karlsson, S., Diiker, A. and Allard, B.. 1995. Charac- terization of the submicron phase in surface waters. Analyst, 120: 603-608.
Ledin, A., Karlsson, S., H~tkansson, K., Sand~n, P. and Diiker, A., 1996. Temporal changes in concentration, composition and size distribution of the colloidal phase in lake Risten, Sweden. Sci. Total Environ., 188: 87-99.
Lundgren, T., 1990. Bersbo - - the first full scale project in Sweden to abate acid mine drainage from old mining activi- ties. In: Proc. Annual Meeting. Geological Association of Canada, Vancouver.
Pettersson, C., H~kansson, K.. Karlsson, S. and Allard, B., 1993. Metal speciation in a humic surface water system polluted by acidic leachates from a mine waste deposit in Sweden. Water Res., 27: 863-871.
Sand~n, P., Karlsson, S. and Lohm, U., 1987. Environmental impacts of an old mine tailings deposit - - metal concentra- tions and water pathways. Nordic Hydrol., 16: 301-312.
Sandrn, P., 199l. Estimation and simulation of metal mass trans- port in an old mining area. Water Air and Soil Pollut., 57/58: 387-398.

P. Sand~n et al . /Journal of Geochemical Exploration 58 (1997) 145-155 155
Stutnrrt, W. (Editor). 1990. Aquatic Chemical Kinetics. Wiley, New York, 545 pp.
Stumm, W., 1992. Chemistry of the Solid-Water Interface. Wi- Ley, New York, 428 pp.
Walling, D.E. and Foster, D.E., 1975. Variations in the natural "hemical concentration of river water during flood flows, and the lag effect: some further comments. J. Hydrol., 26: 237-244.
Wolrath, H.. Karlsson, S. and Dahl6n, J., 1997. Determination of F , CI , NO~-, PO) and SO 4- in natural waters with capillary zone electrophoresis - - comparison with Swedish reference methods. Submitted.