Variation of Moho depth in the central part of the Alborz Mountains, northern Iran
12
Geophys. J. Int. (2010) 181, 173–184 doi: 10.1111/j.1365-246X.2010.04518.x GJI Geodynamics and tectonics Variation of Moho depth in the central part of the Alborz Mountains, northern Iran A. Radjaee, 1 D. Rham, 2 M. Mokhtari, 1 M. Tatar, 1 K. Priestley 2 and D. Hatzfeld 3 1 International Institute of Earthquake Engineering and Seismology, Tehran, Iran 2 Department of Earth Sciences, University of Cambridge, Cambridge, UK. E-mail: [email protected] 3 Laboratoire de Geophysique Interne et Tectonophysique de Grenoble, University Joseph Fourier, Grenoble, France Accepted 2010 January 11. Received 2010 January 9; in original form 2009 September 9 SUMMARY The Alborz Mountains of northern Iran form a belt of active crustal deformation along the southern side of the Caspian Sea within the broad Arabian–Eurasia continental collision zone. Although the range has an average elevation of about 3000 m with the volcanic peak Damavand reaching an elevations of 5671 m, early gravity studies found that the crust beneath the range is no thicker than that beneath the surrounding region suggesting the range is not supported by a crustal root. We determine a model for the crust of the central Alborz Mountains using teleseismic receiver functions from data recorded on a network of broad-band seismographs temporarily deployed across the central part of the range. The receiver functions from these recordings have been inverted simultaneously with fundamental-mode Rayleigh wave group velocity measurements in the 10–100 s period range. Our analysis shows a thickening of the crust from ∼48 km beneath the northern part of the Central Iranian Plateau to 55–58 km below the central part of the Alborz Mountains, then a thinning of the crust to ∼46 km north of the Alborz Mountains beneath the coastal region of the South Caspian Sea. Our seismological results show that the central Alborz Mountains have a moderate crustal root but of insufficient thickness to compensate the elevation of the range. The analysis of free-air gravity shows that the elevation of the Alborz Mountains is largely supported by the elastic strength of the Iranian Plate, the South Caspian Plate, or both. Key words: Continental margins: convergent; Intra-plate processes; Crustal structure. 1 INTRODUCTION The Alborz Mountains form a seismically active fold-and-thrust belt along the southern Caspian Sea coast extending from the southern end of the Talesh Mountains in the west to their junction with the Kopeh Dagh Mountains in the east (Fig. 1). About a quarter of the overall Arabian-Eurasian convergence in this part of the collision zone (∼5 ± 2 mm yr −1 ) is accommodated across the Alborz Moun- tains, the remainder occurring in the Zagros Mountains of SW Iran and across the South Caspian Basin (Vernant et al. 2004). Most of the focal mechanisms for earthquakes (Fig. 1) in the Alborz show either reverse faulting or left-lateral strike-slip on faults parallel to the regional strike of the range (Priestley et al. 1994; Jackson et al. 2002). All well-constrained earthquake centroid focal depths in the belt occur at depths shallower than ∼30 km. The Alborz are narrow (120–150 km wide), steep and bounded by major thrust faults on the north (e.g. Khazar Fault) and south (e.g. North Tehran and North Qazvin Faults) sides of the range (Berberian & Yeats 1999) (Fig. 1). The north-bounding reverse faults dip southwards, suggesting the underthrusting of the south Caspian basin (see Tatar et al. 2007) and the south-bounding reverse faults dip northwards; both help accom- modate shortening between central Iran and stable Eurasia. Strike slip faults occur at higher elevations in the range. Dating of thermal histories of granites in the central Alborz suggests a rapid uplift of the range between about 6 and 4 Ma (Axen et al. 2001), nearly syn- chronous with subsidence in the South Caspian (Allen et al. 2004) while others suggest the range is somewhat older (Guest et al. 2006; Ballato et al. 2008). Few studies have focused on the crustal structure of Iran, and those that have are primarily concerned with the large-scale struc- ture of the Iranian Plateau and not the detailed structure of the Alborz region. Knowledge of the Moho depth beneath the Alborz Mountains is important for understanding the complex tectonics of northern Iran and for evaluating seismic hazard in the region. The Alborz are a young mountain range (Axen et al. 2001; Guest et al. 2006; Ballato et al. 2008), and earlier gravity analysis (Dehghani & Makris 1984) suggested that the range does not have a crustal root making it unclear what supports the topography. The seismic hazard in the region is substantial and there is a long history of devastating earthquakes. Towns on the site of the modern capital city of Tehran located on the southern slopes of the Alborz Mountains have been severely damaged or destroyed by C 2010 The Authors 173 Journal compilation C 2010 RAS
-
Upload
independent -
Category
Documents
-
view
1 -
download
0
Transcript of Variation of Moho depth in the central part of the Alborz Mountains, northern Iran

Geophys. J. Int. (2010) 181, 173–184 doi: 10.1111/j.1365-246X.2010.04518.x
GJI
Geo
dyna
mic
san
dte
cton
ics
Variation of Moho depth in the central part of the AlborzMountains, northern Iran
A. Radjaee,1 D. Rham,2 M. Mokhtari,1 M. Tatar,1 K. Priestley2 and D. Hatzfeld3
1International Institute of Earthquake Engineering and Seismology, Tehran, Iran2Department of Earth Sciences, University of Cambridge, Cambridge, UK. E-mail: [email protected] de Geophysique Interne et Tectonophysique de Grenoble, University Joseph Fourier, Grenoble, France
Accepted 2010 January 11. Received 2010 January 9; in original form 2009 September 9
S U M M A R YThe Alborz Mountains of northern Iran form a belt of active crustal deformation along thesouthern side of the Caspian Sea within the broad Arabian–Eurasia continental collision zone.Although the range has an average elevation of about 3000 m with the volcanic peak Damavandreaching an elevations of 5671 m, early gravity studies found that the crust beneath the rangeis no thicker than that beneath the surrounding region suggesting the range is not supportedby a crustal root. We determine a model for the crust of the central Alborz Mountains usingteleseismic receiver functions from data recorded on a network of broad-band seismographstemporarily deployed across the central part of the range. The receiver functions from theserecordings have been inverted simultaneously with fundamental-mode Rayleigh wave groupvelocity measurements in the 10–100 s period range. Our analysis shows a thickening of thecrust from ∼48 km beneath the northern part of the Central Iranian Plateau to 55–58 km belowthe central part of the Alborz Mountains, then a thinning of the crust to ∼46 km north of theAlborz Mountains beneath the coastal region of the South Caspian Sea. Our seismologicalresults show that the central Alborz Mountains have a moderate crustal root but of insufficientthickness to compensate the elevation of the range. The analysis of free-air gravity shows thatthe elevation of the Alborz Mountains is largely supported by the elastic strength of the IranianPlate, the South Caspian Plate, or both.
Key words: Continental margins: convergent; Intra-plate processes; Crustal structure.
1 I N T RO D U C T I O N
The Alborz Mountains form a seismically active fold-and-thrust beltalong the southern Caspian Sea coast extending from the southernend of the Talesh Mountains in the west to their junction with theKopeh Dagh Mountains in the east (Fig. 1). About a quarter of theoverall Arabian-Eurasian convergence in this part of the collisionzone (∼5 ± 2 mm yr−1) is accommodated across the Alborz Moun-tains, the remainder occurring in the Zagros Mountains of SW Iranand across the South Caspian Basin (Vernant et al. 2004). Most ofthe focal mechanisms for earthquakes (Fig. 1) in the Alborz showeither reverse faulting or left-lateral strike-slip on faults parallel tothe regional strike of the range (Priestley et al. 1994; Jackson et al.2002). All well-constrained earthquake centroid focal depths in thebelt occur at depths shallower than ∼30 km. The Alborz are narrow(120–150 km wide), steep and bounded by major thrust faults onthe north (e.g. Khazar Fault) and south (e.g. North Tehran and NorthQazvin Faults) sides of the range (Berberian & Yeats 1999) (Fig. 1).The north-bounding reverse faults dip southwards, suggesting theunderthrusting of the south Caspian basin (see Tatar et al. 2007) andthe south-bounding reverse faults dip northwards; both help accom-
modate shortening between central Iran and stable Eurasia. Strikeslip faults occur at higher elevations in the range. Dating of thermalhistories of granites in the central Alborz suggests a rapid uplift ofthe range between about 6 and 4 Ma (Axen et al. 2001), nearly syn-chronous with subsidence in the South Caspian (Allen et al. 2004)while others suggest the range is somewhat older (Guest et al. 2006;Ballato et al. 2008).
Few studies have focused on the crustal structure of Iran, andthose that have are primarily concerned with the large-scale struc-ture of the Iranian Plateau and not the detailed structure of theAlborz region. Knowledge of the Moho depth beneath the AlborzMountains is important for understanding the complex tectonics ofnorthern Iran and for evaluating seismic hazard in the region. TheAlborz are a young mountain range (Axen et al. 2001; Guest et al.2006; Ballato et al. 2008), and earlier gravity analysis (Dehghani &Makris 1984) suggested that the range does not have a crustal rootmaking it unclear what supports the topography.
The seismic hazard in the region is substantial and there is along history of devastating earthquakes. Towns on the site of themodern capital city of Tehran located on the southern slopes ofthe Alborz Mountains have been severely damaged or destroyed by
C© 2010 The Authors 173Journal compilation C© 2010 RAS
174 A. Radjaee et al.
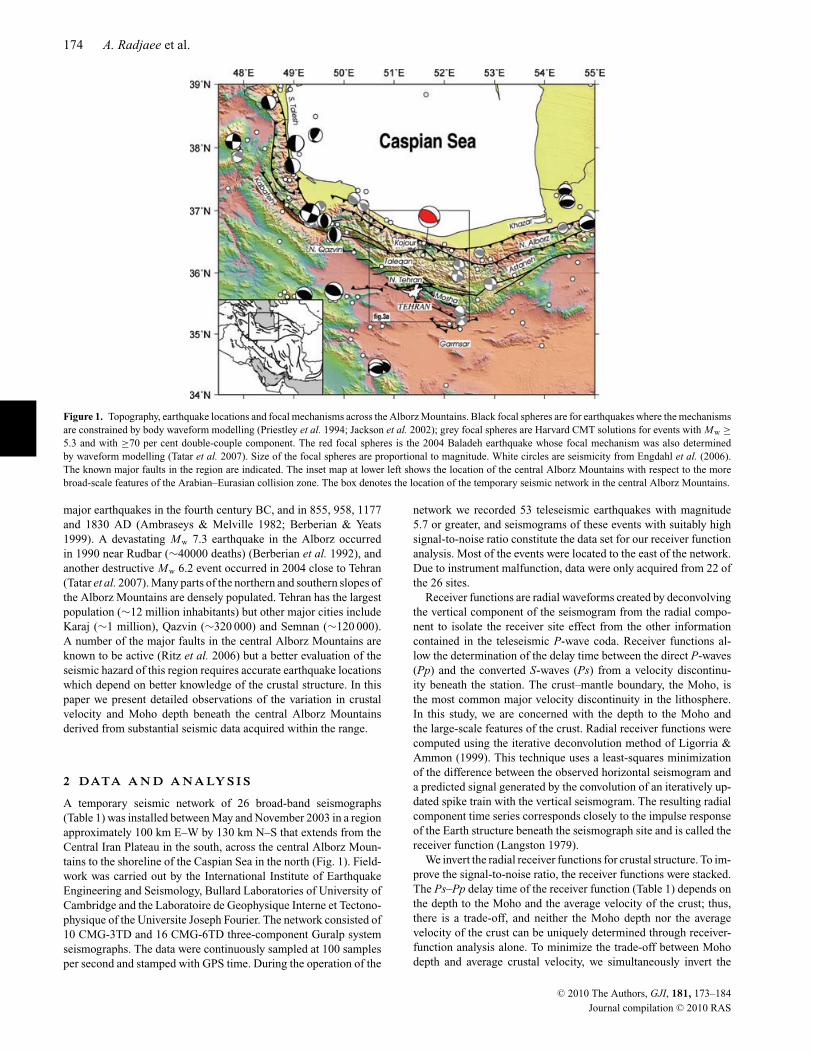
Figure 1. Topography, earthquake locations and focal mechanisms across the Alborz Mountains. Black focal spheres are for earthquakes where the mechanismsare constrained by body waveform modelling (Priestley et al. 1994; Jackson et al. 2002); grey focal spheres are Harvard CMT solutions for events with Mw ≥5.3 and with ≥70 per cent double-couple component. The red focal spheres is the 2004 Baladeh earthquake whose focal mechanism was also determinedby waveform modelling (Tatar et al. 2007). Size of the focal spheres are proportional to magnitude. White circles are seismicity from Engdahl et al. (2006).The known major faults in the region are indicated. The inset map at lower left shows the location of the central Alborz Mountains with respect to the morebroad-scale features of the Arabian–Eurasian collision zone. The box denotes the location of the temporary seismic network in the central Alborz Mountains.
major earthquakes in the fourth century BC, and in 855, 958, 1177and 1830 AD (Ambraseys & Melville 1982; Berberian & Yeats1999). A devastating Mw 7.3 earthquake in the Alborz occurredin 1990 near Rudbar (∼40000 deaths) (Berberian et al. 1992), andanother destructive Mw 6.2 event occurred in 2004 close to Tehran(Tatar et al. 2007). Many parts of the northern and southern slopes ofthe Alborz Mountains are densely populated. Tehran has the largestpopulation (∼12 million inhabitants) but other major cities includeKaraj (∼1 million), Qazvin (∼320 000) and Semnan (∼120 000).A number of the major faults in the central Alborz Mountains areknown to be active (Ritz et al. 2006) but a better evaluation of theseismic hazard of this region requires accurate earthquake locationswhich depend on better knowledge of the crustal structure. In thispaper we present detailed observations of the variation in crustalvelocity and Moho depth beneath the central Alborz Mountainsderived from substantial seismic data acquired within the range.
2 DATA A N D A NA LY S I S
A temporary seismic network of 26 broad-band seismographs(Table 1) was installed between May and November 2003 in a regionapproximately 100 km E–W by 130 km N–S that extends from theCentral Iran Plateau in the south, across the central Alborz Moun-tains to the shoreline of the Caspian Sea in the north (Fig. 1). Field-work was carried out by the International Institute of EarthquakeEngineering and Seismology, Bullard Laboratories of University ofCambridge and the Laboratoire de Geophysique Interne et Tectono-physique of the Universite Joseph Fourier. The network consisted of10 CMG-3TD and 16 CMG-6TD three-component Guralp systemseismographs. The data were continuously sampled at 100 samplesper second and stamped with GPS time. During the operation of the
network we recorded 53 teleseismic earthquakes with magnitude5.7 or greater, and seismograms of these events with suitably highsignal-to-noise ratio constitute the data set for our receiver functionanalysis. Most of the events were located to the east of the network.Due to instrument malfunction, data were only acquired from 22 ofthe 26 sites.
Receiver functions are radial waveforms created by deconvolvingthe vertical component of the seismogram from the radial compo-nent to isolate the receiver site effect from the other informationcontained in the teleseismic P-wave coda. Receiver functions al-low the determination of the delay time between the direct P-waves(Pp) and the converted S-waves (Ps) from a velocity discontinu-ity beneath the station. The crust–mantle boundary, the Moho, isthe most common major velocity discontinuity in the lithosphere.In this study, we are concerned with the depth to the Moho andthe large-scale features of the crust. Radial receiver functions werecomputed using the iterative deconvolution method of Ligorria &Ammon (1999). This technique uses a least-squares minimizationof the difference between the observed horizontal seismogram anda predicted signal generated by the convolution of an iteratively up-dated spike train with the vertical seismogram. The resulting radialcomponent time series corresponds closely to the impulse responseof the Earth structure beneath the seismograph site and is called thereceiver function (Langston 1979).
We invert the radial receiver functions for crustal structure. To im-prove the signal-to-noise ratio, the receiver functions were stacked.The Ps–Pp delay time of the receiver function (Table 1) depends onthe depth to the Moho and the average velocity of the crust; thus,there is a trade-off, and neither the Moho depth nor the averagevelocity of the crust can be uniquely determined through receiver-function analysis alone. To minimize the trade-off between Mohodepth and average crustal velocity, we simultaneously invert the
C© 2010 The Authors, GJI, 181, 173–184
Journal compilation C© 2010 RAS

Variation of Moho depth in Alborz Mountains 175
Table 1. Summary of Alborz Receiver Function results.
Sta. Sensor Lat. Long. Elev. Ps-Pp Number Number Distance Average Moho Average V s
type (◦N) (◦E) (m) (s) RF stacks (degrees) depth (km)a (km s−1)
J2 CMG-3TD 36.122 51.367 2425 6.98 ± 0.47 23 4 30–81 56 3.619J3 CMG-3TD 36.638 51.392 219 4.42 ± 0.18 12 2 30–80 46 3.613K1 CMG-3TD 35.405 51.312 1106 6.39 ± 0.22 30 5 30–99 48 3.569HSBb 35.428 51.357 6.0 51K2 CMG-3TD 35.963 51.542 2203 6.91 ± 0.42 34 4 30–99 57 3.632K3 CMG-3TD 36.385 51.780 1545 7.35 ± 0.31 24 5 30–98 56 3.512L1 CMG-3TD 35.630 51.972 1680 6.91 ± 0.26 27 4 30–81 54 3.592DMVb 35.583 52.028 7.8 67.5L2 CMG-3TD 36.103 52.170 1658 7.03 ± 0.39 35 5 29–98 58 3.638N1 CMG-6TD 36.445 51.910 669 6.08 ± 0.26 21 3 29–80 49 3.569N3 CMG-6TD 36.408 51.565 1361 6.77 ± 0.47 8 2 60–80 56 3.639N4 CMG-6TD 36.378 51.253 1242 6.05 ± 0.35 7 4 63–97 52 3.593N6 CMG-6TD 36.232 51.562 2484 6.23 ± 0.65 16 3 30–79 54 3.620N7 CMG-6TD 36.210 51.828 2026 5.84 ± 0.35 19 4 29–80 52 3.556N8 CMG-6TD 36.002 51.308 2007 5.52 ± 0.27 12 2 30–80 50 3.559N9 CMG-6TD 35.965 51.115 1826 6.21 ± 0.38 21 6 30–96 54 3.579N10 CMG-6TD 35.590 50.630 1262 6.36 ± 0.25 13 2 31–77 49 3.512MHDb 35.686 50.665 6.4 54.5T1 CMG-6TD 36.325 52.125 996 6.65 ± 0.38 22 4 29–80 54 3.640T3 CMG-6TD 36.327 52.357 372 5.00 ± 0.49 18 4 29–79 58 3.448T4 CMG-6TD 36.240 52.347 1013 6.01 ± 0.52 8 4 29–77 54 3.619T5 CMG-6TD 36.193 52.017 1907 6.62 ± 0.57 9 3 39–87 57 3.624T6 CMG-6TD 35.977 52.297 1761 6.70 ± 0.60 17 4 29–80 56 3.622T7 CMG-6TD 35.883 52.165 2118 6.49 ± 0.46 13 3 41–77 53 3.593T9 CMG-6TD 35.448 52.170 1447 6.68 ± 0.33 11 3 30–81 52 3.553aMoho depths referred to the surface.bFrom table 1 of Sodoudi et al. (2009).
P-wave receiver functions with fundamental-mode Rayleigh wavegroup velocity in the period range 10–100 s for the Alborz region(Rham 2009). The simultaneous inversion of both data sets providesstrong constraints on crustal structure since receiver functions aresensitive to discontinuities in the structure but less so to the absolutevelocities, whereas the dispersion data are sensitive to the absolutevelocities but less so to first-order discontinuities.
In the inversion for the crustal model we start with a finelyparametrized initial velocity model with a constant shear wave speedof 4.68 km s−1 from the surface to 310 km depth and with the globalEarth velocity model AK135 (Kennett et al. 1995) at deeper depths.We are only concerned here with the crustal velocity structure; thereason for extending the starting model to such large depths wasto not introduce artefacts in the inversion of the surface waves bytruncating the model. The lack of a Moho discontinuity in the start-ing inversion model assures us that the location of the Moho inthe resulting inversion model is not biased by an initial choice ofa Moho in the inversion starting model, and that the Moho loca-tion in the inversion model was dictated by the receiver functionand surface wave dispersion data alone. We first simultaneouslyinvert the receiver function and dispersion data using the finelyparametrized starting model. The initial inversion models were ex-amined for weak boundaries that straddle discontinuities of similarseismic wave speeds and these layers were then combined to createa more coarsely parametrized model which serves as a new startingmodel for the next inversion iteration. This process was repeated un-til we obtained the simplest model in terms of number of layers thatmatched the major features of the receiver function while simulta-neously satisfying the surface wave data. We then tested the modelusing forward modelling to determine how much the significantfeatures of the model could vary while still giving a satisfactory fitto the receiver function and surface wave dispersion data. We found
from these tests that the average uncertainty in the Moho depth was±2.5 km. Receiver-function and surface wave dispersion inversionresults for data from station K3 are shown in Fig. 2; results for theremaining 21 sites are shown in Figs A1–A4.
3 M O H O D E P T H VA R I AT I O N B E N E AT HT H E A L B O R Z M O U N TA I N S
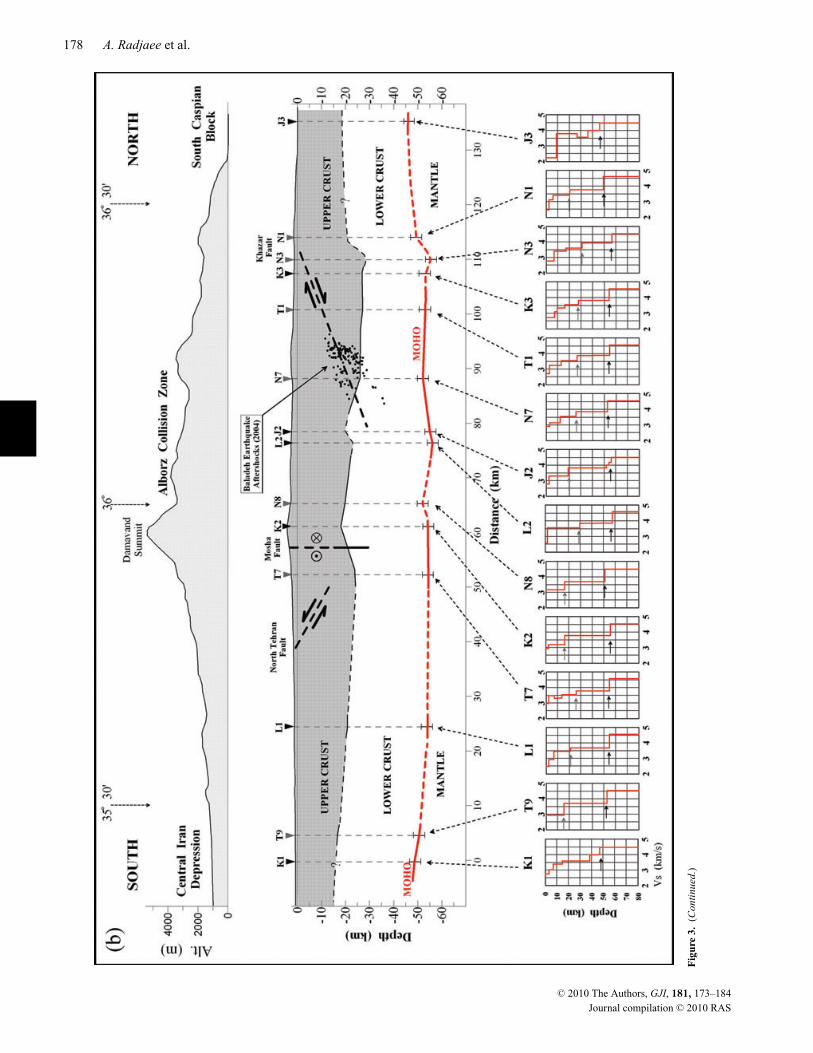
Table 1 and Fig. 3 summarizes the inversion results of the receiverfunction/surface wave analysis. Fig. 3(a) shows the average Mohodepths determined for each site. We interpret the Moho as the depthat which the shear wave velocity reaches sustained values typicalof the sub-Moho mantle, and this depth is denoted by heavy arrowin the wave speed versus depth plots in the lower part of Fig. 3(b).Fig. 3(a) shows only marginal thickening of the crust across theAlborz Mountains with a deepening of the Moho from slightly lessthan 50 km beneath the Central Iranian Plateau south of Tehranto about 55–58 km below the highest part of the range. Along theSouth Caspian coast the crustal thickness is 50 km or less. Mostof the individual crustal models from the receiver-function/surfacewave dispersion inversion suggest a mid-crustal interface (Fig. 3b).The evidence for this feature is not strong and it more likely resultsfrom a positive velocity gradient in the crust and our simplificationof the crustal models. However, the data do not warrant more com-plex crustal models and our philosophy has been to determine thesimplest crustal model in terms of the number of layers required toexplain the seismic observations.
We form a crustal cross-section across the Alborz Mountains byprojecting our results onto a NS profile along longitude 51.75◦Eextending from station K1 on the northern part of the Central IranPlateau to station J3 situated close to southern coast of the Caspian
C© 2010 The Authors, GJI, 181, 173–184
Journal compilation C© 2010 RAS
176 A. Radjaee et al.
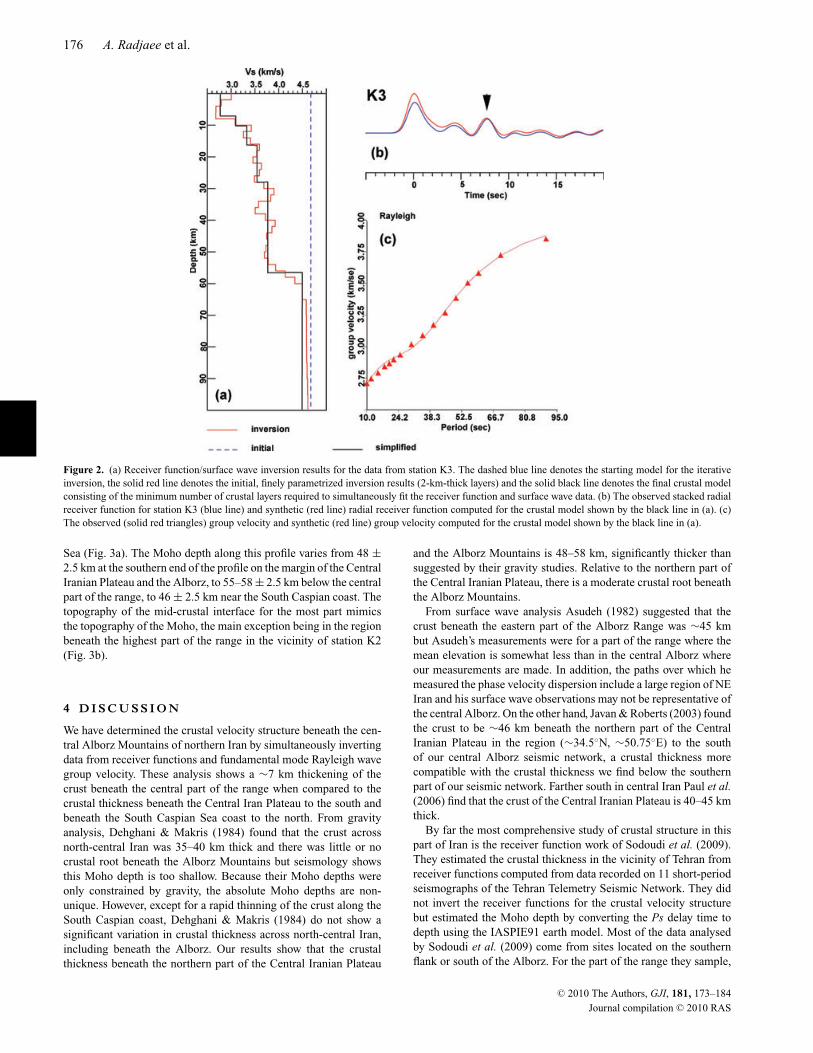
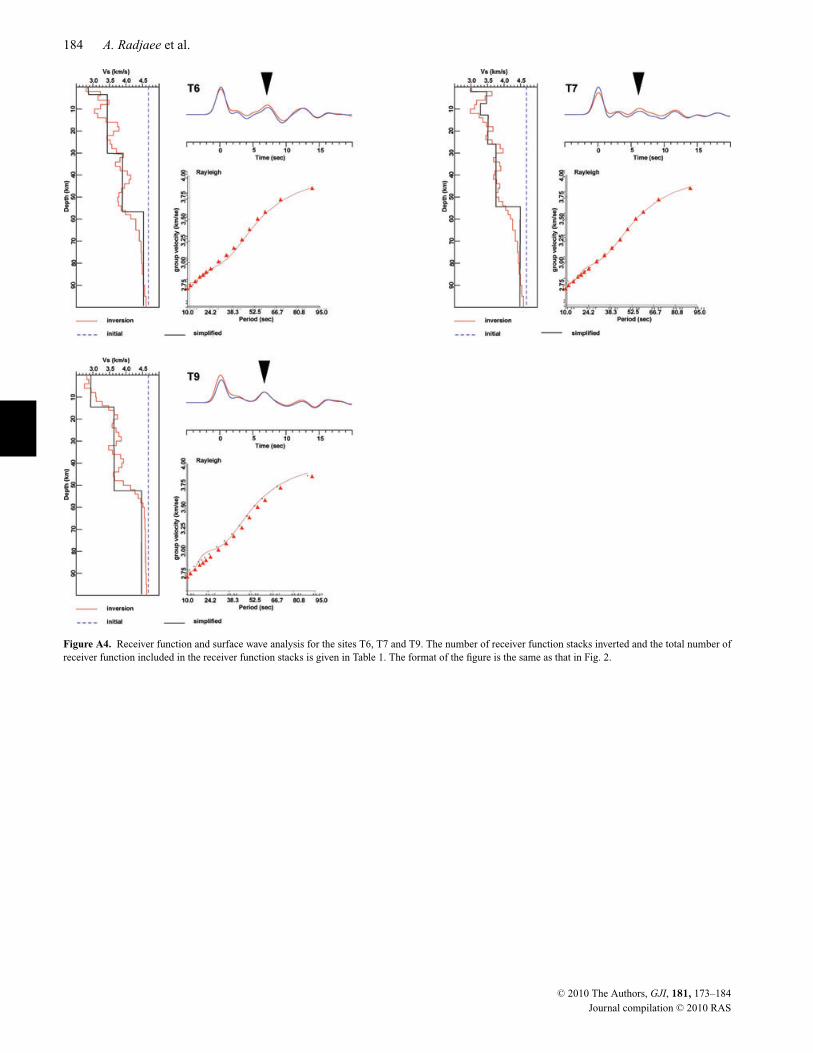
Figure 2. (a) Receiver function/surface wave inversion results for the data from station K3. The dashed blue line denotes the starting model for the iterativeinversion, the solid red line denotes the initial, finely parametrized inversion results (2-km-thick layers) and the solid black line denotes the final crustal modelconsisting of the minimum number of crustal layers required to simultaneously fit the receiver function and surface wave data. (b) The observed stacked radialreceiver function for station K3 (blue line) and synthetic (red line) radial receiver function computed for the crustal model shown by the black line in (a). (c)The observed (solid red triangles) group velocity and synthetic (red line) group velocity computed for the crustal model shown by the black line in (a).
Sea (Fig. 3a). The Moho depth along this profile varies from 48 ±2.5 km at the southern end of the profile on the margin of the CentralIranian Plateau and the Alborz, to 55–58 ± 2.5 km below the centralpart of the range, to 46 ± 2.5 km near the South Caspian coast. Thetopography of the mid-crustal interface for the most part mimicsthe topography of the Moho, the main exception being in the regionbeneath the highest part of the range in the vicinity of station K2(Fig. 3b).
4 D I S C U S S I O N
We have determined the crustal velocity structure beneath the cen-tral Alborz Mountains of northern Iran by simultaneously invertingdata from receiver functions and fundamental mode Rayleigh wavegroup velocity. These analysis shows a ∼7 km thickening of thecrust beneath the central part of the range when compared to thecrustal thickness beneath the Central Iran Plateau to the south andbeneath the South Caspian Sea coast to the north. From gravityanalysis, Dehghani & Makris (1984) found that the crust acrossnorth-central Iran was 35–40 km thick and there was little or nocrustal root beneath the Alborz Mountains but seismology showsthis Moho depth is too shallow. Because their Moho depths wereonly constrained by gravity, the absolute Moho depths are non-unique. However, except for a rapid thinning of the crust along theSouth Caspian coast, Dehghani & Makris (1984) do not show asignificant variation in crustal thickness across north-central Iran,including beneath the Alborz. Our results show that the crustalthickness beneath the northern part of the Central Iranian Plateau
and the Alborz Mountains is 48–58 km, significantly thicker thansuggested by their gravity studies. Relative to the northern part ofthe Central Iranian Plateau, there is a moderate crustal root beneaththe Alborz Mountains.
From surface wave analysis Asudeh (1982) suggested that thecrust beneath the eastern part of the Alborz Range was ∼45 kmbut Asudeh’s measurements were for a part of the range where themean elevation is somewhat less than in the central Alborz whereour measurements are made. In addition, the paths over which hemeasured the phase velocity dispersion include a large region of NEIran and his surface wave observations may not be representative ofthe central Alborz. On the other hand, Javan & Roberts (2003) foundthe crust to be ∼46 km beneath the northern part of the CentralIranian Plateau in the region (∼34.5◦N, ∼50.75◦E) to the southof our central Alborz seismic network, a crustal thickness morecompatible with the crustal thickness we find below the southernpart of our seismic network. Farther south in central Iran Paul et al.(2006) find that the crust of the Central Iranian Plateau is 40–45 kmthick.
By far the most comprehensive study of crustal structure in thispart of Iran is the receiver function work of Sodoudi et al. (2009).They estimated the crustal thickness in the vicinity of Tehran fromreceiver functions computed from data recorded on 11 short-periodseismographs of the Tehran Telemetry Seismic Network. They didnot invert the receiver functions for the crustal velocity structurebut estimated the Moho depth by converting the Ps delay time todepth using the IASPIE91 earth model. Most of the data analysedby Sodoudi et al. (2009) come from sites located on the southernflank or south of the Alborz. For the part of the range they sample,
C© 2010 The Authors, GJI, 181, 173–184
Journal compilation C© 2010 RAS

Variation of Moho depth in Alborz Mountains 177
Figure 3. (a) Moho depths determined from the simultaneous inversion ofreceiver functions and fundamental mode Rayleigh wave group velocities.Average uncertainty in the Moho depths are estimated at ±2.5 km. Thecrustal cross-section shown in (b) was constructed by projecting the crustalvelocity models derived from the receiver function/surface wave inversionat sites ±50 km from the line A–A′ indicated in (a) onto the profile. Theupper part of the cross-section plot (b) shows the variation in topographyacross the Alborz Mountains from the Central Iranian Plateau to the southcoast of the Caspian Sea; the middle section shows the variation in thicknessof the upper and lower crust across the Alborz with the upper crust shadedand the Moho denoted by the heavy red line; and the lower part of the plotshows the individual crustal velocity models used to construct the crustalcross-section. Arrows on the individual crustal velocity models in the lowerpart of the figure show our interpretation of the upper/lower crust boundaryand the crust–mantle boundary. The approximate relationship of the northdipping North Tehran thrust fault, the left-lateral strike-slip Mosha Fault andthe south dipping Khazar thrust fault to the crustal structure are indicatedon the crustal cross-section. Hypocentres of the Baladeh earthquake (Tataret al. 2007) have also been projected onto the crustal cross-section.
they find little variation in crustal thickness. With a few exceptions,they find the Moho depth beneath the southern flank of the rangeand the Central Iranian Plateau immediately to the south to variesbetween 51 and 54.5 km and conclude that the Alborz Mountainshave no crustal root.
Included in Table 1 are the results of Sodoudi et al. (2009) forthree of their stations located very near to our sites. Two of the sites(K1/HSB – 4.9 km and N10/MHD – 10.8 km separation) are onthe plateau south of the Alborz and the third (L1/DMV – 7.6 kmseparation) is near the dormant volcano Damavand. Sodoudi et al.’s.estimates of the Moho depth beneath HSB and MHD are 4–5 kmdeeper than the Moho depths we find beneath K1 and N10. The rea-son for the difference is that Sodoudi et al. (2009) use the IASPIE91earth model (Kennett & Enghdal 1991) to convert the Moho Ps de-lay times to an interface conversion depth. The IASPIE91 model isfaster (average V s 3.81 km s−1) than the average velocity we findfor the central Alborz region (average V s 3.59 km s−1) resulting ina 3–4 km deeper depth estimate. In addition, we find the averageV s beneath the northern part of the Central Iranian Plateau south ofthe Alborz range is somewhat less (3.54 km s−1) than in the centralpart of the range (3.60 km s−1). However, Sodoudi et al. (2009) find
the Moho beneath DMV is 13.5 km deeper than what we find forthe Moho depth below L1; more than can be accounted for by thedifference in V s between the IASPIE91 and our model. Abbassiet al. (2010) determine the crustal thickness beneath Damavandusing seismograms from the permanent broad-band seismographlocated at Damavand and operated by the International Institute forEarthquake Engineering and Seismology. They find a Ps delay of7 s (compared with 6.7 s at L1) and a crustal thickness of 58 ± 2 kmfrom inverting the receiver function and the surface wave group ve-locity for this region (Rham 2009) (compared with 54 km beneathL1). The variation in Moho depth in the vicinity of Damavand maybe due to rapid variations in crustal thickness in the immediate areaof the volcano as suggested by Sodoudi et al. (2009), or it maybe that the IASPIE91 crustal model Sodoudi et al. (2009) used toconvert the Ps delay time to depth is inappropriate for this area.
Crustal thickness beneath the central Alborz Mountains is sig-nificantly greater than the 35–40 km estimated from gravity byDehghani & Makris (1984). However, the observed ∼7 km thickroot we find is thin compared to the 13–17-km-thick root required,based on typical average crust (2.82 Kg M−3) and uppermost man-tle (3.3 Kg M−3) densities, to fully compensate the topography.Studies of earthquake focal mechanisms in the region (Priestleyet al. 1994; Jackson et al. 2002; Tatar et al. 2007) show that theoceanic crust of the South Caspian Basin is underthrusting theAlborz Mountains from the north. Tatar et al. (2007) examined themain shock and aftershock locations of the 2004 Baladeh earthquake(Fig. 3) and found this earthquake involved slip on a southward dip-ping thrust fault, possibly the Khazar Fault, extending to ∼30 kmdepth. It may be that some of the topography is supported by thestrong oceanic lithosphere of the South Caspian Basin. Focal mech-anisms of earthquakes to the south of the range (McKenzie 1972;Jackson & McKenzie 1984; Priestley et al. 1994) show that the Cen-tral Iranian Plateau is underthrusting the Alborz Mountains fromthe south. This raises the possibility that the topography is flexurallysupported.
The effective elastic thickness, Te, is a measure of the strength ofthe plate and its ability to supports crustal loads over geologic timescales. Te can be estimated from the relationship between gravityand topography in the frequency domain by computing the transferfunction or admittance (McKenzie & Fairhead 1997). The gravityfield of northern Iran is well constrained by observations, but theSouth Caspian Basin is largely devoid of measurements (Fig. 4a).Maggi et al. (2000) found that Te of the Central Iranian Plateau is∼8 km. Te for the southern part of the South Caspian plate cannotbe determined because of the lack of gravity data. However, Allenet al. (2002) calculated the Te for the northern part of the SouthCaspian Plate immediately south of the Apsheron Sill and founda value of ∼8 km, similar to that of the Central Iranian Plateau.Except for the eastern margin of the South Caspian Basin, thereis little variation in the crustal structure across the south CaspianPlate (Mangino & Priestley 1998), and therefore, it is not unrea-sonable to take the value of 8 km as an estimate of the Te for thesouthern part of the South Caspian Plate to the north of the AlborzMountains. There is a ∼220 mGal free-air gravity anomaly acrossthe central Alborz (Fig. 4b). Fig. 4(c) shows the admittance for Te
of 8 km. The wavelength of the Alborz topography is 120–150 kmand the average amplitude is ∼2.5 km. This gives a free-air gravityanomaly of 205–235 mGal, similar to the free-air gravity anomalyobserved for the Alborz (Fig. 4b). The uncompensated admittancefor the Iranian or south Caspian Plate (Te = 8 km) is 112 mGal km−1.The admittance for the Alborz is 82–95 mGal km−1 indicates thatmuch of the Alborz topography is flexurally supported by the
C© 2010 The Authors, GJI, 181, 173–184
Journal compilation C© 2010 RAS
178 A. Radjaee et al.
Fig
ure
3.(C
onti
nued
.)
C© 2010 The Authors, GJI, 181, 173–184
Journal compilation C© 2010 RAS

Variation of Moho depth in Alborz Mountains 179
Figure 4. (a) Contoured free-air gravity for northern Iran and the South Caspian Basin. The Alborz Mountains are well-sampled by gravity measurements butthere is little gravity data for the South Caspian Basin, and much of what is shown by the gravity contours in the South Caspian Basin is from interpolation.(b) Gravity profile across the central Alborz Mountains in the region of the seismic experiment. The location of the gravity profile is designated by thesmall, north-south light green box in (a). (c) Admittance for Te of 8 km (Maggi et al. 2000) calculated for the area outlined by the oblique, light green largebox in (a). The wavelength of the Alborz topography is 120–150 km (vertical red dashed lines in c) and the amplitude is ∼2.5 km giving an admittance of82–95 mGal km−1. This gives a free-air gravity anomaly of 205–235 mGal (horizontal red dashed lines in c), similar to that observed in (b). The uncompensatedadmittance for the Iranian or southern Caspian Plate is 112 mGal km−1 (horizontal green dashed-dot line in c) indicating that much of the Alborz topographyis flexurally supported.
Iranian Plate, the South Caspian Plate, or both. The Alborz Moun-tains are too narrow and the north Iran and south Caspian plates toostrong for the Alborz to form a crustal root which fully compensatethe topography.
5 S U M M A RY
(1) Receiver functions and surface wave group velocity data fromseismograms recorded on a network of 22 broad-band seismographshave been used to determine the variation in crustal thickness acrossthe central Alborz Mountains in northern Iran.
(2) Our analysis shows a thickening of the crust from ∼48 kmbeneath the northern part of the Central Iranian Plateau to 55–58 kmbelow the central part of the Alborz Mountains, then a thinning ofthe crust to ∼46 km north of the Alborz Mountains beneath thecoastal region of the South Caspian Sea.
(3) The crust beneath northern Iran and the central Alborz isconsiderably thicker that previously thought and the range doeshave a crustal root but significantly less than that required to fullcompensate the topography.
(4) Analysis of the free-air gravity anomaly across northern Iransuggest that that much of the Alborz topography is flexurally sup-ported.
A C K N OW L E D G M E N T S
Seismic instrumentation for the fieldwork described here was pro-vided by SEISUK. This research has benefited from discussionswith James Jackson and Dan McKenzie. Dan McKenzie providedthe gravity and admittance plots shown in Fig. 4. James Jacksonprovide suggestions which considerably improved the manuscript.We thank the former president of IIEES, Prof. Ghafory-Ashtianyfor his constant support. We thank Bob Herrmann who provided thereceiver function/surface wave inversion routine. Figs 1 and 3(a)were made with GMT (Wessel & Smith 1998). This is CambridgeUniversity Department of Earth Sciences contribution ES 1324.
R E F E R E N C E S
Abbassi, A., Nasrabadi, A., Tatar, M., Yaminifard, F., Abbassi, M., Hatzfeld,D. & Priestley, K., 2010. Crustal velocity structure in the southern edgeof the Central Alborz (Iran), J. Geodyn., 49, 68–78.
Allen, M., Jones, S., Ismail-Zadeh, A., Simmons, M. & Anderson, L., 2002.Onset of subduction as the cause of the rapid Pliocene-Quaternary subsi-dence in the South Caspian basin, Geology, 30, 775–778.
Allen, M., Jackson, J. & Walker, R., 2004. Late Cenozoic reorganizationof the Arabia-Eurasian collision and the comparison of shhort-term andlong-term deformation rates, Tectonics, 23, doi:10.1029/200TC001530.
C© 2010 The Authors, GJI, 181, 173–184
Journal compilation C© 2010 RAS
180 A. Radjaee et al.
Ambraseys, N. & Melville, C.P., 1982. A History of Persian Earthquakes,Cambridge University Press, New York, NY, p. 219.
Asudeh, I., 1982. Seismic structure of Iran from surface and body wave data,Geophys. J. R. astr. Soc., 71, 715–730.
Axen, G., Lam, P., Grove, M., Stockli, D. & Hassanzadeh, J., 2001. Exhuma-tion of the west-central Alborz Mountains, Iran, Caspian subsidence, andcollision-related tectonics, Geology, 29(6), 559–562.
Ballato, P., Nowaczyk, N., Landgraf, A., Strecker, M., Friedrich, A.& Tabatabaei, S., 2008. Tectonic control on sedimentary facies pat-tern and sediment accumulation rates in the Miocene foreland basinof the southern Alborz mountains, northern Iran, Tectonics, 27,doi:10.1029/2008TC002278.
Berberian, M. & Yeats, R., 1999. Patterns of historical earthquake rupturein the Iranian Plateau, Bull. seism. Soc. Am., 89, 120–139.
Berberian, M., Qorashi, M., Jackson, J., Priestley, K. & Wallace, T., 1992.The Rudbar-Tarom earthquake of 20 June 1990 in NW Persia: Preliminaryfield and seismological observations, and its tectonic significance, Bull.seism. Soc. Am., 82, 1726–1755.
Dehghani, G. & Makris, J., 1984. The gravity field and crustal structure ofIran, N. Jb. Geol. Palaont. Abh., 168, 215–229.
Engdahl, E., Jackson, J., Myers, S., Bergman, E. & Priestley, K., 2006.Relocation and assessment of seismicity in the Iran region, Geophys. J.Int., 111, 761–778, doi:10.1029/2005JB004082.
Guest, B., Stockli, D., Grove, G., Axen, G., Lam, P. & Hassanzadeh, J.,2006. Thermal histories from the central Alborz Mountains, northernIran: implications for the spatial and temporal distribution of deformationin northern Iran, B. Geol. Soc. Am., 118, 1507–1521.
Jackson, J. & McKenzie, D., 1984. Active tectonics of the Alpine-Himalayanbelt between western Turkey and Pakistan, Geophys. J. R. astr. Soc., 77,185–264.
Jackson, J., Priestley, K., Allen, M. & Berberian, M., 2002. Active tectonicsof the South Caspian Basin, Geophys. J. Int., 148(2), 214–245.
Javan, D. & Roberts, R., 2003. Crust and uppermost mantle structure ofTehran region from analysis of teleseismic P-waveform receiver functions,Tectonophysics, 364, 115–133.
Kennett, B. & Enghdal, E., 1991. Traveltimes for global earthquake locationand phase identification, Geophys. J. Int., 105, 429–465.
Kennett, B., Engdahl, E. & Bulland, R., 1995. Constraints on seismic veloc-ities in the Earth from travel times, Geophys. J. Int., 122, 108–124.
Langston, C., 1979. Structure under Mt.Rainier, Washington, inferred fromteleseismic body waves, J. geophys. Res., 84, 4749–4762.
Ligorria, J. & Ammon, C., 1999. Iterative deconvolution and receiver-function estimation, Bull. seism. Soc. Am., 89, 1395–1400.
Maggi, A., Jackson, J., McKenzie, D. & Priestley, K., 2000. Earthquakefocal depths, effective elastic thickness, and the strength of the continentallithosphere, Geology, 28, 495–498.
Mangino, S. & Priestley, K., 1998. The crustal structure of the southernCaspian region, Geophys. J. Int., 133, 630–648.
McKenzie, D., 1972. Active tectonics of the Mediterranean region, Geophys.J. R. astr. Soc., 30, 109–185.
McKenzie, D. & Fairhead, D., 1997. Estimates of the effective elastic thick-ness of the continental lithosphere from Bouger and free air gravityanomalies, J. geophys. Res., 102, 27 523–27 552.
Paul, A., Kaviani, A., Hatzfeld, D., Vergne, J. & Mokhtari, M., 2006. Seis-mological evidence for crustal-scale thrusting in the Zagros mountainbelt(Iran), Geophys. J. Int., 166, 227–237.
Priestley, K., Baker, C. & Jackson, J., 1994. Implications of earthquake focalmechanism data for the active tectonics of the south Caspian Basin andsurrounding regions, Geophys. J. Int., 118, 111–141.
Rham, D., 2009. The crustal structure of the Middle East, PhD thesis,University of Cambridge Library, Cambridge, UK.
Ritz, J.-F., Nazari, N., Ghassemi, A., Salamati, R., Shafei, A., Solaymani,S. & Vernant, P., 2006. Active transtention inside central Alborz: a newinsight into northern Iran-south Caspian geodynamics, 34, 477–480.
Sodoudi, F., Yuan, X., Kind, R., Heit, B. & Sadidkhouy, A., 2009. Evi-dence for a missing crustal root and a thin lithosphere beneath the Cen-tral Alborz by receiver function studies, Geophys. J. Int., 177, 733–742,doi:10.1111/j.1365-246X.2009.04115.x.
Tatar, M., Jackson, J., Hatzfeld, D. & Bergman, E., 2007. The 2004 May28 Baladeh earthquake (mw 6.2) in the Alborz, Iran: overthrusting theSouth Caspian Basin margin, partitioning of oblique convergence and theseismic hazard of Tehran, Geophys. J. Int., 170, 249–261.
Vernant, P. et al., 2004. Present-day crustal deformation and plate kinematicsin Middle East constrained by GPS measurements in Iran and northernOman, Geophys. J. Int., 157, 381–398.
Wessel, P. & Smith, W., 1998. New, versions of the generic mapping toolreleased, EOS, Trans. Am. geophys. Un., 79, 579.
A P P E N D I X
Figs A1–A4 can be seen on the following pages.
C© 2010 The Authors, GJI, 181, 173–184
Journal compilation C© 2010 RAS

Variation of Moho depth in Alborz Mountains 181
Figure A1. Receiver function and surface wave analysis for the sites J2, J3, K1, K2, L1 and L2. The number of receiver function stacks inverted and the totalnumber of receiver function included in the receiver function stacks is given in Table 1. The format of the figure is the same as that in Fig. 2.
C© 2010 The Authors, GJI, 181, 173–184
Journal compilation C© 2010 RAS

182 A. Radjaee et al.
Figure A2. Receiver function and surface wave analysis for the sites N1, N3, N4, N6, N7 and N8. The number of receiver function stacks inverted and thetotal number of receiver function included in the receiver function stacks is given in Table 1. The format of the figure is the same as that in Fig. 2.
C© 2010 The Authors, GJI, 181, 173–184
Journal compilation C© 2010 RAS

Variation of Moho depth in Alborz Mountains 183
Figure A3. Receiver function and surface wave analysis for the sites N9, N10, T1, T3, T4 and T5. The number of receiver function stacks inverted and thetotal number of receiver function included in the receiver function stacks is given in Table 1. The format of the figure is the same as that in Fig. 2.
C© 2010 The Authors, GJI, 181, 173–184
Journal compilation C© 2010 RAS
184 A. Radjaee et al.
Figure A4. Receiver function and surface wave analysis for the sites T6, T7 and T9. The number of receiver function stacks inverted and the total number ofreceiver function included in the receiver function stacks is given in Table 1. The format of the figure is the same as that in Fig. 2.
C© 2010 The Authors, GJI, 181, 173–184
Journal compilation C© 2010 RAS