Variation in fractal symmetry of annual growth in aspen as an indicator of developmental stability...
11
Symmetry 2015, 7, 354-364; doi:10.3390/sym7020354 symmetry ISSN 2073-8994 www.mdpi.com/journal/symmetry Article Variation in Fractal Symmetry of Annual Growth in Aspen as an Indicator of Developmental Stability in Trees Jordan P. Sinclair 1, *, Daniel M. Kashian 1 , John B. Bradford 2 and D. Carl Freeman 1 1 Department of Biological Sciences, Wayne State University, Detroit, MI 48208, USA; E-Mails: [email protected] (D.M.K.); [email protected] (D.C.F.) 2 US Geological Survey, Flagstaff, AZ 86011, USA; E-Mail: [email protected] * Author to whom correspondence should be addressed; E-Mail: [email protected]; Tel.: +1-832-994-2057; Fax: +1-713-348-5232. Academic Editor: John H. Graham Received: 5 February 2015 / Accepted: 1 April 2015 / Published: 9 April 2015 Abstract: Fractal symmetry is symmetry across scale. If one looks at a branch of a tree its branching pattern is reminiscent of the tree as a whole. Plants exhibit a number of different symmetries, including bilateral, rotational, translational, and fractal; deviations from each of these types has been associated with organisms developing in stressful environments. Here, we explore the utilization and meaning of fractal analysis on annual growth ring production in woody plants. Early detection of stress in plants is difficult and the compounding effects of multiple or severe stressors can lead to irreversible damage or death. Annual wood production was used to produce a time series for individuals from stands classified as either high vigor or low vigor (a general measure of health). As a measure of symmetry over time, the fractal dimension of each time series was determined and compared among vigor classes. We found that individuals obtained from low vigor sites had a significantly lower fractal dimension than those from high vigor sites. These results agree with patterns found in a variety of other organisms, and we argue that the reduced fractal dimension is related to a loss in system complexity of stressed individuals. Keywords: dendrochronology; fractal patterns; developmental instability; physiological response; plant stress; symmetry of scale OPEN ACCESS
Transcript of Variation in fractal symmetry of annual growth in aspen as an indicator of developmental stability...
Symmetry 2015, 7, 354-364; doi:10.3390/sym7020354
symmetry ISSN 2073-8994
www.mdpi.com/journal/symmetry
Article
Variation in Fractal Symmetry of Annual Growth in Aspen as
an Indicator of Developmental Stability in Trees
Jordan P. Sinclair 1,*, Daniel M. Kashian 1, John B. Bradford 2 and D. Carl Freeman 1
1 Department of Biological Sciences, Wayne State University, Detroit, MI 48208, USA;
E-Mails: [email protected] (D.M.K.); [email protected] (D.C.F.) 2 US Geological Survey, Flagstaff, AZ 86011, USA; E-Mail: [email protected]
* Author to whom correspondence should be addressed; E-Mail: [email protected];
Tel.: +1-832-994-2057; Fax: +1-713-348-5232.
Academic Editor: John H. Graham
Received: 5 February 2015 / Accepted: 1 April 2015 / Published: 9 April 2015
Abstract: Fractal symmetry is symmetry across scale. If one looks at a branch of a tree its
branching pattern is reminiscent of the tree as a whole. Plants exhibit a number of different
symmetries, including bilateral, rotational, translational, and fractal; deviations from each of
these types has been associated with organisms developing in stressful environments. Here,
we explore the utilization and meaning of fractal analysis on annual growth ring production
in woody plants. Early detection of stress in plants is difficult and the compounding effects
of multiple or severe stressors can lead to irreversible damage or death. Annual wood
production was used to produce a time series for individuals from stands classified as either
high vigor or low vigor (a general measure of health). As a measure of symmetry over time,
the fractal dimension of each time series was determined and compared among vigor classes.
We found that individuals obtained from low vigor sites had a significantly lower fractal
dimension than those from high vigor sites. These results agree with patterns found in a
variety of other organisms, and we argue that the reduced fractal dimension is related to a
loss in system complexity of stressed individuals.
Keywords: dendrochronology; fractal patterns; developmental instability; physiological
response; plant stress; symmetry of scale
OPEN ACCESS
Symmetry 2015, 7 355
1. Introduction
Evaluating plant health remains a challenge despite numerous studies and significant progress in the
field (see below). There is currently no direct measure for plant health and in fact, there is not even a
clear definition (reviewed in [1]). What can be agreed upon is that prolonged stress to an organism
reduces vigor which in turn reduces that individual’s general measure of health. Indicators of plant
health are no different; typically defined on a comparative basis and measured indirectly through the
description of observable traits (i.e., crown loss [2], percent damage [3], photosynthetic rates [4], net
photosynthesis [5], critical wilting [6], insect damage (but see [7]), and various imaging techniques [8]).
The presence of measurable change, however, implies an advanced stage of health decline which may
or may not be reversible [9]. One method to detect underlying stress in a population is through
measurements of developmental stability [10,11]. Although fluctuating asymmetry (random deviations
from bilateral symmetry) is the most commonly used measurement, others include phyllotaxy,
equiangular spirals, and fractal dimension [12]. For this study we focus on the fractal dimension of
annual growth rings in trees.
Fractals derive their name because in many, but not all, cases they have non-integer dimensions [13,14].
True fractals display symmetry of scale, and are infinitely complex. Although natural objects are only
approximate fractals, fractal geometry and analysis serve an important role in the natural sciences. One
example is the replacement of smooth, Euclidean shapes historically used in models by more accurate
fractal shapes, representative of many natural objects such as coast lines, clouds, and tree crowns [15,16].
The fractal dimension of an object is often used to describe the roughness of its surface or edge [17,18].
This type of analysis describes the ability of the object to fill space, and is useful when considering things
like photosynthetic surface area (canopy cover [19]), surface gas exchange (leaf or stem surface area [20]),
and water or nutrient acquisition (root systems [21]). Fractals are also well known for their property of
self-similarity or scale-independence. The concept of self-similarity is important for parsimony and
design models (e.g., structure of a fern [22]), developmental stability [12], and the prevalence of self-similar
systems present in the natural world gives rise to questions regarding order and fundamental rules of
nature [23]. A third application of fractal analysis describes the roughness of a time series, displaying
symmetry of scale over time [24,25]. This type of fractal application has been widely used in the medical
field to monitor heart rate, brain wave, blood pressure, and other biological processes in humans ([26]
and references therein); however, this technique has only rarely been used to evaluate developmental
stability in plants [12,27].
Correlations between fractal dimension and stress have been observed in numerous animal species.
The fractal dimension of behavior patterns have been measured and correlated to general health or stress
in chimpanzees [28], fathead minnows [29], Iberian ibex [30], and domestic hens [31]. In plants, fractal
analysis has been used to correlate the fractal dimension of physical measurements (self-similarity) to
stress. Two examples are differential shoot branching patterns across grazing and water stresses in green
pepper [32], and differential root branching across a nitrogen gradient in corn [33]. Finally, it is worth
mentioning that fractal measurement and analysis of human system processes over time has been widely
explored. For example, the fractal dimension of an individual’s heart rate has been shown to be a reliable
indicator of heart disease in humans [34,35], and the fractal dimension of electroencephalogram (EEG)

Symmetry 2015, 7 356
activity, which detects electrical activity in the brain, has been correlated to Alzheimer’s [36]. In all of
the cases described above, the fractal dimension of the measured trait decreased with increased stress.
Lipsitz [26] suggests that healthy organisms have complex systems. He argues that a complex system
is better able to react to stress, and can do so quickly and on many levels. This idea is not a new one.
Emlen et al. [37] outline what they refer to as the attractor hypothesis which is a theory that accounts for
detailed adaptive responses of an organism to their continuously changing environments. In both
accounts, disease or stress reduces the health of the organism, which can then impose a loss of
complexity within the system and enhance susceptibility to additional diseases or stressors [26,37].
In the case of trees, growth depends on several variables, but, for example, is critically dependent on
water availability. Precipitation is generally inconsistent with a high fractal dimension [38]. Individual
trees respond to resource availability in a complex way. They grow more and store resources when
resources available and less when they are limited. This is referred to as environmental buffering and
the more successful an individual is in this buffering, the healthier it should be. In this study, we use
fractal analysis to examine the time series produced from annual growth rings in low and high vigor
trees. We then estimate and compare the fractal dimension of the time series between classifications to
determine if the fractal dimension of annual growth can be used as an indicator of developmental stability
in trees.
2. Methods
Eighteen trembling aspen (Populus tremuloides Michx.) increment cores were selected from a larger
sample collected for a study on aspen decline in northern Minnesota. The subset of cores used in this
study was selected based on age, with only the oldest trees being used due to the requirement of many
annual rings needed to obtain an accurate estimate of fractal dimension. Tree age ranged from 62 to
118 years with an average age of 88.6 (Table 1). Samples were collected at breast height (1.4 m) in
June and July 2009 (incomplete rings from 2009 were excluded from all analysis). All cores were
prepared according to standard techniques [39], dated by hand, then read and cross-dated using
COFECHA [40]. For this study, nine cores were selected from three stands classified as high vigor
stands, and nine cores were selected from three stands classified as low vigor stands (for a total of
18 cores from six stands in two vigor classes). Vigor classification was based on visual assessment and
verified with average annual stand growth over the last decade. High vigor stands were characterized by
an average annual growth greater than 816 mm2·year−1 and low vigor stands by an average annual growth
less than 452 mm2·year−1 [41]. Annual growth measurements are determined using basal area increment
measurements. As the diameter of the tree increases, the same amount of wood production is represented
by smaller and smaller rings. Therefore, ring width is a biased predictor of secondary growth so annual
wood production, (i.e., basal area increment), is used.
The set of basal area increment measurements for each tree was computed using ring widths and the
dplR package for R [42] to produce a time series (Figure 1). The fractal dimension of each time series
was calculated using a variation of the variogram estimator [25] which utilizes a lag (𝑙) of stationary
increments. Specifically, if 𝑆(𝑡, 𝑙) is the sample standard deviation of the time series from time 𝑡 to time
𝑡 + 𝑙 − 1 and 𝑅(𝑡, 𝑙) is the range of the time series observations from time 𝑡 to time 𝑡 + 𝑙 − 1, then 𝑅(𝑡,𝑙)
𝑆(𝑡,𝑙)
is known as the rescaled range. If we then let 𝑅(𝑙) be the average of all the rescaled range values for a
Symmetry 2015, 7 357
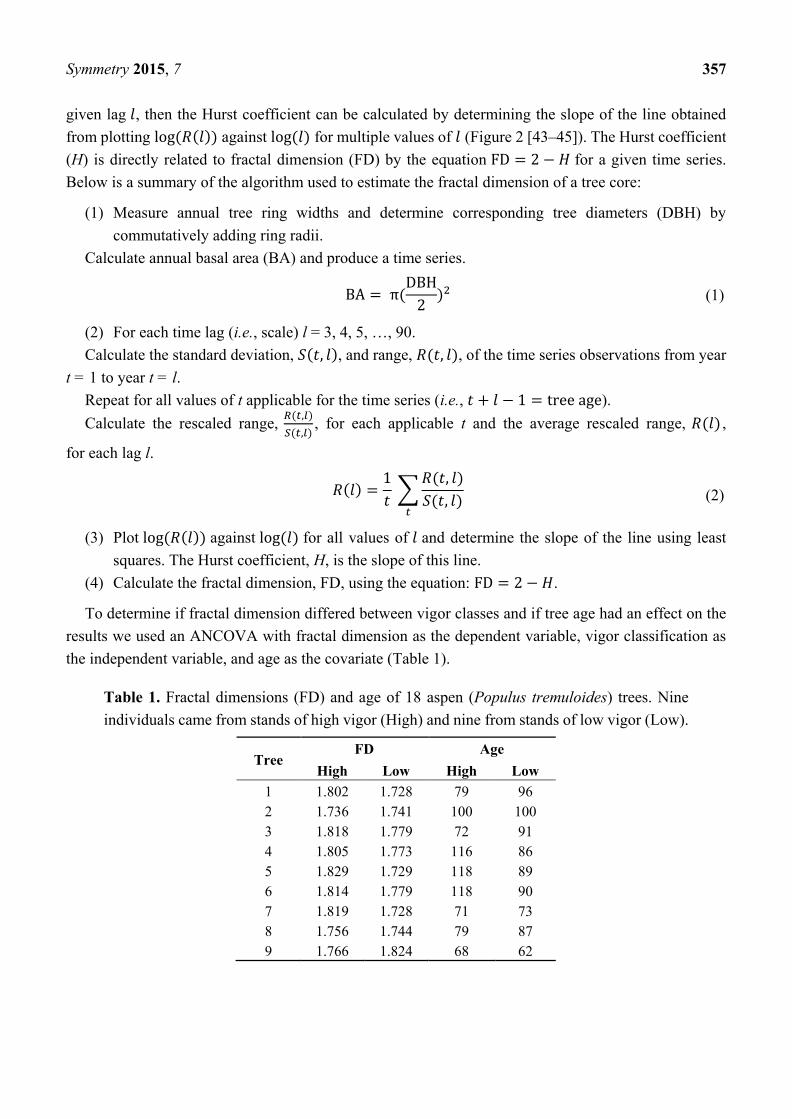
given lag 𝑙, then the Hurst coefficient can be calculated by determining the slope of the line obtained
from plotting log(𝑅(𝑙)) against log(𝑙) for multiple values of 𝑙 (Figure 2 [43–45]). The Hurst coefficient
(H) is directly related to fractal dimension (FD) by the equation FD = 2 − 𝐻 for a given time series.
Below is a summary of the algorithm used to estimate the fractal dimension of a tree core:
(1) Measure annual tree ring widths and determine corresponding tree diameters (DBH) by
commutatively adding ring radii.
Calculate annual basal area (BA) and produce a time series.
BA = π(DBH
2)2 (1)
(2) For each time lag (i.e., scale) l = 3, 4, 5, …, 90.
Calculate the standard deviation, 𝑆(𝑡, 𝑙), and range, 𝑅(𝑡, 𝑙), of the time series observations from year
t = 1 to year t = l.
Repeat for all values of t applicable for the time series (i.e., 𝑡 + 𝑙 − 1 = tree age).
Calculate the rescaled range, 𝑅(𝑡,𝑙)
𝑆(𝑡,𝑙), for each applicable t and the average rescaled range, 𝑅(𝑙) ,
for each lag l.
𝑅(𝑙) =1
𝑡 ∑
𝑅(𝑡, 𝑙)
𝑆(𝑡, 𝑙)𝑡
(2)
(3) Plot log (𝑅(𝑙)) against log (𝑙) for all values of 𝑙 and determine the slope of the line using least
squares. The Hurst coefficient, H, is the slope of this line.
(4) Calculate the fractal dimension, FD, using the equation: FD = 2 − 𝐻.
To determine if fractal dimension differed between vigor classes and if tree age had an effect on the
results we used an ANCOVA with fractal dimension as the dependent variable, vigor classification as
the independent variable, and age as the covariate (Table 1).
Table 1. Fractal dimensions (FD) and age of 18 aspen (Populus tremuloides) trees. Nine
individuals came from stands of high vigor (High) and nine from stands of low vigor (Low).
Tree FD Age
High Low High Low
1 1.802 1.728 79 96
2 1.736 1.741 100 100
3 1.818 1.779 72 91
4 1.805 1.773 116 86
5 1.829 1.729 118 89
6 1.814 1.779 118 90
7 1.819 1.728 71 73
8 1.756 1.744 79 87
9 1.766 1.824 68 62
Symmetry 2015, 7 358
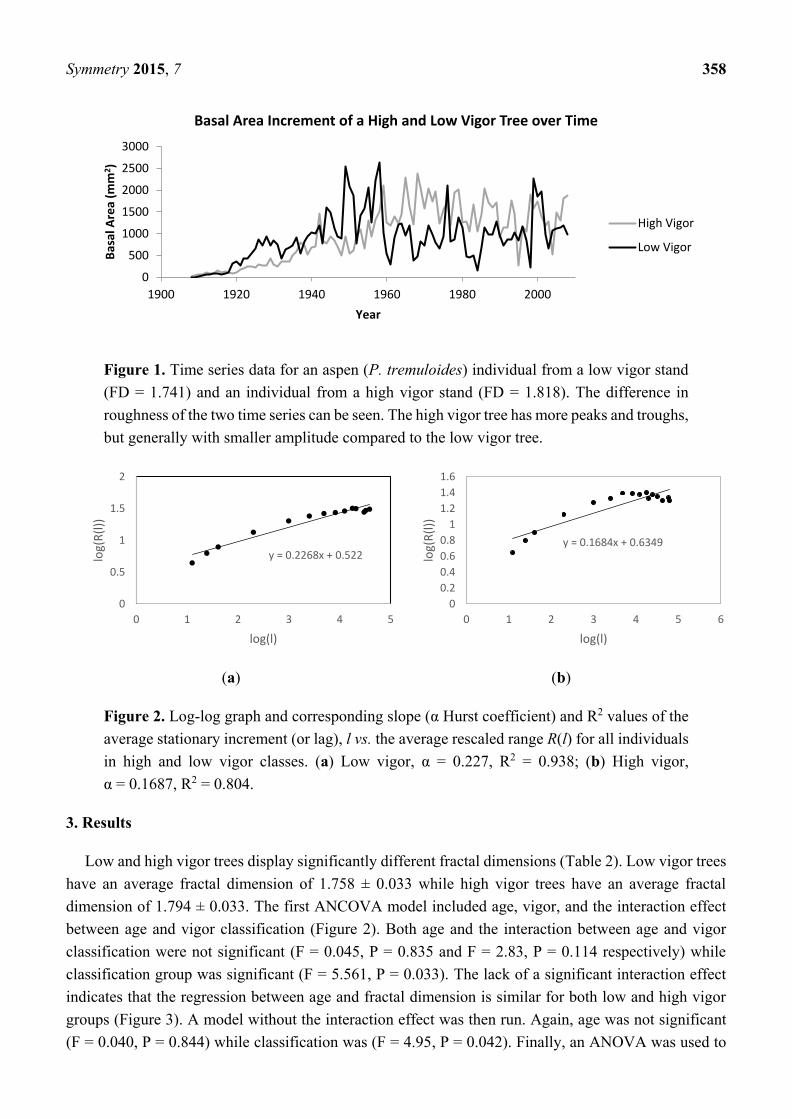
Figure 1. Time series data for an aspen (P. tremuloides) individual from a low vigor stand
(FD = 1.741) and an individual from a high vigor stand (FD = 1.818). The difference in
roughness of the two time series can be seen. The high vigor tree has more peaks and troughs,
but generally with smaller amplitude compared to the low vigor tree.
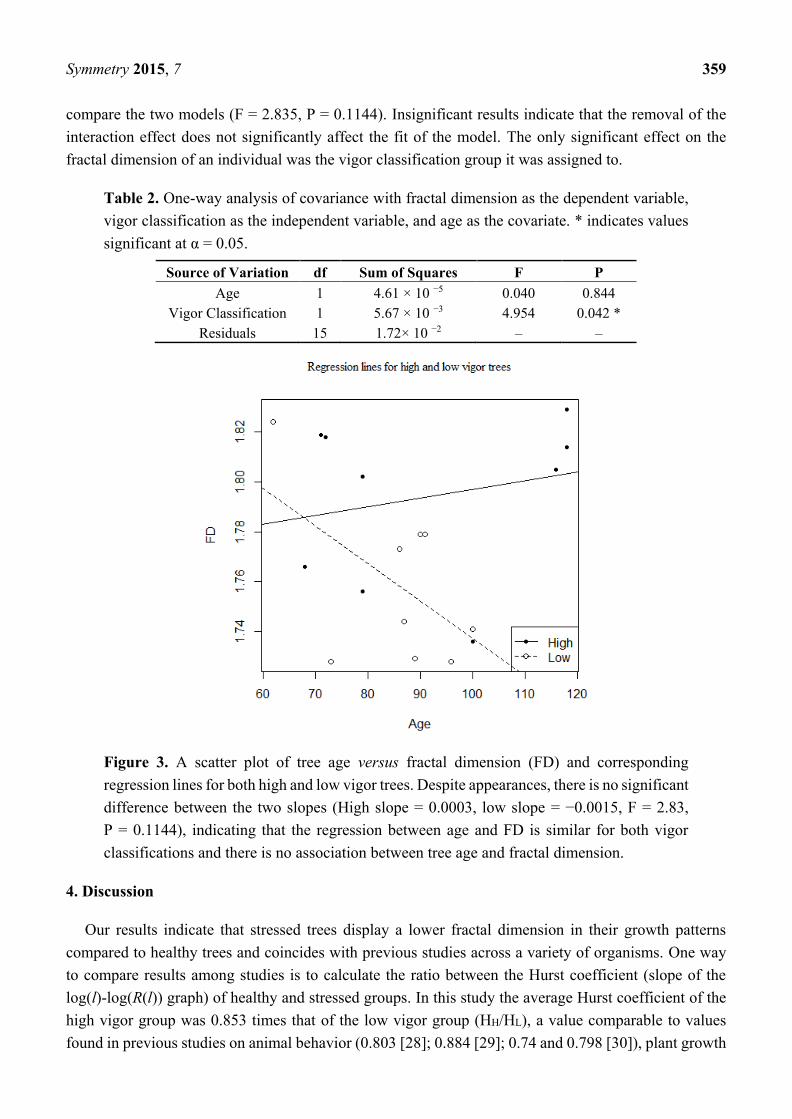
(a) (b)
Figure 2. Log-log graph and corresponding slope (α Hurst coefficient) and R2 values of the
average stationary increment (or lag), l vs. the average rescaled range R(l) for all individuals
in high and low vigor classes. (a) Low vigor, α = 0.227, R2 = 0.938; (b) High vigor,
α = 0.1687, R2 = 0.804.
3. Results
Low and high vigor trees display significantly different fractal dimensions (Table 2). Low vigor trees
have an average fractal dimension of 1.758 ± 0.033 while high vigor trees have an average fractal
dimension of 1.794 ± 0.033. The first ANCOVA model included age, vigor, and the interaction effect
between age and vigor classification (Figure 2). Both age and the interaction between age and vigor
classification were not significant (F = 0.045, P = 0.835 and F = 2.83, P = 0.114 respectively) while
classification group was significant (F = 5.561, P = 0.033). The lack of a significant interaction effect
indicates that the regression between age and fractal dimension is similar for both low and high vigor
groups (Figure 3). A model without the interaction effect was then run. Again, age was not significant
(F = 0.040, P = 0.844) while classification was (F = 4.95, P = 0.042). Finally, an ANOVA was used to
0
500
1000
1500
2000
2500
3000
1900 1920 1940 1960 1980 2000
Bas
al A
rea
(mm
2)
Year
Basal Area Increment of a High and Low Vigor Tree over Time
High Vigor
Low Vigor
y = 0.2268x + 0.522
0
0.5
1
1.5
2
0 1 2 3 4 5
log(
R(l
))
log(l)
y = 0.1684x + 0.6349
0
0.2
0.4
0.6
0.8
1
1.2
1.4
1.6
0 1 2 3 4 5 6
log(
R(l
))
log(l)
Symmetry 2015, 7 359
compare the two models (F = 2.835, P = 0.1144). Insignificant results indicate that the removal of the
interaction effect does not significantly affect the fit of the model. The only significant effect on the
fractal dimension of an individual was the vigor classification group it was assigned to.
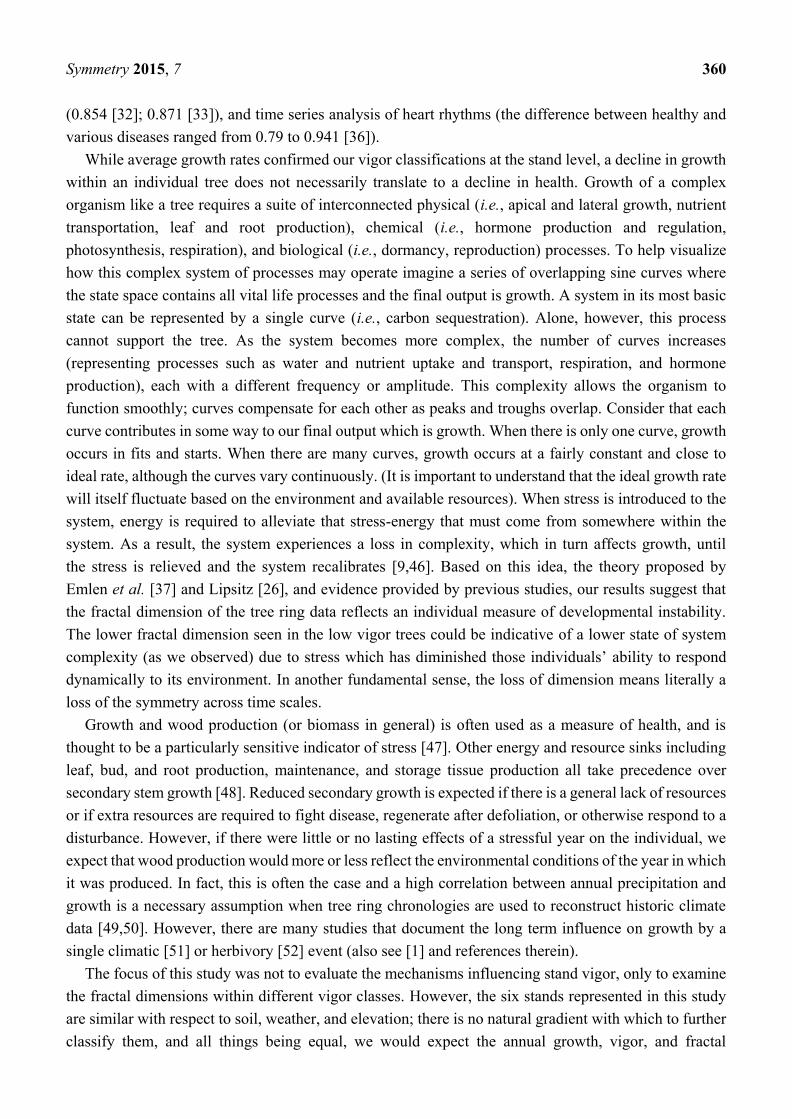
Table 2. One-way analysis of covariance with fractal dimension as the dependent variable,
vigor classification as the independent variable, and age as the covariate. * indicates values
significant at α = 0.05.
Source of Variation df Sum of Squares F P
Age 1 4.61 × 10 −5 0.040 0.844
Vigor Classification 1 5.67 × 10 −3 4.954 0.042 *
Residuals 15 1.72× 10 −2 – –
Figure 3. A scatter plot of tree age versus fractal dimension (FD) and corresponding
regression lines for both high and low vigor trees. Despite appearances, there is no significant
difference between the two slopes (High slope = 0.0003, low slope = −0.0015, F = 2.83,
P = 0.1144), indicating that the regression between age and FD is similar for both vigor
classifications and there is no association between tree age and fractal dimension.
4. Discussion
Our results indicate that stressed trees display a lower fractal dimension in their growth patterns
compared to healthy trees and coincides with previous studies across a variety of organisms. One way
to compare results among studies is to calculate the ratio between the Hurst coefficient (slope of the
log(l)-log(R(l)) graph) of healthy and stressed groups. In this study the average Hurst coefficient of the
high vigor group was 0.853 times that of the low vigor group (HH/HL), a value comparable to values
found in previous studies on animal behavior (0.803 [28]; 0.884 [29]; 0.74 and 0.798 [30]), plant growth
Symmetry 2015, 7 360
(0.854 [32]; 0.871 [33]), and time series analysis of heart rhythms (the difference between healthy and
various diseases ranged from 0.79 to 0.941 [36]).
While average growth rates confirmed our vigor classifications at the stand level, a decline in growth
within an individual tree does not necessarily translate to a decline in health. Growth of a complex
organism like a tree requires a suite of interconnected physical (i.e., apical and lateral growth, nutrient
transportation, leaf and root production), chemical (i.e., hormone production and regulation,
photosynthesis, respiration), and biological (i.e., dormancy, reproduction) processes. To help visualize
how this complex system of processes may operate imagine a series of overlapping sine curves where
the state space contains all vital life processes and the final output is growth. A system in its most basic
state can be represented by a single curve (i.e., carbon sequestration). Alone, however, this process
cannot support the tree. As the system becomes more complex, the number of curves increases
(representing processes such as water and nutrient uptake and transport, respiration, and hormone
production), each with a different frequency or amplitude. This complexity allows the organism to
function smoothly; curves compensate for each other as peaks and troughs overlap. Consider that each
curve contributes in some way to our final output which is growth. When there is only one curve, growth
occurs in fits and starts. When there are many curves, growth occurs at a fairly constant and close to
ideal rate, although the curves vary continuously. (It is important to understand that the ideal growth rate
will itself fluctuate based on the environment and available resources). When stress is introduced to the
system, energy is required to alleviate that stress-energy that must come from somewhere within the
system. As a result, the system experiences a loss in complexity, which in turn affects growth, until
the stress is relieved and the system recalibrates [9,46]. Based on this idea, the theory proposed by
Emlen et al. [37] and Lipsitz [26], and evidence provided by previous studies, our results suggest that
the fractal dimension of the tree ring data reflects an individual measure of developmental instability.
The lower fractal dimension seen in the low vigor trees could be indicative of a lower state of system
complexity (as we observed) due to stress which has diminished those individuals’ ability to respond
dynamically to its environment. In another fundamental sense, the loss of dimension means literally a
loss of the symmetry across time scales.
Growth and wood production (or biomass in general) is often used as a measure of health, and is
thought to be a particularly sensitive indicator of stress [47]. Other energy and resource sinks including
leaf, bud, and root production, maintenance, and storage tissue production all take precedence over
secondary stem growth [48]. Reduced secondary growth is expected if there is a general lack of resources
or if extra resources are required to fight disease, regenerate after defoliation, or otherwise respond to a
disturbance. However, if there were little or no lasting effects of a stressful year on the individual, we
expect that wood production would more or less reflect the environmental conditions of the year in which
it was produced. In fact, this is often the case and a high correlation between annual precipitation and
growth is a necessary assumption when tree ring chronologies are used to reconstruct historic climate
data [49,50]. However, there are many studies that document the long term influence on growth by a
single climatic [51] or herbivory [52] event (also see [1] and references therein).
The focus of this study was not to evaluate the mechanisms influencing stand vigor, only to examine
the fractal dimensions within different vigor classes. However, the six stands represented in this study
are similar with respect to soil, weather, and elevation; there is no natural gradient with which to further
classify them, and all things being equal, we would expect the annual growth, vigor, and fractal
Symmetry 2015, 7 361
dimensions to be similar. Clearly, differences among local site conditions exist, some of which are
responsible for the variation in stand vigor. Differential competition, insect damage, and local weather
patterns are all possible factors affecting stand vigor. For this study, however, we did not identify which
factor(s) affect stand vigor but instead focused on the correlation between fractal dimension and stand
vigor class.
5. Conclusions
Our results support the idea that healthy individuals exhibit higher system complexity compared to
stressed individuals which can be measured by fractal analysis. Higher system complexity in healthy
individuals allows for more efficient reactions to a fluctuating environment, maintaining homeostasis.
Individuals from stands that had low vigor were not producing consistently smaller basal area increments
compared to individuals from high vigor stands, but the pattern with which wood was produced differed.
A healthy individual from a high vigor stand produced wood dynamically resulting in a rough time
series; differential production between years presumably correlates well with available resources.
A stressed individual from a low vigor stand produced wood in a less dynamic pattern, resulting in a
time series that was less rough. If our interpretation is correct, the fractal dimension of tree ring growth
provides a measure of developmental stability over time in woody plants.
Acknowledgments
The authors would like to thank John H. Graham and an anonymous reviewer for their comments
which greatly improved this manuscript. The data used in this study was collected under a Base
Evaluation Monitoring Grant by the Forest Health Monitoring Program of the US Forest Service.
Support for JPS was provided by a Japanese Society for Promotion of Science Postdoctoral Fellowship.
Author Contributions
JPS collected and processed tree cores, did the analysis and wrote the paper. DMK and JBB obtained
funding for the collection of data and contributed knowledge of field site locations. DCF helped write
the paper and made conceptual contributions.
Conflicts of Interest
The authors declare no conflict of interest.
References
1. Dobbertin, M. Tree growth as indicator of tree vitality and of tree reaction to environmental stress:
A review. Eur. J. For. Res. 2005, 124, 319–333.
2. Torelli, N.; Shortle, W.C.; Cufara, K.; Ferlin, F.; Smith, K.T. Detecting changes in tree health and
productivity of silver fir in Slovenia. Eur. J. For. Pathol. 1999, 29, 189–197.
3. Duchesne, L.; Ouimet, R.; Houle, D. Basal area growth of sugar maple in relation to acid deposition,
stand health, and soil nutrients. J. Environ. Qual. 2002, 31, 1676–1683.
Symmetry 2015, 7 362
4. Taylor, O.C.; Cardiff, E.A.; Mersereau, J.D. Apparent photosynthesis as a measure of air pollution
damage. J. Air Pollut. Control Assoc. 1965, 15, 171–173.
5. Myhre, A.; Forberg, E.; Aarnes, H.; Nilsen, S. Reduction of net photosynthesis in oats after
treatments with low concentrations of ozone. Environ. Pollut. 1988, 53, 265–271.
6. Denmead, O.T.; Shaw, R.H. The effects of soil moisture stress at different stages of growth on the
development and yield of corn. Agron. J. 1960, 52, 272–274.
7. Larsson, S. Stressful times for the plant stress—Insect performance hypothesis. Oikos 1989, 56,
277–283.
8. Chaerle, L.; van der Straeten, D. Seeing is believing: Imaging techniques to monitor plant health.
Biochim. Biophys. Acta 2001, 1519, 153–166.
9. Pedersen, B.S. The role of stress in the mortality of midwestern oaks as indicated by growth prior
to death. Ecology 1998, 79, 79–93.
10. Freeman, D.C.; Graham, J.H.; Emlen, J.M. Developmental stability in plants: Symmetries, stress,
and epigenesis. Genetica 1993, 89, 97–119.
11. Freeman, D.C.; Graham, J.H.; Emlen, J.M.; Tracy, M.; Hough, R.A.; Alados, C.L.; Escos, J.
Plant developmental instability: New measures, applications, and regulation. In Developmental
Instability: Causes and Consequences; Polack, M., Ed.; Oxford University Press: New York, NY,
USA, 2002; pp. 927–1027.
12. Graham, J.H.; Freeman, D.C.; Emlen, J.M. Developmental Stability: A Sensitive Indicator of
Populations under Stress; Landis, W.G., Hughes, J.S., Lewis, M.A. Eds.; ASTM Special Technical
Publication 1179; American Society for Testing and Materials: Phiadelphia, PA, USA, 1993;
pp. 136–158.
13. Mandlebrot, B.B. Fractals, Form, Chance, and Dimension; Freeman: San Francisco, NC,
USA, 1977.
14. Mandlebrot, B.B. The Fractal Geometry of Nature; Freeman: New York, NY, USA, 1983; pp. 1–58.
15. Voss, R.F. Random fractals: Self-affinity in noise, music, mountains, and clouds. Physica D
Nonlinear Phenom. 1989, 38, 362–371.
16. Zeide, B.; Pfeifer, P. A method for estimation of fractal dimension of tree crowns. For. Sci. 1991,
37, 1253–1265.
17. Burrough, P.A. Fractal dimensions of landscapes and other environmental data. Nature 1981, 294,
240–242.
18. Theiler, J. Estimating fractal dimension. J. Opt. Soc. Am. 1989, 7, 1056–1073.
19. Critten, D.L. Fractal dimension relationships and values associated with certain plant canopies.
J. Agric. Eng. Res. 1997, 67, 61–72.
20. Kurth, W. Morphological models of plant growth: Possibilities and ecological relevance.
Ecol. Model. 1994, 75, 299–308.
21. Tatsumi, J.; Yamauchi, A.; Kono, Y. Fractal analysis of plant root systems. Ann. Bot. 1989, 64,
499–503.
22. Prusinkiewicz, P.; Hanan, J. Linenmayer Systems, Fractals, and Plants; Springer-Verlag: New
York, NY, USA, 1989.
23. Stevens, P. Patterns in Nature; Atlantic Monthly Press Book: Boston, MA, USA, 1974.

Symmetry 2015, 7 363
24. Bruno, R.; Raspa, G. Geostatistical characterization of fractal models and surfaces. Geostatistics
1989, 1, 77–89.
25. Gneiting, T.; Sevcikova, H.; Percival, D.B. Estimators of fractal dimension: Assessing the
roughness of time series and spatial data. Stat. Sci. 2010, 27, 247–277.
26. Lipsitz, L.A. Dynamics of Stability: The physiological basis of functional health and frailty.
J. Gerontol. Ser. A Biol. Sci. Med. Sci. 2002, 57, 115–125.
27. Graham, J.H.; Duda, J.J.; Brown, M.L.; Kitchen, S.; Emlen, J.M.; Malol, J.; Bankstahl, E.;
Krzysik, A.J.; Balbach, H.; Freeman, D.C.; et al. The effects of drought and disturbance on the
growth and developmental instability of loblolly pine (Pinus taeda L.). Ecol. Indic. 2012, 20,
143–150.
28. MacIntosh, A.J.J.; Alados, C.L.; Huffman, M.A. Fractal analysis of behavior in a wild primate:
Behavioural complexity in health and disease. J. R. Soc. Interface 2011, 8, 1497–1509.
29. Alados, C.L.; Weber, D.N. Lead effects on the predictability of reproductive behavior in fathead
minnows (Pimephales promelas): A mathematical model. Environ. Toxicol. Chem. 1999, 18,
2392–2399.
30. Alados, C.L.; Escos, J.; Emlen, J.M. Fractal structure of sequential behavior patterns: An indicator
of stress. Anim. Behav. 1996, 51, 437–443.
31. Rutherford, K.M.D.; Haskell, M.J.; Glasbey, C.; Jones, R.B.; Lawrence, A.B. Detrended fluctuation
analysis of behavioural responses to mild acute stressors in domestic hens. Appl. Anim. Behav. Sci.
2003, 83, 125–139.
32. Escos, J.M.; Alados, C.L.; Emlen, J.M. Fractal structures and fractal functions as disease indicators.
Oikos 1995, 74, 310–314.
33. Eghball, B.; Settimi, J.R.; Maranville, J.W.; Parkhurst, A.M. Fractal analysis for morphological
description of corn roots under nitrogen stress. Agron. J. 1993, 85, 287–289.
34. Acharya, R.U.; Bhat, P.S.; Kannathal, N.; Rao, A.; Lim, C.M. Analysis of cardiac health using
fractal dimension and wavelet transformation. ITBM-RBM 2005, 26, 133–139.
35. Qtsuka, K.; Cornelissen, G.; Halberg, F. Circadian rhythmic fractal scaling of heart rate variability
in health and coronary artery disease. Clin. Cardiol. 2009, 20, 631–638.
36. Jelles, B.; van Birgelen, J.H.; Slaets, J.P.J.; Hekster, R.E.M.; Jonkman, E.J.; Stam, C.J. Decrease
on non-linear structure in the EEG of Alzheimer patients compared to healthy controls. Clin.
Neurophysiol. 1999, 110, 1159–1167.
37. Emlen, J.M.; Freeman, D.C.; Mills, A.; Graham, J.H. How organisms do the right thing: The
attractor hypothesis. Chaos 1998, 8, 717–726.
38. Selvi, T.S.; Selvaraj, S.R. Fractal Dimension Analysis of Northeast Monsoon of Tmil Nadu.
Univers. J. Environ. Res. Technol. 2011, 1, 219–221.
39. Speer, J.H. Fundamentals of Tree-Ring Research; University of Arizona Press: Tucson, AZ, USA,
2010.
40. Holmes, R.L. Program COFECHA: Version 3; The University of Arizona: Tucson, AZ, USA, 1992.
41. Sakai, A.K.; Burris, T.A. Growth in male and female aspen clones: A twenty-five year longitudinal
study. Ecology 1985, 66, 1921–1927.
42. Bunn, A.G. A dendrochronology program library in R (dplR). Dendrochronologia 2008, 26,
115–124.
Symmetry 2015, 7 364
43. Hurst, H.E. Long term storage capacity of reservoirs. Trans. Am. Soc. Civ. Eng. 1951, 116,
770–808.
44. Mandlebrot, B.B.; Wallis, J.R. Robustness of the rescaled range R/S in the measurement of
non-cyclic long run statistical dependence. Water Resour. Res. 1969, 5, 967–988.
45. Davies, R.B.; Hart, D.S. Tests for Hurst effect. Biometrika 1987, 74, 95–101.
46. Manion, P.D. Tree Disease Concepts; Prentice-Hall: Englewood Cliffs, NJ, USA, 1981.
47. Waring, R.H.; Pitman, G.B. Modifying lodgepole pine stands to change susceptibility to mountain
pine beetle attack. Ecology 1985, 66, 889–897.
48. Waring, R.H. Characteristics of trees predisposed to die. BioScience 1987, 37, 569–573.
49. Fritts, H.C. Tree rings and Climate; Academic Press: New York, NY, USA, 1976.
50. Grissino-Mayer, H.D. A 2129-year reconstruction of precipitation for northwestern New Mexico,
USA. In Tree Rings, Environment, and Humanity; Dean, J.S., Meko, D.M., Swetnam, T.W., Eds.;
Radiocarbon, Department of Geosciences, University of Arizona: Tucson, Arizona, USA, 1996;
pp. 191–204.
51. Lapointe-Garant, M.P.; Huang, J.G.; Geaizquierdo, G.; Raulier, F.; Bernier, P.; Berninger, F. Use
of tree rings to study the effect of climate change on trembling aspen in Quebec. Glob. Change Biol.
2009, 16, 2039–2051.
52. Speed, J.D.M.; Austrheim, G.; Hester, A.J.; Mysterud, A. Browsing interacts with climate to
determine tree-ring increment. Funct. Ecol. 2011, 25, 1018–1023.
© 2015 by the authors; licensee MDPI, Basel, Switzerland. This article is an open access article
distributed under the terms and conditions of the Creative Commons Attribution license
(http://creativecommons.org/licenses/by/4.0/).