Forensic palynology: Current status of a rarely used technique in the United States of America

Variation in Assemblages of Small Fishes and MicrocrustaceansAfter Inundation of Rarely Flooded Wetlands of the LowerOkavango Delta, Botswana
Nqobizitha Siziba • Moses J. Chimbari •
Hillary Masundire • Ketlhatlogile Mosepele •
Lars Ramberg
Received: 12 September 2012 / Accepted: 30 September 2013
� Springer Science+Business Media New York 2013
Abstract Water extraction from floodplain river systems
may alter patterns of inundation of adjacent wetlands and
lead to loss of aquatic biodiversity. Water reaching the Ok-
avango Delta (Delta), Botswana, may decrease due to
excessive water extraction and climate change. However,
due to poor understanding of the link between inundation of
wetlands and biological responses, it is difficult to assess the
impacts of these future water developments on aquatic biota.
Large floods from 2009 to 2011 inundated both rarely and
frequently flooded wetlands in the Delta, creating an
opportunity to examine the ecological significance of
flooding of wetlands with widely differing hydrological
characteristics. We studied the assemblages of small fishes
and microcrustaceans, together with their trophic relation-
ships, in temporary wetlands of the lower Delta. Densities of
microcrustaceans in temporary wetlands were generally
lower than previously recorded in these habitats. Micro-
crustacean density varied with wetland types and hydro-
logical phase of inundation. High densities of
microcrustaceans were recorded in the 2009 to 2010 flooding
season after inundation of rarely flooded sites. Large num-
bers of small fishes were observed during this study. Com-
munity structure of small fishes differed significantly across
the studied wetlands, with poeciliids predominant in fre-
quently flooded wetlands and juvenile cichlids most abun-
dant in rarely flooded wetlands (analysis of similarity,
P \ 0.05). Small fishes of \20 mm fed largely on micro-
crustaceans and may have led to low microcrustacean den-
sities within the wetlands. This result matched our prediction
that rarely flooded wetlands would be more productive;
hence, they supported greater populations of microcrusta-
ceans and cichlids, which are aggressive feeders. However,
the predominance of microcrustaceans in the guts of small
fishes (\20 mm) suggests that predation by fishes may also
be an important regulatory mechanism of microcrustacean
assemblages during large floods when inundated terrestrial
patches of wetlands are highly accessible by fish. We predict
that a decline in the amount of water reaching the Delta will
negatively affect fish recruitment, particularly the cichlids
that heavily exploited the rarely flooded wetlands. Cichlids
are an important human food source, and their decline in fish
catches will negatively affect livelihoods. Hence, priority in
the management of the Delta’s ecological functioning should
be centred on minimising natural water-flow modifications
because any changes may be detrimental to fish-recruitment
processes of the system.
Keywords Flooding frequency �Microcrustaceans �Juvenile fish � Fish predation
Introduction
Inundation of temporary wetlands improves the biological
productivity of the associated rivers (Junk et al. 1989;
N. Siziba (&) � K. Mosepele � L. Ramberg
Okavango Research Institute, University of Botswana,
P/Bag 285, Maun, Botswana
e-mail: [email protected]
N. Siziba
School of Natural Sciences and Mathematics, Chinhoyi
University of Technology, P/Bag 7722, Chinhoyi, Zimbabwe
M. J. Chimbari
University of KwaZulu-Natal, Howard College Campus,
Durban 4041, South Africa
H. Masundire
Department of Biological Sciences, University of Botswana,
P/Bag 0022, Gaborone, Botswana
123
Environmental Management
DOI 10.1007/s00267-013-0183-9

Bayley 1995; Sparks 1995; Ward 1998; Lewis et al. 2001;
Balcombe et al. 2007; Arthington and Balcombe 2011).
Because of their high biological productivity—especially
regarding macroinvertebrates, which are food resources for
early life stages of fish—inundated temporary wetlands are
ideal nursery sites for fishes. Inundation of temporary
wetlands of river–floodplain systems is thought to improve
fish recruitment by stimulating fish spawning and enhanc-
ing food availability and diversification of habitats (Coke
and Pott 1971; Kwak 1988; Harris and Gehrke 1994; Junk
1999). Merron (1991) suggested that fish recruitment in the
Okavango Delta (hereafter referred to as the Delta) pre-
dominantly occurs in temporary wetlands. The biological
productivity of temporary wetlands is generally influenced
by inundation dynamics in which wetlands interacts with
the timing, magnitude, duration, and frequency of flooding
(Power et al. 1995). However, despite the acknowledged
importance of inundation of temporary wetlands, we know
little in general, and for the Delta in particular, about the
linkages between flooding dynamics and biological
responses.
The wetlands of the Delta are grouped into two major
categories: the permanent wetlands and the temporary
wetlands (McCarthy et al. 2005). The permanent wetlands
are usually inundated with water, whereas the temporary
wetlands experience periodic inundation and drying. The
temporary wetlands may be further divided into two major
types depending on the average return interval (ARI) of the
floods: (1) the frequently flooded wetlands and (2) the
rarely flooded wetlands (McCarthy et al. 2005; Murray-
Hudson et al. 2011). The least increased frequently flooded
wetlands are closer to the active river channels and are
inundated every flooding season or once in 2 years,
whereas the rarely flooded wetlands receive water only
during large floods with an ARI of once or twice in
30 years (Wolski and Murray-Hudson 2006). Large floods
are experienced in the Delta during years of high rainfall
and high inflows into the system (Mendelsohn et al. 2010).
The inundation of these different temporary wetland types
may have nonuniform biological responses.
The annual primary production cycle of the Okavango
Delta is largely sustained by allocthonous energy mobi-
lised from inundated temporary wetlands (Mendelsohn
et al. 2010). When wetlands of the Delta dry, they support
a high biomass of terrestrial vegetation that attracts for-
aging mammals, such as elephants, buffaloes, zebras,
giraffes, small antelopes, and hippopotamuses (Bonyongo
2004). These foraging animals deposit large quantities of
dung (nutrients) on the temporary wetlands, which sup-
ports a boom in aquatic production (algae and micro-
crustaceans) when inundation occurs (McLachlan 1971;
Junk et al. 1989; Bayley 1995; Balcombe et al. 2007;
Arthington and Balcombe 2011). Juvenile fish and small-
sized fish species (collectively referred to hereafter as
small fishes) capitalise on the high microcrustacean den-
sities (Bayley 1988; Høberg et al. 2002; Lindholm and
Hessen 2007a).
Although there is widespread supposition that micro-
crustaceans are an important food source for early life
stages of fish (Brooks and Dodson 1965; May 1974;
Cushing 1972, 1990), this has not been validated within the
Okavango Delta. The early life history of fish is charac-
terized by high mortality (Trippel and Chambers 1997).
Survival of fish during their early life stages affects
recruitment success and, in turn, the variable dynamics of
fish stocks (Cushing 1972, 1990; Horwood et al. 2000).
Possibly as an adaptation to synchronise breeding with the
availability of microcrustaceans, Floodplain River fishes
spawn before or during inundation of temporary wetlands
and raise their juveniles within these habitats (Munro 1990;
Merron 1991; Welcomme 2001). Microcrustaceans in
temporary wetlands are also preyed on by predatory
macroinvertebrates, such as those of the family Chaobori-
dae (Lewis 1977; Arcifa 2000) and Notonectidae (Gilbert
and Burns 1999; Lindholm and Hessen 2007b). Both
macroinvertebrates and small fishes are also key food
sources for higher-order organisms, such as larger fishes
(Merron 1998), crocodiles (Wallace and Leslie 2008), and
water birds (Cowx 2007). Therefore, the dependence of
small fishes on microcrustaceans may be a critical trophic
link allowing the productivity associated with wetland
inundation to flow up the food chain (Fernando 1994).
Fish production in the Delta (Merron 1991; Mosepele
et al. 2009; Ramberg et al. 2010) and elsewhere (Wel-
comme 1979; Lowe-McConnell 1987; Agostinho and Za-
lewski 1995) increases during years of large floods.
However, there is debate regarding the causal mechanisms
for high fish yield associated with these events. Numerous
models, including the flood recruitment model (Humphries
et al. 1999), the critical period hypothesis (Hjort 1914; May
1974), and the match/mismatch hypothesis (Cushing 1972,
1990) propose that microcrustacean availability is a key
driver of early survivorship and overall fish production
(stock size). However, others (King et al. 2009; Ramberg
et al. 2010) believe that predation is more important and
that poor survivorship during years of limited flooding is
caused more by the increased exposure of young fish to
greater predation within the main channel, as well as
constricted wetland habitats, than by a lack of food.
Although different causal mechanisms are proposed, rela-
tively few studies in the Delta have assessed the link
between wetland inundation, microcrustaceans, and pro-
duction of small fishes.
There is a need to better understand the relationship
between inundation of temporary wetlands and production
of small fishes in the Delta because the natural hydrograph
Environmental Management
123

will be altered by increasing future water abstractions
(Ashton 2000; Mbaiwa 2004) and climate change (An-
dersson et al. 2006; Murray-Hudson et al. 2006; Milzow
et al. 2010). Various water developmental projects—such
as irrigation, hydropower dams, and expansion of munici-
pal water supplies—have been proposed by Angola,
Namibia, and Botswana. These are all expected to decrease
water inflows into the Okavango Delta (Ashton 2000). The
historically larger floods, evident from the natural hydro-
graph of the Delta, will be knocked out first, and on the
extremes some of the temporary wetlands, such as the
rarely flooded patches, will be excluded from the system
permanently. The situation is likely to be complicated by
climate change; most models within the region are pre-
dicting an increase in temperature and a decrease in rainfall
(Andersson et al. 2006; Murray-Hudson et al. 2006; Mil-
zow et al. 2010). If the Delta receives less water in the
future, the extent of inundation of temporary wetlands will
decrease, and fish production may be compromised.
This study examined the community structure of mi-
crocrustaceans and small fishes, together with their trophic
relationships, in frequently and rarely flooded wetlands of
the Okavango Delta. We hypothesized that as a conse-
quence of nutrient and organic matter accumulation during
years of no flooding, inundation of rarely flooded wetlands
will produce greater densities of microcrustaceans when
these patches are inundated, compared with frequently
flooded wetlands, and that this will in turn create more
suitable habitat for small fishes. An increased understand-
ing of the link between inundation of different temporary
wetland types and the associated biological responses will
improve our ability to predict the likely consequences of
decreased flooding on fish productivity and guide man-
agement options.
Materials and Methods
Study Area
The study was performed at the Okavango Delta in the
Kalahari Desert of northern Botswana (Fig. 1). Rain falling
in the highlands of Angola contributes the largest inflows
into the Delta, and local rains are also important in deter-
mining the extent of inundation of the system (Andersson
et al. 2006). Annually, the floods arrive in the upper Delta
between February and April and reach the lower parts of
the Delta 5 months later (Gieske 1996). The floods are
distributed across the system through a series of distribu-
tory channels. As water flows through these channels, some
of it overflows and inundates surrounding low lands, thus
creating temporary wetlands.
Study Sites
Eight frequently flooded and five rarely flooded wetlands
were selected in the lower Delta for the present study
(Fig. 1). The vegetation community composition in dif-
ferent wetland types is different with frequently flooded
wetlands dominated by wetland grasses (Bonyongo et al.
2000). Thick stands of emergent sedges, as well as leaf-
floating and submerged macrophytes, in deep open water
habitats are also predominant in frequently flooded wet-
lands (Meyer 1999; Bonyongo et al. 2000). Rarely flooded
wetlands are characterized by terrestrial grasses and thick
forests dominated by Acacia spp. and Colophospermum
mopane (Meyer 1999). Macrophytes Ludwigia stolonifera
and Lagarosiphon ilicifolius become established over time
within these wetlands (Siziba et al. 2011a).
Some Hydrological Aspects of the 2009–2010
and 2010–2011 Flooding Seasons
The large floods of 2009–2010 to 2010–2011 were of much
greater magnitude than the those received by the Delta in
the past 30 years (http://168.167.30.198/ori/monitoring/
water/). The average monthly discharge from the Okav-
ango River at Mohembo reached estimated peaks of 890
and 898 m3/s, respectively, in the 2009–2010 and
2010–2011 flooding seasons (Fig. 2). These peaks recorded
in these two seasons were [50 % above the peak of
average flooding years shown as 1989 and 1999 (Fig. 2.)
During low to average floods, temporary wetlands are
usually inundated for 3–4 months, whereas during this
study water remained in the wetlands throughout the
respective flooding seasons. The study wetlands ranged
from 1,000 to 2,000 m long, 200 to 500 m wide, and 1.5 to
3.8 m deep at peak flooding during this study. The wet-
lands expand at the onset of flooding until peak flooding
and then constrict. A detailed description of the studied
wetlands is provided in Siziba et al. (2011a, b).
During the two flood seasons of study, water encroached
the dry wetlands (rising flood phase) in May 2009 and
April through May 2010. The maximum water levels
reached within the study floodplains (flood peak) occurred
in July 2009 and June through July 2010, and the gradual
drying-up of floodplains (flood receding phase) coincided
with the following months: October 2009, February
through March 2010, September through November 2010,
and January through March 2011.
Field Sampling
Samples of microcrustaceans and small fishes were collected
from the shallow inundated terrestrial grasses of the wet-
lands, referred to as the marginal zone. The choice of the
Environmental Management
123

study habitat of the temporary wetlands sites was influenced
by previous studies in the Delta (Lindholm and Hessen
2007a; Siziba et al. 2011c) and elsewhere (Bayley 1988),
indicating that marginal zones of the wetlands are the most
productive and support greater densities of both microcrus-
taceans and small fishes. Sampling was undertaken on 14
occasions from May 2009 through March 2011 during the
rising phase of the hydrograph (May 2009 and April through
May 2010), at the flood peak (July 2009 and June through
July 2010), and as flood waters were receding (October 2009,
February through March 2010, September through Novem-
ber 2010, and January through March 2011).
Microcrustaceans
Microcrustaceans were sampled using the tube sampling
method (Graves and Morrow 1998) due to the shallowness
and high density of vegetation within the marginal zone. At
each site, a plexiglass tube (6 cm in diameter, 0.5 m in
length) was pushed through inundated grasses to collect
water samples. Microcrustacean samples from each study
wetland were collected during the day (0800–1,500 h)
from 20 randomly selected points separated by 10 m. A
20-L container was filled with microcrustacean samples to
constitute a spatially composited sample representing each
study wetland. To concentrate the microcrustaceans, the
20-L samples were filtered through a 45-lm mesh net and
fixed with Lugol’s solution for processing in the laboratory.
During analysis, preserved microcrustacean samples
were homogenised by gently mixing to attain an even
distribution of organisms before the Utermohl technique
(Paxinos and Mitchell 2000) was employed to quantify the
microfauna. Depending on the density of microcrustaceans
and turbidity, subsamples of 2 or 5 ml were sedimented in
counting chambers for at least 4 h before the microfauna
were identified and counted under an inverted microscope.
Fig. 1 Locations of the studied
wetlands in the lower Okavango
Delta, Botswana, showing
frequently flooded (1–8) and
rarely flooded (9–13) wetlands
Environmental Management
123

Except for the taxonomically challenging ostracods and
nauplii of copepods, which could only be identified to
family level, taxonomic keys (Korovchinsky 1992; Smir-
nov 1992, 1996; Orlova-Bienkowskaja 2001; Fernando
2002) were used to identify microcrustaceans to species
level. The actual densities of microcrustaceans in the
samples were calculated and expressed as numbers per litre
according to the procedures in Masundire (1997). Pub-
lished length–dry weight relationships (Botrell et al. 1976;
Masundire 1994; Kawabata and Urabe 1998) were used to
estimate microcrustacean biomass in the samples. For mi-
crocrustacean species not included in these publications,
we applied length–weight equations of taxa with similar
body shapes. Biomass was expressed as average dry weight
(dw) per litre.
Small Fishes
Small fishes were sampled at the same time as microcrus-
taceans using a throw-trap net design modified from Peli-
cice et al. (2005). The trap net consisted of a heavy bottom
metal ring and a light top ring (see Siziba et al. 2011a for a
full description). Separated by a distance of 20 m, the net
was deployed five times from the edge of each study wet-
land. After deployment, the heavy bottom metal ring was
pressed against the floor of the wetlands while at the same
time suspending the light top ring above water to prevent
trapped fish from escaping. The volume of water enclosed
in the trap was estimated by multiplying the average water
depth and enclosed area. Vegetation and other materials
were removed from the trap before fish were scooped out
using an aluminium dip net (0.20 9 0.45-m frame, 1-mm
mesh) until no fish were captured in ten successive scoops.
Fish were identified as to species level where possible
according to Skelton (2001). Fish abundances were
expressed as numbers per sampled water volume (m3).
Subsamples of fish for diet assessment were fixed in
10 % formalin soon after capture and then preserved in
75 % ethanol within 24 h. Because it was not possible to
assess the gut contents of all sampled species, only the guts
of the most abundant tilapia juveniles—Pseudocrenilabrus
philander, Barbus haasianus, and the topminnow Aploc-
heilichthys hutereaui—were examined. Before gut contents
were examined, the total length of each sample was mea-
sured to the nearest millimetre. The stomach or the whole
digestive tract of each fish sample was removed, placed
into a Petri dish, and cut open in 20 mL of distilled water.
Gut contents were apportioned into different major food
types (algae, macroinvertebrates, microcrustaceans, detri-
tus, plant matter, plant seeds, and small fishes) under an
inverted microscope at 259 to 1009 magnification. The
microcrustaceans present in the fish stomachs were iden-
tified to their lowest possible taxonomic level and enu-
merated. To avoid overestimating the numbers, only heads
were counted when only body parts of microcrustaceans
were encountered.
Data Analysis
Data on microcrustacean density and abundance of small
fishes was first checked for normality and homogeneity of
variances using Kolmogorov–Smirnov procedure and Le-
vene’s test, respectively. To improve on assumptions of
normality and homogeneity of variances, both microcrus-
tacean and small fishes data were log10(x ? 1) trans-
formed. Normalization tests and transformations were
performed using SPSS version 19 (IBM, New York, NY,
USA).
Trifactorial analysis of variance (ANOVA) was used to
analyze the influence of wetland types (frequently flooded
and rarely flooded), hydrological phases of inundation
(filling phase, peak flooding, and flood recession), and
sampling seasons (2009–2010 and 2010–2011) on both
microcrustacean density and fish abundance in wetlands
(Sokal and Rohlf 1991). Nonmetric multidimensional
scaling (NMDS) and analysis of similarity (ANOSIM),
based on Bray–Curtis dissimilarity measures, were
employed to assess differences in the community structure
of microcrustaceans and small fishes between the fre-
quently and rarely flooded wetlands. When significant
differences in community structure were detected, simi-
larity percentage procedures (SIMPER) were used to
determine which species contributed the highest dissimi-
larity. Multivariate analyses were performed using Primer
version 6.1.5 (Clarke and Gorley 2006).
Fig. 2 Hydrographs of water discharge at Mohembo during sampling
seasons (2009 and 2010). Hydrographs of years 1989 and 1999 are
examples of inflows during small-sized floods to average flooding
years (http://168.167.30.198/ori/monitoring/water/)
Environmental Management
123
The relative contribution of each major food type to
the diet of individual fish was estimated using Hyslop’s
(1980) indirect volumetric method. The diet composition
of the fish species was summarised by the frequency of
occurrence method (Hyslop 1980), which records the
percentage of stomachs containing a particular food item
of the total stomachs containing food. The index of rel-
ative importance (IRI) (Pinkas et al. 1971; Hart et al.
2002) was used to determine the most important micro-
crustaceans in the fish guts. This index accounts for fre-
quency of occurrence, relative volume of contribution,
and relative abundance (in terms of number) according to
the following formula: IRI = (% frequency of occurrence
* (relative % volume ? % average number of micro-
crustaceans). Significance level in all of these analyses
was set at a\ 0.05.
Results
Microcrustacean Assemblage
There was no significant difference in community structure
across the different wetland types (ANOSIM, global
R = 0.028, P = 0.37). Thirty-eight microcrustacean taxa
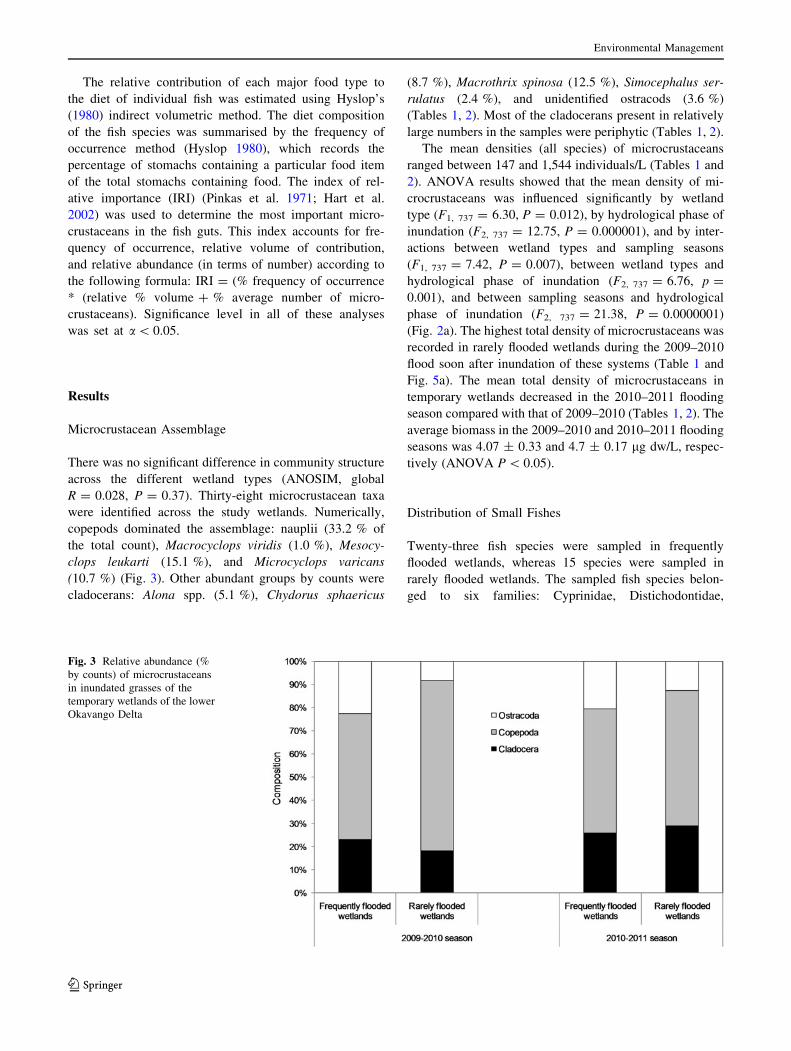
were identified across the study wetlands. Numerically,
copepods dominated the assemblage: nauplii (33.2 % of
the total count), Macrocyclops viridis (1.0 %), Mesocy-
clops leukarti (15.1 %), and Microcyclops varicans
(10.7 %) (Fig. 3). Other abundant groups by counts were
cladocerans: Alona spp. (5.1 %), Chydorus sphaericus
(8.7 %), Macrothrix spinosa (12.5 %), Simocephalus ser-
rulatus (2.4 %), and unidentified ostracods (3.6 %)
(Tables 1, 2). Most of the cladocerans present in relatively
large numbers in the samples were periphytic (Tables 1, 2).
The mean densities (all species) of microcrustaceans
ranged between 147 and 1,544 individuals/L (Tables 1 and
2). ANOVA results showed that the mean density of mi-
crocrustaceans was influenced significantly by wetland
type (F1, 737 = 6.30, P = 0.012), by hydrological phase of
inundation (F2, 737 = 12.75, P = 0.000001), and by inter-
actions between wetland types and sampling seasons
(F1, 737 = 7.42, P = 0.007), between wetland types and
hydrological phase of inundation (F2, 737 = 6.76, p =
0.001), and between sampling seasons and hydrological
phase of inundation (F2, 737 = 21.38, P = 0.0000001)
(Fig. 2a). The highest total density of microcrustaceans was
recorded in rarely flooded wetlands during the 2009–2010
flood soon after inundation of these systems (Table 1 and
Fig. 5a). The mean total density of microcrustaceans in
temporary wetlands decreased in the 2010–2011 flooding
season compared with that of 2009–2010 (Tables 1, 2). The
average biomass in the 2009–2010 and 2010–2011 flooding
seasons was 4.07 ± 0.33 and 4.7 ± 0.17 lg dw/L, respec-
tively (ANOVA P \ 0.05).
Distribution of Small Fishes
Twenty-three fish species were sampled in frequently
flooded wetlands, whereas 15 species were sampled in
rarely flooded wetlands. The sampled fish species belon-
ged to six families: Cyprinidae, Distichodontidae,
Fig. 3 Relative abundance (%
by counts) of microcrustaceans
in inundated grasses of the
temporary wetlands of the lower
Okavango Delta
Environmental Management
123

Cichlidae, Poeciliidae, Anabantidae, and Clarridae. Of
these families, the poeciliids, cichlids, and small cyprinids
were most widely distributed across the studied wetlands.
Juvenile cichlids were predominantly collected in rarely
flooded wetlands, whereas poeciliids were most abundant
in frequently flooded wetlands (Fig. 4). The mean total
abundance of fish was high during this study with a
maximum of 282 and 260 individuals/m3 caught in fre-
quently flooded wetlands and rarely flooded wetlands,
respectively. Trifactorial ANOVA showed no significant
interactions for the main factors (wetland types, hydro-
logical phases of inundation, and sampling seasons)
(P \ 0.05). However, the ANOVA results showed a sig-
nificant influence of sampling season (F1, 520 = 10.98,
P = 0.001) and hydrological phase of inundation
(F2, 520 = 3.55, P = 0.029) (Fig. 2b) on the abundance of
small fishes. In contrast to that of the microcrustaceans,
the mean abundance of small fishes increased during the
2010–2011 flooding season compared with that of
2009–2010 (Fig. 5b). ANOSIM showed significant dif-
ferences in the community structure of small fishes
between the rarely and frequently flooded study sites
(Fig. 6; global R = 0.496, P = 0.0001). SIMPER analysis
detected a 48.2 % dissimilarity in fish assemblages
between the two habitats due to differences in abundances
of Tilapia and Oreochromis and minnows A. hutereaui, A.
johnstoni, A. katangae, and B. haasianus. Among the
Table 1 Mean density (number per litre and SEM) of microcrusta-
cean in frequently flooded wetlands and rarely flooded wetlands
during the May 2009 to March 2010 season
Wetland type Flood
rising
Peak
flooding
Flood
recession
Frequently flooded
Copepoda
Cyclopoid nauplii 56 ± 30 161 ± 116 231 ± 45
M. viridis 2 ± 2 0 12 ± 3
M. varicans 10 ± 9 26 ± 19 84 ± 17
M. leukartii 9 ± 4 79 ± 52 154 ± 25
Cladocera
M. spinosa 4 ± 2 33 ± 8 177 ± 71
C. sphaericus 10 ± 5 55 ± 28 62 ± 20
Alona 22 ± 13 30 ± 16 43 ± 11
Simocephalus 0 15 ± 2 27 ± 12
Moina 0 0 8 ± 0
Ostracoda
Ostracods 32 ± 10 138 ± 71 78 ± 8
Mean total numbers/L 147 537 876
Rarely flooded
Copepoda
Cyclopoid nauplii 673 ± 326 832 ± 435 165 ± 42
M. viridis 21 ± 9 3 ± 2 0
M. varicans 152 ± 43 210 ± 120 66 ± 28
M. leukartii 13 ± 1 0 153 ± 82
Cladocera
M. spinosa 4 ± 2 180 ± 158 51 ± 29
C. sphaericus 12 ± 3 225 ± 90 33 ± 14
Alona 0 75 ± 60 66 ± 21
Simocephalus 0 0 27 ± 19
Moina 1 ± 1 0 11 ± 4
Ostracoda
Ostracods 1 ± 1 19 ± 4 111 ± 8
Mean total numbers/L 877 1,544 681
Table 2 Mean density (numbers per litre and SEM) of the most
abundant microcrustaceans in frequently flooded wetlands and rarely
flooded wetlands during the April 2010–March 2011 season
Wetland type Flood
rising
Peak
flooding
Flood
recession
Frequently flooded
Copepoda
Cyclopoid nauplii 389 ± 142 97 ± 25 167 ± 47
M. viridis 13 ± 5 18 ± 7
M. varicans 91 ± 73 32 ± 7 43 ± 8
M. leukartii 39 ± 11 58 ± 14 105 ± 16
Cladocera
M. spinosa 29 ± 7 23 ± 7 78 ± 13
C. sphaericus 20 ± 5 17 ± 4 104 ± 53
Alona 45 ± 19 27 ± 10 42 ± 13
Simocephalus 20 ± 4 52 ± 18 17 ± 4
Moina 4 ± 2 13 ± 5 12 ± 4
Ostracoda
Ostracods 8 ± 3 48 ± 18 32 ± 5
Mean total numbers/L 646 380 618
Rarely flooded
Copepoda
Cyclopoid nauplii 81 ± 21 146 ± 123 95 ± 35
M. viridis 42 ± 12 34 ± 26 17 ± 5
M. varicans 89 ± 64 360 ± 292 19 ± 5
M. leukartii 0 117 ± 72 37 ± 9
Cladocera
M. spinosa 93 ± 67 4 ± 2 116 ± 44
C. sphaericus 43 ± 10 0 30 ± 12
Alona 30 ± 8 4 ± 1 20 ± 6
Simocephalus 4 ± 1 4 ± 2 34 ± 28
Moina 0 0 12 ± 4
Ostracoda
Ostracods 4 8 ± 3 38 ± 7
Mean total numbers/L 384 676 395
Environmental Management
123

small-sized fish species, B. haasianus was clearly more
abundant in rarely flooded wetlands.
Fish Gut Contents
Caught fish were categorized into four body size classes:
\20, 20–29, 30–39, and [40 mm (Table 3). The gut
content of all fishes included six major food categories:
microcrustaceans, which represented 71.2 % of the overall
diet, algae (10 %), detritus (8.4 %), macroinvertebrates
(7.5 %), small fishes (1.6 %), and plant materials (1.3 %).
The gut contents of small sizes of fishes (\20 mm) was
entirely comprised of microcrustaceans (Table 3).
The proportions of microcrustaceans in stomachs of the
cichlids (tilapias and P. philander) decreased with
increasing body size (Table 3). The gut content of tilapias
[20 mm in length was mainly detritus, algae, and plant
materials. In contrast, the guts of P. philander of similar
size ([20 mm) mostly contained larger prey, such as cal-
anoids; macroinvertebrates, such as shrimps (Caridina
nilotica); and fish fry, including topminnows (Table 3).
The diet of the relatively small-sized A. hutereaui and B.
haasianus was dominated by microcrustaceans (Table 3).
IRI results indicated that Moina micrura, M. spinosa, C.
sphaericus, and cyclopoids were the most important mi-
crocrustaceans preyed on by tilapias (Table 4). Cyclopoids,
calanoids, M. spinosa, and ostracods were the most
important organisms in the diet of P. philander (Table 4).
C. sphaericus, cyclopoids, and M. spinosa were the most
important organisms in the stomachs of A. hutereaui. The
small cyprinid B. haasianus mainly fed on larger micro-
crustaceans, such as the cyclopoids, M. spinosa, M. mac-
rocopa, and Daphnia laevis (Table 4). Nauplii of copepods
that were most abundant in the water column were rarely
encountered in fish stomachs.
Tilapias sampled from the rarely flooded sites had more
microcrustaceans in their guts than those from the fre-
quently flooded sites (Table 5). The number of micro-
crustaceans counted in the stomachs of juvenile tilapias
from rarely flooded sites ranged C143 C. sphaericus/fish
gut. M. spinosa, C. sphaericus, and M. micrura were pre-
dominant (by numbers) in stomachs of tilapia juveniles
from rarely flooded wetlands, whereas C. sphaericus were
predominant (also by numbers [10 organisms/gut]) in
stomachs of juvenile cichlids from the frequently flooded
wetlands (Table 5).
Discussion
High numbers of microcrustaceans that that appeared after
inundation of rarely flooded terrestrial patches of the sys-
tem match the hypothesis of this study. Inundation of
habitats rich in organic debris, such as the rarely flooded
wetlands, is associated with a boom in aquatic biological
activities (Angermeier and Karr 1984; Pusey and Ar-
thington 2003; Rolls and Wilson 2010; Balcombe et al.
2007; Arthington and Balcombe 2011). According to
Mosepele et al. (2009), nutrients such as phosphorus and
organic carbon accumulate within the temporary wetlands
during years of no flooding. The evidence from this study
suggests that inundation of rarely flooded patches of the
Okavango Delta may create the most suitable nursery
habitats, which will in turn support high production of
small fishes.
Fig. 4 Relative abundance (%
of catches) of small fishes in
inundated grasses of the
temporary wetlands of the lower
Okavango Delta
Environmental Management
123

The large numbers of small fishes observed in temporary
wetlands provide evidence of extensive utilisation of these
habitats by fish during large floods as previously reported
in the Delta by Lindholm et al. (2007). These small fishes
were dominated by cichlid juveniles (T. sparrmanii, T.
rendalli, P. philander, and Oreochromis spp.), topminnows
of the genus Aplocheilichthys, and small cyprinids of the
Barbus spp. as previously reported (Høberg et al. 2002;
Lindholm et al. 2007; Siziba et al. 2011a). Large numbers
of small fishes in temporary wetlands conflicts with Lind-
holm and Hessen (2007a) who found few small fishes in the
same habitats during low floods. It seems that the use of
temporary wetlands in the Delta by fish depends on flood
sizes and increases during large floods and decreases dur-
ing drought years. Our results support findings from else-
where in the world that large flooding of temporary
wetland habitats enhance fish recruitment (Balcombe et al.
2007; Zeug and Winemiller 2008; King et al. 2009; Rolls
and Wilson 2010) and support high fish production (Lowe-
McConnell 1979; de Graaf 2003) per the flood recruitment
model (Harris and Gehrke 1994).
In line with our hypothesis, fish assemblage structure
differed between wetland types. Topminnows numerically
dominated fish assemblages from frequently flooded sites,
Fig. 5 The averages (±SEM)
of a microcrustaceans/L and
b small fishes/m3 across
different wetland types during
the different hydrological
phases of inundation of
2009–2010 to 2010–2011
seasons. FRP filling phase, HFP
peak flooding, ReFP flood
recession
Environmental Management
123

whereas juvenile cichlids dominated the rarely flooded
sites. We propose that in temporary wetlands of the Delta,
dietary requirements of the fish drove this association. For
example, adult topminnow diet is known to be based on
small-sized invertebrates (Skelton 2001) whereas, in con-
trast, adult cichlids feed largely on terrestrial detritus and
algae (Merron 1991; Winemiller and Kelso-Winemiller
2003), items that were found in high abundance in the most
productive environs of rarely flooded wetlands (Siziba
et al. 2011a). High numbers of cichlid juveniles within
inundated rarely flooded terrestrial patches was also
reported by an earlier study in the Delta (Siziba et al.
2011b). Greater numbers of microcrustaceans in the guts of
individuals of cichlid juveniles sampled from rarely floo-
ded wetlands than those from frequently flooded wetlands
gives more evidence to our prediction of high productivity
of rarely flooded wetlands. Therefore, the human prefer-
ence for cichlids as a fishery target in the Delta (Merron
and Bruton 1995; Mosepele 2000) suggests that large
floods are likely to be important if the fishery is to be
sustained.
Microcrustaceans were the most abundant food items in
the diet of small fishes of the temporary wetlands. These
microfauna were relatively more important with a fre-
quency of occurrence of *100 % in the diet of fishes
especially within the size class of \20-mm TL. The pre-
dominance of microcrustaceans in guts of small fishes
within the temporary wetlands is in agreement with other
studies performed elsewhere (Brooks and Dodson 1965;
May 1974; Cushing 1990; Meschiatti and Arcifa 2002;
Medeiros and Arthington 2008) and in the Delta (Høberg
Fig. 6 NMDS ordinations of the 13 studied wetlands based on
community structure of small fishes during different phases of
flooding. Frequently flooded wetlands (empty circles) and rarely
flooded wetlands (filled circles)
Table 3 Contribution by volume (vol%) and frequency of occurrence (% freq) of microcrustaceans and other food types in the stomachs of
tilapia juveniles A. hutereaui, P. philander, and B. haasianus
Size class (mm) Food items Tilapias (n = 114) A. hutereaui (n = 80) P. philander (n = 80) B. haasianus (n = 80)
% Vol % Freq % Vol % Freq % Vol % Freq % Vol % Freq
\20 Algae 7.4 6.1 7.5 7.7 15.7 33.3 0 0
Macroinvertebrates 7.3 21.2 20.0 23.1 0 0 0 0
Microcrustaceans 85.3 100.0 72.5 100.0 84.3 100.0 100.0 100.0
20–29 Algae 14.6 50.0 0 0 0 33.3 0 0
Detritus 10.4 37.5 0 0 0 0 0 0
Macroinvertebrates 20.0 45.8 67.8 66.7 23.5 33.3 9.2 10.0
Microcrustaceans 51.4 97.9 32.7 100.0 76.5 100.0 90.8 100.0
Plant matter 3.7 2.1 0 0 0 0 0 0
30–39 Algae 29.0 88.2 0 0 0 0 0 0
Detritus 22.9 82.3 0 0 0 0 0 0
Macroinvertebrates 11.7 41.1 0 0 0 0 0 0
Microcrustaceans 28.7 100.0 100.0 100.0 100.0 100.0
Plant matter 7.8 5.9 0 0 0 0 0 0
[40 Algae 19.4 93.3 0 0 0 0 0 0
Detritus 28.8 100.0 0 0 0 0 0 0
Macroinvertebrates 9.8 26.7 0 0 25.2 42.9 0 0
Microcrustaceans 8.4 53.3 0 0 35.6 71.4 0 0
Plant matter 27.2 26.7 0 0 0 0 0 0
Plant seeds 6.4 6.7 0 0 0 0 0 0
Small fishes 0 0 0 0 39.2 57.1 0 0
Environmental Management
123

et al. 2002). The large number of microcrustaceans in the
stomachs of small fishes further support the important
trophic link of these microfauna in conveying energy to
fish, which in turn support other higher-order consumers
(Winemiller 1996; Jones et al. 1999; Fisher et al. 2001).
This study showed that with increasing body size, tila-
pias changed their diet from that dominated by micro-
crustaceans to one dominated by detritus and vegetative
materials, whereas P. philander switched to larger animals,
such as calanoids, shrimps (C. nilotica), and small fishes.
However, the small-sized fish species, A. hutereaui and B.
haasianus remained feeding on microcrustaceans even
after exceeding the 20-mm size class. According to
Medeiros and Arthington (2008), small microphagic
planktivores/insectivores, such as minnows, are limited in
choice of food items by their small body and small mouth-
gape sizes. The shift of tilapias to a detritus-based diet has
been observed in the Delta (Høberg et al. 2002), and the
progressive shift of P. philanders with increasing body size
toward larger animals is in line with other reports (O’Brien
1979; Mhlanga 2004). However, in the Delta, the shift by
tilapias from a microcrustacean-based diet to other food
items seemed to occur earlier in life than what has been
reported elsewhere (Balarin and Haller 1982; Moriarty and
Moriarty 1973; Lazzaro 1991). Early shifts and inclusion of
other food items in their diets by tilapias may be an
adaptation to the short-lived nature (3–4 months) of wet-
land inundation on the Delta. Furthermore, early shifts in
diet may be a survival strategy because they decrease the
period of dependence on microcrustaceans, which were the
key food source for small fishes within the system. Hence,
based on the critical period hypothesis (Hjort 1914, 1926;
May 1974) and the match/mismatch hypothesis (Cushing
1972, 1990), microcrustacean availability in the Delta is
likely to regulate recruitment of juvenile fish into adult fish
populations before they exceed the 20-mm size class.
The assemblage structure, density, and size class of
microcrustaceans collected during this study differed con-
siderably from previous collections on the Delta. Micro-
crustaceans collected during years of low flows (i.e.,
drought) were dominated by large-sized and more plank-
tonic species, such as M. micrura, D. laevis, and M. leuk-
arti (Lindholm and Hessen 2007a). During this study,
small-sized nauplii of copepods C. sphaericus and more
periphytic cladocerans, such as M. spinosa, dominated the
samples. Densities of microcrustaceans were also consid-
erably greater during the drought surveys. For example,
5-fold more M. micrura were recorded by Lindholm and
Hessen (2007a) than during the present study. We suggest
that the high density of large-sized microcrustaceans dur-
ing drought was a consequence of concentration effects
Table 4 IRI for invertebrates consumed by small fishes within the
temporary wetlands of the Okavango Delta
Invertebrates Tilapia P. philander A. hutereaui B. haasianus
Cladocera
M. micrura 2,169.1 97.0 679.9 1,887.1
Macrothrix 1,395.8 1,812.5 1,501.4 2,134.6
Pleuroxus 583.7 31.7 0 864.9
Chydorus 1,190.4 126.1 6,032.9 322.9
Simocephalus 313.6 207.1 205.1 79.5
Dhuvedia 97.8 132.5 0 0
Diaphanosoma 21.3 1,529.0 0 0
Ceriodaphnia 81.9 37.3 85.3 370.8
D. laevis 100.1 0 0 1,865.0
M. macrocopa 0 456.1 0 0
Alona 205.2 208.2 931.0 0
Allonella 26.5 0 0 0
Ilyocryptus 3.5 0 0 0
Copepoda
Nauplii 3.5 79.2 64.2 0
Cyclopoids 1,264.1 0 2,270.6 5,049.4
Calanoids 0 2,605.5 0 0
Ostracoda
Ostracods 1,128.1 1,143.5 90.1 793.4
Rotifers
Lecane 0 0 548.1 0
Asplanchna 0 15.8 179.8 0
Keratella 0 0 90.9 0
Macroinvertebrates
Mosquito larvae 0 21.4 0 0
C. nilotica 0 683.6 0 0
Table 5 Mean counts (number/gut) of microcrustaceans in stomachs
of tilapia juveniles in temporary wetlands of the lower Okavango
Delta
Frequently flooded
wetlands (n = 57)
Rarely flooded
wetlands (n = 57)
Cladocera
Moina 7 ± 2 21 ± 8
Macrothrix 9 ± 3 48 ± 18
Pleuroxus 1 ± 0.4 15 ± 5
Chydorus 10 ± 2 31 ± 11
Dunhevedia 1 ± 0.6 1 ± 0.5
Simocephalus 3 ± 1 4 ± 2
Diaphanosoma 2 ± 1 4 ± 2
Ceriodaphnia 4 ± 2 1 ± 0.3
D. laevis 1 ± 0.5 4 ± 2
Alona 4 ± 2 6 ± 3
Allonella 4 ± 3 0
Copepoda
Cyclopoids 5 ± 2 3 ± 1
Nauplii 2 ± 1 1 ± 0.5
Ostracoda
Ostracods 4 ± 1.5 8 ± 0.5
Environmental Management
123

during wetland drying and decreased fish recruitment. In
contrast, the lower densities and reduced size of micro-
crustaceans during large-sized flood years suggests that
predation is shaping this assemblage. For example, the size
efficiency hypothesis (Brooks and Dodson 1965) argues
that selective predation leads to the extinction of large
microcrustaceans and dominance of microfauna of smaller
body sizes (Mehner and Thiel 1999; Shurin and Allen
2001). Intense predation pressure on microcrustaceans also
typically results in an assembly of fewer individuals and
fewer vulnerable planktonic genera, such as Daphnia and
Moina (Brooks and Dodson 1965; Fernando 2002) such as
observed here. Intense predation pressure on microcrusta-
ceans by small fishes within the temporary wetlands of the
Delta has been suggested by others (Ramberg et al. 2006;
Høberg et al. 2002; Siziba et al. 2011b).
It appears that the magnitude of flooding indirectly
shapes the microcrustacean assemblage by affecting the
rates and key sources of mortality. We propose that during
years of small floods (drought years), microcrustaceans in
temporary wetlands are self-regulated by density-depen-
dent mechanisms, such as competition among microcrus-
taceans for limited resources, which sees the larger
individuals survive (Lindholm and Hessen 2007a). Fish
predation is relatively unimportant during drought years
because low water levels limit fish passage into temporary
wetlands (Lindholm and Hessen 2007a). During years of
large flood, density-dependent mechanisms are relaxed due
to the abundance of available habitat. Fish have good
access to the wetlands where they breed and prey heavily
on microcrustaceans. Therefore, during large floods, mi-
crocrustacean assemblages are likely to be regulated by
predation rather than by the density-dependent forces.
Therefore, we suggest that manipulative experiments,
possibly through microcosms, should be performed to
understand the actual predation effect of small fishes on
microcrustacean assemblages of the Delta.
Conclusion
The findings of this study suggest that in the Delta, fish
recruitment and production may increase during years of
large floods. This is because large floods increase the area
of inundated terrestrial patches, including the rarely floo-
ded wetlands, which are nursery habitats for cichlids, an
important food source for people in Botswana. The small
fishes that dominate the temporary wetland habitats pre-
dominantly feed on microcrustaceans, particularly fish of
\20-mm body size. Hence, low availability of micro-
crustaceans due to no or reduced extent of Delta inundation
may negatively affect fish stocks by constraining the pro-
duction of fish during their early life stages (\20 mm).
This implies that the loss of temporary wetlands may lead
to poor recruitment, which will adversely affect higher-
order animals, such as fish, aquatic birds, piscivorous
fishes, crocodiles, and human beings. Therefore, in the
Delta the management challenge lies in striking a balance
between water needed for the ecological functioning of the
system and that for needed for developmental projects. We
suggest that management efforts in the Delta should con-
sider the significance of inundation of temporary wetlands,
including the rarely inundated terrestrial patches, on the
availability of microcrustaceans and production of small
fishes.
Acknowledgments This study was funded by Carnegie–RISE
through the Sub-Saharan Africa Water Resources Network. Staff at
the University of Botswana Okavango Research Institute especially
Thebe Kemosedile and Kaelo Makati for providing technical support
during field sampling.
References
Agostinho AA, Zalewski M (1995) The dependence of fish commu-
nity structure and dynamics on floodplain and riparian ecotone
zone in Parana River, Brazil. Hydrobiologia 303:141–148
Andersson L, Wilk J, Todd MC, Hughes DA, Earle A, Kniveton D
et al (2006) Impact of climate change and development scenarios
on flow patterns in the Okavango River. J Hydrol 331:43–57
Angermeier PL, Karr JR (1984) Relationships between woody debris
and fish habitat in a small warm-water stream. Trans Am
Microsc Soc 113:716–726
Arcifa M (2000) Feeding habits of Chaoboridae larvae in a tropical
Brazilian reservoir. Rev Bras Biol 60:591–597
Arthington AH, Balcombe SR (2011) Extreme flow variability and
the ‘‘boom’’ and ‘‘bust’’ ecology of fish in arid zone floodplain
rivers: a case history with implications for environmental flows,
conservation and management. Ecohydrology 4:708–720
Ashton P (2000) Potential environmental impacts associated with the
proposed abstraction of water from the Okavango River in
Namibia. South Afr J Aquat Sci 25:175–182
Balarin J, Haller R (1982) The intensive culture of tilapia in tanks,
raceways and cages. Recent Adv Aquac 1:265–355
Balcombe SR, Bunn SE, Arthington AH, Fawcett JH, McKenzie-
Smith FJ, Wright A (2007) Fish larvae, growth and biomass
relationships in an Australian arid zone river: links between
floodplains and waterholes. Freshw Biol 52:2385–2398
Bayley PB (1988) Factors affecting growth rates of young tropical
floodplain fishes: seasonality and density-dependence. Environ
Biol Fish 21:127–142
Bayley PB (1995) Understanding large river: floodplain ecosystems.
Bioscience 45:153–158
Bonyongo MC (2004) The ecology of large herbivores in the
Okavango Delta, Botswana. Doctoral thesis, University of
Bristol, Bristol, UK
Bonyongo M, Bredenkamp G, Veenendaal E (2000) Floodplain
vegetation in the Nxaraga Lagoon area, Okavango Delta,
Botswana. South Afr J Bot 66:15–21
Botrell HH, Duncan A, Gliwicz ZM, Grygierek E, Herzig A,
Hillbright-Ilkowska A et al (1976) A review of some problems
in zooplankton production studies. Nor J Zool 24:419–456
Brooks JL, Dodson SI (1965) Predation, body size, and composition
of plankton. Science 150:28–35
Environmental Management
123

Clarke KR, Gorley RN (2006) Primer v6.1.5: User manual/tutorial.
Plymouth Marine Laboratory, Plymouth, UK
Coke M, Pott RM (1971) The Pongolo floodplain pans. Newsl Limnol
Soc S Afr 16:20–26
Cowx IG (2007) Interactions between fish and birds: Implications for
management. Blackwell, Oxford
Cushing DH (1972) The production cycle and the numbers of marine
fish. Symp Zool Soc Lond 29:213–232
Cushing D (1990) Plankton production and year-class strength in fish
populations: an update of the match/mismatch hypothesis. Adv
Mar Biol 26:249–293
de Graaf G (2003) Dynamics of floodplain fisheries in Bangladesh,
results of 8 years fisheries monitoring in the compartmentaliza-
tion pilot project. Fish Manag Ecol 10:191–199
Fernando C (1994) Zooplankton, fish and fisheries in tropical
freshwaters. Hydrobiologia 272:105–123
Fernando CH (2002) A guide to tropical freshwater zooplankton:
Identification, ecology and impact on fisheries. Bachuys, Leiden
Fisher SJ, Brown ML, Willis DW (2001) Temporal food web
variability in an upper Missouri River backwater: energy
origination points and transfer mechanisms. Department of
Wildlife and Fisheries Sciences. Ecol Freshw Fish 10:154–167
Gieske A (1996) Modelling outflow from the Jao/Boro river system in
the Okavango Delta, Botswana. J Hydrol 193:214–239
Gilbert JJ, Burns CW (1999) Some observations on the diet of the
backswimmer, Anisops wakefieldi (Hemiptera: Notonectidae).
Hydrobiologia 412:111–118
Graves KG, Morrow JC (1998) Tube sampler for zooplankton. Prog
Fish Cult 50:182–183
Harris JH, Gehrke PC (1994) Modelling the relationship between
streamflow and population recruitment to manage freshwater
fisheries. Agric Syst Inform Technol 72:393–407
Hart RK, Calver MC, Dickman CR (2002) The index of relative
importance: an alternative approach to reducing bias in descrip-
tive studies of animal diet. Wildl Res 29:415–421
Hjort J (1914) Fluctuations in the great fisheries of northern Europe
reviewed in the light of biological research. Rapp PV Reun Cons
Int Explor Mer 20:1–13
Hjort J (1926) Fluctuations in the year classes of important food
fishes. ICES J Mar Sci 1:5–38
Høberg P, Lindholm M, Ramberg L, Hessen D (2002) Aquatic food
web dynamics on a floodplain in the Okavango Delta, Botswana.
Hydrobiologia 470:23–30
Horwood J, Cushing D, Wyatt T (2000) Planktonic determination of
variability and sustainability of fisheries. J Plankton Res
22(7):1419–1422
Humphries P, King AJ, Koehn JD (1999) Fish, flows and floodplains:
links between freshwater fishes and their environment in the
Murray-Darling river system, Australia. Environ Biol Fish
56:129–151
Hyslop E (1980) Stomach contents analysis—A review of methods
and their application. J Fish Biol 17:411–429
Jones RI, Grey J, Sleep D, Arvola L (1999) Stable isotope analysis of
zooplankton carbon nutrition in humic lakes. Oikos 86:97–104
Junk WJ (1999) The flood pulse concept of large rivers: learning from
the tropics. Arch Hydrobiol 115(Suppl):261–280
Junk WJ, Bayley PB, Sparks RE (1989) The flood pulse concept in
river-floodplain systems. Can Special Publ Fish Aquat Sci
106:110–127
Kawabata K, Urabe J (1998) Length–weight relationships of eight
freshwater planktonic crustacean species in Japan. Freshw Biol
39:199–205
King A, Tonkin Z, Mahoney J (2009) Environmental flow enhances
native fish spawning and recruitment in the Murray River,
Australia. River Res Appl 25:1205–1218
Korovchinsky NM (1992) Sididae and Holopediidae: (Crustacea:
Daphniiformes). Guides to the identification of the microinver-
tebrates of the continental waters of the world. Academic
Publishers, Hague
Kwak TJ (1988) Lateral movement and use of floodplain habitat by
fishes of the Kankakee River, Illinois. Am Midl Nat
120(2):241–249
Lazzaro X (1991) Feeding convergence in South American and
African zooplanktivorous cichlids Geophagus brasiliensis and
Tilapia rendalli. Environ Biol Fish 31:283–293
Lewis WM Jr (1977) Feeding selectivity of a tropical Chaoborus
population. Freshw Biol 7:311–325
Lewis WM Jr, Hamilton SK, Rodrıguez M, Saunders JF III, Lasi MA
(2001) Foodweb analysis of the Orinoco floodplain based on
production estimates and stable isotope data. J North Am
Benthol Soc 20:241–254
Lindholm M, Hessen D (2007a) Zooplankton succession on seasonal
floodplains: surfing on a wave of food. Hydrobiologia
592:95–104
Lindholm M, Hessen DO (2007b) Competition and niche partitioning
in a floodplain ecosystem: a cladoceran community squeezed
between fish and invertebrate predation. Afr Zool 42:158–164
Lindholm M, Hessen D, Mosepele K, Wolski P (2007) Food webs and
energy fluxes on a seasonal floodplain: the influence of flood
size. Wetlands 27:775–784
Lowe-McConnell RH (1979) Ecological aspects of seasonality in
fishes of tropical waters. In: Miller PJ (ed) Fish phenology.
London Academic Press, London, pp 219–241
Lowe-McConnell RH (1987) Ecological studies in tropical fish
communities. Cambridge University Press, Cambridge
Masundire HM (1994) Mean individual dry weight and length–weight
regressions of some zooplankton of Lake Kariba. Hydrobiologia
272:231–238
Masundire HM (1997) Spatial and temporal variations in the
composition and density of crustacean plankton in the five
basins of Lake Kariba, Zambia-Zimbabwe. J Plankton Res
19:43–62
May RM (1974) Larval mortality in marine fishes and the criticalperiod concept. In: Blaxter JH (ed) The early history of fish.
Springer, New York
Mbaiwa JE (2004) Causes and possible solutions to water resource
conflicts in the Okavango River Basin: the case of Angola,
Namibia and Botswana. Phys Chem Earth 29:1319–1326
McCarthy J, Gumbricht T, McCarthy TS (2005) Ecoregion classifi-
cation in the Okavango Delta, Botswana from multitemporal
remote sensing. Int J Remote Sens 26:4339–4357
McLachlan S (1971) The rate of nutrient release from grass and dung
following immersion in lake water. Hydrobiologia 37:521–530
Medeiros ESF, Arthington AH (2008) The importance of zooplankton
in the diets of three native fish species in floodplain waterholes
of a dryland river, the Macintyre River, Australia. Hydrobiologia
614:19–31
Mehner T, Thiel R (1999) A review of predation impact by 0 ? fish
on zooplankton in fresh and brackish waters of the temperate
northern hemisphere. Environ Biol Fish 56:169–181
Mendelsohn JM, Vanderpost C, Ramberg L, Murray-Hudson M,
Wolski P, Mosopele K (2010) Okavango Delta: floods of life.
Research and Information Services of Namibia, Windhoek
Merron GS (1991) The ecology and management of the fishes of the
Okavango Delta, Botswana, with particular reference to the role
of the seasonal flood. Doctoral thesis, Rhodes University, South
Africa
Merron GS (1998) Pack-hunting in two species of catfish, Clavias
gariepinus and C. ngamensis, in the Okavango Delta, Botswana.
J Fish Biol 43(4):575–584
Environmental Management
123
Merron SG, Bruton NM (1995) Community ecology and conservation
of the fishes of the Okavango Delta, Botswana. Environ Biol
Fish 43:109–119
Meschiatti A, Arcifa M (2002) Early life stages of fish and the
relationships with zooplankton in a tropical Brazilian reservoir:
lake Monte Alegre. Brazilian J Biol 62:41–50
Meyer T (1999) Ecological mappings in the research area of the
HOORC, Okavango Delta, Botswana. Master’s thesis, Anhalt
University, Kothen, Germany
Mhlanga L (2004) The diet of five cichlid fish species from Lake
Kariba, Zimbabwe. Trans Zimb Sci Assoc 74:16–21
Milzow C, Burg V, Kinzelbach W (2010) Estimating future ecoregion
distributions within the Okavango Delta Wetlands based on
hydrological simulations and future climate and development
scenarios. J Hydrol 381:89–100
Moriarty C, Moriarty D (1973) Quantitative estimation of the daily
ingestion of phytoplankton by Tilapia nilotica and Haplochromis
nigripennis in Lake George, Uganda. J Zool 171:18–23
Mosepele K (2000) Preliminary length based stock assessment of the
main exploited stocks of the Okavango delta fishery. MPhil
thesis, University of Bergen, Bergen, Norway
Mosepele K, Moyle P, Merron G, Purkey D, Mosepele B (2009) Fish,
floods, and ecosystem engineers: aquatic conservation in the
Okavango Delta, Botswana. Bioscience 59:53–64
Munro AD (1990) Tropical freshwater fishes. In: Munro AD, Scott
AP, Lam TJ (eds) Reproductive seasonality in teleosts: environ-
mental influences. CRC Press, Boca Raton, pp 145–239
Murray-Hudson M, Wolski P, Ringrose S (2006) Scenarios of the
impact of local and upstream changes in climate and water use
on hydro-ecology in the Okavango Delta, Botswana. J Hydrol
331:73–84
Murray-Hudson M, Combs F, Wolski P, Brown MT (2011) A
vegetation-based hierarchical classification for seasonally pulsed
floodplains in the Okavango Delta, Botswana. Afr J Aquat Sci
36(3):223–234
O’Brien WJ (1979) The predator-prey interaction of planktivorous
fish and zooplankton: recent research with planktivorous fish and
their zooplankton prey shows the evolutionary thrust and parry
of the predator-prey relationship. Am Sci 67:572–581
Orlova-Bienkowskaja M (2001) Cladocera: Anomopoda, Daphniidae:
Genus Simocephalus. Backhuys, Leiden
Paxinos R, Mitchell JG (2000) A rapid Utermohl method for
estimating algal numbers. J Plankton Res 22:2255–2262
Pelicice FM, Agostinho AA, Thomaz SM (2005) Fish assemblages
associated with Egeria in a tropical reservoir: investigating the
effects of plant biomass and deil period. Acta Oecologica
27:9–16
Pinkas L, Oliphant MS, Inverson ILK (1971) Food habits of albacore,
bluefin tuna and bonito in Californian waters. California
Department of Fish and Game Fisheries. Fish Bull 152:11–105
Power ME, Sun A, Parker G, Dietrich WE, Wootton JT (1995)
Hydraulic food-chain models. Bioscience 45(3):159–167
Pusey BJ, Arthington AH (2003) Importance of the riparian zone to
the conservation and management of freshwater fish: a review.
Mar Freshw Res 54:1–16
Ramberg L, Hancock P, Lindholm M, Meyer T, Ringrose S, Sliva J
et al (2006) Species diversity of the Okavango Delta, Botswana.
Aquat Sci 68:310–337
Ramberg L, Lindholm M, Hessen OD, Murray-Hudson M, Bonyongo
C, Heinl M et al (2010) Aquatic ecosystem responses to fire and
flood size in the Okavango Delta: observations from the seasonal
floodplains. Wetlands Ecol Manag 18(5):587–595
Rolls RJ, Wilson GG (2010) Spatial and temporal patterns in fish
assemblages following an artificially extended floodplain inun-
dation event, northern Murray-Darling Basin, Australia. Environ
Manag 45:822–833
Shurin JB, Allen EG (2001) Effects of competition, predation, and
dispersal on species richness at local and regional scales. Am Nat
158:624–637
Siziba N, Chimbari M, Mosepele K, Masundire H (2011a) Spatial and
temporal variations in densities of small fishes across different
temporary floodplain types of the lower Okavango Delta,
Botswana. Afr J Aquat Sci 36:309–320
Siziba N, Chimbari MJ, Masundire H, Mosepele K (2011b) Spatial
and temporal variations of microinvertebrates across temporary
floodplains of the lower Okavango Delta, Botswana. Phys Chem
Earth 36:939–948
Siziba N, Chimbari MJ, Masundire H, Mosepele K (2011c) Spatial
variations of microinvertebrates across different microhabitats of
temporary floodplains of lower Okavango Delta, Botswana. Afr J
Ecol 50:43–52
Skelton P (2001) A complete guide to the freshwater fishes of
southern Africa. Struik, Cape Town
Smirnov NN (1992) The macrothricidae of the world. Guides to the
identification of the microinvertebrates of the continental waters
of the world. SPB Academic, The Hague
Smirnov NN (1996) Cladocera: The Chydorinae and Sayciinae
(Chydoridae) of the world. SPB Academic, Amsterdam
Sokal RR, Rohlf FJ (1991) Biometry: the principles and practice of
statistics in biological research. Freeman, New York
Sparks RE (1995) Need for ecosystem management of large rivers
and their floodplains. Bioscience 45:168–182
Trippel E, Chambers R (1997) The early life history of fishes and its
role in recruitment processes. In: Chambers RC, Trippel EA
(eds) Early life history and recruitment in fish populations.
Chapman and Hall, London, pp 21–32
Wallace KM, Leslie AJ (2008) Diet of the Nile crocodile (Crocodylus
niloticus) in the Okavango Delta, Botswana. J Herpetol
42(2):361–368
Ward JV (1998) Riverine landscapes: biodiversity patterns, distur-
bance regimes, and aquatic conservation. Biol Conserv
83:269–278
Welcomme RL (1979) Fisheries ecology of floodplain rivers.
Longman, London
Welcomme RL (2001) Inland fisheries: ecology and management.
Blackwell Science, Oxford
Winemiller KO (1996) Factors driving temporal and spatial variation
in aquatic floodplain food webs. In: Polis GA, Winemiller KO
(eds) Food webs: Integration of patterns and dynamics. Chapman
and Hall, New York, pp 298–312
Winemiller K, Kelso-Winemiller L (2003) Food habits of tilapiine
cichlids of the Upper Zambezi River and floodplain during the
descending phase of the hydrologic cycle. J Fish Biol
63:120–128
Wolski P, Murray-Hudson M. (2006) Reconstruction of 1989-2005
inundation history in the Okavango Delta from archival LandSat
TM imagery. Globewetlands Symposium, ESA-ESRIN, Frascati,
Rome, Italy, October 19–20, 2006
Zeug S, Winemiller K (2008) Relationships between hydrology,
spatial heterogeneity and fish recruitment dynamics in a
temperate floodplain river. River Res Appl 24:90–102
Environmental Management
123
Copyright © 2022 FDOKUMEN