
OBIS - a Data and Information Management System for the Okavango Basin
Available online at www.sciencedirect.com
www.elsevier.com/locate/pce
Physics and Chemistry of the Earth 33 (2008) 157–164
An investigation of permanent and transient changes inflood distribution and outflows in the Okavango Delta, Botswana
Piotr Wolski *, Mike Murray-Hudson
Harry Oppenheimer Okavango Research Centre, Private Bag 285, Maun, Botswana
Received 9 August 2005Available online 5 May 2007
Abstract
The annual flood cycle in the Okavango Delta is the basis of subsistence of the local population, providing water, arable land andwetland resources. Additionally, it forms the basis of a large tourism industry. Flooding in the Okavango Delta is, however, very variableboth at short and long term time scales. Past research suggested the influence of factors such as tectonic activity, sedimentation, vege-tation change or human influence on the spatial distribution of floodwaters. Change in the flooding regime at any given site is thus oftenperceived as an effect of permanent change in the system, and this perception results in unnecessary demands for engineering interven-tions in the system. However, it is possible that some of the perceived changes in flood regime are apparent transient effects of non-lin-earity of the system and variation in hydrological inputs. Hydrometric data and satellite-derived flood maps are analysed here usingstatistical methods (covariance analysis and double mass analysis) to distinguish between temporal and permanent changes in variousparts of the Okavango Delta. The analyses reveal that system non-linearity causes the hydrological responses of the Okavango Deltato be non-proportional to the inputs. Periods of one to several consecutive years are present when flood extents and outflows are eitherconsiderably higher or lower (flow or flood regimes) than what would be expected considering the magnitude of inflow. Such effects arevisible throughout the entire system, or only in some distributaries, and do not, as previously thought, represent permanent change inflood distribution. However, flood regime change that appears to result from a physical change in the system has been detected. Thischange has a nature of shift in flood distribution between the Thaoge and the Xudum, with the latter receiving more water after1997 at the expense of the former and causing 2004 re-flooding of Lake Ngami.� 2007 Elsevier Ltd. All rights reserved.
Keywords: Okavango Delta; Change detection; Inundation; Flow regime; Time series; Non-stationarity
1. Introduction
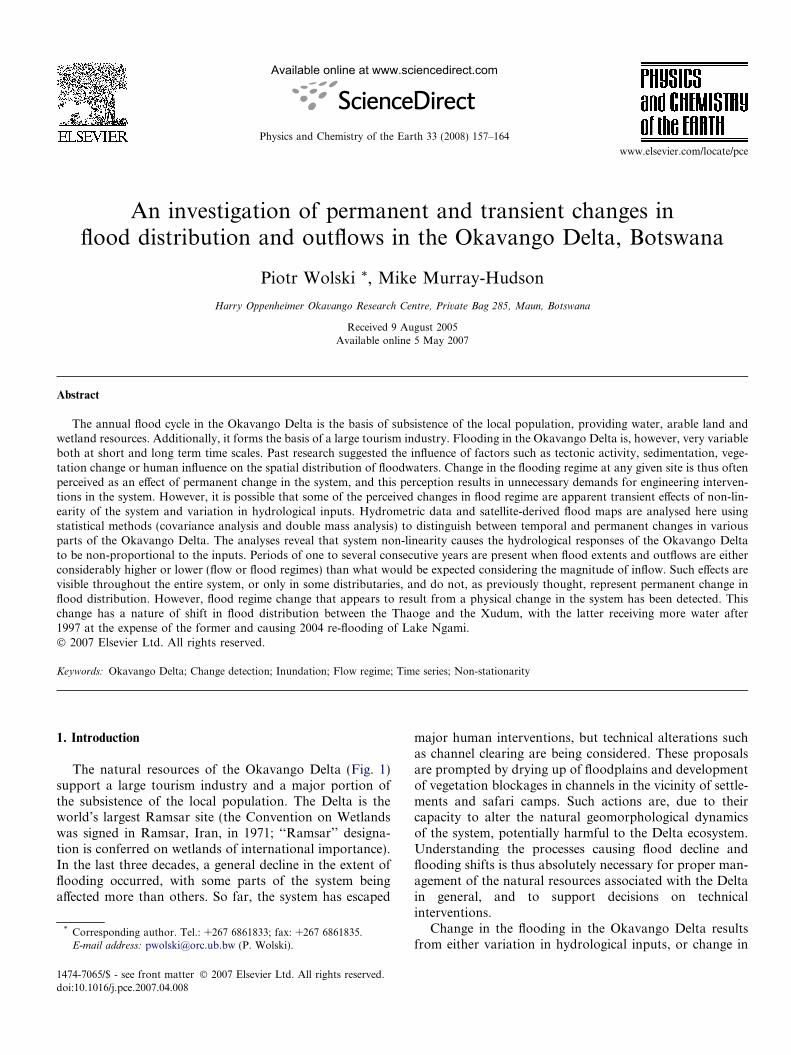
The natural resources of the Okavango Delta (Fig. 1)support a large tourism industry and a major portion ofthe subsistence of the local population. The Delta is theworld’s largest Ramsar site (the Convention on Wetlandswas signed in Ramsar, Iran, in 1971; ‘‘Ramsar’’ designa-tion is conferred on wetlands of international importance).In the last three decades, a general decline in the extent offlooding occurred, with some parts of the system beingaffected more than others. So far, the system has escaped
1474-7065/$ - see front matter � 2007 Elsevier Ltd. All rights reserved.
doi:10.1016/j.pce.2007.04.008
* Corresponding author. Tel.: +267 6861833; fax: +267 6861835.E-mail address: [email protected] (P. Wolski).
major human interventions, but technical alterations suchas channel clearing are being considered. These proposalsare prompted by drying up of floodplains and developmentof vegetation blockages in channels in the vicinity of settle-ments and safari camps. Such actions are, due to theircapacity to alter the natural geomorphological dynamicsof the system, potentially harmful to the Delta ecosystem.Understanding the processes causing flood decline andflooding shifts is thus absolutely necessary for proper man-agement of the natural resources associated with the Deltain general, and to support decisions on technicalinterventions.
Change in the flooding in the Okavango Delta resultsfrom either variation in hydrological inputs, or change in
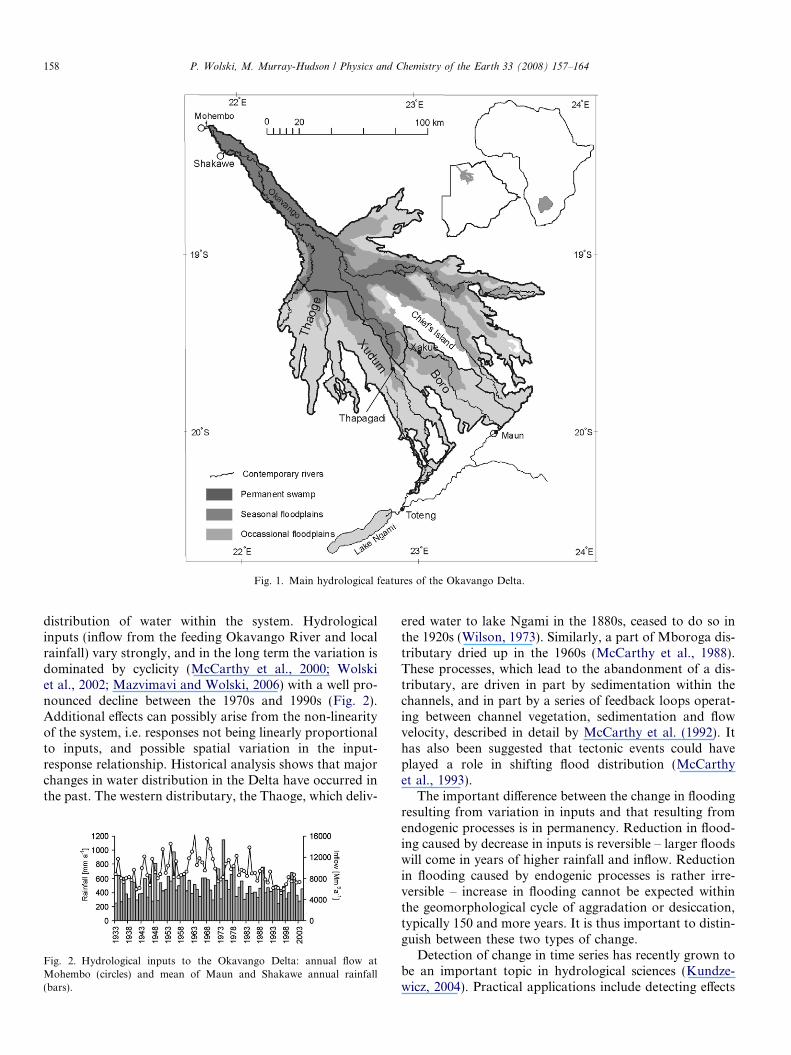
Fig. 1. Main hydrological features of the Okavango Delta.
158 P. Wolski, M. Murray-Hudson / Physics and Chemistry of the Earth 33 (2008) 157–164
distribution of water within the system. Hydrologicalinputs (inflow from the feeding Okavango River and localrainfall) vary strongly, and in the long term the variation isdominated by cyclicity (McCarthy et al., 2000; Wolskiet al., 2002; Mazvimavi and Wolski, 2006) with a well pro-nounced decline between the 1970s and 1990s (Fig. 2).Additional effects can possibly arise from the non-linearityof the system, i.e. responses not being linearly proportionalto inputs, and possible spatial variation in the input-response relationship. Historical analysis shows that majorchanges in water distribution in the Delta have occurred inthe past. The western distributary, the Thaoge, which deliv-
Fig. 2. Hydrological inputs to the Okavango Delta: annual flow atMohembo (circles) and mean of Maun and Shakawe annual rainfall(bars).
ered water to lake Ngami in the 1880s, ceased to do so inthe 1920s (Wilson, 1973). Similarly, a part of Mboroga dis-tributary dried up in the 1960s (McCarthy et al., 1988).These processes, which lead to the abandonment of a dis-tributary, are driven in part by sedimentation within thechannels, and in part by a series of feedback loops operat-ing between channel vegetation, sedimentation and flowvelocity, described in detail by McCarthy et al. (1992). Ithas also been suggested that tectonic events could haveplayed a role in shifting flood distribution (McCarthyet al., 1993).
The important difference between the change in floodingresulting from variation in inputs and that resulting fromendogenic processes is in permanency. Reduction in flood-ing caused by decrease in inputs is reversible – larger floodswill come in years of higher rainfall and inflow. Reductionin flooding caused by endogenic processes is rather irre-versible – increase in flooding cannot be expected withinthe geomorphological cycle of aggradation or desiccation,typically 150 and more years. It is thus important to distin-guish between these two types of change.
Detection of change in time series has recently grown tobe an important topic in hydrological sciences (Kundze-wicz, 2004). Practical applications include detecting effects

P. Wolski, M. Murray-Hudson / Physics and Chemistry of the Earth 33 (2008) 157–164 159
of climate change, damming and land use change on flowcharacteristics such as minimum flow, peak flow, floodarrival, duration of flood or number of runoff days (e.g.Burn and Hag Elnur, 2002; Kahya and Kalayci, 2004; Iro-ume et al., 2005). This is usually done by analysing a singletime series using statistical tests that identify gradual orabrupt change in the mean or standard deviation. The timeseries analysed can be either an original hydrological vari-able (e.g. runoff or rainfall) or a residual of an observedtime series and that simulated by a hydrological model,which is run under the assumption of stationarity of thesystem (e.g. Schreider et al., 2002). In the latter case, obvi-ously, the analysis is directed towards detecting changesdue to alteration of the system (e.g. land use). Since hydro-logical time series are inherently characterized by variabil-ity and often non-linearity, improvement of methods fordetecting trends and abrupt changes under such conditionsis therefore a focus of recent theoretical advances (Kundze-wicz and Robson, 2004). Kundzewicz and Robson (2004)stress, however, that for proper interpretation, results ofstatistical analyses of a single time series have to be relatedto auxiliary information on timing and magnitude ofpossible changes in the system, i.e. related to independentestimates of climatic variability or land use change.Cross-correlation analysis is a rigorous method for investi-gating relationships between a dependent variable, ofwhich change is being investigated (e.g. runoff or some ofits characteristics), and a possible influencing variable (suchas rainfall) (e.g. Burn and Hag Elnur, 2002). Another tech-nique used in change detection is covariance analysis,which is used in detecting relative change, i.e. change in agiven variable at one site compared to that variable inanother site, where change is expected not to have occurred(Helsel and Hirsch, 1991). Covariance analysis is oftenused in paired catchment studies (e.g. Iroume et al., 2005).
In this paper, we address the issue of distinguishing per-manent and transient change in hydrological responses inthe Okavango Delta. Techniques such as covariance analy-sis and double mass analysis are used in order to comparethe variation in hydrological responses (inundation areaand discharges) observed in various parts of the systemwith each other, and with variation in hydrological inputs.
2. Study site
The features of the Okavango Delta have been describedin detail elsewhere in literature (e.g. Gieske, 1997; Gumb-richt et al., 2004; McCarthy et al., 1998). In brief, the Deltais a large alluvial fan with surface gradient in the order of1:3700, where water and sediment from the inflowingOkavango River are spread across the conical surfacethrough a system of channels and floodplains (Fig. 1).Channels in the system have permeable banks formed byreeds and sedges (Ellery et al., 1993). The upper part ofthe Delta, which has the shape of a panhandle, is a20 km broad flat-bottomed valley, with a well-definedmeandering channel. At the apex of the alluvial fan proper,
the channel flows through a relatively unbound system offloodplains. Further downstream chains of islands causedifferentiation into relatively separate distributaries, form-ing the characteristic fan shape, with the Chief’s Island,the largest land body in the Delta, dividing the system intoeastern and western parts.
Annually, in response to the flood wave arriving withthe Okavango River, the inundated area expands from alow of 3500–6000 km2 in January/February to a high of6000–12,000 km2 in August/September. This flood eventis out of phase with the rainy season which lasts fromNovember to March. This is partly caused by delay ofthe flood wave on its way from the 600 km distant headwa-ters feeding the Okavango River, and partly by slow prop-agation of the flood within the Delta itself. Statisticalanalyses have shown that outflows from the system andflooding extents vary in response to inflow from the Okav-ango River as well as to local rainfall (McCarthy et al.,1998; Gumbricht et al., 2004).
3. Materials and methods
There is a number of hydrometric stations in the Deltawhere channel water levels and (or) discharges are mea-sured monthly (logistics allowing). Data from these sta-tions cover the period of 1970–2004. The available datainclude satellite imagery-derived flood maps, derived asdescribed by McCarthy et al. (2004). These cover the per-iod of 1985–2004 and have a spatial resolution of1 · 1 km, and temporal resolution of 10 days, but they havenumerous gaps. For the purpose of this study, annual flowseries were derived for each station analysed and meanmonthly inundated area were determined for each distribu-tary analysed. Long term rainfall data are available onlyfor Maun and Shakawe. Average annual rainfall fromthese stations was used.
The time series of inputs, and responses (water levels,discharges, flood extents) are non-stationary (Fig. 2). Totest for change in hydrological responses of the system, asingle time series analysis could not be used, as the detectedchange would reflect the change in inputs rather than theeffects of processes occurring within the system. The hydro-logical responses in the analysed system are influenced byseveral factors: local rainfall, inflow to the system and ante-cedent conditions. A change in the system should thereforemanifest itself by change in relationship between givenresponse and its influencing factors. As shown by McCar-thy et al. (1998), Gumbricht et al. (2004) and Wolskiet al. (2005), relationships between hydrological responsesand inputs in the Okavango Delta are relatively wellexpressed using multiple linear regression models. In orderto assess changes occurring in the system, we use multiplelinear regression relationships between inputs andresponses and undertake covariance analysis (Helsel andHirsch, 1991). In this analysis, a binary variable is intro-duced into the multiple regression, taking values of 1 fora period when change was expected to occur and 0 for
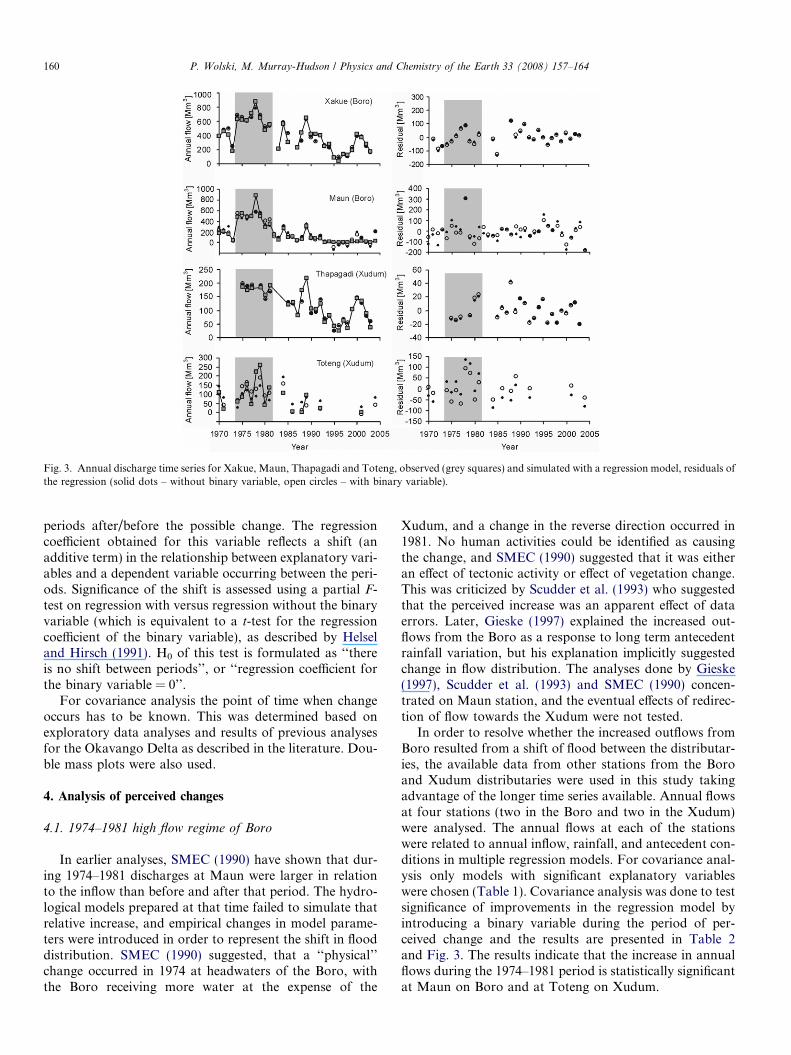
Fig. 3. Annual discharge time series for Xakue, Maun, Thapagadi and Toteng, observed (grey squares) and simulated with a regression model, residuals ofthe regression (solid dots – without binary variable, open circles – with binary variable).
160 P. Wolski, M. Murray-Hudson / Physics and Chemistry of the Earth 33 (2008) 157–164
periods after/before the possible change. The regressioncoefficient obtained for this variable reflects a shift (anadditive term) in the relationship between explanatory vari-ables and a dependent variable occurring between the peri-ods. Significance of the shift is assessed using a partial F-test on regression with versus regression without the binaryvariable (which is equivalent to a t-test for the regressioncoefficient of the binary variable), as described by Helseland Hirsch (1991). H0 of this test is formulated as ‘‘thereis no shift between periods’’, or ‘‘regression coefficient forthe binary variable = 0’’.
For covariance analysis the point of time when changeoccurs has to be known. This was determined based onexploratory data analyses and results of previous analysesfor the Okavango Delta as described in the literature. Dou-ble mass plots were also used.
4. Analysis of perceived changes
4.1. 1974–1981 high flow regime of Boro
In earlier analyses, SMEC (1990) have shown that dur-ing 1974–1981 discharges at Maun were larger in relationto the inflow than before and after that period. The hydro-logical models prepared at that time failed to simulate thatrelative increase, and empirical changes in model parame-ters were introduced in order to represent the shift in flooddistribution. SMEC (1990) suggested, that a ‘‘physical’’change occurred in 1974 at headwaters of the Boro, withthe Boro receiving more water at the expense of the
Xudum, and a change in the reverse direction occurred in1981. No human activities could be identified as causingthe change, and SMEC (1990) suggested that it was eitheran effect of tectonic activity or effect of vegetation change.This was criticized by Scudder et al. (1993) who suggestedthat the perceived increase was an apparent effect of dataerrors. Later, Gieske (1997) explained the increased out-flows from the Boro as a response to long term antecedentrainfall variation, but his explanation implicitly suggestedchange in flow distribution. The analyses done by Gieske(1997), Scudder et al. (1993) and SMEC (1990) concen-trated on Maun station, and the eventual effects of redirec-tion of flow towards the Xudum were not tested.
In order to resolve whether the increased outflows fromBoro resulted from a shift of flood between the distributar-ies, the available data from other stations from the Boroand Xudum distributaries were used in this study takingadvantage of the longer time series available. Annual flowsat four stations (two in the Boro and two in the Xudum)were analysed. The annual flows at each of the stationswere related to annual inflow, rainfall, and antecedent con-ditions in multiple regression models. For covariance anal-ysis only models with significant explanatory variableswere chosen (Table 1). Covariance analysis was done to testsignificance of improvements in the regression model byintroducing a binary variable during the period of per-ceived change and the results are presented in Table 2and Fig. 3. The results indicate that the increase in annualflows during the 1974–1981 period is statistically significantat Maun on Boro and at Toteng on Xudum.
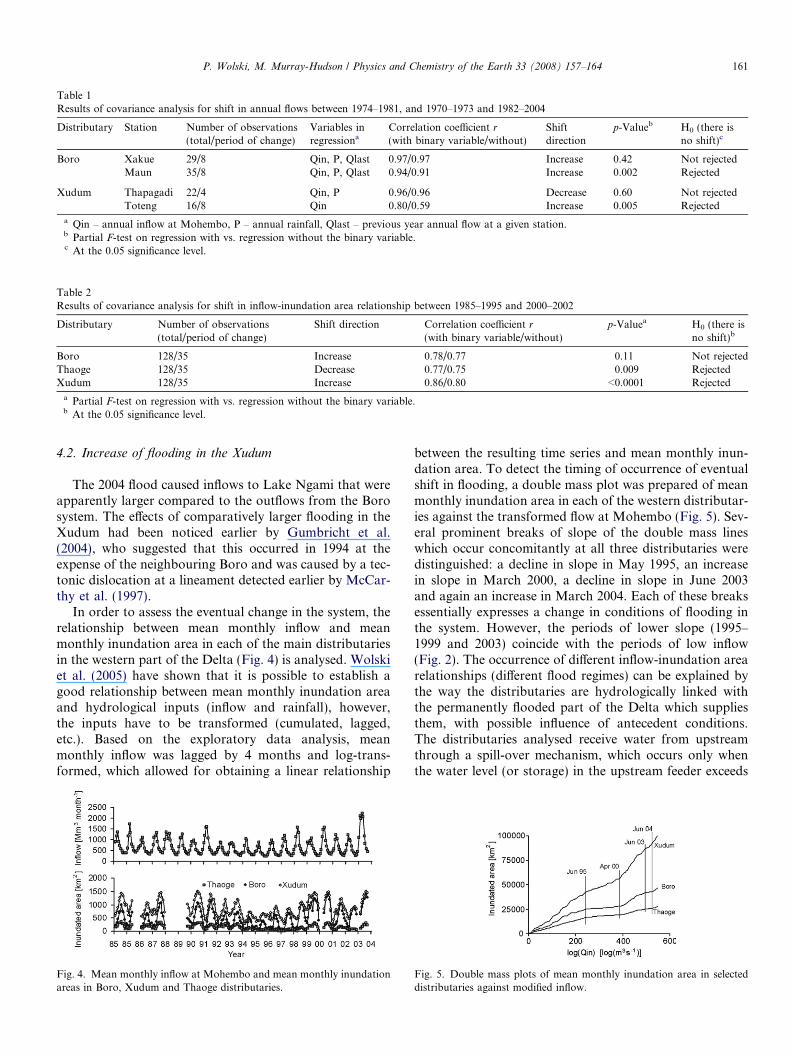
Table 1Results of covariance analysis for shift in annual flows between 1974–1981, and 1970–1973 and 1982–2004
Distributary Station Number of observations(total/period of change)
Variables inregressiona
Correlation coefficient r
(with binary variable/without)Shiftdirection
p-Valueb H0 (there isno shift)c
Boro Xakue 29/8 Qin, P, Qlast 0.97/0.97 Increase 0.42 Not rejectedMaun 35/8 Qin, P, Qlast 0.94/0.91 Increase 0.002 Rejected
Xudum Thapagadi 22/4 Qin, P 0.96/0.96 Decrease 0.60 Not rejectedToteng 16/8 Qin 0.80/0.59 Increase 0.005 Rejected
a Qin – annual inflow at Mohembo, P – annual rainfall, Qlast – previous year annual flow at a given station.b Partial F-test on regression with vs. regression without the binary variable.c At the 0.05 significance level.
Table 2Results of covariance analysis for shift in inflow-inundation area relationship between 1985–1995 and 2000–2002
Distributary Number of observations(total/period of change)
Shift direction Correlation coefficient r
(with binary variable/without)p-Valuea H0 (there is
no shift)b
Boro 128/35 Increase 0.78/0.77 0.11 Not rejectedThaoge 128/35 Decrease 0.77/0.75 0.009 RejectedXudum 128/35 Increase 0.86/0.80 <0.0001 Rejected
a Partial F-test on regression with vs. regression without the binary variable.b At the 0.05 significance level.
P. Wolski, M. Murray-Hudson / Physics and Chemistry of the Earth 33 (2008) 157–164 161
4.2. Increase of flooding in the Xudum
The 2004 flood caused inflows to Lake Ngami that wereapparently larger compared to the outflows from the Borosystem. The effects of comparatively larger flooding in theXudum had been noticed earlier by Gumbricht et al.(2004), who suggested that this occurred in 1994 at theexpense of the neighbouring Boro and was caused by a tec-tonic dislocation at a lineament detected earlier by McCar-thy et al. (1997).
In order to assess the eventual change in the system, therelationship between mean monthly inflow and meanmonthly inundation area in each of the main distributariesin the western part of the Delta (Fig. 4) is analysed. Wolskiet al. (2005) have shown that it is possible to establish agood relationship between mean monthly inundation areaand hydrological inputs (inflow and rainfall), however,the inputs have to be transformed (cumulated, lagged,etc.). Based on the exploratory data analysis, meanmonthly inflow was lagged by 4 months and log-trans-formed, which allowed for obtaining a linear relationship
Fig. 4. Mean monthly inflow at Mohembo and mean monthly inundationareas in Boro, Xudum and Thaoge distributaries.
between the resulting time series and mean monthly inun-dation area. To detect the timing of occurrence of eventualshift in flooding, a double mass plot was prepared of meanmonthly inundation area in each of the western distributar-ies against the transformed flow at Mohembo (Fig. 5). Sev-eral prominent breaks of slope of the double mass lineswhich occur concomitantly at all three distributaries weredistinguished: a decline in slope in May 1995, an increasein slope in March 2000, a decline in slope in June 2003and again an increase in March 2004. Each of these breaksessentially expresses a change in conditions of flooding inthe system. However, the periods of lower slope (1995–1999 and 2003) coincide with the periods of low inflow(Fig. 2). The occurrence of different inflow-inundation arearelationships (different flood regimes) can be explained bythe way the distributaries are hydrologically linked withthe permanently flooded part of the Delta which suppliesthem, with possible influence of antecedent conditions.The distributaries analysed receive water from upstreamthrough a spill-over mechanism, which occurs only whenthe water level (or storage) in the upstream feeder exceeds
Fig. 5. Double mass plots of mean monthly inundation area in selecteddistributaries against modified inflow.

Fig. 6. Relationship between the modified inflow and mean monthly inundation area in Boro, Xudum and Thaoge distributaries for pre-1995 (solid dotsand solid line) and 2000–2003 period (circles and dashed line).
162 P. Wolski, M. Murray-Hudson / Physics and Chemistry of the Earth 33 (2008) 157–164
a certain threshold value. During the low inflow years of1995–1999 as well as in 2003 that threshold was barelyexceeded, which resulted in comparably smaller floodextents in the analysed distributaries. The Xudum probablylinks more directly with the feeding upstream part of theDelta, or the threshold level is lower than that in the Boroand Thaoge, and thus, the decline in flooding in the Xudumwas less pronounced (less prominent decline in slope for1995–2000 shown in Fig. 5) than in the other distributaries.At the arrival of larger floods in 2000 and in 2004, all threedistributaries displayed relatively larger flooding. The effectof the low flood regime of the years 1995–2000 and for2003 is therefore similar in nature to the high flow regimeobserved in the Boro (and the Xudum) in 1974–1981,described in the previous section. In view of this, the even-tual ‘‘physical’’ change in the system, if it occurred, shouldmanifest itself through change in the inflow-inundationarea relationship between hydrologically comparable peri-ods namely pre-1995 and 2000–2002. The summary ofcovariance analysis performed on these time series is pre-sented in Table 2 and Fig. 6. The analysis reveals a statis-tically significant increase in flooding in the Xudum, astatistically significant decrease in flooding in the Thaogeand a lack of change in the Boro. The increase in theXudum flooding is therefore confirmed by the data, andseems to be caused by shift from the Thaoge, and not, asearlier suspected from the Boro. In order to pinpoint thetime of eventual shift, cumulative mean monthly inunda-tion area in the Xudum was plotted against the cumulative
Fig. 7. Double mass plot of mean monthly inundation area in Xudum andThaoge.
mean monthly inundation area in the Thaoge (Fig. 7). Thedistinct change in slope of the line suggests that the shifttook place in July 1997.
5. Discussion
The analysis of flow time series from the Boro andXudum stations revealed that indeed the relative increasein Maun flows observed between 1974 and 1981 was statis-tically significant. However, a similar statistically signifi-cant increase was observed in the Toteng flows. It is not,therefore, possible, that the Boro increase was caused byredirection of some water from the Xudum, as suggestedby Gieske (1997) and SMEC (1990). The onset of the ‘‘highflow regime’’ occurred in 1974 when rainfall of1145 mm a�1 was recorded, which is the highest annualrainfall in record. In a recent hydrological model Wolskiet al. (2006) simulated the effects of rainfall recharge togroundwater. The rise in groundwater levels due to thehigh recharge in 1974 (Fig. 8) caused reduction of infiltra-tion losses and thus an increase in the amount of wateravailable for outflow from the system. The high groundwa-ter table conditions lasted for several years, and caused per-sistence of higher outflows. The effect of increased outflowswas simulated not only in the Boro, but in the entire sys-tem, and thus also in the Xudum. The results of the mod-elling study agree with the relative increase in Toteng
Fig. 8. Shallow groundwater aquifer volume in the distal OkavangoDelta, as simulated by hydrological model of Wolski et al. (2006) (line, V)and mean Maun and Shakawe annual rainfall (bars, P). Period of highgroundwater levels coinciding with Boro River ‘‘high flow regime’’ markedby the bracket.
P. Wolski, M. Murray-Hudson / Physics and Chemistry of the Earth 33 (2008) 157–164 163
outflows detected in this study. However, the methods usedhere did not detect increased flows in the stations in thecentral Delta during the period 1974–1981. These stations,however, do not capture variability associated with off-channel flows, which could be significant, as the 20–30 mwide channels in both the Thapagadi and Xakue arelocated within 500–3000 m wide systems of floodplains.In the Maun and Toteng stations, where the increase wasdetected, the entire flow is measured as flow at these sta-tions is confined in well-defined valleys. The analyses pre-sented by Wolski et al. (2006) reveal strong differences indynamics of channels and distributaries in the Delta, andthus it is likely that the effects of increased flows in the cen-tral part of the system were present, but were simply notrevealed by the existing monitoring network.
In view of the above, it therefore seems that the so-called‘‘high flow regime of Boro’’ is not an effect of change inflood distribution, but results from the high rainfall of1974, and signifies non-linearity in the system.
The strong non-linearity of the system is also revealed inthe analyses of mean monthly inundation area in the wes-tern distributaries of the Okavango Delta. Firstly, there areperiods characterized by different inflow-inundation arearelationship (different flooding regimes), possibly respond-ing to prevalent wetness conditions in the system. Sec-ondly, within such periods, the relationship betweeninundation areas and inflow is non-linear. Thirdly, eachdistributary is characterized by a different inflow-inunda-tion area relationship (as shown indirectly by the differentslopes in Fig. 6). All these factors cause the response of dis-tributaries to changing inputs to be different, giving theappearance of changes in flood distribution. However, wehave detected a statistically significant change in hydrolog-ical responses that appears to result from a physical changein the system. This change has the nature of a shift in flooddistribution between the Thaoge and the Xudum, with thelatter receiving more water after 1997 at the expense of theformer. The reasons for the shift can only be hypothesizedat this stage. No human activity was identified to occur inthe system that could potentially cause the change. It couldtherefore be either an effect of the aggradation process thatcaused the desiccation of Thaoge in the beginning of thecentury and associated change in channel vegetation, or atectonically facilitated redistribution of water. Unfortu-nately, at this stage no independent data exist that canallow determination of causal factors of the shift, and con-firm that the detected change is indeed the effect of physicalchange in the system, and not a transient effect resultingfrom system non-linearity associated with a specificsequence of inputs.
6. Conclusions
The analyses presented here reveal that the hydrologicalresponses of the Okavango Delta are strongly influenced bysystem non-linearity, and real physical changes rarelyoccur. The effects arising from non-linearity are temporary,
while those arising from a physical change are permanent(at least in the management time horizon). Additionally,the non-linear effects are systematic, while the physicalchange is much less so. It is extremely important to distin-guish between these effects, as they have drastically differ-ent management implications. For example, the ‘‘highflow regime’’ of Boro, revealed here as a transient and sys-tematic process, was previously thought to be an essentiallyrandom process (SMEC, 1990). The study by SMEC (1990)was done in the context of designing a reservoir. Obviously,the design parameters of an eventual reservoir would bedifferent depending which explanation of the ‘‘high flowregime’’ is accepted.
The important phenomenon revealed here is that theresponses in the Okavango Delta are not proportional tothe inputs. Long periods occur when flood extents and out-flows are either considerably higher or lower (flow or floodregimes) than what would be expected given the magnitudeof inflow. The situation of smaller flood extent or reducedoutflow is often perceived as an effect of permanent changein the system, and this perception results in unnecessarydemands for interventions into the system and causes con-flicts between the various users (communities, conserva-tionists, safari operators and government departments)who often blame each other for causing the change. Animproved understanding of the non-linearity and persis-tence of hydrological responses in the Okavango Delta istherefore imperative.
A number of comprehensive hydrological models havebeen developed recently for the Okavango Delta (Bauer,2004; Jacobsen et al., 2005; Wolski et al., 2006). Only themodel by Wolski et al. (2006) deals with the presence andpersistence of ‘‘flow regimes’’, although only in respect ofthe 1974–1981 period. Simpler regression models also exist(Gumbricht et al., 2004; McCarthy et al., 1998; Wolskiet al., 2005). These models are linear and do not accountfor possible mechanisms causing flow regimes. The analysispresented here opens up possibilities for improving thesemodels.
References
Bauer, P., 2004. Flooding and salt transport in the Okavango Delta,Botswana: key issues for sustainable wetland management. PhDThesis, ETH Zurich, Zurich, 175 pp.
Burn, D.H., Hag Elnur, M.A., 2002. Detection of hydrologic trends andvariability. Journal of Hydrology 255, 107–122.
Ellery, W.N., Ellery, K., Rogers, K.H., McCarthy, T.S., Walker, B.H.,1993. Vegetation, hydrology and sedimentation processes as determi-nants of channel form and dynamics in the northeastern OkavangoDelta, Botswana. African Journal of Ecology 31 (1), 10–25.
Gieske, A., 1997. Modelling outflow from the Jao/Boro River systemin the Okavango Delta, Botswana. Journal of Hydrology 193, 214–239.
Gumbricht, T., Wolski, P., McCarthy, T.S., 2004. Forecasting the spatialextent of the annual flood in the Okavango Delta, Botswana. Journalof Hydrology 290, 178–191.
Helsel, D.L., Hirsch, R.M., 1991. Statistical methods in water resources.Techniques of Water-Resources Investigations of the USGS, Book 4,Hydrologic Analysis and Interpretation. USGS.
164 P. Wolski, M. Murray-Hudson / Physics and Chemistry of the Earth 33 (2008) 157–164
Iroume, A., Huber, A., Schulz, K., 2005. Summer flows in experimentalcatchments with different forest covers, Chile. Journal of Hydrology300 (1–4), 300–313.
Jacobsen, T., McDonald, A., Enggrob, H., 2005. Integrated HydrologicalModel, Okavango Delta Management Plan. Department of WaterAffairs Gaborone, Botswana.
Kahya, E., Kalayci, S., 2004. Trend analysis of streamflow in Turkey.Journal of Hydrology 289 (1–4), 128–144.
Kundzewicz, Z.W., 2004. Searching for change in hydrological data.Hydrological Sciences Journal/Journal des Sciences Hydrologiques 49(1), 3–6.
Kundzewicz, Z.W., Robson, A.J., 2004. Change detection in hydrologicalrecords – a review of the methodology. Hydrological Sciences Journal/Journal des Sciences Hydrologiques 49 (1), 7–19.
Mazvimavi, D., Wolski, P., 2006. Long-term variations of annual flows ofthe Okavango and Zambezi Rivers. Physics and Chemistry of theEarth 31 (15–16), 944–951.
McCarthy, T.S. et al., 1988. Incremental aggradation on the OkavangoDelta-fan, Botswana. Geomorphology 1 (3), 267–278.
McCarthy, T.S. et al., 1997. The gradient of the Okavango Fan,Botswana, and its sedimentological and tectonic implications. Journalof African Earth Sciences 24 (1–2), 65–78.
McCarthy, J. et al., 2004. Flooding patterns in the Okavango Wetland inBotswana, between 1972 and 2000. Ambio 7, 453–457.
McCarthy, T.S., Ellery, W.N., Stanistreet, I.G., 1992. Avulsion mecha-nisms on the Okavango Fan, Botswana: the control of a fluvial systemby vegetation. Sedimentology 39 (5), 779–795.
McCarthy, T.S., Green, R.W., Franey, N.J., 1993. The influence of neo-tectonics on water dispersal in the northeastern regions of theOkavango swamps, Botswana. Journal of African Earth Sciences 17(1), 23–32.
McCarthy, T.S., Bloem, A., Larkin, P.A., 1998. Observations on thehydrology and geohydrology of the Okavango Delta. South AfricanJournal of Geology 101 (2), 101–117.
McCarthy, T.S., Cooper, G.R.J., Tyson, P.D., Ellery, W.N., 2000.Seasonal flooding in the Okavango Delta, Botswana – recent historyand future prospects. South African Journal of Science 96 (1), 25–33.
Schreider, S.Y. et al., 2002. Detecting changes in streamflow response tochanges in non-climatic catchment conditions: farm dam developmentin the Murray-Darling Basin, Australia. Journal of Hydrology 262 (1–4), 84–98.
Scudder, T., et al., 1993. The IUCN review of the Southern OkavangoIntegrated Water Development Project. IUCN, Gland, Switzerland.
SMEC, 1990. Southern Okavango Integrated Water Development Project.Department of Water Affairs, Gaborone, Botswana.
Wilson, B.H., 1973. Some natural and man-made changes in the channelsof the Okavango Delta. Botswana Notes and Records 5, 132–153.
Wolski, P., Gumbricht, T., McCarthy, T.S., 2002. Assessing future changein the Okavango Delta: the use of a regression model of the maximumannual flood in a Monte Carlo simulation. In: Proceedings of theConference on Environmental Monitoring of Tropical and SubtropicalWetlands, 4–8 December 2002, Maun, Botswana.
Wolski, P., Masaka, L., Raditsebe, L., Murray-Hudson, M., 2005.Aspects of seasonal dynamics of flooding in the Okavango Delta.Botswana Notes and Records 37, 177–195.
Wolski, P., Murray-Hudson, M., Raditsebe, L., 2006. Flooding dynamicsin a large low-gradient alluvial fan, the Okavango Delta from analysisand interpretation of 30-year hydrometric record. Hydrology andEarth System Sciences 3.
Wolski, P., Savenije, H., Murray-Hudson, M., Gumbricht, T., 2006.Modelling of the flooding in the Okavango Delta, Botswana, using ahybrid reservoir-GIS model. Journal of Hydrology 331, 58–72.
Copyright © 2022 FDOKUMEN