Variable effects of labile carbon on the carbon use of different microbial groups in black slate...
14
Variable effects of labile carbon on the carbon use of different microbial groups in black slate degradation Anne-Gret Seifert a , Susan Trumbore a,b , Xiaomei Xu b , Dachung Zhang b , Erika Kothe c , Gerd Gleixner a,⇑ a Max Planck Institute for Biogeochemistry, P.O. Box 10 01 64, 07701 Jena, Germany b Department of Earth System Science, University of California, Irvine, CA 92697-3100, USA c Microbial Phytopathology, Institute of Microbiology, Friedrich Schiller University, Neugasse 25, 07743 Jena, Germany Received 5 March 2010; accepted in revised form 23 December 2010; available online 1 March 2011 Abstract Weathering of ancient organic matter contributes significantly to biogeochemical carbon cycles over geological times. The principle role of microorganisms in this process is well recognized. However, information is lacking on the contribution of individual groups of microorganisms and on the effect of labile carbon sources to the degradation process. Therefore, we investigated the contribution of fungi, Gram-positive and Gram-negative bacteria in the degradation process using a column experiment. Investigations were performed on low metamorphic black slates. All columns contained freshly crushed, sieved (0.63–2 mm), not autoclaved black slates. Two columns were inoculated with the lignite-degrading fungus Schizophyllum com- mune and received a culture medium containing 13 C labeled glucose, two columns received only this culture medium and two control columns received only water. The total mass balance was calculated from all carbon added to the slate and the CO 2 and DOC losses. Phospholipid fatty acids (PLFA) were extracted to investigate microbial communities. We used both the compound specific 14 C and 13 C signal of the PLFA to quantify carbon uptake from black slates and the glucose of the culture medium, respectively. The total carbon loss in these columns exceeded the amount of added carbon by approximately 60%, indicating that black slate carbon has been used. PLFA associated with Gram-positive bacteria dominated the indigenous community and took up 22% of carbon from black slate carbon, whereas PLFA of Gram-negative bacteria used only 8% of carbon from the slates. PLFA of Gram-negative bacteria and fungi were both mostly activated by the glucose addition. The added Schizophyllum did not establish well in the columns and was overgrown by the indigenous microbial community. Our results suggest that espe- cially Gram-positive bacteria are able to live on and degrade black slate material. They also benefit from easy degradable car- bon from the nutrient broth. In natural environments priming due to root exudates might consequently enhance weathering. Ó 2011 Elsevier Ltd. All rights reserved. 1. INTRODUCTION Weathering of ancient organic material, together with the burial of recent organic matter controls the C and O cycle on geological time scales (Berner, 1987; Petsch and Berner, 1998; Bouchez et al., 2010). About 90% of organic matter (OM) (15,000 10 18 g C) resides in shales and other sedimentary rocks (Berner, 1989). Under subsurface condi- tions organic carbon in sedimentary rocks is recalcitrant to degradation, but exposure of this organic material to oxy- genated surfaces can result in OM loss and release of CO 2 . It is estimated that weathering of black shales causes 12% of annual CO 2 flux from oxidative weathering of sed- imentary rocks (Jaffe et al., 2002). Besides abiotic processes (Chang and Berner, 1998, 1999), microorganisms can contribute to weathering of ancient organic material. The uptake of organic carbon by microbes consumes O 2 and releases CO 2 and therefore 0016-7037/$ - see front matter Ó 2011 Elsevier Ltd. All rights reserved. doi:10.1016/j.gca.2011.02.037 ⇑ Corresponding author. Tel.: +49 3641 576172. E-mail address: [email protected] (G. Gleixner). www.elsevier.com/locate/gca Available online at www.sciencedirect.com Geochimica et Cosmochimica Acta 75 (2011) 2557–2570
-
Upload
independent -
Category
Documents
-
view
4 -
download
0
Transcript of Variable effects of labile carbon on the carbon use of different microbial groups in black slate...
Available online at www.sciencedirect.com
www.elsevier.com/locate/gca
Geochimica et Cosmochimica Acta 75 (2011) 2557–2570
Variable effects of labile carbon on the carbon use ofdifferent microbial groups in black slate degradation
Anne-Gret Seifert a, Susan Trumbore a,b, Xiaomei Xu b, Dachung Zhang b,Erika Kothe c, Gerd Gleixner a,⇑
a Max Planck Institute for Biogeochemistry, P.O. Box 10 01 64, 07701 Jena, Germanyb Department of Earth System Science, University of California, Irvine, CA 92697-3100, USA
c Microbial Phytopathology, Institute of Microbiology, Friedrich Schiller University, Neugasse 25, 07743 Jena, Germany
Received 5 March 2010; accepted in revised form 23 December 2010; available online 1 March 2011
Abstract
Weathering of ancient organic matter contributes significantly to biogeochemical carbon cycles over geological times. Theprinciple role of microorganisms in this process is well recognized. However, information is lacking on the contribution ofindividual groups of microorganisms and on the effect of labile carbon sources to the degradation process. Therefore, weinvestigated the contribution of fungi, Gram-positive and Gram-negative bacteria in the degradation process using a columnexperiment. Investigations were performed on low metamorphic black slates. All columns contained freshly crushed, sieved(0.63–2 mm), not autoclaved black slates. Two columns were inoculated with the lignite-degrading fungus Schizophyllum com-
mune and received a culture medium containing 13C labeled glucose, two columns received only this culture medium and twocontrol columns received only water.
The total mass balance was calculated from all carbon added to the slate and the CO2 and DOC losses. Phospholipid fattyacids (PLFA) were extracted to investigate microbial communities. We used both the compound specific 14C and 13C signal ofthe PLFA to quantify carbon uptake from black slates and the glucose of the culture medium, respectively.
The total carbon loss in these columns exceeded the amount of added carbon by approximately 60%, indicating that blackslate carbon has been used. PLFA associated with Gram-positive bacteria dominated the indigenous community and took up22% of carbon from black slate carbon, whereas PLFA of Gram-negative bacteria used only 8% of carbon from the slates.PLFA of Gram-negative bacteria and fungi were both mostly activated by the glucose addition. The added Schizophyllum didnot establish well in the columns and was overgrown by the indigenous microbial community. Our results suggest that espe-cially Gram-positive bacteria are able to live on and degrade black slate material. They also benefit from easy degradable car-bon from the nutrient broth. In natural environments priming due to root exudates might consequently enhance weathering.� 2011 Elsevier Ltd. All rights reserved.
1. INTRODUCTION
Weathering of ancient organic material, together withthe burial of recent organic matter controls the C and Ocycle on geological time scales (Berner, 1987; Petsch andBerner, 1998; Bouchez et al., 2010). About 90% of organicmatter (OM) (15,000 � 1018 g C) resides in shales and other
0016-7037/$ - see front matter � 2011 Elsevier Ltd. All rights reserved.
doi:10.1016/j.gca.2011.02.037
⇑ Corresponding author. Tel.: +49 3641 576172.E-mail address: [email protected] (G. Gleixner).
sedimentary rocks (Berner, 1989). Under subsurface condi-tions organic carbon in sedimentary rocks is recalcitrant todegradation, but exposure of this organic material to oxy-genated surfaces can result in OM loss and release ofCO2. It is estimated that weathering of black shales causes12% of annual CO2 flux from oxidative weathering of sed-imentary rocks (Jaffe et al., 2002).
Besides abiotic processes (Chang and Berner, 1998,1999), microorganisms can contribute to weathering ofancient organic material. The uptake of organic carbonby microbes consumes O2 and releases CO2 and therefore
2558 A.-G. Seifert et al. / Geochimica et Cosmochimica Acta 75 (2011) 2557–2570
has implication on the global atmospheric carbon balance.Degradation of black thermally immature shale organicmatter by microorganisms was first shown by Petsch et al.(2001b), who enriched microbial biomass on cultures con-taining only shale organic matter. Microorganisms growingon these cultures assimilated 74–94% of radiocarbon-freematerial. The uptake of ancient carbon from soils and sed-iments by microorganisms is generally accepted (Rethemey-er et al., 2004; Kramer and Gleixner, 2006; Kuzyakov et al.,2009). However, so far it is not well understood during rockweathering which microbial groups e.g. Gram-positive bac-teria, Gram-negative bacteria or fungi are responsible forthe degradation and how this process can be controlled.
In general, weathering of black shales results in a loss ofaliphatic carbon (Petsch et al., 2001a), whereas aromatic car-bon, which needs stronger oxidative enzymes like peroxi-dases or laccases, remains in the shales. The organic matterof low metamorphic slates contains mainly aromatic com-pounds. With increasing level of biodegradation, however,aromatic compounds are also decomposed (Volkman et al.,1984). This suggests the importance of fungi that producethese enzymes in the degradation process. Evidently, Wengelet al. (2006) demonstrated in a batch experiment that releaseof dissolved organic carbon from slates and charcoal was en-hanced by the activity of the basidiomycete Schizophyllum
commune. In general, S. commune is known to degrade poly-cyclic aromatic hydrocarbons (Matsubara et al., 2006), TNT(Bayman and Radkar, 1997) and textile dyes (Abadulla et al.,2000). Lignolytic fungi like S. commune create extracellularradical producing enzymes with very low substrate specificitythat even degrade complex polymers like lignite and coal un-der aerobic conditions (Hofrichter et al., 1997a,b, 1999).Consequently, the inoculation of shales and slates with S.
commune should increase slate weathering and the uptakeof slate derived carbon. Gram-positive and Gram-negativebacteria are also known to degrade organic macromolecules(Vicuna, 1988; Zimmermann, 1990; Perestelo et al., 1996).Differences between both groups are based on the chemicaland physical properties of their cell walls. Gram-positive bac-teria have a high amount of peptidoglycan and abundant tei-choic acids in their cell walls. Gram-negative bacteria haveonly a thin peptidoglycans layer and no teichonic acids. Acti-nomycetes, which belong to Gram-positive bacteria, are ableto colonize solid surfaces due to their mycelial structure.Many bacterial strains, especially actinomycetes, have beenshown to depolymerise lignin (Ball et al., 1989; Berrocalet al., 1997), but their ability to mineralize lignin is limitedcompared to fungi (Buswell and Odier, 1987; Ball et al.,1989; Godden et al., 1992). Gram-negative bacteria are gen-erally considered to grow fast on easily degradable organicmatter (Burke et al., 2003; Leckie et al., 2004) whereasGram-positive bacteria are more related to soil derived car-bon (Fierer et al., 2003; Kramer and Gleixner, 2008), whichcan contain ancient organic matter (Rethemeyer et al.,2005; Kramer and Gleixner, 2006).
Labile organic substrates like glucose can be used tostimulate microbial activity and to induce so called priming.Priming effects are changes in the turnover of organic mat-ter caused by moderate treatment of the substrate e.g.microorganisms can use more refractory organic carbon
after addition of labile organic matter (Hamer and Marsch-ner, 2002) or they are activated by the added substrate,strongly increase their numbers and finally target moreremaining refractory substrates if labile organic matter iscompletely consumed (De Nobili et al., 2001; Kuzyakovand Bol, 2006). For a review regarding priming effects seeKuzyakov et al. (2000).
Phospholipid fatty acids (PLFA) analyses combinedwith compound specific stable isotope and radiocarbonmeasurements are well established to determine the carbonuptake in microorganisms (Petsch et al., 2001a; Kramer andGleixner, 2006). PLFA are generally used to compare thestructure of microbial communities (Frostegard et al.,1993a,b; Bossio and Scow, 1998). Phospholipids are a ma-jor part of the cell membrane and after cell death they arerapidly degraded. This ensures that only viable microorgan-isms are investigated (White et al., 1979; Tunlid and White,1992). Due to differences in chemical structure, some PLFAcan be indicative of specific microbial groups like bacteriaor fungi (Zelles, 1997, 1999; Baath and Anderson, 2003).Branched chain (br) fatty acids generally are associatedwith Gram-positive bacteria (Lechevalier and Lechevalier,1988; Zelles, 1997), Gram-negative bacteria are character-ized by having monounsaturated fatty acids (MUFA)(Zelles, 1997) and the polyunsaturated fatty acid (PUFA)18:2x6,9 is a marker for fungi (Frostegard and Baath,1996). Straight chain saturated fatty acids are equally dis-tributed among groups (Zelles, 1997). Additionally, 13Clabeling (Pombo et al., 2002; Abraham and Hesse, 2003;Kramer and Gleixner, 2006) or the use of natural 13C sig-nals of carbon substrates is a common method to determinecarbon sources of microorganisms.
14C decays with a half-life of 5730 years. Organic materialolder than�60,000 years contains no detectable 14C. Carbonof black slate consequently is radiocarbon free and makesthis carbon pool fossil. If any radiocarbon free material isincorporated by microbes, this will be directly reflected bythe 14C content of PLFA (Rethemeyer et al., 2005; Slateret al., 2006; Kramer and Gleixner, 2006). With the natural13C and 14C labeling we can discriminate between the effectsglucose has on microbial growth and to which extent micro-bial groups are able to assimilate black slate organic matter.
The study aims to answer the following questions:
1. What are the relative roles of fungi, Gram-positive andGram-negative bacteria in black slate degradation?
2. Can the inoculation with lignite-degrading fungienhance the degradation of black slate?
3. Does priming with glucose enhance microbialweathering?
2. METHODS
2.1. Site description and sampling
Black slate material was taken from a mining wastedump in Schmiedefeld/Thuringian Forest (50�320 N,11�120 E) with an age of approximately 50 yrs. The areawas a former mining district, where alum, vitriol of iron-
Microbial use of black slate carbon 2559
and copper, sulfur and earth colors were produced. Blackslates from the lower graptolite shale formation (LowerSilurian age) outcrop in Variscan deformed anticlines ofEast and South Thuringia, Germany. Slates are low-grademetamorphic rocks that form from shale under pressureat temperatures of a few hundred degrees. It consists be-sides organic carbon of illite, illite–smectite, chlorite,muscovite, quartz, pyrite/marcasite and minor amounts ofopaline silica and phosphates and carbonates. Coalificationvaries between vitrinite reflectance <3% and >6% Rm(Kunert, 1999). Dark-colored unweathered slates containa wide range (6–23% of Corg) whereas the strongly weath-ered (light-colored) slates contain a much lower range andorganic matter content (0.2–2% of Corg) (Fischer et al.,2009). Slates used in our experiment were dark gray andcontained 2.7% organic carbon. Pyrolysis experiments haveindicated that the black slate organic matter consists mainlyof non-pyrolysable material and contains only minor por-tions of pyrolysable material (Fischer et al., 2009). Thesmall low-temperature signal was caused by molecules con-taining CH3 groups (bitumen fraction, 80–300 �C) and theCO2 release between 300 and 800 �C results from the pres-ence of carboxylic groups in the kerogen macromolecule.
Untreated black slate material was sieved to sand sizebetween 0.63 and 2 mm to create a well-aerated pore space.During sieving coarse roots, plant and animal residualswere extracted by hand. Thus, not all modern carbon couldbe removed as can be seen from 14C values of black slate(see Section 3.5). Plant material can be either too small topick out by hand or plant-derived DOC can be adsorbedon the slate surfaces.
Black slate carbon content was measured from ball-milled subsamples by elemental analysis before incubation(Elementaranalysator vario Max CN, Elementar Analysen-systeme GmbH, Hanau, Germany).
2.2. Microorganisms and growth conditions
S. commune was obtained from the strain collectionsat the Institute of Microbiology, University of Jena.S. commune (strain 4–40) was cultured on minimal mediumagar plates (20 g/l glucose, 2 g/l asparagine, 1 g/l K2HPO4,0.5 g/l KH2PO4, 0.5 g/l MgSO4�7H2O, 100 ll/l thiaminedichloride, 15 g/l agar). Pre-grown cultures were made from1cm2 of S. commune that was added to 300 ml of a liquidminimal medium. The flasks were shaken for 7 days with140 rpm at 28 �C. The pre-cultures were centrifuged at4000 rpm and washed twice with sterile distilled water.20 ml of microbial suspension (approximately 1 g microbialbiomass) was added to 200 ml of a medium containing 10 g/l glucose, 0.5 g/l asparagine, 0.5 g/l K2HPO4, 0.25 g/lKH2PO4, 0.2 g/l MgSO4�7H2O, 0.01 g/l FeSO4�7H2O,100 ll thiamine dichloride (column medium). The pH wasadjusted to 6.3 with 5 N NaOH. Two hundred millilitersof medium per column was used for inoculation.
2.3. Column setup
The columns contained 1.5 kg (wet weight) of non-auto-claved black slate material with a grain size of 0.63 to
2 mm. Columns were made of PVC 30 cm high and had adiameter of 10 cm. Columns were mounted on buchner-funnels (Brand, Germany) filled with Teflon filter material(Stockhausen, Germany) with a pore size of 70 lm. Twocolumns were inoculated with fungus S. commune usingthe column medium described above, two columns receivedonly the column medium and two control columns receivedonly sterile deionised water (Fig. 1). After initial feedingand inoculation, only sterile deionised water was added tothe columns except on day 122, when 200 ml of the columnmedium but without glucose was added. The additionproved that no nutrient limitation was present. Columnswere watered with sterile deionised water through the upperpart every four to five days when the water content droppedbelow 20%. The water content was adjusted to about20–25% to avoid drying and allow oxic conditions. Wateroutflow only occurred when new water was supplied. Thewater content was monitored with Theta probes (TypeML2X, Cambridge, England) connected to a data logger(Campbell Scientific, Inc., USA) and evaluated by thedatalogger support software ‘PC208W’ (Campbell Scien-tific, Inc., USA). The columns were incubated for 183 daysin climate chambers at 28 �C and 60% air humidity indarkness.
2.4. Total carbon loss from the columns
The carbon loss was calculated from gaseous and liquidcarbon. CO2 efflux was measured to determine microbialrespiration. For CO2 measurements, the Vaisala-SensorGMP343 (measurement range 0–4000 ppm, accuracy 2%)(Vaisala, Finland) was installed in a headspace-chamber(PVC, 16.5 cm high, dia 10 cm) which could be attachedto the columns. Inside the headspace, a fan was used to en-sure mixing of the air. CO2 efflux was calculated as concen-tration increase with time in an isolated volume. The sensormakes approximately one measurement per second and wasmounted on the columns for around 10 min. Results weresent to the post-processing program ‘RS232Log’ (Jena,Germany). Linear regression on the set of measurementswas used to determine the emission rate. CO2 measure-ments were performed on days 1, 2, 3, 4, 6, 8, 10, 12, 15,18, 22, 25, 31, 37, 44, 51, 74, 93, 114, 122, 124, 152, 183.The total CO2 efflux during the 183 day period was esti-mated from a potential fit to the data of daily measure-ments, except for the control columns, where no trend inthe results was observed and consequently all daily mea-surements were averaged.
The effluent was collected and analyzed for dissolved or-ganic carbon (DOC) and glucose content from the medium.After sampling, the effluent was filtered through membranefilters with a pore size of 0.45 lm. Aqueous samples weretaken on days 3, 8, 19, 39, 84 and 141. DOC was deter-mined using a high TOC analyzer (detection limit 0.5 mg/l, precision for samples between 0.5 and 10 mg/L C < 5%)(Elementar Analysensysteme GmbH, Hanau, Germany).Glucose content was measured with the ion chromatographICS-3000 (Dionex, Sunnyvale, USA). To determine theamount of carbon that was produced the total carbon lossfrom the columns was calculated using following equation:
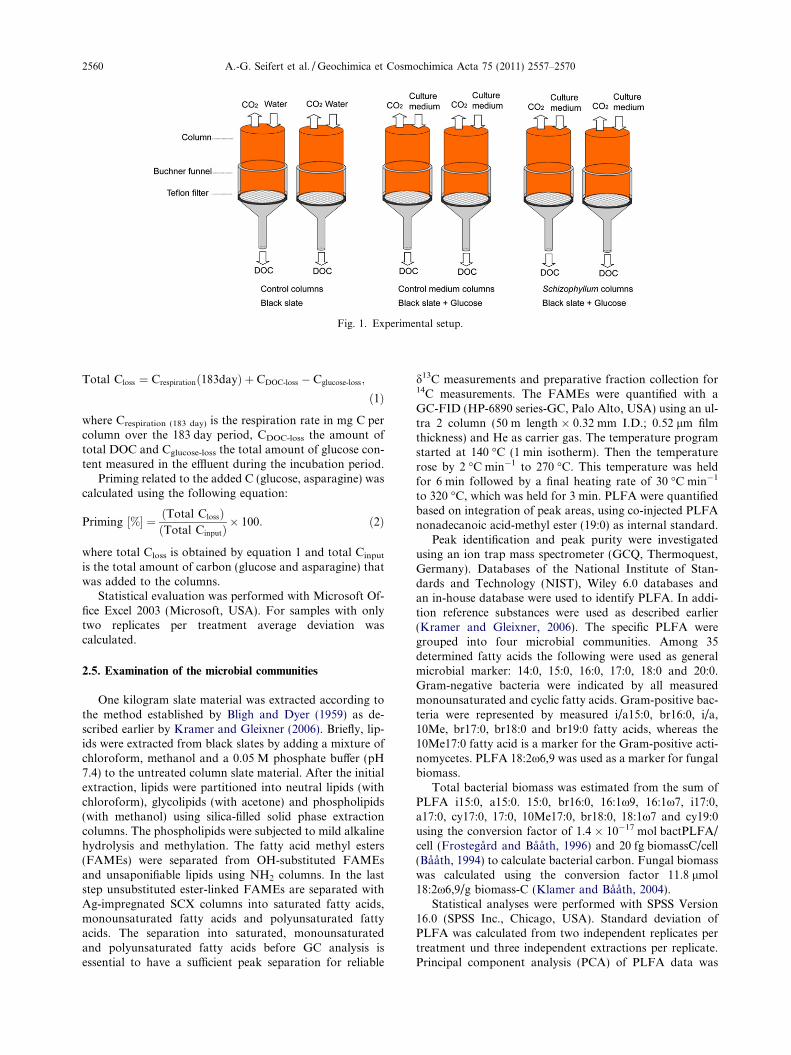
Fig. 1. Experimental setup.
2560 A.-G. Seifert et al. / Geochimica et Cosmochimica Acta 75 (2011) 2557–2570
Total Closs ¼ Crespirationð183dayÞ þ CDOC-loss � Cglucose-loss;
ð1Þ
where Crespiration (183 day) is the respiration rate in mg C percolumn over the 183 day period, CDOC-loss the amount oftotal DOC and Cglucose-loss the total amount of glucose con-tent measured in the effluent during the incubation period.
Priming related to the added C (glucose, asparagine) wascalculated using the following equation:
Priming ½%� ¼ ðTotal ClossÞðTotal CinputÞ
� 100: ð2Þ
where total Closs is obtained by equation 1 and total Cinput
is the total amount of carbon (glucose and asparagine) thatwas added to the columns.
Statistical evaluation was performed with Microsoft Of-fice Excel 2003 (Microsoft, USA). For samples with onlytwo replicates per treatment average deviation wascalculated.
2.5. Examination of the microbial communities
One kilogram slate material was extracted according tothe method established by Bligh and Dyer (1959) as de-scribed earlier by Kramer and Gleixner (2006). Briefly, lip-ids were extracted from black slates by adding a mixture ofchloroform, methanol and a 0.05 M phosphate buffer (pH7.4) to the untreated column slate material. After the initialextraction, lipids were partitioned into neutral lipids (withchloroform), glycolipids (with acetone) and phospholipids(with methanol) using silica-filled solid phase extractioncolumns. The phospholipids were subjected to mild alkalinehydrolysis and methylation. The fatty acid methyl esters(FAMEs) were separated from OH-substituted FAMEsand unsaponifiable lipids using NH2 columns. In the laststep unsubstituted ester-linked FAMEs are separated withAg-impregnated SCX columns into saturated fatty acids,monounsaturated fatty acids and polyunsaturated fattyacids. The separation into saturated, monounsaturatedand polyunsaturated fatty acids before GC analysis isessential to have a sufficient peak separation for reliable
d13C measurements and preparative fraction collection for14C measurements. The FAMEs were quantified with aGC-FID (HP-6890 series-GC, Palo Alto, USA) using an ul-tra 2 column (50 m length � 0.32 mm I.D.; 0.52 lm filmthickness) and He as carrier gas. The temperature programstarted at 140 �C (1 min isotherm). Then the temperaturerose by 2 �C min�1 to 270 �C. This temperature was heldfor 6 min followed by a final heating rate of 30 �C min�1
to 320 �C, which was held for 3 min. PLFA were quantifiedbased on integration of peak areas, using co-injected PLFAnonadecanoic acid-methyl ester (19:0) as internal standard.
Peak identification and peak purity were investigatedusing an ion trap mass spectrometer (GCQ, Thermoquest,Germany). Databases of the National Institute of Stan-dards and Technology (NIST), Wiley 6.0 databases andan in-house database were used to identify PLFA. In addi-tion reference substances were used as described earlier(Kramer and Gleixner, 2006). The specific PLFA weregrouped into four microbial communities. Among 35determined fatty acids the following were used as generalmicrobial marker: 14:0, 15:0, 16:0, 17:0, 18:0 and 20:0.Gram-negative bacteria were indicated by all measuredmonounsaturated and cyclic fatty acids. Gram-positive bac-teria were represented by measured i/a15:0, br16:0, i/a,10Me, br17:0, br18:0 and br19:0 fatty acids, whereas the10Me17:0 fatty acid is a marker for the Gram-positive acti-nomycetes. PLFA 18:2x6,9 was used as a marker for fungalbiomass.
Total bacterial biomass was estimated from the sum ofPLFA i15:0, a15:0. 15:0, br16:0, 16:1x9, 16:1x7, i17:0,a17:0, cy17:0, 17:0, 10Me17:0, br18:0, 18:1x7 and cy19:0using the conversion factor of 1.4 � 10�17 mol bactPLFA/cell (Frostegard and Baath, 1996) and 20 fg biomassC/cell(Baath, 1994) to calculate bacterial carbon. Fungal biomasswas calculated using the conversion factor 11.8 lmol18:2x6,9/g biomass-C (Klamer and Baath, 2004).
Statistical analyses were performed with SPSS Version16.0 (SPSS Inc., Chicago, USA). Standard deviation ofPLFA was calculated from two independent replicates pertreatment und three independent extractions per replicate.Principal component analysis (PCA) of PLFA data was
Microbial use of black slate carbon 2561
carried out to investigate treatment effects. Significantdifferences of means for microbial groups in the differenttreatments were judged by analysis of variance (ANOVA)and Tukey’s test.
2.6. Stable isotope measurements
The d13C values of black slates and glucose were deter-mined by an elemental analyser (EA 1110, CE Instruments,Milan, Italy) coupled to an isotope ratio mass spectrome-ter (IRMS) (DELTAplusXL, Finnigan MAT, Bremen,Germany). Solid samples were weighted according to thecarbon content into tin capsules (1 mg black slate,0.11 mg glucose) and combusted in an oxygen stream at1150 �C. The d13C values were determined on evolvedCO2, which was transferred to the IRMS. Standard devia-tion for analytical uncertainties of bulk samples was 0.22&.
Compound specific determination of d13C values of indi-vidual FAME was performed by an IRMS (DELTAplusXL,Finnigan MAT, Germany). Column and temperature pro-grams were the same as described above for PLFA mea-surements. All d13C values are averages of threemeasurements. Results were corrected for the methylatingreagent (Kramer and Gleixner, 2006). Isotope ratios are ex-pressed as d13C in per mill [&]. Values are relative to thereference standard V-PDB using NBS 22 (Coplen et al.,2006). The median for standard deviation of d13C valuesof PLFA is about �0.5 and ranged between �0.04 and �2.
The contribution of glucose derived carbon in percentwas calculated based on the isotopic shift (d13C values) be-tween microbial PLFA of the different treatments relativeto the isotopic difference of glucose and black slate by thefollowing equation (Eq. (3)) (Gleixner et al., 2002; Kramerand Gleixner, 2006):
Glucose uptake ½%� ¼ ðd13CPLFA medium�fed columns � d13CPLFA control columnsÞ
ðd13Cglucose � d13Cblack slateÞ� 100
ð3Þwhereas d13CPLFA_medium fed columns is the isotope ratio ofthe phospholipid fatty acid obtained from these columns,d13CPLFA_control columns the isotope ratio of the phospholipidfatty acid from the control columns, d13Cglucose that of glu-cose added to the columns and d13Cblack slate that of blackslate used in the experiment. Due to fractionation in d13Cin different lipids the PLFA of the different treatments haveto be used in the enumerator.
2.7. Bulk and compound specific 14C measurements
14C content of black slate material and glucose were mea-sured at the Max Planck Institute for Biogeochemistry inJena with accelerator mass spectroscopy 3MV AMS (HighVoltage Engineering Europe) (Steinhof et al., 2004). Approx-imately 1 mg carbon per sample was weighted into tin cap-sules and combusted by an elemental analyzer (EA/NA1110 NC 2500, Thermo Quest Italia S.p.A., Italy). TheCO2 evolved during dry combustion was reduced to graphiteby heating H2 and CO2 in the presence of iron powder at650 �C. The graphite was pressed into targets and measured
with the AMS. Detection limit is about 0.2pMC (percentmodern carbon). Standard deviation is based on either statis-tical error of all measurements or on standard deviation ofseveral runs of black slate and glucose sample.
14C measurements of FAME were performed at UC Ir-vine KCCAMS laboratory (Southon and Santos, 2004). Weneeded between 10 and 30 lg of carbon for the radiocarbonmeasurement, so we injected known 14C FAME standardsinto the preparative capillary gas chromatograph (PCGC)and trapped and processed them as we did our samples todetermine corrections for contamination during purifica-tion procedures (data not shown). Other tests were usedto determine corrections for the sample combustion andgraphitization procedures (Santos et al., 2007a; Krameret al., 2010). Since these corrections are size dependent,we used different numbers of injections to obtain differentamounts of our standard PLFA (approximately 10, 20,30 lg). We measured the 14C content of individual FAME(16:0, microbial marker) and grouped FAME (i/a, 10Me17:0 – Gram-positive marker and 16:1x9, 17:1 (1,2,3),18:1x9, 18:1x7 – Gram-negative marker) extracted and iso-lated from the column experiment. FAME used for 14Canalysis are composites made from the two column repli-cates. We had to combine compounds from Gram-positiveand Gram-negative marker to get enough carbon to mea-sure 14C. Compounds combined for 14C measurements wereco-eluted into the same trap. FAME were separated using aGC (Agilent-6890 series GC, Agilent Technologies, SantaClara, USA) coupled to a preparative fraction collector(PFC) (Gerstel, Germany). The column used was a DB-5 ms (30 m length � 0.53 mm I.D.; 0.5 lm film thickness)with ultrapure helium as carrier gas. The initial temperaturewas 140 �C (1 min isotherm). Then temperature rose by5 �C min�1 to 220 �C, followed by a heating rate of2 �C min�1 to 230 �C and a final heating rate of20 �C min�1 to 320 �C, held for 3 min. The reisolated sam-ples were quantified with the GC-FID using the same col-umn and temperature program as described above.
Isolated compounds were dried and placed into combus-tion tubes. Combustion and graphitization of FAME wasperformed at the UCI Keck Carbon Cycle AMS facility(Santos et al., 2007a, 2007b). In the first step, carbon dioxidewas produced by combustion at 550 �C in evacuated quartztubes in the presence of CuO and silver wire. CO2 was re-duced to graphite with hydrogen over pre-baked iron powderat 450 �C for samples <30 lg and at 550 �C for samples�1 mg. Graphite was pressed into targets and mounted onwheels for 14C analysis. The 14C signal of the FAME hadto be corrected for the single carbon atom added to each mol-ecule during derivatisation (Kramer and Gleixner, 2006).
14C data are expressed in percent fraction modern car-bon (FMC) relative to the 14C activity of the oxalic acidstandard and corrected to d13C of �25& using values mea-sured in AMS.
The carbon used in the medium-fed columns can be as-sumed to be mixtures of two endmembers clearly distin-guished by their d13C and D14C values. The first endmemberis glucose (d13C = �11.1&, 14C = 1.6074 FMC). The secondendmember represents black slate carbon (d13C = �28.8&,14C = 0.079 FMC). Based on the differences in 14C values

2562 A.-G. Seifert et al. / Geochimica et Cosmochimica Acta 75 (2011) 2557–2570
between microbial PLFA using glucose and black slate it waspossible to calculate the proportion of black slate derived car-bon in the microbial PLFA (Eq. (4)). The contribution ofblack slate derived carbon in percent was calculated basedon the isotopic shift (D14C values) between microbial PLFAfrom treatments fed with the culture medium and modern14C values relative to the isotopic difference of glucose andblack slate using the following equation.
Black slate uptake ½%� ¼ ðd14CPLFA medium�fed columns � d14CglucoseÞ
ðd14Cblack slate � d14glucoseÞ
� 100
ð4Þwhereas 14CPLFA_medium fed columns is the 14C content of thespecific phospholipid fatty acid, 14Cglucose the 14C content ofthe glucose used and 14Cblack slate the 14C content of theblack slate. Because we have no data for PLFA receivedonly a modern carbon source the 14C value of glucosewas used in the enumerator. Values were used in fractionmodern carbon (FMC).
3. RESULTS
3.1. Respiration measurements
Respiration rates in the columns differed considerablybetween columns that obtained a culture medium and con-trol columns that only received water (Table 1). The respi-ration rates in control columns with water varied between0.23 and 3.29 mg C-CO2 d�1, which resulted in an averagedcarbon flux of 258.1 mg C-CO2 over the 183 day period(Fig. 2). Initial CO2 effluxes of up to 277 mg C-CO2
(±41) were measured in the medium-fed columns (con-trol-medium and Schizophyllum). These values strongly de-creased until day 12 and declined further over the next threeweeks and finally stabilized from day 37 to a constant med-ian value of 3.8 mg C-CO2 in both control-medium col-umns and 2.9 and 3.1 mg C-CO2 in the Schizophyllum
Table 1Mass balance and microbial parameters from the column experiment.
Control
Total Cadded [mg C] 0Cglc loss 0Respiration [mg C] 258 (53)DOC loss [mg C] 0DOC-Cglc loss [mg C] 2 (0.3)Total carbon loss [mg C] 260 (52)Priming [%] related to controlsPriming [%] related to Cadded
PLFA [ng g�1 dw] 270 (13)Bacterial cells g�1 dw 4.0 � 107 (2.6 �Bacterial carbon lg g�1 dw 0.8 (0)Fungal carbon lg g�1 dw 0.9 (0.1)metabolic quotient [mg C-CO2 h�1/g microbialcarbon)
24 (2.6)
Average deviation based on column replicates in parentheses; dw, dry w
columns (Fig. 2). The total respiration was almost identicalfrom all medium-fed columns and summed up in the183 day period to 1270.1 mg C-CO2 (±108.9) in the con-trol-medium columns and to 1176.9 mg C-CO2 (±87.5) inthe Schizophyllum columns. Thus, inoculation with fungidid not affect respiration rates. After the additional nutrientfeeding (without glucose) 122 days after the start of theexperiment, the amount of respired carbon from all med-ium-fed columns increased in relation to the median valuesshortly to values between 24.9 mg C-CO2 d�1 (control-med-ium 2) and 30.2 mg C-CO2 d�1 (control-medium 1), but de-clined to former magnitudes two days later indicating thatno mineral limitation was present.
3.2. Liquid carbon loss
Treatment with a growth medium strongly affected theDOC loss from the columns. Control columns lost only2.1 mg DOC (±0.2) and no glucose was measured in theeffluent, while control medium columns lost 118 mg DOC(±26) and Schizophyllum columns 220 mg DOC (±14)and both also lost glucose. Therefore, DOC exports werecorrected for the glucose loss. The corrected DOC loss overthe 183 day period was highest from the Schizophyllum col-umns (122 mg C ± 5.1). It was about 50 mg C larger than inthe control-medium columns (74 mg C ± 0.8, Table 1)
3.3. Microbial communities
Total amount of PLFA depended strongly on carbon andnutrient supply from the medium. The PLFA concentrationwas lowest in the control columns (270 ng PLFA g�1 dw,±13, Table 1). The detected amounts represent the indige-nous microflora of the non-sterile, surface-sampled blackslates. Feeding of the columns with a culture mediumresulted in considerable higher amounts of PLFA, whereasonly minor differences were observed between both med-ium-fed treatments. PLFA concentrations were 1387(±38) ng PLFA g�1 dw in the control-medium columns
Control-medium
Schizophyllum
836 83644 (26) 98 (19)1270 (109) 1177 (88)118 (26) 220 (14)74 (0.8) 122 (5)1344 (108) 1299 (93)212 (32) 216 (28)161 (10) 155 (9)1387 (38) 1218 (80)
106) 1.8 � 108 (2.5 � 106) 1.7 � 108 (1.0 � 106)3.7 (0.1) 3.3 (0.2)11.7 (1.6) 5.8 (0.8)39 (0.8) 67 (1.4)
eight
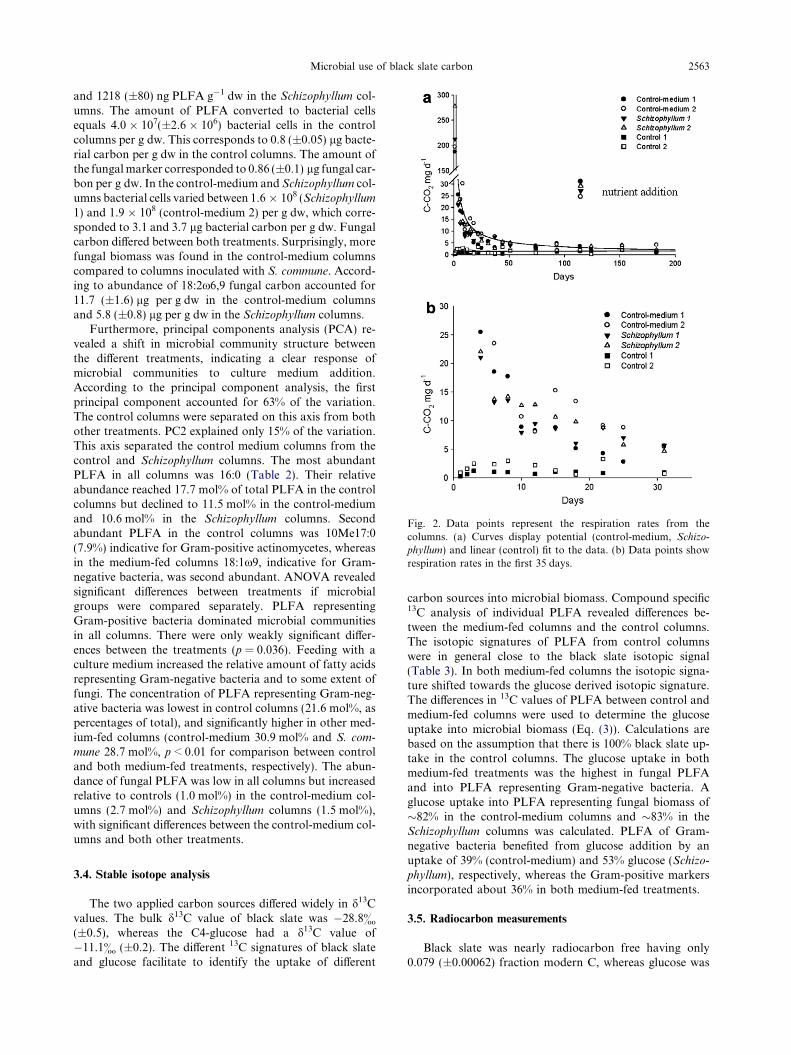
Fig. 2. Data points represent the respiration rates from thecolumns. (a) Curves display potential (control-medium, Schizo-
phyllum) and linear (control) fit to the data. (b) Data points showrespiration rates in the first 35 days.
Microbial use of black slate carbon 2563
and 1218 (±80) ng PLFA g�1 dw in the Schizophyllum col-umns. The amount of PLFA converted to bacterial cellsequals 4.0 � 107(±2.6 � 106) bacterial cells in the controlcolumns per g dw. This corresponds to 0.8 (±0.05) lg bacte-rial carbon per g dw in the control columns. The amount ofthe fungal marker corresponded to 0.86 (±0.1) lg fungal car-bon per g dw. In the control-medium and Schizophyllum col-umns bacterial cells varied between 1.6 � 108 (Schizophyllum
1) and 1.9 � 108 (control-medium 2) per g dw, which corre-sponded to 3.1 and 3.7 lg bacterial carbon per g dw. Fungalcarbon differed between both treatments. Surprisingly, morefungal biomass was found in the control-medium columnscompared to columns inoculated with S. commune. Accord-ing to abundance of 18:2x6,9 fungal carbon accounted for11.7 (±1.6) lg per g dw in the control-medium columnsand 5.8 (±0.8) lg per g dw in the Schizophyllum columns.
Furthermore, principal components analysis (PCA) re-vealed a shift in microbial community structure betweenthe different treatments, indicating a clear response ofmicrobial communities to culture medium addition.According to the principal component analysis, the firstprincipal component accounted for 63% of the variation.The control columns were separated on this axis from bothother treatments. PC2 explained only 15% of the variation.This axis separated the control medium columns from thecontrol and Schizophyllum columns. The most abundantPLFA in all columns was 16:0 (Table 2). Their relativeabundance reached 17.7 mol% of total PLFA in the controlcolumns but declined to 11.5 mol% in the control-mediumand 10.6 mol% in the Schizophyllum columns. Secondabundant PLFA in the control columns was 10Me17:0(7.9%) indicative for Gram-positive actinomycetes, whereasin the medium-fed columns 18:1x9, indicative for Gram-negative bacteria, was second abundant. ANOVA revealedsignificant differences between treatments if microbialgroups were compared separately. PLFA representingGram-positive bacteria dominated microbial communitiesin all columns. There were only weakly significant differ-ences between the treatments (p = 0.036). Feeding with aculture medium increased the relative amount of fatty acidsrepresenting Gram-negative bacteria and to some extent offungi. The concentration of PLFA representing Gram-neg-ative bacteria was lowest in control columns (21.6 mol%, aspercentages of total), and significantly higher in other med-ium-fed columns (control-medium 30.9 mol% and S. com-
mune 28.7 mol%, p < 0.01 for comparison between controland both medium-fed treatments, respectively). The abun-dance of fungal PLFA was low in all columns but increasedrelative to controls (1.0 mol%) in the control-medium col-umns (2.7 mol%) and Schizophyllum columns (1.5 mol%),with significant differences between the control-medium col-umns and both other treatments.
3.4. Stable isotope analysis
The two applied carbon sources differed widely in d13Cvalues. The bulk d13C value of black slate was �28.8&
(±0.5), whereas the C4-glucose had a d13C value of�11.1& (±0.2). The different 13C signatures of black slateand glucose facilitate to identify the uptake of different
carbon sources into microbial biomass. Compound specific13C analysis of individual PLFA revealed differences be-tween the medium-fed columns and the control columns.The isotopic signatures of PLFA from control columnswere in general close to the black slate isotopic signal(Table 3). In both medium-fed columns the isotopic signa-ture shifted towards the glucose derived isotopic signature.The differences in 13C values of PLFA between control andmedium-fed columns were used to determine the glucoseuptake into microbial biomass (Eq. (3)). Calculations arebased on the assumption that there is 100% black slate up-take in the control columns. The glucose uptake in bothmedium-fed treatments was the highest in fungal PLFAand into PLFA representing Gram-negative bacteria. Aglucose uptake into PLFA representing fungal biomass of�82% in the control-medium columns and �83% in theSchizophyllum columns was calculated. PLFA of Gram-negative bacteria benefited from glucose addition by anuptake of 39% (control-medium) and 53% glucose (Schizo-
phyllum), respectively, whereas the Gram-positive markersincorporated about 36% in both medium-fed treatments.
3.5. Radiocarbon measurements
Black slate was nearly radiocarbon free having only0.079 (±0.00062) fraction modern C, whereas glucose was

Table 2Amounts of identified PLFA of all treatments after incubation period in mol% g�1 dw (dry weight). Standard deviation in parentheses.Standard deviation is calculated from two replicates per treatment and three individual extractions per replicate.
Control Control medium Schizophyllum
14:0 Microbes 2.38 (0.30) 1.87 (0.12) 1.90 (0.11)15:0 Microbes 1.26 (0.16) 1.27 (0.13) 1.27 (0.13)16:0 Microbes 17.71 (0.41) 11.47 (0.71) 10.59 (0.71)17:0 Microbes 1.31 (0.18) 1.32 (0.11) 1.26 (0.13)18:0 Microbes 3.54 (0.22) 2.94 (0.14) 2.87 (0.04)20:0 Microbes 1.16 (0.22) 1.00 (0.07) 1.05 (0.13)i15:0 Bacteria (G+) 5.32 (0.37) 4.56 (0.34) 5.27 (0.30)a15:0 Bacteria (G+) 4.07 (0.58) 4.23 (0.25) 5.88 (0.16)br16:0 Bacteria (G+) 5.30 (0.42) 5.37 (0.31) 5.76 (0.19)br16:0 Bacteria (G+) 1.22 (0.10) 1.26 (0.18)10Me17:0 Bacteria (G+) 7.92 (1.22) 5.64 (0.34) 4.93 (0.15)br17:0 Bacteria (G+) 2.01 (0.05) 1.33 (0.07) 1.22 (0.14)i17:0 Bacteria (G+) 6.06 (0.16) 6.06 (0.39) 5.96 (0.22)br17:0 Bacteria (G+) 2.54 (0.22) 3.82 (0.21) 4.36 (0.19)a17:0 Bacteria (G+) 5.02 (0.13) 4.68 (0.42) 4.72 (0.34)br17:0 Bacteria (G+) 4.80 (0.45) 2.54 (0.25) 2.41 (0.05)br18:0 Bacteria (G+) 0.69 (0.09) 0.96 (0.08) 1.03 (0.14)br18:0 Bacteria (G+) 1.11 (0.20) 1.82 (0.11) 1.87 (0.09)br19:0 Bacteria (G+) 4.20 (0.15) 2.09 (0.13) 1.89 (0.08)br19:0 Bacteria (G+) 0.47 (0.07) 1.33 (0.11) 1.39 (0.12)br19:0 Bacteria (G+) 0.49 (0.09) 1.33 (0.06) 1.59 (0.10)cy19:0 Bacteria (G�) 1.95 (0.25) 1.53 (0.07) 1.41 (0.10)cy19:0 Bacteria (G�) 6.25 (0.74) 3.99 (0.30) 4.97 (0.22)15:1 Bacteria (G�) 0.67 (0.05) 1.34 (0.07) 1.23 (0.13)16:1 Bacteria (G�) 1.29 (0.09) 1.19 (0.13)16:1x9 Bacteria (G�) 2.87 (0.39) 2.94 (0.36) 2.64 (0.13)16:1x7 Bacteria (G�) 1.78 (0.20) 2.32 (0.21) 2.51 (0.12)16:1 Bacteria (G�) 1.38 (0.08)17:1 Bacteria (G�) 0.96 (0.06) 1.73 (0.09) 2.09 (0.14)17:1 Bacteria (G�) 0.87 (0.07) 1.36 (0.05) 1.35 (0.14)17:1 Bacteria (G�) 0.81 (0.07) 1.03 (0.07) 0.79 (0.39)18:1x9 Bacteria (G�) 3.96 (0.41) 8.59 (1.75) 7.53 (0.76)18:1x7 Bacteria (G�) 1.48 (0.17) 1.71 (0.11) 1.97 (0.10)20:1 Bacteria (G�) 1.64 (0.11) 1.02 (0.11)18:2x6,9 Fungi 1.02 (0.27) 2.69 (0.91) 1.52 (0.32)
Sum Microbes 27.35 (0.62) 19.86 (1.17) 18.94 (0.47)Gram (+) 50.03 (1.94) 46.98 (2.36) 49.54 (1.14)Gram (�) 21.60 (1.60) 30.85 (2.92) 28.69 (0.97)Fungi 1.02 (0.27) 2.69 (0.91) 1.52 (0.32)
2564 A.-G. Seifert et al. / Geochimica et Cosmochimica Acta 75 (2011) 2557–2570
modern (1.0674 ± 0.0022; fraction modern C). A minimumamount necessary for reliable 14C measurements was foundto be 10 lg (data not shown). The three samples fulfillingthe requirements had a fraction modern carbon value of0.8486 (±0.0618) for PLFA representing Gram-positivebacteria (i/a, 10Me 17:0, control-medium columns),0.8931 for general microbial marker (±0.0682, 16:0, Schizo-
phyllum columns) and 0.9904 (±0.0542) for Gram-negativemarker (16:1x9, 17:1 (1,2,3), 18:1x9, 18:1x7, Schizophyllum
columns. Accordingly, we calculated carbon use from theslate in the order of 22, 18, and 8%, respectively (Eq. (4)).
4. DISCUSSION
We were able to demonstrate for the first time the im-pact of different microbial groups on degradation of lowmetamorphic black slate in the presence of a labile carbonsource. To demonstrate this we combined a mass balance
approach using carbon budgets and compound specific13C and 14C analysis of PLFA. Contributions from degra-dation of black slate were evident from all three ap-proaches. Especially results of 14C analysis imply thatGram-positive bacteria were best adapted to black slatedegradation. Moreover, Gram-positive bacteria dominatedthe microbial community in all columns indicating that theymight be best adapted to live in black slate environments.The 10Me17:0 fatty acid, a marker for Gram-positive acti-nomycetes, was found in relatively high amounts in all col-umns. Feeding with a culture medium increased the amountof Gram-negative bacteria in the medium-fed columns.Former investigations showed that Gram-negative bacteriaare more dependent on the input of fresh plant derived or-ganic matter (Kramer and Gleixner, 2006; Habekost et al.,2008), which is easily degradable like glucose, whereasGram-positive bacteria have been found to use fossil organ-ic carbon from soils (Kramer and Gleixner, 2006).
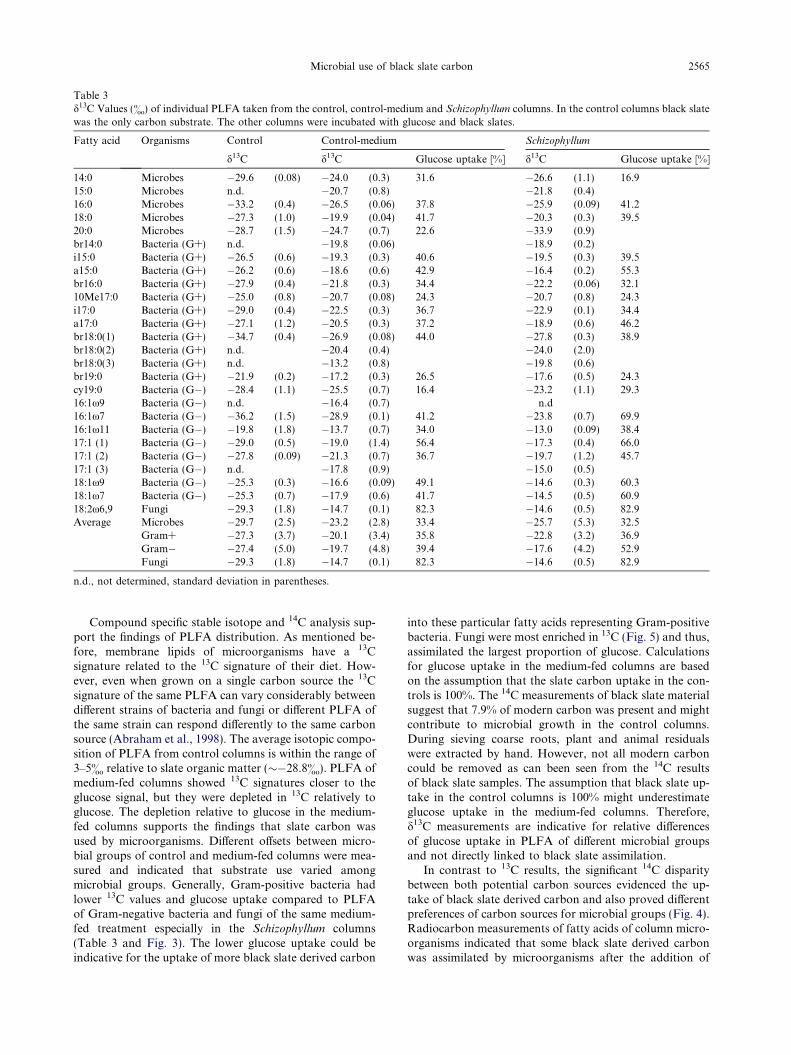
Table 3d13C Values (&) of individual PLFA taken from the control, control-medium and Schizophyllum columns. In the control columns black slatewas the only carbon substrate. The other columns were incubated with glucose and black slates.
Fatty acid Organisms Control Control-medium Schizophyllum
d13C d13C Glucose uptake [%] d13C Glucose uptake [%]
14:0 Microbes �29.6 (0.08) �24.0 (0.3) 31.6 �26.6 (1.1) 16.915:0 Microbes n.d. �20.7 (0.8) �21.8 (0.4)16:0 Microbes �33.2 (0.4) �26.5 (0.06) 37.8 �25.9 (0.09) 41.218:0 Microbes �27.3 (1.0) �19.9 (0.04) 41.7 �20.3 (0.3) 39.520:0 Microbes �28.7 (1.5) �24.7 (0.7) 22.6 �33.9 (0.9)br14:0 Bacteria (G+) n.d. �19.8 (0.06) �18.9 (0.2)i15:0 Bacteria (G+) �26.5 (0.6) �19.3 (0.3) 40.6 �19.5 (0.3) 39.5a15:0 Bacteria (G+) �26.2 (0.6) �18.6 (0.6) 42.9 �16.4 (0.2) 55.3br16:0 Bacteria (G+) �27.9 (0.4) �21.8 (0.3) 34.4 �22.2 (0.06) 32.110Me17:0 Bacteria (G+) �25.0 (0.8) �20.7 (0.08) 24.3 �20.7 (0.8) 24.3i17:0 Bacteria (G+) �29.0 (0.4) �22.5 (0.3) 36.7 �22.9 (0.1) 34.4a17:0 Bacteria (G+) �27.1 (1.2) �20.5 (0.3) 37.2 �18.9 (0.6) 46.2br18:0(1) Bacteria (G+) �34.7 (0.4) �26.9 (0.08) 44.0 �27.8 (0.3) 38.9br18:0(2) Bacteria (G+) n.d. �20.4 (0.4) �24.0 (2.0)br18:0(3) Bacteria (G+) n.d. �13.2 (0.8) �19.8 (0.6)br19:0 Bacteria (G+) �21.9 (0.2) �17.2 (0.3) 26.5 �17.6 (0.5) 24.3cy19:0 Bacteria (G�) �28.4 (1.1) �25.5 (0.7) 16.4 �23.2 (1.1) 29.316:1x9 Bacteria (G�) n.d. �16.4 (0.7) n.d16:1x7 Bacteria (G�) �36.2 (1.5) �28.9 (0.1) 41.2 �23.8 (0.7) 69.916:1x11 Bacteria (G�) �19.8 (1.8) �13.7 (0.7) 34.0 �13.0 (0.09) 38.417:1 (1) Bacteria (G�) �29.0 (0.5) �19.0 (1.4) 56.4 �17.3 (0.4) 66.017:1 (2) Bacteria (G�) �27.8 (0.09) �21.3 (0.7) 36.7 �19.7 (1.2) 45.717:1 (3) Bacteria (G�) n.d. �17.8 (0.9) �15.0 (0.5)18:1x9 Bacteria (G�) �25.3 (0.3) �16.6 (0.09) 49.1 �14.6 (0.3) 60.318:1x7 Bacteria (G�) �25.3 (0.7) �17.9 (0.6) 41.7 �14.5 (0.5) 60.918:2x6,9 Fungi �29.3 (1.8) �14.7 (0.1) 82.3 �14.6 (0.5) 82.9Average Microbes �29.7 (2.5) �23.2 (2.8) 33.4 �25.7 (5.3) 32.5
Gram+ �27.3 (3.7) �20.1 (3.4) 35.8 �22.8 (3.2) 36.9Gram� �27.4 (5.0) �19.7 (4.8) 39.4 �17.6 (4.2) 52.9Fungi �29.3 (1.8) �14.7 (0.1) 82.3 �14.6 (0.5) 82.9
n.d., not determined, standard deviation in parentheses.
Microbial use of black slate carbon 2565
Compound specific stable isotope and 14C analysis sup-port the findings of PLFA distribution. As mentioned be-fore, membrane lipids of microorganisms have a 13Csignature related to the 13C signature of their diet. How-ever, even when grown on a single carbon source the 13Csignature of the same PLFA can vary considerably betweendifferent strains of bacteria and fungi or different PLFA ofthe same strain can respond differently to the same carbonsource (Abraham et al., 1998). The average isotopic compo-sition of PLFA from control columns is within the range of3–5& relative to slate organic matter (��28.8&). PLFA ofmedium-fed columns showed 13C signatures closer to theglucose signal, but they were depleted in 13C relatively toglucose. The depletion relative to glucose in the medium-fed columns supports the findings that slate carbon wasused by microorganisms. Different offsets between micro-bial groups of control and medium-fed columns were mea-sured and indicated that substrate use varied amongmicrobial groups. Generally, Gram-positive bacteria hadlower 13C values and glucose uptake compared to PLFAof Gram-negative bacteria and fungi of the same medium-fed treatment especially in the Schizophyllum columns(Table 3 and Fig. 3). The lower glucose uptake could beindicative for the uptake of more black slate derived carbon
into these particular fatty acids representing Gram-positivebacteria. Fungi were most enriched in 13C (Fig. 5) and thus,assimilated the largest proportion of glucose. Calculationsfor glucose uptake in the medium-fed columns are basedon the assumption that the slate carbon uptake in the con-trols is 100%. The 14C measurements of black slate materialsuggest that 7.9% of modern carbon was present and mightcontribute to microbial growth in the control columns.During sieving coarse roots, plant and animal residualswere extracted by hand. However, not all modern carboncould be removed as can been seen from the 14C resultsof black slate samples. The assumption that black slate up-take in the control columns is 100% might underestimateglucose uptake in the medium-fed columns. Therefore,d13C measurements are indicative for relative differencesof glucose uptake in PLFA of different microbial groupsand not directly linked to black slate assimilation.
In contrast to 13C results, the significant 14C disparitybetween both potential carbon sources evidenced the up-take of black slate derived carbon and also proved differentpreferences of carbon sources for microbial groups (Fig. 4).Radiocarbon measurements of fatty acids of column micro-organisms indicated that some black slate derived carbonwas assimilated by microorganisms after the addition of
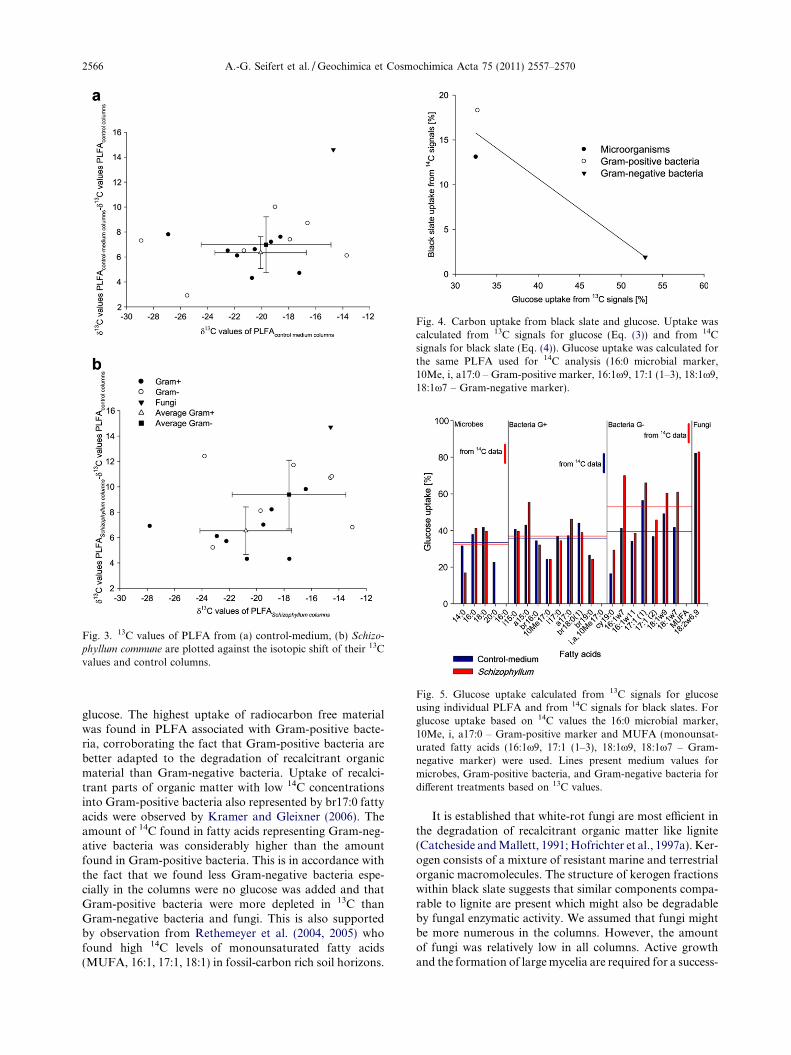
Fig. 3. 13C values of PLFA from (a) control-medium, (b) Schizo-
phyllum commune are plotted against the isotopic shift of their 13Cvalues and control columns.
Fig. 5. Glucose uptake calculated from 13C signals for glucoseusing individual PLFA and from 14C signals for black slates. Forglucose uptake based on 14C values the 16:0 microbial marker,10Me, i, a17:0 – Gram-positive marker and MUFA (monounsat-urated fatty acids (16:1x9, 17:1 (1–3), 18:1x9, 18:1x7 – Gram-negative marker) were used. Lines present medium values formicrobes, Gram-positive bacteria, and Gram-negative bacteria fordifferent treatments based on 13C values.
Fig. 4. Carbon uptake from black slate and glucose. Uptake wascalculated from 13C signals for glucose (Eq. (3)) and from 14Csignals for black slate (Eq. (4)). Glucose uptake was calculated forthe same PLFA used for 14C analysis (16:0 microbial marker,10Me, i, a17:0 – Gram-positive marker, 16:1x9, 17:1 (1–3), 18:1x9,18:1x7 – Gram-negative marker).
2566 A.-G. Seifert et al. / Geochimica et Cosmochimica Acta 75 (2011) 2557–2570
glucose. The highest uptake of radiocarbon free materialwas found in PLFA associated with Gram-positive bacte-ria, corroborating the fact that Gram-positive bacteria arebetter adapted to the degradation of recalcitrant organicmaterial than Gram-negative bacteria. Uptake of recalci-trant parts of organic matter with low 14C concentrationsinto Gram-positive bacteria also represented by br17:0 fattyacids were observed by Kramer and Gleixner (2006). Theamount of 14C found in fatty acids representing Gram-neg-ative bacteria was considerably higher than the amountfound in Gram-positive bacteria. This is in accordance withthe fact that we found less Gram-negative bacteria espe-cially in the columns were no glucose was added and thatGram-positive bacteria were more depleted in 13C thanGram-negative bacteria and fungi. This is also supportedby observation from Rethemeyer et al. (2004, 2005) whofound high 14C levels of monounsaturated fatty acids(MUFA, 16:1, 17:1, 18:1) in fossil-carbon rich soil horizons.
It is established that white-rot fungi are most efficient inthe degradation of recalcitrant organic matter like lignite(Catcheside and Mallett, 1991; Hofrichter et al., 1997a). Ker-ogen consists of a mixture of resistant marine and terrestrialorganic macromolecules. The structure of kerogen fractionswithin black slate suggests that similar components compa-rable to lignite are present which might also be degradableby fungal enzymatic activity. We assumed that fungi mightbe more numerous in the columns. However, the amountof fungi was relatively low in all columns. Active growthand the formation of large mycelia are required for a success-
Microbial use of black slate carbon 2567
ful colonization of the environment. Studies have shown thatthe activity of inoculated white-rot fungi was improved bythe addition of glucose and mineral salts in non-sterile soils(Morgan et al., 1993). A primary carbon source is also re-quired to establish biodegradation of recalcitrant com-pounds. However, the preferences of white-rot fungi tocolonize wood might limit their capability to live in slate con-taining environments. Thus, other organic substrates likestraw and wood shavings might have been a better carbonsources to stimulate fungal growth (Morgan et al., 1993).Our results suggest that only a small amount of fungi benefitsmost from glucose, which is also confirmed by results fromlitter degradation (Rubino et al., 2009).
We did not find any influence of inoculation with thefungi S. commune on respiration rate and total amount ofPLFA. The lack of inoculated fungal growth in thesenon-autoclaved columns could be explained by the inabilityof the fungus to compete with the indigenous soil microor-ganisms (Radtke et al., 1994; in der Wiesche et al., 1996;Martens and Zadrazil, 1998; Andersson et al., 2000). Sur-prisingly, the amount of fungal carbon was even higher inthe control-medium columns compared to the Schizophyl-
lum columns. The growth of bacteria antagonistic toS. commune might have been stimulated by the culture med-ium and might have also negatively affected the indigenousfungal population in these columns. However, DOC losswas stimulated in Schizophyllum columns compared toother columns. Martens and Zadrazil (1998) observed thatnon-colonizing fungi started to disintegrate resulting in theaccumulation of water which diffuses into the soil. Productsof mycelium decay from non-colonizing S. commune mighthave stimulated the higher DOC loss from the Schizophyl-
lum columns compared to the control-medium columns.Carbon input is considered to be the limiting factor for
microbial biomass. The microbial community compositionand the amount of microorganisms in the columns de-pended on the availability of glucose. Glucose as labile car-bon source is easily degradable and supports the growth ofmicroorganisms as can be seen from the increased numbersof PLFA and the higher CO2 efflux rates from the medium-fed columns. However, the abundance of PLFA indicates asmall microbial population. Compared to natural oxygen-ated environments, the PLFA concentration was low(Burke et al., 2003; Habekost et al., 2008). PLFA concen-trations in the columns were also lower than PLFA concen-tration measured by Petsch et al. (2003) in a core section(28.9 nmol g�1), which contained nearly 100% slate organicmatter. However, compared to investigations performed byColwell et al. (1997) and Ringelberg et al. (1997) the col-umns showed a 100- to 500-fold greater PLFA concentra-tion than detected in slates and sandstones of deepsubsurface sediments with similar organic matter sources,but under anoxic conditions. The limited supply of easydegradable carbon resulted in a low level of microbial bio-mass and activity in the columns. Carbon in the control col-umns was only provided by black slate or atmospheric CO2
deposition for chemoautotrophic organisms. Results of gas-eous and liquid carbon loss indicate that addition of a cul-ture medium resulted in a higher loss of carbon derivedfrom black slates. Carbon loss was enhanced in the
medium-fed columns compared to control columns. Addi-tionally, if the total carbon loss in the medium-fed columnswas related to the added carbon (glucose, asparagine) itcould be shown that the amount of carbon released fromthese columns exceeded the amount of added carbon by60% (Table 1). The observed positive priming effect is re-lated to enhanced degradation of black slate derived car-bon, since the additionally released C-CO2 exceeded theamount of added carbon introduced with the culture med-ium. However, plant and animal debris might also contrib-ute to the enhanced carbon release. Positive priming forblack carbon in soils as a result of glucose addition was alsoshown by Hamer et al. (2004) and Kuzyakov et al. (2009).The observed positive priming effect relative to controls issimilar to effects measured by Hamer et al. (2004) forcharred black carbon. The studies by Hamer et al. (2004)and Kuzyakov et al. (2009) suggested cometabolic decom-position. This suggest that microorganisms are not depen-dent on black slate use as carbon and energy source, butenzymes produced by microorganisms are able to degradeblack slate. The combined results from compound specific13C and 14C analysis suggest that different microbial groupsuse different carbon sources for their growth. Our 14C re-sults suggest that especially Gram-positive bacteria are ableto use black slate derived carbon as carbon source andincorporate into microbial biomass. Gram-positive bacteriamight even benefit from a priming effect. A glucose uptakeof �33% indicated by 13C values coincided with a relativelyhigh black slate uptake as can be seen for the PLFA markerfor Gram-positive bacteria (i, a, 10Me17:0br) and microor-ganisms (Figs. 4 and 5). In contrast the higher glucose up-take in Gram-negative bacteria resulted in almost no blackcarbon uptake. Results can have implications on degrada-tion processes in natural environments. Stockpiles are ex-posed to the earth’s surfaces for decades and are nowpartly overgrowing by plants and forests. Such conditionsmay facilitate microorganisms to grow on black slate sur-faces and accelerate degradation processes depending onthe input of fresh organic material.
In conclusion we could demonstrate:
1. The biodegradability of low grade metamorphic blackslates was demonstrated using a column experiment.Microbial degradation of high molecular weight sub-stances must therefore be considered as a process affect-ing organic matter in sediments and rocks when activemicroorganisms are present.
2. We observed positive priming as a result of glucose addi-tion. A moderate glucose uptake corresponded with arelative high black slate uptake.
3. Taken together results from PLFA, stable isotope andradiocarbon measurements, the results emphasize thatespecially Gram-positive bacteria are able to utilizeblack slate derived carbon. Gram-positive bacteria mighthave advantages to colonize solid surfaces and todegrade complex biopolymers.
4. The inoculation with the fungus S. commune did notaffect degradation of black slates in our experiment,probably because the inherited microbial populationoutcompeted the fungus.
2568 A.-G. Seifert et al. / Geochimica et Cosmochimica Acta 75 (2011) 2557–2570
5. The significant difference in 14C content of fossil geolog-ical systems compared to modern carbon sources can beused to investigate microbial carbon uptake and cycling.
ACKNOWLEDGMENTS
This work was supported by the German Research Foundation(DFG) within the graduate school 1257. The authors thank OlafKolle for the support of respiration and water content measure-ments as well as the Steffen Ruhlow for the help during stable iso-tope analysis of PLFA and people at the stable isotope lab (HeikeGeilmann) and 14C labs in Jena (Axel Steinhof, Heike Machts) andIrvine (John Southon, Guaciara Dos Santos) for their help duringmeasurements. The authors also thank the anonymous reviewersfor constructive comments and suggestions improving themanuscript.
REFERENCES
Abadulla E., Robra K. H., Gubitz G. M., Silva L. M. and Cavaco-Paulo A. (2000) Enzymatic decolorization of textile dyeingeffluents. Text. Res. J. 70, 409–414.
Abraham W. R., Hesse C. and Pelz O. (1998) Ratios of carbonisotopes in microbial lipids as an indicator of substrate usage.Appl. Environ. Microbiol. 64(11), 4202–4209.
Abraham W. R. and Hesse C. (2003) Isotope fractionations in thebiosynthesis of cell components by different fungi: a basis forenvironmental carbon flux studies. FEMS Microbiol. Ecol.
46(1), 121–128.
Andersson B. E., Welinder L., Olsson P. A., Olsson S. andHenrysson T. (2000) Growth of inoculated white-rot fungi andtheir interactions with the bacterial community in soil contam-inated with polycyclic aromatic hydrocarbons, as measured byphospholipid fatty acids. Bioresour. Technol. 73, 29–36.
Baath E. (1994) Thymidine and leucine incorporation in soilbacteria with different cell-size. Microb. Ecol. 27(3), 267–278.
Baath E. and Anderson T. H. (2003) Comparison of soil fungal/bacterial ratios in a pH gradient using physiological and PLFA-based techniques. Soil Biol. Biochem. 35(7), 955–963.
Ball A. S., Betts W. B. and McCarthy A. J. (1989) Degradation oflignin-related compounds by actinomycetes. Appl. Environ.
Microbiol. 55(6), 1642–1644.
Bayman P. and Radkar G. V. (1997) Transformation and toleranceof TNT (2, 4, 6-trinitrotoluene) by fungi. Int. Biodeterior.
Biodegrad. 39, 45–53.
Berner R. A. (1987) Models for carbon and sulfur cycles andatmospheric oxygen - application to paleozoic geologic history.Am. J. Sci. 287, 177–196.
Berner R. A. (1989) Biogeochemical cycles of carbon and sulfurand their effect on atmospheric oxygen over phanerozoic time.Global Planet. Change 75(1–2), 97–122.
Berrocal M. M., Rodriguez J., Ball A. S., PerezLeblic M. I. andArias M. E. (1997) Solubilisation and mineralisation of [C-14]lignocellulose from wheat straw by Streptomyces cyaneusCECT 3335 during growth in solid-state fermentation. Appl.
Microbiol. Biotechnol. 48(3), 379–384.
Bligh E. G. and Dyer W. J. (1959) A rapid method of total lipidextraction and purification. Can. J. Biochem. Physiol. 37(8),
911–917.
Bossio D. A. and Scow K. M. (1998) Impacts of carbon andflooding on soil microbial communities: phospholipid fatty acidprofiles and substrate utilization patterns. Microb. Ecol. 35(3),
265–278.
Bouchez J., Beyssac O., Galy V., Gaillardet J., France-Lanord C.,Maurice L. and Moreira-Turcq P. (2010) Oxidation of petro-genic organic carbon in the Amazon floodplain as a source ofatmospheric CO2. Geology 38, 255–258.
Burke R. A., Molina M., Cox J. E., Osher L. J. and Piccolo M. C.(2003) Stable carbon isotope ratio and composition of micro-bial fatty acids in tropical soils. J. Environ. Qual. 32(1), 198–
206.
Buswell J. A. and Odier E. (1987) Lignin biodegradation. Crit. Rev.
Biotechnol. 6, 1–60.
Catcheside D. E. A. and Mallett K. J. (1991) Solubilization ofaustralian lignites by fungi and other microorganisms. Energy
Fuels 5(11), 141–145.
Chang S. B. and Berner R. A. (1998) Humic substance formationvia the oxidative weathering of coal. Environ. Sci. Technol. 32,
2883–2886.
Chang S. B. and Berner R. A. (1999) Coal weathering and thegeochemical carbon cycle. Geochim. Cosmochim. Acta 63, 3301–
3310.
Colwell F. S., Onstott T. C., Delwiche M. E., Chandler D.,Fredrickson J. K., Yao Q. J., McKinley J. P., Boone D. R.,Griffiths R., Phelps T. J., Ringelberg D., White D. C.,LaFreniere L., Balkwill D., Lehman R. M., Konisky J. andLong P. E. (1997) Microorganisms from deep, high temperaturesandstones: constraints on microbial colonization. FEMS
Microbiol. Rev. 20(3–4), 425–435.
Coplen T. B., Brand W. A., Gehre M., Groning M., Meijer H. A.J., Toman B. and Verkouteren R. M. (2006) After two decadesa second anchor for the VPDB delta C-13 scale. Rapid
Commun. Mass Spectrom. 20, 3165–3166.
De Nobili M., Contin M., Mondini C. and Brookes P. C. (2001)Soil microbial biomass is triggered into activity by traceamounts of substrate. Soil Biol. Biochem. 33(9), 1163–1170.
Fierer N., Schimel J. P. and Holden P. A. (2003) Variations inmicrobial community composition through two soil depthprofiles. Soil Biol. Biochem. 35, 167–176.
Fischer C., Schmidt C., Bauer A., Gaupp R. and Heide K. (2009)Mineralogical and geochemical alteration of low-grade meta-morphic black slates due to oxidative weathering. Chem. Erde
69, 127–142.
Frostegard A. and Baath E. (1996) The use of phospholipid fattyacid analysis to estimate bacterial and fungal biomass in soil.Biol. Fert. Soils 22(1–2), 59–65.
Frostegard A., Baath E. and Tunlid A. (1993a) Shifts in thestructure of soil microbial communities in limed forests asrevealed by phospholipid fatty-acid analysis. Soil Biol. Biochem.
25(6), 723–730.
Frostegard A., Tunlid A. and Baath E. (1993b) Phospholipid fatty-acid composition, biomass, and activity of microbial commu-nities from 2 soil types experimentally exposed to differentheavy-metals. Appl. Environ. Microbiol. 59(11), 3605–3617.
Gleixner G., Poirier N., Bol R. and Balesdent J. (2002) Moleculardynamics of organic matter in a cultivated soil. Org. Geochem.
33, 357–366.
Godden B., Ball A. S., Helvenstein P., McCarthy A. J. andPenninckx M. J. (1992) Towards elucidation of the lignindegradation pathway in actinomycetes. J. Gen. Microbiol. 138,
2441–2448.
Habekost M., Eisenhauer N., Scheu S., Steinbeiss S., WeigeltA. and Gleixner G. (2008) Seasonal changes in the soilmicrobial community in a grassland plant diversity gradientfour years after establishment. Soil Biol. Biochem. 40(10),
2588–2595.
Hamer U. and Marschner B. (2002) Priming effects of sugars,amino acids, organic acids and catechol on the mineralizationof lignin and peat. J. Plant Nutr. Soil Sci. 165(3), 261–268.
Microbial use of black slate carbon 2569
Hamer U., Marschner B., Brodowski S. and Amelung W. (2004)Interactive priming of black carbon and glucose mineralisation.Org. Geochem. 35, 823–830.
Hofrichter M., Bublitz F. and Fritsche W. (1997a) Fungal attackon coal II. Solubilization of low-rank coal by filamentous fungi.Fuel Process. Technol. 52(1–3), 55–64.
Hofrichter M., Bublitz F. and Fritsche W. (1997b) Fungal attackon coal: I. Modification of hard coal by fungi. Fuel Process.Technol. 52(1–3), 43–53.
Hofrichter M., Ziegenhagen D., Sorge S., Ullrich R., Bublitz F.and Fritsche W. (1999) Degradation of lignite (low-rank coal)by ligninolytic basidiomycetes and their manganese peroxidasesystem. Appl. Microbiol. Biotechnol. 52(1), 78–84.
in der Wiesche C., Martens R. and Zadrazil F. (1996) Two-stepdegradation of pyrene by white-rot fungi and soil microorgan-isms. Appl. Microbiol. Biotechnol. 46, 653–659.
Jaffe L. A., Peucker-Ehrenbrink B. and Petsch S. T. (2002)Mobility of rhenium, platinum group elements and organiccarbon during black slate weathering. Earth Planet Sci. Lett.
198(3–4), 339–353.
Klamer M. and Baath E. (2004) Estimation of conversion factorsfor fungal biomass determination in compost using ergosteroland PLFA 18:2 omega 6,9. Soil Biol. Biochem. 36(1), 57–65.
Kramer C. and Gleixner G. (2008) Soil organic matter in soil depthprofiles: distinct carbon preferences of microbial groups duringcarbon transformation. Soil Biol. Biochem. 40, 425–433.
Kramer C. and Gleixner G. (2006) Variable use of plant- and soil-derived carbon by microorganisms in agricultural soils. Soil
Biol. Biochem. 38(11), 3267–3278.
Kramer C., Trumbore S., Froberg M., Dozal L. M. C., Zhang D.C., Xu X. M., Santos G. M. and Hanson P. J. (2010) Recent(< 4 year old) leaf litter is not a major source of microbialcarbon in a temperate forest mineral soil. Soil Biol. Biochem. 42,
1028–1037.
Kunert V. (1999) Die Frankenwalder Querzone – Entwicklungeiner thermischen Anomalie im Saxothuringikum, Ph.D. The-sis, University of Giessen.
Kuzyakov Y. and Bol R. (2006) Sources and mechanisms ofpriming effect induced in two grassland soils amended withslurry and sugar. Soil Biol. Biochem. 38(4), 747–758.
Kuzyakov Y., Friedel J. K. and Stahr K. (2000) Review ofmechanisms and quantification of priming effects. Soil Biol.
Biochem. 32, 1485–1498.
Kuzyakov Y., Subbotina I., Chen H. Q., Bogomolova I. and Xu X.L. (2009) Black carbon decomposition and incorporation intosoil microbial biomass estimated by C-14 labeling. Soil Biol.
Biochem. 41, 210–219.
Lechevalier H. and Lechevalier M. P. (1988) Chemotaxonomic useof lipids an overview. In Microbial Lipids, Vol. 1 Xviii+963p(eds. C. Ratledge and S. G. Wilkinson). Academic Press,
London, England, UK; San Diego, California, USA; Illus, pp.
869–902.
Leckie S. E., Prescott C. E., Grayston S. J., Neufeld J. D. andMohn W. W. (2004) Characterization of humus microbialcommunities in adjacent forest types that differ in nitrogenavailability. Microb. Ecol. 48, 29–40.
Martens R. and Zadrazil F. (1998) Screening of white-rot fungi fortheir ability to mineralize polycyclic aromatic hydrocarbons insoil. Folia Microbiol. 43, 97–103.
Matsubara M., Lynch J. M. and De Leij F. (2006) A simplescreening procedure for selecting fungi with potential for use inthe bioremediation of contaminated land. Enzyme Microb.
Technol. 39, 1365–1372.
Morgan P., Lee S. A., Lewis S. T., Sheppard A. N. and WatkinsonR. J. (1993) Growth and biodegradation by white-rot fungiinoculated into soil. Soil Biol. Biochem. 25, 279–287.
Perestelo F., Rodriguez A., Perez R., Carnicero A., de laFuente G. and Falcon M. A. (1996) Isolation of abacterium capable of limited degradation of industrial andlabelled, natural and synthetic lignins. World J. Microbiol.
Biotechnol. 12, 111–112.
Petsch S. T. and Berner R. A. (1998) Coupling the geochemicalcycles of C, P, Fe, and S: the effect on atmospheric O-2 and theisotopic records of carbon and sulfur. Am. J. Sci. 298, 246–262.
Petsch S. T., Smernik R. J., Eglinton T. I. and Oades J. M. (2001a)A solid state 13C-NMR study of kerogen degradation duringblack slate weathering. Geochim. Cosmochim. Acta 65(12),
1867–1882.
Petsch S. T., Eglinton T. I. and Edwards K. J. (2001b) C-14-deadliving biomass: evidence for microbial assimilation of ancientorganic carbon during share weathering. Science 292(5519),
1127–1131.
Petsch S. T., Edwards K. J. and Eglinton T. I. (2003) Abundance,distribution and delta C-13 analysis of microbial phospholipid-derived fatty acids in a black slate weathering profile. Org.
Geochem. 34(6), 731–743.
Pombo S. A., Pelz O., Schroth M. H. and Zeyer J. (2002) Field-scale C-13-labeling of phospholipid fatty acids (PLFA) anddissolved inorganic carbon: tracing acetate assimilation andmineralization in a petroleum hydrocarbon-contaminated aqui-fer. FEMS Microbiol. Ecol. 41(3), 259–267.
Radtke C., Cook W. S. and Anderson A. (1994) Factors affectingantagonism of the growth of Phanerochaete chrysosporium bybacteria isolated from soils. Appl. Microbiol. Biotechnol. 41,
274–280.
Rethemeyer J., Kramer C., Gleixner G., Wiesenberg G. L. B.,Schwark L., Andersen N., Nadeau M. J. and Grootes P. M.(2004) Complexity of soil organic matter: AMS C-14 analysis ofsoil lipid fractions and individual compounds. Radiocarbon 46,
465–473.
Rethemeyer J., Kramer C., Gleixner G., John B., Yamashita T.,Flessa H., Andersen N., Nadeau M. J. and Grootes P. M.(2005) Transformation of organic matter in agricultural soils:radiocarbon concentration versus soil depth. Geoderma 128(1–
2), 94–105.
Ringelberg D. B., Sutton S. and White D. C. (1997) Biomass,bioactivity and biodiversity: microbial ecology of the deepsubsurface. analysis of ester-linked phospholipid fatty acids.FEMS Microbiol. Rev. 20(3–4), 371–377.
Rubino M., Lubritt C., D’Onofrio A., Terrasi F., Kramer C.,Gleixner G. and Cotrufo M. F. (2009) Isotopic evidences formicrobiologically mediated and direct C input to soil com-pounds from three different leaf litters during their decompo-sition. Environ. Chem. Lett. 7, 85–95.
Santos G. M., Moore R. B., Southon J. R., Griffin S., Hinger E.and Zhang D. (2007a) AMS C-14 sample preparation at theKCCAMS/UCI facility: status report and performance of smallsamples. Radiocarbon 49(2), 255–269.
Santos G. M., Southon J. R., Griffin S., Beaupre S. R. and DruffelE. R. M. (2007b) Ultra small-mass AMS C-14 sample prepa-ration and analyses at KCCAMS/UCI Facility. Nucl. Instrum.
Meth. B 259(1), 293–302.
Slater G. F., Nelson R. K., Kile B. M. and Reddy C. M. (2006)Intrinsic bacterial biodegradation of petroleum contaminationdemonstrated in situ using natural abundance, molecular-levelC-14 analysis. Org. Geochem. 37(9), 981–989.
Southon J. R. and Santos G. M. (2004) Ion source development atKCCAMS, University of California, Irvine. Radiocarbon 46(1),
33–39.
Steinhof A., Adamiec G., Gleixner G., van Klinken G. J. andWagner T. (2004) The new C-14 analysis laboratory in Jena,Germany. Radiocarbon 46(1), 51–58.
2570 A.-G. Seifert et al. / Geochimica et Cosmochimica Acta 75 (2011) 2557–2570
Tunlid A. and White D. C. (1992) Biochemical analysis of biomasscommunity structure nutritional status and metabolic activityof microbial communities in soil. In Soil Biochemistry (eds. G.Stotzky and J.-M. Bollag). Marcel Dekker, New York, pp. 229–
262 (Chapter 7).
Volkman J. K., Alexander R., Kagi R. I., Rowland S. J. andSheppard P. N. (1984) Biodegradation of aromatic hydrocar-bons in crude oils from the Barrow Sub-basin of WesternAustralia. Org. Geochem. 6, 619–632.
Vicuna R. (1988) Bacterial degradation of lignin. Enzyme Microb.
Technol. 10, 646–655.
Wengel M., Kothe E., Schmidt C. M., Heide K. and Gleixner G.(2006) Degradation of organic matter from black slates andcharcoal by the wood-rotting fungus Schizophyllum commune
and release of DOC and heavy metals in the aqueous phase. Sci.
Total Environ. 367(1), 383–393.
White D. C., Davis W. M., Nickels J. S., King J. D. and Bobbie R.J. (1979) Determination of the sedimentary microbial biomassby extractable lipid phosphate. Oecologia 40(1), 51–62.
Zelles L. (1997) Phospholipid fatty acid profiles in selectedmembers of soil microbial communities. Chemosphere 35,
275–294.
Zelles L. (1999) Fatty acid patterns of phospholipids andlipopolysaccharides in the characterisation of microbial com-munities in soil: a review. Biol. Fert. Soils 29, 111–129.
Zimmermann W. (1990) Degradation of lignin by bacteria. J.
Biotechnol. 13, 119–130.
Associate editor: Thomas S. Bianchi