Variability of the Denmark Strait Overflow during the Last Glacial Maximum
75
Primary and secondary signals of variations in the Denmark Strait Overflow over the last glacial cycle Kumulative Dissertation zur Erlangung des Doktorgrades der Mathematisch-Naturwissenschaftlichen Fakultät der Christian-Albrechts-Universität zu Kiel vorgelegt von Christian Millo Kiel, 2005
Transcript of Variability of the Denmark Strait Overflow during the Last Glacial Maximum
Primary and secondary signals of variations in theDenmark Strait Overflow over the last glacial cycle
Kumulative Dissertationzur Erlangung des Doktorgrades
der Mathematisch-Naturwissenschaftlichen Fakultätder Christian-Albrechts-Universität
zu Kiel
vorgelegt vonChristian Millo
Kiel, 2005
I
Abstract
The Denmark Strait Overflow (DSO) today carries cold (-1°C) and dense
bottom water into the Northern North Atlantic, and in part counterbalances the
northward inflow of warm surface water of the North Atlantic Current and its
ramifications. This heat and mass balance profoundly influence the modern Atlantic
thermohaline circulation. A quantitative reconstruction of the intensity of overturning
rates during past ocean scenarios such as the Last Glacial Maximum (LGM) is a
fundamental but yet open objective of paleoceanography.
In the first part of this study, we reconstruct the variability of the DSO for the
LGM up to the transition to Heinrich meltwater event I on the basis of four new and
several published planktic and epibenthic stable isotope records obtained from sites to
the north and south of the Denmark Strait. The spatial and temporal pattern of
epibenthic ∂18O and ∂13C maxima across the LGM Denmark Strait reveal a north-
south density gradient from σ0 ~ 28.7 to 28.1 at 800 – 1800 m water depth and suggest
ongoing convection of dense and highly ventilated water in the Nordic Seas and a
glacial DSO that was directed to the south like today, eventually forming the glacial
North Atlantic Deepwater. To the south of Iceland a further convection cell of Glacial
North Atlantic Intermediate Water is documented by less high density (σ0 ~ 28.1) but
extremely high epibenthic ∂13C values (~ 1.70‰) that implies a strong ventilation on
top of the Mid Atlantic Ridge.
In Chapter 3 we present striking planktic and epibenthic ∂13C values reaching
up to –7‰, as documented in two coeval sediment records obtained from the
southeastern Greenland margin and the adjacent basin floor over Marine Isotope Stage
(MIS) 5.2 - MIS 5.1 and over stadial-to-interstadial times in MIS 4 and early MIS 3.13C-depleted foraminifera possibly integrated a primary (down to –2.5‰) and a post-
depositional (~ -20‰) light ∂13C signatures resulting from thermal instability of
(strongly 12C-enriched) methane hydrates and subsequent oxidation of methane in
pore and ocean water. Methane hydrates possibly dissociated during short-term
inversions of the DSO and inherent incursions of relatively warm (up to ~ 8°C) Upper
Atlantic Intermediate Water into the Greenland Sea basin, events that resulted from a
short-term meltwater-induced shut-off of deepwater formation in the Nordic Seas.
II
Kurzfassung
Der Denmark Strait Overflow (DSO) transportiert heute kaltes (-1°C), dichtes
Bodenwasser in den nördlichen Nordatlantik, wodurch der nordwärts gerichtete Einstrom
der warmen Oberflächenwassermassen des Nordatlantikstroms teilweise ausgeglichen
wird. Dieses Massen- und Wärmegleichgewicht beeinflusst die atlantische thermohaline
Zirkulation tiefgreifend. Eine quantitative Rekonstruktion der Intensität der
„overturning“-Raten vergangener Szenarien wie des Letzten Glazialen Maximums
(LGM), ist deshalb eine grundsätzliche, noch offene Frage der Paläoozeanographie.
Im ersten Teil dieser Arbeit wird die Variabilität des DSO während des LGM bis zum
Schmelzwasserereignis Heinrich I rekonstruiert, auf Grundlage vier neuer, sowie
mehrerer publizierter Zeitserien stabiler Isotope planktonischer und epibenthischer
Foraminiferen, von Kernpositionen nördlich und südlich der Dänemark Straße. Das
räumliche und zeitliche Muster der epibenthischen ∂18O und ∂13C Maxima entlang der
Dänemark Straße zeigt im LGM einen Nord-Süd-Dichte-Gradienten von σ0 ~ 28,7 bis
28,1 in Wassertiefen von 800 – 1800 m. Dies weist auf fortlaufende Konvektion von
dichten, gut durchlüfteten Wassermassen im Nordmeer mit einer wie heute südwärts
gerichteten Ablenkung des DSO, der schließlich zur Bildung von glaziale nordatlantische
Tiefenwassers beiträgt. Südlich von Island belegen extrem hohe epibenthische ∂13C Werte
(~ 1,70‰) zusammen mit einer ebenfalls hohen Dichte (σ0 ~ 28,1) eine weitere
Konvektionszelle glazialen nordatlantischen Zwischenwassers, indem sie eine gute
Belüftung des Wassers über dem Mittelatlantischen Rückens bezeugen.
In Kapitel 3 werden ungewöhnlich leichte (bis zu -7‰) planktische und epibenthische
∂13C Werte aus zwei Sedimentkernen vom südöstlichen grönländischen Kontinentalhang
und angrenzendem Becken vorgestellt. Diese traten jeweils in den marinen
Isotopenstadien (MIS) 5.2 – 5.1 sowie in den Stadial-Interstadialen im Übergang von MIS
4 zum frühen MIS 3 auf. Diese 13C abgereicherten Foraminiferen integrierten
möglicherweise primäre (bis zu -2,5‰) und sekundäre (post-depositionale ~ -20‰)
extrem leichte 13C Signaturen, die aus thermisch instabil gewordenen (stark an 12C
angereicherten) Methanhydraten, und anschließender Oxidation des Methans im Poren-
und Meerwasser stammen. Methanhydrate dissoziierten möglicherweise während
kurzfristiger Ereignisse einer Umkehr des DSO, verbunden mit dem Einstrom von relativ
warmem (bis zu ~ 8°C) oberen atlantischen Zwischenwasser in das Becken der
Grönlandsee, gesteuert durch einen Schmelzwasser-induzierten Zusammenbruch der
Tiefenwasserbildung im Nordmeer.
III
Contents
Abstract...............................................................................………..................................................…...I
Kurzfassung...................................................................................…....................................................II
Contents....................................................................................................……….................................III
CHAPTER 1. INTRODUCTION......................................................…...........................................1
1.1 Background.......................................................................................................................................1
1.2 This study..........................................................................................................................................2
1.3 Material and methods......................................................................................................................6
1.4 Age control......................................................................................................................................10
References.............................................................................................................................................13
CHAPTER 2. VARIABILITY OF THE DENMARK STRAIT OVERFLOW
DURING THE LAST GLACIAL MAXIMUM...........……………….....................................17
Abstract.................................................................................................................................................17
2.1 Introduction....................................................................................................................................18
2.2 Material and methods...............................................................................................................….21
2.3 Age control......................................................................................................................................23
2.4 Results.........................................................................................................................................…24
Epibenthic ∂18O record for the LGM and H1..................................................................................…...24
Epibenthic ∂13C record for the LGM and H1...................................................................................…..28
2.5 Discussion..................................................................................................................................…..28
2.6 Conclusions.....................................................................................................................................33
Acknowledgments................................................................................................................................34
References.............................................................................................................................................35
IV
CHAPTER 3. METHANE SIGNALS AND VARIATIONS
IN DENMARK STRAIT OVERFLOW......................................................................................39
3A. Methane-driven Late Pleistocene ∂∂∂∂13C minima
and Overflow reversals in the S.W. Greenland Sea............................................................….39
Abstract.................................................................................................................................................39
3A.1 Introduction.................................................................................................................................40
3A.2 Study area....................................................................................................................................41
3A.3 Methods........................................................................................................................................41
3A.4 Age control...................................................................................................................................42
3A.5 Results...........................................................................................................................................44
Outstanding ∂13C minima.......................................................................................................................44
Distribution of secondary crystalline overgrowth..............................................................................…45
Primary versus authigenic ∂13C signature...........................................................................................…47
3A.6 Discussion and Conclusions........................................................................................................47
Acknowledgments.................................................................................................................................49
References.............................................................................................................................................50
3B. Methane-induced early diagenesis of foraminiferal tests
in the southwestern Greenland Sea........................................................................................…..52
Abstract.................................................................................................................................................52
3B.1 Introduction..............................................................................................................................…53
3B.2 Study area and methods.........................................................................................................….54
3B.3 Results...........................................................................................................................................56
3B.4 Discussion.....................................................................................................................................60
3B.5 Conclusions...................................................................................................................................63
Acknowledgments.................................................................................................................................64
References.............................................................................................................................................65
General Acknowledgments...............................................................................................................67
Chapter 1. Introduction
1
CHAPTER 1
Introduction
1.1 Background
The Denmark Strait Overflow (DSO) today forms a giant cataract which carries cold
and dense water from the Greenland Sea into the Northern North Atlantic. This
current is a major component (3 x 10⁶ m3/s = 3 Sv) of the total southward outflow of
deepwater (6 Sv) from the Nordic Seas into the Atlantic Ocean. An additional flux of
low salinity and low density surface water reaches the North Atlantic through the
Canadian Archipelago (1.7 Sv) and via the East Greenland Current (EGC) (1.3 Sv).
This southward outflow of cold water compensates for the inflow (8 Sv) of warm and
saline surface water of Atlantic origin into the Greenland-Iceland-Norwegian Seas (1
Sv from the Pacific Ocean reaches the Arctic Ocean through the Bering Strait)
(Hansen & Østerhus, 2000). This mass balance is a key factor governing the modern
Atlantic Thermohaline Circulation (THC) system and thus the poleward heat transport
in the northern hemisphere.
The strength of the DSO mainly depends on the density contrast between the
water masses to the north and south of the Denmark Strait (Whitehead et al., 1974),
and therefore is particularly sensitive to changes in sea surface salinity due to
meltwater release from the neighbour ice sheets (Hansen et al., 2001; Dickson et al.,
2002). Significant changes in the intensity and direction of the DSO are expected to
have occurred on geological time scales owing to perturbations of the density pattern
during episodes of major freshwater discharge into the Nordic Seas, such as during
the Dansgaard-Oeschger (DO) stadials and Heinrich Events (H). For example,
meltwater pulses, inferred from light planktic ∂18O anomalies in the Nordic Seas, led
to a cessation of deepwater formation documented by a dramatic reduction in benthic
∂13C values during the H1 (15 kyrs BP) (Sarnthein et al., 2000). The weakening or
complete shut off of surface ocean convection caused an inversion of North Atlantic
THC and possibly led to a DSO reversal which resulted in a northward incursion of
relatively warm and highly saline Atlantic Upper Intermediate Water into the Nordic
Sea during major Dansgaard-Oeschger stadials (Rasmussen & Thomsen, 2004).
Significant changes in the DSO regime are also expected for the Last Glacial
Maximum (LGM). In this period, ice sheets constricted the Denmark Strait aperture
from both sides (Larsen, 1983). Moreover the eustatic sea level reduction by 120 to
Chapter 1. Introduction
2
130 m (Lambeck & Chapell, 2001) and glacio-eustatic rebounds induced by changes
in the volume of continental ice sheets on Greenland and Iceland (Fleming &
Lambeck, 2004) diminished the maximum depth of the Denmark Strait sill by about
130 m (today 630 m) and possibly reduced the intensity of DSO.
Model simulations of the DSO over the LGM suggest a substantial decrease of
its flux to 0,7 Sv (Koesters et al., 2004), in harmony with models of glacial North
Atlantic THC, which show that the overturning was weaker or even reversed
(Ganopolski et al., 1998). These conclusions are supported by reconstructions of
LGM bottom and intermediate water ventilation inferred from epibenthic
foraminiferal ∂13C (Curry et al., 1988; Duplessy et al., 1988; Sarnthein et al., 1994;
Skinner & Shackleton, 2004) and estimates of deepwater export from the North
Atlantic based on foraminiferal Cd/Ca (Boyle 1992) and sediment 231Pa/230Th (Yu et
al., 1996; McManus et al., 2004). These estimates indicate a major reduction in the
flux of North Atlantic Deepwater accompanied by an enhanced northward advection
of Antarctic Bottom Water but still remain semi-quantitative, a “major
embarrassment” to paleoceanography, as it was stressed at the recent SCOR/IMAGES
workshop in Atlanta (March 2005).
Reconstructions of LGM sea ice cover based on sea surface temperature
estimates and the spatial pattern of planktic ∂18O revealed that large portions of the
glacial Nordic Seas were ice-free during summer (Weinelt et al., 1996; Norgaard-
Pedersen et al., 2003; Sarnthein et al., 2003). Accordingly, deepwater continued to
form in the Nordic Seas also during the LGM owing to open-ocean convection during
interstadials and/or injections of high-salinity brine water during stadials with
enhanced seasonal sea ice formation (Dokken & Jansen, 1999; Voelker, 1999). These
results are in agreement with the model of Paul & Schaefer-Neth (2003) showing
ongoing convection in the Nordic Seas during the LGM and suggest that a minor DSO
was flowing into the Northern North Atlantic over most of that time.
1.2 This study
The objective of this thesis is to reconstruct the variability of the DSO for various
periods of major climate change: the Last Glacial to H1 transition, the warming at the
boundary between Marine Isotope Stage (MIS) 5.2 and MIS 5.1, and for stadial-to-
interstadial times in MIS 4 and early MIS 3.
Chapter 1. Introduction
3
This reconstruction is based on five new stable isotope records obtained from sites to
the north and south of the Denmark Strait and includes several published isotope
records.
A short overview of the chapters is given below:
Chapter 2: Variability of the Denmark Strait Overflow during the Last Glacial
Maximum. A reconstruction of the spatial and temporal variability of the glacial DSO
is obtained on the basis of eight epibenthic stable isotope records from core locations
to the north and south of the Denmark Strait. Epibenthic ∂18O is used as proxy for
bottom water density assuming that bottom water temperatures at the LGM were close
to the freezing point all over the study area and thus the temperature effect on
foraminiferal ∂18O values was negligible. Epibenthic ∂13C values are used as proxy of
bottom water ventilation (Duplessy 1982; Zahn et al., 1986; Curry et al., 1988). LGM
stable isotope values from each coring site have been horizontally projected onto two
virtual vertical transects crossing the study area from north-east to south-west and
from west to east in order to reveal the spatial distribution pattern of paleo-water
masses and gradients of bottom water density and ventilation, which allow us to infer
the intensity and pathway of the glacial DSO.
Chapter 3 – section A: Methane-driven Late Pleistocene ∂∂∂∂13C minima and
Overflow reversals in the southwestern Greenland Sea. Two planktic ∂13C records
from a three-sediment core transect running from the northwestern Icelandic slope,
across the Blosseville Basin and the eastern Greenland slope reveal coeval events of
extreme ∂13C depletion, which have progressively decreased from the eastern
Greenland slope toward east. A series of major ∂13C anomalies start in the middle of
MIS 5.2 and has a total duration of approximately 18,000 years. Negative planktic
∂13C extremes around –6 ‰ occur during peak DO stadial 22 and subsequent DO
interstadial 21 and match a peak in atmospheric methane concentration (Blunier &
Brook, 2001). A second major ∂13C event reaching –5 ‰ is documented over 4000
years by both planktic and epibenthic ∂13C records near the onset of DO interstadial
14.
These extreme 13C-depletions reach beyond the natural range of ∂13C in
Dissolved Inorganic Carbon (DIC) driven by the remineralization of organic matter.
Chapter 1. Introduction
4
Thus they cannot be accounted for in terms of nutrient enrichment in ocean water, but
rather require an alternative source of light carbon isotope, that is methane released
from gas hydrate (clathrate) reservoirs. This hypothesis is also supported by the
evidence of a DSO reversal during the meltwater regime of MIS 5.2. During this time
strongly reduced sea surface salinity in the Nordic Seas (recorded as planktic ∂18O
minimum) induced a strong stratification of the surface ocean, sea ice formation that
sealed off the sea surface, and a complete breakdown of deepwater formation in the
Nordic Seas, which in turn may have led to a northward incursion of relatively warm
(8°C) and saline Atlantic Upper Intermediate Water (Zahn et al., 1987; Rasmussen &
Thomsen, 2004) and a bottom water warming by 8 to 9 °C. This warming possibly
triggered dissociation of methane hydrates in sediments along the eastern Greenland
slope and a release of methane into the Blosseville Basin. A hypothesis is proposed
that a plume of methane spread from the East Greenland slope and rapidly diffused
toward Iceland. This model is consistent with evidence that the ∂13C excursion was
found coeval at two different locations and clearly decreased from west to east.
Oxidation of methane (-40 to –60 ‰ ∂13C) to isotopically light DIC led to the
observed negative ∂13C shift in planktic and benthic foraminiferal tests.
Scanning Electron Microscope (SEM) and light microscope investigations
revealed that planktic and benthic foraminifera obtained from the record with
maximum negative ∂13C excursion are also affected by a post-depositional, secondary
overgrowth of authigenic carbonate which is absent in non-excursion (i.e. ∂13C= 0 ‰)
intervals. In contrast, foraminifera obtained from the two coring sites more distal from
the East Greenland margin, which exhibit minor 13C-depletion, do not show evidence
of diagenetic overgrowth under the binocular.
In summary, the negative ∂13C excursions in the western Blosseville Basin
possibly reflect a primary and a secondary, methane-induced decrease in ∂13CDIC. The
authigenic carbonate overcrusts have additionally lowered foraminiferal ∂13C at the
site of maximum carbon isotope shift. Most likely they formed in a microenvironment
of high methane concentration in pore fluids, which locally caused a supersaturation
in isotopically light CaCO3 (discussed in detail in Chapter 3B). Methane may have
escaped the sea floor near to this location and may have diffused in the water column
slightly eastward in the basin, across the track of the EGC.
Chapter 1. Introduction
5
Chapter 3 - section B: Methane-induced early diagenesis of foraminiferal tests in
the southwestern Greenland Sea. It is a matter of ongoing debate, whether
extremely negative foraminiferal ∂13C values that are interpreted to reflect events of
clathrate destabilization and subsequent injections of methane into the ocean may
either derive from the DIC composition at primary calcification and/or from
authigenesis (Torres et al., 2003; Cannariato & Stott, 2004, Hill et al., 2004). Chapter
3B focuses on the relationship between extreme, possibly methane-induced planktic
and epibenthic 13C-depletions and features of diagenetic alteration of foraminifera.
SEM and light microscopic evidence revealed that 13C-depleted foraminifera
are enveloped by authigenic crusts which amount to 10 to 20 % of the total test, while
the remaining 80 to 90 % appears to be unaltered, primary calcite. This feature
likewise affects planktic, epi- and endobenthic species and consists of a
cryptocrystalline overgrowth on the external walls, whereas cryptocrystals are quasi-
prismatic and reach up to 10 µm within the chambers. Porous species as
Neogloboquadrina pachyderma sinistral are more extensively altered than less porous
species such as Cibicides lobatulus. Qualitative Electron Dispersive X-rays (EDX)
estimates of the elemental composition suggest that the overgrowth consists of calcite
enriched in manganese and iron. Foraminifera obtained from core intervals with
“normal” (0 ‰) ∂13C values appear largely unaffected by authigenetic alteration under
the SEM and do not reveal any enrichment in trace elements.
Two subsamples of N. pachyderma s. obtained from one and the same 13C-
depleted interval were progressively leached up to 30 and 60 % of the original mass
and subsequently analysed in order to reveal potential ∂13C changes. This experiment
relied on the assumption that primary and secondary calcite are differentially sensitive
to dissolution because of different crystal structures. Thus, differences in the isotopic
composition of both components might be inferred from differential post-leaching
∂13C values and a mass balance calculation. It turned out that specimens which
underwent leaching revealed slightly more negative ∂13C values than unleached
specimens. The mass balance indicated that both the primary and the authigenetic
component are 13C-depleted, the secondary, possibly authigenic overcrust being
isotopically lighter than the original tests. Hence, the ∂13C values of the primary
foraminiferal test are likely to document a negative excursion in ∂13CDIC, while the
∂13C of the overcrust may reflect the composition of 12C-enriched pore fluids.
Chapter 1. Introduction
6
Since the organic carbon content of Quaternary sediments at the East
Greenland slope is very low (Schlueter et al., 2001), thermal destabilization of
clathrates and subsequent release of methane is the most plausible explanation to
account for a simultaneous 12C-enrichment in pore fluids and ocean DIC. Oxidation of
methane in seawater may have driven a negative shift of ∂13CDIC, whereas pore water
methane may have led to supersaturation of isotopically light calcium carbonate
which eventually precipitated on and in foraminifera tests (in case the observed crusts
do not partially belong to the encrustations that are characteristic of N. pachyderma s.
that have reached an adult stage in the water column).
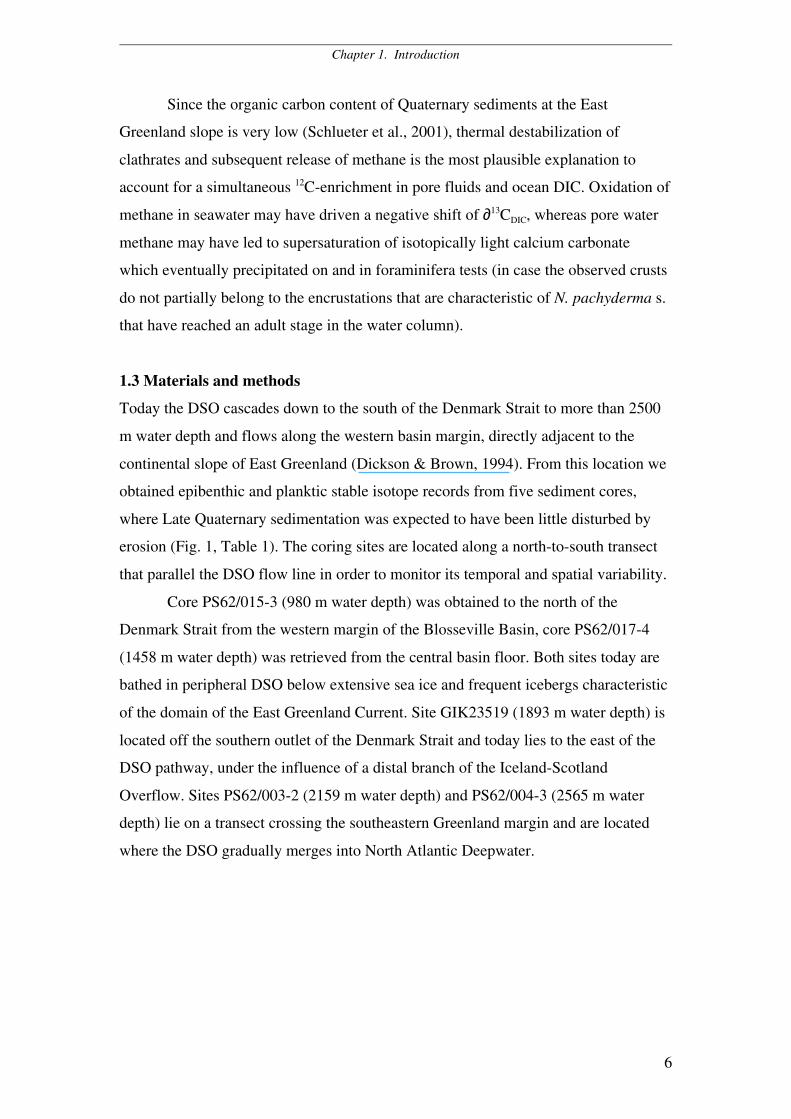
1.3 Materials and methods
Today the DSO cascades down to the south of the Denmark Strait to more than 2500
m water depth and flows along the western basin margin, directly adjacent to the
continental slope of East Greenland (Dickson & Brown, 1994). From this location we
obtained epibenthic and planktic stable isotope records from five sediment cores,
where Late Quaternary sedimentation was expected to have been little disturbed by
erosion (Fig. 1, Table 1). The coring sites are located along a north-to-south transect
that parallel the DSO flow line in order to monitor its temporal and spatial variability.
Core PS62/015-3 (980 m water depth) was obtained to the north of the
Denmark Strait from the western margin of the Blosseville Basin, core PS62/017-4
(1458 m water depth) was retrieved from the central basin floor. Both sites today are
bathed in peripheral DSO below extensive sea ice and frequent icebergs characteristic
of the domain of the East Greenland Current. Site GIK23519 (1893 m water depth) is
located off the southern outlet of the Denmark Strait and today lies to the east of the
DSO pathway, under the influence of a distal branch of the Iceland-Scotland
Overflow. Sites PS62/003-2 (2159 m water depth) and PS62/004-3 (2565 m water
depth) lie on a transect crossing the southeastern Greenland margin and are located
where the DSO gradually merges into North Atlantic Deepwater.
Chapter 1. Introduction
7
Table 1. New sediment records presented in this study
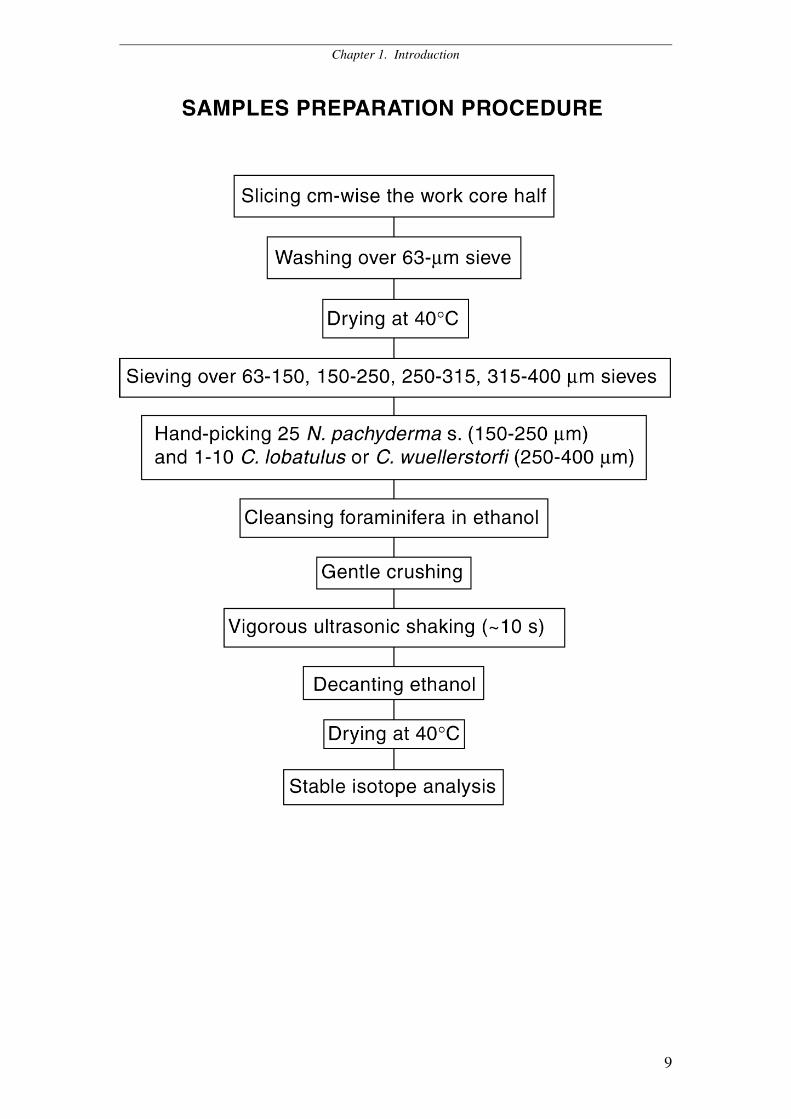
The work halves of the sediment cores were sampled centimeter-wise.
Sediment samples were washed over a 63-µm sieve and dried at 40 °C. Where
available, 25 specimens of N. pachyderma s. (150-250 µm) and 1 to 10 specimens of
C. wuellerstorfi or C. lobatulus (250-400 µm) were hand-picked for multiple and
Chapter 1. Introduction
8
single-specimen stable isotope analysis respectively. According to standard
preparation routine, foraminifera were cleansed in ethanol, gently crushed and treated
for 10 seconds in the ultrasonic bath. After vigorous ultrasonic shaking, undesired fine
carbonate debris, coccoliths, and other potential contaminants go into suspension and
may easily be eliminated by decanting the ethanol from the vial. Oxygen and carbon
stable isotope values were measured at the Leibniz Laboratory of Kiel University
using the Carboprep line and an automated MAT-251 mass spectrometer (analytical
precision: ± 0.07 ‰ for ∂18O, ± 0.05 ‰ for ∂13C). Stable isotope data (altogether 1532
measurements) are being stored at PANGAEA databank.
Epibenthic ∂18O values were adjusted to ∂18O values of Uvigerina peregrina
by adding 0.64 ‰ and used as proxy for bottom water density, assuming that sea
bottom temperature at the LGM was close to the freezing point and the temperature
effect on ∂18O changes can thus be ignored. Epibenthic ∂13C values, in turn, were used
as proxy for bottom water ventilation (Duplessy, 1982; Zahn et al., 1986, Curry et al.,
1988). We did not apply the +0.32 ‰ correction to glacial ∂13C values because they
would exceed the maximum ∂13C value of 2 ‰ resulting from physical fractionation
at the atmosphere-ocean interface.
Analysis of single-grain benthic foraminifera makes it possible to determine
the short-term variability of ∂18O and ∂13C values within each sample interval. This
variability may reveal whether some benthic foraminifera specimens calcified under
the influence of high salinity, dense brine water (Voelker, 1999) which is released
near to the sea surface during (seasonal) sea ice formation and is distinguished by
light ∂18O /∂13C signals at the sea floor (Veum et al., 1992). Furthermore, single-
specimen isotope data provide information about the range of absolute maximum and
minimum ∂18O and ∂13C values which document maxima and minima in bottom water
density and ventilation. This information is averaged out by using multiple-specimens
analyses.
The degree of (possibly methane-induced) diagenetic alteration of planktic and
benthic foraminifera at Site PS62/015-3 was assessed under the binocular with up to a
32 X magnification and with SEM. Qualitative estimates of the trace element
composition of the tests were obtained by EDX (CAMSCAN Serie 2 CS 44).
Foraminiferal specimens were fixed on a stub and subsequently coated with a mixture
of gold and palladium to improve backscatter.
Chapter 1. Introduction
9
Chapter 1. Introduction
10
1.4 Age control
The chronology of cores PS62/015-3 and PS62/017-4 is based on both ∂18O and
magnetic stratigraphy. Correlation of relative paleointensity and inclination with the
North Atlantic reference record NAPIS 75 (Laj et al., 2000) provided the
chronostratigraphic framework for the last 75 kyrs. Norwegian Basin (65 kyrs),
Laschamp (41 kyrs), and Mono Lake (34.5 kyrs) events of minimum magnetic
intensity served as major correlation markers. On the basis of this magneto-
stratigraphic framework planktic ∂18O records of cores PS62/015-3 and PS62/017-4
were tuned to the high-resolution planktic ∂18O record of neighbour core PS2644 the
chronology of which is based on densely-spaced 14C datings and on tuning to the
incremental time scale of GISP2 (Voelker et al., 1998). Abrupt light ∂18O spikes in
core PS2644 are accompanied by high percentages of ice-rafted debris and increased
percentages of N. pachyderma s., indicative of low sea surface temperature (Voelker
et al., 1998). Accordingly, these planktic ∂18O peaks are considered to reflect
meltwater pulses of Heinrich Events 1 to 6 and other cold DO stadials in GISP2
(Bond et al., 1993), meltwater pulses that spread far across the East Greenland
continental margin. Conversely, the end of each meltwater spike in the planktic ∂18O
record of core PS2644 was matched to phases of abrupt temperature rise on
Greenland.
The transition from the LGM to H1 is identified on the basis of a prominent
planktic ∂18O shift from 4.5 to 2.5 ‰ in the uppermost sections of cores PS2644,
PS62/015-3, and PS62/017-4. This shift forms a fundamental correlation marker
between the three planktic ∂18O records. Other major correlation markers are the
meltwater spikes corresponding to stadials such as Heinrich Events 3 (MIS 2/ MIS 3
boundary), H4, H5, H5.2, and H6 (MIS 3/ MIS 4 boundary). Since the chronology of
core PS2644 is tuned to GISP2, we used the GISP2 time scale (Grootes & Stuiver,
1997) as stratigraphic reference for MIS 3 and 4, whereas the lowermost portions of
the records were dated according to the North GRIP time scale (North Greenland Ice
Core Project Members 2004). The record of core PS62/015-3 reaches back to 86.5
kyrs, the center of MIS 5.2, whereas the record of core PS62/017-4 reaches MIS 5.1,
back to 78 kyrs.
Chapter 1. Introduction
11
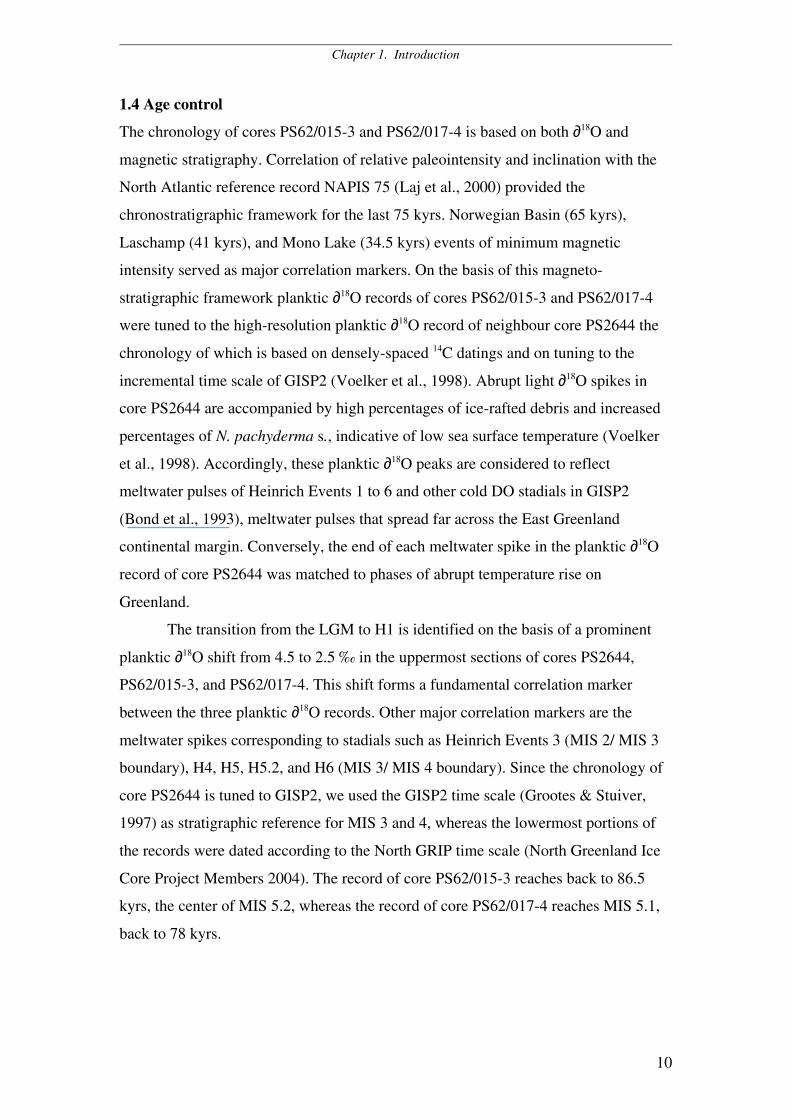
The age control of core GIK23519 is based on ∂18O stratigraphy and five 14C
datings for the interval spanning the LGM and Terminations IA and IB (Fig. 2; Table
2). Because of poor preservation of this gravity core near its top, we correlated the
upper section of the planktic ∂18O record with a record from a box corer retrieved at
the same location and produced a composite depth record for the Holocene.
Fig. 2. Planktic and epibenthic ∂18O records of Site 23519 plotted versus calendar age. LGM definedaccording to GLAMAP 2000 (Sarnthein et al., 2003). Arrows indicate positions of 14C ages. Areservoir effect correction of –400 yrs has been applied to all 14C ages. Nps = Neogloboquadrinapachyderma sin.; Cw = Cibicidoides wuellerstorfi.
Table 2. 14C datings in core 23519.
A plateau of constant maximum planktic ∂18O values of 4.5 to 4.7 ‰ and
benthic ∂18O values of 5.2 to 5.4 ‰ (Fig. 2) forms a most prominent stratigraphic
marker in GIK23519, which corresponds to the LGM according to the definition
(“Last Isotopic Maximum”) given by GLAMAP 2000 (Sarnthein et al., 2003). The
end of the LGM is characterized by an abrupt decrease in planktic ∂18O to values of
3.5 ‰, which is paralleled by a distinct drop of benthic ∂18O values from 5.3 to 4.25
‰. The latter may be partly interpreted as brine water signal resulting from enhanced
sea ice formation during H1 (Fig. 2). The Holocene is characterized by a gradual
decrease of benthic and planktic ∂18O values, interrupted by minor meltwater signals
in the planktic record.
Chapter 1. Introduction
12
The age models of cores PS62/003-2 and PS62/004-3 are based on correlation
of epibenthic ∂18O records with the densely 14C-dated epibenthic ∂18O record of
neighbour core SU90-24 (Elliot et al., 1998; Elliot et al., 2002).
For reasons of internal consistency we converted all 14C ages older than 13,000
years into calendar ages after Voelker et al. (1998) after deducing a global reservoir
age of – 400 years. However, Waelbroeck et al. (2001) demonstrated that the reservoir
age near the top of H1 (15 kyrs BP) was ~1800 years, whereas it was ~800 years at
the end of the Younger Dryas cold event (approximately 11.6 kyrs BP). Accordingly,
the timing of H1 in our age model may be overestimated by up to 1.4 kyrs.
Correlation of foraminiferal ∂18O records and magnetic intensities was carried
out by using the software AnalySeries, version 1.2 (Paillard et al., 1996). In summary,
planktic ∂18O records of cores PS62/015-3 and PS62/017-4 correlate with those of
core PS2644 with a squared correlation coefficient r2= 0.40 and 0.60 respectively. r2=
0.56 and 0.58 for the correlation between benthic ∂18O records of cores PS62/003-2
and PS62/004-3 versus SU90-24. Discrepancies are mainly due to a lower sampling
resolution of cores PS62/015-3 and PS62/017-4, and scarcity of epibenthic
foraminifera in various sections of cores PS62/003-2 and PS62/004-3.
Chapter 1. Introduction
13
References for Chapter 1
Blunier, T. & Brook, E.J. 2001: Timing of millennial-scale climate change in Antarctica andGreenland during the last glacial period. Science 291, 109-112.
Bond, G., Broeker, W., Johnsen, S., McManus, J., Labeyrie, L., Jouzel, J. & Bonani, G. 1993:Correlations between climate records from North Atlantic sediments and Greenland ice.Nature 365, 143-147.
Boyle, E.A. 1992: Cadmium and ∂13C paleochemical ocean distributions during the stage 2glacial maximum. Annual Reviews Earth Planetary Science 20, 245-287.
Cannariato, K.G. & Stott, L.D. 2004: Evidence against clathrate-derived methane release toSanta Barbara Basin surface waters? Geochemistry Geophysics Geosystems 5, doi.10.1029/2003GC000600.
Curry, W.B., Duplessy, J.C., Labeyrie, L.D. & Shackleton, N.J. 1988: Changes in thedistribution of ∂13C of deep water ΣCO2 between the last glaciation and the Holocene.Paleoceanography 3, 317-341.
Dickson, R.R. & Brown, J. 1994: The Production of North Atlantic Deep Water – Sources,Rates and Pathways. Journal of Geophysical Research C99, 12319-12341.
Dickson, B., Yashayaev, I., Meincke, J., Turrell, B., Dye, S. & Holfort, J. 2002: Rapidfreshening of the deep North Atlantic Ocean over the past four decades. Nature 416, 832-837.
Dokken, T.M. & Jansen, E. 1999: Rapid changes in the mechanism of ocean convectionduring the last glacial cycle. Nature 401, 458-461.
Duplessy, J.-C. 1982: North Atlantic Deep Water circulation during the last climatic cycle.Bulletin Institut de Geólogie de Bassin d’Aquitaine 31, 379-391.
Duplessy, J.-C., Shackleton, N.J., Fairbanks, R.G., Labeyrie, L., Oppo, D. & Kallel, N. 1988:Deepwater source variations during the last climatic cycle and their impact on the globaldeepwater circulation. Paleoceanography 3, 343-360.
Elliot, M., Labeyrie, L., Bond, G., Cortijo, E., Turon, J.L., Tisnerat, N. & Duplessy, J.-C.1998: Millennial-scale iceberg discharges in the Irminger Basin during the last glacial period:Relationship with the Heinrich events and environmental settings. Paleoceanography 13, 433-466.
Elliot, M., Labeyrie, L. & Duplessy, J.-C. 2002: Changes in North Atlantic deep-waterformation associated with the Dansgaard-Oeschger temperature oscillations (60-10 ka).Quaternary Science Reviews 21, 1153-1165.
Fleming, K. & Lambeck, K. 2004: Constraints on the Greenland Ice Sheet since the LastGlacial Maximum from sea-level observations and glacial-rebound models. QuaternaryScience Reviews 23, 1053-1077.
Ganopolski, A., Rahmstorf, S., Petoukhov, V. & Claussen, M. 1998: Simulation of modernand glacial climates with a coupled global model of intermediate complexity. Nature 391,351-356.

Chapter 1. Introduction
14
Grootes, P.M. & Stuiver, M. 1997: 18O/16O variability in Greenland snow and ice with 10-3 to105 year time resolution. Journal of Geophysical Research 102, 26455-26470.
Hagen, S. & Hald, M. 2002: Variation in surface and deep water circulation in the DenmarkStrait, North Atlantic, during marine isotope stages 3 and 2. Paleoceanography 17, 1-16.
Hansen, B. & Østerhus, S. 2000: North Atlantic-Nordic Seas exchanges. Progress inOceanography 45, 109-208.
Hansen, B., Turell, W.R. & Østerhus, S. 2001: Decreasing overflow from the Nordic Seasinto the Atlantic Ocean through the Faeroe-Shetland Channel since 1950. Nature 411, 927-930.
Hill, T.M., Kennett, J.P. & Spero, H.J. 2004: High-resolution records of methanehydrate dissociation: ODP Site 893, Santa Barbara Basin. Earth and Planetary ScienceLetters 223, 127-140.
Hill, T.M., Kennett, J.P. & Valentine, D.L. 2004: Isotopic evidence for the incorporation ofmethane-derived carbon into foraminifera from modern methane seeps, Hydrate Ridge,Northeast Pacific. Geochimica et Cosmochimica Acta 68, 4619-4627.
Jung, S. 1996: Wassermassenaustausch zwischen NE-Atlantik und Nordmeer waehrend derletzen 300,000/ 80,000 Jahre im Abbild stabiler O- und C-Isotope. Berichte aus demSonderforschungsbereich 313 nr. 61, University of Kiel, 104 pp.
Koesters, F., Kaese, R., Fleming, K. & Wolf, D. 2004: Denmark Strait overflow for LastGlacial maximum to Holocene conditions. Paleoceanography 19, PA2019.
Laj, C., Kissel, C., Mazaud, A., Channell, J.E.T. & Beer, J. 2000: North Atlanticpaleointensity stack since 75 ka (NAPIS-75) and the duration of the Laschamp event. RoyalSociety of London Philosophical Transactions, ser. A vol. 358, 1009-1025.
Lambeck, K. & Chappell, J. 2001: Sea level change through the last glacial cycle. Science292, 679-686.
Larsen, B. 1983: Geology of the Greenland-Iceland Ridge in the Denmark Strait. In Bott,M.H.P., Saxov, S., Talwani, M. & Thiede, J. (eds.): Structure and Development of theGreenland-Scotland Ridge: New Methods and Concepts, 425-444. Plenum Press, New York.
McManus, J.F., Francois, R., Gheradi, J.M., Keigwin, L.D. & Brown-Leger, S. 2004:Collapse and rapid resumption of Atlantic meridional circulation linked to deglacial climatechanges. Nature 428, 834-837.
Norgaard-Pedersen, N., Spielhagen, R.F., Erlenkeuser, H., Grootes, P.M., Heinemeier, J. &Knies, J. 2003: Arctic Ocean during the Last Glacial Maximum: Atlantic and polar domainsof surface water mass distribution and ice cover. Paleoceanography 18, 8.
North Greenland Ice Core Project members 2004: High-resolution record of NorthernHemisphere climate extending into the last interglacial period. Nature 431, 147-151.
Paillard, D., Labeyrie, L. & Yiou, P. 1996: Macintosh program performs time-series analysis.EOS Transactions A m e r i c a n G e o p h y s i c a l U n i o n 77, 379.
Chapter 1. Introduction
15
Paul, A. & Schäfer-Neth, C. 2003: Modeling the water masses of the Atlantic Ocean at thelast Glacial Maximum. Paleoceanography 18, 3.
Rasmussen, T.L. & Thomsen, E. 2004: The role of the North Atlantic Drift in the millennialtimescale glacial climate fluctuations. Palaeogeography, Palaeoclimatology, Palaeoecology210, 101-116.
Sarnthein, M., Pflaumann, U. & Weinelt, M. 2003: Past extent of sea ice in the northern NorthAtlantic inferred from foraminiferal paleotemperature estimates.Paleoceanography 18, 1-8.
Sarnthein, M., Winn, K., Jung, S.J.A., Duplessy, J.-C., Labeyrie, L., Erlenkeuser, H. &Ganssen, G. 1994: Changes in east Atlantic deepwater circulation over the last 30,000 years:Eight time slice reconstructions. Paleoceanography 9, 209-267.
Schlueter, M., Sauter, E.J., Schulz-Bull, D., Balzer, W. & Suess, E. 2001: Fluxes of organiccarbon and biogenic silica reaching the seafloor: A comparison of high northern and southernlatitudes of the Atlantic Ocean. In Schaefer, P. et al. (eds.): The Northern North Atlantic: Achanging environment, 225-240. Springer, Berlin.
Skinner, L.C. & Shackleton, N.J. 2004: Rapid transient changes in the northeast Atlantic deepwater ventilation age across termination I. Paleoceanography 19, PA 2005.
Torres, M.E., Mix, A.C., Kinports, K., Haley, B., Klinkhammer, G.P., McManus, J. & deAngelis, M.A. 2003: Is methane venting at the seafloor recorded by ∂13C of benthicforaminifera shells? Paleoceanography 18, 1062.
van Kreveld, S., Sarnthein, M., Erlenkeuser, H., Grootes, P., Jung, S., Nadeau, M.J.,Pflaumann, U. & Voelker, A. 2000: Potential links between surging ice sheets, circulationchanges, and the Dansgaard-Oeschger cycles in the Irminger Sea, 60-18 kyr.Paleoceanography, 15, 425-442.
Veum, T., Jansen, E., Arnoldt, M., Beyer, I. & Duplessy, J.-C. 1992: Water mass exchangebetween the North Atlantic and the Norwegian Sea during the past 28.000 years. Nature 356,783-785.
Voelker, A.H. 1999: Zur Deutung der Dansgaard-Oeschger Ereignisse in ultra-hochauflösenden Sedimentprofilen aus dem Europäischen Nordmeer. Ph.D. thesis, Universityof Kiel, 180 pp.
Voelker, A. H., Sarnthein, M., Grootes, P.M., Erlenkeuser, H., Laj, C., Mazaud, A., Nadeau,M. J. & Schleicher, M. 1998: Correlation of marine 14C ages from the Nordic Seas with theGISP2 isotope record: implications for 14C calibration beyond 25 ka BP. Radiocarbon 40,517-534.
Waelbroeck, C., Duplessy, J.-C., Michel, E., Labeyrie, L., Paillard, D. & Duprat, J. 2001: Thetiming of the last deglaciation in North Atlantic climate records. Nature 412, 724-726.
Weinelt, M., Sarnthein, M., Pflaumann, U., Schulz, H., Jung, S. & Erlenkeuser, H. 1996: Ice-free Nordic Seas during the Last Glacial Maximum? Potential sites of deepwater formation.Paleoclimate 1, 283-309.
Whitehead, J.A., Leetmaa, A. & Knox, R.A. 1974: Rotating hydraulics of strait and sill flows.Geophysical Fluid Dynamics 6, 101-125.
Chapter 1. Introduction
16
Yu, E.-F., Francois, R. & Bacon, M.P. 1996: Similar rates of modern and last-glacial oceanthermohaline circulation inferred from radiochemical data. Nature 379, 689-694.
Zahn, R., Sarnthein, M. & Erlenkeuser, H. 1987: Benthos isotopic evidence for changes of theMediterranean outflow during the late Quaternary. Paleoceanography 2, 543-559.
Zahn, R., Winn, K. & Sarnthein, M. 1986: Benthic foraminiferal ∂13C and accumulation ratesof organic carbon: Uvigerina peregrina group and Cibicidoides wuellerstorfi.Paleoceanography 1, 27-42.
Chapter 2. LGM Variability of the Denmark Strait Overflow
17
CHAPTER 2
Variability of the Denmark Strait Overflow
during the Last Glacial Maximum
CHRISTIAN MILLO, MICHAEL SARNTHEIN, ANTJE VOELKER ANDHELMUT ERLENKEUSER
Christian Millo ([email protected]) and Michael Sarnthein, Department of Geology, Christian-Albrechts-Universitaet, Olshausenstrasse 40, D-24118 Kiel, Germany;
Antje Voelker, INETI Department of Marine Geology, Estrada da Portela, Zambujal,2720 Alfragide, Portugal;
Helmut Erlenkeuser, Leibniz-Labor for Radiometric Dating and Isotope Research, Max-Eyth-Strasse11, D-24118 Kiel, Germany.
Accepted for publication in Boreas on 28 July 2005
Abstract
The Denmark Strait Overflow (DSO) today compensates for the northward flowing
Norwegian and Irminger branches of the North Atlantic Current that drive the Nordic
heat pump. During the Last Glacial Maximum (LGM) ice sheets constricted the
Denmark Strait aperture in addition to ice eustatic/isostatic effects which reduced its
depth (today ~630 m) by ~130 m. These factors combined with a reduced north-south
density gradient of the water masses are expected to have restricted or even reversed
the LGM DSO intensity. To better confine these boundary conditions, we present a
first reconstruction of the glacial DSO, using four new and four published epibenthic
and planktic stable-isotope records from sites to the north and south of the Denmark
Strait. The spatial and temporal distribution of epibenthic δ18O and δ13C maxima
reveals a north-south density gradient at intermediate water depths from σ0 ~28.7 to
28.4 / 28.1 and suggests that dense and highly ventilated water was convected in the
Nordic Seas during the LGM. On the other hand, extremely high epibenthic δ13C
values on top of the Mid Atlantic Ridge document a further convection cell of Glacial
North Atlantic Intermediate Water to the south of Iceland, which however was
Chapter 2. LGM Variability of the Denmark Strait Overflow
18
marked by much lower density (σ0 ~28.1). The north-south gradient of water density
possibly implied that the glacial DSO was directed to the south like today and fed
Glacial North Atlantic Deepwater that has underthrusted the Glacial North Atlantic
Intermediate Water in the Irminger Basin.
2.1 Introduction
The Denmark Strait, together with the Iceland-Faeroe and the Faeroe-Shetland
Channel today form the most important gateway for meridional ocean circulation in
the northern hemisphere (Dickson & Brown 1994). Deepwater originating from
winter convection in the Nordic Seas forms huge currents of cold and dense water,
which cross these passages and cascade into the northern North Atlantic,
compensating for the northward inflow of relatively warm and saline surface water
carried by the North Atlantic Current and its ramifications. Hansen & Østerhus (2000)
calculated that the Norwegian and Greenland Seas today receive a total flux of
approximately eight Sverdrups (Sv), that is 8 x 10⁶ m3/s, advected by the North
Atlantic Current and its branches (Fig. 1). The Arctic Ocean receives an additional
flux of 1 Sv from the Pacific Ocean via the Bering Strait. This inflow is balanced by
the outflow across the Canadian Archipelago (1.7 Sv), along the eastern Greenland
shelf (East Greenland Current, 1.3 Sv), and at intermediate depths by the Iceland-
Shetland Overflow (3 Sv) and the Denmark Strait Overflow (DSO) (3 Sv) (Fig. 1).
This mass balance is a key factor governing the poleward heat transport in the
northern hemisphere and has a strong influence on the climate in Europe and total
Eurasia.
The DSO has particular climatic relevance in that it may influence the
intensity of North Atlantic Deep Water (NADW) circulation (Gerdes & Köberle 1995;
Dickson et al. 1997; Dörscher & Redler 1997). The strength of DSO mainly depends
on the density gradient between water masses to the north and south of the Denmark
Strait and the height of dense water above the strait’s sill (Whitehead et al. 1974).
Variations in density contrast may arise from episodic meltwater discharge from sea
ice and nearby ice sheets. It has recently been shown that the density σ0 of DSO
diminished by about 0.02 over the last forty years due to a 0.035‰ salinity decrease
(Dickson et al. 2002). This freshening was accompanied by a 20% decrease in the
Faeroe component of the Overflow (Hansen et al. 2001). South of the Denmark Strait
Chapter 2. LGM Variability of the Denmark Strait Overflow
19
the DSO cascades down to more than 2500 m water depth, forming a major source of
NADW (Fig. 2).
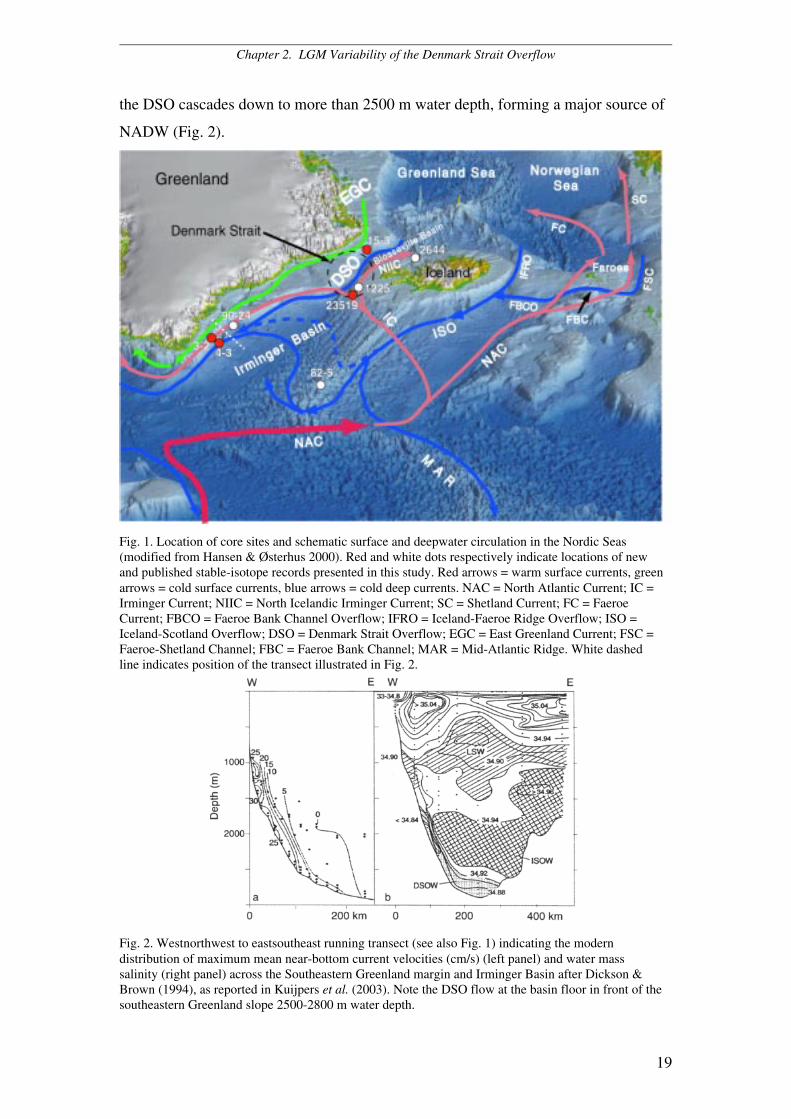
Fig. 1. Location of core sites and schematic surface and deepwater circulation in the Nordic Seas(modified from Hansen & Østerhus 2000). Red and white dots respectively indicate locations of newand published stable-isotope records presented in this study. Red arrows = warm surface currents, greenarrows = cold surface currents, blue arrows = cold deep currents. NAC = North Atlantic Current; IC =Irminger Current; NIIC = North Icelandic Irminger Current; SC = Shetland Current; FC = FaeroeCurrent; FBCO = Faeroe Bank Channel Overflow; IFRO = Iceland-Faeroe Ridge Overflow; ISO =Iceland-Scotland Overflow; DSO = Denmark Strait Overflow; EGC = East Greenland Current; FSC =Faeroe-Shetland Channel; FBC = Faeroe Bank Channel; MAR = Mid-Atlantic Ridge. White dashedline indicates position of the transect illustrated in Fig. 2.
Fig. 2. Westnorthwest to eastsoutheast running transect (see also Fig. 1) indicating the moderndistribution of maximum mean near-bottom current velocities (cm/s) (left panel) and water masssalinity (right panel) across the Southeastern Greenland margin and Irminger Basin after Dickson &Brown (1994), as reported in Kuijpers et al. (2003). Note the DSO flow at the basin floor in front of thesoutheastern Greenland slope 2500-2800 m water depth.
Chapter 2. LGM Variability of the Denmark Strait Overflow
20
Even more severe changes in Overflow intensity are expected to have occurred
on geological time scales, with interesting consequences on Atlantic thermohaline
circulation (THC) and global climate. During the last glacial period the Denmark
Strait sill depth varied significantly, in response to eustatic sea level reduction by 120
to 130 m (Peltier 1994; Lambeck & Chappell 2001; Clark & Mix 2002) and glacio-
eustatic rebounds induced by changes in the volume of continental ice sheets in
Greenland and Iceland (Fleming & Lambeck 2004). Accordingly, the maximum sill
depth of the Denmark Strait (today 630 m) was reduced by about 130 m. In addition,
ice sheets on the Greenland and Icelandic shelves (Larsen 1983) constricted
considerably the Denmark Strait aperture from both sides. Accordingly, one may
expect that the intensity of DSO during the Last Glacial Maximum (LGM) was
reduced. Numerical models employed to simulate the strength of NADW formation
produce results that appear still inconsistent since the hydrological cycle is poorly
represented (Joussaume & Taylor 2000). Some models indeed show that the LGM
North Atlantic THC was weaker or reversed (Ganopolski et al. 1998; Prange et al.
2002; Schmittner et al. 2002; Kim et al. 2003). Koesters et al. (2004) locally
constrained the glacial DSO to trickling 0.7 Sv. In contrast, other models even suggest
an invigorated glacial overturning (i.e. Kitoh et al. 2001; Hewitt et al. 2003).
Most empiric reconstructions of bottom and intermediate water ventilation
during the LGM were based on epibenthic foraminifera δ13C and point to a major
reduction in glacial NADW formation accompanied by a far northward intrusion of
Antarctic Bottom Water (Curry et al. 1988; Duplessy et al. 1988; Sarnthein et al.
1994; Skinner & Shackleton 2004). These results are in harmony with estimates of
deepwater export from the North Atlantic based on foraminiferal Cd/Ca (Boyle 1992)
and sediment 231Pa/230Th records (Yu et al. 1996; McManus et al. 2004). Various
model simulations suggest that the LGM convection cells were located to the south of
the Greenland-Scotland Ridge (Ganopolski et al. 1998), since CLIMAP (1981) had
reconstructed a perennial sea ice cover for the Nordic Seas during glacial times.
However, Weinelt et al. (1996), Sarnthein et al. (2003), and Nørgaard-Pedersen et al.
(2003) demonstrated that the peak glacial Nordic Seas were largely ice-free during
summer. In harmony with these findings, Voelker (1999) and Dokken & Jansen
(1999) showed that deepwater formed more or less continuously in the Nordic Seas
over the last 60 to 10 kyr, driven by two different mechanisms, open-ocean
Chapter 2. LGM Variability of the Denmark Strait Overflow
21
convection during interstadials and/or brine rejection during stadials. This conclusion
is supported by the model of Paul & Schäfer-Neth (2003), suggesting ongoing LGM
convection in the Nordic Seas.
In this paper, we present a detailed reconstruction of the variability of the DSO for the
LGM. We present bottom and intermediate water flow directions through the
Denmark Strait and potential sources of deepwater on the basis of four new and four
published benthic foraminifera stable-isotope records obtained from sediment cores
retrieved to the north and south of the Denmark Strait (Fig. 1). Two core sites today
lie below the Irminger Current, the other coring sites lie below the EGC and are
bathed in peripheral DSO.
2.2 Materials and methods
To trace the spatial and temporal variability of the DSO we obtained epibenthic and
planktic stable-isotope records from four sediment cores retrieved along the eastern
margin of the path of the Overflow (Fig. 1; Table 1). Site PS62/015-3 (henceforth
referred to as site/core 15-3) is located at the East Greenland slope north of the
Denmark Strait, Site GIK23519 (henceforth 23519) lies at the southern outlet of the
strait, whereas Sites PS62/003-2 and PS62/004-3 (henceforth 3-2 and 4-3) lie on a
transect crossing the south-eastern Greenland margin. We also included data from Site
PS2644 (henceforth 2644) on the north-western slope of Iceland (Voelker 1999) and
published data of cores JM96-1225 (henceforth 1225) (Hagen & Hald 2002), SU90-
24 (henceforth 90-24) (Elliot et al. 2002), and SO82-5 (henceforth 82-5) (Jung 1996;
van Kreveld et al. 2000) to establish palaeoceanographic transects across the Irminger
Basin.
Table 1. New sediment records presented in this study
Core Recovery(m)
Latitude Longitude Water depth(m)
Average samplingresolution (cm)
PS62/015-3 6.36 67° 55.855’ N 25° 25.590’ W 980 5GIK 23519 6.41 64° 47.840’ N 29° 35.750’ W 1893 1 to 5PS62/003-2 12.40 61° 42.003’ N 39° 04.041’ W 2159 10PS62/004-3 12.96 61° 31.559’ N 38° 07.387’ W 2565 5 to 10
Sediment cores were sampled in slices 1 cm thick. Samples were washed over
a 63-µm sieve and dried at 40°C. Where available 25 specimens of the planktic
foraminifera Neogloboquadrina pachyderma sinistral (Nps) (150-250 µm) and 1 to 10
specimens of the epibentic Cibicidoides wuellerstorfi, Cibicides lobatulus, and
Chapter 2. LGM Variability of the Denmark Strait Overflow
22
Cibicidoides pachyderma (250-400 µm) were hand-picked for multi- and single-
specimen stable-isotope analyses. Isotopic data of core 2644 are from Voelker (1999).
Where possible, stable-isotope analyses were carried out on single benthic
foraminifera. This method makes it possible to distinguish populations of specimens
which calcified their shells in “normally” convected deepwater from shells under the
influence of brine water, which therefore are characterized by lighter carbon and
oxygen isotopic values. Due to the low weight of epibenthic foraminifera at Sites 3-2
and 4-3, most benthic isotope data were based on analyses of 2 to 3 specimens. A
number of core sections were barren of any benthic foraminifera specimens.
Foraminiferal samples were gently crushed, ultrasonically cleaned in ethanol,
and dried. Oxygen and carbon stable-isotopes were measured at the Leibniz
Laboratory of Kiel University using the Kiel Carboprep line and an automated MAT-
251 mass spectrometer (analytical precision: ± 0.07‰ for δ18O, ± 0.05‰ for δ13C).
For selected past time intervals, epibenthic δ13C and δ18O values were averaged for
each of the investigated sites. Isotope values interpreted as brine water influenced
were not included into the average.
Epibenthic δ18O values were adjusted to δ18O values of Uvigerina peregrina
by adding 0.64‰ and used as proxy for bottom water density, assuming that sea
bottom temperature at the LGM was close to the freezing point and the temperature
effect on δ18O changes can thus be ignored. Epibenthic δ13C values, in turn, were used
as proxy for bottom water ventilation (Duplessy 1982; Zahn et al. 1986; Curry et al.
1988). δ13C signals of the three epibenthic Cibicidoides / Cibicides species outlined
above are regarded as equally suitable for reconstructing the nutrient content of
bottom water masses, as shown for C. wuellerstorfi and C. lobatulus by Weinelt et al.
(2001). Voelker (1999) demonstrated by multiple analyses of single specimens of C.
lobatulus and C. pachyderma that δ13C values of these two species don’t show any
offset. On the other hand, Mackensen & Licari (2004) reported on δ13C of “living” C.
wuellerstorfi from the South Atlantic, that exceeds the values of “living” C.
pachyderma and C. lobatulus by 0.2 to 0.6‰. The δ13C values measured in cores to
the north to the Denmark Strait are derived from C. pachyderma and C. lobatulus
only, whereas the values from the Irminger Basin to the south are based on C.
wuellerstorfi only. Accordingly, the glacial δ13C values reconstructed for the
Blosseville Basin in the north may be underestimated by 0.3‰.
Chapter 2. LGM Variability of the Denmark Strait Overflow
23
We did not apply the +0.32‰ correction to glacial δ13C values because they would
exceed the maximum δ13C value of 2‰ resulting from physical fractionation at the
atmosphere-ocean interface. Spatial density gradients and the patterns of bottom water
ventilation were plotted on vertical palaeoceanographic sections similar to those in
Zahn et al. (1987). For this purpose, LGM stable-isotope values from each coring site
were horizontally projected onto virtual vertical planes crossing the study area from
north-east to south-west and west to east assuming horizontal water mass
stratification, that is ignoring the asymmetries due to Coriolis forcing.
2.3 Age control
Chronology of core 15-3 is based on both magnetic and δ18O stratigraphy. Correlation
of relative magnetic palaeointensity and inclination with the North Atlantic reference
record NAPIS 75 (Laj et al. 2000) form the framework for long-term age control for
the last 75 kyr. The Norwegian Basin (65 kyr), Laschamp (41 kyr), and Mono Lake
(34.5 kyr) events of minimum palaeointensity were identified as major correlation
markers. This magneto-stratigraphic framework formed the basis for a stratigraphic
correlation of the planktic δ18O record of Site 15-3 with the high-resolution planktic
δ18O record of neighbour core 2644 (Millo et al. in press). The latter record has a
robust chronology based on densely spaced 14C datings and on tuning of the planktic
δ18O record to the incremental time scale of the GISP2 ice core (Voelker et al. 1998;
Voelker et al. 2000). Age models of cores 3-2 and 4-3 are based on correlation of
epibenthic δ18O records with the 14C-dated epibenthic δ18O record of neighbour core
90-24 (Elliot et al. 1998; Elliot et al. 2002). The sediment record of core 4-3 does not
reach the LGM but ends at the beginning of Marine Isotope Stage 2 (Fig. 4).
Correlation amongst the various δ18O records was established using the
software AnalySeries, version 1.2 (Paillard et al. 1996). In summary, planktic δ18O
record of core 15-3 correlates with those of 2644 with a squared correlation
coefficient r2 = 0.40, whereas r2 = 0.56 / 0.58 for the correlation between benthic δ18O
records of cores 3-2 and 4-3 versus 90-24. Discrepancies are mainly due to still
inadequate sampling resolution of core 15-3 and the lack of benthic foraminifera
specimens in various sections of cores 3-2 and 4-3.
The age control of core 23519 is based on δ18O stratigraphy, refined by five14C datings for the interval spanning the LGM, Heinrich event I (H1), and
Chapter 2. LGM Variability of the Denmark Strait Overflow
24
Termination IA and IB. For reasons of internal consistency we converted 14C dates
older than 13 000 years into calibrated ages after Voelker et al. (1998) after deducing
a global reservoir age of – 400 years. We are aware that in the North Atlantic region
the reservoir effect near the end of H1 (15 kyr BP) as well as near the end of the
Younger Dryas cold spell (approximately 11.6 kyr BP) was significantly higher than
400 years (Waelbroeck et al. 2001). This implies that the timing of H1 may be
overestimated in our age models by up to 1.5 kyr. We followed the definition of the
LGM time slice given by GLAMAP 2000 (Sarnthein et al. 2003). This definition
relies on the assumption that foraminiferal δ18O maxima in the North Atlantic Ocean
correspond to the maximum extent of global ice sheets.
2.4 Results
Epibenthic δ18O record for the LGM and H1
In our study region the benthic δ18O values reach fairly constant maxima of 5.20 to
5.55‰ during the LGM (Fig. 3A, B). In addition, there are several episodes of
significantly lighter δ18O values which interrupt these plateaus. These events are
particularly evident in the single-specimen benthic δ18O records of cores 2644, 23519,
and 15-3 where the isotope data reveal two distinct subgroups, one of them with a
significant δ18O offset toward lighter values (Fig. 3A, B). These abrupt benthic δ18O
excursions probably derived from short-term, possibly seasonal injections of high-
density brine water as the result of sea-ice melt and formation in the surface ocean
(Veum et al. 1992). These light values were excluded from the averages in Fig. 3.
During the LGM, the absolute benthic δ18O signal culminates with values
between 5.55 and 5.30‰ at the north-western Icelandic slope (2644) and values of
5.48 to 5.06‰ at Site 15-3 (Fig. 3A). At the southern entrance to the Denmark Strait
Site 23519 shows benthic δ18O values of 5.43 to 4.87‰ (Fig. 3B) whereas at the
south-eastern Greenland slope δ18O values span between 5.51 and 5.33‰ (Site 90-24,
Elliot et al. 2002) (Fig. 4) and reach 5.35‰ at Site 3-2 (Fig. 3B). The onset of the
meltwater regime of H1 was characterized by particularly distinct brine water spikes
in the benthic δ18O records at Sites 2644, 15-3, and 23519, signals that matched the
abrupt meltwater-induced decrease in planktic δ18O at the inception of H1 (Fig. 3A,
B).
Chapter 2. LGM Variability of the Denmark Strait Overflow
25
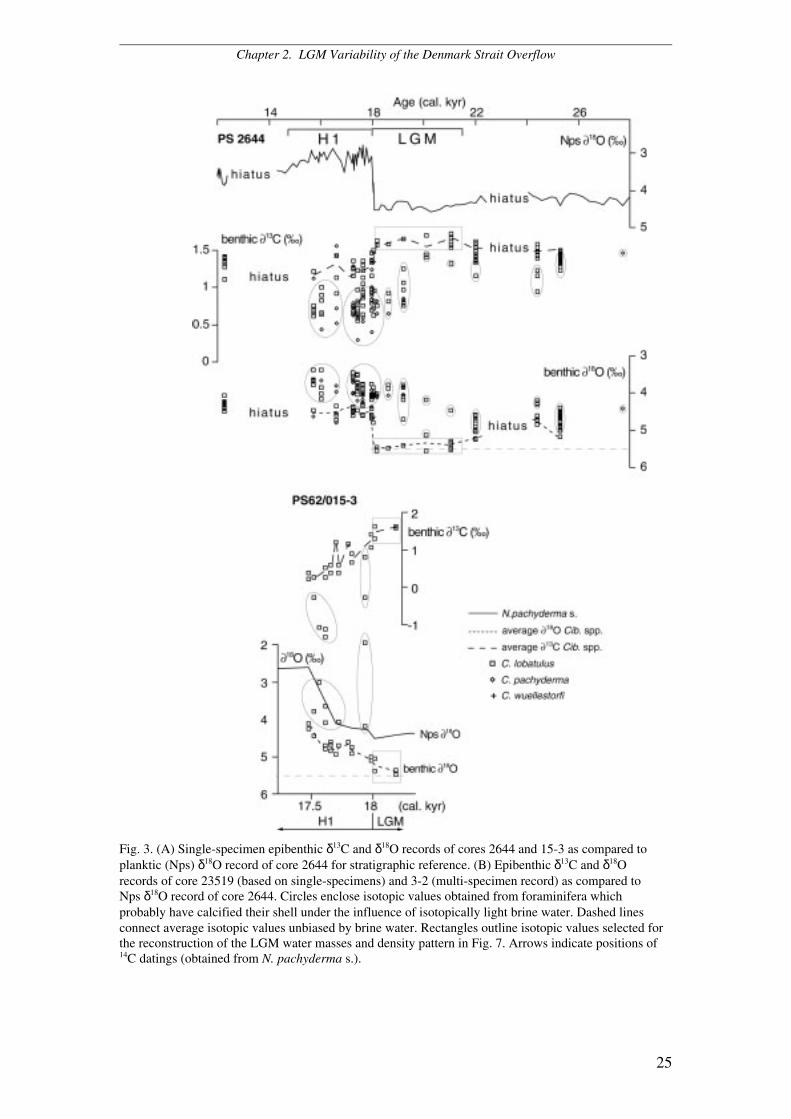
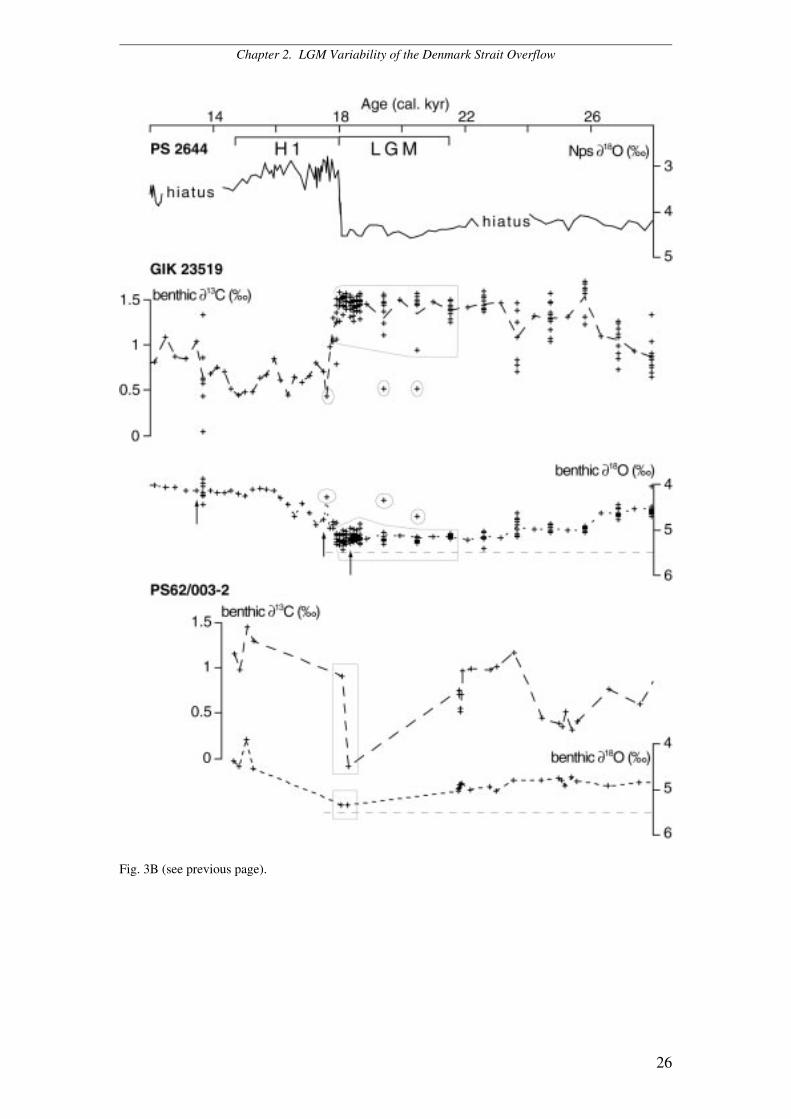
Fig. 3. (A) Single-specimen epibenthic δ13C and δ18O records of cores 2644 and 15-3 as compared toplanktic (Nps) δ18O record of core 2644 for stratigraphic reference. (B) Epibenthic δ13C and δ18Orecords of core 23519 (based on single-specimens) and 3-2 (multi-specimen record) as compared toNps δ18O record of core 2644. Circles enclose isotopic values obtained from foraminifera whichprobably have calcified their shell under the influence of isotopically light brine water. Dashed linesconnect average isotopic values unbiased by brine water. Rectangles outline isotopic values selected forthe reconstruction of the LGM water masses and density pattern in Fig. 7. Arrows indicate positions of14C datings (obtained from N. pachyderma s.).
Chapter 2. LGM Variability of the Denmark Strait Overflow
26
Fig. 3B (see previous page).
Chapter 2. LGM Variability of the Denmark Strait Overflow
27
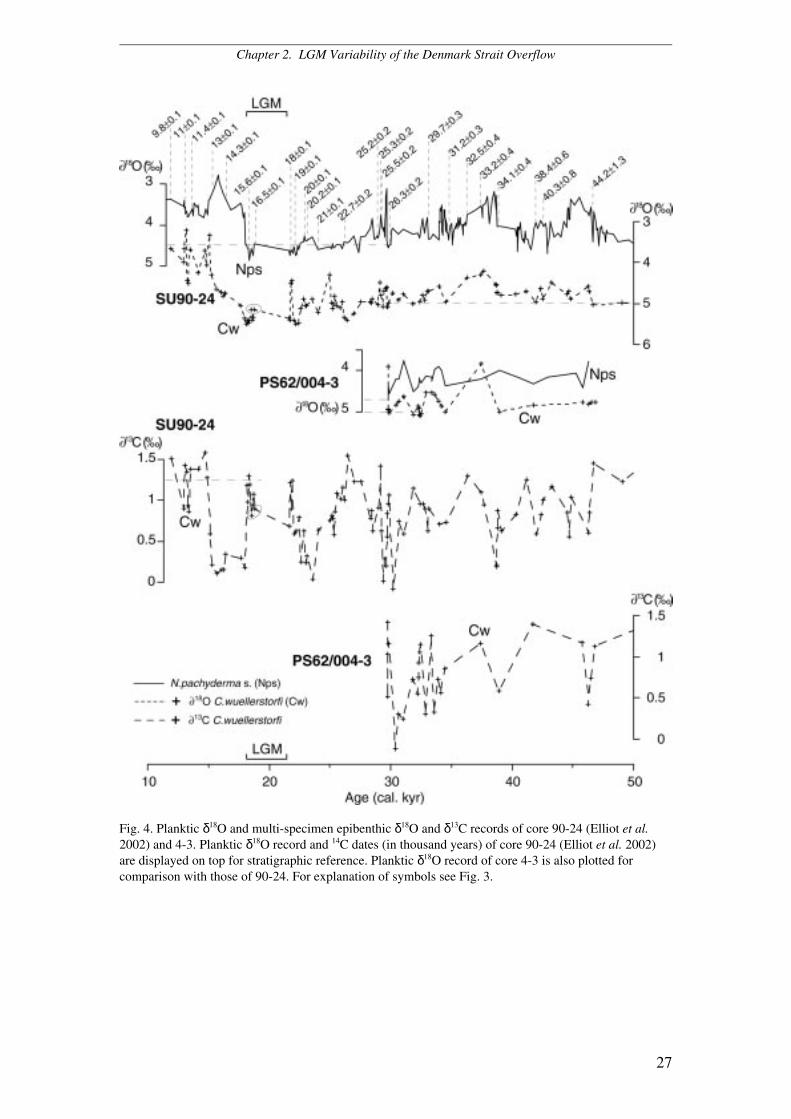
Fig. 4. Planktic δ18O and multi-specimen epibenthic δ18O and δ13C records of core 90-24 (Elliot et al.2002) and 4-3. Planktic δ18O record and 14C dates (in thousand years) of core 90-24 (Elliot et al. 2002)are displayed on top for stratigraphic reference. Planktic δ18O record of core 4-3 is also plotted forcomparison with those of 90-24. For explanation of symbols see Fig. 3.
Chapter 2. LGM Variability of the Denmark Strait Overflow
28
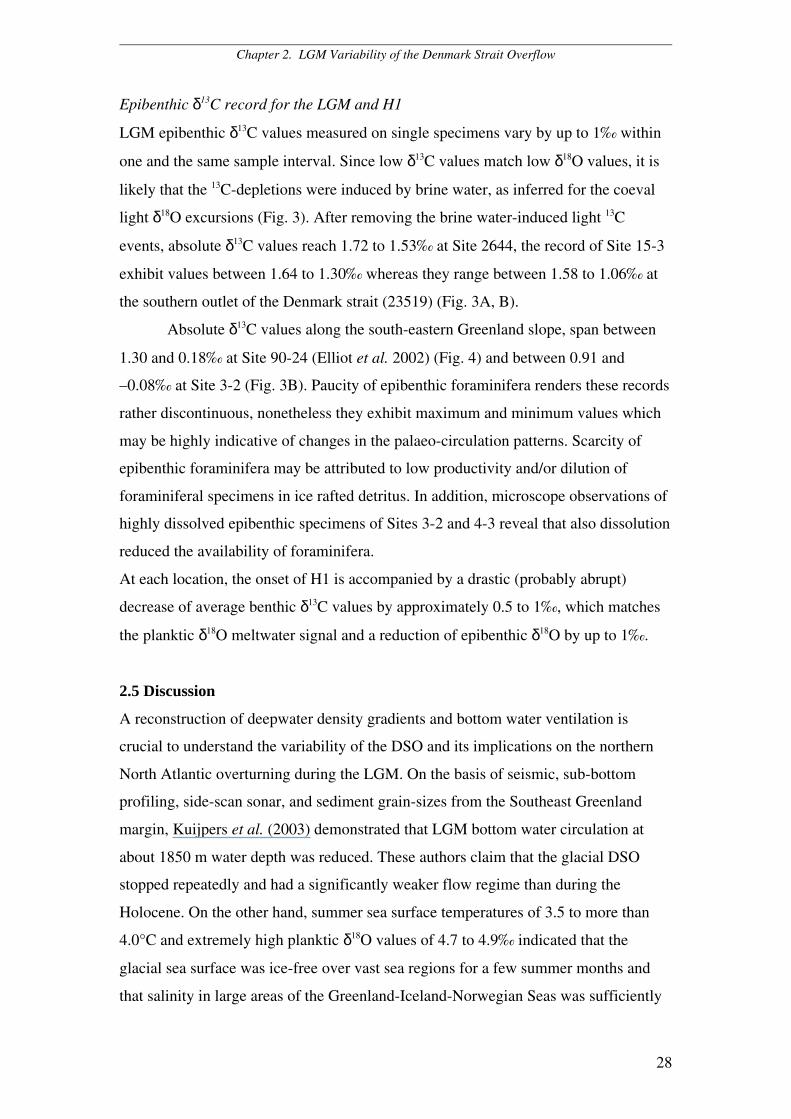
Epibenthic δ13C record for the LGM and H1
LGM epibenthic δ13C values measured on single specimens vary by up to 1‰ within
one and the same sample interval. Since low δ13C values match low δ18O values, it is
likely that the 13C-depletions were induced by brine water, as inferred for the coeval
light δ18O excursions (Fig. 3). After removing the brine water-induced light 13C
events, absolute δ13C values reach 1.72 to 1.53‰ at Site 2644, the record of Site 15-3
exhibit values between 1.64 to 1.30‰ whereas they range between 1.58 to 1.06‰ at
the southern outlet of the Denmark strait (23519) (Fig. 3A, B).
Absolute δ13C values along the south-eastern Greenland slope, span between
1.30 and 0.18‰ at Site 90-24 (Elliot et al. 2002) (Fig. 4) and between 0.91 and
–0.08‰ at Site 3-2 (Fig. 3B). Paucity of epibenthic foraminifera renders these records
rather discontinuous, nonetheless they exhibit maximum and minimum values which
may be highly indicative of changes in the palaeo-circulation patterns. Scarcity of
epibenthic foraminifera may be attributed to low productivity and/or dilution of
foraminiferal specimens in ice rafted detritus. In addition, microscope observations of
highly dissolved epibenthic specimens of Sites 3-2 and 4-3 reveal that also dissolution
reduced the availability of foraminifera.
At each location, the onset of H1 is accompanied by a drastic (probably abrupt)
decrease of average benthic δ13C values by approximately 0.5 to 1‰, which matches
the planktic δ18O meltwater signal and a reduction of epibenthic δ18O by up to 1‰.
2.5 Discussion
A reconstruction of deepwater density gradients and bottom water ventilation is
crucial to understand the variability of the DSO and its implications on the northern
North Atlantic overturning during the LGM. On the basis of seismic, sub-bottom
profiling, side-scan sonar, and sediment grain-sizes from the Southeast Greenland
margin, Kuijpers et al. (2003) demonstrated that LGM bottom water circulation at
about 1850 m water depth was reduced. These authors claim that the glacial DSO
stopped repeatedly and had a significantly weaker flow regime than during the
Holocene. On the other hand, summer sea surface temperatures of 3.5 to more than
4.0°C and extremely high planktic δ18O values of 4.7 to 4.9‰ indicated that the
glacial sea surface was ice-free over vast sea regions for a few summer months and
that salinity in large areas of the Greenland-Iceland-Norwegian Seas was sufficiently
Chapter 2. LGM Variability of the Denmark Strait Overflow
29
high for (short-term) seasonal deepwater convection (Weinelt et al. 1996; Sarnthein et
al. 2003). In addition, benthic δ13C-based reconstructions of the spatial pattern of the
LGM intermediate and deepwater ventilation in the Northern North Atlantic suggest
that Glacial Upper North Atlantic Deepwater (GNADW) was formed or even
enhanced to the south of Iceland at water depths similar to those of modern Labrador
Sea Water (Jung 1996). In summary, one may expect that a minor DSO was active
during the LGM, even though its flow direction might have been occasionally
reversed. In addition, model experiments of Koesters et al. (2004) predict that the
density contrast between north and south of the Denmark Strait was most probably
reduced during the LGM and, accordingly, the path of the glacial DSO had shifted to
shallower depths.
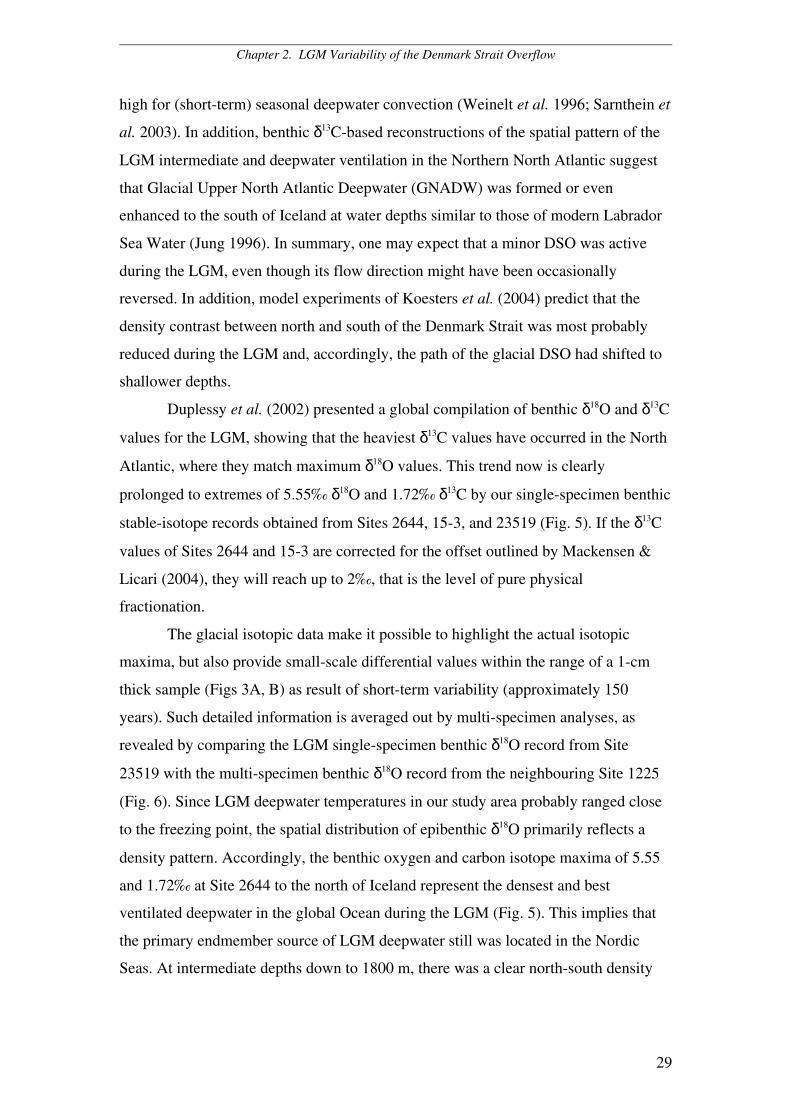
Duplessy et al. (2002) presented a global compilation of benthic δ18O and δ13C
values for the LGM, showing that the heaviest δ13C values have occurred in the North
Atlantic, where they match maximum δ18O values. This trend now is clearly
prolonged to extremes of 5.55‰ δ18O and 1.72‰ δ13C by our single-specimen benthic
stable-isotope records obtained from Sites 2644, 15-3, and 23519 (Fig. 5). If the δ13C
values of Sites 2644 and 15-3 are corrected for the offset outlined by Mackensen &
Licari (2004), they will reach up to 2‰, that is the level of pure physical
fractionation.
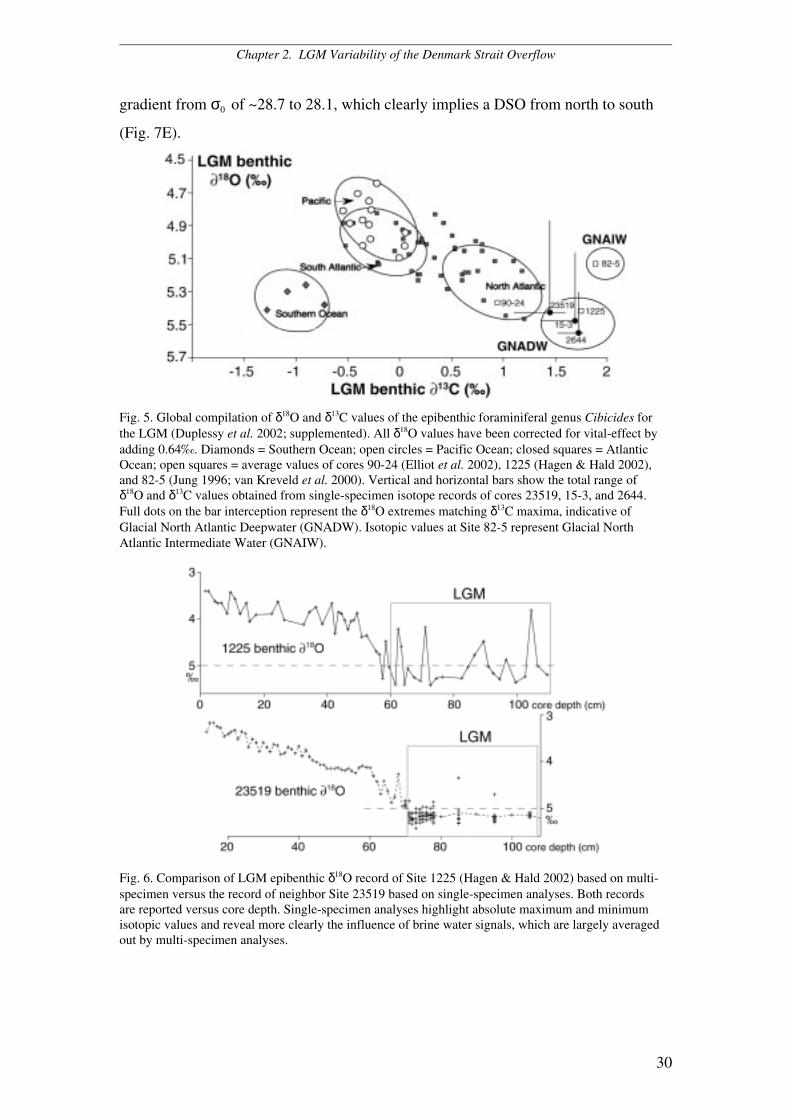
The glacial isotopic data make it possible to highlight the actual isotopic
maxima, but also provide small-scale differential values within the range of a 1-cm
thick sample (Figs 3A, B) as result of short-term variability (approximately 150
years). Such detailed information is averaged out by multi-specimen analyses, as
revealed by comparing the LGM single-specimen benthic δ18O record from Site
23519 with the multi-specimen benthic δ18O record from the neighbouring Site 1225
(Fig. 6). Since LGM deepwater temperatures in our study area probably ranged close
to the freezing point, the spatial distribution of epibenthic δ18O primarily reflects a
density pattern. Accordingly, the benthic oxygen and carbon isotope maxima of 5.55
and 1.72‰ at Site 2644 to the north of Iceland represent the densest and best
ventilated deepwater in the global Ocean during the LGM (Fig. 5). This implies that
the primary endmember source of LGM deepwater still was located in the Nordic
Seas. At intermediate depths down to 1800 m, there was a clear north-south density
Chapter 2. LGM Variability of the Denmark Strait Overflow
30
gradient from σ0 of ~28.7 to 28.1, which clearly implies a DSO from north to south
(Fig. 7E).
Fig. 5. Global compilation of δ18O and δ13C values of the epibenthic foraminiferal genus Cibicides forthe LGM (Duplessy et al. 2002; supplemented). All δ18O values have been corrected for vital-effect byadding 0.64‰. Diamonds = Southern Ocean; open circles = Pacific Ocean; closed squares = AtlanticOcean; open squares = average values of cores 90-24 (Elliot et al. 2002), 1225 (Hagen & Hald 2002),and 82-5 (Jung 1996; van Kreveld et al. 2000). Vertical and horizontal bars show the total range ofδ18O and δ13C values obtained from single-specimen isotope records of cores 23519, 15-3, and 2644.Full dots on the bar interception represent the δ18O extremes matching δ13C maxima, indicative ofGlacial North Atlantic Deepwater (GNADW). Isotopic values at Site 82-5 represent Glacial NorthAtlantic Intermediate Water (GNAIW).
Fig. 6. Comparison of LGM epibenthic δ18O record of Site 1225 (Hagen & Hald 2002) based on multi-specimen versus the record of neighbor Site 23519 based on single-specimen analyses. Both recordsare reported versus core depth. Single-specimen analyses highlight absolute maximum and minimumisotopic values and reveal more clearly the influence of brine water signals, which are largely averagedout by multi-specimen analyses.
0
++
+
3-2 4-3
90-24
23519 82-5
1
1225
2
3
++
+
+
+
3
2
1
0
3-2
4-3
90-2423519
82-51225
2644
15-3
+
+
+
++
+ ++
Iceland
Iceland
LGM sea level
LGM sea level
LGM Benthic ¶ 18O
LGM Benthic ¶ 18O
km
km
W E
NNE SSW1000 km
500 km
DK Strait
GDSO
SOW
GNAIW
A
C
MAR
DK Strait
0
++
+
3-2 4-3
90-24
23519 82-5
1
1225
2
3
++
+
+
+
3
2
1
0
3-2
4-3
90-2423519
82-51225
2644
15-3
+
+
+
++
+ ++
Iceland
Iceland
LGM sea level
LGM Benthic ¶ 13C
LGM Benthic ¶ 13C
km
km
W E
NNE SSW1000 km
500 km
DK Strait
GNADW
SOW
GNAIW
B
D
MAR
DK Strait
5.35
>5.36 (extrapolated)
5.22
5.18
5.06
5.06
5.22
5.18 5.355.36
>5.36 (extrapolated)
5.45
5.32
0.91-0.08 1.30
0.18
?
1.53
1.43
1.72
1.72
0.91-0.08
?1.30
0.18
1.53
1.43
1.53
1.62NSDW
GNAIWGDSO
GNADW
NSDWGDSO
GNADW
SOW
GNADW5.36
°C 6
4
2
0
-235 35.5 36 36.5 37 ‰S
4.6
4.8
55.2
5.45.6
¶18 O ‰28.0
28.4
28.8
σ0
++264490-24122582-5
++
E
GNAIW
31
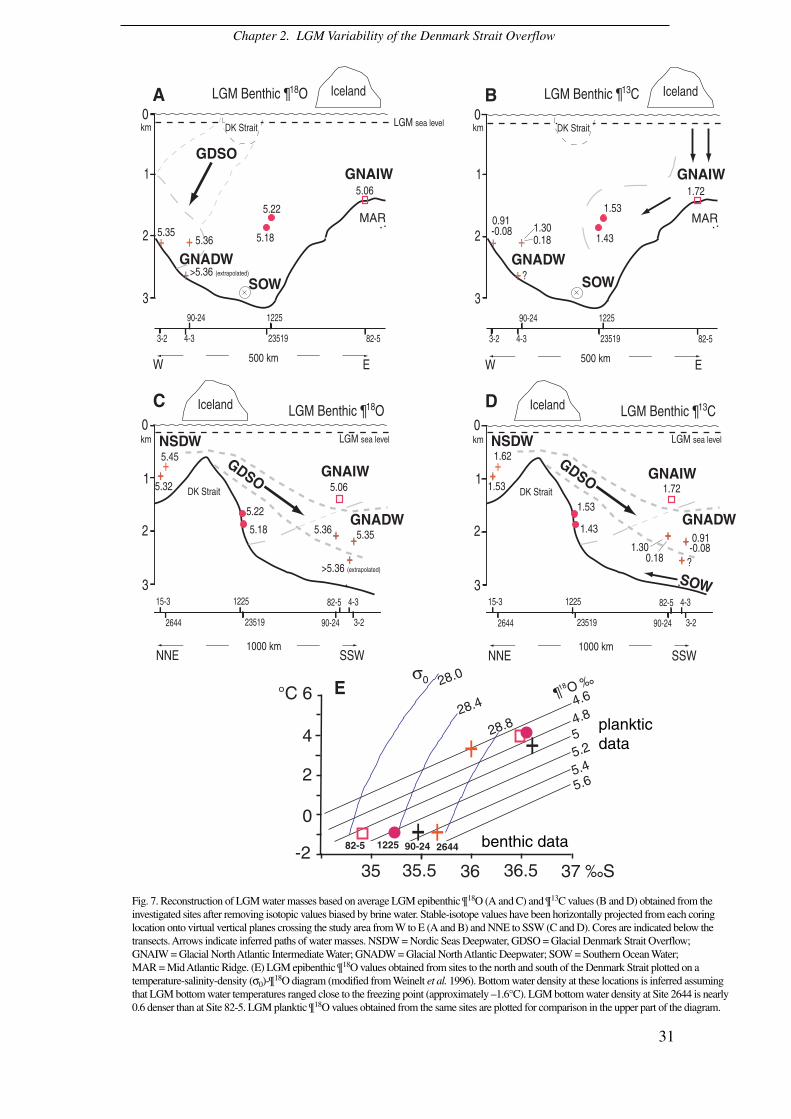
Fig. 7. Reconstruction of LGM water masses based on average LGM epibenthic ¶ 18O (A and C) and ¶ 13C values (B and D) obtained from theinvestigated sites after removing isotopic values biased by brine water. Stable-isotope values have been horizontally projected from each coringlocation onto virtual vertical planes crossing the study area from W to E (A and B) and NNE to SSW (C and D). Cores are indicated below thetransects. Arrows indicate inferred paths of water masses. NSDW = Nordic Seas Deepwater, GDSO = Glacial Denmark Strait Overflow;GNAIW = Glacial North Atlantic Intermediate Water; GNADW = Glacial North Atlantic Deepwater; SOW = Southern Ocean Water;MAR = Mid Atlantic Ridge. (E) LGM epibenthic ¶ 18O values obtained from sites to the north and south of the Denmark Strait plotted on atemperature-salinity-density (σ0)-
18O diagram (modified from Weinelt et al. 1996). Bottom water density at these locations is inferred assumingthat LGM bottom water temperatures ranged close to the freezing point (approximately –1.6°C). LGM bottom water density at Site 2644 is nearly0.6 denser than at Site 82-5. LGM planktic ¶ 18O values obtained from the same sites are plotted for comparison in the upper part of the diagram.
Chapter 2. LGM Variability of the Denmark Strait Overflow
benthic data
plankticdata
Chapter 2. LGM Variability of the Denmark Strait Overflow
32
Bottom water density slightly decrease to σ0 of ~28.4 at the two sites close to
the southern outlet of the Denmark Strait, with maximum δ18O values of 5.43‰ and
average values of 5.18‰ at Site 23519 and of 5.22‰ at nearby Site 1225 (Hagen &
Hald 2002) (Fig. 7). In contrast, farther south, off south-east Greenland, epibenthic
δ18O values at Sites 90-24 and 3-2 reached a slightly higher maximum level of 5.51‰
and average δ18O values to 5.36‰ (Figs 4, 7). At the deeper Site 4-3 δ18O values
greater than 5.36‰ may be assumed on the basis of stratigraphic and spatial
extrapolations (Fig. 4). This pattern suggests that a glacial DSO-like deepwater
incursion originated from dense and maximum ventilated water in the Nordic Seas
and washed the eastern flank of the Greenland slope like today (Dickson & Brown
1994), eventually forming the GNADW (Fig. 7). On the other hand, relatively lower
bottom water density inferred for Sites 23519 and 1225 indicates that the DSO has
bypassed those locations to the west, higher upslope (Fig. 7), as predicted by the
model of Koesters et al. (2004).
Epibenthic δ18O values of 5.06‰ at Site 82-5 document a much reduced
density (σ0 ~28.1) on top of the Mid Atlantic Ridge (1417 m), where fairly constant
δ13C values of 1.72‰ document a maximum in bottom water ventilation throughout
the LGM (Jung 1996; van Kreveld et al. 2000). This extreme competes with the
previously outlined ventilation peak at Site 2644 in the Blosseville Basin with a
maximum δ13C value of 1.72‰ (Fig. 3A) and an average of 1.62‰ (Fig. 7). At greater
depths, Blosseville Basin Site 15-3 exhibits a slightly lower ventilation with δ13C
values reaching up to 1.64‰ and an average of 1.53‰. Likewise, the records
immediately to the south of the Denmark Strait are characterized by fairly high
ventilation with average LGM values of 1.43 to 1.53‰ (Fig. 7) and single peaks of
1.73‰ at Site 1225 (Hagen & Hald 2002). In summary, there were two “competitive”
separate LGM convection cells: One of them was located to the south of Iceland
(Duplessy et al. 1991; Sarnthein et al. 1994) forming Glacial North Atlantic
Intermediate Water (GNAIW), while the second convection cell produced deepwater
with a slightly higher density to the north of the Denmark Strait. The match between
heavy epibenthic δ18O and δ13C values to the north of Iceland (Fig. 3A) demonstrates
that at least short-term pulses of high-density and highly ventilated water were
advected from the Nordic Seas through the Denmark Strait into the deep Atlantic
during the LGM, that was a source for GNADW. In addition, a number of distinct
Chapter 2. LGM Variability of the Denmark Strait Overflow
33
events of light δ18O and light δ13C are documented in our single-specimen records,
which suggest that seasonal plumes of brine water were an additional factor
contributing to the formation of deep and intermediate water both to the north and the
south of the Denmark Strait throughout the LGM (Fig 3A, B).
In addition, several incursions of strongly 13C-depleted Southern Ocean Water
are documented at the lowermost southeastern Greenland slope by absolute δ13C
minima of 0.18 and –0.08‰ at Sites 90-24 and 3-2 (Figs 3B, 4, 7). On the other hand,
δ13C maxima of 1.30 and 0.91‰ at these sites possibly reveal competition between
the southern-source water mass and GNADW.
A pattern of deep and intermediate-water circulation totally different from the LGM is
found for the subsequent meltwater regime of H1. A significant decrease in bottom
water ventilation matches distinct brine-induced light δ18O pulses in our benthic
records starting from the onset of H1 (Fig. 3). These features point to a breakdown in
the meridional overturn both to the north and south of the Denmark Strait and suggest
a complete shut-off or reversal (south-north direction) of the DSO. Benthic bottom
water temperature records may provide crucial evidence for past current directions.
2.6 Conclusions
A stable-isotope-based reconstruction of the bottom and intermediate water density
pattern across the Denmark Strait over the LGM indicates a north-south density
gradient from σ0 ~28.7 to 28.1 at about 800 - 1800 m water depth. Maximum-density
and highly ventilated water masses were convected to the north of the Denmark Strait
and formed a southward flowing DSO and further downstream, the primary source of
GNADW, flowing southward along the lower East Greenland slope like today.
To the south of Iceland highly ventilated but less dense GNAIW formed on top of the
Mid Atlantic Ridge, in areas largely free of sea ice during both LGM summers and
winters. During seasonal sea ice formation, plumes of high-density brine water were
an additional factor that contributed to glacial deep and intermediate water formation
both to the north and south of the Denmark Strait and dominated the scenario during
subsequent H1 stadial.
Chapter 2. LGM Variability of the Denmark Strait Overflow
34
Acknowledgements.- We are grateful to P. Grootes for 14C datings and interesting
discussions. Special thanks go to M. Weinelt for comments on density
reconstructions. We acknowledge K. Kissling, D. Gudehus, N. Gehre, P. Springer, D.
Magens, D. Petereit, R. Isemer, A. Klug, and M. Remetin for helping in sample
preparation. We thank C. Sieler for data managing. The work was founded by the
Deutsche Forschungsgemeinschaft (Kiel Forschergruppe 451).
References
Boyle, E.A. 1992: Cadmium and δ13C paleochemical ocean distributions during thestage 2 glacial maximum. Annual Reviews Earth Planetary Science 20, 245-287.
Clark, P.U. & Mix, A.C. 2002: Ice sheets and sea level of the Last Glacial Maximum.Quaternary Science Reviews 21, 1-7.
CLIMAP Project Members (CLIMAP) 1981: Seasonal reconstructions of the Earth’ssurface at the Last Glacial Maximum, Map Chart Ser. MC-36. Geological Society ofAmerica, Boulder, Colorado.
Curry, W.B., Duplessy, J.C., Labeyrie, L.D. & Shackleton, N.J. 1988: Changes in thedistribution of δ13C of deep water ΣCO2 between the last glaciation and the Holocene.Paleoceanography 3, 317-341.
Dickson, R.R. & Brown, J. 1994: The Production of North Atlantic Deep Water –Sources, Rates and Pathways. Journal of Geophysical Research C99, 12319-12341.
Dickson, R.R., Lazier, J., Meincke, J., Rhines, P. & Swift, J. 1997: Long-termcoordinated changes in the convective activity of the North Atlantic. Progress inOceanography 38, 241-295.
Dickson, B., Yashayaev, I., Meincke, J., Turrell, B., Dye, S. & Holfort, J. 2002: Rapidfreshening of the deep North Atlantic Ocean over the past four decades. Nature 416,832-837.
Dokken, T.M. & Jansen, E. 1999: Rapid changes in the mechanism of oceanconvection during the last glacial cycle. Nature 401, 458-461.
Dörscher, R. & Redler, R. 1997: The relative importance of northern overflow andsubpolar deep convection for the North Atlantic thermohaline circulation. Journal ofPhysical Oceanography 27, 1894-1902.
Duplessy, J.-C. 1982: North Atlantic Deep Water circulation during the last climaticcycle. Bulletin Institut de Geólogie de Bassin d’Aquitaine 31, 379-391.
Chapter 2. LGM Variability of the Denmark Strait Overflow
35
Duplessy, J.-C., Labeyrie, L., Juillet-Leclerc, A., Maitre, F., Duprat, J. & Sarnthein,M. 1991: Surface salinity reconstruction of the North Atlantic Ocean during the LGM.Oceanologica Acta 14, 311-324.
Duplessy, J.-C., Labeyrie, L. & Waelbroeck, C. 2002: Constraints on the oceanoxygen isotopic enrichment between the Last Glacial Maximum and the Holocene:Paleoceanographic implications. Quaternary Science Reviews 21, 315-330.
Duplessy, J.-C., Shackleton, N.J., Fairbanks, R.G., Labeyrie, L., Oppo, D. & Kallel,N. 1988: Deepwater source variations during the last climatic cicle and their impacton the global deepwater circulation. Paleoceanography 3, 343-360.
Elliot, M., Labeyrie, L., Bond, G., Cortijo, E., Turon, J.L., Tisnerat, N. & Duplessy,J.-C. 1998: Millenial-scale iceberg discharges in the Irminger Basin during the lastglacial period: Relationship with the Heinrich events and environmental settings.Paleoceanography 13, 433-466.
Elliot, M., Labeyrie, L. & Duplessy, J.-C. 2002: Changes in North Atlantic deep-water formation associated with the Dansgaard-Oeschger temperature oscillations(60-10 ka). Quaternary Science Reviews 21, 1153-1165.
Fleming, K. & Lambeck, K. 2004: Constraints on the Greenland Ice Sheet since theLast Glacial Maximum from sea-level observations and glacial-rebound models.Quaternary Science Reviews 23, 1053-1077.
Ganopolski, A., Rahmstorf, S., Petoukhov, V. & Claussen, M. 1998: Simulation ofmodern and glacial climates with a coupled global model of intermediate complexity.Nature 391, 351-356.
Gerdes, R. & Köberle, C. 1995: On the influence of DSOW in a numerical model ofthe North Atlantic general circulation. Journal of Physical Oceanography 25, 2624-2642.
Hagen, S. & Hald, M. 2002: Variation in surface and deep water circulation in theDenmark Strait, North Atlantic, during marine isotope stages 3 and 2.Paleoceanography 17, 1-16.
Hansen, B. & Østerhus, S. 2000: North Atlantic-Nordic Seas exchanges. Progress inOceanography 45, 109-208.
Hansen, B., Turell, W.R. & Østerhus, S. 2001: Decreasing overflow from the NordicSeas into the Atlantic Ocean through the Faeroe-Shetland Channel since 1950. Nature411, 927-930.
Hewitt, C.D., Stouffer, R.J., Broccoli, A.J., Mitchell, J.F.B. & Valdes, P.J. 2003: Theeffect of ocean dynamics in a coupled GCM simulation of the Last Glacial Maximum.Climate Dynamics 20, 203-218.
Joussaume S. & Taylor, K.E. 2000: Proceedings of the third Paleoclimate ModelingIntercomparison Project (PMIP) workshop, edited by P. Braconnot, 271 pp.
Chapter 2. LGM Variability of the Denmark Strait Overflow
36
Jung, S. 1996: Wassermassenaustausch zwischen NE-Atlantik und Nordmeerwährend der letzen 300,000/ 80,000 Jahre im Abbild stabiler O- und C-Isotope.Berichte aus dem Sonderforschungsbereich 313 nr. 61, University of Kiel, 104 pp.
Kim, S.J., Flato, G.M. & Boer, G.J. 2003: A coupled climate model simulation of theLast Glacial Maximum, Part 2: approach to equilibrium. Climate Dynamics 20, 635-661.
Kitoh, A., Murakami, S. & Koide, H. 2001: A simulation of the Last GlacialMaximum with a coupled atmosphere-ocean GCM. Geophysical Research Letters 28,2221-2224.
Koesters, F., Kaese, R., Fleming, K. & Wolf, D. 2004: Denmark Strait overflow forLast Glacial maximum to Holocene conditions. Paleoceanography 19 (2), PA2019.
van Kreveld, S., Sarnthein, M., Erlenkeuser, H., Grootes, P., Jung, S., Nadeau, M.J.,Pflaumann, U. & Voelker, A. 2000: Potential links between surging ice sheets,circulation changes, and the Dansgaard-Oeschger cycles in the Irminger Sea, 60-18kyr. Paleoceanography 15, 425-442.
Kuijpers, A., Troelstra, S.R., Prins, M.A., Linthout, K., Akhmetzhanov, A., Bouryak,S., Bachmann, M.F., Lassen, S., Rasmussen, S. & Jensen, J.B. 2003: Late Quaternarysedimentary processes and ocean circulation changes at the Southeast Greenlandmargin. Marine Geology 195, 109-129.
Laj, C., Kissel, C., Mazaud, A.,Channell, J.E.T. & Beer, J. 2000: North Atlanticpaleointensity stack since 75 ka of the Laschamp event. Royal Society of LondonPhilosophical Transactions A 358, 1009-1025.
Lambeck, K. & Chappell, J. 2001: Sea level change through the last glacial cycle.Science 292, 679-686.
Larsen, B. 1983: Geology of the Greenland-Iceland Ridge in the Denmark Strait. InBott, M.H.P., Saxov, S., Talwani, M. & Thiede, J. (eds.): Structure and Developmentof the Greenland-Scotland Ridge: New Methods and Concepts, 425-444. PlenumPress, New York.
Mackensen, A. & Licari, L. 2004: Carbon isotopes of live benthic foraminifera fromthe South Atlantic: Sensitivity to bottom water carbonate saturation state and organicmatter rain rates. In Wefer, G., Mulitza, S. & Ratmeyer, V. (eds.): The South Atlanticin the late Quaternary: Reconstruction of material budgets and current systems, 623-644. Springer, Berlin.
McManus, J.F., Francois, R., Gheradi, J.M., Keigwin, L.D. & Brown-Leger, S. 2004:Collapse and rapid resumption of Atlantic meridional circulation linked to deglacialclimate changes. Nature 428, 834-837.
Chapter 2. LGM Variability of the Denmark Strait Overflow
37
Nørgaard-Pedersen, N., Spielhagen, R.F., Erlenkeuser, H., Grootes, P.M., Heinemeier,J. & Knies, J. 2003: Arctic Ocean during the Last Glacial Maximum: Atlantic andpolar domains of surface water mass distribution and ice cover. Paleoceanography 18(3), 8.
Paillard, D., Labeyrie, L. & Yiou, P. 1996: Macintosh program performs time-seriesanalysis. EOS Transactions A m e r i c a n G e o p h y s i c a l U n i o n 77, p. 379.
Paul, A. & Schäfer-Neth, C. 2003: Modeling the water masses of the Atlantic Oceanat the last Glacial Maximum. Paleoceanography 18 (3), 3.
Peltier, W.R. 1994: Ice age paleotopography. Science 265, 195-201.
Prange, M., Romanova, V. & Lohmann, G. 2002: The glacial thermohalinecirculation: Stable or unstable ? Geophysical Research Letters 29 (21), 24.
Sarnthein, M., Pflaumann, U. & Weinelt, M. 2003: Past extent of sea ice in thenorthern North Atlantic inferred from foraminiferal paleotemperature estimates.Paleoceanography 18, 1-8.
Sarnthein, M., Winn, K., Jung, S.J.A., Duplessy, J.-C., Labeyrie, L., Erlenkeuser, H.& Ganssen, G. 1994: Changes in east Atlantic deepwater circulation over the last30,000 years: Eight time slice reconstructions. Paleoceanography 9, 209-267.
Schmittner, A., Meissner, K.J., Eby, M. & Weaver, A.J. 2002: Forcing of the deepocean circulation in simulations of the last glacial maximum. Paleoceanography 17(2), 5.
Skinner, L.C. & Shackleton, N.J. 2004: Rapid transient changes in the northeastAtlantic deep water ventilation age across termination I. Paleoceanography 19 (2),PA 2005.
Veum, T., Jansen, E., Arnoldt, M., Beyer, I. & Duplessy, J.-C. 1992: Water massexchange between the North Atlantic and the Norwegian Sea during the past 28.000years. Nature 356, 783-785.
Voelker, A.H. 1999: Zur Deutung der Dansgaard-Oeschger Ereignisse in ultra-hochauflösenden Sedimentprofilen aus dem Europäischen Nordmeer. Ph.D.dissertation, University of Kiel, 180 pp.
Voelker, A. H., Grootes, P.M., Nadeau, M.-J. & Sarnthein, M. 2000: Radiocarbonlevels in the Iceland Sea from 25-53 ka and their link to the Earth’s Magnetic FieldIntensity. Radiocarbon 42, 437-452.
Voelker, A. H., Sarnthein, M., Grootes, P.M., Erlenkeuser, H., Laj, C., Mazaud, A.,Nadeau, M. J. & Schleicher, M. 1998: Correlation of marine 14C ages from the NordicSeas with the GISP2 isotope record: implications for 14C calibration beyond 25 ka BP.Radiocarbon 40, 517-534.

Chapter 2. LGM Variability of the Denmark Strait Overflow
38
Waelbroeck, C., Duplessy, J.C., Michel, E., Labeyrie, L., Paillard, D. & Duprat, J.2001: The timing of the last deglaciation in North Atlantic climate records. Nature412, 724-726.
Weinelt, M., Kuhnt, W., Sarnthein, M., Altenbach, A., Costello, O., Erlenkeuser, H.,Pflaumann, U., Simstich, J., Struck, U., Thies, A., Trauth, M.H. & Vogelsang, E.2001: Paleoceanographic proxies in the northern North Atlantic. In Schäfer, P.,Ritzrau, W., Schlüter, M. & Thiede, J. (eds.): The northern North Atlantic: Achanging environment, 319-352. Springer, Berlin.
Weinelt, M., Sarnthein, M., Pflaumann, U., Schulz, H., Jung, S. & Erlenkeuser, H.1996: Ice-free Nordic Seas during the Last Glacial Maximum? Potential sites ofdeepwater formation. Paleoclimate 1, 283-309.
Whitehead, J.A., Leetmaa, A. & Knox, R.A. 1974: Rotating hydraulics of strait andsill flows. Geophysical Fluid Dynamics 6, 101-125.
Yu, E.-F., Francois, R. & Bacon, M.P. 1996: Similar rates of modern and last-glacialocean thermohaline circulation inferred from radiochemical data. Nature 379, 689-694.
Zahn, R., Sarnthein, M. & Erlenkeuser, H. 1987: Benthos isotopic evidence forchanges of the Mediterranean outflow during the late Quaternary. Paleoceanography2, 543-559.
Zahn, R., Winn, K. & Sarnthein, M. 1986: Benthic foraminiferal δ13C andaccumulation rates of organic carbon: Uvigerina peregrina group and Cibicidoideswuellerstorfi. Paleoceanography 1, 27-42.
Chapter 3A. Methane-driven ∂13C minima
39
CHAPTER 3
Methane signals and variations in Denmark Strait Overflow
3A. Methane-driven Late Pleistocene ∂∂∂∂13C minima and Overflow reversals
in the S.W. Greenland Sea
CHRISTIAN MILLO, MICHAEL SARNTHEIN, HELMUT ERLENKEUSER ANDTHOMAS FREDERICHS
Christian Millo ([email protected]) and Michael Sarnthein, Department of Geology, Christian-Albrechts-Universitaet, Olshausenstrasse 40, D-24118 Kiel, Germany;
Helmut Erlenkeuser, Leibniz-Labor for Radiometric Dating and Isotope Research, Max-Eyth-Strasse11, D-24118 Kiel, Germany;
Thomas Frederichs, Department of Geology, University of Bremen, Klagenfurter Strasse, D-28359Bremen, Germany.
Accepted for publication in Geology on 6 July 2005.
ABSTRACT
A core transect across the southwestern Greenland Sea reveals coeval events
of extremely negative planktic and benthic δ13C excursions between 40 and 87 ka. The
most pronounced event, Event 1, began at peak Dansgaard-Oeschger (DO) stadial 22
(85 ka) with a duration of 18 k.y. During this episode, incursions of Atlantic
Intermediate Water caused a bottom water warming of up to 8 °C. Amplitude, timing,
and geographic pattern of the δ13C events suggest that this bottom water warming
triggered clathrate instability along the East Greenland slope and a methane-induced
depletion of δ13CDIC (DIC—dissolved inorganic carbon). Since δ13C Event 1 matches a
major peak in atmospheric CH4 concentration (Blunier and Brook, 2001), this
clathrate destabilization may have contributed to the rise in atmospheric CH4 and thus
to climate warming over marine isotope stage (MIS) 5.1.
Keywords: Clathrates, global warming, Denmark Strait Overflow, Heinrich events.
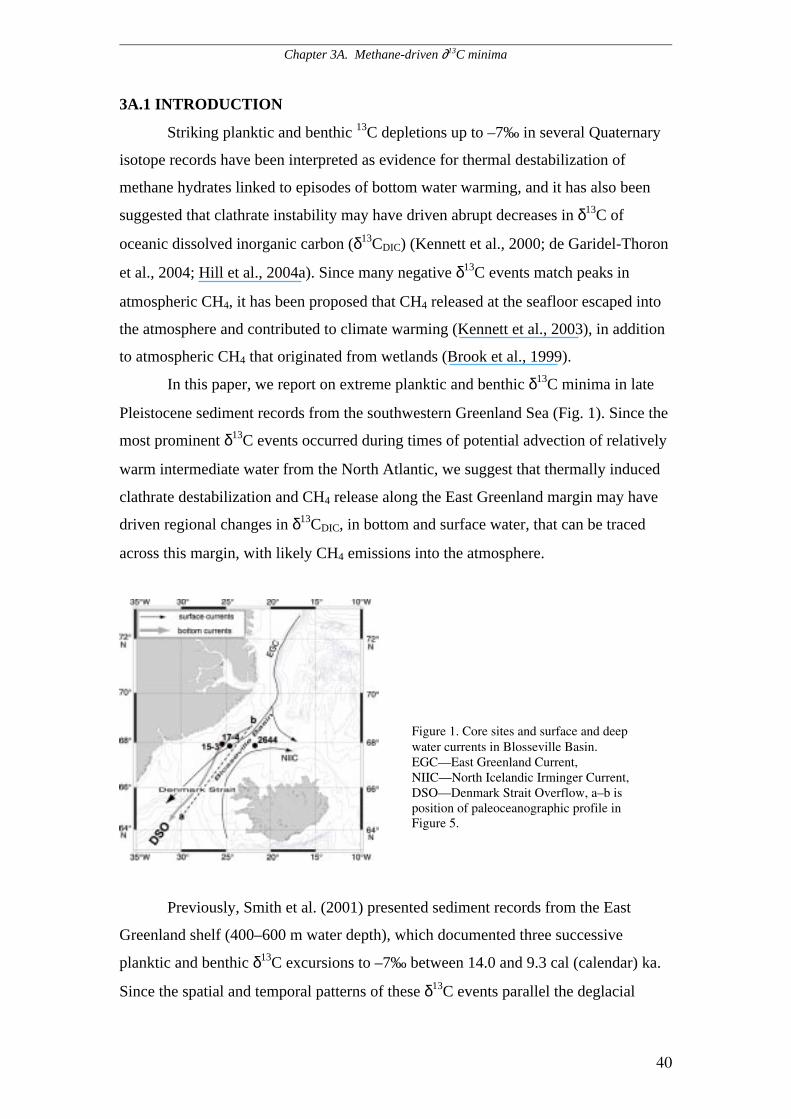
Chapter 3A. Methane-driven ∂13C minima
40
3A.1 INTRODUCTION
Striking planktic and benthic 13C depletions up to –7‰ in several Quaternary
isotope records have been interpreted as evidence for thermal destabilization of
methane hydrates linked to episodes of bottom water warming, and it has also been
suggested that clathrate instability may have driven abrupt decreases in δ13C of
oceanic dissolved inorganic carbon (δ13CDIC) (Kennett et al., 2000; de Garidel-Thoron
et al., 2004; Hill et al., 2004a). Since many negative δ13C events match peaks in
atmospheric CH4, it has been proposed that CH4 released at the seafloor escaped into
the atmosphere and contributed to climate warming (Kennett et al., 2003), in addition
to atmospheric CH4 that originated from wetlands (Brook et al., 1999).
In this paper, we report on extreme planktic and benthic δ13C minima in late
Pleistocene sediment records from the southwestern Greenland Sea (Fig. 1). Since the
most prominent δ13C events occurred during times of potential advection of relatively
warm intermediate water from the North Atlantic, we suggest that thermally induced
clathrate destabilization and CH4 release along the East Greenland margin may have
driven regional changes in δ13CDIC, in bottom and surface water, that can be traced
across this margin, with likely CH4 emissions into the atmosphere.
Previously, Smith et al. (2001) presented sediment records from the East
Greenland shelf (400–600 m water depth), which documented three successive
planktic and benthic δ13C excursions to –7‰ between 14.0 and 9.3 cal (calendar) ka.
Since the spatial and temporal patterns of these δ13C events parallel the deglacial
Figure 1. Core sites and surface and deepwater currents in Blosseville Basin.EGC—East Greenland Current,NIIC—North Icelandic Irminger Current,DSO—Denmark Strait Overflow, a–b isposition of paleoceanographic profile inFigure 5.

Chapter 3A. Methane-driven ∂13C minima
41
retreat of ice sheets, the authors concluded that the δ13C excursions were linked to
dissociation of clathrate due to a reduction in ice load and intrusion of warm bottom
water.
3A.2 STUDY AREA
Our sediment records were obtained from the Blosseville Basin to the north of
the Denmark Strait, between East Greenland and northwest Iceland, with maximum
water depths of 1500 m (Fig. 1). Along the northwestern basin margin, the East
Greenland Current (EGC) carries cold and low-salinity water southward; along
Iceland the northern branch of the Irminger Current carries warm and high-salinity
water to the northeast. This water mass cools in winter, is convected, and in part
forms the Denmark Strait Overflow (DSO), an important source of North Atlantic
Deep Water.
Hemipelagic site Polarstern (PS) 62/015-3 (named site/core 15-3; 67°55.85′N,
25°25.59′W, 980 m water depth [mwd]) and clayey pelagic site PS 62/017-4 (named
site/core 17-4; 67°51.01′N, 24°35.12′W, 1458 mwd) today are bathed in the DSO
below extensive sea ice (and icebergs) characteristic of the East Greenland margin.
Hemipelagic site PS 2644 (named site/core 2644; 67°52.02′N, 21°45.92′W, 777 mwd)
is located below the northern branch of the Irminger Current (Fig. 1).
3A.3 METHODS
Core 15-3 was sampled every 5 cm from the core top down to 200 cm below
sediment surface (bsf), every 2–3 cm from 200 to 400 cm bsf, and further below at
each centimeter down to the core bottom (636 cm). In 17-4 (632 cm) sampling spaces
were 1–2 cm. Samples were washed over a 63µm sieve and dried at 40 °C.
In both cores the concentration of foraminifera was highly variable, some
intervals being barren. Up to 25 specimens of planktic Neogloboquadrina
pachyderma sinistral (150–250 µm) and 1–10 specimens of epibenthic Cibicides
lobatulus (250–400 µm) were picked for multiple- and single-specimen stable-isotope
analysis, respectively. Isotopic data of core 2644 are from Voelker (1999).
Following standard preparation routines, foraminiferal samples were gently
crushed, ultrasonically cleaned in ethanol, and dried. O and C stable isotopes were
measured at the Leibniz Laboratory at Kiel University using the Kiel Carboprep line
Chapter 3A. Methane-driven ∂13C minima
42
and an automated MAT-251 mass spectrometer (analytical precision: ±0.07‰ for
δ18O, ±0.05‰ for δ13C PDB).
The preservation state of planktic and benthic foraminifera and their trace-
element compositions were estimated from selected representative specimens using a
scanning electron microscope (SEM) and energy dispersive x-ray (EDX)
(CAMSCAN Serie 2 CS 44). SEM and EDX analyses of C. lobatulus were carried out
on single test fragments, the remainder of tests were used for single-test stable-isotope
analysis.
3A.4 AGE CONTROL
The chronology of cores 15-3 and 17-4 is based on both δ18O and
paleomagnetic stratigraphy. Primary age control for the last 75 k.y. was based on a
correlation of relative magnetic paleointensity signals in cores 15-3 and 17-4 with the
reference record NAPIS 75 (Laj et al., 2000), which employs the age control of core
2644 (Voelker et al., 1998) (Fig. 2A–C). Norwegian Basin (ca. 60–65 ka), Laschamp
(41 ka), and Mono Lake (34.5 ka) events of minimum paleointensity form major
correlation markers. In total, the various δ18O and magnetic records correlate well for
the core sections older than 30 ka. In addition, planktic δ18O records of cores 15-3 and
17-4 were fine tuned to that of neighboring core 2644, which has a robust chronology
based on numerous 14C datings and on tuning to the incremental time scale of
Greenland Ice Sheet Project 2 (GISP2) (Fig. 2D–F). Abrupt negative δ18O excursions
in core 2644 reflect meltwater pulses associated with Heinrich Events (HE) 1–6 and
other cold Dansgaard-Oeschger (DO) stadials, since coeval planktic-foraminifera-
based sea-surface temperature estimates do not reveal any significant warming
(Voelker, 1999). The end of each meltwater spike is linked to an abrupt temperature
increase over Greenland and in the northern North Atlantic (van Kreveld et al., 2000).
Because of internal consistency, we used the GISP2 time scale (Grootes and
Stuiver, 1997) as stratigraphic base for marine isotope stages (MIS) 3 and 4. Sections
older than 75 ka were dated by the scheme of North Greenland Ice Core Project
(2004) members. The record of core 15-3 reaches back to 86.5 ka, the center of MIS
5.2, core 17-4 spans the last 78 k.y.
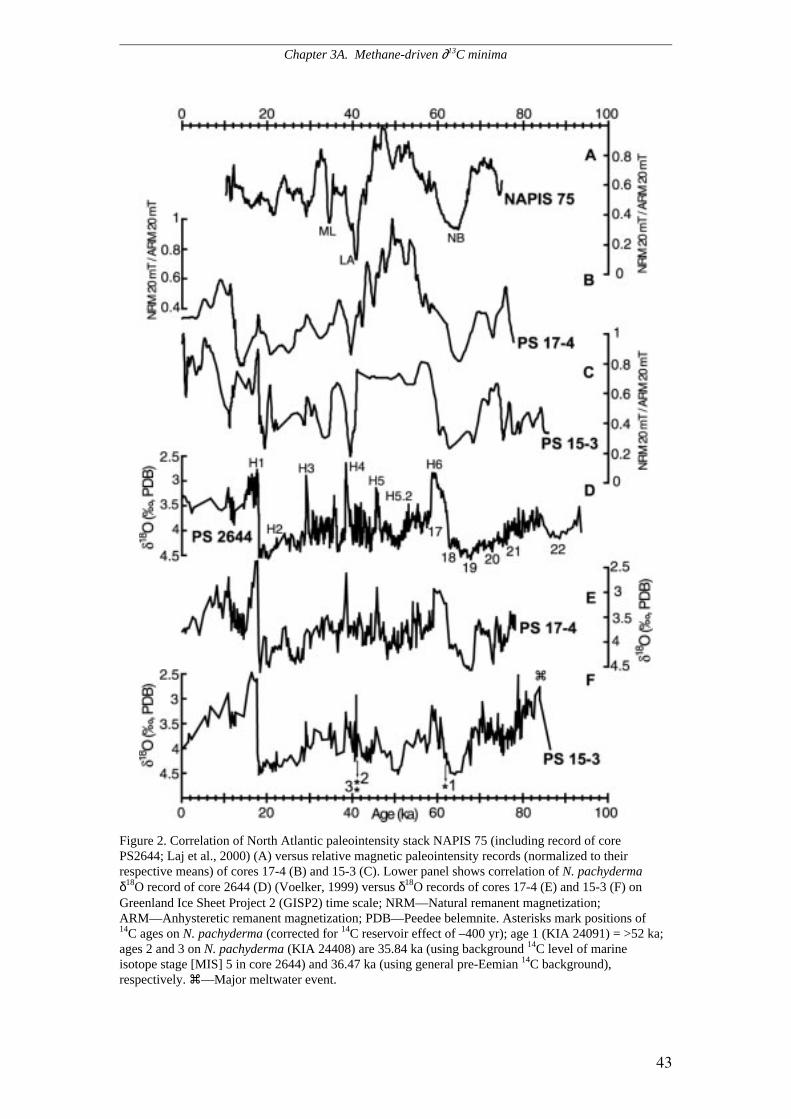
Chapter 3A. Methane-driven ∂13C minima
43
Figure 2. Correlation of North Atlantic paleointensity stack NAPIS 75 (including record of corePS2644; Laj et al., 2000) (A) versus relative magnetic paleointensity records (normalized to theirrespective means) of cores 17-4 (B) and 15-3 (C). Lower panel shows correlation of N. pachydermaδ18O record of core 2644 (D) (Voelker, 1999) versus δ18O records of cores 17-4 (E) and 15-3 (F) onGreenland Ice Sheet Project 2 (GISP2) time scale; NRM—Natural remanent magnetization;ARM—Anhysteretic remanent magnetization; PDB—Peedee belemnite. Asterisks mark positions of14C ages on N. pachyderma (corrected for 14C reservoir effect of –400 yr); age 1 (KIA 24091) = >52 ka;ages 2 and 3 on N. pachyderma (KIA 24408) are 35.84 ka (using background 14C level of marineisotope stage [MIS] 5 in core 2644) and 36.47 ka (using general pre-Eemian 14C background),respectively. !—Major meltwater event.
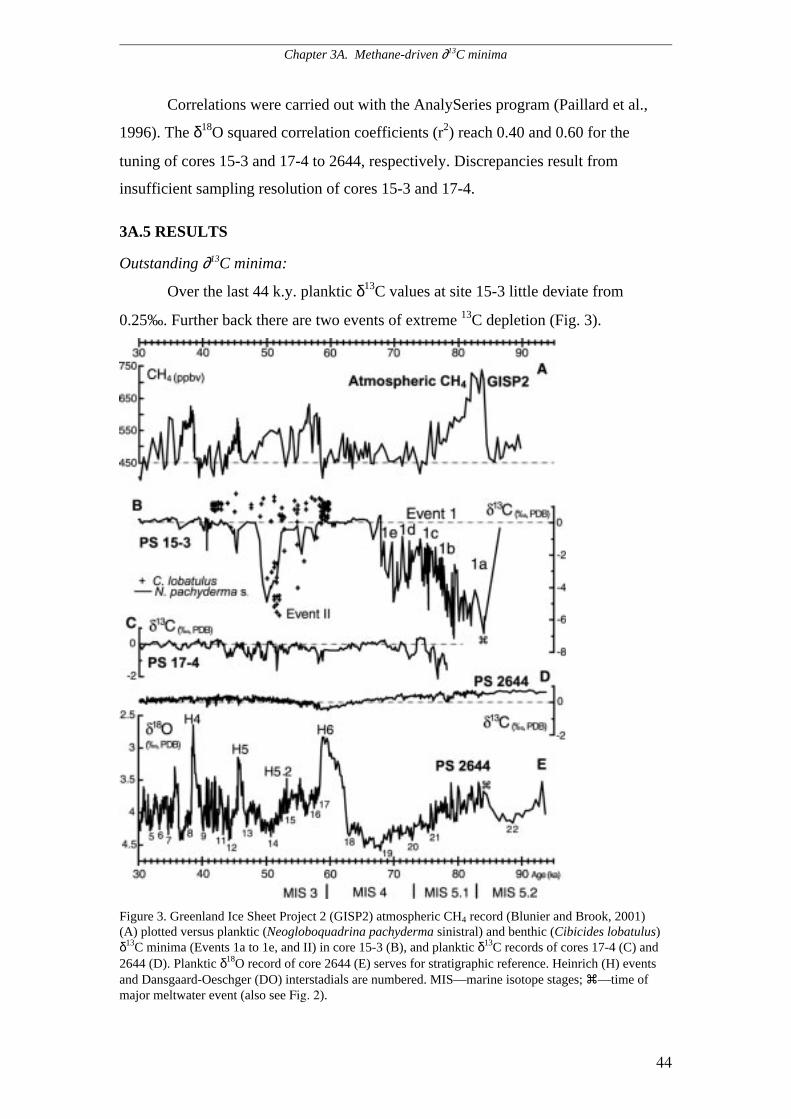
Chapter 3A. Methane-driven ∂13C minima
44
Correlations were carried out with the AnalySeries program (Paillard et al.,
1996). The δ18O squared correlation coefficients (r2) reach 0.40 and 0.60 for the
tuning of cores 15-3 and 17-4 to 2644, respectively. Discrepancies result from
insufficient sampling resolution of cores 15-3 and 17-4.
3A.5 RESULTS
Outstanding ∂13C minima:
Over the last 44 k.y. planktic δ13C values at site 15-3 little deviate from
0.25‰. Further back there are two events of extreme 13C depletion (Fig. 3).
Figure 3. Greenland Ice Sheet Project 2 (GISP2) atmospheric CH4 record (Blunier and Brook, 2001)(A) plotted versus planktic (Neogloboquadrina pachyderma sinistral) and benthic (Cibicides lobatulus)δ13C minima (Events 1a to 1e, and II) in core 15-3 (B), and planktic δ13C records of cores 17-4 (C) and2644 (D). Planktic δ18O record of core 2644 (E) serves for stratigraphic reference. Heinrich (H) eventsand Dansgaard-Oeschger (DO) interstadials are numbered. MIS—marine isotope stages; !—time ofmajor meltwater event (also see Fig. 2).
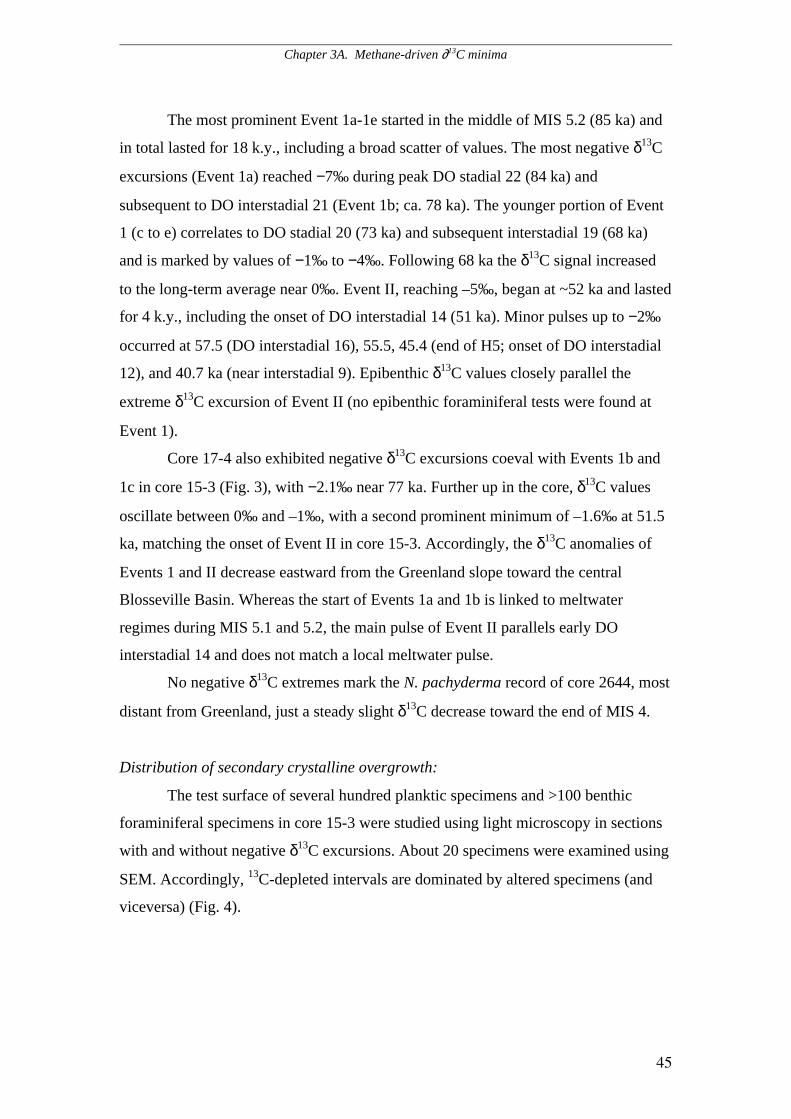
Chapter 3A. Methane-driven ∂13C minima
45
The most prominent Event 1a-1e started in the middle of MIS 5.2 (85 ka) and
in total lasted for 18 k.y., including a broad scatter of values. The most negative δ13C
excursions (Event 1a) reached −7‰ during peak DO stadial 22 (84 ka) and
subsequent to DO interstadial 21 (Event 1b; ca. 78 ka). The younger portion of Event
1 (c to e) correlates to DO stadial 20 (73 ka) and subsequent interstadial 19 (68 ka)
and is marked by values of −1‰ to −4‰. Following 68 ka the δ13C signal increased
to the long-term average near 0‰. Event II, reaching –5‰, began at ~52 ka and lasted
for 4 k.y., including the onset of DO interstadial 14 (51 ka). Minor pulses up to −2‰
occurred at 57.5 (DO interstadial 16), 55.5, 45.4 (end of H5; onset of DO interstadial
12), and 40.7 ka (near interstadial 9). Epibenthic δ13C values closely parallel the
extreme δ13C excursion of Event II (no epibenthic foraminiferal tests were found at
Event 1).
Core 17-4 also exhibited negative δ13C excursions coeval with Events 1b and
1c in core 15-3 (Fig. 3), with −2.1‰ near 77 ka. Further up in the core, δ13C values
oscillate between 0‰ and –1‰, with a second prominent minimum of –1.6‰ at 51.5
ka, matching the onset of Event II in core 15-3. Accordingly, the δ13C anomalies of
Events 1 and II decrease eastward from the Greenland slope toward the central
Blosseville Basin. Whereas the start of Events 1a and 1b is linked to meltwater
regimes during MIS 5.1 and 5.2, the main pulse of Event II parallels early DO
interstadial 14 and does not match a local meltwater pulse.
No negative δ13C extremes mark the N. pachyderma record of core 2644, most
distant from Greenland, just a steady slight δ13C decrease toward the end of MIS 4.
Distribution of secondary crystalline overgrowth:
The test surface of several hundred planktic specimens and >100 benthic
foraminiferal specimens in core 15-3 were studied using light microscopy in sections
with and without negative δ13C excursions. About 20 specimens were examined using
SEM. Accordingly, 13C-depleted intervals are dominated by altered specimens (and
viceversa) (Fig. 4).
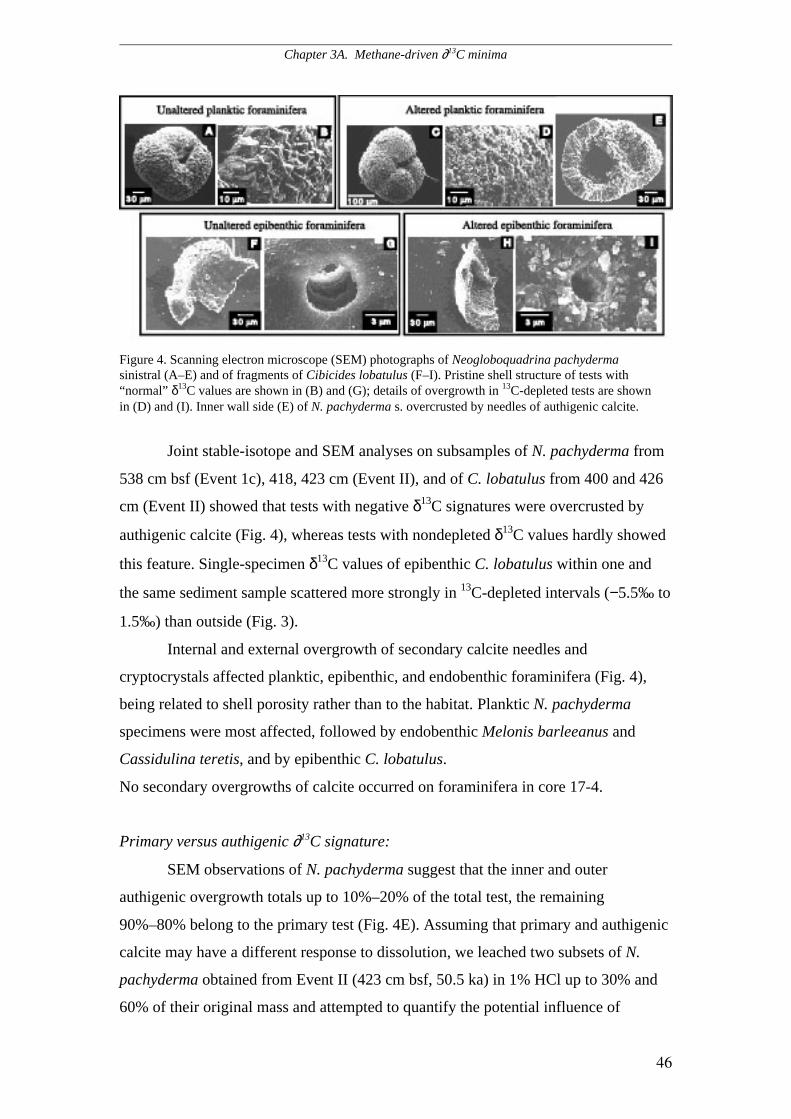
Chapter 3A. Methane-driven ∂13C minima
46
Figure 4. Scanning electron microscope (SEM) photographs of Neogloboquadrina pachydermasinistral (A–E) and of fragments of Cibicides lobatulus (F–I). Pristine shell structure of tests with“normal” δ13C values are shown in (B) and (G); details of overgrowth in 13C-depleted tests are shownin (D) and (I). Inner wall side (E) of N. pachyderma s. overcrusted by needles of authigenic calcite.
Joint stable-isotope and SEM analyses on subsamples of N. pachyderma from
538 cm bsf (Event 1c), 418, 423 cm (Event II), and of C. lobatulus from 400 and 426
cm (Event II) showed that tests with negative δ13C signatures were overcrusted by
authigenic calcite (Fig. 4), whereas tests with nondepleted δ13C values hardly showed
this feature. Single-specimen δ13C values of epibenthic C. lobatulus within one and
the same sediment sample scattered more strongly in 13C-depleted intervals (−5.5‰ to
1.5‰) than outside (Fig. 3).
Internal and external overgrowth of secondary calcite needles and
cryptocrystals affected planktic, epibenthic, and endobenthic foraminifera (Fig. 4),
being related to shell porosity rather than to the habitat. Planktic N. pachyderma
specimens were most affected, followed by endobenthic Melonis barleeanus and
Cassidulina teretis, and by epibenthic C. lobatulus.
No secondary overgrowths of calcite occurred on foraminifera in core 17-4.
Primary versus authigenic ∂13C signature:
SEM observations of N. pachyderma suggest that the inner and outer
authigenic overgrowth totals up to 10%–20% of the total test, the remaining
90%–80% belong to the primary test (Fig. 4E). Assuming that primary and authigenic
calcite may have a different response to dissolution, we leached two subsets of N.
pachyderma obtained from Event II (423 cm bsf, 50.5 ka) in 1% HCl up to 30% and
60% of their original mass and attempted to quantify the potential influence of
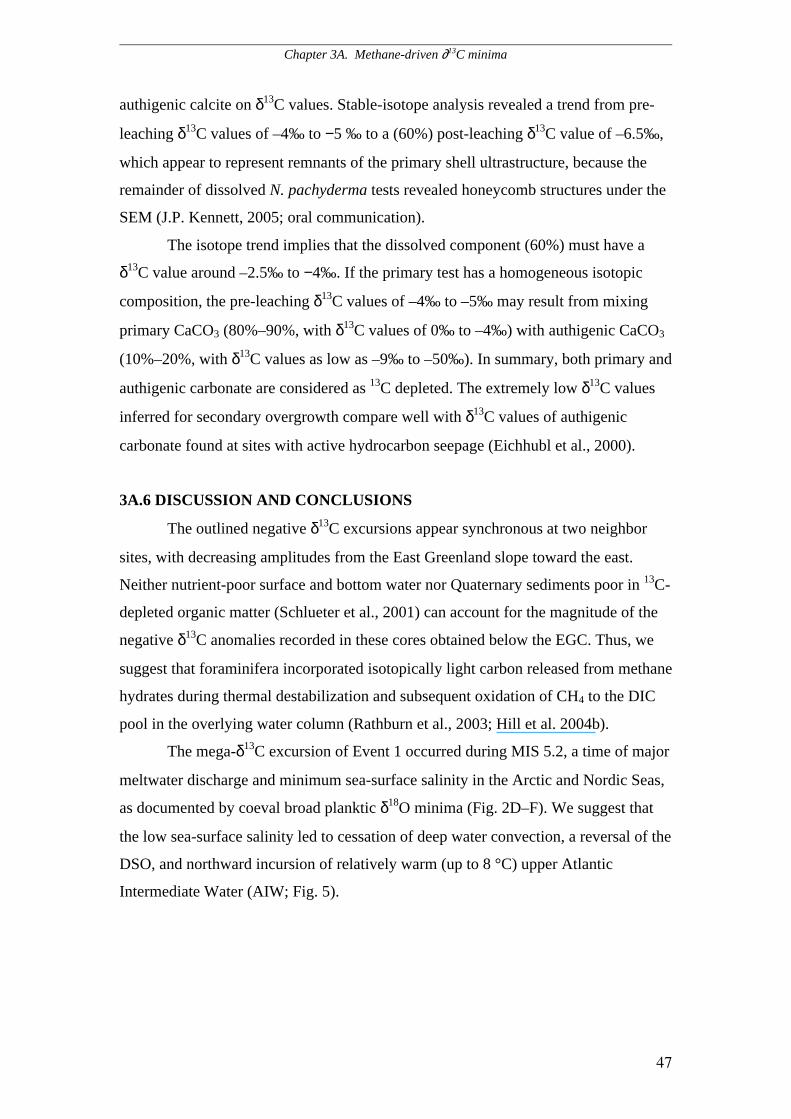
Chapter 3A. Methane-driven ∂13C minima
47
authigenic calcite on δ13C values. Stable-isotope analysis revealed a trend from pre-
leaching δ13C values of –4‰ to −5 ‰ to a (60%) post-leaching δ13C value of –6.5‰,
which appear to represent remnants of the primary shell ultrastructure, because the
remainder of dissolved N. pachyderma tests revealed honeycomb structures under the
SEM (J.P. Kennett, 2005; oral communication).
The isotope trend implies that the dissolved component (60%) must have a
δ13C value around –2.5‰ to −4‰. If the primary test has a homogeneous isotopic
composition, the pre-leaching δ13C values of –4‰ to –5‰ may result from mixing
primary CaCO3 (80%–90%, with δ13C values of 0‰ to –4‰) with authigenic CaCO3
(10%–20%, with δ13C values as low as –9‰ to –50‰). In summary, both primary and
authigenic carbonate are considered as 13C depleted. The extremely low δ13C values
inferred for secondary overgrowth compare well with δ13C values of authigenic
carbonate found at sites with active hydrocarbon seepage (Eichhubl et al., 2000).
3A.6 DISCUSSION AND CONCLUSIONS
The outlined negative δ13C excursions appear synchronous at two neighbor
sites, with decreasing amplitudes from the East Greenland slope toward the east.
Neither nutrient-poor surface and bottom water nor Quaternary sediments poor in 13C-
depleted organic matter (Schlueter et al., 2001) can account for the magnitude of the
negative δ13C anomalies recorded in these cores obtained below the EGC. Thus, we
suggest that foraminifera incorporated isotopically light carbon released from methane
hydrates during thermal destabilization and subsequent oxidation of CH4 to the DIC
pool in the overlying water column (Rathburn et al., 2003; Hill et al. 2004b).
The mega-δ13C excursion of Event 1 occurred during MIS 5.2, a time of major
meltwater discharge and minimum sea-surface salinity in the Arctic and Nordic Seas,
as documented by coeval broad planktic δ18O minima (Fig. 2D–F). We suggest that
the low sea-surface salinity led to cessation of deep water convection, a reversal of the
DSO, and northward incursion of relatively warm (up to 8 °C) upper Atlantic
Intermediate Water (AIW; Fig. 5).
Chapter 3A. Methane-driven ∂13C minima
48
Figure 5. Paleoceanographic model profile across Blosseville Basin during periods of Denmark StraitOverflow (DSO) reversals and incursion of relatively warm Atlantic Upper Intermediate Water (AIW)(adapted from Kennett et al., 2000). Bubbles indicate CH4 blow-out plume from East Greenland slope.MIS—marine isotope stage.
Rasmussen and Thomsen (2004) first postulated for DO stadials that AIW
(from the Mediterranean Outflow) may have debouched into the Nordic Seas, below
stratified cold surface water. This warming and a relative sea-level lowstand
(Lambeck and Chappell, 2001) during MIS 5.2 possibly led to clathrate instability
near to site 15-3 (clathrates at 700 mwd become unstable at 8 °C; Dickens and
Quinby-Hunt, 1994) (Fig. 5). Although bottom simulating reflections have rarely been
encountered along the Greenland slope, clathrates of pre-Quaternary origin are likely
to occur (B. Larsen, 2005; personal comm.). In addition, a methane origin for the δ13C
excursions is supported by (1) coeval 13C depletion at different sites, decreasing from
the Greenland slope (Site 15-3) toward the east; and (2) isotopically light authigenic
overgrowth at site 15-3, where no other source of 13C-depleted organic carbon is
available. Such overgrowth is common for CH4-enriched vent regions (Eichhubl et al.,
2000).
The impact of methane-influenced DIC on primary tests of N. pachyderma can
be explained by the conceptual model that rising CH4 bubbles reached the stratified
surface water of the southward flowing EGC (Fig. 5), there producing a significant13C depletion of DIC. Moreover, extensive sea ice probably delayed the gas exchange
between ocean and atmosphere, increased CH4 concentration in surface water, and
thereby prolonged the residence time of the negative δ13C shift up to a
Chapter 3A. Methane-driven ∂13C minima
49
summer/growth season (2-3 months). In total, the amount of CH4 responsible for
lowering the δ13CDIC by –2.5‰ to –4‰, (the additional lowering towards –7‰ is
ascribed to diagenetic overprint) was calculated from the water volume affected
(~1,900 km3) in both the immediate bottom water and the sea ice covered, 150 meter
thick surface layer of the (western) Blosseville Basin (Fig. 5), methane δ13C of –65‰
versus the background δ13CDIC value of 0‰, and a DIC concentration of 2.2 mmol/kg,
and may amount to 2.6 – 4.3 Tg equal to 3.5 – 6.5 km3 of CH4 for each season
affected, and up to 21 to 40 km3 of molten clathrate for every 1000 years (with 164 m3
of gas per m3 of clathrate at 1 atm).
Less pronounced negative δ13C anomalies in core 17-4 (central Blosseville
Basin) suggest a smaller negative change in surface water δ13C due to eastward
dilution of the CH4 plume, but are also linked to an apparent absence of authigenesis
in both planktic and benthic foraminifera at this site (based on light microscopy).
The major δ13C minima of Events 1a and II match atmospheric CH4 maxima
(Blunier and Brook, 2001) during MIS 5.2, 5.1, and 3, both in terms of amplitude and
duration (Fig. 3). This may support the hypothesis that destabilization of methane
hydrates has contributed to increases in atmospheric CH4 during stadial-to-interstadial
warmings (Kennett et al., 2003).
In summary, a meltwater-induced cessation of deep water convection in the
Greenland Sea, northward advection of warm intermediate water, and subsequent
thermal instability of clathrates appear to be the most likely explanation for the
extreme δ13C Events 1a-1c. No such inferred meltwater pulses are yet recorded during
Event II at the transition from HE 5.2 to DO interstadial 14, and hence this aspect of
the hypothesis requires explanation.
ACKNOWLEDGMENTS
We thank M. Weinelt, P.M. Grootes, J. Kennett (Santa Barbara), B. Larsen
(Copenhagen), and the reviewers for highly valuable comments and advice, and
the German Research Foundation (DFG) for support within the Kiel Research
Unit 451.
Chapter 3A. Methane-driven ∂13C minima
50
REFERENCES CITED:
Blunier, T., and Brook, E.J., 2001, Timing of millennial-scale climate change inAntarctica and Greenland during the last glacial period: Science, v. 291,p. 109–112.
Brook, E.J., Harder, S., Severinghaus, J., and Bender, M., 1999, Atmospheric methaneand millennial-scale climate change, in Clark, P.U., et al., eds., Mechanisms ofglobal climate change at millennial time scales: American Geophysical UnionGeophysical Monograph 112, p. 165–175.
de Garidel-Thoron, T., Beaufort, L., Bassinot, F., and Henry, P., 2004, Evidence forlarge methane releases to the atmosphere from deep-sea gas-hydrate dissociationduring the last glacial episode: Proceedings of the National Academy of Sciencesof the United States of America, v. 101, p. 9187–9192.
Dickens, G.R., and Quinby-Hunt, M.S., 1994, Methane hydrate stability in seawater:Geophysical Research Letters, v. 21, p. 2115–2118.
Eichhubl, P., Greene, H.G., Naehr, T., and Maher, N., 2000, Structural control of fluidflow: Offshore fluid seepage in the Santa Barbara Basin, California: Journal ofGeochemical Exploration, v. 69–70, p. 545–549.
Grootes, P.M., and Stuiver, M., 1997, 18O/16O variability in Greenland snow and icewith 10−3 to 105 year time resolution: Journal of Geophysical Research, v. 102,no. C12, p. 26,455–26,470.
Hill, T.M., Kennett, J.P., and Spero, H.J., 2004a, High-resolution records of methanehydrate dissociation: ODP Site 893, Santa Barbara Basin: Earth and PlanetaryScience Letters, v. 223, p. 127–140.
Hill, T.M., Kennett, J.P., and Valentine, D.L., 2004b, Isotopic evidence for theincorporation of methane-derived carbon into foraminifera from modern methaneseeps, Hydrate Ridge, northeast Pacific: Geochimica et Cosmochimica Acta,v. 68, p. 4619–4627.
Kennett, J.P., Cannariato, K.G., Hendy, I.L., and Behl, R.J., 2000, Carbon isotopicevidence for methane hydrate instability during Quaternary interstadials: Science,v. 288, p. 128–133.
Kennett, J.P., Cannariato, K.G., Hendy, I.L., and Behl, R.J., 2003, Methane hydratesin Quaternary climate change, the Clathrate Gun Hypothesis: Washington D.C.,American Geophysical Union, 216 p.
Laj, C., Kissel, C., Mazaud, A., Channell, J.E.T., and Beer, J., 2000, North Atlanticpaleointensity stack since 75 ka of the Laschamp event: Royal Society of LondonPhilosophical Transactions, ser. A, v. 358, p. 1009–1025.
Lambeck, K., and Chappell, J., 2001, Sea level change through the last glacial cycle:Science, v. 292, p. 679–686.
North Greenland Ice Core Project Members, 2004, High-resolution record of NorthernHemisphere climate extending into the last interglacial period: Nature, v. 431,p. 147–151.
Paillard, D., Labeyrie, L., and Yiou, P., 1996, Macintosh program performs time-series analysis: Eos (Transactions, American Geophysical Union), v. 77, p. 379.
Rasmussen, T.L., and Thomsen, E., 2004, The role of the North Atlantic Drift in themillennial timescale glacial climate fluctuations: Palaeogeography,Palaeoclimatology, Palaeoecology, v. 210, p. 101–116.
Rathburn, A.E., Perez, E.M., Martin, J.B., Day, S.A., Mahn, C., Gieskes, J., Ziebis,W., Williams, D., and Bahls, A., 2003, Relationships between the distribution andstable isotopic composition of living benthic foraminifera and cold methane seep
Chapter 3A. Methane-driven ∂13C minima
51
biogeochemistry in Monterey Bay, California: Geochemistry, Geophysics,Geosystems, v. 4, p. 1106.
Schlueter, M., Sauter, E.J., Schulz-Bull, D., Balzer, W., and Suess, E., 2001, Fluxes oforganic carbon and biogenic silica reaching the seafloor: A comparison of highnorthern and southern latitudes of the Atlantic Ocean, in Schaefer, P., et al., eds.,The northern North Atlantic: A changing environment: Berlin, Springer, p.225–240.
Smith, L.M., Sachs, J.P., Jennings, A.E., Anderson, D.M., and de Vernal, A., 2001,Light δ13C events during deglaciation of the East Greenland continental shelfattributed to methane release from gas hydrates: Geophysical Research Letters,v. 28, p. 2217–2220.
van Kreveld, S., Sarnthein, M., Erlenkeuser, H., Grootes, P., Jung, S., Nadeau, M.J.,Pflaumann, U., and Voelker, A., 2000, Potential links between surging ice sheets,circulation changes, and the Dansgaard-Oeschger cycles in the Irminger Sea,60–18 kyr: Paleoceanography, v. 15, p. 425–442.
Voelker, A.H., 1999, Zur Deutung der Dansgaard-Oeschger Ereignisse in ultra-hochauflösenden Sedimentprofilen aus dem Europäischen Nordmeer (Ph.D.thesis): Kiel, University of Kiel, 180 p.
Voelker, A.H., Sarnthein, M., Grootes, P.M., Erlenkeuser, H., Laj, C., Mazaud, A.,Nadeau, M.J., and Schleicher, M., 1998, Correlation of marine 14C ages from theNordic Seas with the GISP2 isotope record: Implications for 14C calibrationbeyond 25 ka BP: Radiocarbon, v. 40, p. 517–534.
Chapter 3B. Methane-induced diagenesis of foraminiferal tests
52
3B. Methane-induced early diagenesis of foraminiferal tests in the
southwestern Greenland Sea
CHRISTIAN MILLO, MICHAEL SARNTHEIN, HELMUT ERLENKEUSER, PIETGROOTES, AND NILS ANDERSEN
Christian Millo ([email protected]) and Michael Sarnthein, Department of Geology, Christian-Albrechts-Universitaet, Olshausenstrasse 40, D-24118 Kiel, Germany;
Helmut Erlenkeuser, Piet Grootes, and Nils Andersen, Leibniz-Labor for Radiometric Dating andIsotope Research, Max-Eyth-Strasse 11, D-24118 Kiel, Germany.
Accepted for publication in Marine Micropaleontology on 25 July 2005
Abstract
Planktic and epibenthic foraminiferal δ13C records at Site PS62/015-3 (southwestern
Greenland Sea) reveal a series of transient events of extreme 13C depletion down to
–6‰ during the period 90-40 ka. Scanning electron microscope studies of the
ultrastructures of foraminiferal tests suggest that 13C depleted specimens are affected
by some 10-20% overgrowth by authigenic calcite contributing to the light δ13C
signal. Incremental-leaching experiments and census counts of pristine versus
overgrowth-affected specimens show that the 13C depleted foraminiferal tests
incorporate a primary δ13C signature most likely ranging from +1 to –1.7‰ and a
post-depositional δ13C signature around –17 to –19.5‰. Extremely low values of
productivity and organic carbon in Late Quaternary sediments along the East
Greenland margin preclude organic matter as potential source of the isotopically light
carbon. In contrast, thermal instability of clathrates and subsequent aerobic oxidation
of (highly 12C enriched) methane in pore and ocean water provide a compelling
mechanism to account for the negative δ13C excursions of both primary and post-
depositional carbonates. Here, pore water methane may have led to a supersaturation
of 13C depleted bicarbonate and precipitation of isotopically light authigenic calcite on
Chapter 3B. Methane-induced diagenesis of foraminiferal tests
53
and in foraminiferal tests, a feature that may serve as a tracer to former sites of
clathrate destabilization.
Keywords: Greenland Sea, Stable carbon isotope, Clathrates, Diagenesis,
Foraminifera.
3B.1 Introduction
The stable isotope composition of foraminiferal tests is widely used in
paleoceanographic studies to reconstruct the physical and chemical parameters of
ambient water masses. In recent years, extremely negative anomalies were frequently
identified in planktic and benthic carbon isotope records at times of abrupt global
warming. These events suggest that large amounts of isotopically light carbon have
been released into the ocean as result of thermally-induced clathrate dissociation, light
carbon that eventually has been incorporated into the Dissolved Inorganic Carbon
(DIC) pool and the skeletons of marine organisms (Wefer et al., 1994; Dickens et al.,
1995; Kennett et al., 2000; Hill et al., 2004). It is a matter of ongoing debate, whether
such extremely negative foraminiferal δ13C values derive from the DIC composition at
primary calcification and/or from subsequent authigenesis (Cannariato and Stott,
2004). To address the controversy, extensive studies were carried out by several
authors with conflicting and complex conclusions.
On the one hand, trace element analyses of 13C depleted benthic specimens
from the Hydrate Ridge (Oregon) showed a Mg/Ca ratio of 30 to 50 mmol/mol and
thus indicated a post-depositional overprint (Torres et al., 2003). On the other hand,
stable isotope measurements of living (rose Bengal stained) benthic individuals from
active methane seeps (Rathburn et al. 2003; Hill et al. 2004) revealed that most
foraminiferal tests just reflect the primary, extremely low δ13CDIC signal of their
habitat. Furthermore, scanning electron microscope (SEM) images coupled with
stable isotope data of single planktic and benthic foraminiferal tests revealed no
evidence of secondary CaCO3 precipitates in 13C depleted individuals (Kennett et al.,
2000; de Garidel-Thoron et al., 2004; Hill et al. 2004). In contrast, Lembke et al.
(pers. comm.) report authigenic carbonate overgrowth which induced severe 13C
depletion of foraminifera obtained from methane vents near the entrance of the Sea of
Okhotsk. In summary, these findings suggest that episodic methane seepage from
Chapter 3B. Methane-induced diagenesis of foraminiferal tests
54
marine sediments leaves a primary and /or a post-depositional imprint on
foraminiferal δ13C.
In this study we further elaborate on extreme δ13C minima recently reported by
Millo et al. (in press, 2005). They showed planktic and epibenthic stable isotope
records at Site PS62/015-3 (Blosseville Basin, East Greenland slope), which
document during the last 90 000 years several transient events of 13C depletion down
to –6‰, a level unusual for the Nordic Seas. Organic matter can be largely dismissed
as source of light carbon isotopes, since the organic carbon content in sediments along
the East Greenland margin is low. On the other hand, these δ13C minima appear to be
linked to meltwater-induced reversals in the Denmark Strait Overflow and a dramatic
bottom water warming in the Blosseville Basin during Dansgaard-Oeschger stadials.
The bottom water warming, in turn, is considered as a trigger of thermal instability of
clathrates, thus providing a compelling mechanism for the injection of isotopically
light methane into both pore water and the ocean surface layer, where methane is
subjected to aerobic oxidation and added to the local DIC.
At Site 15-3, the extreme δ13C minima in planktic and benthic foraminifera
appear to be linked to features of secondary overgrowth, that is to early diagenesis
still within one and the same stratigraphic horizon. In contrast, coeval but less
negative δ13CDIC excursions (~ -1.25‰) that are documented as aberrant in a planktic
δ13C record from neighbor Site PS62/ 017-4 don’t appear paralleled by post-
depositional alteration. These different records may thus suggest that early diagenetic
overgrowth on foraminiferal specimens may concentrate to the vicinity of sites of
hydrate destabilization. In this study we try to constrain both the extent of 13C
depletion representing a primary signal of methane in the water column and the extent
of post-depositional, secondary δ13C signatures due to authigenic carbonate.
3B.2 Study area and methods
Sediment core PS62/015-3 (referred to as core/Site 15-3; 67° 55.85‘ N, 25° 25.59‘ W,
980 m water depth) was retrieved from the Blosseville Basin which is located to the
north of the Denmark Strait between East Greenland and Northwest Iceland with
water depths reaching approximately 1500 m (Fig. 1).
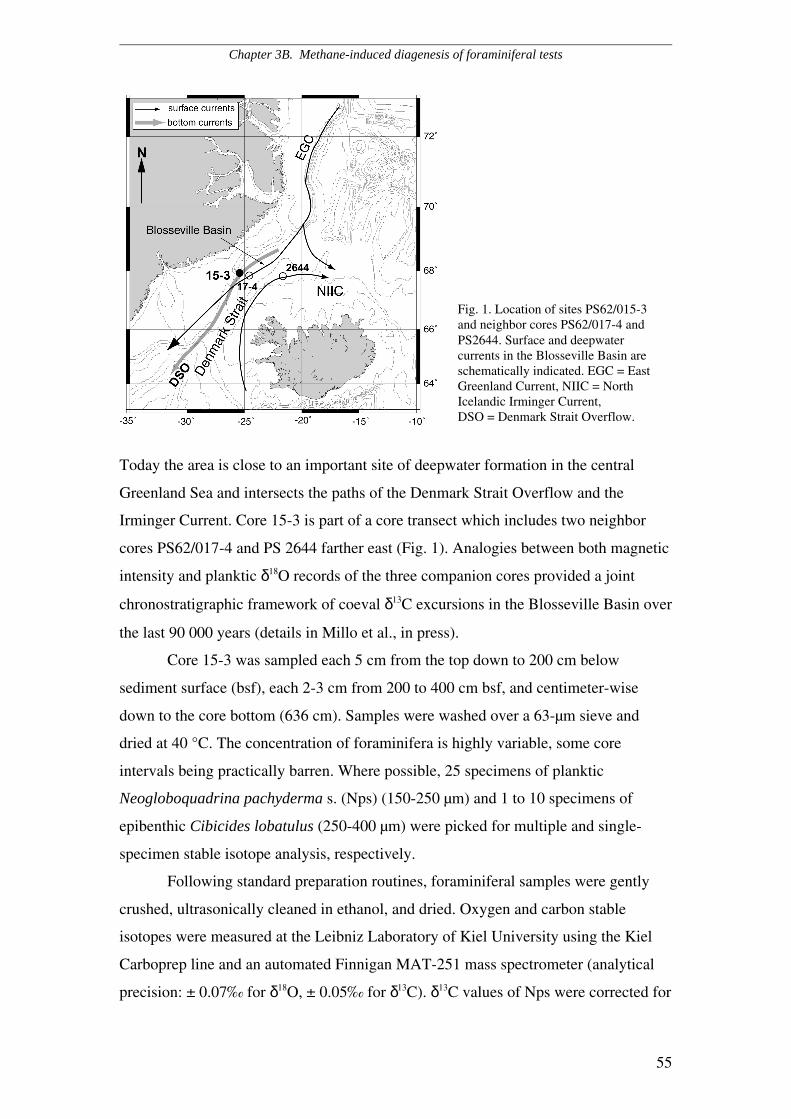
Chapter 3B. Methane-induced diagenesis of foraminiferal tests
55
Today the area is close to an important site of deepwater formation in the central
Greenland Sea and intersects the paths of the Denmark Strait Overflow and the
Irminger Current. Core 15-3 is part of a core transect which includes two neighbor
cores PS62/017-4 and PS 2644 farther east (Fig. 1). Analogies between both magnetic
intensity and planktic δ18O records of the three companion cores provided a joint
chronostratigraphic framework of coeval δ13C excursions in the Blosseville Basin over
the last 90 000 years (details in Millo et al., in press).
Core 15-3 was sampled each 5 cm from the top down to 200 cm below
sediment surface (bsf), each 2-3 cm from 200 to 400 cm bsf, and centimeter-wise
down to the core bottom (636 cm). Samples were washed over a 63-µm sieve and
dried at 40 °C. The concentration of foraminifera is highly variable, some core
intervals being practically barren. Where possible, 25 specimens of planktic
Neogloboquadrina pachyderma s. (Nps) (150-250 µm) and 1 to 10 specimens of
epibenthic Cibicides lobatulus (250-400 µm) were picked for multiple and single-
specimen stable isotope analysis, respectively.
Following standard preparation routines, foraminiferal samples were gently
crushed, ultrasonically cleaned in ethanol, and dried. Oxygen and carbon stable
isotopes were measured at the Leibniz Laboratory of Kiel University using the Kiel
Carboprep line and an automated Finnigan MAT-251 mass spectrometer (analytical
precision: ± 0.07‰ for δ18O, ± 0.05‰ for δ13C). δ13C values of Nps were corrected for
Fig. 1. Location of sites PS62/015-3and neighbor cores PS62/017-4 andPS2644. Surface and deepwatercurrents in the Blosseville Basin areschematically indicated. EGC = EastGreenland Current, NIIC = NorthIcelandic Irminger Current,DSO = Denmark Strait Overflow.
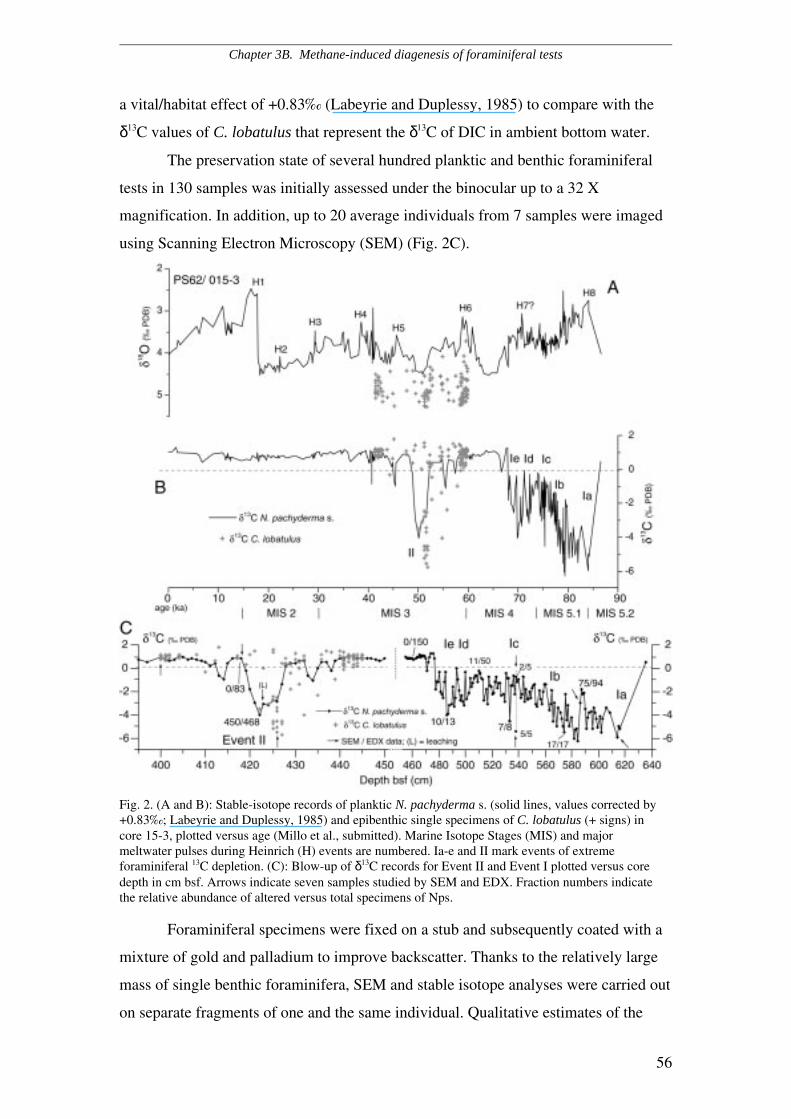
Chapter 3B. Methane-induced diagenesis of foraminiferal tests
56
a vital/habitat effect of +0.83‰ (Labeyrie and Duplessy, 1985) to compare with the
δ13C values of C. lobatulus that represent the δ13C of DIC in ambient bottom water.
The preservation state of several hundred planktic and benthic foraminiferal
tests in 130 samples was initially assessed under the binocular up to a 32 X
magnification. In addition, up to 20 average individuals from 7 samples were imaged
using Scanning Electron Microscopy (SEM) (Fig. 2C).
Fig. 2. (A and B): Stable-isotope records of planktic N. pachyderma s. (solid lines, values corrected by+0.83‰; Labeyrie and Duplessy, 1985) and epibenthic single specimens of C. lobatulus (+ signs) incore 15-3, plotted versus age (Millo et al., submitted). Marine Isotope Stages (MIS) and majormeltwater pulses during Heinrich (H) events are numbered. Ia-e and II mark events of extremeforaminiferal 13C depletion. (C): Blow-up of δ13C records for Event II and Event I plotted versus coredepth in cm bsf. Arrows indicate seven samples studied by SEM and EDX. Fraction numbers indicatethe relative abundance of altered versus total specimens of Nps.
Foraminiferal specimens were fixed on a stub and subsequently coated with a
mixture of gold and palladium to improve backscatter. Thanks to the relatively large
mass of single benthic foraminifera, SEM and stable isotope analyses were carried out
on separate fragments of one and the same individual. Qualitative estimates of the
Chapter 3B. Methane-induced diagenesis of foraminiferal tests
57
trace metal content were obtained from the test surface with Energy Dispersive X-ray
(EDX) (CAMSCAN Serie 2 CS 44).
To constrain more closely the primary and the secondary, diagenetic imprints
on foraminiferal δ13C values we also picked two subsamples of 50 Nps specimens
each from a strongly 13C depleted core section (423 cm bsf). These specimens were
leached – in a random approach – up to 30 and 60% of the original mass using 1%
HCl (0.28 mol/l). After rinsing with demineralized water, samples were cleansed in
ethanol, dried, and prepared for stable isotope analysis in order to reveal potential
δ13C changes. Independently of the isotopic composition, the elemental composition
of both the unleached and the 60–% leached shells was analyzed by EDX.
The interpretation of these experiments relied on various assumptions. (1) The
proportions of primary and authigenic carbonates in foraminiferal tests were roughly
constrained by visual SEM estimates to a range of 90/10 to 80/20, used as working
hypothesis. For example, by studying shell fragments we compared the thickness of
the overgrowth of authigenic small euhedral crystals and crystal clusters on top of
pristine test walls and surfaces with the thickness of the pristine test portion itself,
characterized by crystal palisades (see Fig. 3J, K and L). (2) Primary and authigenic
carbonates are regarded as differentially sensitive to dissolution because of different
crystal structures. (3) Accordingly, it should be possible to infer differences in the
isotopic composition of both components from pre- and post-leaching δ13C values and
via a mass balance calculation, if the isotopic composition of the primary shell is
assumed homogeneous. However, our EDX analyses show that large portions (up to
80/ 90%) of the non–dissolved shell remnants consist of non–carbonate (Table 1b)
and hence are non–homogeneous.
3B.3 Results
The planktic and benthic foraminiferal δ13C records of core 15-3 exhibit two major
intervals of extreme 13C depletion (Fig. 2; for details see Millo et al., in press). The
most prominent event occurs in the older portion of the record, between 580 and 615
cm bsf (Fig. 2C), that is from 85 to 79 ka (Fig. 2B), where δ13C values of Nps scatter
broadly between –6.2 and –2.2‰ and subsequently increase gradually upcore to 0 and
+1‰. In the lowermost portion of this Event Ia planktic foraminiferal specimens are
rare, and epibenthic specimens are absent.
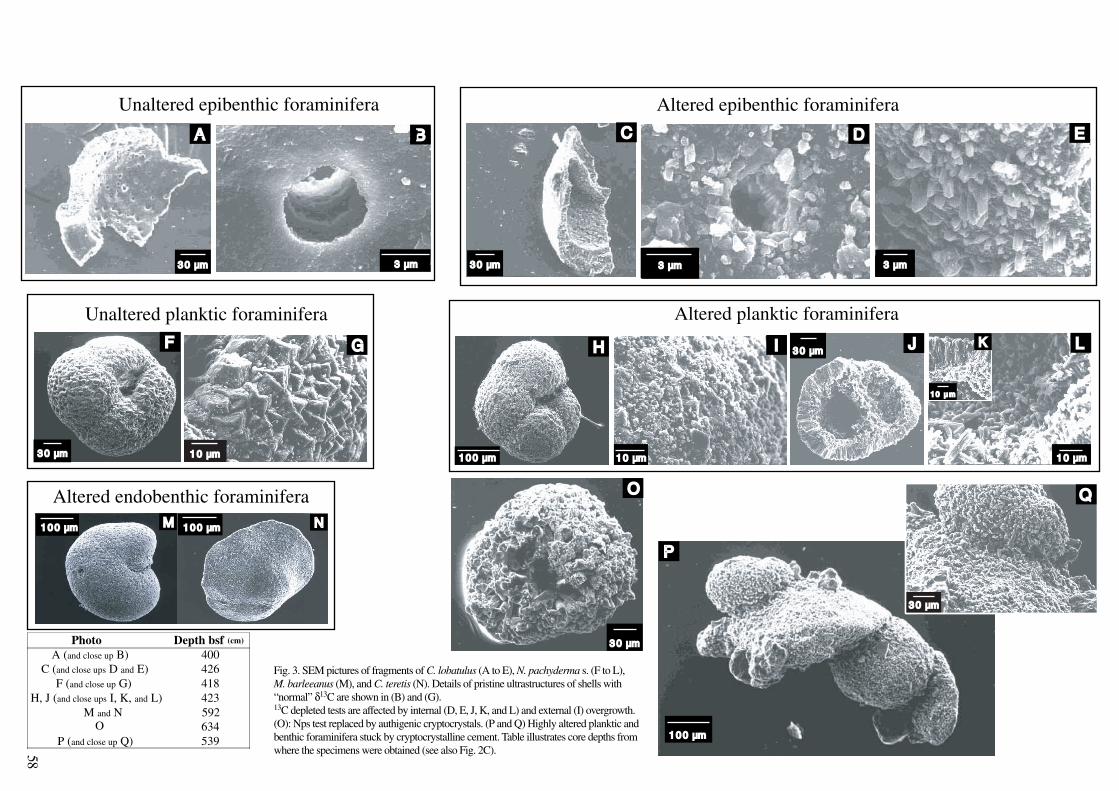
Unaltered epibenthic foraminifera
Unaltered planktic foraminifera Altered planktic foraminifera
Altered epibenthic foraminifera
A B C D E
LJ IH
Q
P
O
GF
3 0 µm 3 µm 3 0 µm
1 0 µm
3 0 µm
3 0 µm
1 0 0 µm
3 0 µm
1 0 µm
1 0 µ m
1 0 0 µm 1 0 0 µm
Altered endobenthic foraminifera
K
M N
Photo Depth bsf (cm)
A (and close up B) 400C (and close ups D and E) 426
F (and close up G) 418H, J (and close ups I, K, and L) 423
O 634P (and close up Q) 539
M and N 592
3 µm
1 0 µm
3 µm
3 0 µm
Fig. 3. SEM pictures of fragments of C. lobatulus (A to E), N. pachyderma s. (F to L),M. barleeanus (M), and C. teretis (N). Details of pristine ultrastructures of shells with “normal” δ13C are shown in (B) and (G).13C depleted tests are affected by internal (D, E, J, K, and L) and external (I) overgrowth. (O): Nps test replaced by authigenic cryptocrystals. (P and Q) Highly altered planktic and benthic foraminifera stuck by cryptocrystalline cement. Table illustrates core depths from where the specimens were obtained (see also Fig. 2C).58
1 0 0 µm
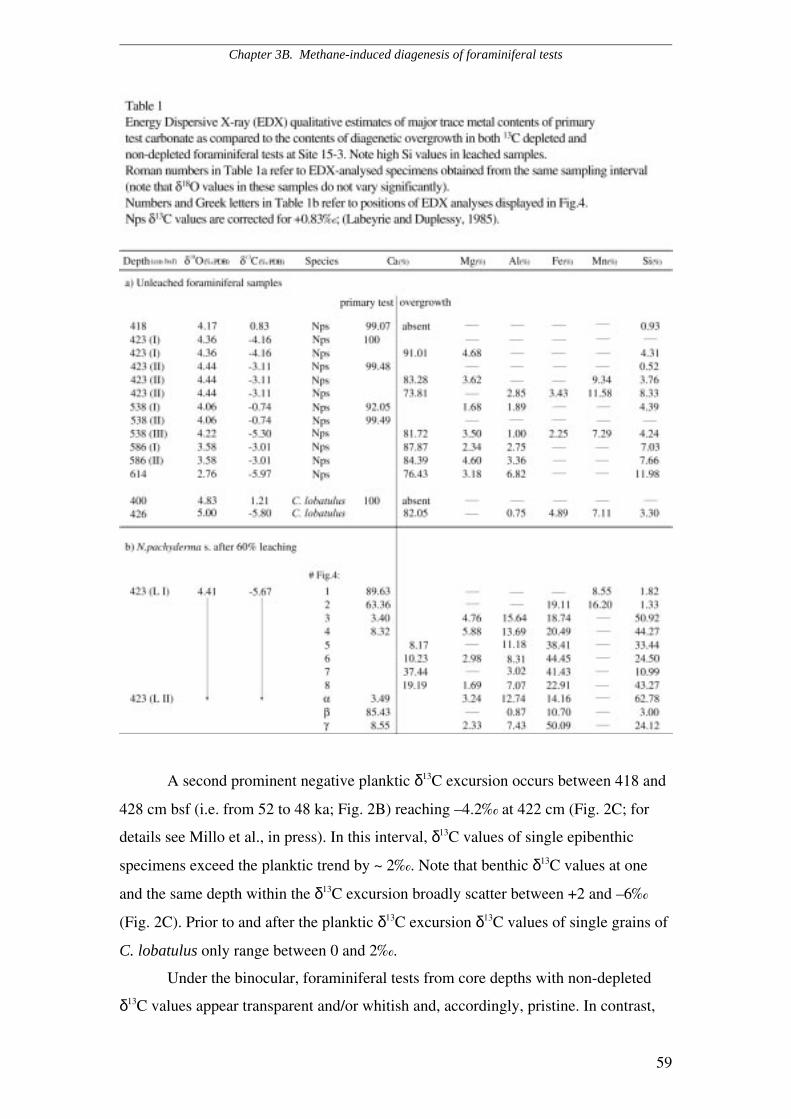
Chapter 3B. Methane-induced diagenesis of foraminiferal tests
59
A second prominent negative planktic δ13C excursion occurs between 418 and
428 cm bsf (i.e. from 52 to 48 ka; Fig. 2B) reaching –4.2‰ at 422 cm (Fig. 2C; for
details see Millo et al., in press). In this interval, δ13C values of single epibenthic
specimens exceed the planktic trend by ~ 2‰. Note that benthic δ13C values at one
and the same depth within the δ13C excursion broadly scatter between +2 and –6‰
(Fig. 2C). Prior to and after the planktic δ13C excursion δ13C values of single grains of
C. lobatulus only range between 0 and 2‰.
Under the binocular, foraminiferal tests from core depths with non-depleted
δ13C values appear transparent and/or whitish and, accordingly, pristine. In contrast,
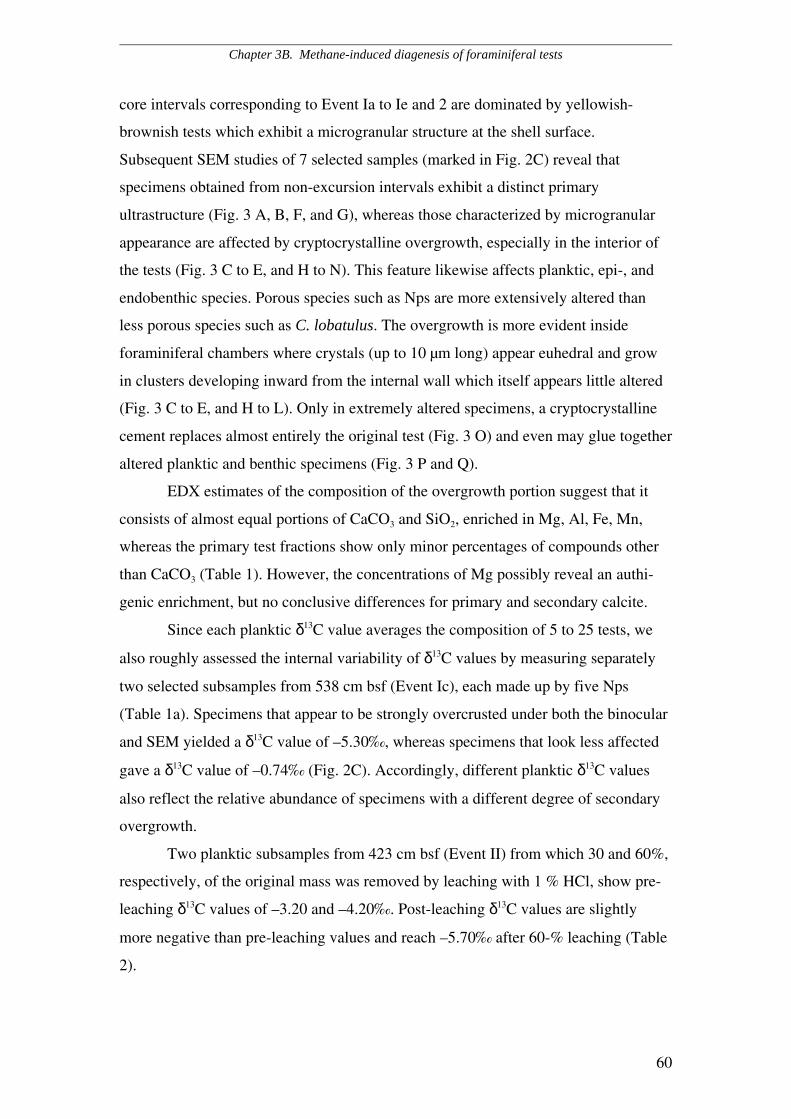
Chapter 3B. Methane-induced diagenesis of foraminiferal tests
60
core intervals corresponding to Event Ia to Ie and 2 are dominated by yellowish-
brownish tests which exhibit a microgranular structure at the shell surface.
Subsequent SEM studies of 7 selected samples (marked in Fig. 2C) reveal that
specimens obtained from non-excursion intervals exhibit a distinct primary
ultrastructure (Fig. 3 A, B, F, and G), whereas those characterized by microgranular
appearance are affected by cryptocrystalline overgrowth, especially in the interior of
the tests (Fig. 3 C to E, and H to N). This feature likewise affects planktic, epi-, and
endobenthic species. Porous species such as Nps are more extensively altered than
less porous species such as C. lobatulus. The overgrowth is more evident inside
foraminiferal chambers where crystals (up to 10 µm long) appear euhedral and grow
in clusters developing inward from the internal wall which itself appears little altered
(Fig. 3 C to E, and H to L). Only in extremely altered specimens, a cryptocrystalline
cement replaces almost entirely the original test (Fig. 3 O) and even may glue together
altered planktic and benthic specimens (Fig. 3 P and Q).
EDX estimates of the composition of the overgrowth portion suggest that it
consists of almost equal portions of CaCO3 and SiO2, enriched in Mg, Al, Fe, Mn,
whereas the primary test fractions show only minor percentages of compounds other
than CaCO3 (Table 1). However, the concentrations of Mg possibly reveal an authi-
genic enrichment, but no conclusive differences for primary and secondary calcite.
Since each planktic δ13C value averages the composition of 5 to 25 tests, we
also roughly assessed the internal variability of δ13C values by measuring separately
two selected subsamples from 538 cm bsf (Event Ic), each made up by five Nps
(Table 1a). Specimens that appear to be strongly overcrusted under both the binocular
and SEM yielded a δ13C value of –5.30‰, whereas specimens that look less affected
gave a δ13C value of –0.74‰ (Fig. 2C). Accordingly, different planktic δ13C values
also reflect the relative abundance of specimens with a different degree of secondary
overgrowth.
Two planktic subsamples from 423 cm bsf (Event II) from which 30 and 60%,
respectively, of the original mass was removed by leaching with 1 % HCl, show pre-
leaching δ13C values of –3.20 and –4.20‰. Post-leaching δ13C values are slightly
more negative than pre-leaching values and reach –5.70‰ after 60-% leaching (Table
2).
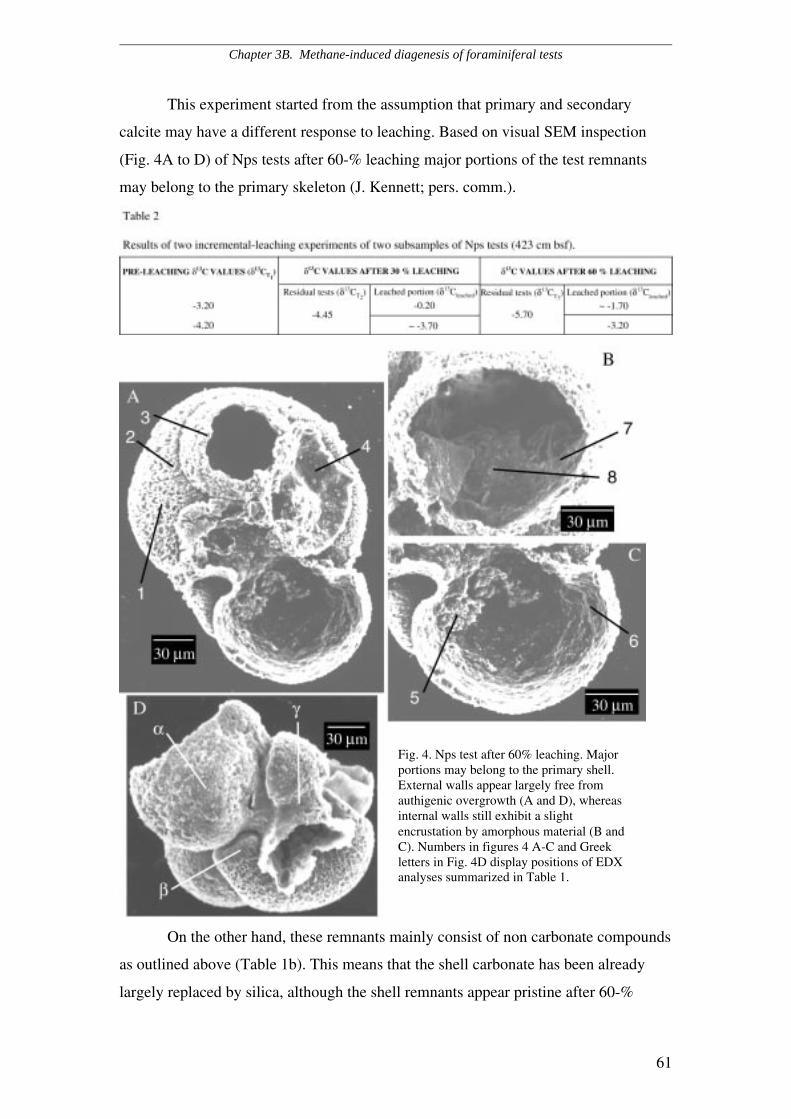
Chapter 3B. Methane-induced diagenesis of foraminiferal tests
61
This experiment started from the assumption that primary and secondary
calcite may have a different response to leaching. Based on visual SEM inspection
(Fig. 4A to D) of Nps tests after 60-% leaching major portions of the test remnants
may belong to the primary skeleton (J. Kennett; pers. comm.).
On the other hand, these remnants mainly consist of non carbonate compounds
as outlined above (Table 1b). This means that the shell carbonate has been already
largely replaced by silica, although the shell remnants appear pristine after 60-%
Fig. 4. Nps test after 60% leaching. Majorportions may belong to the primary shell.External walls appear largely free fromauthigenic overgrowth (A and D), whereasinternal walls still exhibit a slightencrustation by amorphous material (B andC). Numbers in figures 4 A-C and Greekletters in Fig. 4D display positions of EDXanalyses summarized in Table 1.
Chapter 3B. Methane-induced diagenesis of foraminiferal tests
62
leaching. This implies that our visual estimates of primary versus secondary shell
carbonates may be misleading and that the composition of the primary shell cannot be
considered as strictly homogeneous.
3B.4 Discussion
The δ13C values of planktic Nps specimens affected by secondary overgrowth
integrate a mixture of carbon isotope signatures formed at primary and secondary /
authigenic calcification. If we assume the primary shell of Nps and the secondary
calcite, respectively, are isotopically homogeneous, we can consider them as end
members yielding the various isotope values observed by mixing. The results of the
leaching experiments can be used to estimate via isotopic mass balance calculations
the possible combinations of isotopic end member compositions and thus the possible
range of isotopic compositions for primary shell and overgrowth. SEM estimates
suggesting the secondary overgrowth may amount to 10 to 20% of the total tests
further restrict the ranges. The calculations will give only an approximation since (1)
Nps is building its test across different habitat ranges with differential stages of
ventilation and DIC composition (e.g., Simstich et al., 2002) and (2) in view of the
EDX estimates on strongly leached Nps remnants (Table 1b).
We use the following mass balance equation:
δ13CT = P δ13CP + S δ13CS (1)
where δ13CT is the δ13C value of the total Nps test; P is the percentage of the primary
Nps test (supposedly amounting to 80 - 90%) with an isotopic composition δ13CP, and
S is the percentage of the authigenic component (20 - 10%) with an isotopic
composition δ13CS, and P + S = 1. Moreover, to constrain our mass balance estimates
also the following numbers need to be considered: Provided 60% of the total tests
with initial δ13CT1 values of either –3.2‰ or –4.2‰ were dissolved (Fig. 5B) and the
post-leaching δ13CT3 of the remaining 40% is ~ –5.7‰, we calculate the isotopic
composition of the dissolved test portions as δ13Cleached = ~ –1.7 or –3.2‰,
respectively.
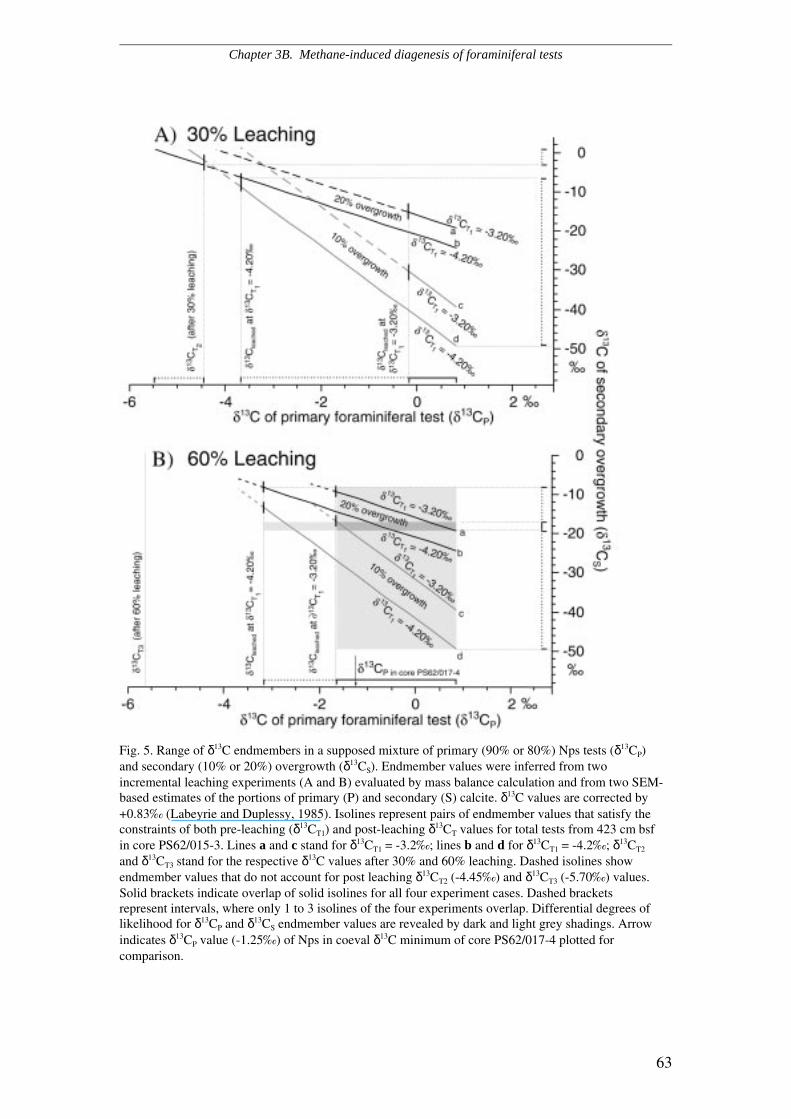
Chapter 3B. Methane-induced diagenesis of foraminiferal tests
63
Fig. 5. Range of δ13C endmembers in a supposed mixture of primary (90% or 80%) Nps tests (δ13CP)and secondary (10% or 20%) overgrowth (δ13CS). Endmember values were inferred from twoincremental leaching experiments (A and B) evaluated by mass balance calculation and from two SEM-based estimates of the portions of primary (P) and secondary (S) calcite. δ13C values are corrected by+0.83‰ (Labeyrie and Duplessy, 1985). Isolines represent pairs of endmember values that satisfy theconstraints of both pre-leaching (δ13CT1) and post-leaching δ13CT values for total tests from 423 cm bsfin core PS62/015-3. Lines a and c stand for δ13CT1 = -3.2‰; lines b and d for δ13CT1 = -4.2‰; δ13CT2
and δ13CT3 stand for the respective δ13C values after 30% and 60% leaching. Dashed isolines showendmember values that do not account for post leaching δ13CT2 (-4.45‰) and δ13CT3 (-5.70‰) values.Solid brackets indicate overlap of solid isolines for all four experiment cases. Dashed bracketsrepresent intervals, where only 1 to 3 isolines of the four experiments overlap. Differential degrees oflikelihood for δ13CP and δ13CS endmember values are revealed by dark and light grey shadings. Arrowindicates δ13CP value (-1.25‰) of Nps in coeval δ13C minimum of core PS62/017-4 plotted forcomparison.
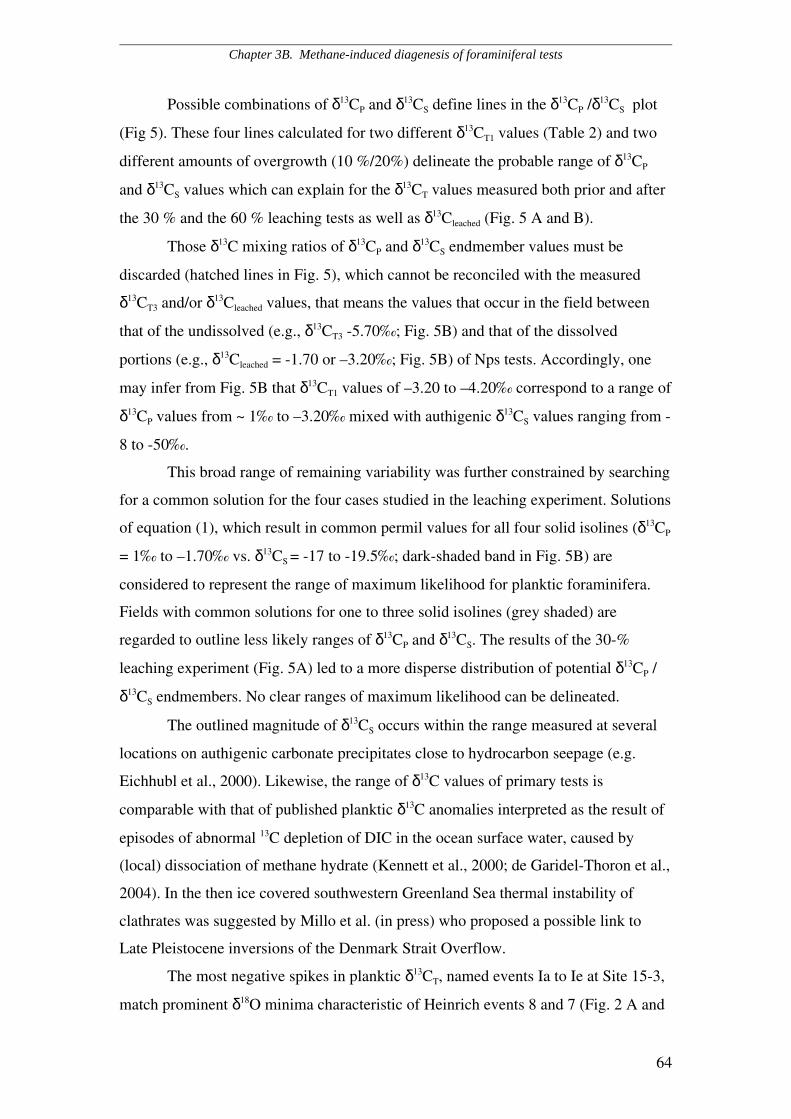
Chapter 3B. Methane-induced diagenesis of foraminiferal tests
64
Possible combinations of δ13CP and δ13CS define lines in the δ13CP /δ13CS plot
(Fig 5). These four lines calculated for two different δ13CT1 values (Table 2) and two
different amounts of overgrowth (10 %/20%) delineate the probable range of δ13CP
and δ13CS values which can explain for the δ13CT values measured both prior and after
the 30 % and the 60 % leaching tests as well as δ13Cleached (Fig. 5 A and B).
Those δ13C mixing ratios of δ13CP and δ13CS endmember values must be
discarded (hatched lines in Fig. 5), which cannot be reconciled with the measured
δ13CT3 and/or δ13Cleached values, that means the values that occur in the field between
that of the undissolved (e.g., δ13CT3 -5.70‰; Fig. 5B) and that of the dissolved
portions (e.g., δ13Cleached = -1.70 or –3.20‰; Fig. 5B) of Nps tests. Accordingly, one
may infer from Fig. 5B that δ13CT1 values of –3.20 to –4.20‰ correspond to a range of
δ13CP values from ~ 1‰ to –3.20‰ mixed with authigenic δ13CS values ranging from -
8 to -50‰.
This broad range of remaining variability was further constrained by searching
for a common solution for the four cases studied in the leaching experiment. Solutions
of equation (1), which result in common permil values for all four solid isolines (δ13CP
= 1‰ to –1.70‰ vs. δ13CS = -17 to -19.5‰; dark-shaded band in Fig. 5B) are
considered to represent the range of maximum likelihood for planktic foraminifera.
Fields with common solutions for one to three solid isolines (grey shaded) are
regarded to outline less likely ranges of δ13CP and δ13CS. The results of the 30-%
leaching experiment (Fig. 5A) led to a more disperse distribution of potential δ13CP /
δ13CS endmembers. No clear ranges of maximum likelihood can be delineated.
The outlined magnitude of δ13CS occurs within the range measured at several
locations on authigenic carbonate precipitates close to hydrocarbon seepage (e.g.
Eichhubl et al., 2000). Likewise, the range of δ13C values of primary tests is
comparable with that of published planktic δ13C anomalies interpreted as the result of
episodes of abnormal 13C depletion of DIC in the ocean surface water, caused by
(local) dissociation of methane hydrate (Kennett et al., 2000; de Garidel-Thoron et al.,
2004). In the then ice covered southwestern Greenland Sea thermal instability of
clathrates was suggested by Millo et al. (in press) who proposed a possible link to
Late Pleistocene inversions of the Denmark Strait Overflow.
The most negative spikes in planktic δ13CT, named events Ia to Ie at Site 15-3,
match prominent δ18O minima characteristic of Heinrich events 8 and 7 (Fig. 2 A and
Chapter 3B. Methane-induced diagenesis of foraminiferal tests
65
B). Different from the δ13C minima, these δ18O minima which document major
meltwater pulses (Millo et al., in press), do not vary neither with the presence or
absence of authigenic overgrowth nor with the intensity of shell leaching (Table 1).
According to Millo et al. (in press) high concentrations of methane can be
assumed for short time intervals in the sedimentary microenvironment of the East
Greenland continental margin, concentrations that may have promoted the coeval
precipitation of 13C depleted authigenic carbonate in epibenthic, endobenthic, and
planktic foraminiferal tests at Site 15-3. This conclusion is supported by increasing
percentages of altered Nps tests with decreasing values of δ13CT within narrow
stratigraphic horizons, with a special increase of altered tests from –0.80‰ to –1.70‰
(Fig. 6). This trend is in harmony with the pattern in Fig. 5B, where δ13CP values of
less than –1.70‰ were found to be less likely. For comparison, coeval methane
affected δ13CT minima at neighbor Site 17-4 which lies distant from the Greenland
margin on the floor of the Blosseville Basin (Fig. 1) are not linked to any features of
secondary overgrowth and do not drop below –1.25‰. This value may thus come
close to the approximate ultimate limit of 13C depletion in near-surface water DIC of
the then ice covered Greenland Sea.
Fig. 6. Percentages of diagenetically altered Nps tests versus δ13CT values corrected for +0.83‰(Labeyrie and Duplessy, 1985). Each δ13CT value averages the composition of 5 to 25 tests. Thepercentage of altered tests increases significantly below δ13CT = –1.70‰.
Chapter 3B. Methane-induced diagenesis of foraminiferal tests
66
Examples of post-depositional 13C depletion analogous to the postulated vents
at Site 15-3 were observed in benthic foraminifera obtained from the active methane
vent regions near the entrance on the Sea of Okhotsk (Lembke et al., pers. comm.). In
our study area, alternative sources for isotopically light carbon in pore fluids such as
the oxidation of organic matter can be dismissed since the organic carbon content in
Late Pleistocene sediments along the East Greenland margin is extremely low
(Schlueter at al., 2001; Nam et al., 1995).
We interpret the origin of the outlined short-lasting depletion of primary and
authigenic δ13C values in both planktic and benthic foraminiferal tests as quasi-coeval
within narrowly constrained stratigraphic horizons, because also the pure primary
shells associated with altered shells already show an aberrant signal of 13C depletion
(e.g., in sample 538 cm bsf, Fig. 2C, also Fig. 6). Accordingly, an increasing degree
of early diagenesis of foraminiferal tests may possibly serve as indicator for the
vicinity of core locations to sites of transient past clathrate destabilization, sites that
today do not show the slightest release of methane.
3B.5 Conclusions
• Aerobic oxidation of methane in free ocean water necessarily caused a distinct
δ13C shift of DIC in sea water ambient to the primary calcification of
foraminifera obtained from well confined stratigraphic horizons in core 15-3
from the East Greenland continental slope (Millo et al., in press). On top of
this shift, pore water methane led to a supersaturation of 13C depleted
bicarbonate and the precipitation of 13C depleted secondary carbonate on and
in foraminiferal tests.
• Visual SEM-based estimates for 13C depleted foraminiferal tests led to the
working hypothesis that these shells consist of a mixture of primary calcite
and authigenic carbonate overgrowth with relative proportions of 80-90 versus
10-20%.
• EDX-based analyses that focused on the element composition of both primary
and authigenic shell portions show that the authigenic fraction is enriched in
silica, iron, and manganese. After leaching 60% of two planktic foraminiferal
samples, both the primary and secondary portions in shell remnants of two
Chapter 3B. Methane-induced diagenesis of foraminiferal tests
67
randomly selected Nps specimens consist of non–carbonate elements that
amount to 60 to 95%, thus suggesting a major replacement of CaCO3.
• Both leaching experiments (dissolving 30 and 60 % of the original shell mass,
respectively) and census counts of pristine vs. overgrowth-affected
foraminiferal tests helped to constrain more closely the carbon isotope
composition of primary and authigenic portions of foraminifera. The results
suggest that planktic foraminiferal tests from methane-induced 13C depleted
horizons integrate a primary δ13C signature most likely ranging from 1 to
–1.70‰ and a diagenetic δ13C signal around –17 to –19.5‰.
• If our conclusions are correct, in particular, if the finding is correct that the
secondary overgrowth formed only shortly after the deposition of the already13C depleted primary tests, the increase in overgrowth of light authigenic
carbonate on top of primary 12C enriched foraminiferal tests may serve as
tracer to constrain former sites of clathrate destabilization.
Acknowledgments
We are grateful to J.P. Kennett (S. Barbara CA), L. Lembke, T. Hill, M. Weinelt, and
an anonymous reviewer for valuable comments and advice. We acknowledge U.
Schuldt and various students for assisting with SEM exposures. This study was
supported by the German Science foundation within Research Theme FOR 451.
Chapter 3B. Methane-induced diagenesis of foraminiferal tests
68
References
Cannariato, K.G., Stott, L.D., 2004. Evidence against clathrate-derived methanerelease to Santa Barbara Basin surface waters? Geochemistry Geophysics Geosystems5 (5), doi. 10.1029/2003GC000600.
de Garidel-Thoron, T., Beaufort, L., Bassinot, F., Henry, P., 2004. Evidence for largemethane releases to the atmosphere from deep-sea gas hydrate dissociation during thelast glacial episode. PNAS 101, 9187-9192.
Dickens, G.R., O’Neil, J.R., Rea, D.K., Owen, R.M., 1995. Dissociation of oceanicmethane hydrate as a cause of carbon isotope excursion at the end of the Paleocene.Paleoceanography 10, 965-971.
Eichhubl, P., Greene, H.G., Naehr, T., Maher, N., 2000. Structural control of fluidflow: offshore fluid seepage in the Santa Barbara Basin, California. Journal ofGeochemical Exploration 69-70, 545-549.
Hill, T.M., Kennett, J.P., Spero, H.J., 2004. High-resolution records of methanehydrate dissociation: ODP Site 893, Santa Barbara Basin. Earth & Planetary ScienceLetters 223, 127-140.
Kennett, J.P., Cannariato, K.G., Hendy, I.L., Behl, R.J., 2000. Carbon isotopicevidence for methane hydrate instability during Quaternary interstadials. Science 288,128-133.
Labeyrie, L.D., Duplessy, J.C., 1985. Changes in the oceanic 13C/12C ratio during thelast 140 000 years: High–latitude surface water records. Palaeogeography,Palaeoclimatology, Palaeoecology 50, 217-240.
Millo, C., Sarnthein, M., Erlenkeuser, H., Frederichs, T., 2005. Methane-driven LatePleistocene δ13C minima and overflow reversals in the S.W. Greenland Sea. Geology33, 4 pp. (in press).
Nam, S-I., Stein, R., Grobe, H., Hubberten, H., 1995. Late Quaternary glacial-interglacial changes in sediment composition at the East Greenland continentalmargin and their paleoceanographic implications. Marine Geology 122, 243-262.
Rathburn, A.E., Perez, E.M., Martin, J.B, Day, S.A., Mahn, C., Gieskes, J., Ziebis,W., Williams, D., Bahls, A., 2003. Relationships between the distribution and stableisotopic composition of living benthic foraminifera and cold methane seepbiogeochemistry in Monterey Bay, California. Geochemistry Geophysics Geosystems4, p. 28.
Schlueter, M., Sauter, E.J., Schulz-Bull, D., Balzer, W., Suess, E., 2001. Fluxes oforganic carbon and biogenic silica reaching the seafloor: A comparison of highnorthern and southern latitudes of the Atlantic Ocean. In: Schaefer, P. et al., (Eds.),The Northern North Atlantic: A changing environment. Springer, Berlin, pp. 225-240.
Chapter 3B. Methane-induced diagenesis of foraminiferal tests
69
Simstich, J., Sarnthein, M., Erlenkeuser, H., 2002. Paired δ18O signals of N.pachyderma (s) and T. quinqueloba show thermal stratification structure in NordicSeas. Marine Micropaleontology 912, 1-19.
Torres, M.E., Mix, A.C., Kinports, K., Haley, B., Klinkhammer, G.P., McManus, J.,de Angelis, M.A., 2003. Is methane venting at the seafloor recorded by δ13C ofbenthic foraminifera shells? Paleoceanography 18 (3) 1062, doi:10.1029/2002PA000824.
Wefer, G., Heinze, P.M., Berger, W.H., 1994. Clues to ancient methane release.Nature 369, p. 282.
70
General Acknowledgments
I wish to thank Prof. Michael Sarnthein for the continuous supervision of my studyand for his scientific input and advice.
I am thankful to Dr. Mara Weinelt, who kindly supported me with her expertise inmicropaleontology and for her patient explanations, especially with regard toreconstructions of ocean water density.
I owe my gratitude to Prof. Pieter M. Grootes for his important contribution to thisstudy and for numerous discussions and valuable suggestions. I also thank a lot histeam for the quality of AMS- 14C datings.
A special thank to Prof. James Kennett for his fundamental scientific support, inparticular with regard to the interpretation of extreme primary and post-depositionalforaminiferal 13C-depletions.
I am particularly thankful to Dr. Helmut Erlenkeuser, who took care of severalhundred stable-isotope analyses, for his scientific advice and for long, interestingdiscussions about physical processes involving stable isotopes and sample preparationprocedures.
I thank Dr. Nils Andersen for carrying out leaching experiments on foraminiferal testsand for most fruitful exchange of ideas.
I am greatly indebted to Karin Kissling, Claudia Sieler, Dörte Gudehus, NadineGehre, and Wolfgang Reimers for their kindness and technical assistance. I also thankUte Schuldt and his team for SEM exposures.
I wish to express my sincere and profound gratitude to several students, who took careof preparation of several hundred samples with accuracy and punctuality. They arePina Springer, Diana Magens, Dorothee Petereit, Antje Klug, Rena Isemer, andMarina Remetin.