Variability of organophosphorus insecticide residues in large size crops grown in commercial farms...
11
Food Additives and Contaminants, February 2006; 23(2): 148–158 Variability of organophosphorus insecticide residues in large size crops grown in commercial farms in Brazil ELOISA CALDAS 1 , ANDREIA JARDIM 2 , ARPAD AMBRUS 3 , & LUIZ CESAR SOUZA 4 1 College of Health Sciences, 2 Chemistry Institute, University of Brası´lia, 70919-970, Brası´lia, DF, Brazil, 3 Central Service for Plant Protection and Soil Conservation, H-1118, Budapest, Hungary, and 4 Central Laboratory of Public Health of Federal District, 70830-010, Brasilia, DF, Brazil (Received 12 September 2005; accepted 17 November 2005) Abstract Field trials were conducted in commercial agricultural areas in Brazil to determine the variability of residues of parathion methyl, diazinon and methidathion in individual units of large crops treated twice with a mixture of the three pesticides. Over 120 random samples were collected, extracted with ethyl acetate and residues determined by GC/FPD. The recoveries and their coefficient of variation were, in general, within the acceptable levels during sample analyses. Residues in papaya and mango were not affected by the position of the fruits in the plant, apparently more or less exposed to the pesticides. Variability factor , defined as the 97.5th percentile divided by the mean of residues in all samples taken from a field ranged from 2.0–2.6. The variability of residues within the plant contributed to about 34–61% of the field variability. The results found in this study support the variability factor of 3 adopted by the FAO/WHO for the deterministic estimation of dietary acute intake of pesticides. Keywords: Organophosphorus, variability factor, pesticides, food Introduction The significance of the dietary acute exposure to pesticide was recognized in the beginning of the 1990s after reports of poisonings from consumption of contaminated food resulting from misuse of pesticides (Goldman et al. 1990; MAFF 1993). Much higher pesticide residues were found in a small proportion of individual units of crops treated according to good agricultural practices than what would be expected based on the residues detected in composite samples (Ambrus 1979; Andersson 2000; Carter et al. 2000; Harris 2000). These findings draw attention to the potential risk of exposure of con- sumers to pesticides when eating such food. Particularly, the organophosphorus and carbamate pesticides are of concern, due to their anticholin- esterase activity in the nervous system, with potential to alter neurological development and cause subtle and long-lasting neurobehavioral impairments in infants and children (Ahlbom et al. 1995; Marrs 2000). A procedure to calculate the acute dietary intake for pesticide residues was proposed in 1997 by a Joint FAO/WHO Consultation (WHO 1997). In this methodology, for crops of unit weight higher than 25 g, the residue concentration to be used in the exposure estimation is calculated by multiplying the residue found in a composite sample by a ‘variability factor’ to take into account the different concentra- tions of residues in individual units of a composite sample. During the Consultation, the variability factor was defined as ‘‘the ratio of a highest level of residues in the individual commodity unit to the corresponding residue level seen in the composite sample’’. The definition was later refined by an international conference sponsored by the UK in 1999 to represent ‘‘the 97.5th percentile of the residues present in crop units divided by the mean of the residue population of the sampled lot’’ (Harris et al. 2000). Due to the lack of extensive residue data to reflect the variability factor at the time of the Consultation, Correspondence: Prof. Eloisa Caldas. E-mail: [email protected] ISSN 0265–203X print/ISSN 1464–5122 online ß 2006 Taylor & Francis DOI: 10.1080/02652030500479708
-
Upload
independent -
Category
Documents
-
view
1 -
download
0
Transcript of Variability of organophosphorus insecticide residues in large size crops grown in commercial farms...
Food Additives and Contaminants, February 2006; 23(2): 148–158
Variability of organophosphorus insecticide residues in large size cropsgrown in commercial farms in Brazil
ELOISA CALDAS1, ANDREIA JARDIM2, ARPAD AMBRUS3, & LUIZ CESAR SOUZA4
1College of Health Sciences, 2Chemistry Institute, University of Brası lia, 70919-970, Brası lia, DF, Brazil, 3Central
Service for Plant Protection and Soil Conservation, H-1118, Budapest, Hungary, and 4Central Laboratory of
Public Health of Federal District, 70830-010, Brasilia, DF, Brazil
(Received 12 September 2005; accepted 17 November 2005)
AbstractField trials were conducted in commercial agricultural areas in Brazil to determine the variability of residues of parathionmethyl, diazinon and methidathion in individual units of large crops treated twice with a mixture of the three pesticides. Over120 random samples were collected, extracted with ethyl acetate and residues determined by GC/FPD. The recoveries andtheir coefficient of variation were, in general, within the acceptable levels during sample analyses. Residues in papayaand mango were not affected by the position of the fruits in the plant, apparently more or less exposed to the pesticides.Variability factor �, defined as the 97.5th percentile divided by the mean of residues in all samples taken from a field rangedfrom 2.0–2.6. The variability of residues within the plant contributed to about 34–61% of the field variability. The resultsfound in this study support the variability factor of 3 adopted by the FAO/WHO for the deterministic estimation of dietaryacute intake of pesticides.
Keywords: Organophosphorus, variability factor, pesticides, food
Introduction
The significance of the dietary acute exposure to
pesticide was recognized in the beginning of the
1990s after reports of poisonings from consumption
of contaminated food resulting from misuse of
pesticides (Goldman et al. 1990; MAFF 1993).
Much higher pesticide residues were found in a small
proportion of individual units of crops treated
according to good agricultural practices than what
would be expected based on the residues detected in
composite samples (Ambrus 1979; Andersson 2000;
Carter et al. 2000; Harris 2000). These findings draw
attention to the potential risk of exposure of con-
sumers to pesticides when eating such food.
Particularly, the organophosphorus and carbamate
pesticides are of concern, due to their anticholin-
esterase activity in the nervous system, with potential
to alter neurological development and cause
subtle and long-lasting neurobehavioral impairments
in infants and children (Ahlbom et al. 1995;
Marrs 2000).
A procedure to calculate the acute dietary intake
for pesticide residues was proposed in 1997 by a
Joint FAO/WHO Consultation (WHO 1997). In this
methodology, for crops of unit weight higher than
25 g, the residue concentration to be used in the
exposure estimation is calculated by multiplying the
residue found in a composite sample by a ‘variability
factor’ to take into account the different concentra-
tions of residues in individual units of a composite
sample. During the Consultation, the variability
factor was defined as ‘‘the ratio of a highest level
of residues in the individual commodity unit to the
corresponding residue level seen in the composite
sample’’. The definition was later refined by an
international conference sponsored by the UK in
1999 to represent ‘‘the 97.5th percentile of the
residues present in crop units divided by the mean of
the residue population of the sampled lot’’ (Harris
et al. 2000).
Due to the lack of extensive residue data to reflect
the variability factor at the time of the Consultation,
Correspondence: Prof. Eloisa Caldas. E-mail: [email protected]
ISSN 0265–203X print/ISSN 1464–5122 online � 2006 Taylor & Francis
DOI: 10.1080/02652030500479708

default values of 5 and 10 were recommended,
assuming the worst case that all residues were present
in one fruit of the composite sample containing 5
or 10 crop units. These were based on the Codex
sampling protocol, which specifies that for crops with
units >250 g a composite sample should contain
at least 5 units, and for crops with unit weight
between 25 and 250 g, a minimum of 10 units should
be taken (Codex 1988).
Since the Consultation, many studies have been
conducted to determine the variability of residues
in various commodity pesticides combinations.
Hamilton et al. (2004) summarized many of these
studies, and found that the majority of the variability
factors fall into the 2.0–3.0 range. In general,
variability factors were found not be influenced by
the physicochemical characteristics of the pesticides,
crop unit size, environmental conditions and mode
of application. The authors recommended that a
variability factor of 3 should replace the default
values established earlier. In 2003 the FAO/WHO
Joint Meeting on Pesticide Residues ( JMPR) agreed
that a variability factor of 3 would be suitable to be
used in the acute intake estimations at international
level (FAO 2004).
The vast majority of the available unit crop residue
data, however, were obtained with medium size
crops, and data on large crops (>250 g unit weight)
are missing. Furthermore, questions still persists
on whether the sole variability factor of 3 would be
appropriate to assess the acute exposure of con-
sumers to pesticide residues and to guarantee the
protection of consumers.
This paper describes the findings of four field
studies conducted in Brazilian commercial farms,
designed to determine the variability of organo-
phosphorus residues in individual units of large
size crops grown according to normal commercial
farming practice under tropical conditions.
Material and methods
Field studies and sampling
Two field trials were conducted with two varieties of
papaya (Carica papaya L.), named papaya formosa
and papaya havai, in the state of Bahia, in the
northeast region of Brazil (Lat: 11�560–14�050 S;
Long: 45�430–46�220 W). The plantations were
pivots of 516–614m of diameter with rows, on
average, 1.6–1.8m apart, and the plants 1.5m apart
within the row. The studies in mango (Mangifera
indica) and summer squash (Cucurbita pepomelo
pepo) were conducted in the Federal District area,
in the central region of the country (Lat: 15�300–
16�030 S; Long: 47�250–48� 120 W). Mango trees
(about 5m high with canopy of 3–4m diameter) were
planted at 7� 5m square. The summer squash
plants were 1� 0.5m apart. During the experiments,
minimum and maximum temperatures ranged
from 12–17�C and 29–30�C, respectively. Rainfall
was <10mm. The pesticides, purchased in the local
market, were mixed in the tank and applied to the
plants by farm employees according to normal
commercial practices. The application rates were
the highest authorized in Brazil for the pesticide/crop
at the time of the study. The number of applications,
the application interval and the PHI were chosen
to assure that residues would be at a detectable
concentration in the crop units. For all crops, a
pre-test with 2–3 plants was performed, using the
selected application protocol, to confirm that detect-
able residues in the units would be found in the trial.
Details of the plots and application rates are shown
in Table I.
The study design required a minimum of 120
treated individual crop units from each field, how-
ever additional units were taken to allow for any loss
during transportation and analysis. The units were
taken according to random sampling plans prepared
taking into account the size and arrangement of the
treated area. For papaya and mango, fruits from
different positions within the plants were harvested.
Three positions were distinguished according to the
apparent exposition to spray: Fruits being on the
surface of the canopy (exposed, E); fruits which were
partially covered by leaves, by other fruits or in
the side part of the plant, (partially exposed, ME);
and fruits in the internal part of the plant
(non-exposed, NE).
In the papaya formosa experiment, a sampling area
of 6 rows (258 plants) was selected within the treated
plot (60 rows; 2210 plants). In all the other
experiments, the sampling area was the whole treated
plot, excluding the border area, which contained
1 (squash) to 3 rows. Units were collected at growing
stage of crops ready to be commercialized. Each
individual crop unit was placed directly in a
polyethylene bag, tested for interferences and put in
another bag previously labelled with the sample code.
Information on position of the unit in the plant was
added to the label at the time of sampling. The crop
unit code also identified, along with the row from
which the unit was taken, the number of the plant in
the row and the number of the unit sampled in the
plant. Twenty control crop units were collected from
an untreated area located at appropriate distance
(minimum of 30 rows apart) from the treated plot, in
the same commercial field. Crop units were placed
in paper or plastic boxes, with care to prevent crop
damage, and transported on the same day to the
Central Laboratory of Public Health of the
Federal District (LACEN-DF), in Brasilia, DF, to
be processed and analysed. The approximate
Organophosphorus insecticide residues in Brazilian crops 149

Table I. Information on field experiments where 2 applications were made to the plants.
Time of Field ApplicationApplication rate
Sampling after
Crop the study characteristicsa Treated plot technique Compounds appliedb kg a.i/ hl kg a.i/ha Interval last treatment
Papaya formosa July 2003 3 years
109 ha/516m �
1100 plants/ha
0.2 ha
258 plants
6 rows
2000 l tank truck,
manual spray
Parathion methyl
Diazinon
0.06
0.09
0.6
0.9
7 days 16 h
Papaya havai July 2004 4 years
210 ha/614m �
1000 plants/ha
0.3 ha
559 plants
20 rows
Arbus 2000
20�nozzle
#16 spray
Parathion methyl
Methidathion
0.06
0.04
1.0
0.7
7 days 16 h
Mango February 2004 2 years
12 ha
3480 plants
0.6 ha
148 plants
6 rows
400 l tank truck,
manual spray
Parathion methyl
Methidathion
0.075
0.05
1.2
0.8
3 days 18 h
Summer squash September 2004 40 days
3 ha
6000 plants
0.02 ha
310 plants
12 rows
20 l costal,
manual spray
Parathion methyl
Methidathion
0.06
0.04
0.6
0.4
1 day 2 h
aAge of the plants, area (hectare, ha), diameter � (papaya) and number of plants; bEC formulation; containing 600 g active ingredient (a.i.)/l for parathion methyl and diazinon and 400 g/lof methidathion.
150
E.Caldasetal.

transportation time from the field to the Laboratory
ranged from 30min for mango and summer squash
to 6 h for papaya formosa.
Sample processing and extraction
The weight of each individual crop unit was
recorded. The papaya formosa fruits were sliced
longitudinally (corresponding to the vertical position
on the trees) and two opposite sides were taken for
processing (the other two sides were discarded);
mango fruits were de-stoned before homogenization,
and the weights of the stones were recorded.
Residues in mango were expressed as mg residue/kg
whole fruit. The whole unit of the other crops were
processed and analysed. Units were cut in small
peaces (�2 cm2), mixed and portions placed in a
blender to be homogenized (1–2mm particles size).
This procedure was performed in 2–3 steps, as the
size of the blenders did not allow processing the
whole unit. All processed portions were transferred
to the original polyethylene bag and thoroughly
mixed until reaching homogeneity. The processing
and extraction procedures started on the same day
when the samples arrived in the laboratory, and
lasted for a maximum of 4 days. Units were kept
at 4�C until processed and at �20�C between
processing and extraction.
Portions (15� 2 g) of all homogenized units were
extracted with 40ml ethyl acetate (pesticide residue
grade) in the presence of 30 g of anhydrous sodium
sulphate in an ultra sonicator (Elma, GER) for
15min. 5ml of the extracts were evaporated under
nitrogen at 40�C, dissolved with ethyl acetate and
analysed by gas chromatography with a flame
photometric detector (GC/FPD). The dried extracts
were kept at �20�C until analysed, within 15 days
after extraction.
Gas chromatographic analysis
The unit extracts were analysed using either a
GC HP 6890 with a HP 7683 auto sampler or a
GC Finnigan-9001 with an AS-2000 auto sampler.
For each study, a new OV 5% phenyl methyl
syloxane column (15.0m, 250 mm diam., film thick-
ness 0.25 mm) was used. Temperature program was:
70�C/1min, 30�C/min up to 250�C, hold for 1min.
Hydrogen was used as carrier gas and nitrogen
as make-up gas. Total run time was 8min and 1 mlof the extracts was injected. Certified analytical
standards of parathion methyl and fenthion were
donated by Bayer Crop Sciences, methidathion and
diazinon by Syngenta Analytical Development &
Product Chemistry, and dimethoate by Cheminova.
Working solutions were prepared in ethyl acetate
after sequential dilution of primary stock solutions
of 100 mg/ml.
Testing the performance of the method
The recovery of the residues was tested prior to the
field trials for each crop/pesticide combination at
levels of 0.00mg/kg (n¼ 4), 0.01mg/kg (n¼ 5);
0.1mg/kg (n¼ 4) and 1.0mg/kg (n¼ 4). The
analyte concentration was determined with
weighted linear regression calibration carried out
with matrix-matched solutions of calibration stan-
dards at 50, 200, 500 and 1500 pg/ml levels,
prepared on the day of the analysis. The calibration
standards were injected in two replicates alternately
with the unit extracts. In all cases, the untreated
control units (0.00mg/kg) gave no detectable
residues. The stability of the chromatographic
system was tested by analysing a mixture of 2
organophosphorous pesticides injected at 100 or
200 pg/ml level (dimethoate and methidathion in the
papaya formosa experiment; diazinon and fenthion
in papaya havai and summer squash; diazinon and
dimethoate in mango) during the injection
sequence. No significant change was seen in the
retention time of the compounds neither in their
peak area and width within one analytical batch.
Each batch consisted of 20–30 unit extracts. The
performance of the method during each batch was
tested by analysing control units fortified at 2 or 3
concentration levels (2 or 3 replicates at each
level). The repeatability of the procedure was
tested by analysing within the same batch 4 or 5
portions of one treated unit of papaya formosa,
papaya havai and summer squash. In addition, a
second portion of each 5 treated mango and
summer squash units were reanalysed in subse-
quent batches.
Results and discussion
The results of method validation conducted before
the trials are presented in Table II. Mean recoveries
were between 74 and 108%, with the exception of
mango at 0.01mg/kg level, where the recovery of
parathion methyl and methidathion (�146%) were
higher than the acceptable recovery for this concen-
tration level (120%) (Codex 2003). These high
recoveries indicated that the determination of the
residues in mango at 0.01mg/kg level could not be
carried out accurately. Coefficients of variation (CV)
in all cases were not significantly different from those
specified by the Codex Alimentarius Commission
(Codex 2003). No significant differences were
found among recoveries at various levels and a
mean recovery for each crop/pesticide was estimated
(Table II). In addition, the CV at the different
concentration levels could also be pooled to
obtain a mean coefficient of variation, CVave,
Organophosphorus insecticide residues in Brazilian crops 151

which indicates a typical reproducibility value for
the method.
The method performance verification during the
analyses of the individual units also did not show
concentration dependency, and the recovery data
from various concentration levels were pooled
for each crop/pesticide combination (Table III).
For papaya formosa, the procedure control was
done in a single batch at 3 concentration levels
(0.01, 0.05 and 0.5mg/kg, 3 replicates samples at
each level). For this crop, low mean recovery of
parathion methyl was found, which indicated some
gross errors, but the source of it could not be
identified. The mean recoveries and their CVs for
the other crops were not significantly different from
the limits specified by the Codex document on
Good Laboratory Practice. As the majority of the
residues were above 0.06 and 0.1mg/kg, where the
performance of the method was acceptable, it was
concluded that the analytical uncertainty did not
have significant effect on the conclusions drawn from
the trials.
The analyses of replicate test portions of the
treated samples within a single batch and in
subsequent batches are also shown in Table III.
The within batch repeatability CVA, calculated from
the residues found in replicate test portions of the
same individual unit sample, were less than 20% in
all cases, with the exception of parathion methyl
in papaya formosa (28.2%), and showed no relation
to the incurred residue levels or type of matrix. The
CVL, calculated for the relative differences between
residues found in 2 subsequent bathes (5 sets of
replicate analysis), of mango and summer squash
ranged from 7.6–18.2%.
As the individual units were stored at 4�C before
extraction (maximum 4 days), we studied the effect
of this storage time on the stability of residues.
From 30–60 units were extracted each day. The
ANOVA test showed that the mean residues found
in mango and papaya units processed and extracted
in different days were not significantly different
(Table IV). In case of summer squash, one unit
analysed on day 2 contained much higher residues
Table III. Method performance during the experiments.
Fortified samples Replicate of treated samples
Crop Pesticide Mean % recovery (CV, %)
Same batch mean residue,
mg/kg (CVA, %) Subsequent batches, CVL, %
Papaya formosa Parathion methyl 58.1 (20.2)a 0.15 (28.2)b –
Diazinon 75.2 (17.6)a 0.09 (14.5)b
Papaya havai Parathion methyl 86.1 (12.5)c 0.05 (16.2)d –
Methidathion 85.7 (14.2)c 0.08 (17.2)d
Mango Parathion methyl 79.2 (13.4)c – 14.3
Methidathion 83.7 (6.2)c 18.2
Summer squash Parathion methyl 82.0 (19.7)c 0.03 (16.6)d 7.6
Methidathion 83.7 (16.5)c 0.09 (18.1)d 13.8
a0.01, 0.05, 0.5mg/kg, 1 single batch, 3 replicates at each level; b4 replicate samples, same batch; c0.01, 0.1mg/kg, 6 batches, 2 or3 replicates at each level at each batch; d5 replicate samples, same batch; CVL¼ reproducibility coefficient of variation calculated fromthe relative differences in residues found in replicate test portions analysed in 5 sets of subsequent batches.
Table II. Mean recoveries (%) and coefficient of variations (CV%) obtained during method validation at 3 fortification levels.
Mean recovery (CV ), %Total mean recovery
Crop Compound 0.01mg/kg, n¼5 0.1mg/kg, n¼ 4 1.0mg/kg, n¼ 4 (CVave)a, %
Papaya formosa Parathion methyl 108 (12.3) 90.2 (9.8) 88.4 (3.9) 100 (8.7)
Diazinon 99.5 (16.2) 90.9 (13.9) 86.2 (5.4) 92.2 (11.8)
Papaya havai Parathion methyl 85.2 (8.0) 88.7 (5.5) 82,3 (5.3) 85.4 (6.2)
Methidathion 88.5 (9.8) 86.7 (7.4) 80.5 (7.1) 85.2 (8.1)
Mango Parathion methyl 147 (12.9) 88.3 (23.9) 105 (24.6) 113 (20.3)
Methidathion 145 (8.6) 91.4 (12.6) 99.8 (18.6) 112 (13.3)
Summer squash Parathion methyl 79.5 (8.1) 86.8 (3.9) 89.5 (3.6) 85.3 (5.2)
Methidathion 74.8 (12.2) 82.4 (4.9) 89.5 (1.8) 82.2 (6.3)
aTotal mean recovery: average of all recovery data obtained at 3 spike level; CVave: average coefficient of variation at all fortification levels;n is the number of fortified samples at each level.
152 E. Caldas et al.

than the rest of the units (0.30mg/kg and 0.66mg/kg
of parathion methyl and methidathion, respectively),
which increased the mean residue of units analysed
on that day. This led to a significant difference
between the mean residues found on units analysed
on days 2 and 4. This difference was of 30% for
parathion methyl and 18% for methidathion, which
is within the acceptability criteria for storage stability
(30%) set by the FAO/WHO JMPR (FAO 2000).
These results show that there is no correlation
between extraction time and residue level, and that
the storage at 4�C did not affect the validity of the
results. The tendencies of residue levels in mango
and summer squash units extracted after each other
are shown in Figure 1. This figure also indicates that
the residues of both pesticides varied in the same
direction, confirming that the random variation of
the GC analysis did not affect significantly the results
either.
Table V shows the crop unit weights, the level of
residues found in the crops and the variability of the
residues. In all experiments, residues in control units
(10 or 20 units were analysed) were <LOQ. The crop
mean unit weights ranged from 446–1491 g, which
characterize the crops as large size (Codex 1988). As
the residues in the treated crops did not resemble any
parametric distribution, non-parametric method was
used to calculate the required number of individual
crop units (sample size) which should taken from a
field for analysis. Taking into consideration of the
basic requirements for estimating the variability
factor (97.5th percentile of the sampled population
at 95% confidence level), a minimum of 119 units
had to be taken randomly to obtain at least one value
above the 97.5th percentile (P97.5) with 95%
probability. In the present study, 128 treated
units of papaya havai and summer squash and
139 units of mango were analysed, which enabled
the estimation of the P97.5 with >95% confidence.
In the papaya formosa trial, due to technical
problems detected afterwards, the second application
was not performed in half of the treated field. For this
trial, only the 66 fruits were collected from the area
which received the two applications. That enabled
the estimation of the P97.5 with 81% confidence.
In some studies, variability of residues in indi-
vidual units have been estimated from very limited
number of data (down to 10 units) (Lentza-Rizos
and Balokas 2001; Lentza-Rizos and Tsioumplekou
2001; Fernandez-Cruz et al. 2004; Boulard et al.
2005). As the probability of finding a crop unit
containing residues at or above the 97.5th percentile
of the residues in the treated crops with small
number of samples is very low (e.g. 50% with
27 samples), the results from these studies should
be interpreted with caution, and should not be used
for estimating the variability factor as defined by the
FAO/WHO.
For all crop/pesticide combinations, more than
90% of the treated units had detected residues
(>0.01mg/kg), and for the calculation of the mean,
residues <LOQ were replaced with � LOQ. Some
authors have also used this approach (Hill and
Reynolds 2002; Earl et al. 2000), while others
assumed the values at <LOQ as zero (Hamilton
et al. 2004). Ambrus (2000) has tested the effect
of non-detectable residues and their LOQ on the
calculation of the variability factor. The author found
that the effect of replacing the LOQ with its half
value on the mean and variability factor depends
on the ratio of the LOQ and the mean residue.
Generally, where the residues below the LOQ are not
more than 20% of the data points the replacement
can be done without significantly affecting (<10%)
the estimated mean values.
Pesticide residues in treated samples had a
maximum of 0.66mg/kg (methidathion in summer
squash), and the mean residues ranged from
0.05–0.18mg/kg (Table V). The observed variability
of residues was in the range of 49.6% and 73.0%.
Subtracting the analytical errors (Table III) accord-
ing to the error propagation law resulted in true
variability in the range of 46.5–67.3, indicating that
the relatively large analytical errors did not affect
significantly the estimation of the true variability
of residues.
Table IV. Mean residues (mg/kg) found in individual units processed and extracted after up to 4 days of
storage at 4�C.
Day of extraction, after storage at 4�C
Crop Compound 2 3 4 p
Mango Parathion methyl 0.215 0.173 0.216 0.130
Methidathion 0.194 0.166 0.217 0.048
Papaya Parathion methyl 0.053 0.048 0.042 0.081
Methidathion 0.080 0.064 0.068 0.110
Summer squash Parathion methyl 0.089 0.048 0.062 0.001
Methidathion 0.180 0.112 0.147 0.002
Organophosphorus insecticide residues in Brazilian crops 153

The Rmax/mean ranged from 2.1–4.6. Residue levels
at P97.5 estimated from the sampled data set ranged
from 0.10–0.45mg/kg. It should be pointed out,
however, that the residue data used here represents
only a sample taken from the unknown population
of the residues in the treated area. Hamilton et al.
(2004) have emphasized that the P97.5 of residues
in the sample may not be the same as the P97.5
percentile of residues in the sampled commodity,
and recommended a methodology for estimation
of the 97.5th percentile of the residues in the
sampled population (P97.5*). Table V shows for
each crop/pesticide the P97.5* calculated according
to the methodology described by Hamilton et al.
With the exception of parathion methyl in papaya
formosa, where the number of samples was only 66,
and the two values were equal, P97.5* was always
higher than P97.5. This was expected, in view of the
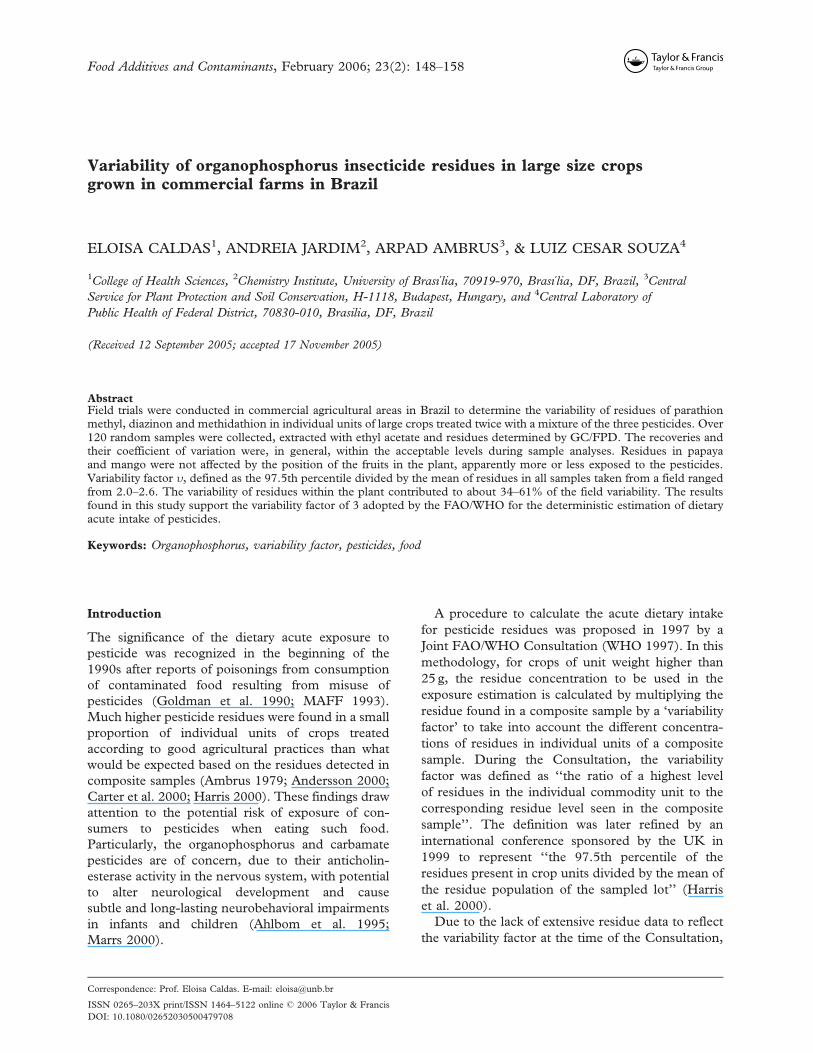
skewed distribution of the residues (see Figure 2).
The variability factors calculated either as the ratio
between P97.5 and the mean (�) or the P97.5*
and the mean (�*) are also shown on Table V.
The values, between 2.0 and 3.1, were within the
same range found in other studies with different
pesticides and medium size crops (Ambrus 2000;
Roberts et al. 2002; Hamilton et al. 2004).
In this study, the units were collected after a
maximum of 12 h after the last application, to
ensure detectable residues. The shortest PHI
for the pesticides in crops used in Brazil was
14 days, furthermore, significantly longer than
the actual sampling interval. Although deposition
concentrations, pesticide metabolism, or residue
dilution by crop growth might affect residue levels
at a certain PHI, previous studies indicated that the
variability of residues was not significantly influenced
by the average residue and the time interval between
0.8
0.7
0.6
0.5
0.4
0.3
0.2
0.1
0.0
−0.1
1 11 21 31 41 51 61 71 81 91 101 111 121
Extraction sequence
11 21 31 41 51 61 71 81 91 101 111 121 131
Extraction sequence
mg
/kg
0.7
0.6
0.5
0.4
0.3
0.2
0.1
0.0
mg
/kg
Parathion MethylMethidathionLinéaire (Methidathion)Linéaire (Parathion Methyl)
Parathion MethylMethidathionLinéaire (Methidathion)Linéaire (Parathion Methyl)
(a)
(b)
Figure 1. Residues of parathion methyl and methidathion on individual units of summer squash [a] and mango [b] processed and extracted
up to 4 days stored at 4�C.
154 E. Caldas et al.

Table V. Residue levels and variability of organophosphorus insecticide residues in the crops.
Crop
Unit weight
mean, g
CV, % Compound
Samples
analysed/>LOQ
Min–max,
mg/kg
Meana,
mg/kg CV, % Rmax/Rmean
P97.5,
mg/kg
P97.5*,
mg/kg
Variability
factor, �
Variability
factor, �*
Papaya formosa 1491.1 P. methyl 6/66 0.01–0.42 0.15 73.0 2.9 0.38 0.38 2.6 2.6
24.1 Diazinon 6/66 0.02–0.31 0.14 53.0 2.1 0.29 0.30 2.0 2.1
Papaya Havai 658.3 P. methyl 128/126 <0.01–0.12 0.05 51.0 2.6 0.10 0.11 2.1 2.4
32.0 Methidathion 128/128 0.01–0.16 0.07 49.6 2.3 0.14 0.15 2.0 2.1
Mango 853.3 P. methyl 139/138 <0.01–0.64 0.18 59.3 3.2 0.45 0.49 2.4 2.7
27.8 Methidathion 139/138 <0.01–0.54 0.18 55.2 2.8 0.38 0.41 2.2 2.3
Summer squash 446.5 P. methyl 128/118 <0.01–0.29 0.06 72.7 4.5 0.17 0.20 2.6 3.1
27.7 Methidathion 128/127 <0.01–0.66 0.14 61.2 4.6 0.32 0.39 2.2 2.7
aResidues <LOQ were considered at � LOQ; P97.5¼ 97.5th percentile in the data set; P97.5*¼ 97.5th percentile in the population from which the data was sampled (Hamilton et al. 2004);Rmax/Rmean¼ ratio between the highest residue in the data set and the mean; �¼ ratio between the P97.5 and the mean; �*¼ ratio between the P97.5* and the mean.
Orga
nophosp
horu
sinsecticid
eresid
ues
inBrazilia
ncrop
s155

0.00
0.05
0.10
0.15
0.20
0.25
0.30
0.35
0.40
0.02 0.04 0.06 0.08 0.1 0.12 0.14 0.16 0.18 0.2 0.22 0.24 0.26
mg/kg
Rela
tive
frequ
ency
Parathion methylMethidathion
0.00
0.02
0.04
0.06
0.08
0.10
0.12
0.14
0.16
0.18
0.20
0.02
0.04
0.06
0.08 0.1 0.12
0.14
0.16
0.18 0.2 0.22
0.24
0.26
0.28 0.3 0.32
0.34
0.36
0.38 0.4 0.42
0.44
0.46
0.48 0.5 0.52
0.54
0.56
0.58 0.6
mg/kg
0.02
0.04
0.06
0.08 0.1 0.12
0.14
0.16
0.18 0.2 0.22
0.24
0.26
0.28 0.3 0.32
0.34
0.36
0.38 0.4 0.42
0.44
0.46
0.48 0.5 0.52
0.54
0.56
0.58 0.6 0.62
0.64
mg/kg
0.02
0.04
0.06
0.08 0.1 0.12
0.14
0.16
0.18 0.2 0.22
0.24
0.26
0.28 0.3 0.32
0.34
0.36
0.38 0.4 0.42
0.44
0.46
0.48
>0.50
mg/kg
Rela
tive
frequ
ency
DiazinonParathion methyl
0.25
0.20
0.15
0.10
0.05
0.00Re
lativ
e fre
quen
cy
Parathion methylMethidathion
(a)(b)
(c) (d)
0.00
0.01
0.02
0.03
0.04
0.05
0.06
0.07
0.08
0.09
0.10
Rela
tive
frequ
ency
Parathion methylMethidathion
Figure 2. Distribution of residues in [a] papaya formosa (n¼ 66); [b] papaya havai (n¼ 128); [c] mango (n¼ 139) and [d] summer squash (n¼ 128).
156
E.Caldasetal.

last application and sampling (Ambrus 2000; Harris
et al. 2000; Kaethner 2001).
The distributions of residue levels in the treated
crops shown in Figure 2 were positively skewed, with
the asymmetric tail extending towards large values.
The coefficient of variation (CV) of the residues
ranged from 49–73%, with the highest variation for
parathion methyl in papaya formosa and summer
squash (Table V). The same kind of distribution and
CV has been observed by other authors for describ-
ing residue levels in many crops (Ambrus 2000;
Hill 2000).
Table VI shows the distribution of residues in
papaya and mango collected from different parts of
the plants, being apparently more or less exposed
to the pesticide spray, depending on the degree of
coverage of fruits by leaves or other fruits. Due to
the large overall variation of residues (Table V),
no significant difference could be observed in the
residues in fruits being in different the positions
within the plants. In Hungary, no significant
difference was found between the average residue
levels of the chlorpyrifos methyl in fruits collected
from different positions in the apple tree (n¼ 320),
although apparently higher residues were found in
the apples collected from the bottom and middle
third of the tree compared with residues in the top
(Ambrus 2000). Similar distribution was reported
from Switzerland (n¼ 126) (Dieterle RM et al.
personal communication in Hamilton et al. 2004).
For papaya havai, mango and summer squash, the
variability of the residues within the plants were also
estimated (Table VI). The ratio Rmax/Rmean ranged
from 1.2–2.0 (n¼ 3–10). The contribution of the
within plant variability for the total variability of
residues in these crops, calculated by dividing
the mean Rmax/Rmean for each pesticide/crop
combination shown in Table VI by the Rmax/Rmean
found in the corresponding sample set (Table V),
ranged from 55.7–61% in papaya havai and mango
and from 34.7–37.8% in summer squash.
This study presents for the first time residue data
in large tropical fruits treated according to commer-
cial agriculture practice. Thus it fills the gap in the
database required for estimating acute intake to
pesticides. The results support the variability factor
of 3 currently used by the FAO/WHO JMPR in
the deterministic methodology for the estimation
of dietary acute intake at international level. It is
emphasized that the variability factor as it is currently
defined is only applicable to data set from a single lot.
In case of residue data from market place, where it is
likely that samples from different lots are mixed,
the concept is not applicable.
Acknowledgements
We thank the farm owners for making available
the area, the equipments and the personnel for the
conduction of the field studies. We also thank the
technicians of the Central Laboratory of Public
Health of Federal District (LACEN-DF) for helping
with the sample processing procedures. This work
was supported by the International Atomic Energy
Agency (PFL-AGRO 200341239, 200441048 and
200441480) and by the Brazilian Research Agency
FAP-DF (No. 193.000.391/99).
References
Ahlbom J, Fredriksson A, Eriksson P. 1995. Exposure to an
organophosphate (DFP) during a defined period in neonatal life
induces permanent changes in brain muscarinic receptors and
behavior in adult mice. Brain Research 677:13–19.
Ambrus A. 1979. The influence of sampling methods and other
field techniques on the results of residue analysis. In: Frehse H,
Geissbuhler H, editors. Pesticide residues. Oxford: Pergamon
Press. pp 6–18.
Table VI. Residues in units according to position in the plant and variability of residues within a single plant.
Crop Compound Exposed Partly exposed Non-exposed Rmax/Rmeanb
Papaya/formosa N 35 – 31
Parathion methyla 0.15� 0.10 – 0.14� 0.10 –
Diazinona 0.14� 0.07 – 0.15� 0.08 –
Papaya/havai N 66 24 38
Parathion methyla 0.05� 0.02 0.04� 0.02 0.04� 0.02 1.3/1.6 (n¼ 5/4)
Methidathiona 0.08� 0.03 0.06� 0.03 0.06� 0.03 1.2/1.4 (n¼ 5/4)
Mango N 54 49 36
Parathion methyla 0.21� 0.11 0.20� 0.12 0.19� 0.13 1.8 (n¼ 10)
Methidathiona 0.22� 0.10 0.20� 0.11 0.17� 0.11 1.7 (n¼ 10)
Summer squash Parathion methyl – – – 1.8/1.3/2.0 (n¼ 3)
Methidathion – – – 1.2/1.7/1.8 (n¼ 3)
N is the total number of individual units taken from each position of all sampled plants; amean of residues� standard deviation, in mg/kg;beach entry corresponds to the data from one plant; (n) is the number of individual units analysed from a single plant.
Organophosphorus insecticide residues in Brazilian crops 157

Ambrus A. 2000. Within and between field variability of residue
data and sampling implications. Food Additives and
Contaminants 17:519–537.
Andersson A. 2000. Comparison of pesticide residues in
composite samples and in individual units: The Swedish
approach to sampling. Food Additives and Contaminants
17:547–550.
Boulard M, Aguilera A, Camacho F, Soussi M, Valverde A.
2005. Effect of household processing and unit-to-unit
variability of pyrifenox, pyridaben, and tralomethrin residues
in tomatoes. Journal of Agricultural and Food Chemistry
53:4054–4058.
Carter AD, Fogg P, Beard GR. 2000. Investigations into the
causes of residue variability on carrots in the UK. Food
Additives and Contaminants 17:503–509.
CODEX 1988. Codex Alimentarius Committee on Pesticide
Residues. Draft revised recommended method of sampling
for the determination of pesticide residues for compliance with
MRLs, Alinorm 99.24, Appendix III, FAO, Rome.
CODEX 2003. Codex Secretariat, Report of the 35th Session
of Codex Committee on Pesticide Residues. Available from:
ftp://ftp.fao.org/codex/alinorm03/Al0324Ae.pdf
Earl M, Kaethner M, Uihlein M. 2000. Unit to unit variation of
pesticide residues-options for acute dietary risk assessment.
Food Additives and Contaminants 17:83–89.
FAO 2002. Submission and evaluation of pesticide residues data
for the estimation of maximum residue levels in food and feed.
FAO Plant Production and Protection Paper, 170.
FAO 2004. Pesticide residues in food. Report of the
Joint Meeting of the FAO Panel of Experts on Pesticide
Residues in Food and the Environment and the WHO Expert
Group on Pesticide Residues. FAO Plant Production
and Protection Paper Food and Agriculture Organization.
Chapter 3. Roma.
Fernandez-Cruz ML, Villarroya M, Llanos S, Alonso-Prados JL,
Garcia-Baudin JM. 2004. Field-incurred fenitrothion residues
in kakis: Comparison of individual fruits, composite samples,
and peeled and cooked fruits. Journal of Agricultural and Food
Chemistry 52:860–863.
Goldman LR, Beller M, Jackson RJ. 1990. Aldicarb food
poisonings in California, 1985–1988: Toxicity estimates for
humans. Archives of Environmental Health 45:141–147.
Hamilton D, Ambrus A, Dieterle R, Felsot A, Harris C,
Petersen B, Racke K, Wong S, Gonzalez R, Tanaka K,
Earl M, Roberts G, Bhula R. 2004. Pesticide residues in
food – acute dietary exposure. Pesticide Management
Science 60:311–339.
Harris CA. 2000. How the variability issue was uncovered: The
history of the UK residue variability findings. Food Additives
and Contaminants 17:491–495.
Harris CA, Mascall JR, Warren SF, Crossley SJ. 2000. Summary
report of the international conference on pesticide residues
variability and acute dietary risk assessment. Food Additives
and Contaminants 17:481–485.
Hill AR. 2000. Residue variability and sampling-practical
problems and consequences for residues monitoring. Food
Additives and Contaminants 17:539–546.
Hill AR, Reynolds SL. 2002. Unit-to-unit variability of pesticide
residues in fruit and vegetables. Food Additives and
Contaminants 19:733–747.
Kaethner M. 2001. Determination of residues variability
in table and wine grapes after a tank-mix application of
anilinopyrimidine, triazole, pyrethroid, organophosphate
and dicarboximide crop protection products, France/Germany
2000 to 2001. Summary Report, European Crop Protection
Association, Residues Expert Group, Belgium. pp 1–36.
Unpublished.
Lentza-Rizos CH, Tsioumplekou M. 2001. Residues of aldicarb
in oranges: A unit-to-unit variability study. Food Additives and
Contaminants 18:86–97.
Lentza-Rizos C, Balokas A. 2001. Residue levels of chlorpropham
in individual tubers and composite samples of postharvest-
treated potatoes. Journal of Agricultural and Food Chemistry
49:710–714.
MAFF 1993. Annual report of the working party on pesticide
residues: 1992, Supplement to The Pesticides Register 1993.
London, UK: HMSO.
Marrs TC. 2000. The health significance of pesticide variability in
individual commodity items. Food Additives and Contaminants
17:487–489.
Roberts GS, Cook CR, McAllister JT, Rose G. 2002. Unit to unit
variability of residues on apples post-harvest treated with
diphenylamine, iprodione and carbendazim, 10th IUPAC
International Congress on the Chemistry of Crop Protection,
Basel, Abstract 6b.10.
WHO 1997. Report of the Joint FAO/WHO Consultation on
Food Consumption and Exposure assessment of chemicals.
Geneva, Switzerland, Document WHO/FSF/FOS/97.5.
158 E. Caldas et al.