Valorisation of forestry waste by pyrolysis in an auger reactor
11
Valorisation of forestry waste by pyrolysis in an auger reactor Neus Puy a,⇑ , Ramón Murillo b , María V. Navarro b , José M. López b , Joan Rieradevall a,c , G. Fowler d , Ignacio Aranguren b , Tomás García b , Jordi Bartrolí e , Ana M. Mastral b a Institute of Environmental Science and Technology (ICTA), Universitat Autònoma de Barcelona, Edifici Cn – Campus de la UAB, 08193 Cerdanyola del Vallès, Barcelona, Spain b Instituto de Carboquímica, CSIC, M Luesma Castan 4, 50018 Zaragoza, Spain c Department of Chemical Engineering, Universitat Autònoma de Barcelona, ETSE, Campus de la UAB, 08193 Cerdanyola del Vallès, Barcelona, Spain d Department of Civil and Environmental Engineering, Imperial College London, South Kensington Campus, London SW7 2AZ, United Kingdom e Department of Chemistry, Universitat Autònoma de Barcelona, Edifici Cn – Campus de la UAB, 08193 Cerdanyola del Vallès, Barcelona, Spain article info Article history: Received 11 August 2010 Accepted 21 January 2011 Available online 17 February 2011 abstract Pyrolysis of forestry waste has been carried out in an auger reactor to study the influence of operational variables on the reactor performance and the properties of the related products. Pine woodchips were used for the first time as raw material and fed continuously into the reactor. Ten experiments were car- ried out under inert atmosphere at: (i) different reaction temperature (1073, 973, 873, 823 and 773 K); (ii) different solid residence time (5, 3, 2 and 1.5 min); and (iii) different biomass flow rate (3.9, 4.8 and 6.9 kg/h). Results show that the greatest yields for liquid production (59%) and optimum product characterisation were obtained at the lowest temperature studied (773 K) and applying solid residence times longer than 2 min. Regarding bio-oil properties, GC/MS qualitative identification show that the most abundant compounds are volatile polar compounds, phenols and benzenediols; and very few differ- ences can be observed among the samples regardless of the pyrolysis operating conditions. On the whole, experimental results demonstrate that complete reaction of forest woodchips can be achieved in an auger reactor in most of the experimental conditions tested. Moreover, this study presents the initial steps for the future scaling up of the auger reactor with the aim of converting it into a mobile plant which will be able to remotely process biomass such as energy crops, forestry and agricultural wastes to obtain bio-oil that, in turn, can be used as energy vector to avoid high transport costs. Ó 2011 Elsevier Ltd. All rights reserved. 1. Introduction Forest residues play an important role in forest management since they are considered a by-product that does not have a wide- spread usage due to its high volume and consequently its high har- vesting and transport costs. Forest biomass represents a good opportunity as renewable energy source (Bridgwater and Peacocke, 2000) that, in turn, can be of great significance in mitigating cli- mate change by reducing carbon dioxide emissions and by a pro- gressive replacement of fossil fuels. However, less attention has been paid to produce energy from forest residues, accumulated from neglected forests that overproduce important amounts of bio- mass per year that has no current use (Puy et al., 2008). Moreover, such increase of forested areas and the lack of forest management results in an increase of fire risk (Tabara et al., 2003), which has been intensified during the last decades. One of the major issues to be addressed when tackling forest residues, which consist mainly of small trees and bushes, is their high transport costs due to its low apparent density. Thus, if forest residues may be used as energy source, it is needed to find a way to reduce this high volume to an energy vector. Besides, logistics and supply chain management are critical areas for the successful energetic use of waste biomass (Iakovou et al., 2010). In such a context, pyrolysis is an alternative to direct combustion of biomass due to the recov- ery of solid and liquid materials, which is beneficial when biomass resources are remote since the liquid can be readily stored and transported (Bridgwater and Peacocke, 2000). The liquid material is a fuel, known as bio-oil, that can be used as an energy vector and has been successfully tested in engines, turbines, and boilers, and has been upgraded to high-quality hydrocarbon fuels, although at a presently unacceptable energetic and financial costs (Czernik and Bridgwater, 2004). Numerous pyrolysis processes have been studied with the aim of obtaining bio-oil for later upgrading and producing improved marketable products (Bridgwater and Peacocke, 2000; Mohan et al., 2006), and under different conditions using different reactors and technologies to maximise liquid production (Mohan et al., 2006). Large-scale commercial processes have been developed dur- ing the past decades, which are mainly based on bubbling and cir- 0956-053X/$ - see front matter Ó 2011 Elsevier Ltd. All rights reserved. doi:10.1016/j.wasman.2011.01.020 ⇑ Corresponding author. Tel.: +34 935813760; fax: +34 935868008. E-mail address: [email protected] (N. Puy). Waste Management 31 (2011) 1339–1349 Contents lists available at ScienceDirect Waste Management journal homepage: www.elsevier.com/locate/wasman
-
Upload
independent -
Category
Documents
-
view
2 -
download
0
Transcript of Valorisation of forestry waste by pyrolysis in an auger reactor

Waste Management 31 (2011) 1339–1349
Contents lists available at ScienceDirect
Waste Management
journal homepage: www.elsevier .com/locate /wasman
Valorisation of forestry waste by pyrolysis in an auger reactor
Neus Puy a,⇑, Ramón Murillo b, María V. Navarro b, José M. López b, Joan Rieradevall a,c, G. Fowler d,Ignacio Aranguren b, Tomás García b, Jordi Bartrolí e, Ana M. Mastral b
a Institute of Environmental Science and Technology (ICTA), Universitat Autònoma de Barcelona, Edifici Cn – Campus de la UAB, 08193 Cerdanyola del Vallès, Barcelona, Spainb Instituto de Carboquímica, CSIC, M Luesma Castan 4, 50018 Zaragoza, Spainc Department of Chemical Engineering, Universitat Autònoma de Barcelona, ETSE, Campus de la UAB, 08193 Cerdanyola del Vallès, Barcelona, Spaind Department of Civil and Environmental Engineering, Imperial College London, South Kensington Campus, London SW7 2AZ, United Kingdome Department of Chemistry, Universitat Autònoma de Barcelona, Edifici Cn – Campus de la UAB, 08193 Cerdanyola del Vallès, Barcelona, Spain
a r t i c l e i n f o a b s t r a c t
Article history:Received 11 August 2010Accepted 21 January 2011Available online 17 February 2011
0956-053X/$ - see front matter � 2011 Elsevier Ltd. Adoi:10.1016/j.wasman.2011.01.020
⇑ Corresponding author. Tel.: +34 935813760; fax:E-mail address: [email protected] (N. Puy).
Pyrolysis of forestry waste has been carried out in an auger reactor to study the influence of operationalvariables on the reactor performance and the properties of the related products. Pine woodchips wereused for the first time as raw material and fed continuously into the reactor. Ten experiments were car-ried out under inert atmosphere at: (i) different reaction temperature (1073, 973, 873, 823 and 773 K);(ii) different solid residence time (5, 3, 2 and 1.5 min); and (iii) different biomass flow rate (3.9, 4.8and 6.9 kg/h). Results show that the greatest yields for liquid production (59%) and optimum productcharacterisation were obtained at the lowest temperature studied (773 K) and applying solid residencetimes longer than 2 min. Regarding bio-oil properties, GC/MS qualitative identification show that themost abundant compounds are volatile polar compounds, phenols and benzenediols; and very few differ-ences can be observed among the samples regardless of the pyrolysis operating conditions. On the whole,experimental results demonstrate that complete reaction of forest woodchips can be achieved in an augerreactor in most of the experimental conditions tested. Moreover, this study presents the initial steps forthe future scaling up of the auger reactor with the aim of converting it into a mobile plant which will beable to remotely process biomass such as energy crops, forestry and agricultural wastes to obtain bio-oilthat, in turn, can be used as energy vector to avoid high transport costs.
� 2011 Elsevier Ltd. All rights reserved.
1. Introduction
Forest residues play an important role in forest managementsince they are considered a by-product that does not have a wide-spread usage due to its high volume and consequently its high har-vesting and transport costs. Forest biomass represents a goodopportunity as renewable energy source (Bridgwater and Peacocke,2000) that, in turn, can be of great significance in mitigating cli-mate change by reducing carbon dioxide emissions and by a pro-gressive replacement of fossil fuels. However, less attention hasbeen paid to produce energy from forest residues, accumulatedfrom neglected forests that overproduce important amounts of bio-mass per year that has no current use (Puy et al., 2008). Moreover,such increase of forested areas and the lack of forest managementresults in an increase of fire risk (Tabara et al., 2003), which hasbeen intensified during the last decades. One of the major issuesto be addressed when tackling forest residues, which consistmainly of small trees and bushes, is their high transport costs
ll rights reserved.
+34 935868008.
due to its low apparent density. Thus, if forest residues may beused as energy source, it is needed to find a way to reduce this highvolume to an energy vector. Besides, logistics and supply chainmanagement are critical areas for the successful energetic use ofwaste biomass (Iakovou et al., 2010). In such a context, pyrolysisis an alternative to direct combustion of biomass due to the recov-ery of solid and liquid materials, which is beneficial when biomassresources are remote since the liquid can be readily stored andtransported (Bridgwater and Peacocke, 2000). The liquid materialis a fuel, known as bio-oil, that can be used as an energy vectorand has been successfully tested in engines, turbines, and boilers,and has been upgraded to high-quality hydrocarbon fuels,although at a presently unacceptable energetic and financial costs(Czernik and Bridgwater, 2004).
Numerous pyrolysis processes have been studied with the aimof obtaining bio-oil for later upgrading and producing improvedmarketable products (Bridgwater and Peacocke, 2000; Mohanet al., 2006), and under different conditions using different reactorsand technologies to maximise liquid production (Mohan et al.,2006). Large-scale commercial processes have been developed dur-ing the past decades, which are mainly based on bubbling and cir-
1340 N. Puy et al. / Waste Management 31 (2011) 1339–1349
culating fluidised bed reactors (Bridgwater et al., 1999; Bridgwaterand Peacocke, 2000).
To process forest biomass that is produced in remote locations,a preliminary assessment demonstrated in 2006 the feasibility ofmodular and transportable bio-oil plants based on auger reactors(Badger and Fransham, 2006). In 2007, Ingram and co-workers sug-gested that portable auger reactors might be used to produce bio-oil at locations in forests (Ingram et al., 2008). At TCBiomass2009,Briens and co-workers presented a mobile pyrolysis system for theconversion of biomass into bio-oil based on a fluidised bed reactor(Briens et al., 2009).
Auger reactors offer numerous advantages such as their com-pact design and the lower process temperature (Mohan et al.,2006). Several auger configurations have been studied in literature(Bhattacharya et al., 2009; Garcia-Perez et al., 2007a; Ingram et al.,2008; Mohan et al., 2006; Thangalazhy-Gopakumar et al., 2010),although the influence of the operating conditions on the productyields and product composition has not yet been addressed whenforest residue woodchips are used. Moreover, these studies pyro-lyse biomass of small particle size (sawdust up to 4 mm) or pellets,which require grinding, sieving and pelletising as pre-treatmentstages that are, in turn, more energy intensive.
Therefore, this study aims to evaluate the process performanceand chemical properties and composition of pyrolysis products ob-tained in an auger reactor using forestry waste woodchips (up to20 mm of nominal size) as feedstock under different operationalparameters: temperature, solid residence time and mass flow rate.The use of this feedstock represents lesser pre-treatment and lessenergy consumption of the overall process. Finally, scaling up is-sues are addressed with a view to the further objective of convert-ing the auger reactor, which has a compact design and operatescontinuously with low maintenance operations, to a mobile plant.
2. Experimental section
2.1. Feedstock
Pine woodchips from forest residues of two different specieswere mixed and used as raw material for the experiments: Scotspine (Pinus sylvestris) and Black pine (Pinus nigra) obtained fromthe northern area of Catalonia (Spain). Woodchips were sieved toa nominal size of 20 mm and were seasoned up to 7% of moisturecontent. Table 1 shows the proximate, ultimate analysis and lowheating value of the woodchips used in the pyrolysis plant. Theultimate analysis was determined in a Carlo Erba EA1108 instru-ment. The moisture content was determined by ISO-589-1981;the ash content by ISO-1171-1976 and the volatile matter byISO-5263-1974. The low heating value was measured experimen-
Table 1Proximate and ultimate analyses of the woodchips sam-ples as received.
Proximate analysis (wt.%)Moisture 6.21Ash 0.39Volatile 78.52Fixed carbona 14.88
Ultimate analysis (wt.%)Carbon 48.28Hydrogen 6.34Nitrogen 0.21Oxygena 45.17Sulphur 0.00LHV (MJ kg�1) 18.01
a Calculated by difference.
tally with a bomb calorimeter IKA C-2000 and determined byUNE 164001 EX.
2.2. Thermogravimetric analysis
Initial pyrolysis tests were conducted in a thermobalance SETA-RAM Setsys Evolution. The inert gas was introduced into the sys-tem through the bottom with a predefined composition and totalflow. In this study all tests were run at a constant flow of nitrogenof 0.05 NL/min in a reactor with 20 mm of internal diameter to pro-duce a gas stream with a linear velocity of 2.51 � 10�3 m/s. The sen-sitivity of this apparatus is 3 � 10�11 kg. The thermobalance wasprovided with an electric oven that can operate up to 2023 K andit is controlled with a PID temperature controller. A thermocoupleis located close to the platinum basket where the sample is locatedfor temperature monitoring and control. The solid weight loss, to-gether with other process variables like temperature, was re-corded. Three experiments at different heating rates of 5; 10 and20 K/min were performed from room temperature up to 973 Kplacing 9.5 mg of biomass (particle size less than 0.2 mm) in thebasket.
2.3. Pyrolysis reactor
Pyrolysis of the pine woodchips was carried out in an augerreactor, which has been described in detail in previous literature(Aylón et al., 2010; Aylon et al., 2008) and it is shown in Fig. 1. Itcomprises four main parts: the feeding system, the reactor, thevessel for solids collection and the condensing system. Both thefeeding system and the reactor consist of screws, which allow car-rying out the process continuously. Electrical furnaces heat thereactor and temperature profiles along the reactor are measuredby three thermocouples. Woodchips move through the reactorwhile decomposing into a solid residue and a gaseous product,which reaches the condensing system by natural convection withthe help of the carrier gas (nitrogen, 5 NL/min). The solid residueleaves the reactor falling into a vessel for solids. The condensedfraction is recovered in a liquid collector after moving down bygravity. Non-condensable vapours at ambient temperature areconducted to a burner before reaching the atmosphere.
Ten experiments were carried out under different conditions:reaction temperature (1073, 973, 873, 823 and 773 K), solid resi-dence time (5, 3, 2 and 1.5 min) and mass flow rate (3.9, 4.8 and6.9 kg/h). Liquid yields, consisting of water and organic com-pounds, and solid yields of the experiments were directly obtainedby weight. The gas yield was calculated by means of the nitrogenfraction sampled in the gas bag, except for the experiments per-formed at highest temperatures (823, 873, 973 and 1023 K) wherethe gas yield was calculated through mass balance, owing to theinconsistency of the results obtained. Each experiment lastedapproximately 3 h, depending on the experimental conditions.
2.4. Product characterisation
Samples of the three fractions (solid, liquid and gas) were takenat timed intervals throughout the experiments. Liquid fraction wascharacterised by means of simulated distillation and GC/MS. Solidfraction and gas fraction were characterised by proximate analysisand gas chromatography coupled with a TCD detector, respec-tively. Further details of product characterisation are provided inthe following section.
2.4.1. Bio-oil characterisationPyrolysis liquid samples obtained from the experiments were
stored in sealed plastic bottles and kept refrigerated with no lightexposure.
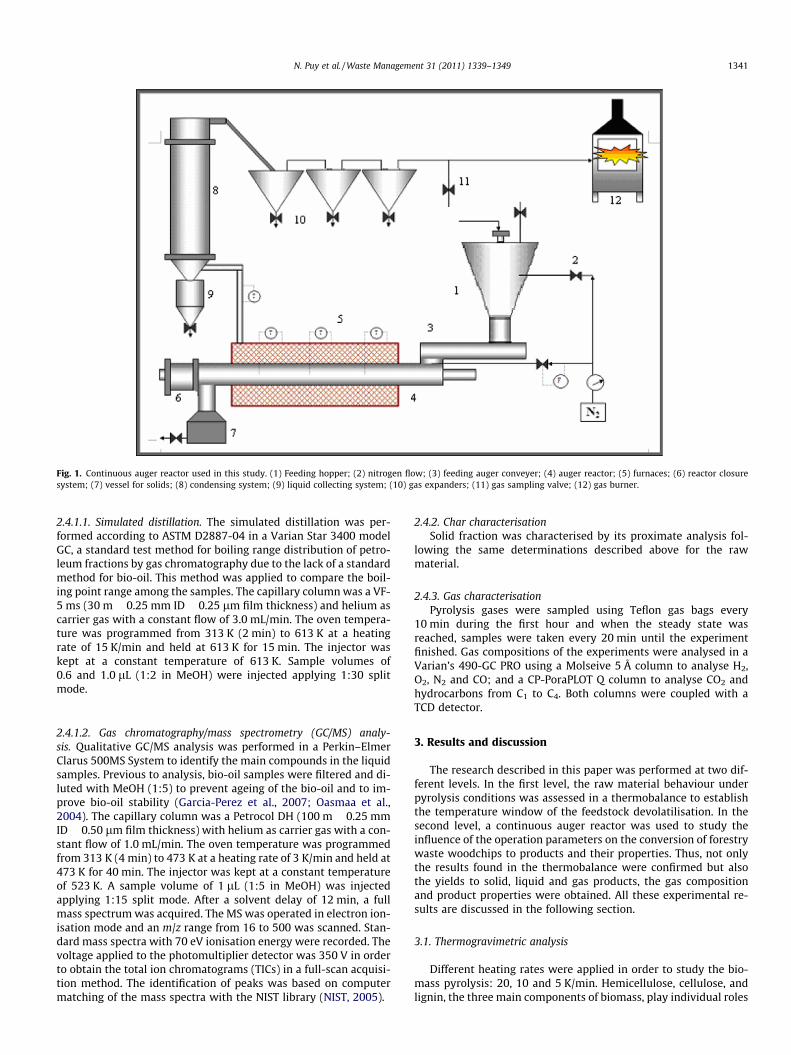
Fig. 1. Continuous auger reactor used in this study. (1) Feeding hopper; (2) nitrogen flow; (3) feeding auger conveyer; (4) auger reactor; (5) furnaces; (6) reactor closuresystem; (7) vessel for solids; (8) condensing system; (9) liquid collecting system; (10) gas expanders; (11) gas sampling valve; (12) gas burner.
N. Puy et al. / Waste Management 31 (2011) 1339–1349 1341
2.4.1.1. Simulated distillation. The simulated distillation was per-formed according to ASTM D2887-04 in a Varian Star 3400 modelGC, a standard test method for boiling range distribution of petro-leum fractions by gas chromatography due to the lack of a standardmethod for bio-oil. This method was applied to compare the boil-ing point range among the samples. The capillary column was a VF-5 ms (30 m � 0.25 mm ID � 0.25 lm film thickness) and helium ascarrier gas with a constant flow of 3.0 mL/min. The oven tempera-ture was programmed from 313 K (2 min) to 613 K at a heatingrate of 15 K/min and held at 613 K for 15 min. The injector waskept at a constant temperature of 613 K. Sample volumes of0.6 and 1.0 lL (1:2 in MeOH) were injected applying 1:30 splitmode.
2.4.1.2. Gas chromatography/mass spectrometry (GC/MS) analy-sis. Qualitative GC/MS analysis was performed in a Perkin–ElmerClarus 500MS System to identify the main compounds in the liquidsamples. Previous to analysis, bio-oil samples were filtered and di-luted with MeOH (1:5) to prevent ageing of the bio-oil and to im-prove bio-oil stability (Garcia-Perez et al., 2007; Oasmaa et al.,2004). The capillary column was a Petrocol DH (100 m � 0.25 mmID � 0.50 lm film thickness) with helium as carrier gas with a con-stant flow of 1.0 mL/min. The oven temperature was programmedfrom 313 K (4 min) to 473 K at a heating rate of 3 K/min and held at473 K for 40 min. The injector was kept at a constant temperatureof 523 K. A sample volume of 1 lL (1:5 in MeOH) was injectedapplying 1:15 split mode. After a solvent delay of 12 min, a fullmass spectrum was acquired. The MS was operated in electron ion-isation mode and an m/z range from 16 to 500 was scanned. Stan-dard mass spectra with 70 eV ionisation energy were recorded. Thevoltage applied to the photomultiplier detector was 350 V in orderto obtain the total ion chromatograms (TICs) in a full-scan acquisi-tion method. The identification of peaks was based on computermatching of the mass spectra with the NIST library (NIST, 2005).
2.4.2. Char characterisationSolid fraction was characterised by its proximate analysis fol-
lowing the same determinations described above for the rawmaterial.
2.4.3. Gas characterisationPyrolysis gases were sampled using Teflon gas bags every
10 min during the first hour and when the steady state wasreached, samples were taken every 20 min until the experimentfinished. Gas compositions of the experiments were analysed in aVarian’s 490-GC PRO using a Molseive 5 Å column to analyse H2,O2, N2 and CO; and a CP-PoraPLOT Q column to analyse CO2 andhydrocarbons from C1 to C4. Both columns were coupled with aTCD detector.
3. Results and discussion
The research described in this paper was performed at two dif-ferent levels. In the first level, the raw material behaviour underpyrolysis conditions was assessed in a thermobalance to establishthe temperature window of the feedstock devolatilisation. In thesecond level, a continuous auger reactor was used to study theinfluence of the operation parameters on the conversion of forestrywaste woodchips to products and their properties. Thus, not onlythe results found in the thermobalance were confirmed but alsothe yields to solid, liquid and gas products, the gas compositionand product properties were obtained. All these experimental re-sults are discussed in the following section.
3.1. Thermogravimetric analysis
Different heating rates were applied in order to study the bio-mass pyrolysis: 20, 10 and 5 K/min. Hemicellulose, cellulose, andlignin, the three main components of biomass, play individual roles

Table 2Experimental conditions studied in the auger reactor with pine woodchips asfeedstock and product yields.
Temperature(K)
Solidresidencetime (min)
Mass flowrate (kg/h)
Liquidyield(wt.%)
Solidyield(wt.%)
Gasyield(wt.%)
Reaction temperature1073 5.0 3.9 36.6 19.0 44.4a
973 5.0 3.9 37.2 21.3 41.6a
873 5.0 3.9 45.1 23.7 31.2a
823 5.0 3.9 51.4 25.7 22.7a
773 5.0 3.9 56.5 26.4 19.0
Solid residence time773 3.0 3.9 57.0 26.0 18.0773 2.0 3.9 53.2 28.7 16.7773 1.5 3.9 45.0 41.5 15.0
Mass flow rate773 5.0 4.8 56.4 27.8 22.5773 5.0 6.9 58.7 25.8 24.7
a Calculated through mass balance.
1342 N. Puy et al. / Waste Management 31 (2011) 1339–1349
in biomass pyrolysis (Yang et al., 2006). Fig. 2 shows the experi-mental reaction rate versus temperature (final temperature at973 K). Wood devolatilisation occurs between 400 and 773 K.and these temperature ranges slightly depend on the heating rateused. Wood decomposition takes place, as a previous study showed(Navarro et al., 2009), mainly in three steps: first lignin decompo-sition, which lasts until 773 K, followed by hemicellulose decom-position and, finally, cellulose decomposition. Lignin is thecompound with longer decomposition times, since its decomposi-tion starts at the same time of hemicellulose and can last until873 K (Navarro et al., 2009). It can be observed that working tem-peratures higher than 773 K will ensure total biomass conversion.Lower reaction temperatures could lead to incomplete pyrolysis ofthe wood samples, especially when large biomass particle size suchas woodchips are used compared to particle size less than 0.2 mmanalysed in the thermogravimetric analysis, because particle size isa key variable involved in heat transfer between gas and solid. It iswidely recognised that for large particles, convective heat transferbetween two phases become the controlling factor and the lowbiomass thermal conductivity introduces significant internal heattransfer limitations (Di Blasi, 2008).
3.2. Effect of temperature on pyrolysis products
The pyrolysis reaction was carried out at five different temper-atures ranging from 773 to 1073 K and different product yieldswere obtained depending on the reaction temperature (see Ta-ble 2). As it is showed, the maximum liquid yield (58.7 wt.%) at thisset of experiments is obtained at low reaction temperature (773 K),since severe cracking of the primary pyrolysis products occurs athigher temperatures (Mastral et al., 2000). Liquid yields of theexperiments carried out at 773 K ranged from 45% to 59%, whichis slightly higher than the yields obtained in other auger reactors.For instance, Mohan et al. (2006) reported liquid yields in augerreactors from 30% to 50%, and Garcia-Perez and co-workersachieved up to 50.4% of liquid yield from pine chips in their batchreactor at 773 K (Garcia-Perez et al., 2007a). Comparing the liquidyield obtained with pine pellets, Ingram and co-workers achieved aliquid yield up to 55.2% using ground-pellets (Ingram et al., 2008)while Garcia-Perez reported a 57.8% liquid yield (Garcia-Perezet al., 2007a). Comparing to other reactors, the yield of bio-oil ob-tained is similar to the reported in a bubbling fluidised bed reactor(Park et al., 2008) or to some extent low (60–80 wt.%) (Mohanet al., 2006; Wang et al., 2005), although the improvement in thisstudy is the mild biomass pre-treatment to keep it as simple aspossible. Water content of the bio-oil, determined by means of
0
0.2
0.4
0.6
0.8
1
1.2
1.4
1.6
0
20
40
60
80
100
200 300 400 500 600 700 800 900 1000
rate
of w
eig
ht l
oss
(mg
/min
)
Wei
gh
t (%
)
Temperature (K)
5 K/min
10 K/min
20 K/min
Fig. 2. Experimental results of weight loss (%) (black lines) and rate of weight loss(mg/min) (grey lines) from the thermogravimetric analysis (final temperature973 K).
Karl-Fisher titration (Crison Titromatic), ranged from 11 to19 wt.% with a high variability depending on the sample.
The particle size of biomass fed into the reactor was woodchipsinstead of sawdust and no specific drying treatment was carriedout either since the woodchips were air-dried. Considering thatthe size reduction of biomass feedstock is a very energy-intensiveand non-trivial operation due to the fibrous nature of most bio-mass materials, the capability of using large particles to achievehigh yields of quality bio-oil would be advantageous (Wanget al., 2005). It is reported that pyrolysis of large particle size bio-mass leads to pyrolysis secondary reactions, such as homogeneousand heterogeneous reactions, which include processes such ascracking, partial oxidation, re-polymerisation and condensation(Di Blasi, 2008) which could finally produce an increase in the yieldof char (Garcia-Perez et al., 2007a). Solid yields range from 19 to26 wt.% due to the different biomass devolatilisation rate achieved,which is between the 30% char yield obtained by Garcia-Perez et al.(2007a) and the char yield obtained by Ingram and co-workers thatis up to 19.8% (Ingram et al., 2008) when they pyrolyse pellets.
Accordingly, gas yields increase with higher reaction tempera-tures, similar to what it is stated in previous literature (Bridgwaterand Peacocke, 2000; Gilbert et al., 2009).
3.2.1. Effect of temperature on liquid propertiesThe influence of temperature on the bio-oil properties has been
studied by simulated distillation and GC/MS.
3.2.1.1. Simulated distillation. This method is used to study theinfluence of pyrolysis parameters on some bio-oil characteristicsdetermining the boiling point distribution of different fuel frac-tions. Three ranges of temperature have been differentiated (seeTable 3) in order to compare the bio-oils with gasoline and gasoil.The simulated distillation corresponding to the pyrolysis liquidswith boiling points comprised in the gasoline interval (lower than473 K), which ranges from 20.0% to 26.2% mass, does not show anyclear tendency according to temperature. The same lack of ten-dency can be observed in the performance of the pyrolysis liquidscompared to the gasoil fraction (with boiling points above 473 K).
3.2.1.2. Gas chromatography/mass spectrometry (GC/MS). Pyrolysisoils are a complex mixture of water, higher molecular weight lig-nin fragments and lower molecular weight organics. Oxygen ispresent in most of the compounds identified in the bio-oil (Scholzeand Meier, 2001) and this high amount of reactive oxygen-contain-ing compounds implies instability in pyrolysis oils (Oasmaa et al.,

N. Puy et al. / Waste Management 31 (2011) 1339–1349 1343
2004). Thermal cracking reactions on biomass pyrolysis generatethe following products: primary products (cellulose and hemicel-lulose-derived products, and lignin derived methoxyphenols); sec-ondary products (phenolics and oleofins); alkyl tertiary products(methylderivates of aromatics); and condensed tertiary products(PAH). Thus, thermal analysis performed by GC/MS of the pyrolysisliquids reflects the sum of the thermal response of its three maincomponents (cellulose, hemicellulose and lignin). The experimentcarried out at 773 K, in which the solid residence time was 5 minand the mass flow rate was set at 3.9 kg/h, achieved one of thehighest bio-oil yield in the auger reactor (56.6%). An example ofthe Total Ion Chromatogram of this sample is shown in Fig. 3. Morethan 150 compounds were detected and among them, 64 com-pounds were identified by comparison with spectra from the NISTmass spectral library. The identified compounds listed in Table 4included carboxylic acids, alcohols, aldehydes, ketones and pheno-lic compounds. The most abundant species, according to the per-centage of area of the chromatogram, are: 4-methyl-1,2-benzenediol (7.2%); 1,2-benzenediol (5.7%); 2-methoxy-4-methyl-phenol (5.1%); D-allose (3.4%); 2-methoxyphenol (3.5%); and aceticacid (3.3%).
In this bio-oil sample, the functional groups distribution is di-vided into mostly phenols (47.5%); followed by ketones (10.0%);acids (7.0%); aldehydes (4.0%); polycyclics (1.0%) and other func-tional groups, which represent the 0.1% of the total area. Table 5summarises the identified compounds classified into functionalgroups. The influence of reaction temperature on the compositionof bio-oil can be observed in Fig. 4. Reaction temperature wasnoted to be the most important operational parameter that affectsbio-oil composition. The influence of reaction temperature on thebio-oils results in a higher amount of polycyclic compounds, an in-crease that results from the further reaction of primary products(Alen et al., 1996), which increases from the 1.0% of the total areaof the chromatogram at 773 K to 10.6% at 1073 K, as shown inFig. 4. It has been reported that at very high temperatures, dehy-drogenation/aromatisation reactions can eventually lead to largerpolynuclear aromatic hydrocarbons and, eventually, increases incarbonisation (Di Blasi, 1996; Effendi et al., 2008; Garcia-Perezet al., 2007a; Mohan et al., 2006). It should be noted that aromaticcompounds, especially naphthalene and heavier PAHs, cause tech-nical problems for engine combustion or for advanced catalytic gasconversion (Dufour et al., 2007). Overall, the proportions of pheno-lic compounds do not show significant variations between thetemperatures studied. However, the presence of aldehydes and ke-tones is substantially higher in the samples prepared at lower tem-peratures. These ranged from 0.8% and 4.0% in the case of
Table 3Simulated distillation of the pyrolysis oil obtained under different operationalconditions.
Boiling point distribution (% mass)
<473 K 473–623 K >623 K
Reaction temperature (K) (mass flow rate = 3.9 kg/h, residence time = 5.0 min)1073 21.1 41.0 37.9973 26.2 46.9 26.9873 23.2 45.6 31.2823 16.1 36.7 47.2773 20.0 37.7 42.3
Solid residence time (min) (T = 773 K, mass flow rate = 3.9 kg/h)3 19.3 36.2 44.52 18.2 33.6 48.21.5 17.8 30.0 52.2
Mass flow rate (kg/h) (T = 773 K, residence time = 5.0 min)4.8 18.5 33.8 47.76.9 15.4 32.3 52.3
aldehydes and between 5.8% and 9.9% for ketones, with decreasingtemperature of pyrolysis.
A further analysis of the reaction temperature dependence ofthe chemical composition of the bio-oils has been performed. Thebio-oil fractions have been represented previously as a mixture ofeight macro-families (Garcia-Perez et al., 2007b), designated as:volatile non-polar compounds, volatile polar compounds, monolig-nols, polar compounds with moderate volatility, sugars, extractive-derived compounds, heavy non-polar compounds and heavy polarcompounds. The volatile non-polar compounds are mainly formedof alkenes and aromatics. Bio-oil derived volatile polar compoundsinclude compounds with 1–5 atoms of carbon with boiling pointsup to approximately 423 K, which include mainly ketones suchas 2-cyclopenten-1-one. The monolignols and polar compoundswith moderate volatility are present in bio-oils as phenols and ben-zenediols, guaiacols and syringols. The extractive-derived com-pounds are fatty and resin acids, paraffins and phenanthrenes.The sugars present in bio-oils are mainly polysaccharides, althoughthey could not be identified in the bio-oils obtained in the augerreactor. This fact coincides with results presented by Wang et al.(2009), even though levoglucosan is regarded to be a primary pyro-lysis product of holocellulose (hemicellulose and cellulose), whichincreases with temperature (Branca et al., 2003). The monosaccha-ride D-allose is identified in the bio-oil samples obtained at tem-peratures ranging from 773 to 973 K, but it is not present at1073 K. This might be explained by the complete degradation ofholocellulose at high temperatures. In this study, heavy non-polarcompounds and heavy polar compounds can not be determineddue to the temperature limitation of the GC column used.
It can be observed that the presence of acids, such as propanoicacid or acetic acid, and esters in the samples rises moderately atincreasing reaction temperatures (see Supporting informationFig. S.1). Phenolic compounds in pyrolysis oils are originated fromthe degradation of lignin present in the feedstock (Branca et al.,2003; Hassan et al., 2009; Oasmaa and Kuoppala, 2003). Althoughno significant differences can be seen among the samples in rela-tion to the occurrence of phenols, the amount of phenol and 3-methylphenol (m-cresol) increases with preparation temperature,indicating that they are also formed from secondary degradationreactions (see Supporting information Fig. S.2). Since the liquidreaction products were recovered altogether, the effect of sidereactions is important, for example, phenolic compounds tend topolymerise with aldehydes under acidic conditions (Murwanash-yaka et al., 2001). Given that the experiments were run at temper-atures above 623 K, secondary pyrolysis products, mainlycatechols, can be observed. The presence of these compounds in-creases with longer holding times, due to demethylation of meth-oxy phenols rather than dehydration reactions (Murwanashyakaet al., 2001).
In accordance with previous literature (Branca et al., 2003), theincreased yield of furans (5-methyl-2-furancarboxaldehyde and 5-hydroxymethyl-2-furancarboxaldehyde) observed at low tempera-ture can be attributed to hemicellulose decomposition (see Sup-porting information Fig. S.3), given that the subsequentdehydration of levoglucosan yields substituted furan and pyranderivatives (Ingram et al., 2008).
Finally, as the temperature is increased, early increases in theproduction of ketones (see Supporting information Fig. S.4) canbe observed, reflecting the primary degradation of wood compo-nents (cellulose, hemicellulose and lignin) (Branca et al., 2003).At higher temperatures dehydration reactions occur and theiroccurrence decreases, as the formation of phenols is favoured.
3.2.2. Effect of temperature on char propertiesTable 6 shows the char proximate analysis where it can be ob-
served that although reaching reaction temperatures of 1073 K, the

Fig. 3. Total Ion Chromatogram of bio-oil produced from pine woodchips at 773 K, 5 min of solid residence time and 3.9 kg/h of mass flow rate. Numbering of compounds isaccording to Table 4.
1344 N. Puy et al. / Waste Management 31 (2011) 1339–1349
volatile matter remains above 10%. In the thermobalance essays al-most complete devolatilisation was achieved for temperaturesaround 773 K. This difference can mainly come from the influenceof three operational parameters changed from one system to theother: heating rate, solid residence time and particle size. In theauger reactor the particle will suffer a change in temperature fromroom temperature to 773–1073 K at a much higher heating ratethan in the thermogravimetric analysis runs and a subsequent shiftof the pyrolysis reaction to higher temperatures. This influence of
the heating rate in the pyrolysis process has been previously re-ported and modelled for different kinds of biomass and for the bio-mass components cellulose, hemicellulose and lignin (Navarroet al., 2009). The particle size (thermobalance 0.2 mm, auger reac-tor 20 mm) can also have a negative impact in the devolatilisationreached in the process since higher particle sizes above 0.2 mmproduce secondary reactions that lead to higher char yields (DiBlasi, 2008) due to the temperature gradient effect on the primaryproduct distribution produced in processes with internal and

Table 4Main compounds identified in the bio-oil in the experiment ran at 773 K (solid residence time = 5.0 min; mass flow rate = 3.9 kg/h).
Id Compound Mw Formula Retention time (min) Area (%)a
1 Acetate-1-propen-2-ol 100 C5H8O2 12.388 0.52 2,3-Butanedione 86 C4H6O2 14.840 0.33 Acetic acid 60 C2H4O2 15.772 3.34 2-Butenal 70 C4H6O 17.374 0.15 2-Acetate-1,2-propanediol 118 C5H10O3 17.684 2.06 2,2-Dimethoxy-propane 104 C5H12O2 18.362 0.17 3-Methyl-3-buten-2-one 84 C5H8O 18.779 0.18 2-Pentanone 86 C5H10O 19.417 0.19 Propanoic acid 74 C3H6O2 20.177 0.510 2,5-Dimethyl-furan 96 C6H8O 20.880 0.111 (e)-3-Penten-2-one 84 C5H8O 22.179 0.212 (Acetyloxy)-acetic acid 118 C4H6O4 23.021 0.213 1-Hydroxy-2-butanone 88 C4H8O2 23.405 0.614 Butanoic acid 88 C4H8O2 25.342 0.615 3-Methyl-2-butanone 86 C5H10O 29.077 0.516 2-Cyclopentene-1,4-dione 96 C5H4O2 30.246 0.117 2-Methyl-2-cyclopenten-1-one 96 C6H8O 32.412 0.518 1-(2-Furanyl)-ethanone 110 C6H6O2 32.633 0.219 2,5-Hexanedione 114 C6H10O2 32.919 0.120 2-Hydroxy-2-cyclopenten-1-one 98 C5H6O2 33.360 0.621 1-(Acetyloxy)-2-butanone 130 C6H10O3 35.199 0.222 5-Methyl-2-furancarboxaldehyde 110 C6H6O2 35.665 1.023 2-Cyclopenten-1-one, 3-methyl- 96 C6H8O 35.943 1.224 Phenol 94 C6H6O 36.875 1.925 2,5-Dihydro-3,5-dimethyl 2-furanone 112 C6H8O2 37.528 0.426 3,4-Dimethyl-2-cyclopenten-1-one 110 C7H10O 37.904 0.127 2-Cyclohexene-1,4-dione 110 C6H6O2 39.294 0.228 4-Methyl-5h-furan-2-one 98 C5H6O2 39.653 0.429 2-Hydroxy-2-cyclopenten-1-one 112 C6H8O2 39.882 2.130 2,3-Dimethyl-2-cyclopenten-1-one 110 C7H10O 40.642 0.431 2-Hydroxy-benzaldehyde 122 C7H6O2 40.937 0.232 2-Methyl-phenol 108 C7H8O 41.321 2.433 2-Hydroxy-2-cyclopenten-1-one 126 C7H10O2 41.778 0.334 3-Methyl-phenol 108 C7H8O 42.408 2.635 2-Methoxy-phenol 124 C7H8O2 43.527 3.536 2,5-Dimethyl-phenol 122 C8H10O 44.590 0.237 Maltol 126 C6H6O3 44.745 0.538 3-Ethyl-2-hydroxy-2-cyclopenten-1-one 126 C7H10O2 45.227 0.439 2-Ethyl-phenol 122 C8H10O 45.938 0.240 2,5-Dimethyl-phenol 122 C8H10O 46.617 2.741 2,6-Dimethyl-phenol 122 C8H10O 48.211 0.242 4-Methoxy-3-methyl-phenol 138 C8H10O2 48.546 0.343 1,2-Benzenediol 110 C6H6O2 48.905 5.744 2-Methoxy-4-methyl-phenol 138 C8H10O2 49.273 5.145 5-(Hydrxymethyl)-2-furancarboxaldehyde 126 C6H6O3 49.739 1.446 3,4,5-Trimethyl-phenol 136 C9H12O 49.902 0.447 3,4-Dimethoxytoluene 152 C9H12O2 51.039 0.548 2-Ethyl-5-methyl-phenol 136 C9H12O 51.325 1.149 3-Ethyl-5-methyl-phenol 136 C9H12O 51.553 0.150 4-(2-Propenyl)-phenol 134 C9H10O 51.856 0.151 Hydroquinone 110 C6H6O2 52.060 0.152 4-Methyl-1,2-benzenediol 124 C7H8O2 53.662 7.253 2-Methoxy-4-vinylphenol 150 C9H10O2 55.231 0.554 4-(2-Propenyl)-phenol 134 C9H10O 56.073 0.355 2-Methoxy-3-(2-propenyl)-phenol 164 C10H12O2 57.389 1.456 2-Methoxy-4-propyl-phenol 166 C10H14O2 58.018 0.457 4-Ethylcatechol 138 C8H10O2 58.182 1.558 Vanillin 152 C8H8O3 58.901 1.359 (e)-2-Methoxy-4-(1-propenyl)-phenol 164 C10H12O2 59.923 1.060 (z)-2-Methoxy-4-(1-propenyl)-phenol 164 C10H12O2 62.105 1.961 D-allose 180 C6H12O6 62.865 3.9
62 1-(4-Hydroxy-3-methoxyphenyl)-ethanone 166 C9H10O3 63.666 0.963 1-Methyl-7-(1-methylethyl)-naphthalene 184 C14H16 72.019 0.364 4-Hydroxy-2-methoxycinnamaldehyde 178 C10H10O3 82.047 1.3
a Calculated by dividing each product peak area by the sum of areas of all product peaks.
N. Puy et al. / Waste Management 31 (2011) 1339–1349 1345
external heat transfer control. Finally, the solid residence time ismuch shorter in the auger reactor than in the thermobalance. Forexample, in the fastest thermobalance experiment (20 K/min),the solid residence time at reaction temperature (between 450and 975 K) was around 41 min (26 min during the heating up per-iod and 15 min at the final temperature) much longer than themaximum 5 min in the auger reactor.
3.2.3. Effect of temperature on gas propertiesThe gas composition for the reaction temperatures studied can
be observed in Fig. 5. The composition has been expressed in termsof yield to the different gas compounds since gas yield differsdepending on each temperature. It is observed that higher reactiontemperature produces a higher cracking, depolymerisation, decar-boxylation and oxidation in the gas phase (González et al., 2003).
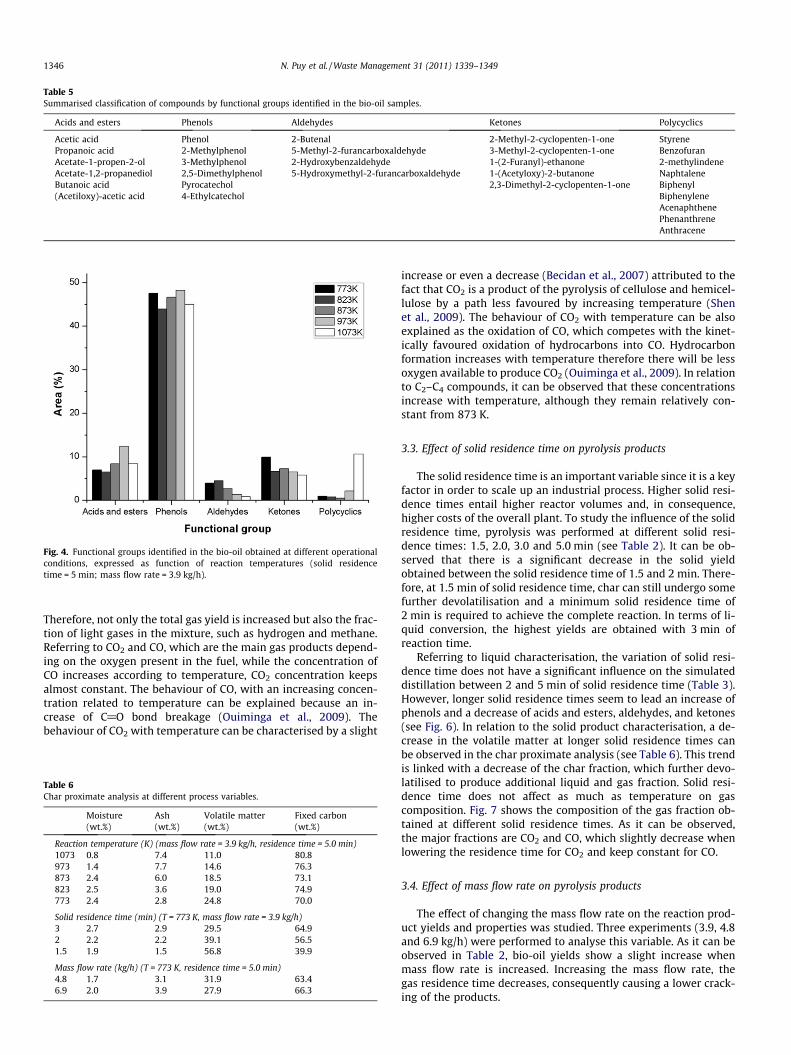
Table 5Summarised classification of compounds by functional groups identified in the bio-oil samples.
Acids and esters Phenols Aldehydes Ketones Polycyclics
Acetic acid Phenol 2-Butenal 2-Methyl-2-cyclopenten-1-one StyrenePropanoic acid 2-Methylphenol 5-Methyl-2-furancarboxaldehyde 3-Methyl-2-cyclopenten-1-one BenzofuranAcetate-1-propen-2-ol 3-Methylphenol 2-Hydroxybenzaldehyde 1-(2-Furanyl)-ethanone 2-methylindeneAcetate-1,2-propanediol 2,5-Dimethylphenol 5-Hydroxymethyl-2-furancarboxaldehyde 1-(Acetyloxy)-2-butanone NaphtaleneButanoic acid Pyrocatechol 2,3-Dimethyl-2-cyclopenten-1-one Biphenyl(Acetiloxy)-acetic acid 4-Ethylcatechol Biphenylene
AcenaphthenePhenanthreneAnthracene
Fig. 4. Functional groups identified in the bio-oil obtained at different operationalconditions, expressed as function of reaction temperatures (solid residencetime = 5 min; mass flow rate = 3.9 kg/h).
1346 N. Puy et al. / Waste Management 31 (2011) 1339–1349
Therefore, not only the total gas yield is increased but also the frac-tion of light gases in the mixture, such as hydrogen and methane.Referring to CO2 and CO, which are the main gas products depend-ing on the oxygen present in the fuel, while the concentration ofCO increases according to temperature, CO2 concentration keepsalmost constant. The behaviour of CO, with an increasing concen-tration related to temperature can be explained because an in-crease of C@O bond breakage (Ouiminga et al., 2009). Thebehaviour of CO2 with temperature can be characterised by a slight
Table 6Char proximate analysis at different process variables.
Moisture(wt.%)
Ash(wt.%)
Volatile matter(wt.%)
Fixed carbon(wt.%)
Reaction temperature (K) (mass flow rate = 3.9 kg/h, residence time = 5.0 min)1073 0.8 7.4 11.0 80.8973 1.4 7.7 14.6 76.3873 2.4 6.0 18.5 73.1823 2.5 3.6 19.0 74.9773 2.4 2.8 24.8 70.0
Solid residence time (min) (T = 773 K, mass flow rate = 3.9 kg/h)3 2.7 2.9 29.5 64.92 2.2 2.2 39.1 56.51.5 1.9 1.5 56.8 39.9
Mass flow rate (kg/h) (T = 773 K, residence time = 5.0 min)4.8 1.7 3.1 31.9 63.46.9 2.0 3.9 27.9 66.3
increase or even a decrease (Becidan et al., 2007) attributed to thefact that CO2 is a product of the pyrolysis of cellulose and hemicel-lulose by a path less favoured by increasing temperature (Shenet al., 2009). The behaviour of CO2 with temperature can be alsoexplained as the oxidation of CO, which competes with the kinet-ically favoured oxidation of hydrocarbons into CO. Hydrocarbonformation increases with temperature therefore there will be lessoxygen available to produce CO2 (Ouiminga et al., 2009). In relationto C2–C4 compounds, it can be observed that these concentrationsincrease with temperature, although they remain relatively con-stant from 873 K.
3.3. Effect of solid residence time on pyrolysis products
The solid residence time is an important variable since it is a keyfactor in order to scale up an industrial process. Higher solid resi-dence times entail higher reactor volumes and, in consequence,higher costs of the overall plant. To study the influence of the solidresidence time, pyrolysis was performed at different solid resi-dence times: 1.5, 2.0, 3.0 and 5.0 min (see Table 2). It can be ob-served that there is a significant decrease in the solid yieldobtained between the solid residence time of 1.5 and 2 min. There-fore, at 1.5 min of solid residence time, char can still undergo somefurther devolatilisation and a minimum solid residence time of2 min is required to achieve the complete reaction. In terms of li-quid conversion, the highest yields are obtained with 3 min ofreaction time.
Referring to liquid characterisation, the variation of solid resi-dence time does not have a significant influence on the simulateddistillation between 2 and 5 min of solid residence time (Table 3).However, longer solid residence times seem to lead an increase ofphenols and a decrease of acids and esters, aldehydes, and ketones(see Fig. 6). In relation to the solid product characterisation, a de-crease in the volatile matter at longer solid residence times canbe observed in the char proximate analysis (see Table 6). This trendis linked with a decrease of the char fraction, which further devo-latilised to produce additional liquid and gas fraction. Solid resi-dence time does not affect as much as temperature on gascomposition. Fig. 7 shows the composition of the gas fraction ob-tained at different solid residence times. As it can be observed,the major fractions are CO2 and CO, which slightly decrease whenlowering the residence time for CO2 and keep constant for CO.
3.4. Effect of mass flow rate on pyrolysis products
The effect of changing the mass flow rate on the reaction prod-uct yields and properties was studied. Three experiments (3.9, 4.8and 6.9 kg/h) were performed to analyse this variable. As it can beobserved in Table 2, bio-oil yields show a slight increase whenmass flow rate is increased. Increasing the mass flow rate, thegas residence time decreases, consequently causing a lower crack-ing of the products.

Fig. 5. Composition of the gas fraction obtained at different reaction temperatures(solid residence time = 5 min; mass flow rate = 3.9 kg/h).
Fig. 6. Functional groups identified in the bio-oil obtained at different operationalconditions, expressed as function of solid residence time (T = 773 K, mass flowrate = 3.9 kg/h).
Fig. 7. Composition of the gas fraction obtained at different solid residence times(T = 773 K, mass flow rate = 3.9 kg/h).
Fig. 8. Functional groups identified in the bio-oil obtained at different operationalconditions, expressed as function of mass flow rate (T = 773 K, solid residencetime = 5.0 min).
N. Puy et al. / Waste Management 31 (2011) 1339–1349 1347
The functional groups identified in the bio-oil obtained at differ-ent mass flow rates do not show significant differences betweenthe samples, as it was observed with the variation of the solid res-idence time (see Fig. 8). On the other hand, some differences can beobserved in the simulated distillation curves (see Table 3). Whenthe biomass flow rate is increased, the gasoline percentage in theliquid yield decreases from 20% to 15% and the gasoil percentagevaries from 80% to 85% in the studied range. No significant differ-ences can be observed between the three mass flow rates studiedon the char characterisation (see Table 6). Regarding the composi-tion of the gas fraction (see Fig. 9), at higher mass flows the CO2
content diminishes due to the formation of more volatile com-pounds and consequently their residence time diminishes in detri-mental to their cracking and reaction of oxygen to CO2.
3.5. Process scaling up
It has been demonstrated during this research that forestrywaste pyrolysis can be performed in an auger reactor obtaining
similar yields and product characteristics as other types of reactorssuch as fluidised beds (Mohan et al., 2006; Park et al., 2008).Around 250 kg of woodchips were processed during the wholeexperimental campaign and, once all the devices were adaptedfor biomass processing, no significant incidences were detected.This proves that the design is robust and appropriate for this pro-cess and valuable information for scaling up to a large-scale planthas been generated. It can be stated that a larger reactor based onthis technology could be designed whenever a minimum solid res-idence time of 2 min is ensured in order to have full biomass devol-atilisation. In addition, it is important to highlight the largerparticle size of the woodchips fed into the pilot plant (20 mm)compared to the sawdust used in fluidised bed reactors and otherauger reactors. This fact provides lower energy and economic costsof biomass pre-treatment since it is an industrial product that iscurrently used in biomass boilers. It has also been proven that773 K could be used as design temperature since the highest bio-oil yield is obtained and it ensures complete woodchipsdevolatilisation.

Fig. 9. Composition of the gas fraction obtained at different mass flow rates(T = 773 K, residence time = 5.0 min).
1348 N. Puy et al. / Waste Management 31 (2011) 1339–1349
4. Conclusions
The objective of this study was to assess the performance of anauger reactor in the pyrolysis of forestry waste woodchips and todetermine the yields and properties of liquid, char and gaseousproducts obtained under different reaction temperatures (from1073 to 773 K), solid residence times (5, 3, 2 and 1.5 min) and massflow rates (3.9, 4.8 and 6.9 kg/h). It has been demonstrated thatforest residues woodchip pyrolysis can be successfully achievedin an auger reactor under experimental conditions close to theoperation range of parameters of possible industrial scale plants(continuous operation, moderate temperature and low solid resi-dence time).
In the range studied, 773 K offers the most valuable yields andproduct characteristics for liquid production. It has been confirmedthat solid residence times longer than 2 min are needed in order toreach complete conversion. Pyrolysis liquids from forestry wasteshave a wide range of compounds with boiling points similar to gas-oline and diesel. Qualitative identification carried out by GC/MSshowed that the most abundant compounds are volatile polar com-pounds, which mainly included carboxylic acids, ketones, alde-hydes and monolignols, which were formed of phenols andbenzenediols (pyrocatechol). A higher reaction temperature inthe pyrolysis process led to an increase of aromatic compounds,mainly formed by PAH such as naphtalene or biphenyl. It was alsoobserved that longer residence times decrease the volatile mattercontent in the char. On the other hand, it was noted that biomassflow rate slightly affects the process in the range studied.
Finally, this study shows that the auger reactor used in thiswork is a plausible option for justifying the future scaling up ofthe plant, not only due to the good yields to liquid product andits properties, but also owing to the less pre-treatment applied tothe biomass and the simplicity of the reactor. This fact will allowin the near future to process residual forest biomass in remotelocations by means of a mobile auger reactor pyrolysis plant.
Acknowledgements
This work was partly funded by the Spanish Ministerio de Cien-cia e Innovacion project CTQ2009-13873. Dr. López contract is fi-nanced by the Ramon y Cajal Program of the Ministerio deCiencia e Innovacion.
Appendix A. Supplementary data
Supplementary data associated with this article can be found, inthe online version, at doi:10.1016/j.wasman.2011.01.020.
References
Alen, R., Kuoppala, E., Oesch, P., 1996. Formation of the main degradation compoundgroups from wood and its components during pyrolysis. Journal of Analyticaland Applied Pyrolysis 36, 137–148.
Aylon, E., Fernandez-Colino, A., Navarro, M.V., Murillo, R., Garcia, T., Mastral, A.M.,2008. Waste tire pyrolysis: comparison between fixed bed reactor and movingbed reactor. Industrial and Engineering Chemistry Research 47, 4029–4033.
Aylón, E., Fernández-Colino, A., Murillo, R., Navarro, M.V., García, T., Mastral, A.M.,2010. Valorisation of waste tyre by pyrolysis in a moving bed reactor. WasteManagement 30, 1220–1224.
Badger, P.C., Fransham, P., 2006. Use of mobile fast pyrolysis plants to densifybiomass and reduce biomass handling costs – a preliminary assessment.Biomass and Bioenergy 30, 321–325.
Becidan, M., Skreiberg, Ø., Hustad, J.E., 2007. Products distribution and gas release inpyrolysis of thermally thick biomass residues samples. Journal of Analytical andApplied Pyrolysis 78, 207–213.
Bhattacharya, P., Steele, P.H., Hassan, E.B.M., Mitchell, B., Ingram, L., Pittman Jr., C.U.,2009. Wood/plastic copyrolysis in an auger reactor: chemical and physicalanalysis of the products. Fuel 88, 1251–1260.
Branca, C., Giudicianni, P., Di Blasi, C., 2003. GC/MS characterization of liquidsgenerated from low-temperature pyrolysis of wood. Industrial and EngineeringChemistry Research 42, 3190–3202.
Bridgwater, A.V., Peacocke, G.V.C., 2000. Fast pyrolysis processes for biomass.Renewable and Sustainable Energy Reviews 4, 1–73.
Bridgwater, A.V., Meier, D., Radlein, D., 1999. An overview of fast pyrolysis ofbiomass. Organic Geochemistry 30, 1479–1493.
Briens, C., Berruti, F., Ferrante, L., 2009. A mobile pyrolyzer for the conversion ofbiomass into bio-oil, tcbiomass2009, Chicago.
Czernik, S., Bridgwater, A.V., 2004. Overview of applications of biomass fastpyrolysis oil. Energy and Fuels 18, 590–598.
Di Blasi, C., 1996. Kinetic and heat transfer control in the slow and flash pyrolysis ofsolids. Industrial and Engineering Chemistry Research 35, 37–46.
Di Blasi, C., 2008. Modeling chemical and physical processes of wood and biomasspyrolysis. Progress in Energy and Combustion Science 34, 47–90.
Dufour, A., Girods, P., Masson, E., Normand, S., Rogaume, Y., Zoulalian, A., 2007.Comparison of two methods of measuring wood pyrolysis tar. Journal ofChromatography A 1164, 240–247.
Effendi, A., Gerhauser, H., Bridgwater, A.V., 2008. Production of renewable phenolicresins by thermochemical conversion of biomass: a review. Renewable andSustainable Energy Reviews 12, 2092–2116.
Garcia-Perez, M., Adams, T.T., Goodrum, J.W., Geller, D.P., Das, K.C., 2007a.Production and fuel properties of pine chip bio-oil/biodiesel blends. Energyand Fuels 21, 2363–2372.
Garcia-Perez, M., Chaala, A., Pakdel, H., Kretschmer, D., Roy, C., 2007b.Characterization of bio-oils in chemical families. Biomass and Bioenergy 31,222–242.
Gilbert, P., Ryu, C., Sharifi, V., Swithenbank, J., 2009. Tar reduction in pyrolysisvapours from biomass over a hot char bed. Bioresource Technology 100, 6045–6051.
González, J.F., Encinar, J.M., Canito, J.L., Sabio, E., Chacón, M., 2003. Pyrolysis ofcherry stones: energy uses of the different fractions and kinetic study. Journal ofAnalytical and Applied Pyrolysis 67, 165–190.
Hassan, E.M., Yu, F., Ingram, L., Steele, P., 2009. The potential use of whole-treebiomass for bio-oil fuels. Energy Sources Part a-Recovery Utilization andEnvironmental Effects 31, 1829–1839.
Iakovou, E., Karagiannidis, A., Vlachos, D., Toka, A., Malamakis, A., 2010. Wastebiomass-to-energy supply chain management: a critical synthesis. WasteManagement 30, 1860–1870.
Ingram, L., Mohan, D., Bricka, M., Steele, P., Strobel, D., Crocker, D., Mitchell, B.,Mohammad, J., Cantrell, K., Pittman, C.U., 2008. Pyrolysis of wood and bark in anauger reactor: physical properties and chemical analysis of the produced bio-oils. Energy and Fuels 22, 614–625.
Mastral, A.M., Murillo, R., Callen, M.S., Garcia, T., Snape, C.E., 2000. Influence ofprocess variables on oils from tire pyrolysis and hydropyrolysis in a swept fixedbed reactor. Energy and Fuels 14, 739–744.
Mohan, D., Pittman, C.U., Steele, P.H., 2006. Pyrolysis of wood/biomass for bio-oil: acritical review. Energy and Fuels 20, 848–889.
Murwanashyaka, J.N., Pakdel, H., Roy, C., 2001. Step-wise and one-step vacuumpyrolysis of birch-derived biomass to monitor the evolution of phenols. Journalof Analytical and Applied Pyrolysis 60, 219–231.
Navarro, M.V., Murillo, R., Mastral, A.M., Puy, N., Bartroli, J., 2009. Application of thedistributed activation energy model to biomass and biomass constituentsdevolatilization. Aiche Journal 55, 2700–2715.
NIST, 2005. NIST Standard Reference Database, National Institute of Standards andTechnology. US Department of Commerce, Gaithersburg, MD, USA.
Oasmaa, A., Kuoppala, E., 2003. Fast pyrolysis of forestry residue. 3. Storage stabilityof liquid fuel. Energy and Fuels 17, 1075–1084.

N. Puy et al. / Waste Management 31 (2011) 1339–1349 1349
Oasmaa, A., Kuoppala, E., Selin, J.-F., Gust, S., Solantausta, Y., 2004. Fast pyrolysis offorestry residue and pine. 4. Improvement of the product quality by solventaddition. Energy and Fuels 18, 1578–1583.
Ouiminga, S.K., Rogaume, T., Sougoti, M., Commandre, J.M., Koulidiati, J., 2009.Experimental characterization of gaseous species emitted by the fast pyrolysisof biomass and polyethylene. Journal of Analytical and Applied Pyrolysis 86,260–268.
Park, H.J., Park, Y.K., Kim, J.S., 2008. Influence of reaction conditions and the charseparation system on the production of bio-oil from radiata pine sawdust byfast pyrolysis. Fuel Processing Technology 89, 797–802.
Puy, N., Tàbara, D., Bartrolí Molins, J., Bartrolí Almera, J., Rieradevall, J., 2008.Integrated Assessment of forest bioenergy systems in Mediterranean basinareas: the case of Catalonia and the use of participatory IA-focus groups.Renewable and Sustainable Energy Reviews 12, 1451–1464.
Scholze, B., Meier, D., 2001. Characterization of the water-insoluble fraction frompyrolysis oil (pyrolytic lignin). Part I. PY-GC/MS, FTIR, and functional groups.Journal of Analytical and Applied Pyrolysis 60, 41–54.
Shen, J., Wang, X.-S., Garcia-Perez, M., Mourant, D., Rhodes, M.J., Li, C.-Z., 2009.Effects of particle size on the fast pyrolysis of oil mallee woody biomass. Fuel88, 1810–1817.
Tabara, D., Sauri, D., Cerdan, R., 2003. Forest fire risk management and publicparticipation in changing socioenvironmental conditions: a case study in aMediterranean region. Risk Analysis 23, 249–260.
Thangalazhy-Gopakumar, S., Adhikari, S., Ravindran, H., Gupta, R.B., Fasina, O., Tu,M., Fernando, S.D., 2010. Physiochemical properties of bio-oil produced atvarious temperatures from pine wood using an auger reactor. BioresourceTechnology 101, 8389–8395.
Wang, X.Q., Kersten, S.R.A., Prins, W., van Swaaij, W.P.M., 2005. Biomass pyrolysis ina fluidized bed reactor. Part 2: experimental validation of model results.Industrial and Engineering Chemistry Research 44, 8786–8795.
Wang, Z., Cao, J., Wang, J., 2009. Pyrolytic characteristics of pine wood in a slowlyheating and gas sweeping fixed-bed reactor. Journal of Analytical and AppliedPyrolysis 84, 179–184.
Yang, H.P., Yan, R., Chen, H.P., Zheng, C.G., Lee, D.H., Liang, D.T., 2006. In-depthinvestigation of biomass pyrolysis based on three major components:hemicellulose, cellulose and lignin. Energy and Fuels 20, 388–393.