Validation of the cumulative or replicate NAA method for the determination of trace elements in...
12
Validation of the Cumulative or Replicate NAA Method for the Determination of Trace Elements in Biological Materials M. F. REIs, *'1 A. A. S. C. MACHADO, 2 M. ABDULLA, 3 J. CANARIO, 4 AND J. C. SILVA 1 'INETI- ICEN - DEEN, Sacavem, Portugal; 2Laquipai, Faculty of Science, University of Oporto, Portugal; 3Department of Clinical Pharmacology and Therapeutics, Hamdard University, New Delhi, India; and 4Faculty of Science, University of Lisbon, Portugal ABSTRACT To make the best use of time and facilities, a neutron activation system, fully automatic, including spectrum and data processing, to be used with short-lived nuclides, has been recently developed at the Portuguese Research Reactor (in Portuguese "Reactor Portugu6s de Investiga~o," RPI). Using this system, the cumulative neutron acti- vation analysis method is now being implemented. This article sum- marizes the experimental procedures used to validate the cumulative NAA method for the determination of selenium in biological samples, emphasizing the determination of the essential characteristics of pre- cision, accuracy, and limits of detection and of quantification of the method. The article also examines how detection limits and precision are improved when the samples are analyzed by this method com- pared to the cyclic activation measurements in use at RPI for the determination of selenium. The improvement is demonstrated for the measurement of selenium in several reference materials when the result obtained by adding up seven spectra of separate aliquots of the same sample is compared to the result from a cumulative spectrum of seven (whenever possible) consecutive cycles of a single sample. *Author to whom all correspondence and reprint requests should be addressed. Biological Trace Element Research Editor: G. N. Schrauzer 1994 by Humana Press Inc. 585
-
Upload
independent -
Category
Documents
-
view
1 -
download
0
Transcript of Validation of the cumulative or replicate NAA method for the determination of trace elements in...

Validation of the Cumulative or Replicate NAA Method
for the Determination of Trace Elements in Biological Materials
M. F. REIs, *'1 A. A. S. C. MACHADO, 2 M. ABDULLA, 3
J . CANARIO, 4 AND J . C. SILVA 1
'INETI- ICEN - DEEN, Sacavem, Portugal; 2Laquipai, Faculty of Science, University of Oporto, Portugal; 3Department of Clinical
Pharmacology and Therapeutics, Hamdard University, New Delhi, India; and 4Faculty of Science,
University of Lisbon, Portugal
ABSTRACT
To make the best use of time and facilities, a neutron activation system, fully automatic, including spectrum and data processing, to be used with short-lived nuclides, has been recently developed at the Portuguese Research Reactor (in Portuguese "Reactor Portugu6s de Investiga~o," RPI). Using this system, the cumulative neutron acti- vation analysis method is now being implemented. This article sum- marizes the experimental procedures used to validate the cumulative NAA method for the determination of selenium in biological samples, emphasizing the determination of the essential characteristics of pre- cision, accuracy, and limits of detection and of quantification of the method. The article also examines how detection limits and precision are improved when the samples are analyzed by this method com- pared to the cyclic activation measurements in use at RPI for the determination of selenium. The improvement is demonstrated for the measurement of selenium in several reference materials when the result obtained by adding up seven spectra of separate aliquots of the same sample is compared to the result from a cumulative spectrum of seven (whenever possible) consecutive cycles of a single sample.
*Author to whom all correspondence and reprint requests should be addressed.
Biological Trace Element Research Editor: G. N. Schrauzer �9 1994 by Humana Press Inc.
585

586 Reis et al.
Index Entries: Validation of analytical methods; cLm~ulative or replicate neutron activation analysis; human hair, blood, and diet samples; selenium; short-lived nuclides.
INTRODUCTION
Neutron activation analysis with short-lived nuclides has a great potential for the determination of a number of elements in a variety of sample matrices. The disadvantages are the fact that a number of ele- ments have no short-lived nuclides and the need for rather sophisticated irradiation and measurement equipment, if very short-lived nuclides are involved. The main advantages are: the possibility of repeating the analy- sis with the same sample in very few days or, sometimes, within a few hours or even minutes; the significant reduction of experimental time; the attainment of fast results; and, generally, better sensitivities and lim- its of detection than those offered by the corresponding long-lived nuclides under standardized experimental conditions (1-4).
The problems associated with the application of neutron activation analysis with short-lived nuclides to some samples of nutritional and clinical origin (particularly composite diets, foodstuffs, and blood sam- ples) are the result of background activity induced in the matrices. Sig- nal-to-background ratio can be significantly improved by using methods based on the principles of cyclic activation (1,5-7). Usually, in cyclic acti- vation, the sample is irradiated for a short period of time (relative to the half-life of the isotope of interest), rapidly transferred to the detector for counting (again for a short period of time), and the entire process repeated for a number of cycles. The activities detected at each counting period are summed to produce a cumulative spectrum over the total experimental time (5). However, the growth of the activity from radionu- clides with longer half-lives restricts the number of cycles that may be made before high backgrotmd-to-signal ratio occurs (8,9). Guinn (10) has shown that cumulative or replicate analysis, consisting of analyzing n aliquots of the same sample and accumulating the n spectra as a single cumulative spectrum improves considerably the precision and detection limits of single-sample analysis, even when n cyclic measurements of the single sample are performed. These procedures can be applied using the facilities available for cyclic instrumental NAA (CINAA) and do not require any additional expensive equipment.
To be able to use this method at the RPI, some improvements have been done at the recently developed neutron activation system (4) in use at RPI since 1990. The system is now fully automated, including spectrum and data-processing, and can be used routinely for the analysis of large amounts of samples. A detailed description will be given elsewhere (11).
When a new or modified analytical method is being considered for use in routine analysis of a large number of samples, it has to be sub- jected to a validation study, in order to demonstrate that the method is appropriate for the analysis of the matrices to which it will be applied and to gather preliminary information on precision, accuracy, and detec-

Validation of the Cumulative or Replicate NAA 587
tion limits of the method itself (12). The present study describes the experimental procedures to validate the cumulative or replicate NAA method at the RPI, since the method is intended to be used in routine determination of selenium (and, in the near future, of other trace ele- ments producing shortqived nuclides) in complement with and/or alter- native to cyclic activation analysis. This validation study is part of a quality-assurance program of trace element analysis in progress at RPI Laboratory for the application of INAA methods with short-lived nuclides. To demonstrate the better performance of the cumulative NAA method for the determination of selenium compared to cyclic activation analysis, results from measurements of selenium in several reference materials using both methods are also presented in this article.
MATERIAL AND M E T H O D S
S t a n d a r d s
Selenium and multielemental comparator standards were prepared by depositing microliter portions, containing microgram quantities, of ultrapure (Alpha Ventron Corp., Alpha Johnson Matthey Gmbh, Karls- mhe, Germany) solutions on a cellulose support, wetting them with ultrapure water to achieve homogeneity, and evaporating them to dry- ness at low heat under an infrared lamp. The standards were heat-sealed in small polyethylene vials (1.2 mL) and placed in medium-sized irradi- ation vials (7 mL), together with a second small vial, used as spacer to keep the sample in place and to prevent displacement of the sealed cap. The irradiation vial was then heat-sealed according to the procedure described elsewhere (4,13,14).
Reference Materials Samples of reference materials from NIST and IAEA, dried accord-
ing to the procedures recommended by the issuing agencies, were weighed into small polyethylene vials and prepared for irradiation fol- lowing the procedure described in the preceding section.
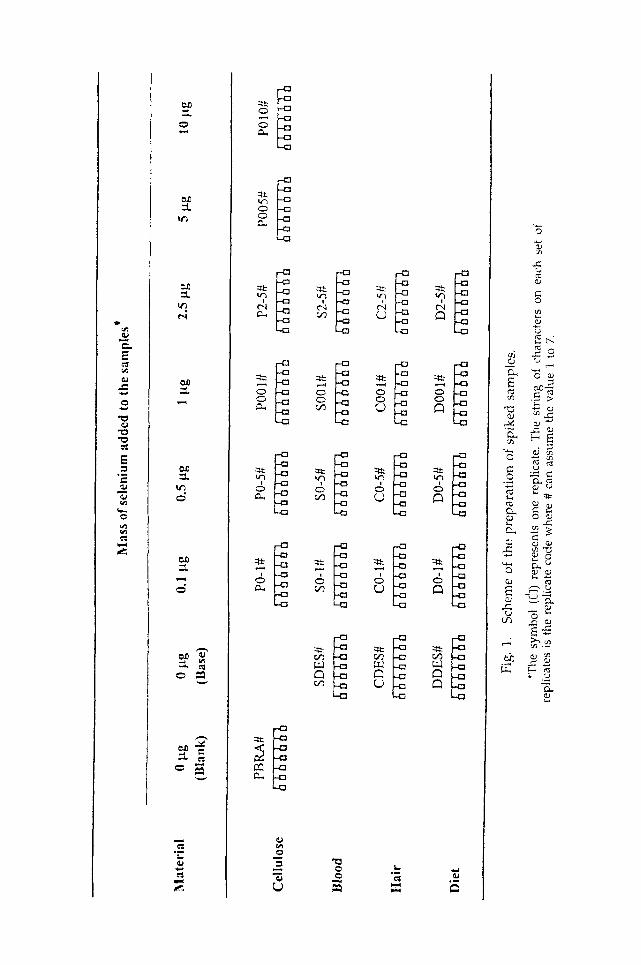
Sample Preparation Following the scheme shown in Fig. 1, three series of samples were
prepared (each series corresponding to a different type of matrix ex- pected to be analyzed by the cumulative method). The samples included homogenized and lyophilized composite daily diets, lyophilized human whole-blood samples, and samples of human hair, washed according to the protocol recommended by IAEA (15). Preparation of samples involved spiking substrates with known amounts of selenium, selected in order to cover the range of the element concentrations normally expected to be encoLmtered in the corresponding ~pe of matrix. Five dif- ferent concentration levels were obtained, the substrate itself being used as the lowest level. For each substrate, seven replicates of each concen-
:L
~ 0
v~q
t , .
oo
%
i
0
0
&
C ~
8
~j
~J
~j
t l . ~
�9
; !
r- ,
c j
b ~

Validation of the Cumulative or Replicate NAA 589
tration were prepared in a total of 35 replicates/sample. The "spikes" were microliter portions of ul trapure solutions, prepared at the same time for the standards (cellulose support) and containing known amounts of selenium, which were deposited into small vials containing substrate and evaporated to dryness at low heat under an infrared lamp. No special precautions were taken to ensure homogeneity of the spiked samples, since the inhomogeneity of the sample material is not a serious concern when using the cumulative NAA method (10).
Irradiations All samples and standards were irradiated in the RPI at a thermal
neutron flux of 1.9 x 10 12 n-cm-2.s-1 with 1 and 3% of epithermal and fast neutrons respectively. The neutron flux remains reasonably constant dur- ing sequential irradiations of large sets of samples meaning that the sam- pies and comparator standards can be irradiated separately. ~lb safeguard against unexpected changes of stability of the system during the analy- sis of a large set of samples, the same set of standards was irradiated after irradiation of a small number of samples (usually five or seven). The time between irradiation of standards was selected in such a way to allow them completely to decay before the next irradiation. The CINAA and cumulative NAA methods involved the following timing parame- ters: an irradiation time of 10 s, a decay time of 5 s, and a counting time of 10 s. The number of cycles was planned to be seven. However, because of growing background activity,, the maximum number of cycles used was restricted to four. For certain reference materials, such as Oyster Tis- sue, NIST-SRM-1566a, and Total Diet, NIST-SRM-1548, that number could not even be higher than two. The cumulative NAA method was applied with 7 replicates/sample.
Transfer and Counting Systems Routing of the samples and acquisition of the spectra are controlled
by the fully automatic neutron activation system in use at the RPI (4). The 7-ray spectrometer is a CANBERRA HPGe coaxial detector, model GC3518 (relative efficiency at 1.33 MeV, Co-60, 35%) coupled to an MCA, which is a board level product (CANBERRA AccuSpec/A) with emula- tion software. Spectral data are d u m p e d on floppy disks for off-line spec- tral analysis by SAMPO-90, a ,/-ray spectrum analysis program from CANBEI~RA. The 162-keV 7-ray of 77mSe (17.4 s) was used to determine the selenium content.
RESULTS AND DISCUSSION
For the validation of the method, all the replicates for all the sam- pies and concentrations, as well as several standard reference materials and standards of selenium were processed, in random order, seven times, on seven different days and by the same analyst. This procedure aimed

590 Reis et al.
at subjecting the me thod to all factors likely to affect it wi thout intro- ducing any between-analyst variance. For each sample and each concen- tration level, the mean concentrat ion and s tandard deviat ion were calculated based on the seven runs performed.
Precision of Cumulat ive NAA Method for Diet, Blood, and Hair Samples
From Fig. 2 it can be seen that the s tandard deviat ion varies wi th the se lenium level, over the ranges of concentrat ion studied, for all the matri- ces used in this work. In the case of diet, the function seems to be linear over the whole range, which means that the relative s tandard deviat ion (see Fig. 3) can be considered constant a round a mean value. However , more results wou ld be needed to establish this relationship unambigu- ously.
Concerning blood and particularly hair samples, the relative stan- dard deviat ion presents the expected variation at the low concentrat ion end. When higher concentrat ion levels are considered, def ined trends for constant values are evident. The plots of s tandard deviat ion vs mean concentrat ion can be used to interpolate the value of the s tandard devi- ation for any level of analyte that has not been covered in this work. They are particularly useful for the establishment of the limits of detec- tion and quantification, as will be demons t ra ted in the next section.
As normal ly observed, the relative s tandard deviat ion for blood and hair samples becomes nearly constant for the ranges of higher concen- trations. For the lower concentrat ion ranges, the absolute s tandard devi- ation is constant, so that the relative deviat ion appears to double for each half decrease in analyte concentration. The course of this variation is in agreement with that of the Horwitz curve (16) calculated for a wide vari- ety of analytes and different instrumental me thods of analysis.
Limits of Detection and Quantification
The Limit of detection is def ined by the American Chemical Society (ACS) (17,1.8) as the blank signal plus at least three times the s tandard deviat ion of the blank value. In analytical methods that use a spectral peak and that have no need of using blank samples, the blank may be est imated from the height of the background to the actual or expected peak. Its s tandard deviation m a y be based on the evaluation of the count- ing statistics (19). If, as is the case, the regression line "s tandard devia- tion vs analyte concentrat ion" is available for a particular matrix (see Fig. 2), the limit of detection may be calculated directly as three times the intercept (so) of this line (20).
The ACS guidelines define the limit of quantification as the blank signal p lus ten times the s tandard deviat ion of the blank. Based on the plot of s tandard deviat ion vs analyte concentration, this parameter can be s imply calculated by mul t ip lying the intercept of the line by ten. Table 1 shows the detection and quantification limits for the diet, blood, and hair samples s tudied by the cumulat ive NAA method in this work.

Validation of the Cumulative or Replicate NAA 591
Human hair
0.25 - -
~ 0.20
0.15
0 .10
~3 0.05
0.(30
. . . . . . . . . . . . . . . . . . i i , o , ,_o . , . ,_ , . . . . . . . . . . . . .
_~ / / . - - " "
0 1 2 3 4 5 6 7 8 9
�9 Exper imen ta l po in ts
- - y=O.O2+O.O7x r'=-O.g82
. . . . . . . . . . . y=O.O6"lnx + 0.095
10
Human blood
0.40. �84
A O.3O
0.25 L ...........
0.2O ~ . / ' ~
0.151 / "
o.~ l/,~" 0.00 k " , ,
0 2 ,4
p,.~. ........
I
�9 E~pedmental points
y=O.O3+O.O5x r=0 .987
. . . . . . . . . . y=O.O98' lnx + 0.0901
[ L i
5 8 10 12 t 4 16
Mixed human diet
o;3o T
J = 0 .20
~ o.15 t O.lO r .
' [ 0.05 - - y=O.O3+O,Olx r-=0.911
0.00 1 0 1 2 3 4 5 6 7
C o n c e n t r a t i o n ( u g l g )
Fig. 2. Variation of standard deviation with concentration for biological matrices analyzed by cumulative NAA method.
Accuracy To validate an analytical method, external quality assessment is
mandatory , since this is a sure means of detecting problems of bias that are difficult to identify by internal control measures. One of the most power fu l and convincLng ways to establish the reliability of an analytical

592 Reis et al.
Human hair
15
,
L
L !
10
J
9 8 7 6 5 4 3 2 1
x x
x •
10%N. "
-10 r,,.
-15
Human blood
12
)K
q
J
18 14 12 10 8 0 4 2
x 8
x
4
0
-4
• -8
-12
Mixed human diet
x
x.
•
•
g o
o ~
-a a
eJ - 9 n .
8 7 6 5 4 3 2 1 0
C o n c e n t r a t i o n ( u g / g )
Fig. 3. Variation of precision with concentration for biological matrices analyzed by cumulative NAA method.
me thod is by the use of suitable s tandard reference materials (SRM) (19). In this work, a n u m b e r of reference materials (nine) were analvzed for selenium, and the concentration values, based on the averages of seven determinat ions , were compared with certified values, whenever possible. As can be seen from Table 2 and Fig. 4, the agreement is generally good.

Validation of the Cumulative or Replicate NAA 593
Table 1 Limit of Detection and Limit of Quantification of Selenium for Biological
Materials Analyzed by Cumulative NAA Method
Sample material
Mixed human diet
Human blood
Human hair
Intercept s o LOD LOQ
0.026 0.078 0.26
0.025 0.075 0.25
0.018 0.054 0.18
Slight differences, from unity and zero respectively, shown by the slope and intercept of the "best" line fitted to the experimental points, merely represent a random variation. To confirm this a "confidence band" around the least-squares straight line was calculated. The theoretical line of unity slope and zero intercept lies within this confidence band mean- ing that, with the selected level of confidence (95%), the experimental slope and intercept are not significantly different from tmity and zero, respectively. Since the theoretical line is well centered in the band, the method can be considered unbiased.
Improvement in Precision and Detection Limits
The selenium contents of a number of SRMs, determined by CINAA and cumulative NAA methods, are given in Table 3. Each concentration value is the average of three independent determinations by CINAA, obtained with the indicated number of cycles, and of four determinations by the cumulative NAA method, with seven replicates for each material. Detection and quantification limits were calculated according to the methods described by Currie (21).
From Table 3, it can be seen that for most of the SRMs studied, the detection limits and precision of measurements improve in CINAA with an increasing number of cycles, as is often the case. However, it is also evident that the improvement is much more significant when the cumu- lative NAA method is used for the same material. As p red ic tedby Guinn (10), for most of the SRMs, precision and detection limits are improved by approximately a factor of nl/2, where n is the number of replicates used.
C O N C L U S I O N S
The work performed to validate the cumulative NAA method at RPI Laboratory, corresponds to a need for available realistic information on the main characteristics of this analytical method for the determination of selenium in three different biological matrices already being analyzed in our laboratory. The analysis of these samples is part of a nutritional s tudy in progress in a well-defined Portuguese population group of rural

594 Reis et al.
Table 2 Selenium content* of Reference Materials Analvzed
by Cumulative NAA Method
Reference Material This work Recommended value (~g/Z) (~g/z)
Mixed Human Diet IAEA-H-9 n.d. 0.11 + 0.01 Non-Fat Milk NIST-SRM-1549 n.d. 0.11 + 0.01 Powder Total Diet NIST-SRM-1548 0.24 + 0.02 0.25 Animal Muscle [AEA-H-4 0.33 + 0.01 0.28 + 0.03 Rice Flour NIST-SRM-1568 0.29 + 0.01 0.4 + 0.1 Bovine Liver NIST-SRM-1577a 0.71 +0.04 0.71 +0.07 Wheat Flour NIST-SRN-1567a 1.07 + 0. I 1.1 + 0.2 Fish Flesh " IAEA-MA-A-2 1.20 + 0.04 1.7 + 0.3 Oyster tissue NIST-SRM- 1566a 2.04 _+ 0.13 2.21 + 0.24 Albacore Tuna NIST-RM-50 4.3 +__ 0.28 3.6 + 0.4
*Content based on four determinations of seven replicates per reference material. n.d.: not detected.
4-L &
m
,,,'~x 2-- / _ ~ .
0 ~ i ! ~ i
0 1 2 3 4 t
5
Certified / Recommended value (ugJg)
Fig. 4. Selenium content in SRM.
workers, where the selenium content in the diets is k n o w n to be very low (13). After validation, one can establish whe ther our data, der ived f rom samples of the type of the matrices s tudied, have true quant i ta t ive va lue or whe the r they are main ly qualitative. The results of this s tudy are also very useful in val idat ing the working range of the analytical me thod con- f i rming the reliability of the me thod in the de te rmina t ion of se len ium for the matr ices involved. At present, similar work is unde r way to p roduce the same kind of results for other trace elements of nutri t ional impor-

Validation o f the Cumula t i ve or Repl icate N A A 595
"Fable 3 Precision, Accuracy, Detection, and Quantification Limits for Selenium
in Biological Reference Materials Analyzed by CINAA* and Cumulative or Replicate NAA Method
Reported # Mean :l: SD %SD LOD LOQ Reference Material value cycles
(~'W~ (~g/~ (%) ( ~ (~g/g)
Oyster tissue NIST-SRM-1566a 2.21 • 0 24
Rice Flour NIST-SRM- 1568 0.4 • 0 l
Bovine Liver NIST-SRM-1577a 0.71 4-0.07
Albacore Tuna NIST-RM-50 3.6 ~. 0 4
Fish Flesh IAEA-MA-A-2 1.7 • 0 3
Animal Muscle IAEA-H-4 0.28 • 03
Total Diet NIST-SRM- 1548 0.25
1 2.24+-0.30 13.4 0.239 1.010 2 2.25 _+0.16 7.2 0 168 0.629
Rep** 2.04_+.0.12 5.7 0.105 0.361
[ 0.32 4- 0.02 5.6 0.084 0.423 2 0.33 +- 0.01 1.6 0.053 0,231 3 0.36 :t: 0.02 5.3 0.048 0.190 4 0.35 4-0,02 5.6 0.038 0.147
Rep 0.29 4- 0.01 4.8 0.026 0.097
1 0.80+-0.06 7.3 0.129 0.643 2 0.74 4- 0.05 7 3 0.088 0.302 3 0.75 • 0.07 8.7 0.076 0.299 4 0.77 + 0.05 6.8 0.071 0,263
Pep 0.71 +0.04 5.2 0.049 0.178
1 4.60 4-0.16 3.6 0.158 0.792 2 4.36_+0.11 2.6 0.123 0.499 3 4.49 +0.I 1 2.4 0.103 0.395
Rep 4.32 :t:0.28 6.5 0.094 0.320
I 1.26+_0.15 12.3 0.165 0.841 2 1.16 4-0.01 0.8 0.122 0,507 3 1.21 • 5.1 0.100 0.393 4 1.21 _+0.07 5.7 0.08 ~) 0.335
Rep 1.20 + 0.04 3.2 0.066 0.240
1 0.31 • t0,4 0.104 0.582 2 0.31 • 0.04 12.7 0.076 0 335 3 0.30 • 0.04 I 1.7 0.064 0.264
Rep 0.33 • 3.3 0,040 0.13:
1 0.30 +_ 0.02 7.1 0.089 0.569 2 0.28 • 0.03 9.9 0.086 0.363
Rep 0.24 _ 0_02 9.5 0_049 O,17g
*Results obtained as average of three determinations with the indicated number of cycles.
**Rep: Results obtained by cumulative or replicate NAA method.
tance: copper, zinc, and manganese (22). The results will be publ i shed very soon.
REFERENCES
1. K. N. DeSilva and A. Chart, J. Trace Microprobe Tech. 1, 307-337 (1982-83). 2. A. Chatt and J. Holzebecher, Trans. Am. Nucl. Soc. 62, 220-222 (1990). 3. F. Grass, Trans. Am. NucI. Soc. 62, 220 (1990).

596 Reis et al.
4. M. E Reis and E. Martinho, J. Radioanal. Nucl. Chem., Articles 167, 39-44 (1993).
5. N. M. Spyrou, ]. Radioanal. Chem. 61, 211-242 (1981). 6. A. Chatt, K. N. DeSilva, J. Holzbecher, D. C. Stuart, R. E. Tout, and D. E.
Ryan, Can. J. Chem. 59, 1660-1664 (1981). 7. L. S. McDowell, P. R. Giffen, and A. Chatt, ]. Radioat~aI. Nucl. Chem. 100,
519-529 (1987). 8. S. J. Parry, J. Radioanal. Chem. 75, 252,-258 (1982). 9. G. Erdtmann and H. Petri, in Treatise on Analytical Chemistl]/, part I, vol. 14,
2nd ed. Wiley, (1986). 10. P. Guinn, Radiochem. Radioanal. Lett. 44, 133-138 (1980). 11. M. E Reis, A. A. S. C. Machado, and M. Abdulla, to be published. 12. J. P. Dux, in Handbook of Quality Assurance for the Analytical Chemistn d Labo-
ratory, Van Nostrand Reinhold, 1986. 13. M. E Reis, J. Holzbecher, E. Martinho, and A. Chatt, Biol. Trace Element Res.,
26/27, 629-635 (1990). 14. M. E Reis, Report LNETI/DEEN-R-91/22 (1991). 15. Yu. S. Ryabukhin, Report IAEA/RL/50, Vienna, Austria (1978). 16. W. Horwitz, L. Kamps, and K. W. Boyer, J. Assoc. Off. Chem. 63, 1344-1354
(1980). 17. American Chemical Society, Anat. Chem. 52, 2242-2249 (1980). 18. American Chemical Society, Anal. Chem. 55, 2210-2218 (1983). 19. R. M. Parr, Nutr. Res., Suppl. 1, 5-11 (1985). 20. A. A. S. C. Machado, in Controlo de Qualidade em Qufmica Analftica, MSc
Course, Faculdade de Ci~ncias, Porto (1991). 21. L. A. Cuttle, Anal. Chem. 40, 586-593 (1968). 22. M. Abdulla, PhD. dissertation, Lurid University, Sweden (1985).


![Renal Beh[ccedil]et's disease: A cumulative analysis](https://static.fdokumen.com/doc/165x107/63244bda03238a9ff60ad61e/renal-behccedilets-disease-a-cumulative-analysis.jpg)