
Validation of EMT Digital Twin Models for Dynamic Voltage ...
19
applied sciences Article Validation of EMT Digital Twin Models for Dynamic Voltage Performance Assessment of 66 kV Offshore Transmission Network Saran Ganesh 1 , Arcadio Perilla 1 , Jose Rueda Torres 1, * , Peter Palensky 1 and Mart van der Meijden 1,2 Citation: Ganesh, S.; Perilla, A.; Torres, J.R.; Palensky, P.; van der Meijden, M. Validation of EMT Digital Twin Models for Dynamic Voltage Performance Assessment of 66 kV Offshore Transmission Network. Appl. Sci. 2021, 11, 244. https://doi.org/10.3390/ app11010244 Received: 28 October 2020 Accepted: 18 December 2020 Published: 29 December 2020 Publisher’s Note: MDPI stays neu- tral with regard to jurisdictional clai- ms in published maps and institutio- nal affiliations. Copyright: © 2020 by the authors. Li- censee MDPI, Basel, Switzerland. This article is an open access article distributed under the terms and con- ditions of the Creative Commons At- tribution (CC BY) license (https:// creativecommons.org/licenses/by/ 4.0/). 1 Department of Electrical Sustainable Energy, Delft University of Technology, Mekelweg 4, 2628 CD Delft, The Netherlands; [email protected] (S.G.); [email protected] (A.P.); [email protected] (P.P.); [email protected] (M.v.d.M.) 2 TenneT TSO B.V., 6812 AR Arnhem, The Netherlands * Correspondence: [email protected] Abstract: The increase in Power Electronic (PE) converters due to the increase in offshore wind energy deployment have given rise to technical challenges (e.g., due to unprecedented fast dynamic phenomena) related to voltage and frequency stability in the power system. In the Offshore Wind Farms (OWFs), the currently available current injection-based voltage control for PE converters are not suitable for voltage control in PE dominated systems due to the absence of continuous voltage control and ineffectiveness during islanding. Moreover, in such power systems, the conventional controllers are not suitable for frequency control due to the absence of dynamic frequency control. The paper presents the Direct Voltage Control (DVC) strategy in a real-time environment to mitigate challenges related to voltage and frequency stability during islanding of OWFs. The control strategy is implemented in the average Electro-magnetic Transient (EMT) model of Type-4 Wind Generator (WG) in RSCAD ® Version 5.011.1. It is compared with the benchmark model of the control strategy in DIgSILENT PowerFactory TM 2019 SP2 (×64) in EMT platform. The comparison based on short- term voltage stability and reactive current injection reveals that both the models provide similar results, confirming the validation of the RSCAD model. Moreover, the detailed representation of the converters in the RSCAD model provides a better depiction of the real-world operation. Keywords: Direct Voltage Control; EMT; Offshore Wind Farm; digital twin model 1. Introduction To combat climate change, the production of greenhouse gas emissions must be reduced to significant levels and shift to the use of Renewable Energy Sources (RES) must be accomplished. In numbers, the European Union’s (EU) Nationally Determined Contribution (NDC) under the Paris Agreement is to reduce greenhouse gas emissions by at least 40% by 2030 when compared to 1990 [1]. RES are connected to the power system through Power Electronic (PE) converters. However, PE converters do not possess inherent inertial response characteristics. Until now, the integration of RES to the power system has not created major problems since the stability of the system is maintained by the synchronous machines in power plants. Traditionally, the inertia for the power system is provided by these synchronous machines connected to the network. However, an increase in RES in the future causes an increase in PE converter based generation units. Simultaneously, the synchronous machines in conventional power plants need to be disconnected from the network. This makes the power systems weak due to low short circuit power and low system inertia. Therefore, the consequence of disconnecting the synchronous generators leads to the requirement of the PE converter based generation units to take up the role of governing the stability of the power system. The major contributing source among the available RES is wind energy. Specifically, offshore wind energy is predicted to be the most significant source of energy among the Appl. Sci. 2021, 11, 244. https://doi.org/10.3390/app11010244 https://www.mdpi.com/journal/applsci
-
Upload
khangminh22 -
Category
Documents
-
view
1 -
download
0
Transcript of Validation of EMT Digital Twin Models for Dynamic Voltage ...

applied sciences
Article
Validation of EMT Digital Twin Models for Dynamic VoltagePerformance Assessment of 66 kV OffshoreTransmission Network
Saran Ganesh 1, Arcadio Perilla 1 , Jose Rueda Torres 1,* , Peter Palensky 1 and Mart van der Meijden 1,2
Citation: Ganesh, S.; Perilla, A.;
Torres, J.R.; Palensky, P.; van der
Meijden, M. Validation of EMT
Digital Twin Models for Dynamic
Voltage Performance Assessment of
66 kV Offshore Transmission
Network. Appl. Sci. 2021, 11, 244.
https://doi.org/10.3390/
app11010244
Received: 28 October 2020
Accepted: 18 December 2020
Published: 29 December 2020
Publisher’s Note: MDPI stays neu-
tral with regard to jurisdictional clai-
ms in published maps and institutio-
nal affiliations.
Copyright: © 2020 by the authors. Li-
censee MDPI, Basel, Switzerland.
This article is an open access article
distributed under the terms and con-
ditions of the Creative Commons At-
tribution (CC BY) license (https://
creativecommons.org/licenses/by/
4.0/).
1 Department of Electrical Sustainable Energy, Delft University of Technology, Mekelweg 4,2628 CD Delft, The Netherlands; [email protected] (S.G.); [email protected] (A.P.);[email protected] (P.P.); [email protected] (M.v.d.M.)
2 TenneT TSO B.V., 6812 AR Arnhem, The Netherlands* Correspondence: [email protected]
Abstract: The increase in Power Electronic (PE) converters due to the increase in offshore windenergy deployment have given rise to technical challenges (e.g., due to unprecedented fast dynamicphenomena) related to voltage and frequency stability in the power system. In the Offshore WindFarms (OWFs), the currently available current injection-based voltage control for PE converters arenot suitable for voltage control in PE dominated systems due to the absence of continuous voltagecontrol and ineffectiveness during islanding. Moreover, in such power systems, the conventionalcontrollers are not suitable for frequency control due to the absence of dynamic frequency control.The paper presents the Direct Voltage Control (DVC) strategy in a real-time environment to mitigatechallenges related to voltage and frequency stability during islanding of OWFs. The control strategyis implemented in the average Electro-magnetic Transient (EMT) model of Type-4 Wind Generator(WG) in RSCAD® Version 5.011.1. It is compared with the benchmark model of the control strategyin DIgSILENT PowerFactoryTM 2019 SP2 (×64) in EMT platform. The comparison based on short-term voltage stability and reactive current injection reveals that both the models provide similarresults, confirming the validation of the RSCAD model. Moreover, the detailed representation of theconverters in the RSCAD model provides a better depiction of the real-world operation.
Keywords: Direct Voltage Control; EMT; Offshore Wind Farm; digital twin model
1. Introduction
To combat climate change, the production of greenhouse gas emissions must bereduced to significant levels and shift to the use of Renewable Energy Sources (RES)must be accomplished. In numbers, the European Union’s (EU) Nationally DeterminedContribution (NDC) under the Paris Agreement is to reduce greenhouse gas emissions byat least 40% by 2030 when compared to 1990 [1].
RES are connected to the power system through Power Electronic (PE) converters.However, PE converters do not possess inherent inertial response characteristics. Until now,the integration of RES to the power system has not created major problems since the stabilityof the system is maintained by the synchronous machines in power plants. Traditionally,the inertia for the power system is provided by these synchronous machines connected tothe network. However, an increase in RES in the future causes an increase in PE converterbased generation units. Simultaneously, the synchronous machines in conventional powerplants need to be disconnected from the network. This makes the power systems weakdue to low short circuit power and low system inertia. Therefore, the consequence ofdisconnecting the synchronous generators leads to the requirement of the PE converterbased generation units to take up the role of governing the stability of the power system.
The major contributing source among the available RES is wind energy. Specifically,offshore wind energy is predicted to be the most significant source of energy among the
Appl. Sci. 2021, 11, 244. https://doi.org/10.3390/app11010244 https://www.mdpi.com/journal/applsci

Appl. Sci. 2021, 11, 244 2 of 19
North Sea countries by 2040 [2]. As a result, the deployment of offshore wind energytechnology is expected to grow further. With the increase in integration of offshore windenergy, the inherent characteristics of offshore wind energy conversion systems will affectthe nature of the power system. The vulnerable wind speed conditions due to the uncertainbehaviour of wind could lead to variations in the supply and demand, and therefore,fluctuations in voltages and frequency are bound to occur. Moreover, as the power systemsbecome weak due to the decommissioning of synchronous generators in conventionalpower plants that use non-renewable sources, the integration of offshore wind power plantsto such weak power systems pose various research challenges on the power system stability.
One of the challenges is related to voltage stability. The continuous variation in off-shore wind speed causes a constant change in the active power output of the offshore windpower plant. This could lead to an increase in the reactive power output and consequently,the voltage at the point of common coupling (PCC). The conventional current controlmethods using Proportional Integral (PI) controllers in the modern Wind Generators (WGs)are capable of providing voltage control by injecting reactive currents when connected to astrong network (SCR = SCMVA/P; where SCR is the Short Circuit Ratio, SCMVA is the ShortCircuit power of the network and P is the active power generation. If SCR = 100 to 250,it is a strong grid. If SCR = 5 to 25, it is a weak grid). However, these controllers are notsuitable for operation in highly PE converter dominated grids as the connected networkis weak and is not capable of absorbing the injected currents. Furthermore, during thescenario of islanding, voltage control by the conventional current controllers is ineffectivedue to the absence of continuous voltage control, and the deviation in voltage is not highenough to activate an effective voltage reduction mechanism. There are challenges in termsof frequency stability as well since the conventional current controllers in the WGs are notequipped to provide frequency control of the network during islanding.
The drawback of these control strategies with respect to parallel operation of convert-ers is that they require an already existing reference voltage. There are control strategiesthat create the reference voltage and are termed as voltage control strategies. One amongthe voltage control strategies is the V/F (voltage/frequency) control that is utilized foroperation in the islanded mode. The drawback with V/F control is that it is not equippedfor the parallel operation of various voltage forming converter units [3]. Therefore, thereneed to be new control strategies in the WGs that can create the reference voltage and workin parallel operation. Such control strategies are an emerging area of research and studiesare being performed in this regard. Few among the new control strategies are mentionedas follows:
• Virtual Synchronous Machines (VSM): The PE converter control is modelled with thecharacteristics of a synchronous machine in terms of inertia and voltage support bycorrespondingly deriving the equivalent equations [4–6].
• Modified Droop Control: This strategy is common for standalone grids, where theparallel operation of voltage forming units is developed recently using the f/P (fre-quency/active power) and V/Q (voltage/reactive power) droop controls similar tothe control in synchronous generators [7]. Few authors have named these droopcontrol concepts as Virtual Synchronous Machines Without Inertia (VSCM0H) [8].
• Direct Voltage Control (DVC): DVC is a representation of the conventional currentcontrol approach towards a voltage control. DVC allows for the direct control ofthe AC converter voltage which in turn varies the current injected by the converter[9,10]. This approach provides continuous voltage control both in steady-state anddynamic scenarios.
• Extended Current Control: The control is similar to the conventional current controlwith an additional inertia control in the outer control loop by using a synthetic inertiacontroller that gives a behaviour similar to that of a synchronous machine [11,12].
The major issue with conventional control is the wind up of the integrator that causesthe voltage to rise. This happens because the reference value of current remains non-zero and the measured current following islanding nearly falls to zero. In the Direct

Appl. Sci. 2021, 11, 244 3 of 19
Voltage Control (DVC) implemented in Reference [9], the integrator term is avoided, andthe proportional term is moved to the output end. This mitigates the above mentionedchallenges related to voltage and frequency control by providing continuous voltagesupport without a dead band, and by providing dynamic frequency control during steadystate and dynamic conditions of the network. Studies performed by I. Erlich et al. andA. Korai et al. in References [9,10] show appealing results of the implemented DVC forhighly PE dominated systems. The simulations are tested for different grids based onreal-world data and provide promising outcomes with effective voltage and frequencycontrol. Hence, with such proven results and available models, the DVC strategy waschosen to be incorporated for this work.
Traditionally, the transmission of power from Offshore Wind Farm (OWF) to theoffshore converter station uses a combination of 33 kV and 145 kV High Voltage AlternatingCurrent (HVAC) cables. The OWFs are connected to an Alternating Current (AC) offshoreplatform using 33 kV HVAC cables. The platform holds a power transformer that is usedto step-up voltage from 33 kV to 145 kV, and power is transferred from the AC platformto the offshore converter station using 145 kV HVAC cables [13]. However, the upcomingprojects are expected to have a higher voltage level of 66 kV for transmission to allow twicethe amount of power transferred compared to 33 kV. Therefore, this would only require 66kV HVAC cables to directly connect OWFs to offshore converter station, avoiding the useof an AC collector platform [14].
This paper implements the DVC from Reference [9] in a digital twin representation ofa 66 kV HVAC OWF network in RSCAD, and the performance of DVC is tested for highlysevere dynamic conditions in the network. Such a model is unique and goes beyond theprevious works performed in this direction [15]. The implementation of DVC in RSCADdepicts the real-world applicability of the control and the utilization of 66 kV HVACoffshore network is in line with the upcoming trend in offshore wind power transmission.Moreover, this model is the first important milestone in research for moving towards 2 GWmodels of offshore networks. Finally, the paper also compares and validates the RSCADmodel against a similar digital twin representation of a 66 kV HVAC network in DIgSILENTPowerFactory with the benchmark DVC model, under similar dynamic conditions.
The sections of the paper are arranged as follows. The layout of the digital twin modelin RSCAD is presented in Section 2. In Section 3, the implementation of DVC in the offshorenetwork in RSCAD is detailed. Section 4 presents the analysis of the dynamic performanceof the network in RSCAD. The digital twin representation of the model in PowerFactoryis examined in Section 5. The comparison of the RSCAD and PowerFactory models isdiscussed in Section 6. Section 7 concludes the paper.
2. Overview of the Digital Twin Model in RSCAD
A 66 kV offshore network, as shown in Figure 1 is developed in RSCAD. The networkconsists of the following components:
• An aggregated representation of ∼700 MW installed capacity OWF is modelled withthe following elements:
– Wind Generation System– High Pass filter (HPF) with series reactor– OWF transformer
• HVAC cables• External AC system

Appl. Sci. 2021, 11, 244 4 of 19
66/2kV,6MVA
Transformer-Scaleupto700MVA
0.9kV,6MVA
WindGeneratorMSCGSCSeriesReactor,L1
HighPassFilter
PCCBus
SourceBus
66kVHVACcable
ExternalACsystem
DCcircuitR L
COWF
PMSG
WG
Figure 1. Single line diagram of the 66 kV High Voltage Alternating Current (HVAC) offshore test network in RSCAD.
2.1. Aggregated OWF
The ∼700 MW offshore wind power is represented by a single OWF consisting of 116numbers of Type-4 WGs, each rated 6 MW connected in parallel. The aggregated modelconsists of PE components which require high switching frequency for operation, andhence has to be modelled for smaller time steps. For this purpose, the aggregated OWFconsisting of the PE converters are modelled in a small time step environment which hasa time step in the range of 1400–3750 ns in RSCAD [16]. The standard aggregated modelcontains the Permanent Magnet Synchronous Generator (PMSG), Machine Side Converter(MSC), Direct Current (DC) capacitors, chopper circuit, Grid Side Converter (GSC) andOWF transformer. An additional HPF with a series reactor is modelled at the output of theGSC, as illustrated in Figure 1 to mitigate harmonics content.
2.1.1. Wind Generation System
The wind generation system consists of PMSG, MSC, DC circuit and GSC. The EMTmodel of Type-4 WG with detailed modelling of MSC, DC circuit and GSC representedby three-level VSCs are utilized for this work. The basic models available in IEPG Sectionof Delft University of Technology, developed as a part of the MIGRATE project [17] isconsidered for this work. The control for GSC developed in Reference [18] is modified andimplemented in this paper. This is explained in detail in Section 3.1.
2.1.2. High Pass Filter (HPF) with Series Reactor
The switching operation of PE converters leads to generation of harmonics. Thereby,to mitigate these harmonics, filters are provided at the output of the GSC. There are varioustypes of filters available for this application. The common ones are the LCL filter, L filterand high pass filter [19]. In RSCAD, there is a HPF block readily available in the small timestep library, as shown in Figure 2 [16]. After the HPF parameters are calculated and set,then it would only be required to tune the inductance of the series reactor to limit the flowof current and thereby stabilizing the voltage. Hence, it was decided to go with HPF.
Figure 2. High Pass Filter in RSCAD.
Appl. Sci. 2021, 11, 244 5 of 19
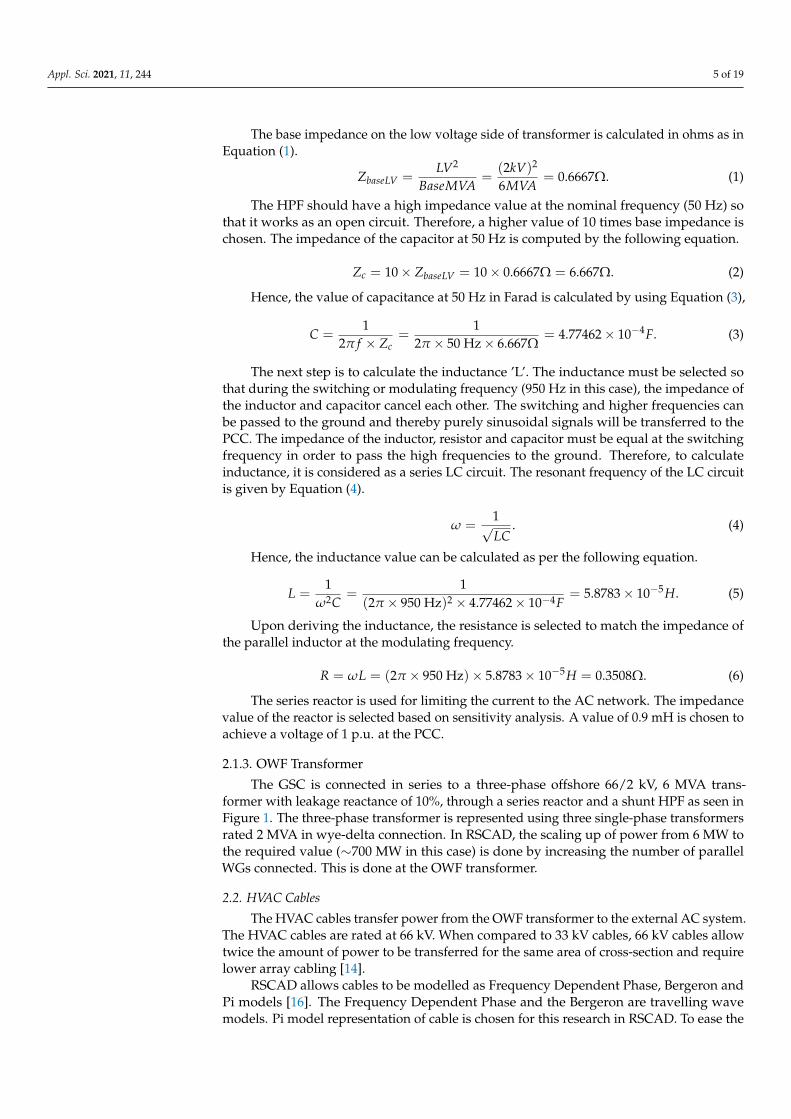
The base impedance on the low voltage side of transformer is calculated in ohms as inEquation (1).
ZbaseLV =LV2
BaseMVA=
(2kV)2
6MVA= 0.6667Ω. (1)
The HPF should have a high impedance value at the nominal frequency (50 Hz) sothat it works as an open circuit. Therefore, a higher value of 10 times base impedance ischosen. The impedance of the capacitor at 50 Hz is computed by the following equation.
Zc = 10× ZbaseLV = 10× 0.6667Ω = 6.667Ω. (2)
Hence, the value of capacitance at 50 Hz in Farad is calculated by using Equation (3),
C =1
2π f × Zc=
12π × 50 Hz× 6.667Ω
= 4.77462× 10⁻⁴F. (3)
The next step is to calculate the inductance ’L’. The inductance must be selected sothat during the switching or modulating frequency (950 Hz in this case), the impedance ofthe inductor and capacitor cancel each other. The switching and higher frequencies canbe passed to the ground and thereby purely sinusoidal signals will be transferred to thePCC. The impedance of the inductor, resistor and capacitor must be equal at the switchingfrequency in order to pass the high frequencies to the ground. Therefore, to calculateinductance, it is considered as a series LC circuit. The resonant frequency of the LC circuitis given by Equation (4).
ω =1√LC
. (4)
Hence, the inductance value can be calculated as per the following equation.
L =1
ω2C=
1(2π × 950 Hz)2 × 4.77462× 10−4F
= 5.8783× 10⁻⁵H. (5)
Upon deriving the inductance, the resistance is selected to match the impedance ofthe parallel inductor at the modulating frequency.
R = ωL = (2π × 950 Hz)× 5.8783× 10⁻⁵H = 0.3508Ω. (6)
The series reactor is used for limiting the current to the AC network. The impedancevalue of the reactor is selected based on sensitivity analysis. A value of 0.9 mH is chosen toachieve a voltage of 1 p.u. at the PCC.
2.1.3. OWF Transformer
The GSC is connected in series to a three-phase offshore 66/2 kV, 6 MVA trans-former with leakage reactance of 10%, through a series reactor and a shunt HPF as seen inFigure 1. The three-phase transformer is represented using three single-phase transformersrated 2 MVA in wye-delta connection. In RSCAD, the scaling up of power from 6 MW tothe required value (∼700 MW in this case) is done by increasing the number of parallelWGs connected. This is done at the OWF transformer.
2.2. HVAC Cables
The HVAC cables transfer power from the OWF transformer to the external AC system.The HVAC cables are rated at 66 kV. When compared to 33 kV cables, 66 kV cables allowtwice the amount of power to be transferred for the same area of cross-section and requirelower array cabling [14].
RSCAD allows cables to be modelled as Frequency Dependent Phase, Bergeron andPi models [16]. The Frequency Dependent Phase and the Bergeron are travelling wavemodels. Pi model representation of cable is chosen for this research in RSCAD. To ease the
Appl. Sci. 2021, 11, 244 6 of 19
goal of comparing the performance of models in two EMT softwares, which is explainedlater in this section, a Pi cable model was chosen.
2.3. External AC System
The external AC system represents the infinite grid connection and is modelled asan AC voltage source. The infinite grid is similar to the representation of a synchronousgenerator with high inertia constant. For a strong grid, typical values of inertia constant of5 MW/MVA2 depicting a synchronous generator is chosen from Reference [20]. The com-monly represented damping constant is the frequency-dependent load damping constant.However, the damping constant is zero in this case as no loads and a lossless machine isconsidered. Alternatively, for short circuit calculations, the reference parameters given inReference [21] can be chosen for representing an infinite grid. The parameters include shortcircuit power of 30 GVA and X/R of 10, where X/R = the amount of reactance X dividedby the amount of resistance R. The AC source voltage is rated at 66 kV.
3. Control Structures
The control strategies are implemented for the MSC, DC chopper and GSC of theType-4 WG. The conventional current control architecture is utilized in MSC control. Themajor area of interest for this paper is the control strategy of GSC. The DVC implementedin Reference [9] for a 33 kV network is implemented in the GSC for this work.
3.1. Implementation of DVC in RSCAD
The control strategy depicted in Reference [9] is achieved in RSCAD software. Thecontrol was implemented in RSCAD in Reference [18] for a 33 kV HVAC transmissionnetwork, but the final goal of achieving reactive current injection during severe dynamicconditions was lacking. The primary reason was due to the avoidance of the currentlimiter block that is explained later in this section. However, the block is implementedsuccessfully in this work, and the results are illustrated. Since RSCAD allows modelling ofthe secondary side of the transformer as required for one WG, the control loop parametersof GSC remain the same as 33 kV for a 66 kV offshore network and are based on thebenchmark values provided in Reference [22]. The parameters used for DVC is providedin Appendix A.
3.1.1. Reactive Power Control
From the control structure developed, as shown in Figure 3 and inspired byReference [9], it can be seen that, unlike in conventional current control, the reactivecurrent is not directly utilized for voltage control. The converter voltage is directly con-trolled here, and this allows the current to modify on its own according to varying networkconditions. This strategy is similar to the voltage control in conventional synchronous gen-erators. The reactive control loop consists of an outer loop based on a slow VAR controllerthat tracks the changes in set points required by the system-wide demand. The inner loopconsists of a fast-acting controller, as the name suggests, that responds towards crucialchanges in voltage where quick action is required [9].
Slow global VAR control: It is the upper-level controller and can be modelled as apower factor, reactive power or voltage controller. The reference values can be directlysent as inputs to the PI controller if the controller is made to use for reactive power orpower factor control. The voltage controller is used here, and this requires reactive powerreference (qPCC_re f ) to be determined from a predefined voltage versus reactive powerdroop characteristic. A voltage value for which the injection of reactive power is zero isobtained from this characteristic. The obtained reactive power reference output is providedas input to the PI controller having a small proportional gain (kQ) and ample time constant(TQ) in order to avoid transformer tap changes and not very fast in order to avoid unwantedcontroller interactions. The automatic adjustment of reactive power in relation to varyingvoltage using the proportional gain, (kQV) is significant. There is no dead band present

Appl. Sci. 2021, 11, 244 7 of 19
in order to ensure continuous voltage control. The proportional gain that represents thedroop can be obtained from the following relation,
kQV =∆q
∆VN, (7)
where ∆VN is the difference in reference and measured voltages, ∆q is the difference inreference and measured reactive powers at the PCC.
−𝑘𝑄𝑉+-
𝑉𝑁
𝑉𝑁_𝑟𝑒𝑓+-
𝑞𝑃𝐶𝐶
𝑞𝑃𝐶𝐶_𝑟𝑒𝑓
𝑞𝑚𝑎𝑥
𝑞𝑚𝑖𝑛
𝑘𝑄(1 +1
𝑇𝑄𝑠)
𝑆𝑡𝑜𝑝 𝑖𝑓 𝑉𝐺𝑆𝐶_𝑟𝑒𝑓 𝑙𝑖𝑚𝑖𝑡𝑒𝑑
+-
𝑉𝑃𝐶𝐶
𝑉𝑃𝐶𝐶_𝑟𝑒𝑓𝑘𝑉 −𝑥
𝑉𝐺𝑆𝐶𝑥𝑑_𝑚𝑎𝑥
−𝑉𝐺𝑆𝐶𝑥𝑑_𝑚𝑎𝑥
𝑖𝑞_𝑟𝑒𝑓 +- +
𝑉𝑃𝐶𝐶
𝑘𝑝(𝑠𝑇𝑤
1+𝑠𝑇𝑤)
𝑖𝑑 − 𝑖𝑑_𝑟𝑒𝑓
𝑉𝐺𝑆𝐶𝑑_𝑟𝑒𝑓
Slow global VAR control Fast local voltage control
Damping and transient
current limiting control
Figure 3. Reactive power control loop.
In theory, the proportional gain can be varied with changes in power flow. Butthis is not practically feasible and hence it is recommended to set the reactive powerreference based on load flow calculation in the network and corresponding optimumpower flow (OPF) calculations. The values could be updated at regular intervals. VN_re fcan be determined from qPCC_re f as,
VN_re f = −qPCC_re f
kQV+ VN , (8)
where VN is desired voltage and VN_re f is the voltage at which no reactive power injectionis required. The reactive power limits (qmax and qmin) are the continuous values in steadystate and can be computed from the P-Q diagram of the converter operation. The timeconstant is chosen in the range of 5–30 s wherein a value in the higher range tends tostabilize whereas a value in the lower range can cause interactions with other controllers.
The slow global VAR controller must be made inactive once the converter currentlimit is reached and also during cases of large voltage sags or swells by providing a signalto deactivate the controller. A scenario that could lead to the case mentioned above is athree-phase short circuit event. The output from the upper-level controller must be constantbecause of the chosen high integration time constant or must be limited by a blockingsignal [9].
Fast local voltage control: The voltage reference output (VPCC_re f ) received from theslow global VAR controller is provided as input to the fast local controller. This con-troller must be able to provide prompt support for grid voltage during the time of faults.The response of the controller in terms of voltage support must depend on local inputssensed at the PCC (VPCC) and not on quantities that need to be measured at remote placesusing a communication mechanism. A proportional gain (kV) is used for this purpose.The proportional gain can be obtained from the following relation [9],
kV =∆iq
∆VN, (9)
where ∆iq is the difference in reference and measured reactive currents at the PCC.

Appl. Sci. 2021, 11, 244 8 of 19
The primary control action is provided by the feed-forward term, x, which is thereactance of the PE converter (GSC). The voltage output obtained on multiplying thecurrent (iq_re f ) with x is the set point voltage of GSC in steady state. The reactive powercontrol loop parameters are provided in Table A1.
3.1.2. Active Power Control
The active power control is developed with the DC voltage, direct frequency controland Voltage Dependent Active Power Reduction (VDAPR) control, as shown in Figure 4inspired from Reference [9]. The control of active power is provided using the q-axiscomponent of GSC voltage as per the Equation (10). Theoretically, since the DC capacitorprovides the active power control, the DC energy barrier should be made higher whichis to be done by increasing the capacitor size and DC voltage when in comparison withthe conventional PI based current control [9]. However, considering the practical aspect,such an increase in capacitance is not incorporated for this work and the DC voltage is notincreased and is set at 4 kV. Another significant modification that was done is providingthe minimum limit, Va_lim_min, for the voltage measurement. A small value needs to be setfor this parameter in RSCAD software or else an error causing division by zero would bebound to occur during the start of the simulation.
𝑘𝑆(1 +1
𝑠𝑇𝑆)+
-
𝑉𝐷𝐶
𝑉𝐷𝐶_𝑟𝑒𝑓
𝑉𝑃𝐶𝐶
ƴ𝑝𝑟𝑒𝑓
−𝑥
𝑉𝐺𝑆𝐶𝑥𝑞_𝑚𝑎𝑥
0
𝑖𝑑_𝑟𝑒𝑓- +
𝑘𝑄(𝑠𝑇𝑤
1+𝑠𝑇𝑤)
𝑖𝑞 − 𝑖𝑞_𝑟𝑒𝑓
𝑉𝐺𝑆𝐶𝑞_𝑟𝑒𝑓
0
−𝑝𝑚𝑎𝑥
÷
𝑘𝑎1 + 𝑠𝑇𝑎
𝑉𝑎_lim _𝑚𝑖𝑛
𝑉𝑎_lim _𝑚𝑎𝑥
DC Voltage control
Damping and transient
current limiting control
𝑘𝑅𝑓
1 + 𝑠𝑇𝑅𝑓+-
𝑓𝑚𝑒𝑎𝑠
𝑓0
𝑃𝑐_𝑚𝑎𝑥
𝑃𝑐_𝑚𝑖𝑛
𝑠𝑇𝑈𝑣1 + 𝑠𝑇𝑈𝑣
𝐾𝑈𝑓𝑣
1 + 𝑠𝑇𝑈𝑓𝑣
𝑉𝑃𝐶𝐶
𝑃𝑢𝑓𝑣_𝑚𝑖𝑛
𝑃𝑢𝑓𝑣_𝑚𝑎𝑥
-- ×
++
ҧ𝑝
𝑝𝑛
Direct frequency control
Voltage Dependent Active Power Reduction
Figure 4. Active power control loop.
The active power is calculated as follows:
p = VPCCid = −VPCCVGSC_q
x, (10)
where VPCC is the voltage at PCC, id is the active current in the AC side of GSC and VGSC_qis the reactive component of voltage in the AC side of GSC.
The direct frequency control provides control in case of under frequency and overfrequency. The control is modelled to be activated when the frequency is above 50.2 Hzor below 49.8 Hz. The VDAPR control is provided to control the power injection capacityof the GSC. Since power cannot be injected to the network by the GSC during the timeof faults, the VDAPR allows in reducing the set point of reference power and therebyrefining the dynamic stability of the network. The active power control loop parametersare provided in Table A2.
Appl. Sci. 2021, 11, 244 9 of 19
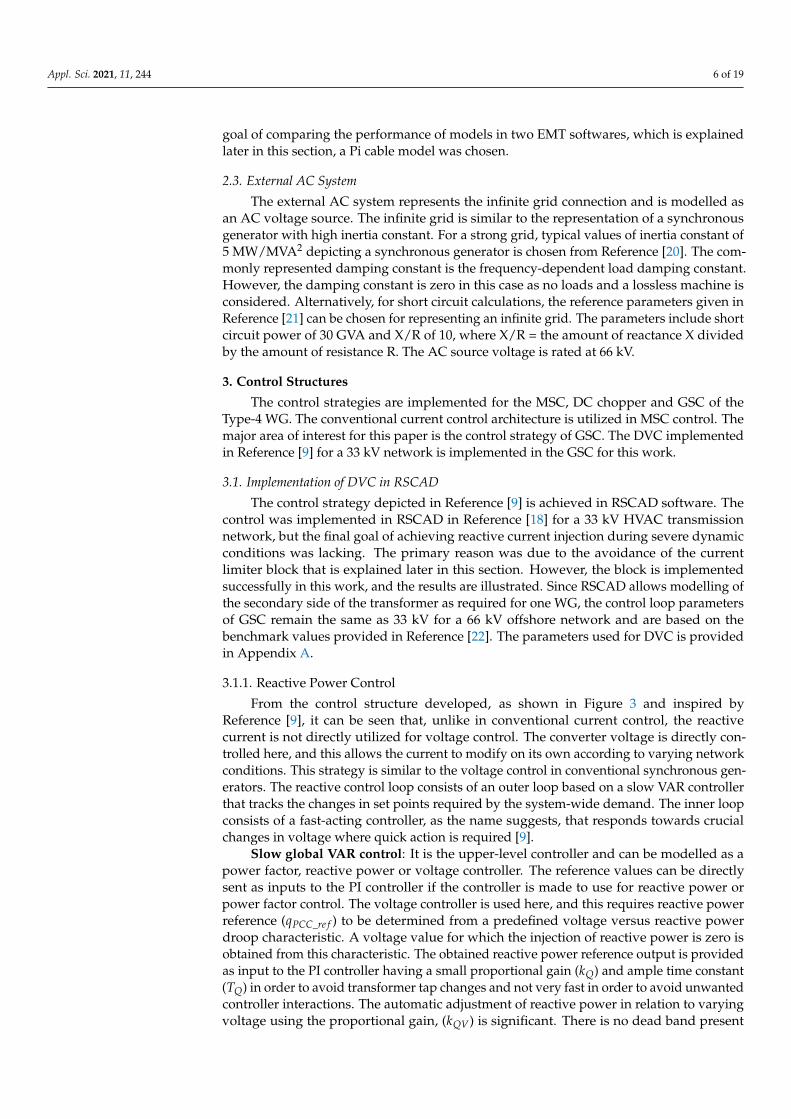
3.1.3. Current Limitation
The current limitation is an important block that protects the PE components fromdamage due to over current. A new maximum current (imax_re f ) value is computed when-ever the maximum current (imax0_re f ) of the PE converter is exceeded. The current limitationis incorporated in GSC based on Equations (11) and (12). The upper and lower limits foriq_re f and id_re f are calculated based on the grid impedance (shown as Priority in Figure 5)and the new maximum currents (id_re f _lim and iq_re f _lim) are computed. Once the referencelimits are computed, the converter voltage limits are calculated by Equation (13) or byEquations (14) and (15) [9].
If
(|id + jiq| − imax0_re f ) > 0 −→ imax_re f = imax0_re f − kred.(|id + jid| − imax0_re f ) (11)
elseimax_re f = imax0_re f . (12)
Limiter
Priority imax_ref
id_ref
iq_ref
id_ref_lim
iq_ref_lim
x
x
VGSCxq_max
VGSCxd_max
Figure 5. Current limitation algorithm in Grid Side Converter (GSC).
As long as the reference current is not limited,
VGSCxq_max = VGSCxd_max = x.imax_re f , (13)
else
VGSCxq_max = x.id_re f _lim (14)
VGSCxd_max = x.iq_re f _lim. (15)
The current limitation parameter for DVC is provided in Table A3.
3.1.4. Voltage Limitation
The AC voltage (VAC) of the GSC is generally limited by the DC (VDC) voltage value.The factor that brings the relationship between the AC and DC voltages is the modulationindex. The modulation index (m) is computed, as shown in Equation (16). The maximumvalue of the modulation index is set around to 1, and GSC voltage must be limited at thatpoint to avoid non-saturation of the GSC.
m =2√
2VAC√3VDC
. (16)

Appl. Sci. 2021, 11, 244 10 of 19
4. Analysis of the Dynamic Performance of 66 kV Test System
After the 66 kV system is modelled, it has to be tested for operation in steady-stateand dynamic conditions. The performance related to short-term voltage stability (faultoccurring for a span of 6–10 cycles accounting for 120–200 ms) and reactive power injectionby the DVC during the most severe dynamic situation in the network has to be analyzed.A three-phase short circuit in the middle of the HVAC cable is chosen to test the same.
4.1. Three-Phase Line to Ground Fault
A three-phase line to ground fault is applied at 0.5 s with a fault clearing time of140 ms. The voltage and frequency responses are plotted for a shorter period (0.3 s to1.3 s) to have a clearer view of the signals during the occurrence of an event. In the pre-faultcondition, the voltage is stabilized at nearly 1.04 p.u., as seen in Figure 6. The frequencyat the PCC computed by the Phase Locked Loop (PLL) is set to 50 Hz, and is shown inFigure 7. The OWF is generating nearly rated active power, that is, active current of nearly1 p.u. is provided by the GSC, as depicted by the green line in Figure 8. There is no reactivecurrent or reactive power injection by the GSC during this time, as seen from the purpleline in Figure 8.
0.3 0.4 0.5 0.6 0.7 0.8 0.9 1 1.1 1.2 1.3
Time (s)
0
0.2
0.4
0.6
0.8
1
1.2
PC
C V
olt
age
(pu
)
Voltage
Figure 6. Voltage at Point of Common Coupling (PCC) following a three phase fault in the middle of the cable.
During the time of the fault, the voltage drops at PCC as expected for a three-phaseline to ground fault. There is no significant drop in frequency since there are no loadsconnected to the OWF. Hence the frequency control does not get activated since deviationremains within 49.8 Hz and 50.2 Hz. DVC allows reactive current and hence reactive powerto be injected by GSC during the time of fault to support the voltage, as shown in Figure 8.The corresponding behaviour is a major requirement as per the grid codes during dynamicconditions, as mentioned in Reference [23]. At the same time, the active current and thusactive power is limited, and hence there is no generation from the OWF (Figure 8). As theactive power output from GSC reduces, the voltage across DC link increases in order tomaintain the power balance. The chopper gets activated when DC voltage goes beyond aparticular limit in order to protect the DC link from overvoltage. After the fault is cleared,the DVC allows for quick recovery, the voltage and powers return to the pre-fault values.
The spike in voltage, frequency and currents after the fault is released at 0.64 s isdue to the fast dynamics of DVC. Another important observation is the transients in thecurrents during the time of fault at 0.5 s in Figure 8. These are due to the dynamic effectsthat arise due to the exclusion of an integrator [9]. It can be controlled by proper tuning ofwashout filters.

Appl. Sci. 2021, 11, 244 11 of 19
0.3 0.4 0.5 0.6 0.7 0.8 0.9 1 1.1 1.2 1.3
Time (s)
49.96
49.98
50
50.02
50.04
50.06
50.08
PL
L F
req
uen
cy (
Hz)
Frequency
Figure 7. Frequency response synthesised by Phase Locked Loop (PLL) following a three phase fault in the middle ofthe cable.
0.3 0.4 0.5 0.6 0.7 0.8 0.9 1 1.1 1.2 1.3
Time (s)
-1
-0.5
0
0.5
1
1.5
2
2.5
Cu
rren
t (p
u)
Active current, Id
Reactive current, Iq
Figure 8. Active and reactive currents flowing to the network following a three phase fault in the middle of the cable.
4.1.1. Parameter Selection for Washout Filters
The damping during the transient process is ensured by the washout filters in thereactive power and active power control loops as seen in Figures 3 and 4 respectively.Parameter sensitivity analysis needs to be performed for the washout filters to ensure fastdamping of transients. The output of the washout filter for various proportional gains for astep response is depicted in Figure 9. The proportional gain represents values to whichthe output of the washout filter changes when there is a change in the input. The timeconstant represents the rate of this change. It can be seen that the output of the washoutfilter changes proportionally to the gain value specified and comes back to the initial valueafter a specific time, depending on the time constant mentioned.
Effect of this property of washout filter is observed in the active and reactive currents atthe PCC for a similar three-phase fault as performed in the previous section. Measurementsare recorded between 0.45 s to 0.65 s in Figures 10 and 11 for active and reactive currents,respectively to analyze the behaviour of transients. The proportional gain is set as 0.01,0.03 and 0.05 for comparison, keeping the time constant = 0.01 s for all the three cases. Itis observed that faster damping can be achieved for higher proportional gains. It makessense as the system would try to damp the transients to the maximum possible value inorder to have minimum fluctuations and also to limit interactions with other controllersduring this period. Thereby, it is worthy to conclude that choosing the right parameters forthe washout filter is one among the key factors in this control approach.

Appl. Sci. 2021, 11, 244 12 of 19
0.48 0.49 0.5 0.51 0.52 0.53 0.54 0.55 0.56 0.57
Time (s)
-0.05
-0.04
-0.03
-0.02
-0.01
0
0.01
Wa
sh
ou
t fi
lte
r o
utp
ut
Proportional Gain = 0.01
Proportional Gain = 0.03
Proportional Gain = 0.05
Figure 9. Output of a washout filter for different proportional gains for a step response.
0.45 0.475 0.5 0.525 0.55 0.575 0.6 0.625 0.65
Time (s)
-1
-0.5
0
0.5
1
1.5
2
Cu
rre
nt
(pu
)
Id: Gain = 0.01
Id: Gain = 0.03
Id: Gain = 0.05
Figure 10. Current in d axis following a three phase fault for proportional gains 0.01, 0.03 and 0.05.
0.45 0.475 0.5 0.525 0.55 0.575 0.6 0.625 0.65
Time (s)
-0.5
0
0.5
1
1.5
2
2.5
Cu
rre
nt
(pu
)
Iq: Gain = 0.01
Iq: Gain = 0.03
Iq: Gain = 0.05
Figure 11. Current in q axis following a three phase fault for proportional gains 0.01, 0.03 and 0.05.

Appl. Sci. 2021, 11, 244 13 of 19
5. Overview of the Digital Twin Model in PowerFactory
The 66 kV offshore network is modelled in PowerFactory as shown in Figure 12. Thenetwork consists of the following components:
• A simplified model of Full Scale Converter (FSC) based Type-4 WG system consistingof the following elements:
– DC circuit– GSC
• HPF with series reactor• OWF transformer• HVAC cables• External AC system
66/2kV,750MVATransformer
0.69kV,750MVA
WindGenerator
PCCBus
SourceBus
66kVHVACcable
ExternalACsystem
FSCBus MSCGSC
DCcircuit
SimplifiedModel
Noscalingrequired
HighPassFilter
R L
C
SeriesReactor,L1
PMSG
WG
Figure 12. Single line diagram of the 66 kV HVAC offshore test network in PowerFactory.
5.1. Simplified FSC Based WG System
The wind turbine and MSC are simplified since they do not contribute to the dynamicsof the network. GSC is modelled in detail. A constant injection of active current is proposedfrom the MSC to the DC side [9]. Hence it is modelled as a DC current source. The WGunit is represented as a static generator model with 750 MVA nominal apparent power. It ismade to operate with constant reactive power (Q) control in order to achieve the activeand reactive power set points same as in RSCAD model. The active power flow is set to∼700 MW, similar to the RSCAD model.
5.1.1. DC Circuit
The DC circuit is detailed, and the voltage across the capacitor is set to 4 kV, sameas the RSCAD model. The chopper activation control is provided when the DC voltagecrosses a minimum set value.
5.1.2. GSC
Unlike the RSCAD model, a two-level GSC is utilized in this model. The PWM is notused in this model, and the GSC is modelled as a controlled voltage source. This is oneamong the major difference with the RSCAD model.
5.2. HPF with Series Reactor
The shunt filter available in the PowerFactory drawing toolbar is chosen. The valuesfor R, L and C are chosen the same as mentioned in Section 2.1.2. A common impedanceelement available in the drawing tool is chosen for the series reactor and is connected atthe output of GSC, as shown in Figure 12. The inductance value chosen is the same as theRSCAD model to have an equal impedance for both the models.

Appl. Sci. 2021, 11, 244 14 of 19
5.3. OWF Transformer
A two winding transformer available in the equipment library folder of DIgSILENTlibrary is used. The transformer is rated 66/2 kV, 750 MVA with a wye-delta configurationto block zero sequence currents. The leakage inductance and resistance of the transformerare set the same as the RSCAD model.
5.4. HVAC Cables
The cables are rated at 66 kV same as the RSCAD model. The cable is modelled fromthe “Cables” section available in the equipment library in DIgSILENT library. The type ofmodel is chosen to be the Pi model. Pi model is utilized as it is easier to input the cableparameters in terms of RLC in both RSCAD and PowerFactory.
5.5. External AC System
The external AC system in PowerFactory also represents an infinite grid. Similar tothe model in RSCAD in Section 2.3, the infinite grid is modelled as an AC voltage sourcerated 66 kV.
5.6. Control Structures
As mentioned in Section 5.1, the wind turbine and MSC models utilized are simplifiedand is made to inject constant active current to the DC circuit. Hence, the control of MSCand wind turbine is not required to be modelled. However, control structures are detailedfor the DC circuit and the GSC. The chopper is made to activate beyond a particular voltagelimit and the benchmark model of DVC from Reference [22] is utilized here for the GSC.
6. Comparison of Models in RSCAD and PowerFactory
The major differences between the 66 kV HVAC network built in RSCAD and Power-Factory are illustrated in Table 1.
Table 1. Differences in models in RSCAD and PowerFactory.
Parameters RSCAD PowerFactory
WG model PMSG Simplified (Constant power model)MSC control Conventional current control Not modelledGSC model VSC with PWM Controlled Voltage Source with no PWM
Generated active power from WG 6 MW ∼700 MWScaling factor at transformer 116 (cf. Section 2.1.3) Not applicable
Representation of GSC: One of the differences in both models is the usage of averagemodel representation of VSC with PWM in RSCAD for the GSC, whereas a controlledvoltage source model is utilized in the PowerFactory model.
Scaling of power: Another significant difference between the two models is that thecomponents connected to the secondary side of the transformer are modelled for one WGof 6 MW in RSCAD whereas it is directly modelled for ∼700 MW in PowerFactory. Thescaling of power to ∼700 MW in RSCAD is done at the 66/2 kV OWF transformer, asmentioned in Section 2.1.3. This helps in modelling and analysis in the real world in termsof single WG.
However, it must be noted that these differences do not affect the performance of thecontrol operation, and both the models have equal impedances that makes the compari-son significant.
6.1. Selection of Time Step in RSCAD and PowerFactory
Before the start of the simulation, a specific time step value suitable for both theRSCAD and PowerFactory models need to be set. For RSCAD software, the ratio of largetime step to small time step needs to higher than 12 if NovaCor processor is used. Since the
Appl. Sci. 2021, 11, 244 15 of 19
small time step is chosen to be 2500 ns for the RSCAD model, as mentioned in Section 2.1, avalue of 50 µs is chosen for the large time step. The PowerFactory model is also initializedwith 50 µs time step.
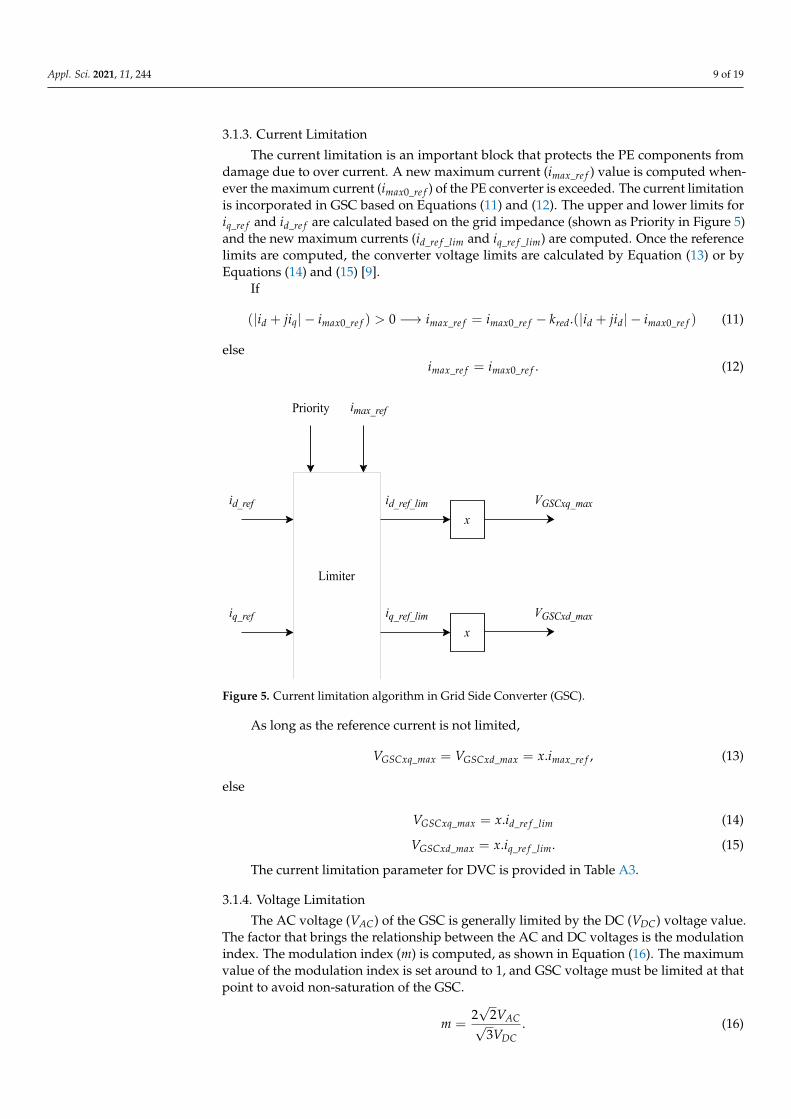
6.2. Event Comparison in RSCAD and PowerFactory
The 66 kV offshore network model in RSCAD and PowerFactory are compared fora three-phase line to ground fault in the middle of the cable. A fault is applied at 0.5 swith a clearing time of 140 ms. The resulting voltage and current waveforms are as shownin Figures 13–15 respectively. As can be observed in Figure 13, the voltage measured atPCC drops and the generation is stopped during the fault period. The voltage profile isthe same in RSCAD and PowerFactory models during the pre-fault, fault and post faultconditions as can be observed. The drop in voltage in both the graphs is the same due toequal impedance in both the models.
0.3 0.4 0.5 0.6 0.7 0.8 0.9 1 1.1 1.2 1.3
Time (s)
0
0.2
0.4
0.6
0.8
1
1.2
PC
C V
olt
ag
e (
pu
)
Voltage in RSCAD
Voltage in PowerFactory
Figure 13. Voltage measured at PCC for a three phase fault in the middle of the cable in RSCAD and PowerFactory.
Due to the unavoidable modelling differences in the software packages, currents aremeasured at PCC bus for the RSCAD model and at FSC bus for the PowerFactory model.However, this does not affect the magnitude as the currents are measured in per unit.The currents in both the models have a similar profile, as summarized for the d-axis inFigure 14 and q-axis in Figure 15. The active and reactive currents generated by the WGhave the same set points in both the models during the pre-fault condition, confirmingthat the power flow in both the models is similar. As the parameters for DVC is samefor both the models, reactive power injection in RSCAD model during the time of fault isachieved similar to the PowerFactory model. The transients occurring during the time offault at 0.5 s can be damped by controlling the parameters of the washout filters, as seenin Section 4.1.1.
Spike in the profiles at the time of fault clearance at 0.64 s is due to fast dynamics ofPLL in both software packages. It is observed that the currents in RSCAD model have slighttransients throughout the simulation. This is due to the detailed model representation ofGSC in RSCAD when compared to a simplified representation in PowerFactory. Therefore,it can be concluded that the RSCAD model with the implemented DVC provides similarresults as the benchmark PowerFactory model. Moreover, the results from RSCAD modelare more detailed and hence can be used as a base model for reference as it provides abetter representation of the real-world operation.
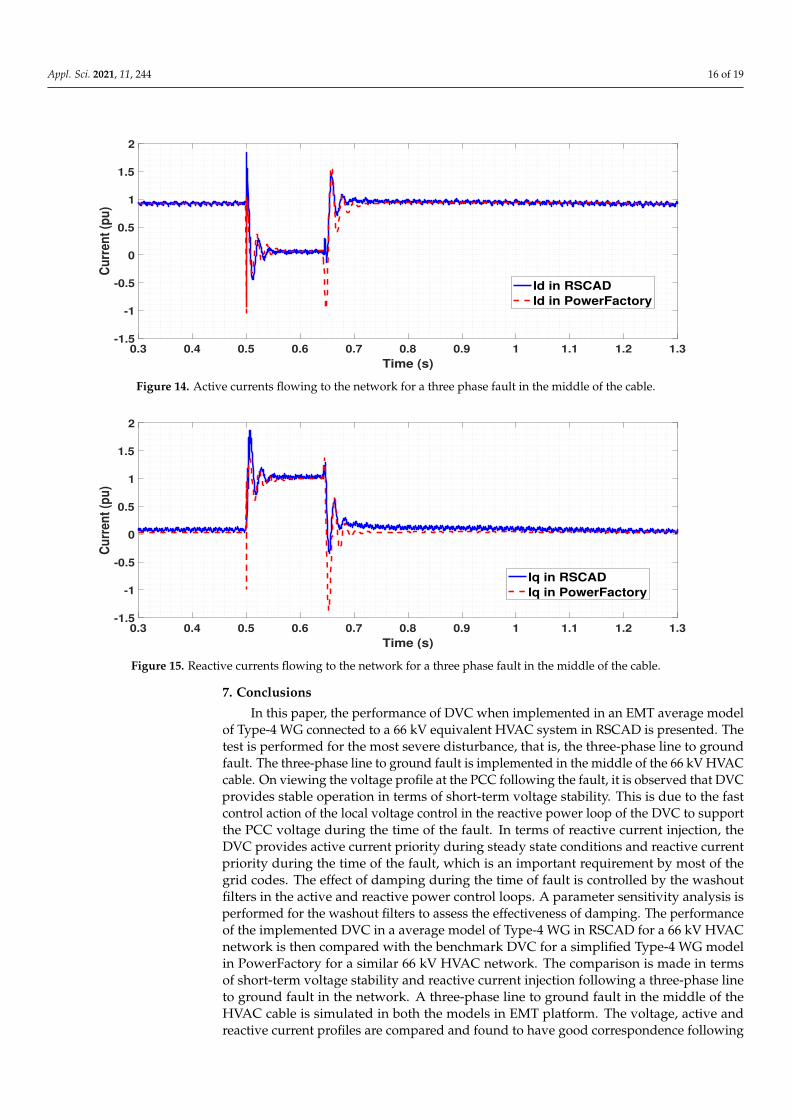
Appl. Sci. 2021, 11, 244 16 of 19
0.3 0.4 0.5 0.6 0.7 0.8 0.9 1 1.1 1.2 1.3
Time (s)
-1.5
-1
-0.5
0
0.5
1
1.5
2
Cu
rre
nt
(pu
)
Id in RSCAD
Id in PowerFactory
Figure 14. Active currents flowing to the network for a three phase fault in the middle of the cable.
0.3 0.4 0.5 0.6 0.7 0.8 0.9 1 1.1 1.2 1.3
Time (s)
-1.5
-1
-0.5
0
0.5
1
1.5
2
Cu
rre
nt
(pu
)
Iq in RSCAD
Iq in PowerFactory
Figure 15. Reactive currents flowing to the network for a three phase fault in the middle of the cable.
7. Conclusions
In this paper, the performance of DVC when implemented in an EMT average modelof Type-4 WG connected to a 66 kV equivalent HVAC system in RSCAD is presented. Thetest is performed for the most severe disturbance, that is, the three-phase line to groundfault. The three-phase line to ground fault is implemented in the middle of the 66 kV HVACcable. On viewing the voltage profile at the PCC following the fault, it is observed that DVCprovides stable operation in terms of short-term voltage stability. This is due to the fastcontrol action of the local voltage control in the reactive power loop of the DVC to supportthe PCC voltage during the time of the fault. In terms of reactive current injection, theDVC provides active current priority during steady state conditions and reactive currentpriority during the time of the fault, which is an important requirement by most of thegrid codes. The effect of damping during the time of fault is controlled by the washoutfilters in the active and reactive power control loops. A parameter sensitivity analysis isperformed for the washout filters to assess the effectiveness of damping. The performanceof the implemented DVC in a average model of Type-4 WG in RSCAD for a 66 kV HVACnetwork is then compared with the benchmark DVC for a simplified Type-4 WG modelin PowerFactory for a similar 66 kV HVAC network. The comparison is made in termsof short-term voltage stability and reactive current injection following a three-phase lineto ground fault in the network. A three-phase line to ground fault in the middle of theHVAC cable is simulated in both the models in EMT platform. The voltage, active andreactive current profiles are compared and found to have good correspondence following

Appl. Sci. 2021, 11, 244 17 of 19
the three-phase line to ground fault. This shows the validation of the DVC implementedin the average model of the Type-4 WG for a 66 kV HVAC offshore network in RSCAD.Moreover, it is observed that the model developed in RSCAD has slight transients in theactive and reactive currents throughout the simulation. This is due to the detailed modelrepresentation of GSC in RSCAD when compared to the simplified model in PowerFactory.These results show that the RSCAD model provides a better detailed representation of thereal-world operation of the implemented DVC and can be used as a reference model. Theway DVC is modelled to provide voltage support during the time of fault in 66 kV HVACnetwork are in line with the results from previous studies, in which DVC is implemented fora 33 kV HVAC network as explained in Reference [9]. As an extension of this research, theDVC can be implemented for single-phase faults by developing a negative sequence controlloop. The study can be extended for Type-3 WGs which consist of the Double Fed InductionGenerator (DFIG) and selective fault analysis can be performed. Due to the increasingdemand for offshore wind energy, the expansion to create large scale offshore networks(greater than or equal to 2 GW) with implemented DVC also needs to be investigated asfuture work.
Author Contributions: Conceptualization, S.G., A.P. and J.R.T.; formal analysis, S.G., A.P. and J.R.T.;investigation, S.G., A.P. and J.R.T.; methodology, S.G., A.P. and J.R.T.; resources, S.G., A.P. and J.R.T.;software, S.G., A.P. and J.R.T.; supervision, J.R.T., A.P., P.P. and M.v.d.M.; validation, S.G., A.P. andJ.R.T.; visualization, S.G., A.P. and J.R.T.; writing—original draft, S.G., A.P. and J.R.T.; writing—review& editing, S.G., A.P., J.R.T., P.P. and M.v.d.M. All authors have read and agreed to the publishedversion of the manuscript.
Funding: This research received no external funding.
Informed Consent Statement: Not applicable.
Data Availability Statement: Data sharing not applicable.
Acknowledgments: This research was fully funded by Delft University of Technology. The authorsthank the experts and technical support staff of RTDS Technologies Inc. and DIgSILENT GmbH forthe insightful discussions during the execution of this research.
Conflicts of Interest: The authors declare no conflict of interest. The funders had no role in the designof the study; in the collection, analyses, or interpretation of data; in the writing of the manuscript, orin the decision to publish the results.
Appendix A
Table A1. Parameters of reactive power control loop in DVC.
Parameters Description Unit Value
kQV Static gain for slow global reactive power control p.u. 6.6qmax/min Maximum/minimum reactive power p.u. 0.31
kQSlow global reactive power control proportional
gain p.u. 0.002
TQSlow global reactive power control integral time
constant s 15
kV Fast local voltage control proportional gain p.u. 0.2x Converter reactance p.u. 0.1
kP Washout filter proportional gain p.u. 0.05Tw Washout filter time constant s 0.01
VGSCxq_max Maximum q-axis converter control voltage

Appl. Sci. 2021, 11, 244 18 of 19
Table A2. Parameters of active power control loop in DVC.
Parameters Description Unit Value
kS DC voltage control proportional gain p.u. 1TS DC voltage control integral time constant p.u. 0.1kR f Proportional gain for direct frequency control p.u. 1TR f First order delay for direct frequency control s 0.2
TUv
Washout time constant for the voltage dependent active powerreduction s 60
kU f v Proportional gain for voltage dependent active power reduction p.u. 2
TU f vFirst order delay for the voltage dependent active power
reduction s 0.005
x Converter reactance p.u. 0.1kQ Washout filter proportional gain p.u. 0.05Tw Washout filter time constant s 0.01Ta Voltage measurement delay s 5
Deadband for direct frequency control Hz 0.2Deadband for voltage dependent active power reduction p.u. 0.1
VGSCxd_max Maximum d-axis converter control voltage
Table A3. Parameters of current limitation in DVC.
Parameters Description Unit Value
kred Gain for current limitation p.u. 1.2
References1. UNFCCC. Adoption of the Paris agreement. COP. In Twenty-First Session of Conference of the Parties, Paris, France, 30 November–11
December 2015; UNFCCC: Rio de Janeiro, Brazil, 2015; Volume 30.2. Ecofys. Translate COP21: 2045 Outlook and Implications for Offshore Wind in the North Seas; Technical Report; Ecofys: Utrecht,
The Netherlands, 2017.3. Weise, B.; Korai, A.; Constantin, A. Comparison of Selected Grid-Forming Converter Control Strategies for Use in Power
Electronic Dominated Power Systems. In Proceedings of the 18th Wind Integration Workshop, Dublin, Ireland, 16–18 October2019; pp. 16–18.
4. Markovic, U.; Chu, Z.; Aristidou, P.; Hug, G. LQR-Based Adaptive Virtual Synchronous Machine for Power Systems with HighInverter Penetration. IEEE Trans. Sustain. Energy 2018, 10, 1501–1512. [CrossRef]
5. Duckwitz, D.; Welck, F.; Glöckler, C. Operational Behavior of the Virtual Synchronous Machine. In Proceedings of theEnergiewende in der Stromversorgung—Systemstabilität und Systemsicherheit—12. ETG/GMA-Tagung “Netzregelung undSystemführung”, Berlin, Germany, 26–27 September 2017.
6. Lu, L.; Cutululis, N.A. Virtual synchronous machine control for wind turbines: a review. J. Phys. Conf. Ser. 2019, 1356, 012028.[CrossRef]
7. Bouzid, A.E.M.; Sicard, P.; Yamane, A.; Paquin, J.N. Simulation of droop control strategy for parallel inverters in autonomous ACmicrogrids. In Proceedings of the 2016 8th International Conference on Modelling, Identification and Control (ICMIC), Algiers,Algeria, 15–17 November 2016; pp. 701–706.
8. Yu, M.; Roscoe, A.J.; Booth, C.D.; Dysko, A.; Ierna, R.; Zhu, J.; Urdal, H. Use of an inertia-less Virtual Synchronous Machinewithin future power networks with high penetrations of converters. In Proceedings of the 2016 Power Systems ComputationConference (PSCC), Genoa, Italy, 20–24 June 2016; pp. 1–7.
9. Korai, A.W. Dynamic Performance of Electrical Power Systems with High Penetration of Power Electronic Converters: Analysisand New Control Methods for Mitigation of Instability Threats and Restoration. Ph.D. Thesis, Universität Duisburg-Essen,Duisburg, Germany, 2019. [CrossRef]
10. Erlich, I.; Korai, A.; Neumann, T.; Koochack Zadeh, M.; Vogt, S.; Buchhagen, C.; Rauscher, C.; Menze, A.; Jung, J. New Control ofWind Turbines Ensuring Stable and Secure Operation Following Islanding of Wind Farms. IEEE Trans. Energy Convers. 2017,32, 1263–1271. [CrossRef]
11. Duckwitz, D. Derivation of Requirements and Comparison of Inertia Emulation Methods for Converter-based Power PlantsPowerSystem Inertia. Ph.D. Thesis, Universität Kassel, Kassel, Germany, 2019. [CrossRef]
12. Liu, X.; Lindemann, A. Control of VSC-HVDC Connected Offshore Windfarms for Providing Synthetic Inertia. IEEE J. Emerg. Sel.Top. Power Electron. 2017, 6, 1407–1417. [CrossRef]
13. Abdelwahed, M.A.; El-Saadany, E.F. Power Sharing Control Strategy of Multiterminal VSC-HVDC Transmission SystemsUtilizing Adaptive Voltage Droop. IEEE Trans. Sustain. Energy 2016, 8, 605–615. [CrossRef]

Appl. Sci. 2021, 11, 244 19 of 19
14. DNV.GL. 66 kV Systems for Offshore Wind Farms; Technical Brochure; DNV.GL: Arnhem, The Netherlands, 2015.15. Lozada Ayala, P. Dynamic System Performance Analysis of a Novel Grid Connection Topology for Offshore Wind Farms Using
MMC-HVDC Transmission. 2018. Available online: https://repository.tudelft.nl/islandora/object/uuid%3Abfd0ac94-fc5b-46e4-a049-742c5249138a (accessed on 27 December 2020).
16. RTDS Technologies Inc. RSCAD Modules. Available online: https://knowledge.rtds.com/hc/en-us/articles/360037537653-RSCAD-Modules (accessed on 27 December 2020).
17. The MIGRATE Project, A EU-Funded Project Under the Framework of European Union’s HORIZON 2020. 2020. Availableonline: https://www.h2020-migrate.eu/#:~:text=The%20MIGRATE%20Project&text=MIGRATE%20stands%20for%20Massive%20InteGRATion,especially%20in%20future%20faced%20with. (accessed on 27 December 2020).
18. Sethi, S. Real-Time Implementation for Gird Forming Control of Type-4 Wind Turbine to Mitigate Voltage and FrequencyInstabilities in High Renewable Penetration. Master’s Thesis, NTNU, Trondheim, Norway, 2019.
19. Beres, R.N.; Wang, X.; Liserre, M.; Blaabjerg, F.; Bak, C.L. A Review of Passive Power Filters for Three-Phase Grid-ConnectedVoltage-Source Converters. IEEE J. Emerg. Sel. Top. Power Electron. 2016, 4, 54–69. [CrossRef]
20. Kothari, D.P.; Nagrath, I. Modern Power System Analysis; Tata McGraw-Hill Education: New Delhi, India, 2003.21. Guide for the Development of Models for HVDC Converters in a HVDC Grid. Technical Brochure, CIGRE Working Group B4.57.
2014. Available online: https://e-cigre.org/publication/604-guide-for-the-development-of-models-for-hvdc-converters-in-a-hvdc-grid (accessed on 27 December 2020).
22. Erlich, I.; Korai, A. Description, Modelling and Simulation of a Benchmark System for Converter Dominated Grids (Part I). 2018.Available online: https://www.digsilent.de/en/faq-reader-powerfactory/do-you-have-an-example-of-a-fault-tolerant-power-system-with-98-share-of-renewables.html (accessed on 27 December 2020).
23. Mohseni, M.; Islam, S.M. Review of international grid codes for wind power integration: Diversity, technology and a case forglobal standard. Renew. Sustain. Energy Rev. 2012, 16, 3876–3890. [CrossRef]