COMBUSTION ENGINE DIGITAL TWIN DEVELOPMENT AND ...
79
i UNIVERSITY OF SPLIT FACULTY OF ELECTRICAL ENGINEERING, MECHANICAL ENGINEERING AND NAVAL ARCHITECTURE MECHANICAL ENGINEERING POSTGRADUATE STUDIES DOCTORAL QUALIFYING EXAM COMBUSTION ENGINE DIGITAL TWIN DEVELOPMENT AND APPLICATION METHODOLOGY FOR REAL TIME DIAGNOSTIC SYSTEMS Nikola Matulić Split, June 2020
-
Upload
khangminh22 -
Category
Documents
-
view
0 -
download
0
Transcript of COMBUSTION ENGINE DIGITAL TWIN DEVELOPMENT AND ...
i
UNIVERSITY OF SPLIT
FACULTY OF ELECTRICAL ENGINEERING,
MECHANICAL ENGINEERING AND NAVAL
ARCHITECTURE
MECHANICAL ENGINEERING POSTGRADUATE STUDIES
DOCTORAL QUALIFYING EXAM
COMBUSTION ENGINE DIGITAL TWIN
DEVELOPMENT AND APPLICATION
METHODOLOGY FOR REAL TIME
DIAGNOSTIC SYSTEMS
Nikola Matulić
Split, June 2020

ii
SVEUČILIŠTE U SPLITU
FAKULTET ELEKTROTEHNIKE, STROJARSTVA I
BRODOGRADNJE
POSLIJEDIPLOMSKI DOKTORSKI STUDIJ
STROJARSTVA
KVALIFIKACIJSKI ISPIT
RAZVOJ DIGITALNIH BLIZANACA
MOTORA SA UNUTARNJIM IZGARANJEM
I APLIKACIJSKE METODOLOGIJE ZA
DIJAGNOSTIČKE SUSTAVE U REALNOM
VREMENU
Nikola Matulić
Split, Lipanj 2020.

3
The doctoral qualifying exam was prepared at Department of mechanical engineering and naval
architecture, Faculty of electrical engineering, mechanical engineering and naval architecture,
Ruđera Boškovića 32, 21000 Split, Croatia.
Mentor: prof.dr.sc. Gojmir Radica
Kvalifikacijski doktorski ispit je izrađen na Zavodu za strojarstvo i brodogradnju, Fakulteta
elektrotehnike, strojarstva i brodogradnje, Ruđera Boškovića 32, 21000 Split, Hrvatska.
Mentor: prof.dr.sc. Gojmir Radica
4
1 Content
1 INTRODUCTION ............................................................................................................ 7
2 MARINE ENGINE OVERVIEW ................................................................................. 10
2.1 Marine engine types ................................................................................................. 10
2.2 Marine engine auxiliary systems ............................................................................ 14
2.2.1. Hydraulic system for injection, exhaust valve and lubrication actuation ........... 14
2.2.1.1 Injection system .......................................................................................... 16
2.2.1.2 Exhaust valve actuation system .................................................................. 17
2.2.1.3 Lubrication system ...................................................................................... 18
Fuel supply and preparation system ...................................................................... 19
Cooling system ......................................................................................................... 20
Air starting system ................................................................................................... 22
3 MARINE ENGINE CONTROL LAYOUT ................................................................. 23
4 ENGINE PROTECTION AND TYPICAL FAILURES ............................................ 27
4.1 The safety features and typical failures for the slow speed large marine engines
27
4.2 The typical failures for the medium speed mainly four stroke engines .............. 30
1. Engine not able to start: .......................................................................................... 31
2. Overheating: ............................................................................................................. 34
3. Slowdown: ................................................................................................................ 37
4. Oil pressure: ............................................................................................................. 38
5 ENGINE DIAGNOSTIC METHODS .......................................................................... 41
5.1 Measurement dana trend analysis ......................................................................... 41
5.2 Vibroacoustic analysis ............................................................................................. 44
5.3 Endoscopic methods ................................................................................................ 44
5.4 Exhaust gas composition analysis .......................................................................... 45
5.5 Data driven statistical methods and neural networks .......................................... 45
5
5.6 Model based diagnostic ........................................................................................... 47
6 MARINE ENGINE DIGITAL TWIN .......................................................................... 50
6.1 Cylinder Model ........................................................................................................ 51
6.2 Injection model ........................................................................................................ 55
6.3 Cylinder wall temperature model .......................................................................... 56
6.4 Turbocharger model ................................................................................................ 57
6.5 Charge air cooler model .......................................................................................... 58
7 DIGITAL TWIN APPLICATION METHODOLOGY ............................................. 59
7.1 Onboard optimization tool ...................................................................................... 60
7.2 Model Based Diagnostic tool ................................................................................... 62
In-cylinder model based diagnostic concept ......................................................... 63
Injector and rail model based diagnostic concept ................................................ 64
Turbocharger model based diagnostic concept .................................................... 65
Charge Air Cooler model based diagnostic concept ............................................. 66
8 CONCLUSION ............................................................................................................... 67

6
List of figures
Figure 1. Construction scheme of 2 stroke slow speed marine diesel engine [5] .................... 11
Figure 2 Construction scheme of 4 stroke marine diesel engine [5] ........................................ 13
Figure 3 Marine engine high-pressure hydraulic system [6] .................................................... 14
Figure 4 Hydraulic cylinder unit [8] ........................................................................................ 15
Figure 5 InFI Unit [8] ............................................................................................................... 16
Figure 6 InVA Unit [8] ............................................................................................................. 17
Figure 7 Alfa lubricator [8] ...................................................................................................... 18
Figure 8 Heavy fuel oil supply system [9] ............................................................................... 19
Figure 9 Fresh water cooling circuit [10] ................................................................................. 21
Figure 10 Air starting system [11] ........................................................................................... 22
Figure 11 Large marine engine control layout [12] ................................................................. 24
Figure 12 Fuel injection process [8] ......................................................................................... 26
Figure 13 Exhaust valve opening and closing profiles [6] ....................................................... 26
Figure 14 The example of Pressure and temperature ranges [13]Wärtsilä RT-flex48T-D ...... 28
Figure 15 In-cylinder pressure trace [5] ................................................................................... 29
Figure 16 Data Flow CoCoS [16] ............................................................................................ 43
Figure 17 Application of Artificial Neural Networks for marine engine fault diagnosis [17] . 46
Figure 18 System overview of using neural networks for marine engine failure detection [17]
.................................................................................................................................................. 47
Figure 19 Constant determination philosophy [19] .................................................................. 49
Figure 20 Spray Discretization in Multi-Zone Combustion Model [22] ................................. 52
Figure 21 Re-entrainment of burned gas [22] .......................................................................... 53
Figure 22 Injector hole and needle seat flow coefficients [22] ................................................ 56
Figure 23 Digital Twin application directions [20] .................................................................. 59
Figure 24 Optimization tool strategy selection ........................................................................ 60
Figure 25 Digital twin engine optimization concept ................................................................ 61
Figure 26 In-cylinder diagnostic concept overview ................................................................. 63
Figure 27 Injector and rail diagnostic concept ......................................................................... 64
Figure 28 Turbocharger diagnostic concept ............................................................................. 65
Figure 29 Charge Air Cooler diagnostic concept ..................................................................... 66
7
1 INTRODUCTION
Internal combustion engines have been around since 1860. [1] where Etienne Lenoir
created the first commercially used combustion engine. This combustion engine was based on
the cycle which contained no compression stroke and the mixture of coal gas and air was spark
ignited by Ruhmkorff coil [2]. The theoretical Lenoire cycle consisted of isobaric heat release,
isochoric combustion and adiabatic expansion stroke. At 1876. Nikolaus Otto invented the first
modern conventional internal combustion engine. The improvement compared to Lenoire cycle
was introduction of the compression stroke which lead to the higher combustion pressures and
temperatures and thus to the higher combustion efficiency. The theoretical Otto cycle consists
of isentropic compression, isochoric combustion, isentropic expansion and isochoric heat
release. This cycle served as the foundation of the working process of all modern gasoline
internal combustion engines. At 1892. Rudolf diesel invented the diesel engine where ignition
was caused primarily by increasing the temperature by piston moving towards the top dead
center during the compression stroke. This increased the temperature of the mixture inside the
combustion chamber, which initiated start of the combustion effect. These engines are also
nowadays called compression ignition engines. The theoretical diesel cycle consists of an
isentropic compression, isobaric combustion, isentropic expansion and isochoric heat release.
This diesel cycle serves as the base working cycle for all modern diesel engines. There are also
number of variations of these cycles especially in gasoline engines. Nowadays popular in
downsized turbocharged gasoline engines is the Miller cycle whose characteristic is shorter
open duration of the intake camshaft. For the hybrid applications Atkinson cycle applied mostly
on naturally aspirated engine is used whose characteristic is longer opening duration of the
intake camshaft.
Internal combustion engines have many different fields of application such as automotive,
motorcycle, commercial, aviation and different kind of other industries. Depending on the
application internal combustion engines can also be divided on 2 stroke or 4 stroke engines. 2
stroke engines perform the gas exchange and the rest of the standard cycle in one movement of
the piston from bottom dead center to top dead center and back. 4 stroke combustion engines
perform the gas exchange in the additional stroke of the piston which together with standard
cycle leads to overall count of 4 stokes per cycle. 2 stroke piston engines are mainly used in
light machinery applications such as portable chainsaws and similar, motorcycles with the low
swept volumes, small aircraft applications, large heavy fuel oil marine diesel engine
8
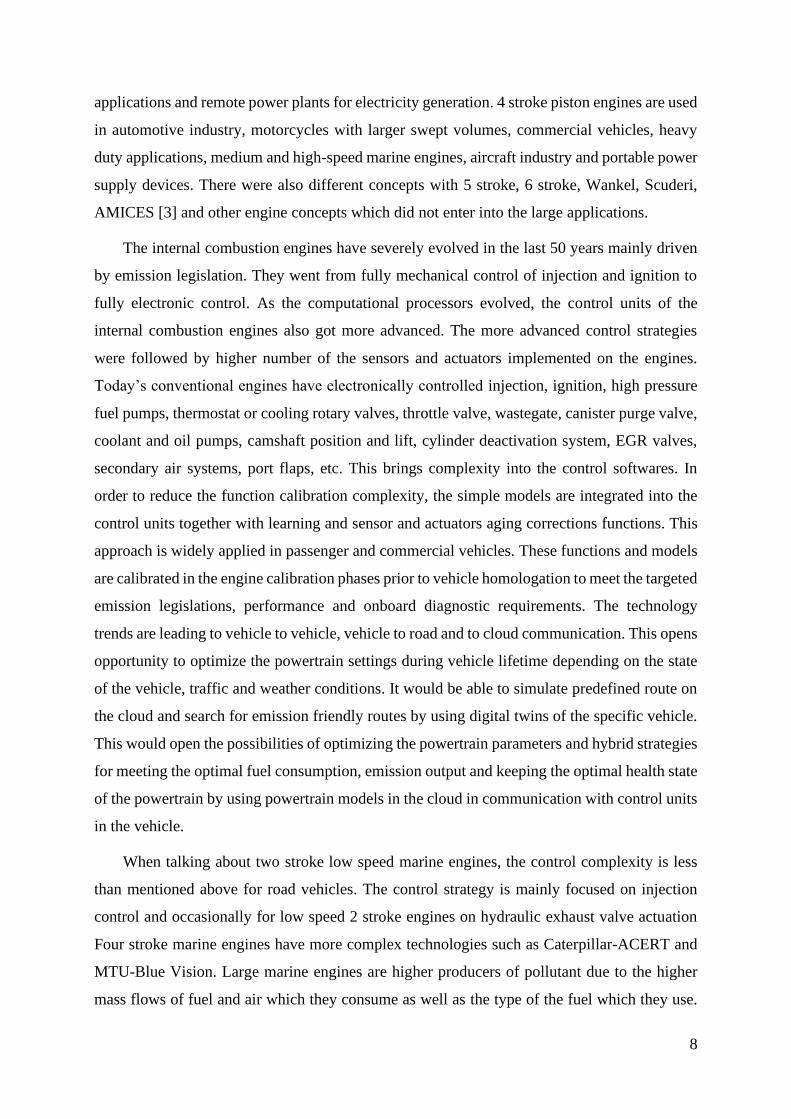
applications and remote power plants for electricity generation. 4 stroke piston engines are used
in automotive industry, motorcycles with larger swept volumes, commercial vehicles, heavy
duty applications, medium and high-speed marine engines, aircraft industry and portable power
supply devices. There were also different concepts with 5 stroke, 6 stroke, Wankel, Scuderi,
AMICES [3] and other engine concepts which did not enter into the large applications.
The internal combustion engines have severely evolved in the last 50 years mainly driven
by emission legislation. They went from fully mechanical control of injection and ignition to
fully electronic control. As the computational processors evolved, the control units of the
internal combustion engines also got more advanced. The more advanced control strategies
were followed by higher number of the sensors and actuators implemented on the engines.
Today’s conventional engines have electronically controlled injection, ignition, high pressure
fuel pumps, thermostat or cooling rotary valves, throttle valve, wastegate, canister purge valve,
coolant and oil pumps, camshaft position and lift, cylinder deactivation system, EGR valves,
secondary air systems, port flaps, etc. This brings complexity into the control softwares. In
order to reduce the function calibration complexity, the simple models are integrated into the
control units together with learning and sensor and actuators aging corrections functions. This
approach is widely applied in passenger and commercial vehicles. These functions and models
are calibrated in the engine calibration phases prior to vehicle homologation to meet the targeted
emission legislations, performance and onboard diagnostic requirements. The technology
trends are leading to vehicle to vehicle, vehicle to road and to cloud communication. This opens
opportunity to optimize the powertrain settings during vehicle lifetime depending on the state
of the vehicle, traffic and weather conditions. It would be able to simulate predefined route on
the cloud and search for emission friendly routes by using digital twins of the specific vehicle.
This would open the possibilities of optimizing the powertrain parameters and hybrid strategies
for meeting the optimal fuel consumption, emission output and keeping the optimal health state
of the powertrain by using powertrain models in the cloud in communication with control units
in the vehicle.
When talking about two stroke low speed marine engines, the control complexity is less
than mentioned above for road vehicles. The control strategy is mainly focused on injection
control and occasionally for low speed 2 stroke engines on hydraulic exhaust valve actuation
Four stroke marine engines have more complex technologies such as Caterpillar-ACERT and
MTU-Blue Vision. Large marine engines are higher producers of pollutant due to the higher
mass flows of fuel and air which they consume as well as the type of the fuel which they use.

9
During component wearing and degradation consumption and pollutants are increasing
drastically. It is important to mention that lifetime of large marine engines is about 30 years. In
this periode the engines are many times retrofitted and the engine calibration does not fit to the
one initially performed on the engine testbed. For these reasons the methodology of the digital
twins or the engine models in use case of predicting the engine failures and optimizing the
engine calibration by using models in the cloud solutions is chosen to be developed in this
doctor thesis.
This qualifying work is focused on investigating the current marine engines control setups,
engine control units, actuators and sensors. The available physical real time models are going
to be evaluated in order to be used for engine model calibration and simulation of the early
symptoms of the engine component failure. The evaluation of existing monitoring and
diagnostic systems and methods for the marine engines which are existing on the market will
be processed. Finally, the benefit of applying the real-time physical models on the cloud which
are communicating with the real engine which is operating on the real-world condition will be
evaluated. In order for this approach to work the engine model calibration methodology and
failure simulation needs to be developed. When proven successful, this would be the first
methodology of a kind where parallelly to a real engine it would be able to simulate how the
engine should work in the current real-world conditions and thus, by comparing the results of
the digital twin simulation to a real engine with the help of presimulated failure matrices, it
would be possible to determine root cause and location of possible failure as well as suggest
the engine optimal actuator settings for longer lifetime, less fuel consumption and lower
emissions.
10
2 MARINE ENGINE OVERVIEW
2.1 Marine engine types
Marine diesel engines can be divided into a few subgroups based on working cycle, filling
mechanism, construction, engine speed, etc. [4]. Based on working cycle they can be
distinguished between 2 stoke and 4 stroke engines. 2 stroke diesel engines are mainly applied
on large vessels such as tankers, bulk carriers etc, and they are fueled with heavy oil. 4 stroke
engines are also used in large vessels but mainly as a part of generator sets widely applied on a
cruise vessels. 4 stroke engines are very common on medium and small length vessels such as
ferries, touristic boats, speed boats, fishing vessels, etc.
Engines with different filling mechanisms are divided into the turbocharged and naturally
aspirated engines. Turbocharged engines increase the pressure of the fresh air entering cylinder
through the cylinder ports or intake valve by boosting the air with compressor side of the
turbocharger. The pressure at the start of cylinder compression phase is higher than ambient
pressure. Naturally aspirated engines do not increase the pressure of the air or the mixture before
the cylinder compression phase. The pressure at start of compression phase is lower than
ambient in most of the operating points with maximum achievable pressure of the one at the
ambient level. In some cases, naturally aspirated can achieve pressures at cylinder inlet slightly
higher than ambient due to pressure pulsation effects.
Regarding to construction the marine diesel engine can be roughly divided by the engines
with and without the crosshead. The engines with the crosshead are mainly 2 stroke slow speed
large engines shown on the figure 1.
11
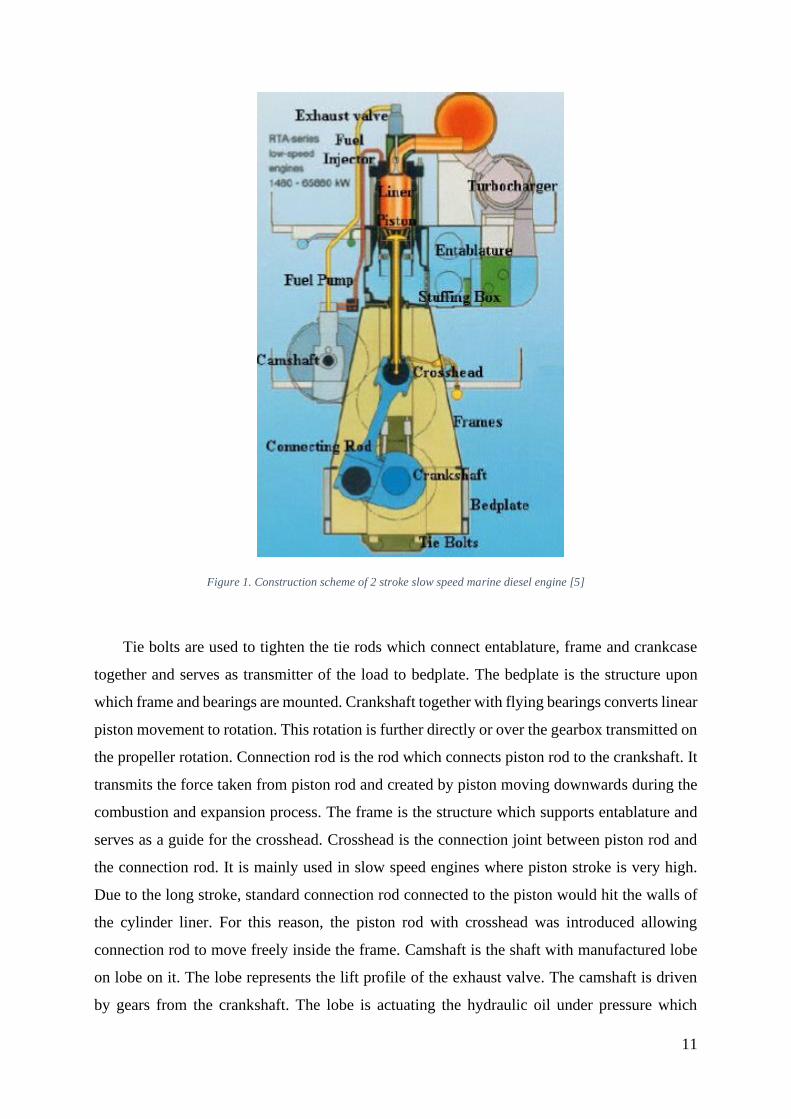
Figure 1. Construction scheme of 2 stroke slow speed marine diesel engine [5]
Tie bolts are used to tighten the tie rods which connect entablature, frame and crankcase
together and serves as transmitter of the load to bedplate. The bedplate is the structure upon
which frame and bearings are mounted. Crankshaft together with flying bearings converts linear
piston movement to rotation. This rotation is further directly or over the gearbox transmitted on
the propeller rotation. Connection rod is the rod which connects piston rod to the crankshaft. It
transmits the force taken from piston rod and created by piston moving downwards during the
combustion and expansion process. The frame is the structure which supports entablature and
serves as a guide for the crosshead. Crosshead is the connection joint between piston rod and
the connection rod. It is mainly used in slow speed engines where piston stroke is very high.
Due to the long stroke, standard connection rod connected to the piston would hit the walls of
the cylinder liner. For this reason, the piston rod with crosshead was introduced allowing
connection rod to move freely inside the frame. Camshaft is the shaft with manufactured lobe
on lobe on it. The lobe represents the lift profile of the exhaust valve. The camshaft is driven
by gears from the crankshaft. The lobe is actuating the hydraulic oil under pressure which
12
directly or influenced by electro-controlled hydraulic valves is initiating the opening of the
exhaust valve. Fuel pump as well is driven by gears from the crankshaft. It is boosting the
pressure in the fuel line towards the injectors. The stuffing box is the not allowing the oil from
the crankcase to enter into the scavenging area and vice versa. The entablature or widely known
as cylinder block. It is a housing for the scavenged air, cylinder liner and cooling space around
the liner. Piston is the movable part of the combustion chamber. With piston rings it is in the
contact with the liner and moves across the liner from bottom to top dead center. It transports
the work produced by combustion and expansion towards the crankshaft as well as it
compresses the air in the cylinder during the compression phase of the cycle. Liner is the
stationary part of the combustion chamber which serves as a guide for the piston. The liner is
water cooled on the outer side of the combustion chamber in order to obtain the material
defined, safe operating temperature. Turbocharger is a thermal machine used to increase the
pressure at the cylinder inlet ports in order to achieve higher engine power outputs as well as
higher operating efficiency. It consists of the turbine and the compressor part with the shaft
connecting them. Often it also contains the bypass valve for the regulation of the scavenging
pressure. The turbine is driven by the enthalpy of the exhaust gasses from the exhaust collector
and power produced on the turbine is delivered to the compressor. Compressor based on the
flow and efficiency characteristics, is increasing the pressure and the temperature of the air at
its outlet. Fuel injector is hydraulically driven nozzle which injects the fuel into the combustion
chamber. The fuel needs to be at the desired pressure and temperature as well as it needs to be
injected at the specific timing in order to increase the combustion efficiency and reduce the
emissions. For better injection control, multiple injectors are installed in the single cylinder.
The exhaust valve releases the combustion product out of the combustion chamber into the
exhaust collector. It is indirectly camshaft driven and the opening is hydraulically controlled
over the electro-hydraulic valve. The timing of the exhaust valve opening and closing is of high
importance to the working cycle in terms of having better control over the gas exchange and
residual gas content.
4 stroke marine engines differ to the 2 stroke engine in the speed range they operate which
leads to construction differences, figure 2. Generally, 4 strokes engines have shorter stroke,
meaning there is no need of using the piston rod and crosshead. Connection rod is connected
directly from the crankshaft to the piston. This also means that the design of the frame, bedplate
and the whole crankcase will be performed differently. One of the main difference is that there
are no inlet ports but air filling is performed over the intake valve. The opening and closing of
13
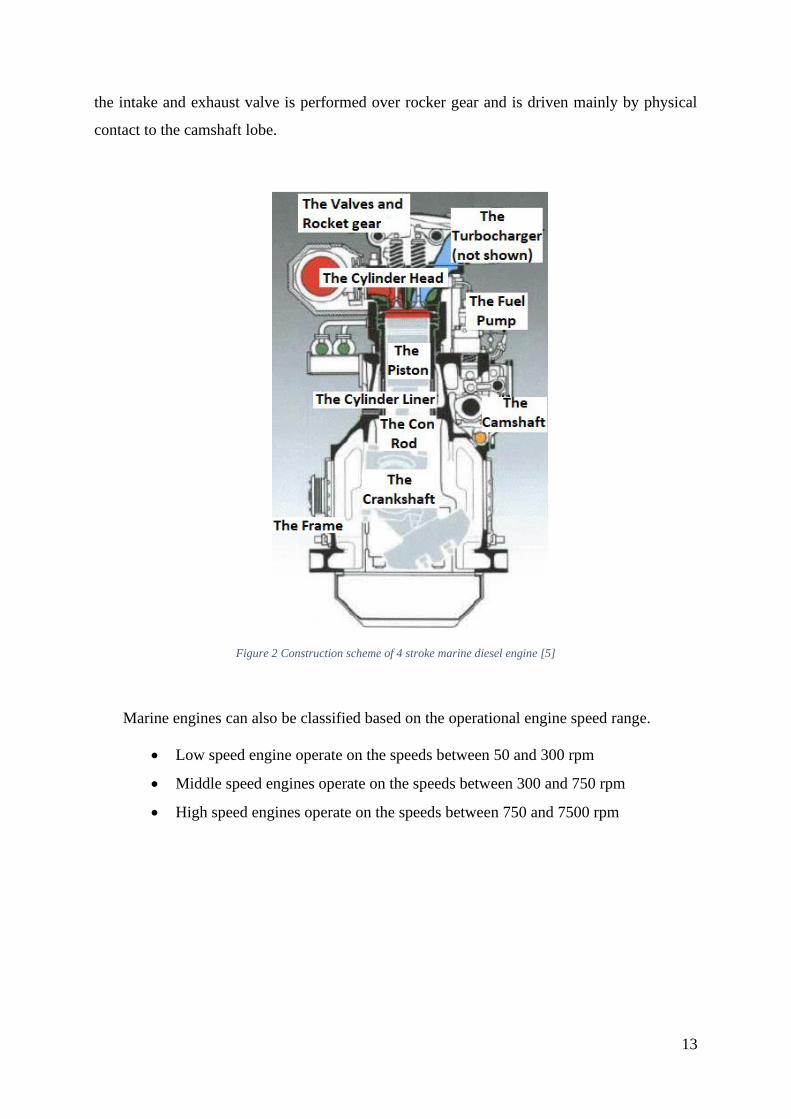
the intake and exhaust valve is performed over rocker gear and is driven mainly by physical
contact to the camshaft lobe.
Figure 2 Construction scheme of 4 stroke marine diesel engine [5]
Marine engines can also be classified based on the operational engine speed range.
• Low speed engine operate on the speeds between 50 and 300 rpm
• Middle speed engines operate on the speeds between 300 and 750 rpm
• High speed engines operate on the speeds between 750 and 7500 rpm
14
2.2 Marine engine auxiliary systems
2.2.1. Hydraulic system for injection, exhaust valve and lubrication actuation
Four stroke, especially medium and high speed engines have solenoid or piezo injectors
who are actuated by current, directly on the actuator. The exhaust valve actuation is performed
also directly with the camshaft mechanically driven by the crankshaft rotation. The pressurized
lubrication oil is delivered with the pump driven by the crankshaft rotation over the gear
rotational translation. In two stoke large engines, all three above mentioned systems are
actuated over the pressurized hydraulic oil with the exception of Wartsila two stroke engine
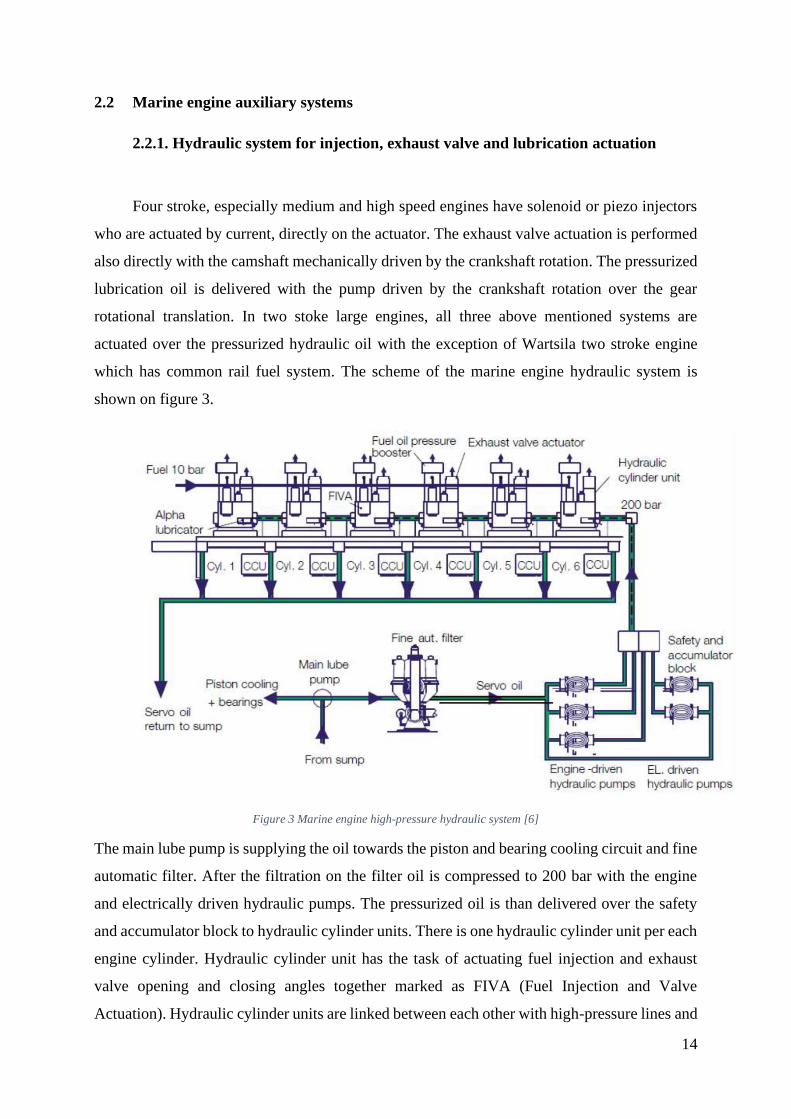
which has common rail fuel system. The scheme of the marine engine hydraulic system is
shown on figure 3.
Figure 3 Marine engine high-pressure hydraulic system [6]
The main lube pump is supplying the oil towards the piston and bearing cooling circuit and fine
automatic filter. After the filtration on the filter oil is compressed to 200 bar with the engine
and electrically driven hydraulic pumps. The pressurized oil is than delivered over the safety
and accumulator block to hydraulic cylinder units. There is one hydraulic cylinder unit per each
engine cylinder. Hydraulic cylinder unit has the task of actuating fuel injection and exhaust
valve opening and closing angles together marked as FIVA (Fuel Injection and Valve
Actuation). Hydraulic cylinder units are linked between each other with high-pressure lines and
15
are controlled by CYL-EU (cylinder electronic units). After the performed task in hydraulic
cylinder units, oil return to the oil sump and closes the circuit loop.
Hydraulic power supply system consists of filter, pumps, hydraulic accumulator blocks
and electronic pressure control system. The filter unit consists of fine automatic filter who filters
the particulates with diameter higher than 6 µm or 10 µm and secondary or redundant filter who
blocks the particulates with diameter higher than 25 µm [7]. The pumps used in hydraulic
system are axial pumps. At least 2 pumps are driven by electric engine and are used during the
startup of the hydraulic system. The rest of the pumps are driven by the combustion engine over
the gear set mounted on the crankshaft. Electrically driven pumps have operating pressure to
up to 175 bar and mechanically drive to 250 bar. Operation of the pumps is balanced by second
order moment compensator shaft.
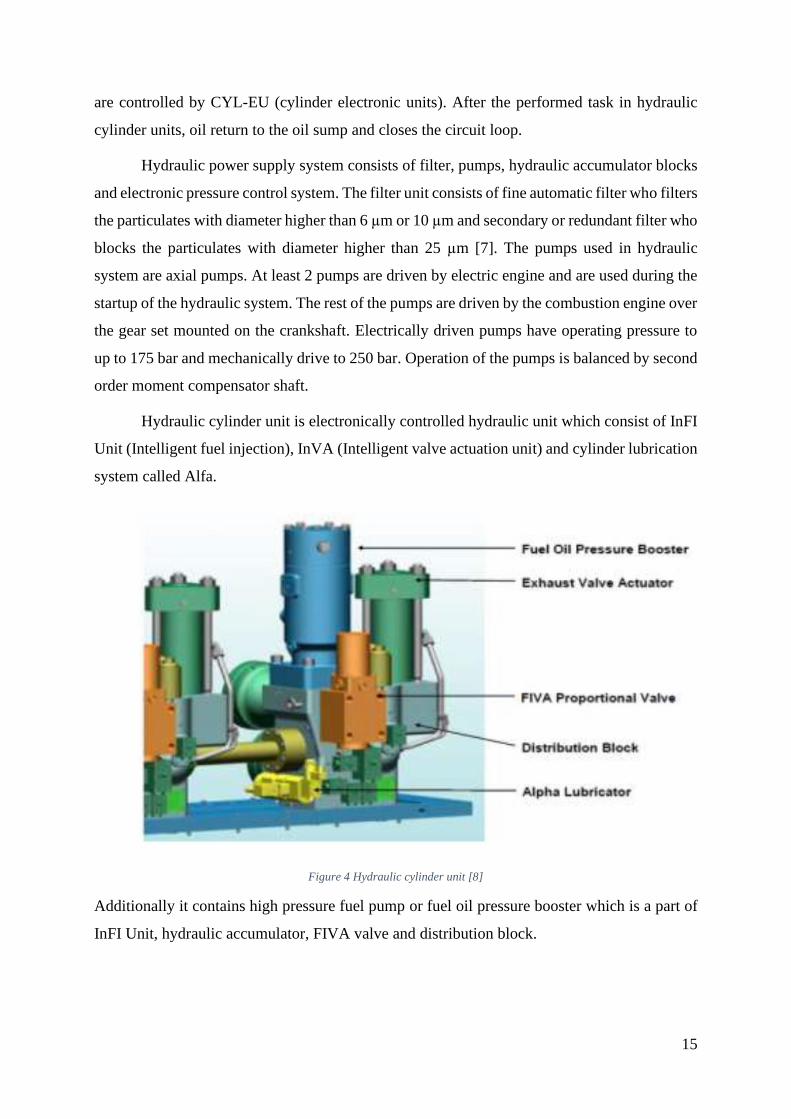
Hydraulic cylinder unit is electronically controlled hydraulic unit which consist of InFI
Unit (Intelligent fuel injection), InVA (Intelligent valve actuation unit) and cylinder lubrication
system called Alfa.
Figure 4 Hydraulic cylinder unit [8]
Additionally it contains high pressure fuel pump or fuel oil pressure booster which is a part of
InFI Unit, hydraulic accumulator, FIVA valve and distribution block.

16
2.2.1.1 Injection system
Because of the combustion efficiency, pollutant formation and component protection,
injection system needs to comply to specific injection strategies which consider delivering
specific amount of fuel, at specific timing and under specific injection pressure. 4 stroke
medium speed engine have fully electronically controlled opening and closing angles of the
piezo injectors as well as variable control of injection pressure. The 2 stroke large engines have
slightly more complex hydraulically control system. As previously mentioned MAN ME InFI
unit consists of fuel oil pressure booster, high pressure pipes and slide-type fuel valves.
Figure 5 InFI Unit [8]
Based on the engine operating state, load and crankshaft position signal, FIVA proportional
valve is actuated and directs the hydraulic oil towards the hydraulic piston located in fuel oil
pressure booster. Hydraulic piston over the fuel plunger compresses the fuel which is supplied
through suction valve with delivery pressure around 10 bar to the operating injection pressure
to up to 1000 bar. When the pressure inside the high pressure pipe outpowers the spring force,
the slide fuel valve starts to inject the fuel into the engine cylinder and FIVA valve releases the
hydraulic fuel towards the oil tank. FIVA valve is controlled by cylinder control unit. The
control unit considers the feedback position of the FIVA valve and fuel booster hydraulic piston
position. It also gives the possibility to adjust the injection timing.
17
2.2.1.2 Exhaust valve actuation system
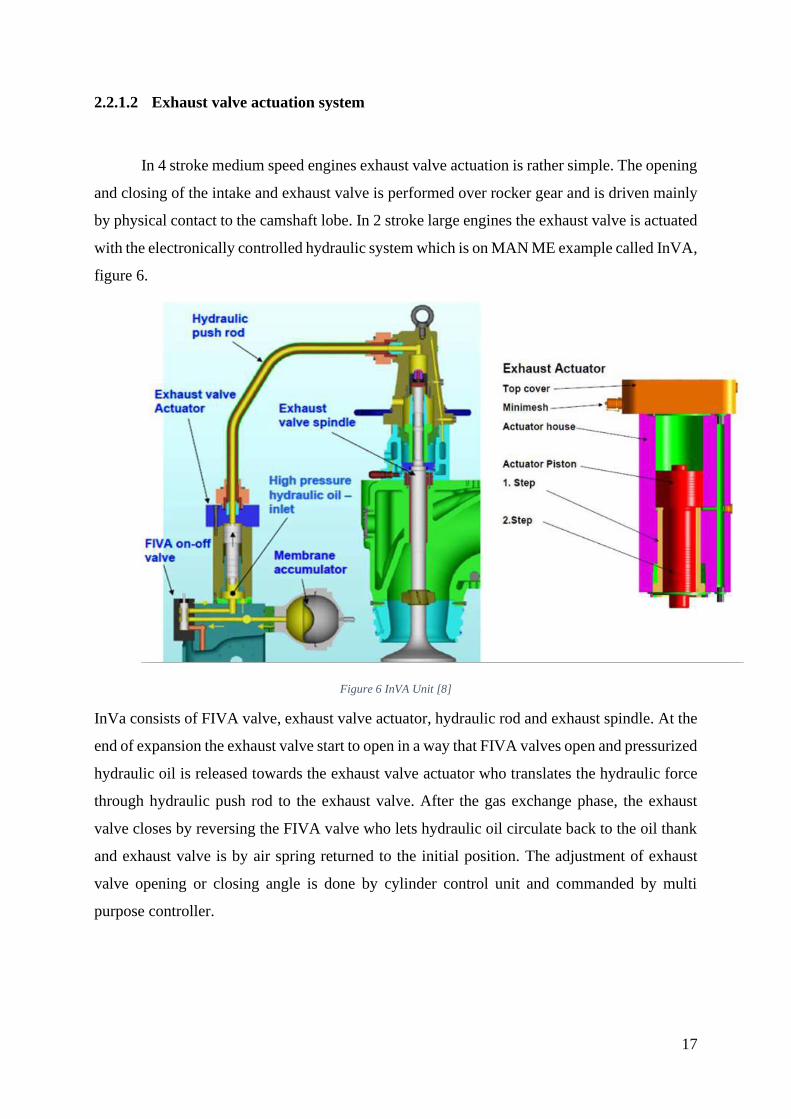
In 4 stroke medium speed engines exhaust valve actuation is rather simple. The opening
and closing of the intake and exhaust valve is performed over rocker gear and is driven mainly
by physical contact to the camshaft lobe. In 2 stroke large engines the exhaust valve is actuated
with the electronically controlled hydraulic system which is on MAN ME example called InVA,
figure 6.
Figure 6 InVA Unit [8]
InVa consists of FIVA valve, exhaust valve actuator, hydraulic rod and exhaust spindle. At the
end of expansion the exhaust valve start to open in a way that FIVA valves open and pressurized
hydraulic oil is released towards the exhaust valve actuator who translates the hydraulic force
through hydraulic push rod to the exhaust valve. After the gas exchange phase, the exhaust
valve closes by reversing the FIVA valve who lets hydraulic oil circulate back to the oil thank
and exhaust valve is by air spring returned to the initial position. The adjustment of exhaust
valve opening or closing angle is done by cylinder control unit and commanded by multi
purpose controller.
18
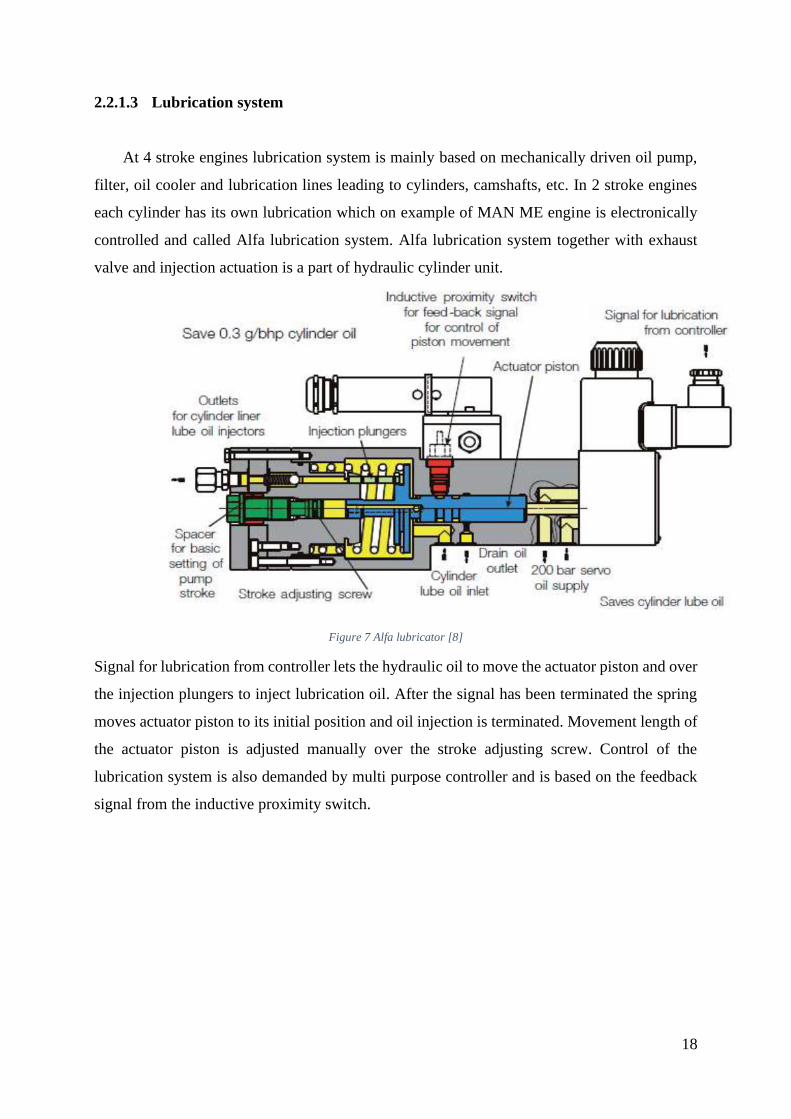
2.2.1.3 Lubrication system
At 4 stroke engines lubrication system is mainly based on mechanically driven oil pump,
filter, oil cooler and lubrication lines leading to cylinders, camshafts, etc. In 2 stroke engines
each cylinder has its own lubrication which on example of MAN ME engine is electronically
controlled and called Alfa lubrication system. Alfa lubrication system together with exhaust
valve and injection actuation is a part of hydraulic cylinder unit.
Figure 7 Alfa lubricator [8]
Signal for lubrication from controller lets the hydraulic oil to move the actuator piston and over
the injection plungers to inject lubrication oil. After the signal has been terminated the spring
moves actuator piston to its initial position and oil injection is terminated. Movement length of
the actuator piston is adjusted manually over the stroke adjusting screw. Control of the
lubrication system is also demanded by multi purpose controller and is based on the feedback
signal from the inductive proximity switch.
19
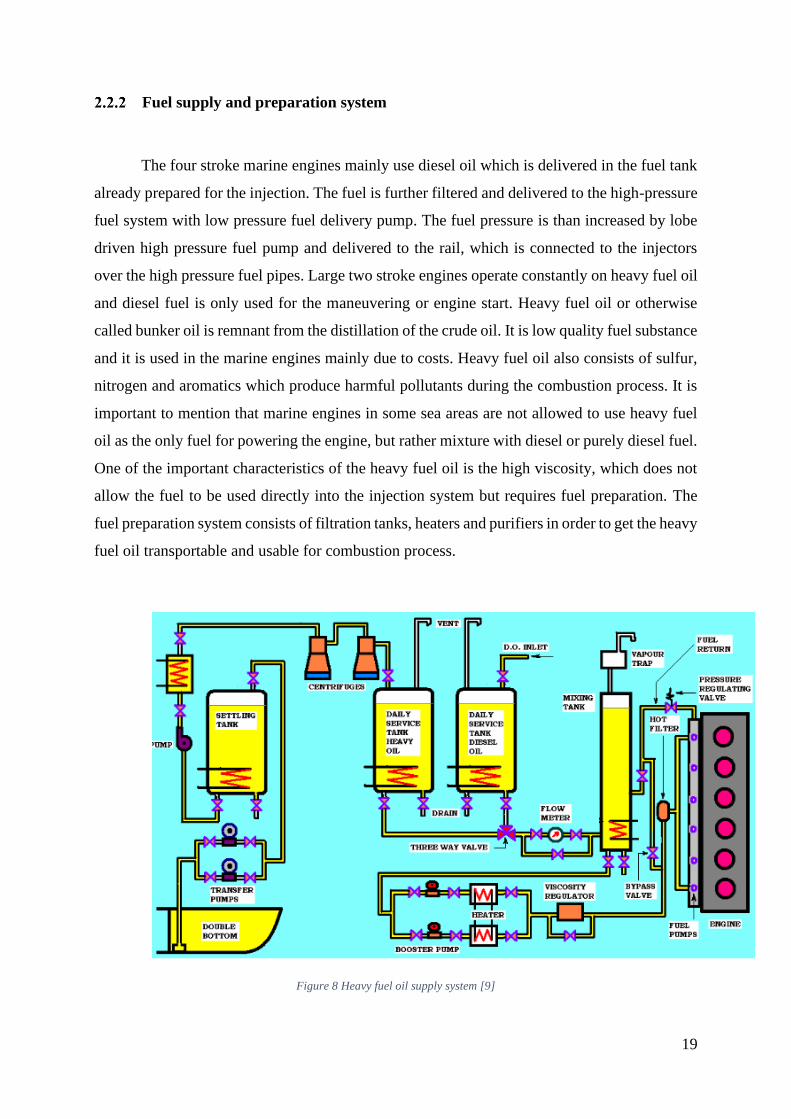
Fuel supply and preparation system
The four stroke marine engines mainly use diesel oil which is delivered in the fuel tank
already prepared for the injection. The fuel is further filtered and delivered to the high-pressure
fuel system with low pressure fuel delivery pump. The fuel pressure is than increased by lobe
driven high pressure fuel pump and delivered to the rail, which is connected to the injectors
over the high pressure fuel pipes. Large two stroke engines operate constantly on heavy fuel oil
and diesel fuel is only used for the maneuvering or engine start. Heavy fuel oil or otherwise
called bunker oil is remnant from the distillation of the crude oil. It is low quality fuel substance
and it is used in the marine engines mainly due to costs. Heavy fuel oil also consists of sulfur,
nitrogen and aromatics which produce harmful pollutants during the combustion process. It is
important to mention that marine engines in some sea areas are not allowed to use heavy fuel
oil as the only fuel for powering the engine, but rather mixture with diesel or purely diesel fuel.
One of the important characteristics of the heavy fuel oil is the high viscosity, which does not
allow the fuel to be used directly into the injection system but requires fuel preparation. The
fuel preparation system consists of filtration tanks, heaters and purifiers in order to get the heavy
fuel oil transportable and usable for combustion process.
Figure 8 Heavy fuel oil supply system [9]
20
Heavy fuel oil when boarded is stored in bunker tanks where it is heated to achieve the viscosity
level which allows the oil to be pumped by transfer pumps into the settling tank. Settling tank
has the volume capacity for 24 hours engine fuel demand. In settling tank heavy fuel oil is
heated as well and water as well as the heavy impurities are separated by gravity on the bottom
of the tank. The impurities need to be drained regularly. Heavy fuel oil is than pumped into the
centrifuges where all impurities are removed from the fuel. The fuel oil is than pumped into the
daily service tanks and over the three way valve and flow meter to mixing tank. Over the three
way valve it is possible to choose if heavy fuel oil, diesel fuel or mixture will be used. The
mixing tank task is to provide smoother transition from diesel fuel to heavy fuel oil operation
by allowing gradual change in temperature and viscosity of the fuel. It is also used as fuel
recirculation tank. Booster pumps boost the fuel to desired pressure and over the viscosity
regulator by adjusting the temperature, the optimal viscosity for combustion is controlled.
Pressure regulating valve controls the supply pressure for the pumps who boost the fuel pressure
which is used in InFI system. Bypass valve with hot filter is used to preheat the fuel before
stating the engine.
Cooling system
The engine cooling system onboard ships is separated into the sea water and fresh water
circuit. Fresh water is used to cool machinery and sea water as secondary circuit to cool down
the fresh water circuit. Four stroke medium speed engines get cooled cylinder jackets,
lubrication circuit and charge air cooler by the fresh water circuit. In large two stroke engine
the cooling circuit is slightly more complex. Figure 9 shows one typical schematic of the fresh
water cooling circuit of the large two stroke low speed diesel engine. Fresh water cooling circuit
in this application cools down the jacket, piston, lubrication oil and fuel valve. For each of the
stated there is a cooling circuit applied. Additionally the blower and charge air cooler can be
cooled by fresh water or directly with sea water. Jacket cooler water pump pumps the water in
the compartments around the cylinder liner and head, turbocharger and exhaust valves. The
water is circulated further towards jacket cooler where the temperature is lowered by heat
exchange with sea water. The expansion tank is also mounted onto the circuit to compensate
the water loss and to minimize the pressure oscillations. There is also the control valve which
regulates the water flow for each cylinder individually.

21
Figure 9 Fresh water cooling circuit [10]
The piston cooling pump pumps the water either to piston cooler which drops the water
temperature by heat exchange with the sea water or towards the piston depending on the
position of the control valve. The water flows towards the piston through telescopic and stand
pipes and after cooling the piston it flows out to piston water tank.
Lubrication oil pump pumps the oil into the oil cooler to cool it to operating temperature or
directly to the moving parts of the bearings depending on the position of the control valve. After
the lubrication the oil will become heated and will drop into the oil sump tank.
The injected fuel temperature is important for the combustion efficiency and pollutant
formation. For this reason injectors are drilled with passages through which the water circulates
and controls the temperature of the injected fuel. This system as well as jacket cooling system
is closed and requires the expansion tank.

22
Air starting system
The pneumatic air starting system is specific for large marine engines. The starting of
the engine is done by injecting pressurized air into the engine cylinders at TDC until exhaust
valve opens and by this pushing the cylinder downwards. The air is pressurized by the
compressors and stored into the receivers. The pressure inside the receivers is around 30 bar.
The air from the receivers is delivered over the automatic non-return valve to the air start valve
which is mounted on each engine cylinder. The opening of the valves is controlled by pilot air
system.
Figure 10 Air starting system [11]
After the start signal is applied the pilot air activates the automatic valve. The distributor
receives the pressurized air as well, which will be based on the activation order will activate the
air start valve. The distributor is synchronized with the crankshaft position by receiving the

23
crank angle signal to activation control unit or mechanically over the camshaft, aiming to
activate the air start valve when cylinder is at TDC. There are some safety measures to be
applied on the starting system such as interlock which stops the activation of automatic valve.
Compressor lubrication oil will accumulate on the pipelines of the air system and under the air
start valve leakage the high temperature gasses from cylinder can cause oil fire. For this reason
flame traps together with non-return and relief valves are installed.
3 MARINE ENGINE CONTROL LAYOUT
Driven by emission legislation, engine manufacturers were forced to develop and
implement newer types of actuators who are able to adjust the fuel injection, air filling and other
emission relevant parameters with more degrees of freedom and more accuracy. As in the
previous chapters, the difference between 4 stroke and 2 stroke is rather noticeable.
Four stroke engine control module based on the load demand and sensor information listed
below:
• Engine speed and timing
• Fuel pressure and temperature
• Gear oil pressure and temperature
• Engine oil pressure and temperature
• Intake manifold air pressure and temperature
• Coolant temperature and level
is determining how much fuel needs to be injected in order to achieve desired torque. After fuel
determination, the emission and component protection parameters are defined by setting the
desired injection pressure, number of injections and injection timing. Based on desired rail
pressure the high-pressure fuel pump actuator angle and injection timing for injectors is
calculated and finally control module releases current towards the actuators.
There are also additional actuators and sensors installed depending on engine concept. For
example, if exhaust gas recuperation (EGR) is used, the EGR valve is controlled and fresh air
mass flow meter is installed. For variable turbine geometry the control for the blade position is
being used.

24
For 2 stroke engines the control layout is more complex. The complexity comes due to large
stroke engine design which is more exposed to cylinder liner wearing and thus has more
necessity for cylinder balancing and as well more complex auxiliary hydraulic system for
injection and exhaust valve control. The main control module also controls starting, stopping
and reversing engine operation. The control layout is shown on figure 11.
Figure 11 Large marine engine control layout [12]

25
The central part of the control layout is common electronic unit (COM-EU) which coordinates
lubrication system, fuel supply system, hydraulic oil system and CYL-EU. It takes commands
of speed and load from engine room and communicates with engine safety and alarm system.
There is a single COM-EU per engine and per each cylinder there is one CYL-EU. The
thermodynamic control logic is similar as described in 4 stroke engines with higher complexity
on actuation periphery condition preparation in hydraulic servo system. In 2 stroke engines
there is larger number of sensors installed. The pressure and temperature sensor is installed after
or in each engine component from perspective of the cylinder block, air path, lubrication,
cooling and hydraulic system. With different engine or driveline concepts such as dual fuel
engines, gas engines, engines with utilization boilers, diesel generators, etc., the additional
sensors are added. Bellow listed is the example of most important sensors on conventional 2
stoke large engine:
• Ambient pressure and temperature
• Pressure and temperature after the air filter
• Pressure and temperature after the compressor
• Scavenge pressure and temperature
• Exhaust collector pressure and temperature
• Pressure and temperature after the turbine
• Turbocharger speed
• Engine speed or crankshaft position
• Incylinder pressure indication traces
• Coolant circuit temperatures
• Oil pressure and temperature
• Oil mass flow
• Fuel booster position
• Fuel pressure
• Hydraulic oil pressure
• Exhaust valve actuator position
• Cylinder liner temperature
• Main and crosshead bearing temperatures
Based on sensor information, speed and load demand, the COM-EU based on precalibrated
control functions sends information to CYL-EU who actuates FIVA system as described in
chapter 2.2.1.1. and 2.2.1.2.

26
Figure 12 Fuel injection process [8]
The injection process consists of preparation phase where fuel reaches desired injection
pressure, start of injection where injector starts to release the fuel into the cylinder, injection
phase and injection control of combustion monitoring. Prior to injection, control unit is
diagnosing if FIVA feedback current signal or fuel booster position are faulty. The injection
parameters, injection pressure, start angle and duration are calibrated inside the control unit in
order to achieve optimum cylinder balancing, desired in-cylinder peak pressures, optimal
combustion efficiency and desired emission targets.
Figure 13 Exhaust valve opening and closing profiles [6]
The exhaust valve is also variably controlled over FIVA system with the control unit. It is
possible to do variations of opening and closing angles of the exhaust valve. These variation
are mainly used to improve gas exchange, control the compression pressure, exhaust
temperature and compensate leakage over the exhaust valve.
27
4 ENGINE PROTECTION AND TYPICAL FAILURES
Engine is the most expensive and safety critical item on the vessel. Due to aging and
different operating load profiles due to rough sea conditions it is also subject to failures. For the
exact reason, engine safety system are introduced. Safety systems can be delivered by engine
manufacturers or external tools can used as well.
4.1 The safety features and typical failures for the slow speed large marine engines
The safety features can be grouped in:
• Alarms
• Slow down
• Shut down
• Start Interlock
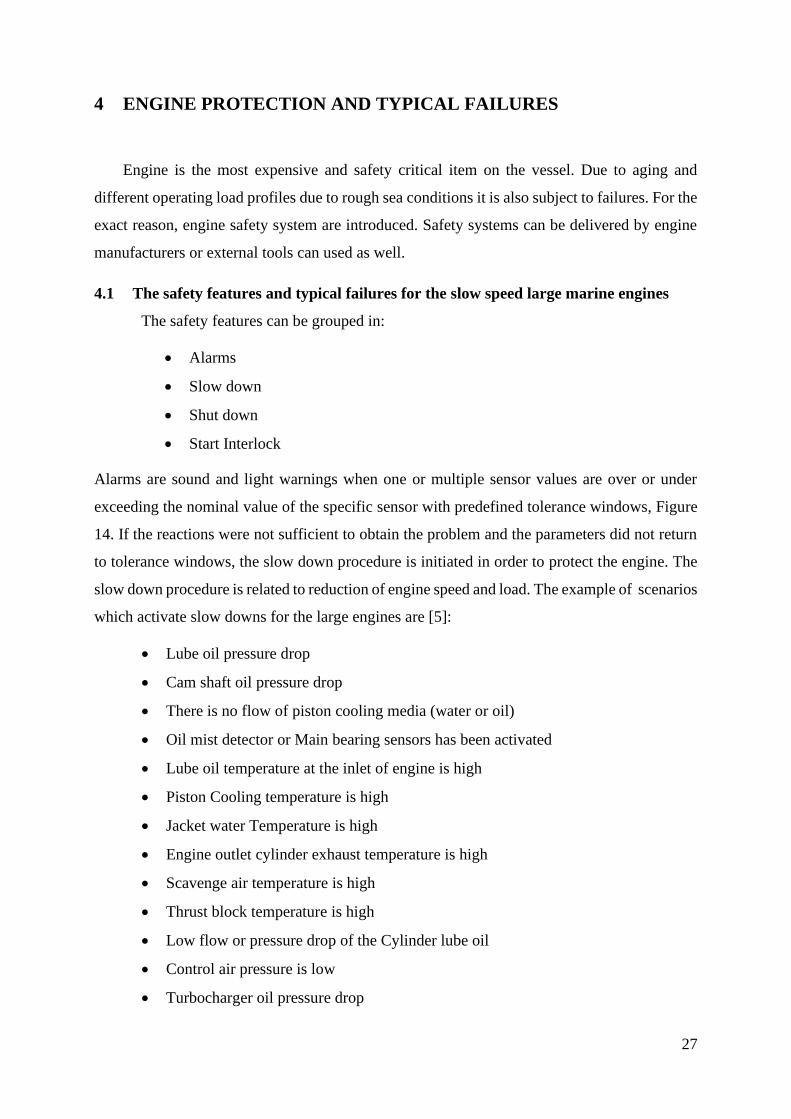
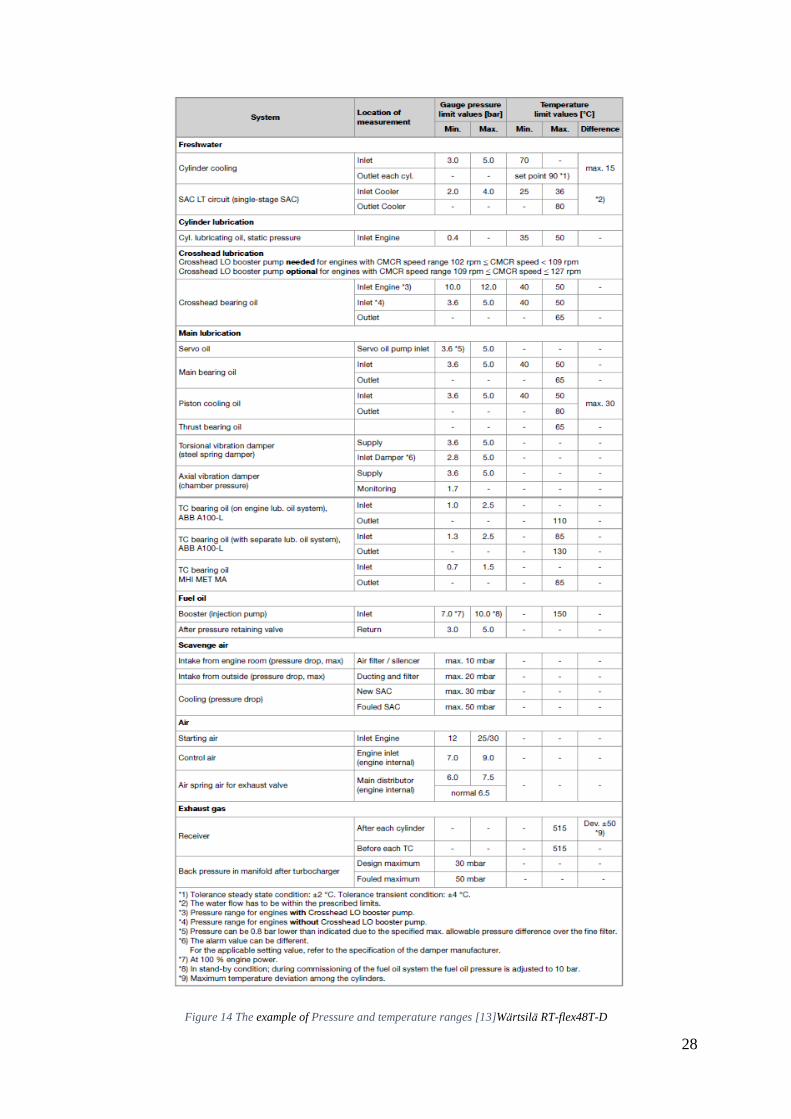
Alarms are sound and light warnings when one or multiple sensor values are over or under
exceeding the nominal value of the specific sensor with predefined tolerance windows, Figure
14. If the reactions were not sufficient to obtain the problem and the parameters did not return
to tolerance windows, the slow down procedure is initiated in order to protect the engine. The
slow down procedure is related to reduction of engine speed and load. The example of scenarios
which activate slow downs for the large engines are [5]:
• Lube oil pressure drop
• Cam shaft oil pressure drop
• There is no flow of piston cooling media (water or oil)
• Oil mist detector or Main bearing sensors has been activated
• Lube oil temperature at the inlet of engine is high
• Piston Cooling temperature is high
• Jacket water Temperature is high
• Engine outlet cylinder exhaust temperature is high
• Scavenge air temperature is high
• Thrust block temperature is high
• Low flow or pressure drop of the Cylinder lube oil
• Control air pressure is low
• Turbocharger oil pressure drop
28
Figure 14 The example of Pressure and temperature ranges [13]Wärtsilä RT-flex48T-D
29
If there are high deviation for the two stroke large engines in sensor parameters such as engine
oil pressure, the shut down procedure is started and all fuel supplies are cut down. The scenarios
which activate shut downs for large engines are [5]:
• Lube oil inlet pressure to engine is very low <1 bar
• Cam shaft Lube oil pressure is very low < 1.5 bar
• Very high Jacket cooling water temperature >95 deg C
• Low Jacket cooling water pressure < 0.1 bar
• No flow of Cylinder lube oil
• Thrust block temperature very high > 90 deg C
• Lube oil inlet pressure for turbocharger is low < 0.8 bar
• Over speed of the engine which activates shut down at 107 % of Max. continuous
rating MCR
• Oil mist detector
• Turbocharger oil pressure
Start interlock will not allow engine to be started if all the systems are not initiated or operated
properly.
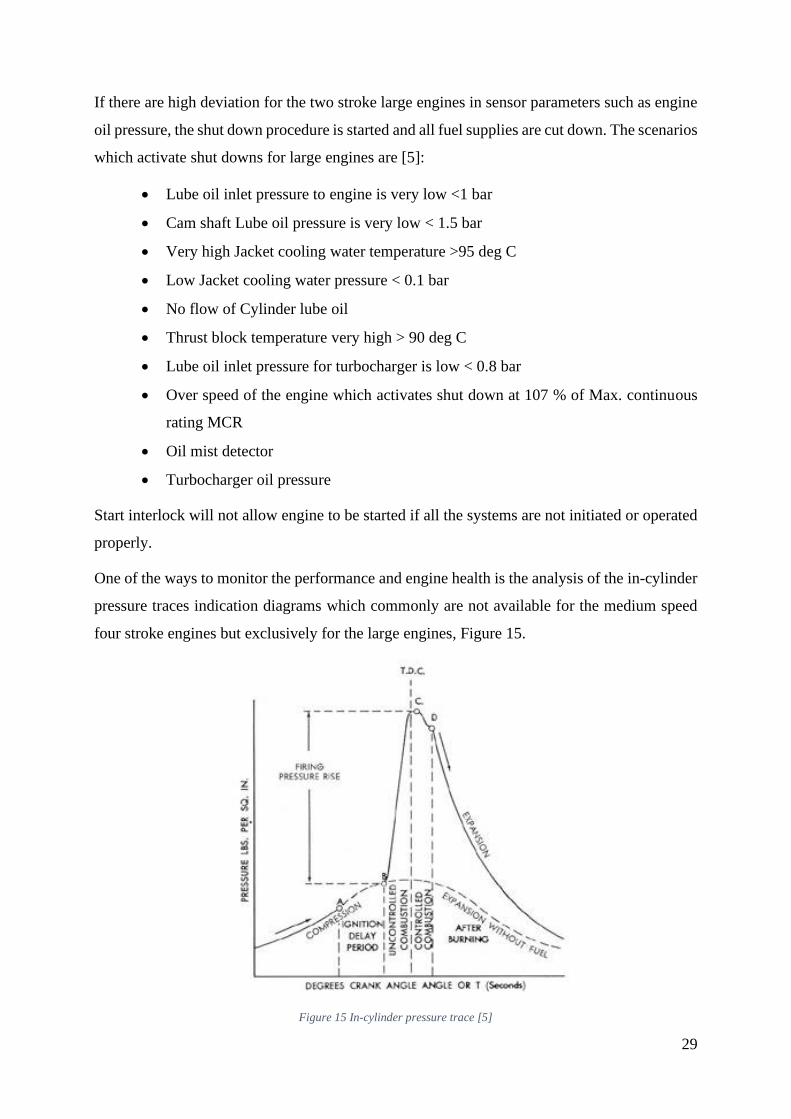
One of the ways to monitor the performance and engine health is the analysis of the in-cylinder
pressure traces indication diagrams which commonly are not available for the medium speed
four stroke engines but exclusively for the large engines, Figure 15.
Figure 15 In-cylinder pressure trace [5]
30
When the measured diagram is compared to the reference one of the healthy engine a few types
of typical deviations can be observed:
1. Compression pressure shows no deviation but peak firing pressure is too high. This
indication on false injection setting pointing to the position of the fuel timing camshafts
or settings with possibility of the failure of FIVA system. The high peak firing pressure
is caused by too early injection and if all fuel injection control timing setting are valid,
the only cause left is damaged injector leakage.
2. Compression pressure and peak firing pressure are low. This indicate on air and mixture
leakage through exhaust valve, piston rings, wearing of the cylinder liner, burnt piston
crown or low scavenging pressure.
3. Compression and peak firing pressure are high. This indicates on false exhaust valve
timing. Late opening of exhaust valve means prolonged expansion which bring more
work into the compression stroke of upcoming cylinder in the firing order. This can also
indicate overload of the engine.
The mentioned symptoms or failures are cylinder individual. When monitoring the whole
cylinder group, it is important to balance the performance between the individual cylinders. The
cylinder or power balancing is mainly done by adjusting the fuel amount per each cylinder and
by not exceeding safety measures such as too high exhaust temperature. Unbalanced operation
can lead to overload of bearings and gears, vibrations, overheated pistons, cracked crankshaft,
bolts failure, etc.
4.2 The typical failures for the medium speed mainly four stroke engines
Common approach to group the failures based on symptoms and especially for medium
speed 4 stroke engines where extensive monitoring devices on board are not available is [14]:
1. Engine not able to start
2. Overheating
3. Slow down
4. Oil pressure
31
1. Engine not able to start:
Engine not able to start is most probably due to a not sufficient air or fuel supply. This
means all fuel and air paths in the engine must be unconstrained.
If the engine cannot overcome the cranking phase when starter motor is active the list
of causes and action suggestions as stated by [14] are:
Battery capacity low:
• Check that electrolyte level is above the plates.
• Try to start the engine on the other bank of batteries. Failing this, try to start the
engine on both banks of batteries. Never continue to use a battery if the starter motor
is sluggish because high discharge rates will buckle the battery plates.
• Take the specific gravity of each cell of the battery. A fully charged battery would
have a specific gravity reading in each cell of 1.26 where as a flat battery would give
a reading of 1. 1 0. The specific gravity reading should not vary more than 0.030
between cells. A lower reading on one cell usually indicates the battery needs
replacing
Battery connection dirty:
Check that the connections to and on the battery is clean and tight. A dirty or loose
connection can be identified by the heat it generates.
Bad electrical connection to starter motor:
The starter motor draws the most load on the battery especially on diesel engines because
of their high compression ratios. The electrical connections must therefore be tight and
clean.
Faulty starter motor:
The starter motor could be burnt out or the pinion is not engaging with the ring gear on
the flywheel.
32
Incorrect grade of the lubrication oil:
If the oil is too thick, the engine will not attain sufficient speed on the starter motor to
generate the amount of heat required on the compression stroke to ignite the fuel.
Engine has been overhauled and it is tight:
The parts of an overhauled engine are brought back to their correct clearances. In these
clearances there will be a number of high spots and they will be worn away as the engine
is run in. When the engine is run in, it will turn easily. The engine will not attain sufficient
speed on the starter motor to generate the amount of heat to ignite the fuel.
Air cleaner restriction:
The air cleaner is choked, blocking or restricting the air required for the engine.
Exhaust gas restriction:
• Could be caused by a bucket left on the outlet of a vertical exhaust pipe to prevent
rain water entering the engine or by the automatic flap valve fitted for this purpose
and is stuck in the closed position.
• Occasionally a baffle could come loose in a silencer and block the passage of exhaust
gas.
• The air must be compressed to a high enough temperature to ignite the fuel. This is
usually due to low or poor compression. Compression pressure can be checked by
replacing each fuel injector in rum with a compression gauge.
Fuel tank empty:
Fuel piping could develop a leak emptying the contents of the fuel tank into the bilges.
Blocked fuel feed line:
The suction valve on the fuel tank could have vibrated closed or someone could have
closed the emergency fuel shut off valve.
Faulty fuel lift pump:
Fuel is not being delivered from the fuel tank to the engine. If it is of the diaphragm type,
the diaphragm could be perished or damaged. The drive to the pump could be damaged.
33
Choked fuel filter:
The fuel filter has choked up with foreign matter as to prevent the full flow of fuel. The
filter may not have been changed at its recommended period. A bad batch of fuel may
have been received. The filter may require changing at more frequent intervals until the
system is clean.
Air in fuel system:
Air is compressible where fuel is not. Air in a fuel system will cause the engine to
malfunction or not start. Air usually enters the fuel system when repairs are carried out
or where there is a fuel leak. This air must be bled off until a bubble free fuel is obtained.
Some fuel systems have a manual priming handle on the fuel lift pump or on the fuel
injection pump. In addition, there are bleed valves throughout the system, such as on
filters or water separators.
Faulty fuel injection pump:
The pump is not delivering the fuel to the injector
Faulty fuel injectors:
The valve pintle may be seized shut in its nozzle and no fuel is delivered to the cylinder.
The holes or orifices in the nozzle may be blocked. The valve pintle may not be sealing
on its seat.
Incorrect fuel pump timing:
The fuel is not being delivered to the fuel injector at the precise moment in the cycle. The
engine could have been overhauled and the timing of the fuel pump was incorrectly
carried out. It is possible for the timing to alter whilst the engine is running due to
insufficient tension on the fuel pump coupling bolts.

34
2. Overheating:
Overheating is detected by reading high temperature values of the cooling, oil or exhaust
temperature gauge. If the temperature increase gradually it is probably sign of wearing or
strained flow surfaces and sudden increase in temperature would mean faulty thermostat, pump
or engine overload.
The list of the failure root causes is as stated by [14]:
Sea water intake grid:
Could become clogged over a period of time so there would be a gradual increase in the
fresh water cooling temperature. Reduce the engine speed until the normal operating
temperature is obtained, or take steps to remove the obstruction.
Clogged sea water strainer:
• Could become clogged over a period of time so there would be a gradual increase in the
fresh water cooling temperature. Reduce the engine speed gradually and stop the engine.
Clean out the strainer. Start the engine and let it idle until temperature stabilizes.
• Alternately the vessel may have voyaged through matter which quickly clogged the
strainer. Take the above action.
Thermostat not opening fully:
• When the engine is cold the thermostat is in the closed position. Water is circulated
through the engine only. As the engine reaches its operating temperature, the thermostat
opens and allows the water circulating through the engine to pass through the fresh water
cooler or the keel cooling pipes.
• Should the thermostat stay in its closed position or not open fully, the engine will
overheat. Feel the pipe from the thermostat housing to the fresh water cooler. This will
indicate whether or not water is flowing through it. Reduce the engine speed gradually
and stop the engine. When the engine has cooled down, replace the thermostat. Should
you be at sea and have no replacement thermostat, the engine can be run with the a
thermostat removed.

35
Faulty impeller in sea water pump:
• A faulty impeller in the sea water pump could be damaged. Damage usually occurs
when the pump is run dry. The discharge pipe would be warm and not at the same
temperature as the sea water. Also, there would be no sea water discharge overboard.
Reduce the engine speed gradually and stop the engine. Replace the impeller.
• Should you be at sea and have no replacement impeller, it may be possible to reach port
at reduced speed, if the impeller is only partially damaged and can still pump some
water. Alternately, a sea water hose from the fire pump or the wash deck hose could be
connected up to the system at the discharge.
Keel cooling pipes low efficiency due to marine growth (only for keel cooled engines):
This causes a gradual increase in the fresh water temperature. Reduce the engine speed
gradually until the normal operating speed is obtained. The vessel will have to be slipped to
clean the keel cooling pipes.
Air in a sea water cooling system:
On a lot of vessels, air is trapped in the sea water cooling system when the vessel re-enters
the water after slipping. With the engine stopped, the air can be bled off by slackening off
the backing plate on a pump or loosening a join in the seawater cooling pipe on the suction
side of the pump that is below the water line. If it is a pump and it is run dry until the engine
overheats, the rubber impeller will be severely damaged.
Low speed of the water pump:
On some vessels the sea water pump is belt driven from the engine. The adjustment of the
belt may cause it to slip. Reduce the engine speed gradually and stop the engine. Adjust the
belt tension.
Faulty impeller:
A faulty impeller in the fresh water pump could be damaged. Reduce the engine speed
gradually and stop the engine. Replace the impeller. Should you be at sea and have no
replacement impeller, it may be possible to reach port at reduced speed if the impeller is
only partially damaged and can still pump some water.
36
Scale buildup on cylinder water jackets:
Fresh water contains impurities. They come out of solution at high temperatures and will
adhere to hot surfaces. The scale will stop the transfer of heat from the combustion process
to the fresh water cooling and, in the case of passages, will restrict the flow. This will be a
gradual process. Reduce the engine speed until normal operating temperature is attained.
Tight engine parts causing friction:
A new or overhauled engine normally runs hotter because it is tight. As the engine is run in,
the high spots disappear. The engine turns easily, thereby reducing the operating
temperature. Reduce the engine speed so that it runs at its normal operating temperature.
Cooling water level too low:
• A leak has developed in the fresh water system causing a loss of water in the header
tank. It could be a leak in the piping, seal in the pump or a blown cylinder head gasket.
Reduce the engine speed gradually and if the fresh water system is the unpressurised
type, very slowly top up the header tank to its correct level.
• If the fresh water system is of the pressurized type, reduce the engine speed gradually
and stop the engine. Let the engine cool down. Start the engine and very slowly top up
the header tank to its correct level. If there is very little water in the header tank, it is
advisable to stop the engine and let the engine cool right down before adding fresh
water. If possible, the leak should be repaired.
Blown cylinder head gasket:
A cylinder head gasket leaking will be indicated by bubbles in the header tank. The extent
of the leak will determine the amount of bubbles. However, when the engine is stopped,
there is no pressure in the cylinder. The header tank is above the cylinder thereby putting
pressure (a head) on the water. The water would then flow through the leak in the cylinder
head gasket into the cylinder.
37
Engine overload:
Engine in the overload can enter due to dirty hull, rope around the propeller, bent propeller
blade, large pitch propeller. The engine speed should be reduced until the normal operating
temperature is attained. To stop overheating, it would be necessary to
clean the hull of marine growth, or repair any damage to the prop.
Dirty or damaged fresh water cooler:
The sea water discharged overboard would be restricted. It is unusual for the cooler to be
completely blocked. Reduce engine speed until normal operating temperature is attained.
Stop engine and clean the cooler or return to port under reduced speed.
3. Slowdown:
Slowdown of the ship during voyage can lead to a dangerous outcomes especially under
severe weather conditions. The most common cause of the slowdown is the fuel supply.
The list of the possible failure root causes is as stated by [14]:
Fuel tank empty:
Isolate the damaged fuel tank and use another one
Fuel tank outlet pipe split or corroded:
Carry out temporary repair to pipe by placing a piece of rubber around it, then a thin bit of
metal to give the rubber some support and attach them with hose clips. Isolate empty fuel
tank and use another fuel tank.
Water in the fuel
Drain off the water at the fuel tank and, if fitted, at the water separator.
Clogged fuel filter
Depending on the type of filter, clean the filter or replace the disposable element.
Faulty fuel lift:
Pump failure. Replace the pump.

38
4. Oil pressure:
The oil pressure loss causes severe mechanical damage on the engine. The drop can
happen suddenly or continuously. Over a sudden oil pressure drop, the engine needs to be
shut off immediately and is usually followed by alarm sound., The list of the possible failure
root causes is as stated by [14]:,
Insufficient level of oil in the sump:
May cause a fluctuation of the oil pressure as the vessel rolls, the pump could lose suction
and air enters it. Reduce speed and top up the sump to the correct level.
Lubrication oil pump strainer clogged:
The additives in the oil keep the foreign matter and sludge in suspension for the filter to
remove. Signs of a dirty filter would usually be a gradual drop in pressure. If possible, clean
the strainer.
Faulty lubrication oil pump:
If the drive to the pump has sheared, there would be no oil pressure at all. The engine must
be stopped immediately otherwise severe damage will occur. Should the gears or rotors of
the pump be worn or too much clearance between them and the backing plate, there will be
a gradual drop in oil pressure. If the lower oil pressure is sufficient, voyage at reduced speed
back to port.
Faulty relief valve:
The pressure relief valve may be stuck in the open position or its spring may have broken.
A cold engine when started, will have a high oil pressure which will cause the relief valve
to open. The engine’s oil pressure drops as the engine reaches its normal operating
temperature and the oil thins out. This results in the relief valve closing. Should the relief
valve stick in the open position or the spring break, the oil pressure will drop below normal.
Free up the sticking relief valve or replace the relief valve spring.
39
Filter partially blocked:
With the filter being partially blocked, the flow of oil will gradually be restricted. Lower oil
pressure will occur and be indicated on the pressure gauge until the filter by-pass valve
opens. Replace the filter element or clean the filter (centrifugal type).
Oil temperature too high:
A high oil temperature will thin the oil out causing it to run more easily with a resulting
drop in oil pressure. This could be caused by a worn engine which would have fresh water
overheating as well. Alternately, it could be caused by a dirty oil cooler on the sea water
side. Run the engine at a slower speed until the normal operating oil pressure is obtained
and voyage home. Alternately, clean the tubes in the oil cooler.
Faulty oil pressure gauge:
A faulty oil pressure gauge could indicate a low oil pressure where in fact the actual pressure
is correct. If the oil pressure gauge is suspected, try another one.
Fracture lubrication oil pipes:
Will result in a gradual or sudden drop in pressure if the pipe splits. If it is possible, repair
the leak. If the lower oil pressure is sufficient, steam at reduced speed back to port.
Water in the oil:
Water mixing with oil will result in emulsified oil. It is grey/white or sometimes described
as milky in color. Emulsified oil loses its lubricating properties. When a certain amount of
emulsification takes place, the oil pressure will drop below normal. Stop the water leak and
change the lubricating oil.
Fuel in the oil:
Fuel contamination will thin out the oil and it will run easily off the dip stick. There will be
a rise in the level in the sump. The dip stick will also have a fuel smell. Fuel contaminated
oil loses its lubricating properties and the oil pressure will drop below normal. Stop the fuel
leak and change the lubricating oil.
40
Regular maintenance is of high importance to keeping the engine healthy. It depends on the
engine manufacturer suggestions such as engine hours, fixed dated due to fluid aging
characteristics, oil grades, cumulated time on specific load, etc. The routine checks of engine
performance parameters and states are done on daily basis, some on monthly, etc. and are
logged into the logbook.
The intervals are engine and condition dependent and what follows is an average procedure
recommended by [14] for a small medium and high-speed diesel engine.
Daily checks:
Check lube oil level in engine and gearbox, water levels, fuel level, drain water trap (or tank),
visual check of all V belts for wear and tension, engine and hoses for water/oil leeks, listen for
knocks or rattles. check gauges, grease any grease nipples on pumps, check battery
Every 50 Hours:
Clean fuel filters and remove condensation.
Every 250 hours:
Replace fuel filter, change lube and gearbox oil, replace lube oil filter, clean thermostat, check
and adjust governor linkage, check and adjust valve clearance, re-tighten major bolts, clean air
filters and replace if necessary
Every 500 hours:
Replace zincs in engine, check rubber impellors, check fuel pump, check injectors (spray
pattern, injection pressure, clean)
Every Year:
Valve grind, check rocker arms and valve guides, overhaul, clean and check piston rings, check
Con rod (bearings, bolts and torque), check crank arm deflection
Every two years:
Main bearings, crank shaft, clutch/gearbox
41
5 ENGINE DIAGNOSTIC METHODS
The influence of engine condition change can be reduced with regular maintenance, thus
various condition monitoring systems are introduced. There are systems provided by engine
manufacturers and also 3rd party systems. They can all be divided in a few system types:
• Measurement data trend monitoring
• Vibroacoustic analysis
• Endoscopic methods
• Exhaust gas composition analysis
• Data driven statistical methods and neural networks
• Model based diagnostic
The various types of fault detection methods are reviewed by [37] and the newest approaches
using machine learning, artificial intelligence, fuzzy logic, etc. methods are demonstrated in
detail by [38].
5.1 Measurement dana trend analysis
Most of the tools on the market are based on the engine sensor parameters monitoring.
The parameters are usually obtained from the data network in the engine room or are available
on the standardized diagnostic data ports which are usually CAN based. From the history of the
parameter logging, it is possible to determine the parameter trend and gradient. Based on the
determined trends, the experience based diagnostic warnings are implemented into the applied
tools. The warnings are also based on predefined sensor warning or alarm threshold values. One
of the segment representatives is MAN B&Ws CoCoS-EDS [15]. It is engine diagnostic system
dedicated for diagnostic and monitoring of large marine engines. It is focusing on
turbocharging, combustion, injection, airpath, oil and water pressures and temperatures,
component temperatures, air and charge air cooler cleanness and exhaust gas boiler state. The
system uses standard alarm monitoring values and additional sensors in order to make the
analysis more precise. The short term trend analysis the data is stored in 5 minutes intervals and
memory depth is two weeks. The long term trend analysis is based on short term daily based
values accumulated over maximum 2 years. The data flow diagram is shown on figure 16. The
data is logged every second. The data is processed in a form of the raw data. The raw data is
then being filtered by calculating relevant information for further use. The data is than being

42
grouped to the specific data branch. It is possible to add data manually if the measurement
source was external. The data flow consists of a nominal values which serve as the reference
for further diagnostic tasks. The reference is obtained by healthy engine measurements and
stored in that way. The system monitors the current operating values and can display them in
forms of charts, curves, etc. Based on the monitored values diagnostic is performed. The
diagnose is mainly based on the detection of the wear or the failure detected by temperature
differences and its rise, pressure drops, indication pressure traces change and its comparison to
the nominal data. It also suggests further actions in order to eliminate the symptoms or the
failure.
There are other data trend monitoring system under which the The Data Trend by
Norcontrol [39], CC-10 by B&W [40], Comos and DMTAS by Mitsubishi [41]. There are
others on the market as well for medium speed 4 stroke as well as large slow speed engines.
The research of the market holders is shown in the Appendix 1 containing not only engine
diagnostic but also engine optimization as well as trim position and route optimization which
contributes to fuel savings and engine durability.

43
Figure 16 Data Flow CoCoS [16]
The benefit of this kind of a system is constant monitoring and having insight into the historic
engine behavior. The downsize is that the only failure predictiveness is based on the trend
monitoring which requires a lot of experience from user in order to make reasonable
conclusions. Another downsize is that in order to detect or monitor component health, sensors
need to be installed in or around it. There is weak failure symptom correlation for detection root
causes on the location further than monitored ones.
44
5.2 Vibroacoustic analysis
This method is based on the measurement of the vibrations of the engine. Since every
engine component vibrates, the biggest challenge is to isolate the component contribution
during the spectral analysis. The change in the frequency spectrum is being monitored and by
knowing the source of vibration different kind of anomalies can be detected. The most common
are the thermal processes, combustion roughness caused by injection system failures,
component wearing and cumulation of the composition on the specific friction relevant
components. The method operates in real-time and uses Fast-Fourier analysis or digital filtering
for the vibration signal processing.
The acoustic method is also present for the detection of the wearing, corrosion and other
types of settlement or damage on the material. The acoustic wave is sent throughout the material
which has a specific amplitude. The amplitude of the vibration decreases with the time and
distance and is described by its envelope shape. When the envelope shape changes, it indicated
the abnormalities in the material.
The benefit of this method is usage of a single or minor number of measurement locations
to obtain the vibration signals for further processing. From this signal it is possible to diagnose
the failures on locations other than the measurement points. The downsize of the method is
complexity of component vibration detection in a spectrum which makes the method sometimes
not reliable and there is no predictiveness of the failure detection.
5.3 Endoscopic methods
It is visual inspection of the engine components by using endoscopes. It is used for tight
areas such as combustion chamber or turbocharger. In combustion chamber it is possible to
inspect piston, liner, cylinder head, exhaust valves, etc. the endoscopy can be performed in 3
dimensions with single lens which gives us picture in 3 dimensions.
The benefit of this method is reliable detection of the damages on the material which
online systems are not able to detect. The downsize is that it requires engine to be in shut down
in order to perform the measurements. There is also no predictiveness of the failure into this
approach.
45
5.4 Exhaust gas composition analysis
Exhaust gas composition analysis is performed using portable emission device. Ideally
the device should be placed as close to cylinder exhaust valves, normally on the pipe on the
exhaust collector. This method measures exhaust emission components and by comparing it to
engine shop data or latest healthy engine state, it is possible to bring the conclusion on the
injector state, injection timing, wearing, etc. For example, higher NOx emissions mean higher
in-cylinder peak temperatures which is probably cause by premature injection. CO emissions
are corelated to combustion efficiency, HC to injector leakage, etc.
The benefit of the system is that it requires a single point for the measurement and is able
to provide the data from which more detailed conclusion on combustion process can be made.
The downsize of the method is that it hard or impossible to determine any root cause of the
failure outside of the combustion chamber in a direct way. Another downsize is that has not
failure predictiveness capabilities.
5.5 Data driven statistical methods and neural networks
Since modern ships stream the data over the standardized protocols direction engine room
through ship communication network, the data became the valuable source for diagnosing the
engine condition. When dealing with large amount of historic data, by using statistical methods
it is possible to predict the probabilities of the specific component failures. The prediction
quality depends mainly on the historic data amount, data quality and encountering similar
events during the data collection period.
Except applying statistical methods on data, the artificial neural networks can be applied
as well. The example is shown on the fishing vessel [17].

46
Figure 17 Application of Artificial Neural Networks for marine engine fault diagnosis [17]
The process on the figure 17 is described in the 4 steps. First step is dana acquisition, step 2 is
dana selection, purging and conditioning, step 3 of the engine model and finally step 4 is fault
diagnosis. In the data acquisition phase the combustion, turbocharger, fuel condition and the
electrical consumption parameters were measured I time duration of 2 years with more than
10000 engine operating hours. In the second step the data was purged or filtered by removing
implausibility as well as for modelling nonrelevant engine operation. After purging the data, all
relevant input and output variables are defined and finally data is being processed by calculation
some engine relevant parameters and averaging desired measured or calculated data.
After data preparation, sensitivity analysis is performed in order to determine the weighting
factors for each variable. In step 3, three-layer feed-forward network is trained by data obtained
during the measurement phase. The final phase, fault diagnosis, is based on dirty turbine, air
filter, charge air cooler and bad fuel injection detection. The system frame is finally divided
into sensors, neural network engine model and fault detection as in figure 18. Fault is detected
when fuel consumption deviates more than 3% from the one obtained by the measurement.

47
Failure cause is detected by comparing simulated data from the one obtained by the
measurement and if simulation deviates more than predefined threshold with reference to the
measurement, failure root cause is detected.
Figure 18 System overview of using neural networks for marine engine failure detection [17]
The benefit of this system is that it runs online and evaluates the engine states constantly. The
downsize is the long measurement period for getting the data for the model buildup, model
extrapolation capabilities are minor which means low predictability of the failures which
happen out of the scenario range which was obtained during the measurement campaign.
5.6 Model based diagnostic
Model based methods use models as the representation of the physical component which
is being observed. The simulation results are compared with the physical unit of interest and
from its observations, the faults can be detected. The fault is the abnormal behavior of the
component or the system which does not meet function specification and can lead to a failure
[42]. By comparing the simulation to the measurement values the residuals are being calculated.
Having the residual near zero point to no fault and if different than zero, indicates the

48
component or system fault. There are different ways of handling the residuals. One of the is
null hypothesis. By observing the residuals, if null hypothesis conditions are holding, there is
no fault happening. The null hypothesis conditions or rules are defined by probability theory.
The threshold is defined and when the residuals are withing there is no fault, when the threshold
is exceeded, the fault is detected [43]. The most popular hypothesis used in diagnostics are
Sequential Probability Ratio Test [44], Cumulative Sum algorithm [45] and General Likelihood
Ratio Test [43]. The residuals estimation can also be conducted by using the technique called
parameter estimation [46, 47]. The system is modeled using mathematical equations and in the
equations relevant parameters are defined such as, blow-by coefficient, turbocharger efficiency,
etc. the parameters are initially calibrated and during the evaluation phase re-adjusted to
reproduce the current behavior of the component or the system. The parameters can be
estimated using optimization techniques such as Kalman filter [48, 49], weighted least squares
[50] and others. If the parameter differs from the nominally calibrated value, the fault is being
detected and points to the location of the possible failure. This method was applied in the marine
engine model based diagnostic approach by [19] and is widely used in gas turbine industry [51-
56].
As the lack of predictability in the previous methods presented in chapter 5 shows
difficulties when diagnosing the engine fault and specially over the lack of capability to
consider engine retrofitting where the actual engine data is compared to the one obtained in the
past during the measurement campaign, model based diagnostic is introduced. The central part
of the diagnostic is the thermodynamic physical based engine model [18]. The engine model
and its auxiliaries are calibrated on the engine shop or sea trial data. The modeled parameters
have focus on in-cylinder combustion, exhaust temperatures and the turbocharger. The
simulation model shows the reference engine behavior under the current conditions and based
on the modifications needed to match the status of the currently running online measurements,
the reasonable conclusions for the fault diagnostic can be done. The modifications are done in
the engine model constants.
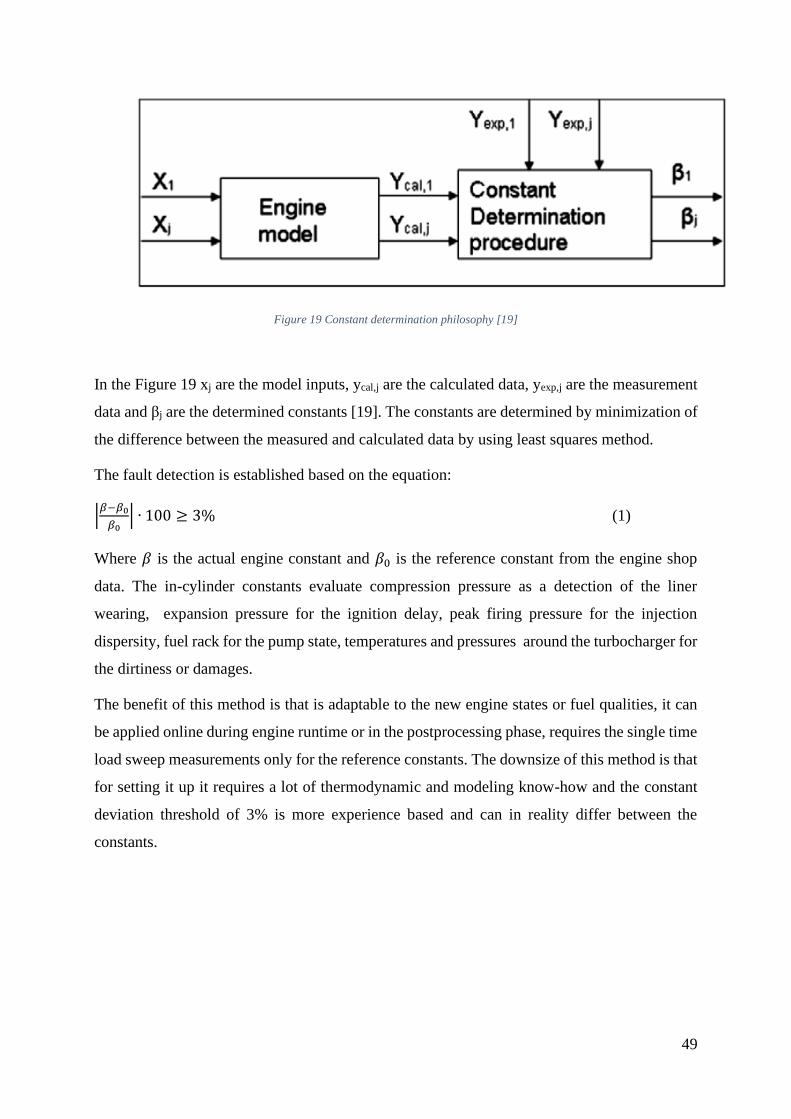
49
Figure 19 Constant determination philosophy [19]
In the Figure 19 xj are the model inputs, ycal,j are the calculated data, yexp,j are the measurement
data and βj are the determined constants [19]. The constants are determined by minimization of
the difference between the measured and calculated data by using least squares method.
The fault detection is established based on the equation:
|𝛽−𝛽0
𝛽0| ∙ 100 ≥ 3% (1)
Where 𝛽 is the actual engine constant and 𝛽0 is the reference constant from the engine shop
data. The in-cylinder constants evaluate compression pressure as a detection of the liner
wearing, expansion pressure for the ignition delay, peak firing pressure for the injection
dispersity, fuel rack for the pump state, temperatures and pressures around the turbocharger for
the dirtiness or damages.
The benefit of this method is that is adaptable to the new engine states or fuel qualities, it can
be applied online during engine runtime or in the postprocessing phase, requires the single time
load sweep measurements only for the reference constants. The downsize of this method is that
for setting it up it requires a lot of thermodynamic and modeling know-how and the constant
deviation threshold of 3% is more experience based and can in reality differ between the
constants.
50
6 MARINE ENGINE DIGITAL TWIN
From the diagnostic methods stated above it can be concluded that optimal diagnostic
method should be non-intrusive, should operate online during engine running hours constantly,
should be easily adaptable (after engine retrofit, different fuel characteristics, et.), require as
less possible sensor information (ideally no additional sensors as engine already has installed
by engine manufacturer) and needs to be predictive. The only method which can comply with
all requirements stated above is the one based on the advanced digital twin. The digital twin
must combine a few technologies used in nowadays diagnostic system such as data trending,
advanced physical models including combustion, emissions, turbocharging and fuel path with
easily adjustable calibration coefficients who are adapted by current sail condition or engine
state by using machine learning methods.
The market is recognizing the importance of the digital twins in the marine applications.
As stated by classification society DNV GL [20] the digital twin is an asset that can create the
value for the all stakeholders in the marine industry. For the shipowners who are using more
and more complex propulsion systems that coexist with other onboard power generation and
consumer systems as a part of the onboard energy distribution, digital twins can serve to test,
verify and certify such systems. It gives them the insights on operational data, possibility of
optimization of the performance and reduction of operational costs especially when applying
on the overall fleet. One of the most significant use cases is the possibility for the fault
diagnostic or maintenance predictions as well as post-retrofit benchmark. The benefit when
dealing with operational analysis is that the digital twins can simulate the historic operations,
real-time as well as predict the system behavior for the future scenarios. The Original
Equipment Manufacturers can gain by integrating the simulation models during the design
phase ensuring that components perform properly as a part of the larger system. It also opens
the possibility for the monitoring and predicting the component maintenance intervals as a part
of condition based maintenance approach during the component lifetime. The classification
societies have also noticed the high need for this technology in the future in terms of secure
reporting followed by monitoring, digital twins applications in terms of condition based
maintenance, vessel operation optimization, fuel and emission predictions. Lloyd’s Register
even introduced Digital Compliance framework under which the digital twins can be tested,
verified and certified [21]. The application and development of digital twins need to go through
quite a few challenges. The shipowners and other shareholders will need to get used to the new
51
tools or toolchains, rise of the new business models which derive from the application of digital
twins, standardization of the naming conventions, data quality, model connection interfaces,
etc. One of the major challenges is the competence to build and calibrate predictable and robust
simulation model. The simulation model or the digital twin of the specific physical asset can be
ship hydrodynamic model, propeller model, ballast water treatment model, etc. As the
machinery is the most critical and expensive part to fail on the ship, the thesis will be focused
on the digital twin for the diesel propulsion engine applied on 2 stroke large engines and 4
stroke medium speed engines.
In order for model based diagnostic method to avoid triggering false fault detections, it
requires the model to be robust and predictable. One of the most advanced system simulation
tools, AVL Cruise M was chosen as the core platform for digital twin implementation,
calibration and testing. Except advanced physical models, multiple degrees of freedom on
model calibration process, it is 0 dimensional based simulation tool which is able to deliver
results in real-time. Real-time simulation is one of the main model requirements for online
diagnostic operations in closed-loop with the real engine and user.
6.1 Cylinder Model
Cylinder model is built from number of sub-models such as Port In –representing inlet
port opening surface and flow characteristics, Direct Injector – representing rail and injector
model, Port Out –representing exhaust valve opening surface with variable opening and
closing angles, the Combustion Chamber contains geometrical data and combustion models
and finally SW (solid wall) elements representing the temperatures of the components in the
cylinder.
5.
For the prediction of the combustion, AVL´s Multi-Zone Combustion model is evaluated.
As described in Cruise M Manual [22] the model divides the spray into a high number of
zones, Fig 20. The benefits of using the multizone model towards more conventional
approaches is described by [23].The sub-models of charge entrainment, evaporation, ignition
delay and combustion are calculated for each zone. Each injection package is divided into
the number of radial zones. The total number of zones depends on duration of injection,
calculation time-step and discretization in the radial direction.
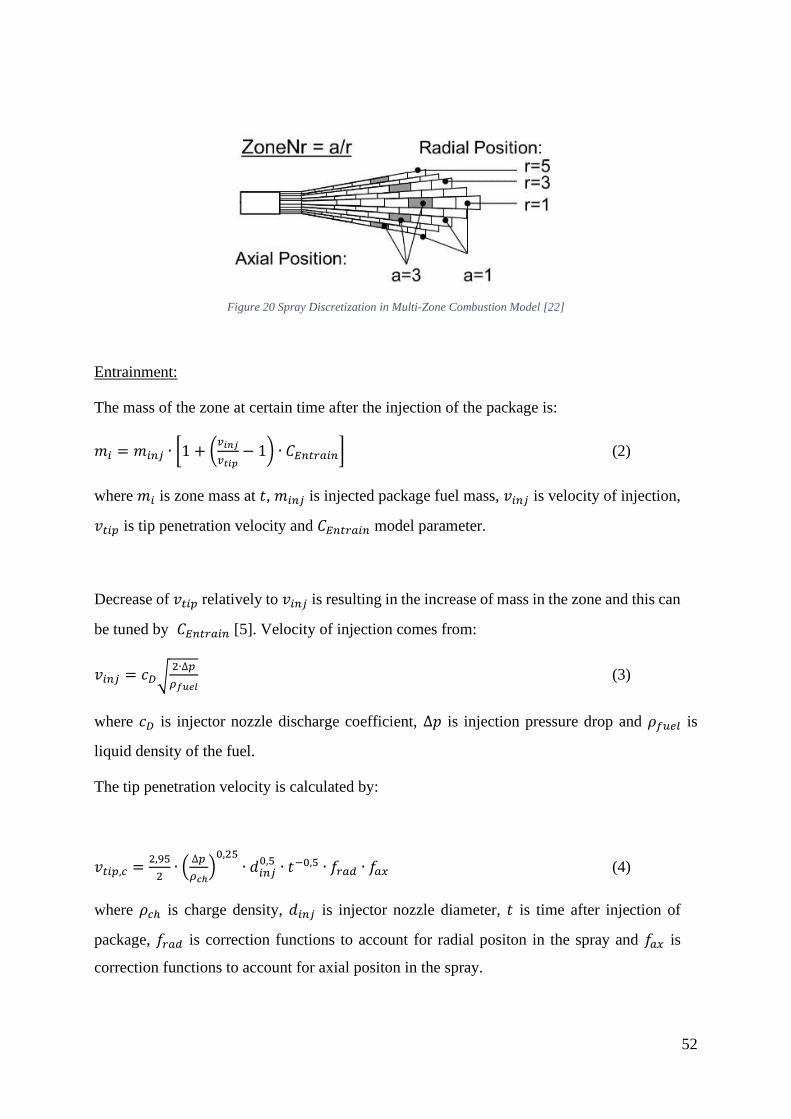
52
Figure 20 Spray Discretization in Multi-Zone Combustion Model [22]
Entrainment:
The mass of the zone at certain time after the injection of the package is:
𝑚𝑖 = 𝑚𝑖𝑛𝑗 ∙ [1 + (𝑣𝑖𝑛𝑗
𝑣𝑡𝑖𝑝− 1) ∙ 𝐶𝐸𝑛𝑡𝑟𝑎𝑖𝑛] (2)
where 𝑚𝑖 is zone mass at 𝑡, 𝑚𝑖𝑛𝑗 is injected package fuel mass, 𝑣𝑖𝑛𝑗 is velocity of injection,
𝑣𝑡𝑖𝑝 is tip penetration velocity and 𝐶𝐸𝑛𝑡𝑟𝑎𝑖𝑛 model parameter.
Decrease of 𝑣𝑡𝑖𝑝 relatively to 𝑣𝑖𝑛𝑗 is resulting in the increase of mass in the zone and this can
be tuned by 𝐶𝐸𝑛𝑡𝑟𝑎𝑖𝑛 [5]. Velocity of injection comes from:
𝑣𝑖𝑛𝑗 = 𝑐𝐷√2∙∆𝑝
𝜌𝑓𝑢𝑒𝑙 (3)
where 𝑐𝐷 is injector nozzle discharge coefficient, ∆𝑝 is injection pressure drop and 𝜌𝑓𝑢𝑒𝑙 is
liquid density of the fuel.
The tip penetration velocity is calculated by:
𝑣𝑡𝑖𝑝,𝑐 =2,95
2∙ (
∆𝑝
𝜌𝑐ℎ)
0,25
∙ 𝑑𝑖𝑛𝑗0,5 ∙ 𝑡−0,5 ∙ 𝑓𝑟𝑎𝑑 ∙ 𝑓𝑎𝑥 (4)
where 𝜌𝑐ℎ is charge density, 𝑑𝑖𝑛𝑗 is injector nozzle diameter, 𝑡 is time after injection of
package, 𝑓𝑟𝑎𝑑 is correction functions to account for radial positon in the spray and 𝑓𝑎𝑥 is
correction functions to account for axial positon in the spray.
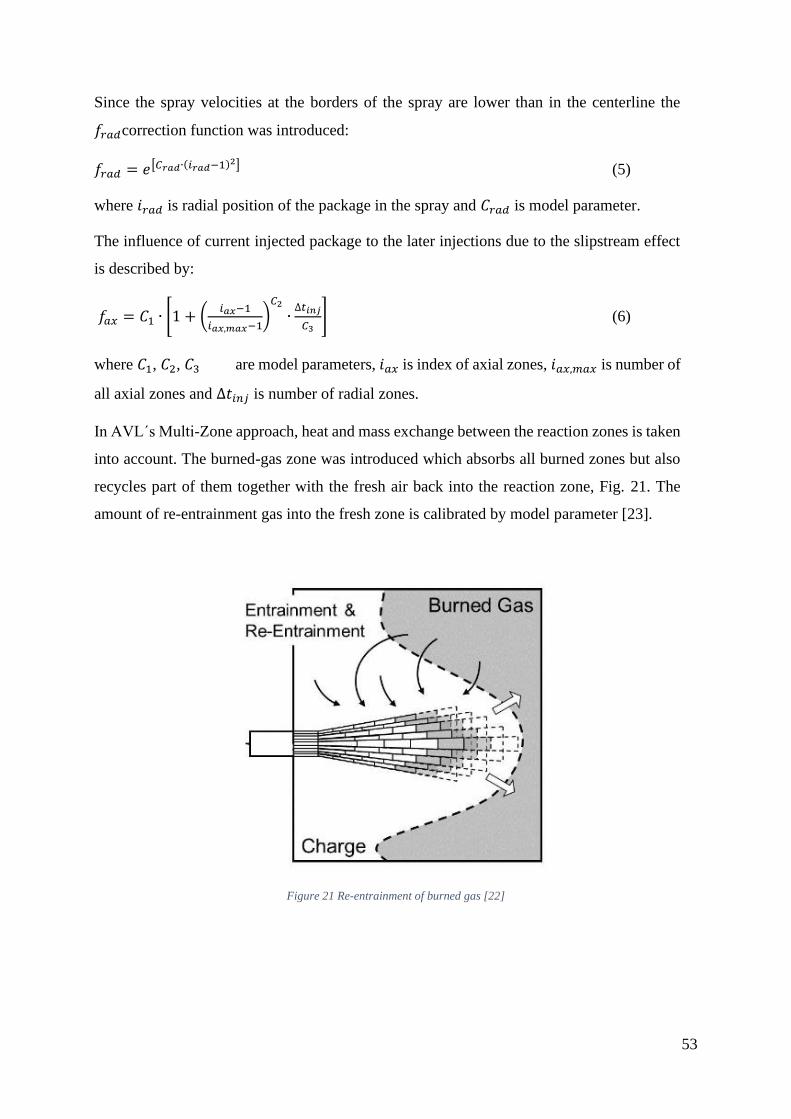
53
Since the spray velocities at the borders of the spray are lower than in the centerline the
𝑓𝑟𝑎𝑑correction function was introduced:
𝑓𝑟𝑎𝑑 = 𝑒[𝐶𝑟𝑎𝑑∙(𝑖𝑟𝑎𝑑−1)2] (5)
where 𝑖𝑟𝑎𝑑 is radial position of the package in the spray and 𝐶𝑟𝑎𝑑 is model parameter.
The influence of current injected package to the later injections due to the slipstream effect
is described by:
𝑓𝑎𝑥 = 𝐶1 ∙ [1 + (𝑖𝑎𝑥−1
𝑖𝑎𝑥,𝑚𝑎𝑥−1)
𝐶2
∙∆𝑡𝑖𝑛𝑗
𝐶3] (6)
where 𝐶1, 𝐶2, 𝐶3 are model parameters, 𝑖𝑎𝑥 is index of axial zones, 𝑖𝑎𝑥,𝑚𝑎𝑥 is number of
all axial zones and ∆𝑡𝑖𝑛𝑗 is number of radial zones.
In AVL´s Multi-Zone approach, heat and mass exchange between the reaction zones is taken
into account. The burned-gas zone was introduced which absorbs all burned zones but also
recycles part of them together with the fresh air back into the reaction zone, Fig. 21. The
amount of re-entrainment gas into the fresh zone is calibrated by model parameter [23].
Figure 21 Re-entrainment of burned gas [22]
54
The heat exchange between the zones is calculated by:
𝑑𝑞𝑍𝑡𝑜𝐶ℎ
𝑑𝑡= 𝛼ℎ𝑡 ∙ 𝐴𝑖 ∙ (𝑇𝑖 − 𝑇𝑐ℎ) (7)
where 𝛼ℎ𝑡 is heat transfer coefficient,𝐴𝑖 is zone surface calculated from the zone volume
with assumption of its spherical shape, 𝑇𝑖 is temperature of zone and 𝑇𝑐ℎ is charge
temperature.
Evaporation:
The evaporation mechanism is calculated in 2 areas of droplet temperature separated by
critical temperature [24]. The evaporation rate below critical temperature is calculated by:
𝑑𝑚𝑓𝑣
𝑑𝑡|
𝑇𝑙<𝑇𝑐𝑟
= 𝐶𝐸𝑣𝑎𝑝 ∙ 𝜋 ∙ 𝑆𝑀𝐷 ∙ 𝐷𝑣 ∙ 𝑆ℎ ∙𝑝
𝑅∙𝑇𝑚∙ 𝑙𝑛 (
𝑝
𝑝−𝑝𝑠) (8)
and above critical temperature:
𝑑𝑚𝑓𝑣
𝑑𝑡|
𝑇𝑙>𝑇𝑐𝑟
= 𝐶𝐸𝑣𝑎𝑝 ∙ 𝐶1 ∙ 𝜋 ∙ 𝑆𝑀𝐷 ∙ (𝑝
6)
𝐶2
(9)
where 𝑆𝑀𝐷 is Sauter mean diameter, 𝑆ℎ is Sherwood’s number, 𝑝𝑠 is saturation pressure, 𝑝
is cylinder pressure and 𝐶𝐸𝑣𝑎𝑝, 𝐶1 and 𝐶2 are model parameters.
Heat transfer to droplet is calculated by:
𝑞 = 𝐶𝑒𝑡ℎ ∙ 𝜋 ∙ 𝑆𝑀𝐷 ∙ 𝜆𝑚 ∙ (𝑇𝑖 − 𝑇𝑙) ∙ 𝑁𝑢 ∙ (𝑧
𝑒𝑧−1) (10)
where 𝜆𝑚 is thermal conductivity, 𝑇𝑙 is temperature of liquid, 𝑁𝑢 is Nusselt number, 𝑧 is fuel
parameter and 𝐶𝑒𝑡ℎ is model parameter.
The Sauter´s mean diameter at breakup is calculated by:
𝑆𝑀𝐷𝑡𝑏 =12,392∙𝑑𝑖𝑛𝑗
0,44∙𝜌𝑓𝑢𝑒𝑙0,42 ∙(𝜎𝑓𝑢𝑒𝑙∙𝑣𝑓𝑢𝑒𝑙)
0,28
∆𝑝0,42∙𝜌𝑐ℎ0,28 (11)
where 𝜎𝑓𝑢𝑒𝑙 is surface tension of the fuel, 𝑣𝑓𝑢𝑒𝑙 is fuel flow velocity and 𝜌𝑐ℎ is charge density.
For model calibration 2 main parameters are used, 𝐶𝑒𝑡ℎ to control the heat up of the droplet
and 𝐶𝐸𝑣𝑎𝑝 for controlling the evaporation rate.
Ignition delay:
The auto ignition starts when progress variable reaches the value of 1.

55
∫1
𝜏∙ 𝑑𝑡 ≥ 1
𝑖𝑛𝑗+��
𝑖𝑛𝑗 (12)
where 𝜏 is characteristic ignition delay time and it is calculated by:
𝜏 = 𝐶𝐼𝑔𝑛𝐷𝑒𝑙 ∙ 𝑝−1,02 ∙ 𝑒
𝐶𝐼𝑔𝑛𝐸𝑥𝑝
𝑇𝐼𝑔𝑛𝐷𝑒𝑙 (13)
where 𝐶𝐼𝑔𝑛𝐷𝑒𝑙 is ignition delay parameter, 𝐶𝐼𝑔𝑛𝐸𝑥𝑝 is ignition delay exponent and 𝑇𝐼𝑔𝑛𝐷𝑒𝑙 is
temperature for ignition delay calculation and it represents mean spray temperature.
Combustion:
The fuel burning rate is defined by the reaction kinetic approach by Jung [25]. The
concentrations are set by the mass fraction of fuel vapor and air.
𝑑𝑥𝑓𝑏
𝑑𝑡= 𝐾𝑏 ∙ 𝜌𝑐ℎ
𝑎𝑝 ∙ 𝑥𝑓𝑣 ∙ 𝑥𝑂2
𝑏𝑂2 ∙ 𝑒−𝑐𝑎𝑟𝑟ℎ
𝑇𝑖 (14)
where 𝑑𝑥𝑓𝑏
𝑑𝑡 is the fuel burning rate, 𝐾𝑏 is chemical reaction parameter, 𝑥𝑓𝑣 is fuel vapor mass
concentration, 𝑥𝑂2 is oxygen mass concentration and 𝑎𝑝, 𝑏𝑂2
, 𝑐𝑎𝑟𝑟ℎ are model parameters.
NOX formation is based on [26] with the reactions based on Zeldovich mechanism and Soot
formation is based on [27].
6.2 Injection model
The injection model is made of rail and injector model. They are defined by geometry,
injection signals and profiles. The injection process is crank angle resolved.
The rail model is a 0D model and considers the compressibility of fluid and is calculated by:
𝑑𝑝𝑟𝑎𝑖𝑙
𝑑𝑡=
𝐸
𝑉𝑟𝑎𝑖𝑙∙
1
𝜌𝑟𝑎𝑖𝑙∙ (
𝑑𝑚𝑝𝑢𝑚𝑝
𝑑𝑡+
𝑑𝑚𝑖𝑛𝑗
𝑑𝑡) (15)
where 𝐸 is the bulk modulus for the working fluid, 𝑉𝑟𝑎𝑖𝑙 is rail volume, 𝜌𝑟𝑎𝑖𝑙 is density
of the fluid inside rail, 𝑑𝑚𝑝𝑢𝑚𝑝
𝑑𝑡 is mass flow through pump and
𝑑𝑚𝑖𝑛𝑗
𝑑𝑡 is mass flow through
injector.
Approach used for injector rate determination is based on injection velocity and nozzle area.
The flow coefficients are representing the friction and in the model they are introduced over
the hole and needle seat area, Fig. 22.

56
Figure 22 Injector hole and needle seat flow coefficients [22]
𝑑𝑚𝑖𝑛𝑗
𝑑𝑡=
√2 ∙ 𝜌𝑓𝑢𝑒𝑙 ∙ (𝑝𝑝𝑖𝑝𝑒 − 𝑝𝑐𝑦𝑙) ∙
1
(𝜁𝑁𝑆
𝐴𝑁𝑆2 +
𝜁𝑁𝐻
𝐴𝑁𝐻2 )
(16)
where 𝑑𝑚𝑖𝑛𝑗
𝑑𝑡 is injected fuel mass flow, 𝜌𝑓𝑢𝑒𝑙 is density of the fuel, 𝑝𝑝𝑖𝑝𝑒 is pressure inside
pipe, 𝑝𝑐𝑦𝑙 is pressure inside cylinder, 𝜁𝑁𝑆 is needle seat flow coefficient, 𝜁𝑁𝐻 is nozzle hole
flow coefficient, 𝐴𝑁𝑆 is area of needle seat and 𝐴𝑁𝐻 is area of the nozzle hole.
6.3 Cylinder wall temperature model
Cylinder wall temperature models is built from heat transfer between gas in the
cylinder and solid wall and from solid wall to the coolant. The heat transfer is calculated by:
�� = �� ∙ 𝑐𝑝 ∙ (𝑇𝑖𝑛𝑙𝑒𝑡 − 𝑇𝑤) ∙ [1 − 𝑒𝑥𝑝 (−𝐴𝑡𝑟𝑎𝑛𝑠∙𝛼∙𝐹𝐻𝑇∙𝐹𝑡𝑎𝑟𝑔𝑒𝑡
��∙𝑐𝑝)] (17)
where 𝐴𝑡𝑟𝑎𝑛𝑠 is heat transfer surface, 𝑇𝑖𝑛𝑙𝑒𝑡 is inlet fluid temperature, 𝑇𝑤 is wall temperature,
𝛼 is heat transfer coefficient, 𝑐𝑝 is specific heat capacity, 𝐹𝐻𝑇 is heat transfer multiplier,
𝐹𝑡𝑎𝑟𝑔𝑒𝑡 is factor used to evaluate target pressure drop or target efficiency and �� is mass flow
rate.
The temperature in the wall is built up from relation:
𝑚 ∙ 𝑐𝑝(𝑇) ∙𝑑𝑇𝑠
𝑑𝑡= ∑ 𝐻𝑖
(18)
where 𝑚 is solid wall mass, 𝑐𝑝(𝑇) is temperature dependent specific heat, 𝑇𝑠 is
temperature of the solid, 𝑡 is time and 𝐻𝑖 are heat fluxes.

57
The port, exhaust valve, piston, cylinder head and liner temperature models are built with the
same relations but different geometry characteristics.
6.4 Turbocharger model
The compressor power is calculated from enthalpy difference and mass flow defined
by turbocharger speed and pressure ratio map.
𝑃𝐶 = ��𝑐 ∙ (ℎ2 − ℎ1) (19)
where 𝑃𝐶 is compressor power consumption, ��𝑐 is mass flow rate in the compressor, ℎ2 is
enthalpy at the outlet of the compressor and ℎ1 is enthalpy at the inlet of the compressor.
The enthalpy difference is given by:
ℎ2 − ℎ1 =1
𝜂𝑠,𝐶∙ 𝑐𝑝 ∙ 𝑇1 ∙ [(
𝑝02
𝑝01)
𝜅−1
𝜅− 1] (20)
where 𝜅 is ratio of the heat capacity at a constant pressure to the heat capacity at constant
volume, 𝜂𝑠,𝐶 is isentropic efficiency of the compressor, 𝑐𝑝 is mean value of the specific heat
at constant pressure between the compressor inlet and outlet, 𝑇1 is compressor inlet
temperature and 𝑝02
𝑝01 is total to total compressor pressure ratio.
The same as for compressor the turbine power is calculated by:
𝑃𝑡 = ��𝑡 ∙ (ℎ03 − ℎ04) (21)
where 𝑃𝑡 is turbine power, ��𝑡 is mass flow rate in the turbine, ℎ03 is total enthalpy at
the turbine inlet and ℎ04 is total enthalpy at the turbine outlet.
The enthalpy difference is:
ℎ03 − ℎ04 = 𝜂𝑠,𝑡 ∙ 𝑐𝑝 ∙ 𝑇03 ∙ [1 − (𝑝4
𝑝03)
𝜅−1
𝜅] (22)
Where 𝜂𝑠,𝑡 is isentropic turbine efficiency, 𝑐𝑝 is mean specific heat at constant pressure
between turbine inlet and outlet, 𝑇03 is total turbine inlet temperature, 𝑝4
𝑝03 is turbine expansion
ratio, total to static and 𝜅 is ratio of the heat capacity at a constant pressure to the heat .
58
The turbocharger speed in stationary and transient behavior is given by:
𝑑𝜔𝑇𝐶
𝑑𝑡=
1
𝐼𝑇𝐶∙
𝑃𝑇−𝑃𝐶
𝜔𝑇𝐶 (23)
where 𝜔𝑇𝐶 is turbocharger wheel speed, 𝐼𝑇𝐶 is turbocharger wheel inertia.
6.5 Charge air cooler model
Pressure drop over the charge air cooler is defined by:
∆𝑝 = 𝐹𝑓𝑟 ∙ 𝜁 ∙𝐿
𝐷ℎ𝑦𝑑∙
𝜌∙𝜈2
2 (24)
where 𝐹𝑓𝑟 is friction force, 𝜁 is friction factor which a function of the Reynolds number, 𝐿 is
length, 𝐷ℎ𝑦𝑑is hydraulic diameter, 𝜌 density and 𝜈 kinematic viscosity.
The described digital twin is a generic diesel physical model. The major challenge is the
understanding and calibration of the model in order to achieve all the requirements that digital
twin is demanding. In the thesis, the digital twin will be calibrated referenced to the engine shop
measurement data for widely common 2 stroke large engine as well as 4 stroke medium speed
engine. The boundaries of the model will be determined and the automatic model calibration
method based on genetic algorithm optimization method will be assessed. The model will
afterwards be exercised in order to create sensor data behavior fault pattern matrices by
simulating the component failures with the digital twin. The patterns can be therefor used for
the automatic failure detection applications. The model can also be used for the optimization
purpose [57] as well as for emission monitoring [58].

59
7 DIGITAL TWIN APPLICATION METHODOLOGY
In recent years the digital technologies have rapidly evolved into the maritime sector. The
wider coverage of the GSM and the cheaper and efficient satellite data transfer made the cloud
computing technology accessible for the maritime sector. This opens the possibility to
interconnect all the stakeholder and offers opportunity for the new business models. The
cheaper sensors allowed wide spread of the measurable assets which can store the data locally
or send it directly to the cloud towards the data analytics algorithms. The big data technologies
coupled with the artificial intelligence offer faster and more precise conclusion extraction from
large amount of data as well as training the algorithms for the maintenance, diagnostic and
similar. The development of the simulation technologies puts the digital twins in the focus of
the digital applications for maritime sector. In large variety of the digital twin applications, a
few can be emphasized as a high value creators: maintenance requirement detection, sensors
measurement plausibility checks, fleet benchmarking, retrofit evaluation, fuel consumption,
emissions, failures predictions and complex system interaction predictions. The digital twin can
also be used for operation optimization by simulating optimal machinery settings during the
ship voyage.
Figure 23 Digital Twin application directions [20]
In the thesis the possible engine digital twin application usecases will be conceptually
created and are here introduced.
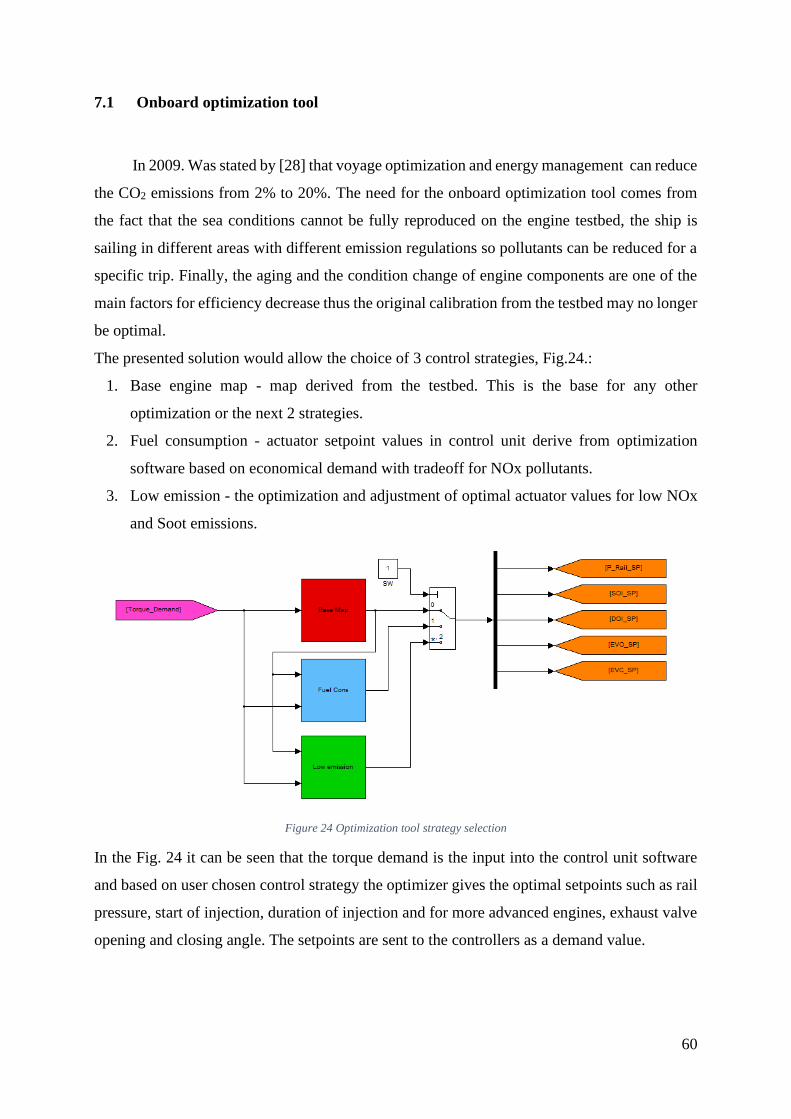
60
7.1 Onboard optimization tool
In 2009. Was stated by [28] that voyage optimization and energy management can reduce
the CO2 emissions from 2% to 20%. The need for the onboard optimization tool comes from
the fact that the sea conditions cannot be fully reproduced on the engine testbed, the ship is
sailing in different areas with different emission regulations so pollutants can be reduced for a
specific trip. Finally, the aging and the condition change of engine components are one of the
main factors for efficiency decrease thus the original calibration from the testbed may no longer
be optimal.
The presented solution would allow the choice of 3 control strategies, Fig.24.:
1. Base engine map - map derived from the testbed. This is the base for any other
optimization or the next 2 strategies.
2. Fuel consumption - actuator setpoint values in control unit derive from optimization
software based on economical demand with tradeoff for NOx pollutants.
3. Low emission - the optimization and adjustment of optimal actuator values for low NOx
and Soot emissions.
Figure 24 Optimization tool strategy selection
In the Fig. 24 it can be seen that the torque demand is the input into the control unit software
and based on user chosen control strategy the optimizer gives the optimal setpoints such as rail
pressure, start of injection, duration of injection and for more advanced engines, exhaust valve
opening and closing angle. The setpoints are sent to the controllers as a demand value.
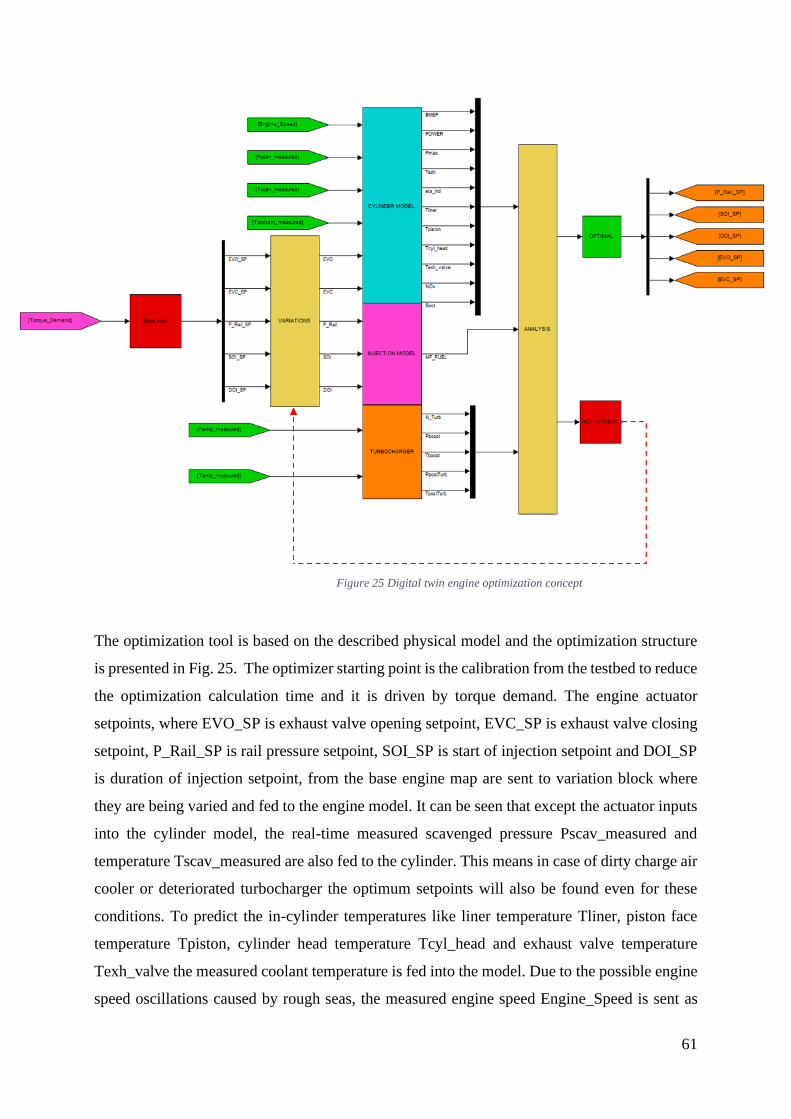
61
The optimization tool is based on the described physical model and the optimization structure
is presented in Fig. 25. The optimizer starting point is the calibration from the testbed to reduce
the optimization calculation time and it is driven by torque demand. The engine actuator
setpoints, where EVO_SP is exhaust valve opening setpoint, EVC_SP is exhaust valve closing
setpoint, P_Rail_SP is rail pressure setpoint, SOI_SP is start of injection setpoint and DOI_SP
is duration of injection setpoint, from the base engine map are sent to variation block where
they are being varied and fed to the engine model. It can be seen that except the actuator inputs
into the cylinder model, the real-time measured scavenged pressure Pscav_measured and
temperature Tscav_measured are also fed to the cylinder. This means in case of dirty charge air
cooler or deteriorated turbocharger the optimum setpoints will also be found even for these
conditions. To predict the in-cylinder temperatures like liner temperature Tliner, piston face
temperature Tpiston, cylinder head temperature Tcyl_head and exhaust valve temperature
Texh_valve the measured coolant temperature is fed into the model. Due to the possible engine
speed oscillations caused by rough seas, the measured engine speed Engine_Speed is sent as
Figure 25 Digital twin engine optimization concept
62
input into the cylinder model. The performance outputs from cylinder model that are used for
optimization are BMEP, POWER, in-cylinder peak pressure Pmax, exhaust temperature Texh
and indicated efficiency eta_ind. For the emission optimization, NOx, CO, CO2, HC and Soot
prediction is calculated.
The injection model is fed with start of injection, duration of injection and rail pressure and
predicts injected fuel flow MF_FUEL. The turbocharger model receives ambient pressure
Pamb_measured and temperature Tamb_measured as inputs which gives the possibility to
predict the engine behavior in the different environmental conditions. The rest of inputs for (20)
and (22) are calculated from the air path volumes. The predictions from turbocharger model are
turbocharger speed N_Turb, boost pressure Pboost, boost temperature T_boost, pressure at
turbine outlet PpostTurb and temperature at turbine outlet TpostTurb. Air filter pressure drop
is as well calculated in the turbocharger component.
After predicting the engine behavior with cylinder, injection and turbocharger models, the
results are sent to the analysis block. The analysis block decides if the results are optimal. If
yes, it forwards the new actuator setpoints to the controllers which actuate the actuators on the
engine and if not, the variations of the inputs in the engine model are being varied until optimum
is reached. The optimum depends on which control strategy was chosen, fuel consumption or
low emission, Fig. 24.
During the variations the engine runs on the base map or on the last optimal value derived
from the onboard optimizer, Fig. 25. This points that that the optimizer doesn´t have to be real-
time capable and thus the AVL Multi-Zone Combustion model was used, which runs slightly
slower than real-time. If a faster on board optimization and real-time diagnostic is needed, then
the faster combustion models need to be applied such as AVL MCC 2014.
7.2 Model Based Diagnostic tool
In the year 2011, it was reported that more than 50% of the fleet is older than 15 years [31].
Engine long term operation causes engine condition change which results in lower efficiency,
higher fuel consumption and thus increase in NOx, CO and CO2 emissions. The diagnostic
system can detect the faults or aging and adapt to the new conditions or prevent the major
failures. In the next chapters the application of the engine model on error simulation and a few
malfunctions detections is presented.

63
In-cylinder model based diagnostic concept
The base of the in-cylinder diagnose model is the cylinder model shown in chapter 6.1. The
measured values from the engine in real-time are fed to the in-cylinder diagnostic tool and some
of them are used as model inputs and others for the diagnostics. The measured inputs to the
cylinder model are engine speed, scavenged pressure and temperature, coolant temperature,
EVO_ctrl_Out is the real exhaust valve opening angle with included opening deadtime,
EVC_ctrl_Out is the real exhaust valve closing angle with included opening deadtime and
MF_FUEL_measured is the fuel amount measured on fuel metering unit. Based on these inputs
the cylinder model gives two types of results. One is pressure and temperature information
crank angle based and the other is mean value based. The mean value model outputs, such as
exhaust temperature, exhaust pressure, temperature of exhaust valve, liner, piston and cylinder
head temperature are compared with measured values and in diagnose block (Fig. 26.) The
relative deviation is calculated. If the relative deviation is close to the predefined threshold
value the component protection is activated which sends the control unit or the user the request
to regulate the injection timing and duration and exhaust valve timing until the relative error
Figure 26 In-cylinder diagnostic concept overview
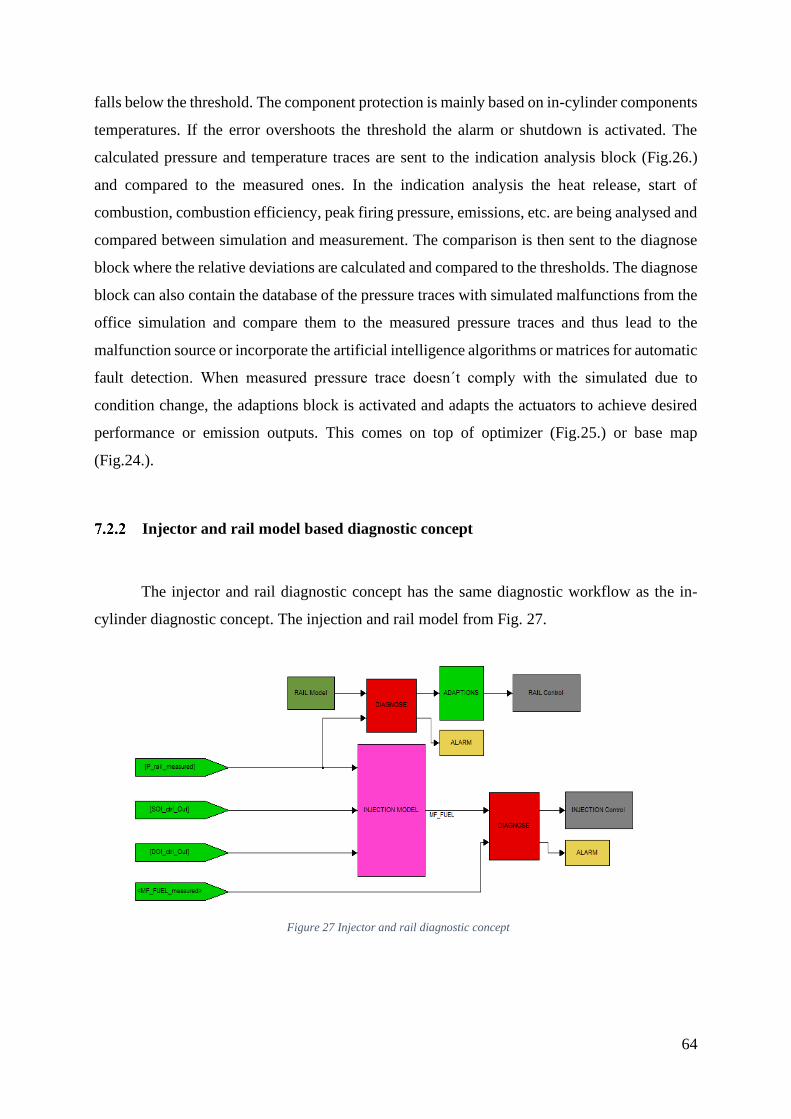
64
falls below the threshold. The component protection is mainly based on in-cylinder components
temperatures. If the error overshoots the threshold the alarm or shutdown is activated. The
calculated pressure and temperature traces are sent to the indication analysis block (Fig.26.)
and compared to the measured ones. In the indication analysis the heat release, start of
combustion, combustion efficiency, peak firing pressure, emissions, etc. are being analysed and
compared between simulation and measurement. The comparison is then sent to the diagnose
block where the relative deviations are calculated and compared to the thresholds. The diagnose
block can also contain the database of the pressure traces with simulated malfunctions from the
office simulation and compare them to the measured pressure traces and thus lead to the
malfunction source or incorporate the artificial intelligence algorithms or matrices for automatic
fault detection. When measured pressure trace doesn´t comply with the simulated due to
condition change, the adaptions block is activated and adapts the actuators to achieve desired
performance or emission outputs. This comes on top of optimizer (Fig.25.) or base map
(Fig.24.).
Injector and rail model based diagnostic concept
The injector and rail diagnostic concept has the same diagnostic workflow as the in-
cylinder diagnostic concept. The injection and rail model from Fig. 27.
Figure 27 Injector and rail diagnostic concept

65
The inputs to injection model are P_rail_measured which is measured rail pressure,
SOI_ctrl_Out is the measured or demanded by control unit start of injection, DOI_ctrl_Out is
duration of injection measured or demanded by control unit and the fuel amount measured on
fuel metering unit. The rail pressure submodel as an input, uses the mass flow of the fuel pump,
injected mass flow and from it calculates the rail pressure. The calculated rail pressure is then
compared to the measured on and then in diagnose block relative deviation is compared to the
threshold. If under the same pump and injected mass flows the relative deviation overshoots the
threshold value than there is high possibility for leakage. The injection model calculates the
fuel and compares it to the measured fuel amount to find the malfunction. In this way it is not
fully possible to find the source of the injector malfunction that is why the method is combined
with the in-cylinder pressure trace analysis for localisation of the fault.
Turbocharger model based diagnostic concept
The Turbocharger diagnose model the same diagnose workflow as the in-cylinder and
injector/rail diagnose model.
The inputs to the turbocharger diagnose model are values measured in real-time such as ambient
pressure and temperature, Pboost_measured which is the measured boost pressure,
Tboost_measured which is the measured boost temperature, exhaust pressure and temperature,
N_Turb_measured which is turbocharger rotational speed and Pfilter_measured is the pressure
after the air filter. The model calculates N_Turb turbocharger speed and Pfilter pressure after
the air filter and comparing it to the measurement. After calculating relative deviations the
turbocharger degradation, plugged or damaged air filter can be detected.
Figure 28 Turbocharger diagnostic concept
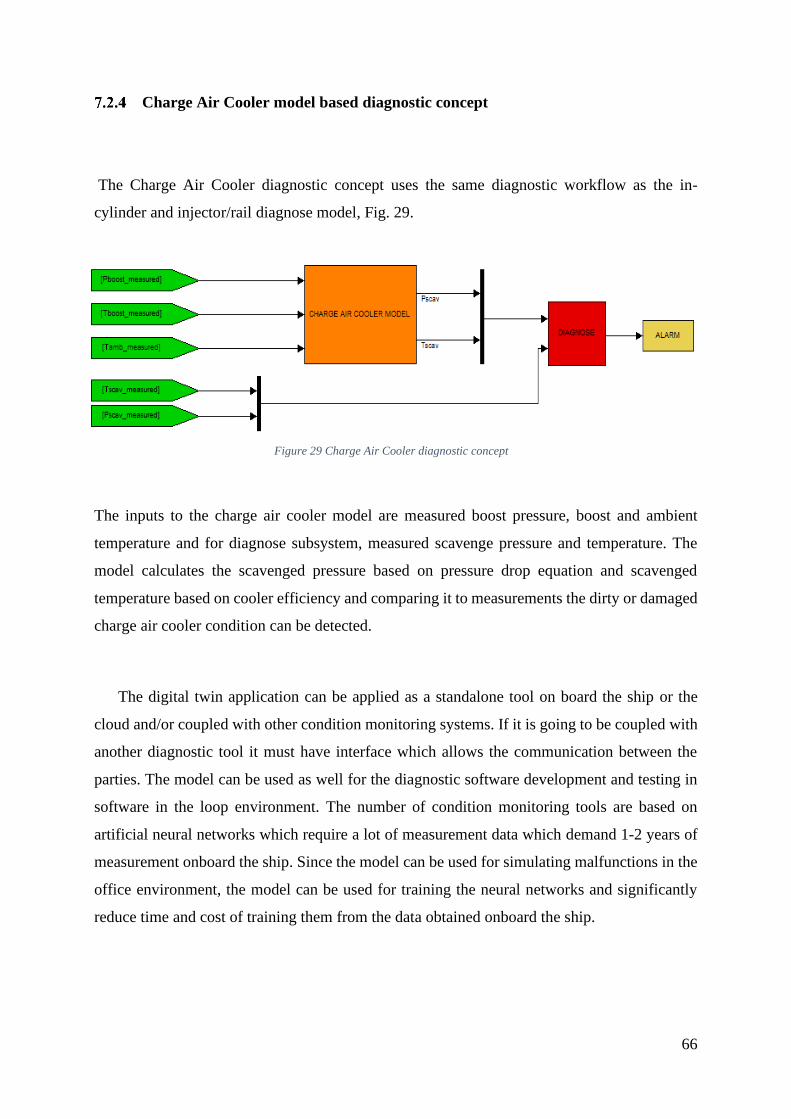
66
Charge Air Cooler model based diagnostic concept
The Charge Air Cooler diagnostic concept uses the same diagnostic workflow as the in-
cylinder and injector/rail diagnose model, Fig. 29.
The inputs to the charge air cooler model are measured boost pressure, boost and ambient
temperature and for diagnose subsystem, measured scavenge pressure and temperature. The
model calculates the scavenged pressure based on pressure drop equation and scavenged
temperature based on cooler efficiency and comparing it to measurements the dirty or damaged
charge air cooler condition can be detected.
The digital twin application can be applied as a standalone tool on board the ship or the
cloud and/or coupled with other condition monitoring systems. If it is going to be coupled with
another diagnostic tool it must have interface which allows the communication between the
parties. The model can be used as well for the diagnostic software development and testing in
software in the loop environment. The number of condition monitoring tools are based on
artificial neural networks which require a lot of measurement data which demand 1-2 years of
measurement onboard the ship. Since the model can be used for simulating malfunctions in the
office environment, the model can be used for training the neural networks and significantly
reduce time and cost of training them from the data obtained onboard the ship.
Figure 29 Charge Air Cooler diagnostic concept

67
8 CONCLUSION
The marine engine is the main and most important segment of the machinery onboard the
ship. It's not only observed from the performance, but also from safety perspective. The ship
engine is a single highest initial investment and lifetime long maintenance cost item. Depending
on the applications, it is also main operational cost producer in terms of the fuel consumption.
This, together with the reduced limits in emission legislations has driven the development of
the control layouts, in the last decade especially. The electro/hydraulic controls demanded some
engine mechanical changes as well as the changes in the auxiliary systems as described in the
first 3 chapters. The marine powertrain industry is currently migrating towards the hybrid
applications which will make systems even more complex to handle and maintain.
Due to the powertrain complexity, the risks of having the engine breakdown at the open
seas are increasing. Chapter 4 deals with the research of the most common engine breakdowns.
Although there are measures to preserve an engine, most of them are active when the alarms
take already place. Most of the safety measures are focused on the engine slowdown or shutoff.
This produces the costly downtimes until the repairs are done, sometimes even not possible at
the seas as well as increases the danger when running without propulsion on the sever weather
conditions or in the port. In order to foresee the engine breakdowns and avoid costly and
dangerous events, the placement of monitoring and diagnostic tools is of an essential need. The
diagnostic approaches presented in the chapter 5 are the research reviews from most diagnostic
products currently available on the market (Appendix 1). The benefits and drawbacks of each
method are emphasized and the one who showed the least drawbacks is the digital twin method.
The method was conceptually introduced in 1997. By [18], reintroduced in 2000. [35] and
applied at 2010. by [19]. Due to its setup complexity has never been broadly applied, but has
gained more interest with newly introduced technologies with connected machinery into the
cloud services.
The highest benefit of the digital twin method is its predictability and the possibility to
isolate and resimulate engine component behavior and by it, precisely detecting the root cause
of the engine failure even at the early stage of possible breakdown. The biggest drawback of
the method is the requirement of the specific knowledge for the digital twin generation and its
calibration. The novelty in the thesis will focus on introducing the methodology for digital twin
generation, demonstrating also the automatic method for the model calibration in order to bring
the model results quality as close to the real engine measurements and still ensuring the desired

68
model predictability. In order to make the model calibration method generally applicable for
the different kinds of engine families such as 2 stroke large engines, 4 stroke medium and high
speed diesel engines, the advanced engine model is selected as seen in chapter 6. The standard
Vibe, single or 2 zones combustion models need to be drastically altered in order to cope with
the model output quality requirements when applying it generically to different varieties of
diesel engine families. The advanced multizone combustion model should cope with all needs
in terms of combustion results quality as well as combined with emission submodels, the
emission predictability [23, 24, 25, 26, 27, 29 ,30, 32, 33, 34, 36]. For the diagnostic purpose it
is also important to be able to simulate the additional components such as injectors, fuel pump,
turbocharger and charge air cooler as described by models in chapter 6.
The methodology developed of model generation and calibration in the thesis will be able
to demonstrate the model or digital twin results quality referenced to the engine testbed
measurements for 2 stroke large and 4 stroke medium speed diesel engine, using same model
structure but with different model calibration parameter sets. When having the digital twin
calibrated, it will be possible to develop the predictability of the engine failure simulation will
be performed by artificially generating the engine faults on the engine model and creating from
the failure simulation results which based on the failure specific sensor value patterns,
automatically detects the engine fault while still being in its early stage.
Based on the demonstrated digital twin quality, the new approach in diagnostic method
will be evaluated together with the engine optimization concept aiming to merge the digital
twin with the engine control unit and chief engineer onboard the ship. The research is tending
to demonstrate the usage of the smart approach in the digital twin calibration as well as
demonstrate the new concept of using the digital twin in favor of engine safety, fuel
consumption and emission reduction.
.
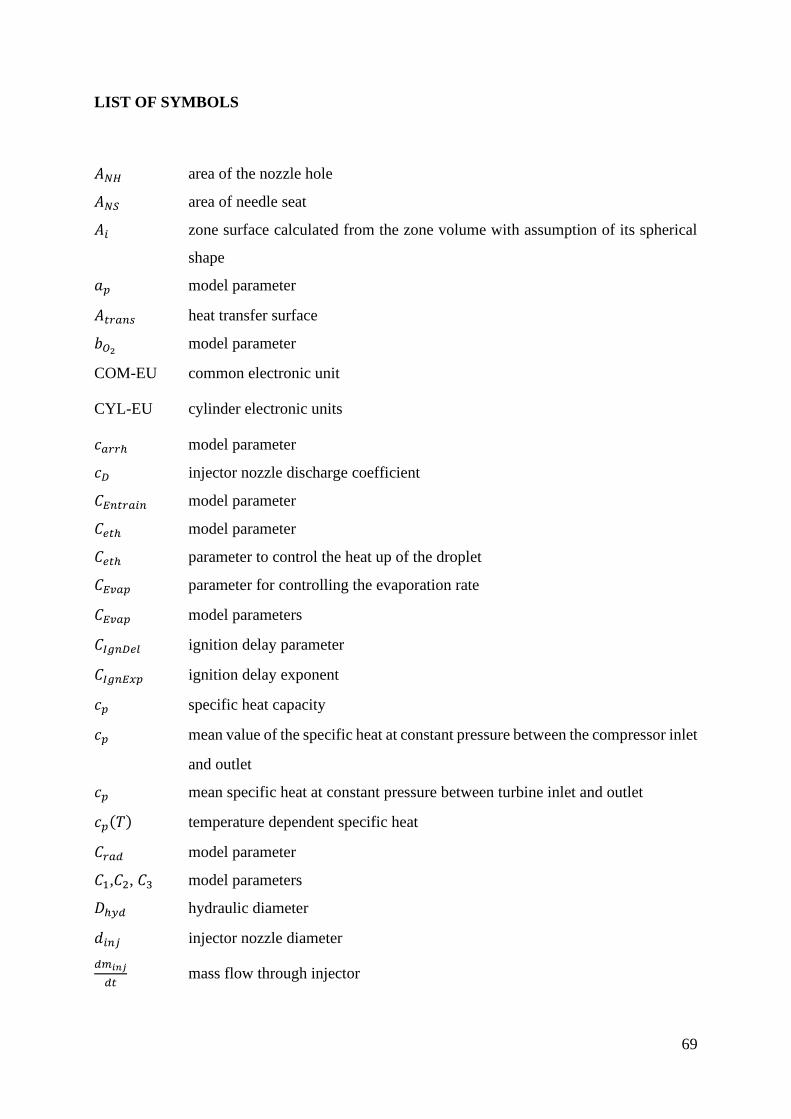
69
LIST OF SYMBOLS
𝐴𝑁𝐻 area of the nozzle hole
𝐴𝑁𝑆 area of needle seat
𝐴𝑖 zone surface calculated from the zone volume with assumption of its spherical
shape
𝑎𝑝 model parameter
𝐴𝑡𝑟𝑎𝑛𝑠 heat transfer surface
𝑏𝑂2 model parameter
COM-EU common electronic unit
CYL-EU cylinder electronic units
𝑐𝑎𝑟𝑟ℎ model parameter
𝑐𝐷 injector nozzle discharge coefficient
𝐶𝐸𝑛𝑡𝑟𝑎𝑖𝑛 model parameter
𝐶𝑒𝑡ℎ model parameter
𝐶𝑒𝑡ℎ parameter to control the heat up of the droplet
𝐶𝐸𝑣𝑎𝑝 parameter for controlling the evaporation rate
𝐶𝐸𝑣𝑎𝑝 model parameters
𝐶𝐼𝑔𝑛𝐷𝑒𝑙 ignition delay parameter
𝐶𝐼𝑔𝑛𝐸𝑥𝑝 ignition delay exponent
𝑐𝑝 specific heat capacity
𝑐𝑝 mean value of the specific heat at constant pressure between the compressor inlet
and outlet
𝑐𝑝 mean specific heat at constant pressure between turbine inlet and outlet
𝑐𝑝(𝑇) temperature dependent specific heat
𝐶𝑟𝑎𝑑 model parameter
𝐶1,𝐶2, 𝐶3 model parameters
𝐷ℎ𝑦𝑑 hydraulic diameter
𝑑𝑖𝑛𝑗 injector nozzle diameter
𝑑𝑚𝑖𝑛𝑗
𝑑𝑡 mass flow through injector
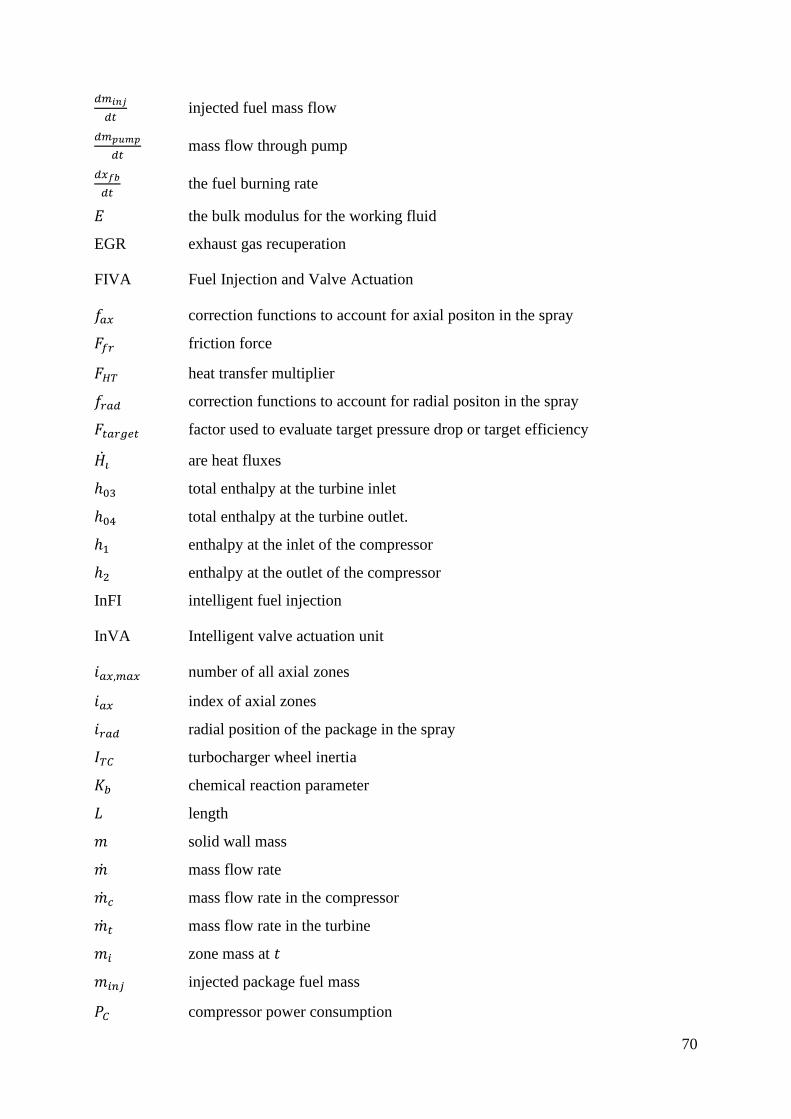
70
𝑑𝑚𝑖𝑛𝑗
𝑑𝑡 injected fuel mass flow
𝑑𝑚𝑝𝑢𝑚𝑝
𝑑𝑡 mass flow through pump
𝑑𝑥𝑓𝑏
𝑑𝑡 the fuel burning rate
𝐸 the bulk modulus for the working fluid
EGR exhaust gas recuperation
FIVA Fuel Injection and Valve Actuation
𝑓𝑎𝑥 correction functions to account for axial positon in the spray
𝐹𝑓𝑟 friction force
𝐹𝐻𝑇 heat transfer multiplier
𝑓𝑟𝑎𝑑 correction functions to account for radial positon in the spray
𝐹𝑡𝑎𝑟𝑔𝑒𝑡 factor used to evaluate target pressure drop or target efficiency
𝐻𝑖 are heat fluxes
ℎ03 total enthalpy at the turbine inlet
ℎ04 total enthalpy at the turbine outlet.
ℎ1 enthalpy at the inlet of the compressor
ℎ2 enthalpy at the outlet of the compressor
InFI intelligent fuel injection
InVA Intelligent valve actuation unit
𝑖𝑎𝑥,𝑚𝑎𝑥 number of all axial zones
𝑖𝑎𝑥 index of axial zones
𝑖𝑟𝑎𝑑 radial position of the package in the spray
𝐼𝑇𝐶 turbocharger wheel inertia
𝐾𝑏 chemical reaction parameter
𝐿 length
𝑚 solid wall mass
�� mass flow rate
��𝑐 mass flow rate in the compressor
��𝑡 mass flow rate in the turbine
𝑚𝑖 zone mass at 𝑡
𝑚𝑖𝑛𝑗 injected package fuel mass
𝑃𝐶 compressor power consumption
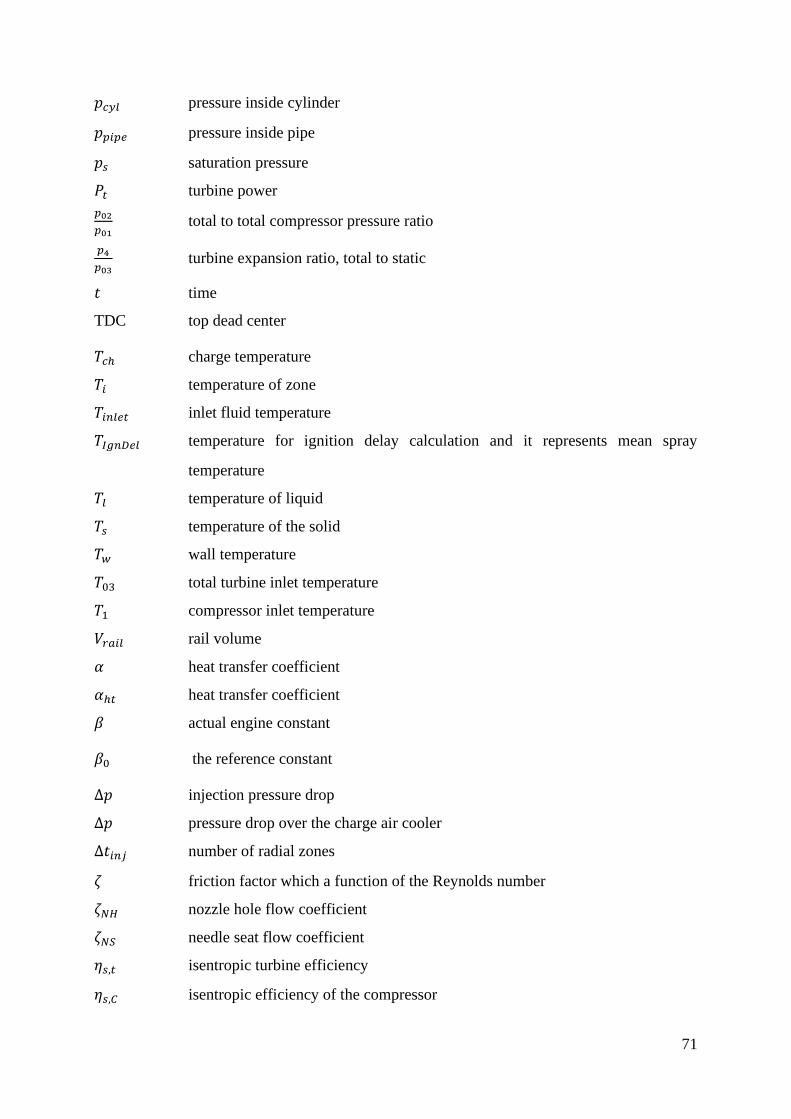
71
𝑝𝑐𝑦𝑙 pressure inside cylinder
𝑝𝑝𝑖𝑝𝑒 pressure inside pipe
𝑝𝑠 saturation pressure
𝑃𝑡 turbine power
𝑝02
𝑝01 total to total compressor pressure ratio
𝑝4
𝑝03 turbine expansion ratio, total to static
𝑡 time
TDC top dead center
𝑇𝑐ℎ charge temperature
𝑇𝑖 temperature of zone
𝑇𝑖𝑛𝑙𝑒𝑡 inlet fluid temperature
𝑇𝐼𝑔𝑛𝐷𝑒𝑙 temperature for ignition delay calculation and it represents mean spray
temperature
𝑇𝑙 temperature of liquid
𝑇𝑠 temperature of the solid
𝑇𝑤 wall temperature
𝑇03 total turbine inlet temperature
𝑇1 compressor inlet temperature
𝑉𝑟𝑎𝑖𝑙 rail volume
𝛼 heat transfer coefficient
𝛼ℎ𝑡 heat transfer coefficient
𝛽 actual engine constant
𝛽0 the reference constant
∆𝑝 injection pressure drop
∆𝑝 pressure drop over the charge air cooler
∆𝑡𝑖𝑛𝑗 number of radial zones
𝜁 friction factor which a function of the Reynolds number
𝜁𝑁𝐻 nozzle hole flow coefficient
𝜁𝑁𝑆 needle seat flow coefficient
𝜂𝑠,𝑡 isentropic turbine efficiency
𝜂𝑠,𝐶 isentropic efficiency of the compressor

72
𝜅 ratio of the heat capacity at a constant pressure to the heat capacity at constant
volume
𝜆𝑚 thermal conductivity
𝜈 kinematic viscosity
𝜌 density
𝜌𝑐ℎ charge density
𝜌𝑐ℎ charge density
𝜌𝑓𝑢𝑒𝑙 liquid density of the fuel
𝜌𝑓𝑢𝑒𝑙 density of the fuel
𝜌𝑟𝑎𝑖𝑙 density of the fluid inside rail
𝜎𝑓𝑢𝑒𝑙 surface tension of the fuel
𝜏 characteristic ignition delay time
𝜔𝑇𝐶 turbocharger wheel speed
𝑆𝑀𝐷 Sauter mean diameter
𝑁𝑢 Nusselt number
𝑆ℎ Sherwood’s number
73
REFERENCES
[1]"History of Technology: Internal Combustion engines". Encyclopædia Britannica.
Britannica.com. Retrieved 2012-03-20
[2] Georgano, G.N. Cars: Early and Vintage 1886–1930(London: Grange-Universal, 1990),
p.9.
[3] Matulić, Nikola; Radica, Gojmir; Nižetić, Sandro. Thermodynamic analysis of active
modular internal combustion engine concept: targeting efficiency increase and carbon dioxide
emissions reduction of gasoline engines // International journal of energy research, SI (2018),
1-13. doi:10.1002/er.4055
[4] Milić, L.: Brodski dizelski motori I, Pomorski odjel, Dubrovnik, 2002.
[5] Vamshikrishna Kuruva, Marine Diesel Engine Introduction And Theory, Scribd,
29.12.2015.
[6]ME Engines-the New Generation of Diesel Engines;
http://www.mandiesel.com/files/news/filesof2810/p412-0503.pdf
[7] Radica, G.: Inteligentni brodski dvotaktni dizel motori, Pomorski fakultet, Split 2011.
[8] ME Control System;
http://download.odessacrewing.com/test/MAGIC%20FINISH%20PLAN/MANBW%
20Files/0603%20ME%20Control%20System.pdf
[9] MarineInfoSite;
http://marineinfobox.blogspot.com/2017/06/properties-and-working-system-of-marine.html
Retrieved 2019-07-14
[10] Marine Engineer World;
http://www.free-marine.com/i3dieselcooling.htm Retrieved 2019-07-17
[11] Faculty of Maritime Studies University of Rijeka;
https://www.pfri.uniri.hr/bopri/documents/15_StartingAirSystem.pdf Retrieved at 2019-07-17
[12] M. Morsy El Gohary , Khaled M. Abdou: Computer based selection and performance
analysis of marine diesel engine; Alexandria Engineering Journal (2011) 50, 1–11
[13] WinGD_Marine_Information_Manual, DBAB646817, 2017-04-06
[14] DIESEL ENGINEERING for pacific island mariners:
https://spccfpstore1.blob.core.windows.net/digitallibrary-
docs/files/23/23e06da86f1ee89e80f8a4219f16fefe.pdf?sv=2015-12-
11&sr=b&sig=4MRAj4NvoY3%2BvM%2B6FAvIMN8RDt96qEzOHMb6%2FdxkcFE%3D
&se=2020-05-11T05%3A35%3A20Z&sp=r&rscc=public%2C%20max-
age%3D864000%2C%20max-
stale%3D86400&rsct=application%2Fpdf&rscd=inline%3B%20filename%3D%22diesel_lg.p
df%22
Retrieved 2019-11-13
[15] https://maritimeexpert.files.wordpress.com/2016/08/b1-operatinginstructions1.pdf
Retrieved 2019-12-15
[16] B.Salic: Primjena ekspertnih sustava za odrzavanje suvremenih brodskih motora, Split,
2016
[17] Oihane C. Basurko , Zigor Uriondo : Condition-Based Maintenance for medium speed
diesel engines used in vessels in operation; Applied Thermal Engineering, 07.02.2015
74
[18] D.T. Hountalas, A.D. Kouremenos: Development and application of a fully automatic
troubleshooting method for large marine diesel engines; Applied Thermal Engineering
28.10.1997
[19] V.T. Lamaris, D.T. Hountalas: A general purpose diagnostic technique for marine diesel
engines – Application
on the main propulsion and auxiliary diesel units of a marine vessel Energy Conversion and
Management 51 (2010) 740–753
[20]
https://www.dma.dk/Documents/Publikationer/Digital%20Twin%20report%20for%20DMA.
PDF Retrieved at 2020-05-03
[21] https://thedigitalship.com/download-digital-ship/send/16-2018/2658-digital-ship-132-
october-2018 Retrieved at 2020-05-03
[22] Cruise M Manual, 2015
[23] Poetsch, C., Ofner, H., Schutting, E., "Assessment of a Multi Zone Combustion Model for
Analysis and Prediction
C0I Engine Combustion and Emissions", SAE 2011-01-1439, SAE World Congress 2011,
Detroit, USA
[24] Reinhardt, H., "Modellierung des Zuendverzuges bei Mehrfacheinspritzungen
aufgeladener Dieselmotoren mit Direkteinspritzung innerhalb der thermodynamischen
Prozessrechnung". Abschlussbericht. FVV Heft 870, 2008
[25] Jung, D., Assanis, D.N., "Multi-Zone DI Diesel Spray Combustion Model for Cycle
Simulation Studies of Engine Performance and Emissions", SAE 2001-0-1246, SAE World
Congress 2001, Detroit, USA.
[26] Pattas K., Haefner G., 'Stickoxidbildung bei der ottomotorischen Verbrennung', MTZ Nr.
12, 397-404, 1973.
[27] Hiroyasu, H., Kadota, T., Arai M., "Development and Use of a Spray Combustion
Modeling to Predict Diesel Engine Efficiency and Pollutant Emissions, Part I": Combustion
Modeling, Bulletin of the JSME, Vol. 26, pp.569-575, 1983
[28]Ø. Buhaug, J.J. Corbett, Ø. Endresen, V. Eyring, J. Faber, S. Hanayama, D.S. Lee, D. Lee,
H. Lindstad, A.Z. Markowska, A. Mjelde, D. Nelissen, J. Nilsen, C. Pålsson, J.J. Winebrake,
W. Wu, K. Yoshida, Second IMO GHG Study 2009, International Maritime Organization
(IMO), London, United Kingdom, 2009, p. 240.
[29] V.T. Lamaris *, D.T. Hountalas: A general purpose diagnostic technique for marine diesel
engines – Application
on the main propulsion and auxiliary diesel units of a marine vessel, Energy Conversion and
Management 51 (2010) 740–753
[30] Hiroyasu, H., Kadota, T., Arai M., "Development and Use of a Spray Combustion
Modeling to Predict Diesel Engine Efficiency and Pollutant Emissions, Part I": Combustion
Modeling, Bulletin of the JSME, Vol. 26, pp.569-575, 1983
[31] The World Merchant Fleet in 2011, Statistics from Equasis, Lisbon, Portugal, 2012.
[32] Varde, K.S., Popa, D.M., Varde, L.K., "Spray Angle and Atomization in Diesel Sprays".
SAE 841055, 1984 SAE World Congress, Detroit, USA
[33] Bozza F. and Gimelli A., "A Comprehensive 1D Model for the Simulation of a Small-Size
Two-Stroke SI Engine", SAE Paper 2004-01-0999, 2004.
[34] Poetsch, C., Ofner, H. and Cartellieri, W., "Analysis of Thermodynamic Characteristics of
Diesel Engine Emission Control Strategies Using a Multi-Zone Combustion Model," SAE Int.
J. Engines 5(3):2012, doi:10.4271/2012-01-1340.
[35] Dimitrios T. Hountalas,” Prediction of marine diesel engine performance under fault
Conditions”, Applied Thermal Engineering 20 (2000) 1753±1783
75
[36] Fabio Scappin , Sigurður H. Stefansson , Fredrik Haglind, Anders Andreasen, Ulrik
Larsen, “Validation of a zero-dimensional model for prediction of NOx and engine
performance for electronically controlled marine two-stroke diesel engines”, Applied Thermal
Engineering 37 (2012) 344e352
[37] Dubravko Miljković,“ Fault Detection Methods: A Literature Survey”, MIPRO 2011/CTS,
Page 110-115
[38] Skliros C, Esperon Miguez M, Fakhre A, Jennions IK. A review of model based and data
driven methods targeting hardware systems diagnostics. Diagnostyka. 2019;20(1):3-21.
http://dx.doi.org/10.29354/diag/99603
[39] Foyen, A., „Aspects of condition monitoring and maintenance of machinery“,Norvegian
Shipping news, No11C, 1977.
[40] Ostergard A, Fischer P, „B&W condition check system CC-10 for 2-storke K-GF diesel
engines“, Proceeding of 2-nd IFAC/IFIP Symposium, Washington 1976. [41] Sagawa, R., Nakamura, Y., Development of new diagnosis and trend analysis system for
marine diesel engine, Bulletin of the Mar. Eng. Soc., Vol. 18, Japan 1980.
[42] Matthew Daigle, Indranil Roychoudhury, „Mode-Based Diagnostics“, Diagnostics &
Prognostics Group, Intelligent Systems Division NASA Ames Research Center, PHM 2016:
Model-based Diagnostics
[43] Shi N-Z, Tao J. Statistical hypothesis testing. Toh Tuck Link, Singapore: World
Scientific Publishing Co. Pte. Ltd.; 2008.
[44] Siegmund D. Sequential Analysis. New York: Springer; 1985.
[45] Mohanty SR, Pradhan AK, Routray A. A cumulative sum-based fault detector for power
system relaying application. IEEE Trans Power Deliv. 2008;23(1):79–86.
[46] Isermann R. Fault diagnosis of machines via parameter estimation and knowledge
processing-Tutorial paper. Automatica. 1993;29(4):815–35.
[47] Isermann R. Process Fault Detection Based on Modeling and Estimation Methods-A
Survey. 1984;4(4).
[48] Volponi AJ. Foundations of Gas Path Analysis I. In: Gas turbine condition monitoring
and fault diagnosis - Lecture series 2003-01. von Karman Institute for Fluid Dynamics; 2003.
[49] Volponi AJ. Foundation of Gas Path Analysis II. In: Gas turbine condition monitoring
and fault diagnosis - Lecture series 2003-01. von Karman Institute for Fluid Dynamics;
[50] Doel DL. An Assessment of Weighted-Least-Squares Based Gas Path. In: International
gas turbinbe and aeroengine congress and exposition. Cincinati, Ohio: ASME; 1993.
[51] Urban LA. Gas path analysis applied to turbine engine condition monitoring. J Aircr.
1973;10(7):400–6.
[52] Doel DL. Development of baselines, influence coefficients and statistical inputs for gas
path analysis. In: Gas turbine condition monitoring and fault diagnosis - Lecture series 2003-
01. von Karman Institute for Fluid Dynamics; 2003.
[53] Stamatis AG. Optimum Use of Existing Sensor Information for Gas Turbine Diagnostics.
In: Proceedings of the ASME Turbo Expo 2008
http://proceedings.asmedigitalcollection.asme.org/proceeding.aspx?articleid=1623480
[54] Volponi AJ. Gas Turbine Engine Health Management: Past, Present, and Future Trends.
J Eng Gas Turbines Power. 2014;136(5):051201.
http://gasturbinespower.asmedigitalcollection.asme.org/article.aspx?doi=10.1115/1.4026126
[55] A.Stamatis, K. Mathioudakis, G. Berrios KP. Jet engine fault detection with discrete
operating points gas path analysis. J Propuls Power. 1991;7(6).
[56] Doel DL. TEMPER-A Gas-Path Analysis Tool for Commercial Jet Engines. J Eng Gas
Turbines Power 1994;116(1):82. http://link.aip.org/link/JETPEZ/v116/i1/p82/s1&Agg=doi
[57] Lifetime Project, Athens, October 8, 2003

76
[58] N. P. Kyrtatos*, G. G. Dimopoulos, G. P. Theotokatos, E. I. Tzanos and N. I. Xiros,
„NOx-BOX: A SOFTWARE SENSOR FOR REAL-TIME EXHAUST EMISSIONS
ESTIMATION IN MARINE ENGINES“, Laboratory of Marine Engineering Department of
Naval Architecture & Marine Engineering National Technical University of Athens
9 Iroon Polytechneiou str., PO Box 64033, GR-157 73 Zografos, Greece
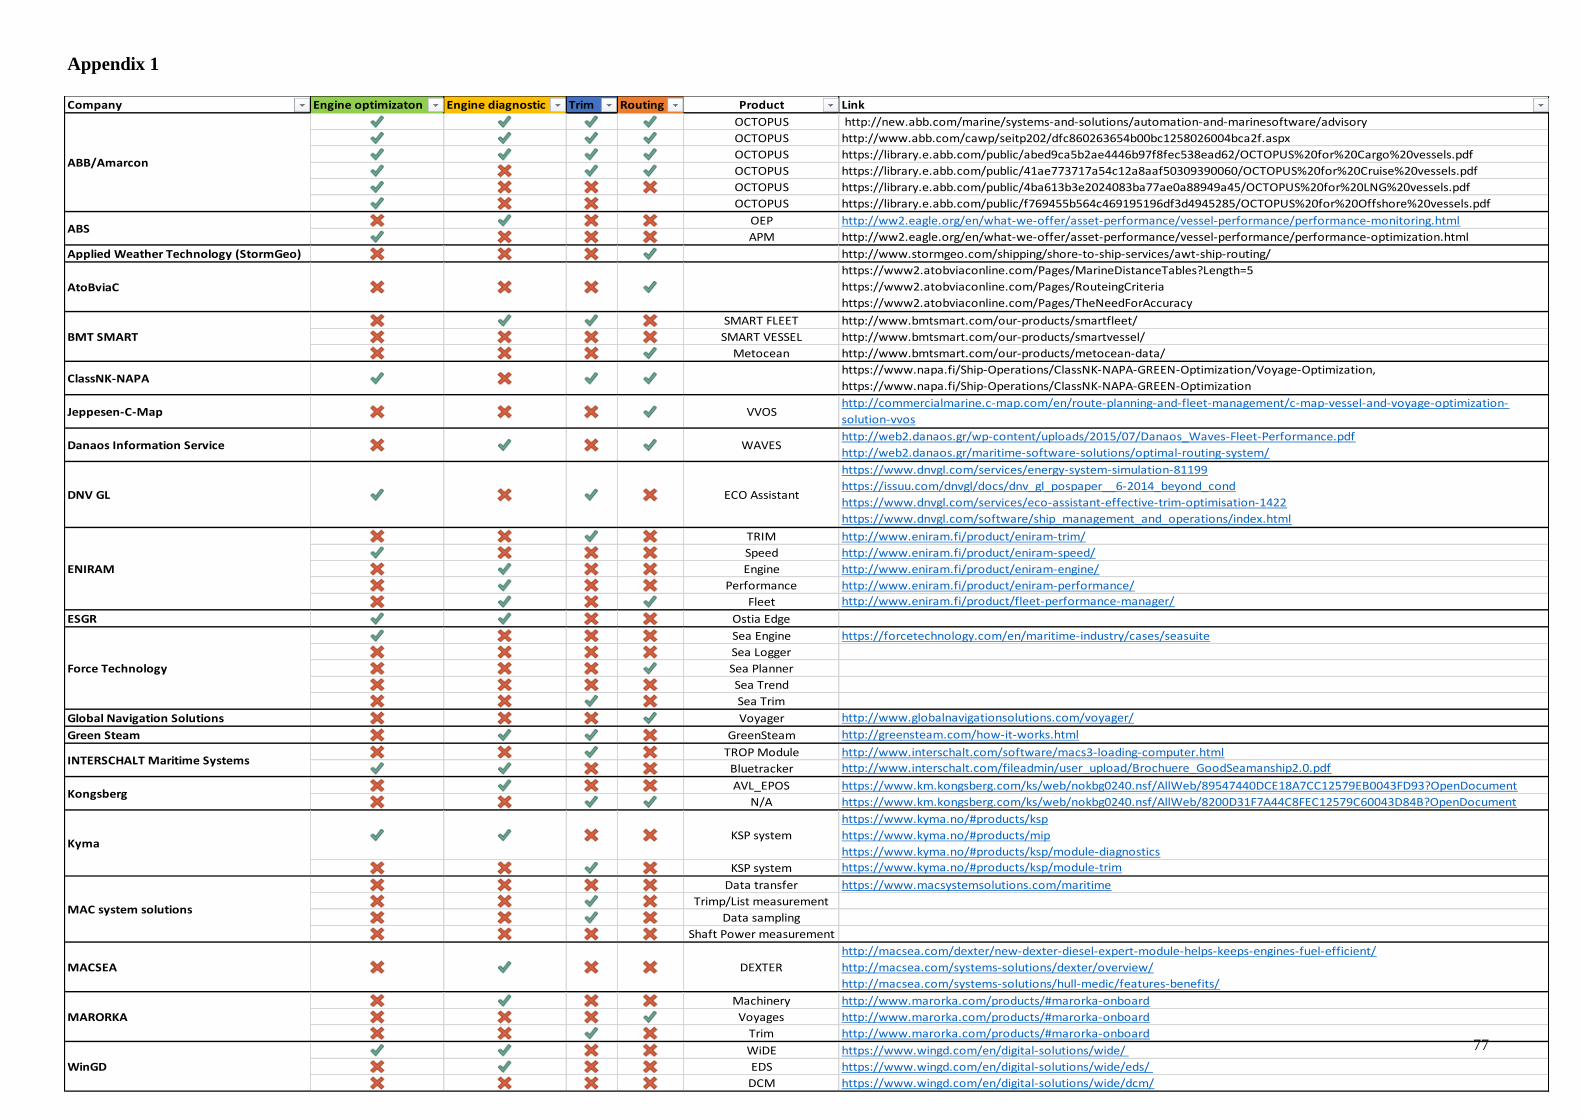
77
Appendix 1
Company Engine optimizaton Engine diagnostic Trim Routing Product Link
OCTOPUS http://new.abb.com/marine/systems-and-solutions/automation-and-marinesoftware/advisory
OCTOPUS http://www.abb.com/cawp/seitp202/dfc860263654b00bc1258026004bca2f.aspx
OCTOPUS https://library.e.abb.com/public/abed9ca5b2ae4446b97f8fec538ead62/OCTOPUS%20for%20Cargo%20vessels.pdf
OCTOPUS https://library.e.abb.com/public/41ae773717a54c12a8aaf50309390060/OCTOPUS%20for%20Cruise%20vessels.pdf
OCTOPUS https://library.e.abb.com/public/4ba613b3e2024083ba77ae0a88949a45/OCTOPUS%20for%20LNG%20vessels.pdf
OCTOPUS https://library.e.abb.com/public/f769455b564c469195196df3d4945285/OCTOPUS%20for%20Offshore%20vessels.pdf
OEP http://ww2.eagle.org/en/what-we-offer/asset-performance/vessel-performance/performance-monitoring.html
APM http://ww2.eagle.org/en/what-we-offer/asset-performance/vessel-performance/performance-optimization.html
Applied Weather Technology (StormGeo) http://www.stormgeo.com/shipping/shore-to-ship-services/awt-ship-routing/
AtoBviaC
https://www2.atobviaconline.com/Pages/MarineDistanceTables?Length=5
https://www2.atobviaconline.com/Pages/RouteingCriteria
https://www2.atobviaconline.com/Pages/TheNeedForAccuracy
SMART FLEET http://www.bmtsmart.com/our-products/smartfleet/
SMART VESSEL http://www.bmtsmart.com/our-products/smartvessel/
Metocean http://www.bmtsmart.com/our-products/metocean-data/
ClassNK-NAPAhttps://www.napa.fi/Ship-Operations/ClassNK-NAPA-GREEN-Optimization/Voyage-Optimization,
https://www.napa.fi/Ship-Operations/ClassNK-NAPA-GREEN-Optimization
Jeppesen-C-Map VVOShttp://commercialmarine.c-map.com/en/route-planning-and-fleet-management/c-map-vessel-and-voyage-optimization-
solution-vvos
Danaos Information Service WAVEShttp://web2.danaos.gr/wp-content/uploads/2015/07/Danaos_Waves-Fleet-Performance.pdf
http://web2.danaos.gr/maritime-software-solutions/optimal-routing-system/
DNV GL ECO Assistant
https://www.dnvgl.com/services/energy-system-simulation-81199
https://issuu.com/dnvgl/docs/dnv_gl_pospaper__6-2014_beyond_cond
https://www.dnvgl.com/services/eco-assistant-effective-trim-optimisation-1422
https://www.dnvgl.com/software/ship_management_and_operations/index.html
TRIM http://www.eniram.fi/product/eniram-trim/
Speed http://www.eniram.fi/product/eniram-speed/
Engine http://www.eniram.fi/product/eniram-engine/
Performance http://www.eniram.fi/product/eniram-performance/
Fleet http://www.eniram.fi/product/fleet-performance-manager/
ESGR Ostia Edge
Sea Engine https://forcetechnology.com/en/maritime-industry/cases/seasuite
Sea Logger
Sea Planner
Sea Trend
Sea Trim
Global Navigation Solutions Voyager http://www.globalnavigationsolutions.com/voyager/
Green Steam GreenSteam http://greensteam.com/how-it-works.html
TROP Module http://www.interschalt.com/software/macs3-loading-computer.html
Bluetracker http://www.interschalt.com/fileadmin/user_upload/Brochuere_GoodSeamanship2.0.pdf
AVL_EPOS https://www.km.kongsberg.com/ks/web/nokbg0240.nsf/AllWeb/89547440DCE18A7CC12579EB0043FD93?OpenDocument
N/A https://www.km.kongsberg.com/ks/web/nokbg0240.nsf/AllWeb/8200D31F7A44C8FEC12579C60043D84B?OpenDocument
KSP system
https://www.kyma.no/#products/ksp
https://www.kyma.no/#products/mip
https://www.kyma.no/#products/ksp/module-diagnostics
KSP system https://www.kyma.no/#products/ksp/module-trim
Data transfer https://www.macsystemsolutions.com/maritime
Trimp/List measurement
Data sampling
Shaft Power measurement
MACSEA DEXTER
http://macsea.com/dexter/new-dexter-diesel-expert-module-helps-keeps-engines-fuel-efficient/
http://macsea.com/systems-solutions/dexter/overview/
http://macsea.com/systems-solutions/hull-medic/features-benefits/
Machinery http://www.marorka.com/products/#marorka-onboard
Voyages http://www.marorka.com/products/#marorka-onboard
Trim http://www.marorka.com/products/#marorka-onboard
WiDE https://www.wingd.com/en/digital-solutions/wide/
EDS https://www.wingd.com/en/digital-solutions/wide/eds/
DCM https://www.wingd.com/en/digital-solutions/wide/dcm/
Kongsberg
Kyma
MAC system solutions
MARORKA
WinGD
ABB/Amarcon
ABS
BMT SMART
ENIRAM
Force Technology
INTERSCHALT Maritime Systems

78
ABSTRACT
The marine engine is the most important segment of the machinery onboard the ship.
It's not only observed from the performance, but also from the safety perspective. The marine
engines are getting more complex driven by emission legislations in terms of control
configurations, complex auxiliary systems and hybridization. The complexity increases the
risk of failures which are not just the cost parameter but also a significant safety factor.
The monitoring and diagnostic systems became the central tool for engine
maintenance strategies and are a ground upon which the engine optimization can be
performed. However, most of the diagnostic methods on the market have under its benefits
also a significant drawbacks in terms of unreliable or not detectable engine faults or costly
and timely preparation phase.
In the qualifying paper different kind of diagnostic methods were investigated where
the digital twin diagnostic concept is isolated as the most rounded method but currently with
very less application activities on the market. One of the main reasons is the required expert
know-how for digital twin generation and skills for the digital twin calibration. The advanced
digital twin engine model is physically described together with all diagnostic relevant
auxiliary models. The new concepts of the digital twin application concepts were
demonstrated driven by the nowadays available engine control unit communication and
satellite data transfer technologies. If the digital twin is able to demonstrate its easy
adaption/calibration to the new engines or data and keeping its required results quality, it
would open the door for presented optimization and diagnostic concepts to be applied in the
real-world applications. This would lead to significant fuel consumption reduction, cleaner
exhaust emissions and decrease in the machinery breakdowns.

79
SAŽETAK
Brodski motor je najznačajniji stroj na cijelome brodu ne samo iz perspektive njegovih
performansi već značajno i u pogledu sigurnosti same plovidbe. Vođeni legislativom, brodski
motori postaju sve kompleksniji u vidu kontrolnih strategija, kompleksnih pomoćnih strojeva
i uređaja te same hibridizacije pogona. Njihova kompleksnost uvećava rizik pojave kvara koji
nisu samo financijski parametar već i značajni sigurnosni faktor.
Dijagnostički i nadzorni sustavi su postali centralni alat za planiranje održavanja
brodskog motora i baza na kojoj se izvršava optimizacija rada brodskog pogona. Međutim,
većina dijagnostičkih alata na tržištu osim svojih prednosti posjeduju i značajne nedostatke u
smislu nepouzdanih ili ne detektiranih kvarova ili su metode koje zahtijevaju skupu i
dugotrajnu pripremu.
U kvalifikacijskom radu istražene su različite dijagnostičke metode te dijagnostički
koncept uporabe digitalnih blizanaca ili virtualnih simulacijskih modela fizičke komponente
u svrhu detekcije kvara motora je istaknut kao najpotpunija metoda. Metoda se još ne koristi u
brodskoj industriji. Jedan od glavnih razloga tome je potrebno znanje u razvoju digitalnih
blizanaca i vještine pri kalibraciji istih. Opisan je napredan fizikalni model motora zajedno sa
svim dijagnostički relevantnim pomoćnim ili dodatnim modelima. Demonstrirani su novi
koncepti uporabe digitalnih blizanaca vođeni tehnologijama trenutnih komunikacijskih sučelja
motornih kontrolnih jedinica te satelitskim tehnologijama prijenosa podataka sa broda na
kopno. Zaključeno je da ukoliko bi razvoj digitalnog blizanca za specifični motor bio brz i
jednostavan uz zadržavanje željenih kvaliteta rezultata, bilo bi omogućena primjena opisanih
koncepata optimizacije i dijagnostike motora na samome brodu. To bi vodilo značajnom
smanjenju potrošnje goriva, smanjenju emitiranja ispušnih emisija te povećanju sigurnosti sa
smanjenjem broja kvarova motora.