Utilisation of Formal Health Care and Out-of-Pocket Payments in Rural Bangladesh
60
September 2012 Institute of Microfinance (InM) Syed M. Ahsan Syed Abdul Hamid Shubhasish Barua Utilisation of Formal Health Care and Out-of-Pocket Payments in Rural Bangladesh Working Paper No. 13
Transcript of Utilisation of Formal Health Care and Out-of-Pocket Payments in Rural Bangladesh

September 2012
Institute of Microfinance (InM)
Syed M. AhsanSyed Abdul HamidShubhasish Barua
Utilisation of Formal Health Care andOut-of-Pocket Payments
in Rural Bangladesh
Working Paper No. 13

Utilisation of Formal Health Care and Out-of-Pocket Payments in Rural Bangladesh*
Syed M. Ahsan 1,2,6
Syed Abdul Hamid 2,3
Shubhasish Barua 4,5
1 = Department of Economics, Concordia University, Montreal, Canada
2 = Institute of Health Economics, University of Dhaka, Dhaka, Bangladesh
3 = Institute of Microfi nance (InM), Dhaka, Bangladesh
4 = Department of Development Studies, University of Dhaka, Dhaka, Bangladesh
5 = Department of Economics, University of Warwick, Coventry, England
6 = CESifo, Munich
September 2012
* The authors are grateful to UKaid DFID’s PROSPER (‘Promoting Financial Services for Poverty Reduction Programme’) project for providing funds for the longitudinal study “Microinsurance, Poverty & Vulnerability” undertaken by Microinsurance Research Unit (MRU) at the Institute of Microfi nance (InM) launched in January 2009. However any opinions expressed and policy suggestions proposed in the document are the authors’ own and do not necessarily refl ect the views of either InM or that of the funding agency. Chowdhury Asif, Afroza Begum, Suvadra Gupta, Raysul Naim, Shahidul Islam and Nahid Akhter have provided valuable research and logistical assistance. The authors are also grateful to Grameen Kalyan for its kind cooperation with this research.

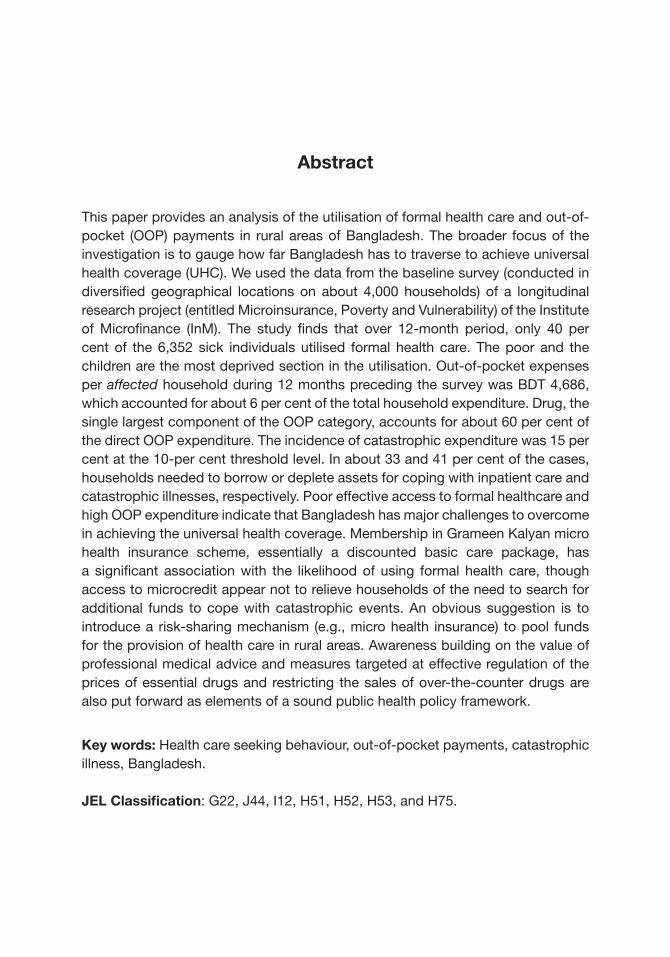
Abstract
This paper provides an analysis of the utilisation of formal health care and out-of-pocket (OOP) payments in rural areas of Bangladesh. The broader focus of the investigation is to gauge how far Bangladesh has to traverse to achieve universal health coverage (UHC). We used the data from the baseline survey (conducted in diversifi ed geographical locations on about 4,000 households) of a longitudinal research project (entitled Microinsurance, Poverty and Vulnerability) of the Institute of Microfi nance (InM). The study fi nds that over 12-month period, only 40 per cent of the 6,352 sick individuals utilised formal health care. The poor and the children are the most deprived section in the utilisation. Out-of-pocket expenses per affected household during 12 months preceding the survey was BDT 4,686, which accounted for about 6 per cent of the total household expenditure. Drug, the single largest component of the OOP category, accounts for about 60 per cent of the direct OOP expenditure. The incidence of catastrophic expenditure was 15 per cent at the 10-per cent threshold level. In about 33 and 41 per cent of the cases, households needed to borrow or deplete assets for coping with inpatient care and catastrophic illnesses, respectively. Poor effective access to formal healthcare and high OOP expenditure indicate that Bangladesh has major challenges to overcome in achieving the universal health coverage. Membership in Grameen Kalyan micro health insurance scheme, essentially a discounted basic care package, has a signifi cant association with the likelihood of using formal health care, though access to microcredit appear not to relieve households of the need to search for additional funds to cope with catastrophic events. An obvious suggestion is to introduce a risk-sharing mechanism (e.g., micro health insurance) to pool funds for the provision of health care in rural areas. Awareness building on the value of professional medical advice and measures targeted at effective regulation of the prices of essential drugs and restricting the sales of over-the-counter drugs are also put forward as elements of a sound public health policy framework.
Key words: Health care seeking behaviour, out-of-pocket payments, catastrophic illness, Bangladesh.
JEL Classifi cation: G22, J44, I12, H51, H52, H53, and H75.

Working Paper No. 13
Utilisation of Formal Health Care and Out-of-Pocket Payments in Rural Bangladesh
1
1. Introduction
The weakest link in the path to universal health coverage (UHC) in a country like Bangladesh appears to be the lack of access to formal care providers, both in physical and monetary terms. Improving access to quality healthcare and at the same time reducing the out-of-pocket (OOP) payments, while formidable challenges under any circumstances, are imperative for achieving UHC.1 The same processes would also ensure that the effectiveness of the poverty reduction strategies does not get subverted by health shocks, which may lead to debilitating OOP expenses. Comprehensive evidence on the actual state of access to facilities, pattern of morbidity among the rural population, choice of provider, extent of OOP costs, sources of fi nancing these costs is crucial for appropriate policy formulation targeted toward the twin goals universal health coverage and the elimination of poverty. While there exist some studies on health care seeking behaviour in Bangladesh, no scientifi c research appears to have been carried out analysing OOP health expenditures.2
In a series of papers, Ahmed et al. (2000, 2003, 2006) have examined the impact of BRAC’s integrated rural development programme on health care seeking behaviour in the Matlab-centred (a sub-district of Chandpur) demographic surveillance area of ICDDR,B. Another study (Alam et al., 2009), which explored the care seeking behaviour of children aged below 15 years using the data from a survey conducted in 1996 on 2,695 households, is also based on the same surveillance area. Hamid et al. (2011) analysed the impact of micro health insurance (MHI) on health care seeking behaviour along with indicators like health awareness and health status of the microcredit members using a sample of 329 households drawn from 4 villages of a sub-district of Manikganj. Nanda (1999) illustrated the impact of some microcredit programmes on the utilisation of formal health care. Amin et al. (2001) examined the impact of a pilot health programme on the utilisation of essential services package (ESP), an intervention of the health authorities in Bangladesh (MoHFW) that targeted delivery of primary care to the rural residents (upazila and below) to be offered by public facilities, which launched in 1998.3
1 The two primary criteria for achieving universal health coverage are (a) ensuring the use of health services by all and (b) prevention of fi nancial hardship while paying for the health services (WHO, 2010).
2 Dalal and Rahman (2009) provided descriptive statistics of OOP expenditure for 3,411 injury victims. Khan et al. (2009) estimated OOP costs of maternal and newborn care for 1,200 married women (aged 15-49 years) who had a one-year-old child, while Munsur et al. (2009) estimated the OOP costs for drugs in Bangladesh. However, there is a growing literature in this area in India (Ranson, 2002; Flores et al., 2008: Vaishnavi et al., 2009; Garg et al., 2009) and other developing countries (Wagstaff et al., 2003; Belli et al., 2004; Falkingham, 2004; Hotchkiss et al., 2005; Doorslaer et al., 2007; Ekman, B. 2007; Chi et al., 2008; Somkotra et al., 2008; Patcharanarumol et al., 2009; Yardim et al., 2010).
3 The core strategy of the broader Health and Population Sector Project (HPSP) was to earmark about 60% of the national health budget for ESP.

Working Paper No. 13
Institute of Microfi nance
2
Ahmed et al. (2005) compared health seeking behaviour of the elderly (aged 60 years and above) with younger adults (aged 20-59 years) using the data from the baseline survey of a research project exploring the effectiveness of low cost preventive and health promotion interventions in improving primary health care services for the elderly in rural areas of Bangladesh. The latter survey was conducted on 966 households drawn from some selected villages in two sub-districts of Chandpur district in 2003. Biswas et al. (2006) explored the health seeking behaviour of the elderly using the data from the same project collected through some qualitative tools (focus group discussions and in-depth interviews). Ahmed (2001) explored the health care seeking behaviour from a survey of 2,550 households of fi ve ethnic minorities in the Chittagong Hill Tracts. Some other studies explored the health care seeking behaviour under maternal conditions (Moran et al. 2007, Amin et al. 2010).
Most studies cited above had either narrowly focussed their investigation of care-seeking to a relatively small geographic area of the country (notably Matlab Upazila in Chandpur district), or picked a specifi c (typically) local intervention in order to observe the impact on behaviour. However, this is not the focus of the current research. Our goal is to view the big picture, i.e., the broad contours of the overall health seeking behaviour in its key dimensions (e.g., morbidity prevalence, care-seeking, costs of care and the means of fi nance). The only restriction by design is the rural focus, and this is justifi able on grounds of prioritisation of research funds since it is here that the ‘access’ issue cited above is a major compromising factor. It may be noted that Household Income and Expenditures Survey (HIES) of Bangladesh regularly reports health care seeking pattern without suffi cient detail to make it relevant for policy guidance. The available evidence may therefore be of limited generalisability due to the lack of coverage and limited scope. It thus remains unknown what it might take for Bangladesh to achieve universal health coverage and how to prioritise these.
This paper contributes in reducing this knowledge gap by providing a comprehensive analysis of the utilisation of formal healthcare and OOP payment using data for about 4,000 households obtained from a survey conducted in diversifi ed geographical locations of rural Bangladesh. We estimate self-reported morbidity, the proportion of individuals seeking care given the reported morbidity, level and determinants of the utilisation of formal healthcare as well as OOP payment including catastrophic events and the coping mechanism.
The study fi nds that over a 12-month period, 33 per cent of the individuals had self-reported morbidity and 98 per cent of whom utilised some kind of health care.
Working Paper No. 13
Utilisation of Formal Health Care and Out-of-Pocket Payments in Rural Bangladesh
3
However, only 40 per cent sought health care from formal providers. OOP costs per affected household during the 12 months preceding the survey was BDT 4,686, which was about 6% of the total household consumption.4 Expenditure on drugs appears to be the largest component of OOP costs, using up about three-fi fths of the total healthcare spending. The incidence of catastrophic expenditure was 15 per cent at the 10-per cent threshold level. Further, in about 33 and 41 per cent of the cases, the household needed to borrow or deplete assets for coping with inpatient care and catastrophic illnesses.
The organisation of the paper is as follows. Section 2 explains the methodology of the study including the survey methods, data collection and the analytical methods; section 3 presents the analytical fi ndings; section 4 provides a broader interpretation of the main fi ndings of the study and situates these in the context of both the literature as well as the current debate on public health policy, especially universal health coverage. Section 5 offers some conclusions.
4 One US dollar was equivalent to BDT 69 while the survey was in progress (mid-2009); thus all BDT fi gures have been converted at this rate where relevant.
Working Paper No. 13
Institute of Microfi nance
4
2. Methodology
2.1 Data
This paper uses data from the baseline survey of a longitudinal study project entitled ‘Microinsurance and Vulnerability’ undertaken by the Microinsurance Research Unit (MRU) at the Institute of Microfi nance (InM). The survey subjects were 4,010 stratifi ed randomly selected households distributed over 120 villages in 7 districts in Bangladesh, which accounted for about 20,000 individuals.
The survey was conducted in multiple stages. In the fi rst stage, 10 health centres (spread over 5 districts) offering Grameen Kalyan’s (GK) micro health insurance (MHI) scheme were selected purposively for a suitable mix of established and emerging centres keeping in view also the geographical diversifi cation.5 One comparable control union adjacent to each GK programme centre was then selected purposively for each of the programme areas. Each area was treated as a stratum yielding a total of 20 strata (i.e., 10 programme and 10 control). A sampling frame was formed by listing all the villages in each programme and control strata. A sample of 7 villages was randomly selected from each of the 10 programme strata and 5 villages from each of the 10 control strata yielding a total of 120 villages which are considered as primary sampling units (PSUs).
In the 2nd stage, a census was conducted in all PSUs and, thus, about 30,000 households (i.e., 19,067 from programme areas and 10,929 from control unions) were listed. In the programme villages, the listed households were divided into two groups: GK health insurance card holders (CH) and non-card holders (NCH). In each programme stratum, 105 households were randomly selected from the cardholder group and 150 from the non-card holder group.6 A total of 2,510 households (1,010 cardholders and 1,500 non-card holders) were then selected from the programme areas. Similarly, in each control stratum, 150 households were randomly selected from the listed households resulting in a total of 1,500 households for all control areas. Thus, we ended up with 4,010 households combining all programme and control areas.
All groups of observations (programme, control, card holder and non-card holder) were included in the analysis. As this is a complex multi-stage, stratifi ed sampling
5 Grameen Kalyan (an organisation of the Grameen Bank group) has been operating a prepaid health insurance scheme since 1990s in a provider mode. In November 2010, GK had 13,890 insurance cardholders in 53 health centres. 6 In fact there was a lack of suffi cient number of cardholders in one programme area and thus, we randomly selected 65 cardholders in this area.

Working Paper No. 13
Utilisation of Formal Health Care and Out-of-Pocket Payments in Rural Bangladesh
5
design, one may encounter unequal selection probability for the surveyed households leading to heteroscedasticity in standard errors by primary sampling units (Lee and Forthofer, 2006). Thus, we used sampling weights, which adjust for the complex survey design, non-response and over-sampling of GK cardholders to get the correct standard errors.
In addition to questions regarding health seeking pattern, OOP payment and the sources of coping with this expenditure, the questionnaire for the household survey also included a detailed set of questions on household demographic condition, occupation, education, income, expenditure and assets. The data were collected for all demographic segments of household members including children, those of working age and the elderly over the 12 months preceding the survey. A series of questions including type of illnesses, duration, severity and type of providers sought at the fi rst contact and at the second contact (if any) were separately asked of the respondents for each episode of illness. The information about OOP costs for consultations, drugs, diagnostic tests, surgical operations, bed charge, transports and others (food, lodging, unoffi cial fees, etc) and sources of fi nancing these expenses were also asked. We aimed at interviewing household head as he/she plays the main role in making decisions concerning major events in the household. However, in her/her absence, the spouse was interviewed.
We also conducted a village survey which covered details of physical, education and health infrastructures, literacy rate, macro shocks (fl oods, droughts, cyclones, river erosions, pest attack and so on) and the type of insurance products available locally.
The study team sought the comments and suggestions of a group of experts both inside and outside of InM on the draft version of the questionnaire. Incorporating the reviewer responses, the revised questionnaire was made ready for the training of interviewers. After a through checking of inconsistencies and language suitability during training sessions, the questionnaire was readied for testing. Incorporating the feedback received from the piloting process, the questionnaire was then fi nalised before being administered to the subjects. The survey was conducted via interviewers. A group of 60 individuals (both female and male) having a Master’s degree and three years’ experience in household survey was selected from a competitive viva-voce. They were provided with a fi ve-day training course on the background of the study and the questionnaire. In addition to mock interviews, pilot surveys were conducted in some villages near Dhaka city. On the basis of their performance in training and piloting, a fi nal group of 50 were selected (10 as fi eld supervisors, FS, and 40 as fi eld investigators, FI); and 5 were placed in the
Working Paper No. 13
Institute of Microfi nance
6
waiting list. Selected interviewers were divided into 10 groups each consisting of a fi eld supervisor and 4 fi eld investigators. The core research team visited all the survey areas during the fi rst two weeks of the survey for ensuring the quality of the data collection process. During the fi eld visits the completed questionnaires were thoroughly checked and instructions were conveyed to each survey team via cell phone upon discovering any anomalies. In addition, a research assistant made unannounced fi eld visits and verifi ed the questionnaires from time to time. The survey was conducted during July and August 2009.
Data entry procedures were executed by two sets of trained data entry operators. Data was analysed in version 11 of the STATA software.
2.2 Analytical Methods
A wide range of therapeutic choices (varying from self-care to modern western medicine) is available in a medically pluralistic society like Bangladesh. In a series of papers Ahmed (2001) and Ahmed et al. (2000, 2003, 2005, 2006) broadly classifi ed the healthcare providers into fi ve categories: (a) self-care, (b) para-professional (village practitioners who receive a one-year training in diagnosing and treating common rural ailments, medical assistants who complete a 3-year medical programme, and government and non-government community health workers), (c) qualifi ed allopathic (licensed providers who have professional medical degrees), (d) unqualifi ed allopathic (drugstore salesmen, quacks), and (e) traditional healers including homeopathy providers. Since the survey respondents may have limited knowledge about the detailed qualifi cations of the providers, such a grouping based on household survey may provide ambiguous results, which necessitates undertaking a detailed survey of the providers prior to the household survey.
In this paper we have primarily classifi ed the health care providers following some earlier studies (Nanda, 1999; BBS, 2007; Hamid et al, 2011) into: (i) self-care, (ii) unqualifi ed private providers (quacks, drugstore salesmen, homeopathic providers, traditional healers and faith healers), (iii) qualifi ed private providers (private hospitals/clinics/doctor chambers), (iv) NGO providers and (v) government providers. Like Nanda (1999) and Hamid et al (2011), these can be further classifi ed into: informal (summing categories (i) and (ii)) and formal (combining categories (iii), (iv) and (v)).
In specifying the factors determining the type of provider chosen, we have used the modifi ed version of the behavioural model following a number of studies in developing countries (Subedi, 1989; Fosu, 1994; Amin et al., 2010). This model hypothesises that four categories of factors infl uence health care seeking behaviour: (a) ‘predisposing’ (age, sex, education, marital status, health status, occupation,

Working Paper No. 13
Utilisation of Formal Health Care and Out-of-Pocket Payments in Rural Bangladesh
7
religion, household size, attitude towards health services, previous experience, price, quality of care and so on), (b) ‘enabling’ (household resources like household income, land holding, non-land asset, membership in MFIs or other fi nancial institutions, relationship with health providers; and (c) community resources like proximity to the provider, type of nearest healthcare provider, scope of existing health insurance, social network) and, (d) need (type of diseases such as acute or chronic, severity, number of sick days reported, number of workdays lost).
We construct direct OOP fi gure by adding up the expenses paid for consultations, drugs, diagnostic tests, surgical operations, and bed charges. Total OOP cost is constructed by adding the personal expenses incurred for transport, food, lodging, unoffi cial fees, etc. to direct OOP payments. We further classifi ed OOP payments into ‘catastrophic’ and ‘non-catastrophic’ categories. Financial catastrophe arises when payments for health care is a signifi cant fraction of the household’s fi nancial resources. This burden may force the household to sacrifi ce both present and future consumption of other goods and services, and thus pose a threat to the living standard both in the short and the long run. Ideally longitudinal data is required to estimate the extent of serious disruption in wellbeing caused due to unpredictable OOP payments. However, in the absence of such data, alternative threshold levels have been proposed in the literature. A number of studies have used 10 per cent of total household expenditure as catastrophic, while others have used thresholds up to 25 per cent.7 In this paper, we use both 10 and 25 per cent of total expenditure as alternative threshold levels.
The burden of OOP payment depends not only on the size of catastrophic expenses but also on the strategies adopted for fi nancing health expenses. Households usually adopt different strategies (such as regular income, accumulated saving, borrowing, asset depletion and so on) for meeting the healthcare expenses. Economically some strategies, such as borrowing and asset depletion prove burdensome than using up income and accumulated saving.8
We used both bivariate and multivariate methods for analysing the data. The nature of the outcome variable (regular, binary or ordered) dictates the specifi cation of a model in multivariate analysis. We have structured the outcomes illustrated above
7 See for example, studies by Pradhan and Prescott, 2002; Ranson, 2002; Wagstaff and Van Doorslaer, 2003; O’Donnell et al., 2005 and Garg and Karan, 2005. Vaishnavi and Dash (2009), however, used both 10 and 25 per cent, while van Doorslaer et al. (2006) used 5 and 25 per cent and Flores et al. (2008) used 5, 10 and 20 per cent of total expenditure as alternative thresholds.
8 Use of income for meeting health expenses reduces current consumption of other goods and services. Using up accumulated saving reduces future income by reducing investment, while borrowing reduces future consumption and investment via debt servicing. Finally, asset depletion (especially of productive ones) reduces future income, and thus would lower future consumption.
Working Paper No. 13
Institute of Microfi nance
8
as binary outcomes. One can use either logit or probit model to regress the binary outcome. However, probit model is commonly used in the literature. Thus, in this paper we specify probit models to regress the binary outcomes (e.g., utilisation of formal vs. informal health care, utilisation of private vs. public health care, incidence of catastrophic vs. non-catastrophic expenses and more burdensome sources vs. less expensive sources of coping with OOP costs). An illustration of model specifi cation and structure of independent variables used in the model for each outcome has been provided in the respective sections.
Working Paper No. 13
Utilisation of Formal Health Care and Out-of-Pocket Payments in Rural Bangladesh
9
3. Analysis and Findings
3.1 Demographic and Socio-Economic Characteristics
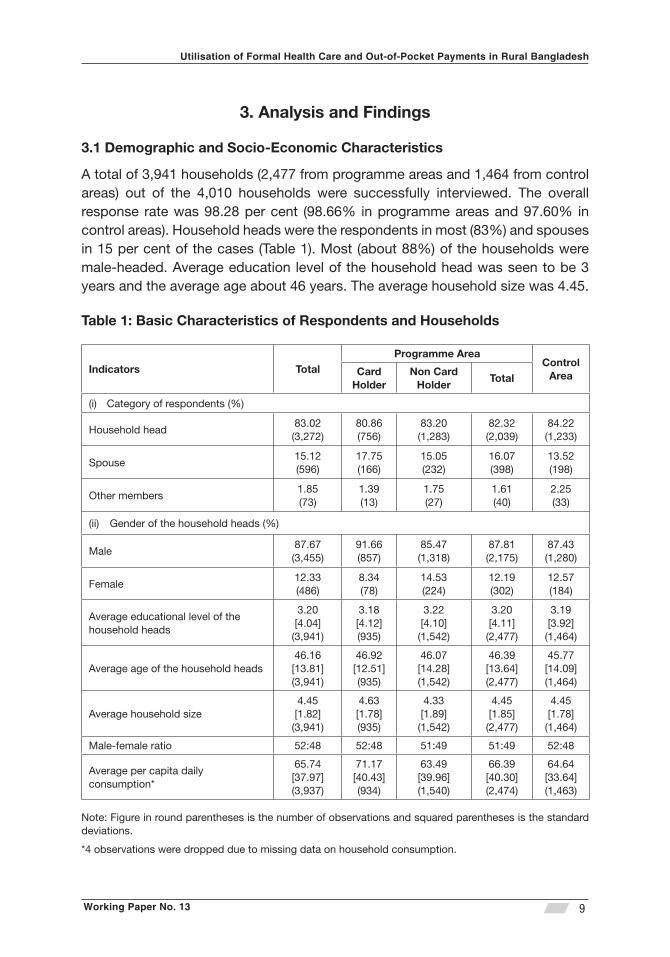
A total of 3,941 households (2,477 from programme areas and 1,464 from control areas) out of the 4,010 households were successfully interviewed. The overall response rate was 98.28 per cent (98.66% in programme areas and 97.60% in control areas). Household heads were the respondents in most (83%) and spouses in 15 per cent of the cases (Table 1). Most (about 88%) of the households were male-headed. Average education level of the household head was seen to be 3 years and the average age about 46 years. The average household size was 4.45.
Table 1: Basic Characteristics of Respondents and Households
Indicators Total Programme Area
Control Area Card
Holder Non Card
Holder Total
Category of respondents (%)(i)
Household head83.02(3,272)
80.86(756)
83.20(1,283)
82.32(2,039)
84.22(1,233)
Spouse15.12(596)
17.75(166)
15.05(232)
16.07(398)
13.52(198)
Other members1.85(73)
1.39(13)
1.75(27)
1.61(40)
2.25(33)
Gender of the household heads (%)(ii)
Male87.67(3,455)
91.66(857)
85.47(1,318)
87.81(2,175)
87.43(1,280)
Female12.33(486)
8.34(78)
14.53(224)
12.19(302)
12.57(184)
Average educational level of the household heads
3.20[4.04](3,941)
3.18[4.12](935)
3.22[4.10](1,542)
3.20[4.11](2,477)
3.19[3.92](1,464)
Average age of the household heads46.16[13.81](3,941)
46.92[12.51](935)
46.07[14.28](1,542)
46.39[13.64](2,477)
45.77[14.09](1,464)
Average household size 4.45[1.82](3,941)
4.63[1.78](935)
4.33[1.89](1,542)
4.45[1.85](2,477)
4.45[1.78](1,464)
Male-female ratio 52:48 52:48 51:49 51:49 52:48
Average per capita daily consumption*
65.74[37.97](3,937)
71.17[40.43](934)
63.49[39.96](1,540)
66.39[40.30](2,474)
64.64[33.64](1,463)
Note: Figure in round parentheses is the number of observations and squared parentheses is the standard deviations.
*4 observations were dropped due to missing data on household consumption.
Working Paper No. 13
Institute of Microfi nance
10
The mean of per capita daily consumption (both food and non-food) is about BDT 66.9 The agriculture sector absorbed by about 30 per cent of the household heads (about 29% in programme areas and about 32% in control areas) followed by day labour (about 16%) and small business (about 14%, not shown in Tables).
3.2 Pattern of Morbidity and Care Seeking
The survey enquired whether any individual in the household suffered any acute or chronic condition during the 12 months preceding the interview. They were also asked whether they had received any treatment for their condition and the type of care they received, if any. The survey covered 19,424 individuals of which about 33 per cent underwent some form of self-reported morbidity over 12 months. At the household level, about 88 per cent (3,459 out of 3,941) of households reported at least one episode of illness while about 55 per cent of them (i.e., 48% of the sampled households) had more than one in the 12-month period (about 35% had 2 episodes and about 20% had 3 or more). Figure 1 shows the pattern of self-reported morbidity and the proportion of individuals seeking care given the morbidity.
9 Note that poverty line expenditure estimated by cost of basic need (CBN) approach is BDT 61. For measuring food consumption we considered the expenditure on all the food bundles consumed by the households for the week preceding the survey. We considered expenditure for non-food consumption against the following items: clothing, toiletries, cookware, blanket, furniture, lamp, fl ash light, candle, match, kerosene, electricity, transportation, fuel, maintenance and repair of household contents, taxes, donation and tolls, recreation, smoking, tuition fees, stationeries, mobile and land telephone bills, festivals and traditional ceremonies, electronic equipment and health expenses (both direct and indirect).

Working Paper No. 13
Utilisation of Formal Health Care and Out-of-Pocket Payments in Rural Bangladesh
11
Figure 1: A Schematic View of Self-Reported Illnesses
Did seek any treatment?
Self-reported (major) symptoms (%) (n)
Fever, cough & cold 33.00 2,136
Gastro intestinal disorder
10.71 694
Pain 5.76 373
Diarrhoea 4.83 313
Typhoid 3.58 232
Headache 3.57 231
Blood pressure 2.27 147
Skin diseases 2.16 140
Dysentery 2.15 139
Influenza 1.93 125 Jaundice 1.82 118
Heart disease 1.76 114
Ear diseases 1.58 102
Dental disease 1.41 91
Breathing problem
1.41 91
Fracture 1.33 86
Eye disease 1.19 77
Anaemia 1.05 68
Diabetes 1.03 67
Asthma 0.97 63
Pox 0.96 62
STDS 0.96 62
Pneumonia 0.96 62
Uterus removal 0.94 61
Injury/wound 0.82 53
Tumour 0.77 50
11.08 717 Total 100 6,474
Self-reported cases of illness
(%) (n)
Total 33.33 6,474
Programme 32.09 3,907 • Card
holder 33.17 1,574 • Non-card
holder 31.39 2,333
Control 35.42 2,567
Severity of illness (%)
• Bed ridden (48.12) • Inability to stand
easily (1.79) • Inability to sit easily
(1.36) • Inability to walk
easily (4.80) • Inability to do regular
activities (30.99) • Not much severe
(12.94)
Yes
(%) (n)
Total 98.12 6,352
Programme 98.64 3,854
• Card holder 98.35 1,548 • Non card
holder 98.84 2,306
Control 97.31 2,498
No
(%) (n)
Total 1.88 122
Programme 1.36 53
Control 2.69 69
Reasons for not seeking any treatment % (n)
• Unable to pay 44.26 (54) • Not needed 37.70 (46) • Lack of perception
about the severity of disease 9.84 (12)
• Other 8.20 (10)
Total number of individuals covered in the survey (n)
Total 19,424
Programme 12,177
• Card holder 4,745
• Non-card holder 7,432
Control 7,247
Self-reported ailments by major categories
(%) (n) CDs 48.86 3,163
NCDs 49.00 3,172 A&I 2.15 139 Total 100 6,474
Self-reported ailments by hospital visit
(%) (n) In-patient 4.94 314
Out-patient 95.06 6,038
Total 100 6,352
Number of visits
(%) (n)
One time 81.36 5,168
Two times 16.78 1,066
Three times 1.24 79
Four times 0.61 39
Other disease
Working Paper No. 13
Institute of Microfi nance
12
Our analysis reveals that the incidence of morbidity was signifi cantly lower (p-value < 0.05) in the programme areas compared to the control areas. However, this was slightly higher among the GK cardholders than non-card holders. About one-third of the ill persons suffered from ‘general cough and fever’. Other major symptoms were gastrointestinal disorder, abdominal pain, diarrhoea, typhoid, headache, blood pressure, skin diseases and dysentery. The incidence of communicable diseases (CDs) and non-communicable diseases (NCDs) was about equal in the sample. In terms of the extent of illness, about 48 per cent of the sick were ‘severely ill’ (bed ridden), 39 per cent ‘moderately ill’ and the remaining 13 per cent ‘not very ill’.10
The overwhelming majority (about 98%) of the ill persons sought some kind of care; though most (95%) of the care-seekers went for outpatient services. It is further seen that about 81% of all who sought care, had only one visit; about 17% had two and a meagre 2% required three or more visits to the ‘provider’; see below for the range of providers. Although, the utilisation of health care was slightly higher in the programme compared to the control areas, there was no difference between the GK cardholders and the non-card holders. About 38 per cent of those who did not seek any care in spite of being ill, had the perception that provider care was not needed in their case, but about 44 per cent of them were prevented from accessing provider care due to the inability to pay. However the latter fi gure (actually just 54 episodes out of 6,474) accounts for even less than one per cent of all who reported being sick over the 12-month-period under review.
3.3 The Choice between Formal vs. Informal Care
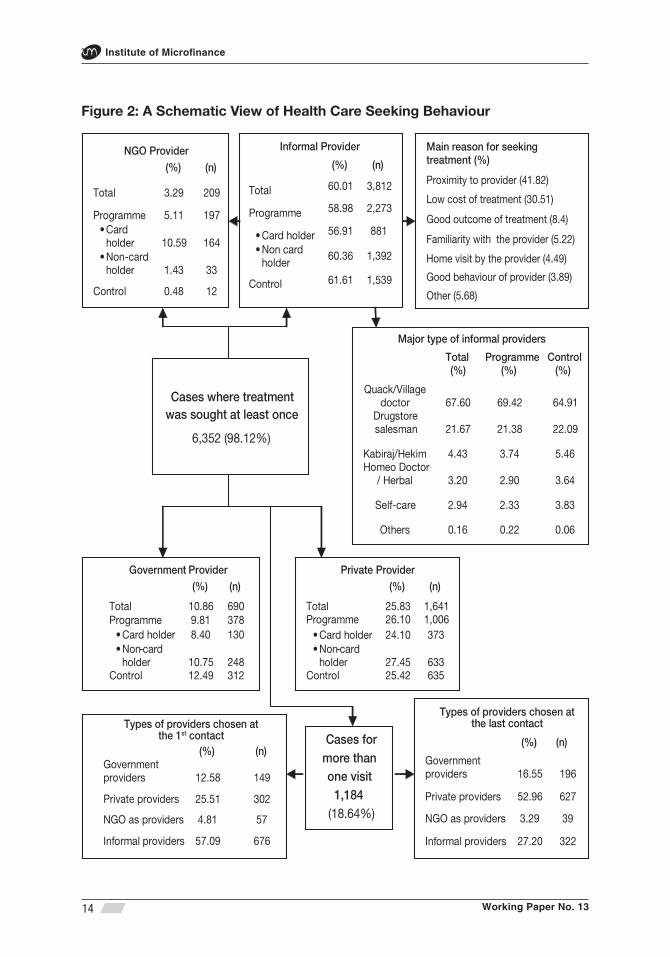
Figure 2 illustrates the type of health care sought by the sick. Predictably, the majority (about 60%) of those who sought some form of health care went to informal providers followed by private providers (about 26%) and government providers (about 11%). More than two-thirds (about 68%) of those who went to informal providers, visited quacks (village doctors) followed by drugstore salesman (about 22%). While the propensity to choose informal providers was about the same between the programme and control areas (59 vs. 61.6 per cent, respectively), it was marginally lower among the GK cardholders compared to non-card holders (56.9 vs. 60.4 per cent respectively). Proximity was reported to be the main reason for selecting the type of provider by about 42 per cent of those who sought ‘informal’ care followed by the ‘low cost of treatment’ (about 31%). Among GK cardholders, as just noted, a majority went for informal care, and only 10.6
10 A structured question was posed to identify the severity of illness using the following options: (i) bed ridden, (ii) inability to stand properly, (iii) inability to sit properly, (iv) inability to walk properly, (v) inability to perform regular activities, and (vi) not much ill. We classifi ed the fi rst one as ‘severe’, (ii)-(v) ‘moderately severe’ and (vi) ‘not very ill’.
Working Paper No. 13
Utilisation of Formal Health Care and Out-of-Pocket Payments in Rural Bangladesh
13
per cent (i.e., 164 out of 1,548 sought cares) went to the GK facility, a puzzle that needs to be addressed fully.
For those choosing formal providers, while the propensity to seek private care remained about the same (26.1 vs. 25.4, respectively) for programme and control groups, there appears to be some important differences when it came to choose between government and NGO providers. In fact, lacking access to NGO care, which was utilised by about 5.1 per cent of the programme patients, control subjects chose government care instead (12.5 vs. 9.8 in the programme areas).
Working Paper No. 13
Institute of Microfi nance
14
Figure 2: A Schematic View of Health Care Seeking Behaviour
Cases where treatment
was sought at least once
6,352 (98.12%)
Cases for more than one visit
1,184 (18.64%)
Types of providers chosen atthe 1st contact
(%) (n) Government providers 12.58 149
Private providers 25.51 302
NGO as providers 4.81 57
Informal providers 57.09 676
Informal Provider
(%) (n)
Total 60.01 3,812
Programme 58.98 2,273
• Card holder 56.91 881
• Non card holder
60.36 1,392
Control 61.61 1,539
Government Provider (%) (n)
Total 10.86 690 Programme 9.81 378
• Card holder 8.40 130 • Non-card
holder 10.75 248 Control 12.49 312
Private Provider (%) (n)
Total 25.83 1,641
Programme 26.10 1,006
• Card holder 24.10 373 • Non-card
holder 27.45 633 Control 25.42 635
NGO Provider
(%) (n)
Total 3.29 209
Programme 5.11 197 • Card
holder 10.59 164 • Non-card
holder 1.43 33
Control 0.48 12
Types of providers chosen atthe last contact
(%) (n)
Government providers 16.55 196
Private providers 52.96 627
NGO as providers 3.29 39
Informal providers 27.20 322
Major type of informal providers
Total (%)
Programme (%)
Control (%)
Quack/Village doctor 67.60 69.42 64.91
Drugstore salesman 21.67 21.38 22.09
Kabiraj/Hekim 4.43 3.74 5.46 Homeo Doctor
/ Herbal 3.20 2.90 3.64
Self-care 2.94 2.33 3.83
Others 0.16 0.22 0.06
Main reason for seeking treatment (%)
Proximity to provider (41.82)
Low cost of treatment (30.51)
Good outcome of treatment (8.4) Familiarity with the provider (5.22)
Home visit by the provider (4.49)
Good behaviour of provider (3.89)
Other (5.68)
Working Paper No. 13
Utilisation of Formal Health Care and Out-of-Pocket Payments in Rural Bangladesh
15
Turning to those requiring multiple visits, about three quarters (about 73%) found care from formal providers (mainly private providers) in the last contact, while in the fi rst contact, the majority (about 57%) had sought out informal providers. The later fi gures may indicate something about the relative quality and cost of care.
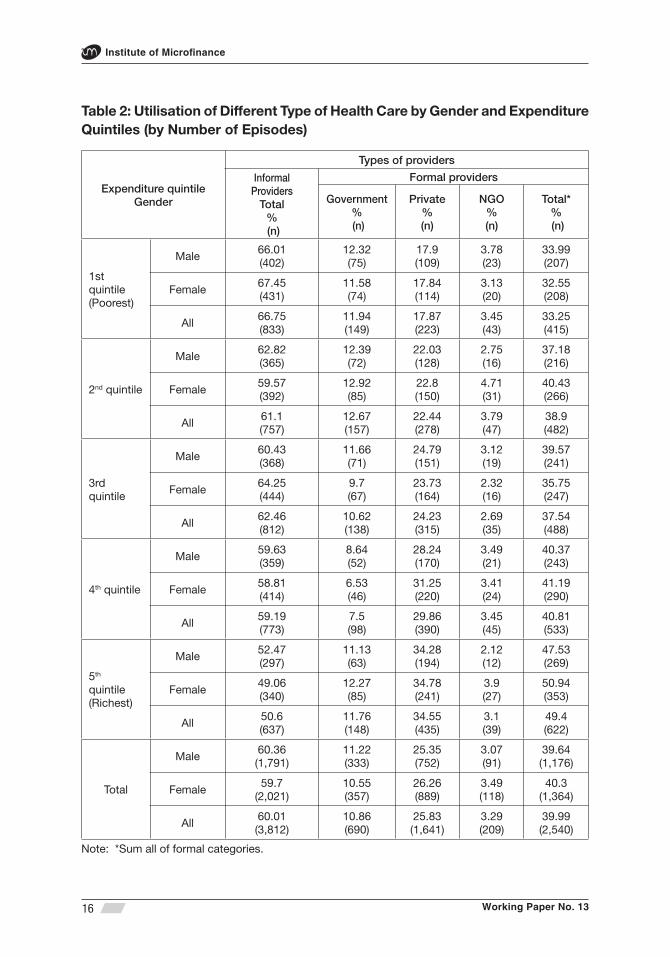
Table 2 shows the distribution of the type of care provider over the expenditure quintiles and the gender of the ill.11 As one moves up the expenditure ladder, the utilisation of formal care, while still low in absolute terms, improves signifi cantly, especially for female patients. Not surprisingly, the above pattern in the access to formal care is mostly on account of the presumably costlier private facilities (utilisation rate going up from 18% in the lowest quintile to about 35% in the highest quintile).
Overall, the poorest quintile shows a signifi cantly lower (p-value < 0.05) utilisation of formal care than the rich (fourth and fi fth) quintiles (33 vs. 41 and 49 per cent, respectively), which can be plausibly explained by resource constraints. The difference between the 4th and the 5th quintiles by their 8-percentage point difference in the preference for formal care is striking, indicating perhaps that health care is a luxury good (i.e., as conventionally measured by reference to income elasticity). It is also evident that access to public facilities appears to improve dramatically as one moves up from the 4th to the 5th quintile, presumably due to the better-off receiving good attention at the government hospitals by virtue of their social status, a phenomenon that is consistent with evidence elsewhere.
11 Non-health household expenditure was considered in computing quintiles.
Working Paper No. 13
Institute of Microfi nance
16
Table 2: Utilisation of Different Type of Health Care by Gender and Expenditure Quintiles (by Number of Episodes)
Expenditure quintileGender
Types of providers
Informal Providers
Total% (n)
Formal providers
Government % (n)
Private% (n)
NGO% (n)
Total*% (n)
1st quintile (Poorest)
Male66.01(402)
12.32(75)
17.9(109)
3.78(23)
33.99(207)
Female67.45(431)
11.58(74)
17.84(114)
3.13(20)
32.55(208)
All66.75(833)
11.94(149)
17.87(223)
3.45(43)
33.25(415)
2nd quintile
Male62.82(365)
12.39(72)
22.03(128)
2.75(16)
37.18(216)
Female59.57(392)
12.92(85)
22.8(150)
4.71(31)
40.43(266)
All61.1(757)
12.67(157)
22.44(278)
3.79(47)
38.9(482)
3rd quintile
Male60.43(368)
11.66(71)
24.79(151)
3.12(19)
39.57(241)
Female64.25(444)
9.7(67)
23.73(164)
2.32(16)
35.75(247)
All62.46(812)
10.62(138)
24.23(315)
2.69(35)
37.54(488)
4th quintile
Male59.63(359)
8.64(52)
28.24(170)
3.49(21)
40.37(243)
Female58.81(414)
6.53(46)
31.25(220)
3.41(24)
41.19(290)
All59.19(773)
7.5(98)
29.86(390)
3.45(45)
40.81(533)
5th quintile(Richest)
Male52.47(297)
11.13(63)
34.28(194)
2.12(12)
47.53(269)
Female49.06(340)
12.27(85)
34.78(241)
3.9(27)
50.94(353)
All50.6(637)
11.76(148)
34.55(435)
3.1(39)
49.4(622)
Total
Male60.36(1,791)
11.22(333)
25.35(752)
3.07(91)
39.64(1,176)
Female59.7
(2,021)10.55(357)
26.26(889)
3.49(118)
40.3(1,364)
All60.01(3,812)
10.86(690)
25.83(1,641)
3.29(209)
39.99(2,540)
Note: *Sum all of formal categories.

Working Paper No. 13
Utilisation of Formal Health Care and Out-of-Pocket Payments in Rural Bangladesh
17
Somewhat surprisingly, the utilisation rate of public/NGO care has remained stagnant across expenditure groups both for males and females (at about 11 and 3 per cent, respectively) even when a lot of progress has been made in recent years with the provision of maternal care by such agencies especially in rural locations.
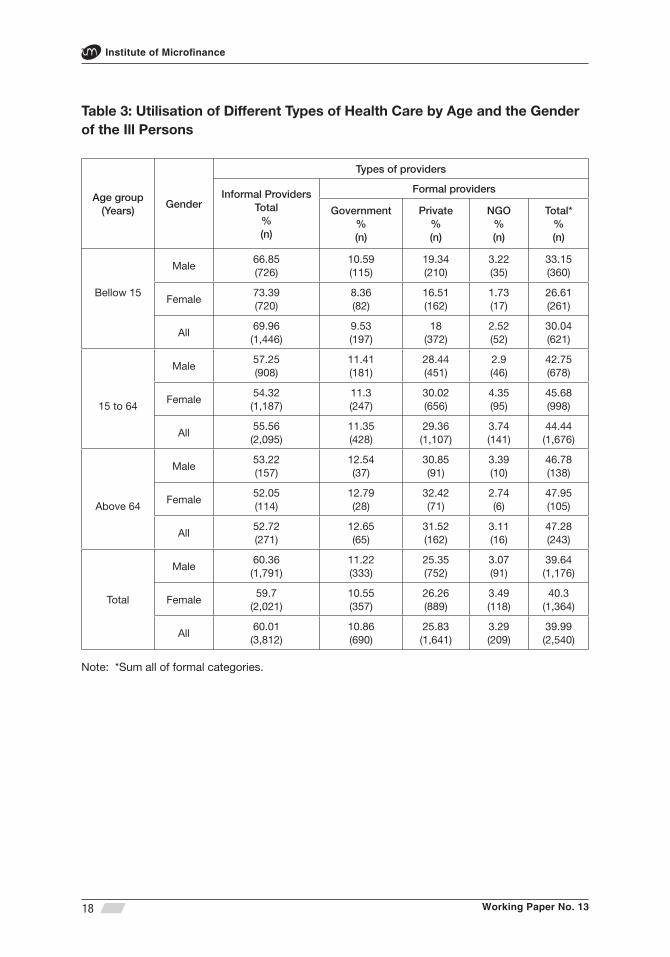
Table 3 shows the association between age/gender of the patient and the care-seeking pattern. Utilisation of formal healthcare appears to rise perceptibly with the age of the sick person. The children (age < 15 years) had signifi cantly (p-value <0.01) lower utilisation of formal healthcare compared to working age population (age 15-64 years) and the elderly (age > 64 years).
Working Paper No. 13
Institute of Microfi nance
18
Table 3: Utilisation of Different Types of Health Care by Age and the Gender of the Ill Persons
Age group(Years)
Gender
Types of providers
Informal ProvidersTotal
%(n)
Formal providers
Government%(n)
Private%(n)
NGO%(n)
Total*%(n)
Bellow 15
Male66.85(726)
10.59(115)
19.34(210)
3.22(35)
33.15(360)
Female73.39(720)
8.36(82)
16.51(162)
1.73(17)
26.61(261)
All69.96(1,446)
9.53(197)
18(372)
2.52(52)
30.04(621)
15 to 64
Male57.25(908)
11.41(181)
28.44(451)
2.9(46)
42.75(678)
Female54.32(1,187)
11.3(247)
30.02(656)
4.35(95)
45.68(998)
All55.56(2,095)
11.35(428)
29.36(1,107)
3.74(141)
44.44(1,676)
Above 64
Male53.22(157)
12.54(37)
30.85(91)
3.39(10)
46.78(138)
Female52.05(114)
12.79(28)
32.42(71)
2.74(6)
47.95(105)
All52.72(271)
12.65(65)
31.52(162)
3.11(16)
47.28(243)
Total
Male60.36(1,791)
11.22(333)
25.35(752)
3.07(91)
39.64(1,176)
Female59.7
(2,021)10.55(357)
26.26(889)
3.49(118)
40.3(1,364)
All60.01(3,812)
10.86(690)
25.83(1,641)
3.29(209)
39.99(2,540)
Note: *Sum all of formal categories.
Working Paper No. 13
Utilisation of Formal Health Care and Out-of-Pocket Payments in Rural Bangladesh
19
Interestingly, the above difference between the children and the working age population remains signifi cant (p-value <0.05) for all expenditure quintiles (not reported in Table 3, however). Although the utilisation rate of formal healthcare is slightly higher among adult women (vis-à-vis men), especially those in the working age group, this is signifi cantly (p-value < 0 .10) lower for the female children (i.e., compared to boys).
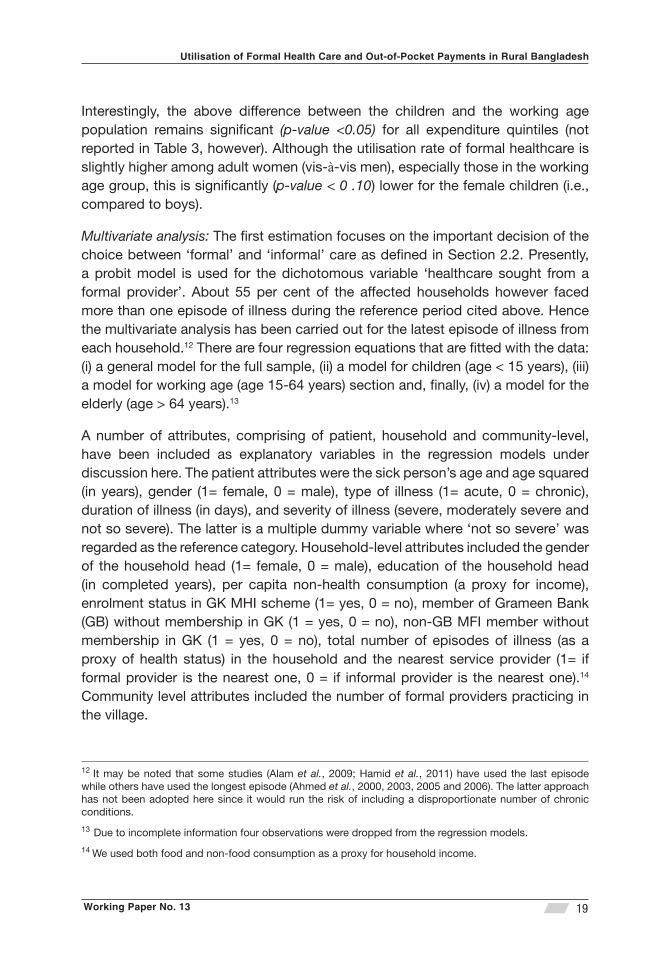
Multivariate analysis: The fi rst estimation focuses on the important decision of the choice between ‘formal’ and ‘informal’ care as defi ned in Section 2.2. Presently, a probit model is used for the dichotomous variable ‘healthcare sought from a formal provider’. About 55 per cent of the affected households however faced more than one episode of illness during the reference period cited above. Hence the multivariate analysis has been carried out for the latest episode of illness from each household.12 There are four regression equations that are fi tted with the data: (i) a general model for the full sample, (ii) a model for children (age < 15 years), (iii) a model for working age (age 15-64 years) section and, fi nally, (iv) a model for the elderly (age > 64 years).13
A number of attributes, comprising of patient, household and community-level, have been included as explanatory variables in the regression models under discussion here. The patient attributes were the sick person’s age and age squared (in years), gender (1= female, 0 = male), type of illness (1= acute, 0 = chronic), duration of illness (in days), and severity of illness (severe, moderately severe and not so severe). The latter is a multiple dummy variable where ‘not so severe’ was regarded as the reference category. Household-level attributes included the gender of the household head (1= female, 0 = male), education of the household head (in completed years), per capita non-health consumption (a proxy for income), enrolment status in GK MHI scheme (1= yes, 0 = no), member of Grameen Bank (GB) without membership in GK (1 = yes, 0 = no), non-GB MFI member without membership in GK (1 = yes, 0 = no), total number of episodes of illness (as a proxy of health status) in the household and the nearest service provider (1= if formal provider is the nearest one, 0 = if informal provider is the nearest one).14 Community level attributes included the number of formal providers practicing in the village.
12 It may be noted that some studies (Alam et al., 2009; Hamid et al., 2011) have used the last episode while others have used the longest episode (Ahmed et al., 2000, 2003, 2005 and 2006). The latter approach has not been adopted here since it would run the risk of including a disproportionate number of chronic conditions.
13 Due to incomplete information four observations were dropped from the regression models.
14 We used both food and non-food consumption as a proxy for household income.

Working Paper No. 13
Institute of Microfi nance
20
In order to compute unbiased estimates in model (I) svy (survey) family of commands available in STATA software has been used, which is especially suited to the complex survey design here. However, svy command is not applicable to models (II), (III) and (IV) because the sampling weight does not fi t the data clustered (by age) within strata. Thus, in these models conventional commands were used for estimating the probit model. All the models are jointly signifi cant at the one-per cent level. All models other than model (II) also pass the RESET test.
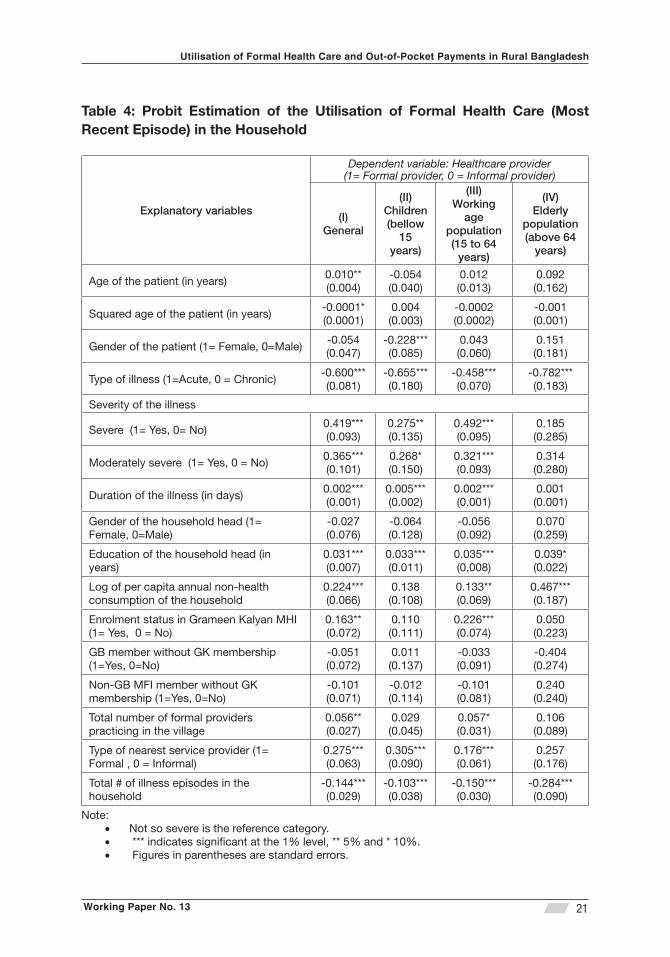
Estimation results reported in Table 4 shows that the likelihood of using formal care in general (all age categories), i.e., model (I), increases signifi cantly (p-value ≤ 0.05) with the age of the patient, duration of illness, severity of the illness, education of the household head, non-health per capita consumption and total number of formal providers practicing in the village. The likelihood of using formal care also signifi cantly increases (p-value ≤ 0.05) where the (formal) provider is the nearest one and when the household had enrolment in Grameen Kalyan MHI scheme. The GK membership, a type of formal intervention, though outpatient only, had a signifi cant effect on the choice of formal care both in general and especially so for the working age population. Another study by Ahmed et al. (2006) also found that a formal intervention (targeted at the ultra-poor) had increased the use of formal care by 9 per cent.
Acute (as opposed to chronic) condition of illness and total number of illness episodes in the household each has signifi cant (p-value < 0.01) negative association with the likelihood of using formal care. Financial burden would presumably explain such behaviour.
The factors cited above are also similarly associated with the likelihood of using formal care of the children and the working age population with some exceptions. Non-health annual per capita consumption does not have any signifi cant association with the likelihood of using formal care in the choice of care type for children (model II). Though girl patients have signifi cant (p-value < 0.01) negative association with the choice of formal care vis-à-vis boys in the same model, if this is indicative of a bias against female health, it only applies to those below 15. Enrolment status in GK health programme seems also not to matter here.
The working age equation (model III) is very similar to the general case (i.e., model I), except in some minor aspects much as the patient’s age. The model relating to the elderly (i.e., 64 and over) however leads to some surprising observations. Contrary to the general case, none of the patient’s age, the severity of illness, health plan enrolment status or the proximity to the provider appear to matter in the choice of the care provider. There are thus indications that the elderly heath is ignored to an extent by society.15
15 However, Ahmed et al. (2005) claim to fi nd no major difference between young adults and the elderly, though the latter were defi ned to be the 60+ group, while it is 64 and above in the present case.
Working Paper No. 13
Utilisation of Formal Health Care and Out-of-Pocket Payments in Rural Bangladesh
21
Table 4: Probit Estimation of the Utilisation of Formal Health Care (Most Recent Episode) in the Household
Explanatory variables
Dependent variable: Healthcare provider (1= Formal provider, 0 = Informal provider)
(I)General
(II)Children (bellow
15 years)
(III)Working
age population (15 to 64
years)
(IV)Elderly
population(above 64
years)
Age of the patient (in years)0.010**(0.004)
-0.054(0.040)
0.012(0.013)
0.092(0.162)
Squared age of the patient (in years)-0.0001*(0.0001)
0.004(0.003)
-0.0002(0.0002)
-0.001(0.001)
Gender of the patient (1= Female, 0=Male)-0.054(0.047)
-0.228***(0.085)
0.043(0.060)
0.151(0.181)
Type of illness (1=Acute, 0 = Chronic)-0.600***(0.081)
-0.655***(0.180)
-0.458***(0.070)
-0.782***(0.183)
Severity of the illness
Severe (1= Yes, 0= No)0.419***(0.093)
0.275**(0.135)
0.492***(0.095)
0.185(0.285)
Moderately severe (1= Yes, 0 = No)0.365***(0.101)
0.268*(0.150)
0.321***(0.093)
0.314(0.280)
Duration of the illness (in days)0.002***(0.001)
0.005***(0.002)
0.002***(0.001)
0.001(0.001)
Gender of the household head (1= Female, 0=Male)
-0.027(0.076)
-0.064(0.128)
-0.056(0.092)
0.070(0.259)
Education of the household head (in years)
0.031***(0.007)
0.033***(0.011)
0.035***(0.008)
0.039*(0.022)
Log of per capita annual non-health consumption of the household
0.224***(0.066)
0.138(0.108)
0.133**(0.069)
0.467***(0.187)
Enrolment status in Grameen Kalyan MHI (1= Yes, 0 = No)
0.163**(0.072)
0.110(0.111)
0.226***(0.074)
0.050(0.223)
GB member without GK membership (1=Yes, 0=No)
-0.051(0.072)
0.011(0.137)
-0.033(0.091)
-0.404(0.274)
Non-GB MFI member without GK membership (1=Yes, 0=No)
-0.101(0.071)
-0.012(0.114)
-0.101(0.081)
0.240(0.240)
Total number of formal providers practicing in the village
0.056**(0.027)
0.029(0.045)
0.057*(0.031)
0.106(0.089)
Type of nearest service provider (1= Formal , 0 = Informal)
0.275***(0.063)
0.305***(0.090)
0.176***(0.061)
0.257(0.176)
Total # of illness episodes in the household
-0.144***(0.029)
-0.103***(0.038)
-0.150***(0.030)
-0.284***(0.090)
Note: Not so severe is the reference category.• *** indicates signifi cant at the 1% level, ** 5% and * 10%.• Figures in parentheses are standard errors.•
Working Paper No. 13
Institute of Microfi nance
22
Table 4: Probit Estimation of the Utilisation of Formal Health Care (Most Recent Episode) in the Household (Continued)
Particulars
Dependent variable: Healthcare provider(1= Formal provider, 0 = Informal provider)
(I)General
(II)Children (bellow
15 years)
(III)Working age population (15 to 64
years)
(IV)Elderly
population(above 64
years)
Number of episodes (see note 4 below)
3,392 1,045 2,058 289
Number of Strata 20 - - -
Number of PSUs (Primary sampling units)
120 - - -
F-statistic/ LR Chi2 F(16,85)= 14.04***
LR chi2 (16) = 97.11***
LR chi2 (16) =230.07***
LR chi2 (16) = 64.53***
Pseudo R2 - 0.074 0.081 0.161
Goodness-of-fi t test -
Pearson Chi2
(1028)=1051.73Prob> Chi2
=0.297
Pearson Chi2 (2041)=
2070.35Prob> Chi2 =
0.320
Pearson Chi2
(272)= 294.37Prob> Chi2 =
0.168
RESET test
Adjusted Wald test F(1,100) =2.36
Prob > F =0.128
Chi2 (1) = 12.28Prob> Chi2
=0.001
Chi2 (1)= 1.43Prob> Chi2
=0.232
Chi2 (1)=0.44Prob> Chi2 =
0.508
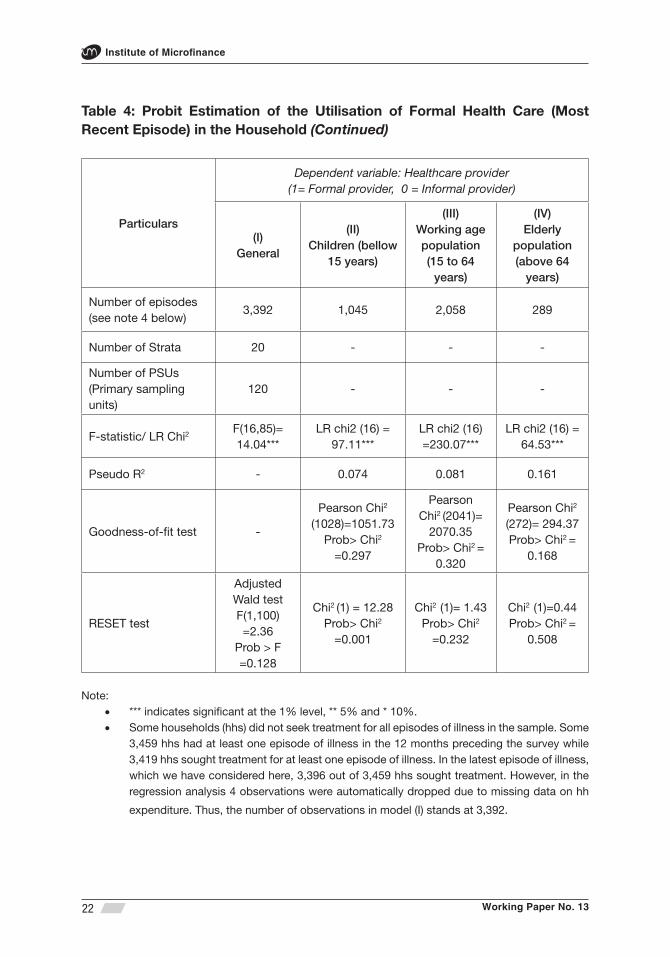
Note: *** indicates signifi cant at the 1% level, ** 5% and * 10%.• Some households (hhs) did not seek treatment for all episodes of illness in the sample. Some • 3,459 hhs had at least one episode of illness in the 12 months preceding the survey while 3,419 hhs sought treatment for at least one episode of illness. In the latest episode of illness, which we have considered here, 3,396 out of 3,459 hhs sought treatment. However, in the regression analysis 4 observations were automatically dropped due to missing data on hh
expenditure. Thus, the number of observations in model (I) stands at 3,392.
Working Paper No. 13
Utilisation of Formal Health Care and Out-of-Pocket Payments in Rural Bangladesh
23
3.4 Out of Pocket (OOP) Payments
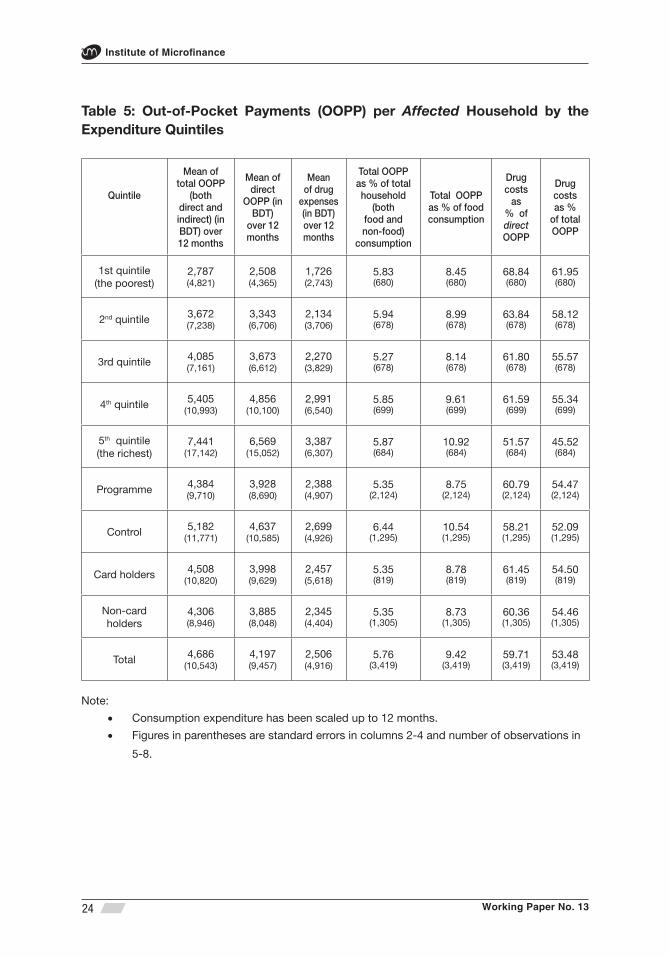
Turning to the behaviour of OOP payments, it is seen that total (both direct and indirect), direct and OOP costs on account of drugs per affected household for all episodes of illnesses during the 12 months preceding the survey stood at BDT 4,686, BDT 4,197 and BDT 2,506 respectively (Table 5).16 Cost of drugs is therefore the major component of OOP payments accounting for about 60 per cent of direct and about 53 per cent of total OOP costs. In other words, total OOP payment comes to about 6 per cent of the value of total household consumption and about 9 per cent of the food expenses. Although the absolute value of OOP payment shows a defi nite positive association as one move up the expenditure quintile, there is no signifi cant variation across the quintiles in its share of either total or food consumption.
The share of drug costs in both direct and total OOP payment however shows an unambiguous negative pattern across the quintiles, and the difference (69 vs. 52 per cent for the poorest and the richest quintiles, respectively) is signifi cant (p-value < 0.05). Health care for the very poor therefore appears to be largely synonymous with ‘accessing drugs’.
Earlier it has been observed that the ‘formal’ care seeking behaviour does differ between the programme and control segments of the survey population (Figure 2). The higher expense incurred by the control group would be consistent with their higher propensity to utilise government care as NGO care is largely absent in these locations. Thus while there is a considerable difference in all categories of OOP payments between the programme and control areas, the difference is negligible between GK cardholders and non-card holders.
16 Total, direct and OOP costs for drug from all episodes of diseases over 12 months, when averaged over all sampled households, decline to BDT 4,065, BDT 3,641 and BDT 2,174, respectively (not shown in the table).
Working Paper No. 13
Institute of Microfi nance
24
Table 5: Out-of-Pocket Payments (OOPP) per Affected Household by the Expenditure Quintiles
Quintile
Mean of total OOPP
(both direct and indirect) (in BDT) over 12 months
Mean of direct
OOPP (in BDT)
over 12 months
Mean of drug
expenses (in BDT) over 12 months
Total OOPP as % of total household
(both food and non-food)
consumption
Total OOPP as % of food consumption
Drug costs
as % of direct OOPP
Drug costs as %
of total OOPP
1st quintile(the poorest)
2,787(4,821)
2,508(4,365)
1,726(2,743)
5.83(680)
8.45(680)
68.84(680)
61.95(680)
2nd quintile 3,672(7,238)
3,343(6,706)
2,134(3,706)
5.94(678)
8.99(678)
63.84(678)
58.12(678)
3rd quintile 4,085(7,161)
3,673(6,612)
2,270(3,829)
5.27(678)
8.14(678)
61.80(678)
55.57(678)
4th quintile 5,405(10,993)
4,856(10,100)
2,991(6,540)
5.85(699)
9.61(699)
61.59(699)
55.34(699)
5th quintile(the richest)
7,441(17,142)
6,569(15,052)
3,387(6,307)
5.87(684)
10.92(684)
51.57(684)
45.52(684)
Programme 4,384(9,710)
3,928(8,690)
2,388(4,907)
5.35(2,124)
8.75(2,124)
60.79(2,124)
54.47(2,124)
Control 5,182(11,771)
4,637(10,585)
2,699(4,926)
6.44(1,295)
10.54(1,295)
58.21(1,295)
52.09(1,295)
Card holders 4,508(10,820)
3,998(9,629)
2,457(5,618)
5.35(819)
8.78(819)
61.45(819)
54.50(819)
Non-card holders
4,306(8,946)
3,885(8,048)
2,345(4,404)
5.35(1,305)
8.73(1,305)
60.36(1,305)
54.46(1,305)
Total 4,686(10,543)
4,197(9,457)
2,506(4,916)
5.76(3,419)
9.42(3,419)
59.71(3,419)
53.48(3,419)
Note:
Consumption expenditure has been scaled up to 12 months. • Figures in parentheses are standard errors in columns 2-4 and number of observations in •
5-8.
Working Paper No. 13
Utilisation of Formal Health Care and Out-of-Pocket Payments in Rural Bangladesh
25
Reviewing the types of illnesses, it is noted that total OOP payments per episode of CDs, NCDs and A&I (accidents and injuries) was BDT 949, BDT 4,014 and BDT 4,651 respectively (Table A1). Quite plausibly therefore, NCDs and A&I per episode involved signifi cantly (p-value < .01) higher OOP costs than CDs. Presumably a good part of the A&I expenses would be for whatever ‘emergency care’ that can be accessed at the time. OOP costs per episode of chronic condition (BDT 5,924) was signifi cantly (p-value < .01) higher than for acute conditions (BDT 1,669), and similarly for an episode of inpatient vs. outpatient care (BDT 17,293 and BDT 1,754 respectively).
Insofar as drug expenses (as a share of direct OOP costs) are concerned, the pattern appears most stable (over 59%) for the disease nature (i.e., acute vs. chronic), gender or age categories of the patient for that matter. However, when interpreted by the type of illness along the CD/NCD/A&I orientation, drugs expense ratio rises to 74 per cent for CD, while staying at 56 and 60 per cent, respectively, for NCDs and AI.
Interestingly, total OOP cost per episode of illness for female patients (BDT 2,362) was signifi cantly (p-value < .01) lower than for males (BDT 2,706), which may be seen as another aspect of the gender divide in the rural health scene. The precise reasoning behind the fi nding is however beyond the scope of the present analysis.
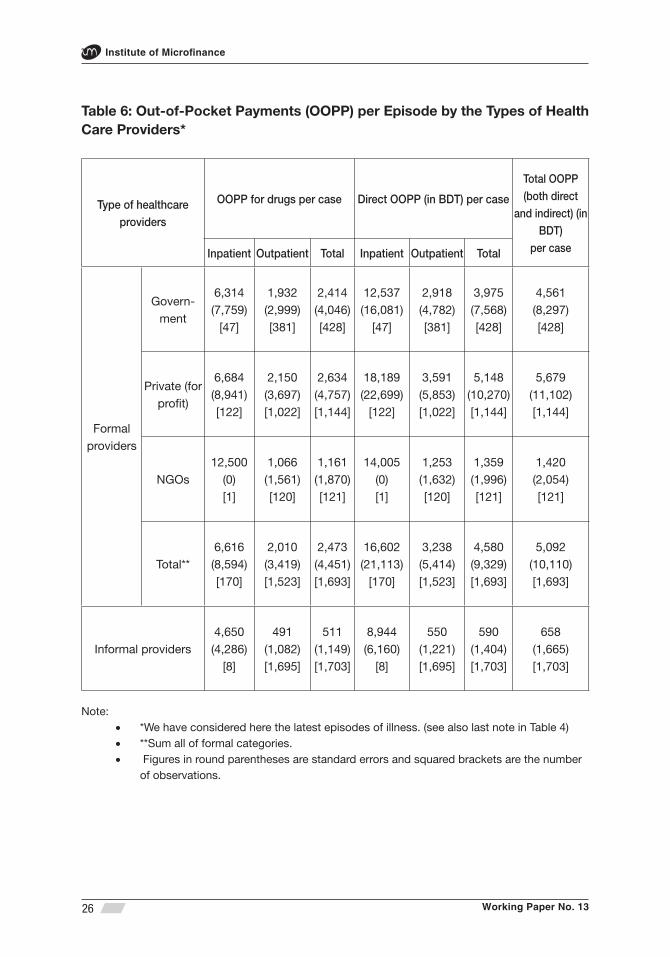
As would be expected, there is a signifi cant (p-value <0.05) difference in direct (or total) OOP payments between informal care and formal care simply because there are only a limited number of procedures (invasive or otherwise) that may be available in an ‘informal’ setting. The latter hypothesis is consistent with the observation that this spending gap exists both for inpatient (though relevant only in a handful of cases) and outpatient care (Table 6).
Insofar, as inpatient care is concerned, government facilities charge about one third less per episode than those in the private domain (p-value < .05), and half of the cost of the former appear to be drug related, while the latter’s share in private facilities is about one third. The above fi gures are consistent with the claim made earlier that private facilities focus more on surgeries than government hospitals; anecdotally, many argue that government doctors often steer surgical patients away to private care where the same professionals serve as consultants.
Working Paper No. 13
Institute of Microfi nance
26
Table 6: Out-of-Pocket Payments (OOPP) per Episode by the Types of Health Care Providers*
Type of healthcare providers
OOPP for drugs per case Direct OOPP (in BDT) per case
Total OOPP (both direct
and indirect) (in BDT)
per caseInpatient Outpatient Total Inpatient Outpatient Total
Formal providers
Govern-ment
6,314(7,759)
[47]
1,932(2,999)[381]
2,414(4,046)[428]
12,537(16,081)
[47]
2,918(4,782)[381]
3,975(7,568)[428]
4,561(8,297)[428]
Private (for profi t)
6,684(8,941)[122]
2,150(3,697)[1,022]
2,634(4,757)[1,144]
18,189(22,699)
[122]
3,591(5,853)[1,022]
5,148(10,270)[1,144]
5,679(11,102)[1,144]
NGOs12,500
(0)[1]
1,066(1,561)[120]
1,161(1,870)[121]
14,005(0)[1]
1,253(1,632)[120]
1,359(1,996)[121]
1,420(2,054)[121]
Total**6,616(8,594)[170]
2,010(3,419)[1,523]
2,473(4,451)[1,693]
16,602(21,113)
[170]
3,238(5,414)[1,523]
4,580(9,329)[1,693]
5,092(10,110)[1,693]
Informal providers4,650(4,286)
[8]
491(1,082)[1,695]
511(1,149)[1,703]
8,944(6,160)
[8]
550(1,221)[1,695]
590(1,404)[1,703]
658(1,665)[1,703]
Note: *We have considered here the latest episodes of illness. (see also last note in Table 4)• **Sum all of formal categories.• Figures in round parentheses are standard errors and squared brackets are the number • of observations.
Working Paper No. 13
Utilisation of Formal Health Care and Out-of-Pocket Payments in Rural Bangladesh
27
Comparing NGO outpatient care with the same in government hospitals, it is seen that government care is signifi cantly (p-value < .05) more expensive, both on account of drugs and overall.17 This may appear surprisingly since government care is meant to be mostly free. However, one explanation behind the fi gures is that treatment for chronic illnesses is signifi cantly (p-value < .05) more expensive than acute illnesses and a signifi cantly (p-value <.05) higher proportion of chronic cases were treated in the government compared to NGO facilities (Table A2).
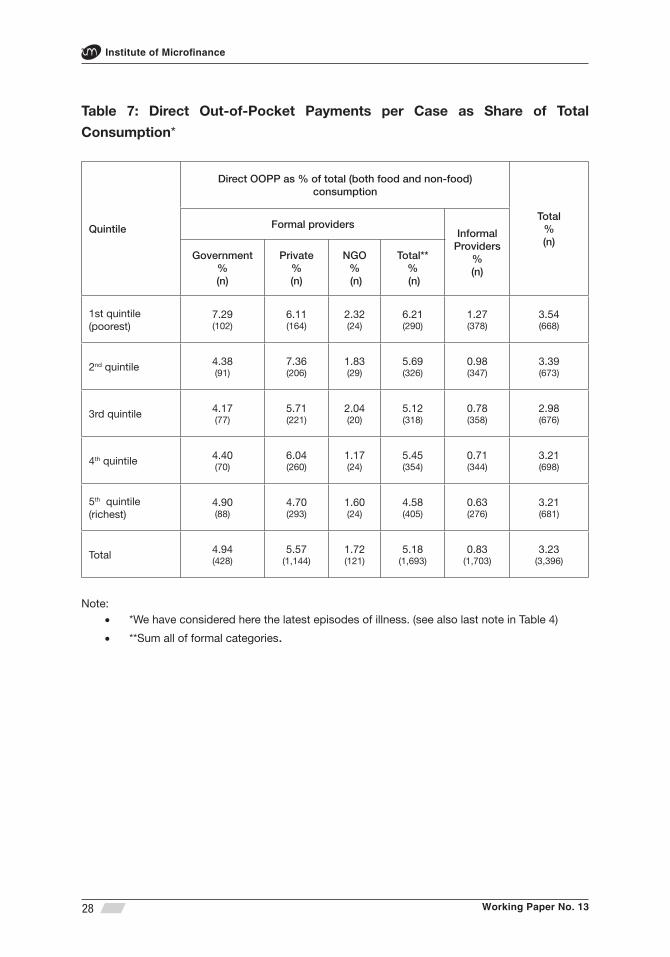
Table 7 provides the distributional aspect of direct OOP payments by representing the latter as a share of total household consumption (food and non-food). While the poorest spend the highest share (3.54%) of total consumption on health care, the average is 3.23%. Thus it may seem that there is not much of a pattern to the aggregate outcome by each expenditure quintile. However, such a conclusion is inappropriate when explored at a more disaggregate level. The poorest spend 6.21% of total consumption on OOP payments for seeking formal care while the average is 5.18%. The relatively benign share at the aggregate level emerges out of the fact that poor mainly (about 57%) seek informal care, which does not cost as much (just 1.27 per cent of consumption).18 The high formal sector cost faced by the poorest group is in part incurred by those visiting government facilities, where the expenditure ratio rises to 7.3 against an average of 4.9 per cent for all income groups. There is therefore an indication that the impact of OOP payment on income distribution is indeed regressive.
17 NGO facilities typically do not offer inpatient care; in this sample there was only one such episode out of a total of 121.
18 Though the OOP expense data relates to 3,396 episodes of illnesses, the ratios comparing different quintiles do no prove to be statistically signifi cant.
Working Paper No. 13
Institute of Microfi nance
28
Table 7: Direct Out-of-Pocket Payments per Case as Share of Total
Consumption*
Quintile
Direct OOPP as % of total (both food and non-food) consumption
Total%(n)
Formal providersInformal
Providers%(n)
Government % (n)
Private % (n)
NGO% (n)
Total**% (n)
1st quintile (poorest)
7.29(102)
6.11(164)
2.32(24)
6.21(290)
1.27(378)
3.54(668)
2nd quintile 4.38(91)
7.36(206)
1.83(29)
5.69(326)
0.98(347)
3.39(673)
3rd quintile 4.17(77)
5.71(221)
2.04(20)
5.12(318)
0.78(358)
2.98(676)
4th quintile 4.40(70)
6.04(260)
1.17(24)
5.45(354)
0.71(344)
3.21(698)
5th quintile (richest)
4.90(88)
4.70(293)
1.60(24)
4.58(405)
0.63(276)
3.21(681)
Total 4.94(428)
5.57(1,144)
1.72(121)
5.18(1,693)
0.83(1,703)
3.23(3,396)
Note: *We have considered here the latest episodes of illness. (see also last note in Table 4)•
**Sum all of formal categories• .

Working Paper No. 13
Utilisation of Formal Health Care and Out-of-Pocket Payments in Rural Bangladesh
29
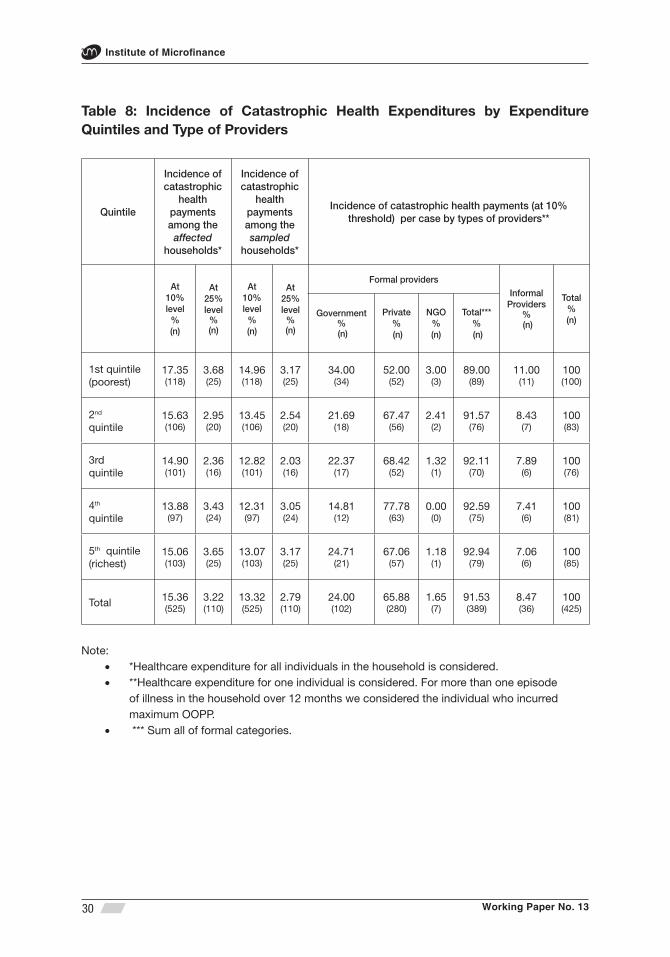
Next we turn to the incidence of illness that leads to catastrophic health expenditures. First we included all health expenditure (involving multiple members as appropriate) within the family in measuring the ratio of household consumption for the year. About 13 (about 3) per cent of the sampled households, namely 525, incurred catastrophic healthcare expenditure at the 10 (25)-per cent threshold level, respectively, over the 12 months preceding the survey (Table 8).19 As may be anticipated from the above discussion, the poorest quintile again emerges as the group having suffered the most from such high level expenses as a share of household consumption (17.4 vs. 15.4% of households for the overall sample), though the difference is not statistically signifi cant.
However, a second defi nition is also used, whereby the share of OOP payments on account of an individual (not the household’s) exceeding 10 per cent of the total household consumption is categorised as incurring catastrophic healthcare expenses. Some households having two or more sick members faced catastrophic level of expenses when the costs were combined for all household members, though no single member alone infl icted such high expenses. Leaving the latter out led to a smaller sample of 460 episodes encountered by 425 instead of 525 households as in the fi rst method.
A fi nal elimination was done to pick up only those events that exerted the maximum expense in cases where a single household had faced multiple occurrences of catastrophic OOP costs, i.e., 425 episodes, only one per household. The smaller sample has the advantage that each event being unique to a household can be related to the type of provider the patient had sought care from. It is seen that most of these episodes (280 out of 425) involved private formal care. The poorest, while experiencing the largest share of catastrophic expenses of any group (100 out of 425), also frequented private facilities more than any other provider (in 52% of cases). In the two highest income groups (i.e., 4th-5th quintiles), however, an even larger majority (120 among 166, i.e., 72%) incurred catastrophic expenses while accessing private care.20
19 The actual number of hhs experiencing catastrophic healthcare expenditure at the 10-per cent level comes to 525, which is 13.3 per cent of the sample fi gure (i.e., 3,941), but when expressed as a share of all hhs who actually sought medical treatment for illness (i.e., 3,419), the ratio rises to 15.4 per cent. Similarly at the 25% threshold, there are 110 hhs, which comes out to 2.8 per cent of the sample and 3.2 per cent of all hhs incurring health expenditure.
20 The incidence of inpatient care is only slightly higher for those accessing private care than for the overall sub-sample of 425 episodes involving catastrophic costs’ (about 41 vs. 37 per cent, respectively).
Working Paper No. 13
Institute of Microfi nance
30
Table 8: Incidence of Catastrophic Health Expenditures by Expenditure Quintiles and Type of Providers
Quintile
Incidence of catastrophic
health payments among the
affected households*
Incidence of catastrophic
health payments among the sampled
households*
Incidence of catastrophic health payments (at 10% threshold) per case by types of providers**
At 10% level
% (n)
At 25% level
% (n)
At 10% level
% (n)
At 25% level
% (n)
Formal providersInformal
Providers% (n)
Total%(n)
Government% (n)
Private% (n)
NGO% (n)
Total***% (n)
1st quintile (poorest)
17.35(118)
3.68(25)
14.96(118)
3.17(25)
34.00(34)
52.00(52)
3.00(3)
89.00(89)
11.00(11)
100(100)
2nd quintile
15.63(106)
2.95(20)
13.45(106)
2.54(20)
21.69(18)
67.47(56)
2.41(2)
91.57(76)
8.43(7)
100(83)
3rd quintile
14.90(101)
2.36(16)
12.82(101)
2.03(16)
22.37(17)
68.42(52)
1.32(1)
92.11(70)
7.89(6)
100(76)
4th quintile
13.88(97)
3.43(24)
12.31(97)
3.05(24)
14.81(12)
77.78(63)
0.00(0)
92.59(75)
7.41(6)
100(81)
5th quintile (richest)
15.06(103)
3.65(25)
13.07(103)
3.17(25)
24.71(21)
67.06(57)
1.18(1)
92.94(79)
7.06(6)
100(85)
Total 15.36(525)
3.22(110)
13.32(525)
2.79(110)
24.00(102)
65.88(280)
1.65(7)
91.53(389)
8.47(36)
100(425)
Note: *Healthcare expenditure for all individuals in the household is considered.• **Healthcare expenditure for one individual is considered. For more than one episode • of illness in the household over 12 months we considered the individual who incurred maximum OOPP. *** Sum all of formal categories.•

Working Paper No. 13
Utilisation of Formal Health Care and Out-of-Pocket Payments in Rural Bangladesh
31
In the multivariate analysis we have concentrated on catastrophic health expenses (at the 10% threshold level) for a single episode of illness in the household, i.e., selecting the episode exerting the maximum expense where more than one member in the household had sought care. We specifi ed a probit regression model (1 = occurrence of catastrophic expenses at 10% threshold, 0 = otherwise). The explanatory variables included in the model are: age, age squared and gender of the ill person, duration of illness, type of care (1= inpatient, 0 = outpatient), chronic or acute type of illness, severity of the illness, education of the household head, per capita annual non-health consumption, type of health care provider chosen (1= formal, 0 = informal), enrolment status in Grameen Kalyan MHI, member of Grameen Bank (GB) without membership in GK, non-GB MFI member without membership in GK, education rate in the village and the nearest service provider (1= if formal provider is the nearest one, 0 = if informal provider is the nearest one). Like model (I) of Table 4 we have used svy (survey) family of commands. The adjusted-F statistics shows that there is no evidence of lack of model fi t.
Estimation results reported in Table 10, model (V), provide support for several hypotheses that are rather plausible. For example, the likelihood of the incidence of catastrophic expenses increases signifi cantly (p-value < 0.01) for inpatient care and with the severity and duration of disease, and of course, when utilising a formal provider. The same likelihood declines signifi cantly (p-value < 0.01) for acute (rather than chronic) condition and with increase in per capita non-health consumption. The age variable interacts with the dependent variable in a concave fashion; rising patient age increases the likelihood of catastrophic expense, while age-squared leads to a decline (p-value < 0.01).
Interestingly, none of gender, education level, GK/GB membership seem to matter. Somewhat intriguingly it is seen that non-GB MFI members (without GK affi liation) are less likely to face catastrophic health expenses, though this is only signifi cant at the 10-per cent level.21 One may have speculated that the above result may arise due to ‘other MFI’ members not being as poor as GB members; however, if anything, the opposite happens to be true.
21 Actually this result holds unaltered even when the independent variable in question is modifi ed to refer to the all ‘non-GB MFI members’, though the latter is not shown in Table 10.
Working Paper No. 13
Institute of Microfi nance
32
3.5 Sources of Financing Out-of-Pocket (OOP) Payments
OOP costs for each episode of illness may be fi nanced by more than one source. In order to incorporate this element, the respondents were asked to name up to two principal means of coping. Thus, there was more than one response for several cases, all of which have been included in the analysis. To be precise, there were 6,352 illnesses in this dataset that required care, but due to multiple sources of expenditure, total coping means came to 7,017 altogether, i.e., in about one in nine cases, the care seekers resorted to a second source. However, 314 inpatient episodes required 441 separate means of coping, i.e., a much higher ratio of two in fi ve being burdened by a second source. Finally, in the case of catastrophic events, a total of 460 episodes involved 660 means of fi nance, which also implies a similar, if slightly harsher, burden on the affected households as that for inpatient care.
We have primarily analysed the above cited coping data by grouping the responses into four broad categories: income and saving, borrowing, asset depletion and other (donation, family assistance, etc.). The fi rst may be defi ned as ‘less burdensome’ as the family diverts regular expenditure into health or using up accumulated liquid saving, while other categories imply direct or indirect claims on future resources, and together these are categorised as the ‘more burdensome’ of the coping mechanisms.
Table 9A shows the frequency distribution across the quintiles for three categories of care separately, i.e., illnesses in general, inpatient and those leading to catastrophic expense. Results show that for the fi rst category, i.e., all illnesses, 82 per cent of the responses relate to ‘regular income and accumulated saving’ as means of fi nance. However, this ratio varies substantially across the quintiles; the poorest can use this 75.4% of times, while the fi gure rises to 88.7 per cent in the richest group. This difference between the poorest and richest quintiles happens to be highly signifi cant (p-value < .01). A similar difference, i.e., statistically signifi cant at the 1% level, also exists insofar as borrowing is required to meet OOP costs in general (overall 12.6 per cent of responses). Here the ratios for the two quintiles are 17.3 and 7.4, respectively. The above two categories exhaust 95 per cent of all responses and the remaining sources are relatively too few to draw any reliable inferences from.
There is thus a defi nite pattern to the source of health care fi nancing in general. Although in a relatively low number of cases fi nancing is met from borrowing or other burdensome sources, there is a defi nite regressive tone to the fi gures. The poorest quintile uses such sources in 24.6 per cent of cases, while the comparable
Working Paper No. 13
Utilisation of Formal Health Care and Out-of-Pocket Payments in Rural Bangladesh
33
fi gure for the richest is only 11.3, a difference which is also signifi cant statistically (p-value < .01).
In meeting inpatient care and catastrophic health expenses, a relatively higher reliance is placed on ‘more burdensome’ sources across all quintiles since ‘income and saving’ is inadequate for all income groups. Households needed to borrow in 27.7 and 33.5 per cent of cases for these two categories of illnesses, respectively. Asset depletion, arguably the most burdensome of means, appears to be invoked in about 5.2 and 7.7 per cent of the cases for fi nancing inpatient care and catastrophic illness, respectively. But in these latter cases (i.e., borrowing and asset depletion), the difference between the rich and the poor is not so robust. Reliance on ‘income and saving’ for inpatient care is however strongly in favour of the rich, meeting 67.6 per cent of needs against 44.8 for the poorest. The comparable fi gures for ‘catastrophic costs’ are 58.2 and 40.5, respectively. Table 9B provides further details of the data construction as represented in Table 9A.
We have also separately analysed the individual contribution of each specifi c means of fi nance (namely, income, accumulated saving, borrowing or asset depletion) for those who reported only a single source as well as the contribution of ‘combination of strategies’ for those who reported two sources (Table A3). Figures show that although current ‘income’ alone plays a dominant role for coping with general illnesses, its role diminishes greatly when dealing with inpatient care and those resulting in catastrophic costs. Moreover, a single source is typically not suffi cient to cope with any type of illnesses. Those with access to a single source of fi nance managed to deal with 57.4 per cent of all illnesses; the comparable fi gures for inpatient and catastrophic events were 31.8 and 35.9 per cent, respectively. Thus households use various combinations of strategies to primarily cope with inpatient care and those leading to catastrophic costs.

Working Paper No. 13
Institute of Microfi nance
34
Tab
le 9
A: S
our
ces
of
Fina
ncin
g o
f H
ealt
hcar
e b
y E
xpen
dit
ure
Qui
ntile
s
Qui
ntile
s
Illne
sses
in g
ener
al (a
ll ep
isod
es o
f ill
ness
es in
the
hous
ehol
d)In
patie
nt c
are
Cat
astr
ophi
c ev
ents
: Exp
ense
s at
10%
th
resh
old
leve
l
Inco
me
and
savi
ngB
orro
win
gA
sset
de
plet
ion
Oth
er
sour
ces
Inco
me
and
savi
ngB
orro
win
gA
sset
de
plet
ion
Oth
er
sour
ces
Inco
me
and
savi
ngB
orro
win
gAs
set
depl
etio
nO
ther
so
urce
s
1st q
uint
ile(p
oore
st )
75.3
9(1
,063
)17
.30
(244
)2.
27(3
2)5.
04(7
1)44
.83
(26)
27.5
9(1
6)1.
72 (1)
25.8
6(1
5)40
.54
(60)
37.8
4(5
6)8.
11(1
2)13
.51
(20)
2nd q
uint
ile79
.31
(1,1
00)
14.7
1(2
04)
2.16
(30)
3.82
(53)
46.3
8(3
2)34
.78
(24)
7.25 (5)
11.5
9(8
)41
.60
(52)
36.0
0(4
5)9.
60(1
2)12
.80
(16)
Mid
dle
qui
ntile
82.7
7(1
,196
)13
.70
(198
)1.
31(1
9)2.
21(3
2)50
.00
(36)
34.7
2(2
5)5.
56 (4)
9.72 (7)
47.5
0(5
7)38
.33
(46)
8.33
(10)
5.83 (7)
4th q
uint
ile86
.28
(1,2
33)
9.80
(140
)1.
47(2
1)2.
45(3
5)57
.28
(59)
26.2
1(2
7)5.
83 (6)
10.6
8(1
1)58
.65
(78)
28.5
7(3
8)5.
26 (7)
7.52
(10)
5th q
uint
ile(R
iche
st)
88.7
1(1
,194
)7.
43(1
00)
1.41
(19)
2.45
(33)
67.6
3(9
4)21
.58
(30)
5.04 (7)
5.76 (8)
58.2
1(7
8)26
.87
(36)
7.46
(10)
7.46
(10)
Tota
l # o
f so
urce
s82
.46
(5,7
86)
12.6
3(8
86)
1.72
(121
)3.
19(2
24)
56.0
1(2
47)
27.6
6(1
22)
5.22
(23)
11.1
1(4
9)49
.24
(325
)33
.48
(221
)7.
73(5
1)9.
55(6
3)
No
tes:
Col
umn
fi gur
es in
eac
h ce
ll ar
e co
nstr
ucte
d s
uch
that
the
num
erat
or is
the
num
ber
of
resp
onse
s fo
r ea
ch c
ateg
ory
and
den
omin
ator
is t
he
• to
tal n
umb
er o
f res
pon
ses
for
all e
pis
odes
com
bin
ed r
elev
ant
to e
ach
qui
ntile
.
Fig
ures
in p
aren
thes
es a
re t
he n
umb
er o
f fi n
anci
ng s
ourc
es r
elev
ant
to t
he c
olum
n ce
ll.
•
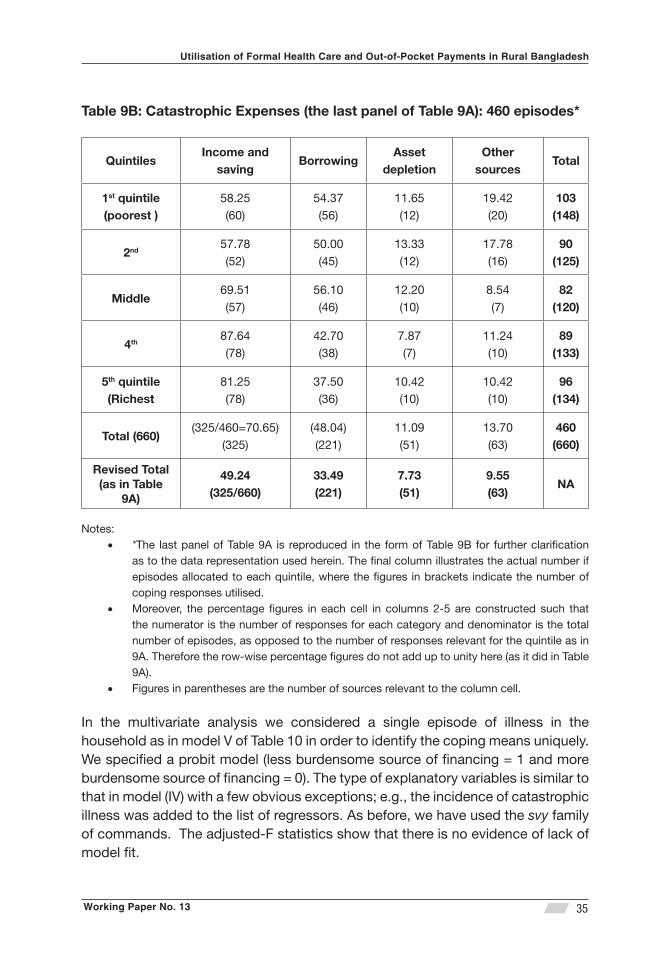
Working Paper No. 13
Utilisation of Formal Health Care and Out-of-Pocket Payments in Rural Bangladesh
35
Table 9B: Catastrophic Expenses (the last panel of Table 9A): 460 episodes*
QuintilesIncome and
savingBorrowing
Asset depletion
Other sources
Total
1st quintile (poorest )
58.25(60)
54.37(56)
11.65(12)
19.42(20)
103(148)
2nd 57.78(52)
50.00(45)
13.33(12)
17.78(16)
90(125)
Middle 69.51(57)
56.10(46)
12.20(10)
8.54(7)
82(120)
4th 87.64(78)
42.70(38)
7.87(7)
11.24(10)
89(133)
5th quintile (Richest
81.25(78)
37.50(36)
10.42(10)
10.42(10)
96(134)
Total (660)(325/460=70.65)
(325)(48.04)(221)
11.09(51)
13.70(63)
460(660)
Revised Total (as in Table
9A)
49.24(325/660)
33.49(221)
7.73 (51)
9.55(63)
NA
Notes:*• The last panel of Table 9A is reproduced in the form of Table 9B for further clarifi cation as to the data representation used herein. The fi nal column illustrates the actual number if episodes allocated to each quintile, where the fi gures in brackets indicate the number of coping responses utilised. Moreover, the percentage fi gures in each cell in columns 2-5 are constructed such that • the numerator is the number of responses for each category and denominator is the total number of episodes, as opposed to the number of responses relevant for the quintile as in 9A. Therefore the row-wise percentage fi gures do not add up to unity here (as it did in Table 9A). Figures in parentheses are the number of sources relevant to the column cell. •
In the multivariate analysis we considered a single episode of illness in the household as in model V of Table 10 in order to identify the coping means uniquely. We specifi ed a probit model (less burdensome source of fi nancing = 1 and more burdensome source of fi nancing = 0). The type of explanatory variables is similar to that in model (IV) with a few obvious exceptions; e.g., the incidence of catastrophic illness was added to the list of regressors. As before, we have used the svy family of commands. The adjusted-F statistics show that there is no evidence of lack of model fi t.
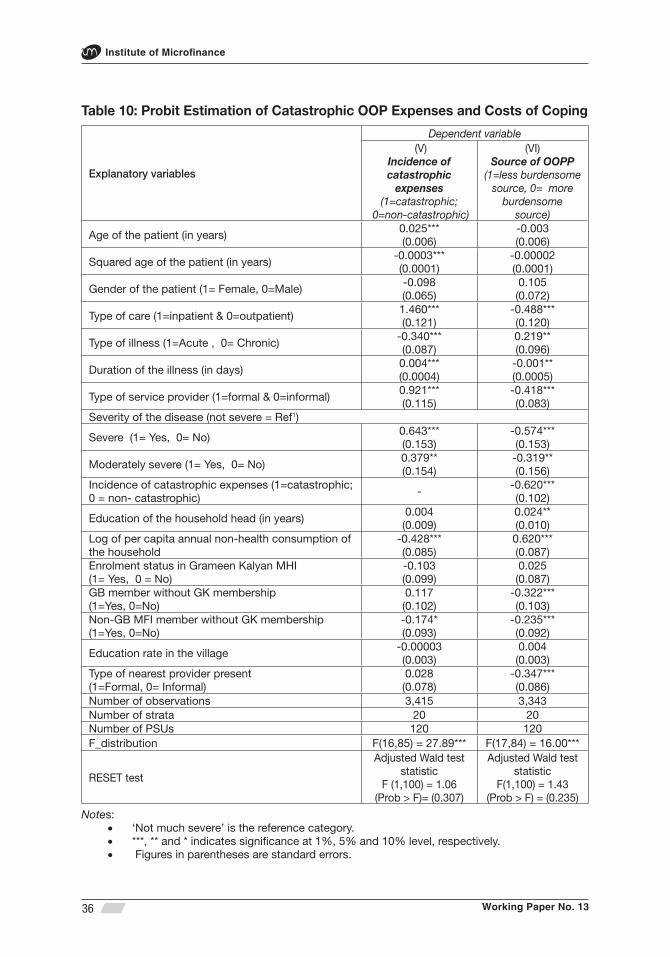
Working Paper No. 13
Institute of Microfi nance
36
Table 10: Probit Estimation of Catastrophic OOP Expenses and Costs of Coping
Explanatory variables
Dependent variable (V)
Incidence of catastrophic
expenses (1=catastrophic;
0=non-catastrophic)
(VI)Source of OOPP
(1=less burdensome source, 0= more
burdensome source)
Age of the patient (in years)0.025***(0.006)
-0.003(0.006)
Squared age of the patient (in years)-0.0003***(0.0001)
-0.00002(0.0001)
Gender of the patient (1= Female, 0=Male)-0.098(0.065)
0.105(0.072)
Type of care (1=inpatient & 0=outpatient)1.460***(0.121)
-0.488***(0.120)
Type of illness (1=Acute , 0= Chronic)-0.340***(0.087)
0.219**(0.096)
Duration of the illness (in days)0.004***(0.0004)
-0.001**(0.0005)
Type of service provider (1=formal & 0=informal)0.921***(0.115)
-0.418***(0.083)
Severity of the disease (not severe = Ref1)
Severe (1= Yes, 0= No)0.643***(0.153)
-0.574***(0.153)
Moderately severe (1= Yes, 0= No)0.379**(0.154)
-0.319**(0.156)
Incidence of catastrophic expenses (1=catastrophic; 0 = non- catastrophic)
--0.620***(0.102)
Education of the household head (in years) 0.004(0.009)
0.024**(0.010)
Log of per capita annual non-health consumption of the household
-0.428***(0.085)
0.620***(0.087)
Enrolment status in Grameen Kalyan MHI(1= Yes, 0 = No)
-0.103(0.099)
0.025(0.087)
GB member without GK membership(1=Yes, 0=No)
0.117(0.102)
-0.322***(0.103)
Non-GB MFI member without GK membership (1=Yes, 0=No)
-0.174*(0.093)
-0.235***(0.092)
Education rate in the village -0.00003(0.003)
0.004(0.003)
Type of nearest provider present(1=Formal, 0= Informal)
0.028(0.078)
-0.347***(0.086)
Number of observations 3,415 3,343Number of strata 20 20Number of PSUs 120 120F_distribution F(16,85) = 27.89*** F(17,84) = 16.00***
RESET test
Adjusted Wald test statistic
F (1,100) = 1.06(Prob > F)= (0.307)
Adjusted Wald test statistic
F(1,100) = 1.43(Prob > F) = (0.235)
Notes: ‘Not much severe’ is the reference category.• ***, ** and * indicates signifi cance at 1%, 5% and 10% level, respectively. • Figures in parentheses are standard errors.•
Working Paper No. 13
Utilisation of Formal Health Care and Out-of-Pocket Payments in Rural Bangladesh
37
Model VI in Table 10 shows that the likelihood of fi nancing with less burdensome source (income and accumulated saving) increases signifi cantly with increases in per non-health consumption (p-value < .01), for acute (rather than chronic) care and education of the household head (p-value < .05). The same likelihood decreases signifi cantly with each of the incidence of formal care, inpatient care, those leading to catastrophic costs and with the severity of the condition, all at the one-per cent level. An identical conclusion follows when the nearest provider happens to be a formal one. Duration of illness also raises the probability of burdensome source of fi nance, but this is so with p-value < .05.
The GB/GK/MFI membership variables provide intriguing results, much more so here than in the discussion of the incidence of illnesses infl icting catastrophic expense. GK membership by itself again appears not to matter. Non-GB members without GK membership, while earlier seen less likely to face catastrophic expense, are now seen prone to utilise more burdensome means of fi nance much like GB members (both with p-value < .01). Access to microcredit appears not to directly affect the recipients’ capacity to meet OOP heath costs without incurring additional debt or resorting to other more burdensome means of fi nance such as asset depletion. This is a hypothesis deserving of serious examination in its own right, though unfortunately falling beyond the scope of the current paper.

Working Paper No. 13
Institute of Microfi nance
38
4. Interpretation and Discussion
(a) Formal vs. informal care: This study examines the level and determinants of the utilisation of both formal health care and OOP payments based on about 4,000 observations. The broader focus of the investigation would thus be to gauge how far Bangladesh has to travel to achieve universal health coverage (UHC). The weakest link in the path to UHC would appear to be the lack of access to formal care providers, both in physical and monetary terms. Consequently a majority of patients fi rst seek informal providers (Figure 2).22 Similar evidence is also found in the literature (Hamid et al., 2011). Proximity and low cost of treatment were reported as major reasons for choosing informal providers.
Survey records show that about 33 per cent of individuals self-reported some kind of morbidity during the 12 months preceding the survey. The major disease symptoms are: general cough and fever, stomach pain, diarrhoea, gastrointestinal disorders and typhoid. The incidence of NCDs is about equal to CDs. An overwhelming majority (98%) of those falling sick sought health care, while as cited already, a majority (about 60%) went for informal care. Of all care seekers, 95 per cent utilised outpatient care. Inability to pay was a major reason for the few who abstained from seeking any type of care.
The utilisation of formal care is signifi cantly lower among the poorest than the richest (i.e., 33 vs. 49 per cent, respectively). The appeal of informal care, almost exclusively for outpatient services, is of course the total costs, which is about a fourth of just the drug costs for such care in the formal sector.
Despite substantial efforts by both government and NGO providers, private care is still the dominant mode treating 65 per cent of all episodes that make up the formal care market. The gender element in the choice of formal vs. informal care is rather muted for all expenditure quintiles, except however for children below 15. The above contrasts with an earlier fi nding by Ahmed et al (2000) that women had signifi cantly low level of health care utilisation than men. The so-called ‘son preference’ however appears to peek through the care seeking pattern so that female children, though not adult females, are signifi cantly less likely to receive formal care when sick (p < 0.01, Tables 3 and 4).
In terms of the broader determinants of formal care seeking, education of the household head, chronic nature of illness, severity, duration, household purchasing
22 The rate of switching to formal care is signifi cantly (p-value <0.01) higher at the second contact among those who at the fi rst contact sought care from informal providers.

Working Paper No. 13
Utilisation of Formal Health Care and Out-of-Pocket Payments in Rural Bangladesh
39
power, and of course, the easy access to the provider fi gure prominently in the Probit estimation model (Table 4). There does appear some negligence of the elderly (i.e., those above 64) however in receiving formal care. Among the factors just identifi ed above, several do not carry over to the elderly segment of the population when they are estimated separately (‘equation IV’); in particular, severity of the condition, duration, easy access to the provider all fail to be signifi cant for the hapless elderly. As most households are resource constrained, total number of episodes of illness in the household exerts a strong negative effect (p < 0.01) on the likelihood of utilising formal care for all age groups (Table 4).
The multivariate results also show that enrolment in GK micro health insurance has a positive association (p < 0.05) with the likelihood of the utilising formal care, though this effect wanes to insignifi cance when applied to children and the elderly. The possible age bias cited above associated with the participation in GK ‘health insurance’ scheme may be explained as follows. One of the potential reasons is that Grameen Kalyan’s health centres mainly provide primary care while the elderly usually suffers from chronic and other age-specifi c disorders which typically require secondary and/or tertiary type of care.
(b) Pattern of out-of-pocket (OOP) costs: Total 12-month household level OOP costs is about BDT 4.7K per affected household, which is about 6% of the total household consumption, or put another way, about 15 times higher than the average expenditure on education. While richer households appear to incur higher OOP expenditure in absolute terms, the consumption ratio is however stable across income quintiles. Vaishnavi & Dash (2009) found a similar result in the urban areas of Tamil Nadu in India. However, van Doorslaer et al. (2007) found that 28 per cent of the households in Bangladesh spent more than 5 per cent of total household budget (and 4.5 per cent spent more than 25 per cent) on total OOP health expense.
The major part (about 60%) of direct OOP payment is directed to drugs while similar evidence was found in Ghana and Benin (WHO, 2006) and in India (Vaishnavi & Dash, 2009). The drug share of OOP costs however increases with decreases in household income, reaching 69% in the poorest from a low of 52% in the richest quintile.
Among formal providers, the average direct OOP cost per visit is about 30% higher for private providers compared to public; however as a share of total consumption, private care uses up only a fraction (1/8th) more than public. The discrepancy between the two sets of fi gures is presumably explained by self-selection by the richer segment in the choice of the provider.
Working Paper No. 13
Institute of Microfi nance
40
(c) Catastrophic OOP costs: The incidence of catastrophic health payments is seen to be higher among the poorer quintiles, but the differences do not appear to be statistically signifi cant. Predictably, elements such as utilisation of formal care, inpatient treatment, severity and duration of illness all aggravate the risk of incurring high health costs.
Restricting one episode per household (i.e., the more expensive one in case of multiple episodes) leads to 425 cases of catastrophic health costs at the household level. Here a large majority (66%) happens to have used private care, and more so in the upper quintiles (Table 8). Catastrophic health payments were also seen to be higher (by 61%) for the households consuming private than public health care in India (Vaishnavi & Dash, 2009).
Somewhat surprisingly, the role of inpatient care in leading to catastrophic expense is not large; only about 37% of these cases were hospitalisation while the rest were outpatient care, If we focus on private care alone, the hospitalisation ratio rises to only 41%. Hence catastrophic costs occur for outpatient care in a majority of cases. The multivariate results show that age, inpatient care, duration and severity of disease, and visiting formal providers have strong positive association with the likelihood of incidence of catastrophic payments while per capita non-health consumption, age-squared of the patient and acute illness have strong negative association.
These results are not directly comparable to the evidence provided by other studies due to methodological differences in defi ning catastrophic payments. However, in India, Flores et al (2008) found that about 34 per cent faced catastrophic health payments at the 10-per cent threshold in rural areas. At the same threshold level, Ranson (2002) found that 15 per cent households faced catastrophic payments even after operating a community based health insurance scheme in Gujarat.
(d) Burden of fi nancing OOP costs: For illnesses in general, the less burdensome means of fi nance, namely using up current income and accumulated saving is mostly adequate to deal with even for the poorest group (for up to 75% of cases). However, this ratio drops to 45 and 41 per cent, respectively, for inpatient services and those leading to catastrophic costs. Thus in the latter events, certainly for the poorest quintile, more burdensome sources of fi nance, namely, further borrowing and asset depletion is called upon for the most part.
Utilisation of both inpatient and formal care, duration of illness, their severity and the occurrence of catastrophic costs each increases the probability of using burdensome means of fi nance. Curiously, it is seen that MFI membership (either GB

Working Paper No. 13
Utilisation of Formal Health Care and Out-of-Pocket Payments in Rural Bangladesh
41
or non-GB) is highly signifi cantly associated with the recourse to more burdensome means, an issue deserving of further analysis.
Aspects of the above fi ndings are comparable to the evidence available in Africa and India. In one African study, 30 per cent of households fi nanced OOP costs for inpatient care from costly sources as interpreted here (Leive and Xu, 2008). Vaishnavi and Dash (2009) found that the similar share is 34 per cent for households for inpatient care in urban Tamil Nadu while Flores et al. (2008) found fi gures of 38 per cent for rural areas and 24 per cent for urban areas from Indian National Household Survey.
(e) Insurance as a tool to contain high OOP costs: Poor utilisation of formal health care especially by the low income people, high OOP payments (especially for private formal and all inpatient care), and the large reliance on expensive sources of fi nancing OOP costs by many households are among the bottlenecks that are likely to impede the progress toward universal health coverage. Therefore there is an urgent need to develop feasible policy innovations that are easily implementable. The Government of Bangladesh (GoB) has invested substantially since independence to increase the utilisation of formal health care with special attention to the rural population.23 There are also signifi cant efforts by not-for-profi t organisations (NGOs) for expanding the modern health services to the rural areas.
In spite of these measures, as per National Health Accounts for 2008 and other donor sources, Bangladesh spends about $16 per capita on health, or about 3.4 % of GDP (i.e., total health expenditure, THE), of which the public share is a mere 31% (i.e., about $5 per capita or about 1% of GDP). The prospect of a signifi cant enhancement of public spending via the revenue system is minimal in the intermediate term that is, say over the next 5-10 years.
Thus, in order to achieve universal health coverage and at the same time reverse the hardships caused by health shocks, Bangladesh needs to introduce alternative ways to raise funds for the provision of healthcare. Pre-payment and better risk-pooling are precisely the type of mechanisms that are ex-ante ideal to deal with catastrophic health payments thus providing fi nancial protection to the poor.
23 There is a three-tier mechanism for providing health care in rural areas: (i) domiciliary services by a Health Assistant and Family Welfare Assistant at the household level; (ii) Health and Family Welfare Centres at the union level, and (iii) Upazila Health Complexes (UZHCs) at the sub-district level. The latter provides both outpatient and inpatient services including maternal and child health and family planning; these are the primary facilities for implementing the Essential Services Package (ESP), which was designed to attain ‘Health for All’.
Working Paper No. 13
Institute of Microfi nance
42
These modalities have been identifi ed internationally as key devices for ensuring equity in fi nancing health care (e.g., WHO, 2005 and 2010), but these have not been tried out in Bangladesh to date.24 There is empirical evidence from developing countries that health insurance modalities reduce catastrophic health payments (Ranson, 2002; Yardima, 2010).
The high share of drug in total OOP expenditure also requires some policy attention related to drug price control. Compared to the neighbouring countries, drug prices are quite high in Bangladesh (Islam, 2008). The Directorate of Drug Administration (DDA) of Bangladesh has fi xed the maximum retail price of the essential drugs, but for the remainder it in fact merely endorses the proposed price of the manufacturer. Although Bangladesh National Drug Policy (2005) aims to ensure rational pricing of essential drugs, it is evident that the regulatory authorities have little control over the drug prices (Chowdhury and Kabir, 2009). There is also over use of drugs in Bangladesh. Evidence shows that at least half of the drugs are not prescribed, dispensed or sold appropriately (Guyon et al., 1994; Chowdhury et al., 2006). Self-medication and purchase of all types of drugs without prescription from thousands of quasi-legal and unlicensed drug stores are the major reasons for the over use of drugs (Islam et al., 1996; Islam, 2006; and Smith, 2004). Consumer awareness would also play a major role here so that the uninformed may learn the value of professional medical advice than rely on the half-literate drugstore sales staff.
24 Most NGO interventions in the name of micro health insurance are mere subsidised care, typically outpatient, of indifferent quality. The pre-payment part is mostly a minor (10-25%) discount on a limited range of services made available by the provider-insurer with the consequence that bulk of the risk is eventually borne by the ‘insured’ via OOP payments (Ahsan et al., 2012).

Working Paper No. 13
Utilisation of Formal Health Care and Out-of-Pocket Payments in Rural Bangladesh
43
5. Conclusions
The study shows that the self-reported incidence of illnesses is relatively high (33%) and NCDs are prominent in terms of both incidence and total burden of OOP payments. Although overall utilisation of health care is very high (98% of the ill seeking ‘care’), utilisation of formal care is very low (40%). Majority (65%) of those seeking formal care choose private care. The poor and the children, especially females, are more deprived in the utilisation of formal care. While the lure of the informal route (mostly drug oriented) is the lower per-episode costs, it is uncertain what the patients gain in return for such expenditure, especially if they need to seek such services frequently, often for the same complaint. Hence the case for and scope of a major public health campaign in this regard can hardly be overemphasised.
Overall total OOP payment is rather high (BDT 4,686 per household over the 12-month reference period), which is about 6% of annual household consumption (food and non-food). OOP costs for formal care (especially private care) is even higher. Drugs account for the majority component of OOP payments, and more so for the poorer segments. Among formal providers, the average direct OOP cost per visit is about 30% higher for private providers compared to public.
The incidence of catastrophic health payments (due mostly to the utilisation of formal care) is also higher for the poor. Somewhat surprisingly, however, it is seen that while more such visits occur in private facilities, in terms of sheer frequency, catastrophic costs are incurred more in outpatient services than for hospitalisation. Of course, the per-visit inpatient costs are far greater than in outpatient care for each category of provider.
A large proportion of the households need to borrow and/or sell assets for meeting the costs of inpatient care. Coping with catastrophic health payments requires even greater reliance on these sources. The burden of mitigating such payments on the part of the poor is still greater so that in a majority of such cases, they need to resort to costly means of fi nance which compromise their capacity to earn a living in the next period (i.e., due to lack of capital).
Given these fi ndings we may conclude that Bangladesh has to go the distance in achieving the universal health coverage or some semblance of it. Thus, the country needs to start afresh with innovative means of raising funds for the provision of health care, especially in rural areas. Micro health insurance is one such innovation that relies on pooling the risk as well as available resources for the provision of
Working Paper No. 13
Institute of Microfi nance
44
affordable care. There is evidence that health insurance reduces the catastrophic health payments. The paper also suggests adoption of suitable regulatory measures for rationalising the retail price structure of all essential as well as prescription drugs, implementing restrictions on selling over-the-counter drugs, and engage in public health campaign to inform the public of the dangers of following drugstore sales staff advice and motivate them instead to seek professional medical advice whenever feasible.
Working Paper No. 13
Utilisation of Formal Health Care and Out-of-Pocket Payments in Rural Bangladesh
45
References
Ahmed, S. M. (2001). Differing health and health-seeking behaviour: ethnic minorities of the Chittagong Hill Tracts, Bangladesh. Asia Pacifi c Journal of Public Health, 13(2), 100-8.
Ahmed, S. M., Adams, A. M., Chowdhury, M. & Bhuiya, A. (2000). Gender, socioeconomic development and health-seeking behaviour in Bangladesh. Social Science & Medicine, 51(3),361-371.
Ahmed, S. M., Adams, A. M., Chowdhury, M. & Bhuiya, A. (2003). Changing health-seeking behaviour in Matlab, Bangladesh: do development interventions matter? Health Policy and Planning, 18(3), 306–315.
Ahmed, S. M., Petzold, M., Kabir, J. N. & Tomson, G. (2006). Targeted intervention for the ultra poor in rural Bangladesh: Does it make any difference in their health-seeking behaviour? Social Science & Medicine, 63(11), 2899-2911.
Ahmed, S. M., Tomson, G., Petzold, M. & Kabir, Z. N. (2005). Socioeconomic status overrides age and gender in determining health-seeking behaviour in Rural Bangladesh. Bulletin of the World Health Organisation, 83(2), 109-117.
Ahsan S. M., M. Mahmud, S. A. Hamid & S. Barua (2012), “Financing Health Care: An Evaluation of the NGO-led Micro Health Insurance”, Chapter 5 in Bangladesh Health Watch, James P. Grant School of Public Health, 77-99.
Alam, N., Ginneken, J. K. van & Timaeus, I. (2009). Determinants of Perceived Morbidity and Use of Health Services by Children Less Than 15 Years Old in Rural Bangladesh. Maternal and Child Health Journal, 13(1), 119–129.
Amin, R., Pierre, M. S., Ahmed, A. & Haq, R. (2001). Integration of an Essential Services Package (ESP) in Child and Reproductive Health and Family Planning with a Micro-credit Programme for Poor Women: Experience from a Pilot Project in Rural Bangladesh. World Development, 29(9), 1611-1621.
Amin, R., Becker, S. & Shah, N. M. (2010). Socioeconomic factors differentiating maternal and child health-seeking behaviour in rural Bangladesh: A cross-sectional analysis. International Journal for Equity in Health, 9(9).
Working Paper No. 13
Institute of Microfi nance
46
BBS (Bangladesh Bureau of Statistics) (2007). Report of the Household Income & Expenditure Survey 2005. Dhaka: Bangladesh Bureau of Statistics, Ministry of Planning, Government of Bangladesh.
Belli, P., Gotsadze, G. & Shahriari, H. (2004). Out-of-pocket and informal payments in health sector: evidence from Georgia. Health Policy, 70(1), 109-123.
Biswas, P., Kabir, Z. N., Nilsson, J. & Zaman, S.(2006) Dynamics of Health Care Seeking Behaviour of Elderly People in Rural Bangladesh. International Journal of Ageing and Later Life, 1(1), 69-89.
Chi, C., Lee, J., Tsai, S. & Chen, W. (2008). Out-of-pocket payment for medical care under Taiwan’s National Health Insurance system. Health Economics, 17(8), 961–975.
Chowdhury, F. R., Rahman, M. M., Huq, M. F. & Begum, S. (2006). Rationality of drug uses: its Bangladeshi perspectives. Mymensing Medical Journal, 15(2), 215-219.
Chowdhury, N., Kabir, E. R. (2009). Per pill price difference across therapeutic categories: A study of the essential drug brands marketed by multinational and local pharmaceutical companies in Bangladesh. African Journal of Marketing Management, 1(9). 220-226.
Dalal, K., & Rahman, A. (2009). Out-of-pocket payments for unintentional injuries: a study in rural Bangladesh. International Journal of Injury Control and Safety Promotion, 16(1), 41-7.
van Doorslaer, E., O’Donnell, O., Rannan-Eliya, R.P., Somanathan, A., Adhikari, S. R., Garg, C. C., Harbianto, D., Herrin, A.N., Huq, M.N., Ibragimova, S., Karan, A., Ng, C.W., Pande, B.R., Racelis, R., Tao, S., Tin, K., Tisayaticom, K., Trisnantoro, L., Vasavid, C., Zhao, Y. (2006). Effect of payments for health care on poverty estimates in 11 countries in Asia: An analysis of household survey data. Lancet, 368(9544), 1357–64.
van Doorslaer, E. , O’Donnell, O., Rannan-Eliya, R. P. & Somanathan et al. (2007). Catastrophic payments for health care in Asia. Health Economics, 16(11), 1159-1184.
Working Paper No. 13
Utilisation of Formal Health Care and Out-of-Pocket Payments in Rural Bangladesh
47
Ekman, B. (2007). Catastrophic health payments and health insurance: Some counterintuitive evidence from one low-income country. Health Policy, 83(2-3), 304–313.
Flores, G., Krishnakumar, J., O’donnell, O. & Doorslaer, E. V. (2008). Coping with health-care costs: implications for the measurement of catastrophic expenditures and poverty. Health Economics, 17(12), 1393–1412.
Falkingham, J. (2004). Poverty, out-of-pocket payments and access to health care: evidence from Tajikistan. Social Science & Medicine, 58(2), 247-258.
Fosu, G.B. (1994). Childhood morbidity and health services utilisation: Cross- national comparisons of user-related factors from DHS data. Social Science & Medicine, 38(9), 1209-1220.
Garg, C. C. & Karan, A. K. (2005). Health and Millennium Development Goal 1 : Reducing out-of –pocket expenditures to reduce income poverty- Evidence from India. EQUITAP project: Working paper No. 15.
Garg, C. C. & Karan, A. K. (2009). Reducing out-of-pocket expenditures to reduce poverty: a disaggregated analysis at rural-urban and state level in India. Health Policy and Planning, 24(2), 116–128.
Guyon, A. B., Barman, A., Ahmed, J. U., Ahmed, A. U. & Alam, M. S. (1994). A baseline survey on use of drugs at the primary health care level in Bangladesh. Bulletin of the World Health Organisation, 72(2), 265-71.
Hamid, S. A., Robers, J., Mosley, P. (2011). Evaluating the Health Effects of Micro Health Insurance Placement: Evidence from Bangladesh. World Development, 39(3), 339-411.
Hotchkiss, D.R., Hutchinson, P. L., Malaj, A. & Berruti, A. A. (2005). Out-of-pocket payments and utilisation of health care services in Albania: Evidence from three districts. Health Policy,75(1), 18–39.
Islam, M.S. (2006). A review on the policy and practices of therapeutic drug uses in Bangladesh. Calicut Medical Journal, 4(4), e2.
Islam, M. S. (2008). Therapeutic drug uses in Bangladesh: policy versus practice. Indian Journal of Medical Ethics, 5(1), 24-25.
Working Paper No. 13
Institute of Microfi nance
48
Islam, N., Goldman, J. D., Kunin, C. M. (1996). Ask the expert. APUA (Alliance fpr the Prudent Use of Antibiotics) Newsletter, 14(2), 5.
Khan, M. N. U., Quayyum, Z., Nasreen, H. E., Ensor, T., Salahuddin, S. (2009). Household Costs of Obtaining Maternal and Newborn Care in Rural Bangladesh: Baseline Survey, Research Monograph Series, BRAC RED. No. 43.
Leive, A. & Xu, K. (2008). Coping with out-of-pocket health payments: empirical evidence from 15 African countries. Bulletin of the World Health Organisation, 86(11), 849–856.
Lee, E. S. & Forthofer, R. N. (2006). Analysing Complex Survey Data, London: Sage.
Moran, A. C., Winch, P. J., Sultana, N., Kalim, N., Afzal, K. M., Koblinsky, M., Arifeen, S. E., Seraji, M. H. R., Mannan , I., Darmstadt, G. L., Baqui, A. H & The Bangladesh PROJAHNMO Maternal Morbidity Study Group (2007). Patterns of maternal care seeking behaviours in rural Bangladesh. Tropical Medicine and International Health, 12(7), 823–832.
Munsur, A. M., Atia., Koffi , A. K. & Kawahara, K. (2009). Household out-of-pocket expenditures on health care in Bangladesh according to principal component analysis (PCA). Biosci Trends, 3(1), 25-31.
Nanda, P. (1999). Women’s Participation in Rural Credit Programmes in Bangladesh and their Demand for Formal Health Care: Is there a Positive Impact? Health Economics, 8(5), 415-428.
O’Donnell, O., Doorslaer, E. V., Rannan-Eliya, R. P., Somanathan, A., Garg, C. C., Hanvoravongchai, P., Huq, M. N., Karan, A., Leung, G. M., Tin, K. & Vasavid, C. (2005). Explaining the incidence of catastrophic expenditures on health care: Comparative evidence from Asia. EQUITAP Project: Working Paper No.5.
Patcharanarumol, W., Mills, A. & Tangcharoensathien, V. (2009). Dealing with the cost of illness: The experience of four villages in LAO PDR. Journal of International Development, 21(2), 212–230.
Pradhan, M. & Prescott, N. (2002). Social risk management options for medical care in Indonesia. Health Economics, 11(5), 431–446.
Working Paper No. 13
Utilisation of Formal Health Care and Out-of-Pocket Payments in Rural Bangladesh
49
Ranson, M. K. (2002). Reduction of catastrophic health care expenditures by a community-based health insurance scheme in Gujarat, India: current experiences and challenges. Bulletin of the World Health Organisation, 80(8), 613–621.
Smith, G. (2004). What FIP and WHO are doing to fi ght the problem of counterfeit drugs? Pharm Journal, 273, 394-6.
Somkotra, T. & Lagrada, L. P. (2008). Payments for health care and its effect on catastrophe and impoverishment: Experience from the transition to Universal Coverage in Thailand. Social Science & Medicine, 67(12), 2027-2035.
Subedi, J. (1989).Modern Health Services and Health Care Behavior: A Survey in Kathmandu, Nepal. Journal of Health and Social Behaviour, 30(4), 412-420.
Townsend, R. (1994). Risk and Insurance in Village India, Econometrica, 62(3), 539–592.
Vaishnavi, S. D. & Dash, U. (2009). Catastrophic payments for health care among households in urban Tamil Nadu, India. Journal of International Development, 21(2), 169–184.
Wagstaff, A. & Doorslaer, E. V. (2003). Catastrophe and impoverishment in paying for health care: with applications toVietnam1993—1998. Health Economics, 12(11), 921–934.
World Health Organisation (WHO) (2005). Sustainable health fi nancing, universal coverage and social health insurance. In: 115th World Health Assembly Resolution EB 115.R15, Geneva.
World Health Organisation (WHO) (2006). Health Action International for Africa (HAI Africa). Medicines prices survey and proposed interventions to improve sustainable access to affordable medicines in 6 sub-Saharan African countries. WHO, Geneva, Switzerland.
World Health Organisation (WHO) (2010). Health Systems Financing: The path to universal coverage. WHO, Geneva, Switzerland.
Yardim, M. S., Cilingiroglu, N. & Yardim, N. (2010). Catastrophic health expenditure and impoverishment in Turkey. Health Policy, 94(1), 26– 33.
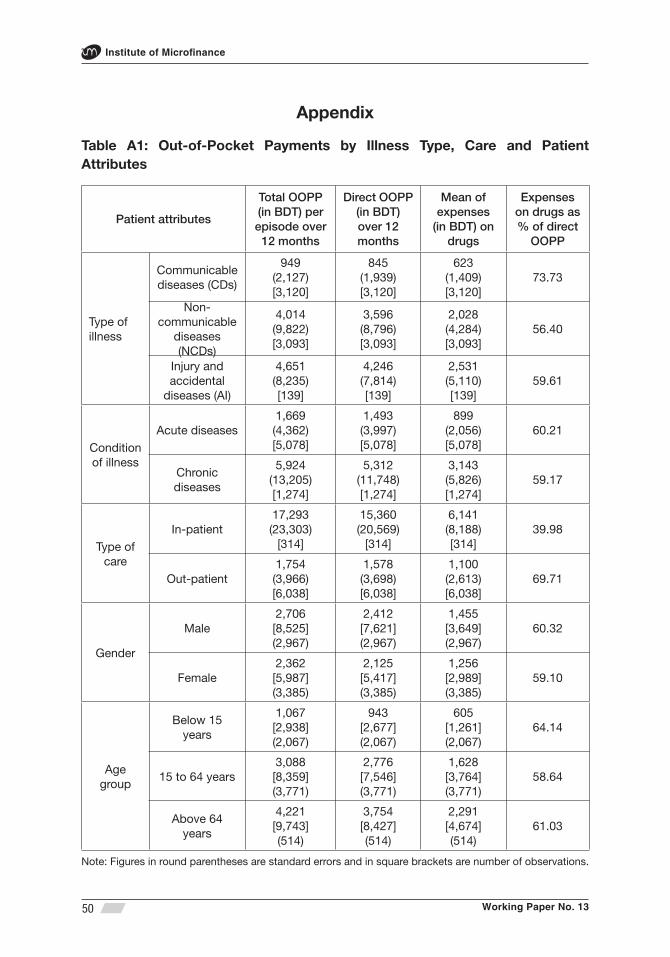
Working Paper No. 13
Institute of Microfi nance
50
Appendix
Table A1: Out-of-Pocket Payments by Illness Type, Care and Patient Attributes
Patient attributes
Total OOPP (in BDT) per episode over
12 months
Direct OOPP (in BDT)over 12 months
Mean of expenses
(in BDT) on drugs
Expenses on drugs as % of direct
OOPP
Type of illness
Communicable diseases (CDs)
949(2,127)[3,120]
845(1,939)[3,120]
623(1,409)[3,120]
73.73
Non- communicable
diseases (NCDs)
4,014(9,822)[3,093]
3,596(8,796)[3,093]
2,028(4,284)[3,093]
56.40
Injury and accidental
diseases (AI)
4,651(8,235)[139]
4,246(7,814)[139]
2,531(5,110)[139]
59.61
Condition of illness
Acute diseases1,669(4,362)[5,078]
1,493(3,997)[5,078]
899(2,056)[5,078]
60.21
Chronic diseases
5,924(13,205)[1,274]
5,312(11,748)[1,274]
3,143(5,826)[1,274]
59.17
Type of care
In-patient 17,293(23,303)
[314]
15,360(20,569)
[314]
6,141(8,188)[314]
39.98
Out-patient1,754(3,966)[6,038]
1,578(3,698)[6,038]
1,100(2,613)[6,038]
69.71
Gender
Male2,706[8,525](2,967)
2,412[7,621](2,967)
1,455[3,649](2,967)
60.32
Female2,362[5,987](3,385)
2,125[5,417](3,385)
1,256[2,989](3,385)
59.10
Age group
Below 15 years
1,067[2,938](2,067)
943[2,677](2,067)
605[1,261](2,067)
64.14
15 to 64 years3,088[8,359](3,771)
2,776[7,546](3,771)
1,628[3,764](3,771)
58.64
Above 64 years
4,221[9,743](514)
3,754[8,427](514)
2,291[4,674](514)
61.03
Note: Figures in round parentheses are standard errors and in square brackets are number of observations.
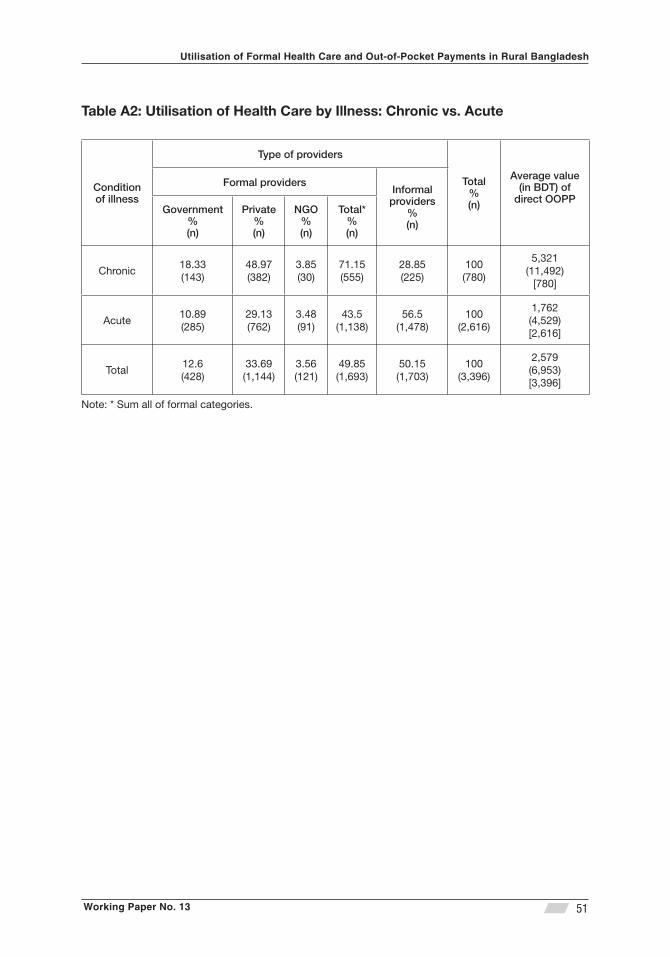
Working Paper No. 13
Utilisation of Formal Health Care and Out-of-Pocket Payments in Rural Bangladesh
51
Table A2: Utilisation of Health Care by Illness: Chronic vs. Acute
Condition of illness
Type of providers
Total%(n)
Average value (in BDT) of
direct OOPP
Formal providersInformal
providers%(n)
Government%(n)
Private%(n)
NGO%(n)
Total*%(n)
Chronic18.33(143)
48.97(382)
3.85(30)
71.15(555)
28.85(225)
100(780)
5,321(11,492)
[780]
Acute10.89(285)
29.13(762)
3.48(91)
43.5(1,138)
56.5(1,478)
100(2,616)
1,762(4,529)[2,616]
Total12.6(428)
33.69(1,144)
3.56(121)
49.85(1,693)
50.15(1,703)
100(3,396)
2,579(6,953)[3,396]
Note: * Sum all of formal categories.
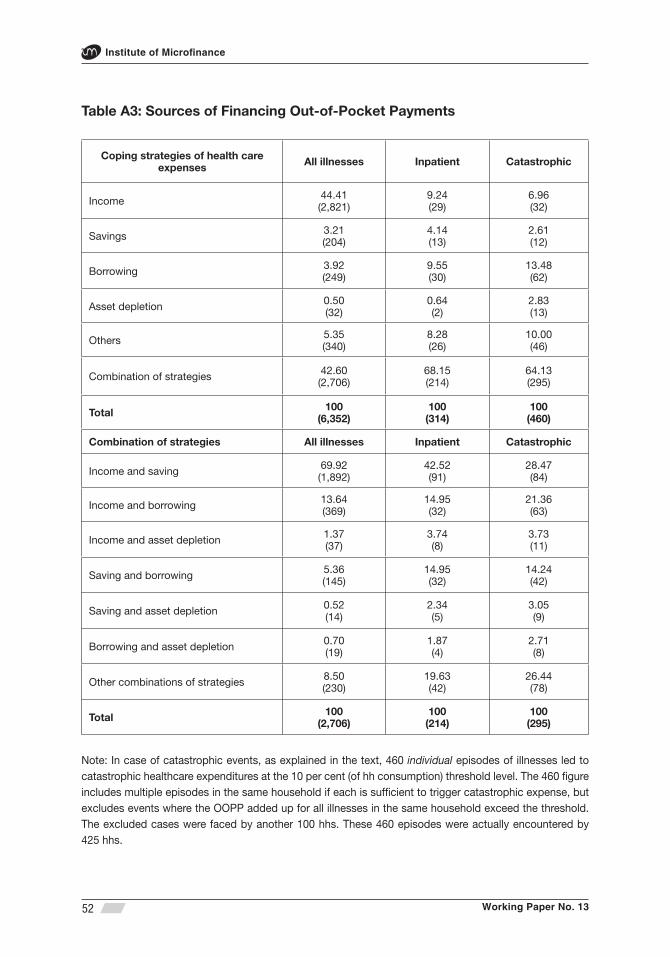
Working Paper No. 13
Institute of Microfi nance
52
Table A3: Sources of Financing Out-of-Pocket Payments
Coping strategies of health care expenses All illnesses Inpatient Catastrophic
Income 44.41(2,821)
9.24(29)
6.96(32)
Savings 3.21(204)
4.14(13)
2.61(12)
Borrowing 3.92(249)
9.55(30)
13.48(62)
Asset depletion 0.50(32)
0.64(2)
2.83(13)
Others 5.35(340)
8.28(26)
10.00(46)
Combination of strategies 42.60(2,706)
68.15(214)
64.13(295)
Total 100(6,352)
100(314)
100(460)
Combination of strategies All illnesses Inpatient Catastrophic
Income and saving 69.92(1,892)
42.52(91)
28.47(84)
Income and borrowing 13.64(369)
14.95(32)
21.36(63)
Income and asset depletion 1.37(37)
3.74(8)
3.73(11)
Saving and borrowing 5.36(145)
14.95(32)
14.24(42)
Saving and asset depletion 0.52(14)
2.34(5)
3.05(9)
Borrowing and asset depletion 0.70(19)
1.87(4)
2.71(8)
Other combinations of strategies 8.50(230)
19.63(42)
26.44(78)
Total 100(2,706)
100(214)
100(295)
Note: In case of catastrophic events, as explained in the text, 460 individual episodes of illnesses led to catastrophic healthcare expenditures at the 10 per cent (of hh consumption) threshold level. The 460 fi gure includes multiple episodes in the same household if each is suffi cient to trigger catastrophic expense, but excludes events where the OOPP added up for all illnesses in the same household exceed the threshold. The excluded cases were faced by another 100 hhs. These 460 episodes were actually encountered by 425 hhs.

Institute of Microfi nance
The Institute of Microfi nance (InM) is an independent non-profi t organisation
established primarily to meet the research and training needs of national
as well as of global microcredit programmes. Initiated and promoted by
Palli Karma-Sahayak Foundation (PKSF) on 1 November 2006, the Institute
is principally funded by UKaid, Department for International Development
(DFID) through its Promoting Financial Services for Poverty Reduction
(PROSPER) Programme. InM has an excellent team of professionals in
research, training and knowledge management. InM draws research scholars
from reputed universities here and abroad. The major services that InM
provides are research on poverty, microfi nance, enterprise development,
impact assessment and evaluation of microfi nance programmes. Beside
research, InM provides microfi nance related training, capacity building
support and knowledge management services to microfi nance institutions
and other development organisations.
For information please contact:
House # 2/1, Block-D, Lalmatia, Dhaka-1207, Bangladesh
PKSF Bhaban, Agargaon, Dhaka-1207, Bangladesh
PABX: +88-02-8100479, +88-02-8100676-7, Fax: +88-02-8100481 Email: [email protected] ; Web: www.inm.org.bd
Institute of Microfi nance (InM)