Using wavelet analysis to detect the influence of low frequency magnetic fields on human...
13
IOP PUBLISHING PHYSIOLOGICAL MEASUREMENT Physiol. Meas. 28 (2007) 321–333 doi:10.1088/0967-3334/28/3/007 Using wavelet analysis to detect the influence of low frequency magnetic fields on human physiological tremor A N Pavlov 1 , A N Tupitsyn 1 , A Legros 2 , A Beuter 3 and E Mosekilde 4 1 Department of Physics, Saratov State University, Astrakhanskaya Str. 83, 410026, Saratov, Russia 2 Lawson Health Research Institute, St. Joseph’s Health Care, 268, Grosvenor Street, London, Ontario, N6A 4V2, Canada 3 Institut de Cognitique, Universit´ e Victor Segalen Bordeaux 2, 146 Rue L´ eo Saignat, 33076 Bordeaux, Cedex, France 4 Department of Physics, Technical University of Denmark, 2800 Kongens Lyngby, Denmark E-mail: [email protected] Received 17 August 2006, accepted for publication 31 January 2007 Published 23 February 2007 Online at stacks.iop.org/PM/28/321 Abstract The influence of extremely low frequency magnetic fields (ELF-MFs) on human physiological processes and, in particular, on motor activity is still not established with certainty. Using the wavelet-transform approach, changes in the characteristics of human finger micromovement are studied in the presence of a low intensity MF centred at the level of the head. Different approaches to nonstationary signal analysis involving real as well as complex wavelet functions are considered. We find evidence that ELF-MFs lead to more regular postural tremor and more homogeneous energy distribution. Keywords: physiological tremor, magnetic fields, wavelet analysis, H¨ older coefficients, local intermittency 1. Introduction In our daily lives we are all exposed to different sources of extremely low frequency (ELF, below 300 Hz) and low intensity (below 2 mT) magnetic fields (MFs), such as personal computers, domestic electrical appliances, residential power installations, etc (Gandhi et al 2001, Gauger 1985). The influence of such ELF-MFs on the central and peripheral nervous system remains open and to some extent controversial. The main reason for this is the obvious problems of detecting ELF-MF effects in classical neurophysiological signals such as electroencephalograms or evoked potentials. Experimental recordings of the brain electrical activity are contaminated by the presence of the MF itself (Cook et al 2004), which significantly complicates attempts to reveal changes of the neurophysiological parameters. 0967-3334/07/030321+13$30.00 © 2007 IOP Publishing Ltd Printed in the UK 321
Transcript of Using wavelet analysis to detect the influence of low frequency magnetic fields on human...
IOP PUBLISHING PHYSIOLOGICAL MEASUREMENT
Physiol. Meas. 28 (2007) 321–333 doi:10.1088/0967-3334/28/3/007
Using wavelet analysis to detect the influence of lowfrequency magnetic fields on human physiologicaltremor
A N Pavlov1, A N Tupitsyn1, A Legros2, A Beuter3 and E Mosekilde4
1 Department of Physics, Saratov State University, Astrakhanskaya Str. 83, 410026, Saratov,Russia2 Lawson Health Research Institute, St. Joseph’s Health Care, 268, Grosvenor Street, London,Ontario, N6A 4V2, Canada3 Institut de Cognitique, Universite Victor Segalen Bordeaux 2, 146 Rue Leo Saignat,33076 Bordeaux, Cedex, France4 Department of Physics, Technical University of Denmark, 2800 Kongens Lyngby, Denmark
E-mail: [email protected]
Received 17 August 2006, accepted for publication 31 January 2007Published 23 February 2007Online at stacks.iop.org/PM/28/321
AbstractThe influence of extremely low frequency magnetic fields (ELF-MFs) onhuman physiological processes and, in particular, on motor activity is still notestablished with certainty. Using the wavelet-transform approach, changes inthe characteristics of human finger micromovement are studied in the presenceof a low intensity MF centred at the level of the head. Different approachesto nonstationary signal analysis involving real as well as complex waveletfunctions are considered. We find evidence that ELF-MFs lead to more regularpostural tremor and more homogeneous energy distribution.
Keywords: physiological tremor, magnetic fields, wavelet analysis, Holdercoefficients, local intermittency
1. Introduction
In our daily lives we are all exposed to different sources of extremely low frequency(ELF, below 300 Hz) and low intensity (below 2 mT) magnetic fields (MFs), such aspersonal computers, domestic electrical appliances, residential power installations, etc (Gandhiet al 2001, Gauger 1985). The influence of such ELF-MFs on the central and peripheralnervous system remains open and to some extent controversial. The main reason for thisis the obvious problems of detecting ELF-MF effects in classical neurophysiological signalssuch as electroencephalograms or evoked potentials. Experimental recordings of the brainelectrical activity are contaminated by the presence of the MF itself (Cook et al 2004), whichsignificantly complicates attempts to reveal changes of the neurophysiological parameters.
0967-3334/07/030321+13$30.00 © 2007 IOP Publishing Ltd Printed in the UK 321
322 A N Pavlov et al
Being a highly sensitive indicator of the activity of the nervous system, physiological tremoroffers an opportunity to avoid this problem and thus to study, although indirectly, possibleMF-induced effects on the activity of the central nervous system.
Tremor is a rhythmical involuntary oscillatory movement of a body part which dependson the recording conditions and the body part examined (Beuter et al 2003). It has a variableamplitude and a relatively stable frequency. It is now generally accepted that physiologicaltremor is a peripheral manifestation of a central oscillatory activity. According to McAuleyand Marsden (2000) tremor has a multifactorial origin including central nervous systemoscillatory activity, motor unit firing properties starting firing at around 8 to 10 Hz, limbmechanical resonance and reflex loop resonance (the stretch reflex is a negative feedback loopand the loop time is about 50 ms). Most of the normal physiological tremor frequency contentis between 5 and 15 Hz, and it is influenced by many factors (temperature, smoking, stress,fatigue, etc) (Wachs and Boshes 1961). In general, however, healthy people demonstrateweak-amplitude physiological tremor with frequencies around 8–12 Hz (Elble and Koller1990). Tremor appears to follow a continuum between its physiological and pathologicalmanifestations. We have observed that, going in the direction of abnormality, tremor frequencydecreases and its frequency content becomes more organized. That is, the more regular thesignal, the more abnormal (sometimes pathological) is the tremor. The latter was discussed,for instance, in the work of Edwards and Beuter (1999). In addition, the lower the frequencyof tremor, the more abnormal (sometimes pathological) is the tremor. Going in the directionof pathology, tremor amplitude usually increases and tends to fluctuate (Edwards and Beuter1999).
If ELF-MFs influence human neurophysiological processes, this should be revealed aschanges in the physiological tremor, especially during a postural maintenance task which leadsto activation of neuromuscular processes. This situation may be realized, for instance, whena person maintains the index finger in a horizontal position (postural tremor). The effects oflow intensity MF (1 mT, 50 Hz) on human motor behaviour were considered in a recent paper(Legros and Beuter 2005), using standard statistical analysis of the experimental data. Thispaper aimed to reveal any possible responses of ELF-MF in index finger microdisplacements.It was shown that the MF changes the energy distribution at low frequencies (2–4 Hz). Asubsequent work (Legros et al 2006) exploiting the technique of wavelet analysis did notshow any effect of the application of MFs on the local frequency organization of posturaltremor. It was concluded, however, that the effects of ELF-MFs could be comparable to thoseof relaxation. This conclusion allows us to suppose that the ELF-MF can change correlationproperties of postural tremor data. Note that quantification of the corresponding changes islimited by instability of the standard correlation analysis as applied to short noisy time series. Astudy of correlation properties based on the Holder exponents (Muzy et al 1994) has a numberof advantages in the latter case. In particular, a variance of the estimated characteristicscan be significantly reduced (Dumsky 2005). Within the framework of the Holder analysis,changes of signal characteristics can be described in terms of the ‘smoothness’ of tremor data.Additionally, we study other possible effects in postural tremor caused by the ELF-MF suchas the homogeneity of the energy distribution. We show that the use of Holder analysis and ofa local intermittency measure allows us to reveal short-term changes in signal structure thatoccur during 5–10 s.
2. Experiments
Experiments were performed on volunteers from the personnel of a French electricity company‘Electricite de France’ (24 men, aged between 20 and 50 years, the average age is 37.8 ± 8).
Magnetic field effects on physiological tremor 323
Off
On (a)1 2 3 4 5 6 7 8
time
0.0 2.5 5.0 7.5 10.0t, sec
0.0
0.2
0.4
0.6
x
onoff
(b)
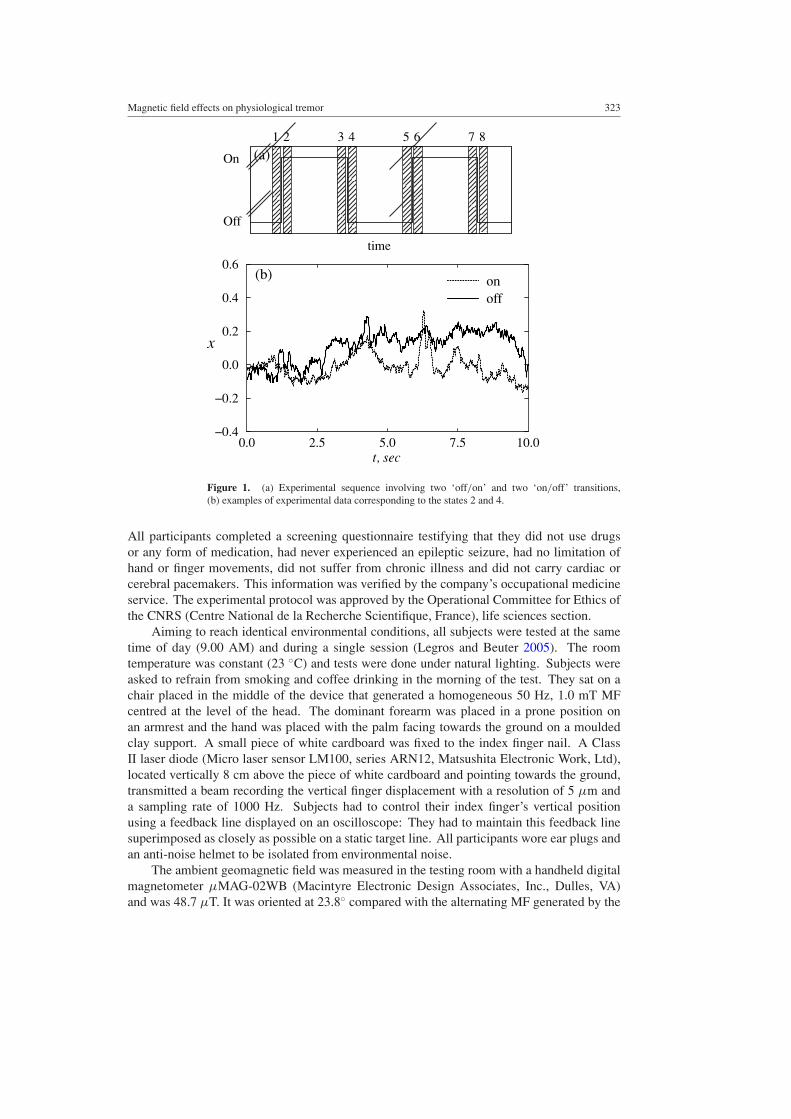
Figure 1. (a) Experimental sequence involving two ‘off/on’ and two ‘on/off’ transitions,(b) examples of experimental data corresponding to the states 2 and 4.
All participants completed a screening questionnaire testifying that they did not use drugsor any form of medication, had never experienced an epileptic seizure, had no limitation ofhand or finger movements, did not suffer from chronic illness and did not carry cardiac orcerebral pacemakers. This information was verified by the company’s occupational medicineservice. The experimental protocol was approved by the Operational Committee for Ethics ofthe CNRS (Centre National de la Recherche Scientifique, France), life sciences section.
Aiming to reach identical environmental conditions, all subjects were tested at the sametime of day (9.00 AM) and during a single session (Legros and Beuter 2005). The roomtemperature was constant (23 ◦C) and tests were done under natural lighting. Subjects wereasked to refrain from smoking and coffee drinking in the morning of the test. They sat on achair placed in the middle of the device that generated a homogeneous 50 Hz, 1.0 mT MFcentred at the level of the head. The dominant forearm was placed in a prone position onan armrest and the hand was placed with the palm facing towards the ground on a mouldedclay support. A small piece of white cardboard was fixed to the index finger nail. A ClassII laser diode (Micro laser sensor LM100, series ARN12, Matsushita Electronic Work, Ltd),located vertically 8 cm above the piece of white cardboard and pointing towards the ground,transmitted a beam recording the vertical finger displacement with a resolution of 5 µm anda sampling rate of 1000 Hz. Subjects had to control their index finger’s vertical positionusing a feedback line displayed on an oscilloscope: They had to maintain this feedback linesuperimposed as closely as possible on a static target line. All participants wore ear plugs andan anti-noise helmet to be isolated from environmental noise.
The ambient geomagnetic field was measured in the testing room with a handheld digitalmagnetometer µMAG-02WB (Macintyre Electronic Design Associates, Inc., Dulles, VA)and was 48.7 µT. It was oriented at 23.8◦ compared with the alternating MF generated by the
324 A N Pavlov et al
exposure system. Since this is a static field, it does not induce any electrical current in the bodyand did not therefore influence the results. Background ambient alternating MF produced bysurrounding electric and electronic sources was also measured with an EMDEX Lite monitor(ENERTECH Consultants, Campbell, CA) and was less than 0.01 µT. It is 100 000 times lessthan the field used in the experiment and could not then influence the results as well.
Each experimental session lasted 65 min and included two sequences of postural tremortesting. A session was composed of 16 conditions of tremor testing, each lasting 62 s andspaced with a 3 min resting period in between. One sequence (real) contained four MFtransitions with 4 min in between (two ‘off/on’ and two ‘on/off’, see figure 1(a)). Timeseries of 62 s centred on each MF transition were recorded. The other sequence (sham) wasused as a control: during this sequence, the MF was never present, even in the so-called ‘on’condition, but the time course of tremor recordings was similar to the real exposure sequence.A computer controlled the course of the experiment, which was conducted following a doubleblind, counterbalanced procedure (neither the subject nor the experimenter knew when theMF was present). The approach was designed to emphasize rapid changes occurring inphysiological tremor induced by the application of low frequency MFs and to reduce thesignificance of possible confounding factors. The use of sham sequences as control conditionsensures the external validity of the results: because the subject has no information whetherthe MF is actually presented, it is possible to reveal actual changes of postural tremor inducedby the MF. ‘Sham’ sequences allowed us to estimate a range of possible changes of differentcharacteristics (not caused by the MF).
Velocity data obtained by numerical differentiation (simple backward difference) of therecorded time series of vertical finger position were used in subsequent analyses. The presenceof MFs produced artefacts at the grid frequency (50 Hz). Since tremor occurs in the lowerfrequency domain, a low-pass filtering of the data was applied with a cut-off frequency 40 Hz(using a filter with infinitely sharp characteristics, obtained through fast Fourier transformfollowed by the inverse transform). Aiming to remove a slow nonstationarity (trend) fromthe experimental recordings, an additional high-pass filtering with the cut-off frequency 2 Hzwas used at the stage of data preprocessing (applying a similar filtering procedure). A furthernumerical analysis of tremor data was performed based on custom programs written in C.Statistical tests are performed using Matlab (The Mathworks, Natick, MA).
3. Wavelet analysis
As previously mentioned, Legros and Beuter (2005) have recently studied the effects of MFs onphysiological tremor using standard methods of statistical analysis. This included estimationsof amplitude variations, of different characteristics of the probability density function and ofthe spectral power distribution. This study revealed some changes in the power spectra inthe presence of ELF-MF. Preliminary wavelet analyses were performed in a preceding work(Legros et al 2006). In particular, this work suggested that the effects of ELF-MFs could becomparable to those of relaxation.
Let us emphasize, however, that the analysed data are quite nonstationary (figure 1(b)).This leads to a variety of problems concerning the interpretation of the results obtainedby standard statistical methods. In particular, the presence of nonstationarity reduces thereliability of quantification of amplitude variations and broadens the probability densityfunction. The complex inhomogeneous dynamics of living systems is often studied moreeffectively by using specialized tools whose efficiency does not depend on the requirement ofstationarity. At present, one of the most efficient tools is probably wavelet analysis (Grossmanand Morlet 1984, Chui 1992, Mallat 1998, Marsh et al 2005, Sosnovtseva et al 2005).
Magnetic field effects on physiological tremor 325
The wavelet transform of a signal x(t) has the following form:
W(a, b) = 1√a
∫ ∞
−∞x(t)ψ∗
(t − b
a
)dt, (1)
where ψ is the basis function (the wavelet), and a and b are the scale and time displacementparameters. W(a, b) are referred to as the wavelet coefficients. The choice of the basisfunction ψ depends on the aim of the research. Different functions have different featuresin both the time and the frequency domains. Hence, the proper selection of ψ gives anopportunity to reveal different aspects of the structure of the analysed process. The purpose ofthe following sections is to study features of tremor data with more refined wavelet-based toolssuch as Holder analysis and a local intermittency measure (Astaf’eva 1996). As mentionedabove, these tools allow us to reveal short-term changes in the signal structure.
3.1. Analysis based on real wavelets
Some features of the signal x(t) do not depend on the basis function ψ . One such featureis the local regularity that is usually estimated within the framework of multifractals (Muzyet al 1993, 1994). This estimation is performed with real wavelets constructed, e.g., bydifferentiation of the Gaussian function:
ψ(m)(θ) = (−1)m∂m
∂θm
[exp
(−θ2
2
)]. (2)
In this paper we consider m = 1 (‘WAVE’ wavelet) and use ψ(1)(θ) when computing thetransform (1) with real wavelets. θ = t−b
a�t, where �t is the sampling step (�t = 0.001 s). The
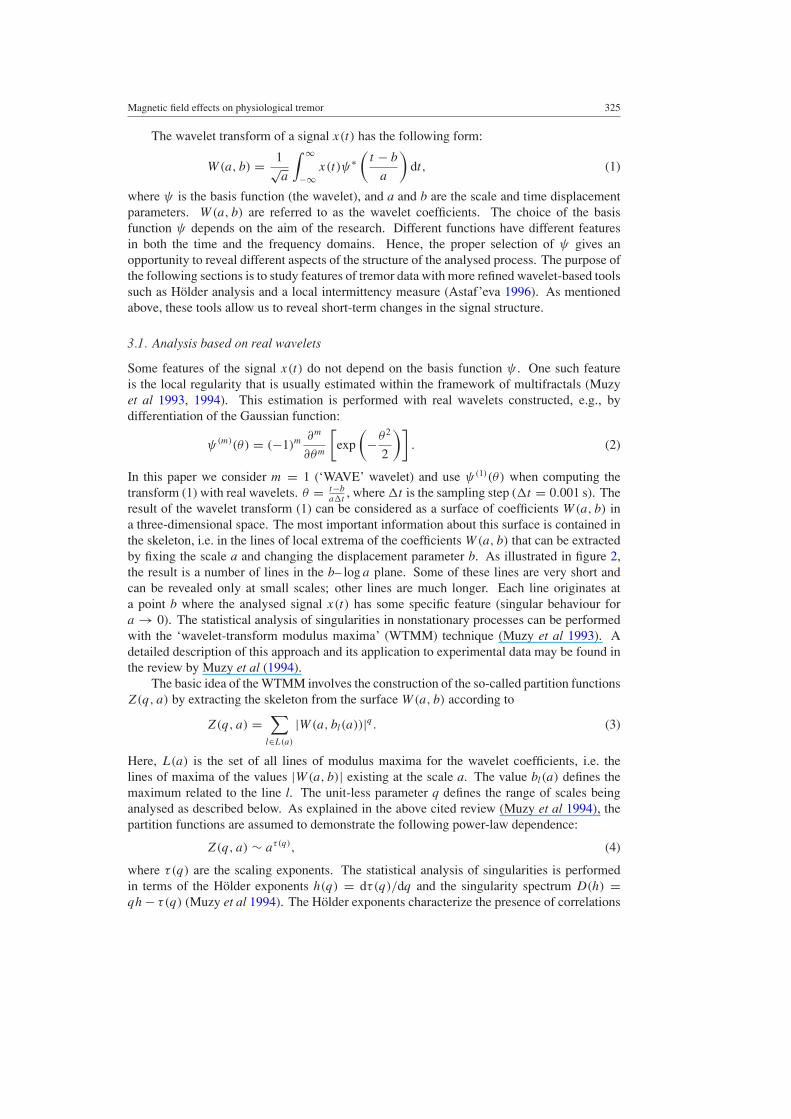
result of the wavelet transform (1) can be considered as a surface of coefficients W(a, b) ina three-dimensional space. The most important information about this surface is contained inthe skeleton, i.e. in the lines of local extrema of the coefficients W(a, b) that can be extractedby fixing the scale a and changing the displacement parameter b. As illustrated in figure 2,the result is a number of lines in the b– log a plane. Some of these lines are very short andcan be revealed only at small scales; other lines are much longer. Each line originates ata point b where the analysed signal x(t) has some specific feature (singular behaviour fora → 0). The statistical analysis of singularities in nonstationary processes can be performedwith the ‘wavelet-transform modulus maxima’ (WTMM) technique (Muzy et al 1993). Adetailed description of this approach and its application to experimental data may be found inthe review by Muzy et al (1994).
The basic idea of the WTMM involves the construction of the so-called partition functionsZ(q, a) by extracting the skeleton from the surface W(a, b) according to
Z(q, a) =∑
l∈L(a)
|W(a, bl(a))|q . (3)
Here, L(a) is the set of all lines of modulus maxima for the wavelet coefficients, i.e. thelines of maxima of the values |W(a, b)| existing at the scale a. The value bl(a) defines themaximum related to the line l. The unit-less parameter q defines the range of scales beinganalysed as described below. As explained in the above cited review (Muzy et al 1994), thepartition functions are assumed to demonstrate the following power-law dependence:
Z(q, a) ∼ aτ(q), (4)
where τ(q) are the scaling exponents. The statistical analysis of singularities is performedin terms of the Holder exponents h(q) = dτ(q)/dq and the singularity spectrum D(h) =qh − τ(q) (Muzy et al 1994). The Holder exponents characterize the presence of correlations
326 A N Pavlov et al
0.0 2.5 5.0 7.5 10.0b, sec
0.0
2.0
4.0
6.0
8.0
log
a
Figure 2. Skeleton computed for the signal shown in figure 1(b) (‘on’ condition). Each lineoriginates at a point where the analysed signal x(t) has singular behaviour at a → 0. Here, weconsider the range log a ∈ [0.1; 7.5]. Aiming to reduce possible pitfalls of the Holder analysis,further estimations of the scaling exponents are performed for the range log a ∈ [0.7; 4.0].
of different types in the analysed process, e.g., anti-correlated (h < 0.5) or correlated (h > 0.5)
dynamics, absence of correlations (h = 0.5) and conformity of the signal x(t) with classicalexamples of random processes: 1/f noise (h = 1), Brownian motion (h = 1.5), etc. Ingeneral, the ‘smoother’ the signal x(t), the greater the exponents h(q) are. When performinga study of correlation properties for short noisy data, the use of Holder exponents can havesome advantages over the classical correlation function, in particular, a higher stability of theestimated characteristics (Dumsky 2005). It is known that the wavelet-based methods havedifferent limitations and pitfalls (Maraun and Kurths 2004, Veneziano et al 1995, Sosnovtsevaet al 2005). In particular, the singularity spectrum D(h) can lead to different misinterpretationsof the actual dynamics (Veneziano et al 1995). Nevertheless, the averaged value of theHolder exponents allows one to characterize even small changes of correlation properties.The partition function Z(q, a) describes the power-law dependences (4) at q < 0 for weaksingularities or small fluctuations and at q > 0 for strong singularities or large fluctuations.Aiming to estimate the scaling exponents τ(q), we use the range log a ∈ [0.7; 4.0].
3.2. Analyses based on complex wavelets
Today, spectral analyses of nonstationary processes are often performed with the wavelettransform (1), using a complex basis function ψ (Grossman and Morlet 1984, Chui 1992).The advantages of this approach in comparison with a classical spectral analysis based on afinite-time Fourier transform have been widely discussed (Chui 1992, Mallat 1998). If we onlyneed to determine the time-averaged spectral components presented by the analysed signal,then the classical approach can be successfully applied. However, if we are interested in thetemporal evolution of the rhythmic components, then the wavelets have clear advantages.
Probably the most popular complex basis function is the Morlet wavelet whose simplifiedexpression can be written in the form
ψ(θ) = π−1/4 exp(j2πf0θ) exp
[−θ2
2
]. (5)
Function (5) is used in our study when performing analysis based on complex wavelets. Thetransformation (1) represents a two-dimensional decomposition of a scalar time series withthe frequency (f = f0/(a�t)) and time (b) treated as independent quantities. Unlike the
Magnetic field effects on physiological tremor 327
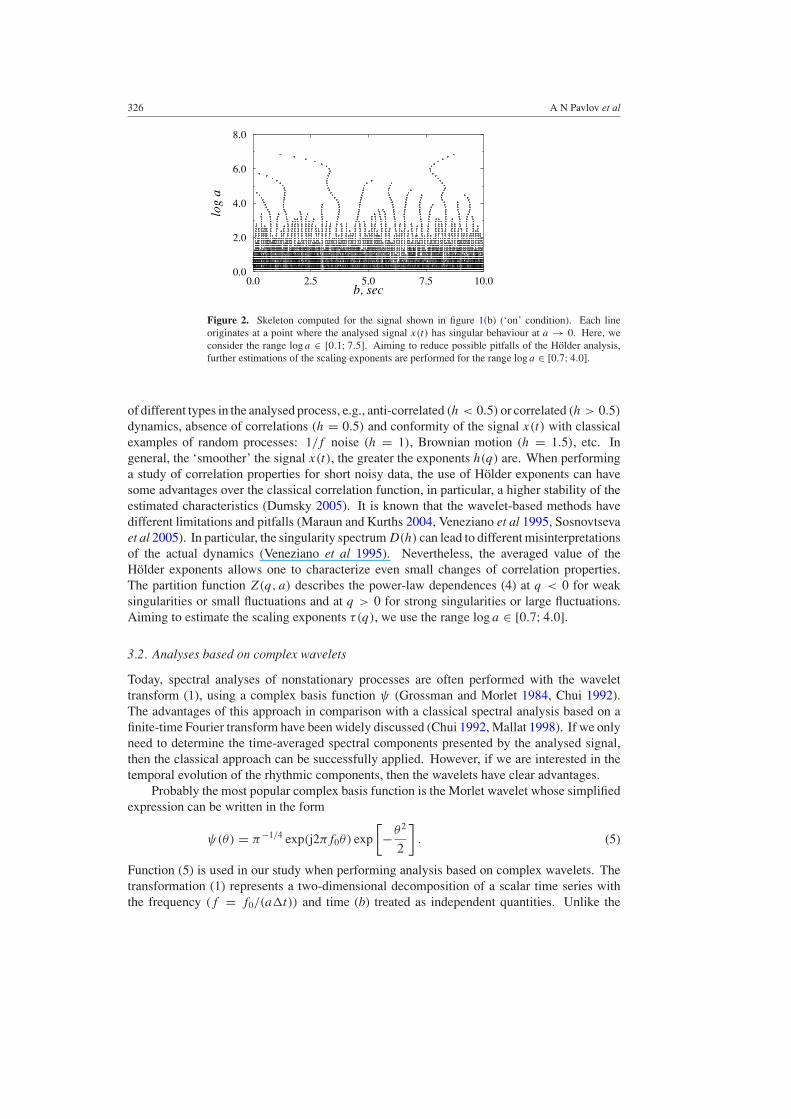
Figure 3. Time-frequency spectrum illustrating the complex structure of spectral components forthe signal shown in figure 1(b) (‘on’ condition).
case of a real function ψ , analyses based on the complex wavelet (5) typically deal withthe energy density E(f, b) = |W(f, b)|2 instead of the wavelet coefficients W(a, b). Theenergy density also represents a surface in a three-dimensional space whose sections at fixedtime moments b = t∗ correspond to the local energy spectrum. The main information aboutthe surface E(f, b) is associated with the dynamics of its local maxima, i.e. with the timeevolution of instantaneous frequencies of the main rhythmic components. Their extraction canbe realized by analogy with the skeleton in section 3.1. The difference, however, consists in thefixation of the displacement parameter b and the choice of local peaks of the surface E(f, b)
under variation of the scale parameter a (or the frequency f ). As a result, the instantaneousfrequencies of all rhythms that are present in the analysed signal will be detected. An exampleis shown in figure 3, where we consider the range f ∈ [2; 20] Hz. The required range of a isestimated depending on the chosen frequencies.
In addition to the local spectra there are a number of other characteristics estimated fromthe energy density including, e.g., the measure of local intermittency (local deviations fromthe average value of energy at each scale). The latter quantifies the inhomogeneity of theenergy distribution (Astaf’eva 1996):
I (f, b) = E(f, b)
〈E(f, b)〉 . (6)
Here, the angular brackets denote averaging over time, i.e. over the parameter b. As acharacteristic of the inhomogeneity, we suggest using the standard deviation of the measureI (f, b) from its mean value 〈I (f, b)〉 = 1. When dealing with noise-like processes suchas physiological tremor data (figure 1(b)), averaging within some window in the frequencydomain may be useful to smooth out strong variations of the measure I (f, b).
4. Results
4.1. Analysis of local regularity with real wavelets
Because of the ability of neural systems to adapt to external signals on a variety of differenttime scales, our study of the ELF-MF-induced effects on physiological tremor is performedusing short time intervals after the ‘off/on’ transitions (states 2 and 6 in figure 1(a)) and afterthe ‘on/off’ transitions (states 4 and 8). These short time periods involve transient processes,and the application of specialized tools for nonstationary data analysis is, therefore, needed.
328 A N Pavlov et al
0.8 1.0 1.2 1.4 1.6 1.8 2.0h
0.0
0.2
0.4
0.6
0.8
1.0
1.2
D
onoff
(a)
q
0.8
1.0
1.2
1.4
1.6
1.8
2.0
h
onoff
(b)
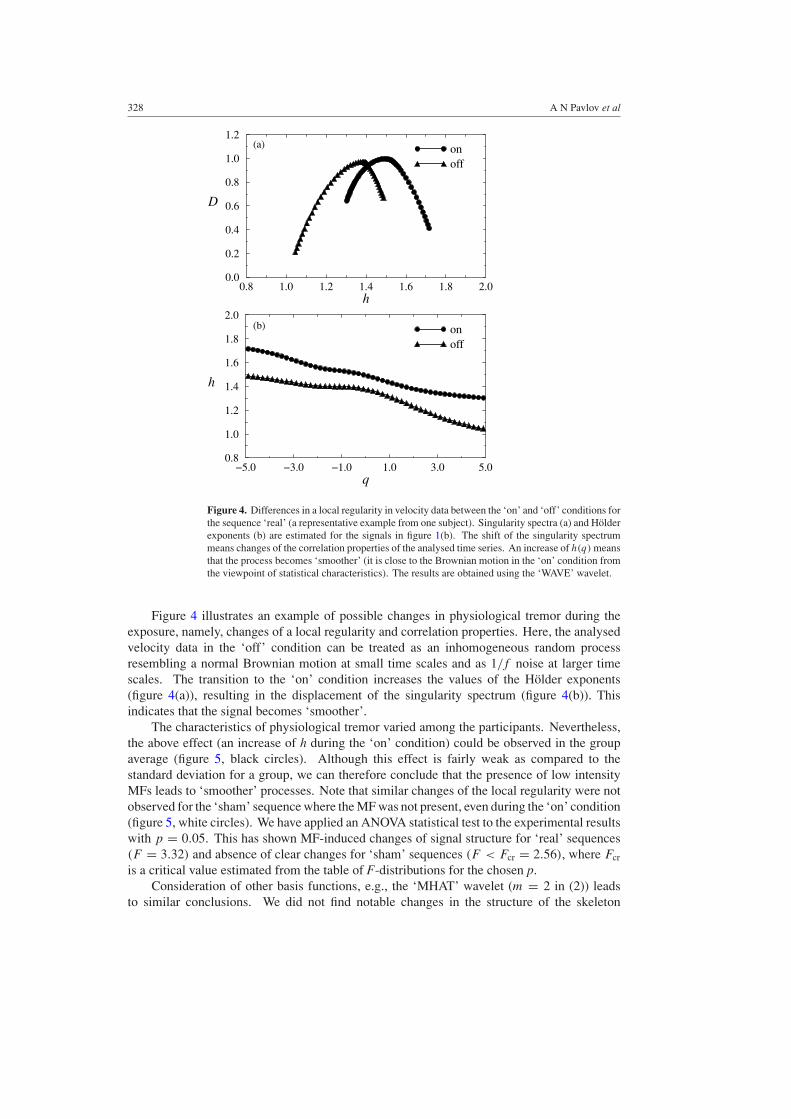
Figure 4. Differences in a local regularity in velocity data between the ‘on’ and ‘off’ conditions forthe sequence ‘real’ (a representative example from one subject). Singularity spectra (a) and Holderexponents (b) are estimated for the signals in figure 1(b). The shift of the singularity spectrummeans changes of the correlation properties of the analysed time series. An increase of h(q) meansthat the process becomes ‘smoother’ (it is close to the Brownian motion in the ‘on’ condition fromthe viewpoint of statistical characteristics). The results are obtained using the ‘WAVE’ wavelet.
Figure 4 illustrates an example of possible changes in physiological tremor during theexposure, namely, changes of a local regularity and correlation properties. Here, the analysedvelocity data in the ‘off’ condition can be treated as an inhomogeneous random processresembling a normal Brownian motion at small time scales and as 1/f noise at larger timescales. The transition to the ‘on’ condition increases the values of the Holder exponents(figure 4(a)), resulting in the displacement of the singularity spectrum (figure 4(b)). Thisindicates that the signal becomes ‘smoother’.
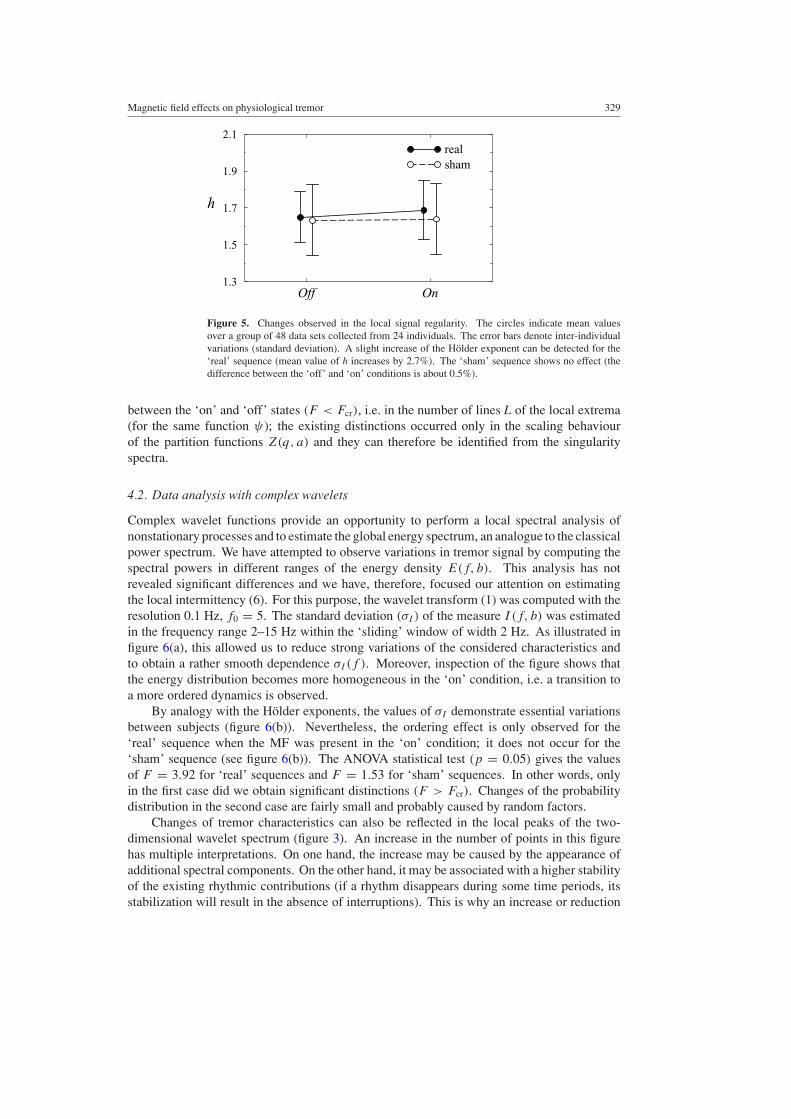
The characteristics of physiological tremor varied among the participants. Nevertheless,the above effect (an increase of h during the ‘on’ condition) could be observed in the groupaverage (figure 5, black circles). Although this effect is fairly weak as compared to thestandard deviation for a group, we can therefore conclude that the presence of low intensityMFs leads to ‘smoother’ processes. Note that similar changes of the local regularity were notobserved for the ‘sham’ sequence where the MF was not present, even during the ‘on’ condition(figure 5, white circles). We have applied an ANOVA statistical test to the experimental resultswith p = 0.05. This has shown MF-induced changes of signal structure for ‘real’ sequences(F = 3.32) and absence of clear changes for ‘sham’ sequences (F < Fcr = 2.56), where Fcr
is a critical value estimated from the table of F-distributions for the chosen p.Consideration of other basis functions, e.g., the ‘MHAT’ wavelet (m = 2 in (2)) leads
to similar conclusions. We did not find notable changes in the structure of the skeleton
Magnetic field effects on physiological tremor 329
Off On1.3
1.5
1.7
1.9
2.1
h
realsham
Figure 5. Changes observed in the local signal regularity. The circles indicate mean valuesover a group of 48 data sets collected from 24 individuals. The error bars denote inter-individualvariations (standard deviation). A slight increase of the Holder exponent can be detected for the‘real’ sequence (mean value of h increases by 2.7%). The ‘sham’ sequence shows no effect (thedifference between the ‘off’ and ‘on’ conditions is about 0.5%).
between the ‘on’ and ‘off’ states (F < Fcr), i.e. in the number of lines L of the local extrema(for the same function ψ); the existing distinctions occurred only in the scaling behaviourof the partition functions Z(q, a) and they can therefore be identified from the singularityspectra.
4.2. Data analysis with complex wavelets
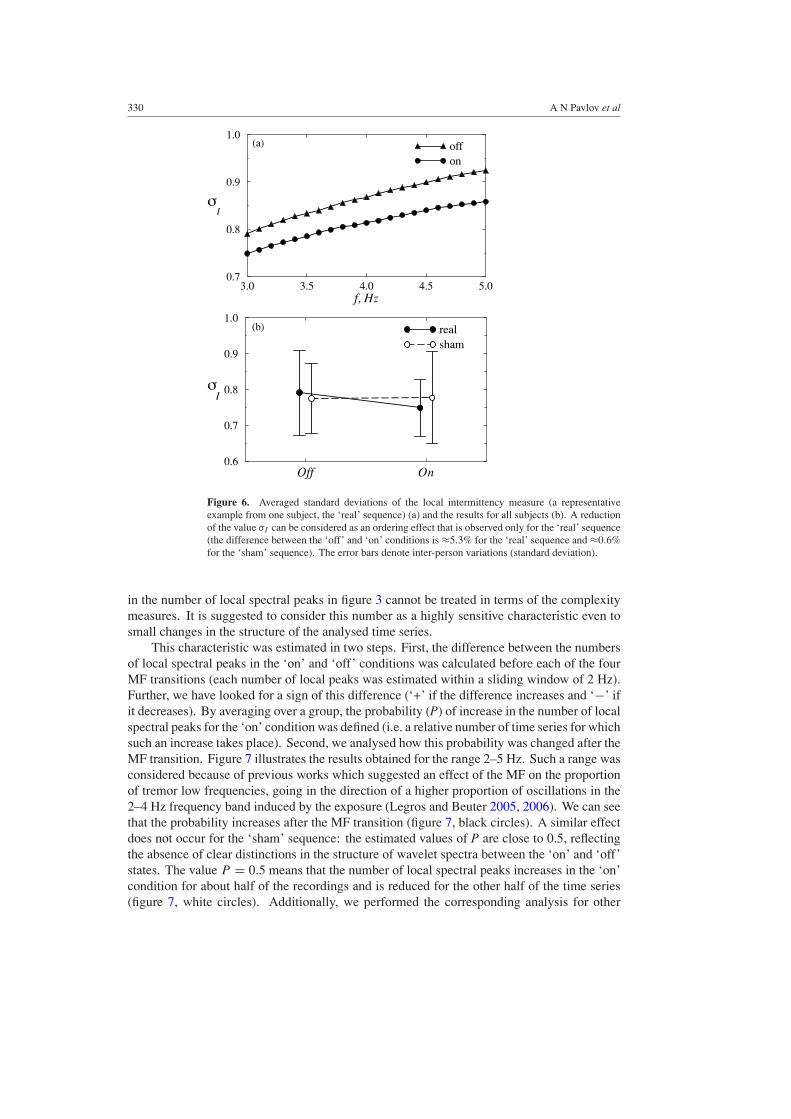
Complex wavelet functions provide an opportunity to perform a local spectral analysis ofnonstationary processes and to estimate the global energy spectrum, an analogue to the classicalpower spectrum. We have attempted to observe variations in tremor signal by computing thespectral powers in different ranges of the energy density E(f, b). This analysis has notrevealed significant differences and we have, therefore, focused our attention on estimatingthe local intermittency (6). For this purpose, the wavelet transform (1) was computed with theresolution 0.1 Hz, f0 = 5. The standard deviation (σI ) of the measure I (f, b) was estimatedin the frequency range 2–15 Hz within the ‘sliding’ window of width 2 Hz. As illustrated infigure 6(a), this allowed us to reduce strong variations of the considered characteristics andto obtain a rather smooth dependence σI (f ). Moreover, inspection of the figure shows thatthe energy distribution becomes more homogeneous in the ‘on’ condition, i.e. a transition toa more ordered dynamics is observed.
By analogy with the Holder exponents, the values of σI demonstrate essential variationsbetween subjects (figure 6(b)). Nevertheless, the ordering effect is only observed for the‘real’ sequence when the MF was present in the ‘on’ condition; it does not occur for the‘sham’ sequence (see figure 6(b)). The ANOVA statistical test (p = 0.05) gives the valuesof F = 3.92 for ‘real’ sequences and F = 1.53 for ‘sham’ sequences. In other words, onlyin the first case did we obtain significant distinctions (F > Fcr). Changes of the probabilitydistribution in the second case are fairly small and probably caused by random factors.
Changes of tremor characteristics can also be reflected in the local peaks of the two-dimensional wavelet spectrum (figure 3). An increase in the number of points in this figurehas multiple interpretations. On one hand, the increase may be caused by the appearance ofadditional spectral components. On the other hand, it may be associated with a higher stabilityof the existing rhythmic contributions (if a rhythm disappears during some time periods, itsstabilization will result in the absence of interruptions). This is why an increase or reduction
330 A N Pavlov et al
3.0 3.5 4.0 4.5 5.0f, Hz
0.7
0.8
0.9
1.0offon
I
(a)
Off On0.6
0.7
0.8
0.9
1.0realsham
I
(b)
Figure 6. Averaged standard deviations of the local intermittency measure (a representativeexample from one subject, the ‘real’ sequence) (a) and the results for all subjects (b). A reductionof the value σI can be considered as an ordering effect that is observed only for the ‘real’ sequence(the difference between the ‘off’ and ‘on’ conditions is ≈5.3% for the ‘real’ sequence and ≈0.6%for the ‘sham’ sequence). The error bars denote inter-person variations (standard deviation).
in the number of local spectral peaks in figure 3 cannot be treated in terms of the complexitymeasures. It is suggested to consider this number as a highly sensitive characteristic even tosmall changes in the structure of the analysed time series.
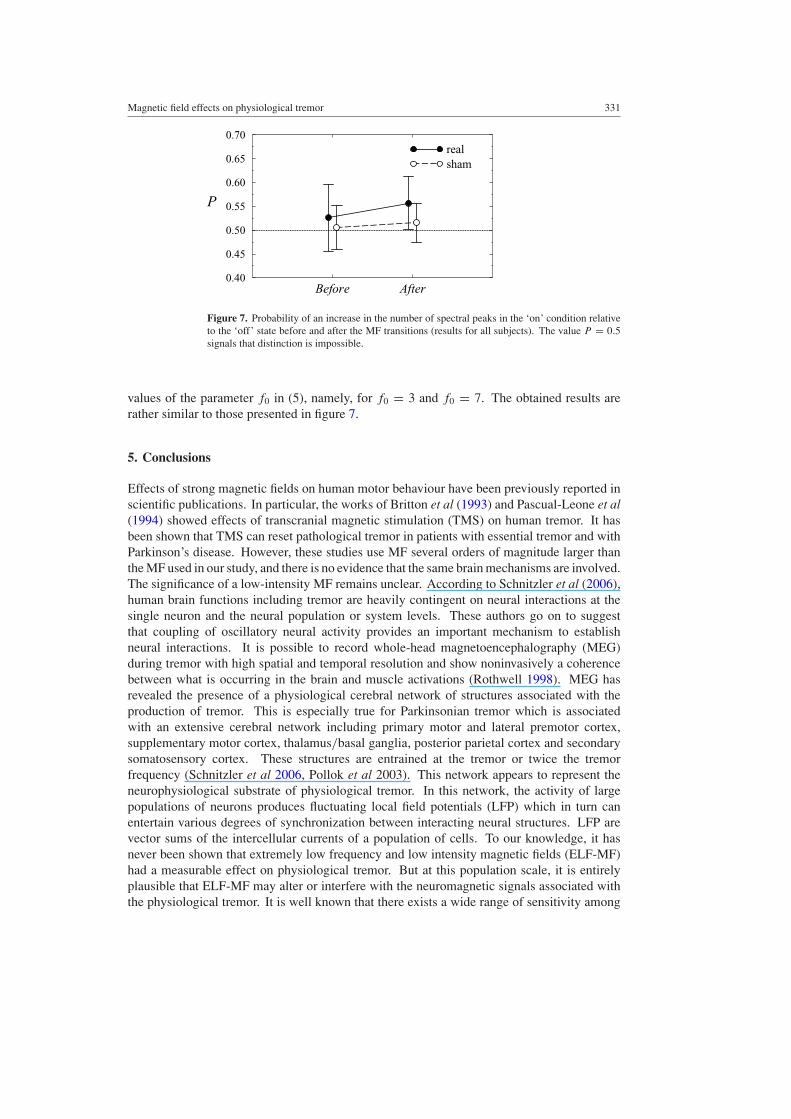
This characteristic was estimated in two steps. First, the difference between the numbersof local spectral peaks in the ‘on’ and ‘off’ conditions was calculated before each of the fourMF transitions (each number of local peaks was estimated within a sliding window of 2 Hz).Further, we have looked for a sign of this difference (‘+’ if the difference increases and ‘−’ ifit decreases). By averaging over a group, the probability (P) of increase in the number of localspectral peaks for the ‘on’ condition was defined (i.e. a relative number of time series for whichsuch an increase takes place). Second, we analysed how this probability was changed after theMF transition. Figure 7 illustrates the results obtained for the range 2–5 Hz. Such a range wasconsidered because of previous works which suggested an effect of the MF on the proportionof tremor low frequencies, going in the direction of a higher proportion of oscillations in the2–4 Hz frequency band induced by the exposure (Legros and Beuter 2005, 2006). We can seethat the probability increases after the MF transition (figure 7, black circles). A similar effectdoes not occur for the ‘sham’ sequence: the estimated values of P are close to 0.5, reflectingthe absence of clear distinctions in the structure of wavelet spectra between the ‘on’ and ‘off’states. The value P = 0.5 means that the number of local spectral peaks increases in the ‘on’condition for about half of the recordings and is reduced for the other half of the time series(figure 7, white circles). Additionally, we performed the corresponding analysis for other
Magnetic field effects on physiological tremor 331
Before After0.40
0.45
0.50
0.55
0.60
0.65
0.70
P
realsham
Figure 7. Probability of an increase in the number of spectral peaks in the ‘on’ condition relativeto the ‘off’ state before and after the MF transitions (results for all subjects). The value P = 0.5signals that distinction is impossible.
values of the parameter f0 in (5), namely, for f0 = 3 and f0 = 7. The obtained results arerather similar to those presented in figure 7.
5. Conclusions
Effects of strong magnetic fields on human motor behaviour have been previously reported inscientific publications. In particular, the works of Britton et al (1993) and Pascual-Leone et al(1994) showed effects of transcranial magnetic stimulation (TMS) on human tremor. It hasbeen shown that TMS can reset pathological tremor in patients with essential tremor and withParkinson’s disease. However, these studies use MF several orders of magnitude larger thanthe MF used in our study, and there is no evidence that the same brain mechanisms are involved.The significance of a low-intensity MF remains unclear. According to Schnitzler et al (2006),human brain functions including tremor are heavily contingent on neural interactions at thesingle neuron and the neural population or system levels. These authors go on to suggestthat coupling of oscillatory neural activity provides an important mechanism to establishneural interactions. It is possible to record whole-head magnetoencephalography (MEG)during tremor with high spatial and temporal resolution and show noninvasively a coherencebetween what is occurring in the brain and muscle activations (Rothwell 1998). MEG hasrevealed the presence of a physiological cerebral network of structures associated with theproduction of tremor. This is especially true for Parkinsonian tremor which is associatedwith an extensive cerebral network including primary motor and lateral premotor cortex,supplementary motor cortex, thalamus/basal ganglia, posterior parietal cortex and secondarysomatosensory cortex. These structures are entrained at the tremor or twice the tremorfrequency (Schnitzler et al 2006, Pollok et al 2003). This network appears to represent theneurophysiological substrate of physiological tremor. In this network, the activity of largepopulations of neurons produces fluctuating local field potentials (LFP) which in turn canentertain various degrees of synchronization between interacting neural structures. LFP arevector sums of the intercellular currents of a population of cells. To our knowledge, it hasnever been shown that extremely low frequency and low intensity magnetic fields (ELF-MF)had a measurable effect on physiological tremor. But at this population scale, it is entirelyplausible that ELF-MF may alter or interfere with the neuromagnetic signals associated withthe physiological tremor. It is well known that there exists a wide range of sensitivity among
332 A N Pavlov et al
neurons to imposed fields. Some neurons can change the frequency of their spontaneous firingby very small changes in their membrane potentials due to external fields of less than a fewmillivolts per centimetre (Terzuolo and Bullock 1956, Bullock 1986).
The purpose of the present paper was to study whether the characteristics of posturalphysiological tremor are sensitive to the influence of low intensity (1.0 mT) and lowfrequency (50 Hz) magnetic fields. Considering the nonstationarity of the analysed processes,our investigations were performed by means of modern wavelet analyses with differentbasis functions (real and complex) and a variety of refinements (Holder coefficients, localintermittency measure and number of spectral peaks). We found evidence to show thatapplication of a low-intensity MF leads to the following effects:
• an increase in the local regularity of the tremor data and, as a consequence, changes of itscorrelation properties;
• a reduction of the standard deviation of the local intermittency measure, i.e. a morehomogeneous distribution of the energy;
• an increase in the number of the local spectral peaks in the range 2–5 Hz.
The obtained results are in agreement with the previous finding (Legros et al 2006) that theeffects of ELF-MFs could be comparable to those of relaxation. All of these effects are fairlyweak. Nevertheless, the results are consistent among the various tests and they suggest thatELF-MFs actually can have an influence on human neurophysiological processes or, at least,on physiological tremor, which we have used as a highly sensitive indicator of neuromotorpathway responsiveness.
Acknowledgments
We express our sincere thanks to O V Sosnovtseva for fruitful discussions. This work was partlysupported by the European Union through the Network of Excellence BioSim, contract no.LSHB-CT-2004-005137. AP acknowledges support from the Russian Ministry of Educationand Sciences.
References
Astaf’eva N M 1996 Wavelet analysis: basic theory and some applications Phys.-Usp. 39 1085Beuter A, Glass L, Mackey M C and Titcombe M S 2003 Nonlinear Dynamics in Physiology and Medicine (New
York: Springer)Britton T C, Thompson P D, Day B L, Rothwell J C, Findley L J and Marsden C D 1993 Modulation of postural wrist
tremors by magnetic stimulation of the motor cortex in patients with Parkinson’s disease or essential tremor andin normal subjects mimicking tremor Ann. Neurol. 33 473
Bullock T H 1986 ‘Simple’ model systems need comparative studies: differences are as important as commonalitiesTrends Neurosci. 9 470
Chui C K 1992 An Introduction to Wavelets (New York: Academic)Cook C M, Thomas A W and Prato F S 2004 Resting EEG is affected by exposure to a pulsed ELF magnetic field
Bioelectromagnetics 25 196Dumsky D V 2005 Application of wavelet analysis to study signal structure PhD Thesis Saratov State University,
Saratov (in Russian)Edwards R and Beuter A 1999 Indexes for identification of abnormal tremor using computer tremor evaluation systems
IEEE Trans. Biomed. Eng. 46 895Elble R J and Koller W C 1990 Tremor (London: Johns Hopkins University Press)Gandhi O P, Kang G, Wu D and Lazzi G 2001 Currents induced in anatomic models of the human for uniform and
nonuniform power frequency magnetic fields Bioelectromagnetics 22 112Gauger J R 1985 Household appliance magnetic field survey IEEE Trans. Power Appar. Syst. 104 9
Magnetic field effects on physiological tremor 333
Grossman A and Morlet J 1984 Decomposition of Hardy functions into square integrable wavelets of constant shapeSIAM J. Math. Anal. 15 723
Legros A and Beuter A 2005 Effect of a low intensity magnetic field on human behavior Bioelectromagnetics 26 657Legros A and Beuter A 2006 Individual subject sensitivity to extremely low frequency magnetic field
Neurotoxicology 27 534Legros A, Gaillot P and Beuter A 2006 Transient effect of low intensity magnetic field on human motor behavior
Med. Eng. Phys. 28 827Mallat S G 1998 A Wavelet Tour of Signal Processing (San Diego: Academic)Maraun D and Kurths J 2004 Cross wavelet analysis: significance testing and pitfalls Nonlinear Process. Geophys.
11 505Marsh D J, Sosnovtseva O V, Pavlov A N, Yip K-P and Holstein-Rathlou N-H 2005 Frequency encoding in renal
blood flow regulation Am. J. Physiol. 288 R1160McAuley J H and Marsden C D 2000 Physiological and pathological tremors and rhythmic central motor control
Brain 123 1545Muzy J F, Bacry E and Arneodo A 1993 Multifractal formalism for fractal signals: the structure-function approach
versus the wavelet-transform modulus-maxima method Phys. Rev. E 47 875Muzy J F, Bacry E and Arneodo A 1994 The multifractal formalism revisited with wavelets Int. J. Bifurcation
Chaos 4 245Pascual-Leone A, Valls-Sole J, Toro C, Wassermann E M and Hallett M 1994 Resetting of essential tremor and
postural tremor in Parkinson’s disease with transcranial magnetic stimulation Muscle Nerve 17 800Pollok B, Muller K, Aschersleben G, Schmitz F, Schnitzler A and Prinz W 2003 Cortical activations associated with
auditorily paced finger tapping Neuroreport 14 247Rothwell J C 1998 Physiology and anatomy of possible oscillators in the central nervous system Mov. Disord. 13 24Schnitzler A, Timmermann L and Gross J 2006 Physiological and pathological oscillatory networks in the human
motor system J. Physiol. Paris 99 3Sosnovtseva O V, Pavlov A N, Mosekilde E, Holstein-Rathlou N-H and Marsh D J 2005 Double-wavelet approach
to studying the modulation properties of nonstationary multimode dynamics Physiol. Meas. 26 351Terzuolo C A and Bullock T H 1956 Measurement of imposed voltage gradient adequate to modulate neuronal firing
Proc. Natl Acad. Sci. 42 687Veneziano D, Moglen G E and Bras R L 1995 Multifractal analysis: pitfalls of standard procedures and alternatives
Phys. Rev. E 52 1387Wachs H and Boshes B 1961 Tremor studies in normals and in Parkinsonism Arch. Neurol. 4 66