Using Ultrasonic Levitation to Initiate and Track Charge Transfer
24
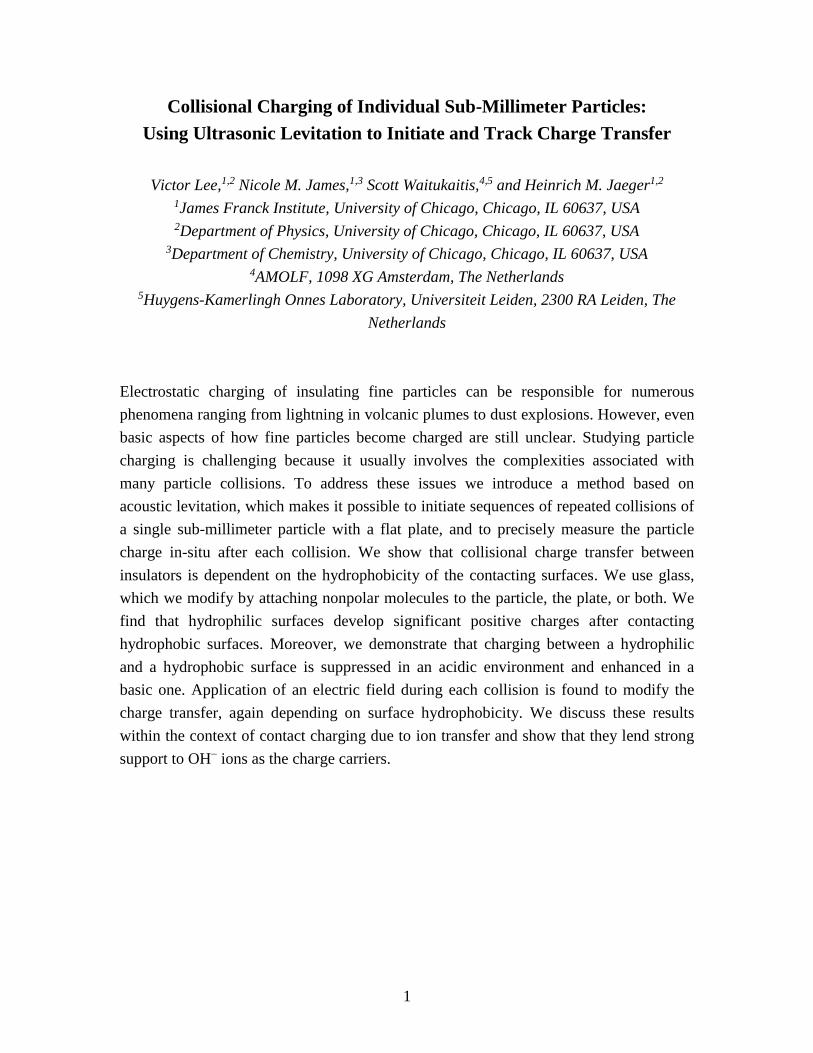
1 Collisional Charging of Individual Sub-Millimeter Particles: Using Ultrasonic Levitation to Initiate and Track Charge Transfer Victor Lee, 1,2 Nicole M. James, 1,3 Scott Waitukaitis, 4,5 and Heinrich M. Jaeger 1,2 1 James Franck Institute, University of Chicago, Chicago, IL 60637, USA 2 Department of Physics, University of Chicago, Chicago, IL 60637, USA 3 Department of Chemistry, University of Chicago, Chicago, IL 60637, USA 4 AMOLF, 1098 XG Amsterdam, The Netherlands 5 Huygens-Kamerlingh Onnes Laboratory, Universiteit Leiden, 2300 RA Leiden, The Netherlands Electrostatic charging of insulating fine particles can be responsible for numerous phenomena ranging from lightning in volcanic plumes to dust explosions. However, even basic aspects of how fine particles become charged are still unclear. Studying particle charging is challenging because it usually involves the complexities associated with many particle collisions. To address these issues we introduce a method based on acoustic levitation, which makes it possible to initiate sequences of repeated collisions of a single sub-millimeter particle with a flat plate, and to precisely measure the particle charge in-situ after each collision. We show that collisional charge transfer between insulators is dependent on the hydrophobicity of the contacting surfaces. We use glass, which we modify by attaching nonpolar molecules to the particle, the plate, or both. We find that hydrophilic surfaces develop significant positive charges after contacting hydrophobic surfaces. Moreover, we demonstrate that charging between a hydrophilic and a hydrophobic surface is suppressed in an acidic environment and enhanced in a basic one. Application of an electric field during each collision is found to modify the charge transfer, again depending on surface hydrophobicity. We discuss these results within the context of contact charging due to ion transfer and show that they lend strong support to OH − ions as the charge carriers.
-
Upload
khangminh22 -
Category
Documents
-
view
0 -
download
0
Transcript of Using Ultrasonic Levitation to Initiate and Track Charge Transfer
1
Collisional Charging of Individual Sub-Millimeter Particles:
Using Ultrasonic Levitation to Initiate and Track Charge Transfer
Victor Lee,1,2 Nicole M. James,1,3 Scott Waitukaitis,4,5 and Heinrich M. Jaeger1,2 1James Franck Institute, University of Chicago, Chicago, IL 60637, USA 2Department of Physics, University of Chicago, Chicago, IL 60637, USA
3Department of Chemistry, University of Chicago, Chicago, IL 60637, USA 4AMOLF, 1098 XG Amsterdam, The Netherlands
5Huygens-Kamerlingh Onnes Laboratory, Universiteit Leiden, 2300 RA Leiden, The
Netherlands
Electrostatic charging of insulating fine particles can be responsible for numerous
phenomena ranging from lightning in volcanic plumes to dust explosions. However, even
basic aspects of how fine particles become charged are still unclear. Studying particle
charging is challenging because it usually involves the complexities associated with
many particle collisions. To address these issues we introduce a method based on
acoustic levitation, which makes it possible to initiate sequences of repeated collisions of
a single sub-millimeter particle with a flat plate, and to precisely measure the particle
charge in-situ after each collision. We show that collisional charge transfer between
insulators is dependent on the hydrophobicity of the contacting surfaces. We use glass,
which we modify by attaching nonpolar molecules to the particle, the plate, or both. We
find that hydrophilic surfaces develop significant positive charges after contacting
hydrophobic surfaces. Moreover, we demonstrate that charging between a hydrophilic
and a hydrophobic surface is suppressed in an acidic environment and enhanced in a
basic one. Application of an electric field during each collision is found to modify the
charge transfer, again depending on surface hydrophobicity. We discuss these results
within the context of contact charging due to ion transfer and show that they lend strong
support to OH− ions as the charge carriers.
2
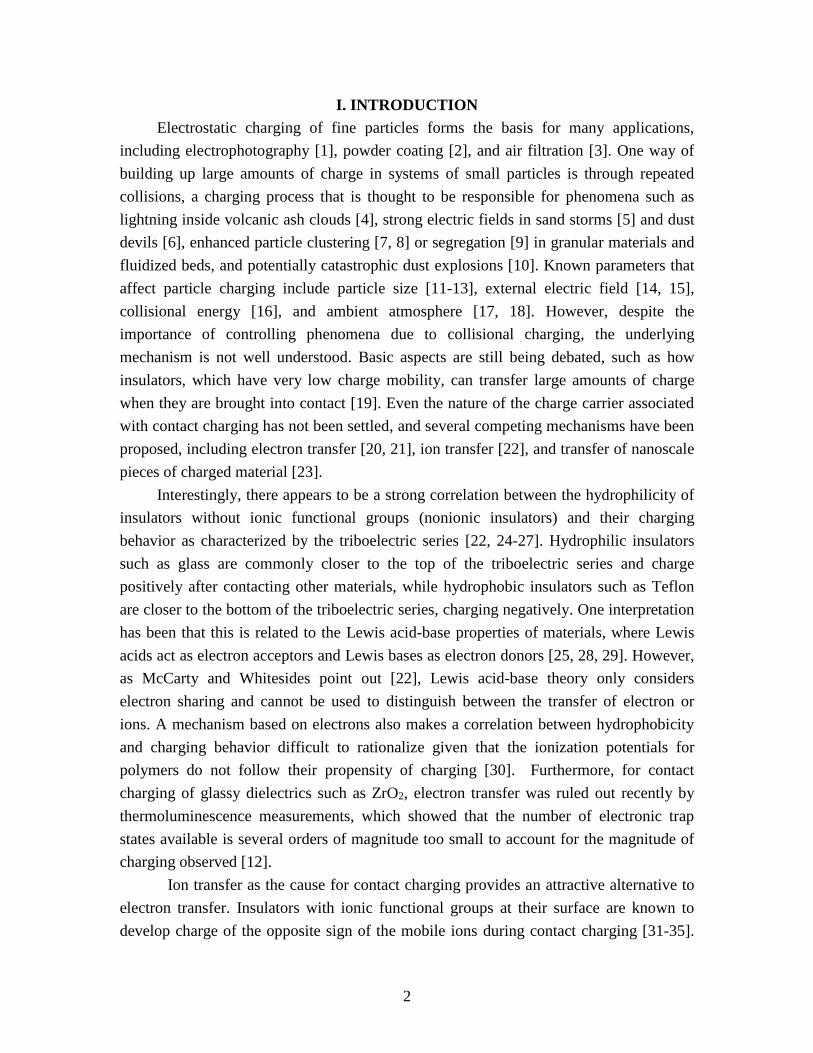
I. INTRODUCTION
Electrostatic charging of fine particles forms the basis for many applications,
including electrophotography [1], powder coating [2], and air filtration [3]. One way of
building up large amounts of charge in systems of small particles is through repeated
collisions, a charging process that is thought to be responsible for phenomena such as
lightning inside volcanic ash clouds [4], strong electric fields in sand storms [5] and dust
devils [6], enhanced particle clustering [7, 8] or segregation [9] in granular materials and
fluidized beds, and potentially catastrophic dust explosions [10]. Known parameters that
affect particle charging include particle size [11-13], external electric field [14, 15],
collisional energy [16], and ambient atmosphere [17, 18]. However, despite the
importance of controlling phenomena due to collisional charging, the underlying
mechanism is not well understood. Basic aspects are still being debated, such as how
insulators, which have very low charge mobility, can transfer large amounts of charge
when they are brought into contact [19]. Even the nature of the charge carrier associated
with contact charging has not been settled, and several competing mechanisms have been
proposed, including electron transfer [20, 21], ion transfer [22], and transfer of nanoscale
pieces of charged material [23].
Interestingly, there appears to be a strong correlation between the hydrophilicity of
insulators without ionic functional groups (nonionic insulators) and their charging
behavior as characterized by the triboelectric series [22, 24-27]. Hydrophilic insulators
such as glass are commonly closer to the top of the triboelectric series and charge
positively after contacting other materials, while hydrophobic insulators such as Teflon
are closer to the bottom of the triboelectric series, charging negatively. One interpretation
has been that this is related to the Lewis acid-base properties of materials, where Lewis
acids act as electron acceptors and Lewis bases as electron donors [25, 28, 29]. However,
as McCarty and Whitesides point out [22], Lewis acid-base theory only considers
electron sharing and cannot be used to distinguish between the transfer of electron or
ions. A mechanism based on electrons also makes a correlation between hydrophobicity
and charging behavior difficult to rationalize given that the ionization potentials for
polymers do not follow their propensity of charging [30]. Furthermore, for contact
charging of glassy dielectrics such as ZrO2, electron transfer was ruled out recently by
thermoluminescence measurements, which showed that the number of electronic trap
states available is several orders of magnitude too small to account for the magnitude of
charging observed [12].
Ion transfer as the cause for contact charging provides an attractive alternative to
electron transfer. Insulators with ionic functional groups at their surface are known to
develop charge of the opposite sign of the mobile ions during contact charging [31-35].

3
For nonionic insulators, it has been suggested that adsorbed water may be responsible
[22]. Under ambient conditions, it only takes microseconds for water molecules to be
adsorbed on any surface [36], and even under high vacuum it requires extensive baking to
remove adsorbed water [37]. Water adsorbed from the ambient atmosphere has been
found to enhance contact charging of insulators at relative humidity (RH) up to at least
40% [31, 38] (at high RH, contact charging can decrease due to higher surface
conductivity, which allows charge to leak to ground [18, 31, 39]). Electrokinetic
measurements and x-ray photoelectron spectroscopy revealed the accumulation of OH−
ions at solid-water interfaces in hydrophobic insulators [40], hydrophilic self-assembled
monolayers [41, 42], ice [43], and metals [44]. Recently, Burgo et al. demonstrated that
water is positioned at the top of the triboelectric series [45]; that is, water develops
positive charge after flowing over any other solid surface. Experiments on flow
electrification of water by other research groups also showed the same direction of charge
transfer [46-49]. All of these results can be ascribed to the adsorption of OH− ions at
solid-water interfaces, which causes positive charging of water and negative charging of
solids.
This points to a scenario whereby contact between two insulating solids could
lead to a net charge transfer via OH− ions whenever there is an asymmetry in the
coverage of absorbed water on the contacting surfaces. This will happen most likely
when a hydrophilic and a hydrophobic surface come into contact. A particularly
interesting consequence of these ideas is that they can provide new insights regarding the
contact charging of objects made from the same material [11-13, 19, 20, 50], i.e., in a
situation where the triboelectric series has no predictive power.
Here we test this scenario for collisional contact charging of fine particles, where
systematic, quantitative experiments have been notoriously difficult. To date, the most
common technique for studying the charging of fine particles uses Faraday cup devices
[9, 51, 52]. These devices involve large numbers of particles, which, as a result of
multiple, uncontrolled particle-particle and particle-wall collisions, hinders the
interpretation of the results. While there are experimental techniques for making precise
measurements of the impact charging of a single sub-millimeter particle [53-56], what
has been lacking is a method for tracking the evolution of the charging process over
repeated, highly controlled collisions.
In this paper, we introduce such method by combining high-speed videography
and acoustic levitation [57-61]—a contact-free and material-independent technique of
object manipulation. This enables us to create automated, computer-controlled collision
sequences followed by in situ charge measurement after each collision. As a result, we
can narrow down the complex problem of many-particle collisional charging to following
4
repeated collisions of a single particle with a target plate. In our experiments we change
the hydrophobicity of the particle and plate surfaces, vary the ambient gas environment,
and apply external electric fields during particle-plate collisions. Our findings provide
strong evidence that hydrophilicity plays a key role in contact charging and they offer
new insights into how contact charging of fine particles can be controlled.
II. EXPERIMENTAL SETUP AND PROCEDURE
The basic idea for our setup is to create with ultrasound a switchable particle trap
and to extract the particle’s charge from its resonant oscillatory motion inside that trap. In
a typical measurement sequence, the particle is initially suspended above a flat plate by
acoustic levitation. Next, an oscillating electric field is applied and the particle charge q is
extracted from the response to the field. To initiate a collision, the acoustic trap is then
briefly switched off. This causes the particle to drop due to gravity, collide with the target
plate below, and bounce up. By appropriately timing when the acoustic field is turned
back on (~12 ms in our experiments) the particle becomes trapped again, ensuring that
there was precisely one collision per drop (see SI movie). After each drop, the AC
electric field is applied to extract q. This sequence is repeated under computer control
over 100s or 1,000s of collision events, enabling precise tracking of collisional charge
transfer.
The experimental setup is shown in Fig. 1(a). A function generator and a high
voltage amplifier provided the driving voltage signal for a transducer (Hesentec Rank E)
that generated ultrasound at 146.5 kHz. A flat target plate underneath the transducer acted
as a reflector. Setting the distance between the transducer and the sound-reflecting target
plate to half the wavelength of sound (λ/2) created a standing wave with a single pressure
node at λ/4, in which a sub-millimeter particle could be trapped. To also confine the
particle horizontally, we machined a small cylindrical depression (800 μm diameter, 125
μm deep) into the flat surface of the transducer and adjusted the distance between the
bottom of the depression and the target plate to match λ/2 (≈ 1.2 mm).
For a spherical particle with radius R much smaller than λ (in our experiments R ≈
100 µm and thus R/λ < 0.1), the acoustic potential U derived by Gor’kov is [62]
𝑈 = 2𝜋𝑅3(⟨𝑝2⟩
3𝜌𝑐2−
𝜌⟨𝑣2⟩
2), (1)
where ρ is the density of the ambient gas, c is the speed of sound, and ⟨𝑝2⟩ and ⟨𝑣2⟩ are
the mean square amplitudes of the acoustic pressure and velocity of the gas. To obtain
expressions for the latter two, we start from the acoustic velocity potential for a standing
sound wave along the vertical axis (y-axis), given by [63]
𝜙 = −𝑣0
𝑘cos𝑘𝑦 sin𝜔𝑡, (2)
where 𝑣0 is the maximum acoustic velocity, k = 2π/λ is the wave number, and ω = kc is
5
the angular frequency of sound. This leads to acoustic pressure and velocity for the
standing sound wave along the y-axis according to
𝑝 = −𝜌𝜕𝜙
𝜕𝑥= 𝜌𝑐𝑣0 cos 𝑘𝑦 cos𝜔𝑡 (3)
and
𝑣 =𝜕𝜙
𝜕𝑦= 𝑣0 sin𝑘𝑦 sin𝜔𝑡. (4)
Inserting Eqs. (3) and (4) into (1) we obtain U. Figure 1(b) shows the dimensionless
acoustic potential �̃� = 𝑈/(𝜋𝑅3𝜌𝑣02), simulated with COMSOL Multiphysics 5.2. The
particle can be trapped at the vertical equilibrium point, where gravity is balanced by the
acoustic radiation force
𝐹𝑎𝑦 = −𝜕𝑈
𝜕𝑦=
5
6𝜋𝑅3𝜌𝑣0
2𝑘 sin2𝑘𝑦. (5)
To obtain the net charge q of a levitated particle, we applied a vertical electric field
across the gap between an aluminum block underneath the target plate and the grounded
transducer (Fig. 1(a)). Via a computer-controlled relay, a large DC field was applied to
extract the particle’s charge polarity by observing its up or down movement with the
camera, and an AC field was applied (using a signal generator and an amplifier) to drive
the particle into resonance. From the measured resonance frequency and amplitude at
resonance we then extracted the charge magnitude |q| by a numerical procedure, as
described next.
The equation of motion of the particle along the y-axis can be expressed as
𝑚�̈� + 2𝑚𝛽�̇� = 𝐹𝑎𝑦 −𝑚𝑔 + |𝑞|𝐸0 sin(𝜔𝐸(𝑡)𝑡), (6)
where m is the particle mass, 2mβẏ is the air drag on the particle, mg is the force of
gravity, and 𝐸0 and 𝜔𝐸 are the amplitude and angular frequency of the applied AC
electric field.
For a given particle, we computed m from the material density and the particle size
as measured with an optical microscope (Fig. 1(c)). The parameter β was obtained from
fitting the envelope of the free vertical oscillation of the particle after it was picked up
from the target plate by applying a strong acoustic radiation force in the absence of any
E-field (Fig. 1(d), β ≈ 2.4 s-1 for the example shown). The field strength E0 was obtained
from modeling with COMSOL the electric field between the aluminum block and the
transducer, including the small depression in the transducer surface and the presence of
the glass target plate. Fay is provided by Eq. (5) and can be expressed as
𝐹𝑎𝑦 =5
6𝜋𝑅3𝜌𝑣0
2𝑘 sin (4𝜋𝑦
𝜆) ≡ 𝐹𝑎0 sin(
4𝜋𝑦
𝜆). (7)
As a function of the parameters |q| and Fa0, Eq. (6) can be solved numerically to
obtain simulated particle trajectories ys(t). Each such trajectory is characterized by two
features, a resonance frequency and an amplitude at resonance, that can directly be
compared to experiment. We then treated |q| and Fa0 as variables and used a Nelder–
Mead simplex algorithm [64] to minimize the squared relative error
6
𝛿 = (𝐴'max−𝐴max
𝐴max)2+ (
𝑓'max−𝑓max
𝑓max)2 (8)
between simulated (primed) and experimentally measured (unprimed) amplitudes and
frequencies.
To find these amplitudes and frequencies, a linear frequency sweep was applied,
starting at some frequency 𝑓𝑖. This means 𝜔𝐸(𝑡) = 2𝜋(𝛼𝑡/2 + 𝑓𝑖), where α is the sweep
rate. From the experimentally measured trajectories and their simulated counterparts the
resonance frequencies and amplitudes were then extracted via a Hilbert transform [65]
(see Appendix B). The minimization was terminated when δ became less than 10-7. This
provided a well-defined, automated path that led from experimental trajectory data to the
charge magnitude |q|.
The close agreement between experimental and simulated data is shown in
Figs.1(e)&(f). The figures give an example of y(t) in response to an AC electric field that
was frequency-swept from 50 Hz to 150 Hz in 15 seconds. The particle exhibited a
resonance with Amax ≈ 52 μm at fmax ≈ 93 Hz.
One particular advantage of our method is that by including a time-dependent 𝜔𝐸
in Eq. (6), experimental frequency sweeps can be fast and |q| can still be extracted
reliably, even if in those cases the apparent resonance frequency and associated
maximum amplitude have shifted because the particle did not have sufficient time to
equilibrate. This is shown in Fig. 1(g).
Based on Eq. (6), |q| scales as m/E0. As a result, the uncertainty |q| of the
measured charge magnitude becomes smaller with larger E0. Our experiments used AC
electric fields in the range 3.3 × 10³ V/m < E0 < 1.6 × 10⁵ V/m, giving a charge
uncertainty 1 × 10³ e ≲ |q| ≲ 6.5 × 10⁴ e, in units of the elementary charge e = 1.6 ×
10-19 C. Our detection limit for the particle charge arises from the difficulty of measuring
Amax and fmax when the particle oscillation amplitude falls below ~3 μm.
All experiments were conducted at 40% RH inside a Plexiglas chamber filled with
an adjustable mixture of dry nitrogen gas and nitrogen gas saturated with water vapor
(unless otherwise stated). The levitated particle was imaged from the side by a high-speed
video camera (Phantom v12; 1000 frames per second) using backlight illumination. The
particle position was tracked with the algorithm developed by Crocker and Grier [66].
The measurements reported here focus on the specific case were both the particle
(Fig. 1(c)) and the target plate were borosilicate glass. This material is naturally
hydrophilic due to polar -OH groups at its surface. This is shown by contact angle
measurements (Fig. 2(a)). To investigate the effect of hydrophobicity on particle
charging, we made glass particles or glass plates hydrophobic by attaching nonpolar
methyl (-CH3) groups via silanization (see Appendix A for details on sample
preparation).

7
III. RESULTS AND DISCUSSION
A. Charging of hydrophilic and hydrophobic particles
In Fig. 2(b), we plot the evolution of the net charge q on a levitated particle, after it
has collided with the target plate N times. For a hydrophilic glass particle colliding with a
hydrophobic glass plate (red trace), we find that, for more than 500 successive collisions,
the particle steadily accumulates positive charge at a constant rate dq/dN ≈ +6600
e/collision. If the conditions are inverted and a hydrophobic glass particle collides with a
hydrophilic plate (blue trace), we find that the particle accumulates negative charge at a
rate dq/dN ≈ −6400 e/collision, i.e., the amount of charge transferred is similar but in the
opposite direction. For contact between similar surfaces (hydrophilic particle vs.
hydrophilic plate and hydrophobic particle vs. hydrophobic plate), charging is very much
suppressed (green and black traces). In these experiments the number of collisions N was
limited by the charge magnitude: when the charge reached |q| ≈ 4 × 10⁶ e, the attractive
electrostatic force between the particle and the target plate became comparable to the
acoustic lifting force, and after colliding the particle stuck to the plate.
Taken together, these data show clearly that collisional contacts drive hydrophilic
glass surfaces positive and their hydrophobic counterparts negative. To explain our
results, we start from the suggestion by McCarty and Whitesides that contact charging
between nonionic insulators very generally might be due to the transfer of OH− ions from
molecularly thin layers of water adsorbed on the surfaces at ambient conditions [22]. An
important point is that such layers do not form a continuous film but instead break up into
islands or patches, even on a hydrophilic material like atomically flat mica [67]. At 40%
RH the surface coverage with water was found to be only ~50% on mica, with water
patches ranging in spatial extent from tens of nanometers to over a micron, and even at
90% RH incomplete coverage was observed. A second important point is that negative
charge accumulates at the interface of a water layer with a hydrophobic surface. While
many details of the configuration of aqueous ions at surfaces are still not fully understood
and various mechanisms supporting the observed negative charge are under debate [68-
70], molecular-dynamics simulations have shown that OH− ions tend to be more localized
at the interface with a hydrophobic surface, while H+ ions are more mobile and can thus
diffuse more readily away [71]. Alternatively, an excess of OH− ions at such interface has
been ascribed to enhanced autolysis of interfacial water molecules [69, 72, 73].
Based on this propensity for OH− ions to accumulate at hydrophobic interfaces,
we suggest a possible scenario for the charge transfer between nonionic insulators with
different hydrophobicity and thus different amounts of adsorbed water. This is sketched
in Fig. 2(c). When an adsorbed water island (wet patch) on one surface contacts an area

8
without water molecules (dry patch) on another surface, OH− ions from the wet patch
preferentially accumulate at the interface between water and dry patch. When the contact
is broken (e.g., at the end of a collision), the greater affinity of OH− for the interface
together with the larger mobility of H+ then implies that there is a high likelihood that
OH− is left behind (together with some neutral water). This leads to negative charge
transfer from wet to dry patch after separation.
This scenario is consistent with recent experiments, which found that solid
materials tend to become negatively charged after contacting water [45]. For hydrophilic
insulators, water molecules are adsorbed from the atmospheric moisture due to the
formation of hydrogen bonds [74]. Although hydrophobic insulators can still adsorb
water due to ubiquitous dispersion forces [74, 75], these forces are smaller than hydrogen
bonds, which can lead to larger dry patches on a hydrophobic surface. A hydrophilic
surface has the larger amount of adsorbed water and therefore, after separation, it leaves a
net negative charge on the hydrophobic surface. Another factor may be that a
hydrophobic insulator can have a higher affinity for OH− ions, leading to more OH−
adsorption on the hydrophobic surface. This is based on electrokinetic studies, which find
that the zeta potential is generally more negative with increasing hydrophobicity [43, 76,
77].
Our scenario implies that the net charge transfer is determined by the difference in
coverage of water islands between the two contacting surfaces and by the affinities of
OH− and H+ ions for different materials. An immediate consequence is that two
contacting surfaces of similar hydrophobicity or hydrophilicity, with their statistically
similar coverage of water patches, should exhibit a greatly reduced net charge transfer, as
already seen in Fig. 2(b).
In fact, at these low charging rates, subtle differences in material fabrication,
preparation or handling become apparent. Figure 2(d) shows different trials of charge
transfer measurements for a hydrophilic glass particle colliding with a hydrophilic glass
plate. We observe both directions of charge transfer, at charging rate from dq/dN = −460
to 900 e/collision. As expected, the charging rate is even smaller for a hydrophobic
particle colliding with a hydrophobic glass plate, with dq/dN from −26 to 80 e/collision
(Fig. 2(e)), because fewer wet patches, and thus fewer transferable ions, are available.
In situ contact charging measurements by other research groups imply that the
surface charge should eventually saturate with N once the transferable ions have been
depleted, or should exhibit rapid discharge events when the charge per unit surface area
has become sufficiently large [33, 50, 78]. By contrast, the results in Fig. 2 exhibit no
sign of charge saturation up to |q| = 4 × 10⁶ e. This is explained by the fact that the
particles rotate while trapped and oscillated [79]. Therefore, different spots of the particle
9
contact the target plate during successive collisions. With a maximum contact area Ac
during particle collisions of ~20 μm2 in our experiments (Appendix C) and a total particle
surface area of ~1.3 × 105 μm2, we estimate that it would take, on average, over 7,000
collisions until the same patch is involved in a collision for the second time. The highly
linear q(N) dependence we found in all cases thus demonstrates that any wet and dry
patches must have been much smaller than 20 μm2, so that the particle surfaces appeared
homogeneous when averaged over the contact area.
B. Particle charging in acidic/basic atmospheres
If the contact charging is indeed due to OH− ions, then changing the chemical
composition of the ambient atmosphere, which will alter the number of available OH−
ions in the adsorbed water layers, should influence the amount of charge transferred per
collision. To test this, we changed the ambient atmosphere by introducing acidic or basic
vapors to the experimental chamber, similar to Ref. [38]. These vapors were prepared by
bubbling nitrogen gas into 1M aqueous solutions of acetic acid or ammonia, respectively.
The chamber atmosphere was stabilized for two hours before each experiment.
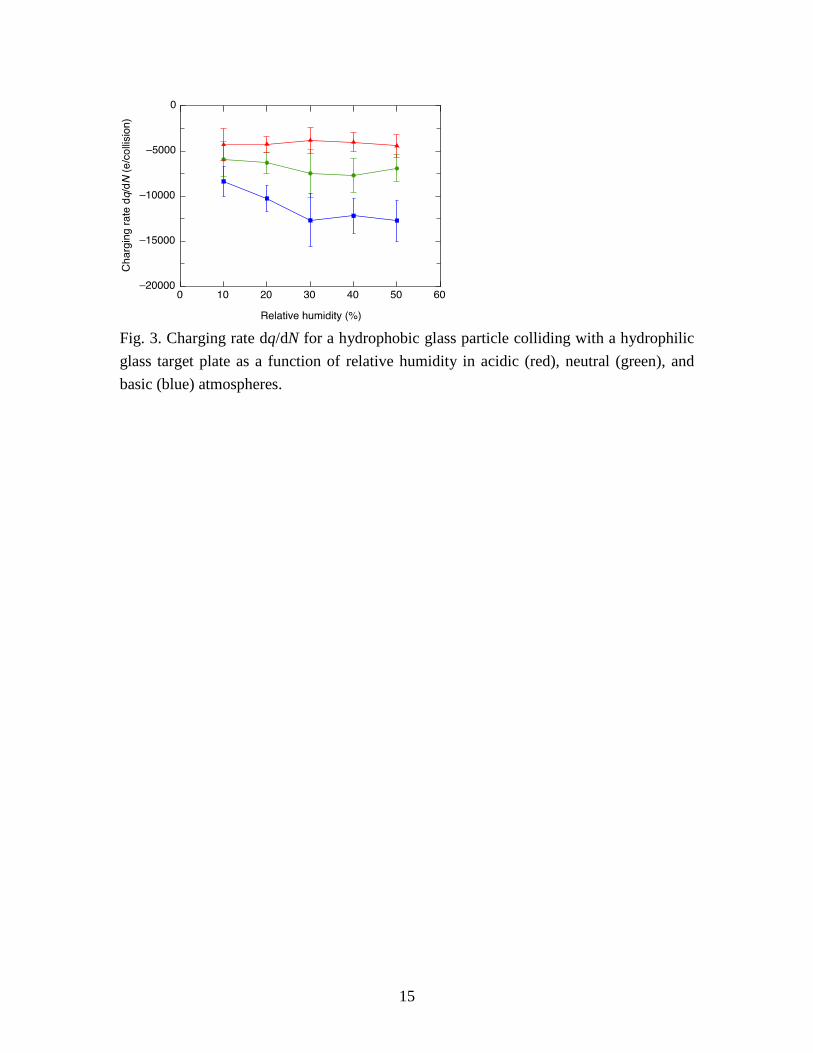
In Fig. 3, we plot the charging rate of a hydrophobic particle colliding with a
hydrophilic glass target plate as a function of relative humidity in acidic, basic, and
neutral environments. Over the relative humidity range studied (10-50% RH), the
negative charging rate of the particle in a neutral atmosphere (Fig. 2(b)) is further
enhanced in a basic atmosphere, while it is suppressed in an acidic atmosphere. This
makes sense in light of the electrokinetic studies, which showed that OH− and H+ ions
have a much stronger affinity for hydrophobic surfaces than other ions [40, 41, 43, 76],
whereas the acetate and ammonium counter-ions behave indifferent [80-82]. Thus, the
enhancement and suppression of the charging rate in basic and acidic environments can
be attributed to different numbers of OH− ions available in the adsorbed water, which are
the ions predominantly transferred from a hydrophilic to a hydrophobic surface during
contact.
Our experiments could only reach RH values around 50%. Controlled levitation-
collision sequences become difficult to perform with larger humidity due to the
increasingly strong capillary forces between particle and target plate. While the data in
Fig. 3 stays relatively flat up to 50% RH, larger humidity eventually will let charge leak
away by increasing the conductivity. Previous studies showed, however, that charging of
hydrophobic particles does not decrease until 60 % RH is reached [18, 39].
C. Particle charging controlled by electric fields
Particle charging induced by electric fields has been observed previously [14, 15],
10
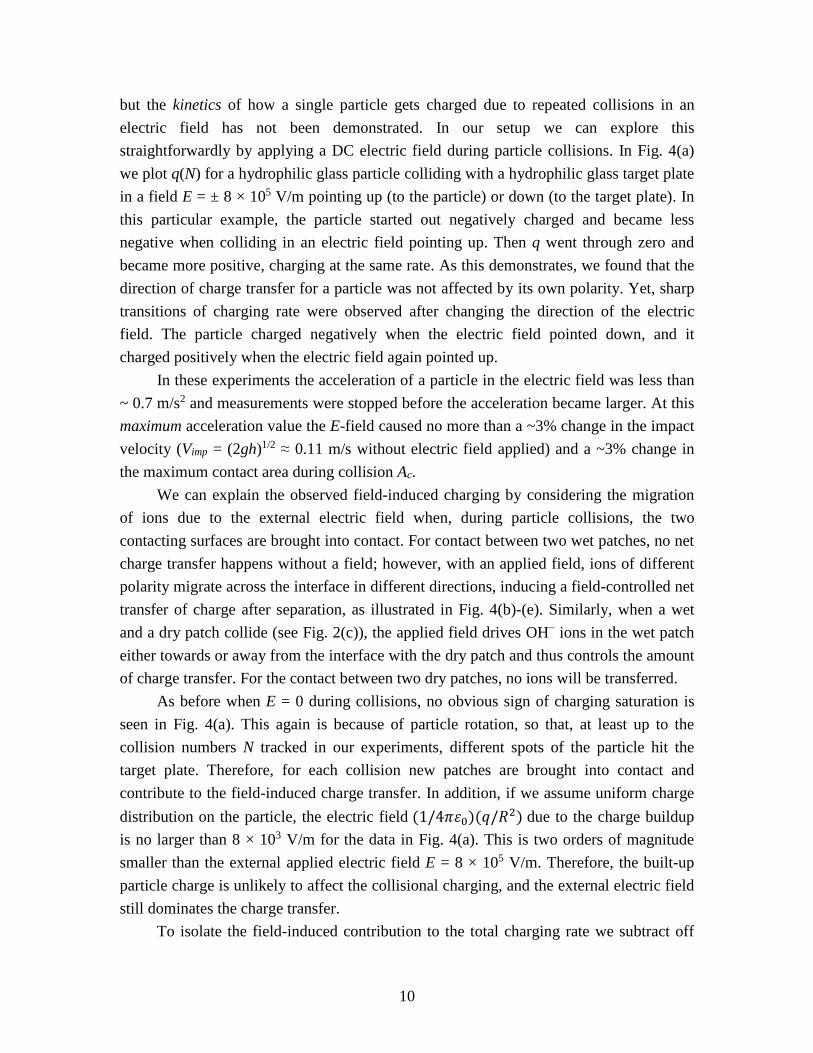
but the kinetics of how a single particle gets charged due to repeated collisions in an
electric field has not been demonstrated. In our setup we can explore this
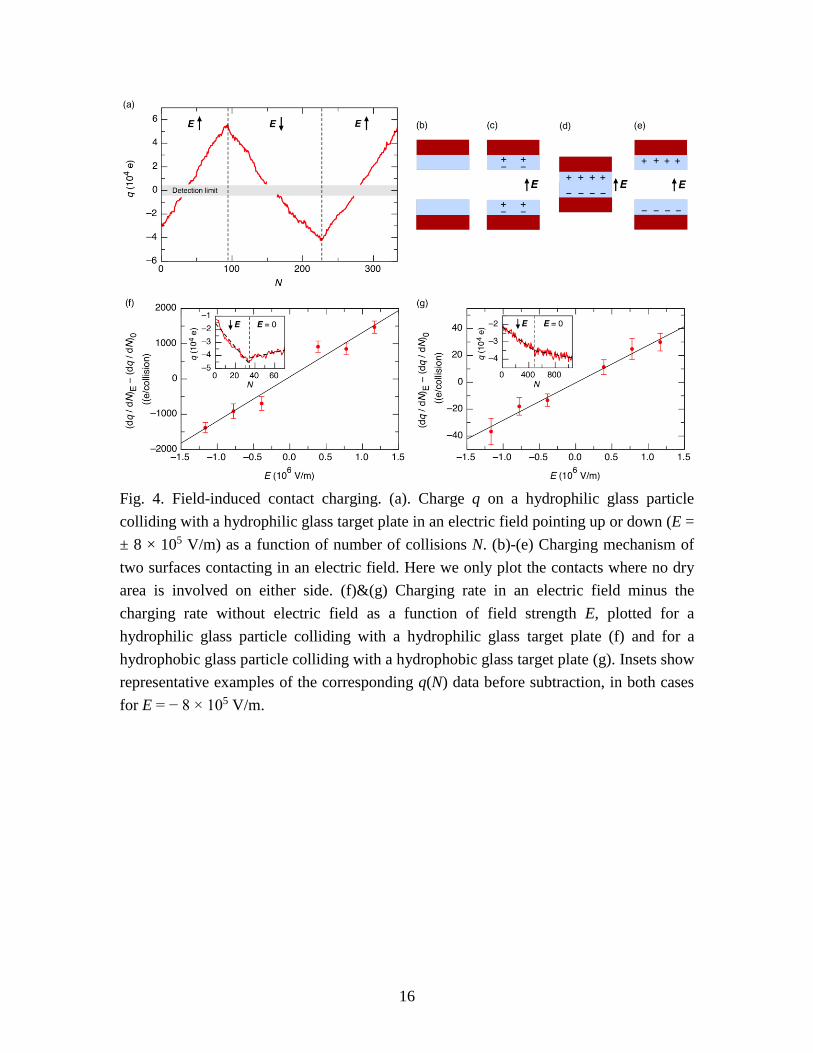
straightforwardly by applying a DC electric field during particle collisions. In Fig. 4(a)
we plot q(N) for a hydrophilic glass particle colliding with a hydrophilic glass target plate
in a field E = ± 8 × 10⁵ V/m pointing up (to the particle) or down (to the target plate). In
this particular example, the particle started out negatively charged and became less
negative when colliding in an electric field pointing up. Then q went through zero and
became more positive, charging at the same rate. As this demonstrates, we found that the
direction of charge transfer for a particle was not affected by its own polarity. Yet, sharp
transitions of charging rate were observed after changing the direction of the electric
field. The particle charged negatively when the electric field pointed down, and it
charged positively when the electric field again pointed up.
In these experiments the acceleration of a particle in the electric field was less than
~ 0.7 m/s2 and measurements were stopped before the acceleration became larger. At this
maximum acceleration value the E-field caused no more than a ~3% change in the impact
velocity (Vimp = (2gh)1/2 ≈ 0.11 m/s without electric field applied) and a ~3% change in
the maximum contact area during collision Ac.
We can explain the observed field-induced charging by considering the migration
of ions due to the external electric field when, during particle collisions, the two
contacting surfaces are brought into contact. For contact between two wet patches, no net
charge transfer happens without a field; however, with an applied field, ions of different
polarity migrate across the interface in different directions, inducing a field-controlled net
transfer of charge after separation, as illustrated in Fig. 4(b)-(e). Similarly, when a wet
and a dry patch collide (see Fig. 2(c)), the applied field drives OH− ions in the wet patch
either towards or away from the interface with the dry patch and thus controls the amount
of charge transfer. For the contact between two dry patches, no ions will be transferred.
As before when E = 0 during collisions, no obvious sign of charging saturation is
seen in Fig. 4(a). This again is because of particle rotation, so that, at least up to the
collision numbers N tracked in our experiments, different spots of the particle hit the
target plate. Therefore, for each collision new patches are brought into contact and
contribute to the field-induced charge transfer. In addition, if we assume uniform charge
distribution on the particle, the electric field (1/4𝜋휀0)(𝑞/𝑅2) due to the charge buildup
is no larger than 8 × 10³ V/m for the data in Fig. 4(a). This is two orders of magnitude
smaller than the external applied electric field E = 8 × 10⁵ V/m. Therefore, the built-up
particle charge is unlikely to affect the collisional charging, and the external electric field
still dominates the charge transfer.
To isolate the field-induced contribution to the total charging rate we subtract off
11
the charging rate measured in the absence of the field, which can be zero, positive, or
negative (Fig. 2(b)) and can even depend on subtle differences in the average number of
wet and dry patches (Fig. 2(d)). Figure 4(f) shows (dq/dN)E − (dq/dN)0 versus E for a
hydrophilic glass particle colliding with a hydrophilic glass target plate, where (dq/dN)E
is the rate for a particle colliding in a DC field, and (dq/dN)0 is the rate for the same
particle and target plate without the field. A linear relationship between is observed, with
slope 1.25 × 10⁻³ ± 8 × 10⁻⁵ (e/collision)/(V/m).
Along the same lines we expect significantly reduced coverage for a hydrophobic
glass particle colliding with a hydrophobic glass target plate in a DC electric field.
Indeed, the slope of the linear fit of (dq/dN)E − (dq/dN)0 vs. E is only 2.8 × 10⁻⁵ ± 3 × 10⁻⁶
(e/collision)/(V/m) (Fig. 4(g)), a reduction of nearly two orders of magnitude compared
to the case of hydrophilic glass surfaces.
IV. CONCLUSIONS
We showed for the case of glass particles colliding with a glass plate that contact
charging is controlled by the hydrophobicity of the contacting surfaces: hydrophilic
surfaces accumulate positive charge, whereas hydrophobic surfaces obtain negative
charge. Contact charging between a hydrophilic and a hydrophobic surface is suppressed
(enhanced) in an acidic (basic) atmosphere. We further showed that the application of an
external electric field during particle collisions can be used to control the direction of
charge transfer. These findings provide strong evidence in support of a contact charging
mechanism for nonionic insulators that relies on the transfer of OH− ions. Presumably
these ions are transferred from molecularly thin patches of water on one of the colliding
surfaces to a dry patch on the other. In this scenario, hydrophilic surfaces simply contain
more wet patches than hydrophobic surfaces do, thereby increasing the likelihood of
donating OH− ions. This also can explain why E-field-induced charging is significantly
larger for collisions between hydrophilic surfaces than between hydrophobic ones.
Furthermore, this scenario provides an explanation for the collisional charging of
insulating particles comprised of the very same material, where there are too few
electrons available to act as the charge carriers. Adsorbed water, by contrast, provides a
plentiful source of OH− ions, which means that larger particles can donate more OH− than
smaller particles and thus tend to charge positively.
The acoustic-levitation-based technique demonstrated here can be extended
straightforwardly to other particle types and sizes as well as particle-plate material
combinations. The only significant limitation is that the particle should be shaped such
that after each collision it bounces upward vertically and can be recaptured by the
acoustic field. In principle, it should also be possible to vary the collision velocity by
12
modulating the acoustic field or by accelerating (or decelerating) the particle with an
appropriately chosen E-field pulse prior to each collision.
Acknowledgements
We would like to thank Thiago Burgo, Troy Shinbrot, Andrei Tokmakoff, and Tom
Witten for insightful discussions. This work was supported by the National Science
Foundation under grant DMR-1309611. N.J. acknowledges support by the Chicago
MRSEC through NSF DMR-1420709, which also provided the high-speed camera
through its shared experimental facilities.
13
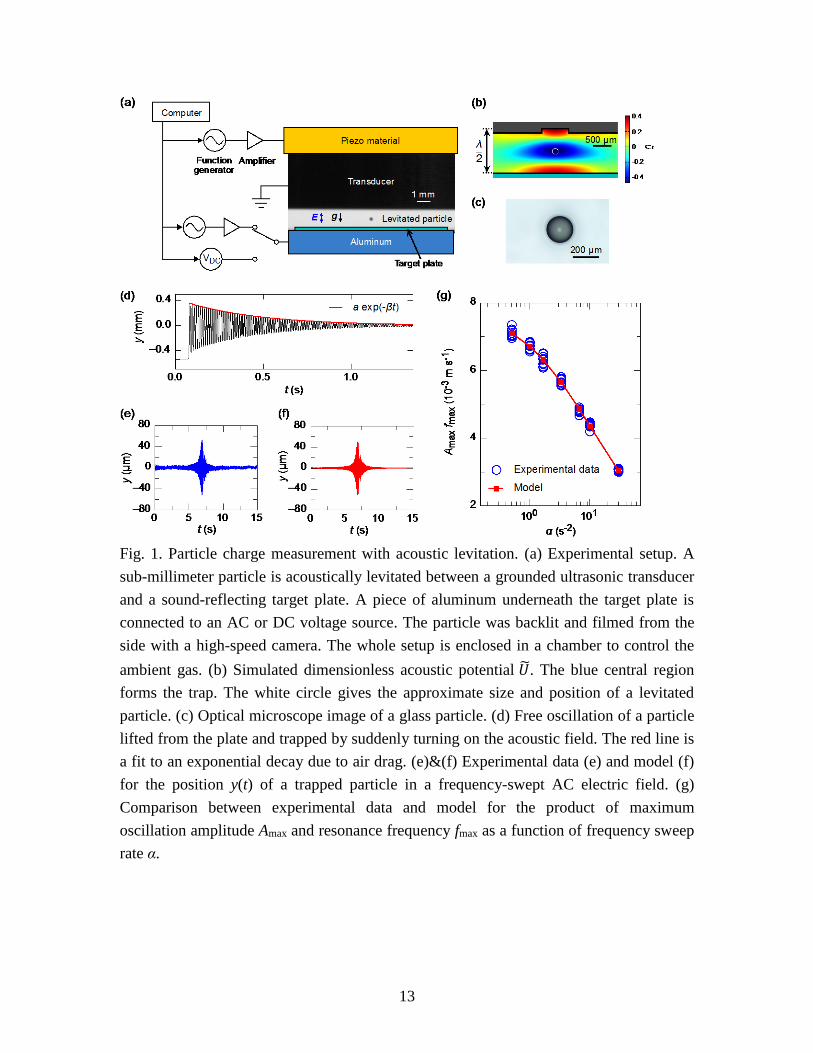
Fig. 1. Particle charge measurement with acoustic levitation. (a) Experimental setup. A
sub-millimeter particle is acoustically levitated between a grounded ultrasonic transducer
and a sound-reflecting target plate. A piece of aluminum underneath the target plate is
connected to an AC or DC voltage source. The particle was backlit and filmed from the
side with a high-speed camera. The whole setup is enclosed in a chamber to control the
ambient gas. (b) Simulated dimensionless acoustic potential �̃�. The blue central region
forms the trap. The white circle gives the approximate size and position of a levitated
particle. (c) Optical microscope image of a glass particle. (d) Free oscillation of a particle
lifted from the plate and trapped by suddenly turning on the acoustic field. The red line is
a fit to an exponential decay due to air drag. (e)&(f) Experimental data (e) and model (f)
for the position y(t) of a trapped particle in a frequency-swept AC electric field. (g)
Comparison between experimental data and model for the product of maximum
oscillation amplitude Amax and resonance frequency fmax as a function of frequency sweep
rate α.

14
Fig. 2. Charge transfer between glass surfaces. (a) Glass surface silanized with
trimethylchlorosilane (CH3)3SiCl. The contact angles between a water drop and the glass
plate before and after silanization were 50 ± 3° and 110 ± 3°, respectively. (b) Examples
of the evolution of particle charge q with the number of particle-plate collisions N for a
hydrophilic particle against a hydrophobic plate (red), hydrophobic particle against
hydrophilic plate (blue), hydrophilic particle against hydrophilic plate (black), and
hydrophobic particle against hydrophobic plate (green). In the experiments corresponding
to the red and blue curves, we used a lower amplitude of the AC electric field (3.3 × 10³
V/m) to prevent highly charged particles from colliding with the transducer or target plate
during the field-driven oscillations, which resulted in a higher statistical error of the
charge measurements. (c) Proposed mechanism of charge transfer between a wet patch
and a dry patch on two contacting surfaces. (d)&(e) Different trials showing q(N) for a
hydrophilic particle against a hydrophilic plate (d) and a hydrophobic particle against a
hydrophobic plate (e).
15
Fig. 3. Charging rate dq/dN for a hydrophobic glass particle colliding with a hydrophilic
glass target plate as a function of relative humidity in acidic (red), neutral (green), and
basic (blue) atmospheres.
16
Fig. 4. Field-induced contact charging. (a). Charge q on a hydrophilic glass particle
colliding with a hydrophilic glass target plate in an electric field pointing up or down (E =
± 8 × 10⁵ V/m) as a function of number of collisions N. (b)-(e) Charging mechanism of
two surfaces contacting in an electric field. Here we only plot the contacts where no dry
area is involved on either side. (f)&(g) Charging rate in an electric field minus the
charging rate without electric field as a function of field strength E, plotted for a
hydrophilic glass particle colliding with a hydrophilic glass target plate (f) and for a
hydrophobic glass particle colliding with a hydrophobic glass target plate (g). Insets show
representative examples of the corresponding q(N) data before subtraction, in both cases
for E = − 8 × 10⁵ V/m.
17
Appendix A: Sample preparation
Borosilicate glass particles (Cospheric; density ρp = 2200 kg/m3, diameter D =
204 ± 8 μm) and borosilicate glass target plates (Fisher Scientific, Catalog no. 12-542B
cover slides; 22 mm × 22 mm, 0.15 ± 0.02 mm thick) were cleaned in an ultrasonic bath
of acetone, ethanol, and DI water for one hour each, and dried in a vacuum chamber with
an oil-free pump. Hydrophobic glass particles and target plates were prepared by
silanizing hydrophilic substrates, adapting the method used by Burgo et al. [83]: glass
particles and cover slides were boiled in anhydrous ethanol for 2 hours and then
immersed in a base bath for 1.5-3 hours. The glass substrates were then rinsed with water
and ethanol and dried for 12 hours at 65°C. Then, they were then immersed in a 10%
(w/w) solution of chlorotrimethylsilane (Sigma-Aldrich) in ethanol for 8 hours, washed
with ethanol, dried at 70°C on a hot plate, and stored in a desiccator.
Appendix B: Using Hilbert transform to obtain the maximum amplitude of
oscillation and the resonance frequency
We can obtain the analytic signal Y(t) for the vertical position y(t) of the levitated particle
𝑌(𝑡) = 𝑦(𝑡) + 𝑖�̃�(𝑡) = 𝐴(𝑡)𝑒𝑖𝜑(𝑡), (9)
where �̃�(𝑡) is the Hilbert transform of 𝑦(𝑡) defined by [65]
�̃�(𝑡) = �̂�[𝑦(𝑡)] =1
𝜋∫
𝑦(𝜏)
𝑡−𝜏𝑑𝜏
∞
−∞. (10)
The instantaneous amplitude 𝐴(𝑡) and frequency 𝑓(𝑡) of 𝑦(𝑡) can be obtained by
𝐴(𝑡) = |𝑌(𝑡)| = √𝑦2(𝑡) + �̃�2(𝑡) (11)
and
𝑓(𝑡) =1
2𝜋
𝑑𝜑(𝑡)
𝑑𝑡, (12)
where 𝜑(𝑡) is the instantaneous phase angle, given by
𝜑(𝑡) = arctan (�̃�(𝑡)
𝑦(𝑡)). (13)
In Fig. 5, we plot the zoomed-in data of y(t) in Fig. 1(e) and its corresponding A(t) and
f(t). We define the maximum amplitude of oscillation Amax to be the maximum point of
A(t) at 𝑡 = 𝑡', and the resonance frequency fmax to be its corresponding instantaneous
frequency (𝑓max = 𝑓(𝑡')).

18
Fig. 5. Instantaneous amplitude and frequency obtained from the Hilbert transform. (a)
Zoomed-in data of y(t) from Fig. 1(e) (blue) and its instantaneous amplitude A(t) (red).
(b) Instantaneous frequency f(t) of y(t) in (a). The vertical dotted line indicates the time 𝑡'
when A = Amax and f = fmax.
Appendix C: Estimation of maximum contact area during particle-plate collisions
The maximum contact area during collision Ac due to elastic-plastic deformation for
a particle being dropped onto a flat surface can be estimated with the Hertz contact theory
[84, 85]:
𝐴𝑐 = 0.41𝜋𝐷2√𝜌𝑝
𝑌𝑝(𝑉𝑖𝑚𝑝 − 0.05√
𝜅4𝑌𝑝5
𝜌𝑝), (14)
where D = 204 ± 8 μm, ρp = 2200 kg/m3 and Yp = 190 MPa are diameter, density and
yield pressure of the particle, respectively, supplied by the manufacturer, Vimp = (2gh)1/2 =
0.11 m/s is the impact velocity, h = 0.6 mm is the drop height,
κ = (1 − ν1)2/E1 + (1 − ν2)
2/E2 is the elasticity parameter, ν1 = ν2 = 0.2 and
E1 = E2 = 67.5 GPa are Poisson's ratio and Young’s modulus of borosilicate glass [86],
and subscripts 1 and 2 denote the particle and the target plate, respectively. We obtain Ac
~ 20 μm2 for a glass particle in our setup.
Appendix D: Charges of levitated particles without any collisions
To see the effect of the ambient N2 gas on the charge q of the particles, we levitated
hydrophilic and hydrophobic glass particles and repeatedly measured q without any
collisions for ~25 hours. An example is shown in Fig. 6. This is much larger than the
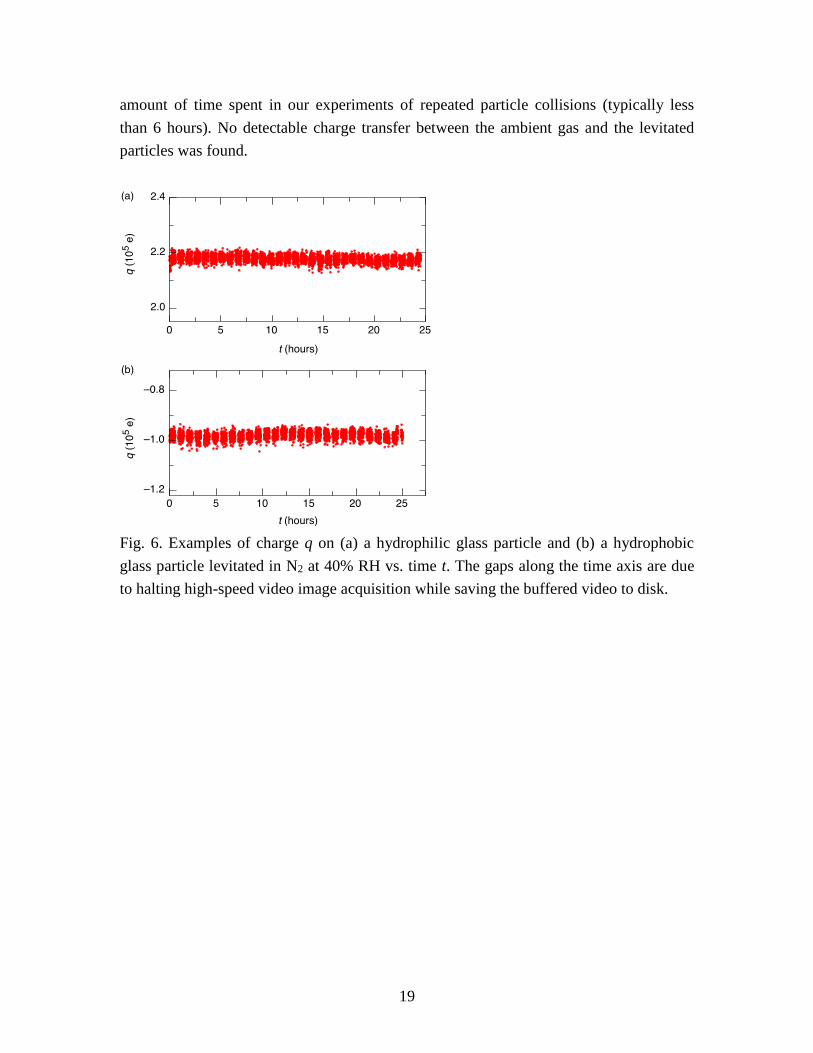
19
amount of time spent in our experiments of repeated particle collisions (typically less
than 6 hours). No detectable charge transfer between the ambient gas and the levitated
particles was found.
Fig. 6. Examples of charge q on (a) a hydrophilic glass particle and (b) a hydrophobic
glass particle levitated in N2 at 40% RH vs. time t. The gaps along the time axis are due
to halting high-speed video image acquisition while saving the buffered video to disk.
20
References
[1] L. B. Schein, Electrophotography and Development Physics (Springer Science &
Business Media, 2013), Vol. 14.
[2] A. G. Bailey, The science and technology of electrostatic powder spraying,
transport and coating, J. Electrostat. 45, 85 (1998).
[3] A. Jaworek, A. Krupa, and T. Czech, Modern electrostatic devices and methods
for exhaust gas cleaning: A brief review, J. Electrostat. 65, 133 (2007).
[4] M. Brook, C. Moore, and T. Sigurgeirsson, Lightning in volcanic clouds, J.
Geophys. Res. 79, 472 (1974).
[5] C. Stow, Dust and sand storm electrification, Weather 24, 134 (1969).
[6] G. D. Freier, The electric field of a large dust devil, J. Geophys. Res. 65, 3504
(1960).
[7] V. Lee, S. R. Waitukaitis, M. Z. Miskin, and H. M. Jaeger, Direct observation of
particle interactions and clustering in charged granular streams, Nat. Phys. 11, 733
(2015).
[8] R. Cocco, F. Shaffer, R. Hays, S. R. Karri, and T. Knowlton, Particle clusters in
and above fluidized beds, Powder Technol. 203, 3 (2010).
[9] A. Mehrotra, F. J. Muzzio, and T. Shinbrot, Spontaneous separation of charged
grains, Phys. Rev. Lett. 99, 058001 (2007).
[10] T. Abbasi and S. Abbasi, Dust explosions-cases, causes, consequences, and
control, J. Hazard. Mater. 140, 7 (2007).
[11] K. M. Forward, D. J. Lacks, and R. M. Sankaran, Charge segregation depends on
particle size in triboelectrically charged granular materials, Phys. Rev. Lett. 102, 028001
(2009).
[12] S. R. Waitukaitis, V. Lee, J. M. Pierson, S. L. Forman, and H. M. Jaeger, Size-
dependent same-material tribocharging in insulating grains, Phys. Rev. Lett. 112, 218001
(2014).
[13] M. A. Bilici, J. R. Toth III, R. M. Sankaran, and D. J. Lacks, Particle size effects
in particle-particle triboelectric charging studied with an integrated fluidized bed and
electrostatic separator system, Rev. Sci. Instrum. 85, 103903 (2014).
[14] T. Pähtz, H. J. Herrmann, and T. Shinbrot, Why do particle clouds generate
electric charges?, Nat. Phys. 6, 364 (2010).
[15] Y. Z. Zhang, T. Pähtz, Y. H. Liu, X. L. Wang, R. Zhang, Y. Shen, R. J. Ji, and B.
P. Cai, Electric field and humidity trigger contact electrification, Phys. Rev. X 5, 011002
(2015).
[16] T. Poppe, J. Blum, and T. Henning, Experiments on collisional grain charging of
micron-sized preplanetary dust, Astrophys. J. 533, 472 (2000).
[17] T. Matsuyama and H. Yamamoto, Charge relaxation process dominates contact
charging of a particle in atmospheric conditions, J. Phys. D: Appl. Phys. 28, 2418 (1995).
[18] A. Schella, S. Herminghaus, and M. Schröter, Influence of humidity on tribo-
electric charging and segregation in shaken granular media, Soft Matter 13, 394 (2017).
[19] D. J. Lacks and R. M. Sankaran, Contact electrification of insulating materials, J.
Phys. D: Appl. Phys. 44, 453001 (2011).
[20] J. Lowell and W. Truscott, Triboelectrification of identical insulators. II. Theory
and further experiments, J. Phys. D: Appl. Phys. 19, 1281 (1986).
21
[21] C. Liu and A. J. Bard, Electrostatic electrochemistry at insulators, Nat. Mater. 7,
505 (2008).
[22] L. S. McCarty and G. M. Whitesides, Electrostatic charging due to separation of
ions at interfaces: Contact electrification of ionic electrets, Angew. Chem. Int. Ed. 47,
2188 (2008).
[23] H. T. Baytekin, A. Z. Patashinski, M. Branicki, B. Baytekin, S. Soh, and B. A.
Grzybowski, The mosaic of surface charge in contact electrification, Science 333, 308
(2011).
[24] R. G. Horn, D. T. Smith, and A. Grabbe, Contact electrification induced by
monolayer modification of a surface and relation to acid-base interactions, Nature
(London) 366, 442 (1993).
[25] J. Clint and T. Dunstan, Acid-base components of solid surfaces and the
triboelectric series, Europhys. Lett. 54, 320 (2001).
[26] F. Galembeck, T. A. Burgo, L. B. Balestrin, R. F. Gouveia, C. A. Silva, and A.
Galembeck, Friction, tribochemistry and triboelectricity: Recent progress and
perspectives, RSC Adv. 4, 64280 (2014).
[27] S. Friedle and S. W. Thomas, Controlling contact electrification with
photochromic polymers, Angew. Chem. Int. Ed. 49, 7968 (2010).
[28] R. P. N. Veregin, M. N. V. McDougall, M. S. Hawkins, C. Vong, V. Skorokhod,
and H. P. Schreiber, A bidirectional acid-base charging model for triboelectrification:
Part 1. Theory, J. Imaging Sci. Technol. 50, 282 (2006).
[29] R. P. N. VereginA, M. N. V. McDougall, M. S. Hawkins, C. Vong, V.
Skorokhod, and H. P. Schreiber, A bidirectional acid-base charging model for
triboelectrification: Part II. Experimental verification by inverse gas chromatography and
charging of metal oxides, J. Imaging Sci. Technol. 50, 288 (2006).
[30] A. F. Diaz and R. M. Felix-Navarro, A semi-quantitative tribo-electric series for
polymeric materials: The influence of chemical structure and properties, J. Electrostat.
62, 277 (2004).
[31] S. Pence, V. J. Novotny, and A. F. Diaz, Effect of surface moisture on contact
charge of polymers containing ions, Langmuir 10, 592 (1994).
[32] A. Diaz, Contact electrification of materials: The chemistry of ions on polymer
surfaces, J. Adhes. 67, 111 (1998).
[33] S. W. Thomas, S. J. Vella, G. K. Kaufman, and G. M. Whitesides, Patterns of
electrostatic charge and discharge in contact electrification, Angew. Chem. 120, 6756
(2008).
[34] L. S. McCarty, A. Winkleman, and G. M. Whitesides, Ionic electrets:
Electrostatic charging of surfaces by transferring mobile ions upon contact, J. Am. Chem.
Soc. 129, 4075 (2007).
[35] S. W. Thomas, S. J. Vella, M. D. Dickey, G. K. Kaufman, and G. M. Whitesides,
Controlling the kinetics of contact electrification with patterned surfaces, J. Am. Chem.
Soc. 131, 8746 (2009).
[36] G. E. Ewing, Ambient thin film water on insulator surfaces, Chem. Rev. 106,
1511 (2006).
[37] A. Berman, Water vapor in vacuum systems, Vacuum 47, 327 (1996).
22
[38] J. A. Wiles, M. Fialkowski, M. R. Radowski, G. M. Whitesides, and B. A.
Grzybowski, Effects of surface modification and moisture on the rates of charge transfer
between metals and organic materials, J. Phys. Chem. B 108, 20296 (2004).
[39] E. Németh, V. Albrecht, G. Schubert, and F. Simon, Polymer tribo-electric
charging: Dependence on thermodynamic surface properties and relative humidity, J.
Electrostat. 58, 3 (2003).
[40] R. Zimmermann, S. Dukhin, and C. Werner, Electrokinetic measurements reveal
interfacial charge at polymer films caused by simple electrolyte ions, J. Phys. Chem. B
105, 8544 (2001).
[41] R. Zimmermann, U. Freudenberg, R. Schweiß, D. Küttner, and C. Werner,
Hydroxide and hydronium ion adsorption—a survey, Curr. Opin. Colloid In. 15, 196
(2010).
[42] Y.-H. M. Chan, R. Schweiss, C. Werner, and M. Grunze, Electrokinetic
characterization of oligo-and poly (ethylene glycol)-terminated self-assembled
monolayers on gold and glass surfaces, Langmuir 19, 7380 (2003).
[43] J. Drzymala, Z. Sadowski, L. Holysz, and E. Chibowski, Ice/water interface: Zeta
potential, point of zero charge, and hydrophobicity, J. Colloid Interface Sci. 220, 229
(1999).
[44] S. Yamamoto, H. Bluhm, K. Andersson, G. Ketteler, H. Ogasawara, M.
Salmeron, and A. Nilsson, In situ x-ray photoelectron spectroscopy studies of water on
metals and oxides at ambient conditions, J. Phys.: Condens. Matter 20, 184025 (2008).
[45] T. A. Burgo, F. Galembeck, and G. H. Pollack, Where is water in the triboelectric
series?, J. Electrostat. 80, 30 (2016).
[46] K. Yatsuzuka, Y. Mizuno, and K. Asano, Electrification phenomena of pure water
droplets dripping and sliding on a polymer surface, J. Electrostat. 32, 157 (1994).
[47] K. Yatsuzuka, Y. Higashiyama, and K. Asano, Electrification of polymer surface
caused by sliding ultrapure water, IEEE Trans. Ind. Appl. 32, 825 (1996).
[48] M. Matsui, N. Murasaki, K. Fujibayashi, P. Y. Bao, and Y. Kishimoto,
Electrification of pure water flowing down a trough set up with a resin sheet, J.
Electrostat. 31, 1 (1993).
[49] B. Ravelo, F. Duval, S. Kane, and B. Nsom, Demonstration of the triboelectricity
effect by the flow of liquid water in the insulating pipe, J. Electrostat. 69, 473 (2011).
[50] M. M. Apodaca, P. J. Wesson, K. J. M. Bishop, M. A. Ratner, and B. A.
Grzybowski, Contact electrification between identical materials, Angew. Chem. Int. Ed.
49, 946 (2010).
[51] K. R. LaMarche, X. Liu, S. K. Shah, T. Shinbrot, and B. J. Glasser, Electrostatic
charging during the flow of grains from a cylinder, Powder Technol. 195, 158 (2009).
[52] A. Sowinski, F. Salama, and P. Mehrani, New technique for electrostatic charge
measurement in gas-solid fluidized beds, J. Electrostat. 67, 568 (2009).
[53] T. Matsuyama, M. Ogu, H. Yamamoto, J. C. Marijnissen, and B. Scarlett, Impact
charging experiments with single particles of hundred micrometre size, Powder Technol.
135, 14 (2003).
[54] H. Watanabe, A. Samimi, Y. L. Ding, M. Ghadiri, T. Matsuyama, and K. G. Pitt,
Measurement of charge transfer due to single particle impact, Particle & Particle Systems
Characterization 23, 133 (2006).

23
[55] A. Sickafoose, J. Colwell, M. Horányi, and S. Robertson, Photoelectric charging
of dust particles in vacuum, Phys. Rev. Lett. 84, 6034 (2000).
[56] M. K. Mazumder, R. Ware, T. Yokoyama, B. Rubin, and D. Kamp, Measurement
of particle size and electrostatic charge distributions on toners using e-spart analyzer,
IEEE Trans. Ind. Appl. 27, 611 (1991).
[57] W. L. Nyborg, Radiation pressure on a small rigid sphere, J. Acous. Soc. Am. 42,
947 (1967).
[58] E. H. Trinh, Compact acoustic levitation device for studies in fluid-dynamics and
material science in the laboratory and microgravity, Rev. Sci. Instrum. 56, 2059 (1985).
[59] R. Löfstedt and S. Putterman, Theory of long wavelength acoustic radiation
pressure, J. Acoust. Soc. Am. 90, 2027 (1991).
[60] W. Xie and B. Wei, Parametric study of single-axis acoustic levitation, Appl.
Phys. Lett. 79, 881 (2001).
[61] E. Lierke and L. Holitzner, Perspectives of an acoustic-
electrostatic/electrodynamic hybrid levitator for small fluid and solid samples, Meas. Sci.
Technol. 19, 115803 (2008).
[62] L. P. Gor'kov, On the forces acting on a small particle in an acoustical field in an
ideal fluid, Soviet Physics Doklady 6, 773 (1962).
[63] M. Barmatz and P. Collas, Acoustic radiation potential on a sphere in plane,
cylindrical, and spherical standing wave fields, J. Acoust. Soc. Am. 77, 928 (1985).
[64] J. C. Lagarias, J. A. Reeds, M. H. Wright, and P. E. Wright, Convergence
properties of the nelder-mead simplex method in low dimensions, SIAM J. Optim. 9, 112
(1998).
[65] S. L. Hahn, Hilbert Transforms in Signal Processing (Artech House Boston,
1996), Vol. 2.
[66] J. C. Crocker and D. G. Grier, Methods of digital video microscopy for colloidal
studies, J. Colloid Interface Sci. 179, 298 (1996).
[67] K. Xu, P. Cao, and J. R. Heath, Graphene visualizes the first water adlayers on
mica at ambient conditions, Science 329, 1188 (2010).
[68] V. Buch, A. Milet, R. Vácha, P. Jungwirth, and J. P. Devlin, Water surface is
acidic, Proceedings of the National Academy of Sciences 104, 7342 (2007).
[69] J. K. Beattie, A. M. Djerdjev, and G. G. Warr, The surface of neat water is basic,
Faraday Discuss. 141, 31 (2009).
[70] R. Vácha, S. W. Rick, P. Jungwirth, A. G. de Beer, H. B. de Aguiar, J.-S. Samson,
and S. Roke, The orientation and charge of water at the hydrophobic oil droplet-water
interface, J. Am. Chem. Soc. 133, 10204 (2011).
[71] K. N. Kudin and R. Car, Why are water-hydrophobic interfaces charged?, J. Am.
Chem. Soc. 130, 3915 (2008).
[72] T. W. Healy and D. W. Fuerstenau, The isoelectric point/point-of zero-charge of
interfaces formed by aqueous solutions and nonpolar solids, liquids, and gases, J. Colloid
Interface Sci. 309, 183 (2007).
[73] J. Lützenkirchen, T. Preočanin, and N. Kallay, A macroscopic water structure
based model for describing charging phenomena at inert hydrophobic surfaces in aqueous
electrolyte solutions, PCCP 10, 4946 (2008).
[74] D. B. Asay and S. H. Kim, Evolution of the adsorbed water layer structure on
silicon oxide at room temperature, J. Phys. Chem. B 109, 16760 (2005).

24
[75] Y. Awakuni and J. Calderwood, Water vapour adsorption and surface
conductivity in solids, J. Phys. D: Appl. Phys. 5, 1038 (1972).
[76] A. Bismarck, A. Boccaccini, E. Egia-Ajuriagojeaskoa, D. Hülsenberg, and T.
Leutbecher, Surface characterization of glass fibers made from silicate waste: Zeta-
potential and contact angle measurements, J. Mater. Sci. 39, 401 (2004).
[77] N. Kuehn, H. J. Jacobasch, and K. Lunkenheimer, Zum zusammenhang zwischen
dem kontaktwinkel zwischen wasser und festen polymeren und ihrem zeta-potential
gegenüber wäßrigen lösungen, Acta Polym. 37, 394 (1986).
[78] J. A. Wiles, B. A. Grzybowski, A. Winkleman, and G. M. Whitesides, A tool for
studying contact electrification in systems comprising metals and insulating polymers,
Anal. Chem. 75, 4859 (2003).
[79] J. Rudnick and M. Barmatz, Oscillational instabilities in single-mode acoustic
levitators, J. Acoust. Soc. Am. 87, 81 (1990).
[80] J. K. Beattie, A. M. Djerdjev, G. V. Franks, and G. G. Warr, Dipolar anions are
not preferentially attracted to the oil/water interface, J. Phys. Chem. B 109, 15675 (2005).
[81] P. Mela, A. van Den Berg, Y. Fintschenko, E. B. Cummings, B. A. Simmons, and
B. J. Kirby, The zeta potential of cyclo-olefin polymer microchannels and its effects on
insulative (electrodeless) dielectrophoresis particle trapping devices, Electrophoresis 26,
1792 (2005).
[82] D. Li, M. B. Müller, S. Gilje, R. B. Kaner, and G. G. Wallace, Processable
aqueous dispersions of graphene nanosheets, Nature nanotechnology 3, 101 (2008).
[83] T. A. Burgo, C. A. Silva, L. B. Balestrin, and F. Galembeck, Friction coefficient
dependence on electrostatic tribocharging, Scientific Reports 3 (2013).
[84] H. Masuda and K. Iinoya, Electrification of particles by impact on inclined metal
plates, AlChE J. 24, 950 (1978).
[85] S. Timoshenko and J. Goodier, Theory of Elasticity (McGraw-Hill, 1970).
[86] E. B. Shand, Glass Engineering Handbook (McGraw-Hill, 1958).