Using tracer tests and hydrological observations to evaluate effects of tunnel drainage on...
16
Using tracer tests and hydrological observations to evaluate effects of tunnel drainage on groundwater and surface waters in the Northern Apennines (Italy) Valentina Vincenzi & Alessandro Gargini & Nico Goldscheider Abstract The impact of a railway tunnel on groundwater and surface waters in the Northern Apennines (Italy) was demonstrated and characterised by multi-tracer tests and hydrological observations. The 15-km-long Firenzuola tunnel crosses turbidite marls and sandstones previously not considered as aquifers. During the drilling, water inrushes occurred at fracture zones, and the tunnel still continues to drain the aquifer. The water table dropped below the level of the valleys, and gaining streams transformed into losing streams or ran completely dry, as did many springs, causing severe damage to the aquatic fauna and other elements of the ecosystem. Two multi- tracer tests, each using uranine and sulforhodamine G, were carried out in two impacted catchments in order to confirm and quantify the stream–aquifer–tunnel interrelations. The results proved connection between losing streams and numerous water inlets in the tunnel, with maximum linear distances of 1.4 km and velocities up to 135 m/d. Several of the demonstrated flowpaths pass under previous ground- water divides (mountain ridges), proving that the tunnel has completely modified the regional flow system. Water balance estimations demonstrate that the observed water losses cannot be explained by climate change but can largely be attributed to the tunnel drainage. Keywords Tracer tests . Draining tunnel . Hydrogeological impact . Fractured rocks . Italy Introduction Hydrogeological studies related to tunnels often focus on one or several of the following aspects: 1. From a technical point of view, groundwater is a problem for the construction of tunnels. 2. From an ecological and hydrological point of view, tunnels represent a risk for groundwater and the connected surface waters and ecosystems. 3. From a scientific point of view, tunnels offer the opportunity to access and study underground environ- ments, including aquifers and groundwater. Many hydrogeological and engineering studies mainly deal with the first aspect. Groundwater inrushes into tunnels imply a risk for the workmen and machines, especially if these inrushes occur unexpectedly and at high pressures and/or flow rates. Groundwater can also lower the stability of the tunnel face and increase the construc- tion time and costs (Cesano et al. 2000; Day 2004; Lee et al. 2003), or even cause collapse (Tseng et al. 2001). Tunnels in the unsaturated zone and in low-permeabil- ity geological formations such as poorly fractured crys- talline rocks, are often built as draining tunnels. Tunnels that cross the saturated zone of an aquifer, as well as tunnels below rivers or the sea, generally require impermeable linings, which entail higher technical efforts and costs (Atkinson and Mair 1983). Drainage tunnels below the groundwater level create an elongated zone of depression. The drawdown and the lateral extent of this depression depend on the depth of the tunnel below the initial water table and on aquifer hydraulic characteristics. A wide range of methods has been proposed to predict both groundwater inflow to tunnels and the drawdown A preliminary version of the study has been presented, as oral communication, at the XXXV IAH Congress “Groundwater & Ecosystems” held in Lisbon on 17–21 September 2007. V. Vincenzi ()) : A. Gargini Earth Sciences Department, University of Ferrara, Via Saragat 1, B building, 44100, Ferrara, Italy e-mail: [email protected] Tel.: +39-0532-974691 Fax: +39-0532-974767 N. Goldscheider Centre of Hydrogeology, University of Neuchâtel, Rue Emile-Argand 11, 2009, Neuchâtel, Switzerland Published in Hydrogeology Journal 17, issue 1, 135-150, 2009 which should be used for any reference to this work 1
-
Upload
independent -
Category
Documents
-
view
5 -
download
0
Transcript of Using tracer tests and hydrological observations to evaluate effects of tunnel drainage on...
Using tracer tests and hydrological observations to evaluate effectsof tunnel drainage on groundwater and surface waters in the NorthernApennines (Italy)
Valentina Vincenzi & Alessandro Gargini & Nico Goldscheider
Abstract The impact of a railway tunnel on groundwaterand surface waters in the Northern Apennines (Italy) wasdemonstrated and characterised by multi-tracer tests andhydrological observations. The 15-km-long Firenzuolatunnel crosses turbidite marls and sandstones previouslynot considered as aquifers. During the drilling, waterinrushes occurred at fracture zones, and the tunnel stillcontinues to drain the aquifer. The water table droppedbelow the level of the valleys, and gaining streamstransformed into losing streams or ran completely dry, asdid many springs, causing severe damage to the aquaticfauna and other elements of the ecosystem. Two multi-tracer tests, each using uranine and sulforhodamine G, werecarried out in two impacted catchments in order to confirmand quantify the stream–aquifer–tunnel interrelations. Theresults proved connection between losing streams andnumerous water inlets in the tunnel, with maximum lineardistances of 1.4 km and velocities up to 135 m/d. Several ofthe demonstrated flowpaths pass under previous ground-water divides (mountain ridges), proving that the tunnel hascompletely modified the regional flow system. Waterbalance estimations demonstrate that the observed water
losses cannot be explained by climate change but canlargely be attributed to the tunnel drainage.
Keywords Tracer tests . Draining tunnel . Hydrogeological impact . Fractured rocks . Italy
Introduction
Hydrogeological studies related to tunnels often focus onone or several of the following aspects:
1. From a technical point of view, groundwater is aproblem for the construction of tunnels.
2. From an ecological and hydrological point of view,tunnels represent a risk for groundwater and theconnected surface waters and ecosystems.
3. From a scientific point of view, tunnels offer theopportunity to access and study underground environ-ments, including aquifers and groundwater.
Many hydrogeological and engineering studies mainlydeal with the first aspect. Groundwater inrushes intotunnels imply a risk for the workmen and machines,especially if these inrushes occur unexpectedly and at highpressures and/or flow rates. Groundwater can also lowerthe stability of the tunnel face and increase the construc-tion time and costs (Cesano et al. 2000; Day 2004; Lee etal. 2003), or even cause collapse (Tseng et al. 2001).
Tunnels in the unsaturated zone and in low-permeabil-ity geological formations such as poorly fractured crys-talline rocks, are often built as draining tunnels. Tunnelsthat cross the saturated zone of an aquifer, as well astunnels below rivers or the sea, generally requireimpermeable linings, which entail higher technical effortsand costs (Atkinson and Mair 1983). Drainage tunnelsbelow the groundwater level create an elongated zone ofdepression. The drawdown and the lateral extent of thisdepression depend on the depth of the tunnel below theinitial water table and on aquifer hydraulic characteristics.A wide range of methods has been proposed to predictboth groundwater inflow to tunnels and the drawdown
A preliminary version of the study has been presented, as oralcommunication, at the XXXV IAH Congress “Groundwater &Ecosystems” held in Lisbon on 17–21 September 2007.
V. Vincenzi ()) :A. GarginiEarth Sciences Department,University of Ferrara,Via Saragat 1, B building, 44100, Ferrara, Italye-mail: [email protected].: +39-0532-974691Fax: +39-0532-974767
N. GoldscheiderCentre of Hydrogeology,University of Neuchâtel,Rue Emile-Argand 11, 2009, Neuchâtel, Switzerland
Published in Hydrogeology Journal 17, issue 1, 135-150, 2009which should be used for any reference to this work
1

caused by the tunnel such as analytical solutions fordifferent hydrogeological settings (Goodman et al. 1965;Kolymbas and Wagner 2007; Marechal and Perrochet2003; Perrochet 2005), including solutions for transientflow towards tunnels drilled into heterogeneous formations(Perrochet and Dematteis 2007) or tunnels in multi-layeraquifer systems (Yang and Yeh 2007), as well as differentnumerical models (Molinero et al. 2002; Feinstein et al.2003; Yoo 2005).
Any groundwater drawdown alters the natural hydro-geological flow system and can consequently impactgroundwater-dependent vegetation, surface streams, lakes,wetlands and the associated aquatic ecosystems, but alsosprings and wells. Obviously, this can also affect theregional population and create problems related to drinkingwater supply, agriculture, irrigation, fishing, tourism andother activities (Sjolander-Lindqvist 2005). The magnitudeof the impact depends on the drawdown and on the flowrate that is diverted from the natural system into the tunnel(Ii and Kagami 1997; Kitterod et al. 2000).
The wise approach is to assess the potential hydrologicaland ecological impact of a tunnel before building it, andtake appropriate measures to minimise the impact such asimpermeable linings, at least in the sectors of the tunnel thatcross the most permeable zones and/or the zones wheresurface waters and ecosystems are most vulnerable togroundwater drawdown (Kvaerner and Klove 2006).
The study presented in this paper deals with anexample where this was not done. Between 1996 and2005, nine tunnels with a total length of 73 km weredrilled across the Northern Apennine chain, Italy, for thehigh-speed railway connection between Bologna andFlorence. The region consists of turbidite formationsincluding marls and sandstones that were erroneouslynot considered as relevant aquifers. Therefore, the tunnelswere built without impermeable linings. Huge waterinrushes, often from fractures and localised in specificsectors, occurred during the drilling process, and thetunnels still continue to drain the aquifer. As a result,many streams and springs in the region run partly orcompletely dry, obviously causing severe damage to theaquatic ecosystem, particularly the invertebrate, amphib-ians and fish fauna, although this impact has not beensystematically monitored.
Detailed spring and surface water monitoring, alongwith geological and hydrogeological observations, made itpossible to document the impact of the tunnel ongroundwater and surface waters, and to set up aconceptual model of the tunnel–aquifer–surface interac-tions. It was possible to infer that the tunnels have entirelyaltered the natural flow systems: gaining streams trans-formed into losing streams, previous drainage divides losttheir function, and the entire natural drainage system wasreplaced by underground drainage towards the tunnel(Gargini et al. 2008).
However, due to a shortage of groundwater observationwells and detailed, long-term information concerning thepre-construction state, at some places this conceptualmodel was lacking solid evidence. Although the impact
of the tunnel seemed obvious, it was difficult to prove thatthe alteration of the natural drainage system was not, forexample, due to climate change. Therefore, starting fromthe results of Gargini et al. (2008), a new study wasperformed during years 2005–2007, after the tunnelcompletion, with new specific field measurements andinvestigations on the impacted streams, new tunnelsurveys and several tracer tests between the losing surfacestreams and the tunnels.
This paper presents the results of this study at theFirenzuola tunnel, where the most severe impacts havebeen observed and studied in several catchments. Themain goals were:
1. To confirm (or refute) the conceptual model of regionalgroundwater and surface waters drainage by the tunnel,even across previous drainage divides
2. To characterise the impact on streams waters, inrelation to geological features, in order to evaluatepossible mitigation measures for the maintenance of aminimum summer flow
3. To better characterise and quantify the flow paths, flowvelocities, flow rates and flow processes in thisanthropogenically altered hydrogeological system
4. To obtain insights into the hydrogeology of turbiditeformations
5. To test the applicability of artificial tracers for this typeof problem and hydrogeological setting
Description of the study area
General geological and hydrogeological settingThe Firenzuola tunnel is 15,060 m long and crosses themain Apenninic water divide between Santerno River tothe north and Arno River to the south (Fig. 1). Drillingbegan in 1996 through four access windows (total length:3,519 m) and was completed at the end of 2005.
The tunnel is mostly drilled through silico-clasticturbidite units of the Miocene Marnoso Arenacea Forma-tion (MAF), consisting of arenitic layers (sandstones) andpelitic layers (marls; Ricci Lucchi 1986; Zattin et al.2000). The MAF can be subdivided into lithostratigraphicmembers according to the ratio of arenitic to pelitic layers(A/P ratio) (Cibin et al. 2004; Gargini et al. 2006;Amy and Talling 2006). The tunnel crosses two memberswith high A/P ratios (i.e. predominantly sandstones):Nespoli member, from the kilometric progressive (p.)48+000 km to p. 49+500 km, and Premilcuore member,from p. 51+600 km to p. 54+700 km (Fig. 1).
The Apenninic chain is a typical thrust-fold beltresulting from compression tectonics, followed by a post-orogenic extension phase in its southern part. Firenzuolatunnel is located at the border between two differenttectonic domains: the first one (north of the main waterdivide) has been subjected to a dominant compressivetectonic stress field; the second one (farther to the south)has been subjected to an extensional tectonic phase
2
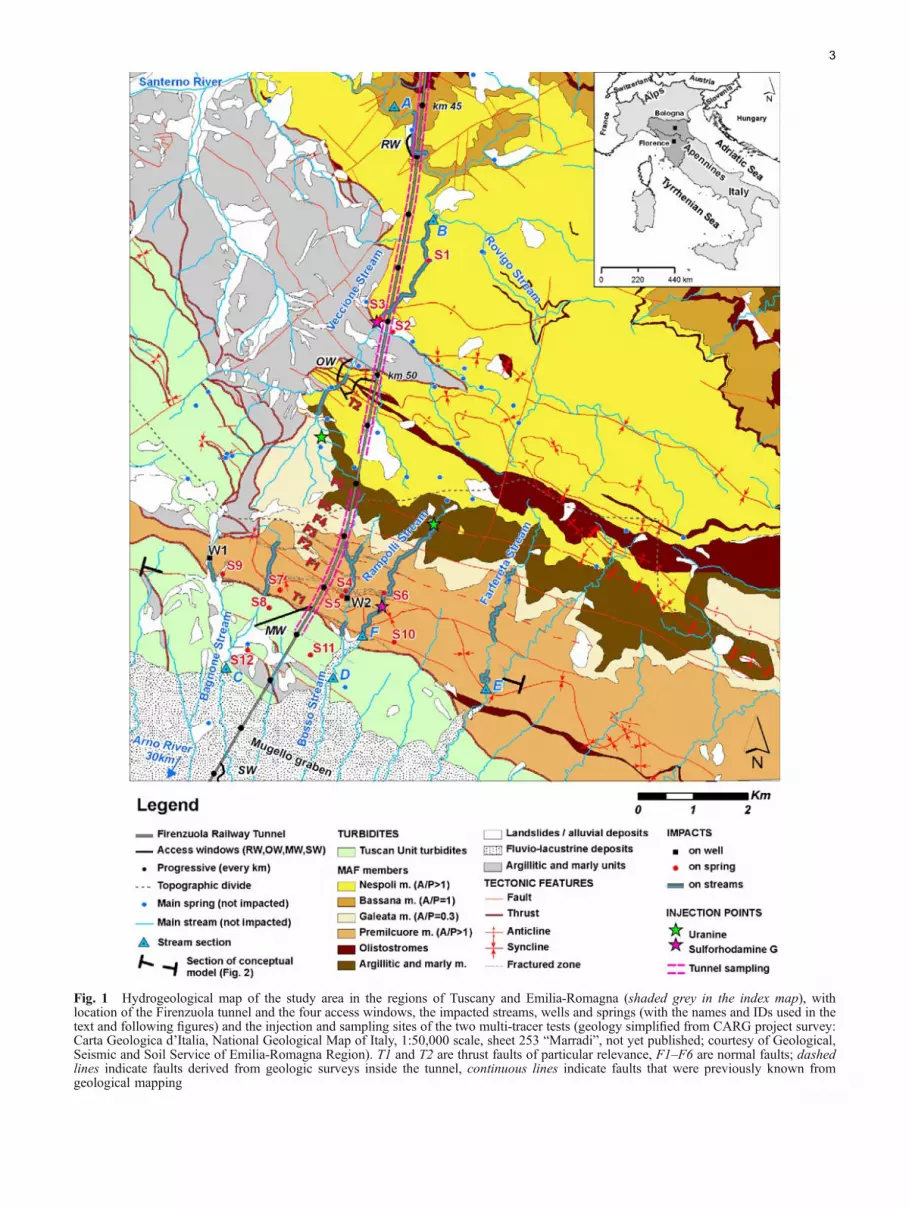
Fig. 1 Hydrogeological map of the study area in the regions of Tuscany and Emilia-Romagna (shaded grey in the index map), withlocation of the Firenzuola tunnel and the four access windows, the impacted streams, wells and springs (with the names and IDs used in thetext and following figures) and the injection and sampling sites of the two multi-tracer tests (geology simplified from CARG project survey:Carta Geologica d’Italia, National Geological Map of Italy, 1:50,000 scale, sheet 253 “Marradi”, not yet published; courtesy of Geological,Seismic and Soil Service of Emilia-Romagna Region). T1 and T2 are thrust faults of particular relevance, F1–F6 are normal faults; dashedlines indicate faults derived from geologic surveys inside the tunnel, continuous lines indicate faults that were previously known fromgeological mapping
3
(Bendkik et al. 1994; Boccaletti et al. 1997; Cerrina Feroniet al. 2002). Thrusts prevail north of the divide (T2 inFig. 1); normal faults prevail to the south (F1–F6 inFig. 1), due to the opening of the Mugello graben.
Turbidite formations, although widespread throughoutthe world, have not received much attention in thehydrogeological literature and are often not consideredas relevant aquifers due to the high percentage of fine-grained components. However, in some regions, fracturedturbidites represent important aquifers.
The mean precipitation in the region is 1569 mm/year(average value from 1960 to 2004); the years 1995 to 1998were slightly drier, with an average of 1439 mm/year. Thehydrologic year, which starts in October, presents a rainfallmaximum during November to April and a drier seasonfrom May to October (Gargini et al. 2008).
A conceptual model of groundwater circulation inturbidites was recently proposed on the basis of a largequantity of hydrogeological monitoring data related totunnel excavations (Gargini et al. 2008). According to thismodel, three main types of groundwater flow system(GFS) can be identified in turbidite aquifers:
GFS 1: Shallow groundwater circulation in the upper-most 100–200 m, where stress release has causedintense fracturing; regolith, landslide deposits anddebris also belong to this zone. A shallow GFS largelyfollows the topography and discharges into many smallsprings (often < 1 L/s; ‘slope’ type spring, S) or streams.
GFS 2: Along major extensional structures (steep andrelatively deep-reaching fracture zones), linear flow
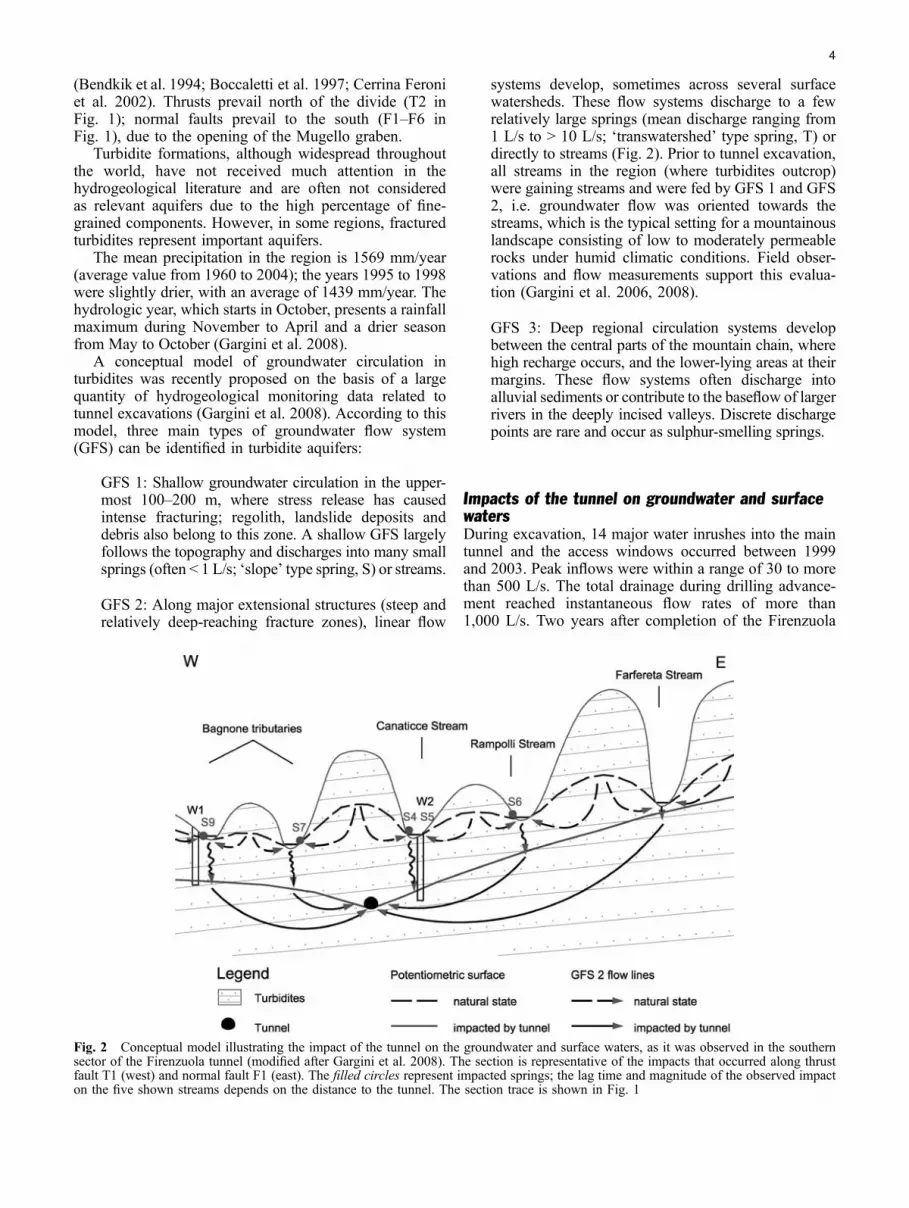
systems develop, sometimes across several surfacewatersheds. These flow systems discharge to a fewrelatively large springs (mean discharge ranging from1 L/s to > 10 L/s; ‘transwatershed’ type spring, T) ordirectly to streams (Fig. 2). Prior to tunnel excavation,all streams in the region (where turbidites outcrop)were gaining streams and were fed by GFS 1 and GFS2, i.e. groundwater flow was oriented towards thestreams, which is the typical setting for a mountainouslandscape consisting of low to moderately permeablerocks under humid climatic conditions. Field obser-vations and flow measurements support this evalua-tion (Gargini et al. 2006, 2008).
GFS 3: Deep regional circulation systems developbetween the central parts of the mountain chain, wherehigh recharge occurs, and the lower-lying areas at theirmargins. These flow systems often discharge intoalluvial sediments or contribute to the baseflow of largerrivers in the deeply incised valleys. Discrete dischargepoints are rare and occur as sulphur-smelling springs.
Impacts of the tunnel on groundwater and surfacewatersDuring excavation, 14 major water inrushes into the maintunnel and the access windows occurred between 1999and 2003. Peak inflows were within a range of 30 to morethan 500 L/s. The total drainage during drilling advance-ment reached instantaneous flow rates of more than1,000 L/s. Two years after completion of the Firenzuola
Fig. 2 Conceptual model illustrating the impact of the tunnel on the groundwater and surface waters, as it was observed in the southernsector of the Firenzuola tunnel (modified after Gargini et al. 2008). The section is representative of the impacts that occurred along thrustfault T1 (west) and normal fault F1 (east). The filled circles represent impacted springs; the lag time and magnitude of the observed impacton the five shown streams depends on the distance to the tunnel. The section trace is shown in Fig. 1
4

tunnel, the average drainage outflow is 355 L/s with anevident relationship to the annual recharge regime: 210 L/sat the end of the recession period in autumn, but more than400 L/s during winter (Gargini et al. 2008).
The main impacts on springs and streams occur in thezones consisting of turbidites with a high A/P ratio: theNespoli member in the northern part and the Premilcuoremember in the south. As a consequence, 12 springs (S1–S12in Fig. 1) and five previously perennial streams (Rovigoand Veccione in the north; Bagnone, Bosso and Farfereta inthe south) were completely or seasonally dried, with severesocio-economic and ecological effects such as the totaldisappearance of fish, amphibians and aquatic invertebratesin the dry stream sections. Although this type of impact hasnot been systematically monitored, it is obvious.
The mechanisms of the impact were different in thenorth and in the south, and were established by studyingthe space-time array of the inrush-impact relationships asderived by monitoring data collected by the HydrologicalMonitoring Programme (HMP) performed by the con-structors during drilling advancement.
In the southern part (Premilcuore member), the maininrushes occurred between p. 52+850 km and p. 54+450 km (Fig. 1), during the northward advancement of theMarzano window and the Firenzuola tunnel in 1999–2003, and are related to extensional fracture zones andfaults parallel to the Mugello graben. All main springsaligned along these structures (T1, F1) were completelydried up and the disappearance of summer flow in the fiveimpacted streams shown in Fig. 1 is mainly related towater losses in the intersection zones between the streamsand the extensional faults F1 to F4. Starting from therough data of the HMP (completed through surveys doneby the authors in 2000–2002 and 2005–2007), theprogressive development of the impact has been inferred(Fig. 3). Five main “impact events” can be identified fromwater inrushes during drilling advancement (Fig. 3b),increasing drawdown observed in wells (Fig. 3c), anddecreasing spring and stream flows (Fig. 3c-e). Most ofthe impact events are related to tectonic extensionalstructures crossed by the tunnel, only two of which (F1and F5) had been identified from the surface duringgeologic surveys before drilling:
1. In June 1999, a water inrush of 30 L/s in the accesswindow (MW) at p. 54+450 km along the thrust T1induced a sudden but small drawdown in a well (W1);after one year (July 2000) spring S9, located on thesame structure, also became impacted.
2. In March 2000, the tunnel crossed the extensional faultF1, triggering a water inrush of 20 L/s at p. 54+130 km; the impact on the two spring S4 and S5aligned along F1 was almost immediate (they dried upafter 1 and 3 months, respectively).
3. From January to May 2001, the tunnel crossed F2 fromp. 54+000 km to p. 53+800 km and several nearbywater inrushes in the tunnel increased the total tunneloutflow by one order of magnitude and caused thelowering of the water levels in wells W1 and W2 and
the complete drying up of spring S6; these eventsimpacted, for the first time, Rampolli Stream wheresection F became dry during the summer season.
4. Between March and December 2002, the tunnelcrossed three extensional faults (F3, F4, F5), creatingsignificant water inrushes which increased the totaldrainage by a factor of five; the quite immediate effectwas evident at well W1 with the water level dropping30 m more; no main springs are located along thesestructures and the impact involved mainly the baseflowof streams, reaching Farfereta Stream in July 2003.
5. Finally, the interception of F6 caused some waterinrushes but no impacts were observed, because theupgradient streams and springs are located over a lowpermeability member of MAF, which separates thetunnel from the surface waters.
The hydrographs in Fig. 3 clearly display suddendeclines of spring discharge, with relatively short timelags between the water inrush and the impact; varyingfrom nearly instantaneous to some months, according tothe distance of the spring from the tunnel along the fault.A hydraulic diffusivity estimate was made based on thesetime lags, resulting in a mean value of about 1,000 m/month(Gargini et al. 2008). Fast and intense impacts were alsorecorded on streams. However, the stream hydrographsconsist of baseflow and direct flow, while the tunnelmainly reduces the baseflow, so the effects are evidentmainly during recession periods.
In the northern part (Nespoli member), the maininrushes occurred between p. 45+900 km and p. 48+200 km (Fig. 1). Due to the absence of long andcontinuous extensional fracture zones, these inrushes canbe explained as drainage from a decompressed andgenerally fractured rock mass extending down to 200 mdepth. For the same reason, the drainage effect of thetunnel does not propagate for such long distances as in thesouthern part. Several slope springs and streams (e.g.Rovigo and Veccione) were impacted by the tunnel shortlyafter the water inrushes occurred. In a general way, theimpact in the southern part corresponds to GFS type 2,while the impact in the north corresponds to GFS 1, asdescribed above.
Figure 2 presents a conceptual model of the impact ofthe tunnel on groundwater and surface waters that matchesobservations in the southern part of the study area. Thesection runs along the faults, where higher permeabilitypromotes drainage to the tunnel. The tunnel has com-pletely altered the natural flow system. Before the tunnelwas built, the water table was above the level of thestreams, and the aquifer drained towards springs andstreams. Now, the tunnel drains the entire system; thewater table dropped below the valleys, drainage divideshave lost their function and streams and springs run dry.However, a direct experimental proof for this conceptualmodel was missing. Therefore, a comprehensive experi-mental program was established in order to demonstrateand quantify the stream-aquifer-tunnel connections.
5

Fig. 3 Detailed chronology of impacts on groundwater and surface waters in the southern sector of Firenzuola tunnel. a Drillingadvancement of the main tunnel vs. time. b Monthly tunnel inflow normalised by meters of monthly drilling advancement, and total tunneloutflow vs. time, from p. 54+500 km to p. 51+627 km. c Chronology of impacts on spring S9 and on well W1 (western side of the tunnel).d Chronology of impacts on springs S4, S5, S6 and on well W2 (eastern side of the tunnel). All the springs have been completely dry since2001. e Stream discharge vs. time at stream sections F (Rampolli Stream) and E (Farfereta Stream), eastern side of the tunnel. Since 2003,the two stream sections have been completely dry every summer
6

Materials and methods
General approachStarting from the conceptual model presented in Fig. 2,the general approach was as follows:
1. Identification of the infiltration zones in the streambedsusing existing hydrological data, observations made bylocal people and new detailed stream flow surveys(2001–2006)
2. Characterisation of water inlets in the tunnel, includingthe evaluation of existing data on water inrushes duringthe drilling and detailed surveys of water inlets that arestill active
3. Demonstration and characterisation of the assumedstream-tunnel connections by means of multi-tracertests with a total of four injection sites betweendifferent reaches of the stream network and the waterinlets in the tunnel
Stream flow surveysThe data collected within the HMP made it possible toidentify the impacted stream sections only in a generalway. However, in order to localise the most importantinfiltration zones in the streambeds and to characterisetheir evolution over the year, repeated and detailed streamsurveys were done within the framework of this study,using the salt-dilution method of flow measurement (Käss1998). For each measurement, an appropriate quantity ofsalt (∼1 kg NaCl for an estimated 100 L/s) was dissolvedin a bucket of water and injected into the stream. Thespecific electrical conductivity (SEC, in μS/cm at 25°C)was recorded with a CTD diver 20 to 120 m downstream,where the salt plume had completely mixed with thestream. The natural background was subtracted from themeasured SEC, and the salt concentration (c) wasdetermined using an empirical correlation between c andSEC that was established for each stream. Finally, thestream discharge was obtained by dividing the injectedsalt mass by the surface area below the breakthroughcurve.
Flow measurements inside the tunnelThe monitoring sites in the Firenzuola tunnel aredetermined by the installed drainage system. To avoiduncontrolled water inflows into the tunnel, there is awaterproof PVC foil between the concrete lining and thefractured rock. Every 25 m, on both sides of the tunnel, agroup of 25 m long full-screened tubes drain watertowards an inspection well. Two pipes at the base of eachtunnel sidewall collect the water and convey it towards thetunnel portals.
The discharge at the sampled drainage tubes wasmeasured using a bucket and a stopwatch. The totaldischarge at the tunnel portals is measured automaticallyand continuously by the constructor. On the northern side,
a laser system measures water level at a calibrated weir;on the southern side, a magnetic flowmeter is installed atthe collecting pipe.
Tracer testsTwo multi-tracer tests, with two tracers in each case, weredone in two streams impacted by the tunnel, RampolliStream in the southern part of the area and VeccioneStream further to the north. Because of the expected longtravel times, high dilutions and high dispersivities of thetracers, relatively high injection quantities were required,resulting in high concentrations in the stream water.Therefore, ecotoxicological safety was a major selectioncriterion for the tracers. The fluorescent dyes uranine (CAS518-47-8) and sulforhodamine G (CAS 5873-16-5) wereselected as tracers, because of their favourable properties(Käss 1998) and proven safety (Behrens et al. 2001).
All tracers were dissolved on-site in different barrels ofstream water (∼100 L) and then poured into the flowingstream. As fluorescent dyes are sensitive to sunlight, theinjections were done in the evening. The tracers wereinstantaneous released in the streams (∼1 h), but theeffective duration of the injection into the aquifer wasmuch longer, as there was intermediate storage of tracer inpools of the slow-flowing streams.
On 6 May 2006, 1 kg of sulforhodamine G wasinjected into a tributary of the lower part of RampolliStream, some tens of metres upstream from the confluencepoint with the dry Rampolli streambed; 5 kg of uraninewere injected further upstream (Figs. 1 and 5); the twoparts of the stream were separated by a dry section,ensuring separation of the two tracer injections. On 13December 2006, 8 kg of sulforhodamine G was injected inthe middle part of Veccione Stream and 10 kg of uraninewere injected further upstream (Figs. 1 and 6). There wascontinuous flow between the two injection points, so thaturanine was dispersed in the entire stream, while sulfo-rhodamine G only labelled the lower section of the stream.
Monitoring inside the tunnel included both discretewater sampling (manually and with auto-samplers) andaccumulative sampling by means of activated charcoalbags. Blank samples were taken prior to injections and allwere negative. The sampling surveys involved both singlepoints (i.e. inspection wells or water inlets at fissures inthe concrete) and integral points (i.e. the central trench orthe big pipes conveying waters outside, including all thewater collected further upgradient). During the experi-ment, the monitoring program was continuously modifiedand optimised, as a function of the intermediate results.
The southern part of the tunnel (Firenzuola S) wassampled 32 times between 6 May 2006 and 30 March2007. In total, there are 50 sampling points in this 2,865 mlong part of the tunnel (Figs. 1 and 5). The total number ofanalyses was 1550 for water samples and 930 for charcoalbags. The northern sector (Firenzuola N) is 7,236 m long(Figs. 1 and 6) and was sampled 23 times between 30November 2006 and 13 April 2007, when work inside thetunnel made further sampling impossible. For this exper-
7

iment, 96 sites were sampled; 2,304 water samples and185 charcoal bags were analysed (only from sites wherewater samples were negative). By means of an on-linefluorometer (Schnegg and Flynn 2002), the two tracerswere continuously monitored in the total water outflow atthe northern entrance of the tunnel.
The samples were analysed with a spectrofluorometer(PerkinElmer LS 45). As the tunnel drip waters have a pH>8, it was not necessary to add a basic buffer to the watersamples. Charcoal samples were dried, dipped in an eluentfor 12–14 h (10 g KOH per 100 ml of 96% ethanol) andthen analysed with the spectrofluorometer (Käss 1998).
Evaluation and analysis of the tracer breakthroughcurvesTracer results are presented as concentration-time data, i.e.breakthrough curves (BTCs). Basic parameters weredirectly obtained from the BTCs: first detection time (t1),peak time (tp), peak concentration (cp), and thecorresponding maximum velocity (vmax) and peak velocity(vp). The minimum three-dimensional distances betweenthe stream and the tunnel were taken as relevant flowpathlength (L). For the southern sector, the minimum three-dimensional distances were considered along the mainfaults; for the northern sector, where such prominent faultsare absent, the distances have been considered perpendic-ular to the tunnel. Tracer recoveries (R) were calculated asa function of the variable discharge (Q).
Mathematical models make it possible to obtain moreadvanced transport parameters by fitting a solution of adifferential transport equation to the observed data.Different analytical solutions are available for a widerange of hydrogeological settings with well-defined initialand boundary conditions (Bear 1979; Toride et al. 1993).
In the present case, the tracer pathways include a passagein surface streams followed by transport through a networkof unsaturated and saturated fractures towards the tunnel.There is no mathematical solution for such a complexsystem. In order to obtain at least some global indications onthe transport processes and to be able to compare the
different tracer results, the simplest analytical solution wasfitted to the observed data: the conventional one-dimensionaladvection-dispersion model (ADM; Kreft and Zuber 1978).The ADM requires two fit parameters: advection isexpressed as mean transit time (t0) or mean flow velocity(v); dispersion can be expressed as dispersion coefficient(D) or dispersivity (α=D/v). CXTFIT (Toride et al. 1999)was used to fit the analytical model to the data.
Results and discussion
Evolution of the impact on streamsThe flow measurement data derived from the HMPallowed the comparison of the mean baseflow of thedifferent streams before the tunnel was drilled (1995–1998) with the baseflow after the tunnel drilling (2005–2006) thus providing the consequent estimate of thebaseflow loss. For the calculation of the baseflow values,only stream discharge measurements made after at least5 days from the last rain have been considered.
The baseflow losses range from 40 to 84% (Table 1). Thehighest value corresponds to Bosso Stream; dramatic losses(65%) have also been observed in the Veccione Stream(section B in Fig. 1), a tributary of Rovigo Stream. Theslight decrease of total annual rainfall (8% less rainfall in2005–2006 compared to 1995–1998) is not sufficient toexplain this substantial baseflow loss, which can mainly beattributed to drainage into the tunnel. The total baseflowloss is 254 L/s, less than the total outflow of the tunnel(355 L/s in 2005–2006), suggesting that the system is stillin a transient state and further impacts have to be expected.
On the northern side, Veccione Stream is most severelyimpacted by the tunnel, as well as the lower reaches ofRovigo Stream, which are directly located above thetunnel, and where rock coverage is thin, so that thestream-tunnel connections are obvious.
The tunnel crosses the Veccione watershed over a lengthof 5.5 km. At two places, the tunnel passes directly under thestream: at p. 49+000 km (main tunnel) and near p. 50+000 km (access window; Fig. 1). The impacts are not
Table 1 Baseflow loss estimation for the streams impacted by Firenzuola tunnel compared to rainfall data (data of stream flow during dryperiods from HMP; precipitation measured at Barco rainfall gauge; location of stream sections and rain gauge in Fig. 1). The slight decreaseof annual rainfall of 8% cannot explain the baseflow loss of 40–84%
Stream section Average baseflow (L/s) Baseflow lossNatural conditions (1995–1998) Impacted by tunnel (2005–2006) (L/s) (%)
Northern sector Rovigo Stream (A) 356 190 166 47Southern sector Bagnone Stream (C) 11 6 5 45
Bosso Stream (D) 92 15 77 84Farfereta Stream (E) 15 9 6 40
Total 474 220 254 54
Rainfall (mm/year) Rainfall decrease(mm/year) (%)
1,439 1,325 114 8
8

restricted to these zones but the stream flow surveysrevealed significant seepage losses along most of the stream.In June 2006, the discharge decreased from 60 to 30 L/s inthe middle section of the stream (near p. 49+000 km) andfrom 46 to 25 L/s in the lower section (near km 47) within11 days, demonstrating that the gaining stream had trans-
formed into a losing stream (Fig. 4a). On 18 July 2006, thestream started to dry up in the lower section, and the drypart slowly propagated upstream. In September, the entirelower and middle section of the stream was dry until thebeginning of December due to a particularly dry autumn.
In the southern part of the area, several watersheds areimpacted by the tunnel (Fig. 1). The most severe impactscan be observed in two tributaries of Bosso Stream. Alreadyduring springtime, the western tributary (Canaticce) runscompletely dry in its entire lower part, thereby exterminat-ing all active aquatic live in this previously permanentstream. The eastern tributary (Rampolli) also runs dryduring summer in its lower part, although the springs in itsupper part maintain their flow rates, indicating seepagelosses further downstream. Figure 4b illustrates the tempo-ral evolution of the flow rates along Rampolli Stream: thetwo infiltration zones, where the drying up starts in earlyJune, seem to be related with two tectonic structures (T1and F1). In the following weeks, the dry part of the streammigrates progressively upstream, due to additional infiltra-tion zones. During summer, the stream remains dry untilintense rainfall and recharge restarts in autumn or winter.
Based on these examples and other stream surveys,several hypotheses can be formulated:
& As the tunnel continues to drain the aquifer, the impacton the streams gets worse every year, indicating thatsteady state has not yet been reached.
& Where seepage losses are localised at distinct tectonicstructures (faults and fracture zones), as in the case ofRampolli Stream, dryness starts at these points,suggesting that these structures also constitute theprincipal stream-tunnel connections.
& Where fracturing and seepage losses are more dispersed,as in the case of Veccione Stream, dryness starts in thelower section of the stream and then propagates upstream.
Although the stream flow survey further confirms theconceptual model of regional groundwater drainage by thetunnel, only tracer tests can deliver clear evidence.
Stream-tunnel connections demonstrated by tracertestsThe uranine that was injected in the upper section ofRampolli Stream was detected at several sampling sites inthe southern part of the tunnel, 18 to 74 days (d) after theinjection (Table 2, Fig. 5). The stream is located east of thetunnel, but the tracer arrived on both sides, which can beexplained by over- or underflow; this was possible due tothe presence of a “controlled drainage system”, imple-mented by the tunnelling company (since 2005) in order toelevate the groundwater level above the tunnel in order todecrease the hydraulic gradient and the tunnel dischargerate. Four main stream-tunnel connections can be identified:
1. Where the tunnel crosses the extensional fault F2:uranine detection at sampling site 3DX (first arrivalafter 35 d) proves direct connection between the stream
Fig. 4 Temporal evolution of the drying up process of a VeccioneStream and b Rampolli Stream in 2006. The legend for geologicaland other features is shown in Fig. 1
9

segment that runs dry first during springtime (Fig. 4b)and the 500 L/s water inlet (maximum flow duringdrilling) in the tunnel (Fig. 5b).
2. The narrow zone between F2 and F3: uranine detectionat 4DX 18 days after injection corresponds to the highestobserved maximum velocity, 63 m/d. The tracer alsoarrived at the nearby sampling points 25DX, 25 SX,30DX and 30SX. Probably, the tracer travels first alongfault F2 but then follows the dip of the strata towards thesampling points; another reason could be a denselyfractured zone between the two faults.
3. Several arrival points around the fault F4 showedpositive results about 40 d after injection.
4. Two arrival points are related to F5: uranine arrivedafter about 70 d at 10DX and 12DX, but was onlydetectable in charcoal bags. This connection follows afault and fracture zone that is visible both at the surfacestream and in the tunnel; it represents the longest traceddistance (1.4 km) but also the lowest maximumvelocities (18.8–19.5 m/d).
Sulforhodamine G injected in the lower reach ofRampolli Stream, down gradient to the dry reach, wasnot detected at any of the sampling sites. This can beexplained by the relatively low injection quantity (1 kg),the properties of the tracer, which is more prone toadsorption than uranine (Käss 1998), and/or a lessdeveloped stream-tunnel connection.
At the Veccione test site, both tracers injected into thestream were detected at numerous sampling sites in the
northern sector of the tunnel (Table 2, Fig. 6). In general,uranine delivered better results, i.e. a greater number ofpositive detections and breakthrough curves with clearerpeaks and shorter tails, demonstrating a more conservativebehaviour than sulforhodamine G (Fig. 7). In general, thetracers arrived only on the side of the tunnel that isoriented towards the stream, indicating that the tunnelseparates the aquifer. Only near p. 49+000 km, where thetunnel passes below the stream, was uranine detected onboth sides of the tunnel. Despite the large number ofpositive sampling sites, four main connection zones can beidentified:
1. Lower part of Rovigo Stream: uranine arrived in theshortest times (1–2 d), with highest velocities andhighest concentrations (up to 10 ppb). Eleven positivedetections in this sector are located on the western sideof the main tunnel.
2. Confluence of Veccione and Rovigo streams: thehighest water inflows into the tunnel occur in a 300-m-long sector near the confluence point. Uraninearrived after 17 d, with a maximum velocity of 20 m/d and concentrations < 0.14 ppb. Eight positivedetections are located on the eastern side of the tunnel,which coincides with the geometry of the stream.
3. Veccione valley from p. 47+500 km to p. 49+000 km:thirteen arrival points are dispersed along this reach(eight on the eastern side and five on the western one),not clearly related to any particular tectonic structures;the first detections occurred after 8 days, with similarconcentrations to those in zone 2.
Table 2 Summary of uranine tracer test results: minimum three-dimensional distance between stream and sampling point inside the tunnel(L), discharge of water inlet (Q), time of first detection (t1), peak time (tp), peak concentration (cp), and the corresponding maximumvelocity (vmax) and peak velocity (vp), tracer recoveries (R), as well as the velocity (v) and dispersivities (α) and regression coefficient (R2)obtained by modelling (ADM); NDnot determined, NAnot applicable. The table shows the results obtained at 20 representative tracerarrival points: 12 of 35 from the northern sector of the tunnel and 8 of 13 from the southern sector
ID water inlet Basic data ADML Q t1 tp cp vmax vp R v α R2
(m) (L/min) (d after injection) (μg/L) (m/d) (m/d) (g) (m/d) (m)
Northern sector 9DX 117 1 1 2 4.33 116.8 58.4 0.02 42.3 14.7 0.96220DX 135 6 1 2 6.72 135.4 67.7 0.39 28.7 27.4 0.929RW 94 420 1 1 5.66 94.0 94.0 9.17 NA NA NA83SX 373 156 17 45 0.13 21.9 8.3 1.71 5.8 68.7 0.98385SXm 373 30 17 45 0.15 22.0 8.3 0.39 5.2 89.2 0.90185SXv 373 135 17 50 0.13 22.0 7.5 1.53 5.2 87.8 0.96088SX 403 40 17 45 0.12 23.7 9.0 0.37 5.8 65.1 0.97089SX 403 34 17 45 0.12 23.7 9.0 0.31 5.6 68.8 0.960111SX 468 175 30 91 0.05 15.6 5.1 0.64 3.0 74.0 0.987141SX 203 3 8 26 0.90 25.4 7.8 0.21 3.1 82.6 0.965141DX 203 2 8 30 0.55 25.4 6.8 0.08 2.8 60.8 0.901148SX 206 4 8 30 0.36 25.8 6.9 0.15 1.0 239.0 0.968OSTDX 91 600 4 17 5.12 22.8 5.4 216 1.5 40.2 0.970
Southern sector 3DX 1,114 ND 35 ND ND 31.8 ND ND NA NA NA4DX 1,140 ND 18 56 0.37 63.3 20.4 ND 5.5 574.9 0.95030DX 1,110 ND ND 69 0.28 ND 16.1 ND 14.4 25.2 0.87025DX 1,107 ND ND 53 0.07 ND 20.9 ND 18.7 44.9 0.7996DXa 1,113 ND 35 ND ND 31.8 ND ND NA NA NA7DXv 1,122 ND 47 ND ND 23.9 ND ND 5.7 123.8 0.7307DXm 1,122 ND 47 ND ND 23.9 ND ND 10.1 21.7 0.81710DXa 1,348 ND 69 ND ND 19.5 ND ND NA NA NA12DXa 1,390 ND 74 ND ND 18.8 ND ND NA NA NA
aOnly charcoal bags were positive
10
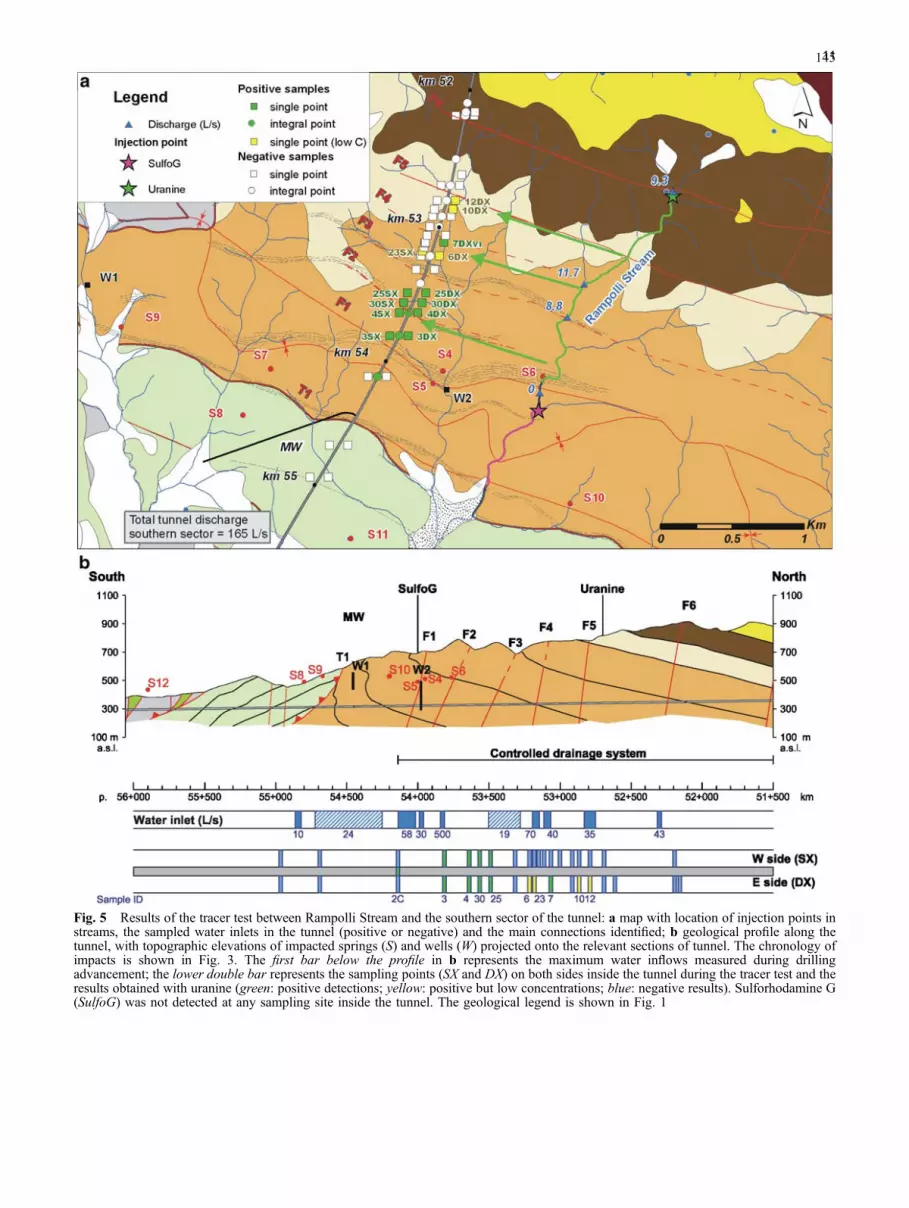
Fig. 5 Results of the tracer test between Rampolli Stream and the southern sector of the tunnel: a map with location of injection points instreams, the sampled water inlets in the tunnel (positive or negative) and the main connections identified; b geological profile along thetunnel, with topographic elevations of impacted springs (S) and wells (W) projected onto the relevant sections of tunnel. The chronology ofimpacts is shown in Fig. 3. The first bar below the profile in b represents the maximum water inflows measured during drillingadvancement; the lower double bar represents the sampling points (SX and DX) on both sides inside the tunnel during the tracer test and theresults obtained with uranine (green: positive detections; yellow: positive but low concentrations; blue: negative results). Sulforhodamine G(SulfoG) was not detected at any sampling site inside the tunnel. The geological legend is shown in Fig. 1
14511
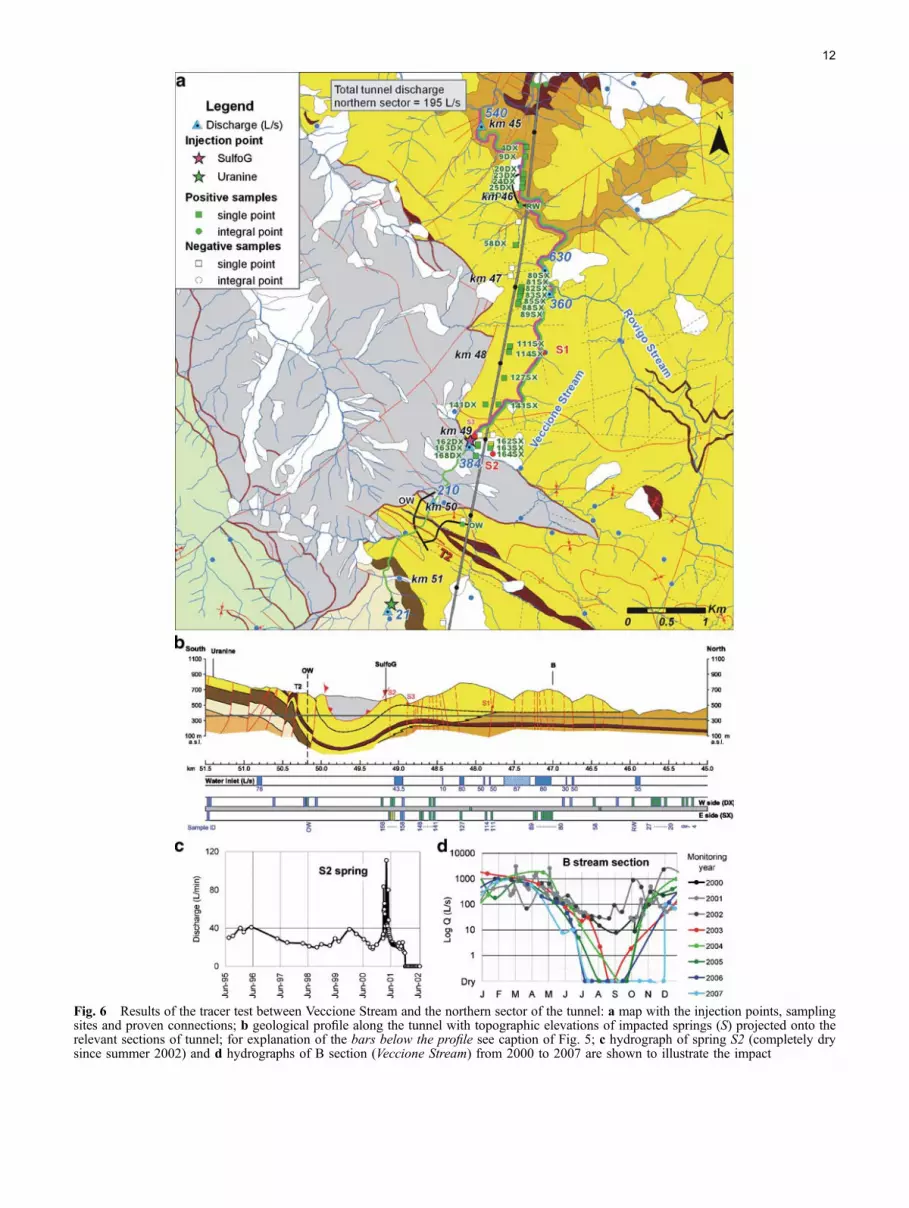
Fig. 6 Results of the tracer test between Veccione Stream and the northern sector of the tunnel: a map with the injection points, samplingsites and proven connections; b geological profile along the tunnel with topographic elevations of impacted springs (S) projected onto therelevant sections of tunnel; for explanation of the bars below the profile see caption of Fig. 5; c hydrograph of spring S2 (completely drysince summer 2002) and d hydrographs of B section (Veccione Stream) from 2000 to 2007 are shown to illustrate the impact
12
4. The integral water sample (i.e. sample taken at acollector that includes water from all outlets furtherupgradient) from the access window OW was alsopositive for uranine, indicating a stream tunnel con-nection along the thrust fault T2.
The tracer recoveries were generally low: 2.3% of theuranine injected into Veccione Stream was recovered in thenorthern sector of the tunnel; the recoveries of the otherexperiments were even lower or undetermined, as it was notpossible tomeasure flow rates at all sampling sites (Table 2);furthermore, some connections were only proven bycharcoal samples. The low recoveries can be explainedby the experimental and hydrogeological conditions suchas injection into surface streams, double-porosity effectsand retardation in the unsaturated zone and aquifer, anddifficult sampling and monitoring conditions in the tunnel.
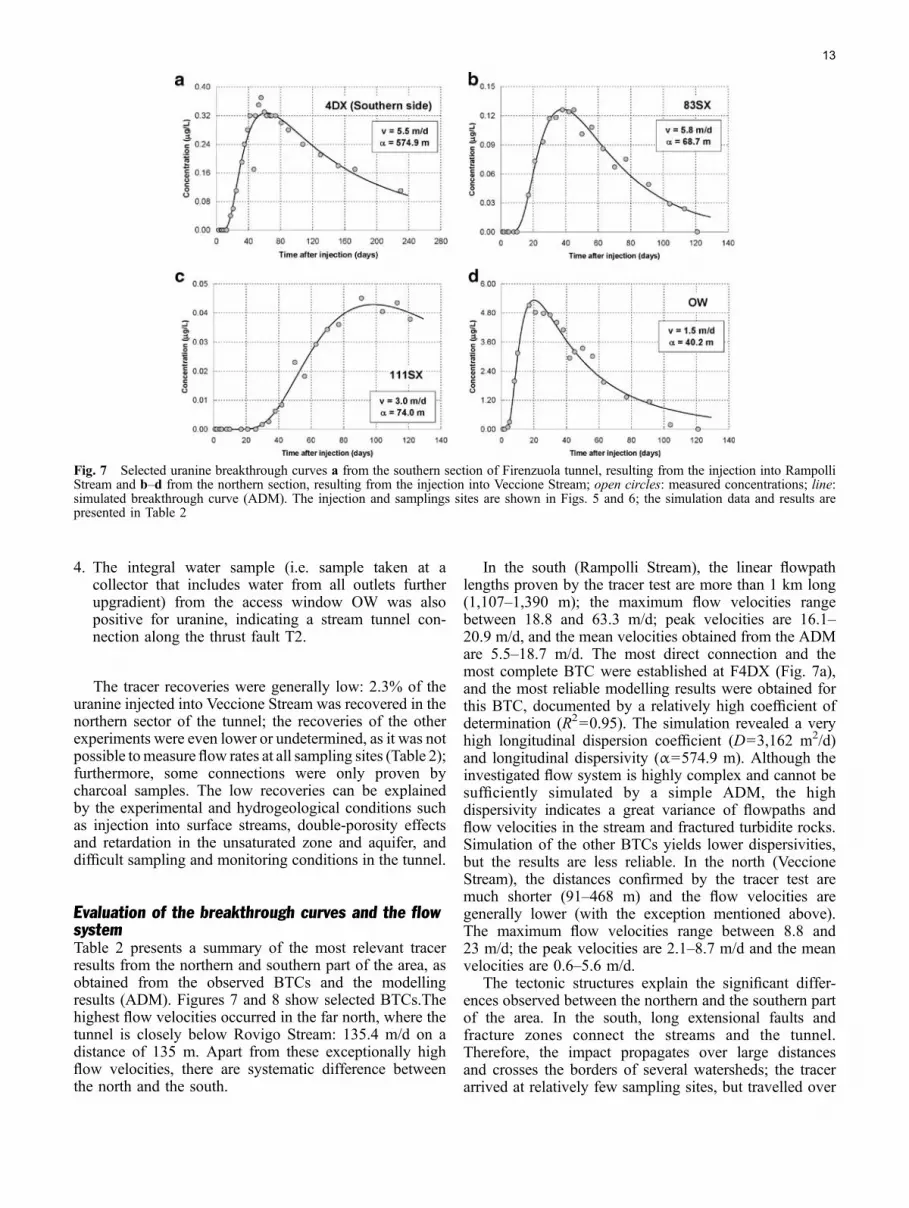
Evaluation of the breakthrough curves and the flowsystemTable 2 presents a summary of the most relevant tracerresults from the northern and southern part of the area, asobtained from the observed BTCs and the modellingresults (ADM). Figures 7 and 8 show selected BTCs.Thehighest flow velocities occurred in the far north, where thetunnel is closely below Rovigo Stream: 135.4 m/d on adistance of 135 m. Apart from these exceptionally highflow velocities, there are systematic difference betweenthe north and the south.
In the south (Rampolli Stream), the linear flowpathlengths proven by the tracer test are more than 1 km long(1,107–1,390 m); the maximum flow velocities rangebetween 18.8 and 63.3 m/d; peak velocities are 16.1–20.9 m/d, and the mean velocities obtained from the ADMare 5.5–18.7 m/d. The most direct connection and themost complete BTC were established at F4DX (Fig. 7a),and the most reliable modelling results were obtained forthis BTC, documented by a relatively high coefficient ofdetermination (R2=0.95). The simulation revealed a veryhigh longitudinal dispersion coefficient (D=3,162 m2/d)and longitudinal dispersivity (α=574.9 m). Although theinvestigated flow system is highly complex and cannot besufficiently simulated by a simple ADM, the highdispersivity indicates a great variance of flowpaths andflow velocities in the stream and fractured turbidite rocks.Simulation of the other BTCs yields lower dispersivities,but the results are less reliable. In the north (VeccioneStream), the distances confirmed by the tracer test aremuch shorter (91–468 m) and the flow velocities aregenerally lower (with the exception mentioned above).The maximum flow velocities range between 8.8 and23 m/d; the peak velocities are 2.1–8.7 m/d and the meanvelocities are 0.6–5.6 m/d.
The tectonic structures explain the significant differ-ences observed between the northern and the southern partof the area. In the south, long extensional faults andfracture zones connect the streams and the tunnel.Therefore, the impact propagates over large distancesand crosses the borders of several watersheds; the tracerarrived at relatively few sampling sites, but travelled over
Fig. 7 Selected uranine breakthrough curves a from the southern section of Firenzuola tunnel, resulting from the injection into RampolliStream and b–d from the northern section, resulting from the injection into Veccione Stream; open circles: measured concentrations; line:simulated breakthrough curve (ADM). The injection and samplings sites are shown in Figs. 5 and 6; the simulation data and results arepresented in Table 2
13
large distances (> 1 km) and at high maximum flowvelocities (up to 63 m/d). In the north, the seepage fromthe streams to the tunnel is distributed over manyfractures, as demonstrated by the large number of tracerarrival points in the tunnel. The proven connections in thiszone are shorter (< 500 m) and maximum flow velocitiesare slower (generally < 26 m/d), with the exception ofsome short and rapid connections in a zone where thetunnel is directly below the stream in a highly fracturedzone. Therefore, the tracer tests have also confirmed thatthere is a permeability gradient from north to south,because of an increasing A/P ratio of the turbidite rocksand an increasing intensity of extensional faulting towardsthe south.
Conclusions and outlook
The tracer tests confirmed that the Firenzuola high-speedrailway tunnel drains the groundwater and surface watersin the region and has entirely altered the natural flow
system. Before the tunnel was drilled, the fracturedturbidite aquifer discharged towards small springs andmountain streams, and surface and groundwater divideslargely coincided with topographic divides. Now, thetunnel has lowered the water table below the level of thestreams, causing inversion of the natural groundwater-surface water interactions: gaining streams have trans-formed into perched and losing streams. The conceptualmodel concerning the impact of the tunnel proposed byGargini et al. (2008) and shown in Fig. 2 was fullyconfirmed.
Significant differences were observed between thenorthern and the southern sector of the area: the highervelocities and longer distances travelled by the tracers inthe southern sector confirm the higher permeability of theturbidites in this zone and also explain the larger tunnelinterference radius.
The detailed stream flow surveys done before and afterthe tunnel drilling made it possible to quantify the totalbaseflow loss: 254 L/s. As the total tunnel outflow (355 L/s in 2005–2006) is higher than this value, further baseflowlosses have to be expected, i.e. the system has not yetreached a steady state. The slightly lower annual precip-itation during these years cannot explain the dramaticbaseflow loss.
The drying up of streams and springs has severe socio-economic and ecological consequences that were, howev-er, not studied within the framework of this project, whichfocused on the hydrogeological aspects. As the ground-water level has been lowered by about 100 m, thevegetation on the lower slopes, in the valleys and nearthe streams has probably lost contact with the groundwa-ter, which may alter the plant communities. The mostsevere ecological impact is on the fauna in the streams,including fish, aquatic invertebrates and different type oflarvae. Although this impact has unfortunately not beenmonitored, it is quite obvious and can also be deducedfrom studies focusing on the impact of droughts on streamfauna (e.g. Reznickova et al. 2007). The type and degreeof ecological impact depends on the type and degree ofhydrological depletion. In stream sections that rancompletely dry, all aquatic fauna has obviously disap-peared. In periodically dry sections and where dischargehas substantially decreased, the species spectrum isexpected to change in order to adapt to the newconditions, but species that rely on permanently flowingwater and high flow rates have disappeared or willdisappear as the drainage by the tunnel continues.
Obviously, the construction of the tunnel was based onincorrect assumptions. The turbidite formations werepreviously not considered as aquifers, partly because thereare generally only few hydrogeological studies dealingwith turbidite rocks and partly because the potentialimpact of the tunnel on the groundwater and surfacewaters in the region was not sufficiently and thoroughlystudied before the tunnel was drilled.
Now, the damage has been done, and restoration is notpossible as long as the tunnel continues to drain theaquifer. Flow measurements and monitoring indicate that a
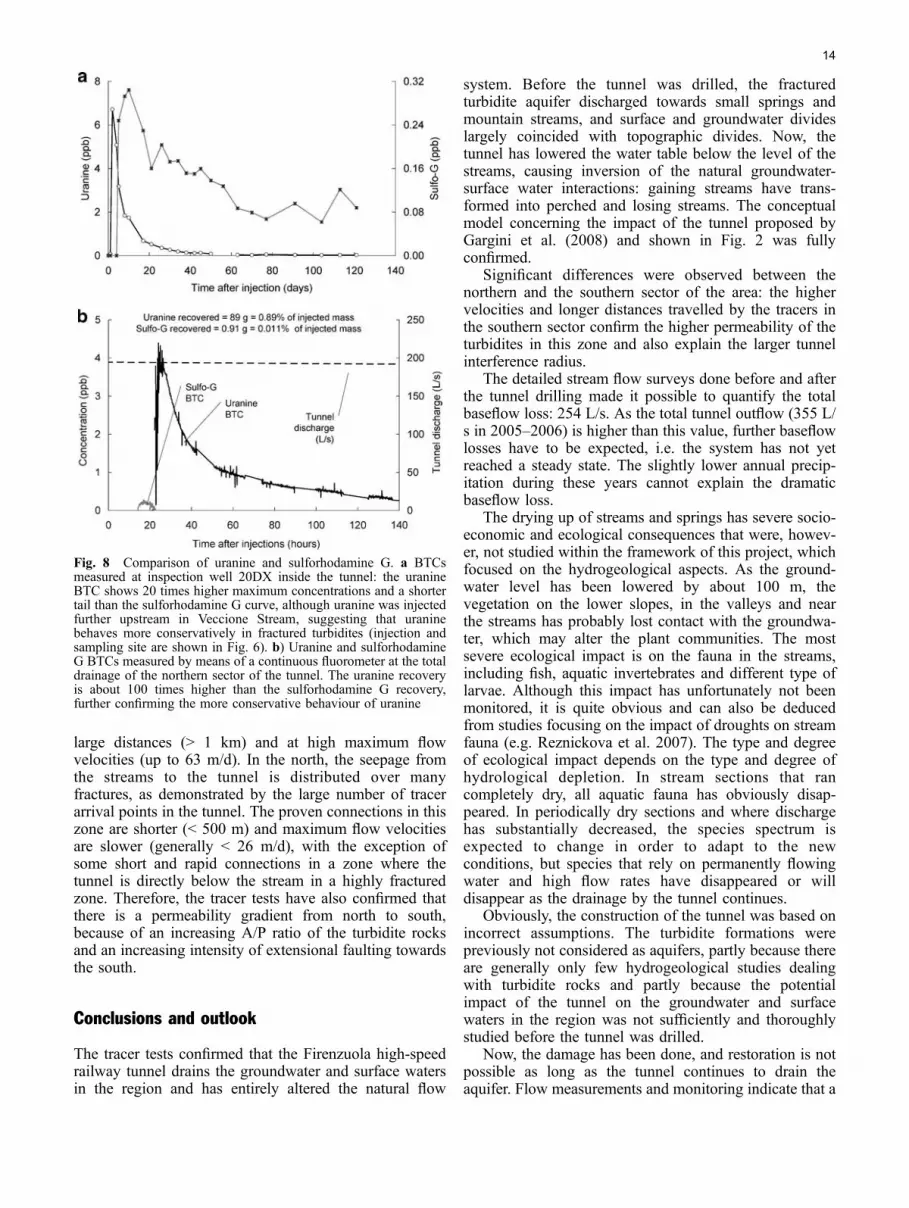
Fig. 8 Comparison of uranine and sulforhodamine G. a BTCsmeasured at inspection well 20DX inside the tunnel: the uranineBTC shows 20 times higher maximum concentrations and a shortertail than the sulforhodamine G curve, although uranine was injectedfurther upstream in Veccione Stream, suggesting that uraninebehaves more conservatively in fractured turbidites (injection andsampling site are shown in Fig. 6). b) Uranine and sulforhodamineG BTCs measured by means of a continuous fluorometer at the totaldrainage of the northern sector of the tunnel. The uranine recoveryis about 100 times higher than the sulforhodamine G recovery,further confirming the more conservative behaviour of uranine
14
steady state has not yet been reached, so the situation mayget worse. Several mitigation strategies are discussed inorder to preserve at least a minimum stream flow:
& From the surface: local streambed sealing or bypassconduits in zones of preferred infiltration, e.g. whereimportant extensional fractures and faults cross thestreams. However, the main problem is not theinfiltration of stream water into the underground, butthe regional groundwater drawdown that has eliminat-ed stream baseflow.
& From the tunnels to the surface: pumping of thedrainage water to the upper sections of the impactedstreams. This is highly energy consuming, and thechemical water quality of the drainage water is not thesame as the initial stream water composition.
& From inside the tunnels: control of drainage by closingdrainage tubes and monitoring water pressure abovethe concrete (‘controlled drainage’). Reducing thedrainage by the tunnel is actually an importantmeasure. However, the impermeable linings of thetunnel cannot withstand high water pressures.
Apart from these main conclusions, the study alsorevealed several other findings of general relevanceconcerning the employed methodology and the hydro-geology of turbidite formations. It was possible to showthat tracer tests are a feasible technique to study thehydrogeological impacts of tunnels. Otz et al. (2003) alsodid tracer tests between the land surface and monitoringpoints in an exploratory gallery built to test the potentialimpact of the Swiss Alp-Transit tunnel. However, theyonly detected minor traces at a few sampling points andconcluded that there is no significant surface-tunnelconnection.
After a first qualitative experiment in 2002, conductedin order to test the methodology applicability (Gargini etal. 2008), the experiments reported here are the first large-scale quantitative tracer tests in turbidite rocks that allowsharpening of the methodology and characterization of theflow systems. As indicated in the introduction, severalother tracer tests have been realized in other catchmentsimpacted by the tunnels. Uranine always delivered thebest results. The tracer tests with tinopal CBS-X, LiCl andKI entirely failed, probably because of the higherdetection limits and/or less favourable transport properties.The tracer test with sulforhodamine G described in thisstudy was successful, but the analysis of the breakthroughcurves clearly showed significant adsorption compared touranine. A tracer test with sulforhodamine G in anothercatchment failed. In karst aquifer systems, a wide range oftracers can be used (e.g. Goldscheider 2005), whileturbidite rocks seem to require a more careful selectionof tracers. Based on the experiences presented here, onlyuranine can be recommended for large-scale tracer tests inturbidite formations.
To date, very few studies focus on the hydrogeology ofturbidite formations and flysch environments, often on thescale of entire sedimentary basins such as the Swiss
Molasse Basin (Keller 1992) and the Central North Slopeforeland basin, Alaska (Nunn et al. 2005). The studyreported here is among the few that investigates experi-mentally the hydrogeology of turbidite formations on acatchment scale and the tracer tests delivered quantitativeinformation on the flow directions and flow velocities infractured turbidite sandstones.
Acknowledgements The authors gratefully acknowledge FlorenceCounty Government for financing the study; the tunnellingcompany CAVET for hydrological monitoring (HMP) and drillingadvancement data and for allowing sampling inside the tunnels;Geologic, Seismic and Soil Service of Emilia-Romagna Region forgeological cartography. A special thanks to all the people who tookpart in the field activities and to Dr. T. Bechtel (Lancaster,Pennsylvania, USA) for checking the manuscript.
References
Amy LA, Talling PJ (2006) Anatomy of turbidites and linkeddebrites based on long distance (120 x 30km) bed correlation,Marnoso Arenacea Formation, Northern Apennines, Italy.Sedimentology 53:161–212
Atkinson JH, Mair RJ (1983) Loads on leaking and watertighttunnel linings, sewers and buried pipes due to groundwater.Geotechnique 33(3):341–344
Bear J (1979) Hydraulics of groundwater. McGraw-Hill, New York,567 pp
Behrens H, Beims U, Dieter H, Dietze G, Eikmann T, Grummt T,Hanisch H, Henseling H, Käss W, Kerndorff H, Leibundgut C,Müller-Wegener U, Ronnefahrt I, Scharenberg B, Schleyer R,Schloz W, Tilkes F (2001) Toxicological and ecotoxicologicalassessment of water tracers. Hydrogeol J 9(3):321–325
Bendkik AM, Boccaletti M, Bonini M, Poccianti C, Sani F (1994)Structural evolution of the outer Apennine chain (Firenzuola-Città di Castello sector and Montefeltro area, Tuscan-Romagnanand Umbro-Marchean Apennine). Mem Soc Geol It 48:515–522
Boccaletti M, Gianelli G, Sani F (1997) Tectonic regime, graniteemplacement and crustal structure in the inner zone of theNorthern Apennines (Tuscany, Italy): a new hypothesis.Tectonophys 270:127–143
Cerrina Feroni A, Martelli L, Martinelli P and Ottria G, concontributi di Catanzariti R (2002) Carta geologico-strutturaledell’Appennino emiliano-romagnolo in scala 1:250.000. (Geo-logic-structural map of the Apennines of Emilia-Romagnaregion, at scale 1:250,000). Regione Emilia-Romagna - CNR,Pisa. S.EL.CA., Florence
Cesano D, Olofsson B, Bagtzoglou AC (2000) Parameters regulat-ing groundwater inflows into hard rock tunnels: a statisticalstudy of the Bolmen Tunnel in southern Sweden. Tunn UndergrSpace Technol 15(2):153–165
Cibin U, Di Giulio A, Martelli L, Catanzariti R, Poccianti C,Rosselli S, Sani F (2004) Factors controlling foredeep turbiditedeposition: the case of Northern Apennines (Oligo-Miocene,Italy). In: Lomas SA, Joseph P (eds) Confined turbidite systems.Geol Soc Lond Spec Publ 222:115–134
Day MJ (2004) Karstic problems in the construction of Milwaukee’sDeep Tunnels. Environ Geol 45(6):859–863
Feinstein DT, Dunning CP, Hunt RJ, Krohelski JT (2003) Stepwiseuse of GFLOW and MODFLOW to determine relativeimportance of shallow and deep receptors. Ground Water 41(2):190–199
Gargini A, Piccinini L, Martelli L, Rosselli S, Bencini A, MessinaA, Canuti P (2006) Hydrogeology of turbidites: a conceptualmodel derived by the geological survey of Tuscan-EmilianApennines and the environmental monitoring for the high speedrailway tunnel connection between Florence and Bologna. BollSoc Geol Ital 125:293–327
15

Gargini A, Vincenzi V, Piccinini L, Zuppi GM, Canuti P (2008)Groundwater flow systems in turbidites of the NorthernApennines (Italy): natural discharge and high speed railwaytunnel drainage. Hydrogeol J (in press). doi:10.1007/s10040-008-0352-8
Goldscheider N (2005) Fold structure and underground drainagepattern in the alpine karst system Hochifen-Gottesacker.Eclogae Geol Helv 98(1):1–17
Goodman RF, Moye DG, Van Schaikwyk A, Javandel I (1965)Ground water inflows during tunnel driving. Bull Int Assoc EngGeol 2(1):39–56
Ii H, Kagami H (1997) Groundwater level and chemistry changesresulting from tunnel construction near Matsumoto City, Japan.Environ Geol 31(1–2):76–84
Käss W (1998) Tracing technique in geohydrology. Balkema,Rotterdam, 600 pp
Keller B (1992) Hydrology of the Swiss Molasse basin: a review ofcurrent knowledge and considerations for the future. EclogaeGeol Helv 85(3):611–652
Kitterod NO, Colleuille H, Wong WK, Pedersen TS (2000)Simulation of groundwater drainage into a tunnel in fracturedrock and numerical analysis of leakage remediation, Romer-iksporten tunnel, Norway. Hydrogeol J 8(5):480–493
Kolymbas D, Wagner P (2007) Groundwater ingress to tunnels: theexact analytical solution. Tunn Undergr Space Technol 22(1):23–27
Kreft A, Zuber A (1978) Physical meaning of dispersion equationand its solution for different initial and boundary conditions.Chem Eng Sci 33(11):1471–1480
Kvaerner J, Klove B (2006) Tracing sources of summer streamflowin boreal headwaters using isotopic signatures and watergeochemical components. J Hydrol 331(1–2):186–204
Lee IM, Nam SW, Ahn JH (2003) Effect of seepage forces ontunnel face stability. Can Geotech J 40(2):342–350
Marechal JC, Perrochet P (2003) New analytical solution for thestudy of hydraulic interaction between Alpine tunnels andgroundwater. Bull Soc Geol Fr 174(5):441–448
Molinero J, Samper J, Juanes R (2002) Numerical modeling of thetransient hydrogeological response produced by tunnel con-struction in fractured bedrocks. Eng Geol 64(4):369–386
Nunn JA, Hanor JS, Lee Y (2005) Migration pathways in theCentral North Slope foreland basin, Alaska USA: solute and
thermal constraints on fluid flow simulations. Basin Res 17(3):403–416
Otz MH, Otz HK, Otz I, Siegel DI (2003) Surface water/groundwater interaction in the Piora Aquifer, Switzerland:evidence from dye tracing tests. Hydrogeol J 11(2):228–239
Perrochet P (2005) Confined flow into a tunnel during progressivedrilling: an analytical solution. Ground Water 43(6):943–946
Perrochet P, Dematteis A (2007) Modeling transient discharge into atunnel drilled in a heterogeneous formation. Ground Water 45(6):786–790
Reznickova P, Paril P, Zahradkova S (2007) The ecological effect ofdrought on the macroinvertebrate fauna of a small intermittentstream: an example from the Czech Republic. Int Rev Hydro-biol 92(4–5):514–526
Ricci Lucchi F (1986) The Oligocene to Recent foreland basins of theNorthern Apennines. Int Assoc Sedimento Spec Publ 8:105–139
Schnegg PA, Flynn R (2002) Online field fluorometers for hydro-geological tracer tests. In: Isotope und Tracer in der Wasserfor-schung, vol 19. Technische Universität Bergakademie Freiberg,Germany, pp 29–36
Sjolander-Lindqvist A (2005) Conflicting perspectives on water in aSwedish railway tunnel project. Environ Values 14(2):221–239
Toride N, Leij FJ, van Genuchten MT (1993) A comprehensive setof analytical solutions for nonequilibrium solute transport withfirst-order decay and zero-order production. Water Resour Res29(7):2167–2182
Toride N, Leij FJ, van Genuchten MT (1999) The CXTFIT code forestimating transport parameters from laboratory or field tracerexperiments. Research Report No. 137, US Salinity Laboratory,USDA, ARS, Riverside, CA
Tseng DJ, Tsai BR, Chang LC (2001) A case study on groundtreatment for a rock tunnel with high groundwater ingression inTaiwan. Tunn Undergr Space Technol 16(3):175–183
Yang SY, Yeh HD (2007) A closed-form solution for a confinedflow into a tunnel during progressive drilling in a multi-layergroundwater flow system. Geophys Res Lett 34(7):L07405
Yoo CS (2005) Interaction between tunneling and groundwater:numerical investigation using three dimensional stress-pore pres-sure coupled analysis. J Geotech Geoenviron Eng 131(2):240–250
Zattin M, Landuzzi A, Picotti V, Zuffa GG (2000) Discriminatingbetween tectonic and sedimentary burial in a fore deepsuccession, Northern Apennines. J Geol Soc Lond 157:629–633
16