COMPARATIVE REPORT ON GRADUATE TRACER SURVEY ...
135
The University of the West Indies REPORT ON GRADUATE TRACER SURVEY OF FIRST DEGREE GRADUATES OF 2008 AND TREND ANALYSIS – COMPARATIVE REPORT FOR MONA, CAVE HILL AND ST AUGUSTINE CAMPUSES One Year After Graduation University Office of Planning and Development – 6 July 2010
-
Upload
khangminh22 -
Category
Documents
-
view
0 -
download
0
Transcript of COMPARATIVE REPORT ON GRADUATE TRACER SURVEY ...

The University of the West Indies
REPORT ON GRADUATE TRACER SURVEY OF FIRST DEGREE GRADUATES OF 2008 AND TREND ANALYSIS – COMPARATIVE REPORT FOR MONA, CAVE HILL AND ST AUGUSTINE CAMPUSES One Year After Graduation University Office of Planning and Development –
6 July 2010

ii | P a g e
COMPARATIVE GRADUATE TRACER SURVEY REPORT (2008 GRADUATES)
This is the second Graduate Tracer Report done for UWI graduates, the first having been done to follow the progress of 2007 graduates. Accordingly this report allows us to compare conditions over the period covered in both reports. Individual Campus reports were done for Mona, Cave Hill and St. Augustine. The relevant reports were shared with Campus Principals and Faculty Deans and this comparative report has been prepared taking feedback from Campus participants into account. The first draft of all reports relevant to the Graduate Tracer Survey was prepared by Mr. Anand Dass. Helpful comments and questions were provided by Mrs. Indrani Bachan-Persad. Feedback from the individual campuses was valuable. This version of the document was finalized following internal discussion at the Office of Planning and Development. It is my hope that you will find this Report on the 2008 Graduates of UWI in the market place informative and useful. I shall be grateful for any thoughts, comments or feedback. You may send emails to [email protected] or [email protected]. It is also my hope that access to this document will help to enrich discussion at the Mid-term Review in August.
Bhoendradatt Tewarie
Pro Vice Chancellor, Planning and Development

iii | P a g e
TABLE OF CONTENTS
EXECUTIVE SUMMARY .......................................................................................................................................... IX
SECTION 1 – INTRODUCTION, METHODOLOGY AND OBJECTIVES OF SURVEY ........................................................ 1
INTRODUCTION ..................................................................................................................................................................... 1
METHODOLOGY .................................................................................................................................................................... 1
MAIN OBJECTIVES OF SURVEY .......................................................................................................................................... 2
SECTION 2 - RESPONSE RATES AND DEMOGRAPHIC PROFILE OF RESPONDENTS ................................................... 3
RESPONSE RATES BY FACULTY/SCHOOL ...................................................................................................................... 3
Trend Analysis –Response Rates .......................................................................................................................... 3
Migration and Response Rate .............................................................................................................................. 4
RESPONDENTS BY SEX ......................................................................................................................................................... 4
AGE PROFILE OF RESPONDENTS ...................................................................................................................................... 5
SECTION 3 - FURTHER STUDIES .............................................................................................................................. 6
RESPONDENTS CURRENTLY PURSUING FURTHER STUDIES ................................................................................... 6
Trend Analysis – Graduates pursuing Postgraduate Studies ................................................................................ 8
GRADUATE ENROLLMENT IN FURTHER EDUCATION BY INSTITUTION ............................................................. 8
Trend Analysis – Postgraduate Enrolment by Type of Institution ........................................................................ 9
TYPES OF POSTGRADUATE PROGRAMMES RESPONDENTS ARE ENROLLED IN ............................................. 10
Trend Analysis – Enrolment in postgraduate studies by type of programme .................................................... 11
RELATIONSHIP BETWEEN POSTGRADUATE STUDY AND FIELD OF FIRST DEGREE ....................................... 13
SECTION 4 - LABOUR MARKET OUTCOMES – EMPLOYMENT CHARACTERISTICS .................................................. 15
EMPLOYMENT RATES BY FACULTY AND AREA OF STUDY .................................................................................... 15
Employment of graduates in the Trinidad and Tobago Economy ...................................................................... 15
Trend Analysis – Employment Rates .................................................................................................................. 16
Employment of graduates in the Jamaican Economy ........................................................................................ 16
Trend Analysis – Employment Rates .................................................................................................................. 17
Trend Analysis – Employment Rates .................................................................................................................. 18
Impact on the brain drain................................................................................................................................... 19
STATUS OF EMPLOYED GRADUATES ............................................................................................................................ 19
EMPLOYMENT AND STUDY ............................................................................................................................................. 20
Trend Analysis – Employment and Study ........................................................................................................... 20
ARE GRADUATES CHANGING JOBS AFTER FIRST EMPLOYMENT? ...................................................................... 21

iv | P a g e
Trend Analysis – Employed graduates in first job after graduation or otherwise .............................................. 21
EMPLOYMENT BY SECTOR ................................................................................................................................................ 22
Trend Analysis – Employment by Sector............................................................................................................. 22
GRADUATE DESTINATION –MAJOR ACTIVITY OF EMPLOYERS AND TYPE OF JOBS
GRADUATE ARE EMPLOYED IN ...................................................................................................................................... 23
St Augustine Campus-employment by type of job ............................................................................................. 23
Mona Campus-employment by type of job ........................................................................................................ 24
Cave Hill Campus-employment by type of job .................................................................................................... 25
Employment by Major Activity of Employer – All Campuses .............................................................................. 26
SECTION 5 - EMPLOYMENT EARNINGS - MEDIAN MONTHLY SALARIES OF GRADUATES
EMPLOYED FULL-TIME ......................................................................................................................................... 27
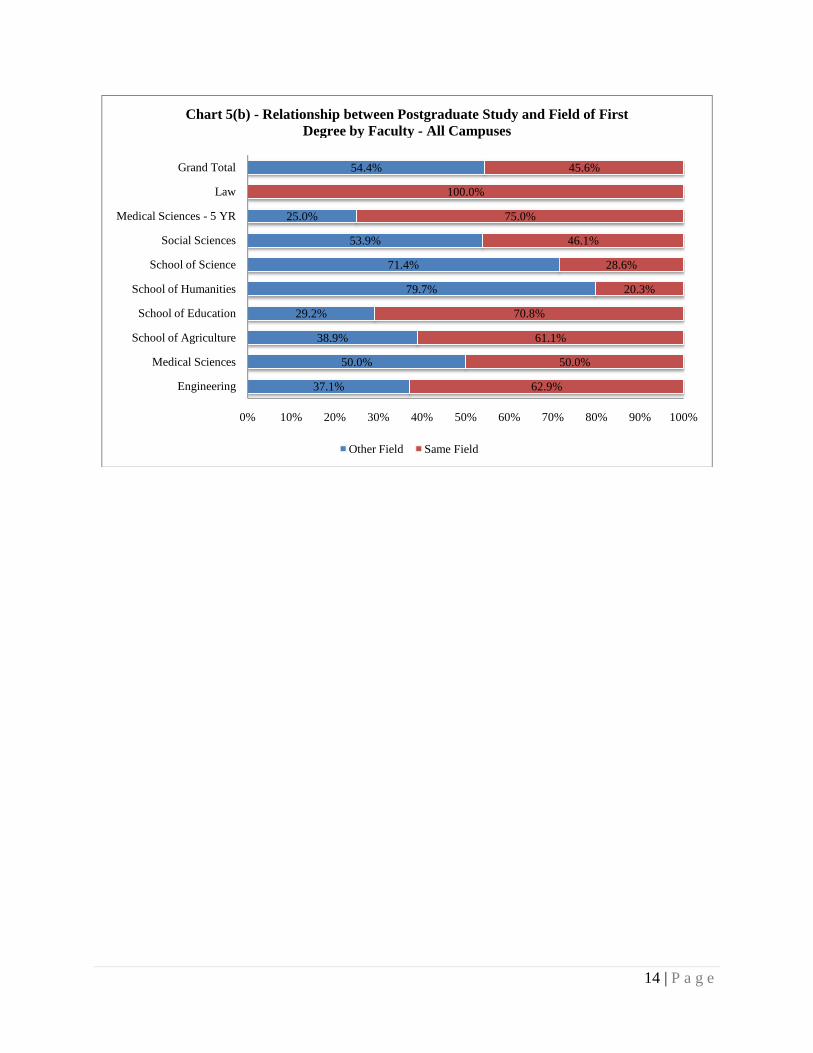
FREQUENCY DISTRIBUTION OF MONTHLY SALARIES OF EMPLOYED GRADUATES ..................................... 27
St Augustine – Graduates employed in Trinidad & Tobago ............................................................................... 27
Mona – Graduates employed in Jamaica ........................................................................................................... 28
Trend Analysis – Frequency Distribution of Salaries ........................................................................................... 28
Cave Hill – Graduates employed in Barbados .................................................................................................... 29
Trend Analysis – Frequency Distribution of Salaries ........................................................................................... 29
MONTHLY SALARIES (MEDIAN) OF EMPLOYED GRADUATES BY FACULTY .................................................... 30
Median Monthly Salaries by Faculty – Graduates employed in Trinidad & Tobago Economy ........................... 30
Trend Analysis – Monthly Median Salaries by Faculty ....................................................................................... 30
Graduate Salaries by Area of Study (Mean and Median) – St Augustine ........................................................... 31
Median Monthly Salaries by Faculty – Graduates employed in the Jamaican Economy ................................... 32
Trend Analysis – Monthly Median Salaries by Faculty ....................................................................................... 32
Graduate Salaries by Area of Study (Mean and Median) - Mona ...................................................................... 34
Median Monthly Salaries by Faculty – Graduates employed in the Barbadian Economy .................................. 36
Trend Analysis – Monthly Median Salaries by Faculty ....................................................................................... 36
Graduate Salaries by Area of Study (Mean and Median) – Cave Hill ................................................................. 37
EARLY CAREER VS MID-CAREER GRADUATES .......................................................................................................... 37
Trend Analysis – Early Career vs Mid Career Graduates .................................................................................... 39
GRADUATE SALARIES BY SECTOR ................................................................................................................................. 41
GENDER DIFFERENTIALS IN SALARIES ........................................................................................................................ 41
Trend Analysis – Median Salaries by Gender ..................................................................................................... 42
THE INFLUENCE OF CLASS OF DEGREE ON INCOME .............................................................................................. 42
Trend Analysis – Influence of Class of Degree on Income .................................................................................. 43
SECTION 6 -SKILLS MATCH AND JOB SATISFACTION ............................................................................................. 44
ALIGNMENT IF CURRENT JOB TO FIRST DEGREE EARNED .................................................................................... 44
Trend Analysis – Alignment of current job to degree earned ............................................................................. 45

v | P a g e
RELATION OF JOB TO QUALIFICATION – IS THE MINIMUM REQUIREMENT FOR CURRENT
JOB A FIRST DEGREE ........................................................................................................................................................... 46
Trend Analysis – Minimum Requirement for Current Job................................................................................... 48
JOB SATISFACTION .............................................................................................................................................................. 49
St Augustine Graduates ...................................................................................................................................... 49
Mona Graduates ................................................................................................................................................ 50
Cave Hill Graduates ............................................................................................................................................ 50
SECTION 7 - PREPARATION FOR THE JOB MARKET – SKILLS AND ATTRIBUTES ACQUIRED
THROUGH BACHELORS DEGREE ........................................................................................................................... 52
SUMMARY OF GRADUATES’ OPINION ON THEIR DEVELOPMENT OF ATTRIBUTES/SKILLS –
PERCENTAGE OF RESPONDENTS SAYING ‘STRONGLY’ ENHANCED RANKED IN
ASCENDING ORDER: 2007 AND 2008 GRADUATES COMPARED ............................................................................ 52
Trend Analysis – Graduates’ Opinion, Mona ...................................................................................................... 53
Trend Analysis – Graduates’ Opinion, Cave Hill ................................................................................................. 55
Trend Analysis – Graduates’ Opinion, St. Augustine .......................................................................................... 56
TREND ANALYSIS - GRADUATES’ OPINION ON THEIR DEVELOPMENT OF ATTRIBUTES/SKILLS BY
FACULTY/SCHOOL – PERCENTAGE SAYING ‘STRONG’ .......................................................................................... 57
Trend Analysis – Graduates’ Opinion on their Personal and Professional Development ................................... 59
SECTION 8– SUMMARY, ISSUES TO CONSIDER AND TREND ANALYSIS ................................................................. 60
POSITIVE TRENDS ................................................................................................................................................................ 60
CHALLENGING TRENDS ................................................................................................................................................... 60
TREND ANALYSIS – WHAT HAS CHANGED SINCE THE 2007 SURVEY? ............................................................... 62
ISSUES TO CONSIDER ARISING OUT OF MAJOR FINDINGS OF SURVEY ............................................................. 62
GENERAL OBSERVATIONS ................................................................................................................................................ 64
APPENDICIES TO REPORT ON GRADUATE TRACER SURVEY OF FIRST DEGREE GRADUATES OF 2008
AND TREND ANALYSIS ......................................................................................................................................... 65
APPENDIX 1A ENROLMENT IN FURTHER STUDIES BY GRADUATES’ FIRST DEGREE, PROGRAM
TYPE ENROLLED IN, FIELD OF STUDY AND NAME OF INSTITUTION – ST AUGUSTINE CAMPUS .............. 66
APPENDIX 1B - ENROLMENT IN FURTHER STUDIES BY GRADUATES’ FIRST DEGREE,
PROGRAM TYPE ENROLLED IN, FIELD OF STUDY AND NAME OF INSTITUTION – MONA CAMPUS......... 73
APPENDIX 1C - ENROLMENT IN FURTHER STUDIES BY GRADUATES’ FIRST DEGREE,
PROGRAM TYPE ENROLLED IN, FIELD OF STUDY AND NAME OF INSTITUTION – CAVE HILL CAMPUS 78
APPENDIX 2A - COMPARATIVE EMPLOYMENT RATES BY FACULTY AND AREA
OF STUDY – TRINIDAD AND TOBAGO .......................................................................................................................... 80
APPENDIX 2B - COMPARATIVE EMPLOYMENT RATES BY FACULTY AND AREA
OF STUDY – JAMAICA ......................................................................................................................................................... 81

vi | P a g e
APPENDIX 2C - COMPARATIVE EMPLOYMENT RATES BY FACULTY AND AREA
OF STUDY – BARBADOS ..................................................................................................................................................... 82
APPENDIX 3A - LIST OF EMPLOYERS AND JOB TITLES – ST AUGUSTINE CAMPUS .......................................... 83
Engineering ........................................................................................................................................................ 83
Medical Sciences – St Augustine ........................................................................................................................ 85
Agriculture – St Augustine .................................................................................................................................. 86
Science – St Augustine ........................................................................................................................................ 87
Humanities – St Augustine ................................................................................................................................. 89
Education – St Augustine ................................................................................................................................... 91
Social Sciences – St Augustine ............................................................................................................................ 92
APPENDIX 3B - LIST OF EMPLOYERS AND JOB TITLES – MONA CAMPUS........................................................... 96
Pure & Applied Sciences ..................................................................................................................................... 96
Medical Sciences - Mona ................................................................................................................................... 98
Humanities - Mona ........................................................................................................................................... 100
Education - Mona ............................................................................................................................................. 103
Social Sciences - Mona ..................................................................................................................................... 106
APPENDIX 3C LIST OF EMPLOYERS AND JOB TITLES – CAVE HILL CAMPUS .................................................. 112
Pure & Applied Sciences ................................................................................................................................... 112
Humanities and Education – Cave Hill.............................................................................................................. 113
Social Sciences – Cave Hill ................................................................................................................................ 114
APPENDIX 4A COMPARATIVE MONTHLY MEDIAN SALARIES BY FACULTY AND
AREA OF STUDY – ST AUGUSTINE CAMPUS .............................................................................................................. 117
APPENDIX 4B COMPARATIVE MONTHLY MEDIAN SALARIES BY FACULTY AND AREA OF STUDY –
MONA CAMPUS ................................................................................................................................................................. 118
APPENDIX 5 - GRADUATES’ OPINION OF UWI’S CONTRIBUTION TO THEIR ATTRIBUTES/SKILLS BY
FACULTY – ALL .................................................................................................................................................................. 119
vii | P a g e
LIST OF TABLES
TABLE 1- RESPONSE RATES BY FACULTY AND CAMPUS – SURVEY OF 2008 GRADUATES .......................................... 3
TABLE 2 – SURVEY RESPONDENTS BY GENDER AND CAMPUS ..................................................................................... 4
TABLE 3(A) - % DISTRIBUTION OF RESPONDENTS BY AGE GROUP AND CAMPUS ....................................................... 5
TABLE 3(B) - % DISTRIBUTION OF RESPONDENTS BY AGE GROUP AND FACULTY ....................................................... 5
TABLE 4 – FURTHER STUDIES AND THE NEW GRADUATE BY CAMPUS/FACULTY- 2008.......................................... 7
TABLE 5 (A)- EMPLOYMENT RATES OF GRADUATES IN TRINIDAD &TOBAGO ECONOMY BY
FACULTY/SCHOOL AREA OF STUDY-2008 ....................................................................................................... 15
TABLE 5(B) - EMPLOYMENT RATES OF GRADUATES IN JAMAICAN ECONOMY BY FACULTY/
SCHOOL AREA OF STUDY-2008. ........................................................................................................................ 17
TABLE 5(C) - EMPLOYMENT RATES OF GRADUATES IN BARBADIAN ECONOMY BY FACULTY/
SCHOOL AREA OF STUDY-2008 ......................................................................................................................... 18
TABLE 6 - TREND ANALYSIS – EMPLOYMENT AND STUDY - % DIST BY CAMPUS...................................................... 21
TABLE 7 - EMPLOYED GRADUATES BY FIRST JOB AFTER GRADUATION OR OTHERWISE ............................................ 21
TABLE 8(A) – GRADUATES EMPLOYED IN TRINIDAD AND TOBAGO BY TYPE OF JOB ................................................ 24
TABLE 8(B) – GRADUATES EMPLOYED IN JAMAICA BY TYPE OF JOB .......................................................................... 25
TABLE 8(C) – GRADUATES EMPLOYED IN BARBADOS BY TYPE OF JOB AND FACULTY .............................................. 25
TABLE 9 - EMPLOYER BY MAJOR ACTIVITY AND CAMPUS ......................................................................................... 26
TABLE 10 – FREQUENCY DISTRIBUTION OF MONTHLY EARNINGS OF GRADUATES ................................................. 27
TABLE 11 – FREQUENCY DISTRIBUTION OF MONTHLY EARNINGS OF GRADUATES IN
FULL-TIME EMPLOYMENT .................................................................................................................................. 28
TABLE 12 – FREQUENCY DISTRIBUTION OF MONTHLY EARNINGS OF GRADUATES ................................................. 29
TABLE 13(A) – COMPARATIVE MEDIAN MONTHLY SALARIES OF EARLY CAREER VS.
MID-CAREER GRADUATES-2008 GRADUATES ................................................................................................. 39
TABLE 13(B) – COMPARATIVE MEDIAN MONTHLY SALARIES OF EARLY CAREER VS.
MID-CAREER GRADUATES-2007 GRADUATES ................................................................................................. 39
TABLE 14 – MEDIAN SALARIES BY SECTOR-2008 ....................................................................................................... 41
TABLE 15(A) - MEDIAN SALARIES (FT EMPLOYMENT) BY GENDER-2008 GRADUATES ............................................ 41
TABLE 15(B) - MEDIAN SALARIES BY GENDER – 2007 GRADUATES .......................................................................... 41
TABLE 16(A) – MEDIAN SALARIES OF GRADUATES BY CLASS OF DEGREE – 2008 GRADUATES ............................... 42

viii | P a g e
TABLE 16(B) – MEDIAN SALARIES OF GRADUATES BY CLASS OF DEGREE – 2007 GRADUATES ................................ 42
TABLE 17 - ALIGNMENT OF FIRST DEGREE TO CURRENT JOB (% DIST.) – TREND ANALYSIS ................................... 46
TABLE 18 - MINIMUM REQUIREMENT FOR JOB – COMPARATIVE SUMMARY ACROSS CAMPUSES (% DIST.) ............ 48
TABLE 19 – TREND ANALYSIS - PERCENTAGE SAYING ‘STRONG’ CONTRIBUTION FOR EACH
ATTRIBUTE/SKILL BY FACULTY/SCHOOL ........................................................................................................ 58

ix | P a g e
EXECUTIVE SUMMARY
The 2008 Graduate Tracer survey of first degree graduates from the St Augustine, Mona and cave Hill Campuses is the second annual survey conducted by the University Office of Planning and Development in collaboration with the Office of Planning and Institutional Research at Mona and the Office of Planning and Projects at Cave Hill. The survey captures information on the destination of UWI graduates approximately one year after they complete their final year of study. The survey was designed specifically to explore the areas of the graduates’ post- university experience in relation to further studies, employment and income as well as the development of skills and attributes necessary for the 21st century graduate. The survey was voluntary and used a mixture of mailing, online and telephone survey methodologies in an attempt to improve the response rate. A total of 1612 graduates or 28% of total graduates sampled responded to this survey. Graduates residing in the campus countries were more responsive than graduates residing in the non-campus countries. Among the important findings of the survey are the following: Further Studies
i. The 2008 Tracer Survey revealed that approximately thirty one percent (31%) of respondents were enrolled in further studies across campuses with the majority (61%) enrolled at the UWI.
ii. A majority of 47% were enrolled in taught masters programmes, 23% in professional programmes, 10% in postgraduate diplomas, 8% in research degrees and 11% in other undergraduate programmes. A significant campus proportion ( 90% ) of those not pursuing postgraduate studies said that they intend to do so in the near future.
iii. There was a marked increase in the percentage of graduates who opted to study and work at the same time moving from 23% for 2007 graduates to 29% for 2008 graduates at St Augustine, from 17 to 25% at Cave Hill and 12% to 16% at Mona.
iv. When graduates were asked if the postgraduate programme in which they are enrolled in is in the same field or within the broader discipline as their first degree, 46% reported in the affirmative while 54% said they were enrolled in another field
Labour Market Outcomes – Employment Characteristics
i. As many as 84% of respondents indicated that they were employed at the time of survey for in Trinidad and Tobago and Barbados while 85% were gainfully employed in Jamaica

x | P a g e
ii. There has been a decline in the employment rates of graduates of 2008 when compared to those of 2007 at St Augustine and Mona. The overall employment rate fell from 91% to 84%, a decline of seven percentage points at St Augustine while at Mona it fell from 91% to 85%. Cave Hill increased from 79% to 83%.
iii. At the Faculty level there were generally high employment rates for Education and Medical Sciences. High unemployment rates were observed for graduates from Science , Agriculture, Social Sciences and Humanities
iv. Across the three campuses the largest segment of employed graduates ranging from 47% at Cave Hill to 52% at Mona were employed in their first job after graduating. 28.8% changed jobs after graduation at St Augustine and 41% returned to their previous job at Cave Hill.
v. The main employer of UWI graduates at the St Augustine and Mona Campuses was the Public Sector accounting for about 58% and 56% of those employed, respectively. The Private Sector absorbed a majority of 56% of graduates at Cave Hill.
vi. A significant proportion of graduates were employed in Professional and Managerial jobs in areas critical to the economy such as Education, Health care, Finance/Banking and Energy based industries. At St Augustine and Mona 56% of employed in Professional or Managerial positions while at Cave Hill the proportion was 43%. However there were worrying levels of underemployment as evidenced by the fact that a higher than desirable percentage of graduates classified their jobs as clerical or sales workers in Agriculture(27%), Social Sciences( 19% at St Augustine, 38% at Mona and 25% at Cave Hill) and Humanities(23% at Mona and 38% at Cave Hill)
Employment Earnings
i. At St Augustine, the top tier of median salaries reported in 2009 went to graduates from the Faculty of Medical Sciences (5 Yr) with TT$19,500, followed by Education with TT$9,240, Medical Sciences (3/4 yr) with $10,000 and Engineering with TT$9,000. In the second tier were graduates from Social Sciences with $7,900. Median salaries were lowest among graduates of Agriculture, Science and Humanities, earning median salaries of $5,125 and $7,080 and $7,380, respectively.
ii. At Mona, the top tier of median salaries reported in 2009 went to graduates from the Faculty of Medical Sciences (5 Yr) with JA$122,090, followed by Education with JA$119,280. In the second tier were graduates from Pure & Applied Sciences with $83,130. Median salaries were lowest among graduates of Medical Sciences (3 yr), Humanities and Social sciences, earning median salaries of $55,690, $75,000 and $80,000, respectively.

xi | P a g e
iii. At Cave Hill, the top tier of median salaries reported in 2009 went to graduates from the Faculty of Education with BDS$4,000 and Humanities with BDS$3,990. In the second tier were graduates from Pure & Applied Sciences with BDS$3,720. Median salaries were lowest among graduates of Social Sciences with BDS$2,920.
iv. When the reported earnings of graduates are aggregated by sectors, median earnings in the Private sector lagged behind those in the Public sector across all campuses.
v. A certain level of income inequality was observed between male and female graduates at St Augustine and Cave Hill. At St Augustine, the median earnings of male respondents were higher than their female counterparts in all faculties. Overall the median salaries of males were TT$8,800 compared to $7,500 for females. This translates into a gap of $1,100. At Cave Hill, overall median salaries of males were BDS$3,670 compared to $3,150 for females. This translates into a gap of $520
vi. Results of the 2008 survey do not confirm any clear pattern that holders of degrees in the higher divisions tend to receive higher compensation and vice versa. There appears to be inconsistencies across Faculties showing no clear link between income and academic performance. In some instances, median salaries of graduates with ‘Upper Second’, ‘Lower Second’ or ‘Pass’ are higher than those with ‘First Class’.
Skills match and Job Satisfaction
i. One year after graduation 47.5% of all graduates employed in full-time employment considered their work ‘closely’ related to their degree while 27.4% said ‘somewhat related within the broader discipline’. The pattern that emerged for graduates of 2008 appears to be generally similar to those of 2007
ii. The percentage of graduates indicating that a first degree is not the minimum requirement for their current jobs was 49.3% across the three campuses.
iii. At St Augustine, when graduates were asked to rate their job satisfaction levels, a majority of 63.3% was either very satisfied or satisfied, 25% said tolerable and 11.4% unsatisfied. At the Faculty/School level, graduates in Agriculture, Social Sciences and Humanities were less likely to be very satisfied or satisfied with their jobs than others.
iv. At Mona just over one half or 50.7% was either ‘very satisfied’ or ‘satisfied’, 37% said ‘tolerable’ and 12.2% were unsatisfied. At the Faculty/School level, graduates in Social Sciences and Medical Sciences (3 yr) were less likely to be ‘very satisfied’ or ‘satisfied’ with their jobs than others
v. At Cave Hill, 57.7% was either ‘very satisfied’ or ‘satisfied’ while 34.4% said ‘tolerable’ and 7.8% were ‘unsatisfied’. At the Faculty/School level, graduates in Humanities were less likely to be ‘very satisfied’ or ‘satisfied’ with their jobs than others.

xii | P a g e
Development of Attributes Graduates were asked to rate the extent to which their UWI education contributed towards each of the following twelve (12) competencies necessary for their personal and professional development in terms of ‘strong’, ‘moderate’, ‘very little’ or ‘none’:
a) Critical thinking skills
b) Problem solving skills
c) Effective writing skills
d) Effective speaking skills
e) Working effectively with modern IT communication technologies
f) Innovative and entrepreneurial
g) Understanding and appreciating diversity and other cultures
h) Ability to think and work independently
i) Capacity to work effectively in teams
j) Socio/Political awareness
k) Ethical conduct
l) Proficiency in a second language
i. When all graduates of 2008 across campuses were asked to reflect on the skills they had developed ‘strongly’ as a result of their first degree experience, respondents indicated that those most developed were (i) their ability to think and work independently (62% rated as ‘strong’) (ii) their capacity to work effectively in teams (59% rated as ‘strong’) and (iii) understanding and appreciating diversity (56% rated as ‘strong’). At the other end of the spectrum, socio-political awareness, working effectively with modern IT, being innovative and entrepreneurial and proficiency in a foreign language were rated ‘strong’ by less than 35% of respondents.
ii. Less graduates in 2008 were inclined to say that their UWI education contributed ‘strongly’ to their personal and professional development than for those in 2007 in all 12 attributes they were surveyed on e.g. in the 2007 survey, 54% of graduates rated UWI’s contribution to their critical thinking skills as ‘strong’ while in the 2008 survey only 49% of graduates said the same.
Major issues arising from findings of Graduate Tracer Survey Based on the results of the Survey of the 2008 graduates and a comparative analysis with the 2007 survey, a number of issues have emerged, many of which are pertinent to the success of the

xiii | P a g e
2007-12 Strategic Plan. Some are common across campuses while others are unique to one or two of the campuses. These issues would require further examination, analysis and research by the University. The following is a brief summary of some of these issues:
• Low enrollment and projected growth in research degrees • The issue of the attractiveness and competitiveness of UWI programmes as it relates to
competition from other Tertiary level institutions • Facilitating the increasing number of graduate students who work and study at the same
time by making delivery of programmes more flexible • High unemployment rates in certain disciplines • Lack of entrepreneurial initiative by graduates • Low rate of private sector employment as compared with public sector • Underemployment of graduates as well as low salaries in some disciplines • Limited relationship between academic performance and income • Income gap by gender • Mismatch between area of study to current job in some areas • Development of key attributes of graduates lagging • Need to look at the impact factor in terms of the initiatives being taken to strengthen
attributes defined for the ideal UWI graduate

SECTION 1 – INTRODUCTION, METHODOLOGY AND OBJECTIVES OF SURVEY
INTRODUCTION
Graduate Tracer Studies provide pertinent information on some issues of strategic significance to an institution. Among the insights that Graduate Tracer Surveys might be able to provide are:
(a) Labor market signals discernable from the job-search experience of recent graduates
(b) Identifiable indicators of the potential demand for postgraduate education
(c) Indicators of the sectoral patterns of absorption of new graduates
(d) Feedback on the impact of university education on the professional as well as personal development of recent graduates.
At the University of The West Indies, little information has been available on outcomes of this nature and as a result, the University Office of Planning and Development has taken the initiative to conduct Graduate Tracer Surveys supported by the Office of Planning and Institutional Research at Mona and the Planning Office at Cave Hill. This study provides a comparative analysis of the outcomes of the second annual Graduate Tracer surveys undertaken at the St Augustine. Mona and Cave Hill Campuses of the University of the West Indies all of which were conducted during the fourth quarter of calendar year 2009 and the first quarter of 2010. This paper also attempts a trend analysis between the surveys of graduates of 2007 and 2008. An Appendix is included at the end of this report which gives detailed results of key aspects of this survey for the benefit of Faculties and Departments. For the three campuses, 5,741 first degree graduates of the class of 2008 who are residing in Campus Countries as well as other Non-Campus Caribbean territories were surveyed approximately one (1) year after graduation of which 1612 graduates or 28% responded. METHODOLOGY
Questionnaires were mailed directly to all first degree graduates in 2008 of the University of the West Indies in their of residence. Self -addressed envelopes were included for graduates to return questionnaires. Graduates were also given the option to complete questionnaires online via an official link to the Graduate Tracer Survey. In an attempt to improve the response rate, incentives were offered in the form of cash prizes to be distributed via a random draw of respondents.

2 | P a g e
MAIN OBJECTIVES OF SURVEY
The 2008 tracer study was designed primarily to explore the following areas of the graduates’ post- university experience:
1. FURTHER STUDIES - percentage of graduates enrolled in further studies immediately after graduation, types of programs and institutions in which enrolled, relationship to first degree field and the intention of those not currently pursuing postgraduate studies to do so in the near future
2. LABOUR MARKET OUTCOMES – employment rates by area of study, employment earnings, employment by sectors, and compatibility of degree earned to employment, level of underemployment and names of employers and occupational types and job satisfaction levels.
3. PREPARATION FOR JOB MARKET – feedback from graduates on the extent of UWI’s contribution towards their professional and personal development.

3 | P a g e
SECTION 2 - RESPONSE RATES AND DEMOGRAPHIC PROFILE OF RESPONDENTS
RESPONSE RATES BY FACULTY/SCHOOL
Five thousand and seven hundred and forty one students (5,741) from Mona, St Augustine and Cave Hill Campuses residing in the UWI contributing countries earned their first degrees in 2008. Table 1 show that 745 or 29.5% at Mona, 653 or 29.5% at St Augustine and 214 or 21.2% at Cave Hill responded to the survey, giving an overall response rate for the University of 28.1%. On a Faculty basis, response rates were best in Social Sciences (30%) and Humanities & Education (30%) while Law with 11% and Medical Sciences 24% were less responsive.
TABLE 1- RESPONSE RATES BY FACULTY AND CAMPUS – SURVEY OF 2008 GRADUATES
ST AUGUSTINE MONA CAVE HILL ALL
FACULTY NO. OF
RESPONSES
RESPONSE
RATES (%)
NO. OF RESPONS
ES
RESPONSE
RATES (%)
NO. OF RESPONS
ES
RESPONSE
RATES (%)
NO. OF RESPONS
ES
RESPONSE
RATES (%)
ENGINEERING 103 28% - - - - 103 28%
HUMANITIES& EDUCATION 111 26.8% 258 33.8% 34 19.4% 403 29.8%
PURE & APPLIED SCIENCES/AGRICULTURE
140 29.9% 82 25% 27 19% 249 26.6%
LAW - - - - 20 11% 20 11%
MEDICAL SCIENCES 52 24% 85 26% 1 4% 138 24%
SOCIAL SCIENCES 245 32% 319 30% 132 28% 696 30%
SUB-TOTAL 653 29.5% 745 29.5% 214 21,2% 1612 28.1%
Note: The graduates of B.B.Med.Sci(Phase 1 of MBBS programme at St Augustine) were excluded from survey)
TREND ANALYSIS –RESPONSE RATES
Chart 1 below shows that when compared to the Survey of 2007 graduates, there has been an improvement in the response rate at St Augustine from 21% to 29% with an increase of 8 percentage points, at Mona from 24% to 30% with an increase of 6 percentage points while Cave Hill marginally increased from 19% to 21% with an increase of 2 percentage points. The overall response rate increased from 22% to 29%.

MIGRATION AND RESPONSE RATE
One of the factors which could have graduates since it was observed that someeither studying or living abroad. proportion of UWI graduates migrating to first world countriesthe extent of such migration. RESPONDENTS BY SEX
Table 2 shows that, overall, women were of 4142 female graduates, 28.6% responded while the survey. This trend was consistent across campuses.female to male graduates in 2008 was 73% to 27%.
TABLE 2 – SURVEY RESPONDENTS B
FACULTY/SCHOOL
TOTAL
GRADUATES –
MALES
ST AUGUSTINE 751
MONA 546
CAVE HILL 285
All 1582
St Augustine
Mona
Cave Hill
All
Chart 1- Trend Analysis: Response Rates by Campus
Response Rate 2008
SE RATE
which could have influenced lower than targeted response rates is migration of bserved that some graduates could not be contacted because they were
either studying or living abroad. No reliable data is available to indicate the extent of the proportion of UWI graduates migrating to first world countries and there is a need to determine
women were slightly more likely to respond than m% responded while 26.3% of 1,582 male graduates responded
This trend was consistent across campuses. It should be noted that the percentage of female to male graduates in 2008 was 73% to 27%.
SURVEY RESPONDENTS BY GENDER AND CAMPUS
TOTAL
GRADUATES –
FEMALE
NO. OF
RESP. -
MALES
% RES. –
MALES
NO. OF RESP
– FEMALES
1461 204 27.2% 443
1957 155 28.4% 589
724 58 20.4% 156
4142 417 26.3% 1188
21%
24%
19%
22%
21%
Trend Analysis: Response Rates by Campus
Response Rate 2008 Response Rate 2007
4 | P a g e
lower than targeted response rates is migration of because they were
to indicate the extent of the and there is a need to determine
men. Out of a total male graduates responded to
It should be noted that the percentage of
NO. OF RESP.
FEMALES
% RESP. -
FEMALES
30.3%
30.1%
21.5%
28.6%
29%
30%
29%

5 | P a g e
AGE PROFILE OF RESPONDENTS
Table (a) shows that 47.2% of total respondents were 24 years or under, 24% were in the 25 to 29 age group while 11.6% were over 39 years of age. There were some variations across campuses with a lower figure of 40.7% of respondents at Cave Hill in the 24 and under age group compared to a corresponding figure of 46.4% for Mona and 50.1% for St Augustine. The Faculty with the youngest group of graduates was Engineering with 69% of respondents 24 years or under followed by Science with 68% from the same group. A majority of graduates from the School of Education (54%) were over 35 years of age, reflecting the fact that the majority admitted were mature students from the teaching service. Twenty three percent (23%) of Social Sciences graduates were over 35 years due to the fact that a number of mature students were admitted to programmes in the Faculty.
TABLE 3(A) - % DISTRIBUTION OF RESPONDENTS BY AGE GROUP AND CAMPUS
FACULTY/SCHOOL
AGE GROUP
24 or Under 25 – 29 30 – 34 35 - 39 Over 39
ST AUGUSTINE 50.1% 27.1% 6.6% 5.5% 10.7%
MONA 46.4% 22.6% 12.6% 7.7% 10.7%
CAVE HILL 40.7% 19.2% 11.7% 11.7% 16.8%
Total 47.2% 23.9% 10.1% 7.3% 11.6%
TABLE 3(B) - % DISTRIBUTION OF RESPONDENTS BY AGE GROUP AND FACULTY
FACULTY/SCHOOL
AGE GROUP Total Count
24 or Under 25 – 29 30 – 34 35 - 39 Over 39
Engineering 68.9% 26.2% 3.9% 1.0% 0.0% 103
Medical Sciences 24.5% 48.9% 12.2% 7.9% 6.5% 139
Agriculture 67.3% 28.6% 4.1% 0.0% 0.0% 49
Education 1.4% 19.6% 25.0% 19.6% 34.5% 148
Humanities 52.2% 26.3% 6.7% 7.5% 7.5% 255
Science 68.0% 24.0% 4.5% 2.0% 1.5% 200
Social Sciences 48.6% 18.2% 10.7% 7.7% 14.8% 698
Law 60.0% 30.0% 5.0% 0.0% 5.0% 20
Grand Total 47.1% 23.9% 10.0% 7.3% 11.5% 1612

6 | P a g e
SECTION 3 - FURTHER STUDIES
RESPONDENTS CURRENTLY PURSUING FURTHER STUDIES
One of the options open to new graduates is that of entering a programme of further study. Respondents were asked if they were currently enrolled in a programme of further studies in either postgraduate degrees (taught masters or research degrees) or postgraduate diplomas, professional non-degree programmes degrees or another undergraduate programme. Table 4 shows that comparatively across campuses, St Augustine Campus recorded the highest percentage of 39.4% of respondents indicating they had taken some form of further education in either higher degrees, professional non-degree qualifications or other first degrees. This was followed by 34.6% of graduates from Cave Hill and 24.3% of graduates from Mona. Apart from Law, graduates from the Faculty of Social Sciences registered the highest proportion of new graduates going on to further their studies with approximately 37% while the Sciences had 35% enrolled. Medical Sciences (3/4 yr) had the lowest enrolment in further studies with 11% followed by Education with 16%. Respondents who were not currently enrolled in postgraduate studies indicated a high level of interest in doing so in the near future across campuses with 93% at Mona, 90% at St Augustine and 84% at Cave Hill. When asked if UWI would be their first choice, 68% answered in the affirmative at Mona, followed by 65% at St Augustine and 63% at Cave Hill. A low percentage of 30% Medical Sciences-5 yr at St Augustine indicated that UWI will be their first choice, while 33% of Social Sciences graduates at Cave Hill said the same. It is difficult to draw conclusions based on such information but it might be worth pursuing these issues at Faculty level.

7 | P a g e
TABLE 4 – FURTHER STUDIES AND THE NEW GRADUATE BY CAMPUS/FACULTY- 2008
Faculty/School
No. of
respondents
% Pursuing
further studies
% of those not pursuing
further studies but who
intend to do so in the
near future
% saying UWI will
be first choice
St Augustine Campus
Engineering 103 34% 88.2% 65%
Humanities 83 33.7% 90.9% 62%
Education 28 32.1% 84.2% 75%
Science 91 42.9% 82.7% 72.1%
Agriculture 49 36.7% 93.5% 75.9%
Medical Sciences(5yr) 44 27.3% 93.8% 30%
Medical Sciences(3/4 yr) 9 33.3% 100% 83.3%
Social Sciences 246 45.9% 91.1% 67.8%
Total 653 39.4% 89.6% 65.1%
Mona Campus
Humanities 141 22.7% 89.9% 62.9%
Education 117 12% 95.1% 83.7%
Pure & Applied Sciences 91 31.7% 92.9% 53.8%
Medical Sciences(5yr) 19 0% 100% 73.7%
Medical Sciences(3yr) 66 7.6% 91.8% 75.0%
Social Sciences 320 32.5% 92.6% 66.0%
Total 745 24.3% 92.6% 68.8%
Cave Hill Campus
Education 3 33.3% 50.0% 100.0%
Humanities 31 29.0% 84.2% 62.5%
Law* 20 90.0% 37.5% 66.7%
Social Sciences 132 31.1% 77.3% 33.3%
Pure and Applied Sciences 27 18.5% 90.7% 69.4%
Total 214 34.6% 84.1% 63.8%
All Campuses
Engineering 103 34.0% 88.2% 65.0%
Humanities 255 27.0% 89.5% 62.6%
Education 148 16.2% 92.7% 82.6%
Science 209 34.9% 88.7% 62.9%
Agriculture 49 36.7% 93.5% 75.9%
Medical Sciences(5yr) 63 19.1% 96.1% 46.9%
Medical Sciences(3/4 yr) 75 10.7% 92.5% 75.8%
Social Sciences 698 37.0% 89.0% 60.7%
Total – All 1600 31.1% 90.1% 64.8%
*The majority of law degree graduates usually enter into Law school upon graduation

TREND ANALYSIS – GRADUATES PURSUING
A larger percentage of graduates of 2008 in all compared to those of 2007(enrolmesince the last survey, there has been opting to pursue postgraduate studies, most significantly at St Augustine with apoint increase followed by Mona with a marginally by 2 percentage points. Students often enter post graduate studies in order to enhance career opportunities, possible that increases in postgraduate enrolmentdue to less full-time employment opportunities resulting from the impact of the economic downturn which began in the last quarter of 2008.
GRADUATE ENROLLMENT
Chart 3(a) show that the majority the West Indies with 65% of graduates from St Augustine, 57% Hill. The residual percentages of students i.e. 35% from from Cave Hill were enrolled in either Local or Regional Tertiary level institutions or Foreign Institutions. Many of the local institutions offer programmes from
0.0%
5.0%
10.0%
15.0%
20.0%
25.0%
30.0%
35.0%
40.0%
St Augustine
27.9%
35.5%
Chart 2 - Trend Analysis of Graduates Pursuing Postgraduate Programmes
Postgrad. Studies
GRADUATES PURSUING POSTGRADUATE STUDIES
A larger percentage of graduates of 2008 in all Faculties chose to enroll in postgraduateenrolment in undergraduate programmes excluded)
since the last survey, there has been a 4 point percentage increase in the number of students studies, most significantly at St Augustine with a
point increase followed by Mona with a 3 point percentage point increase. Cave Hill marginally by 2 percentage points.
enter post graduate studies in order to enhance career opportunities, in postgraduate enrolment, particularly at St Augustine,
time employment opportunities resulting from the impact of the economic downturn which began in the last quarter of 2008.
ENROLLMENT IN FURTHER EDUCATION BY I NSTITUTION
majority of students are enrolled in further studies at the University of with 65% of graduates from St Augustine, 57% from Mona and 53% from Cave
The residual percentages of students i.e. 35% from St Augustine, 43% from Mona and 47% from Cave Hill were enrolled in either Local or Regional Tertiary level institutions or Foreign
Many of the local institutions offer programmes from Foreign institutions through
Mona Cave Hill All
16.3%
34.6%
23.6%
35.5%
19.3%
32.7%
27.9%
Trend Analysis of Graduates Pursuing Postgraduate Programmes
by Campus
Postgrad. Studies - 2007 Postgrad. Studies - 2008
8 | P a g e
postgraduate studies undergraduate programmes excluded). Chart 2 shows point percentage increase in the number of students
studies, most significantly at St Augustine with an 8% percentage point percentage point increase. Cave Hill declined
enter post graduate studies in order to enhance career opportunities, however it is t Augustine, may in part be
time employment opportunities resulting from the impact of the economic
NSTITUTION
at the University of Mona and 53% from Cave
t Augustine, 43% from Mona and 47% from Cave Hill were enrolled in either Local or Regional Tertiary level institutions or Foreign
n institutions through
27.9%
Trend Analysis of Graduates Pursuing Postgraduate Programmes

9 | P a g e
articulation agreements. Chart 3(b) shows a similar trend in terms of percentage distribution of graduates enrolled in postgraduate programmes only.
TREND ANALYSIS – POSTGRADUATE ENROLMENT BY TYPE OF INSTITUTION
Of those graduates pursuing postgraduate programmes, the percentage returning to UWI decreased from 67% to 61%. This decline was most significant at Mona and Cave Hill as shown in Chart 3(c).
St Augustine Mona Cave Hill All
Other TLI 34.7% 42.9% 46.6% 39.3%
University of the West Indies 65.3% 57.1% 53.4% 60.7%
0%10%20%30%40%50%60%70%80%90%
100%
Chart 3(a)-Enrolment Dist. in Further Studies at UWI/Other Institution - Comparative Analysis
St Augustine Mona Cave Hill All
Other TLI 34.9% 40.7% 48.2% 38.7%
University of the West Indies 65.1% 59.3% 51.8% 61.3%
0%10%20%30%40%50%60%70%80%90%
100%
Chart 3(b)-Enrolment Dist. in Postgraduate Programmes at UWI/Other Institution - Comparative Analysis of 2008 Graduates

Although one does not expect all graduates pursuing institution from which they graduated, it is graduates to pursue further studiesattractive and competitive when compared to similar onesinstitutions.
TYPES OF POSTGRADUATE IN
Chart 4(a) shows that the largest group of graduates enrolled in further education at the time of the survey was pursuing Taught degrees, 10% in Postgraduate diplomasin undergraduate programmes. taught masters at St Augustine with 54% while 51% of graduates enrolled at Cave Hill were pursuing professional programmes (including Law School). graduates enrolled at Mona was pursuing other undergraduate programmes.
Mona
St Augustine
Cave Hill
All
Chart 3(c) - Trend Analysis
Although one does not expect all graduates pursuing postgraduate studies to do so institution from which they graduated, it is desirable to enroll a higher proportion of our
studies. It may very well be that our programmes are not sufficientlywhen compared to similar ones offered in other tertiary level
POSTGRADUATE PROGRAMMES RESPONDENTS ARE
he largest group of graduates enrolled in further education at the time of aught masters degrees (47.2%), while 7.7% were enrolled in
iplomas, 23% in Professional non-degree programmes Comparatively, a larger percentage of graduates enrolled in
taught masters at St Augustine with 54% while 51% of graduates enrolled at Cave Hill were pursuing professional programmes (including Law School). A significant amount of 20% of
pursuing other undergraduate programmes.
63.0%
59.7%
66.7%
59.3%
65.1%
51.8%
61.3%
Trend Analysis - % Dist. Enrollment in Postgraduate Programmes at UWI
2008-UWI 2007-UWI
10 | P a g e
studies to do so at the proportion of our
It may very well be that our programmes are not sufficiently offered in other tertiary level
ARE ENROLLED
he largest group of graduates enrolled in further education at the time of were enrolled in Research
programmes and 12% Comparatively, a larger percentage of graduates enrolled in
taught masters at St Augustine with 54% while 51% of graduates enrolled at Cave Hill were A significant amount of 20% of
76.5%

TREND ANALYSIS – ENROLMENT IN
Chart 4(b) shows the percentage of graduates pursuing taught masters declined from 47% coinciding with an increase in the percentage of graduates pursuing professional programmes from 21% to 26%. The percentage opting to pursue research degrees it is just possible that this reflectsmarket. In terms of the decline in the percentage of graduates pursuing taught masters, the issue onmore arises about the attractiveness and competitiveness of our masters programmesof their multidisciplinary orientation
0% 10%
St Augustine
Mona
Cave Hill
All
St Augustine
Taught masters 54.3%
Other First Degree 8.7%
Research Degree 9.8%
Other Professional 15.7%
PG Diplomas 11.4%
Chart 4(a) - % Dist. Enrollment in Further Studies by Type of programme
ENROLMENT IN POSTGRADUATE STUDIES BY TYPE OF P
he percentage of graduates pursuing taught masters declined from % coinciding with an increase in the percentage of graduates pursuing professional
he percentage opting to pursue research degrees remained low, declining from 1it is just possible that this reflects the extent of marketability of research degrees in the labor
In terms of the decline in the percentage of graduates pursuing taught masters, the issue onmore arises about the attractiveness and competitiveness of our masters programmes
ir multidisciplinary orientation and consequently their value in the market place.
20% 30% 40% 50% 60% 70% 80% 90%
St Augustine Mona Cave Hill
54.3% 43.6% 31.5% 47.2%
8.7% 20.4% 4.1% 12.2%
9.8% 4.4% 8.2% 7.7%
15.7% 21.5% 50.7% 22.8%
11.4% 9.9% 5.5% 10.0%
% Dist. Enrollment in Further Studies by Type of programme - Comparative Analysis: 2008 Graduates
11 | P a g e
STUDIES BY TYPE OF PROGRAMME
he percentage of graduates pursuing taught masters declined from 54% to % coinciding with an increase in the percentage of graduates pursuing professional
from 11% to 9% and marketability of research degrees in the labor
In terms of the decline in the percentage of graduates pursuing taught masters, the issue once more arises about the attractiveness and competitiveness of our masters programmes, the extent
and consequently their value in the market place.
90% 100%
All
47.2%
12.2%
7.7%
22.8%
10.0%

12 | P a g e
54.9%
32.9%
59.5%53.8%
43.6%
31.5%
54.3%47.2%
Mona Cave Hill St Augustine All
Chart 4(b) - Trend Analysis - % Dist. of Enrolment in Taught Masters Degrees
2007 2008
11.7%
4.9%
15.0%
11.2%
5.6%
8.6%
10.8%
8.7%
Mona Cave Hill St Augustine All
Chart 4(c) - Trend Analysis - % Dist. of Enrolment in Research Degrees
2007 2008
8.7%
53.7%
8.7%
20.5%27.1%
52.9%
17.2%
26.0%
Mona Cave Hill St Augustine All
Chart 4(d) - Trend Analysis - % Dist. Enrolment in Professional Programmes
2007 2008

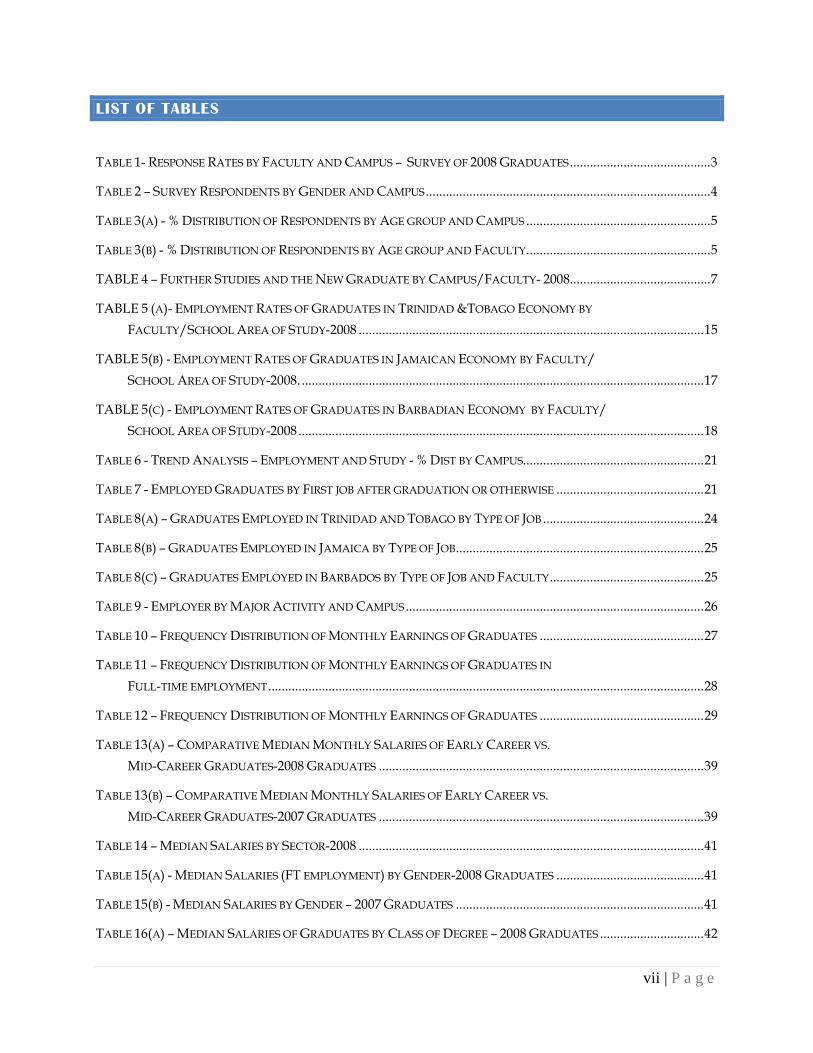
RELATIONSHIP BETWEEN DEGREE
When graduates were asked if the postgraduate programme in which they are enrolled is in the same field or within the broader discipline affirmative while 54% said they were enrolled in another field .
On a Faculty basis, the majority of graduates in Law, Medical Engineering and Agriculture indicated that their postgraduate programmes were in the same field as their first degree. The majority of graduates in Humanities, Sciento pursue further studies in a field different from their first degree as shown in Chart 6 below. is possible that many would have done so in an attempt to make themselves more flexible terms of career choices and better survey reveals that a significant minority of graduates in these and Agriculture and Social Sciences) are underemployed. An issue to consider here is whether taught masters programmes in these Faculties should have a greater multidisciplinary orientationIn any case it may be appropriate to engage stakeholders to discuss taught master’s programmes as part of a process of rethinking See Appendix 1(a)-(c) at end of this report which enrolled in as well as field of study compared to first degree and type of programme enrolled in for all three Campuses
35%
46%
0% 10% 20%
ST AUGUSTINE
MONA
CAVE HILL
ALL
Chart 5(a) - Relationship between Postgraduate Study and Field of First
POSTGRADUATE STUDY A ND FIELD OF FIRST
When graduates were asked if the postgraduate programme in which they are enrolled is in the or within the broader discipline linked to their first degree, 46%
% said they were enrolled in another field.
On a Faculty basis, the majority of graduates in Law, Medical Sciences (5 Yr), Education, Engineering and Agriculture indicated that their postgraduate programmes were in the same field as their first degree. The majority of graduates in Humanities, Science and Social Sciences opted to pursue further studies in a field different from their first degree as shown in Chart 6 below.
any would have done so in an attempt to make themselves more flexible terms of career choices and better opportunities for new career choices. The evidence in this
that a significant minority of graduates in these Faculties (Humanities, Science and Agriculture and Social Sciences) are underemployed. An issue to consider here is whether
asters programmes in these Faculties should have a greater multidisciplinary orientationIn any case it may be appropriate to engage stakeholders to discuss taught master’s programmes as part of a process of rethinking offerings.
end of this report which gives details of Institutions graduates are enrolled in as well as field of study compared to first degree and type of programme enrolled in for all three Campuses.
57%
64%
46%
43%
65%
36%
54%
20% 30% 40% 50% 60% 70% 80%
Relationship between Postgraduate Study and Field of First
Degree by Campuses
Same field Other field
13 | P a g e
ND FIELD OF FIRST
When graduates were asked if the postgraduate programme in which they are enrolled is in the % reported in the
5 Yr), Education, Engineering and Agriculture indicated that their postgraduate programmes were in the same field
ce and Social Sciences opted to pursue further studies in a field different from their first degree as shown in Chart 6 below. It
any would have done so in an attempt to make themselves more flexible in The evidence in this
aculties (Humanities, Science and Agriculture and Social Sciences) are underemployed. An issue to consider here is whether
asters programmes in these Faculties should have a greater multidisciplinary orientation. In any case it may be appropriate to engage stakeholders to discuss taught master’s programmes
gives details of Institutions graduates are enrolled in as well as field of study compared to first degree and type of programme
90% 100%
29.2%
25.0%
0% 10%
Engineering
Medical Sciences
School of Agriculture
School of Education
School of Humanities
School of Science
Social Sciences
Medical Sciences - 5 YR
Law
Grand Total
Chart 5(b) - Relationship between Postgraduate Study and Field of First Degree by Faculty
37.1%
50.0%
38.9%
29.2%
79.7%
71.4%
53.9%
25.0%
54.4%
62.9%
50.0%
61.1%
70.8%
28.6%
46.1%
75.0%
100.0%
45.6%
20% 30% 40% 50% 60% 70% 80%
Relationship between Postgraduate Study and Field of First Degree by Faculty - All Campuses
Other Field Same Field
14 | P a g e
20.3%
28.6%
90% 100%
Relationship between Postgraduate Study and Field of First

15 | P a g e
SECTION 4 - LABOUR MARKET OUTCOMES – EMPLOYMENT CHARACTERISTICS
EMPLOYMENT RATES BY FACULTY AND AREA OF STUDY
One of the main indicators in assessing the impact or success of University education is the ability of graduates to find meaningful employment. It should be noted that the Labor market analysis in this section is confined to the Nationals/residents working in the campus countries of Trinidad & Tobago, Jamaica and Barbados only. The small number of respondents from outside the campus countries makes it risky to draw conclusions about conditions in other territories.
EMPLOYMENT OF GRADUATES IN THE TRINIDAD AND TOBAGO ECONOMY
Table 5(a) shows that 84% of respondents indicated that they were employed while 16% were not employed at the time of survey. At the Faculty level there were high employment rates for Education (90%), Medical Sciences (90%) and Humanities with 90%. Although the Humanities employment figure of 90% is higher than for Cave Hill and Mona, it is difficult to give any conclusive reasons for these differences. High unemployment rates were observed for graduates from Science with 30%, Agriculture with 20% and Social Sciences with 17%.
TABLE 5 (A)- EMPLOYMENT RATES OF GRADUATES IN TRINIDAD &TOBAGO ECONOMY BY FACULTY/SCHOOL AREA OF STUDY-2008
Faculty/Area of Study
No. of respondents
employed - 2008
Employment
Rates - 2008
Comparative
Employment Rates -
2007
Total graduates employed in Trinidad &
Tobago 524 83.6% 90.9%
Engineering 84 88.4 94.8%
Medical Sciences 43 90.7 97.7%
School of Agriculture 46 80.4 92.6%
School of Education 26 96.3 100.0%
School of Humanities 70 89.7 90.5%
School of Science 61 69.3 79.7%
Social Sciences 241 82.6 90.6%
For the benefit of Faculties/Departments further detailed employment data disaggregated by programme disciplines are included in an Appendix2 (a) to this report. This disaggregated data shows that there were significant variations within as well as across Faculties. Appendix 5 shows that above average unemployment rates(20% and over) were observed for graduates from

16 | P a g e
Chemical & Process Engineering, Surveying and Land Information, Life Sciences, Pharmacy, Human Ecology, General Agriculture, Environmental and Natural Resource Management, Computer Science, Life Sciences, Physical Sciences, Foreign Languages, Tourism and Hotel Management, Public Sector Management and Psychology. Caution should be taken in interpreting the results of some programmes with low responses and Departments and Faculties would do well to follow up to determine more accurately the relationship between throughput of graduates and market absorbtion.
TREND ANALYSIS – EMPLOYMENT RATES
Clearly there has been a decline in the employment rates of graduates of 2008 when compared to those of 2007. The overall employment rate fell from 91% to 84%, a decline of seven percentage points. This decline was evident for graduates of all Faculties but most significant for graduates from Science and Agriculture and Social Sciences. Clearly, even after taking into account the effects of the global economic downturn which began in the last quarter of 2008 or the fact that some graduates may have opted to study only and not work, these levels of unemployment for university graduates which are higher than the national unemployment levels(estimated to be 5.25% in 2009), are worrying and highly undesirable. At the programme option level there is a need to monitor the job search outcomes of graduates in those programmes which have continuously over the two surveys shown above average unemployment rates and to evaluate the extent to which lack of employment opportunities or labour market saturation exist. These programmes include Surveying and Land Information, Human Ecology, History, Physical Sciences, Life Sciences, Environmental and Natural Resource Management and Hospitality and Tourism Management
EMPLOYMENT OF GRADUATES IN THE JAMAICAN ECONOMY
Table 5(b) shows that 84.7% of respondents indicated that they were employed while 15.3% were not employed at the time of survey. At the Faculty level there were high employment rates for Education (98.3%), Medical Sciences-5 yr (100%) and Medical Sciences-3 yr with 98%. Higher than average unemployment rates were observed for graduates from Pure & Applied Sciences with 24.7%, Humanities with 20.7% and Social Sciences with 19.3%.

17 | P a g e
TABLE 5(B) - EMPLOYMENT RATES OF GRADUATES IN JAMAICAN ECONOMY BY FACULTY/SCHOOL AREA OF STUDY-2008.
Faculty/Area of Study No of employed respondents -2008 Employment Rates – 2008
Comparative Employment Rates –
2007
Graduates employed in Jamaica 610 84.7% 90.0%
Humanities 110 79.1% 82.4%
Education 113 98.3% 100.0%
Medical Sciences-5 Yr 19 100% 92.9%
Medical Sciences-3 Yr 62 98.4%
Pure and Applied Sciences 55 75.3% 86.1%
Social Sciences 251 80.7% 88.8%
When the data is further disaggregated at the program level, there were significant variations within as well as across Faculties. Appendix 5 shows that above average unemployment rates(20% and over) were observed for graduates in the areas of Creative Arts, English, History, Language & Communication, Life Sciences, Physical Sciences, Economics, Political Sciences, Public Sector Management, Psychology, Social Work, Social Policy and Development and International Relations.. One can argue that the economic downturn would have exacerbated the high unemployment rates in the above mentioned programmes. There is a need to monitor the job search outcomes of graduates in these programmes to evaluate the extent to which lack of employment opportunities or labour market saturation exist.
TREND ANALYSIS – EMPLOYMENT RATES
There has been a decline in the employment rates of graduates of 2008 when compared to those of 2007. The overall employment rate fell from 90% to 84.7%, a decline of five percentage points. This decline was evident for graduates in Pure and Applied Sciences, Humanities and Social Sciences. Clearly, even after taking into account the effects of the global economic downturn which began in the last quarter of 2008 or the fact that some graduates may have opted to study only and not work, these levels of unemployment for university graduates one year after graduation are worrying and highly undesirable. It should be noted the national unemployment rate at the end of 2008 stood at 11.1% for Jamaica (Source ILO Statistics) At the programme option level there is a need to monitor the job search outcomes of graduates in those programmes which have continuously over the two surveys shown above average unemployment rates and to evaluate the extent to which lack of employment opportunities or labour market saturation exist. These programmes include English, History, Physical Sciences, Economics and Psychology, among others.

18 | P a g e
Employment of graduates in the Barbadian Economy Table 5© shows that 83.3% of respondents were employed resulting in an unemployment rate of 16.7%. At the Faculty level there were high employment rates for Education (100%). Although there were no respondents from Medical Sciences in this survey, the employment rate of the previous survey was 100%. High unemployment rates were observed for graduates from Humanities (16%) and Law 100%. The high unemployment rate for Law graduates is not unexpected since most of these graduates would move directly into Law school.
TABLE 5© - EMPLOYMENT RATES OF GRADUATES IN BARBADIAN ECONOMY BY FACULTY/SCHOOL AREA OF STUDY-2008
Faculty/Area of Study No of employed respondents -2008 Employment Rates – 2008
Comparative Employment Rates –
2007
Graduates employed in Barbados 145 83.3% 79.0% Humanities 21 84% 81.5% Education 3 100% 75% Law 8 0% 0% Medical Sciences No Responses 100.0% Pure and Applied Sciences 21 87.5% 78.2% Social Sciences 100 87.7 83.2%
When the data is further disaggregated at the program level, there were significant variations within as well as across Faculties. Appendix 5 shows that above average unemployment rates (20% and over) were observed for graduates from History, Life Sciences, Mathematics, Political Science and Psychology. TREND ANALYSIS – EMPLOYMENT RATES
There has been marginal improvement in employment rates of graduates of 2008 when compared to those of 2007. The overall employment rate increased from 79% to 83.3%, an increase of four percentage points. However, despite the fact that unemployment declined marginally, these levels of unemployment for university graduates which are higher than the national unemployment levels(11% in 2008), are worrying and highly undesirable. At the programme option level there is a need to monitor the job search outcomes of graduates in those programmes which have continuously over the two surveys shown above average unemployment rates and to evaluate the extent to which lack of employment opportunities or labour market saturation exist. These programmes include History, Life Sciences, Mathematics, Political Science and Psychology, among others.

IMPACT ON THE BRAIN DRAIN
The net migration rate of countries in the Caribbean region is probably one of the highest in the world. The apparent widening of the gap between the University educated workforce and occupational opportunities as evidenced by higher unemployment rates worsen the already high migration levels of skilled, professional and entrepreneurial members of the labour force. No reliable data is available to this effect and as such conduct studies examining the true extent othe development of the region through the loss of human capital educational opportunities (GATE in Trinidad & TobagoComplimentary to this, there is need to examine the economies of the region to determine extent of absorptive capacity and the there is an opportunity as well to explore the more rapid rate to improve absorptive STATUS OF EMPLOYED G RADUATES
Chart 6 shows that the majority 93% at Mona, 91% at St Augustine and 84% at Cave Hill.reporting to be in part time employment at Cave Hill with 13.5%
0.0% 10.0% 20.0%
Cave Hill
Employed - Ft 83.8%
Employed -Pt 13.5%
Self Employed 2.7%
Chart 6 - Employment Status by Campus
The net migration rate of countries in the Caribbean region is probably one of the highest in the world. The apparent widening of the gap between the University educated workforce and
as evidenced by higher unemployment rates could only serve to worsen the already high migration levels of skilled, professional and entrepreneurial members of
No reliable data is available to this effect and as such UWI researchers the true extent of the brain drain as well as the impact it is having on
the development of the region through the loss of human capital in the context of educational opportunities (GATE in Trinidad & Tobago and free tertiary education in BarbadosComplimentary to this, there is need to examine the economies of the region to determine
capacity and the match between UWI throughput and market demand. But there is an opportunity as well to explore the critical levers required to trigger diversification at a
absorptive capacity.
RADUATES
the majority of employed graduates were employed in full93% at Mona, 91% at St Augustine and 84% at Cave Hill. There was a higher level of graduates reporting to be in part time employment at Cave Hill with 13.5%.
20.0% 30.0% 40.0% 50.0% 60.0% 70.0% 80.0%90.0%
Cave Hill Mona St Augustine
83.8% 92.9% 90.6%
13.5% 6.6% 8.0%
2.7% 0.5% 1.3%
Employment Status by Campus-2008 Graduates
19 | P a g e
The net migration rate of countries in the Caribbean region is probably one of the highest in the world. The apparent widening of the gap between the University educated workforce and
ld only serve to worsen the already high migration levels of skilled, professional and entrepreneurial members of
researchers need to f the brain drain as well as the impact it is having on
in the context of state subsidized and free tertiary education in Barbados).
Complimentary to this, there is need to examine the economies of the region to determine the and market demand. But
d to trigger diversification at a
of employed graduates were employed in full-time jobs with was a higher level of graduates
90.0% 100.0%
St Augustine
90.6%
8.0%
1.3%

EMPLOYMENT AND STUDY
Chart 7 below shows that many graduates choose to work and study at the same time Augustine with 29.3% and Cave Hill with 25.3% while only 1An analysis of the respondents who were not employed revealed that at Mona and 55% at Cave Hill were furthering their
TREND ANALYSIS – EMPLOYMENT
There is a marked increase in the percentage of graduates who opt to study and work at the same time moving from 23% to 29% at St AugustineMona. There is also a percentage increase in those graduates who are employed at St Augustine moving from Less job opportunities during the period of emany more graduates to enroll in postgraduate studies. With the increase in the number of students opting to work and study at the same time, issues the University has to re-examine is many of these students are enrolled
0%
Cave Hill
Mona
St Augustine
Employed
Employed & Further Studies
Unemployed & Further Studies
Unemployed
Chart 7 - Employment and Study
AND STUDY
below shows that many graduates choose to work and study at the same time Augustine with 29.3% and Cave Hill with 25.3% while only 16% at Mona chose to do likewiseAn analysis of the respondents who were not employed revealed that 64% at St Augusti
were furthering their studies.
EMPLOYMENT AND STUDY
There is a marked increase in the percentage of graduates who opt to study and work at the same % at St Augustine, 17% to 25% at cave Hill and 12% to 16% at
There is also a percentage increase in those graduates who are not studying and not moving from 3.4% to 5.9% and at Mona from 5.6% to 7.4%
job opportunities during the period of economic recession would possibly many more graduates to enroll in postgraduate studies.
With the increase in the number of students opting to work and study at the same time, examine is the structure of delivery of the programmes in which
many of these students are enrolled.
10% 20% 30% 40% 50% 60% 70% 80%90%
Cave Hill Mona St Augustine
58.00% 69% 54.20%
25.3% 15.8% 29.3%
9.1% 7.9% 10.5%
7.5% 7.4% 5.9%
Employment and Study - % Dist. Comparison across Campuses for 2008 Graduates
20 | P a g e
below shows that many graduates choose to work and study at the same time at St 6% at Mona chose to do likewise.
64% at St Augustine, 52%
There is a marked increase in the percentage of graduates who opt to study and work at the same to 25% at cave Hill and 12% to 16% at
studying and not and at Mona from 5.6% to 7.4%.
possibly have encouraged
With the increase in the number of students opting to work and study at the same time, one of the structure of delivery of the programmes in which
90% 100%
St Augustine
54.20%
29.3%
10.5%
5.9%
% Dist. Comparison across Campuses

21 | P a g e
The success of these students will increasingly depend on flexible university structures and systems which suit their needs rather than those of the institution. The opportunities acailable to students in blended learning and e-learning need to be both increased and accelerated.
TABLE 6 - TREND ANALYSIS – EMPLOYMENT AND STUDY - % DIST BY CAMPUS
Faculty/School
Employed &
Studying
Employed and not
Studying
Not Employed &
Studying
Not Employed &
Not Studying
2007 2008 2007 2008 2007 2008 2007 2008
Mona 11.6% 15.8% 78.6% 68.9% 4.5% 7.9% 5.6% 7.4%
Cave Hill 17% 25.3% 62% 58% 12% 9.1% 9% 7.5%
St Augustine 23.1% 29.3% 67.8% 54.2% 5.8% 10.5% 3.4% 5.9%
ARE GRADUATES CHANGING JOBS AFTER FIRST EMPLOYMENT?
Table 7 below shows that across the three campuses the largest segment of employed graduates ranging from 47% at Cave Hill to 52% at Mona were employed in their first job after graduating. 29% changed jobs after graduation at St Augustine and Cave Hill while 23% did so at Mona. 41% returned to their previous job at Cave Hill while 28% at Mona and 23% at St Augustine did likewise.
TABLE 7 - EMPLOYED GRADUATES BY FIRST JOB AFTER GRADUATION OR OTHERWISE
Faculty/School
First job after
graduation (%)
Changed job after
graduation (%)
Returned to previous
job (%) Total (headcount)
2007 2008 2007 2008 2007 2008 2007 2008
Mona 43.7% 52.0% 22.9% 20.0% 33.5% 28.1% 568 631
Cave Hill 39.9% 46.9% 29.5% 12.0% 30.6% 41.1% 183 175
St Augustine 42.5% 50.2 28.8% 27.3 28.6% 22.5 416 524
TREND ANALYSIS – EMPLOYED GRADUATES IN FIRST JOB AFTER GRADUATION OR
OTHERWISE
Compared to the previous year, there was less mobility in a tight job market resulting in an increase in the percentage of graduates who were still in their first job after graduation from across the three campuses. Those who changed jobs declined across campuses.

EMPLOYMENT BY SECTOR
Chart 8(a) shows that the main employer of UWI graduates Jamaica was the Public Sectorrespectively. The Public sector would comprise of the companies. Private Sector absorbed only entities accounted for the employwere employed in the Private sector while other entities accounted for 8%.Barbados was somewhat different with the main employer of graduates being the Private sector with 57%.
TREND ANALYSIS – EMPLOYMENT BY SECTOR
Despite the fact that the percentage of graduateTobago declined from 63% to 58%, this sector remains the major employer of Augustine Campus. The fact that the the structure of the Trinidad and Tobago economy where the fueling high levels of public sector spending. from energy has been slow.
St Augustine
Mona
Cave Hill
0% 10% 20%
St Augustine
Public 57.6%
Private 30.8%
UWI 6.1%
Other 5.5%
Chart 8(a) - % Dist. of Employed Graduates by Sector
Augustine, Mona and Cave Hill
BY SECTOR
he main employer of UWI graduates in Trinidad & Tobago as well as Public Sector accounting for about 58% and 56% of those employedublic sector would comprise of the civil service as well as
rivate Sector absorbed only 30% of graduates in Trinidad and Tobago employment of 12% of graduates and in Jamaica 36% of graduates
were employed in the Private sector while other entities accounted for 8%.Barbados was somewhat different with the main employer of graduates being the Private sector
MENT BY SECTOR
Despite the fact that the percentage of graduates employed in the Public sector from 63% to 58%, this sector remains the major employer of graduates of the St
Augustine Campus. The fact that the Private sector only absorbed 30% of graduates isthe structure of the Trinidad and Tobago economy where the Energy sector drives the economy fueling high levels of public sector spending. The process of diversifying of the economy
20% 30% 40% 50% 60% 70% 80% 90%
Mona Cave Hill
56.4% 33.1%
35.9% 56.6%
3.0% 4.1%
4.6% 6.2%
% Dist. of Employed Graduates by Sector - St
Augustine, Mona and Cave Hill - 2008 Graduates
22 | P a g e
Trinidad & Tobago as well as of those employed,
as well as state owned in Trinidad and Tobago while other
and in Jamaica 36% of graduates were employed in the Private sector while other entities accounted for 8%. The pattern in Barbados was somewhat different with the main employer of graduates being the Private sector
ublic sector in Trinidad & raduates of the St
nly absorbed 30% of graduates is a result of nergy sector drives the economy
of the economy away
90% 100%
Cave Hill

23 | P a g e
The percentage of graduates employed in the Private sector increased from 48% to 57% in Barbados, making this sector the major employer of graduates of the Cave Hill Campus. The fact that the Private sector absorbed the majority of graduates is a result of the structure of the Barbados economy where the tourism and the international business sector are the major drivers of the economy. Despite the fact that the percentage of graduates employed in the Public sector declined marginally from 59% to 56% as shown in Chart 8(b), this sector remains the major employer of graduates of the Mona Campus.
GRADUATE DESTINATION –MAJOR ACTIVITY OF EMPLOYERS A ND TYPE OF JOBS GRADUATE ARE EMPLOYED IN
ST AUGUSTINE CAMPUS-EMPLOYMENT BY TYPE OF JOB
Chart 8(a) shows that the majority of graduates were employed as Professionals (51%), followed the Technicians/Associate professionals (12%). At the Faculty level, the overwhelming majority of graduates in Medical Sciences and Education were employed as Professionals. A higher than average percentage of graduates in Agriculture, Social Sciences and Humanities were employed in Clerical jobs
63%59%
45%
28%33%
48%
58% 56%
33% 30%36%
57%
Public Sector -SA
Public Sector -MO
Public Sector -CH
Private Sector-SA
Private Sector-MO
Private Sector-CH
Chart 8(b) - Trend Analysis - % Dist. of Graduate Employment by Sector
2007 2008

24 | P a g e
TABLE 8(A) – GRADUATES EMPLOYED IN TRINIDAD AND TOBAGO BY TYPE OF JOB
Type of Job/Faculty Engineering
Education
Humanities
Medical Sciences-3
Yr
Medical Sciences - 5 Yr
Science
Social Sciences
Agriculture All
Legislators, Senior Officials
0.0% 0.0% 1.4% 0.0% 0.0% 0.0% 0.0% 0.0% 0.2%
Other 4.8% 7.4% 22.9% 14.3% 0.0% 13.1%
10.6% 13.5% 10.9%
Managerial 7.1% 0.0% 4.3% 0.0% 0.0% 3.3% 7.5% 5.4% 5.3%
Service and Sales 1.2% 0.0% 2.9% 0.0% 0.0% 0.0% 3.0% 8.1% 2.3%
Clerks 0.0% 0.0% 11.4% 0.0% 0.0% 1.6% 15.6% 18.9% 9.0%
Armed Forces 0.0% 0.0% 0.0% 0.0% 0.0% 0.0% 1.0% 0.0% 0.4%
Professionals 53.6% 85.2% 51.4% 71.4% 100.0% 42.6%
41.2% 32.4% 51.1%
Supervisory 6.0% 3.7% 2.9% 14.3% 0.0% 8.2% 13.6% 2.7% 8.0%
Technicians & Associate
Professionals
27.4% 3.7% 1.4% 0.0% 0.0% 27.9%
7.0% 18.9% 12.0%
Skilled Workers/Craftsmen
0.0% 0.0% 1.4% 0.0% 0.0% 3.3% 0.5% 0.0% 0.8%
Grand Total 84 27 70 7 39 61 199 37 524
*See Appendix 3(a) for List of Employers and Title of Jobs
MONA CAMPUS-EMPLOYMENT BY TYPE OF JOB
Chart 8(b) shows that the majority of graduates were employed as Professionals (47.7%), followed by Clerks with 13.3%. At the Faculty level, the overwhelming majority of graduates in Medical Sciences and Education were employed as Professionals. The largest segment of graduates of Social Sciences (24%) reported that they were employed in clerical positions followed by Professional posts with 21%. Science graduates were employed predominantly as Technicians with 31% followed by Professionals with 27%.

25 | P a g e
TABLE 8(B) – GRADUATES EMPLOYED IN JAMAICA BY TYPE OF JOB
Faculty Education
Humanities
Medical Sciences - 3
Yr
Medical Sciences –
5 Yr
Pure and Applied Sciences
Social Sciences All
Legislator, Senior Officials
0.0% 0.0% 1.6% 0.0% 0.0% 0.4% 0.3%
Professionals 84.1% 46.4% 95.2% 94.7% 27.3% 21.1% 47.7%
Managerial 5.3% 3.6% 0.0% 5.3% 7.3% 9.6% 6.4%
Supervisory 10.6% 7.3% 1.6% 0.0% 5.5% 15.1% 10.2%
Service and Sales 0.0% 10.9% 0.0% 0.0% 5.5% 13.9% 8.2%
Technicians & Associate Professionals
0.0% 11.8% 1.6% 0.0% 30.9% 7.6% 8.2%
Clerks 0.0% 12.7% 0.0% 0.0% 10.9% 24.3% 13.3%
Armed Forces 0.0% 0.9% 0.0% 0.0% 5.5% 0.4% 0.8%
Other 0.0% 6.4% 0.0% 0.0% 7.3% 7.6% 4.9%
Grand Total 113 110 62 19 55 251 610
*See Appendix 3(b) for List of Employers and Title of Jobs
CAVE HILL CAMPUS-EMPLOYMENT BY TYPE OF JOB
Chart 8(c) shows that the majority of graduates employed in Barbados were Professionals (32%), followed by Clerks with 17% and Technicians and Associate Professionals with 16%. At the Faculty level, the majority of graduates in Education and Pure and Applied Sciences were employed as Professionals. A higher than average percentage of graduates in Humanities (29%) and Social Sciences (17%) were employed in Clerical jobs
TABLE 8(C) – GRADUATES EMPLOYED IN BARBADOS BY TYPE OF JOB AND FACULTY
Education Humanities
Pure and Applied Sciences
Social Sciences All
Managerial 0.0% 14.3% 9.5% 11.0% 11.0%
Sales & Service Workers 0.0% 9.5% 4.8% 8.0% 7.6%
Clerks 0.0% 28.6% 4.8% 17.0% 16.6%
Armed Forces 0.0% 0.0% 0.0% 3.0% 2.1%
Professionals 66.7% 28.6% 52.4% 28.0% 32.4%
Supervisory 33.3% 14.3% 4.8% 14.0% 13.1%
Technicians & Associate Professionals
0.0% 0.0% 23.8% 18.0% 15.9%
Other 0.0% 4.8% 0.0% 1.0% 1.4%
Grand Total 3 21 21 100 145
*See Appendix 3(c) for List of Employers and Title of Jobs

26 | P a g e
EMPLOYMENT BY MAJOR ACTIVITY OF EMPLOYER – ALL CAMPUSES
The data in Table 9 confirm that a significant proportion of graduates (29%) are absorbed in the Education sector mainly as teachers, followed by Health and Finance, Insurance and Real estate with 14% each. The majority of graduates from Mona are employed in Education, Health and Social Services and Finance, Insurance and Real Estate. Graduates from St Augustine were employed mainly in Education, Health and Social Services and Finance, Insurance and Real Estate and Energy. Graduates from Cave Hill were employed mainly in Finance, Insurance and Real Estate and Energy, Education, and Professional, Scientific & Technical Services.
TABLE 9 - EMPLOYER BY MAJOR ACTIVITY AND CAMPUS
Major Activity of Employer St Augustine Mona Cave Hill All
Arts, Entertainment & Recreation 0.8% 3.5% 2.8% 2.4%
Construction 3.3% 0.3% 0.7% 1.4%
Transportation 0.6% 1.5% 0.0% 1.0%
Information Technology and Communication
1.3% 4.4% 7.6% 3.6%
Professional, Scientific & technical Activities
5.2% 1.0% 11.0% 3.6%
Health & Social Services 15.7% 14.4% 5.5% 14.0%
Other 13.2% 9.7% 11.7% 11.2%
Energy 7.7% 0.6% 0.7% 3.2%
Electricity, Gas, Water 3.4% 0.1% 0.0% 1.4%
Wholesale and Retail Trade 1.5% 1.0% 5.5% 1.7%
Accommodation & Food Service 1.7% 1.5% 2.8% 1.7%
Finance, Insurance & Real Estate 8.6% 14.3% 26.9% 13.5%
Education 30.7% 30.7% 20.0% 29.6%
Agriculture 2.5% 0.7% 0.7% 1.4%
Manufacturing 3.8% 1.0% 4.1% 2.4%
Grand Total 522 720 145 1387
27 | P a g e
SECTION 5 - EMPLOYMENT EARNINGS - MEDIAN MONTHLY SALARIES OF
GRADUATES EMPLOYED FULL-TIME
Salaries earned by new graduates are a standard measure of competitiveness used by many universities in the industrialized countries. Obtaining information on starting salaries for recent graduates is a difficult task, since many graduates are often reluctant to provide this information for a number of reasons. As anticipated this part of the survey was less complete than other information collected in the survey since approximately 10% of employed graduates did not provide information on their salaries. FREQUENCY DISTRIBUTION OF MONTHLY SALARIES OF EMPLO YED GRADUATES
ST AUGUSTINE – GRADUATES EMPLOYED IN TRINIDAD & TOBAGO
Table 10 below shows the distribution of monthly earnings of employed graduates working in Trinidad. If one considers a monthly salary of over $6,000 to be a reasonable starting salary for a first degree holder, it means that approximately 24.3% of employed graduates earn lower than expected salaries. The largest segment of 33.3% earned between $6,000 and $9,000, 27.5% earned between $9,000 and $12,000 while 14.6% earned over $12,000. Trend Analysis – Frequency Distribution of Salaries A higher percentage of graduates earned lower than expected salaries i.e. 24.3% for 2008 graduates compared to 19.5% for 2007 graduates. This is probably the result of the higher levels of underemployment in 2008 as a result of less job opportunities in a contracting economy.
TABLE 10 – FREQUENCY DISTRIBUTION OF MONTHLY EARNINGS OF GRADUATES
Monthly Earnings(TT$) All - 2008 All – 2007
Less than $3,000 1.9% 1.4%
$3,000 to $6,000 22.4% 18.1%
$6,000 to $9,000 33.3% 35.5%
$9,000 to $12,000 27.5% 34.4%
$12,000 and Over 14.6% 10.6%
Total Count 473 349
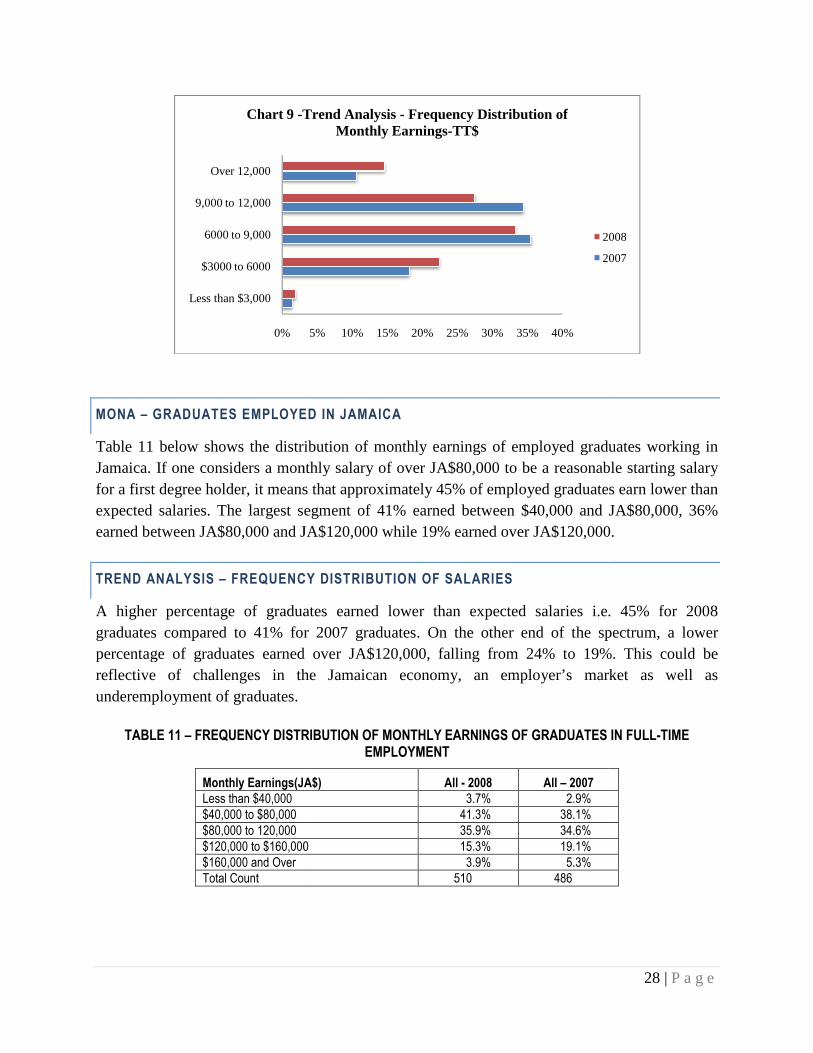
MONA – GRADUATES EMPLOYED I
Table 11 below shows the distribution of monthly earnings of employed graduates working in Jamaica. If one considers a monthly salary of over for a first degree holder, it means that approximately expected salaries. The largest segment of 41% earned between $40,000 and earned between JA$80,000 and JA
TREND ANALYSIS – FREQUENCY DISTRIBUTI
A higher percentage of graduates earned lower than expected salaries i.e. 45% for 2008 graduates compared to 41% for 2007 graduates. On the other end of the spectrum, a lower percentage of graduates earned over reflective of challenges in the Jamaican economy, underemployment of graduates.
TABLE 11 – FREQUENCY DISTRIBUTI
Monthly Earnings(JA$)Less than $40,000 $40,000 to $80,000 $80,000 to 120,000 $120,000 to $160,000$160,000 and Over Total Count
0%
Less than $3,000
$3000 to 6000
6000 to 9,000
9,000 to 12,000
Over 12,000
Chart 9 -Trend Analysis
GRADUATES EMPLOYED IN JAMAICA
below shows the distribution of monthly earnings of employed graduates working in . If one considers a monthly salary of over JA$80,000 to be a reasonable
for a first degree holder, it means that approximately 45% of employed graduates earn lower than . The largest segment of 41% earned between $40,000 and
JA$120,000 while 19% earned over JA$120,000.
FREQUENCY DISTRIBUTION OF SALARIES
f graduates earned lower than expected salaries i.e. 45% for 2008 graduates compared to 41% for 2007 graduates. On the other end of the spectrum, a lower percentage of graduates earned over JA$120,000, falling from 24% to 19%.
hallenges in the Jamaican economy, an employer’s market
FREQUENCY DISTRIBUTION OF MONTHLY EARNINGS OF GRADUATES IN FEMPLOYMENT
Monthly Earnings(JA$) All - 2008 All – 2007 3.7% 2.9% 41.3% 38.1% 35.9% 34.6%
$120,000 to $160,000 15.3% 19.1% 3.9% 5.3%
510 486
5% 10% 15% 20% 25% 30% 35% 40%
Trend Analysis - Frequency Distribution of Monthly Earnings-TT$
2008
2007
28 | P a g e
below shows the distribution of monthly earnings of employed graduates working in reasonable starting salary
tes earn lower than . The largest segment of 41% earned between $40,000 and JA$80,000, 36%
$120,000.
f graduates earned lower than expected salaries i.e. 45% for 2008 graduates compared to 41% for 2007 graduates. On the other end of the spectrum, a lower
120,000, falling from 24% to 19%. This could be market as well as
GS OF GRADUATES IN FULL-TIME
2008
2007

CAVE HILL – GRADUATES EMPLOYED I
Table 12 below shows the distribution of monthly earnings of employed graduates working in Barbados. If one considers a monthly salary of over $for a first degree holder, it means that approximately than expected salaries. The largest segment of 3earned between $3,000 and $4,000 while
TREND ANALYSIS – FREQUENCY DISTRIBUTI
Compared to the previous survey, asalaries i.e. 5.1% for 2008 graduates compared to 1graduates earned between $2,000 to $3000 i.e. 38.5% for 2008 compared to 28.4% 2007 graduates. In terms of earnings, graduates of Cave Hill seem to be slightly better off than their counterparts in Jamaica and Trinidad and Tobago. However, it is possible that this could translate differently in terms of purchasing power.
TABLE 12 – FREQUENCY DISTRIBUTI
Monthly Earnings(BDS$)
Less than $1,000
$1,000 to $2,000
$2,000 to $3,000
$3,000 to $4,000
Over $4,000
Total Count
0% 5%
Less than $40,000
$40,000 to 80,000
$80,000 to $120,000
120,000 to 160,000
Over 160,000
Chart 10 -Trend Analysis
GRADUATES EMPLOYED IN BARBADOS
below shows the distribution of monthly earnings of employed graduates working in . If one considers a monthly salary of over $2,000Bds to be a reasonable starting salary
for a first degree holder, it means that approximately 5.1% of employed gradthan expected salaries. The largest segment of 38% earned between $2,000 and $
,000 while 23% earned over $4,000.
FREQUENCY DISTRIBUTION OF SALARIES
Compared to the previous survey, a lower percentage of graduates earned lower than expected % for 2008 graduates compared to 13.4% for 2007 graduates
graduates earned between $2,000 to $3000 i.e. 38.5% for 2008 compared to 28.4% 2007 ngs, graduates of Cave Hill seem to be slightly better off than their
counterparts in Jamaica and Trinidad and Tobago. However, it is possible that this could translate differently in terms of purchasing power.
FREQUENCY DISTRIBUTION OF MONTHLY EARNINGS OF GRADUATE
Monthly Earnings(BDS$) All - 2008 All – 2007
0.7% 2.2%
4.4% 11.2%
38.5% 28.4%
33.3% 30.6%
22.9% 27.6%
135 144
10% 15% 20% 25% 30% 35% 40% 45%
Trend Analysis - Frequency Distribution of Monthly Earnings-JA$
29 | P a g e
below shows the distribution of monthly earnings of employed graduates working in to be a reasonable starting salary
% of employed graduates earn lower ,000 and $3,000, 33%
percentage of graduates earned lower than expected % for 2007 graduates while more
graduates earned between $2,000 to $3000 i.e. 38.5% for 2008 compared to 28.4% 2007 ngs, graduates of Cave Hill seem to be slightly better off than their
counterparts in Jamaica and Trinidad and Tobago. However, it is possible that this could
EARNINGS OF GRADUATES
45%
2008
2007

MONTHLY SALARIES (MEDIAN) OF EMPLOYED
MEDIAN MONTHLY SALARIES BY FACULTY
TOBAGO ECONOMY
Chart 12 sets out Median Monthly Salaries earned by graduateyear after graduation. The top tier ofFaculty of Medical Sciences (5 Yr)Medical Sciences (3/4 yr) with were graduates from Social Sciencesgraduates of Agriculture, Science and Humanities, TT$7,080 and TT$7,380, respectively
TREND ANALYSIS – MONTHLY MEDIAN SALAR
Even though the overall median salary remained fairly TT$8,400 or showing a marginal decline of $100, the real income of graduates would have declined by a greater margin when one takes cost of living factors into consideration. At the Faculty level there were some significant variations in median salaries over period. Medical Sciences graduatesincrease in median salaries from remuneration packages of these professionalsfor graduates from Science and Agriculture where there were decreases in median salaries from TT$8,800 to TT$7,080 in Science and from
0.00%
Less than $1,000
$1,000 to $2,000
$2,000 to $3,000
$3,000 to $4,000
Over $4,000
Chart 11 -
(MEDIAN) OF EMPLOYED GRADUATES BY FACULTY
IES BY FACULTY – GRADUATES EMPLOYED IN TRINIDAD &
Monthly Salaries earned by graduates employed in fulltier of median salaries reported in 2009 went to graduates from the 5 Yr) with TT$19,500, followed by Education with TT$
yr) with TT$10,000 and Engineering with TT$9,000. In the second tier duates from Social Sciences with TT$7,900. Median salaries were lowest among
Science and Humanities, earning median salaries of , respectively.
MONTHLY MEDIAN SALARIES BY FACULTY
Even though the overall median salary remained fairly stable i.e. moving from showing a marginal decline of $100, the real income of graduates would have
declined by a greater margin when one takes cost of living factors into consideration.
At the Faculty level there were some significant variations in median salaries over . Medical Sciences graduates (5 yr) mainly in Medicine and Dentistry showed a steep
increase in median salaries from TT$12,220 to TT$19,500 which were due to increases in professionals. On the other hand there were some troubling signs
cience and Agriculture where there were decreases in median salaries from 7,080 in Science and from TT$6,180 to TT$5,125 in Agriculture
10.00% 20.00% 30.00% 40.00% 50.00%
-Trend Analysis - Frequency Distribution of Monthly Earnings-BDS$
2008
2007
30 | P a g e
GRADUATES BY FACULTY
N TRINIDAD &
employed in full-time jobs one went to graduates from the
, followed by Education with TT$9,240, In the second tier
alaries were lowest among of TT$5,125 and
moving from TT$8,500 to showing a marginal decline of $100, the real income of graduates would have
declined by a greater margin when one takes cost of living factors into consideration.
At the Faculty level there were some significant variations in median salaries over the two year mainly in Medicine and Dentistry showed a steep
19,500 which were due to increases in e some troubling signs
cience and Agriculture where there were decreases in median salaries from 5,125 in Agriculture. Labour
2008
2007

31 | P a g e
market saturation resulting in some levels of underemployment would possibly have been the major contributor to low incomes.
*See Appendix 4(a) for Details of Median Salaries by Area of Study
GRADUATE SALARIES BY AREA OF STUDY (MEAN AND MEDIAN) – ST AUGUSTINE
Looking at the data a significant feature of the income profile of these graduates is the substantial variations across disciplines. Appendix 3 provides details of Mean and Median salaries by area of study within Faculties for 2007 and 2008 while Chart 13 below gives a ranking of median salaries by area of study for the 2008 graduates. At the upper end of the income earning scale are the graduates in Medicine & Surgery with median earnings of TT$18,960, followed by graduates in Dental Surgery (TT$14,000). Other high income earners are graduates from Nursing, Petroleum Geosciences all of whom had median salaries of over TT$10,000. At the other end of the spectrum lower than average earnings were reported by graduates from Communication Studies (TT6,400), Life Sciences (TT$6,150), History (TT$5,800), International Tourism (TT6,000), Agribusiness Management (TT$5,610) and Linguistics (TT$4,000). Low salaries are normally a reflection of labour market saturation.
$6,148
$8,800
$7,000
$7,791
$8,500
$9,000
$10,666
$10,000
$12,220
$5,125
$7,080
$7,370
$7,900
$8,400
$9,000
$9,244
$10,000
$19,500
Agriculture
Science
Humanities
Social Sciences
All
Engineering
Education
Medical Sciences(3/4 yr)
Medical Sciences(5 yr)
Chart 12 - Trend Analysis - Monthy Median Salaries (TT$) of Graduates employed in Trinidad & Tobago by Faculty/School
Median Salary - 2008 Median Salary - 2007

32 | P a g e
The median salaries are based on those who have responded to this survey and some care should be taken in interpreting the results of those programs with low response rates. Notwithstanding this fact, it is very evident that many graduates are earning lower than expected salaries and special attention should be paid by the University to the performance of these graduates in the labour market An important factor one must bear in mind when comparing the income earnings of graduates across disciplines is the fact that some graduates may be at the beginning of their career and others at mid-career (most of these are over 35 years of age and are in most cases are returning to their previous employer). Almost all the graduates in Education and Nursing, as well as a significant proportion of graduates in Social Work and Public Sector Management are mid-career graduated.
MEDIAN MONTHLY SALARIES BY FACULTY – GRADUATES EMPLOYED IN THE JAMAICAN
ECONOMY
Chart 14 sets out Median Monthly Salaries earned by graduates employed in full-time jobs one year after graduation. The top tier of median salaries reported in 2009 went to graduates from the Faculty of Medical Sciences (5 Yr) with JA$122,090, followed by Education with JA$119,280. In the second tier were graduates from Pure & Applied Sciences with JA$83,130. Median salaries were lowest among graduates of Medical Sciences (3 yr), Humanities and Social sciences, earning median salaries of JA$55,690, JA$75,000 and JA$80,000, respectively.
TREND ANALYSIS – MONTHLY MEDIAN SALARIES BY FACULTY
The overall nominal median salary remained fairly stable at JA$85,000; however, the real income of graduates would have declined when one takes cost of living factors into consideration. A conversion to US$ using the 2007 and 2008 exchange rates shows a decline from US$1,164 to US$966 or a decrease of 17%. At the Faculty level there were no significant changes in nominal median salaries over the two year period with the possible exception of Medical Sciences graduates (5 yr) mainly in Medicine, which showed a decline in median salaries from 150,000 to 122,090. There is no rational explanation for this except to say that this could either be under reporting by graduates or a statistical error. Labour market saturation resulting in some levels of underemployment is a major contributing factor to low incomes.

Linguistics
Agribusiness
International Tourism
History
Life Sciences
Communication Studies
Computer Science & Management
Physical Sciences
Public Sector Management
Envir & Natural Resource Mgmt(Agric)
Envir & Natural Resource Mgmt(Sci)
English
Economics
Sociology
School of Science
Foreign languages
Human Ecology
Psychology
Chemistry & Management
Creative Arts
Management Studies
Mechanical Engineering
Surveying & Land Information
Chemical & Process Engineering
Accounting
Education
Government
Electrical & Computer Eng
Mathematics
Civil Engineering
Pharmacy
Social Work
Petroleum Geosciences
Nursing
Dental Surgery
Medicine & Surgery
Chart 13- Ranking of Gross Monthly Salary(Median) by Area of Study
4,000
5,610
5,690
6,000
6,150
6,400
6,750
6,830
6,880
7,110
7,180
7,290
7,290
7,490
7,610
7,700
7,760
7,940
8,000
8,380
8,400
8,550
8,690
8,950
8,980
9,690
9,870
10,140
10,240
10,400
10,630
11,000
11,570
11,880
14,000
Ranking of Gross Monthly Salary(Median) by Area of Study2008-TT$
33 | P a g e
18,960
Ranking of Gross Monthly Salary(Median) by Area of Study-

34 | P a g e
*See Appendix 4(b) for Details of Median Salaries by Area of Study
GRADUATE SALARIES BY AREA OF STUDY (MEAN AND MEDIAN) - MONA
Looking at the data in Table 9, a significant feature of the income profile of these graduates is the substantial variations across disciplines. Chart 15 gives a ranking of median salaries by area of study for the 2008 graduates. At the upper end of the income earning scale are the graduates in Medicine & Surgery with median earnings of JA$122,090, followed by graduates in Education (JA$119,290). At the other end of the spectrum lower than average earnings( below JA$80,000) were reported by graduates from Library & Information Studies, International Relations, Physical Sciences, Sociology, Computer Sciences, Psychology, Media & Communication, Hospitality & Tourism Management, Economics, History, Political Science and Nursing. The median salaries are based on those who have responded to this survey and some care should be taken in interpreting the results of those programs with low response rates. Notwithstanding this fact, it is very evident that many graduates are earning lower than expected salaries and special attention should be paid by the University to the performance of these graduates in the labour market An important factor one must bear in mind when comparing the income earnings of graduates across disciplines is the fact that some graduates may be at the beginning of their career and others at mid-career (most of these are over 35 years of age and are in most cases are returning to their previous employer). Almost all the graduates in Education as well as a proportion of graduates in Social Sciences and Humanities are mid-career graduated.
85,000
74,000
120,000
150,000
53,000
84,500
80,067
85,000
75,000
119,280
122,090
55,690
83,170
80,000
All Jamaican Residents
Humanities
Education
Medical Sciences – 5 yr
Medical Sciences – 3 yr
Pure and Applied Sciences
Social Sciences
Chart 14 - Trend Analysis - Monthy Median Salaries of Graduates employed in Jamaica by Faculty/School(JA$)
Median Salary - 2008 Median Salary - 2007

Nursing
Political Science
History
Economics
Hosp & Tour Mgmt
Media & Communication
Psychology
Computer Science
Sociology
Computer Science
Philosophy
Physical Therapy
Accounting/Banking
Physical Sciences
International Relations
Library & Information Studies
Actuarial Sciences
English
Spanish
Language Communication
Life Sciences
Pharmacology
Management Studies
Social Work
Public Sector Management
Mathematics
Education
Medicine and Surgery
Chart 15
55,890
65,000
66,500
67,000
67,500
68,000
69,720
70,000
70,000
70,500
72,000
72,500
75,000
77,500
78,000
79,000
80,000
82,000
82,000
82,300
83,220
86,000
88,000
89,185
90,000
94,690
Nursing
Political Science
History
Economics
Hosp & Tour Mgmt
Media & Communication
Psychology
Computer Science
Sociology
Computer Science
Philosophy
Physical Therapy
Accounting/Banking
Physical Sciences
International Relations
Library & Information Studies
Actuarial Sciences
English
Spanish
Language Communication
Life Sciences
Pharmacology
Management Studies
Social Work
Public Sector Management
Mathematics
Education
Medicine and Surgery
Chart 15- Ranking of Gross Monthly Salary(Median) by Area of Study2008-JA$
35 | P a g e
119,280
122,090
Ranking of Gross Monthly Salary(Median) by Area of Study-

36 | P a g e
MEDIAN MONTHLY SALARIES BY FACULTY – GRADUATES EMPLOYED IN THE BARBADIAN
ECONOMY
Chart 16 sets out Median Monthly Salaries earned by graduates employed in full-time jobs one year after graduation. The top tier of median salaries reported in 2009 went to graduates from the Faculty of Education with BDS$4,000 and Humanities with BDS$3,990. In the second tier were graduates from Pure & Applied Sciences with BDS$3,720. Median salaries were lowest among graduates of Social Sciences with BDS$2,920.
TREND ANALYSIS – MONTHLY MEDIAN SALARIES BY FACULTY
The overall median salary declined marginally from BDS$3,500 to BDS$3,200 or showed a marginal decline of $300. In interpreting these results, one must take into account the fact that no responses were received from Medical Sciences in the 2008 survey. In the previous survey, graduates from Medical Sciences recorded the highest median salary (BDS$5,090) which would most likely have influenced the higher overall median salary for 2007 graduates when compared to those of 2008. At the Faculty level there were some variations in median salaries over the two year period. Social Sciences graduates showed an overall decrease in median salary from BDS$3,300 to BDS$2,960 while Humanities showed an increase from BDS$3,500 to BDS$3,990.
*See Appendix 4(c) for Details of Median Salaries by Area of Study
$5,090
$3,700
$3,500
$3,960
$3,300
$3,500
Medical Sciences
Pure & Applied Sciences
Humanities
Education
Social Sciences
All
Chart 16 - Trend Analysis - Monthy Median Salaries (BDS$) of Graduates by Faculty/School
Median Salary - 2008 Median Salary - 2007

37 | P a g e
GRADUATE SALARIES BY AREA OF STUDY (MEAN AND MEDIAN) – CAVE HILL
Looking at the data in Table 9, a significant feature of the income profile of these graduates is the substantial variations across disciplines. Chart 17 gives a ranking of median salaries by area of study for the 2008 graduates. At the upper end of the income earning scale are the graduates in Linguistics, Public sector Management, Physical Sciences and Education all of whom had median salaries of $4,000 and over. As indicated earlier, no data was available for Medical Sciences graduates, however, one can reasonably assume that based on previous data, salaries of these graduates would be at the upper end of the scale. At the other end of the spectrum, lower than average earnings (less than 3,000) were reported by graduates from Accounting, Psychology, Economics, Management Studies and Hospitality and Tourism Management. Low salaries are normally a reflection of labour market saturation. The median salaries are based on those who have responded to this survey and some care should be taken in interpreting the results of those programs with low response rates. Notwithstanding this fact, it is very evident that graduates in certain areas are earning lower than expected salaries and special attention should be paid by the University to the performance of these graduates in the labour market EARLY CAREER VS MID-CAREER GRADUATES
An important factor one must bear in mind when comparing income earnings of graduates across disciplines is the fact that some graduates may be at the beginning of their career and others at mid-career (most of these are over 35 years of age and in most cases are returning to their previous employer). Most of the graduates in Education are mid-career graduates. Table 13(a) below distinguishes between early career graduates (under 35) and mid-career graduates (35 and over). Not surprisingly, salaries of mid-career graduates are higher than early career graduates in all Faculties where applicable across all campuses.

Hospitatility and tourism Management
Management Studies
Economics
Psychology
Accounting
Foreign Languages
Computer Science/IT
Sociology
Social Work
Education
Physical Sciences
Public Sector Management
Linguistics
Chart 17- Ranking of Gross Monthly Salary(Median) by Area of Study
2,400
2,600
2,630
2,950
2,970
3,240
3,650
3,670
3,840
4,000
4,000
4,050
4,900
Ranking of Gross Monthly Salary(Median) by Area of Study2008-BDS$
38 | P a g e
4,900
Ranking of Gross Monthly Salary(Median) by Area of Study-

39 | P a g e
TABLE 13(A) – COMPARATIVE MEDIAN MONTHLY SALARIES OF EARLY CAREER VS. MID-CAREER GRADUATES-2008 GRADUATES
2008 St Augustine Mona Cave Hill
Faculty/School Early Career
Mid-Career
Early Career
Mid-Career Early Career
Mid-Career
Engineering 8,800 - - - - -
Humanities 6,900 8,685 74,000 94500 3,600 4,000
Education 8528 10,000 118,000 120,000 3,900 4120
Medical Sciences – 5 Yr 18,000 - 120,100 - -
Medical Sciences – 3 Yr 10,000 13,000 55,700 55,700 - -
Science 7,000 - 83,000 3,700 4,650
Agriculture 5,125 7,970 - - - -
Social Sciences 7,000 9,980 76,000 109,000 2,800 3800
All 8,000 9,600 81,000 116,300 3,000 4,000
TABLE 13(B) – COMPARATIVE MEDIAN MONTHLY SALARIES OF EARLY CAREER VS. MID-CAREER GRADUATES-2007 GRADUATES
2007 St Augustine Mona Cave Hill
Faculty/School Early Career
Mid-Career
Early Career
Mid-Career Early Career
Mid-Career
Engineering 9,000 - - - - -
Humanities 6,400 8,240 67,330 108,330 3,260 3,820
Education 10,820 118,360 122,000
Medical Sciences – 5 Yr 12,220 - 150,000 - 5,090 -
Medical Sciences – 3 Yr 8,770 10,340 50,000 60,700 - -
Science 8,000 - 84,500 123,000 3,500 4,280
Agriculture 6,000 7,970 - - - -
Social Sciences 6,750 9,210 80,000 93,944 2,900 4,130
All 7,500 10,000 80,000 117,170 3,000 4,100
TREND ANALYSIS – EARLY CAREER VS MID CAREER GRADUATES
In terms of nominal values, the pattern of median income earned by early and mid-career graduates across campuses and faculties appears to be similar with no significant variations. Median salaries of early -career and mid-career graduates were converted to US Dollars and shown in Chart 18(a) below.
This comparison is based strictly on prevailing exchange rates at the time of survey and does not take into
account cost of living indices of the respective countries.

A strict interpretation based sole on
Barbados earn the highest income, followed by those from Trinidad and Tobago with Jamaican graduates
at the lower end of the scale.
Note: Exchange Rates used are: 6.35TT = 1US, 89,000JA = 1 US and 2 BDS = 1US
Note: Exchange Rates used are: 6.30TT = 1US, 80,000JA = 1 US and 2 BDS = 1US
Compared to 2007, when incomes were converted to US dollars, the Jamaican graduates had a decline in salaries which was primarily due to the to the continued devaluation in their currency accompanied by little movement in nominal income
St Augustine
Mona
Cave Hill
Chart 18(a)-Comparative Median Salaries in US$ for Early career and
Mid carreer graduates accross campuses
Mid-career graduates
St Augustine
Mona
Cave Hill
Chart 18(b)-Comparative Median Salaries in US$ for Early career and
Mid carreer graduates accross campuses
Mid-career graduates
sole on exchange rate conversion to US equivalency suggest that graduates in
earn the highest income, followed by those from Trinidad and Tobago with Jamaican graduates
Note: Exchange Rates used are: 6.35TT = 1US, 89,000JA = 1 US and 2 BDS = 1US
Note: Exchange Rates used are: 6.30TT = 1US, 80,000JA = 1 US and 2 BDS = 1US
Compared to 2007, when incomes were converted to US dollars, the Jamaican graduates had a in salaries which was primarily due to the to the continued devaluation in their currency
accompanied by little movement in nominal income
$1,260
$910
$1,500
$1,512
$1,307
Comparative Median Salaries in US$ for Early career and
Mid carreer graduates accross campuses-2008 Graduates
career graduates Early Career Graduates
$1,190
$1,000
$1,500
$1,587
$1,465
$2,050
Comparative Median Salaries in US$ for Early career and
Mid carreer graduates accross campuses-2007 Graduates
career graduates Early Career Graduates
40 | P a g e
exchange rate conversion to US equivalency suggest that graduates in
earn the highest income, followed by those from Trinidad and Tobago with Jamaican graduates
Note: Exchange Rates used are: 6.35TT = 1US, 89,000JA = 1 US and 2 BDS = 1US
Note: Exchange Rates used are: 6.30TT = 1US, 80,000JA = 1 US and 2 BDS = 1US
Compared to 2007, when incomes were converted to US dollars, the Jamaican graduates had a in salaries which was primarily due to the to the continued devaluation in their currency
$2,000
Comparative Median Salaries in US$ for Early career and
$2,050
Comparative Median Salaries in US$ for Early career and
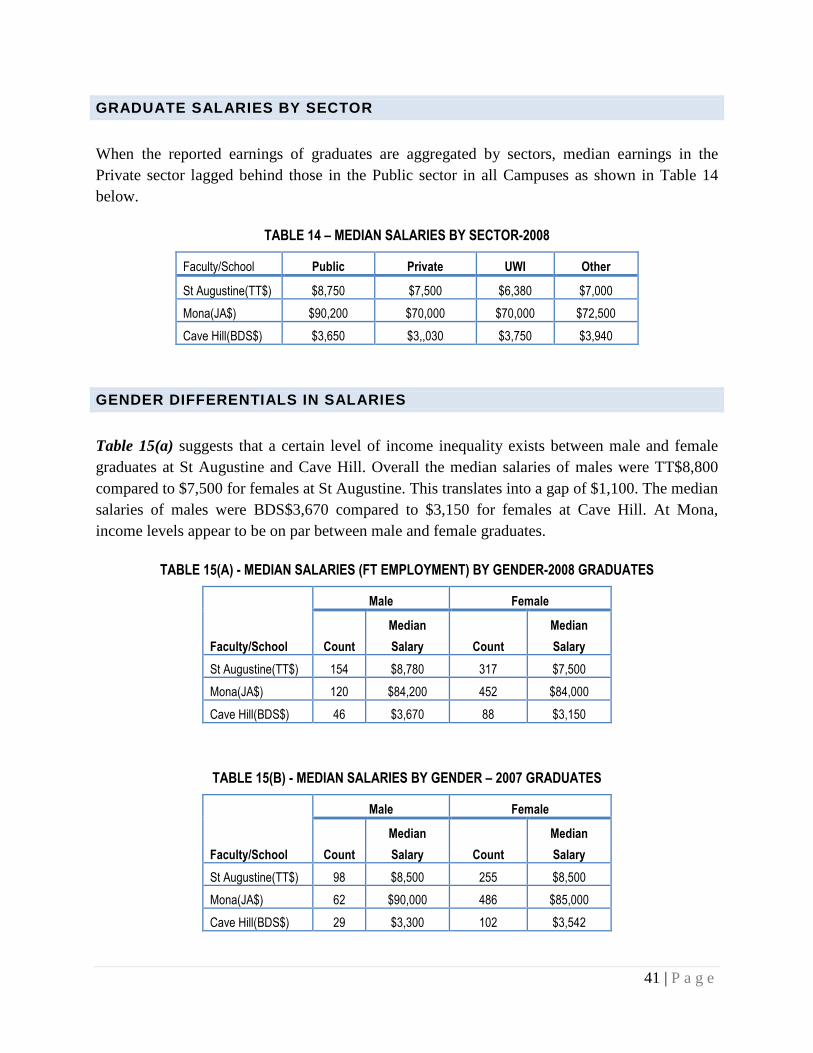
41 | P a g e
GRADUATE SALARIES BY SECTOR
When the reported earnings of graduates are aggregated by sectors, median earnings in the Private sector lagged behind those in the Public sector in all Campuses as shown in Table 14 below.
TABLE 14 – MEDIAN SALARIES BY SECTOR-2008
Faculty/School Public Private UWI Other
St Augustine(TT$) $8,750 $7,500 $6,380 $7,000
Mona(JA$) $90,200 $70,000 $70,000 $72,500
Cave Hill(BDS$) $3,650 $3,,030 $3,750 $3,940
GENDER DIFFERENTIALS IN SALARIES
Table 15(a) suggests that a certain level of income inequality exists between male and female graduates at St Augustine and Cave Hill. Overall the median salaries of males were TT$8,800 compared to $7,500 for females at St Augustine. This translates into a gap of $1,100. The median salaries of males were BDS$3,670 compared to $3,150 for females at Cave Hill. At Mona, income levels appear to be on par between male and female graduates.
TABLE 15(A) - MEDIAN SALARIES (FT EMPLOYMENT) BY GENDER-2008 GRADUATES
Faculty/School
Male Female
Count
Median
Salary Count
Median
Salary
St Augustine(TT$) 154 $8,780 317 $7,500
Mona(JA$) 120 $84,200 452 $84,000
Cave Hill(BDS$) 46 $3,670 88 $3,150
TABLE 15(B) - MEDIAN SALARIES BY GENDER – 2007 GRADUATES
Faculty/School
Male Female
Count
Median
Salary Count
Median
Salary
St Augustine(TT$) 98 $8,500 255 $8,500
Mona(JA$) 62 $90,000 486 $85,000
Cave Hill(BDS$) 29 $3,300 102 $3,542

42 | P a g e
TREND ANALYSIS – MEDIAN SALARIES BY GENDER
Comparative data suggest a widening of the gap between male and female graduates at the St Augustine and Cave Hill Campuses. Clearly, further studies need to done to determine the extent to which the gender gap in the earnings of UWI graduates does in fact exist and why and what what are the factors that influence gender differentials in the earnings of graduates and how this issue needs to be addressed.. THE INFLUENCE OF CLASS OF DEGREE ON INCOME
An interesting consideration is the extent to which degree quality or ‘class of degree’ might influence the size of the salary premium that the graduate can earn upon entering the labour market. The data in Table 16(a) do not confirm that on average holders of degrees in the higher divisions tend to receive higher compensation. There appears to be no clear link between income and academic performance across campuses. In some instances, median salaries of graduates with ‘Upper Second’ or ‘Pass’ are higher than those with ‘First Class’.
TABLE 16(A) – MEDIAN SALARIES OF GRADUATES BY CLASS OF DEGREE – 2008 GRADUATES
Class of Degree
St Augustine Mona Cave Hill
Median
Salary(TT$) Count
Median
Salary(JA$) Count
Median
Salary(BDS$) Count
First Class $8,530 47 86,100 64 3,250 11
Second Class(Upper) $8,750 115 80,000 185 3,450 30
Second Class(Lower) $7,000 204 83,300 242 2,900 75
Pass $7,500 63 84,500 62 3,750 11
Note: Medical Sciences 5-year programmes are excluded because classifications are different.
TABLE 16(B) – MEDIAN SALARIES OF GRADUATES BY CLASS OF DEGREE – 2007 GRADUATES
Class of Degree
St Augustine Mona Cave Hill
Median
Salary(TT$) Count
Median
Salary(JA$) Count
Median
Salary(BDS$) Count
First Class $9,787 60 80,000 54 3,575 8
Second Class(Upper) $8,838 89 89,000 167 3,500 46
Second Class(Lower) $7,984 152 80,133 221 3,200 62
Pass $7,296 26 77,000 35 3,700 10

43 | P a g e
TREND ANALYSIS – INFLUENCE OF CLASS OF DEGREE ON INCOME
When one compares the data for the 2007 in Table 12 above with the 2008 data, a similar pattern of inconsistency between class of degree and income earnings emerged at Mona and Cave Hill. At St Augustine the pattern was somewhat different, showing consistency between class of degree and income earned. These findings raise the issue of meritocracy in the workplace. Normally, one expects that graduates who perform better academically would obtain better jobs and earn higher salaries. Further studies need to be done to determine whether factors such as discrimination by class or political patronage among others influences the apparent lack of meritocracy in the workplace for University graduates and how this issue needs to be addressed.

SECTION 6 -SKILLS MATCH
ALIGNMENT IF CURRENT JOB TO FIRST DEGREE
Graduates were asked the extent to which their current jobs are related to their UWI degree. Although some students do choose to work in areas outside of their disciplines, as a general rule the evidence suggests that students pick a major because they exp Chart 19(a) shows that one year after graduation 50% of all graduates employed in fullemployment considered their work ‘closely’ related to their degree at Mona and 48.7% at St Augustine while 35.4% said so at Cave Hilljob was ‘somewhat related within the broader discipline’ to their degree. This data indicates that from a broad perspective the skills acquired by UWI graduates are generally aligned to the jobs that they hold and consequently one may conclude that skills acquired at UWI are being applied in the workplace.
When the data is disaggregated across faculties as shown in somewhat different in some Faculties. A significant number of graduates in Agriculture (53.8%), Social Sciences (38.1%) and Humanities (31.2%) indicated that their degrees were not related to their current jobs. Although some of
0%
St Augustine-2008
Mona-2008
Cave Hill-2008
All-2008
St Augustine
Closely Related
Related within the broader discipline
Not related but my choice
Not related and not my choice
Chart 19(a) - Alignment of First degree to Current Job(% Dist.)
Augustine,Mona and Cave Hill
SKILLS MATCH AND JOB SATISFACTION
JOB TO FIRST DEGREE EARNED
Graduates were asked the extent to which their current jobs are related to their UWI degree. Although some students do choose to work in areas outside of their disciplines, as a general rule the evidence suggests that students pick a major because they expect to work in that field,
shows that one year after graduation 50% of all graduates employed in fullemployment considered their work ‘closely’ related to their degree at Mona and 48.7% at St Augustine while 35.4% said so at Cave Hill. Across campuses around 27% of students said their job was ‘somewhat related within the broader discipline’ to their degree. This data indicates that from a broad perspective the skills acquired by UWI graduates are generally aligned to the jobs
hold and consequently one may conclude that skills acquired at UWI are being applied
When the data is disaggregated across faculties as shown in Chart 19(b), the story appears to be somewhat different in some Faculties. A significant number of graduates in Agriculture (53.8%), Social Sciences (38.1%) and Humanities (31.2%) indicated that their degrees were not related to their current jobs. Although some of the graduates would have chosen a different field,
20% 40% 60% 80%
St Augustine-2008 Mona-2008 Cave Hill-2008 All-2008
48.7% 50.1% 35.4% 47.5%
29.0% 23.1% 37.7% 27.4%
9.8% 11.9% 9.7% 10.8%
12.5% 14.9% 17.1% 14.3%
Alignment of First degree to Current Job(% Dist.) - St
Augustine,Mona and Cave Hill
44 | P a g e
Graduates were asked the extent to which their current jobs are related to their UWI degree. Although some students do choose to work in areas outside of their disciplines, as a general rule
ect to work in that field,
shows that one year after graduation 50% of all graduates employed in full-time employment considered their work ‘closely’ related to their degree at Mona and 48.7% at St
. Across campuses around 27% of students said their job was ‘somewhat related within the broader discipline’ to their degree. This data indicates that from a broad perspective the skills acquired by UWI graduates are generally aligned to the jobs
hold and consequently one may conclude that skills acquired at UWI are being applied
, the story appears to be somewhat different in some Faculties. A significant number of graduates in Agriculture (53.8%), Social Sciences (38.1%) and Humanities (31.2%) indicated that their degrees were not
chosen a different field,
100%
2008
47.5%
27.4%
10.8%
14.3%

for many it may be the fact that job market saturation to seek employment in a field not related to their degree. Over 90% of graduates in Medical Sciences, Engidegree was either ‘closely related’ or ‘somewhat related’ to their current employment.
TREND ANALYSIS – ALIGNMENT OF CURRENT
Table 17 shows that one year after graduation 4employment considered their work ‘closely’ related to their degree 2008. The pattern that emerged for graduates of 2008 2007. Some 24% of graduates stated that their degree was not related to their jobincreasing from 21% in the previous survey. Clearly there is some level of mismatch of skills in the labour market that have forced a segment of graduates Sciences, Humanities and Pure and Applied Sciences their degree.
0%
Medical Sciences
Engineering
Pure and Applied Sciences
Humanities
Education
Social Sciences
School of Agriculture
Medical
Sciences
Closely Related 98.3%
Related within the broader discipline
Not related but my choice
Not related and not my choice
Chart 19(b) - Alignment of First degree to Current Job by Faculty(% Dist.)
may be the fact that job market saturation would have forced many of these graduates to seek employment in a field not related to their degree.
Over 90% of graduates in Medical Sciences, Engineering and Education said that their university degree was either ‘closely related’ or ‘somewhat related’ to their current employment.
ALIGNMENT OF CURRENT JOB TO DEGREE EARNED
shows that one year after graduation 49% of all graduates employed in fullemployment considered their work ‘closely’ related to their degree in 2007 compared to 48% in
The pattern that emerged for graduates of 2008 appears to be generally similar to those of graduates stated that their degree was not related to their job
1% in the previous survey. Clearly there is some level of mismatch of skills in the labour market that have forced a segment of graduates particularly those from SociSciences, Humanities and Pure and Applied Sciences to seek employment in a field not related to
10% 20% 30% 40% 50% 60% 70% 80%
Medical
SciencesEngineering
Pure and
Applied
Sciences
Humanities EducationSocial
Sciences
98.3% 66.3% 40.0% 40.8% 90.3% 29.5%
1.7% 27.2% 42.0% 28.0% 9.0% 33.4%
0.0% 1.1% 7.3% 11.8% 0.0% 17.0%
0.0% 5.4% 10.7% 19.4% 0.7% 20.1%
Alignment of First degree to Current Job by Faculty(% Dist.) -
Campuses - 2008
45 | P a g e
forced many of these graduates
neering and Education said that their university degree was either ‘closely related’ or ‘somewhat related’ to their current employment.
% of all graduates employed in full-time in 2007 compared to 48% in generally similar to those of
graduates stated that their degree was not related to their job in 2007, 1% in the previous survey. Clearly there is some level of mismatch of skills in
particularly those from Social to seek employment in a field not related to
90% 100%
Social
Sciences
School of
Agriculture
29.5% 20.5%
33.4% 25.6%
17.0% 25.6%
20.1% 28.2%
- All

46 | P a g e
TABLE 17 - ALIGNMENT OF FIRST DEGREE TO CURRENT JOB (% DIST.) – TREND ANALYSIS
Closely
Related
Related within
the broader
discipline
Not
related but
my choice
Not
related
and not my
choice
St Augustine-2007 51.0% 31.0% 6.0% 12.0%
St Augustine-2008 48.7% 29.0% 9.8% 12.5%
Mona -2007 51.0% 27.0% 12.0% 10.0%
Mona-2008 50.1% 23.1% 11.9% 14.9%
Cave Hill-2007 38.0% 32.0% 7.0% 23.0%
Cave Hill-2008 35.4% 37.7% 9.7% 17.1%
All-2007 49.2% 29.4% 9.1% 12.3%
All-2008 47.5% 27.4% 10.8% 14.3%
RELATION OF JOB TO QUALIFICATION – IS THE MINIMUM R EQUIREMENT FOR CURRENT JOB A FIRST DEGREE
One way of determining whether graduates are employed in jobs that are commensurate with their qualifications is to ask whether a First degree is the minimum requirement for their current job Chart 20(a) shows that a significant overall percentage (46%) of respondents across campuses who are employed indicated that a first degree is not the minimum requirement for their current job suggesting that most, if not all of these graduates are overqualified for their current jobs. At the Campus level, a large majority of graduates at Cave Hill (60.6%) indicated that a first degree is not the minimum requirement for their current job, while at Mona 56% said the same. At St Augustine a minority of graduates (37%) indicated that a first degree is not the minimum requirement for their current job.

A deeper analysis of these respondents in graduates from the Education and their current jobs do not require a first degree. This is somewhat expected since these are mid career graduates returning to their previous employers in the public service as teachers and nurses. Of greater concern is theSocial Sciences (50%), Humanities (59%) and Agriculture (48.7%), most of whom are early career graduates, reported that a first degree was not the minimum requirement for their current jobs one year after graduation. This observation is reinforced by the fact that a number of these graduates reported that they were employed in clerical and other low level positions.
St Aug.-2008
Mona-2008
Cave Hill-2008
All-2008
First Degree is not minimum
requirement for current job
First Degree is minimum requirement
for current job
Chart 20(a) - Minimum Requirement for Job(% Dist.)
A deeper analysis of these respondents in Chart 20(b) shows that a significant majority of graduates from the Education and Medical Sciences – 3 Yr Nursing programmes indicated that their current jobs do not require a first degree. This is somewhat expected since these are mid career graduates returning to their previous employers in the public service as teachers and nurses. Of greater concern is the fact that across campuses a significant number of graduates in Social Sciences (50%), Humanities (59%) and Agriculture (48.7%), most of whom are early career graduates, reported that a first degree was not the minimum requirement for their current
one year after graduation. This observation is reinforced by the fact that a number of these graduates reported that they were employed in clerical and other low level positions.
0% 10% 20% 30% 40% 50% 60% 70% 80%
St Aug.-2008 Mona-2008 Cave Hill-2008
37.1% 56.4% 60.6%
First Degree is minimum requirement 62.9% 43.6% 38.4%
Minimum Requirement for Job(% Dist.) - St Augustine,
Mona and Cave Hill
47 | P a g e
shows that a significant majority of Nursing programmes indicated that
their current jobs do not require a first degree. This is somewhat expected since these are mid career graduates returning to their previous employers in the public service as teachers and
a significant number of graduates in Social Sciences (50%), Humanities (59%) and Agriculture (48.7%), most of whom are early career graduates, reported that a first degree was not the minimum requirement for their current
one year after graduation. This observation is reinforced by the fact that a number of these graduates reported that they were employed in clerical and other low level positions.
90% 100%
All-2008
49.3%
50.7%
St Augustine,

TREND ANALYSIS – MINIMUM REQU
Table 18 shows that the number of graduates a first degree remained significant increasing from 47% to 49%. This suggests that many graduates leaving UWI are taking jobs normally occupied school graduates probably because of the narrow them. TABLE 18 - MINIMUM REQUIREMENT
Minimum Requirement for Job
St Aug.-2007
First Degree is not minimum requirement for current job
42%
First Degree is minimum requirement for current job
58%
Engineering
Med. Sci.-Nursing
Med. Sci. - 5 yr
Agriculture
Education
Humanities
Science
Social Sciences
All
Engineerin
g
First Degree is not min. req. 9.8%
First degree is min. req. 90.2%
Chart 20(b) - Minimum Requirement for Job by Faculty/School% Dist.)
MINIMUM REQUIREMENT FOR CURRENT JOB
the number of graduates indicating that their jobs do not necessarily require remained significant increasing from 47% to 49%.
that many graduates leaving UWI are taking jobs normally occupied probably because of the narrow range of opportunities currently available to
MINIMUM REQUIREMENT FOR JOB – COMPARATIVE SUMMARY ACROSS CAMPUSES (
-
St Aug.-2008
Mona-2007
Mona-2008
Cave Hill-2007
Cave Hill-2008 2007
37.1% 51.0% 56.4% 56.0% 60.6% 47.4%
62.9% 49.0% 43.6% 44.0% 38.4% 52.6%
Med. Sci.-
Nursing
Med. Sci. -
5 yr
Agricultur
eEducation
Humanitie
sScience
Social
Sciences
71.2% 1.7% 48.7% 74.5% 59.2% 40.3% 50.0%
28.8% 98.3% 51.3% 25.5% 40.8% 59.7% 50.0%
Minimum Requirement for Job by Faculty/School% Dist.)-2008
Graduates - All Campuses
48 | P a g e
jobs do not necessarily require
that many graduates leaving UWI are taking jobs normally occupied by secondary opportunities currently available to
CAMPUSES (% DIST.)
All-2007
All-2008
47.4% 49.3%
52.6% 50.7%
Social
SciencesAll
50.0% 49.3%
50.0% 50.7%
2008

JOB SATISFACTION
ST AUGUSTINE GRADUATES
In the 2008 survey graduates were asked to rate their job satisfaction levels. At St majority of 63.3% was either very satisfied or satisfiedunsatisfied. At the Faculty/School level, graduates in Agriculture, Social Sciences and Humanities were likely to be very satisfied or satisfied with their jobs Not surprisingly many of these graduates are employed not related to their first degree as well as the fact that some of these jobs commensurate with their qualifications
0% 10%
All
Engineering
Medical Sciences - 3/4 YR
School of Agriculture
Education
Humanities
Science
Social Sciences
Medical Sciences - 5 YR
AllEngineerin
g
Very Satisfied 15.5% 16.7%
Satisfied 48.2% 64.3%
Tolerable 25.0% 11.9%
Unsatisfied 11.4% 7.1%
Chart 21(a) -
In the 2008 survey graduates were asked to rate their job satisfaction levels. At St ther very satisfied or satisfied while 25% said tolerable and 11.4%
At the Faculty/School level, graduates in Agriculture, Social Sciences and Humanities were likely to be very satisfied or satisfied with their jobs than others.
Not surprisingly many of these graduates are employed in low paying jobs that in many casnot related to their first degree as well as the fact that some of these jobs are commensurate with their qualifications.(see Table 8(a))
10% 20% 30% 40% 50% 60% 70% 80%
EngineerinMedical
Sciences -
3/4 YR
School of
AgricultureEducation Humanities Science
Social
Sciences
14.3% 11.4% 11.1% 11.4% 21.7% 13.3%
57.1% 42.9% 55.6% 45.7% 46.7% 39.5%
14.3% 20.0% 33.3% 30.0% 23.3% 32.3%
14.3% 25.7% 0.0% 12.9% 8.3% 14.9%
Job Satisfaction Levels(% Dist.)-St Augustine
49 | P a g e
In the 2008 survey graduates were asked to rate their job satisfaction levels. At St Augustine a 25% said tolerable and 11.4% were
At the Faculty/School level, graduates in Agriculture, Social Sciences and Humanities were less
in many cases are are low level not
90% 100%
Social
Sciences
Medical
Sciences - 5
YR
13.3% 28.2%
39.5% 61.5%
32.3% 10.3%
14.9% 0.0%

MONA GRADUATES
In the 2008 survey graduates were asked to rate their job satisfaction leveone half or 50.7% was either ‘very satisfied’ or ‘satisfied’, 37% said ‘tolerable’ and 12.2% were unsatisfied.
At the Faculty/School level, graduates in Social Sciences and Medical Sciences (3 yr) were less likely to be ‘very satisfied’ or ‘satisfied’ with their jobs than others.
CAVE HILL GRADUATES
At Cave Hill, 57.7% was either ‘very satisfied’ or ‘satisfied’ while 34.4% said ‘tolerable’ and 7.8% were ‘unsatisfied’.
0% 10%
Humanities
Education
Medical Sciences - 5 yr
Pure and Applied Sciences
Social Sciences
Medical Sciences - 3 yr
Grand Total
Humanities Education
Very Satisfied 5.4% 13.9%
Satisfied 44.6% 47.0%
Tolerable 36.6% 34.8%
Unsatisfied 13.4%
Chart 21(b)
In the 2008 survey graduates were asked to rate their job satisfaction levels. At Mona just over one half or 50.7% was either ‘very satisfied’ or ‘satisfied’, 37% said ‘tolerable’ and 12.2% were
At the Faculty/School level, graduates in Social Sciences and Medical Sciences (3 yr) were less satisfied’ or ‘satisfied’ with their jobs than others.
At Cave Hill, 57.7% was either ‘very satisfied’ or ‘satisfied’ while 34.4% said ‘tolerable’ and
10% 20% 30% 40% 50% 60% 70% 80%
Education
Medical
Sciences - 5
yr
Pure and
Applied
Sciences
Social
Sciences
Medical
Sciences - 3
yr
13.9% 0.0% 12.7% 9.3% 12.3%
47.0% 63.2% 36.5% 38.1% 32.3%
34.8% 31.6% 38.1% 37.4% 41.5%
4.3% 5.3% 12.7% 15.2% 13.8%
Chart 21(b) - Job Satisfaction Levels(% Dist.)-Mona
50 | P a g e
ls. At Mona just over one half or 50.7% was either ‘very satisfied’ or ‘satisfied’, 37% said ‘tolerable’ and 12.2% were
At the Faculty/School level, graduates in Social Sciences and Medical Sciences (3 yr) were less
At Cave Hill, 57.7% was either ‘very satisfied’ or ‘satisfied’ while 34.4% said ‘tolerable’ and
90% 100%
3 Grand Total
9.8%
40.9%
37.1%
12.2%

At the Faculty/School level, graduates in Humanities were ‘satisfied’ with their jobs than others.
0% 10%
All
Education
Humanities
Pure and Applied Sciences
Social Sciences
All
Very Satisfied 44.4%
Satisfied 13.3%
Tolerable 34.4%
Unsatisfied 7.8%
Chart 21(c)
At the Faculty/School level, graduates in Humanities were less likely to be ‘very satisfied’ or ‘satisfied’ with their jobs than others.
10% 20% 30% 40% 50% 60% 70% 80%
Education HumanitiesPure and Applied
SciencesSocial Sciences
0.0% 28.6% 41.7%
0.0% 14.3% 8.3%
100.0% 50.0% 41.7%
0.0% 7.1% 8.3%
Chart 21(c) - Job Satisfaction Levels(% Dist.)-Cave Hill
51 | P a g e
less likely to be ‘very satisfied’ or
90% 100%
Social Sciences
50.8%
11.9%
28.8%
8.5%
Cave Hill

52 | P a g e
SECTION 7 - PREPARATION FOR THE JOB MARKET – SKILLS AND ATTRIBUTES
ACQUIRED THROUGH BACHELORS DEGREE
It is now universally accepted that University graduates need to possess critical skills and attributes to address the needs of 21st century development. Graduates were asked to rate the extent to which their UWI education contributed towards each of the following twelve (12) competencies necessary for their personal and professional development in terms of ‘strong’, ‘moderate’, ‘very little’ or ‘none’:
a) Critical thinking skills
b) Problem solving skills
c) Effective writing skills
d) Effective speaking skills
e) Working effectively with modern IT communication technologies
f) Innovative and entrepreneurial
g) Understanding and appreciating diversity and other cultures
h) Ability to think and work independently
i) Capacity to work effectively in teams
j) Socio/Political awareness
k) Ethical conduct
l) Proficiency in a second language SUMMARY OF GRADUATES’ OPINION ON THEIR DEVELOPMENT OF ATTRIBUTES/SKILLS – PERCENTAGE OF RESPONDENTS SAYIN G ‘STRONGLY’ ENHANCED RANKED IN ASCENDING ORDER: 2007 AND 2008 GRADUATES COMPARED
St Augustine Campus - Summary of percentage of graduates saying ‘Strongly’ enhanced ranked in ascending order: 2007 and 2008 graduates compared

Chart 22(a) gives a ranking in ascending order of the opinions of graduates of 2008 and 2007 aSt Augustine. When graduates of 2008 ‘strongly’ as a result of their first degreedeveloped were their ability to think and work independently(58.2% rated as ‘strong’) and their capacity to work effectively in teams(54.4% rated as ‘strong’). Athe development of effective speaking skills, sociomodern IT, being innovative and entrepreneurial and proficiency in a foreign language were rated ‘strong’ by less than 35% of
TREND ANALYSIS – GRADUATES’ OPINION
There appears to be a marginal decline in the percentage graduates saying that education contributed ‘strongly’ the responses of the 2008 survey are compared to that of 2007
Proficiency in a second language
Innovative and entrepreneurial
Working effectively with modern IT communication technologies
Socio/Political awareness
Effective Speaking Skills
Problem solving skills
Effective writing skills
Critical thinking skills
Understanding and appreciating diversity and other cultures
Capacity to work effectively in teams
Ability to think and work independently
Chart 22(a) -% SAYING STRONG CONTRIBUTION FOR EACH ATTRIBUTE/SKILL
% SAYING STRONG CONTRIBUTION
gives a ranking in ascending order of the opinions of graduates of 2008 and 2007 aof 2008 were asked to reflect on the skills they had developed
as a result of their first degree experience, respondents indicated that developed were their ability to think and work independently(58.2% rated as ‘strong’) and their capacity to work effectively in teams(54.4% rated as ‘strong’). At the other end of the spectrum, the development of effective speaking skills, socio-political awareness, working effectively with modern IT, being innovative and entrepreneurial and proficiency in a foreign language were rated ‘strong’ by less than 35% of respondents.
GRADUATES’ OPINION, MONA
a marginal decline in the percentage graduates saying that to their personal and professional development
the responses of the 2008 survey are compared to that of 2007. Added to this, the percentages
7%
18%
25%
32%
34%
39%
42%
44%
45%
48%
5%
15%
23%
26%
34%
36%
39%
38%
39%
46%
Proficiency in a second language
Innovative and entrepreneurial
Working effectively with modern IT communication
Socio/Political awareness
Effective Speaking Skills
Ethical conduct
Problem solving skills
Effective writing skills
Critical thinking skills
Understanding and appreciating diversity and other
Capacity to work effectively in teams
Ability to think and work independently
% SAYING STRONG CONTRIBUTION FOR EACH ATTRIBUTE/SKILL - 2007 and 2008-St Augustine
% SAYING STRONG CONTRIBUTION-2008 % SAYING STRONG CONTRIBUTION
53 | P a g e
gives a ranking in ascending order of the opinions of graduates of 2008 and 2007 at were asked to reflect on the skills they had developed
respondents indicated that those most developed were their ability to think and work independently(58.2% rated as ‘strong’) and their
t the other end of the spectrum, political awareness, working effectively with
modern IT, being innovative and entrepreneurial and proficiency in a foreign language were
a marginal decline in the percentage graduates saying that their UWI in all areas when
, the percentages the
45%
48%
58%
62%
46%
54%
58%
% SAYING STRONG CONTRIBUTION FOR EACH
% SAYING STRONG CONTRIBUTION-2007

ranking of graduate opinions in terms of the 12remained the same. Mona Campus - Summary of percentage of graduates saying ‘Strongly’ enhanced ranked in ascending order: 2007 and 2008 graduates compared
Chart 22(b) gives a ranking in ascending order of the opinions of graduates of 2008 and 2007 at Mona. When graduates of 2008 were asked tas a result of their first degree experience, respondents indicated that those most developed were their ability to work and think independently(63% rated as ‘strong’) and their capacity to work effectively in teams(59% rated as ‘strong’). At the lower end of the spectrum, socioawareness, working effectively with modern IT, being innovative and entrepreneurial and proficiency in a foreign language were rated ‘strong’ by less than 35% of respon
Proficiency in a second language
Innovative and entrepreneurial
Socio/Political awareness
Working effectively with modern IT communication technologies
Effective Speaking Skills
Problem solving skills
Effective writing skills
Understanding and appreciating diversity and other cultures
Critical thinking skills
Capacity to work effectively in teams
Ability to think and work independently
Chart 22(b) - % SAYING STRONG CONTRIBUTION FOR EACH ATTRIBUTE/SKILL
% SAYING STRONG CONTRIBUTION
ranking of graduate opinions in terms of the 12 competencies in terms of those saying ‘strongly’
of percentage of graduates saying ‘Strongly’ enhanced ranked in ascending order: 2007 and 2008 graduates compared
gives a ranking in ascending order of the opinions of graduates of 2008 and 2007 at Mona. When graduates of 2008 were asked to reflect on the skills they had developed ‘strongly’ as a result of their first degree experience, respondents indicated that those most developed were their ability to work and think independently(63% rated as ‘strong’) and their capacity to work
vely in teams(59% rated as ‘strong’). At the lower end of the spectrum, socioawareness, working effectively with modern IT, being innovative and entrepreneurial and proficiency in a foreign language were rated ‘strong’ by less than 35% of respon
5%
18%
35%
35%
43%
43%
5%
17%
31%
33%
42%
43%
45%
Proficiency in a second language
Innovative and entrepreneurial
Socio/Political awareness
Working effectively with modern IT communication
Ethical conduct
Effective Speaking Skills
Problem solving skills
Effective writing skills
Understanding and appreciating diversity and other
Critical thinking skills
Capacity to work effectively in teams
Ability to think and work independently
% SAYING STRONG CONTRIBUTION FOR EACH ATTRIBUTE/SKILL - 2007 and 2008
% SAYING STRONG CONTRIBUTION-2008 % SAYING STRONG CONTRIBUTION
54 | P a g e
in terms of those saying ‘strongly’
of percentage of graduates saying ‘Strongly’ enhanced ranked
gives a ranking in ascending order of the opinions of graduates of 2008 and 2007 at o reflect on the skills they had developed ‘strongly’
as a result of their first degree experience, respondents indicated that those most developed were their ability to work and think independently(63% rated as ‘strong’) and their capacity to work
vely in teams(59% rated as ‘strong’). At the lower end of the spectrum, socio-political awareness, working effectively with modern IT, being innovative and entrepreneurial and proficiency in a foreign language were rated ‘strong’ by less than 35% of respondents.
51%
54%
59%
54%
59%
64%
45%
53%
54%
55%
59%
63%
% SAYING STRONG CONTRIBUTION FOR EACH
% SAYING STRONG CONTRIBUTION-2007

TREND ANALYSIS – GRADUATES’ OPINION
There appears to be marginal declines or no changes in the percentage graduates saying that their UWI education contributed ‘strongly’ to their personal and professional developmentthe responses of the 2008 survey are compared to that of 2007graduates’ opinion of the 12 competencies the same. Cave Hill Campus - Summary of percentage of graduranked in ascending order: 2007 and 2008 graduates compared
Chart 22(c) gives a ranking in ascending order of the opinions of graduates of 2008 and 2007 at Cave Hill. When graduates of 2008 were asked to reflect on the skills they had developed ‘strongly’ as a result of their first degree experience, respondents indicated thadeveloped were their ability to think and work independently (69% rated as ‘strong’), their capacity to work effectively in teams (70% rated as ‘strong’), critical thinking skills (63% rated
Proficiency in a second language
Innovative and entrepreneurial
Working effectively with modern IT communication technologies
Socio/Political awareness
Problem solving skills
Understanding and appreciating diversity and other cultures
Effective writing skills
Critical thinking skills
Ability to think and work independently
Capacity to work effectively in teams
Chart 22(c) -% SAYING STRONG CONTRIBUTION FOR EACH ATTRIBUTE/SKILL
% SAYING STRONG CONTRIBUTION
GRADUATES’ OPINION, CAVE HILL
marginal declines or no changes in the percentage graduates saying that their UWI education contributed ‘strongly’ to their personal and professional developmentthe responses of the 2008 survey are compared to that of 2007. Added to this, the ranking of
opinion of the 12 competencies in terms of those saying ‘strongly’ remained basically
Summary of percentage of graduates saying ‘Strongly’ enhanced ranked in ascending order: 2007 and 2008 graduates compared
gives a ranking in ascending order of the opinions of graduates of 2008 and 2007 at Cave Hill. When graduates of 2008 were asked to reflect on the skills they had developed ‘strongly’ as a result of their first degree experience, respondents indicated thadeveloped were their ability to think and work independently (69% rated as ‘strong’), their capacity to work effectively in teams (70% rated as ‘strong’), critical thinking skills (63% rated
8%
21%
44%
50%
50%
56%
7%
22%
44%
48%
54%
54%
56%
Proficiency in a second language
Innovative and entrepreneurial
Working effectively with modern IT communication
Socio/Political awareness
Speaking skills
Ethical conduct
Problem solving skills
Understanding and appreciating diversity and other
Effective writing skills
Critical thinking skills
Ability to think and work independently
Capacity to work effectively in teams
% SAYING STRONG CONTRIBUTION FOR EACH ATTRIBUTE/SKILL - 2007 and 2008-Cave Hill
% SAYING STRONG CONTRIBUTION-2008 % SAYING STRONG CONTRIBUTION
55 | P a g e
marginal declines or no changes in the percentage graduates saying that their UWI education contributed ‘strongly’ to their personal and professional development when
. Added to this, the ranking of in terms of those saying ‘strongly’ remained basically
ates saying ‘Strongly’ enhanced
gives a ranking in ascending order of the opinions of graduates of 2008 and 2007 at Cave Hill. When graduates of 2008 were asked to reflect on the skills they had developed ‘strongly’ as a result of their first degree experience, respondents indicated that those most developed were their ability to think and work independently (69% rated as ‘strong’), their capacity to work effectively in teams (70% rated as ‘strong’), critical thinking skills (63% rated
56%
70%
61%
60%
71%
75%
73%
54%
54%
56%
60%
63%
63%
69%
70%
% SAYING STRONG CONTRIBUTION FOR EACH
% SAYING STRONG CONTRIBUTION-2007

56 | P a g e
as ‘strong’) and effective writing skills (63% rated as ‘strong’). At the other end of the spectrum, the development of socio-political awareness, working effectively with modern IT, being innovative and entrepreneurial and proficiency in a foreign language were rated ‘strong’ by less than half of respondents.
TREND ANALYSIS – GRADUATES’ OPINION, ST. AUGUSTINE
There appears to be a marginal decline in the percentage of graduates saying that their UWI education contributed ‘strongly’ to their personal and professional development in most attributes(eight out of twelve) when the responses of the 2008 survey are compared to that of 2007. Added to this, the percentages the ranking of graduate opinions in terms of the 12 competencies in terms of those saying ‘strongly’ remained basically same with a few exceptions. All Campuses - Summary of percentage of graduates saying ‘Strongly’ enhanced ranked in ascending order: 2007 and 2008 graduates compared There appears to be marginal declines or no changes in the percentage graduates saying that their UWI education contributed ‘strongly’ to their personal and professional development when the responses of the 2008 survey are compared to that of 2007. Added to this, the ranking of graduates’ opinion of the 12 competencies in terms of those saying ‘strongly’ remained basically the same. As we approach mid-term, the results of the two surveys conducted thus far suggest that we are yet to see signs of significant advance in the preparation of distinctive graduates for the 21st century that exemplifies attributes such as being a critical thinker, a problem solver, an effective communicator etc. Although more time may be required to see tangible results, since the Strategic Plan would have been less than 2 years in implementation at the time of the 2008 graduation, there is indeed still cause for concern.

TREND ANALYSIS - GRADUATES’ OPINION OATTRIBUTES/SKILLS BY FACULTY/SCHOOL‘STRONG’
Table 19 below compares the percentage of graduates saying personal and professional development for each attribute by Faculty/School
Proficiency in a second language
Innovative and entrepreneurial
Working effectively with modern IT
Socio/Political awareness
Problem solving skills
Effective writing skills
Critical thinking skills
Understanding and appreciating diversity and
Capacity to work effectively in teams
Ability to think and work independently
Chart 22(d) - % SAYING STRONG CONTRIBUTION FOR EACH
ATTRIBUTE/SKILL
GRADUATES’ OPINION O N THEIR DEVELOPMENT BY FACULTY/SCHOOL – PERCENTAGE SAYING
compares the percentage of graduates saying UWI contributed strongly development for each attribute by Faculty/School
Proficiency in a second language
Innovative and entrepreneurial
Working effectively with modern IT …
Socio/Political awareness
Speaking skills
Ethical conduct
Problem solving skills
Effective writing skills
Critical thinking skills
Understanding and appreciating diversity and …
Capacity to work effectively in teams
Ability to think and work independently
5%
17%
30%
32%
41%
41%
44%
49%
49%
52%
59%
62%
6%
18%
33%
37%
41%
44%
51%
52%
54%
56%
61%
% SAYING STRONG CONTRIBUTION FOR EACH
ATTRIBUTE/SKILL-ALL CAMPUSES-2008
% SAYING STRONG CONTRIBUTION-2007
% SAYING STRONG CONTRIBUTION-2008
57 | P a g e
N THEIR DEVELOPMENT OF PERCENTAGE SAYING
ed strongly to their
59%
62%
61%
66%

58 | P a g e
TABLE 19 – TREND ANALYSIS - PERCENTAGE SAYING ‘STRONG’ CONTRIBUTION FOR EACH ATTRIBUTE/SKILL BY FACULTY/SCHOOL
Attribute
Grad.
Year Educ. Hum. Law
Med.
Sci. Eng. Agric. Science
Soc.
Sci.
Critical thinking skills 2007 62.3 63.5 59.3 60.7 23.1 37.9 49 51.9
2008 65.5 62.5 63.2 43.8 31.4 35.4 37.7 48.8
Problem solving skills 2007 54.9 48.1 59.3 58.5 36.9 31 51.9 51.6
2008 56.1 43.3 52.6 43.8 42.7 41.7 44.7 44.5
Effective writing skills 2007 62.3 72.6 55.6 40.7 21.5 44.8 36.5 53.1
2008 58.1 68.0 52.6 34.3 29.1 37.5 28.6 51.6
Effective speaking skills 2007 49.1 57.7 48.1 43.7 15.4 24.1 31.3 38.6
2008 47.3 54.7 42.1 33.6 25.7 39.6 24.6 42.2
Working effectively with modern IT communication technologies
2007 41.4 26.9 22.2 28.9 24.6 34.5 39.9 33.5
2008 42.9 33.5 15.8 22.8 29.1 29.2 28.6 29.3
Innovative and entrepreneurial
2007 23 18.8 18.5 17 15.4 17.2 11.5 20.2
2008 24.3 15.7 21.1 9.5 13.6 27.1 10.2 18.5
Understanding and appreciating diversity and other cultures
2007 61.1 68.3 77.8 45.5 32.3 44.8 46.2 58
2008 57.4 64.6 72.2 38.7 24.3 52.1 45.7 54.7
Ability to think and work independently
2007 69.1 69.7 66.7 63.7 49.2 62.1 63 66.3
2008 70.3 64.6 73.7 54.7 57.3 62.5 52.3 63.3
Capacity to work effectively in teams
2007 63.6 54.3 48.1 65.9 53.8 61.1 56.3 65.5
2008 68.9 53.3 63.2 56.2 63.1 64.9 45.7 61.4
Socio/Political awareness 2007 30.9 43.3 44.4 22.2 10.8 55.2 26.9 46.2
2008 30.4 43.3 52.6 14.6 8.7 14.6 20.1 38.8
Ethical conduct 2007 45.1 43.3 59.7 58.4 15.4 37.9 30.9 48.9
2008 53.4 43.3 42.1 44.5 31.1 33.3 22.7 44.1
Proficiency in a second language
2007 3.1 20.2 11.1 3.7 1.5 0.0 3.4 4.1
2008 4.1 13.4 5.3 2.9 1.0 4.2 1.5 4.8
*See Appendix 5 at end of this report for details of graduates’ opinion by Faculty

59 | P a g e
TREND ANALYSIS – GRADUATES’ OPINION ON THEIR PERSONAL AND PROFESSIONAL
DEVELOPMENT
Areas of improvement
• There has been an improvement in the percentages of Engineering graduates indicating ‘strong contribution’ to all attributes, however, graduates in this Faculty were still less likely to say ‘strong contribution’ than those in other Faculties.
Areas of concern
• The percentage of Medical Sciences and Science indicating ‘strong contribution’ to all attributes showed marginal declines since the last survey in 2007. Clearly this is a disturbing trend for these faculties.
• Moderate to weak Critical thinking and problem solving skills for Science, Engineering and Medical Sciences. Graduates in the Humanities, Education and law tended to rate their critical skills higher than those in the Sciences.
• Weak communication skills(speaking and writing) for Science and technology graduates • Moderate to Weak IT skills across Faculties • Weak entrepreneurial skills across Faculties • Low socio-political awareness by graduates of Medical Sciences, Engineering and
Sciences

60 | P a g e
SECTION 8– SUMMARY, ISSUES TO CONSIDER AND TREND ANALYSIS
POSITIVE TRENDS
The results of the Graduate Tracer Survey of 2008 First Degree graduates confirm or reinforce many of the findings of the 2007 survey. As was the case previously, this survey confirms the overall positive impact of a university education for graduates of UWI in many areas. One year after graduation a majority of respondents were employed with 85% at Mona, 84% at St Augustine and 83% at Cave Hill. Many graduates were employed in Professional and Managerial jobs in areas critical to the economy such as Education, Health care, Finance/Banking and Energy based industries. About thirty percent of respondents were enrolled in postgraduate studies with the majority enrolled at UWI in taught masters and research degree programmes. Furthermore a significant proportion of those not currently pursuing postgraduate studies said that they intend to do so in the near future. Many of our graduates are reasonably paid, particularly those working in the energy, health and education sectors. Data also indicate that the majority of respondents indicated that their overall skills acquired at UWI are generally being applied in the workplace. One year after graduation 48% of all graduates employed in full-time employment considered work ‘closely’ related while 27% said ‘somewhat related within the broader discipline’, which means that 75% of employed graduates are engaged in a job related to their area of study at UWI. CHALLENGING TRENDS
While many aspects of the results of the survey speak positively about the quality of education at UWI, as was the case in the 2007 survey, the data does reveal some troubling aspects of the graduates’ experiences beyond university which are worthy of further and closer examination. Many of the issues which were raised in the last survey are once more being mentioned based on the results of the 2008 survey. Some are common across campuses while others are unique to one or two of the campuses
• Low percentage of graduates enrolled in research degrees - Only 7.7% of graduates across campuses pursuing further studies are enrolled in research degrees.

61 | P a g e
• Competition from other institutions for our graduat es – a significant number of graduates pursuing further studies (39%) are enrolled in other local, regional or foreign tertiary level institutions.
• Increase in those opting to work and study simultaneously– a significant number of graduates (29%) chose to work and study at the same time at St Augustine, 25% at Cave Hill and to a lesser extent 16% at Mona.
• High unemployment of graduates in certain areas- Higher than average unemployment rates reported by graduates in the Science(31%) and Agriculture(19%) and Social Sciences(17%) at St Augustine while at Mona there were high unemployment rates in Pure & Applied Sciences(25%), Humanities(21%) and Social Sciences(19%).
• Lack of entrepreneurial initiatives by graduates- The low percentage of self-employed graduates i.e. only 1.5% reported to be self-employed at St Augustine, 1% at Mona and 2.7% at Cave Hill
• Low private sector employment – A lower than desirable percentage of graduates are employed in the private sector at St Augustine (31%) and at Mona (36%). Salaries in the private sector were lower than in the Public sector across all campuses
• Underemployment of graduates in some disciplines -Underemployment, particularly among graduates from Social Sciences, Agriculture and the Humanities. Higher than desirable percentage of graduates classified their jobs as clerical or sales workers.
• Low salaries in some disciplines - Lower than desirable reported salaries for graduates in Humanities as well some disciplines in Social Sciences, Sciences & Agriculture.
• Disconnect between academic performance and salary– There is little evidence to show that the class of degree obtained influences graduate incomes.
• Disconnect between current job and area of study in certain areas - The fact that a higher than desirable proportion of graduates in disciplines in Agriculture, Humanities and Social Sciences revealed that their degree is not related to their current job (whether by choice or not).
• Slow progress on development of graduate re: critical thinking and problem solving skills - A large proportion of Engineering, Science, Agriculture and Medical Sciences said that their university only moderately contributed to their critical thinking and problem solving skills.
• Slow progress on development of graduate re: working effectively with modern IT Communication skills, being innovative and entrepreneurial and proficiency in a foreign language - A substantial majority of respondents indicated than the university contributed moderately or very little to the following attributes (a) working effectively

62 | P a g e
with modern IT Communication skills (b) Being innovative and entrepreneurial (c) proficiency in a foreign language
• Slow progress on development of graduate re: writing and speaking skills - The fact that many graduates in Science and Technology were of the opinion that their university education did not impact strongly on their writing and speaking skills.
TREND ANALYSIS – WHAT HAS CHANGED SINCE THE 2007 SU RVEY?
• Higher response rates - When compared to the survey of 2007 graduates, there has been an improvement in the overall response rates from 22% to 29%
• Increase in graduates pursuing postgraduate programmes - Overall there has been an increase in the percentage of students enrolled in postgraduate studies from 24% to 28%.
• Increasing in graduates working and studying simultaneously- There is a marked increase in the percentage of graduates who opt to study and work across campuses
• Increase in unemployment rates - The percentage of graduates who indicated that they were unemployed rose sharply from 9% to 17% at St Augustine and from 10% to 15% at Mona.
• Decrease in job mobility - Compared to the previous year, there was less mobility in a tight job market resulting in an increase in the percentage of graduates who were still in their first job after graduation, moving from 42.5% to 52% at St Augustine, 44 to 42% at Mona and 40 to 47% at Cave Hill
• Increase in percentage of graduates earning lower than expected salaries - Compared to 2007, the percentage of graduates earning lower than expected salaries increased from 19.5% to 24.4% at St Augustine and from 41% to 45% at Mona. At Cave Hill there was a decline from 13% to 5%.
• Decline in percentage of graduates saying ‘strong contribution’ in the development of attributes - Generally the rankings of attributes across campus remained basically the same as that in the 2007 survey with a marginal decline in the percentages of those saying ‘strong contribution’ in all 12 attributes
ISSUES TO CONSIDER ARISING OUT OF MAJOR FINDINGS OF SURVEY
• Enrollment and projected growth in research degrees - The challenge here is how to build a research enterprise at UWI that will drive a regional culture of research and innovation in a context where funding is scarce and the market for research degrees at this time is weak

63 | P a g e
• Competitiveness of graduate studies programmes – bearing in mind that a significant percentage of graduates pursuing further studies (39%) are enrolled in other local, regional or foreign tertiary level institutions, there is a need to examine whether programmes are more competitive or attractive than UWI’s in certain key areas
• Significant number of graduate students prefer to work and study at the same time – bearing in mind that an increasing number of postgraduates opt to study and work at the same time, there is a need re-examine the way we structure these graduate programme since the success of these students will increasingly depend on flexible university structures and systems which suit their needs rather than those of the institution.
• Unemployment of graduates - Any unemployment of University graduates in any field, one year after graduation in countries of our region is unacceptable. There is a need to examine what are the causes of graduate unemployment and to evaluate the extent of market saturation and skills mismatch. A goal of 60% tertiary level participation rate (Trinidad and Tobago) or one graduate per household (Barbados) or expanded tertiary participation (Jamaica) must be accompanied by rationalization as well as and reallocation of resources to those programmes vital to the development of key sectors.
• Entrepreneurship – A low percentage of self- employed graduates would suggest that the exposure of students to entrepreneurship is still limited or weak. Development of graduates to be entrepreneurial, innovative and self reliant must be key initiatives in our quest to transform and restructure our economy.
• Private sector initiative – Low private sector employment in Trinidad and Tobago and Jamaica is a direct result of large government and lack of diversification of the economy. The University should have a greater impact on national policy making, analysis and evaluation particularly as it relates to economic transformation and diversification. The perception is that the engagement between academics and policy makers is not as strong as it should be.
• Underemployment of graduates as well as low salaries in some disciplines –There is a higher than desirable percentage of graduates who classified their jobs as clerical or sales workers (no university graduate should be employed as a clerk one year after graduation). This may be a direct result of the mismatch between graduates produced in certain disciplines at UWI and skills required in the job market. As mentioned earlier, UWI should consider reallocation of resources towards teaching in areas to fill gaps in the labour market that are critical to development.
• Non-Correlation between academic performance and income– There is little evidence to show that the class of degree obtained influences graduate incomes. The issue of meritocracy in the workplace arises and studies need to be conducted to explain the phenomenon of graduates with good honours earning less than others especially those

64 | P a g e
with pass degrees. Is this a result of discrimination by class, political patronage or other factors?
• Relationship between area of study to current job – Many graduates say that their first degree is not related to their current job. The issue here is whether these programmes are addressing the labour market needs of the society and should these programmes have a greater multidisciplinary orientation so that students can have greater flexibility.
• Development of Attributes – As we approach mid-term, greater focus should be placed on strategies to strengthen UWI’s impact on its graduates re: critical thinking, problem solving, communication skills and working effectively with modern Information technology. These skills are necessary to prepare distinctive graduates for the 21st century and progress in these areas is critical to the success of the 2007-12 Strategic Plan.
• The gender pay gap in graduate employment – Although this phenomenon is not unique to UWI graduates in Trinidad and Tobago or Barbados, studies need to be conducted to determine factors that influence gender pay gaps in this country as well as the wider Caribbean.
• The brain drain - UWI needs to conduct studies to examine the true extent of the brain drain, the factors affecting it as well as the impact it will have on the development of the region through the loss of human capital that has been developed through state subsidized educational opportunities.
GENERAL OBSERVATIONS
While this study is about tracing the fortunes of the 2008 graduates one year after graduation, it is also about the effectiveness of UWI in providing skills for the market and the capacity of national and regional economies to absorb what UWI produces. A cursory assessment will indicate that there is room for the University of the West Indies to play a more effective and decisive role in the transformation of economies of the region. Unless Caribbean economies diversify, expand and become more competitive, increased throughput from UWI will not be absorbed by regional economies. Unless there is a link between research and expansion of knowledge and entrepreneurship, new business creation and knowledge transfer which results in industry innovation, the future of the UWI is threatened and the role of UWI in regional development will diminish.

65 | P a g e
APPENDICIES TO REPORT ON GRADUATE TRACER SURVEY OF FIRST DEGREE
GRADUATES OF 2008 AND TREND ANALYSIS
Appendix 1A - Enrolment in Further studies by graduates’ First degree, Program Type enrolled in, Field of study and Name of Institution – ST Augustine Campus
Appendix 1B - Enrolment in Further studies by graduates’ First degree, Program Type enrolled in, Field of study and Name of Institution – Mona Campus
Appendix 1C - Enrolment in Further studies by graduates’ First degree, Program Type enrolled in, Field of study and Name of Institution – Cave Hill Campus
Appendix 2A - Comparative Employment Rates by Faculty and Area of Study – Trinidad and Tobago
Appendix 2B - Comparative Employment Rates by Faculty and Area of Study – Jamaica
Appendix 2C - Comparative Employment Rates by Faculty and Area of Study – Barbados
Appendix 3A - List of Employers and Job Titles – St Augustine Campus
Appendix 3B - List of Employers and Job Titles – Mona Campus
Appendix 3C - List of Employers and Job Titles – Cave Hill Campus
Appendix 4A - Comparative Monthly Median Salaries by Faculty and Area of Study – St Augustine
Campus
Appendix 4B - Comparative Monthly Median Salaries by Faculty and Area of Study – Mona Campus
Appendix 4C - Comparative Monthly Median Salaries by Faculty and Area of Study – Cave Hill Campus
Appendix 5 - Graduates’ Opinion of UWI’s Contribution to their Attributes/Skills by Faculty – All
Campuses

66 | P a g e
APPENDIX 1A ENROLMENT IN FURTHER STUDIES BY GRADUAT ES’ FIRST DEGREE, PROGRAM TYPE ENROLLED IN, FIELD OF STUDY AN D NAME OF INSTITUTION – ST AUGUSTINE CAMPUS
Faculty/First Degree Program Type enrolled
in Field of Study Name of Institution enrolled
in Engineering Chemical & Process Engineering
Taught Masters Same UWI
Chemical & Process Engineering
Taught Masters Same UWI
Chemical & Process Engineering
Taught Masters Environmental Engineering UWI
Civil Engineering Taught Masters Environmental Engineering UWI Civil Engineering Taught Masters Same UWI Civil Engineering Taught Masters Same UWI Civil Engineering Taught Masters Same UWI Civil Engineering Taught Masters Same Polytechnic Institute, New
York University Civil Engineering Taught Masters Civil with Environmental
Engineering UWI
Electrical & Computer Eng Postgrad. Dip. Economics University of London (External)
Electrical & Computer Eng Taught Masters Same UWI Electrical & Computer Eng Taught Masters Same University of Bath Electrical & Computer Eng Taught Masters Computing Science Imperial College London Mech Eng with Biosystems Professional Same MIC Mechanical Engineering Mphil Same UWI Mechanical Engineering Professional Project Management for
Business Professionals SBCS
Mechanical Engineering Professional Theology Open Bible Institute of Theology
Mechanical Engineering Taught Masters Petroleum Engineering UWI Mechanical Engineering Taught Masters Engineering Asset
Management UWI
Mechanical Engineering Taught Masters Engineering Management UWI Mechanical Engineering Taught Masters Industrial Innovation,
Entrepreneurship and Management
UTT
Mechanical Engineering Taught Masters Petroleum Engineering UWI Mechanical Engineering Taught Masters Petroleum Engineering UWI Petroleum Geoscience Postgrad. Dip. Technology Management &
Entrepreneurship UWI
Petroleum Geoscience Taught Masters MBA SBCS Petroleum Geoscience Taught Masters Same Repsol Centro Superior de
Fornacion and Heriot Watt Petroleum Geoscience Taught Masters Same UTT Surveying & Land Information
First Degree LLB Institute of Law and Academic Studies
Surveying & Land Information
First Degree Architecture University of Technology , Jamaica
Surveying & Land Information
First Degree Civil Engineering UWI
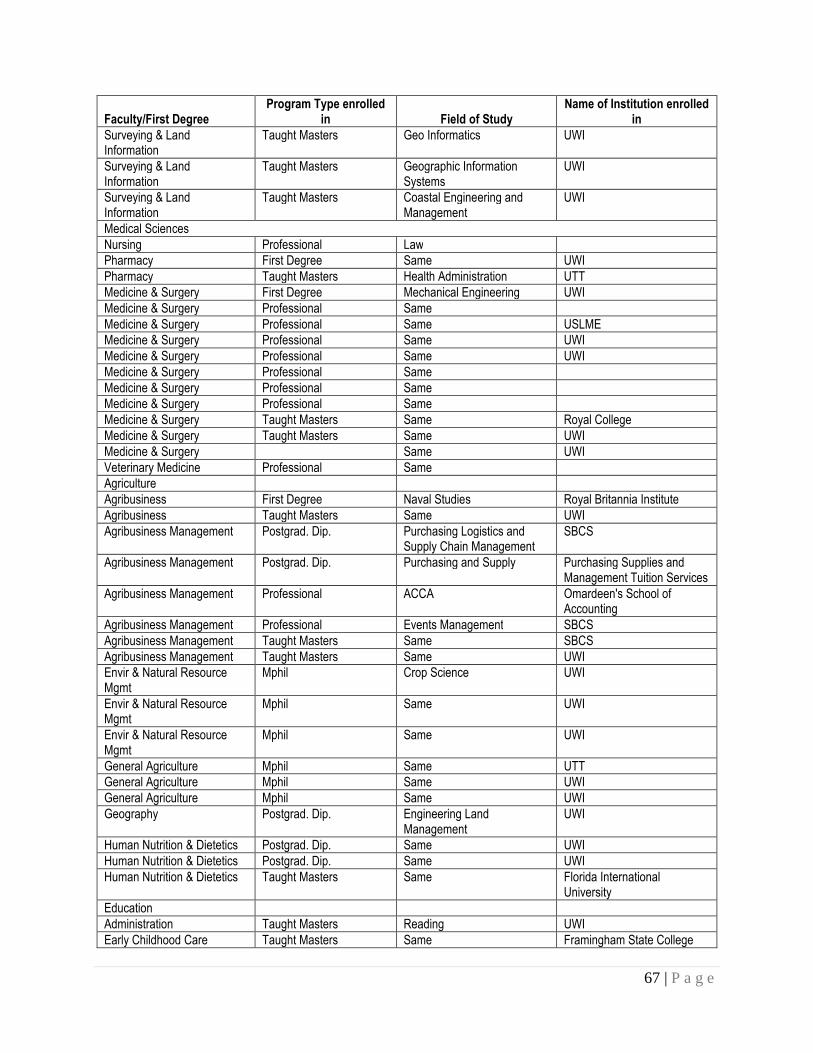
67 | P a g e
Faculty/First Degree Program Type enrolled
in Field of Study Name of Institution enrolled
in Surveying & Land Information
Taught Masters Geo Informatics UWI
Surveying & Land Information
Taught Masters Geographic Information Systems
UWI
Surveying & Land Information
Taught Masters Coastal Engineering and Management
UWI
Medical Sciences Nursing Professional Law Pharmacy First Degree Same UWI Pharmacy Taught Masters Health Administration UTT Medicine & Surgery First Degree Mechanical Engineering UWI Medicine & Surgery Professional Same Medicine & Surgery Professional Same USLME Medicine & Surgery Professional Same UWI Medicine & Surgery Professional Same UWI Medicine & Surgery Professional Same Medicine & Surgery Professional Same Medicine & Surgery Professional Same Medicine & Surgery Taught Masters Same Royal College Medicine & Surgery Taught Masters Same UWI Medicine & Surgery Same UWI Veterinary Medicine Professional Same Agriculture Agribusiness First Degree Naval Studies Royal Britannia Institute Agribusiness Taught Masters Same UWI Agribusiness Management Postgrad. Dip. Purchasing Logistics and
Supply Chain Management SBCS
Agribusiness Management Postgrad. Dip. Purchasing and Supply Purchasing Supplies and Management Tuition Services
Agribusiness Management Professional ACCA Omardeen's School of Accounting
Agribusiness Management Professional Events Management SBCS Agribusiness Management Taught Masters Same SBCS Agribusiness Management Taught Masters Same UWI Envir & Natural Resource Mgmt
Mphil Crop Science UWI
Envir & Natural Resource Mgmt
Mphil Same UWI
Envir & Natural Resource Mgmt
Mphil Same UWI
General Agriculture Mphil Same UTT General Agriculture Mphil Same UWI General Agriculture Mphil Same UWI Geography Postgrad. Dip. Engineering Land
Management UWI
Human Nutrition & Dietetics Postgrad. Dip. Same UWI Human Nutrition & Dietetics Postgrad. Dip. Same UWI Human Nutrition & Dietetics Taught Masters Same Florida International
University Education Administration Taught Masters Reading UWI Early Childhood Care Taught Masters Same Framingham State College

68 | P a g e
Faculty/First Degree Program Type enrolled
in Field of Study Name of Institution enrolled
in Education Early Childhood Care Education
Taught Masters Certificate in Speech and Language Pathology
Educational Administration Taught Masters Same UWI Mathematics Taught Masters Same UWI Primary Education Mphil Same UWI Primary Education Taught Masters Educational Leadership &
Mgmt University of Nottingham
Primary Education Taught Masters Same UWI Cave Hill Primary Education Reading UWI Humanities Communication Studies Mphil Med-Concentration in Youth
Guidance School of Education, UWI
Communication Studies Postgrad. Dip. Marketing, Advertising & Public Relations
Institute of Tertiary Tutors
Communication Studies Taught Masters International Relations UWI Communication Studies Taught Masters EMBA-Business UWI English Lang & Lit with Educ Postgrad. Dip. Postgraduate Diploma in
Education UWI
English Lang & Lit with Educ Professional Human Resource Mgmt Sital English Lang & Lit with Educ Taught Masters Same UWI English Lang & Lit with Educ Taught Masters Literatures in English UWI English Lang & Lit with Educ Taught Masters Same UWI English Lang & Lit with Educ Taught Masters Reading UWI French Postgrad. Dip. DIPG TESOL UWI French & Spanish Postgrad. Dip. Education UWI, St Augustine History First Degree Law UWI History Mphil Same UWI History Postgrad. Dip. Spanish Langdons Language Institute History Professional Diploma in Events Mgmt Arthur Lok Jack History Taught Masters Same UWI History Taught Masters Same UWI History Taught Masters Cultural Studies UWI Literatures in English First Degree Social Sciences UWI Literatures in English First Degree Same UWI Literatures in English Postgrad. Dip. Nebosh (Level 6) National
Diploma CHESS
Literatures in English Professional Public Relations Musical Arts (Special) Postgrad. Dip. Arts and Cultural Mgmt UWI Spanish Taught Masters Family Life Education Spanish Taught Masters Masters of Education in
Reading UWI
Spanish Taught Masters Human Resource Mgmt University of Glasgow UK Science Biochemistry (Science) First Degree Medicine UWI Biochemistry (Science) Mphil Same UWI Biochemistry (Science) Mphil Reproductive Endocrinology UNIVERSITY OF WESTERN
ONTARIO Biochemistry (Science) Postgrad. Dip. Same AMT Biology First Degree Medical Sciences UWI Biology First Degree Doctor of Veterinary Medicine UWI Biology Mphil Medical Microbiology UWI

69 | P a g e
Faculty/First Degree Program Type enrolled
in Field of Study Name of Institution enrolled
in Biology Postgrad. Dip. Education UWI Biology Taught Masters Food Science Technology UWI Biology Taught Masters Engineering UWI Biology Taught Masters Food Science Technology UWI Chemistry First Degree Medicine UWI Chemistry First Degree MBBS UWI Chemistry Mphil Same UWI Chemistry Mphil Soil Science UWI Chemistry Professional Biology and Physics UWI SCHOOL OF
CONTINUING STUDIES Chemistry Taught Masters Environment Engineering UWI Chemistry Taught Masters Manufacturing UTT Computer Science & Management
Mphil Same UWI
Envir & Natural Resource Mgmt
Postgrad. Dip. Land Administration UWI
Envir & Natural Resource Mgmt
Postgrad. Dip. Economics LONDON SCHOOL OF ECONOMICS
Envir & Natural Resource Mgmt
Postgrad. Dip. Industrial Safety PROFESSIONAL ASSOCIATES LTD
Envir & Natural Resource Mgmt
Taught Masters Same UTT
Envir & Natural Resource Mgmt
Taught Masters Coastal Engineering UWI
Envir & Natural Resource Mgmt
Taught Masters Same UWI
Envir & Natural Resource Mgmt
Taught Masters Same UTT
Mathematics Mphil Statistics UWI Mathematics Postgrad. Dip. Education UWI Mathematics Professional Actuarial Science FACULTY & INSTITUTE OF
ACTUARIES Mathematics Taught Masters Same UWI Physics Mphil Same UWI Physics Mphil Renewable Energy UWI Physics Mphil Climatic Analysis UWI Physics Taught Masters Environmental Management UTT Physics Taught Masters Petroleum Engineering UTT Physics Taught Masters Geoinformatics UWI Zoology First Degree Doctor of Veterinary Medicine UWI Zoology Postgrad. Dip. Entomology FLORIDA UNIVERSITY Zoology Taught Masters Public Health UWI Social Sciences Accounting (Special) Postgrad. Dip. Project Management University of Bradford Accounting (Special) Professional Same Omardeen School of
Accounting Ltd Accounting (Special) Professional Same SBCS Accounting (Special) Professional Project Management School of Business and
Computer Science Accounting (Special) Professional Same SAC Chaguanas Banking & Finance (Special) Professional Same Omardeen's School of
Accountancy
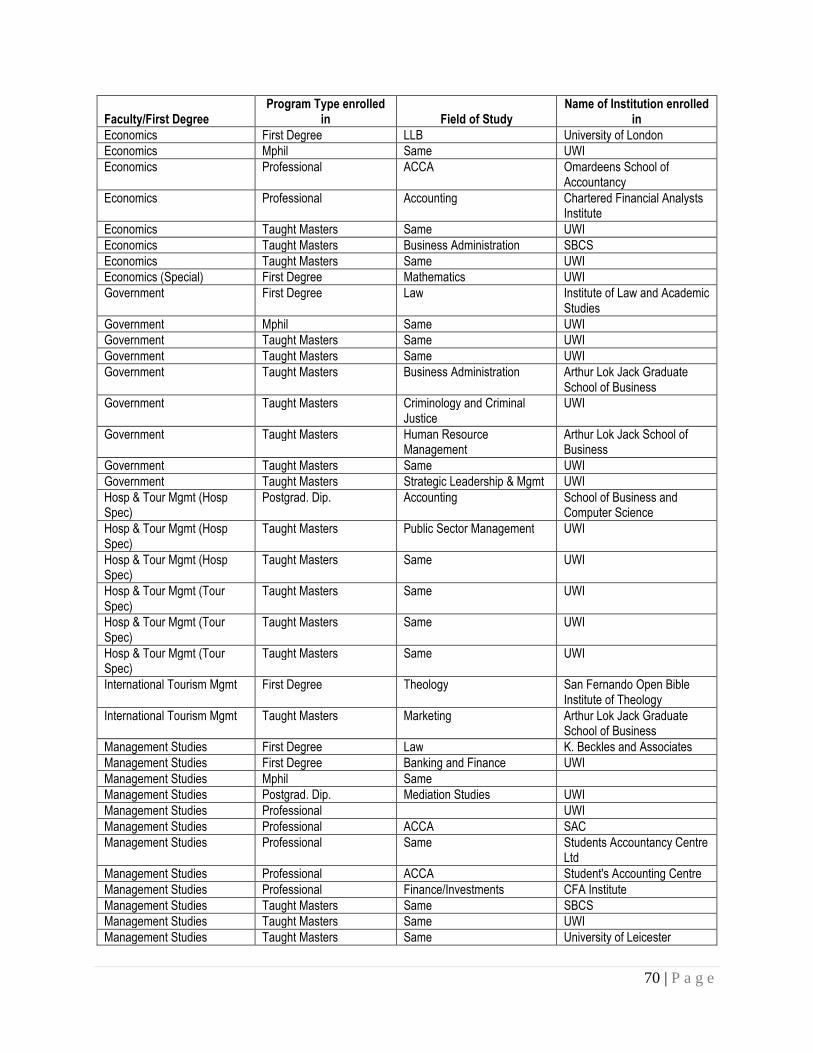
70 | P a g e
Faculty/First Degree Program Type enrolled
in Field of Study Name of Institution enrolled
in Economics First Degree LLB University of London Economics Mphil Same UWI Economics Professional ACCA Omardeens School of
Accountancy Economics Professional Accounting Chartered Financial Analysts
Institute Economics Taught Masters Same UWI Economics Taught Masters Business Administration SBCS Economics Taught Masters Same UWI Economics (Special) First Degree Mathematics UWI Government First Degree Law Institute of Law and Academic
Studies Government Mphil Same UWI Government Taught Masters Same UWI Government Taught Masters Same UWI Government Taught Masters Business Administration Arthur Lok Jack Graduate
School of Business Government Taught Masters Criminology and Criminal
Justice UWI
Government Taught Masters Human Resource Management
Arthur Lok Jack School of Business
Government Taught Masters Same UWI Government Taught Masters Strategic Leadership & Mgmt UWI Hosp & Tour Mgmt (Hosp Spec)
Postgrad. Dip. Accounting School of Business and Computer Science
Hosp & Tour Mgmt (Hosp Spec)
Taught Masters Public Sector Management UWI
Hosp & Tour Mgmt (Hosp Spec)
Taught Masters Same UWI
Hosp & Tour Mgmt (Tour Spec)
Taught Masters Same UWI
Hosp & Tour Mgmt (Tour Spec)
Taught Masters Same UWI
Hosp & Tour Mgmt (Tour Spec)
Taught Masters Same UWI
International Tourism Mgmt First Degree Theology San Fernando Open Bible Institute of Theology
International Tourism Mgmt Taught Masters Marketing Arthur Lok Jack Graduate School of Business
Management Studies First Degree Law K. Beckles and Associates Management Studies First Degree Banking and Finance UWI Management Studies Mphil Same Management Studies Postgrad. Dip. Mediation Studies UWI Management Studies Professional UWI Management Studies Professional ACCA SAC Management Studies Professional Same Students Accountancy Centre
Ltd Management Studies Professional ACCA Student's Accounting Centre Management Studies Professional Finance/Investments CFA Institute Management Studies Taught Masters Same SBCS Management Studies Taught Masters Same UWI Management Studies Taught Masters Same University of Leicester

71 | P a g e
Faculty/First Degree Program Type enrolled
in Field of Study Name of Institution enrolled
in Management Studies Taught Masters Same Arthur Lok Jack School of
Business Management Studies Taught Masters Same SBCS Management Studies Taught Masters Same School of Business and
Computer Studies Management Studies Taught Masters Same Heriot Watt University,
Edinburgh Business School Management Studies Taught Masters Same UWI Management Studies Taught Masters CFA Certification Self-Study Management Studies Taught Masters Same SBCS Management Studies Taught Masters Same Arthur Lok Jack School of
Business Management Studies Taught Masters Urban and Regional Planning UWI Management Studies Taught Masters Same Management Studies Taught Masters Same Arthur Lok Jack School of
Business Management Studies Taught Masters Same UWI Management Studies (Special)
Professional Theology Open Bible Institute of Theology
Management Studies Taught Masters Same SAM Management Studies (Special)
Taught Masters Same Arthur Lok Jack School of Graduate Studies
Management Studies (Special)
Taught Masters Student Administration UWI Mona
Psychology Mphil Cultural Studies UWI Psychology Postgrad. Dip. Same UWI Psychology Postgrad. Dip. Same UWI Psychology Taught Masters Same Mt Hope Psychology Taught Masters Same Caribbean Nazarene College Psychology Taught Masters International MBA Arthur Lok Jack School of
Business Psychology Taught Masters Same SBCS Psychology Taught Masters Human Communication
Studies UWI
Psychology Taught Masters Same UWI Psychology Taught Masters Same Psychology Taught Masters Same UWI Psychology (Special) Taught Masters MED Reading UWI Psychology (Special) Taught Masters Same Psychology (Special) Taught Masters Mediation Studies UWI Psychology (Special) Taught Masters Same USC Public Sector Management Professional ACCA Student's Accountancy
Centre Public Sector Management Taught Masters Global Studies/International
Relations UWI - Institute of International Relations
Public Sector Management Taught Masters Same UWI Public Sector Mgmt (Special) Professional ACCA Student's Accountancy
Centre Public Sector Mgmt (Special) Professional Human Resource
Management Cipriani College of Labour and Cooperative Studies
Public Sector Mgmt (Special) Professional Legal Law Bachelors Degree University of London Public Sector Mgmt (Special) Professional MBA (International) Arthur Lok Jack Graduate

72 | P a g e
Faculty/First Degree Program Type enrolled
in Field of Study Name of Institution enrolled
in School Of Business
Public Sector Mgmt (Special) Professional Business Administration School of Business and Computer Studies
Public Sector Mgmt (Special) Professional Electrical Installation MIC Public Sector Mgmt (Special) Taught Masters Sociology UWI Public Sector Mgmt (Special) Taught Masters Business Management SBCS Public Sector Mgmt (Special) Taught Masters Same School of Business and
Computer Studies Public Sector Mgmt (Special) Taught Masters Same UWI Public Sector Mgmt (Special) Taught Masters Business Administration Arthur Lok Jack School of
Business Public Sector Mgmt (Special) Taught Masters Same UWI Public Sector Mgmt (Special) Taught Masters Same UWI Cave Hill Public Sector Mgmt (Special) Taught Masters International Relations UWI Social Work Taught Masters MHRM Arthur Lok Jack Social Work (Special) Taught Masters Engineering UWI Social Work (Special) Taught Masters Same UWI Social Work (Special) Taught Masters Criminology UWI Social Work (Special) Taught Masters Same UWI Social Work (Special) Taught Masters Human Resource
Management Arthur Lok Jack School of Business
Social Work (Special) Taught Masters Same UWI Sociology Mphil Same UWI Sociology Postgrad. Dip. Mediation Studies UWI Sociology Postgrad. Dip. Mediation Studies UWI Sociology Postgrad. Dip. Gender and Development
Studies UWI
Sociology Taught Masters Msc Development Statistics UWI Sociology Taught Masters Human Resource
Management Arthur Lok Jack College
Sociology Taught Masters Criminology and Criminal Justice
UWI
Sociology Taught Masters Criminology UWI Sociology Taught Masters Business Administration USC Sociology Taught Masters Masters in Health Promotion UWI Sociology Taught Masters Global Studies UWI Sociology Taught Masters Psychology Capella University Sociology Taught Masters Same UWI Sports Management Taught Masters Same Arthur Lok Jack Taught Masters HRM Arthur Lok Jack

73 | P a g e
APPENDIX 1B - ENROLMENT IN FURTHER STUDIES BY GRADU ATES’ FIRST DEGREE, PROGRAM TYPE ENROLLED IN, FIELD OF STUDY AN D NAME OF INSTITUTION – MONA CAMPUS
Faculty/First Degree Program Type enrolled
in Field of Study Name of Institution enrolled
in Early Childhood Education Postgraduate Dip. Same St.Joseph Teachers College Early Childhood Education Professional Supervisory Management UWI Open Campus Early Childhood Education Taught masters Same University of the West Indies Early Childhood Education Taught masters Same Nothern Caribbean University Education Science Taught masters Same University of the West Indies
Educational Administration Taught masters Communication for Social/Behav CARIMAC Mona
English Language and Literature Professional Supervisory Management UWI Open Campus English Language and Literature Taught masters Same University of the West Indies English Language and Literature Taught masters Same University of the West Indies English Language and Literature Taught masters Same University of the West Indies English Language and Literature Taught masters Same Mico University College Mathematics Taught masters Education F.I.U. Mathematics Taught masters Same University of the West Indies School Librarianship Taught masters Same UWI Open Campus Computer Science Professional Same Excelsior Community College
English First Degree Theology United Theological College W.I
History Postgraduate Dip. Education Shortwood Teachers College History First Degree Law Caribbean Legal Practice History First Degree Law University of London History First Degree Law University of London History First Degree Law University of the West Indies History First Degree Law University of the West Indies History First Degree Law UTECH History Mphil Same University of the West Indies History Mphil Same University of the West Indies History Professional Insurance UCC/College of Insurance
History Taught masters Education Mico/Mona School of Business
History Taught masters Government University of the West Indies History & Archaeology First Degree Law University of the West Indies History & Economics First Degree Law University of London History & Literatures in English Postgraduate Dip. Education University of the West Indies Language, Communication and Society First Degree Law University of London Language, Communication and Society Taught masters Education University of the West Indies Language, Communication and Society Taught masters English Language University of the West Indies Language, Communication Taught masters Human Resource Development University of the West Indies

74 | P a g e
Faculty/First Degree Program Type enrolled
in Field of Study Name of Institution enrolled
in and Society Language, Communication and Society Taught masters Psychology International University Carib Linguistics Postgraduate Dip. Business Administration Mona School of Business Literatures in English Postgraduate Dip. Human Resource Mngt. MIND Media & Communication Taught masters International Management University of Liverpool Media & Communication Taught masters Same University of the West Indies Philosophy Postgraduate Dip. Project Mgmt Mona School of Business Philosophy Professional Custom Brokering MIND Spanish Taught masters Education University of the West Indies Spanish and French Mphil Same University of the West Indies Spanish and French Taught masters Education University of the West Indies Theology Postgraduate Dip. Education VTDI Nursing Professional Supervisory Management UWI Open Campus Nursing Taught masters Human Resource Development University of the West Indies Pharmacology Mphil Same University of the West Indies Pharmacology Professional Same Physical Therapy Taught masters EMBA Mona School of Business
Actuarial Science Postgraduate Dip. Same College of Insurance & Profess
Actuarial Science Professional Accounting CFA Institute Actuarial Science Professional Same Society of Actuaries Actuarial Science Professional Same Biochemistry Postgraduate Dip. Education University of the West Indies Biochemistry First Degree Education Mico University College Biochemistry & Chemistry First Degree MBBS University of the West Indies Biochemistry & Chemistry First Degree MBBS University of the West Indies Biotechnology & Botany First Degree MBBS University of the West Indies Chemistry & Applied Chemistry Taught masters Occupational Health & Safety University of the West Indies Computer Science Professional CCNA HEART Computer Science Professional Same Vector Technology Institute Computer Science Taught masters Same University of the West Indies Electronics & Computer Science Professional Same University of the West Indies Environmental Biology First Degree MBBS University of the West Indies Environmental Biology Professional Medical ASA Institute Environmental Biology Taught masters Marine & Terrestrial Ecosystem University of the West Indies Environmental Biology Taught masters Same University of the West Indies Food Chemistry Professional Occupational Health & Safety University of New Brunswick
Geology Taught masters Environmental Science/Mgt University of Trinidad & Tobago
Geology Taught masters Exploration Geophysics University of Edinburgh Geology & Geography Taught masters Same UWI Cave Hill Mathematics Mphil Financial Mathematics Florida State University Mathematics Professional Finance B&B Institute Microbiology First Degree Pharmacy UTECH Molecular Biology First Degree MBBS University of the West Indies Banking & Finance Professional CFA Designation CFA Institute
Banking & Finance Professional Same Institute Chartered Accountant

75 | P a g e
Faculty/First Degree Program Type enrolled
in Field of Study Name of Institution enrolled
in Banking & Finance Taught masters Same Mona School of Business Banking & Finance Taught masters Same Okanagan College Business, Economics and Social Statistics Taught masters Same University of the West Indies Economics First Degree Law University of London Economics Professional Accounting Economics Professional CFA Designation B&B Institute Economics Taught masters International Economics & Law University of the West Indies Economics Taught masters Same University of the West Indies Economics Taught masters Same University of the West Indies Economics and Criminology Taught masters International Relations University of the West Indies Economics and Statistics Taught masters Same University of the West Indies Economics and Statistics Taught masters Same University of the West Indies Economics and Statistics Taught masters Same University of the West Indies Economics and Statistics Taught masters Same University of the West Indies Hotel Management Taught masters Same GULL University International Relations Postgraduate Dip. Education VTDI International Relations Postgraduate Dip. Business Administration Mona School of Business International Relations First Degree Law University of the West Indies International Relations First Degree Law University of London International Relations First Degree Law UTECH International Relations First Degree Law UTECH International Relations First Degree Law University of the West Indies International Relations Taught masters International Economics & Law University of the West Indies International Relations Taught masters Agricultural Economics UWI St. Augustine International Relations Taught masters Same University of the West Indies International Relations and Political Science First Degree Law University of the West Indies International Relations and Spanish Taught masters Same University of the West Indies Labour & Employment Relations Taught masters Global Human Resource Mgmt University of Liverpool Management Studies Postgraduate Dip. Education University of the West Indies Management Studies First Degree Law University of the West Indies Management Studies First Degree Law University of the West Indies Management Studies Mphil Same University of the West Indies Management Studies Professional Computer Graphics Edna Manley Management Studies Professional Certified Internal Auditor American Exam
Management Studies Professional Accounting Institute Chartered Accountant
Management Studies Professional Accounting Student Accountancy Training Management Studies Professional Occupational Health & Safety University of New Brunswick Management Studies Professional Law UTECH Management Studies Professional Same A.C.C.A Management Studies Professional Same A.C.C.A Management Studies Professional Same UK Exam
Management Studies Professional Same B&B Institute Management Studies Professional Same CAJ Management Studies Professional Same A.C.C.A Management Studies Professional Same Student Accountancy Training Management Studies Professional Same AICPA

76 | P a g e
Faculty/First Degree Program Type enrolled
in Field of Study Name of Institution enrolled
in Management Studies Professional Same Student Accountancy Training Management Studies Professional Same Home Study Management Studies Taught masters Marketing UTECH Management Studies Taught masters International Relations University of the West Indies Management Studies Taught masters Gender & Development University of the West Indies Management Studies Taught masters Education UWI Open Campus Management Studies Taught masters Marketing UTECH Management Studies Taught masters Accounting University of the West Indies Management Studies Taught masters National Security & Strat University of the West Indies Management Studies Taught masters Law University of London Management Studies Taught masters Same University of the West Indies Management Studies Taught masters Same F.I.U. Management Studies Taught masters Same University of the West Indies Management Studies Taught masters Same Leicester University Political Science First Degree Law UWI Cave Hill Political Science First Degree Law UTECH Political Science First Degree Law University of London Political Science Taught masters Psychology Northern Caribbean University Psychology Postgraduate Dip. Information Technology University of the West Indies Psychology Postgraduate Dip. Social Work University of the West Indies Psychology Postgraduate Dip. Population & Development University of the West Indies Psychology Postgraduate Dip. Business Administration Mona School of Business Psychology First Degree Registered Nurse Broward College Psychology Taught masters Law CGST/UOL Psychology Taught masters Same University of the West Indies Psychology Taught masters Same University of the West Indies Psychology Taught masters Same University of the West Indies Psychology Taught masters Same University of the West Indies Psychology and Criminology Taught masters Same University of the West Indies Public Sector Management First Degree Law University of the West Indies Public Sector Management First Degree Law University of the West Indies Public Sector Management Professional Accounting A.C.C.A Public Sector Management Professional Accounting University of the West Indies Public Sector Management Professional Accounting Public Sector Management Taught masters Human Resource Development University of the West Indies Public Sector Management Taught masters Governance & Policy SALISES Public Sector Management Taught masters Same University of the West Indies Social Policy and Development First Degree Law University of London Social Policy and Development First Degree Law UWI Cave Hill Social Policy and Development Taught masters Same University of the West Indies Social Policy and Development Taught masters Same University of the West Indies Social Work Postgraduate Dip. Education HEART Social Work Postgraduate Dip. Education College of Agriculture Science Social Work Taught masters Public Health University of the West Indies
Social Work Taught masters Communication for Social/Behav CARIMAC Mona
Social Work Taught masters Same University of the West Indies

77 | P a g e
Faculty/First Degree Program Type enrolled
in Field of Study Name of Institution enrolled
in Sociology First Degree Law University of London Sociology First Degree Law University of the West Indies Sociology First Degree Education UTECH Sociology Taught masters Psychology University of the West Indies Sociology Taught masters Business Edinburgh Business School Sociology Taught masters MBA Mona School of Business Sociology Taught masters Demography University of the West Indies Sociology Taught masters Same University of the West Indies Sociology Taught masters Same University of the West Indies Sociology and Psychology Taught masters Education Mico University College
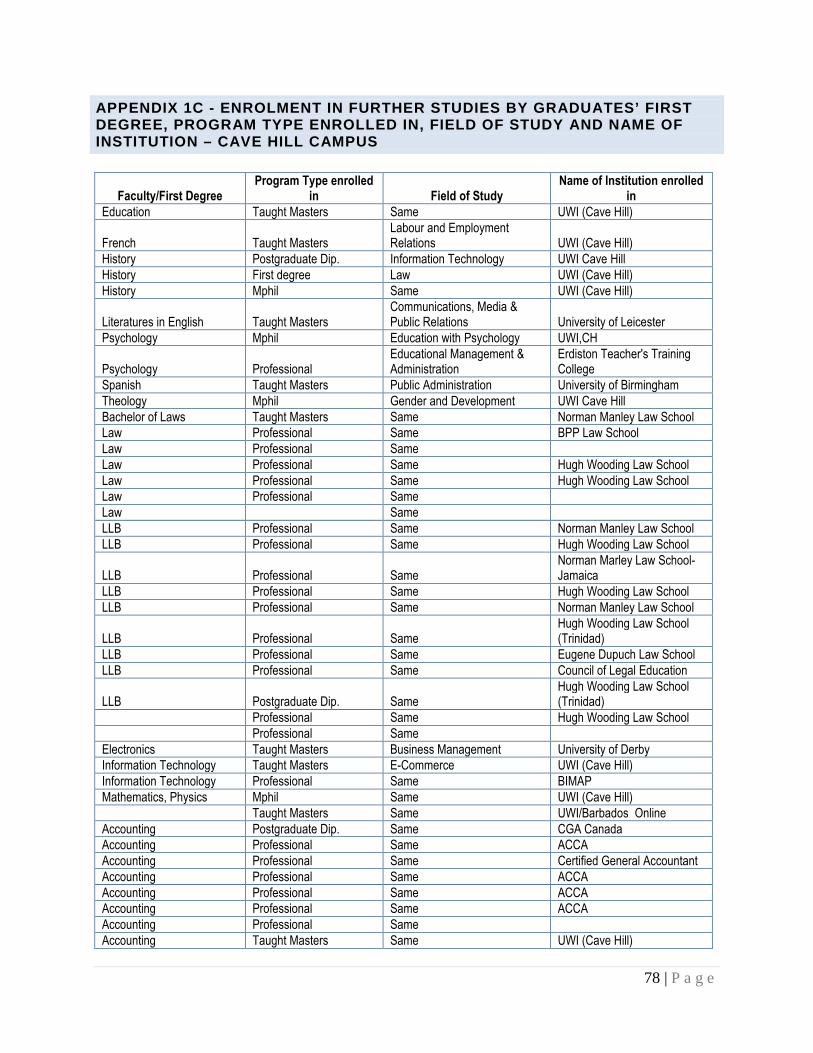
78 | P a g e
APPENDIX 1C - ENROLMENT IN FURTHER STUDIES BY GRADU ATES’ FIRST DEGREE, PROGRAM TYPE ENROLLED IN, FIELD OF STUDY AN D NAME OF INSTITUTION – CAVE HILL CAMPUS
Faculty/First Degree Program Type enrolled
in Field of Study Name of Institution enrolled
in Education Taught Masters Same UWI (Cave Hill)
French Taught Masters Labour and Employment Relations UWI (Cave Hill)
History Postgraduate Dip. Information Technology UWI Cave Hill History First degree Law UWI (Cave Hill) History Mphil Same UWI (Cave Hill)
Literatures in English Taught Masters Communications, Media & Public Relations University of Leicester
Psychology Mphil Education with Psychology UWI,CH
Psychology Professional Educational Management & Administration
Erdiston Teacher's Training College
Spanish Taught Masters Public Administration University of Birmingham Theology Mphil Gender and Development UWI Cave Hill Bachelor of Laws Taught Masters Same Norman Manley Law School Law Professional Same BPP Law School Law Professional Same Law Professional Same Hugh Wooding Law School Law Professional Same Hugh Wooding Law School Law Professional Same Law Same LLB Professional Same Norman Manley Law School LLB Professional Same Hugh Wooding Law School
LLB Professional Same Norman Marley Law School-Jamaica
LLB Professional Same Hugh Wooding Law School LLB Professional Same Norman Manley Law School
LLB Professional Same Hugh Wooding Law School (Trinidad)
LLB Professional Same Eugene Dupuch Law School LLB Professional Same Council of Legal Education
LLB Postgraduate Dip. Same Hugh Wooding Law School (Trinidad)
Professional Same Hugh Wooding Law School Professional Same Electronics Taught Masters Business Management University of Derby Information Technology Taught Masters E-Commerce UWI (Cave Hill) Information Technology Professional Same BIMAP Mathematics, Physics Mphil Same UWI (Cave Hill) Taught Masters Same UWI/Barbados Online Accounting Postgraduate Dip. Same CGA Canada Accounting Professional Same ACCA Accounting Professional Same Certified General Accountant Accounting Professional Same ACCA Accounting Professional Same ACCA Accounting Professional Same ACCA Accounting Professional Same Accounting Taught Masters Same UWI (Cave Hill)
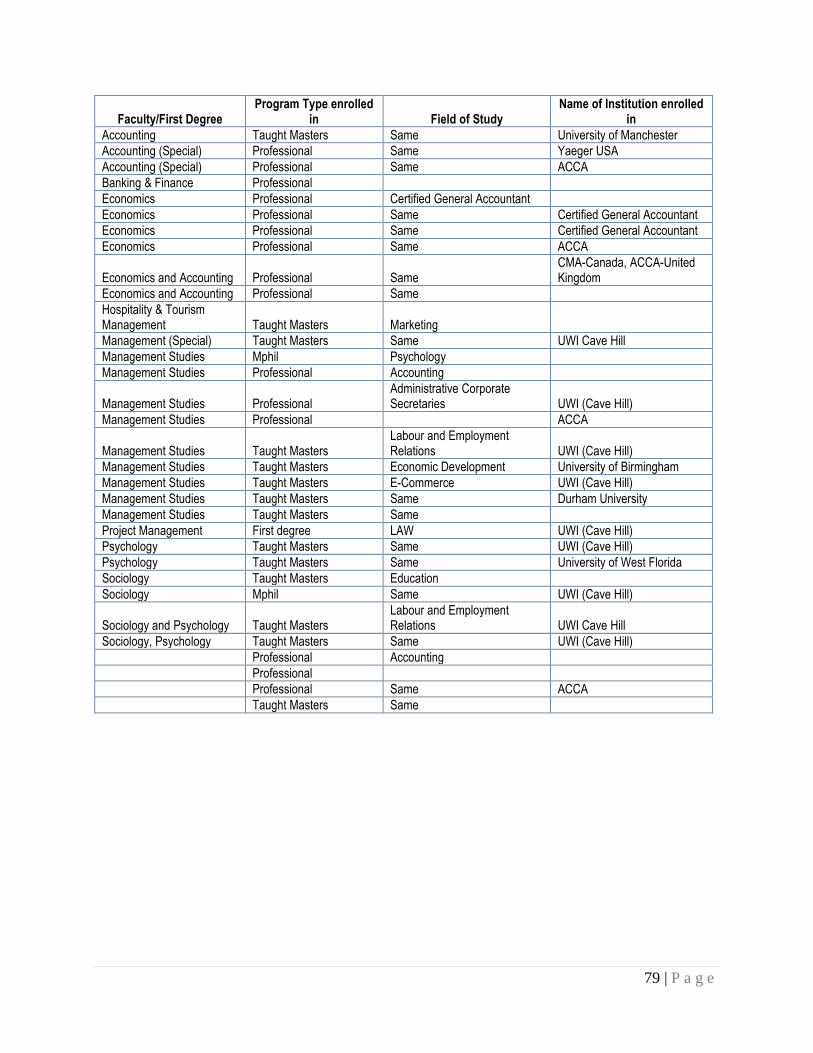
79 | P a g e
Faculty/First Degree Program Type enrolled
in Field of Study Name of Institution enrolled
in Accounting Taught Masters Same University of Manchester Accounting (Special) Professional Same Yaeger USA Accounting (Special) Professional Same ACCA Banking & Finance Professional Economics Professional Certified General Accountant Economics Professional Same Certified General Accountant Economics Professional Same Certified General Accountant Economics Professional Same ACCA
Economics and Accounting Professional Same CMA-Canada, ACCA-United Kingdom
Economics and Accounting Professional Same Hospitality & Tourism Management Taught Masters Marketing Management (Special) Taught Masters Same UWI Cave Hill Management Studies Mphil Psychology Management Studies Professional Accounting
Management Studies Professional Administrative Corporate Secretaries UWI (Cave Hill)
Management Studies Professional ACCA
Management Studies Taught Masters Labour and Employment Relations UWI (Cave Hill)
Management Studies Taught Masters Economic Development University of Birmingham Management Studies Taught Masters E-Commerce UWI (Cave Hill) Management Studies Taught Masters Same Durham University Management Studies Taught Masters Same Project Management First degree LAW UWI (Cave Hill) Psychology Taught Masters Same UWI (Cave Hill) Psychology Taught Masters Same University of West Florida Sociology Taught Masters Education Sociology Mphil Same UWI (Cave Hill)
Sociology and Psychology Taught Masters Labour and Employment Relations UWI Cave Hill
Sociology, Psychology Taught Masters Same UWI (Cave Hill) Professional Accounting Professional Professional Same ACCA Taught Masters Same

80 | P a g e
APPENDIX 2A - COMPARATIVE EMPLOYMENT RATES BY FACUL TY AND AREA OF STUDY – TRINIDAD AND TOBAGO
Faculty/Area of Study No of respondents employed - 2008
Employment Rates - 2008
Comparative Employment Rates - 2007
Trinidad and Tobago Nationals 524 83.6% 90.9%
Engineering 84 88.4 94.8%
Chemical & Process Engineering 7 77.8 100.0%
Civil Engineering 11 81.8 100.0%
Electrical & Computer Eng 20 95.2 100.0%
Industrial Engineering 3 100.0%
Mechanical Engineering 32 91.4 100.0%
Petroleum Geosciences 9 90 100.0%
Surveying & Land Information 8 75 70.0%
Medical Sciences 43 90.7 97.7%
Dental Surgery 5 100 100.0%
Medicine & Surgery 31 88.6 90.0%
Nursing 3 100 100.0%
Pharmacy 4 80 100.0%
Veterinary Medicine 3 100 100.0%
School of Agriculture 46 80.4 92.6%
Agribusiness 25 89.3 93.3%
Envir & Natural Resource Mgmt 5 62.5 100.0%
General Agriculture 2 66.7 100.0%
Human Ecology 4 66.7 80.0%
School of Education 26 96.3 100.0%
Education 26 96.3 100.0%
School of Humanities 70 89.7 90.5%
Communication Studies 9 100 90.0%
Creative Arts 10 100 80.0%
English 23 92 90.5%
Foreign languages 12 80 100.0%
History 11 84.6 88.9%
Linguistics 4 100 66.7%
School of Science 61 69.3 79.7%
Chemistry & Management 2 100 100.0%
Computer Science/ Computer Sci. & Man 4 66.7 100.0%
Envir & Natural Resource Mgmt 14 70 72.2%
Life Sciences 12 54.5 75.0%
Mathematics 12 92.3 75.0%
Physical Sciences 17 68 80.0%
Social Sciences 241 82.6 90.6%
Accounting 9 100 100.0%
Economics 17 81 88.2%
Government 14 82.4 100.0%
Hosp & Tour Mgmt 11 78.6 71.4%
Management Studies 62 90.3 87.5%
Psychology 27 77.1 86.7%
Public Sector Management 23 76.7 100.0%
Social Work 10 83.3 100.0%
Sociology 24 72.7 88.9%
Sports Management 3 100

81 | P a g e
APPENDIX 2B - COMPARATIVE EMPLOYMENT RATES BY FACUL TY AND AREA OF STUDY – JAMAICA
Faculty/Area of Study No of employed respondents -2008
Employment Rates – 2008
Comparative Employment Rates –
2007
All Graduates employed in Jamaica 610 84.7% 90.0%
Humanities 110 79.1% 82.4%
Creative Arts 3 75% 100.0%
English 7 58.3% 77.8%
Geography 55.6%
History 39 69.2% 72.4%
Library & Information Studies 12 100% 100.0%
Linguistics 3 100%
Media & Communication 22 90.9% 89.5%
Foreign Languages 5 83.3% 100.0%
Language Communication 16 76.2% 85.7%
Computer Science 6 85.7
Theology 3 100%
Education 113 98.3% 100.0%
Education 113 98.3% 100.0%
Medical Sciences-5 Yr 19 100% 92.9%
Medicine and Surgery 19 100% 100.0%
Medical Sciences-3 Yr 62 98.4%
Nursing 54 100% 95.3%
Pharmacology 3 100%
Physical Therapy 3 100% 83.3%
Pure and Applied Sciences 55 75.3% 86.1%
Actuarial Sciences 6 85.7% 88.9%
Computer Science 10 90.9% 80.0%
Geography/Geology 2 100% 100.0%
Life Sciences 17 58.6% 89.7%
Mathematics 8 88.2% 100.0%
Physical Sciences 12 80% 66.7%
Social Sciences 251 80.7% 88.8%
Accounting/Banking 15 88.2% 93.3%
Economics 11 61.1% 70.6%
Political Science 3 42.9% 100.0%
Tourism/Hotel Mgmt 13 81.3% 90.6%
Management Studies 108 90% 93.2%
Psychology 31 77.5% 76.7%
Public Sector Management 19 79.2% 100.0%
Social Work 15 78.9% 100.0%
Sociology 13 81.3% 78.6%
Social Policy and Development 3 75%
International Relations 19 67.9 85.7%
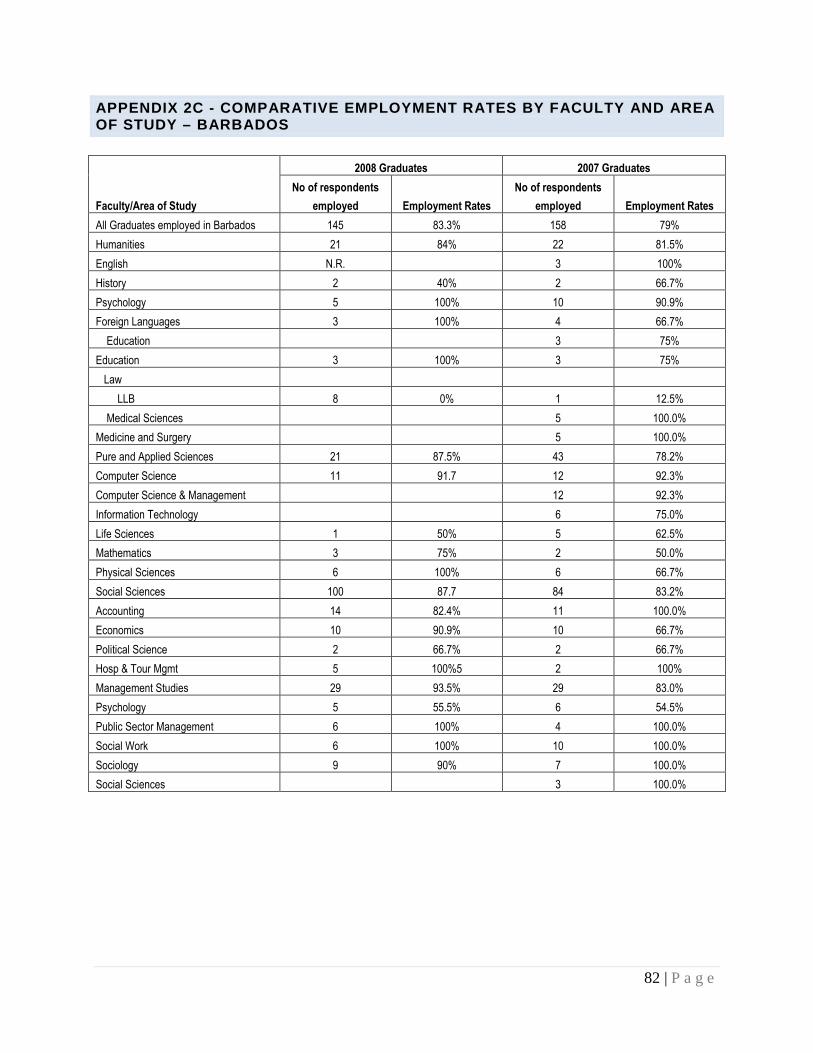
82 | P a g e
APPENDIX 2C - COMPARATIVE EMPLOYMENT RATES BY FACUL TY AND AREA OF STUDY – BARBADOS
Faculty/Area of Study
2008 Graduates 2007 Graduates
No of respondents
employed Employment Rates
No of respondents
employed Employment Rates
All Graduates employed in Barbados 145 83.3% 158 79%
Humanities 21 84% 22 81.5%
English N.R. 3 100%
History 2 40% 2 66.7%
Psychology 5 100% 10 90.9%
Foreign Languages 3 100% 4 66.7%
Education 3 75%
Education 3 100% 3 75%
Law
LLB 8 0% 1 12.5%
Medical Sciences 5 100.0%
Medicine and Surgery 5 100.0%
Pure and Applied Sciences 21 87.5% 43 78.2%
Computer Science 11 91.7 12 92.3%
Computer Science & Management 12 92.3%
Information Technology 6 75.0%
Life Sciences 1 50% 5 62.5%
Mathematics 3 75% 2 50.0%
Physical Sciences 6 100% 6 66.7%
Social Sciences 100 87.7 84 83.2%
Accounting 14 82.4% 11 100.0%
Economics 10 90.9% 10 66.7%
Political Science 2 66.7% 2 66.7%
Hosp & Tour Mgmt 5 100%5 2 100%
Management Studies 29 93.5% 29 83.0%
Psychology 5 55.5% 6 54.5%
Public Sector Management 6 100% 4 100.0%
Social Work 6 100% 10 100.0%
Sociology 9 90% 7 100.0%
Social Sciences 3 100.0%

83 | P a g e
APPENDIX 3A - LIST OF EMPLOYERS AND JOB TITLES – ST AUGUSTINE CAMPUS
ENGINEERING
Programme Option Name of Employer Name or Description of Job
Chemical & Process
Engineering
IPSL Process engineer
IPSL Process Engineer
PETROTRIN Engineering Trainee
Atlantic LNG Graduate Trainee
Powergen Plant Engineer in Training
Self employed Independent Distributor
BHP Billiton Trinidad and Tobago Graduate Process Engineer
Civil Engineering
Ministry of Works Engineering Assistant
Ministry of Works and Transport Engineering Assistant (OJT)
National Petroleum Marketing Co. Ltd. Graduate Intern
Vikab Engineering Civil Engineer
Alpha Engineering and Designs Ltd. Project Engineer
MAAK Technologies Group Inc. Junior Engineer
S.T.E.L Project Engineer
TSTT Faculty Planner ( Civil Works)
Civil with Envir. Eng eTeck Civil Engineer
Electrical & Computer Eng
WASA Engineer Apprentice
UWI Research Assistant
MIC Engineer (Jr.)
Arcelor MITTAL Engineering Trainee
IPSL Graduate in Training
Ministry of Education Teacher
Digicel Trinidad and Tobago Ltd. Transmissions Engineer
Digicel T& T Ltd. Network Engineer
Petroleum Company of Trinidad and
Tobago
Graduate Trainee- Electrical Engineer
IPSL Engineering Trainee
T&TEC Engineering Trainee
CARIB Glass Works Electrical and Instrumentation Engineer
Acuitas Caribbean Ltd. Project Engineer
The Carlton Savannah Assistant Maintenance Manager
TYE Manufacturing Company Electrical Engineer
Powergen Plant Engineer Trainee
PCS Nitrogen Ltd. Electrical and Instrumentation Engineer
T&TEC Engineer in Training
Mechatronics Electrical Engineer
Powergen Plant Engineer Trainee
Industrial Engineering PETROTRIN Graduate Engineer
Mech Eng with Biosystems MIC Engineer in Training
MIC Engineer in Training
Mechanical Engineering Eric Williams Medical Sciences Complex Mechanical Engineering Trainee

84 | P a g e
Programme Option Name of Employer Name or Description of Job
MIC Engineer in Training
Gulf Engineering Services Ltd. Quality Engineer
Super Industrial Services Ltd. Planner
WASA Apprentice Engineer
WASA Engineer Apprentice
DESALCOTT Mechanical Engineer
General Dirt Movers Quality Control Technician
IPSL Graduate in Training, Mechanical Engineer
IPSL Graduate in Training
Tricon Maintenance Engineer
UWI Teaching Assistant
Genivar Trinidad and Tobago Junior Engineer
NP Graduate Intern
IPSL Engineering and Maintenance Graduate in
Training
CARIRI Technologist
CARIRI Technologist
Fine Choice Meats Mechanical Engineer
NH International Service and Technical Officer
Engineer in Training
ANSA McAL Project Manager
PETROTRIN Graduate Trainee
PETROTRIN Graduate Trainee
BGTT Graduate Mechanical Engineer
Petrotrin Operator
Powergen Plant Engineer Trainee
BpTT Mechanical Engineer Challenger
Powergen Plant Engineer Trainee
BP Completions Engineer
Petroleum Geosciences
Ministry of Energy Geophysicist
Petrocom Geoscience Technologist
St. Augustine Community College A'Level Teacher
PETROTRIN Trainee Geologist
Trinidad LMKR Geoscientist
BpTT Challenge Geoscientist
BG Graduate Geologist
BPTT Geologist
Repsol E&P T&T Ltd. New Professional
Surveying & Land Information
Geomatics Management Ltd. Graduate Surveyor
UWI Research
Trinity Housing Engineering Surveyor
PETROTRIN Graduate Engineer
Atlas Engineering Surveyor
PETROTRIN Surveyor

85 | P a g e
MEDICAL SCIENCES – ST AUGUSTINE
Programme Option Name of Employer Name or Description of Job
Nursing
South West Regional Health Authority Head Nurse
Tobago Regional Health Authority District Health Visitor
Pharmacy
Tobago Regional Health Authority Pharmacist
SuperPharm Pharmacist
Bhagans Drugs Pharmacist
SuperPharm Ltd Pharmacist
Dental Surgery
UWI
North West Regional Health Authority Dentist
Ian Dash Associate Dentist
DR. Pravin Sharma Doctor of Dental Surgery
Suite Dental Health Associate Dentist
Medicine & Surgery
Ministry of Health Medical House Officer
North Central Regional Health Authority House Officer
Medical Doctor
San Fernando General Hospital House Officer
North West Regional Health Authority House Officer
South West Regional Health Authority House Officer
South West Regional Health Authority House Officer
South West Regional Health Authority House Officer
North Central Regional Health Authority Medical Doctor
San Fernando General Hospital Doctor
South West Regional Health Authority Medical House Officer
Eric Williams Medical Sciences Complex Doctor
Eastern Regional Health Authority Medical House Officer
North Central Regional Health Authority House Officer
South West Regional Health Authority House Officer
South West Regional Health Authority Medical Doctor
South West Regional Health Authority House Officer
South West Regional Health Authority House Officer
North West Regional Health Authority House Officer
South West Regional Health Authority Medical House Officer
North West Regional Health Authority House Officer
South West Regional Health Authority Medical Doctor
North Central Regional Health Authority House Officer
North Central Regional Health Authority House Officer
North West Regional Health Authority House Officer
South West Regional Health Authority House Officer
Eastern Regional Health Authority House Officer
Mt. Hope House Officer
San Fernando General Hospital House Officer
Ministry of Health House Officer
Veterinary Medicine
North West Veterinary Clinical Veterinarian
Self Employed Doctor
Self Employed Vet

86 | P a g e
AGRICULTURE – ST AUGUSTINE
Programme Option Name of Employer Name or Description of Job
Agribusiness
Andy Balgobin Clerical Assistant
Ministry of National Security Clerk 1
NAMDEVCO Research Assistant I
Coast Guard Officer Cadet
Agribusiness Management
First Citizen's Bank Customer Service Representative
NAMDEVCO Research Assistant
Eastern Veterinary Clinic Veterinary/Administrative Assistant
Ministry of Finance Temporary Clerk
Trevor Baddaloo Enterprises Ltd Marketing Assistant
Southwest Regional Health Authority Graduate Trainee
Trinidad and Tobago Prison Services Administrative Assistant
On the Job Training Teacher Assistant
Ministry of Energy and Energy Industries Health Safety and Environmental Trainee
Colfire Trainee Claims Technician
Ansa Mc Al Legal Clerk
Specialist Chemicals Customer Service Representative
MMS Chartered Accountants Accounting Assistant
Algico Clerical Assistant
Self Employed Event Planner
Trinidad and Tobago Agribusiness Association Research Assistant
NAMDEVCO Research Assistant III
Kentz-Oj's E& I Services Procurement/Materials Manager
PCS Nitrogen Project Assistant
Research Associates Research Officer
NAMDEVCO Field Officer
Agricultural Science Ministry of Education Teacher III
Envir & Natural Resource Mgmt
UTT Research Assistant
Sugarcane Feed Centre Trainee Technician
Ministry of Public Administration Associate Professional
Ministry of Education Teacher III
UWI Demonstrator
General Agriculture UTT Graduate Fellowship Student
Geography Estate Management Company Ltd. Land Administration Officer
Human Ecology UTT Instructor
Human Nutrition & Dietetics
Ministry of Community Development Nutrition and Health Promotion Tutor
Bryden-Psi Medical Representative

87 | P a g e
SCIENCE – ST AUGUSTINE
Programme Option Name of Employer Name or Description of Job
Biochemistry (Science)
Instyle Interior Accents Finance and Project Administration
Manager
THA Medical Laboratory Technician
UWI Lab Technician
Self Employed Manager
UWI Part-time Demonstrator
Biology
UWI Demonstrator
Signature Collection Apprentice Jeweler
NIPDEC Scanning Analyst
Kaiaen Environmental Services Analyst
SWRHA Pharmacist 1
THA Teacher
Chemistry
UWI Demonstrator
UWI Laboratory Technician
STTE Lab Assistant
UWI Lab Technician
UWI Oncology Lab Technician
Angostura Ltd. Laboratory Technician
CARIRI Technologist
THA Teacher III
Cl Blanchfield Chemist
Chemistry & Management
Angostura Ltd. Quality Systems Contractor
Unilever Quality Control Technician
Computer Science
Ministry of Education Classroom Assistant
First Citizens Bank Programmer Analyst
Computer Science &
Management
NIHERST IT Support Technician
Sam Caribbean Ltd. Lecturer
Envir & Natural Resource
Mgmt
Zoological Society of Trinidad and Tobago Temporary Biologist
Sugarcane Feed Centre Agriculture Technician
OJT Research Assistant
Ministry of Agriculture Data Collection Agent
OJT Teaching Assistant
School of Veterinary Medicine Clerical Assistant II
Ministry of Education Analyst
Institute of Marine Affairs Laboratory Technician

88 | P a g e
Programme Option Name of Employer Name or Description of Job
Ministry of Planning, Housing and the
Environment
Research Officer
Ministry of Agriculture Fisheries Officer
Ministry of Education Teacher III
Environmental Policy Analyst
Point Lisas Nitrogen Ltd HSC Officer
Wild Fowl Trust Education Officer
Geography
Kiss Baking Company Quality Control Technician
Eco-Engineering Consultants Ecologist
Mathematics
UWI Demonstrator
Gulf Insurance Ltd Statistical Recorder
Bacon Woodrow and De Souza Ltd. Analyst
Ministry of Education Teacher
Bacon Woodrow & De Souza Ltd. Actuarial Analyst
Ministry of Education Teacher III
Ministry of Education Teacher
Republic Bank Ltd Programmer Analyst
NIPDEC Application Programmer
Ministry of Education Teacher III
Caribbean Airlines Distribution Analyst
Physics
UWI Demonstrator
Coastal Dynamics Ltd Data Analyst
UWI Open Campus Tutor
Ministry of Education Teacher II
Ministry of Education Teacher
Ministry of Education Teacher
Zoology Caribbean Epidemiology Centre Technologist
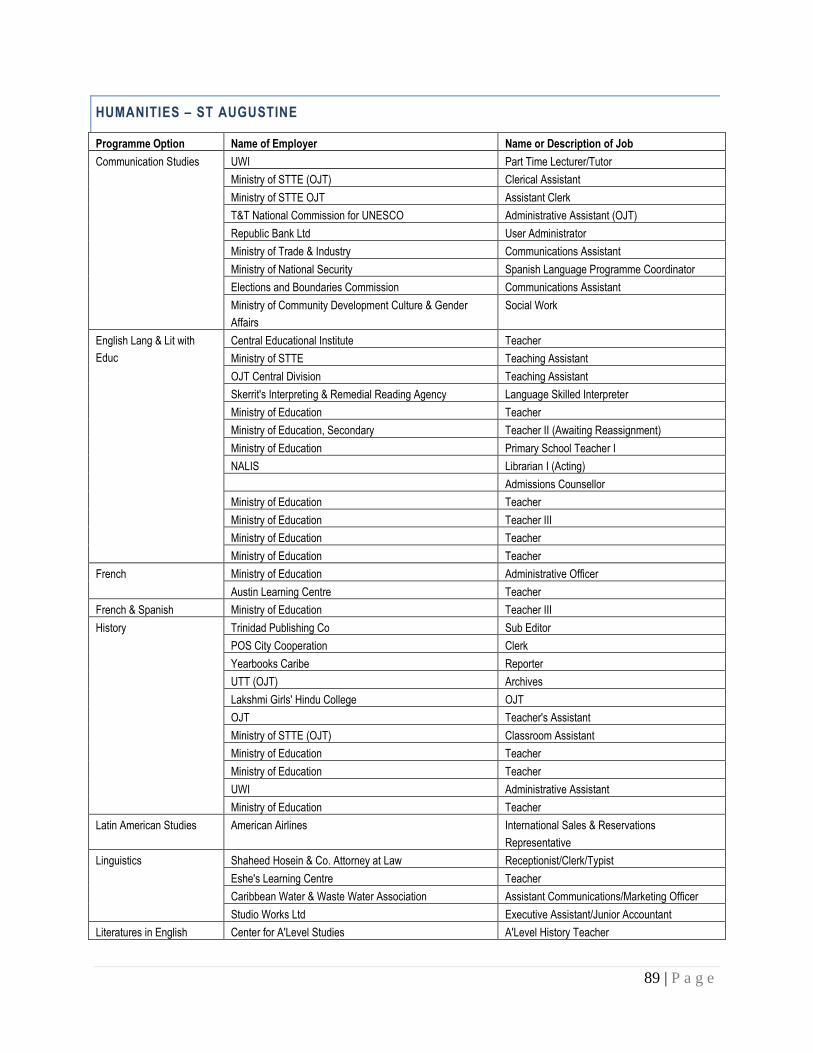
89 | P a g e
HUMANITIES – ST AUGUSTINE
Programme Option Name of Employer Name or Description of Job
Communication Studies
UWI Part Time Lecturer/Tutor
Ministry of STTE (OJT) Clerical Assistant
Ministry of STTE OJT Assistant Clerk
T&T National Commission for UNESCO Administrative Assistant (OJT)
Republic Bank Ltd User Administrator
Ministry of Trade & Industry Communications Assistant
Ministry of National Security Spanish Language Programme Coordinator
Elections and Boundaries Commission Communications Assistant
Ministry of Community Development Culture & Gender
Affairs
Social Work
English Lang & Lit with
Educ
Central Educational Institute Teacher
Ministry of STTE Teaching Assistant
OJT Central Division Teaching Assistant
Skerrit's Interpreting & Remedial Reading Agency Language Skilled Interpreter
Ministry of Education Teacher
Ministry of Education, Secondary Teacher II (Awaiting Reassignment)
Ministry of Education Primary School Teacher I
NALIS Librarian I (Acting)
Admissions Counsellor
Ministry of Education Teacher
Ministry of Education Teacher III
Ministry of Education Teacher
Ministry of Education Teacher
French
Ministry of Education Administrative Officer
Austin Learning Centre Teacher
French & Spanish Ministry of Education Teacher III
History
Trinidad Publishing Co Sub Editor
POS City Cooperation Clerk
Yearbooks Caribe Reporter
UTT (OJT) Archives
Lakshmi Girls' Hindu College OJT
OJT Teacher's Assistant
Ministry of STTE (OJT) Classroom Assistant
Ministry of Education Teacher
Ministry of Education Teacher
UWI Administrative Assistant
Ministry of Education Teacher
Latin American Studies American Airlines International Sales & Reservations
Representative
Linguistics
Shaheed Hosein & Co. Attorney at Law Receptionist/Clerk/Typist
Eshe's Learning Centre Teacher
Caribbean Water & Waste Water Association Assistant Communications/Marketing Officer
Studio Works Ltd Executive Assistant/Junior Accountant
Literatures in English Center for A'Level Studies A'Level History Teacher

90 | P a g e
Programme Option Name of Employer Name or Description of Job
Script-J Administrative Assistant
Amour et Café Owner
Sagicor General Insurance Inc Underwriting Assistant
Ministry of STTE Classroom Assistant
En-Safe Health & Safety Training & Consultancy services Quality Assurance Officer/Lecturer
Ministry of Legal Affairs Media Research Assistant
Ministry of Education Teacher
Ministry of Education Educator
Ministry of Education Teacher III
Musical Arts (Special)
National Steel Symphony of T&T Musician II
Ministry of Education Music Teacher III
Ministry of Education Teacher III
Ministry of Education Music Teacher
Maple Leaf International School Teacher
Ministry of Education Teacher III
Spanish
Elections and Boundaries Commission Temporary Clerk I
T&T National Commission for UNESCO Research Assistant
T&T Water Taxi Service Customer Service Representative
Ministry of Education Spanish Teacher (AT3)
Ministry of Education Teacher
Ministry of Education Teacher III
Ministry of Education Teacher II
Ministry of Education Spanish Teacher
Ministry of Education Secondary Teacher III
Visual Arts (Special)
H Williams Bookstore Ltd Graphic Artist
Printery Supervisor & Graphic Designer
Ministry of Education Teacher III of Secondary School
Teacher Teacher

91 | P a g e
EDUCATION – ST AUGUSTINE
Programme Option Name of Employer Name or Description of Job
Administration Ministry of Education Teacher II
Early Childhood Care
Education
Family Development & Early Children's Research
Centre
Early Childhood Education
Ministry of Education ECC Curriculum Programme
Facilitator
Ministry of Education Senior Teacher
Ministry of Education Teacher
Educational Administration Ministry of Education Teacher
Ministry of Education Principal (Primary)
Mathematics Ministry of Education Teacher/Educator
Primary Education
Ministry of Education Teacher I
Ministry of Education Teacher I
Teacher I
Ministry of Education Teacher I
Ministry of Education Teacher I
Ministry of Education Teacher I
Ministry of Education Teacher I Primary
Ministry of Education Teacher I
Ministry of Education Teacher
Ministry of Education Teacher I
Ministry of Education Head of Department (Teacher
Primary)
Ministry of Education Teacher I
Ministry of Education Teacher I
Ministry of Public Administration Student
Ministry of Education Teacher I
Ministry of Education
Ministry of Education Teacher I
Ministry of Education Teacher
Ministry of Education Principal (Primary)

92 | P a g e
SOCIAL SCIENCES – ST AUGUSTINE
Programme Option Name of Employer Name or Description of Job Accounting (Special)
Ministry of Science Technology & Tertiary Education Assistant Teacher KPMG Staff Assistant I South West Regional Health Authority Accounting Assistant II Ernst & Young Auditor Petrotrin Graduate Trainee Mainstream Foods Ltd Internal Auditor Ministry of Education Teacher III BPTT Rewards Analyst Cipriani College of Labour & Co-Operative Studies Accountant
Banking & Finance (Special)
First Citizens Bank Credit Analyst Republic Bank Ltd Senior Credit Analyst First Citizens Bank Ltd Operations Officer
Economics
Blue Waters Ltd Accounting Officer Mt Hope Medical Sciences Complex Project Officer JD Sellier & Co. Paralegal Ernst and Young External Auditor Water and Sewage Authority Customer Service Assistant WASA Accounts Clerk Tube City IMS Executive Assistant Ministry of Finance Economist RBTT Loans Officer First Citizens Bank Ltd Marketing Officer GIS Ltd Reporter Ministry of Energy Energy Professional Ministry of Social Development Programme Officer I Ministry of Finance Economic Policy Analyst National Petroleum Marketing Co. Graduate Intern Central Bank of Trinidad and Tobago Economist OJT Teaching Assistant Teaching Assistant
Government
Used Car Sales Public Services Credit Union Health Plan Administrator UWI Research Assistant Clico Team Leader Ministry of Social Development Community Development
Officer II T&T Agri Business Association Research Officer Land Settlement Agencies Administrative Officer Judiciary Human Resource Officer III Ministry of National Security Human Resource Assistant UTT Administrative Officer Hilo Food Stores Buyer Ministry of Finance Clerical Officer Believer's Training Centre Coordinator/Counsellor UWI Teaching Assistant
Hosp & Tour Mgmt (Hosp Spec)
National Petroleum Purchasing Clerk Ministry of Science and Technology Acting Clerk Stenographer I Couples for Christ and It's Family Ministries Missionary TTHTI Audit Assistant Judiciary of Trinidad and Tobago - OJT Administrative Assistant South West Regional Health Authority OJT Ministry of Community Development, Culture & Gender Affairs Clerk Trinsatech Ltd Marketing Sales Executive
International Tourism Mgmt
T&T Anapausis Centre Receptionist Government Information Services Ltd Project Assistant Beaches Turks and Caicos Resort Villas and Spa Concierge Agent

93 | P a g e
Programme Option Name of Employer Name or Description of Job Management Studies
Nick Nack Caterers Management Trainee UWI Research Assistant Eastern Regional Health Authority Clerk/ Stenographer I Division of Settlement and Labour Client Relations Officer North Central Regional Health Authority HR Assistant Ministry of National Security Clerk II Guardian Asset Management Accounting Assistant Ministry of Energy Research Assistant Nalis Library Assistant 1 Trinidad and Tobago Mortgage Finance Co. Mortgage Assistant Price Waterhouse Coopers Auditing Associate Land Settlement Agency Social Surveyor Trinidad and Tobago Mortgage Finance Company Ltd Customer Service
Representative NWRHA Dietetic Technician Port Authority of Trinidad and Tobago Junior Clerical Officer Ernst and Young Staff II Auditor Bourse Securities Ltd Investment Analyst First Citizens Bank Ltd Corporate Associate Ministry of Community Development, Culture and Gender Affairs Secretary Human Resource Supervisor Ministry of Education Temporary Primary Teacher Trinidad and Tobago Fire Service Firefighter UWI Marketing Representative Ministry of Education Teacher T&T Mortgage Finance Co. Ltd Mortgage Officer Ministry of Public Utilities Economic Policy Analyst E-Teck Management Trainee Ministry of Public Administration Associate Professional Ministry of Public Administration Associate Professional Ministry of Planning Planning Officer Ministry of Public Administration Associate Professional National Petroleum Graduate Intern -Marketing Ministry of Public Administration Public Management Consultant Ministry of Education Teacher Water and Sewage Authority Administrative Assistant UWI Open Campus Tutor Ministry of Public Administration Public Management Consultant Ministry of Education Teacher Bishops and Trinity College East Sixth Form Teacher Ministry of Education Teacher 1 (Primary) Unilever Human Resource Management
Trainee Agostini Pharmaceutical Ltd Brand Manager Ministry of Science and Technology OJT Ministry of Education Teacher I Angostura LTD Human Resource Assistant UWI Research Assistant Tobago House of Assembly Supervisor Ministry of Public Administration Strategic Analyst Arima Cooperation Sanitation Foreman II RBC/Republic Bank of Trinidad and Tobago Officer in Charge
Administrative Services Ministry of Education Quality Assurance Officer Ministry of Public Administration Manager UWI Administration Assistant First Caribbean International Bank Supervisor - Treasury
Operations

94 | P a g e
Programme Option Name of Employer Name or Description of Job Leadership Consulting Group Ltd Office Manager Republic Bank Limited Clerical Officer
Psychology
NCRHA Clerk I Families in Action Counsellor/Parenting
Facilitator Ministry of Social Development Social Work Assistant Ministry of Legal Affairs Senior Clerical Assistant Ministry of Social Development Graduate Trainee St. George's College Teacher Trainee UTT Assistant Student Counsellor Carib Brewery Executive Assistant Government Information Services Ltd HR Administrator United National Economic Commission for Latin American and the Caribbean, Sub regional Headquarters for the Caribbean
Research/ Project Assistant
Ministry of Education Teacher Ministry of Education Teacher Ministry of Education Guidance Counsellor Human Systems LTD Consultant UWI Administrative Assistant Auditor General Department Auditor II Ministry of Education Teacher Ministry of Education Trainee Guidance Counsellor Leadership Consulting Group Training Facilitator
(Management Consultant) Ministry of Community Development Helpline Supervisor Ministry of Education Teacher I Ministry of Education Teacher I Ministry of Education Guidance Officer I Office of the President Auditor Childline Outreach Officer Administrative Officer/Systems
Trainer Costatt Adjunct Lecturer
Public Sector Management
UWI Technical Assistant Ministry of Education Ministry of National Security Immigration Officer I Ministry of Social Development Office Manager Ministry of Finance Budget Analyst Guardian Holdings Ltd Corporate Services Assistant Ministry of National Security Clerical Relief Ministry of Finance (OJT) Data Operation Clerk/Data
Verification Analyst OSHA Bank Processing Clerk Milat/ Mypart Military Academy Administrative Assistant Ministry of Foreign Affairs Human Resource Assistant Ministry of Education Administrative Assistant Katerserv Ltd Operations Administration Ministry of Trade and Industry Judiciary (Family Court) Administrative Assistant Ministry of National Security Human Resource Officer Ministry of Social Development Coordinating Assistant Clico Foreign Exchange Trader Parliament of Trinidad and Tobago Procedural Clerk Assistant Ministry of National Security-Police Service Division Human Resource Officer III
(Ag) Ministry of Labour Small and Micro Enterprise Cooperative Officer III West Indian Tobacco Company Management and
Manufacturing Trainee

95 | P a g e
Programme Option Name of Employer Name or Description of Job Ministry of Works & Transport Clerk/Typist I
Social Work
Student Support Services Social Worker Judiciary Social Worker Ministry of Education School Social Worker Ministry of National Security Prison Officer Ministry of Health Health Social Worker Ministry of Education Head of Dept-Technology
Education Ministry of Education Guidance Officer I Ministry of Community Development, Culture & Gender Affairs Best Village Officer Ministry of Social Development Family Social Work
Sociology
UWI Part Time Tutor Family Court Assistant to Assessment
Officer Family Court of Trinidad and Tobago Social Work Assistant Maritime Financial Group Accounts Executive
(Corporate) Caribbean Agri-Business Association Research Assistant Ministry of Education Assistant Teacher Primary Land Settlement Agency, Ministry of Housing Social Surveyor Executive Assistant Clico Processing Clerk UWI Senior Lab Assistant Judiciary Statistical Clerk TRICON Human Resource Officer UWI Clerical Assistant Ministry of Science, Technology & Tertiary Education Life Skill Facilitator Petrotrin-Trinmar Clerk Ministry of Public Administration Associate Professional Ministry of Agriculture Administrative Officer II Ministry of Education Teacher I Ministry of National Security Fire Station Officer Accreditation Council of Trinidad and Tobago Acting Research Officer Ministry of Education School Social Worker Ministry of Health - North Central Division Clinical Instructor Upper Level Educational Institute Teacher
Sports Management
Ministry of Social Development Social Welfare Advisor The Sports Company of Trinidad and Tobago Sports Services Officer Ministry of Education Teacher
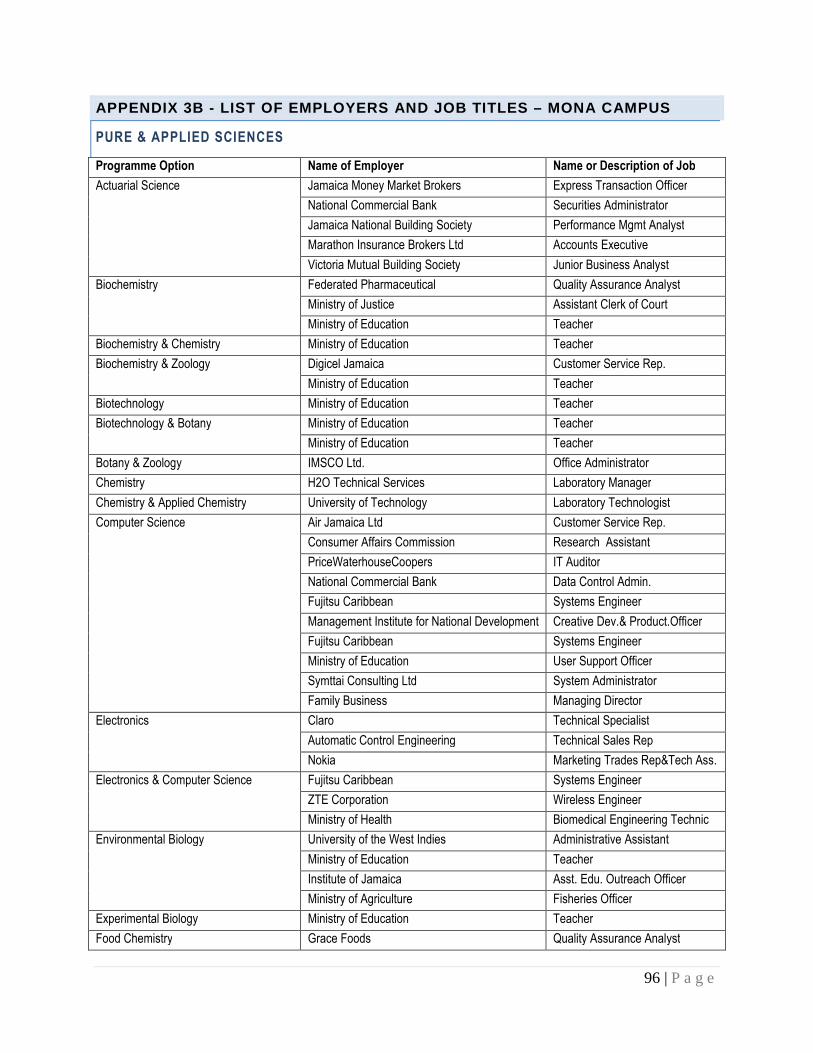
96 | P a g e
APPENDIX 3B - LIST OF EMPLOYERS AND JOB TITLES – MO NA CAMPUS
PURE & APPLIED SCIENCES
Programme Option Name of Employer Name or Description of Job
Actuarial Science
Jamaica Money Market Brokers Express Transaction Officer
National Commercial Bank Securities Administrator
Jamaica National Building Society Performance Mgmt Analyst
Marathon Insurance Brokers Ltd Accounts Executive
Victoria Mutual Building Society Junior Business Analyst
Biochemistry
Federated Pharmaceutical Quality Assurance Analyst
Ministry of Justice Assistant Clerk of Court
Ministry of Education Teacher
Biochemistry & Chemistry Ministry of Education Teacher
Biochemistry & Zoology
Digicel Jamaica Customer Service Rep.
Ministry of Education Teacher
Biotechnology Ministry of Education Teacher
Biotechnology & Botany
Ministry of Education Teacher
Ministry of Education Teacher
Botany & Zoology IMSCO Ltd. Office Administrator
Chemistry H2O Technical Services Laboratory Manager
Chemistry & Applied Chemistry University of Technology Laboratory Technologist
Computer Science
Air Jamaica Ltd Customer Service Rep.
Consumer Affairs Commission Research Assistant
PriceWaterhouseCoopers IT Auditor
National Commercial Bank Data Control Admin.
Fujitsu Caribbean Systems Engineer
Management Institute for National Development Creative Dev.& Product.Officer
Fujitsu Caribbean Systems Engineer
Ministry of Education User Support Officer
Symttai Consulting Ltd System Administrator
Family Business Managing Director
Electronics
Claro Technical Specialist
Automatic Control Engineering Technical Sales Rep
Nokia Marketing Trades Rep&Tech Ass.
Electronics & Computer Science
Fujitsu Caribbean Systems Engineer
ZTE Corporation Wireless Engineer
Ministry of Health Biomedical Engineering Technic
Environmental Biology
University of the West Indies Administrative Assistant
Ministry of Education Teacher
Institute of Jamaica Asst. Edu. Outreach Officer
Ministry of Agriculture Fisheries Officer
Experimental Biology Ministry of Education Teacher
Food Chemistry Grace Foods Quality Assurance Analyst

97 | P a g e
Programme Option Name of Employer Name or Description of Job
Ministry of National Security Student Constable
Geography Self Employed Managing Director
Geology & Geography Ministry of Water & Housing Project Assistant/Core Logger
Mathematics
National Commercial Bank Teller
Digicel Jamaica Inventory Analyst
National Commercial Bank Collections Officer
Mathematics & Computer Science Ministry of Education Teacher
Mathematics & Electronics Jamaica Constabulary Force Constable
Mathematics & Molecular Biology Guardian Life Group Life Administrator
Mathematics with Education
Ministry of Education Teacher
Ministry of Education Teacher-HOD Math
Microbiology Self Employed C.E.O
Molecular Biology Caledonia Medical Laboratory Scientific Officer
Molecular Biology & Chemistry Jamaica Defense Force Officer
Zoology and Chemistry Ministry of Education Teacher

98 | P a g e
MEDICAL SCIENCES - MONA
Programme Option Name of Employer Name or Description of Job
MBBS
Ministry of Health Senior House Officer
Ministry of Health Senior House Officer
Ministry of Health Medical Doctor
Ministry of Health Medical Doctor
Ministry of Health Medical Doctor
Ministry of Health Senior House Officer
University Hospital of the West Indies Medical Doctor
Ministry of Health Senior House Officer
Ministry of Health Senior House Officer
Ministry of Health Medical Doctor
University Hospital of the West Indies Medical Doctor
University Hospital of the West Indies Medical Doctor
Ministry of Health Senior House Officer
Ministry of Health Senior House Officer
Ministry of Health Medical Doctor
Ministry of Health Senior House Officer
Ministry of Health Senior House Officer
University Hospital of the West Indies Medical Doctor
Ministry of Health Registered Nurse
Biochemistry National Rums of Jamaica Ltd. Production Supervisor
Nursing
Ministry of Health Registered Nurse
Ministry of Health Registered Nurse
Ministry of Health Registered Nurse
Ministry of Health Registered Nurse
Ministry of Health Registered Nurse
Ministry of Health Registered Nurse
Ministry of Health Registered Nurse
Ministry of Health Registered Nurse
Ministry of Health Registered Nurse
Ministry of Health Registered Nurse
Ministry of Health Registered Nurse
Ministry of Health Registered Nurse
Ministry of Health Registered Nurse
Ministry of Health Registered Nurse
University Hospital of the West Indies Registered Nurse
Ministry of Health Registered Nurse
Ministry of Health Registered Nurse
Ministry of Health Registered Nurse
Ministry of Health Registered Nurse
Ministry of Health Registered Nurse

99 | P a g e
Programme Option Name of Employer Name or Description of Job
Ministry of Health Registered Nurse
Ministry of Health Registered Nurse
Ministry of Health Registered Nurse
Ministry of Health Registered Nurse
Ministry of Health Registered Nurse
Ministry of Health Registered Nurse
Ministry of Health Registered Nurse
Ministry of Health Registered Nurse
Ministry of Health Registered Nurse
Ministry of Health Registered Nurse
Ministry of Health Registered Nurse
University Hospital of the West Indies Registered Nurse
Ministry of Health Registered Nurse
Ministry of Health Registered Nurse
University Hospital of the West Indies Registered Nurse
University Hospital of the West Indies Registered Nurse
University Hospital of the West Indies Registered Nurse
University Hospital of the West Indies Registered Nurse
Ministry of Health Registered Nurse
Ministry of Health In-service Education Officer
Ministry of Health Registered Nurse
University Hospital of the West Indies Registered Nurse
Ministry of Health Registered Nurse
Ministry of Health Registered Nurse
Ministry of Health Registered Nurse
Ministry of Health Registered Nurse
Ministry of Health Registered Nurse
Ministry of Health Registered Nurse
Ministry of Health Registered Nurse
Ministry of Health Registered Nurse
University Hospital of the West Indies Registered Nurse
Ministry of Health Registered Nurse
Ministry of Health Registered Nurse
Pharmacology
Ministry of Education Teacher
T.Geddes Grant Dist. Limited Medical Representative
University of the West Indies Laboratory Technologist
Physical Therapy
Ministry of Health Physiotherapist
University Hospital of the West Indies Physiotherapist
University Hospital of the West Indies Physiotherapist
Ministry of Health Physiotherapist

100 | P a g e
HUMANITIES - MONA
Programme Option Name of Employer Name or Description of Job
African & African Diaspora Studies Ministry of Education Teacher-Table Tennis Coach
Computer Science
Victoria Mutual Building Society Customer Service Rep.
Ministry of Education Teacher
Ministry of Agriculture Data Control Admin.
Ministry of Education Teacher
Ministry of Education Teacher
Ministry of Education Computer Lab Tech/Assistant
Drama & Cultural Studies Ministry of Education Teacher
Drama & Philosophy Ministry of Education Teacher
English
Ministry of Education Teacher
Ministry of Education Teacher
The National Land Agency Customer Service Rep.
Ministry of Education Teacher
Geography Ministry of Education Teacher
History
Profitable Cooperate Solutions Sales Representative
Binns Business College Teacher
Imaginations Production Assistant
Contaxx Jamaica Solutions Ltd Customer Service Rep.
Ministry of National Security Police Officer
Electoral Office of Jamaica Personal Assistant
Ministry of Education Teacher
Affiliated Computer Services Asset Mgnt. Analyst
Self Employed Managing Director
Insurance Company of the West Indies Customer Service Rep.
RBTT Bank Compliance Rep.
Ministry of Education Teacher
Ministry of Education Teacher
National Commercial Bank Customer Service Rep.
Ministry of Industry, Investment & Commerce Special Assistant
Bank of Nova Scotia Personal Banking Assistant
News Talk 93 FM Technical Operator
Jamaica Public Service Customer Service Rep.
Ministry of Health Customer Service Rep.
Quality Academics Teacher
Marathon Insurance Brokers Ltd Claims Officer
Trafalgar Farm
History & Archaeology
Jamaica National Heritage Trust Junior Archaeologist
Bank of Nova Scotia Bank Teller
History & Economics Bank of Nova Scotia Operations Officer -Teller
History & Literatures in English Ministry of Education Teacher
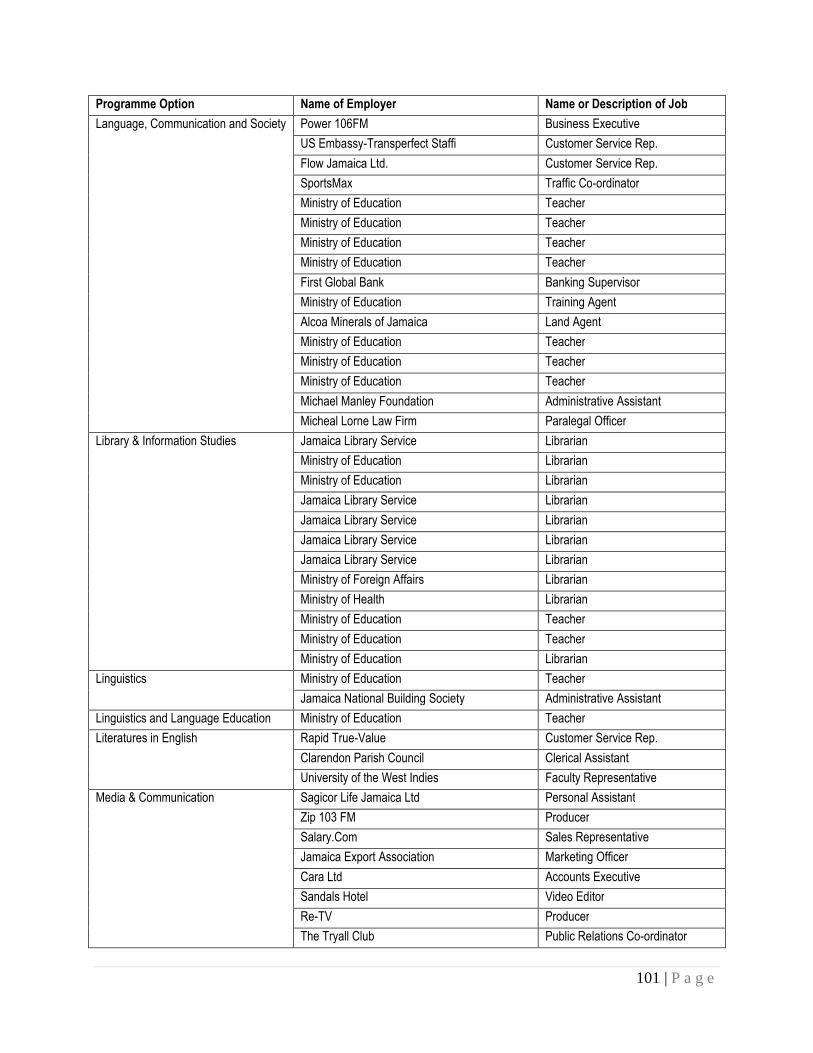
101 | P a g e
Programme Option Name of Employer Name or Description of Job
Language, Communication and Society
Power 106FM Business Executive
US Embassy-Transperfect Staffi Customer Service Rep.
Flow Jamaica Ltd. Customer Service Rep.
SportsMax Traffic Co-ordinator
Ministry of Education Teacher
Ministry of Education Teacher
Ministry of Education Teacher
Ministry of Education Teacher
First Global Bank Banking Supervisor
Ministry of Education Training Agent
Alcoa Minerals of Jamaica Land Agent
Ministry of Education Teacher
Ministry of Education Teacher
Ministry of Education Teacher
Michael Manley Foundation Administrative Assistant
Micheal Lorne Law Firm Paralegal Officer
Library & Information Studies
Jamaica Library Service Librarian
Ministry of Education Librarian
Ministry of Education Librarian
Jamaica Library Service Librarian
Jamaica Library Service Librarian
Jamaica Library Service Librarian
Jamaica Library Service Librarian
Ministry of Foreign Affairs Librarian
Ministry of Health Librarian
Ministry of Education Teacher
Ministry of Education Teacher
Ministry of Education Librarian
Linguistics
Ministry of Education Teacher
Jamaica National Building Society Administrative Assistant
Linguistics and Language Education Ministry of Education Teacher
Literatures in English
Rapid True-Value Customer Service Rep.
Clarendon Parish Council Clerical Assistant
University of the West Indies Faculty Representative
Media & Communication
Sagicor Life Jamaica Ltd Personal Assistant
Zip 103 FM Producer
Salary.Com Sales Representative
Jamaica Export Association Marketing Officer
Cara Ltd Accounts Executive
Sandals Hotel Video Editor
Re-TV Producer
The Tryall Club Public Relations Co-ordinator

102 | P a g e
Programme Option Name of Employer Name or Description of Job
Ministry of Education Teacher
Main Event Entertainment Group Client Services Coordinator
Institute of Jamaica Education Outreach Officer
Ministry of Water & Housing Community Relations/PR Assistant
RJR Communications Group TVJ Reporter/Producer/Presenter
Sandals Hotel Video Editor
Great House OMNIMedia Ltd Accounts Executive
Jamaica Cultural Development Commission Marketing & Promotions Coord.
Nation Wide Radio Production Assistant
Communication Services Limited Executive Assistant
SportsMax Producer
Ministry of Education Teacher
Philosophy
Credit Union Member Service Rep
Insurance Company of the West Indies Customer Service Rep.
Independent Radio Company Producer
The Gleaner Company Sub-Editor
University of the West Indies Senior Secretary
ATC Freight & Shipping Operations Manager
Philosophy & Visual Arts Intralot Jamaica Limited Junior Accountant
Spanish
University of the West Indies Clerical Assistant
Ministry of Education Teacher
Ministry of Education Teacher
Spanish and French
Ministry of Education Teacher
Ministry of Education Teacher
Theology
Jamaica Baptist Union Pastor
Diocese of Jamaica Priest
Ministry of Education Teacher
Visual Arts Ministry of Education Teacher

103 | P a g e
EDUCATION - MONA
Programme Option Name of Employer Name or Description of Job
Biology
Ministry of Education Teacher
Ministry of Education Teacher
Ministry of Education Teacher
Ministry of Education Teacher
Ministry of Education Teacher
Ministry of Education Teacher
Ministry of Education Senior Teacher
Ministry of Education Teacher
Computer Science
Ministry of Education Teacher
Ministry of Education Teacher
Early Childhood Education
Ministry of Education Teacher
Ministry of Education Teacher
Ministry of Education Principal
Ministry of Education Teacher
Ministry of Education Teacher
Ministry of Education Teacher
Ministry of Education Teacher
Ministry of Education Teacher
Ministry of Education Teacher
Ministry of Education Senior Teacher
Ministry of Education Teacher
Ministry of Education Teacher
National Commercial Bank Teacher
Ministry of Education Teacher
Ministry of Education Principal
Education Science Ministry of Education Teacher
Educational Administration
Ministry of Education Senior Teacher
Ministry of Education Principal
Ministry of Education Teacher
Ministry of Education Principal
Ministry of Education Teacher
Ministry of Education Teacher
English
Ministry of Education Teacher
Ministry of Education Teacher
Ministry of Education Teacher
Ministry of Education Teacher
Ministry of Education Teacher
Ministry of Education Teacher
Ministry of Education Teacher
English Language and Literature Ministry of Education Teacher
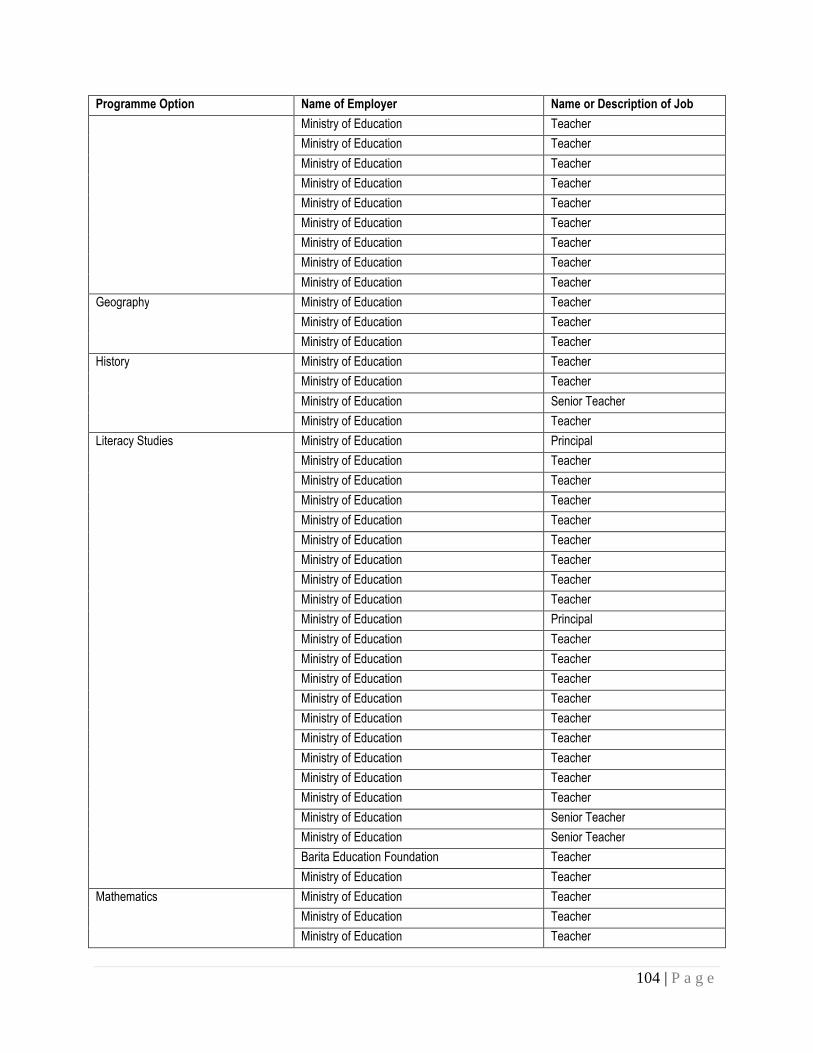
104 | P a g e
Programme Option Name of Employer Name or Description of Job
Ministry of Education Teacher
Ministry of Education Teacher
Ministry of Education Teacher
Ministry of Education Teacher
Ministry of Education Teacher
Ministry of Education Teacher
Ministry of Education Teacher
Ministry of Education Teacher
Ministry of Education Teacher
Geography
Ministry of Education Teacher
Ministry of Education Teacher
Ministry of Education Teacher
History
Ministry of Education Teacher
Ministry of Education Teacher
Ministry of Education Senior Teacher
Ministry of Education Teacher
Literacy Studies
Ministry of Education Principal
Ministry of Education Teacher
Ministry of Education Teacher
Ministry of Education Teacher
Ministry of Education Teacher
Ministry of Education Teacher
Ministry of Education Teacher
Ministry of Education Teacher
Ministry of Education Teacher
Ministry of Education Principal
Ministry of Education Teacher
Ministry of Education Teacher
Ministry of Education Teacher
Ministry of Education Teacher
Ministry of Education Teacher
Ministry of Education Teacher
Ministry of Education Teacher
Ministry of Education Teacher
Ministry of Education Teacher
Ministry of Education Senior Teacher
Ministry of Education Senior Teacher
Barita Education Foundation Teacher
Ministry of Education Teacher
Mathematics
Ministry of Education Teacher
Ministry of Education Teacher
Ministry of Education Teacher

105 | P a g e
Programme Option Name of Employer Name or Description of Job
Ministry of Education Teacher
Ministry of Education Teacher
Ministry of Education Teacher
Ministry of Education Teacher
Ministry of Education Teacher
Ministry of Education Teacher
Ministry of Education Teacher
Ministry of Education Teacher
Ministry of Education Teacher
Primary Education
Ministry of Education Teacher
Ministry of Education Teacher
Ministry of Education Teacher
Ministry of Education Teacher
Ministry of Education Teacher
Ministry of Education Teacher
Ministry of Education Teacher
Ministry of Education Senior Teacher
Ministry of Education Teacher
Ministry of Education Teacher
Ministry of Education Teacher
Ministry of Education Teacher
Ministry of Education Senior Teacher
Ministry of Education Senior Teacher
Ministry of Education Teacher
School Librarianship
Ministry of Education Teacher
Ministry of Education Teacher
Ministry of Education Teacher
Ministry of Education Teacher
Spanish
Ministry of Education Teacher
Ministry of Education Teacher
Ministry of Education Teacher

106 | P a g e
SOCIAL SCIENCES - MONA
Programme Option Name of Employer Name or Description of Job Banking & Finance
Financial and Management Services Audit Clerk Ministry of Education Accounting Technician Bank of Nova Scotia Teller National Commercial Bank Customer Service Rep. Citibank N.A. Service Transaction Rep Desmond Mair Insurance Brokers Ltd. Customer Service Rep. National Commercial Bank Teller First Caribbean International Bank Teller Sagicor Life Jamaica Ltd New Business Clerk Stocks & Securities Ltd Research Assistant National Commercial Bank Teller Guardsman Armoured Ltd Treasuring Officer RBTT Bank Collections Officer Bank of Nova Scotia Floor Manager PriceWaterhouseCoopers Associate Accountant
Economics
Ministry of Health Store Manager Merit Development Home Purchase Facilitator Ministry of Agriculture Agricultural Economist National Commercial Bank Bank Teller CGM Gallgher Insurance Brokers Insurance Broker National Commercial Bank Business Support Clerk Victoria Mutual Building Society Mortgage Clerk National Commercial Bank Bank Teller
Economics and Criminology Ministry of Labour & Social Security Parish Accounting Assistant Economics and Statistics
King Alarm Systems Collections Officer Berts Auto Parts Store Clerk
Hotel Management University College of the Caribbean Programmes Officer International Relations
Jamaica Customs Department Delivery Officer Jamaica Institute of Environmental Professionals
Secretariat Coordinator
Lawe Insurance Brokers Marketing Assistant Ministry of Labour & Social Security Social Worker Ministry of Labour & Social Security Social Worker Social Development Commission Parish Administrator Ministry of Transport & Works Administrator Digicel Jamaica Customer Service Rep. National Commercial Bank Teller Ministry of Tourism Administrative Assistant Air Jamaica Ltd Customer Service Rep. First Caribbean International Bank Customer Service Rep. High Commission of Canada Material Officer HD Hopwood & Company Export Coordinator Ministry of Education Teacher Jamaica College Boys Association Administrator Jamaica Pegasus Hotel Banqueting Sales Executive University of the West Indies Teacher
International Relations and Political Science
Digicel Jamaica Customer Service Rep.
Labour & Employment Relations Ministry of Labour & Social Security Senior Fingerprint Tech Management Studies West Indies Home Contractors Accounts Trainee

107 | P a g e
Programme Option Name of Employer Name or Description of Job Affiliated Computer Services Collections Officer
Affiliated Computer Services Customer Service Rep. Orion Insurance Brokers Ltd Clerical Assistant Affiliated Computer Services Customer Service Rep. Ministry of Justice Administrator Crichton Mullings & Associates Staff Accountant Daly Garrick Daly Audit Senior Council of Community Colleges of Jamaica(CCCJ)
Data Control Admin.
Nesco Stationery Manager Bank of Nova Scotia Customer Service Rep. Hanover Parish Council General Administer G-Tech Jamaica Procall Operator Guardian Life Insurance Broker Digicel Jamaica Customer Service Rep. Victoria Mutual Building Society Teller Affiliated Computer Services Payroll Analyst Jamaica National Building Society Office Services Clerk University Hospital of the West Indies Administrative Assistant Pan Caribbean Bank Teller Air Jamaica Ltd Customer Service Rep. La Maison Property Services Ltd Personal Assistant CGM Gallgher Insurance Brokers Insurance Broker Image One Graphic Designer University of the West Indies Human Resource Assistant KPMG Marketing Assistant Ernst and Young Auditor External Auditor Brandy & Company Accounting Clerk Jamaica National Building Society Administrative Assistant Ministry of Education Teacher Restaurants of Jamaica Marketing Coordinator Affiliated Computer Services Listener Care Rep R & D Chess Managing Director University of the West Indies Course Delivery Assistant Ministry of Education Teacher The Gleaner Company Administrative Assistant Ministry of Health Regional Asset Accountant First Caribbean International Bank Verification Officer Sagicor Life Jamaica Ltd Senior Clerk National Commercial Bank Teller Telecommunications Web Specialist University of Technology Librarian University of Technology Administrative Assistant University of the West Indies Accounting Clerk Ministry of Education Personnel Officer National Commercial Bank Customer Service Rep. Ministry of Health Civil Servant National Commercial Bank Payables Clerk The National Land Agency Paralegal Officer Auditor General Department Auditor Communications & Business Solutions Marketing Executive

108 | P a g e
Programme Option Name of Employer Name or Description of Job Jamaica Private Power Company Limited Junior Accountant Office of the Cabinet Procurement Officer Ministry of Finance & Public Service Auditor Ministry of Water & Housing Senior Inspector Ministry of Education Administrator Ministry of Education Teacher Ministry of Water & Housing Supervisor Careeras Group Ltd. Junior Treasurer Analyst Unicomer Jamaica Extended Warranty Manager National Commercial Bank Product Analyst Office of the Prime Minister Procurement Officer National Commercial Bank Direct Sales Agent Ministry of Education Senior Teacher National Commercial Bank Desk Collections Officer Ministry of Education Principal MBJ Airport Limited Human Resource Assistant Jamaica Customs Department Customs Officer Port Royal Administrative Group Office Manager Jamaica National Building Society Administrative Assistant Office of the Prime Minister Accountant British High Commission Clerical Assistant Urban Development Corporation Senior Secretary Lime Jamaica Engineer Jamaica Defense Force Detachment
Commander(Training) Carimed Ltd Sales Representative Bank of Nova Scotia Teller Bank of Nova Scotia Customer Service Rep. Marchwell Enterprise Ltd. Managing Director Ministry of Finance & Public Service Supervisor Computation Officer Mair Russell Grant Thornton External Auditor Lee Clarke Chang Chartered Acc Semi-Senior Auditor Deloitte and Touche Junior Accountant Victoria Mutual Building Society Customer Service Rep. Auditor General Department Assistant Auditor Betco Premier Ltd. Accounting Supervisor Bureau of Standards Jamaica Treasury Clerk PriceWaterhouseCoopers Staff Accountant Mona Community Co-op. Credit U Assistant Internal Auditor PriceWaterhouseCoopers Staff Accountant Ernst and Young Auditor PriceWaterhouseCoopers Staff Accountant Ministry of Education Teacher Jamaica International Insurance Company Limited
Business Development Officer
Ministry of Water & Housing Senior Internal Auditor Real Properties R Us Personal Assistant Ghad Fisher Manager University of the West Indies Resident Advisor Victoria Mutual Building Society Mortgage Officer Airport Authority of Jamaica Administrative Assistant Scientific Research Council Administrative Assistant

109 | P a g e
Programme Option Name of Employer Name or Description of Job Woodcats International Limited Accountant University of the West Indies Site Coordinator Ministry of Education Assistant Lecturer Micro Investment Development Accountant Corruption Prevention Comm. Senior Financial Investigator Sagicor Life Jamaica Ltd Pension Administration Manager
Political Science
University of Technology Records Clerk Jamaica Customs Department Customs Officer First Regional Credit Union Loan Officer
Psychology
Early Achievers Learning Center Teacher China Garden Restaurant Bartender Digicel Jamaica Customer Service Rep. Digicel Jamaica Customer Service Rep. Notchilus Pees Managing Director Strategic Management & Training Special Projects Co-ord. Victoria Mutual Building Society Telecare Representative First Global Bank Teller Ministry of Education Teacher Air Jamaica Ltd Accountant Government of Jamaica Administrator Ministry of Transport & Works Secretary Guardian Life Customer Service Rep. Emmanuel Counselling Centre Counsellor Ministry of Water & Housing Human Resource Assistant Freelance Managing Director Jamaica Civil Aviation Authority Aeronautical Info. Services Of Ministry of Education Teacher Devereux Foundation Direct Care Professional RBTT Bank Supervisor Pre-University School Administrator Development Options Ltd. Executive Assistant Sandals Hotel Human Resource Coordinator Securities Officer Victoria Mutual Building Society Business Development Officer Self Employed Fashion Design Producer Shipping Association Marketing Associate University of the West Indies Administrative Assistant University of the West Indies Assistant Controller University of the West Indies Records Clerk Donald A Bryan + Associates Legal Assistant
Public Sector Management
Ministry of Health Hospital Administrator Tax Audit and Assessment Department Tax Audit Statistical Institute of Jamaica Registry Clerk Local Government HR Officer Ministry of Education Teacher Ministry of Education Teacher Ministry of Health Assistant Dietician Ministry of Justice Executive Secretary House of Parliament Senior Stenotype Writer University of the West Indies Senior Secretary Ministry of Water & Housing Administrative Assistant Ministry of Health Operation's Manager

110 | P a g e
Programme Option Name of Employer Name or Description of Job Office of the Services Commission Senior Court Report Ministry of Finance & Public Service Accounting Technician Whole Life Ministries Junior Accountant Ministry of Finance & Public Service Accounting Technician Ministry of National Security Senior Human Resource Officer Jamaica Customs Department Customs Officer Office of the Prime Minister Acting Director
Social Policy and Development
Digicel Jamaica Customer Service Rep. University of the West Indies Research Assistant Office of the Children's Registry Registration Officer
Social Work
Ministry of Labour & Social Security Social Worker Ministry of Health Social Worker Ministry of Health Midwife Hanover Parish Council Poor Relief Officer Ministry of Health Social Worker Child Development Agency Children's Officer Ministry of Education Guidance Counsellor Ministry of Education Teacher University Hospital of the West Indies Social Worker University of the West Indies Office Manager Petrojam Purchasing Assistant Social Development Commission Governance Coordinator Ministry of Education Teacher Ministry of Education Dean of Discipline Centre for Disabilities Studies Research Assistant
Sociology
El Shadhai Learning Centre Teacher Victoria Mutual Building Society Arrears Control Clerk Development Options Ltd. Assisting Analyst National Commercial Bank Bank Teller Administrative Assistant Ministry of Finance & Public Service Data Control Admin. Institute of Jamaica Research Assistant Jamaica Cooperative Credit Union Training Assistant Sunday Herald Consultant University of the West Indies Research Assistant
Sociology & Human Resource Development
University Hospital of the West Indies Assistant Director Recruitment
Sociology and Psychology Ministry of Education Teacher Tourism Management
Bank of Nova Scotia Contract Teller Merrils Beach Resorts Manager Jamaica Customs Department Customs Officer Sandals Hotel Front Office Supervisor Digicel Jamaica Customer Service Rep. Guardian Life Customer Service Rep. Affiliated Computer Services Administrative Assistant Bank of Nova Scotia Contractor Urban Development Corporation Junior Marketing Officer Ministry of Education Teacher Bank of Nova Scotia Debt Collector Sandals Hotel Operations Assistant

111 | P a g e

112 | P a g e
APPENDIX 3C LIST OF EMPLOYERS AND JOB TITLES – CAVE HILL CAMPUS
PURE & APPLIED SCIENCES
Programme Option Name of Employer Name or Description of Job
Chemistry Forensic Science Centre Forensic Scientist I
Chemistry Global Drug Supply Pharmacist Assistant
Computer Science Sagicor Life Inc Customer Service Representative
Computer Science Moore Paragon Caribbean Ltd Account Executive
Computer Science R-Tech Networks Owner/Manager
Computer Science Barbados Shipping & Trading Graduate Trainee
Computer Science First Caribbean International Bank Systems Developer
Computer Science and Mathematics
Insurance Corporation of Barbados Ltd Underwriter
Electronics and Mathematics Ministry of Education Teacher
Electronics UWI Senior Lab Tech
Electronics Barbados Bottling Company Asset Care Zone Leader
Electronics Williams Industries Computer Administrator
Information Technology Samuel Jackman Prescod Polytechnic Instructor
Information Technology Ellerslie Secondary School Graduate Teacher
Information Technology Government of Barbados Library Assistant
Information Technology Sagicor Financial Corporation Programmer/Analyst
Information Technology Blue Communications Ltd Network Engineer
Mathematics First Caribbean International Bank Audit Officer
Mathematics Springer Memorial Secondary School Graduate Teacher
Mathematics, Physics UWI Student Demonstrator
Ecology The University of the West Indies Lab Technician

113 | P a g e
HUMANITIES AND EDUCATION – CAVE HILL
Programme Option Name of Employer Name or Description of Job
Education Ministry of Education Graduate Teacher
Education Ministry of Education Teacher
Education Barbados Vocational Training Board Supervisor
French National Sports Council Clerk/Typist
French, Management Regional Business Systems Corporate Account Executive
History UWI Stenographer Clerk I
History Government of Barbados, Ministry of Community Development & Culture
Clerical Officer, Accounts Section
Linguistics UWI Steno/Clerk
Linguistics Cable & Wireless Account Manager
Linguistics and Psychology St. Leonards Boys' Secondary School Graduate Teacher
Literatures in English Royal Bank of Canada Customer Service Representative
Philosophy Management Commission of Parliament Library Assistant
Psychology Ministry of Education Teacher
Psychology St.Gabriel's School Teacher
Psychology Cable & Wireless Barbados Ltd Human Resources Coordinator
Psychology Ministry of Education Teacher
Psychology Government of Barbados Clerical Officer
Spanish and Management Studies
Foster and Ince Cruise Services Check-in Agent
Theology Child Care Board Co-ordinator Private Day Care
Theology O & E Hardware Inc Manager
Humanities(programme not stated)
Ministry of Education Teacher
Ministry of Education Primary School Teacher
Anglican Church Deacon

114 | P a g e
SOCIAL SCIENCES – CAVE HILL
Programme Option Name of Employer Name or Description of Job
Accounting Auditor
Accounting General Post Office Clerical Officer
Accounting Treasury Department Clerical Officer
Accounting Auditor General Department Auditor II
Accounting Central Bank of Barbados Research Officer
Accounting Guardian Life Senior Accounting Assistant
Accounting Hobbs, Niles & Co. Junior Staff Accountant
Accounting Pricewaterhouse/Coopers Auditor
Accounting Sagicor Life Inc Accounting Assistant
Accounting Ernst &Young Tax Professional
Accounting Trans Executive Inc Accountant
Accounting (Special) Ernst &Young Auditor (Staff 2)
Accounting (Special) Cruise Management Ltd Accountant
Accounting (Special) R.B.C. Wealth Management Trust Accountant
Bachelor of Science Management Studies
Barbados Community College Clerical Officer
Bachelor of Science: Management Studies (Special)
SAGICOR ADMINISTRATIVE ASSISTANT
Banking & Finance Almond Resorts Inc Head Hotel Cashier
Banking & Finance KPMG Assistant Accountant
Bsc Management Studies Cable and Wireless (LIME) Accounts Clerk
BSc. Economics and Accounting PriceWaterHouseCoopers Staff Assistant 1
BSc. Management Studies Alleyne School Graduate Teacher
Economics BNB Finance and Trust Clerk
Economics Stansfeld Scott & Co. Ltd Administrative Assistant
Economics Business Advisory Services Assistant Accountant
Economics PriceWaterHouseCoopers Staff Assistant
Economics PriceWaterHouseCoopers Auditor
Economics Tropical computer Ltd Accounts Assistant
Economics Ministry of Economic Affairs Economist I
Economics and Accounting PriceWaterHouseCoopers Auditor
Economics and Management C.S. Construction Ltd Office Manager
Hospitality & Tourism Market One Tele-Marketing Analyst
Hospitality & Tourism Management Foster & Ince Cruise Services Cruise Operations Executive
Hospitality & Tourism Management Island Resorts Ltd Waiter
Hospitality & Tourism Management Suntours Caribbean-Virgin Holidays Tour Representative
Hospitality and Tourism Management Intimate Hotels of Barbados Web Marketing Assistant
Management Michael Greaves Associates Inc Office Administrator
Management (Special) Pruco Assignment Corporation Assistant to Business Manager
Management and Psychology Cables and Accessories Manager
Management Special Caribbean Institute for Meteorology & Hydrology Senior Administrative Officer

115 | P a g e
Programme Option Name of Employer Name or Description of Job
Management Studies Registration Department Clerical Officer
Management Studies Sagicor Life Inc Administrative Assistant
Management Studies Barbados Bottling Company Ltd Asset Care Assistant
Management Studies Ministry of Housing & Lands Steno/Typist
Management Studies Gildain Activewear SRC Retain and Forecasting Assistant
Management Studies RBC Processing Agent
Management Studies Q'Max Solutions Administrative Assistant
Management Studies Royal Bank of Canada Processing Agent
Management Studies RWE Npower Customer Administrant
Management Studies Associates for International Development Inc Project Administrator
Management Studies Consumers Guarantee Insurance Customer Service Representative
Management Studies Sales Clerk
Management Studies Quantum Technology Customer Relations Manager
Management Studies G and A communication Marketing Executive
Management Studies Food and Agriculture Division of the UN National Administrative Officer
Management Studies Self Employed Systems Engineer
Management Studies Barbados Lights and Power Co. Ltd. Administrative Clerk
Management Studies Marcus Evans Marketing Research
Management Studies Permanent Value Asset Management Finance Management
Management Studies Sagicor Life Inc Supervisor
Management Studies Barbados Advocate Newspaper Journalist
Political Science National Library Service Library Assistant
Political Science Government of Barbados Graduate Teacher
Psychology RBTT (Barbados) Ltd Customer Service Representative
Psychology Steve A.H. Gollop Attourney-at-Law Legal Clerk
Psychology Royal Bank of Canada Client Services Representative
Psychology (Special) University of the West Indies Research Assistant
Psychology and Management Ministry of Education Teacher
Public Sector Management Government of Barbados Senior Supervisor
Public Sector Management Ministry of Community Development and Culture Clerical Officer
Public Sector Management Government of Barbados (Police) Inspector of Police
Public Sector Management Ministry of Health Environmental Health
Public Sector Management Ministry of Health Environmental Health Officer
Public Sector Management (Special) Coastal Zone Management Unit Accountant
Social Work Psychiatric Hospital Psychiatric Social Worker
Social Work Welfare Department Welfare Officer
Social Work Ministry of Health Care Coordinator
Social Work Queen Elizabeth Hospital Medical Social Worker
Social Work Challenor Creative Arts and Training Center Social Worker
Social Work Royal Barbados Police Force Sergeant
Sociology Sagicor Life Inc. Pension Plan Administrator
Sociology Commissioner of Police Inspector of Police

116 | P a g e
Programme Option Name of Employer Name or Description of Job
Sociology Self Employed Consultant
Sociology & Psychology Ministry of Education Teacher
Sociology and Psychology UWI Part-time Tutor
Sociology, Psychology Alrick Scott, Attorney-At-Law Legal Secretary
Sociology, Psychology Self Employed Owner
Sociology, Psychology Gildain Activewear SRC Customer Service Representative
Sociology, Psychology Codrington School Teaching Assistant
Social Sciences(programme not stated)
Sagicor Life Inc. Administrative Assistant
Attorney General's Office Stereographer
Lauril Elcock Office Manager
Sagicor Life Inc. Administrative Assistant
E.G. Hutson Trainee Auditor
Barbados National Bank Inc Accounting Officer
UWI Research Assistant
Government of Barbados Petty Officer
Immigration Department Endorsement Officer
Bank of Nova Scotia Processing Clerk
Friendly Signs Inc Director/Office Manager
Substance Abuse foundation Clinical Administrative Assistant
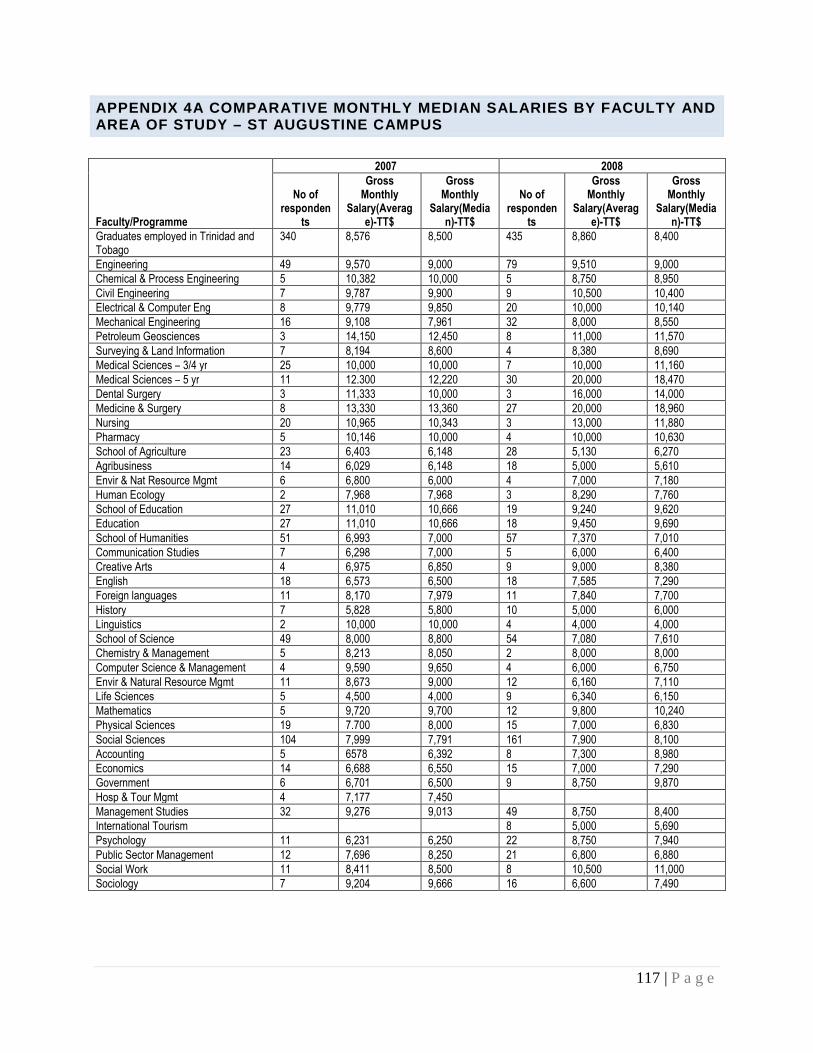
117 | P a g e
APPENDIX 4A COMPARATIVE MONTHLY MEDIAN SALARIES BY FACULTY AND AREA OF STUDY – ST AUGUSTINE CAMPUS
Faculty/Programme
2007 2008
No of responden
ts
Gross Monthly
Salary(Average)-TT$
Gross Monthly
Salary(Median)-TT$
No of responden
ts
Gross Monthly
Salary(Average)-TT$
Gross Monthly
Salary(Median)-TT$
Graduates employed in Trinidad and Tobago
340 8,576 8,500 435 8,860 8,400
Engineering 49 9,570 9,000 79 9,510 9,000 Chemical & Process Engineering 5 10,382 10,000 5 8,750 8,950 Civil Engineering 7 9,787 9,900 9 10,500 10,400 Electrical & Computer Eng 8 9,779 9,850 20 10,000 10,140 Mechanical Engineering 16 9,108 7,961 32 8,000 8,550 Petroleum Geosciences 3 14,150 12,450 8 11,000 11,570 Surveying & Land Information 7 8,194 8,600 4 8,380 8,690 Medical Sciences – 3/4 yr 25 10,000 10,000 7 10,000 11,160 Medical Sciences – 5 yr 11 12.300 12,220 30 20,000 18,470 Dental Surgery 3 11,333 10,000 3 16,000 14,000 Medicine & Surgery 8 13,330 13,360 27 20,000 18,960 Nursing 20 10,965 10,343 3 13,000 11,880 Pharmacy 5 10,146 10,000 4 10,000 10,630 School of Agriculture 23 6,403 6,148 28 5,130 6,270 Agribusiness 14 6,029 6,148 18 5,000 5,610 Envir & Nat Resource Mgmt 6 6,800 6,000 4 7,000 7,180 Human Ecology 2 7,968 7,968 3 8,290 7,760 School of Education 27 11,010 10,666 19 9,240 9,620 Education 27 11,010 10,666 18 9,450 9,690 School of Humanities 51 6,993 7,000 57 7,370 7,010 Communication Studies 7 6,298 7,000 5 6,000 6,400 Creative Arts 4 6,975 6,850 9 9,000 8,380 English 18 6,573 6,500 18 7,585 7,290 Foreign languages 11 8,170 7,979 11 7,840 7,700 History 7 5,828 5,800 10 5,000 6,000 Linguistics 2 10,000 10,000 4 4,000 4,000 School of Science 49 8,000 8,800 54 7,080 7,610 Chemistry & Management 5 8,213 8,050 2 8,000 8,000 Computer Science & Management 4 9,590 9,650 4 6,000 6,750 Envir & Natural Resource Mgmt 11 8,673 9,000 12 6,160 7,110 Life Sciences 5 4,500 4,000 9 6,340 6,150 Mathematics 5 9,720 9,700 12 9,800 10,240 Physical Sciences 19 7.700 8,000 15 7,000 6,830 Social Sciences 104 7,999 7,791 161 7,900 8,100 Accounting 5 6578 6,392 8 7,300 8,980 Economics 14 6,688 6,550 15 7,000 7,290 Government 6 6,701 6,500 9 8,750 9,870 Hosp & Tour Mgmt 4 7,177 7,450 Management Studies 32 9,276 9,013 49 8,750 8,400 International Tourism 8 5,000 5,690 Psychology 11 6,231 6,250 22 8,750 7,940 Public Sector Management 12 7,696 8,250 21 6,800 6,880 Social Work 11 8,411 8,500 8 10,500 11,000 Sociology 7 9,204 9,666 16 6,600 7,490

118 | P a g e
APPENDIX 4B COMPARATIVE MONTHLY MEDIAN SALARIES BY FACULTY AND AREA OF STUDY – MONA CAMPUS
Faculty/Area of Study
2007 2008 No of
respondent employed full-time Mean Median
No of respondent employed full-time Mean Median
Graduates employed in Jamaica 488 92,567 85,000 510
93,370 85,000
Humanities 73 78,184 74,000 88 77,920 75,000 Creative Arts 3 124,840 119,000 2 115,000 115,000 Computer Science 6 78,430 70,500 English 6 71,537 72,250 5 77,400 82,000 Geography 3 60,667 42,000 1 100,000 100,000 History 15 71,584 50,000 18 63,910 66,500 Library & Information Studies 9 88,441 83,613 10 85,520 79,000 Media & Communication 16 87,103 80,000 16 73,110 68,000 Spanish 7 75,601 80,000 75,240 82,000 Language Communication 11 69,874 70,000 14 91,970 82,300 Philosophy 7 66,110 72,000 Education 107 116,093 120,000 102 113,700 119,280 Education 107 116,093 120,000 102 113,700 119,280 Medical Sciences – 5 yr 10 161,333 150,000 18 148,390 122,090 Medicine and Surgery 10 161,333 150,000 18 148,390 122,090 Medical Sciences – 3 yr 53,000 52 59,760 55,690 Nursing 53 63,883 52,000 44 56,340 55,890 Physical Therapy 5 71,600 65,000 4 73,750 72,500 Pharmacology 3 91,670 86,000 Pure and Applied Sciences 58 94,168 84,500 44 97,932 83,170 Actuarial Sciences 8 114,842 93,834 5 92,983 80,000 Computer Science 4 115,125 110,250 9 78,330 70,000 Geography/Geology 9 81,740 80,000 Life Sciences 24 87,443 80,000 12 107,490 83,220 Mathematics 5 118,600 84,000 8 105,210 94,690 Physical Sciences 8 81,906 83,000 10 100,750 77,500 Social Sciences 180 89,857 80,067 206 92,610 80,000 Accounting/Banking 13 89,338 79,166 12 78,080 75,000 Economics 10 82,090 80,500 9 71,450 67,000 Political Science 3 63,000 72,000 3 63,930 65,000 Hosp & Tour Mgmt 25 78,392 80,000 10 88,020 67,500 Management Studies 56 95,595 88,500 98 101,950 88,000 Psychology 17 79,937 80,133 16 86,420 69,720 Public Sector Management 24 95,152 94,500 17 96,250 90,000
Social Work 8 84,564 79,188 14 99,593 89,185 Sociology 9 117,974 82,500 10 73,550 70,000 International Relations 15 85,669 80,000 14 74,890 78,000

119 | P a g e
APPENDIX 5 - GRADUATES’ OPINION OF UWI’S CONTRIBUTI ON TO THEIR ATTRIBUTES/SKILLS BY FACULTY – ALL Campuses
Critical thinking skills
Row Labels none very little moderate strong Total Education 0.0% 4.1% 30.4% 65.5% 148
Humanities 0.0% 3.9% 33.9% 62.2% 254
Engineering 0.0% 11.8% 56.9% 31.4% 102
Medical Sciences - 5 YR 1.6% 7.9% 61.9% 28.6% 63 Medical Sciences 0.0% 4.0% 40.0% 56.0% 75
Science 1.0% 11.6% 49.7% 37.7% 199
Agriculture 2.1% 8.3% 54.2% 35.4% 48
Social Sciences 1.0% 5.4% 44.9% 48.7% 690
Law 0.0% 5.3% 31.6% 63.2% 19
Grand Total 0.7% 6.3% 43.7% 49.2% 1598
Problem solving skills
Row Labels none very little moderate strong Total
School of Education 0.0% 6.1% 37.8% 56.1% 148
School of Humanities 1.2% 7.1% 48.6% 43.1% 255
Engineering 1.0% 3.9% 52.4% 42.7% 103
Medical Sciences - 5 YR 3.2% 7.9% 50.8% 38.1% 63
Medical Sciences 1.3% 6.7% 44.0% 48.0% 75
School of Science 1.0% 10.1% 44.2% 44.7% 199
School of Agriculture 0.0% 8.3% 50.0% 41.7% 48
Social Sciences 0.7% 7.5% 49.3% 42.5% 692
Law 0.0% 0.0% 47.4% 52.6% 19
Grand Total 0.9% 7.3% 47.5% 44.3% 1602
Effective writing skills
Row Labels none very little moderate strong Total
School of Education 0.0% 2.7% 39.2% 58.1% 148
School of Humanities 0.4% 3.1% 28.7% 67.7% 254
Engineering 2.9% 25.2% 42.7% 29.1% 103
Medical Sciences - 5 YR 7.9% 44.4% 34.9% 12.7% 63 Medical Sciences 1.3% 0.0% 46.7% 52.0% 75
School of Science 2.0% 19.1% 50.3% 28.6% 199
School of Agriculture 0.0% 16.7% 45.8% 37.5% 48
Social Sciences 0.3% 7.2% 41.0% 51.5% 693
Law 0.0% 5.3% 42.1% 52.6% 19
Grand Total 1.0% 10.2% 40.3% 48.5% 1602
Effective speaking skills
Row Labels none very little moderate strong Total School of Education 0.0% 6.8% 45.9% 47.3% 148

120 | P a g e
Critical thinking skills Row Labels none very little moderate strong Total
School of Humanities 0.8% 9.0% 35.7% 54.5% 255
Engineering 5.0% 21.8% 47.5% 25.7% 101
Medical Sciences - 5 YR 11.1% 19.0% 52.4% 17.5% 63 Medical Sciences 4.0% 2.7% 46.7% 46.7% 75
School of Science 7.5% 24.6% 43.2% 24.6% 199
School of Agriculture 4.2% 12.5% 43.8% 39.6% 48
Social Sciences 1.9% 14.9% 41.1% 42.1% 693
Law 0.0% 21.1% 36.8% 42.1% 19
Grand Total 2.9% 14.4% 42.1% 40.5% 1601
Working effectively with modern IT communication technologies
Row Labels none very little moderate strong Total
School of Education 0.0% 13.5% 43.9% 42.6% 148
School of Humanities 5.9% 19.6% 41.2% 33.3% 255
Engineering 3.9% 15.5% 51.5% 29.1% 103
Medical Sciences - 5 YR 16.1% 37.1% 41.9% 4.8% 62
Medical Sciences 4.0% 16.0% 42.7% 37.3% 75
School of Science 7.0% 16.1% 48.2% 28.6% 199
School of Agriculture 2.1% 18.8% 50.0% 29.2% 48
Social Sciences 4.3% 21.4% 45.0% 29.3% 693
Law 10.5% 15.8% 57.9% 15.8% 19
Grand Total 4.9% 19.5% 45.2% 30.3% 1602
Count of Question 30: Innovative and entrepreneurial Row Labels none very little moderate strong Total
School of Education 6.8% 27.0% 41.9% 24.3% 148
School of Humanities 11.0% 29.8% 43.5% 15.7% 255
Engineering 10.7% 24.3% 51.5% 13.6% 103
Medical Sciences - 5 YR 19.0% 34.9% 41.3% 4.8% 63 Medical Sciences 8.0% 29.3% 49.3% 13.3% 75
School of Science 19.8% 37.6% 32.5% 10.2% 197
School of Agriculture 4.2% 14.6% 54.2% 27.1% 48
Social Sciences 9.1% 28.6% 43.8% 18.5% 692
Law 10.5% 26.3% 42.1% 21.1% 19
Grand Total 10.8% 29.3% 43.1% 16.8% 1600
Count of Question 30: Understanding and appreciating diversity and other cultures
Row Labels none very little moderate strong Total School of Education 0.0% 8.8% 33.8% 57.4% 148
School of Humanities 0.8% 5.9% 29.0% 64.3% 255
Engineering 7.8% 15.5% 52.4% 24.3% 103
Medical Sciences - 5 YR 6.3% 27.0% 36.5% 30.2% 63
Medical Sciences 1.3% 10.7% 42.7% 45.3% 75

121 | P a g e
Critical thinking skills Row Labels none very little moderate strong Total
School of Science 6.0% 17.1% 31.2% 45.7% 199
School of Agriculture 6.3% 14.6% 27.1% 52.1% 48
Social Sciences 2.6% 9.5% 33.8% 54.0% 692
Law 0.0% 0.0% 27.8% 72.2% 18
Grand Total 3.0% 11.0% 34.2% 51.8% 1601
Ability to think and work independently
Row Labels none very little moderate strong Total School of Education 0.7% 3.4% 25.7% 70.3% 148
School of Humanities 0.8% 5.9% 29.0% 64.3% 255
Engineering 1.9% 8.7% 32.0% 57.3% 103
Medical Sciences - 5 YR 3.2% 7.9% 44.4% 44.4% 63
Medical Sciences 1.3% 0.0% 34.7% 64.0% 75
School of Science 1.5% 6.5% 39.7% 52.3% 199
School of Agriculture 0.0% 8.3% 29.2% 62.5% 48
Social Sciences 1.2% 6.4% 29.2% 63.2% 691
Law 0.0% 0.0% 26.3% 73.7% 19
Grand Total 1.2% 5.9% 31.2% 61.7% 1601
Capacity to work effectively in teams
Row Labels none very little moderate strong Total
School of Education 0.0% 4.7% 26.4% 68.9% 148
School of Humanities 1.6% 9.4% 35.3% 53.7% 255
Engineering 0.0% 4.9% 32.0% 63.1% 103
Medical Sciences - 5 YR 4.8% 4.8% 50.8% 39.7% 63 Medical Sciences 1.3% 0.0% 28.0% 70.7% 75
School of Science 2.0% 10.6% 41.7% 45.7% 199
School of Agriculture 2.1% 2.1% 31.3% 64.6% 48
Social Sciences 1.3% 5.6% 31.6% 61.5% 693
Law 5.3% 21.1% 10.5% 63.2% 19
Grand Total 1.4% 6.5% 33.3% 58.8% 1603
Socio/Political awareness
Row Labels none very little moderate strong Total
School of Education 2.0% 15.5% 52.0% 30.4% 148
School of Humanities 2.4% 14.1% 40.4% 43.1% 255
Engineering 15.5% 34.0% 41.7% 8.7% 103
Medical Sciences - 5 YR 17.5% 44.4% 30.2% 7.9% 63 Medical Sciences 6.7% 13.3% 60.0% 20.0% 75
School of Science 11.1% 32.2% 36.7% 20.1% 199
School of Agriculture 10.4% 27.1% 47.9% 14.6% 48

122 | P a g e
Critical thinking skills Row Labels none very little moderate strong Total
Social Sciences 3.3% 14.0% 43.9% 38.7% 692
Law 5.3% 10.5% 31.6% 52.6% 19
Grand Total 5.7% 19.2% 43.3% 31.8% 1602 Ethical conduct Row Labels none very little moderate strong Total School of Education 4.1% 15.5% 27.0% 53.4% 148
School of Humanities 5.9% 14.1% 36.9% 43.1% 255
Engineering 9.7% 20.4% 38.8% 31.1% 103
Medical Sciences - 5 YR 6.3% 15.9% 34.9% 42.9% 63
Medical Sciences 2.7% 10.7% 40.0% 46.7% 75
School of Science 10.1% 30.8% 36.4% 22.7% 198
School of Agriculture 8.3% 18.8% 39.6% 33.3% 48
Social Sciences 4.1% 14.9% 36.9% 44.1% 691
Law 5.3% 21.1% 31.6% 42.1% 19
Grand Total 5.6% 17.2% 36.1% 41.1% 1600
Proficiency in a second language
Row Labels none very little moderate strong Total
School of Education 60.8% 22.3% 12.8% 4.1% 148
School of Humanities 25.9% 33.3% 27.5% 13.3% 255
Engineering 59.2% 27.2% 12.6% 1.0% 103
Medical Sciences - 5 YR 71.0% 25.8% 3.2% 0.0% 62
Medical Sciences 64.0% 20.0% 10.7% 5.3% 75
School of Science 61.3% 26.1% 11.1% 1.5% 199
School of Agriculture 58.3% 31.3% 6.3% 4.2% 48
Social Sciences 60.3% 24.0% 10.9% 4.8% 688
Law 63.2% 26.3% 5.3% 5.3% 19
Grand Total 55.5% 25.9% 13.3% 5.3% 1597