Multi-level bootstrap analysis of stable clusters in resting-state fMRI
Upload
independentCategory
view
2download
0
Fisheries Research 79 (2006) 294–302
Using the bootstrap to investigate the effects of varying towlengths and catch sampling schemes in fish survey
Santiago Cervino a,∗, Fran Saborido-Rey b
a Instituto Espanol de Oceanografıa, Cabo Estai, Canido s/n, 36200 Vigo, Spainb Instituto de Investigaciones Marinas (CSIC), Eduardo Cabello 6, 36208 Vigo, Spain
Received 4 April 2005; received in revised form 8 March 2006; accepted 14 March 2006
Abstract
In this paper we explore the application of bootstrap methods to analyse of errors in trawl survey indices of abundance at age, with focuson the relative participation of the three sampling levels: haul design, sampling of lengths and sampling of ages, and their implications forsurvey accuracy. The method consists of resampling these three sources of variability, independently and together, following the samplingscheme and comparing the results. Our results show that although the haul design component is the main source of variability of abundanceawrtt©
K
1
bpctaKttaaca
f
0d
t age, the importance of catch sampling (sampling of lengths and ages) may be substantial, especially at low abundance levels. Furthermore,e have used our method as a survey simulator; as an example we have performed a simulation with an alternative sampling scheme, i.e.
educing the tow duration and spending the saved time performing more hauls. The simulation shows that the alternative scheme improveshe accuracy of abundance at age. This survey simulator may be used as a tool to evaluate other alternative sampling schemes. We have usedhe cod (Gadus morhua) data from the Flemish Cap survey as a case study but the method may be adapted to different survey procedures.
2006 Elsevier B.V. All rights reserved.
eywords: Trawl survey; Catch sampling; Bootstrap; Simulations; Flemish Cap cod
. Introduction
Estimates of abundance of fish populations obtained fromottom trawl surveys provide a major source of fisheries inde-endent information for management purposes. When theatch data are not reliable or do not exist, survey indices arehe only source of information to assess the state of a fishery,nd can be used for such (Pennington and Strømme, 1998;orsbrekke et al., 2001). When there are good catch statis-
ics and the age composition of the population is known,he virtual population analysis (VPA) is frequently used tossess the fishery. In these circumstances, the survey datare used to calibrate this model (Shepherd, 1999). In bothases, with and without catch data, the indices of abundancet age show the trend in the evolution of the population and
∗ Corresponding author. Tel.: +34 986 492111; fax: +34 986 498626.E-mail addresses: [email protected] (S. Cervino),
[email protected] (F. Saborido-Rey).
the accuracy of these indices determines the quality of theassessment.
Three different approaches have been applied to improvethe quality of the survey results: one is based on the designof the sampling (Gavaris and Smith, 1987; Smith, 1990); thesecond consist of looking for more realistic statistical modelslike log-normal, gamma or delta log-normal to fit the abun-dance distributions (Myers and Pepin, 1990; Pennington,1996; Steffansson, 1996); and the third uses resampling meth-ods like Monte Carlo or bootstrap. Bootstrap methods wereinitially implemented to calculate the standard error of somestatistics that otherwise would be difficult to perform (Efronand Tibshirani, 1993; Manly, 1997) and have been applied tofishery surveys in various studies (Sigler and Fujioka, 1988;Smith and Gavaris, 1993; Smith, 1997; Pennington et al.,2002; Schunute and Haigh, 2003). These three approachesto improve the survey results have focused mainly on theinter-haul errors but less attention has been directed to theintra-haul variability (Lai, 1993; Cotter, 1998; Pennington
165-7836/$ – see front matter © 2006 Elsevier B.V. All rights reserved.
oi:10.1016/j.fishres.2006.03.021
S. Cervino, F. Saborido-Rey / Fisheries Research 79 (2006) 294–302 295
et al., 2002) that arises from sampling of catches to obtainlength and age frequency distributions.
The statistical implications of catch sampling on trawl sur-veys have been studied by Cotter (1998) who found that thevariability due to catch sampling relative to design variabil-ity may be important in some year-classes. On other hand,Pennington et al. (2002), studied the implications of lengthsampling on the accuracy of survey results, showing thatlength is usually over-sampled and a reduction of size samplesfor length can be done without significant lost of accuracy.Similar results were observed for other attributes that arepositively correlated, like stomach contents (Bogstad et al.,1995). It was suggested that in cases where the attributes ofinterest were positively correlated, the best way to improvethe sampling precision is to take a small sample from as manylocations as possible (Pennington and Vølstad, 1994). Giventhe high cost of trawl surveys, a reduction of tow durationcould be a way to save time and perform more stations inorder to improve the quality of the survey as was done byCarlsson et al. (2000).
The objective of this paper is to use bootstrap to isolatethe sources of survey variability and to evaluate alternativesto improve the survey efficiency. First, we performed asimulation to evaluate the possibility of improving theaccuracy of survey results based on the different variabilityon the three sampling processes. This simulation is based onaTsasatoEs
2
2
ts((bottcs(ia
Fig. 1. Flemish Cap: survey area and stratification.
The sample unit is the area over the bottom covered by astandard trawl. A standard trawl is considered to cover 13.5 mwidth, which is the lateral opening attributed to our Lofotengear, and a objective distance of 1.75 nautical miles, as resultsof trawling at 3.5 knots for 30 effective minutes. Given thedifficulties to keep a constant speed at sea during the trawl,starting and finishing positions of each haul are recorded bya GPS with the aim of measuring the trawl distance and stan-dardize catches.
To estimate abundance at age cod, catch sampling followsthree stages in each haul: first, total cod catch is weighted;second, if excessive weight, a random subsample is weightedand selected for length sampling; and third, a sample offish, usually smaller than the length sample, is used for agesampling. This last sample is used to make a global age-length key (ALK). A relatively low number of aged fish isenough to estimate the proportions-at-age at any length ineach haul given the aggregated ALK; the method assumesthat length-at-age relationship is equal in all samplingstations.
2.2. Estimate of abundance at age
The following four equations describe the sweep areamethod used to estimate the indices of abundance at age (I)f
(
reduction of the standard trawl duration from 30 to 20 min.he basic hypothesis of this simulation has been given byeveral authors that propose a reduction on hauls duration asway to gain time to perform more hauls and improve the
urvey accuracy (Pennington and Vølstad, 1994; Carlsson etl., 2000; Pennington et al., 2002). And second, we evaluatedhe importance of catch sampling (length and age sampling)n the accuracy of the indices of abundance at ages. TheU bottom trawl survey on Flemish Cap was used as a casetudy for the cod stock analysis.
. Materials and methods
.1. Flemish Cap survey
The fish catch data sets for this study were obtained fromhe EU survey on Flemish Cap, which has been carried outince 1988 to assess the main commercial species in the areaVazquez, 2002). The survey area is divided into 19 strataFig. 1), following the NAFO specifications as describedy Doubleday (1981); strata boundaries are mainly basedn depth criteria. The stratified random sampling design inhis survey has 120 hauls, allocated by strata proportionallyo their area. The survey area spreads out to 732 m depthovering the whole cod stock distribution, considered a self-ustained population. The survey is carried out in summerJuly) with small temporal differences between years. Fish-ng hauls are performed during daylight, starting at 6 a.m.nd finishing before 10 p.m.
or the Flemish Cap cod:
1) For each haul (h):
[abundance-at-age]h = [abundance-at-length]h[ALK]
(1)

296 S. Cervino, F. Saborido-Rey / Fisheries Research 79 (2006) 294–302
(2) For each haul: to apply the raising factor (r) to the abun-dance at age array:
Ah = rh[abundance-at-age]h (2)
being r the ratio of weight of catch-weight of sample.(3) For each stratum (st): to calculate the mean density (d)
by age:
dst =∑n
h=1Ah∑nh=1sh
(3)
Sh being the trawl surface and n the number of hauls ineach strata.
(4) For all strata: to turn the density of each stratum in abun-dance and to sum the abundance of all strata:
I =∑
st
dstSst (4)
S being the surface of each strata and I the array of indexof abundance at age.
Standard errors of abundance index as calculated in (4)follow the analytical methods for stratified random surveysas described in Cochran (1977), or as applied in fishery sur-veys (Smith, 1996), assuming perfect randomization. Whenthe target variable is abundance-at-age we have to take intoataas
2
b
based on the idea that the distribution of the values on arandom sample is the best estimate of the distribution of thereal population without any other consideration as parametricassumptions. The observed sample of n values, each one withprobability 1/n is used to model the unknown real populationby resampling with replacement of size n (Manly, 1997). Theobjective is to simulate a high number of pseudosamples fromthe original sample. The distribution of the parameter esti-mated in each one of the pseudosamples is used to estimatetheir statistical properties. In our case the parameters of inter-est are the array of abundances-at-age. Their standard errorand confidence intervals can be estimated, but also the depen-dence between ages observed in each simulation can be usedto calculate their covariance matrix.
All sample units must have the same probability of beingchosen for an adequate bootstrap. In stratified random designsthe sample unit has the same probability within each stratumbut different strata may have different sampling intensities;this implies that resampling has to be applied independentlyin each stratum. This stratified resampling scheme is appliedindependently either to the design of hauls and also to theALK, since age sampling for ALK in our survey follows anstratified scheme with a target random sample of 10 individ-uals in each 1 cm stratum.
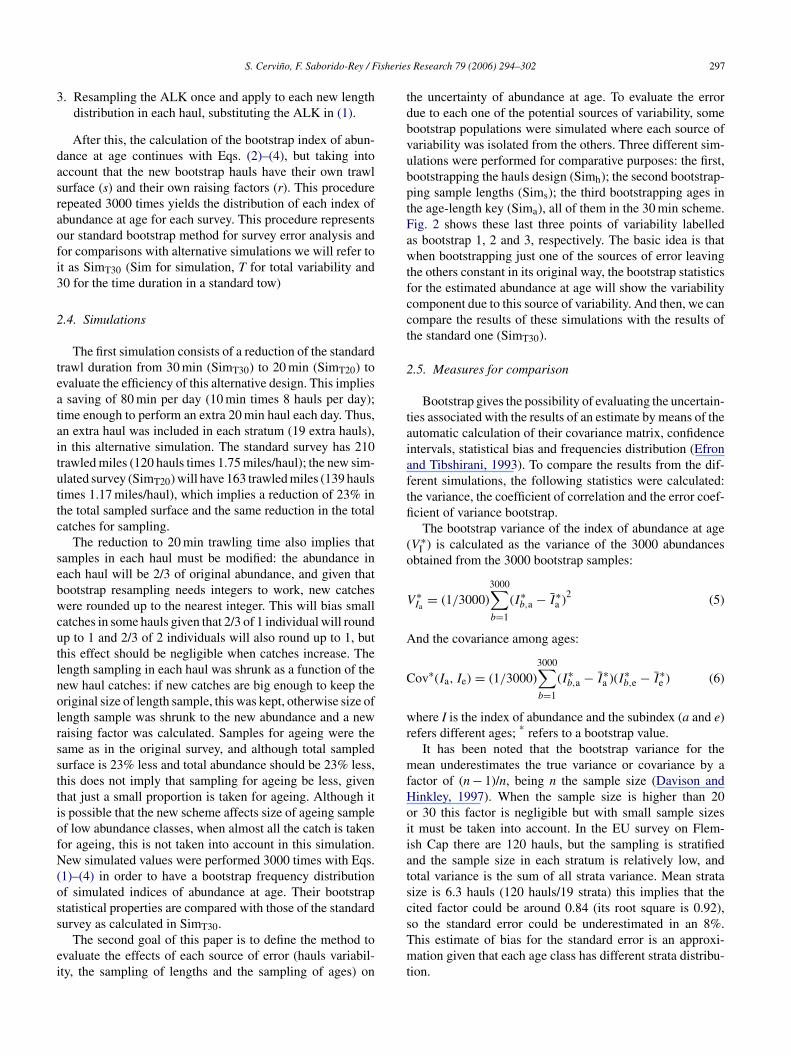
The resampling procedure follows the sampling scheme(Fig. 2), with three different resampling stages:
1
2
F s the sal resamplb
ccount that there is an additional random component due tohe catch sampling, i.e. sampling for sizes and sampling forges. If we like to analyse the variability of abundance-at-ge by bootstrap we have to take into account the three stageampling procedure: hauls, sizes and ages.
.3. Bootstrap procedure and errors in abundance at age
Errors in numbers at age in each year were calculatedy bootstrapping. Bootstrap is a robust statistical method
ig. 2. Sampling and bootstrap scheme. The bootstrap procedure (B) followevels in the sampling of indices of abundance at age. Bootstrap 1 is theootstrap 3 is age-length key resampling.
. Resampling hauls by strata with replacement keeping theoriginal number of hauls in each stratum. A new haulsdistribution is produced for each stratum.
. Resampling with replacement on the length distributionsof every new haul giving the same probability to everymeasurement and keeping the numbers of measurementsin each new haul. The new length distribution substitutesthe lengths array in (1).
mpling scheme (A) and it has three bootstrap levels equivalent to the threeing of hauls by strata; bootstrap 2 is the size distribution resampling and
S. Cervino, F. Saborido-Rey / Fisheries Research 79 (2006) 294–302 297
3. Resampling the ALK once and apply to each new lengthdistribution in each haul, substituting the ALK in (1).
After this, the calculation of the bootstrap index of abun-dance at age continues with Eqs. (2)–(4), but taking intoaccount that the new bootstrap hauls have their own trawlsurface (s) and their own raising factors (r). This procedurerepeated 3000 times yields the distribution of each index ofabundance at age for each survey. This procedure representsour standard bootstrap method for survey error analysis andfor comparisons with alternative simulations we will refer toit as SimT30 (Sim for simulation, T for total variability and30 for the time duration in a standard tow)
2.4. Simulations
The first simulation consists of a reduction of the standardtrawl duration from 30 min (SimT30) to 20 min (SimT20) toevaluate the efficiency of this alternative design. This impliesa saving of 80 min per day (10 min times 8 hauls per day);time enough to perform an extra 20 min haul each day. Thus,an extra haul was included in each stratum (19 extra hauls),in this alternative simulation. The standard survey has 210trawled miles (120 hauls times 1.75 miles/haul); the new sim-ulated survey (SimT20) will have 163 trawled miles (139 haulstimes 1.17 miles/haul), which implies a reduction of 23% intc
sebwcutlnolrssttiofN(oss
ei
the uncertainty of abundance at age. To evaluate the errordue to each one of the potential sources of variability, somebootstrap populations were simulated where each source ofvariability was isolated from the others. Three different sim-ulations were performed for comparative purposes: the first,bootstrapping the hauls design (Simh); the second bootstrap-ping sample lengths (Sims); the third bootstrapping ages inthe age-length key (Sima), all of them in the 30 min scheme.Fig. 2 shows these last three points of variability labelledas bootstrap 1, 2 and 3, respectively. The basic idea is thatwhen bootstrapping just one of the sources of error leavingthe others constant in its original way, the bootstrap statisticsfor the estimated abundance at age will show the variabilitycomponent due to this source of variability. And then, we cancompare the results of these simulations with the results ofthe standard one (SimT30).
2.5. Measures for comparison
Bootstrap gives the possibility of evaluating the uncertain-ties associated with the results of an estimate by means of theautomatic calculation of their covariance matrix, confidenceintervals, statistical bias and frequencies distribution (Efronand Tibshirani, 1993). To compare the results from the dif-ferent simulations, the following statistics were calculated:tfi
(o
V
A
C
wr
mfHoiiatscsTmt
he total sampled surface and the same reduction in the totalatches for sampling.
The reduction to 20 min trawling time also implies thatamples in each haul must be modified: the abundance inach haul will be 2/3 of original abundance, and given thatootstrap resampling needs integers to work, new catchesere rounded up to the nearest integer. This will bias small
atches in some hauls given that 2/3 of 1 individual will roundp to 1 and 2/3 of 2 individuals will also round up to 1, buthis effect should be negligible when catches increase. Theength sampling in each haul was shrunk as a function of theew haul catches: if new catches are big enough to keep theriginal size of length sample, this was kept, otherwise size ofength sample was shrunk to the new abundance and a newaising factor was calculated. Samples for ageing were theame as in the original survey, and although total sampledurface is 23% less and total abundance should be 23% less,his does not imply that sampling for ageing be less, givenhat just a small proportion is taken for ageing. Although its possible that the new scheme affects size of ageing samplef low abundance classes, when almost all the catch is takenor ageing, this is not taken into account in this simulation.ew simulated values were performed 3000 times with Eqs.
1)–(4) in order to have a bootstrap frequency distributionf simulated indices of abundance at age. Their bootstraptatistical properties are compared with those of the standardurvey as calculated in SimT30.
The second goal of this paper is to define the method tovaluate the effects of each source of error (hauls variabil-ty, the sampling of lengths and the sampling of ages) on
he variance, the coefficient of correlation and the error coef-cient of variance bootstrap.
The bootstrap variance of the index of abundance at ageV ∗
I ) is calculated as the variance of the 3000 abundancesbtained from the 3000 bootstrap samples:
∗Ia
= (1/3000)3000∑b=1
(I∗b,a − I∗
a )2 (5)
nd the covariance among ages:
ov∗(Ia, Ie) = (1/3000)3000∑b=1
(I∗b,a − I∗
a )(I∗b,e − I∗
e ) (6)
here I is the index of abundance and the subindex (a and e)efers different ages; * refers to a bootstrap value.
It has been noted that the bootstrap variance for theean underestimates the true variance or covariance by a
actor of (n − 1)/n, being n the sample size (Davison andinkley, 1997). When the sample size is higher than 20r 30 this factor is negligible but with small sample sizest must be taken into account. In the EU survey on Flem-sh Cap there are 120 hauls, but the sampling is stratifiednd the sample size in each stratum is relatively low, andotal variance is the sum of all strata variance. Mean strataize is 6.3 hauls (120 hauls/19 strata) this implies that theited factor could be around 0.84 (its root square is 0.92),o the standard error could be underestimated in an 8%.his estimate of bias for the standard error is an approxi-ation given that each age class has different strata distribu-
ion.

298 S. Cervino, F. Saborido-Rey / Fisheries Research 79 (2006) 294–302
Coefficient of correlation is calculated as[cov(a, b) /(σaσb)]. Note that since bootstrap varianceand covariance underestimate their true values in a factor of(n − 1)/n, the bootstrap correlation is equally biased in thenumerator and the denominator and are not affected by thesmall sample problem as it happens with mean variance.Theerror coefficient of variance bootstrap (ECVB) is calculatedas follows:
ECVBy,a = 1
Iy,a
(∑3000b=1 (I∗
b,y,a − Iy,a)2
3000
)1/2
(7)
The ECVB is a measure of the ratio of root mean squareerror on the estimated deterministic abundance; the rootmean square error measures the average variation in thebootstrap abundance (I*) relative to the deterministic abun-dance (I). Note that square differences measures the dif-ferences between bootstrap abundance indices (I*) and thedeterministic abundance (I), not the mean bootstrap abun-dance (I∗). The difference between I and I∗ is a boot-strap estimate of bias (Efron and Tibshirani, 1993), sothis root mean square error is the same as the standarderror for any unbiased estimator but, if the estimator isbiased ECVB measures the accuracy, i.e. precision and biastogether. This is useful to compare estimators with differentb
3. Results
Abundances at age estimated by the swept area method(Eqs. (1)–(4)) for SimT30, the standard case, are shown inTable 1 (upper panel) together with the bootstrap results: errorcoefficient of variance bootstrap (middle panel) and correla-tion (lower panel). Abundance at age 1 is at the lowest levelsince 1996 and, consequently, the abundance in recent yearsis also low. ECVB values oscillate between 0.1 and 1.3. Atfirst glance it is observed that this high difference in ECVBmay be related with the levels of abundance: the lower theabundance the higher the ECVB. The coefficient of correla-tion in Table 1 (lower panel) shows the correlation betweenconsecutive ages. Correlations between other ages may bealso important but it was shown that the higher correlationsmanly occur between consecutive ages and for simplicity wedecided present only these values. Although in recent yearscorrelations are low, the bootstrap results show high positivecorrelations with frequent values higher than 0.5, especiallyin the former years.
Table 2 shows an analysis of the relationship betweenabundance and error (ECVB) by age class. A linear regres-sion of log abundance-at-age on ECVB for every age classwas performed. The corresponding t-test was presented forevery estimated slope. The slope for the linear regression oflog abundance on ECVB shows negative values for all ages.T
TA r coeffif
A 199
A3138
24545
1
1
E4841243140482835
C094566
ias.
able 1bundance (in thousands) of cod in Flemish Cap by swept area method; erro
or consecutive ages
ges 1988 1989 1990 1991 1992 1993
bundance (in thousands)1 4644 20803 2492 137814 71190 43642 72082 11028 11937 25600 37060 1322373 39819 84280 4755 15381 4748 284034 10585 49149 15469 1928 2033 10105 1171 18571 14660 6283 332 12696 177 1270 4298 1674 1255 1687 224 157 350 296 222 4918 65 140 159 71 12 100
rror coefficient of variance bootstrap (ECVB)1 0.31 0.15 0.22 0.33 0.21 0.2 0.16 0.16 0.13 0.18 0.26 0.3 0.13 0.14 0.14 0.21 0.33 0.4 0.20 0.11 0.15 0.19 0.42 0.5 0.31 0.14 0.15 0.24 0.52 0.6 0.33 0.19 0.15 0.23 0.36 0.7 0.31 0.31 0.26 0.23 0.37 0.8 0.53 0.49 0.41 0.42 1.02 0.
oefficient of correlation1–2 0.65 0.74 0.24 0.82 0.55 0.2–3 0.34 0.37 0.54 0.28 0.88 0.3–4 0.77 0.5 0.59 0.56 0.12 0.
4–5 0.37 0.71 0.44 0.69 0.88 0.785–6 0.63 0.62 0.72 0.81 0.86 0.786–7 0.35 0.06 0.67 0.46 0.67 0.627–8 0.25 0.38 0.59 0.12 0.08 0.17he t-test shows that all the estimated slopes are significantly
cient of variance bootstrap (ECVB) and coefficient of correlation bootstrap
4 1995 1996 1997 1998 1999 2000 2001
47 1546 39 39 25 6 172 45235 11365 2964 139 76 78 13 165199 1238 6131 3146 85 102 276 662 3595 820 4360 1137 105 170 10820 885 2247 358 1449 655 84 7066 33 187 902 73 415 405 4
7 25 8 20 144 19 161 14818 0 6 0 0 6 11 86
0.20 0.24 0.53 0.58 0.60 1.24 0.24 0.300.41 0.44 0.13 0.37 0.42 0.42 1.05 0.110.30 0.23 0.21 0.25 0.32 0.44 0.48 1.270.28 0.21 0.21 0.19 0.12 0.38 0.28 0.370.38 0.24 0.17 0.21 0.14 0.19 0.33 0.380.46 0.52 0.25 0.14 0.35 0.17 0.20 1.141.18 0.65 1.10 0.61 0.30 0.67 0.26 0.290.34 1.35 1.24 0.92 0.34
0.17 0.39 0.33 0.36 0 −0.1 −0.04 −0.170.38 0.74 0.3 0.52 0.17 −0.05 0.55 0.060.7 0.51 0.77 0.9 0.17 0.55 0.53 0
0.47 0.7 0.67 0.64 0.52 0.63 0.35 0.060.19 0.21 0.32 0.35 0.36 0.50 0.37 0.010.11 −0.04 −0.02 0.10 0.14 −0.05 0.41 0.06−0.02 −0.03 −0.03 0.12 0.26

S. Cervino, F. Saborido-Rey / Fisheries Research 79 (2006) 294–302 299
Table 2Statistics for linear regression slope of log abundance on ECVB by age class
Age Slope S.D. t-Student Prob(>|t|)1 −0.151 0.043 −3.509 0.00432 −0.121 0.044 −2.727 0.01843 −0.190 0.042 −4.485 0.00074 −0.081 0.027 −2.996 0.01125 −0.098 0.034 −2.843 0.01486 −0.275 0.050 −5.559 0.00017 −0.467 0.051 −9.178 0.00008 −0.654 0.061 −10.749 0.0000
different from zero. The negative relationship between abun-dance and their error occurs at all ages.
3.1. Effects of tow time reduction
Abundance at age as calculated from SimT20 was esti-mated as bootstrap average. Given that the population inSimT20 is the original population, it should be expected thatestimated abundance at age is the same as the original one;nevertheless some differences are observed at low abun-dance levels (Fig. 3, left panel). Each point represents a valueof abundance at age. These abundance differences, rangingamong −5% and 10%, can be explained as a result of theround up procedure in hauls with just a few fish. Neverthe-less, when estimated abundance increases SimT20 abundancematches SimT30. This means that the 20 min simulation per-forms suitably.
The right panel in Fig. 3 shows the relative effi-ciency of SimT20 regarding to SimT30 (% reduction ofECVB) that was calculated as 100 × (ECVB(SimT20) −ECVB(SimT30))/ECVB(SimT30). The precision of SimT20does not improve the quality of sampling results at low abun-dance levels: the efficiency moves between −5% and 5%for abundances lower than 100 thousands (5 in log scale),but efficiency with higher abundances is always superior inSSw
Fig. 4. Error coefficient of variance bootstrap (ECVB) grouped by abun-dance ranges. Black lines represents ECVB total as calculated from SimT30
and black points are ECVB hauls as calculated from Simh.
3.2. The role of catch sampling variability
A first consideration regarding to the different sources ofvariability on the indices of abundance at age, is whether theinclusion of catch-sampling variability modifies the percep-tion of the estimated error in indices of abundance at age.To address this question, the ECVB in SimT30, where all thesources of variability are taking into account, was comparedwith the ECVB due to hauls design (Simh), where catch sam-pling variability was not considered. Fig. 4 shows the resultsof this comparison, where it can be observed that the differ-ences in error are also dependent on abundance: when theabundance increases, this difference decreases. The meanvalues are 0.35 for ECVB in hauls against 0.48 for ECVBtotal; these differences are mainly due to the catch samplingvariability at low abundance levels. ECVB is practically thesame for abundances higher than 6 (in log scale), meaningthat catch-sampling errors are negligible at this level. Fur-thermore, the minimum abundance level needed to get ECVBstability in the SimT30 is raised at 5.5–6, meanwhile in SimhECVB stability is achieved at 4.5–5. The catch samplingincreases the error of indices of abundance at age and thisincrease mainly occurs at low abundance levels.
ce (left
imT20, and it reaches −10% in some cases. In general,imT20 improves the standard survey efficiency (SimT30)ith an average value of 5% in ECVB.
Fig. 3. Abundance of SimT20 relative to SimT30 standard abundan
panel) and efficiency of SimT20 relative to SimT30 (right panel).
300 S. Cervino, F. Saborido-Rey / Fisheries Research 79 (2006) 294–302
Fig. 5. Relative variance from each variability source: hauls (Simh), sam-pling of size (Sims) and sampling of ages (Sima) regarding to the totalvariance (SimT30).
The participation of each variability source (hauls, lengthsand ages) is better understood if it is expressed in termsof variance, given its additive properties assuming indepen-dency. Abundance variances were calculated from the foursimulations (SimT30, Simh, Sims and Sima) for each age andeach year. Average variance was calculated for abundancegroups and scaled to the total variance (SimT30). If the threeprocesses are independent, the sum of their relative varianceswill be 100. Fig. 5 shows the results of this analysis where it isobserved that length sampling and age sampling are responsi-ble of more than half of the variance at low abundance levels(lower than 5 in log scale), but they are less important at highabundance. The mean variance for all the data (the bar in theright side in Fig. 5) shows the mean participation of the threeprocedures: hauls, length and ages, with 67%, 16% and 14%,respectively, and an unexplained 3%.
In general, it can be said with respect to survey errors thatcoefficients of variance are higher at low abundance levelsand the inclusion of catch sampling variability leads to anincrease of these errors, specially at low abundance, wherethe catch sampling variance are more than a half of the totalvariance. It could be argued than the relation between abun-dance and error could be due to age dependent effects likehigh catches of young fish in just one station, neverthelessTable 2 shows than this relationship occurs at every age.
4
et1uaT
strata; the number of samples by stratum may be consideredsmall. A correction can be derived to obtain a consistent esti-mate of the bootstrap standard error, and it was observed thatthis error for the Flemish Cap cod is approximately 8% lessthan the analytical one. This bias depends on the number ofhauls by stratum and can be quantified and applied to correctthe variance estimate. With respect to the relative participa-tion of each source of variability, it should be taking intoaccount that the bootstrap variance estimation for the threesampling processes does not sum up exactly the total boot-strap variance. This could be due to a fault of independenceamong the processes, bias in bootstrap estimators, the lackof exactitude in bootstrap methods or a combination of thesethree causes. More work is needed to clarify this question, buttaking into account these limitations, the method provides aview about the relative participation of the different samplingprocesses on the abundance at age variance.
4.1. Effects of tow duration
The objective of any trawl survey is to estimate the abun-dance at age with maximum accuracy, but also at the lowestpossible cost. The obvious way to improve the quality of anysurvey is to increase the sample size, but this is not easy whendealing with complex designs. To know how the sampling atdifferent stages affects the variability of the results will allowisoaiddocuisuettshctlbtasnihsi
. Discussion
Bootstrap methods may be useful to estimate samplingrrors. However, an important consideration is the bias dueo small sample size (Davison and Hinkley, 1997; Smith,997). Stratified designs for trawl surveys are usually madep of a high number of strata and, given the cost of samplingt the sea, it is common that each stratum has just a few hauls.he EU Flemish Cap survey is based on 120 hauls over in 19
dentifying the key and sensitive stages. Thus, an alternativeampling scheme can be developed to improve the precisionf the estimates reducing the error and the uncertainty. At lowbundance levels, the whole survey catch of Flemish Cap cods sampled for both length and age distribution. At high abun-ance levels, however, a subsample is taken for length and ageistribution. Nevertheless, the participation of catch samplingn the total variance is relatively low, and little improvementan be expected when increasing the sampling size. In this sit-ation the only way to improve the quality of survey resultss increasing the number of hauls. Apart from the cost ofampling, the time for survey is also limited by the sched-le of the vessel. Given that short tows are, in general, morefficient than long tows (Gunderson, 1993), the reduction ofow duration may result in an extra time to perform moreows, and although the total catch would be lower, the preci-ion of survey results may improve. Pennington et al. (2002)ave showed that given that haul catch is a cluster where fishaught together tend to have more similar characteristics thanhose in the entire population, the effective sample size forength estimates use to be much smaller than the usual num-ers of fish sampled during a survey. If correlations betweenhe studied variables (sizes or ages) are highly positive thenn increasing in the sample size does not improve the preci-ion of this variable as should be expected; on the other hand,egative correlations will have opposite results. Correlationsn Flemish Cap cod abundance at age are mainly positive andigh (Table 1), this means that a reduction of length and ageamples will have less effect in accuracy than if they werendependent.

S. Cervino, F. Saborido-Rey / Fisheries Research 79 (2006) 294–302 301
The results of a simulation based on the EU Flemish Capsurvey and cod abundance at age, with a reduction on thetrawl duration and with an extra haul at each stratum, areclear: at low abundance the errors may increase but whenabundance increases the error reduces up to 10% in somecases; in general the mean errors decrease 5%. This supportthe idea that the reduction of time duration and the increase innumber of hauls is an effective way to improve the accuracyof abundance at age, even when total survey area (and totalcatches) have been reduced. The limit of shortness of trawlingtime is given by our ability to determine with accuracy thetime between the bottom contact of the trawl and the trawllifting off the bottom, i.e. the effective duration of the haul.Some studies have shown that there can be a reduction ontow duration down to 15 or 10 min without lost of precision(Pennington and Vølstad, 1994; Carlsson et al., 2000).
The method developed to evaluate this alternative sam-pling scheme may be useful to evaluate some other samplingdesigns taking into account reductions in sampling of ages orsizes; changes in the strata design or in the allocation of haulsin each stratum, etc. In general the method may be seen as asurvey simulator that allows improving the survey design. Asimilar survey simulator was presented by Schnute and Haigh(2003) although in that case the simulator is parametric anddoes not take into account the intra-haul variability due tosampling of size and ages.
4
doseltbaajtdcb
coibtsavaio
bootstrap underestimates standard errors as the sample sizedecreases, the improvement given by SimT20 will be evenhigher.
5. Conclusion
The proposed method, as an approach to isolating the dif-ferent variability sources in abundance-at-age indices, hasshowed that intra-haul variability due to length and agevariability is an important component in abundance-at-ageerrors, especially at low abundance levels and should be takeninto account when trying to improve the survey efficiency.The method, as an approach to check alternative samplingschemes has showed that survey efficiency may be improvedif saved time is used to perform extra hauls. The work hasbeen made in a monospecific basis using the Flemish Capcod as an example, nevertheless for surveys with many targetspecies all of them should be evaluated together to provide auseful answer. Taking into account this limitation, the surveysimulator may be a useful tool to check alternative samplingschemes like strata design, haul allocation, size sampling forage or length, etc.
Acknowledgements
capN
R
B
C
C
C
D
D
E
G
G
K
.2. The uncertainty in catch sampling
However, the efficiency of a any new survey schemeepends on the relative participation of every sampling stagen the final error. Our results show that the effects of the catchampling variability are more evident at low abundance lev-ls, and given that coefficients of variance are also higher atow levels, the inclusion of catch sampling variability leadso larger differences. An explanation for this behaviour coulde found in the sampling scheme: when the abundance of ange class is low, the sample size for length distribution andgeing is also low, and its error increases. The sample may beust one individual in extreme cases. This problem is impor-ant for the Flemish Cap cod sampling because, being this aepleted stock, the recruitment is at a very low level and it isommon that abundance in some year classes is determinedy just a few individuals, particularly in recent years.
The improvement in efficiency in the 20 min simulationan also be explained in terms of the relative participationf the three sampling stages on the total variability. Variabil-ty at low abundance levels is shared more or less equallyetween the three sources of variability, and the increase inhe number of hauls (one in each stratum) does not compen-ate for the reduction of trawl surface. Nevertheless, whenbundance increases up to 100 thousands (5 in log scale) andariability due to hauls is the main responsible on total vari-nce, the increase of just a haul in each stratum is enough tomprove the efficiency of the new sampling scheme, in spitef a reduction of 23% in the survey catch. Furthermore, since
We are grateful to A. Vazquez and D. Garabana for hisomments. We also would like to thank the comments by twononymous referees. This study was supported by the Euro-ean Commission (DG XIV, Study 00/028) and the Spanishational Research Council (CSIC).
eferences
ogstad, B.M., Pennington, M., Vølstad, J.H., 1995. Cost-efficient surveydesigns for estimating food consumption by fish. Fish. Res. 23, 37–46.
arlsson, D., Kanneworff, P., Folmer, O., Kingsley, M., Pennington, M.,2000. Improving the West Greenland trawl survey for shrimp (Pan-dalus borealis). J. Northw. Atl. Fish. Sci. 27, 151–160.
ochran, W.G., 1977. Sampling Techniques. John Wiley and Sons, NewYork.
otter, A.J.R., 1998. Method for estimating variability due to samplingof catches on trawl survey. Can. J. Fish. Aquat. Sci. 55, 1607–1617.
avison, A.C., Hinkley, D.V., 1997. Bootstrap Methods and their Appli-cation. Cambridge University Press, Cambridge.
oubleday, W.G., 1981. Manual on groundfish survey in the NorthwestAtlantic, NAFO Sci. Counc. Stud., no. 2.
fron, B., Tibshirani, R.J., 1993. An Introduction to the Bootstrap. Chap-man and Hall, London.
avaris, S., Smith, S.J., 1987. Effect of allocation and stratification strate-gies on precision of survey abundance estimates for Atlantic cod(Gadus morhua) on the Eastern Scotian. J. Northw. Atl. Fish. Sci.7, 137–144.
underson, D.R., 1993. Survey of Fisheries Resources. John Wiley andSons, New York.
orsbrekke, K., Mehl, S., Nakken, O., Pennington, M., 2001. A survey-based assessment of the Northeast Artic cod stock. ICES J. Mar. Sci.58, 763–769.

302 S. Cervino, F. Saborido-Rey / Fisheries Research 79 (2006) 294–302
Lai, H.-L., 1993. Optimal sampling design using the age-length key toestimate age composition of a fish population. Fish. Bull. 92, 382–388.
Manly, B.F.J., 1997. Randomization Bootstrap and Monte Carlo Methodsin Biology, 2nd ed. Chapman and Hall, London.
Myers, R.A., Pepin, P., 1990. The robustness of lognormal-based estima-tors of abundance. Biometrics 46, 1185–1192.
Pennington, M., 1996. Estimating the mean and variance from highlyskewed marine data. Fish. Bull. 94, 498–505.
Pennington, M., Strømme, T., 1998. Survey as a research tool for man-aging dynamic stocks. Fish. Res. 37, 97–106.
Pennington, M., Vølstad J.H., 1994. Assessing the effect of intra-haul cor-relation and variable density on estimates of population characteristicsfrom marine surveys. Biometrics 50, 725–732.
Pennington, M., Burmeister, L.-M., Hjellvik, V., 2002. Assessing the pre-cision of frequency distributions estimated from trawl-survey samples.Fish. Bull. 100, 74–80.
Schnute, J.T., Haigh, R., 2003. A simulation model for designing ground-fish trawl surveys. Can. J. Fish. Aquat. Sci. 60, 640–656.
Shepherd, J.G., 1999. Extended survivor analysis: an improved methodfor the analysis of catch-at-age data and abundance indices. ICES J.Mar. Sci. 56, 584–591.
Sigler, M.F., Fujioka, J.T., 1988. Evaluation of variability in sablefish,Anoploma fimbria, abundance indices in the gulf of Alaska using thebootstrap method. Fish. Bull. 86, 445–452.
Smith, S.J., 1990. Use of statistical models for the estimation of abun-dance from groundfish trawl survey data. Can. J. Fish. Aquat. Sci.47, 894–903.
Smith, S.J., 1996. Analysis of data from bottom trawl surveys. NAFOSci. Coun. Stud. 28, 25–54.
Smith, S.J., 1997. Bootstrap confidence limits for groundfish trawl surveyestimates of mean abundance. Can. J. Fish. Aquat. Sci. 54, 616–630.
Smith, S.J., Gavaris, S., 1993. Evaluating the accuracy of projected catchestimates from sequential population analysis and trawl survey abun-dance estimates. In: Smith, S.J., Hunt, J.J., Rivard, D. (Eds.), RiskEvaluation and Biological Reference Points in Fisheries Management,vol. 120. Can. Spec. Publ. Fish. Aquat. Sci., pp. 163–172.
Steffansson, G., 1996. Analysis of groundfish survey abundance data:combining the GLM and delta approaches. ICES J. Mar. Sci. 53,577–588.
Vazquez, A. MS 2002. Results from bottom trawl survey on Flemish Capof July 2001. NAFO SCR Doc. 02/12. p. 43.
Copyright © 2022 FDOKUMEN