Taste sensitivity and aesthetic preferences: Is taste only a metaphor?
ORIGINAL PAPER
Using one-dimensional (1D) and two-dimensional (2D)quantitative proton (1H) nuclear magnetic resonancespectroscopy (q NMR) for the identification and quantificationof taste compounds in raw onion (Allium cepa L.) bulbsand in aqueous solutions where onion tissues are soaked
Audrey Tardieu & Walter De Man & Hervé This
Received: 30 June 2010 /Revised: 21 September 2010 /Accepted: 25 September 2010 /Published online: 23 October 2010# Springer-Verlag 2010
Abstract Solutions obtained by soaking onion (Alliumcepa L.) bulbs samples in water are frequently consumed,either directly or as part of dishes, both at home or in thefood industry. However, little information is availableregarding the extracted metabolites and the extractionmechanisms. In this article, the composition of raw onionextracts and of aqueous solutions where raw onion tissueswere soaked was investigated directly by quantitativeproton nuclear magnetic resonance spectroscopy (q 1HNMR). The assignment of NMR signals was performed,with less than 3% (in area) of unidentified peaks. Analysesof one-dimensional 1H NMR spectra with additional two-dimensional NMR studies showed 20 regions of interestwhere 3 saccharides, 17 amino acids, and 5 organic acidswere detected and quantified. Resonance assignment withchemical shift was done for each saccharide, as well as foreach amino acid and organic acid, with additional work onspin–spin coupling pattern and on observed and notobserved correlations from correlation spectroscopy studies.
Quantification of saccharides was performed and qualifiedby works on peak decomposition algorithms. Complemen-tary studies by high-performance liquid chromatography,mass spectroscopy and tandem mass spectroscopy, and thinlayer chromatography and preparative layer chromatogra-phy were carried out in order to validate the NMR resultson identification.
Keywords Taste . Quantitative 1H NMR . Allium cepa L. .
Saccharides . Amino acids . Organic acids
Introduction
Most human food is based on plant tissues, animaltissues and liquids prepared from them, includingaqueous solutions obtained by thermal processing ofplant or animal tissues in water (“stocks”, “sauces”…).Of course, food is consumed for energy, but the selectionof food products is also based on flavor, i.e., thesynthetic sensation including taste as one component[1]. Molecules contribute to taste by linking to tastereceptors from cells in taste buds [2] but before reachingtaste buds, they have to dissolve in water, as they mustfirst migrate from food to saliva.
Onions (Allium cepa L.) being among the most widelydistributed Liliaceous plants in the world [3] and one of themain vegetables consumed in Europe [4], their content intaste compounds was investigated by many authors [3, 5–9]. They are used either directly as vegetable, or as aseasoning for a wide variety of food preparations [10]. Inboth cases, only the bulbous roots (also called the bulb) areused [11].
A. Tardieu :H. This (*)INRA, Groupe de Gastronomie Moléculaire,UMR 1145, 16 rue Claude Bernard,75005 Paris, Francee-mail: [email protected]
W. De ManMars Food Belgium,Industrielaan 7,2250 Olen, Belgium
H. ThisAgroParisTech, Laboratoire de chimie analytique,16 rue Claude Bernard,75005 Paris, France
Anal Bioanal Chem (2010) 398:3139–3153DOI 10.1007/s00216-010-4255-x
Among water-soluble molecules from plant tissues,saccharides, amino acids, and organic acids are the mostabundant [12]. Onion bulbs are also rich in flavonols andflavonol glycosides (mainly quercetin and kaempferol) thatcontribute to their significant antioxidant properties [13, 14].Being storage organs, saccharides account for a major part oftheir dry matter, contributing to as much as 64 to 80 % of themass of dry matter [15]. Non-structural saccharides aremainly glucose (Glc), fructose (Fru), sucrose (Suc), andfructo-oligosaccharides (FOS), i.e., fructosyl polymers (GFx)with degrees of polymerization x up to 12 [8, 16–19], themain FOS being GF2 and GF3. Indeed, it was determinedthat 1-kestose (1F-β-D-fructofuranosyl (2R,3R,4S,5S,6R)-2-((2S,3S,4S,5R)-3,4-dihydroxy-2,5-bis(hydroxymethyl)tetra-hydrofuran-2-yloxy)-6-(hydroxymethyl)tetrahydro-2 H-py-ran-3,4,5-triol), Kes, one GF2), neokestose (6G-β-D-fructofuranosyl (2R,3R,4S,5S,6R)-2-((2S,3S,4S,5R)-3,4-dihy-droxy-2,5-bis(hydroxymethyl)tetrahydrofuran-2-yloxy)-6-(hydroxymethyl)tetrahydro-2H-pyran-3,4,5-triol, one GF2),nystose (1F(1-β-D-fructofuranosyl)2 (2R,3R,4S,5S,6R)-2-((2S,3S,4S,5R)-3,4-dihydroxy-2,5-bis(hydroxymethyl)tetrahydrofuran-2-yloxy)-6-(hydroxymethyl)tetrahydro-2H-pyran-3,4,5-triol), Nys, one GF3), and total fructans represent0.33, 0.99, 0.16, and 3.43 g/100 g of fresh tissue,respectively [3]. However, the non-structural saccharidecomposition vary significantly among different cultivars:the mean concentration of fructans was found to be equal to49.1 and 6.9 mg/g of fresh weight for Pukekohe Longkeeperand Houston Grano varieties, respectively [6].
The free amino acid content in onion tissues variesalso considerably in onion bulbs [19], arginine andglutamic acid being the most abundant, with 0.56 and0.30 g/100 g of fresh tissue for arginine and glutamic acid,respectively; threonine can also be detected in significantamounts [20].
Many analytical methods [21–23] can detect saccharides,amino acids, and other taste compounds, but some of thesemethods allow only indirect identification (retention factorRf, in chromatographic methods), and this is why they arefrequently associated with identification methods such asmass spectrometry (MS). Another interesting method foridentification of water-soluble compounds is high-resolutionnuclear magnetic resonance (NMR) spectroscopy [24], as allcompounds are detected in one single analysis with minimalsample preparation. It is a powerful, non-destructive, andselective tool for plant metabolite analysis [25].
For example, identification of synthetic and onionflavonoids through their silylation and 29Si NMRspectroscopy—line assignment through 29Si–13C spin–spin couplings was evaluated [26]. Also, one-dimensional (1D) NMR spectroscopy has been usedextensively to profile metabolites in mango [27], lettuceleaves [28], tomato [29], tomato juice [30], beer [31], wine
[32], carrot stocks [12]. However, 1H NMR spectra ofextracts of plants often contain overlapping signals ofsome of the metabolites present in the solution. Two-dimensional (2D) NMR spectroscopy is an easy comple-mentary method for the analysis of the components withoverlapped peaks and for validation of the results of the1D NMR studies [22].
In our general framework of the development of fastanalytical methods of complex systems, we wanted to useboth techniques in order to see if it was possible to identifyand quantify simultaneously the major taste compounds incrushed raw onion and also in aqueous solutions whereonion bulb dice where soaked, as is common practice inkitchens [33]. In order to validate our results, comparisonswere performed with others techniques such as high-performance liquid chromatography (HPLC), mass spec-troscopy (MS and MS/MS), and thin layer chromatography(TLC and PLC).
Materials and methods
All products, samples and hardware used were precisely(± 0.0001 g) weighed at each analytical step. All experi-ments were replicated three times.
Chemicals for NMR studies
D2O: deuterium oxide, 99.9 atom % D, Sigma Aldrich.DCl: deuterium chloride 20 % in deuterium oxide, isotopeenrichment of 100 %, d=1.189, SDS. Sucrose, forbiochemistry and microbiology, Merck. Glucose: D(+)-glucose, anhydrous for biochemistry, Merck. Fructose: D
(−)-fructose, Sigma Aldrich. 1-Kestose ( > 98.0 %), Fluka.Nystose ( > 98.0 %), Fluka. TSP: 3-(Trimethylsilyl)propionic-2,2,3,3-d4 acid, sodium salt, 98 atom % D,Sigma Aldrich. NaN3: sodium azide, Janssen Chimica,potassium hydrogen phthalate, A.C.S. primary standard,99.95–100.05 %, Sigma Aldrich.
Preparation of soaking solutions
Onion bulbs (Armstrong variety) were grown in Poland in2007 (no data on weather available) and stored untilexperiments at 6 °C (for 6 months). After cutting about1 cm of the top and the bottom of bulbs due to theirdifferent chemical composition [3, 4] and also to reproduceculinary processes [33], the first one or two dry and brownscales, known as papery scales, were removed. In order toensure that homogeneous material was compared, onionbulbs were cut lengthwise into two halves; one was kept forthe experiment on ground raw onion (experiment A), theother was kept for the study on soaking of raw onion dice
3140 A. Tardieu et al.
in aqueous solution (experiment B); any possible sproutswere removed.
For each experiment, halves were cut into parallelepi-peds (1 cm × 1 cm × thickness of the scale). Samples werefrozen in liquid nitrogen and ground using a mortar andpestle. B parallelepipeds were introduced in a 500 mL glassflask with a mass of MilliQ water equal to 3 times the totalmass of onion samples and 0.1 % (w/w) sodium azide (toinhibit bacterial growth [34]). The soaking solution wasmagnetically stirred at room temperature (around 23 °C)and about 25 g of it was sampled after 1 day of soaking.The paste of experiment A and the sample of experiment Bwere centrifuged (10,000 rpm for 10 min at 20 °C); then theliquid part was filtered through 45 μm (6.2 cm2, surfactant-free cellulose acetate membrane and depth filter, MinisartPlus, Sartorius). The limpid liquid was frozen at −24 °C.All experiments were repeated three times.
1H NMR
A Superconducting Ultrashield 300 MHz (7.05 T) 54 mmmagnet system NMR spectrometer BZH 30/300/70 E BrukerBiospin (Germany) was used in this study. 1H NMR spectrawere recorded at 21.0 °C in order to avoid differentmutarotation equilibria [35] for the Glc and Fru present inthe sample. The analysis of each sample was performedusing D2O as an internal lock. Spectra were acquired underan automation procedure (automatic shimming and automat-ic sample loading) requiring about 33 min per sample for 1Dacquisition. Spectra were Fourier-transformed with 0.3 Hzline broadening, automatically and manually phased andbaseline corrected using XWIN NMR software (BrukerBiospin, Karlsruhe, Germany).
– 1D NMR—each spectrum consisted of 64 scans of 32 kdata points with a spectral width of 6172.8 Hz and anacquisition time of 5.3 s, a recycle delay of 25 s perscan and a pulse angle of 90 °, in order to allowcomplete relaxation and absolute quantification [36].
– 2D NMR—COSY sequence was done with 64 scanswith a spectral width of 4006.410 Hz and anacquisition time of 0.25 s, and a recycle delay of 2 s.
NMR sample preparation
The frozen solutions of each sample were freeze-dried(Lyolab A, LSL Secfroid SA, Aclens, Switzerland,—48.8 °C, 1.1 mbar) to eliminate water which may causeNMR signal saturation. Resulting solids were dissolved inD2O and freeze-dried again to eliminate residual water.About 15 mg of the resulting solids were re-dissolved in1 g of D2O and the pH was adjusted to 7.0 using knownamounts of DCl solution in D2O at different appropriate
concentrations in order to avoid chemical shift drift. About700 μL of each sample were introduced in NMR tubes(5 mm glass, Wilmad-Aldrich, USA) and weighed. Ahome-made capillary tube with sodium salt of (trimethyl)propionic-2,2,3,3-d4 acid (TSP) dissolved in D2O (0.2 %,w/w) was introduced inside the tube, for chemical shiftcalibration and for quantification [12].
Identification
Each major sugar was identified by peak assignment of1D 1H NMR spectra using comparisons with 1D 1H NMRspectra from pure compounds and with published data[12, 24, 36, 37].
As many peaks overlapped in the amino acids andorganic acid region (between 1 and 3.5 ppm), identifica-tion was performed using 2D 1H NMR spectra. As COSYacquisitions showed the couplings within three links,couplings between α and β positions (or between β andγ positions, etc.) were visible. Then, to identify thedifferent amino acids and organic acids, one proton waslocated by the theoretical value given in former publica-tions and other peaks were identified by correlationspeaks.
Quantification
As indicated above, TSP was used for quantification. Aspreviously published [12], the same capillary tube of TSPwas introduced in each NMR tube. As TSP has a longrelaxation time (over 25 s) [38], the number of protons thatare used for quantification was calculated by quantifying TSPwith a known concentration solution of potassium hydrogenphthalate, which is a stable and fast relaxing molecule.
Main saccharides quantification was performed withcalibration curves for each compound, as each compoundrelaxes differently. Calibration curves for Glc, Fru, and Sucwere previously established using 1D 1H NMR spectra ofsolutions at different concentrations of a mixture of thethree saccharides in order to take into account possibleinteractions in complex solutions [39].
Previous studies of spectral interpretation (results notshown) showed that the best results were obtained using:the doublet at 5.24 ppm (H1α) for Glc, the multiplet at4.10–4.11 ppm (H4β, H3β, H3α) for Fru, and the doublet at5.42 ppm (H1) for Suc. Saccharide concentrations in eachsample were calculated from concentrations in the NMRtube and soaking solution volume by quantifying the peaksof interest by peak decomposition using the Igor Pro 5.03software. For amino acids and organic acids, many over-lapping peaks prevent the quantification of every com-pound, but some amino acids and organic acidsconcentrations were obtained by direct integration (NMR
Identification and quantification of taste compounds in onions 3141
Notebook 2.50 software) of the corresponding peak orcomplex of peaks (cop).
In order to get a quantitative determination of thevarious compounds, standard solutions at different con-centrations were prepared. For each saccharide consid-ered (Glc, Fru, Suc), a mother solution S0 in D2O wasfirst prepared with a concentration of 75 mg/g. Then fivesolutions (S1 to S5) were made for calibration, each Sisolution being prepared from the solution Si−1 withsuccessive dilution factors of 1/10, 4/10, 1/4, 1/5, 1/10.For each solution, the pH was set to 7 by using solutionsof DCl diluted in D2O (at different percentages). NMRtubes were loaded with 700 μL (weighed) of the solutions.For each solution, three spectra were recorded, the fullexperiment and procedure being repeated entirely for eachspectrum (tubes removed of the spectrometer, then thelocking, shimming, and acquisition process being doneagain).
Validation
Three techniques were used for the validation of theidentification of the components (especially the mainFOS, Kes and Nys) of onion extracts by NMR, such asHPLC, MS, TLC, and PLC.
HPLC
Samples of solutions where raw onion dice were soakedwere analyzed using a Phenomenex RHM column formonosaccharides. The solvent was MilliQ water (flow rate600 μL/min), injected in the column by a pump workingaround 100 psi. The detector was a refractometer. Xylitol((2R,3R,4S)-pentane-1,2,3,4,5-pentanol, Xyl) was chosen asinternal standard as its retention time was different fromthose of the saccharides of interest.
Standard solutions made of a mix of Glc, Fru, Suc, and Xylwere prepared at different concentrations, i.e., 5, 2, 1, 0.5, and0.1 mg/g. Samples used were the limpid liquids obtained aftercentrifugation and filtration of the soaking solutions that weredefrosted. These samples were diluted by 10 (w/w) after10 min of homogenization in an ultrasonic bath.
MS
ESI-QqTOF mass spectra were obtained using a QStarmass spectrometer (Applied Biosystems, Courtaboeuf,France). Data were recorded using the Analyst QS softwareand processed with IgorPro. Samples were analyzed inpositive ion mode. Sodium chloride (NaCl) was added toeach sample in order to enhance the ionization efficiency[40]. Ten μL of sample were injected in a 100 μL injectionloop in the flow injection mode at rate of 20 μL/min ofsolvent, i.e., methanol/water, 50:50 (v/v). Standard solutionsfor the identification of [Glc+Fru], Suc, GF2 and GF3 wereestablished using solutions containing Glc, Suc, Kes, andNys at 5 different concentrations, with addition of a fixedamount of an internal standard, i.e., arabinose (Ara) as itsm/z ([Ara+Na]+)=172 does not interfere with the value ofthe m/z of sugars. The centrifuged and filtrated sampleswere defrosted and appropriate dilutions with the solventwere performed, in order to get the best response andminimize matrix effects. MS/MS was used on standards(Suc, Kes, and Nys) in order to obtain reference spectra forthe identification of the [M+Na]+ ions produced during theanalysis of onion samples. These reference spectra werecompared to MS/MS studies on onion samples.
TLC and PLC
The TLC plates used were 20×20 cm TLC aluminumsheets precoated silica gel 60 from Merck. The size of the
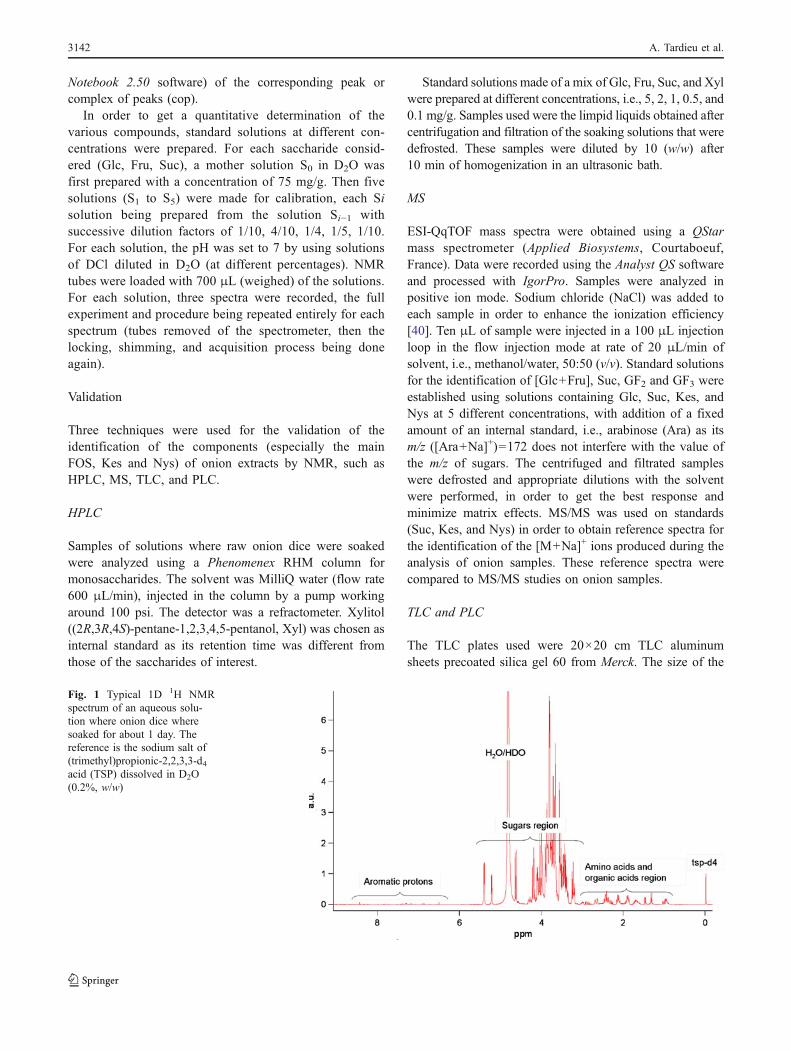
Fig. 1 Typical 1D 1H NMRspectrum of an aqueous solu-tion where onion dice wheresoaked for about 1 day. Thereference is the sodium salt of(trimethyl)propionic-2,2,3,3-d4acid (TSP) dissolved in D2O(0.2%, w/w)
3142 A. Tardieu et al.
TLC sheets was 10×10 cm. Plates were pretreated byimmersion in a 0.02 M solution of sodium acetate [41]. Afterplates drying at 55 °C in an oven for 5 min, samples wereapplied at 1 cm ± 0.1 cm from the edge of the plate. Eachspot was performed by touching a 20 μL capillary tubecontaining the sample to the plate (the tube was weighedbefore and after application in order to make quantitativedetermination of the separated products, using pictureanalysis of plates after development). The atmosphere of thedeveloping chamber (20×20 cm vertical twin-through glassdevelopment chambers) was pre-equilibrated with the devel-oping solvents at least 30 min before the sheets were inserted.
As saccharides are colorless and do not absorb UVradiation, plates were plunged (on the silica side) for 5 s, ina mixture of diphenylamine, aniline, and phosphoric acid inacetone [42]. Baron and Economidis described the prepa-
ration of this saccharide location reagent as a freshly mademixture of 10 mL of a solution A made of 1 g ofdiphenylamine, 1 g of aniline and acetone to 100 mL with1 mL of a solution B that is phosphoric acid at 85% [43].
The PLC plates used were 20×20 cm PLC plates silicagel 60 F254, 2 mm, from Merck. The sample was appliedwith a mechanical dispenser, using a syringe Hamilton500 μL ± 10 μL. Deposition of samples was performed ona line of 19 ± 0.1 cm at 2.5 ± 0.1 cm from the plate edge,by emptying the syringe several times until a total depositof 500 μL, with a drying step at room temperature betweeneach application. As the bands have to be revealed by thelocation agent, a chemical reaction that modify themolecules of interest, after the consecutive developments,1.5 ± 0.1 cm on the left and on the right of the plate weresprayed with the location agent, keeping the middle part of
Compound Assignment 1H multiplicity 1H amount δ1H (ppm)
α-D-Glucopyranose H1α d 1 5.22
H2α n.d. 1 3.52
H3α n.d. 1 3.69
H4α n.d. 1 3.37
H5α n.d. 1 3.81
H’6α n.d. 1 3.75
H”6α n.d. 1 3.81
β-D-Glucopyranose H1β d 1 4.64
H2β t 1 3.23
H3β n.d. 1 3.48
H4β n.d. 1 3.37
H5β n.d. 1 3.44
H’6β n.d. 1 3.75
H”6β n.d. 1 3.88
Table 1 Observed resonanceassignments with chemicalshifts and spin–spin couplingpatterns (d: doublet, t: triplet, n.d.: not determined) of Glc iden-tified in 1D 1H NMR spectrumof solutions where onions dicewhere soaked for about 1 day
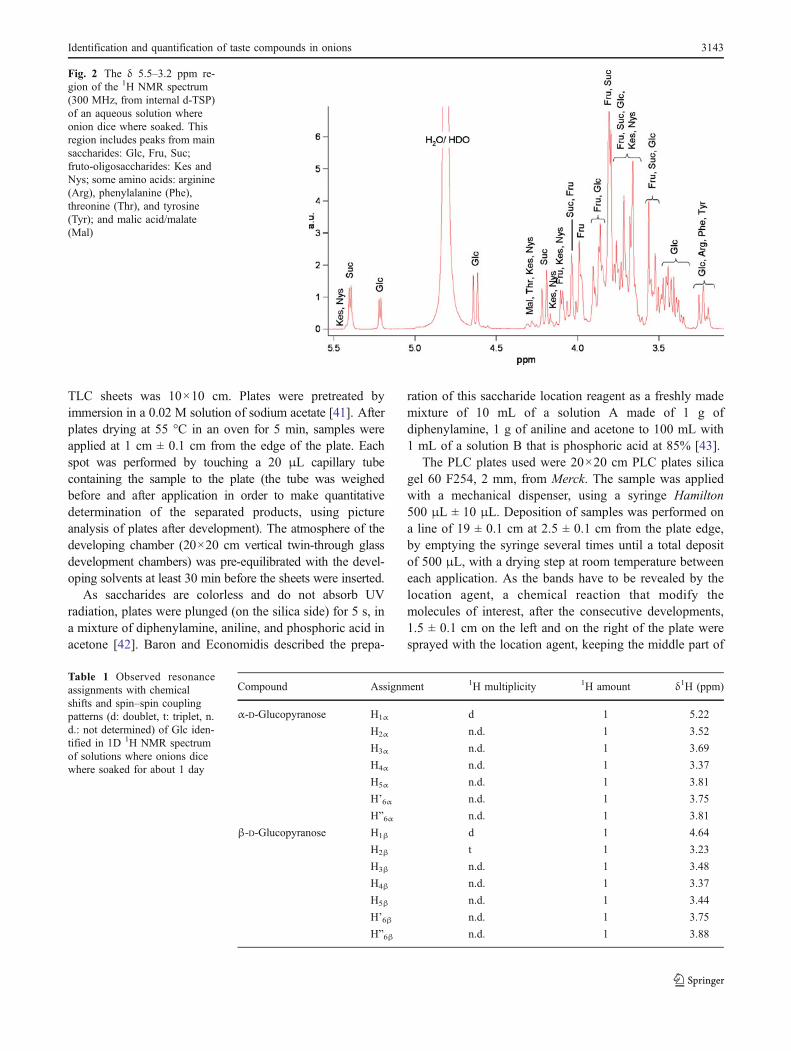
Fig. 2 The δ 5.5–3.2 ppm re-gion of the 1H NMR spectrum(300 MHz, from internal d-TSP)of an aqueous solution whereonion dice where soaked. Thisregion includes peaks from mainsaccharides: Glc, Fru, Suc;fruto-oligosaccharides: Kes andNys; some amino acids: arginine(Arg), phenylalanine (Phe),threonine (Thr), and tyrosine(Tyr); and malic acid/malate(Mal)
Identification and quantification of taste compounds in onions 3143
interest free from the spray with an aluminum fold.Assuming that the elution was vertical and homogenous,the “ghost” spot of each saccharide was removed by scratch-ing. After the immersion in the location agent, bands wererevealed by heating the plates for 5 min in an oven at 120 °C.
Each sample of silica (circa 2–3 g) was then crushedwith a pestle in a mortal and the components were extractedby adding milliQ water (circa 100 g). Solutions were stirredfor 1 h, centrifugated (10,000 rpm, 10 min, 20 °C), filtrated(Millex 33 mm, 0.45 μm, Millipore), and frozen at −24 °C.Finally, samples were double lyophilized and analyzed by1H NMR spectroscopy (see “1H NMR” section).
For identification by TLC and PLC, standard solutionsof Glc, Fru, Suc, Kes, and Nys were prepared at 2 mg/g inmilliQ water. For PLC, more concentrated solutions weremade with concentrations reaching 300 mg/g.
For TLC experiments, the limpid liquid obtained aftercentrifugation and filtration was defrost and analyzed straightafter 10min of homogenization in an ultrasonic bath. For PLCstudies, a concentrated solution of water where onion diceswhere soaked during 7 h was prepared by dissolving about150 mg of freeze-dried matter in 1 g of MilliQ water.
Software
XWIN NMR 3.5 (Bruker Biospin, Germany) and NMRNot-book 2.60/0.1 (NMRTec SAS, Illkirch-Graffenstaden) soft-ware were used for spectrum analysis.
Igor Pro 5.0.3 (Wavemetrics Inc, Oregon, USA) andMaple 13.0 (Maplesoft, Waterloo Maple Inc, USA) soft-ware were used for data handling and peak decomposition.
Results and discussion
Identification of major metabolites in raw onion and rawonion soaking solutions
All 1D 1H NMR spectra of aqueous solutions whereonions tissues were soaked and of raw onion extracts havesimilar shapes (Fig. 1). Three regions can be recognized:the amino acids and organic acids region (0–3.2 ppm), thesaccharide region (3.2–5.5 ppm) and the aromatic protonsregion (6.0–8.0 ppm).
Table 3 Observed resonance assignments with chemical shifts andspin–spin coupling patterns (d: doublet, t: triplet, n.d.: not determined)of Suc identified in 1D 1H spectrum of water where onion dice wheresoaked for about 1 day
Compound Assignment 1Hmultiplicity
1Hamount
δ1H(ppm)
β-D-fructofuranosyl-(2→1)-α-D-glucopyranoside(Sucrose)
H1 d 1 5.41
H2 n.d. 1 3.55
H3 n.d. 1 3.74
H4 n.d. 1 3.46
H5 n.d. 1 3.86
H6 n.d. 2 3.80
H’2 n.d. 2 3.67
H’3 d 1 4.21
H’4 t 1 4.04
H’5 n.d. 1 3.90
H’6 n.d. 2 3.80
Compound Assignment 1H multiplicity 1H amount δ1H (ppm)
α-D-Fructofuranose H1α n.d. 2 3.67
H3α n.d. 1 4.10
H4α n.d. 1 3.99
H5α n.d. 1 4.04
H’6α n.d. 1 3.79
H6α” n.d. 1 3.89
β-D-Fructofuranose H1β n.d 2 3.54
H3β, H4β n.d. 2 4.10
H5β n.d. 1 3.79
H’6β n.d. 1 3.79
H6β” n.d. 1 3.79
β-D-Fructopyranose H’1β n.d. 1 3.54
H”1β n.d. 1 3.67
H3β n.d. 1 3.79
H4β n.d. 1 3.89
H5β n.d. 1 3.99
H’6β n.d. 1 3.67
H6β” n.d. 1 4.04
Table 2 Observed resonanceassignments with chemicalshifts and spin–spin couplingpatterns (n.d.: not determined)of Fru identified in 1D 1H NMRspectra of solutions where oniondice where soaked for about1 day
3144 A. Tardieu et al.
In the saccharide region of 1D 1H NMR spectra(Fig. 2), mono- and disaccharides could be detected easily.Glc, Fru, and Suc were identified after peak assignment(chemical shift δ and multiplicity) using 1D 1H NMRspectra of pure compounds and correlations with pub-lished data [12, 24, 28, 30].
The signals from the three mono- or disaccharides wereidentified as some of their significant peaks are isolated inthe sugar region (Tables 1, 2, and 3).
The small quantities of FOS made peak assignment morecomplex, but TLC and MS analyses with pure compoundsand with the same samples used here showed that they areindeed present (results below, section “Validation”). GF2and GF3 peaks could be observed in raw onion extracts and
in aqueous solutions where raw onion dice where soaked(only for extraction times longer than 24 h) but theirresonances overlap with those from other saccharides [37].The best resolution was for doublets at about 5.44 ppm andat about 4.27 ppm, corresponding to the proton H1 of theGlc unit and to the proton H3′ of the Fru unit, respectively.COSY experiments did not make the identification easier asall the correlations for saccharides were broad.
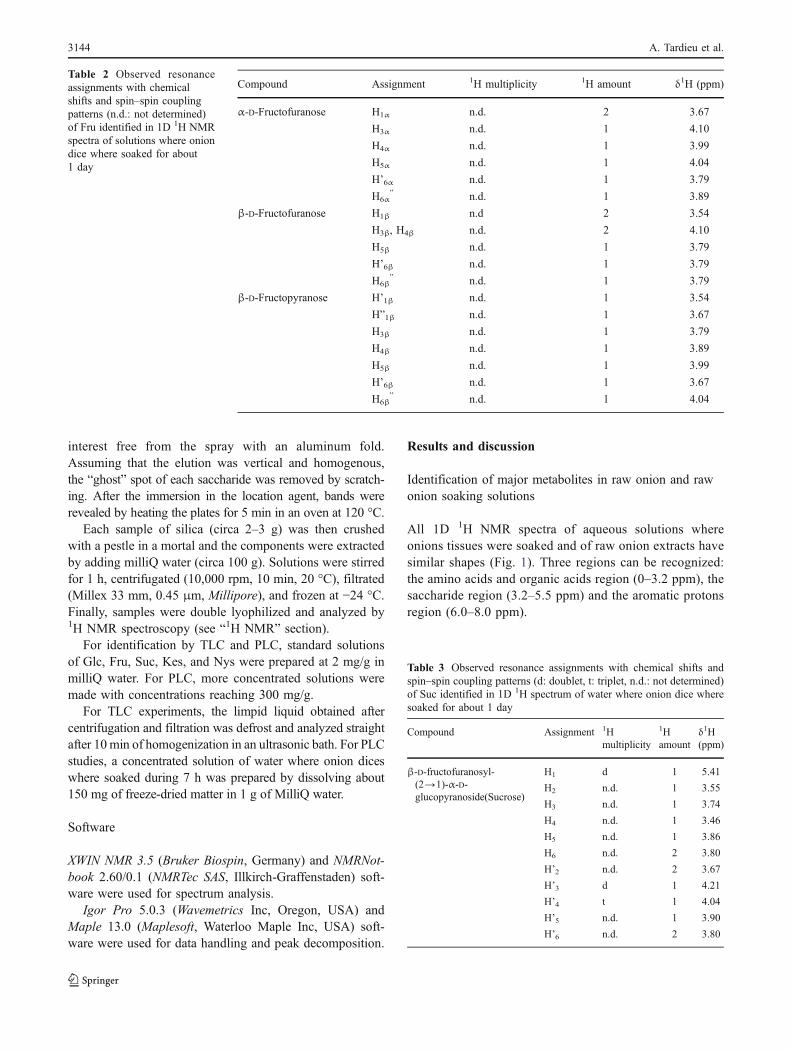
The amino acids and organic acids region of 1D 1HNMR spectra (Fig. 3) shows complex multiplicities of thepeaks, leading to different cop, containing several aminoacids and organic acids together. Peak assignment through1D 1H NMR could not give an accurate determination ofthe possible chemical content. The unassigned peaks from
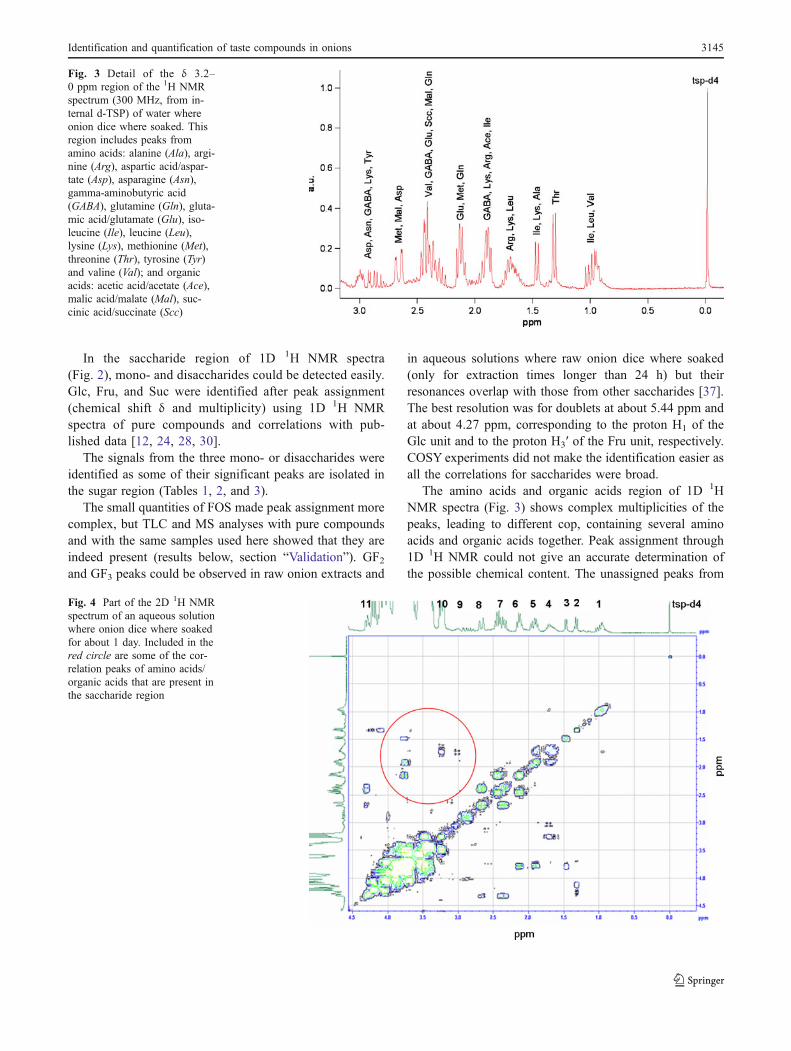
Fig. 4 Part of the 2D 1H NMRspectrum of an aqueous solutionwhere onion dice where soakedfor about 1 day. Included in thered circle are some of the cor-relation peaks of amino acids/organic acids that are present inthe saccharide region
Fig. 3 Detail of the δ 3.2–0 ppm region of the 1H NMRspectrum (300 MHz, from in-ternal d-TSP) of water whereonion dice where soaked. Thisregion includes peaks fromamino acids: alanine (Ala), argi-nine (Arg), aspartic acid/aspar-tate (Asp), asparagine (Asn),gamma-aminobutyric acid(GABA), glutamine (Gln), gluta-mic acid/glutamate (Glu), iso-leucine (Ile), leucine (Leu),lysine (Lys), methionine (Met),threonine (Thr), tyrosine (Tyr)and valine (Val); and organicacids: acetic acid/acetate (Ace),malic acid/malate (Mal), suc-cinic acid/succinate (Scc)
Identification and quantification of taste compounds in onions 3145
these chemical compounds were then examined by 2DCOSY 1H NMR spectroscopy (Fig. 4).
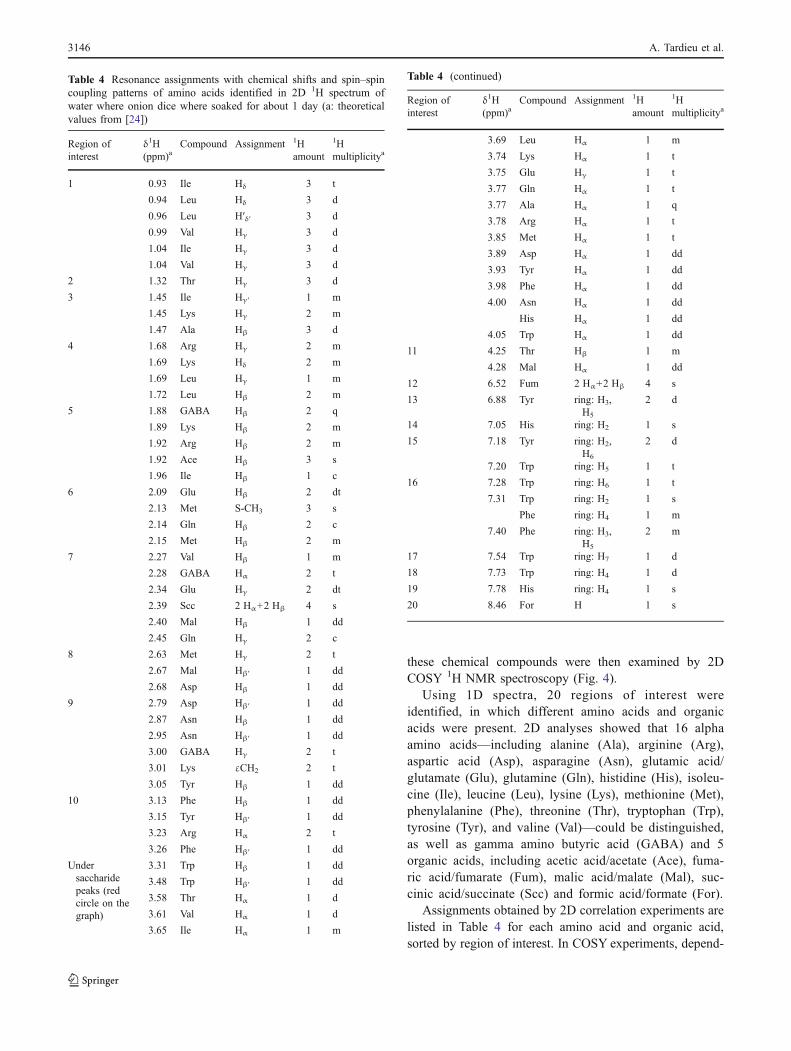
Using 1D spectra, 20 regions of interest wereidentified, in which different amino acids and organicacids were present. 2D analyses showed that 16 alphaamino acids—including alanine (Ala), arginine (Arg),aspartic acid (Asp), asparagine (Asn), glutamic acid/glutamate (Glu), glutamine (Gln), histidine (His), isoleu-cine (Ile), leucine (Leu), lysine (Lys), methionine (Met),phenylalanine (Phe), threonine (Thr), tryptophan (Trp),tyrosine (Tyr), and valine (Val)—could be distinguished,as well as gamma amino butyric acid (GABA) and 5organic acids, including acetic acid/acetate (Ace), fuma-ric acid/fumarate (Fum), malic acid/malate (Mal), suc-cinic acid/succinate (Scc) and formic acid/formate (For).
Assignments obtained by 2D correlation experiments arelisted in Table 4 for each amino acid and organic acid,sorted by region of interest. In COSY experiments, depend-
Table 4 Resonance assignments with chemical shifts and spin–spincoupling patterns of amino acids identified in 2D 1H spectrum ofwater where onion dice where soaked for about 1 day (a: theoreticalvalues from [24])
Region ofinterest
δ1H(ppm)a
Compound Assignment 1Hamount
1Hmultiplicitya
1 0.93 Ile Hδ 3 t
0.94 Leu Hδ 3 d
0.96 Leu H′δ′ 3 d
0.99 Val Hγ 3 d
1.04 Ile Hγ 3 d
1.04 Val Hγ 3 d
2 1.32 Thr Hγ 3 d
3 1.45 Ile Hγ′ 1 m
1.45 Lys Hγ 2 m
1.47 Ala Hβ 3 d
4 1.68 Arg Hγ 2 m
1.69 Lys Hδ 2 m
1.69 Leu Hγ 1 m
1.72 Leu Hβ 2 m
5 1.88 GABA Hβ 2 q
1.89 Lys Hβ 2 m
1.92 Arg Hβ 2 m
1.92 Ace Hβ 3 s
1.96 Ile Hβ 1 c
6 2.09 Glu Hβ 2 dt
2.13 Met S-CH3 3 s
2.14 Gln Hβ 2 c
2.15 Met Hβ 2 m
7 2.27 Val Hβ 1 m
2.28 GABA Hα 2 t
2.34 Glu Hγ 2 dt
2.39 Scc 2 Hα+2 Hβ 4 s
2.40 Mal Hβ 1 dd
2.45 Gln Hγ 2 c
8 2.63 Met Hγ 2 t
2.67 Mal Hβ′ 1 dd
2.68 Asp Hβ 1 dd
9 2.79 Asp Hβ′ 1 dd
2.87 Asn Hβ 1 dd
2.95 Asn Hβ′ 1 dd
3.00 GABA Hγ 2 t
3.01 Lys εCH2 2 t
3.05 Tyr Hβ 1 dd
10 3.13 Phe Hβ 1 dd
3.15 Tyr Hβ′ 1 dd
3.23 Arg Hα 2 t
3.26 Phe Hβ′ 1 dd
Undersaccharidepeaks (redcircle on thegraph)
3.31 Trp Hβ 1 dd
3.48 Trp Hβ′ 1 dd
3.58 Thr Hα 1 d
3.61 Val Hα 1 d
3.65 Ile Hα 1 m
Table 4 (continued)
Region ofinterest
δ1H(ppm)a
Compound Assignment 1Hamount
1Hmultiplicitya
3.69 Leu Hα 1 m
3.74 Lys Hα 1 t
3.75 Glu Hγ 1 t
3.77 Gln Hα 1 t
3.77 Ala Hα 1 q
3.78 Arg Hα 1 t
3.85 Met Hα 1 t
3.89 Asp Hα 1 dd
3.93 Tyr Hα 1 dd
3.98 Phe Hα 1 dd
4.00 Asn Hα 1 dd
His Hα 1 dd
4.05 Trp Hα 1 dd
11 4.25 Thr Hβ 1 m
4.28 Mal Hα 1 dd
12 6.52 Fum 2 Hα+2 Hβ 4 s
13 6.88 Tyr ring: H3,H5
2 d
14 7.05 His ring: H2 1 s
15 7.18 Tyr ring: H2,H6
2 d
7.20 Trp ring: H5 1 t
16 7.28 Trp ring: H6 1 t
7.31 Trp ring: H2 1 s
Phe ring: H4 1 m
7.40 Phe ring: H3,H5
2 m
17 7.54 Trp ring: H7 1 d
18 7.73 Trp ring: H4 1 d
19 7.78 His ring: H4 1 s
20 8.46 For H 1 s
3146 A. Tardieu et al.
ing on the sensitivity threshold, either all peaks andcorrelation peaks are visible, or some correlation peaksare missing, or peaks and correlation peaks are not detected.In this last case, the reason could be that peaks may beincluded within bigger peaks (from saccharides by exam-ple), or that their quantity is lower than the detection level,or that they are not present in the samples.
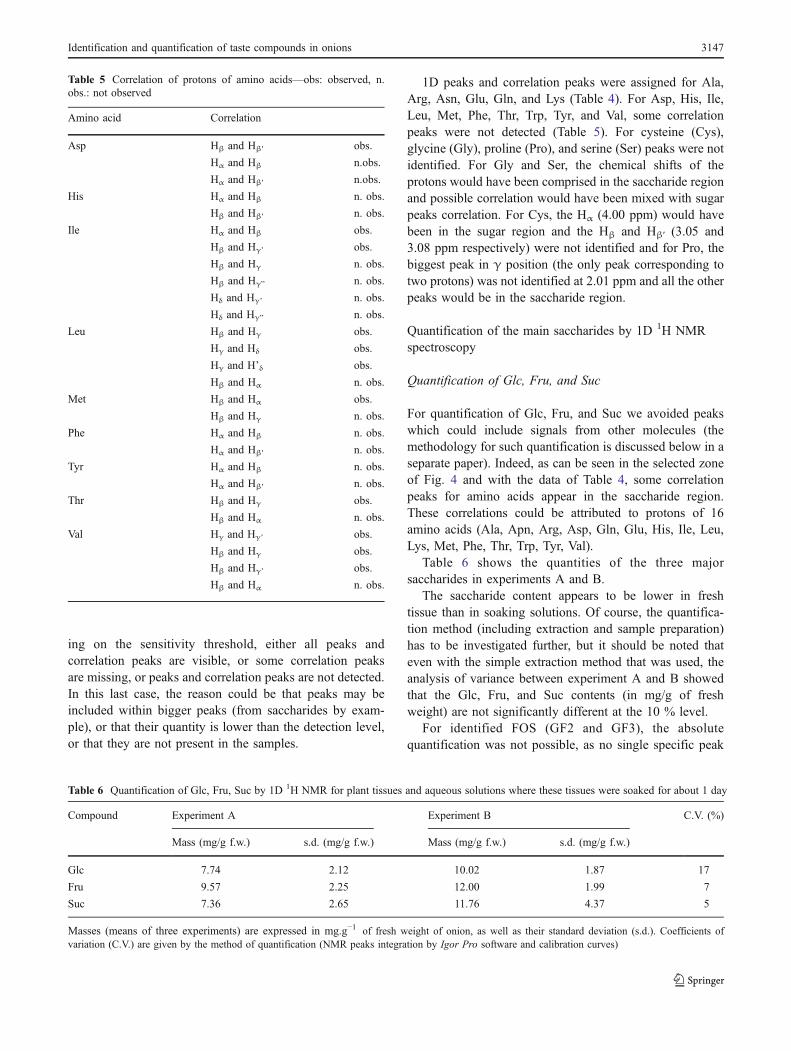
1D peaks and correlation peaks were assigned for Ala,Arg, Asn, Glu, Gln, and Lys (Table 4). For Asp, His, Ile,Leu, Met, Phe, Thr, Trp, Tyr, and Val, some correlationpeaks were not detected (Table 5). For cysteine (Cys),glycine (Gly), proline (Pro), and serine (Ser) peaks were notidentified. For Gly and Ser, the chemical shifts of theprotons would have been comprised in the saccharide regionand possible correlation would have been mixed with sugarpeaks correlation. For Cys, the Hα (4.00 ppm) would havebeen in the sugar region and the Hβ and Hβ′ (3.05 and3.08 ppm respectively) were not identified and for Pro, thebiggest peak in γ position (the only peak corresponding totwo protons) was not identified at 2.01 ppm and all the otherpeaks would be in the saccharide region.
Quantification of the main saccharides by 1D 1H NMRspectroscopy
Quantification of Glc, Fru, and Suc
For quantification of Glc, Fru, and Suc we avoided peakswhich could include signals from other molecules (themethodology for such quantification is discussed below in aseparate paper). Indeed, as can be seen in the selected zoneof Fig. 4 and with the data of Table 4, some correlationpeaks for amino acids appear in the saccharide region.These correlations could be attributed to protons of 16amino acids (Ala, Apn, Arg, Asp, Gln, Glu, His, Ile, Leu,Lys, Met, Phe, Thr, Trp, Tyr, Val).
Table 6 shows the quantities of the three majorsaccharides in experiments A and B.
The saccharide content appears to be lower in freshtissue than in soaking solutions. Of course, the quantifica-tion method (including extraction and sample preparation)has to be investigated further, but it should be noted thateven with the simple extraction method that was used, theanalysis of variance between experiment A and B showedthat the Glc, Fru, and Suc contents (in mg/g of freshweight) are not significantly different at the 10 % level.
For identified FOS (GF2 and GF3), the absolutequantification was not possible, as no single specific peak
Table 5 Correlation of protons of amino acids—obs: observed, n.obs.: not observed
Amino acid Correlation
Asp Hβ and Hβ′ obs.
Hα and Hβ n.obs.
Hα and Hβ′ n.obs.
His Hα and Hβ n. obs.
Hβ and Hβ′ n. obs.
Ile Hα and Hβ obs.
Hβ and Hγ’ obs.
Hβ and Hγ n. obs.
Hβ and Hγ” n. obs.
Hδ and Hγ’ n. obs.
Hδ and Hγ” n. obs.
Leu Hβ and Hγ obs.
Hγ and Hδ obs.
Hγ and H’δ obs.
Hβ and Hα n. obs.
Met Hβ and Hα obs.
Hβ and Hγ n. obs.
Phe Hα and Hβ n. obs.
Hα and Hβ′ n. obs.
Tyr Hα and Hβ n. obs.
Hα and Hβ′ n. obs.
Thr Hβ and Hγ obs.
Hβ and Hα n. obs.
Val Hγ and Hγ’ obs.
Hβ and Hγ obs.
Hβ and Hγ’ obs.
Hβ and Hα n. obs.
Table 6 Quantification of Glc, Fru, Suc by 1D 1H NMR for plant tissues and aqueous solutions where these tissues were soaked for about 1 day
Compound Experiment A Experiment B C.V. (%)
Mass (mg/g f.w.) s.d. (mg/g f.w.) Mass (mg/g f.w.) s.d. (mg/g f.w.)
Glc 7.74 2.12 10.02 1.87 17
Fru 9.57 2.25 12.00 1.99 7
Suc 7.36 2.65 11.76 4.37 5
Masses (means of three experiments) are expressed in mg.g−1 of fresh weight of onion, as well as their standard deviation (s.d.). Coefficients ofvariation (C.V.) are given by the method of quantification (NMR peaks integration by Igor Pro software and calibration curves)
Identification and quantification of taste compounds in onions 3147
could be integrated. However, multi-Lorentzian peak fittingshowed that the area under the H1 doublet of the glucoseunit of GF2 or GF3 represented less than 5% of the areaunder the Suc peak.
Comparison of quantification methods
For each peak of interest, two pairs of methods werecompared: direct integration, using Igor Pro or NMRNote-book integration command, integration after fitting, usingeither a multi-Lorentzian decomposition of a part of thespectrum and integration of the separate peaks, or a multi-Lorentzian decomposition of a part of the spectra andintegration of the fitted curve. As very different results are
obtained, we first observed that the noise and baseline wereresponsible for differences; in these particular conditions,tangent skimming [44, 45] is inappropriate.
In order to get rid of the effect of the noise and the baseline,an automatic algorithm for finding the integral value of peakswas based on the idea that the calculated integral value y of aresonance belonging to a signal can be expressed as:
y ¼Z x
�xpðtÞ þ bðtÞ þ nðtÞ½ �dt
where p(t) is the peak, b(t) and n(t) represent respectively thebaseline and the noise, and x the value of the half interval ofintegration around the peak maximum value (it is assumedthat the noise has a null mean over an interval large enough,and that y does not change if x is chosen large enough).
Indeed for Lorentzian peaks such as NMR ones, theintegration interval should be infinite, but one can easilydetermine the proportion lost in the so-called “dead band”:for a peak represented by the equation:
y ¼ A
x2 þ B;
with a noise h, the proportion of signal lost in the dead band is:
P ¼p AffiffiffiB
p � 2artanffiffiffiffiffiffiffiffiffiffiffiffiffiffih A�h Bð Þ
phffiffiffiB
p� �
A
� � ffiffiffiB
p
p A
With the assumption that the noise has a constant integralvalue over any interval larger than a certain period T and smallenough so that it does not include the peak values, one canwrite:
y ¼Z x
�xpðtÞdt þ
Z x
�xbðtÞdt þ
Z x
�xnðtÞdt ¼
Z x
�xpðtÞ þ 2x
Tk
curve curve curve
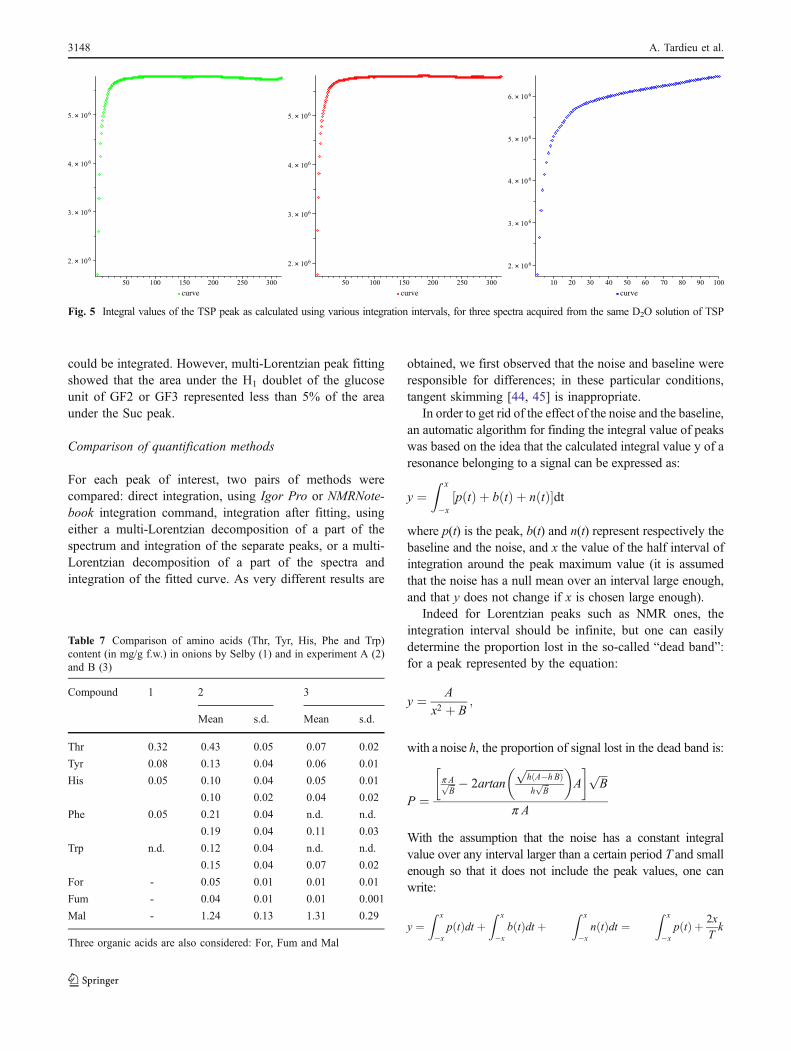
Fig. 5 Integral values of the TSP peak as calculated using various integration intervals, for three spectra acquired from the same D2O solution of TSP
Table 7 Comparison of amino acids (Thr, Tyr, His, Phe and Trp)content (in mg/g f.w.) in onions by Selby (1) and in experiment A (2)and B (3)
Compound 1 2 3
Mean s.d. Mean s.d.
Thr 0.32 0.43 0.05 0.07 0.02
Tyr 0.08 0.13 0.04 0.06 0.01
His 0.05 0.10 0.04 0.05 0.01
0.10 0.02 0.04 0.02
Phe 0.05 0.21 0.04 n.d. n.d.
0.19 0.04 0.11 0.03
Trp n.d. 0.12 0.04 n.d. n.d.
0.15 0.04 0.07 0.02
For - 0.05 0.01 0.01 0.01
Fum - 0.04 0.01 0.01 0.001
Mal - 1.24 0.13 1.31 0.29
Three organic acids are also considered: For, Fum and Mal
3148 A. Tardieu et al.
with:
Z xþT
�xbðtÞdt ¼ k
for any z in the spectrum part considered, k being a constant,and, as assumed before:
Z xþT
�xnðtÞdt ¼ 0
Then y is can be written:
y ¼Z x0
�x0
pðtÞdt þ 2x0T
� �
þZ x0
�xpðtÞdt þ
Z x
x0
pðtÞdt þ 2 x� x0ð ÞT
k
� �
where x0 is chosen so that the peak value is becoming of thesame order of magnitude as the noise.
In this case, the main influence is due to the peak in the firstparenthesis and to the noise and baseline in the secondparenthesis; in other words, if the noise is random and thebaseline is a regular function, as seen in this case, the proposedintegration leads to an increase, due to the signal, plus aconstant variation (including a null variation) where the signalis low compared to the noise. The formula can be simplified as:
y ¼Z x0
�x0
pðtÞdt þ 2x
Tk
This is exactly what was observed in our spectra and itexplains the variations of signals.
In order to find the value of x0, a non arbitrary algorithmhas to be found. Using the assumption that the variation ofthe integral value of the signal is low compared to theintegral value of the noise+baseline after a certain value, this
algorithm can look for “constant” evolution of the integralvalue. Integrating the constant variation gives the equation ofa line that can be back-interpolated to the abscissa axis wherethe real integral value of the peak itself is directly found(interpolating back this line eliminates the second term of thefirst parenthesis in the equation of the previous formula).
This means that the question is to find when the integralvalue of the signal is linear. There are many possibilities,such as looking to the derivative of the signal and findingwhen it is constant. However, we tested another algorithmbased on the idea that the signal is not noisy when it isintegrated over an interval large enough. In the first part ofthe integrated signal, the intersection of the tangent to theintegral curve cuts the ordinate axis at an increasing value, butwhen the peak integral is of the same order of magnitude asthe noise, the ordinate value of this intersection stabilizes. Ifnoise+baseline is now added, there will be an abscissa whenthe ordinate value decreases, before oscillating. This meansthat this abscissa can be considered as the beginning of atangent line, the second extremity being chosen as when thetangent stabilizes (Fig. 5).
Using this algorithm led to a confirmation of what wasknown, i.e., that fitting a peak with a Lorentzian using themaximum height and the width at half height is not preciseenough, because for narrow peaks a small error on theposition of the abscissa used for modeling can have a largeinfluence on the result. It also confirmed that modelingshould be cautiously done, in particular because of thenoise and baseline.
Time (min)
Intensity (a.u.)1
2
3 4
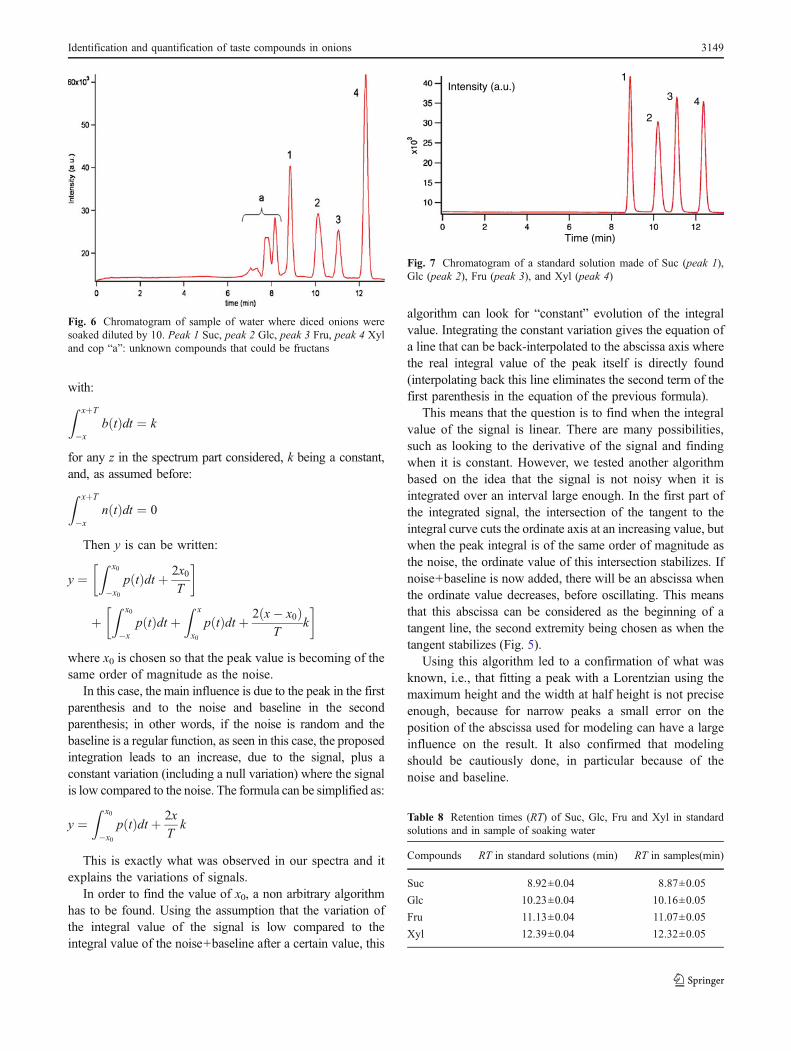
Fig. 7 Chromatogram of a standard solution made of Suc (peak 1),Glc (peak 2), Fru (peak 3), and Xyl (peak 4)
Table 8 Retention times (RT) of Suc, Glc, Fru and Xyl in standardsolutions and in sample of soaking water
Compounds RT in standard solutions (min) RT in samples(min)
Suc 8.92±0.04 8.87±0.05
Glc 10.23±0.04 10.16±0.05
Fru 11.13±0.04 11.07±0.05
Xyl 12.39±0.04 12.32±0.05
Fig. 6 Chromatogram of sample of water where diced onions weresoaked diluted by 10. Peak 1 Suc, peak 2 Glc, peak 3 Fru, peak 4 Xyland cop “a”: unknown compounds that could be fructans
Identification and quantification of taste compounds in onions 3149
Our spectra analysis also led to calculate a coefficient ofvariation of 0.007. Using it, we tested our quantitativemethods with a mixture of three saccharides, and calibra-tion curves with R2 higher than 0.99 were found.
Quantification of some amino acids and organic acidsby 1D 1H NMR spectroscopy
In NMR spectra, signals from amino acids and organic acidsoverlapped in 20 cop (Table 4). Integrating them led to 20equations with 22 unknowns (amino acid and organic acidcontent). Some cop correspond to a single product, as forFor, Fum, His (2 cop), Thr, Trp (2 cop) and Tyr. Someequations could also be solved independently, which allowedthe quantification of Mal and Phe. Arg appears in a copwhere its signal (doublet) overlapped with Glc, Phe, and Tyr(Fig. 2); as Glc, Phe and Tyr can be quantified, it was firsthoped that Arg could be determined; however Glc quantifi-cation by calibration curve comprises all the isomeric forms
whereas the peak of Arg is included in the H2β peak of Glc(Table 1). Finally, 9 irreducible equations with 14 unknownscould not be solved for quantification of other compounds.Table 7 shows the results of the quantification of For, Fum,His, Thr, Trp, and Tyr for experiment A and B, withcomparison with the data of Selby [20].
The same chemical shifts were observed in this study as inprevious studies with carrots stocks [12] and pure compounds[24, 28, 30]. This was expected as the pH was adjusted to thesame values and the samples diluted as in previous studies.The same mono- and disaccharides as for carrots stockscould be observed. Our results confirm previous studies ofonions bulbs with other analytical techniques.
For amino acids, our results were in general accordance withchromatographic analysis by Selby [20]. However, whereasTrp could not be detected by that author, we observed itssignal in our spectra. On the other hand, NMR spectroscopyfailed to detect Gly, and Pro in spite of published concen-trations (0.076 and 0.068 μmol g−1 of fresh weight,
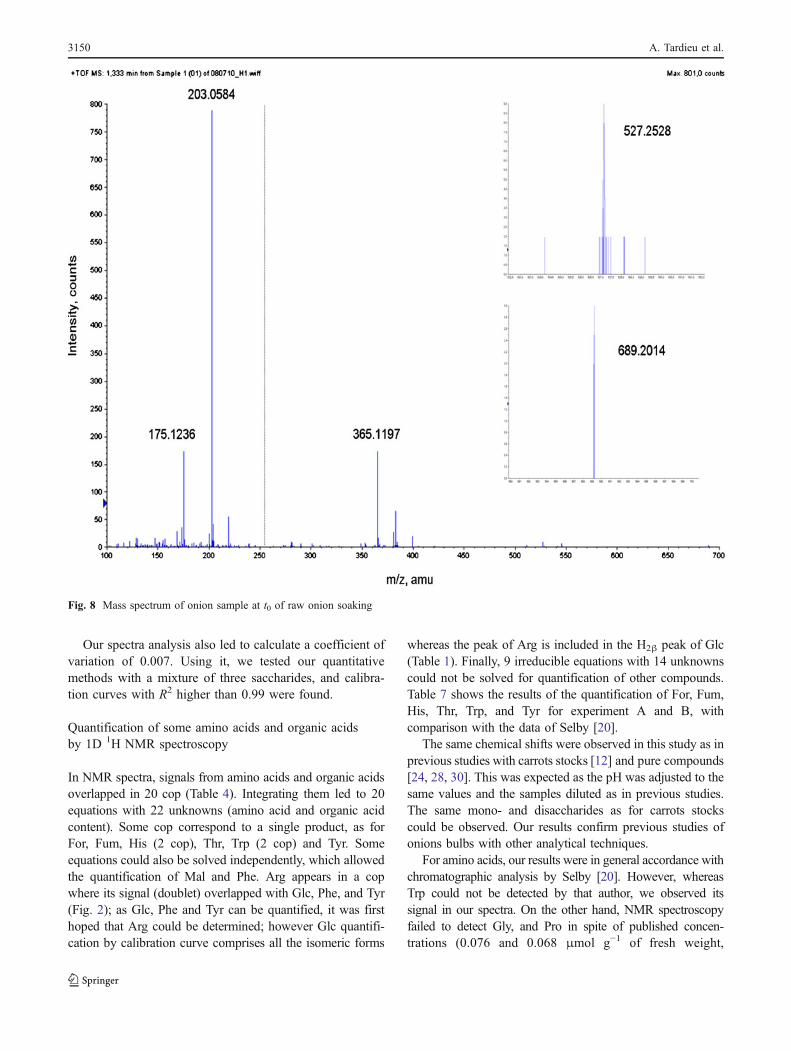
Fig. 8 Mass spectrum of onion sample at t0 of raw onion soaking
3150 A. Tardieu et al.
respectively [20]) which could allow detection. No ethanolwas identified, contrary to published data on carrot stocks [12].
Quantification of amino acids probably needs improve-ment of the method as, except for Mal and Thr, the quantityof amino acids in the NMR tube was calculated to be below0.1 mg. Of course, amino acid signals could be increasedusing bigger amounts of lyophilisate, but saccharide copwould prevent detection of amino signals. However, for theamino acids that could be quantified, we obtained results ofthe same order of magnitude as Selby. Techniques for peakssuppression are to be considered.
Validation
Identification by HPLC of Glc, Fru, and Suc of onionsoaking samples
Identification of Glc, Fru and Suc in aqueous solutions whereonion dice were soaked (Fig. 6) was performed by comparisonof retention times and retention factors (Rf) with those ob-tained by the analyses of standard solutions (Fig. 7, Table 8).Other peaks (noted “a” in Fig. 6) appeared as they elute beforeSuc, they could be representative of FOS, for example.
Identification by MS and MS/MS
From standard solutions, Glc, Fru, Suc, Kes, and Nys wereall detected as [M+Na]+ whereas no [M+H]+ ions were
detected. Fru was detected with the same m/z than Glc: m/z([M+Na]+)=203=180+23, because Glc and Fru have thesame molecular weight (180 g.mol−1). The m/z value of[Suc+Na]+, [Kes+Na]+ and [Nys+Na]+ were, respectively,365 (342+23), 527 (504+23) and 689 (666+23).
All MS analyses of onion samples gave similarspectra, such as shown in Fig. 8. Ions [M+Na]+ of m/zequal to 172, 203, 356, 526, and 689, were identified.They were therefore assumed to correspond to Ara(internal standard), Glc and Fru, Suc, GF2 and GF3,respectively.
MS/MS analyses of ions [M+Na]+ of m/z equal to 356,526 and 689 were also performed and results corroboratedwith MS/MS analyses of standard solutions of Suc, Kes,and Nys, respectively. As a conclusion, MS and MS/MSanalyses not only confirmed NMR studies on the presenceof monosaccharides (Glc+Fru) and Suc, but they were alsohelpful to identify GF2 and GF3.
Identification by TLC and PLC
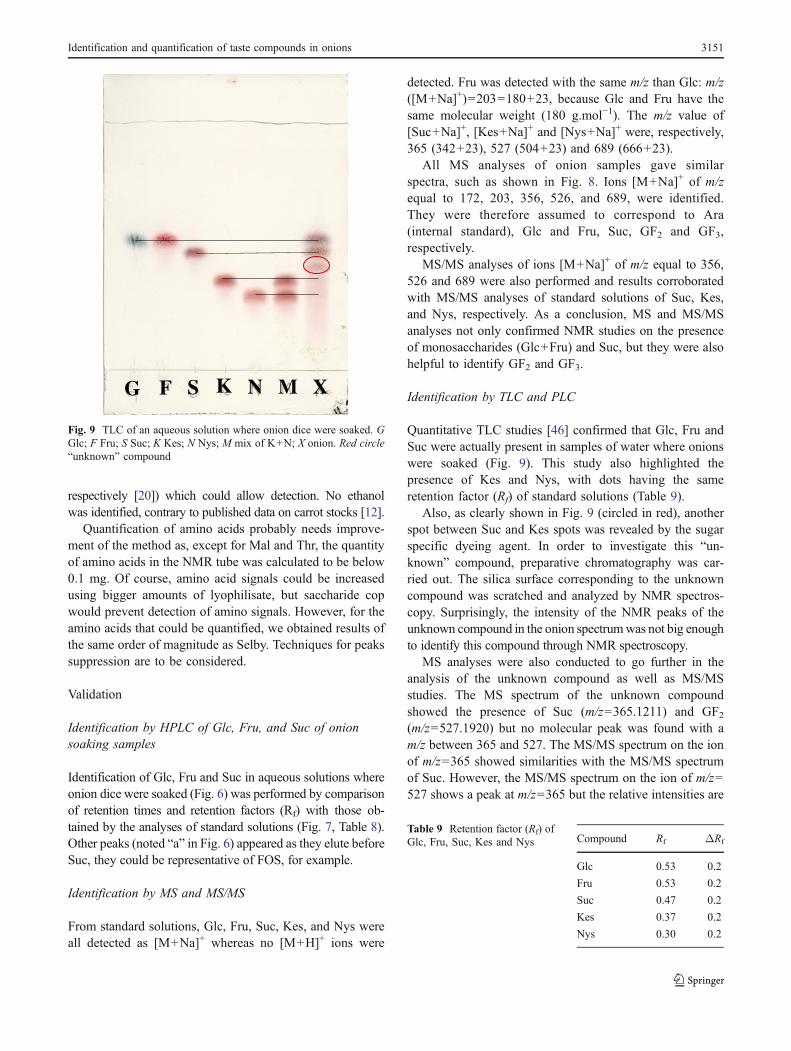
Quantitative TLC studies [46] confirmed that Glc, Fru andSuc were actually present in samples of water where onionswere soaked (Fig. 9). This study also highlighted thepresence of Kes and Nys, with dots having the sameretention factor (Rf) of standard solutions (Table 9).
Also, as clearly shown in Fig. 9 (circled in red), anotherspot between Suc and Kes spots was revealed by the sugarspecific dyeing agent. In order to investigate this “un-known” compound, preparative chromatography was car-ried out. The silica surface corresponding to the unknowncompound was scratched and analyzed by NMR spectros-copy. Surprisingly, the intensity of the NMR peaks of theunknown compound in the onion spectrumwas not big enoughto identify this compound through NMR spectroscopy.
MS analyses were also conducted to go further in theanalysis of the unknown compound as well as MS/MSstudies. The MS spectrum of the unknown compoundshowed the presence of Suc (m/z=365.1211) and GF2(m/z=527.1920) but no molecular peak was found with am/z between 365 and 527. The MS/MS spectrum on the ionof m/z=365 showed similarities with the MS/MS spectrumof Suc. However, the MS/MS spectrum on the ion of m/z=527 shows a peak at m/z=365 but the relative intensities are
Compound Rf ΔRf
Glc 0.53 0.2
Fru 0.53 0.2
Suc 0.47 0.2
Kes 0.37 0.2
Nys 0.30 0.2
Table 9 Retention factor (Rf) ofGlc, Fru, Suc, Kes and Nys
G F S K N M X
Fig. 9 TLC of an aqueous solution where onion dice were soaked. GGlc; F Fru; S Suc; K Kes; N Nys; M mix of K+N; X onion. Red circle“unknown” compound
Identification and quantification of taste compounds in onions 3151
different from those of the MS/MS spectrum of Kes.Different conformations of molecule can lead to differentMS/MS spectra [47]. Then, the unknown compound couldhave been the neoform of kestose (that is more present inonion tissues than Kes). Unfortunately, as neokestose is nota product that is commercially available, the MS/MSspectrum of this pure compound could not have beenperformed to test this hypothesis.
Conclusion
In this study, complete assignment of 3 main saccharides(Glc, Fru, Suc), 17 amino acids and 5 organic acids wasperformed for onion tissues and for soaking solutions using1D and 2D 1H (COSY sequences) NMR spectroscopy.These results were validated using other analytical meth-ods, such as HPLC, MS, and MS/MS, and TLC and PLC.Quantification of Glc, Fru, Suc, as well as of some aminoacids and organic acids was achieved, with sometimes largecoefficients of variation due to the very small amounts ofcompounds. The quantification of saccharides and aminoacids from raw tissues could be improved by betterextractions methods. Davis [48] compared various methods,but further studies (to be published) showed that saccha-rides were not fully recovered by methanol extraction asproposed by O’Donoghue [6].
As a whole, this study confirms that one of the bigadvantages of NMR spectroscopy is the simultaneous anddirect detection of all compounds of low molecular weights.
References
1. Taylor AJ (1996) Volatile flavor release from food during eating.Crit Rev Food Sci Nutr 36(8):765–784
2. Faurion A, Lardier T, Guinard JX, Naudin B (2006) Human tastedetection thresholds, olfaction and taste IX. Ann NY Acad Sci510:276–279
3. Kaack K, Christensen LP, Hansen SL, Grevsen K (2004) Non-structural carbohydrates in processed soft fried onion (Allium cepaL.). Eur Food Res Technol 218:372–379
4. Jaime L, Molla E, Fernandez A, Martin Cabrejas MA, LopezAndreu FJ, Esteban RM (2002) Structural carbohydrate differ-ences and potential source of dietary fiber of onion (Allium cepaL.) tissues. J Agric Food Chem 50:122–128
5. Espinosa-Martos I, Rico E, Rupèrez P (2006) Note. Lowmolecular weight carbohydrates in foods usually consumed inSpain. Food Sci Technol Int 12(2):171–175
6. O’Donoghue EM, Omerfield SD, Bendall M, Hedderly D, EasonJ, Sims I (2004) Evaluation of carbohydrates in Pukekohelongkeeper and Grano cultivars of Allium cepa L. J Agric FoodChem 52:5383–5390
7. Jaime L, Martin-Cabrejas MA, Molla E, Lopez-Andreu FJ,Waldron KW, Esteban RM (2000) Study of total fructan andfructooligosaccharide content in different onion tissues. J SciFood Agric 81:177–182
8. Jaime L, Martin-Cabrejas MA, Molla E, Lopez-Andreu FJ,Esteban RM (2001) Effect of storage on fructan and fructoo-ligosaccharide of onion (Allium cepa L.). J Agric Food Chem49:982–988
9. Gorin N (1979) Enzymatic and high-pressure liquid chromato-graphic estimation of glucose, fructose, and sucrose in powdersfrom stored onions. J Agric Food Chem 27(1):195–197
10. Ng A, Smith AC, Waldron KW (1998) Effect of tissue type andvariety on cell wall chemistry of onion (Allium cepa L.). FoodChem 63(1):17–24
11. Rabinowitch HD, Brewster JL (1990) Onions and allied crops,Vol. 1, Botany, physiology, and genetics
12. Cazor A, Deborde C, Moing A, Rolin D, This H (2006) Sucrose,glucose, and fructose extraction in aqueous carrot root extractsprepared at different temperatures by means of direct NMRmeasurements. J Agric Food Chem 54:4681–4686
13. Lachman J, Orsák M, Pivec V (1999) Flavonoid antioxidants andascorbic acid in onion (Allium cepa L.). Hort Sci Prague-Zahradnictví 26:125–134
14. Lachman J, Proněk D, Hejtmánková A, Dudjak J, Pivec V,Faitová K (2003) Total polyphenol and main flavonoid antiox-idants in different onion (Allium cepa L.) varieties. Hort SciPrague-Zahradnictví 30:142–147
15. Shiomi N, Benkeblia N, Onodera S (2005) The metabolism of thefructooligosaccharides in onion bulbs: a comprehensive review. JAppl Glycosci 52:121–127
16. Shiomi N, Onodera S, Sakai H (1997) Fructo-oligosaccharidecontent and fructosyltransferase activity during growth of onionbulbs. New Phytol 136:105–113
17. Benkeblia N, Onodera S, Shiomi N (2005) Variation in 1-fructo-exohydrolase (1-FEH) and 1-kestose-hydrolysing (1-KH) activitiesand fructo-oligosaccharide (FOS) status in onion bulbs. Influence oftemperature and storage time. J Sci Food Agric 85:227–234
18. Benkeblia N, Takahashi N, Ueno K, Onodera S, Shiomi N (2005)Tetra- and penta-fructooligosaccharide (FOS) isomers assessmentin onion bulb tissues: effect of temperature and storage time.Tetrahedron Asymmetr 16:33–37
19. Rabinowitch HD, Brewster JL (1990) Onions and allied crops vol.3, biochemistry, food science, and minor crops.
20. Selby C, Galpin IJ, Collin HA (1979) Comparison of the onion plant(Allium cepa) and onion tissue culture. New Phytol 83:351–359
21. Fraser PD, Pinto MES, Holloway DE, Bramley PM (2000)Application of high-performance chromatography with photodi-ode array detection to the metabolic profiling of plant isoprenoids.Plant J 24:551–558
22. Roessner U, Luedemann A, Brust D, Fiehn O, Linke T, WillmitzerL, Fernie AR (2001) Metabolic profiling allows comprehensivephenotyping of genetically or environmentally modified plantsystems. Plant Cell 13:11–29
23. Roessner U, Willmitzer L, Fernie AR (2002) Metabolic profilingand biochemical phenotyping of plant systems. Plant Cell Rep21:189–196
24. Fan TWM (1996) Metabolite profiling by one- and two-dimensional NMR analysis of complex mixtures. Prog NuclMagn Reson Spectrosc 28:161–219
25. Pereira GE, Gaudillere JP, Van Leeuwen C, Hilbert G, Maucourt M,Deborde C,MoingA, Rolin D (2005) 1H NMR and chemometrics tocharacterize mature grape berries in four wine-growing areas inBordeaux, France. J Agric Food Chem 53:6382–6389
26. Schraml J, Blechta V, Sýkora J, Soukupová L, Cuřínová P, ProněkD, Lachman J (2005) Identification of polyphenols from plantmaterials through their silylation and 29Si NMR spectroscopy—line assignment through 29Si–13C spin–spin couplings. Magn ResonChem 43:829–834
27. Gil AM, Duarte IF, Delgadillo I, Colquhoun IJ, Casuscelli F,Humpfer E, Spraul M (2000) Study of the compositional changes
3152 A. Tardieu et al.
of mango during ripening by use of nuclear magnetic resonancespectroscopy. J Agric Food Chem 48:1524–1536
28. Sobolev AP, Brosio E, Gianferri R, Segre AL (2005) Metabolicprofile of lettuce leaves by high-field NMR Spectra. Magn ResonChem 43:625–638
29. Le Gall G, Colquhoun IJ, Davies AL, Collins GJ, Verhoeyen ME(2003) Metabolite profiling of tomato (Lycopersicon esculentum)using 1H NMR spectroscopy as a tool to detect potentialunintended effects following a genetic modification. J Agric FoodChem 51:2447–2456
30. Sobolev AP, Segre AL, Lamanna R (2003) Proton high-fieldNMR study of tomato juice. Magn Reson Chem 41:237–245
31. Duarte IF, Barros A, Belton PS, Righelato R, Spraul M, HumpferE, Gil AM (2002) High-resolution nuclear resonance magneticspectroscopy and multivariate analysis for the characterization ofbeer. J Agric Food Chem 50:2475–2481
32. Kosir IJ, Kidric J (2001) Identification of amino acids in wines byone- and two-dimensional nuclear magnetic resonance spectros-copy. J Agric Food Chem 49:50–56
33. Charles C (2009) La cuisine expliquée, éditions BPI, Paris34. Havey MJ, Galmarini CR, Gökce AF, Henson C (2004) QTL
affecting soluble carbohydrate concentrations in stored onionbulbs and their association with flavor and health-enhancingattributes. Genome 47:463–468
35. Le Barc’H N, Grossel JM, Looten P, Mathlouthi M (2001) Kineticstudy of the mutarotation of D-glucose in concentrated aqueoussolution by gas-liquid chromatography. Food Chem 74:119–124
36. Moing A, Maucourt M, Renaud C, Gaudillère G, Brouquisse R,Lebouteiller B, Gousset-Dupont A, Vidal J, Granot D, Denoyes-Rothan B, Lerceteau-Köhler E, Rolin D (2004) Quantitativemetabolic profiling through one-dimensional 1H NMR analyses:application to plant genetics and functional genomics. Funct PlantBiol 31:889–902
37. Fulushi E, Onodera S, Yamamori A, Shiomi N, Kawabata J(2000) NMR analysis of tri- and tetrasaccharides from asparagus.Magn Reson Chem 38:1005–1011
38. Munasinghe JP, Colebrook LD, Attard JJ, Carpenter TA, Hall LD(1997) Estimation of the spin-lattice relaxation time constants oflow molecular weight solutes in dilute complex aqueous solutions:application to urinary metabolites. Magn Reson Chem 36(2):116–123
39. Kaufman SL, Dorman FD (2008) Sucrose clusters exhibiting a magicnumber in dilute aqueous solutions. Langmuir 24(18):9979–9982
40. Hoffman E, Stroobant V (2005) Spectrométrie de masse41. Reiffová K, Podolonovièova J, Onofrejova L, Preisler J, Nemcova
R (2007) Thin-layer chromatography and matrix-assisted laserdesorption/ionization mass spectrometric analysis of oligosacchar-ides in biological samples. J Planar Chrom 20(1):19–25
42. Kocourek J, Ticha M, Koftit J (1966) The use of diphenylamine-aniline-phosphoric acid reagent in the detection and determinationof monosaccharides and their derivatives on paper chromato-grams. J Chromatogr 24:117–124
43. Baron DN, Economidis J (1963) Thin-layer chromatography foramino-acids and sugars. J Clin Pathol 16:484–486
44. Dyson N (1990) Chromatographic integration methods45. Chesler SN, Cram SP (1971) Effect of peak sensing and random
noise on the precision and accuracy of statistical moment analysesfrom digital chromatographic data. Anal Chem 43(14):1922–1933
46. Valverde J, This H (2007) Quantitative determination of photo-synthetic pigments in green beans using thin-layer chromatogra-phy and a flatbed scanner as densitometer. J Chem Educ 84(9):1505–1507
47. Davis F, Terry LA, Chope GA, Faul CFJ (2007) Effect ofextraction procedure on measured sugar concentrations in onion(Allium cepa L.) bulbs. J Agric Food Chem 55(11):4299–4306
48. Mandelbaum A (1983) Mass Spectrom Rev 2:223–284
Identification and quantification of taste compounds in onions 3153
Copyright © 2022 FDOKUMEN