
Appendix 1d: Water Environment - A1d.1 Introduction - GOV.UK
81
Offshore Energy SEA 4: Appendix 1 Environmental Baseline A1d.1 Appendix 1d: Water Environment A1d.1 Introduction A number of aspects of the water environment are reviewed below in a UK context, and for individual Regional Seas: • The major water masses and residual circulation patterns • Density stratification (influenced principally by temperature and salinity) and frontal zones between different water masses • Tidal flows • Tidal range • Overall patterns of temperature and salinity • Wave climate • Internal waves • Water Framework Directive ecological status of coastal and estuarine water bodies • Eutrophication • Ambient noise Recent assessments of changes in hydrographic conditions are summarised, based mainly on reports by Defra (2010a,b,c), the most recent marine climate change impacts Report Card 2020 (MCCIP 2020) and relevant underpinning scientific reviews (e.g. Tinker & Howes 2020, Sharples et al. 2020, McCarthy et al. 2020) which provide the latest evidence in relation to specific aspects of the water environment at a UK-wide scale. A range of other grey and peer reviewed literature sources are also reviewed. Overall, significant anomalies and changes have been noted in sea surface temperature (SST), thermal stratification, circulation patterns, wave climate, pH and sea level – many appear to be correlated to atmospheric climate variability as described by the North Atlantic Oscillation (NAO). Larger-scale trends and process changes have also been noted in the North Atlantic (e.g. in the strength of the Gulf Stream and Atlantic Heat Conveyor (more properly characterised as the Meridional Overturning Circulation (MOC), or the Atlantic Thermohaline circulation (THC), northern hemisphere and globally. There are varying degrees of confidence in the interpretation of observed data and prediction of future trends. A1d.2 UK context There have been a number of information gathering and assessment initiatives which provide significant information on the current state of the UK and neighbouring seas, and the activities which affect them. These include both UK wide overview programmes and longer term specific monitoring and measuring studies. In addition, a significant number of individual academic studies have been undertaken, focused on UK waters.
-
Upload
khangminh22 -
Category
Documents
-
view
0 -
download
0
Transcript of Appendix 1d: Water Environment - A1d.1 Introduction - GOV.UK

Offshore Energy SEA 4: Appendix 1 Environmental Baseline
A1d.1
Appendix 1d: Water Environment
A1d.1 Introduction
A number of aspects of the water environment are reviewed below in a UK context, and for individual Regional Seas:
• The major water masses and residual circulation patterns
• Density stratification (influenced principally by temperature and salinity) and frontal
zones between different water masses
• Tidal flows
• Tidal range
• Overall patterns of temperature and salinity
• Wave climate
• Internal waves
• Water Framework Directive ecological status of coastal and estuarine water bodies
• Eutrophication
• Ambient noise
Recent assessments of changes in hydrographic conditions are summarised, based mainly on reports by Defra (2010a,b,c), the most recent marine climate change impacts Report Card 2020 (MCCIP 2020) and relevant underpinning scientific reviews (e.g. Tinker & Howes 2020, Sharples et al. 2020, McCarthy et al. 2020) which provide the latest evidence in relation to specific aspects of the water environment at a UK-wide scale. A range of other grey and peer reviewed literature sources are also reviewed. Overall, significant anomalies and changes have been noted in sea surface temperature (SST), thermal stratification, circulation patterns, wave climate, pH and sea level – many appear to be correlated to atmospheric climate variability as described by the North Atlantic Oscillation (NAO). Larger-scale trends and process changes have also been noted in the North Atlantic (e.g. in the strength of the Gulf Stream and Atlantic Heat Conveyor (more properly characterised as the Meridional Overturning Circulation (MOC), or the Atlantic Thermohaline circulation (THC), northern hemisphere and globally. There are varying degrees of confidence in the interpretation of observed data and prediction of future trends.
A1d.2 UK context
There have been a number of information gathering and assessment initiatives which provide significant information on the current state of the UK and neighbouring seas, and the activities which affect them. These include both UK wide overview programmes and longer term specific monitoring and measuring studies. In addition, a significant number of individual academic studies have been undertaken, focused on UK waters.

Offshore Energy SEA 4: Appendix 1 Environmental Baseline
A1d.2
The OSPAR Intermediate Assessment 20171 provides an update on the 2010 Quality Status Report (QSR) assessment as well as presenting some new indicators and assessment methodologies which will inform the next QSR due in 2023 as well as the EU Marine Strategy Framework Directive (MSFD). Similarly Charting Progress 2 (Defra 2010c) provided an updated assessment of the state of UK seas since Charting Progress was published in 2005. Supporting technical reports on ocean processes and clean and safe seas (Defra 2010a,b) provide relevant information on the baseline and issues affecting the water environment.
The EU MSFD establishes a framework within which Member States shall take the necessary measures to achieve or maintain Good Environmental Status (GES) in the marine environment by 2020 at the latest. In the UK the Marine Strategy Regulations 2010 transposes the Directive into UK law. The UK Marine Strategy has three components:
• UK Marine Strategy Part 12: an assessment of marine waters, objectives for GES and
targets and indicators to measure progress towards GES (published December 2012);
• UK Marine Strategy Part 23: sets out the monitoring programmes to monitor progress
against the targets and indicators (published August 2014); and
• UK Marine Strategy Part 34: sets out a programme of measures for achieving GES
(published December 2015).
As part of the second implementation cycle of the Strategy, Defra has updated Marine Strategy Part 1 (Defra 2019)5 to include an updated assessment of the state of UK seas and the progress made since 2012 towards achieving GES; revised objectives for GES and targets for the next cycle (2018 – 2024). With respect to eutrophication and hydrographical conditions, the assessment of progress indicated that GES will likely be achieved by 2020. Looking forward, Defra will continue long-term monitoring programmes to monitor hydrographical conditions and help assess the impacts of climate change, such as sea level rise, sea surface temperature and turbidity. It will continue to work with OSPAR in relation to cumulative effects, and to identify future potential developments likely to be of relevance including the anticipated increased pressure on the marine environment resulting from larger developments such offshore wind energy generation. With respect to marine litter, the UK is unlikely to meet GES by 2020 due to the large reservoirs of litter and plastic in the marine environment which cannot be easily removed. The assessment indicated that there was not enough knowledge of the impacts of anthropogenic sound in the marine environment to provide a robust assessment of the extent that GES will be achieved by 2020.
The Marine Policy Statement (MPS) was published in 2011 and underpins marine spatial planning as part of the Marine and Coastal Access Act 2009. It outlined the UK
1 https://oap.ospar.org/en/ospar-assessments/intermediate-assessment-2017/ 2https://assets.publishing.service.gov.uk/government/uploads/system/uploads/attachment_data/file/69632/pb13860-marine-strategy-part1-20121220.pdf 3https://assets.publishing.service.gov.uk/government/uploads/system/uploads/attachment_data/file/341146/msfd-part-2-final.pdf 4 https://assets.publishing.service.gov.uk/government/uploads/system/uploads/attachment_data/file/486623/marine-strategy-part3-programme-of-measures.pdf also see: https://www.gov.uk/government/consultations/marine-strategy-part-three-programme-of-measures 5https://www.gov.uk/government/publications/marine-strategy-part-one-uk-updated-assessment-and-good-environmental-status

Offshore Energy SEA 4: Appendix 1 Environmental Baseline
A1d.3
Administrations’ vision for the UK marine area, with water quality and resources, and noise identified as high level considerations for marine plan authorities (e.g. Marine Management Organisation). The MPS indicated that marine plan authorities must contribute to or align with delivery of the policies and objectives of relevant River Basin Management Plans (RBMPs) and the MSFD. RBMPs were finalised for all UK River Basin Districts (RBD) in 2009, with updates provided in 2015. The Water Framework Directive sets a target of aiming to achieve at least ‘good ecological status’ in all water bodies by 2015. However, provided that certain conditions are satisfied, in some cases the achievement of good status may be delayed until 2021 or 2027.
The Marine Science Coordination Committee (MSCC)6 is a steering committee (consisting of government departments, devolved administrations, environment agencies and research bodies) aimed at identifying opportunities for the alignment and development of marine science in the UK for the purposes of informing policy and forwarding implementation of the UK Marine Science Strategy (2010-2025). It oversees a number of working groups including the Marine Assessment and Reporting Group (MARG), Marine Environmental Data and Information Network (MEDIN)7, and the UK Integrated Marine Observing Network (UK-IMON)8.
MARG provides overall direction to UK monitoring programmes; in particular, it oversees implementation of the UK Marine Monitoring and Assessment Strategy (UKMMAS). It defines monitoring programmes required to meet national, European and international obligations and commitments for assessing the state of, and managing, the marine environment. Further, MARG commissions, manages and approves periodic assessments of the marine environment, as required for national, European and international purposes. In previous years, MARG has overseen production of Charting Progress 2, a comprehensive assessment of the state of UK seas, and development of the UK’s targets, indicators and monitoring programme under the EU marine strategy framework directive. The group also ensures monitoring methods and quality assurance procedures are fit for the purpose of providing comparable monitoring data across the UK. It also oversees and coordinates the activities of four UKMMAS evidence groups (Clean and Safe Seas Evidence Group, Healthy and Biologically Diverse Seas Evidence Group, Productive Seas Evidence Group, and Ocean Processes Evidence Group) (MSCC Strategic Implementation Plan 2015-2025)9.
MEDIN, which combines the Marine Data and Information Partnership (MDIP), and the Marine Environmental Data Action Group (MEDAG), aims to coordinate accessibility and availability, providing online search interfaces for UK marine environmental data. Available resources include wave, current, sea level and tidal data submitted by over 100 UK organisations, marine monitoring programmes and research cruises. The main activities for the UKMMAS evidence groups and MEDIN over recent years have centred on the development of monitoring programmes under MSFD and associated data management plans, and the establishment of a co-ordinated approach for the storage and retrieval of UK marine data (MSCC Strategic Implementation Plan 2015-202510). MEDIN manage and update the United Kingdom Directory
6 https://www.gov.uk/government/groups/marine-science-co-ordination-committee 7 https://www.medin.org.uk/ 8 http://www.uk-imon.info/ 9 https://assets.publishing.service.gov.uk/government/uploads/system/uploads/attachment_data/file/528400/mscc-strategic-implementation-plan.pdf 10 https://assets.publishing.service.gov.uk/government/uploads/system/uploads/attachment_data/file/528400/mscc-strategic-implementation-plan.pdf

Offshore Energy SEA 4: Appendix 1 Environmental Baseline
A1d.4
of Marine Observing Systems (UKDMOS)11, which provides a database of marine monitoring conducted by UK organisations primarily to assist the coordination of UK monitoring programmes for the UKMMAS.
The UK-IMON draws together existing UK marine observing programmes and observatories, including information within MEDIN, Cefas’ SmartBuoy and WaveNet programmes, longer term monitoring initiatives in the Porcupine Abyssal Plain (PAP)12, Rockall Trough (the Extended Ellett Line now Ellet Array13), the Western Channel Observatory14, and wider UK programmes. In addition the National Network of Regional Coastal Monitoring Programmes for England15 and the Scottish coastal observatory16 provide relevant data.
There are a number of long term data sets covering UK waters, with examples listed by Clark et al. (2001), Defra (2010), MCCIP (2013), Owens (2014), Bean et al. (2017) and Morris et al. (2018). There is a long history (>100 years) of monitoring sea temperatures and stratification around the Plymouth area of the western English Channel (Southward et al. 2005, Western Channel Observatory). Daily sea temperatures have also been recorded for over a century in the Northern Irish Sea at Port Erin, Isle of Man, where long term monitoring of offshore nutrients, salinity and chlorophyll has been carried out for around 60 years, and plankton since the 1990s (Government Laboratory (Isle of Man) 2020). Hydrographic monitoring including temperature, salinity, nutrients and chlorophyll has been carried out at Menai Bridge, Anglesey sporadically since 1948 and regularly since 2000 (Evans et al. 2003) although the current status of this time series is not clear.
Hydrographic processes in the North Channel, Sea of the Hebrides and Minches have been sporadically studied over a long time period (see below for references), with particular focus on the distribution of radionuclides from Sellafield and a long-term mooring deployment in the Tiree Passage maintained by the Scottish Association of Marine Science (SAMS) although as above the current status of this deployment is unclear.
The Extended Ellett Line was started in 1975 and until 1996 effort focused on the Rockall Trough portion of the section often with several occupations each year. From 1996 the section was extended to Iceland with regular measurement of nutrients and oxygen in addition to temperature and salinity17. Since 2018, the project has been developed into the new Ellett Array, under NERC's National Capabilty programme CLASS (Climate Linked Atlantic Sector Science), consisting of moorings, gliders and CTD sections in the Rockall Trough and Hatton-Rockall Basin.
Since the pioneering Porcupine and Lightning studies of 1868-1870 (Thomson 1874), the Faroe-Shetland Channel, and to some extent the Rockall Trough, have been one of the most studied oceanic regions of the world. Two hydrographic sections across the Channel have been surveyed by the Aberdeen Marine Laboratory for over a century (Turrell et al. 1999a, 1999b). Long-term monitoring of water exchange between the Atlantic and Nordic seas was described in SEA 1.
11 http://www.ukdmos.org/ 12 https://projects.noc.ac.uk/pap/ 13 http://prj.noc.ac.uk/ExtendedEllettLine/ 14 https://www.westernchannelobservatory.org.uk/ 15 http://www.channelcoast.org/ 16 https://www2.gov.scot/Topics/marine/Publications/TopicSheets/tslist/ScObs 17 https://www.sams.ac.uk/science/projects/extended-ellett-line/

Offshore Energy SEA 4: Appendix 1 Environmental Baseline
A1d.5
The measurement of waves is a relatively recent development, with only very crude instruments available prior to about 1955 (Defra 2010c). In the 1960s and 1970s, the National Institute of Oceanography equipped a number of lightships around the coastline with ship-borne wave-recorders that used acceleration and pressure fluctuations to provide information on wave height and period (but not direction). The recorders were typically only deployed at each site for 1-2 years, the main exception being at Sevenstones light vessel, which eventually provided one of the longest wave records from UK waters. Wave-following buoys using accelerometers replaced pressure type wave recorders, and by the late 1970s most wave recording was being carried out using these instruments. A wide range of instruments for measuring waves has been developed in recent years, including directional wave buoys, downward looking lasers and HF radar; the satellite altimeter has proved particularly successful for climate studies, providing global coverage. Figure A1d.1 below provides a snapshot from the Cefas WaveNet website showing significant wave height around the UK as recorded at monitoring stations / buoys.
Figure A1d.1: Significant wave height (m) on 11th October 2019 as recorded at WaveNet sites around the UK
Notes: Red arrow = Wave direction; Blue arrow = Wind direction. Source: http://wavenet.cefas.co.uk/Map
A1d.2.1 Water masses and circulation
The North Atlantic Current (NAC) is an important component of the global climate system, bringing warm subtropical water to northwest Europe and influencing the climate of the UK and its surrounding seas. The western continental shelf edge and shelf slope of the UK are influenced by two main oceanic circulation systems of the North Atlantic: the sub-polar and sub-tropical gyres. The main branch of the NAC sweeps eastwards from the western North

Offshore Energy SEA 4: Appendix 1 Environmental Baseline
A1d.6
Atlantic before turning in a more northerly direction and flowing to the west of the Hatton Bank (Pollard et al. 2004). Smaller southerly branches of the NAC enter the Hatton-Rockall area from the north and circulate over the Rockall Bank and further to the south. A branch of the NAC travels north-eastward across the Rockall Plateau and through the Rockall Trough towards the Faroe-Shetland Channel (Pollard et al. 2004).
A poleward flowing Shelf Edge Current (SEC) is present along the continental margin and occupies the upper part of the slope typically above 700m, on both sides of the Wyville Thomson Ridge. Near the southern boundary of Regional Sea 8 it makes an excursion across the slope and onto the shelf (Ellett et al. 1986, Souza et al. 2001) before continuing its path along the slope at the southern end of the Hebrides. The SEC is associated with a relatively strong northward flowing coastal current, the Scottish Coastal Current (SCC) which, although a persistent feature (Simpson & Hill 1986), exhibits spatial variation and is modified by both winds and atmospheric pressure gradients.
North of the Wyville Thomson Ridge, there is substantial inflow to the North Sea via the Fair Isle current and to the north-east of Shetland (Turrell et al. 1992, Nauw et al. 2015, Sheehan et al. 2017). Sources and circulation of water in the North Sea as a whole were summarised by SEA2, which identified (after Turrell 1992, see Figure A1d.2) the major water masses in the North Sea as Atlantic water, Scottish coastal water, north North Sea water, Norwegian coastal water, central North Sea water, south North Sea water, Jutland coastal water and Channel water. The main inflow to the North Sea occurs along the western slopes of the Norwegian Trench, around Shetland and between Orkney and Shetland (Winther & Johannessen 2006). Most of this water however recirculates around the northern and eastern North Sea and exits via the surface Norwegian Coastal Current back into the North Atlantic. Only a small percentage Atlantic-origin inflow flows southwards along the coast of Scotland and England (Howarth 2001) and less than 10% of the inflow to the North Sea enters by the English Channel.
The generalised pattern of water movement in the North Sea is forced by a combination of tides (see Section A1d.2.4), wind patterns, density gradients (caused by freshwater input) and pressure gradients (Howarth 2001). They may also be strongly influenced by short-medium term weather conditions, resulting in considerable seasonal and interannual variability. For example, persistent easterly winds across the whole North Sea basin in February/March 2018 (known as the “Beast from the East”) reversed the circulation of North Sea for more than a month (Stanev et al. 2019). Drastic differences in Atlantic water inflow from year to year, caused by atmospheric forcing, explain some of the observed large scale differences in salinity between years (OSPAR 2000, Nauw et al. 2015). Storm events may also generate nearbed, wave-induced currents sufficient to cause sediment mobilisation. Modelling work on the seasonal variability of different components of forcing shows an increase in the wind element during the autumn and winter seasons in the south-west North Sea region, increasing from 0% forcing in spring and summer to 52 and 66% in autumn and winter (Holt & Proctor 2008). This is reflected in the significant wave heights measured throughout the year. Tidal forcing remains a consistent component throughout the year, with density (related to stratification) differences driving a larger component of the flux in spring and summer (75 and 82% compared to 43-44% for autumn and winter). This is however depth averaged and it can be expected that density forcing plays a lesser role in the shallower nearshore regions away from significant freshwater inputs.
The tidal movement in the Irish Sea and English Channel are both from a southerly direction, with a generalised decrease in tidal amplitude with distance caused by bottom friction.

Offshore Energy SEA 4: Appendix 1 Environmental Baseline
A1d.7
Figure A1d.2: Major water masses and residual circulation in the North Sea

Offshore Energy SEA 4: Appendix 1 Environmental Baseline
A1d.8
A1d.2.2 Stratification and frontal zones
Fronts or frontal zones mark boundaries between water masses, including tidally-mixed and stratified areas, and are numerous on the European continental shelf. Tidal mixing fronts normally form in summer months around the UK, when stratification occurs away from the coast due to more settled weather. Salinity fronts are observed all year round and occur where freshwater runoff occurs (e.g. mouths of estuaries and sea lochs), or where there is greater influence of saline ocean waters. Persistent localised fronts can also occur around topographical features, such as islands, banks, deeps and channels, due to their interaction with currents. Internal waves and eddies are also persistent features in these areas. Around the UK, the Flamborough and Islay Fronts have been extensively studied, as has density stratification of the water column in the western English Channel and Irish Sea.
Density stratification is well developed in the summer months of most years in the central and northern North Sea, with the relative strength of the thermocline determined by solar heat input and turbulence generated by wind and tides. The shallow parts of the southern North Sea remain well mixed throughout the year due to tidal action (OSPAR 2010) although the Kattegat, Skagerrak and Norwegian Trench region of the North Sea have stable salinity stratification all year. Further discussion is provided in Section A1d.2.5.
The UKSeaMap project (Connor et al. 2006) developed maps to represent the seasonal ecological character of the water column, using surface salinity, surface to bed temperature difference and frontal probability (i.e. the number of days the horizontal temperature difference between neighbouring modelled locations exceeded 0.5ºC, divided by the number of days in the season over the 10-year run). This analysis emphasized the importance of the Flamborough Front; and also frontal development around the Dogger Bank, along the east coasts of mainland Scotland (north of the Tay), outer Moray Firth and Shetland in summer (Figure A1d.3).
Van Leeuwen et al. (2015) identified five regimes using an applied ecosystem model: permanently stratified, seasonally stratified, intermittently stratified, permanently mixed, and Region Of Freshwater Influence (ROFI). Twenty nine percent of the North Sea did not fall under a specific regime category due to high interannual variability, but overall the regimes were found to be remarkably stable in the model. McQuatters-Gollop et al. (2020) extended coverage of these ecohydrodynamic regimes to the Celtic Seas, noting that the North Sea model was more highly resolved (van Leeuwen et al. 2015), and therefore the zoning might be less reliable in the case of the Celtic Seas and western English Channel (Figure A1d.4).
Typically, a frontal system includes a narrow (typically a few km wide) jet-like current driven by the horizontal density difference (Rodhe 1998). In particular, jets are associated with the margins of cold (or salty) dense pools that remain trapped in deep basins during the summer months after the onset of summer stratification. Although relatively narrow, they can transport water over many hundreds of kilometres. The timing of the onset of this seasonal circulation is dependent on wind mixing, surface heat fluxes and freshwater input, and may vary by up to a month (Brown et al. 1999, 2003). Satellite imagery shows that at the southern boundary of Regional Sea 1, the central North Sea from Flamborough Head to the Frisian Islands is frequently characterised by a thermal front marking transition zones between mixed and stratified water in the North Sea (Pingree & Griffiths 1978, Becker 1990). A persistent narrow (10-15km) near-surface flow between the Firth of Forth and the Dogger Bank has also been noted (Brown et al. 2001), driven by bottom density fronts that fringe the dense pool of cold winter water formed in the central North Sea following stratification.

Offshore Energy SEA 4: Appendix 1 Environmental Baseline
A1d.9
Figure A1d.3: Seasonal water mass and water column structure in UK waters

Offshore Energy SEA 4: Appendix 1 Environmental Baseline
A1d.10
Figure A1d.4: Ecohydrodynamic zones in the Greater North Sea (OSPAR Region II) and Celtic Seas (OSPAR Region III)
Notes: The main EHD zone types, based on water-column structure, are 1) permanently mixed throughout the year, 2) permanently stratified throughout the year, 3) regions of freshwater influence (ROFIs), 4) seasonally thermally stratified (for about half the year, including summer), 5) intermittently stratified and 6) indeterminate regions (inconsistently alternate between the above levels of stratification). Source: McQuatters-Gollop et al. (2019), based on van Leeuwen et al. (2015)
The Islay Front, between the Scottish and Irish coasts is a complex, seasonally distinctive front in which both salinity and temperature play a role in controlling the density structure. The Islay Front is also associated with strong residual currents parallel to the front, and enhanced phytoplankton standing crop (Simpson et al. 1979). Similarly, during spring and summer a complex patchwork of mixed and stratified areas develop within the Irish Sea determined primarily by thermal inputs and tidal mixing (Neil et al. 2012).
In coastal areas, surface heating and settled weather in late summer and autumn can often cause temporary thermoclines to develop (Heath et al. 1999). Temperature and salinity patterns are more complex within the semi-enclosed firths and estuaries (see below).

Offshore Energy SEA 4: Appendix 1 Environmental Baseline
A1d.11
A1d.2.3 Coastal tidal flows
Bathymetry plays a significant role in modifying coastal tidal and residual currents, especially in the North Sea (Nauw et al. 2015). Maximum surface tidal streams, which vary from 0.25 to 0.5m/s over much of the northern North Sea, are in excess of 1.0m/s on the Orkney-Shetland Platform (Pantin 1991). Over the central North Sea, tidal currents are strongest in shallow coastal areas (see below), where the tidal stream is aligned parallel to the coast. Maximum surface current speeds are mainly in excess of 0.5m/s out to about 50km offshore, decreasing eastwards to less than 0.25m/s (Gatliff et al. 1994, ABPmer et al. 2008).
Along the east coast of northern England and mainland Scotland, there is a general southern flood and northern ebb tidal flow, the pattern being complicated by coastal topography, fluvial flow and wind-induced currents. A near surface coastal current (10-15km wide) flows southwards, following the 40m depth contour, from the Firth of Forth to the Dogger Bank (Hill et al. 2008).
Tidal streams reach considerably higher velocities (3.5-4.5m/s) in certain parts of Regional Sea 1, notably in Shetland near Muckle Flugga, in Yell Sound, Linga Sound, Bluemull Sound and near Sumburgh Head; and around Orkney in Hoy Sound and the Pentland Firth (Figure A1d.5). Maximum east-travelling surface tidal streams of 5.3m/s are recorded on the west margin of the Pentland Skerries and near-bed spring tide currents are more than 2.75m/s near the head of the Sandy Riddle decreasing rapidly to around 0.9m/s further to the south-east (Holmes et al. 2004).
The tidal currents in the English Channel flood eastwards and ebb westwards with a maximum rate off Portland Bill at the western end of Regional Sea 3, where they may reach over 3.5m/s. For much of the central part of the English Channel the maximum speed of tidal currents is between 0.75 and 1.25m/s. One peculiar feature of the tides in the central part of the English Channel is the distortion of tidal curves due to the effect of shallow water.
The tide propagates into the Irish Sea from the Atlantic Ocean through both the St George’s Channel and the North; the tidal waves from both directions meet to the south-west of the Isle of Man causing this to be an area of very weak tidal currents (<0.35m/s). Areas of strong tidal currents (depth-averaged values up to 2m/s at spring tides) and hence of vigorous tidal mixing and peak bed stresses are generally throughout St George’s Channel, north west of Anglesey, north of the Isle of Man and in the North Channel.
Through the North Channel and west of mainland Scotland, there is a general northern flood and southern ebb tidal flow, the pattern being complicated by coastal topography, fluvial flow and wind-induced currents with maximum tidal currents in the North Channel and south of Islay (more than 4.0m/s inside Rathlin Island), Gulf of Corryvreckan, Sound of Islay, Firth of Lorne and Sound of Mull.
A1d.2.4 Tidal range
Details of the mean spring tidal range around the UK are presented in Figure A1d.6. It shows that the areas with the greatest tidal range are located within the wider Severn Estuary and around the Channel Islands. The highest astronomical tide recorded at the port of Avonmouth, within the Severn Estuary, in 2015 measured 14.65m (National Tidal and Sea Level Facility). Tidal ranges greater than 6m also occur in The Wash, eastern English Channel and wider Liverpool Bay and Solway Firth. Table A1d.1 details all estuaries within England and Wales with tidal ranges >6m.

Offshore Energy SEA 4: Appendix 1 Environmental Baseline
A1d.12
Figure A1d.5: Peak flow for mean spring tide

Offshore Energy SEA 4: Appendix 1 Environmental Baseline
A1d.13
Table A1d.1: Estuaries with a tidal range of 6m or above in England and Wales
Estuary Regional Sea Tidal range (m)
Severn Estuary 4 12.3
Bridgwater Bay 4 11.1
Thaw Estuary 4 10.5
Blue Anchor Bay 4 9.7
Ogmore Estuary 4 8.9
Mersey Estuary 6 8.9
Afan Estuary 4 8.6
Neath Estuary 4 8.6
Tawe & Swansea Bay 4 8.6
Morecambe Bay 6 8.4
Inner Solway Firth 6 8.4
Duddon Estuary 6 8.1
Alt Estuary 6 8
Ribble Estuary 6 7.9
Esk Estuary 6 7.7
Dee & N. Wirral 6 7.6
Carmarthen Bay 4 7.5
Taw-Torridge Estuary 4 7.3
Loughor Estuary 4 7.1
Conwy Estuary 6 7.1
Traeth Lafan 6 6.9
Clwyd Estuary 6 6.7
Dee Estuary 6 6.7
The Wash 2 6.5
Inner Thames Estuary 2 6.5
Cuckmere Estuary 3 6.5
Gannel Estuary 4 6.4
Traeth Dulas 6 6.4
Traeth Coch 6 6.4
Milford Haven 6 6.3
Ouse Estuary 3 6.1
Humber Estuary 2 6
Source: The Estuary Guide website - http://www.estuary-guide.net/

Offshore Energy SEA 4: Appendix 1 Environmental Baseline
A1d.14
Figure A1d.6: Mean spring tidal range around the UK

Offshore Energy SEA 4: Appendix 1 Environmental Baseline
A1d.15
Conversely, the areas where tidal range is at a minimum, called amphidromic points or tidal nodes (shown on Figure A1d.7), occur off the south coast of England; between Islay, the Mull of Kintyre and the Northern Irish coast; the south-western Irish Sea; the centre of the North Sea offshore Denmark; southern North Sea, offshore The Netherlands; and the south-western coast of Norway. The general tidal flow pattern of the North Sea (see Section A1.d.2.1) is influenced by these points, with the tidal wave entering the northern North Sea and travelling southwards down the UK coastline before travelling around the amphidromic points offshore The Netherlands and Denmark and leaving the North Sea along the Norwegian coast (Nauw et al. 2015). The tidal range increases outward from each amphidromic point (Reynaud & Dalrymple 2012).
Figure A1d.7: M2 co-tidal lines and amphidromic points in UK waters
Isles
Source: Reynaud & Dalrymple (2012), after Sinha & Pingree (1997)
A1d.2.5 Temperature and salinity
Sea surface temperature and salinity values in the northern North Sea are to a large extent influenced by the flow of oceanic Atlantic waters into the North Sea through the Fair Isle Channel (Turrell et al. 1992). Oceanic inflow combines with less saline coastal waters to make up a southern flow down the Scottish east coast.
In coastal waters, land run-off is important in determining temperature and salinity profiles. For example, in Regional Sea 7, strong temperature gradients may coincide with the low-salinity surface layer that can develop in sea lochs. Sea surface temperatures in Regional Sea 3 are

Offshore Energy SEA 4: Appendix 1 Environmental Baseline
A1d.16
strongly influenced by the movement of water along the English Channel which modifies the influence of continental Europe. In winter, relatively warm waters move up the English Channel and average February temperatures range between 6.5ºC and 8ºC.
A number of water masses, characterised by their salinity and temperature characteristics, are known to be present in the deep oceanic channels of Regional Seas 9, 10 and 11, and studies have shown there to be distinct differences due to density stratification and separation by topographic features (notably the Wyville Thomson Ridge).
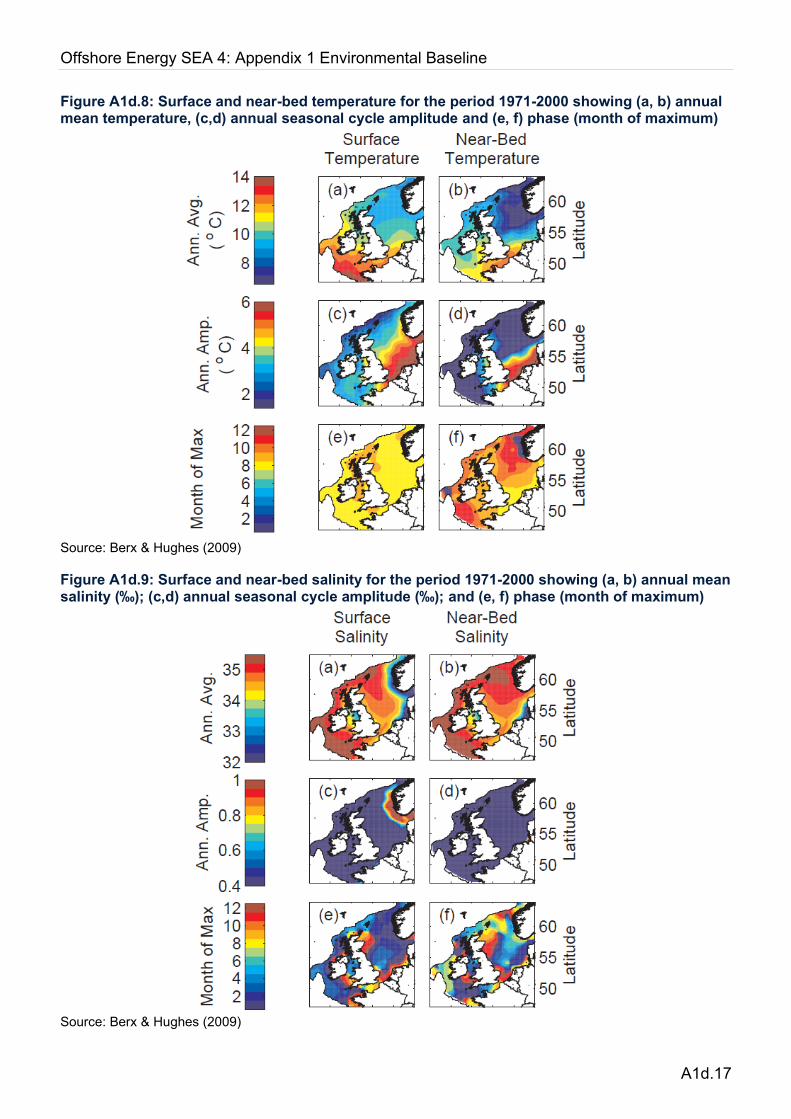
An improved dataset of near surface and bottom temperature and salinity on the north-west European continental shelf by Berx & Hughes (2009) for the years 1971-2000 is shown in Figures A1d.8 and A1d.9. The average temperature for the area (Figure A1d.8a) shows a decrease with increasing latitude and an influence of water from the North Atlantic entering the North Sea from the north. The greatest seasonal variations in temperature occur in the shallow southern part of the North Sea and German Bight where the water column remains well mixed throughout the year. In comparison the northern part of the North Sea has a low annual amplitude especially in near bed temperatures due to the development of seasonal stratification which blocks the mixing of warmer surface waters to depth. This seasonal stratification is also evident in Figures A1d.8e and f which show that in surface waters the month of maximum temperature is uniformly late August / early September but in near bed waters it occurs during October in areas with seasonal stratification. This is because it is only when the thermocline breaks down that warmer surface waters can be mixed to depth. The salinity data (Figure A1d.9a & b) clearly shows the influence of the North Atlantic Current, with increased salinity to the west of the area. Berx & Hughes (2009) state that a clear seasonal signal can only be identified in the Baltic outflow, with all the other areas falling below the 95% confidence boundaries.
A1d.2.6 Wave climate
In British waters, the Western Isles experience the highest wave heights throughout the year (mean significant wave height (Hs) of ca. 3.0m over the winter months (Figure A1d.10). Significant wave heights can, however, exceed 10-15m in these areas during annual storm events (WaveNet website - https://www.cefas.co.uk/cefas-data-hub/wavenet/). The east coast of Shetland, Orkney and the Scottish mainland is more sheltered and less frequently exposed to large, powerful waves than the west. However, North Sea storms and swells can result in relatively large wave heights although only swell waves from the north-east are able to penetrate to the inner Firths due to the protection afforded by the coastal topography (Stapleton & Pethick 1996). Incident waves from this direction occur for only 29% of the year. Mean significant wave heights for the more sheltered central and southern North Sea, Irish Sea, English Channel and inshore waters are low at generally <1.5m.
The wave climate is strongly seasonal (see Figure A1d.10) with maximum mean wave heights peaking around January, although extreme waves may be encountered at other times, most notably between November and March. Again more sheltered areas have the smallest seasonal variability in significant wave height, with the Atlantic Ocean area showing the largest variability (Woolf et al. 2002).
Offshore Energy SEA 4: Appendix 1 Environmental Baseline
A1d.17
Figure A1d.8: Surface and near-bed temperature for the period 1971-2000 showing (a, b) annual mean temperature, (c,d) annual seasonal cycle amplitude and (e, f) phase (month of maximum)
Source: Berx & Hughes (2009)
Figure A1d.9: Surface and near-bed salinity for the period 1971-2000 showing (a, b) annual mean salinity (‰); (c,d) annual seasonal cycle amplitude (‰); and (e, f) phase (month of maximum)
Source: Berx & Hughes (2009)

Offshore Energy SEA 4: Appendix 1 Environmental Baseline
A1d.18
Figure A1d.10: Seasonal mean significant wave height

Offshore Energy SEA 4: Appendix 1 Environmental Baseline
A1d.19
A1d.2.7 Coastal and estuarine water bodies
River Basin Management Plans (RBMP) were published by the relevant devolved national authority (SEPA, EA, NRW and DOE) in 2009 for all UK River Basin Districts (RBD) under the Water Framework Directive (WFD). One of the primary objectives of the WFD is to achieve ‘good ecological status’ for all surface waters, including coastal and transitional (estuarine) water bodies. Additional objectives include; preventing the deterioration of the status of the water body, achieving standards and objectives for protected areas and cessation of discharges, emissions and loses of hazardous substances into surface waters. The initial plans covering the period 2009-2015 were updated in 2015, assessing the progress made against the first plans and revised measured required to meet targets by the next review period in 2021. Consultations on the third RBMP cycle have been, or are currently taking place in Scotland18, England19 and Northern Ireland20).
The WFD classification scheme for water quality includes five status classes: high, good, moderate, poor and bad. Annex V of the WFD provides a general definition of good status for rivers, lakes, transitional waters and coastal waters: “The values of the biological quality elements for the surface water body type show low levels of distortion resulting from human activity, but deviate only slightly from those normally associated with the surface water body type under undisturbed conditions”. More specific definitions including of chemical and biological quality elements are also detailed in Annex V. The current status of relevant RBDs is described below in Table A1d.2.
Table A1d.2: Current extent and status of estuarine and coastal water bodies
River Basin
District
Number of water bodies in the
RBD
Percentage of water bodies at
good or better overall status
(2015)
Estuarine Coastal Estuarine Coastal
Scotland 381 4491 87%1 99%1
Solway Tweed 101 81 90%1 100%1
Northumbria 7 7 14% 57%
Humber 7 2 29% 0%
Anglian 18 13 11% 15%
Thames 10 1 50% 0%
South East 23 11 22% 36%
South West 23 23 17% 61%
Severn 6 0 0% -
Western Wales 282 232 14%2 39%2
18 https://www.sepa.org.uk/environment/water/river-basin-management-planning/ 19 https://consult.environment-agency.gov.uk/environment-and-business/river-basin-management/ 20 https://www.daera-ni.gov.uk/consultations/river-basin-planning-3rd-cycle-timeline-consultation

Offshore Energy SEA 4: Appendix 1 Environmental Baseline
A1d.20
River Basin
District
Number of water bodies in the
RBD
Percentage of water bodies at
good or better overall status
(2015)
Estuarine Coastal Estuarine Coastal
Dee 12 0 0%2 -
North West 11 5 27% 60%
North Western
IRBD
2 1 0% 100%
Neagh-Bann IRBD 2 3 0% 33%
North Eastern IRBD 2 15 0% 47%
Notes:
1. Data for 2017, https://www.sepa.org.uk/data-visualisation/water-classification-hub/,
2. 2018 C2 interim classification data https://drive.google.com/file/d/14w17jL05sNuToVELqMCK_yc6DdHU7STb/view?usp=sharing
Sources: UK Government website - https://www.gov.uk/government/collections/river-basin-management-plans-2015, Natural Resources Wales website - http://waterwatchwales.naturalresourceswales.gov.uk/en/, Scottish Government website - https://www.sepa.org.uk/data-visualisation/water-classification-hub/, Northern Ireland Department of the Environment website - https://www.daera-ni.gov.uk/topics/water/river-basin-management
Flood Risk Management Plans (FRMP) are published by the Environment Agency for England and Natural Resources Wales for Wales covering all areas where there is a significant risk of flooding from main rivers, the sea and reservoirs. The initial plans were published in December 2015 by RBD.
A1d.2.8 Ambient noise
Ambient noise is made up of contributions from many sources, both natural and anthropogenic. These sources add together in a complex manner resulting in significant spatial and temporal variations in the noise field. In recent years there has been an increasing awareness that offshore activities have contributed to significant increases in the levels of underwater ambient noise.
The wide range of ambient noise sources include natural physical sources (e.g. wind, precipitation, sediment transport and shore/surf noise); biological noise (e.g. fish and crustacean species) and anthropogenic sources such as commercial shipping, aggregate extraction, industrial sources, military sources, fishing and aircraft. These sources differ with respect to their physical characteristics and may be described using their sound pressure level, spectrum level, rise time, duty cycle and repetition rate (Hildebrand 2009).
Ambient noise is generally made up of three constituent types – wideband continuous noise, tonals and impulsive noise (Hildebrand 2009). The latter is transient in nature and is usually of wide bandwidth and short duration. It is best characterised by quoting the peak amplitude and repetition rate. Continuous wideband noise is normally characterised as a spectrum level,

Offshore Energy SEA 4: Appendix 1 Environmental Baseline
A1d.21
which is the level in a 1Hz bandwidth. This level is usually given as intensity in decibels (dB) relative to a reference level of 1 micro Pascal (µPa). Tonals are very narrowband signals and are usually characterised as amplitude in dB re 1µPa and frequency. Ambient noise covers the whole acoustic spectrum from below 1Hz, to well over 100kHz. Above this frequency the ambient noise level drops below thermal noise levels.
In deep water the levels of ambient noise are now well defined and the contributions from various sources well understood and categorised according to dominant source and frequency (Urick 1983). In contrast, comparatively shallow water areas (e.g. parts of the Irish Sea and the southern North Sea) were not well studied until recently when information was required to support renewable energy developments in coastal waters (Nedwell et al. 2003). The same authors noted that ambient noise levels in sites utilised for offshore wind farm developments (shallow water shoals) were toward the upper bound of deep water ambient noise levels, due to contributions from natural sources such as surface noise (waves) and anthropogenic sources such as shipping. Propagation losses through the seabed can be significant in shallow coastal waters, but noise from high intensity events such as pile driving can be detectable above background underwater noise for tens of kilometres (Nedwell et al. 2007, Bailey et al. 2010).
In addition to the variety of ambient noise sources and characteristics, there are additional effects which will modify the level and spectral content of the ambient sound field. The effects of density variations on acoustic propagation, losses at the seabed and water surface and multi-path effects are discussed by Harland et al. (2005). Under conditions of low wind speeds and with no precipitation noise, shipping noise is likely to dominate across large parts of the UK continental shelf. Shipping noise will be important in proximity to major port developments. In some offshore areas, ambient noise is likely to be dominated by industrial noise from production facilities (notably where turbines are used for gas compression). Operational noise characteristics associated with oil & gas, and wind farm developments are considered in Section 5.3 of the Environmental Report.
Underwater noise is part of Descriptor 11 of the MSFD aiming for Good Environmental Status (GES) by 2020. The ongoing development of a suitable surveillance indicator to monitor trends in ambient noise was informed by monitoring of noise levels at twelve sites in the Greater North Sea and Celtic Seas (Merchant et al. 2016, Merchant 2018). The monitoring study carried out using field data recorded in 2013 and 2014 provided baseline levels for each of the monitoring locations. Median noise levels in the North Sea were 90.5 dB re 1 µPa in the 63-Hz band, and 93.6 dB re 1 µPa in the 125-Hz band, based on the aggregate median across 10 monitoring locations. In the Celtic Sea, median levels at the single monitoring location were 82.0 dB re 1 µPa and 83.3 dB re 1 µPa for the 63- and 125-Hz bands, respectively. Merchant et al. (2016) concluded that higher percentiles of the noise level distribution (such as 90th percentile) may be more responsive to changes in noise levels from passing ships than the median level (50th percentile), and so may be a more appropriate metric for the assessment. At present, it is unclear whether the ambient noise levels reported may have negative impacts on marine life at the population or ecosystem scale. The analysis revealed that trend detection for this Indicator will require several decades of monitoring, which is incompatible with the 6-year assessment cycle of the UK Marine Strategy21.
Given the significant transnational aspect, the UK coordinates with OSPAR Contracting Parties through the Intersessional Correspondence Group on Noise (ICG-NOISE) and is collaborating
21 https://moat.cefas.co.uk/pressures-from-human-activities/underwater-noise/ambient-noise/

Offshore Energy SEA 4: Appendix 1 Environmental Baseline
A1d.22
with other OSPAR Contracting Parties on two proposals for joint noise monitoring, one covering the Greater North Sea (JOMOPANS)22, the other covering the Atlantic Area (JONAS)23. As part of JOMOPANS, monthly maps of depth-averaged sound pressure levels will be produced (based on numerical modelling and measurements at a number of sites in the North Sea) which it is hoped will enable marine managers and policy makers to identify where noise may adversely affect the North Sea ecosystem24.
A1d.3 Features of Regional Sea 1
There are a number of Scottish coastal observatory sites within Regional Sea 1 including Cromarty, Stonehaven and St Abbs. Stonehaven has been sampled since 1999 with data collected on water temperature, salinity, ocean acidification, pigments, nutrients and phytoplankton. Three coastal stations at Blyth (since 1977), Redcar (1966-2000) and Scarborough (since 1970), are part of the long term Cefas coastal temperature network recording water temperature25. As part of the Wavenet programme, seven nearshore stations record sea temperature and wave characteristics such as significant height, and eighteen offshore stations (primarily associated with oil and gas installations) record wave and wind characteristics. For example, Figure A1d.11 highlights significant wave heights recorded by a waverider buoy located in the central Moray Firth in 54m water depth and the Tyne/Tees buoy in 69m water depth over the last year (November 2018-2019). Noting the different vertical scales, wave heights appear to be slightly greater at the Tyne/Tees location perhaps reflecting the more sheltered nature of the Moray Firth.
Figure A1d.11: Significant wave heights recorded (a) Moray Firth and (b) Tyne/Tees, November 2018-November 2019
a) b)
Source: http://wavenet.cefas.co.uk/Map
The tidal streams present in the Moray Firth are complex and variable in direction (Adams & Martin 1986). Due to the passage of the tidal wave across the outer Firth, tidal currents are stronger in this area than inshore, where topographically induced localised gyres occur (Adams & Martin 1986). Within the inner Moray Firth most of the area is subject to currents of less than 0.5m/s (Stapleton & Pethick 1996). In general, the tides in the outer Firth flood in a north to south-easterly direction, reversing to ebb northwards. However, in the inner Firths of the
22 https://northsearegion.eu/jomopans/about/ 23 https://www.jonasproject.eu/ 24 https://northsearegion.eu/media/10668/interreg_jomopans-policy-brief_a4_web_spreads.pdf 25 https://www.cefas.co.uk/cefas-data-hub/sea-temperature-and-salinity-trends/presentation-of-results/

Offshore Energy SEA 4: Appendix 1 Environmental Baseline
A1d.23
Dornoch, Cromarty and Beauly/Inverness, the tides trend in a more easterly direction. Along the southern shore of the Firth, a notable feature of the tidal current pattern is a flood lasting approximately nine hours of the tidal cycle, with an insignificant ebb flow for the remaining three hours. This phenomenon occurs up to 8km offshore and is a result of the southern Moray coastline sheltering the area from the north flowing ebb current (Dooley 1973). The resultant residual current is an eastward flow along the southern shore of the outer Firth (Adams & Martin 1986).
South of the Tay estuary, the south-going flood tide forms a large clockwise eddy in St Andrews Bay spilling over Abertay sands into the main Tay channel (Charlton et al. 1975). Within the estuary, current velocities can be high with peak spring flood velocities of 1.15m/s to the south west of Buddon Ness. The Tay has the largest mean annual flow of all British rivers (164m3/s; Gilvear et al. 2002), with salinity measurements increasing offshore away from this freshwater input (Berx & Hughes 2009). Sand waves to the west of the Newcombe shoal are also evidence of considerable flow velocity (Charlton et al. 1975). River flow variations can have a significant effect on the tidal regime causing complex patterns of water movement (Ramsay & Brampton 2000).
Typical peak tidal flow velocities at Rosyth in the Firth of Forth are 0.7-1.1m/s on the ebb and 0.4-0.7m/s on the flood, with generally weaker flows seaward of this location. In general, the flood currents are stronger on the north side of the Firth and the ebb stronger on the southern shore. Tidal currents produce a drift westwards along the northern and central Firth, compensated by an eastward flow of water along the southern shore. However, during certain times of year, usually late winter and spring, a seaward flow may also develop along the northern shoreline if the water near the coast becomes stratified.
A shallow and narrow shelf platform (~10km wide and <30m deep) extends from the Firth of Forth down to Flamborough Head, with the seabed shelving smoothly eastwards away from the coast to depths of >70m and up to 110m in the Farn Deeps.
North of the Farne Islands, the nearshore maximum tidal current speed during mean spring tides is 0.5m/s, increasing to about 0.7m/s in Tees Bay. The tidal current flow offshore runs more or less north to south, but closer to the shore the flow is affected by the form of the coast. For example, tidal currents are stronger around headlands such as Flamborough Head (up to 1.5m/s), and eddies or gyres may form within embayments such as Druridge Bay and Hartlepool Bay.
In winter, low salinity surface waters from land run-off within the inner Moray Firth and along its southern coast form a distinctive colder stream close to the southern shore which can be over 1ºC colder than bottom waters. Salinity distributions within the major estuary systems of the Forth and Tay have been extensively studied, partly in relation to their influence on contaminant dispersion. The River Tay and the River Earn together form the major systems draining into the Tay estuary, and between them contribute the greatest volume of freshwater of any river basin in the UK (Pontin & Reid 1975). The estuary is generally turbulent and well mixed, although there is evidence of a saline ‘wedge’ penetrating as far as the narrows at Tayport, where the vertical salinity difference is about 7‰. This wedge is probably formed by saline water coming over the Abertay sands from St Andrews Bay and plunging under the main flow coming down the main channel (Charlton et al. 1975). Within the Forth estuary (upstream of the bridges), the dominant water movement is tidal, with the influence of freshwater from rivers being relatively low. Further to seaward, there is more dilution from rivers on the south shore of the Firth than the north, leading to an outgoing stream of diluted water (32-34‰) along the southern side which is generally distinguished as far seaward as St Abbs Head.

Offshore Energy SEA 4: Appendix 1 Environmental Baseline
A1d.24
A1d.4 Features of Regional Sea 2
The NERC North Sea Project (1987–1992) included studies of the Flamborough Head frontal system, Humber and Thames plumes and resuspension processes, and detailed study of the southern North Sea sandwave system.
The NERC Land Ocean Interaction Study (LOIS) was a 6 year project (1992 - 1998) which aimed to quantify and simulate the fluxes and transformations of materials (sediments, nutrients, contaminants) into and out of the coastal zone. The main study area, embracing river catchments, estuaries and coastal seas, was the east coast from Berwick upon Tweed to Great Yarmouth, concentrating on the Humber and its catchment, and to a lesser extent the River Tweed. LOIS comprised seven components studying riverine, atmospheric, estuarine, coastal and shelf processes, including a major geological study of the sedimentary record in a traverse of the coastal zone to determine how sediment fluxes have influenced sea level, climate and land use. The Flamborough front has been intensively studied (Prandle & Matthews 1990, Lwiza et al. 1991, Gmitrowicz & Brown 1993) including a collaborative experiment in 1988 by MAFF, POL and UCNW which involved Ocean Surface Current Radar (OSCR), ship-borne Acoustic Doppler Current Profiler (ADCP), Lagrangian drifters and moored current meters. Observations of the physical structure of the region between the Northumberland coast and north Dogger Bank were made in 1996 using towed undulating CTD and satellite-tracked drifting buoys, to test for the presence of a summer cold pool system and associated jet circulation in this area (Brown et al. 1999). A more detailed survey of the coast from the Forth to Flamborough Head was also carried out in 1997 (Brown et al. 2001). Strong bottom fronts were observed to bound a cold pool isolated beneath the thermocline, extending continuously for 500km along the 40m contour, from the Firth of Forth to the eastern end of the Dogger Bank. Persistent and narrow (10-15km) cores of cyclonic near-surface flow were also observed with velocities in excess of 0.1m/s.
In general, maximum velocities are below 1.0m/s in the nearshore region, except in the vicinity of major headlands (Flamborough Head, Spurn Point and South Foreland) where peak velocities may reach 2.0m/s. A Defra funded project (AE1225) utilising drifters in the region shows the position of organised summer flows (0.15m/s) north of the Flamborough Front away from the English coastline along the northern edge of Dogger Bank and northeast into the Skaggerak (Figure A1d.12). This figure also shows associated flows (~0.1 m/s) south-west along the southern edge of Dogger Bank and anticlockwise around the edge of the stratified region at the southern end of the Oyster Grounds (Fernand 2006).

Offshore Energy SEA 4: Appendix 1 Environmental Baseline
A1d.25
Figure A1d.12: Drifter tracks in the central and southern North Sea with arrows showing main flow pathways
Source: Cefas (2006)
Significant local variations in patterns of semi-diurnal tidal and residual circulation occur in the vicinity of sandbanks. Bedforms and current meter measurements around the Leman and Well Banks, Smith’s Knoll and Hewett Ridges have demonstrated residual near-bed currents to be strongest towards the bank crestline and in opposing directions on either side of the bank (Caston & Stride 1970, Caston 1972, Huthnance 1973). Current records on each side of Well Bank also demonstrated a clockwise near-bed residual circulation around the bank (Howarth & Huthnance 1984, Collins et al. 1995), with maximum semi-diurnal amplitude around 0.75m/s. This residual circulation pattern is considered to be important in the formation and maintenance of linear sandbanks and will also influence the dispersion of soluble and particulate contaminants.
In winter, the waters in the north of Regional Sea 2 are some of the coldest areas of the UK (Jones et al. 2004); however, sea-surface temperatures increase southwards (from 5 to 7ºC) in February. This is a result of a wedge of relatively warm water extending up from the English Channel which prevents water temperatures dropping below 5ºC. In August, temperatures again increase progressively to the south (from 14 to 16.5ºC), reflecting increased proximity to the warm European landmass. The waters here are also well mixed at that time of year and show no stratification, whereas in the north bottom temperatures are 2-3ºC lower than the surface temperatures. A series of nine measurements points for temperature and salinity along the ferry route from Harwich to Rotterdam have been taken on a weekly basis since 197026. These provide a transect across the southern North Sea and show slightly reduced seasonality in temperatures in the deeper water at the centre of the transect as opposed to the shallower coastal ends.
26 https://www.cefas.co.uk/cefas-data-hub/sea-temperature-and-salinity-trends/presentation-of-results/ferry-route-data/

Offshore Energy SEA 4: Appendix 1 Environmental Baseline
A1d.26
The southern North Sea receives significant freshwater input from the rivers along its eastern boundary and is, as a consequence, less saline than the northern North Sea (Defra 2004). Saline water of North Atlantic origin enters the southern North Sea via the Dover Straits, and this tends to lead to generally more salty water in the most southerly parts of the North Sea.
A1d.5 Features of Regional Sea 3
Regional Sea 3 is characterised by a reasonably well-defined transition between two marine provinces, centred on the Solent. The Eastern Channel is largely influenced by cool Boreal water (which dominates the North Sea system), whereas the western part of the Channel is influenced by relatively warmer Lusitanian water, which comes in part from the North Atlantic Current and in part from the water leaving the Mediterranean. Overall, there is a residual flow of water entering the North Sea from the eastern end of the English Channel, though this accounts for just 10% of the inflow into the North Sea (Howarth 2001).
Circulation patterns in the English Channel, and exchange with the North Sea via the Dover Strait, have been studied using radioactive tracers. For example, seven oceanographic campaigns carried out in the North Sea and Channel by the Marine Radioecology Laboratory (LRM) of La Hague have led to the drawing of general maps showing the distribution of the radionuclides 125Sb, 137Cs, 134Cs and 99Tc in seawater (Bailly du Bois et al. 1995, 1997). On this basis, it is possible to link the flux of radionuclides released from the nuclear fuel reprocessing plant at La Hague (125Sb and 99Tc) with the inventories of radiotracers observed in the southern North Sea. Hence, the most probable mean transit time of Channel waters entering the North Sea were calculated; Channel waters take 110–152 days to flow from Cap de la Hague to the Straits of Dover and 170–250 days to travel from there to the entrance of the Baltic. The water flux through the Straits of Dover was estimated to lie in the range 97,000–195,000m3/s for the period between January and July 1988.
Within Regional Sea 3 there is only one weak front, which lies to the south-east of the Isle of Wight parallel to the coast. Generally speaking, the whole of the eastern Channel is non-stratified, due to the relatively shallow water depth combined with the effects of tidal and wind-generated water movements.
The tidal currents in the English Channel generally flood eastwards and ebb westwards. The maximum tidal current speed at the eastern end of the Regional Sea is at Dover (about 1.75m/s) owing to the restriction of the Channel (Figure A1d.13). Stronger tidal currents in the western-central Channel occur off Portland Bill, where they may reach over 3.5m/s, and off the French coast where extreme current velocities of 4.6m/s have been recorded (James et al. 2007). Strong tidal currents, often with associated overfalls, occur off pronounced headlands such as Selsey Bill, St Catherine’s Point and St Alban’s Head. Within the main embayments, such as Rye Bay on the Kent/East Sussex border, Christchurch Bay, Poole Bay and Weymouth Bay, currents are relatively weak, especially in shallow water. For much of the central part of the English Channel the maximum speed of tidal currents is between 0.75 and 1.25m/s (Figure A1d.13). The eastern English Channel is also exposed to swell from the Atlantic Ocean. Two light vessels moored within the Channel and two Wavenet sites at Hastings and Poole Bay have recorded water temperature and wave conditions since 2003 (2002 for the Hastings Wavenet site) (Figure A1d.14).

Offshore Energy SEA 4: Appendix 1 Environmental Baseline
A1d.27
Figure A1d.13: Maximum amplitude of depth averaged mean spring tidal current
Source: James et al. (2007)
Figure A1d.14: Significant wave heights recorded at (a) Channel light vessel (49°54'N 002°54'W, in 63m water depth) and (b) Hastings (50°44'N 000°45'E, 43m water depth), January 2019- 2020
a) b)
Note: Red crosses represent invalid data. Source: http://wavenet.cefas.co.uk/Map
One peculiar feature of the tides in the central part of the English Channel is the distortion of tidal curves due to the effect of shallow water. A consequence of this is that tides have a marked double low water between Portland Harbour and Kimmeridge Bay. From Swanage to Southampton double high waters occur. In Poole and Christchurch Bays, this distortion results in a long stand of the tide at, or very close to, the high water level.

Offshore Energy SEA 4: Appendix 1 Environmental Baseline
A1d.28
Sea surface temperatures in Regional Sea 3 are strongly influenced by the movement of water along the English Channel which modifies the influence of continental Europe. In winter, relatively warm waters move up the English Channel, and average February temperatures range between 6.5ºC and 8ºC. In August, surface water temperatures in the central English Channel are on average 16-16.5ºC (Lee & Ramster 1981). During the summer months, temperatures increase northwards from the middle of the English Channel towards the coast.
Although slightly lower than in winter (when averages are 35.0-35.2‰), salinity values remain relatively high in summer along the centre of the English Channel (between 34.75-35.0‰), owing to the eastward movement of Atlantic water. Salinity values decrease towards the coast in both summer and winter but normally remain above 34.5‰, except locally at river mouths where there is dilution from freshwater discharge.
A1d.6 Features of Regional Sea 4 & 5
The body of water present within Regional Seas 4 and 5 is predominantly Atlantic in origin. The driving force behind water movements in these regions is the North Atlantic Circulation (NAC). The NAC divides to the south-west of Ireland, with one mass of water moving north-eastwards off the western coast of Ireland and the other heading south-eastwards towards the Bay of Biscay (Lee & Ramster 1981). Whilst the general near-surface direction of water movement is from the north-west, there is also a gyre close to the southern Cornish coast at the entrance to the English Channel. A further deep-water current flows northwards from the Mediterranean, surfacing in the Western Approaches and continuing northwards and eastwards to influence the whole of the south-western peninsula and beyond.
Research into the physical oceanography of the western English Channel has been undertaken since 1888, with a significant number of research cruises undertaken by marine laboratories in Plymouth. In addition, multiple Wavenet and Waverider buoys and a light vessel currently record daily water temperature, salinity and wave conditions (Figure A1d.15) in Regional Seas 4 and 527. There are several consistent fronts within the western Channel. A front divides the shallows of Lyme Bay from deeper offshore water, approximately following the 40m contour. A second front runs south from Bigbury Bay, west of Start Point; a third is situated around Land’s End; and a fourth runs from the north Cornwall coast in a north-westerly direction. A number of seasonal fronts appear periodically in the waters adjacent to the Scilly Isles; on the landward side of these fronts there is mixed water, while on the open sea side the water is stratified (e.g. Suberg et al. 2019).
27 http://wavenet.cefas.co.uk/Map

Offshore Energy SEA 4: Appendix 1 Environmental Baseline
A1d.29
Figure A1d.15: Significant wave heights recorded at (a) SW Isles of Scilly WaveNet Site (49°49'N 006°32'W, in 96m water depth) and (b) Scarweather WaveNet site in the Bristol Channel (51°26'N 003°56'W, in 35m water depth), January 2019- 2020
a) b)
Note: Red crosses represent invalid data. Source: http://wavenet.cefas.co.uk/Map
There are no distinct fronts in the Western Approaches as the water mass in this region remains stratified, with a distinct thermocline present during the summer months. The thermocline provides a marked vertical temperature gradient within a discontinuity layer which usually occurs somewhere between 100 and 500m depth. Vertical mixing is a critical factor for controlling primary production in shelf seas. For the Celtic Sea it had been postulated that one of the main contributors to the energy flux was internal waves, generated at the shelf break. This was tested by Green et al. (2008) who concluded that such internal waves were unlikely to be the main source of energy for mixing on the inner part of the shelf.
In the offshore part of Regional Sea 4, and in the open Atlantic Regional Sea 5, maximum tidal current speeds during mean spring tides range from 0.1-1.0m/s. Current speed maxima during mean neap tides are approximately 40-50% of these values (Lee & Ramster 1981). Satellite tracked drifters (Cefas 2006) show that from early summer to autumn there is a continuous oceanic pathway driven by geostrophic currents from NW France, over the western English Channel, south along the Cornish coast, around the Lizard Peninsular, up the north Cornish and Devon coasts, across the St George’s Channel and then around the south-west and west coast of Ireland (Figure A1d.16). These flows occur at the boundaries of stratified regions, inhibiting lateral transport between stratified and non-stratified areas.

Offshore Energy SEA 4: Appendix 1 Environmental Baseline
A1d.30
Figure A1d.16: Northwards transport from Brittany to Scotland showing Argos drifter tracks overlain on bottom density contours.
Source: Cefas (2006)
On the English side of the western Channel, tidal currents flood eastwards and ebb westwards. The constriction of Atlantic water flow between Start Point and the Cotentin Peninsula on the French coast increases current speed and currents are at their strongest (in the region of 2m/s at mean spring tides) around headlands, such as Start Point, and in the Channel between the Isles of Scilly and the mainland. Within the main embayments, such as Lyme Bay, currents are relatively weak especially in shallow water. For much of the central part of the English Channel the maximum speed of tidal currents is slow, between 0.75 and 1.25m/s. A significant northerly coastal current exists between the Scilly Isles and Lundy Island (Pingree et al. 1999), with an additional localised clockwise circulation measured around the Scilly Isles (Southward et al. 2005).

Offshore Energy SEA 4: Appendix 1 Environmental Baseline
A1d.31
Within the Bristol Channel, the ebb flow is dominant, with complex circulatory flows around the major sandbanks. On the northern side of the peninsula and into the Bristol Channel, current speeds steadily increase to a maximum surface ebb current of 4.6m/s off Foreland Point, and a maximum flood current of 4.2m/s off Weston-super-Mare. Offshore, current speeds are slightly lower, ranging from 0.72m/s off Lundy to over 3.0m/s in the Bristol Deep off Avonmouth (Poulton et al. 2002).
The tidal range for the eastern part of Regional Sea 4 (i.e. the central Channel) is not particularly large; around 3.0-4.0m mean spring in Lyme Bay. Tidal range increases progressively offshore into the English Channel and is particularly high near the Channel Islands. On the northern side of the south-western Peninsula, the mean tidal range at spring tides along the coast shows a steady and large increase north-eastwards, from 5m at Land’s End to 12.3m at Avonmouth. This increase is due to the amplification of the tidal movement as it is funnelled up the Bristol Channel and the tidal range of the Severn Estuary, at around 12m, is the largest in the UK and the second largest in the world. Within the Western Approaches, the tidal range at mean spring tides is between 3-4m (Lee & Ramster 1981).
Sea surface temperatures in Regional Seas 4 and 5 are strongly influenced by the NAC. In winter, relatively warm waters affect the coastal regions of the south-western peninsula, with average February temperatures ranging from 9ºC (around Land’s End) to 6ºC (at the mouth of the Severn Estuary, reflecting the close proximity of surrounding land). The waters around the Isles of Scilly are between 0.5-1ºC higher than at adjacent mainland sites during the winter, while average February surface water temperatures at the edge of the continental shelf are 10.5ºC, more than 1ºC warmer than Cornwall’s coastal waters.
In August, surface water temperatures in the Western Approaches are approximately 16ºC (Lee & Ramster 1981), though temperatures are likely to be slightly higher closer to the coast. At the shelf edge in August, surface water temperatures are on average 16ºC, with mean bottom temperatures only reaching 10-11.5ºC (Lee & Ramster 1981). In this area, a thermocline (temperature gradient) develops between the surface and bottom water during the late spring and remains throughout the summer.
Sea temperatures around the Plymouth area of the western English Channel were first monitored during the latter half of the 19th Century (Hawkins et al. 2003). The Western Channel Observatory28 is an oceanographic time-series and marine biodiversity reference site which combines historical data with present day monitoring and measuring, satellite data and modelling. The observatory operates two scientific buoys which provide hourly measurements including SST, salinity and turbidity. Measurements, including temperature and salinity, are also taken weekly at a coastal station (L4) and fortnightly at an open shelf station (E1, 25nm south-west of Plymouth) using the research vessels of the Plymouth Marine Laboratory and the Marine Biological Association. The E1 station has a record of temperature and salinity dating from 1903, one of the longest offshore records in the world. Sea surface measurements in Plymouth Sound (ca. 50º22’N 04º08’W) were taken by city authorities between 1898-1989 (Cooper 1958) and by a local resident (1967-2003).
Mean annual sea surface temperatures in the western English Channel have undergone considerable interannual fluctuations during the 20th Century, but longer trends can also be observed, with a rise in temperature during the first half of the century, followed by a lowering of temperature in the middle 1950s, and return to high values in 1958-61. A marked decline in
28 https://www.westernchannelobservatory.org.uk/

Offshore Energy SEA 4: Appendix 1 Environmental Baseline
A1d.32
temperature occurred from 1962, and thereafter there was a period of cooler conditions. From the early 1980s temperatures increased slightly until 1990 and there was a substantial increase during the following decade of almost 1ºC, exceeding any changes in the previous 100 years. There is a close correlation with temperature trends in the northern Bay of Biscay (Southward et al. 2005), as well as a good correlation between the strength of the North Atlantic Oscillation and sea surface temperatures in the English Channel.
The Atlantic origin of water within Regional Seas 4 and 5 produces a relatively high mean surface salinity of 35.2‰ in the summer off Land’s End (Barne et al. 1996). Salinity remains fairly constant into the English Channel (though it decreases closer to the shore due to freshwater inputs). Reduced salinity is more evident along the northern boundary into the Bristol Channel (with mean values of 34‰ being recorded from the mouth of the Bristol Channel between Bideford Bay and St Govan’s Head.
A1d.7 Features of Regional Sea 6
The SEA 6 technical report by Howarth (2005) covers many aspects of the oceanography and hydrography of Regional Sea 6. Daily sea temperatures have also been recorded for over a century in the northern Irish Sea at Port Erin, Isle of Man, where long term monitoring of offshore nutrients, salinity and chlorophyll has been carried out for around 60 years, and plankton since the 1990s (Government Laboratory (Isle of Man) 2020). Hydrographic monitoring including temperature, salinity, nutrients and chlorophyll has been carried out at Menai Bridge, Anglesey sporadically since 1948 and regularly since 2000 (Evans et al. 2003) although the current status of this time series is not clear. In addition, the Coastal Observatory in Liverpool Bay which concluded in 2012 integrated measurements from SmartBuoys, instrumented ferries running from the UK to Ireland, drifters, tidal gauges, survey cruises, satellite and radar data, riverine inputs and met stations for the Irish Sea.
The extent of Atlantic inflow to the region varies with changes to large scale circulation patterns in the North East Atlantic (e.g. as a result of atmospheric forcing), and weather, particularly the strength and direction of the prevailing winds. Freshwater run-off is important in determining the character of Irish Sea water masses particularly in coastal and nearshore areas, where for example it causes a band of low salinity water in the coastal region (<50m water depth) close to the Irish coast (Hill et al. 1996). The Irish Sea receives freshwater run-off from a large area of land, approximately 43,000km2 (Bowden 1980) compared to a sea area of approximately 47,000km2 with the majority of the run-off arriving in the eastern Irish Sea, down the Ribble, Mersey and Dee estuaries, into the Solway Firth and into Morecambe Bay. The region is also affected by significant freshwater input from the south via the Bristol Channel.
The mean or residual flow is weak, generally less than 0.1m/s and about 0.01m/s in most places. The main inflow of water is from the Atlantic, flowing south to north through St George’s Channel. The main flow may veer towards the Welsh coast as it moves north, with a weaker flow, generally northward, to the west of the Isle of Man. A minor component of the flow enters the eastern Irish Sea to the north of Anglesey and moves anti-clockwise round the Isle of Man before rejoining the main flow to exit through the North Channel (Defra 2000). Transit times from Sellafield to the North Channel have been estimated in the range 6 to 12 months with a mean residence time for the Irish Sea of 1–2 years (Howarth 2005). Local wind forcing rather than tidal or density driven flow is the principal driving mechanism for flow through the North Channel (Knight & Howarth 1999) with the largest transports generated by along-channel winds. Initial measurements of transport in the North Channel were made by Prandle (1976). Subsequently, detailed measurement of currents across the North Channel

Offshore Energy SEA 4: Appendix 1 Environmental Baseline
A1d.33
(Howarth 1982, Brown & Gmitrowicz 1995, Knight & Howarth 1999) have shown that there is significant horizontal variability in the North Channel, with a long-term persistent southerly flow on the western side of the channel that can transport Atlantic water into the Irish Sea (Edwards et al. 1986).
Throughout much of the region tidal mixing is sufficiently intense to ensure that the water column remains well mixed throughout the year, although there are regions where temperature and/or salinity differences between water masses results in seasonal stratification. However, stratification is a highly dynamic process and in some areas (e.g. east of Isle of Man) is only likely to develop during hot, calm conditions and can easily be mixed away by storms or spring tides.
Long time-series of satellite imagery data has been used to automatically detect thermal ocean fronts. The resulting maps showed considerable and consistent seasonal variation in the occurrence, location and frequency of fronts in the Irish Sea. The front maps agreed closely with in situ and modelled analyses of persistent frontal locations in this region (marked 1-4 in Figure A1d.17), and also identified many additional, variable frontal zones.
Four main, persistent frontal areas are identified in Regional Sea 6 (positions shown in Figure A1d.17):
1. In the western Irish Sea a combination of deeper water (>100m water depth) and slower tidal currents allows stratification to form in spring and summer when tidal energy is insufficient to maintain mixing against the increase in surface buoyancy through solar heating (Young & Holt 2007). The maximum surface to bed temperature difference is around 5ºC during stratification. Bottom fronts drive strong (>0.2m/s) but narrow (10km wide) currents in an anticlockwise direction around the pool of colder water below the thermocline (Young & Holt 2007). This gyre tends to retain particulate and biological (e.g. plankton) material in the region.
2. The Celtic Sea is thermally stratified during summer and a surface front stretches across St George’s Channel. To the south is a deep pool of cold, saline Atlantic water bounded by strong bottom fronts. These drive strong density flows (see below) which allow restricted circulation between the Irish and Celtic Seas, although there is significant transport across the boundary (St Georges Channel; Figure A1d.16)
3. A front separates the stratified regime of the Clyde Sea from the well mixed waters of the North Channel. Significant inputs from the River Clyde and other freshwater sources (60-700 m3/s) promote haline stratification throughout the year. The outflow of surface water over the sill into the North Channel is up to 1.5‰ less than the inflow water (McIntyre et al. 2012), maintaining the stable stratification which is not affected by weak tidal stirring. During the summer, this stratification is reinforced by strong thermal stratification.
4. Differences between saline oceanic inflows and freshwater input also causes haline stratification in the eastern Irish Sea. The resulting density flows are strongest in winter and spring but can be overwhelmed during periods of strong winds. During the summer the haline stratification is reinforced by thermal stratification. In Liverpool Bay freshwater inputs continually replace the stratification that tidal mixing reduces, with 65% of tidal cycles showing a switch between a vertically mixed water column and a stratified one (Polton et al. 2011).

Offshore Energy SEA 4: Appendix 1 Environmental Baseline
A1d.34
Figure A1d.17: Seasonal stratification in the Irish Sea
Notes: POL modeling data of differences between surface and bottom water temperatures for a) 29 June 2005 and b) 4 July 2005. Source: Originally taken from POL website (http://cobs.pol.ac.uk/cobs/sat/)
A strong north flowing jet current has been observed in the eastern St George's Channel in summer (Horsburgh et al. 1998). This jet current is density driven and associated with the Celtic Sea tidal-mixing front which forms between May and October. Peak velocities observed for this current were up to 0.28m/s and there was an indication of a weaker southerly flow on the western side of the St George’s Channel. The observations of this current were made during 1997 and some variability between years can be expected depending on the location of the Celtic Sea front. Brown et al. (2003) also identified these flows, with velocities of 0.25m/s recorded.
There is considerable variation in the tidal range experienced around the Irish Sea. For example, Liverpool Bay experiences a very large tidal range (>10m on the largest spring tides, the second largest in the British Isles) whilst areas of very small tidal range (amphidromic points) are found in the vicinity of Arklow on the Irish coast of St George’s Channel and between Islay and the Mull of Kintyre in the North Channel. The tide propagates into the Irish Sea from the Atlantic Ocean through both the St George’s Channel and the North Channel (Robinson 1979). The tidal waves from both directions meet to the south-west of the Isle of Man causing this to be an area of very weak tidal currents (<0.35m/s). Areas of strong tidal currents (depth-averaged values up to 2m/s at spring tides) and hence of vigorous tidal mixing and peak bed stresses occur generally throughout St George’s Channel, north-west of Anglesey, north of the Isle of Man and in the North Channel (Howarth 2005). In shallow water, sudden changes in bathymetry and/or topography may generate locally high velocities near headlands, islands and estuaries (Defra 2000).
The largest storm surges are generally associated with storms tracking eastward over northern Scotland and occur in the eastern Irish Sea, with maximum surge levels of about 2m predicted for the Lancashire and Cumbrian coasts associated with westerly winds, whilst the maximum surge levels are between 1.25m and 0.75m on the Irish coast and across the St George’s Channel (Flather 1987). The impact of surges also depends critically on the state of the tide

Offshore Energy SEA 4: Appendix 1 Environmental Baseline
A1d.35
with the biggest risk of flooding occurring if the surge peak coincides with high spring tide (Howarth 2005).
Sea surface temperature is coolest in February or March with temperature decreasing from the deeper channel towards the coasts (Figure A1d.18). A warm tongue, with a temperature above 7.5ºC, extends up to the North Channel where 8-8.4ºC is typical. The coolest water is towards the coast in the eastern Irish Sea. At this time of year the temperature is uniform with depth. The situation in the warmest month (August) shows a contrasting pattern, with the coolest surface water in the North Channel (12ºC; amongst the coolest waters on the west coast of Britain) and the deep channel (13-14ºC) and the warmest water close to the coasts, exceeding 16-17ºC in Liverpool and Cardigan Bays.
Figure A1d.18: Sea surface temperatures in Irish Sea
Note: Composite satellite images taken between a) 16-22 March 2003 and b) 10-16 August 2003. Note change of temperature scale between images. Source: Originally taken from PML Remote Sensing Group, Proudman Oceanographic Laboratory website - http://cobs.pol.ac.uk/cobs/sat/
The long term temperature record shows a large degree of variability in the seasonal cycle, although a general increasing trend is apparent, indicating a rise of around 0.6ºC over the last 70-100 years, and particularly an increase in winter temperatures since 1990.
The annual mean salinity decreases from south (34.9‰) to north (34‰) and from the central channel of the Irish Sea (34.3-34.9‰) to the sides (32.0-34.0‰) reflecting the northerly flow of oceanic Atlantic water whose salinity is gradually reduced by coastal freshwater input. Lowest values are found in the north-east, from the Solway Firth to Liverpool Bay, and in the Clyde Sea. Seasonal variations in salinity are small in most areas, although most noticeable near the coasts, being governed by the annual cycle of river flow.
Since the Irish Sea is sheltered with only two relatively narrow ‘windows’, along the axes of the St George’s and North Channels, the majority of waves are locally generated, of fairly short period and hence steep. Swell waves are only present near the entrances of the St George’s and North Channels; hence, the wind direction leading to the largest waves will depend very much on the locality, for instance in Liverpool Bay winds from the north-west cause the largest waves (Howarth 2005). The Cleveleys Waverider buoy recorded wave heights of up to 4.7m

Offshore Energy SEA 4: Appendix 1 Environmental Baseline
A1d.36
during storms in 2014, with all storm waves originating from a westerly or northwesterly direction (Channel Coastal Observatory 2015).
The annual mean significant wave height is greatest at the entrance to St George’s Channel (about 2.3m) with values decreasing northwards. Lowest mean significant wave heights are experienced in sheltered coastal regions particularly Morecambe Bay and the Solway Firth, with monthly averages in 2018 between 0.35m in July and 1m in January at the Morecombe Bay Waverider site (Channel Coastal Observatory 2019). The 50-year return value of significant wave height varies between 8m within the Irish Sea to about 12m at its outer entrances. The effect of waves on processes such as sediment transport will be significant during storms especially in shallow areas of the eastern Irish Sea (Howarth 2005).
A1d.8 Features of Regional Sea 7
In support of SEA 7, Inall & Sherwin (2006) reviewed available information on hydrographic characteristics and processes of the Scottish shelf. Hydrographic processes in the North Channel, Sea of the Hebrides and Minches have been sporadically studied over a long time period (Craig 1959, Prandle 1976, Ellet 1979, Ellet & Edwards 1983, Gillibrand et al. 2003, Baxter et al. 2008), with particular focus on the distribution of radionuclides from Sellafield (e.g. Livingstone et al. 1982, McKinley et al. 1981, McKay et al. 1986, Mackenzie et al. 1987). Subsequently the emphasis has been on development and validation of hydrodynamic models (e.g. Xing & Davies 1996, Pizzamei 2002, Davies & Xing 2003, Wolf et al. 2016).
Direct water circulation measurements in the Sea of the Hebrides and Little Minch have been limited to ad hoc current meter deployments (Ellett & Edwards 1983), studies of the Scottish coastal current (Simpson & Hill 1986; Hill & Simpson 1989), an Acoustic Doppler Current Profiler (ADCP) survey in the Little Minch (Simpson et al. 1990), and a long-term mooring deployment in the Tiree Passage maintained by the Scottish Association for Marine Science (SAMS), which also records temperature and salinity (e.g. Jones et al. 2018). At a local, inshore scale, a large number of short-term (15 day semi-lunar period) current meter deployments have been made over the last decade in relation to consenting of aquaculture sites.
Four research cruises in the Minch and the Sea of the Hebrides during 1996-1998 were used to measure and map the seasonal variability of key physical, chemical and biological characteristics of the water column. In addition, recording current meters were deployed during the 1997 spring cruise to measure water movement through the study region. Data from these studies have been used to calibrate a coastal circulation model of the Scottish western continental shelf (Pizzamei 2002), with results indicating the presence of cyclonic gyres in both the North Minch and Sea of the Hebrides. The model also predicts a southward flow at depth through the western side of the Little Minch, as observed, whereas nearer the surface the expected northward transport is evident.
One site within Regional Sea 7 (Loch Ewe) is sampled as part of the Marine Scotland Long-term Ecosystem Monitoring programme (2002-present); data are collected on water temperature, salinity, nutrients and phytoplankton. In addition, between 2003 and 2011, temperature was monitored and weekly samples for salinity and nutrients taken at Loch Maddy (North Uist).
Tidal flow, temperature, salinity and wave information presented below is largely drawn from Baxter et al. (2008), the Blackstones Wavenet site (56º 03.72’N, 007º 0.41’W, 97m water

Offshore Energy SEA 4: Appendix 1 Environmental Baseline
A1d.37
depth) and the Atlas of UK marine renewable energy resources (ABPmer et al. 2008), supplemented by the relevant JNCC Coastal Directories (Barne et al. 1997a, b).
Water in Regional Sea 7 is derived from three sources: oceanic or Atlantic water, Clyde/Irish Sea water and coastal water derived from the land. Overall circulation patterns (Figure A1d.19) inferred from the distributions of salinity and temperature, and direct water circulation measurements, indicate a net northward transport along the Scottish west coast, both through the Sea of the Hebrides and the Minch and to the west of the Outer Hebrides (the Scottish Coastal Current). On the basis of drifter experiments, Hill et al. (1997) described a bifurcation of the northward coastal current in the Sea of the Hebrides, with a proportion of the water mass passing through the Little Minch, and the remainder re-circulating southward toward Barra Head. This has been corroborated by other studies, e.g. Craig (1959), Simpson and Hill (1986).
Early studies suggested that the Islay Front, between the Scottish and Irish coasts is a seasonally distinctive salinity-controlled front in which temperature plays only a secondary role in controlling the density structure (Simpson et al. 1979). Later work (Hill & Simpson 1989) confirmed that two distinct classes of front coexist west of Islay: the type I front (in which the frontal interface extends continuously from the sea surface to the sea bed) forms the boundary of a low salinity coastal current. The other (type II) front which develops in spring and summer marks the transition between mixed and thermally stratified water. The relative locations of the two frontal types changes with season. In winter, only the type I front is present. When thermal stratification commences in early spring a type II front forms to the west of the type I front. As thermal stratification develops further, in late spring and summer, the type II front advances towards the type I system and eventually crosses it inducing a distortion of the type I interface and bringing about vertical haline stratification. In autumn it appears that the final breakdown of thermal stratification may be inhibited by the vertical salinity (density) gradient associated with the type I front. The Islay Front is also associated with strong residual currents parallel to the front, and enhanced phytoplankton standing crop (Simpson et al. 1979). A thermal front also forms in spring and summer south-west of Tiree (the Tiree Front), related to the boundary between the well mixed shallow shelf area and deeper water (Miller et al. 2015).
Through the North Channel and west of mainland Scotland, there is a general northern flood and southern ebb tidal flow, the pattern being complicated by coastal topography, fluvial flow and wind-induced currents. Maximum tidal currents run in the North Channel and south of Islay (more than 4.0m/s between Rathlin Island) and decrease in all directions away from this zone. Velocities within the sea lochs are generally low, attaining about 0.2m/s in the centre of Loch Linnhe and 0.25m/s off the north coast of the Ross of Mull. An exception to this is in the Gulf of Corryvreckan, the narrow channel between the islands of Jura and Scarba, where a tidal race may reach a speed of 4.3m/s. High current velocities are also characteristic of the Sound of Islay (between Islay and Jura), the Firth of Lorne and Sound of Mull.

Offshore Energy SEA 4: Appendix 1 Environmental Baseline
A1d.38
Figure A1d.19: Shelf circulation pattern and approximate volume fluxes
Source: Courtesy of A. Edwards.
North of Ardnamurchan, maximum tidal currents during mean spring tides are generally between 0.5 and 1m/s. There is an unusual feature in the Sound of Harris: at neap tides in the summer, the south-east going stream runs all day and the north-west going stream runs all night; the effect is reversed at neaps in winter (Ellett 1979).
In the northern Minch between Cape Wrath and the Butt of Lewis, maximum speeds vary from 0.4m/s at spring tides to 0.15m/s at neap tides, these currents flowing approximately north-south. Within the Little Minch between Skye and South Uist the maximum current is 0.5m/s, again in a north-south direction, though values are greater around headlands and over shoaling areas. South of Barra Head on Berneray the maximum surface current during spring tides is 0.75m/s, flowing in an easterly direction.
A number of topographical depressions, including troughs, channels, valleys and canyons generally formed by glacial activity at lower sea levels are found within Regional Sea 7. In general these features have increased seasonal stratification, due to weaker tidal and residual currents, although in some cases sloping bathymetry or the generation of density driven currents may enhance internal mixing. An example is Muck deep, which has been shown to have an internal tide which intensified near-bottom currents and may contribute to density driven cross-shelf circulation (e.g. Ellet & Edwards 1983).
Throughout the area, the dominance of the Atlantic water mass over Clyde/Irish Sea water and land-derived coastal water limits the differences between summer and winter temperatures. In winter, water on the Hebridean shelf is well-mixed, and relatively warm Atlantic water covers most of the shelf west of the islands. By April, less dense water from the coast spreads westward and – after the onset of surface heating and the development of a thermocline – forms the surface water for much of the outer shelf north of Barra Head. Summer

Offshore Energy SEA 4: Appendix 1 Environmental Baseline
A1d.39
temperatures in the North Channel, at around 12°C, are among the lowest on the west coast of Britain because Ireland obstructs the warm flow of the Gulf Stream.
In winter, temperature values decrease eastwards from about 8.5°C across the outer continental shelf to less than 7.0°C off the northern coast and typically between 8.0°C and 8.4°C in the North Channel. Ellett & Edwards (1983) give values ranging from about 12°C in the southern entrance to the Sea of the Hebrides and the northern entrance to the Minch, to less than 10.5°C in the southern part of the Minch. Throughout the year values are more extreme in the shallow waters near coasts. Similarly, slightly more extreme temperatures may occur within the low-salinity surface layer that can develop in sea lochs, especially near river mouths (Ellett & Edwards 1983).
The mean water temperature in the Tiree Passage is 10.1ºC and the dominant mode of variability in the temperature record is the seasonal cycle, with an amplitude of 3.2ºC (Inall & Griffiths 2003). Temperature anomaly time series (deviations from the average monthly values over the last 25 years) from the Tiree Passage and of the full NE Atlantic upper layer show highs in the late 1980s and late 1990s and lows in the early 1980s and mid 1990s. The overall trend on the continental shelf is of warming at a rate of +0.57ºC per decade. In addition, the date of maximum annual temperature has been delayed by 12 days per decade, throughout the time series.
Shelf salinities show only weak seasonality, and no single determining factor has been found for the longitudinal movement of more saline oceanic waters across the shelf. Prolonged periods of high North Atlantic Oscillation index (NAO) were found to coincide with periods of raised salinity of shelf waters (NAO: high values of this index correspond to warm, wet and windy conditions over Scotland). The nature and variability of the Atlantic inflow across the shelf edge onto the Hebridean shelf has been the focus of recent research utilising data from the Tiree Passage Mooring (TPM), the Ellet Line (Jones et al. 2018) as well as drifter and glider releases (Porter et al. 2018, Jones et al. 2020). Jones et al. (2020) estimated that during intense storm periods, on-shelf transport may be up to 0.48Sv, but that this was near the upper limit of transport based on the multi-year time series of coastal current and salinity from the TPM. The likelihood of storms capable of producing these effects was found to be much higher during NAO-positive winters.
The irregular coastline results in a diverse range of wave climates, and most of the available data refers to open sea conditions rather than specific sites. The northernmost coasts between Point of Stoer and Cape Wrath are exposed to both northerly and westerly winds, and experience a wave climate only slightly less energetic than that of western coasts of the Western Isles, Orkney and Shetland (see Figure A1d.20). The western coasts of the southern islands such as Rum and parts of Skye that are not sheltered by the Western Isles are equally exposed to the prevailing winds and energetic waves. The Blackstones waverider buoy, situated between Tiree and the north coast of Ireland, recorded peak significant wave heights of 13.5m over the period December 2014 to December 2015, with all waves >10m coming from a westerly to north west-west direction (Cefas website29). The maximum predicted 50-year wave has a height of over 30m in the north, although significant wave heights in the Minch and Sea of the Hebrides are lower: 75% of the time they are less than 1m and only during 10% of the year do they exceed 2.0m, or at most 2.5m in the extreme north.
29 https://www.cefas.co.uk/cefas-data-hub/wavenet/

Offshore Energy SEA 4: Appendix 1 Environmental Baseline
A1d.40
A1d.9 Features of Regional Sea 8
The physical structure of the shelf seas west of the Hebrides is largely determined by a balance between the stratifying influences of solar radiation and fresh water run-off from the land, and the mixing influences of the strong tidally and wind driven flows, themselves shaped by the irregular bathymetry and coastline.
The European Slope Current (ESC, synonymous with the Shelf Edge Current, SEC) flows along the continental slope, and is apparently continuous at least from the Goban spur to north of Shetland, a distance of approximately 1,600km (Booth & Ellett 1983, Burrows & Thorpe 1999, Souza et al. 2001). At the latitude of the Malin Shelf (~56°N) the ESC is a persistent, predominantly barotropic flow of ~0.2m/s with greater flow variability in winter and a characteristic salinity of 35.35 (Souza et al. 2001). The ESC is constrained to the continental slope, with its velocity core centred approximately above the 800m isobath and the high salinity core consistently displaced closer to the slope, and above the 200-300m isobaths. An explanation of this phenomenon has been given in terms of the differing slope boundary conditions for salinity and momentum (Souza et al. 2001). Despite the normally high steadiness, intrusions of the ESC onto the shelf at ~56°N have been observed in the winter months, and there is a suggestion that in winter both mass flux and poleward momentum are directed upslope (Burrows & Thorpe 1999). Porter et al. (2018) used data from drifters, and hydrographic data from vessel mounted-ADCP, high resolution CTD casts and glider surveys to describe a persistent inflow of Atlantic water onto the Malin Shelf at 55.5°N, which they termed the Atlantic Inflow Current (AIC). They suggest that the slope current is destabilised by complex slope topography (a shallow canyon and change in slope direction) and enters deeper water, inducing negative relative vorticity, potentially initiating the cross slope flow. It is likely that this cross-slope flow is assisted by the prevailing south-westerly wind direction. The loss of this water from the slope does not appear to reduce the strength or size of the slope current, which increases in transport downstream of this intrusion (Porter et al. 2018).
The shelf edge current exhibits weaker flows in spring and stronger flows in autumn; mean current speeds are estimated to be between 0.05 and 0.2m/s, with higher speeds where the flow is ‘squeezed’ by depth contours. The maximum current in summer is at about 200m depth, but in winter flow is much more uniform throughout the water column (IACMST 2005). Measured near-bottom current velocities indicate peak currents over 0.75m/s on the upper continental slope west of Shetland (Graham 1990a, Graham 1990b, Strachan & Stevenson 1990). Sediment bedforms observed on the upper slope, such as small barchan-type sand waves, longitudinal sand patches and comet marks (Werner et al. 1980), confirm currents in the range 0.4 to >0.75 m/s (Kenyon 1986). Periodic and episodic peak currents are driven by a range of processes (Inall & Sherwin 2006) including internal waves (Huthnance 1983), storm surges (Howarth 2005), gyres and eddies (Dooley & Meinke 1981).
There is a wide range in tidal current strength across the Hebrides shelf. In general, there are near-uniform maximum current amplitudes for a mean spring tide over much of the shelf west of 7.5ºW where depths are uniform. Over these parts of the shelf bed friction plays a minor role in determining the tidal currents, and the force balance is primarily between the tidal slope of the surface, inertia and the Coriolis force resulting in highly elliptical tidal currents. Patchy areas to the west and north of the northern Outer Hebrides have more circular M2 tides (rotating anticlockwise). Regions such as these, where tidal ellipses are not rectilinear, experience little or no slack water. Spring-neap modulation of the semi-diurnal tidal currents is strong throughout the region; maximum amplitude of the depth-averaged currents for a mean

Offshore Energy SEA 4: Appendix 1 Environmental Baseline
A1d.41
spring tide indicates extended areas of strongest flows around the headlands of Barra Head and the Butt of Lewis.
Topographic constraints also result in high current velocities in localised areas of Orkney and Shetland, where tidal harmonics are dominated by the M2 component. Flood streams are generally from west to east in the offshore areas, through the Pentland Firth and between islands in Orkney and Shetland, with the flood stream deflected southwards along the Shetland coastline. The M2 maximum tidal current amplitude in nearshore waters is 0.04m/s (BODC 1998), although tidal streams reach considerably higher velocities - between 3.5m/s and 4.5m/s – near Muckle Flugga, in Yell Sound, Linga Sound, Bluemull Sound and near Sumburgh Head in Shetland; through the Pentland Firth; and in Hoy Sound in Orkney.
Residual tidal flows through the Pentland Firth and Fair Isle Channel are very low, so that bedflows are dominated by non-tidal components (Johnson et al. 1982). Estimated maximum orbital near-bottom currents, generated from wind-waves or internal waves at the shelf edge and shorewards, may have speeds up to 10 fold (or more) higher than the tidal currents (Holmes et al. 2003). These orbital currents are important energy sources for mobilising sediment grains into the tidal streams.
During the winter months on the west Hebridean shelf (December to April) the water column is vertically well mixed, and isotherms and isohalines are almost vertical. Temperature and salinity increase offshore and in deeper waters (greater than approximately 100m), and on the outer parts of the shelf the water is of Atlantic origin (S>35.2‰) and the boundary between coastal and oceanic water is sharp, typically 0.5ºC per 10km. This boundary lies approximately two thirds of the distance from Barra to the shelf break, running parallel to the Hebrides and passing close to St Kilda, although there is considerable variability in its shoreward extent. Much of the shelf remains mixed or weakly stratified during the summer with strong thermal stratification restricted largely to sheltered sea lochs on the west coast of the Hebrides and the north coast of mainland Scotland.
A similar pattern is evident west of Orkney, with a strong frontal boundary located close to Cape Wrath in summer, but with greater mixing west of Shetland. Seasonal fronts have also been identified in the Fair Isle region between Orkney and Shetland, with the strong tidal currents in the region separating stratified and well mixed waters. Strength of seasonal stratification correlates with the variability in the fronts, with them being more prominent in spring and summer, although still evident for parts of autumn and winter (Miller et al. 2015). Throughout Regional Sea 8, riverine inputs are relatively small (in terms of catchment area) and temperature and salinity characteristics may be regarded as fully marine. Along the western coasts of Shetland, Orkney and the Western Isles archipelago, the combination of exposure to prevailing winds and deep, open offshore waters produces a high energy wave regime. Data from a number of waverider buoys from Cefas’ strategic wave monitoring network, WaveNet provide details of significant wave heights recorded over the last year for locations west of Hebrides (57°17'.53N, 007°54'.85W) and at the Clair platform, west of Shetland (60°42'N, 2°36'W) (Figure A1d.20). Larger significant wave heights (13m) were recorded west of Hebrides compared to west of Shetland (9m). Similarly, estimated 100 year maximum wave heights from analysis of the Norwegian 10km Reanalysis Archive wave hindcast (1958–2011) for St. Kilda, Schiehallion and Orkney were 36.3, 34.7 and 31.4m, respectively (Santo et al. 2016).

Offshore Energy SEA 4: Appendix 1 Environmental Baseline
A1d.42
Figure A1d.20: Significant wave heights recorded (a) west of Hebrides and (b) at Clair, west of Shetland, May 2018-May 2019
a) b)
Note: Red crosses represent invalid data. Source: http://wavenet.cefas.co.uk/Map
A1d.10 Features of Regional Sea 9
Since the pioneering Porcupine and Lightning studies of 1868-1870 (Thomson 1874), the Faroe-Shetland Channel has been one of the most studied oceanic regions of the world and two hydrographic sections across the Channel have been surveyed by the Aberdeen Marine Laboratory (part of Marine Scotland) for over a century (Turrell et al. 1999a, 1999b). The Faroe Bank Channel (the continuation of the Faroe-Shetland Channel to the south east) is less well studied, although since the late 1980s and the realisation of the importance of this area for the overflow of cold deep water south, a standard section has been studied regularly by the Faroese Fisheries Laboratory (Hansen & Østerhus 2000). A recent Faroe Marine Research Institute workshop brought together researchers active in the waters between Scotland and Iceland to explore ways to coordinate approaches towards a more complete understanding of the physics and dynamics of the region (as reported in Larsen et al. 2017).
A series of research programmes and cruises, detailed in SEA 1 and added to by more recent studies including modelling and satellite imagery (e.g. Marsh et al. 2017, Trivedi & Toumi 2017, Sheehan et al. 2017, Hansen et al. 2017, Bringedal et al. 2018), have allowed for the study of the long-term monitoring of water exchange between the Atlantic and Nordic seas. Observations have been focused on two hydrographic sections across the Faroe-Shetland Channel: the Nolso-Flugga and Fair Isle-Munken sections (McKenna et al. 2016). Since 2008, the weekly ferry M/S Norröna running between Denmark and Iceland has been equipped with an Acoustic Doppler Current Profiler (ADCP) (and more recently a FerryBox system to record near-surface temperature and salinity) to monitor the northward flow of the warm North Atlantic waters through the Faroes-Shetland Channel and over the Faroes-Iceland ridge into the Greenland and Norwegian Seas30.
Circulation in the North Atlantic is largely controlled by the influence of the Atlantic Meridional Overturning Circulation (AMOC). The northern extension of that circulation system brings warm Atlantic water towards the western European margin. The Faroe-Shetland Channel has long been known as a key region for the water exchange between the Atlantic basin and the Nordic Seas (e.g. Dooley & Meincke 1981, Gallego et al. 2018). The Faroe-Shetland Channel is one of three main pathways of North Atlantic water into the Nordic Seas, where it cools to
30 http://po.msrc.sunysb.edu/Norrona/

Offshore Energy SEA 4: Appendix 1 Environmental Baseline
A1d.43
form North Atlantic Deep Water, a process which drives global Meridional Overturning Circulation. This water then travels back along the ocean floor into the Atlantic, again through these three gaps. As a result through the channel poleward flowing Atlantic water flows above southward-flowing water from the Nordic Seas. This ocean heat transport is a key element of the redistribution of heat by the climate system. North of 30°N, the ocean releases its heat to the atmosphere and the delivery of this heat towards the land by the prevailing winds is particularly crucial to maintaining the relatively mild climate of the British and Irish Isles and northwestern Europe (McCarthy et al. 2017).
A number of water masses (Figure A1d.21), characterised by their salinity, temperature and nutrient characteristics, are known to be present in the Faroe-Shetland Channel and studies have shown there to be distinct differences in the distribution of these between the east and west slopes of the Channel (e.g. Dooley & Meincke 1981, Hansen 1985, Saunders 1990, Turrell et al. 1999a, Souza et al. 2001, Hughes & Turrell 2004, McKenna et al. 2016).
The waters over the Wyville-Thomson Ridge and in the upper 500m of the Faroe-Shetland Channel are derived from North Atlantic Water (NAW) which enters the Faroe-Shetland Channel over the Ridge and is concentrated along the eastern side of the Channel, as a slope current close to the edge of the west of Shetland Shelf. It is most intense over the 400m contour (Turrell et al. 1999a). This water originates from the Rockall Trough. The Modified North Atlantic Water dominates the surface flow in the centre and along the western slope of the Channel, and represents the northern branch of the North Atlantic Current. As this water flows towards the Faroe Islands from the west it splits and flows into the Faroe Bank and Faroe Bank Channel areas and northwards around the Faroe Plateau in a clockwise direction, entering the Faroe-Shetland Channel from the north-east (Hansen 1985, Saunders 1990). The net flow of these two water masses is to the northeast (Turrell et al. 1999a) and contributes 2.7Sv (1Sv = 1x10⁶ m3/s) of warm, saline North Atlantic water to the Nordic Seas (Berx et al. 2013), as opposed to 3.8Sv over the Iceland-Faroe Ridge and 0.8Sv through the Denmark Strait (Østerhus et al 2005). Research has, however, shown this volume flux to vary significantly on a seasonal and annual basis (Berx 2012, Bringedal et al. 2018).
The mean velocity of the shelf edge current in the area is approximately 0.40m/s towards the northeast, and in the lower water mass 0.15m/s towards the southwest (Saunders 1990). The shelf edge current exhibits a seasonal maximum transport in December/January and a minimum in June/July (Gould et al. 1985). Measured near-bottom current velocities indicate peak currents over 0.75m/s on the upper continental slope west of Shetland (Graham 1990a, 1990b; Strachan & Stevenson 1990). Sediment bedforms observed on the upper slope, such as small barchan-type sand waves, longitudinal sand patches and comet marks (Werner et al. 1980), confirm currents in the range 0.4 to >0.75 m/s (Kenyon 1986). Periodic and episodic peak currents are driven by semi-diurnal tides, internal waves (Sherwin 1991), storm surges (Turrell & Henderson 1990), gyres and eddies (Dooley & Meinke 1981).

Offshore Energy SEA 4: Appendix 1 Environmental Baseline
A1d.44
Figure A1d.21: Hydrography of the Faroe-Shetland Channel showing a) representation of the paths of the main water masses, b) schematic section across the channel showing generalised distribution of water masses
a)
b)
Notes: NAW = North Atlantic Water; MNAW = Modified North Atlantic Water; MEIW = Modified East Icelandic Water; NSAIW = Norwegian Sea Intermediate Water; NSDW = Norwegian Sea Deep Water, a major component of NADW = North Atlantic Deep Water. Source: Berx (2012)

Offshore Energy SEA 4: Appendix 1 Environmental Baseline
A1d.45
Temperature induced stratification only occurs in summer over the upper 200m on the west Shetland shelf (Hall et al. 2011). There is, however, permanent stratification at ~550-650m water depth along the west Shetland slope associated with the pycnocline separating overlying Atlantic and underlying Norwegian Sea waters. Internal waves form at this interface and result in incursions of cold water at the seabed, accompanied by relatively strong currents (seabed surges) (Grant et al. 1995). Studies have also shown the presence of a semidiurnal internal tide as well as non-linear internal waves (Hall et al. 2011, 2013, 2017), which all promote mixing between the different water masses. Kurekin et al. (2017) describe an SEA funded project to develop and implement an algorithm to automatically identify internal waves from Advanced Synthetic Aperture Radar (ASAR) images. Observational frequency maps of internal waves on the UKCS were generated by automatic processing of the ENVISAT31 ASAR data archive covering the period from 2006 to 2012. A broad region of indistinct features was visible in and on the south east edge of the Faroe-Shetland Channel, north west of a line between 59°N, 5°W and the edge of the UKCS at 62°N, 2°E, appearing in variable locations in 2007-2012, mostly in May-July. Strong features were identified in the middle of the Channel in February 2007 and in the north in June-July 2011. The lack of information on the depth, amplitude and direction of propagation of each internal wave made estimating the potential for interaction with the seabed challenging. However, using a model prediction of the mixed layer depth as a proxy for the internal wave depth, the Faroe-Shetland Channel features were estimated to have no seabed interaction except a region around 60°N, 4°W which had some interaction at 100m amplitude in February and June to August (Kurekin et al. 2017).
Using satellite-derived sea-surface heights and temperatures as well as hydrographic data, Chafik (2012) studied the role of the extreme phases of the North Atlantic Oscillation (NAO) on the local dynamics of the Faroe-Shetland Channel. During a low-NAO event (2009-2010) the Shetland slope current showed a significant deflection from its usual path above the maximal gradient of the bathymetry, ultimately resulting in an anticyclone. This led to an accumulation of North Atlantic Water over the deeper parts of the channel, manifested as a pronounced deepening of the halocline. Leading this deflection of the slope current by around 2 weeks, a cyclonic eddy associated with a doming of the halocline and originating from north of the Faroes had moved southwards in the channel, coming to rest at its southern entrance. Assessing the influence of the NAO on these regional dynamics using 1992-2010 altimetric data, it was found that for positive phases of the NAO, the surface circulation tended to be strongly bathymetrically constrained and thus resembles the mean regional circulation. The negative phases of the NAO are associated with a regional weakening of the wind-stress curl, which leads to a contraction of the Norwegian-Sea gyre and a linked northward migration of the FSC recirculation involving a deflected path of the Shetland-slope current. This change in the circulation under negative NAO conditions may have an impact on the regional ocean climate through the accumulation of saline NAW in the channel (Chafik 2012).
Below the Modified North Atlantic Water, Arctic Intermediate/North Icelandic Water originating from north of the Iceland Faroe Ridge occupies water depths of 400-600m on the Faroese side of the Channel (Blindheim 1990). On the Scottish side of the Channel the area occupied by this water is narrow and in slightly shallower depths. A second intermediate water mass is present on the Faroese side of the Channel in the form of Norwegian Sea Intermediate Water which occupies water depths of 600-800m. This water becomes shallower and occupies a reduced depth range towards the Scottish slope, and occasionally does not extend as far as
31 European Space Agency environmental monitoring satellite

Offshore Energy SEA 4: Appendix 1 Environmental Baseline
A1d.46
the slope. The net flow of this water mass in the Channel is to the south-west (Turrell et al. 1999a).
Below these intermediate waters, at depths of greater than 800m the Channel is filled by cold water originating from the Norwegian Sea, Norwegian Sea Deep Water. It is believed that most of the transport within this water leaves the Channel through the Faroe Bank Channel and to a lesser extent over the Wyville-Thomson Ridge (see below). The main pathway for this south-west trending transport through the channel is a fast, narrow current on the Shetland slope, whereas over the rest of the deep parts of the channel to the west topographically generated eddies force some of the water to recirculate within the channel. Most of this recirculated water is subject to lateral and diapycnal mixing before joining the slope current or flowing over the Wyville Tomson Ridge (Broadbridge & Toumi 2015). However some may be recirculated back into the Norwegian Sea (Turrell et al. 1999a, Hansen & Østerhus 2000).
The Wyville-Thomson Ridge forms the northern most limit of the Rockall Trough and is thought to limit the deep outflow from the Faroe-Shetland Channel towards the Rockall Channel. Knowledge of the Wyville-Thomson Ridge overflow was first documented in 1972 (Ellett & Roberts 1973) and subsequently studied by Ellett and co-workers. Ellett (1998) and others (Ellett & Edwards 1978, Zenk 1980, Saunders 1990) found evidence that the Wyville-Thomson Ridge overflow can be intermittent both spatially and temporally (Hansen 1985, Hansen & Østerhus 2000). In addition to the steady “base” flow over the Ridge there is evidence of more distinct overflow events which can last for a number of days. During these events currents have been observed to be stronger than normal and temperatures lower (below 3ºC), which represents a greater influence of cold water from the Faroe-Shetland Channel Bottom Water. Sherwin & Turrell (2005) and Sherwin et al. (2008) have quantified the overflow and concluded that the total flow (including entrained North Atlantic Water) is substantially higher than previously estimated. A significant part of the overflow appears to be channelled through a canyon that leads southward down the southern flank of the Faroe Bank into the Ellett gully. An alternative overflow location at the eastern end of the Wyville-Thomson Ridge has also been described (Vlasenko & Stashchuk 2018), although predicted transport under spring tidal conditions was 0.3Sv, substantially less than 2.2±0.2Sv calculated for the Faroe Bank Channel overflow (Hansen et al. 2016) and 2 times weaker than that estimated for the western saddle point of the Wyville-Thomson Ridge (Stashchuk et al. 2011).
The waters of the northern North Sea/southern Norwegian Sea are influenced by three main water masses. The upper few hundred metres are dominated by the warm, saline water of the Norwegian Atlantic Current. Deeper water depths are influenced by the bottom waters formed in the adjacent Arctic and Greenland Seas (Gammelsrød et al. 1992 and Østerhus et al. 1996).
Due to the exposed nature of the Atlantic, the wave climate of the Faroe-Shetland Channel is more severe than that found in the northern North Sea. For example, Figure A1d.22 compares significant wave heights recorded by the K7 waverider buoy in 650m water depth in the Faroe-Shetland Channel with those from the Bruce platform in the northern North Sea over the last year (May 2018-2019). The wave climatology of the region was summarised by Gallego et al. (2018) from analysis of 30 years (1980-2009) of modelled waves data from the European Centre for Medium-Range Weather Forecasts ERA Interim reanalysis archive. Throughout the year, the wave field is nearly always dominated by waves from the south west, with the highest monthly mean (6m) and monthly maximum (up to 12.5m) significant wave heights occurring in January. During the summer months, the typical monthly mean significant wave height is 1-3m, with rare extremes of up to 9m (Gallego et al. 2018). Estimated 100 year maximum wave heights for the Scheihallion location west of Shetland were approximately 35m compared to 29m for the Bruce platform (Santo et al. 2016).

Offshore Energy SEA 4: Appendix 1 Environmental Baseline
A1d.47
Figure A1d.22: Significant wave heights recorded (a) K7 buoy and (b) Bruce platform, May 2018-May 2019
a) b)
Note: Red crosses represent invalid data. Source: http://wavenet.cefas.co.uk/Map
A1d.11 Features of Regional Sea 10 & 11
The Rockall Trough and Atlantic Northwest Approaches are influenced by the oceanic circulation systems of the North Atlantic - principally the North Atlantic Current (NAC) which sweeps eastwards from the western North Atlantic before turning in a more northerly direction and flowing to the west of the Hatton Bank. Smaller southerly branches of the NAC enter the Hatton-Rockall area from the north and circulate over the Rockall Bank and further to the south. A branch of the NAC travels north-eastward across the Rockall Plateau and through the Rockall Trough towards the Faroe-Shetland Channel. Significant variability in the NAC flow through the Rockall Trough, both within and between years, was recently described as part of the Overturning in the Subpolar North Atlantic Programme (OSNAP), with periods of low and high transport associated with significant changes in the Rockall Trough circulation (Houpert et al. 2020).
A poleward flowing Shelf Edge Current (SEC) is present along the continental margin and occupies the upper part of the slope, typically above 700m (see above). Near the southern boundary of Regional Sea 10 it makes an excursion across the slope and onto the shelf (Ellett et al. 1986, Souza et al. 2001) before continuing its path along the slope at the southern end of the Hebrides. The current exhibits some seasonality, with weaker flows in spring and stronger flows in autumn, and mean current speeds are estimated to be between 0.05 and 0.2m/s, with higher speeds where the flow is ‘squeezed’ by depth contours. The maximum current in summer is at about 200m depth, but in winter flow is much more uniform throughout the water column (IACMST 2005).
Wintertime mixing of the near-surface layers in the region usually occurs to depths of 500–700m (Ellett & Martin 1973, Meincke 1986; Holliday et al. 2000), but there is evidence of deeper mixing, possibly to 1,000m (Ellett et al. 1986). This mixing forms relatively homogeneous upper layer waters, identified primarily as a saline Eastern North Atlantic Water (ENAW) entering the region from the south (Figure A1d.23), and occasionally a fresher Western North Atlantic Water (WNAW) from the north-west. ENAW forms in the Bay of Biscay (Pollard et al. 1996) and is transported northwards by the SEC through the region and beyond (Ellett & Martin 1973, New et al. 2001). Less saline WNAW is carried into the area by the main branch of the North Atlantic Current (NAC) but generally turns northwards to the west of Hatton

Offshore Energy SEA 4: Appendix 1 Environmental Baseline
A1d.48
Bank and does not usually enter the Rockall Trough (Schmitz & McCartney 1993, Pollard et al. 1996, Holliday et al. 2000).
Since the early 1990s there has been a general warming of surface waters in the Rockall Trough. This warming does not appear to be directly related to atmospheric conditions, as indicated by the NAO Index or to variations in local net atmospheric heat fluxes. Instead, variations in temperature appear to be caused by varying inputs of the water masses to the south of the region - Central North Atlantic Water, Mediterranean Outflow Water, Western North Atlantic Water and Sub Arctic Intermediate Water (Holliday 2003).
Beneath the generally northward flowing surface waters, drifters at a nominal 700m exhibit a more complicated flow pattern. Currents in the northern and western parts of the Iceland Basin are derived from the outflow from the Arctic and flow towards the south-west along the Iceland Shelf edge and Reykjanes Ridge (Lavender et al. 2005). On the western flank of the Rockall Plateau there is a complementary north-eastward flow of ~0.02m/s, which appears to cross the gap between the Lousy and Hatton Banks and enter the Rockall Trough. Within the Rockall Trough, at 700m, there is a fairly strong anti-clockwise rotating current (~0.05m/s), with additional eddies and large scale circulation cells in the order of 100km wide and 1,000m deep (Sherwin et al. 2015). In the north, Norwegian Sea Deep Water (NSDW) is known to flow episodically southwards over the Wyville–Thomson Ridge and into the Rockall Trough at a depth of 600-1,200m (e.g. Sherwin et al. 2008, Johnson et al. 2010). Circulation models (New & Smythe-Wright 2001) and evidence from sediment bedforms within the Rockall Trough (Lonsdale & Hollister 1979) suggest an overall cyclonic flow of deeper water (>1,200m depth), with Labrador Sea Water and North Atlantic Deep Water entering the Rockall Trough from the south (Figure A1d.23). The deep flows then diverge from the slope current and are topographically steered anticlockwise around the Trough, leaving the region immediately to the south of Rockall Bank. These south-westward bottom flows are thought to occur primarily on the lower slopes of the Rockall Bank (New & Smythe-Wright 2001).

Offshore Energy SEA 4: Appendix 1 Environmental Baseline
A1d.49
Figure A1d.23: Rockall Trough area showing bathymetry and major currents
Notes: WTR = Wyville Thomson Ridge, RB = Rosemary Bank, ADS = Anton Dohrn Seamount, HTS = Hebrides Terrace Seamount, WTOW = Wyville Thomson Overflow Water, NAW = North Atlantic Water, ENAW = East North Atlantic Water, SAIW = Sub-Arctic Intermediate Mater, MOW = Mediterranean Overflow Water, LSW = Labrador Sea Water. Source: Sherwin et al. (2015)
During the spring and summer months the water column over much of the oceanic region undergoes thermal stratification, with an upper mixed layer down to approximately 75-100m. The nature and extent of stratification varies both spatially and temporally. Generally, stratification breaks down with the onset of autumn cooling and associated more energetic conditions. This mixing process is reflected in winter temperatures which are fairly constant (9-10°C) through the water column down to about 500-750m, and reach 5-6°C by 1,500m (SAMS 2006). Upwelling occurs along the shelf edge, bringing nutrient rich water to the surface with associated enhanced productivity (IACMST 2005).
Seamounts have been shown to be areas of dynamic hydrography, including internal waves and seamount trapped waves, due to their interaction with ocean currents. Variability in both upper and deep circulation due to eddies has been measured in the Rockall Trough, with eddy activity greatest around the seamounts of the northern Rockall Trough (Dickson et al. 1986, Booth 1988). Current observations near the Anton Dohrn seamount revealed very variable directions, with speeds generally in the order of 0.1-0.2m/s in the upper layers and, about 0.05m/s near the seabed (Ellett et al. 1986). Wind stress levels in the Rockall Trough tend to peak in winter, whilst eddy kinetic energy levels (in the 3 to 28 day band) appear to be at a maximum in spring (Dickson et al. 1986). Drifter observations in January 1984 (Booth 1988) demonstrated that the region around the Anton Dohrn seamount was rich in small eddies with

Offshore Energy SEA 4: Appendix 1 Environmental Baseline
A1d.50
periods of between 1 to 3 days. Other drifter observations (Burrows & Thorpe 1999) have shown much larger eddies, with periods in the order of 10 days and speeds up to 0.25m/s.
Internal waves are periodic oscillations of the water column through disturbances in the vertical density stratification. Essentially, tidal flow across the shelf edge causes the thermocline to depress and this depression propagates away from the shelf edge region as a wave. The NE Atlantic is a prolific area of internal wave generation (Baines 1986), and internal waves have been observed in SAR (Synthetic Aperture Radar) images (e.g. New 1988, Small et al. 1999). These images show the generation points at the shelf edge and packets of internal waves propagating away from the source region periodically on every tide. Booth (1981) suggested that strong oscillatory currents found in the deep northern sector of the Rockall Trough were a result of internal tidal motions. Non linear internal waves (solitons) measured during the LOIS Shelf Edge Study (SES) between 56°N-58°N were associated with oscillations in the thermocline of up to 50m and occasional strong currents (up to 0.5m/s). In regions where internal waves reflect from the continental slope, periodic mixing of water adjacent to the seabed is often observed (White 1994). Such conditions may cause the generation of nepheloid layers (regions of suspended sediment) in the water adjacent to the slope (Thorpe & White 1988).
Cascades of shelf water down slope generally occur intermittently from late winter to spring, when at temperate latitudes water on the shelf can be colder (denser) than in the ocean. Ellett (1968, cited by SAMS 2006) found evidence of cascading on the western side of the Rockall Bank and estimated that the associated speed was about 0.02m/s. Although sufficient conditions for cascading have been observed within the region, there have been few confirmed reports.
Regional Seas 10 and 11 experience some of the harshest metocean conditions in the world. The long Atlantic fetch allows waves of considerable size to develop and these cross the area, particularly during winter months and the region is exposed to the full force of storms generated in the Atlantic Ocean. The largest wave recorded in the Rockall Trough to date was measured at 29.1m in February 2000 (Holliday et al. 2006). The region also experiences exceptionally high interannual variability, and monthly averaged significant wave heights can vary by as much as a factor of two between consecutive years (Woolf et al. 2002). Much of this variability can be attributed to changes in the North Atlantic Oscillation Index (IACMST 2005). For example, a unit change in the NAO will induce a 0.42m increase in the mean winter wave height, and a 1.28m change in the 100 year return value (Woolf et al. 2002).
A1d.12 Evolution of the baseline
Climate change has and will continue to have a pervasive effect on all aspects of the coastal and marine environment including flooding, coastal erosion, water quality and resources (e.g. Quante & Colijn 2016). Globally, the nature and extent of observed changes and projected impacts is described by the latest IPCC (2019) report on the ocean and cryosphere32 in a changing climate. Over the 21st century, the ocean is projected to transition to unprecedented conditions with increased temperatures (virtually certain), greater upper ocean stratification (very likely), further acidification (virtually certain), oxygen decline (medium confidence), and
32 Defined as the components of the Earth System at and below the land and ocean surface that are frozen, including snow cover, glaciers, ice sheets, ice shelves, icebergs, sea ice, lake ice, river ice, permafrost, and seasonally frozen ground (IPCC 2019).

Offshore Energy SEA 4: Appendix 1 Environmental Baseline
A1d.51
altered net primary production (low confidence). The Atlantic Meridional Overturning Circulation (AMOC) is projected to weaken (very likely). The rates and magnitudes of these changes will be smaller under scenarios with low greenhouse gas emissions (very likely) (IPCC 2019).
The most recent Defra UK Climate Projections (UKCP18) considered a series of marine projections which focussed on changes in coastal sea level, including extreme water levels that arise from storm surges and surface waves (Palmer et al. 2018). The UK Marine Climate Change Impacts Partnership (MCCIP) was set up to provide a coordinating framework to enable the transfer of high quality, impartial evidence and guidance on adaptation regarding marine climate change impacts to UK policy advisors and decision-makers. The most recent Report Card 2020 (MCCIP 2020) and relevant underpinning scientific reviews (e.g. Tinker & Howes 2020, Sharples et al. 2020, McCarthy et al. 2020) provide the latest evidence in relation to specific aspects of the water environment at a UK-wide scale, and this is summarised below.
A1d.12.1 Sea surface temperature
Globally, the five years since the last MCCIP full report card was published in 2013 have been the five warmest since records began, with 2017 being recorded as the warmest year on record for the global ocean (Cheng & Zhu 2018). Embedded in the global average trend are local and regional variations; cold-ocean temperature anomalies have been observed in the mid- to high-latitude North Atlantic, starting in the winter 2013/2014, with temperatures at their lowest in 2015 (Figure A1d.24). The cause is thought to be extreme ocean-surface heat loss as a result of atmospheric forcing (Josey et al. 2018). After 2015, the cold anomaly weakened but persisted through 2017, was reinforced in 2018 (González-Pola et al. 2019) and appeared to have weakened again in 2019 (González-Pola et al. 2020).
The warming trend in surface waters around the UK over the last 30 years is shown in Figure A1d.25. Significant increases in SSTs have been recorded to the north of Scotland and in the majority of the North Sea, up to 0.24°C per decade. The influence of the North Atlantic cold anomaly, has weakened the warming along the UK’s south-west coast and resulted in an increase of areas where warming trends are not statistically significant, compared to previous analysis in MCCIP’s 2013 and 2017 (Dye et al. 2013; Hughes et al. 2017).

Offshore Energy SEA 4: Appendix 1 Environmental Baseline
A1d.52
Figure A1d.24: Maps of annual temperature anomalies at 10m depth in the North Atlantic, 2013–2018
Notes: Anomalies are the differences between the ISAS monthly mean values and the reference climatology, WOA05. The colour-coded scale is the same in all panels. Data prepared from the Coriolis, ISAS monthly analysis of Argo data. Source: González-Pola et al. (2019).
Figure A1d.25: Trend in annual average sea-surface temperature (°C/decade) from 1988 to 2017
Notes: Data are from the HadISST1.1 data set (Rayner et al. 2003). Crosses indicate where the trends are not significant at the 95% confidence level (alpha=0.05) using Mann-Kendall non-parametric test for a trend (Mann 1945, Kendall 1975, Gilbert 1987). Source: See Tinker & Howes (2020) for relevant references.

Offshore Energy SEA 4: Appendix 1 Environmental Baseline
A1d.53
In the most northern part of the North Sea, the temperature is influenced by inflowing North Atlantic water, showing similar decadal variations to the water on the Scottish continental shelf and offshore waters to the west of Scotland (Figure A1d.26C) and a general warming since the mid-1980s. Temperatures in the northern North Sea had been declining from a peak in 2003, but in the last few years have increased again with 2014 and 2016 the warmest and third warmest years since 1981, respectively.
In the southern North Sea, atmospheric forcing has been the dominant influence over temperatures. Since the mid-1980s, temperatures have increased, peaking in the late 80s to early 90s. Temperatures then declined with a cool period beginning in 2010 where temperature anomalies were below the average for the period 1981–2012 (Figure A1d.26D). In recent years, temperatures have been warmer, displaying a similar trend to the Northern North Sea with 2014 the warmest year since the late 1970s and temperature anomalies remaining above average. As in the Northern North Sea Region, 2015 was a cooler year but was still warmer than average for the period 1981–2012.
Sea-surface temperatures in the Eastern English Channel displayed no significant trend until the mid-1990s when temperatures began to increase (Figure A1d.26E). No data were recorded for 2016, but 2017, 2014 and 2015 were the second, fourth and sixth warmest years in the 125-year record.
The western English Channel, away from the coast, is mainly influenced by the inflow of North Atlantic Water from the west. Station E1 of the Western Channel Observatory has been sampled since 1903 and lies in 75m of water. Strong interannual to decadal scale variability is evident in this time-series data, but with a period without data this makes it difficult to identify trends, and in particular the data-gap coincides with the period of strong warming apparent in most of the other datasets at the end of the 1980s. Average or below average temperatures in the early 1980s were replaced by warmer than average waters on resumption of sampling, with particularly warm conditions around 2007, more recent years have been close to but slightly higher than average (Figure A1d.26F).
The Tiree Passage Mooring time–series from the Inner Hebrides has been maintained since 1981. The time–series data up to 2014 were recently published (Jones et al. 2018) and shows a cooling from 1981 to the mid-1980s, strong warming between 1986 and 1990, a minimum in the early 1990s and then generally warm conditions apparent between 2002 and 2008 (Inall et al. 2009). As at many of the UK shelf temperature time series locations (see Figure A1d.26C, D, H and G) the years between 2008 and 2013 were slightly cooler than 2002–2008 but warm relative to the 1980s. At this location the winter of 2013 appears to have been the coldest since 1994.
Measurements taken in the Faroe-Shetland Channel show a warming trend since the mid-1980s in the upper levels of the open ocean (0–200m), reaching a peak in 2007 (Figure A1d.26A). Since the last full MCCIP report in 2013, temperatures have decreased, however average temperatures for 2014, 2016 and 2017 are within the 20 warmest in the record. Since the early 2000s, the deeper water of the channel, below 800m where the water has no direct contact with the atmosphere, appears to be warming, with 2017 the third warmest year on record (Figure A1d.26B).
Upper ocean waters in the Rockall Trough (30–800m), display a warming trend since the mid-1990s, peaking in 2007. Since 2007, temperatures have been decreasing and the last 4 years of data appear to be a continuation of this trend (Figure A1d.26I). Deeper waters have displayed little trend over the last 30 years (Figure A1d.26J).

Offshore Energy SEA 4: Appendix 1 Environmental Baseline
A1d.54
To assess annual variations in each region, normalised anomalies have been prepared using the Hadley Gridded Sea Surface Temperature dataset (HADISST1.133, Hawes & Tinker 2020) and are presented in Figure A1d.27. When viewing the data in this format, the similarity in sea surface temperature trends across all CP2 regions is evident. In the mid-1990s, there is a shift to predominantly warm anomalies across all regions with 2007 and 2014 being exceptionally warm years across all regions.
Warming of UK shelf seas is projected to continue over the coming century. Most models suggest an increase of between 0.25°C and 0.4°C per decade. There may be some regional differences. For example, warming is expected to be greatest in the English Channel and North Sea, with smaller increases in the outer UK shelf regions (MCCIP 2020, Tinker & Howes 2020).
33 https://www.metoffice.gov.uk/hadobs/hadisst/

Offshore Energy SEA 4: Appendix 1 Environmental Baseline
A1d.55
Figure A1d.26: Temperature anomalies (black line) and five year running mean (red line) for the UK Charting Progress regions
Source: From IROC2017 time-series data (González-Pola et al. 2018), Tinker & Howes (2020).

Offshore Energy SEA 4: Appendix 1 Environmental Baseline
A1d.56
Figure A1d.27: Anomaly plots for sea-surface temperature anomaly (°C) calculated from HADISST v1 for the period 1950–2018.
Note: CP2 regions - 01 northern North Sea, 02 southern North Sea, 03 eastern Channel, 04 western Channel / Celtic Sea, 05 Irish Sea, 06 Minches western Scotland, 07 Scottish continental shelf, 08 Atlantic NW Approaches. Anomalies are calculated relative to the period 1981–2010 and are normalised with respect to the standard deviation (e.g., a value of +2 indicates 2 standard deviations above normal). Colour intervals 0.5; reds = positive/warm; blues = negative/cool. Source: Tinker & Howes (2020), MCCIP Report Card 2020.
With respect to key challenges and emerging issues, Tinker & Howes (2020) note that the long-term warming trend has also increased the frequency of discrete periods of regional extreme temperatures (marine heatwaves). Globally, marine heatwaves34 have doubled in frequency over the period 1982 to 2016 and have become longer-lasting, more intense and more extensive with between 84–90% of these marine heatwaves attributable to the anthropogenic temperature increase (IPCC 2019). Smale et al. (2019) identify the North Sea as a region where there are a high proportion of species are at the edge of their range of thermal tolerance and high levels of non-climatic human stressors and marine heatwave intensification has concurrently affected the ecosystem. More research is required on the near-shore experience of heat wave conditions and the extent to which these affect industry, society and ecosystems (Tinker & Howes 2020).
A1d.12.2 Stratification
In areas where stratification is controlled thermally, modelling work has suggested that the timing of peak stratification was delayed over the period of 1960-2000 (Young & Holt 2007).
34 A marine heatwave is a period of extreme warm near-sea surface temperature that persists for days to months and can extend up to thousands of kilometres (IPCC 2019).
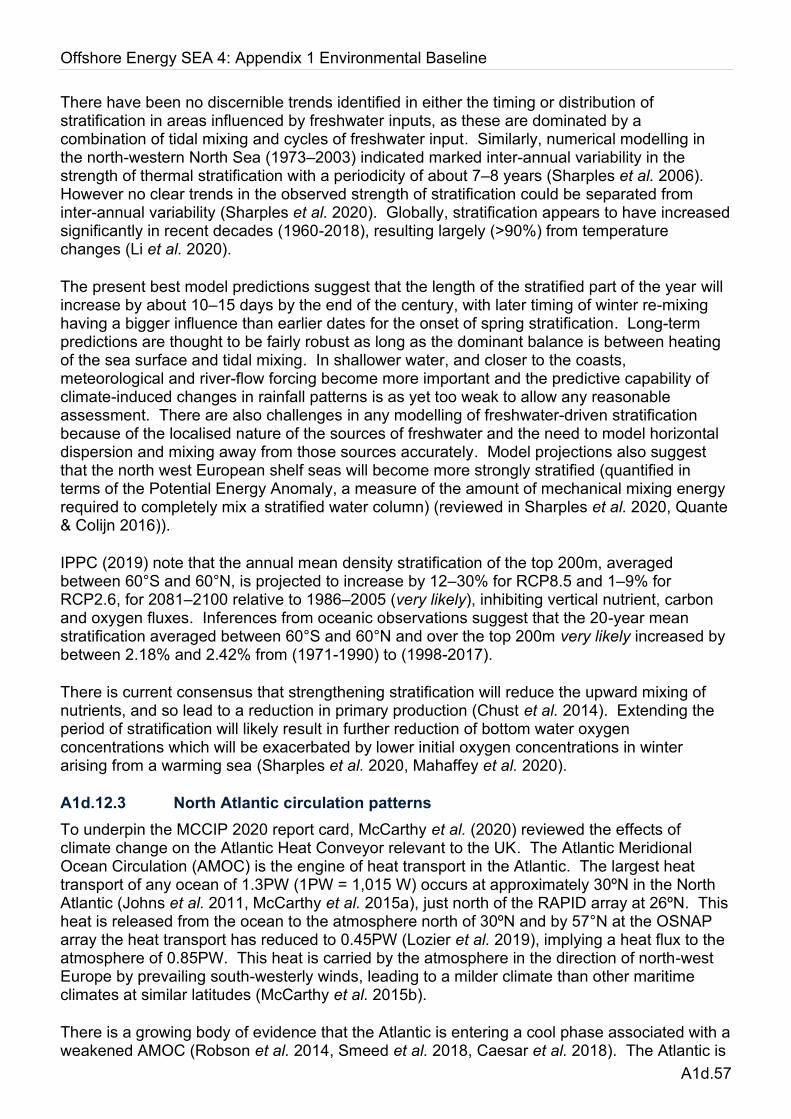
Offshore Energy SEA 4: Appendix 1 Environmental Baseline
A1d.57
There have been no discernible trends identified in either the timing or distribution of stratification in areas influenced by freshwater inputs, as these are dominated by a combination of tidal mixing and cycles of freshwater input. Similarly, numerical modelling in the north-western North Sea (1973–2003) indicated marked inter-annual variability in the strength of thermal stratification with a periodicity of about 7–8 years (Sharples et al. 2006). However no clear trends in the observed strength of stratification could be separated from inter-annual variability (Sharples et al. 2020). Globally, stratification appears to have increased significantly in recent decades (1960-2018), resulting largely (>90%) from temperature changes (Li et al. 2020).
The present best model predictions suggest that the length of the stratified part of the year will increase by about 10–15 days by the end of the century, with later timing of winter re-mixing having a bigger influence than earlier dates for the onset of spring stratification. Long-term predictions are thought to be fairly robust as long as the dominant balance is between heating of the sea surface and tidal mixing. In shallower water, and closer to the coasts, meteorological and river-flow forcing become more important and the predictive capability of climate-induced changes in rainfall patterns is as yet too weak to allow any reasonable assessment. There are also challenges in any modelling of freshwater-driven stratification because of the localised nature of the sources of freshwater and the need to model horizontal dispersion and mixing away from those sources accurately. Model projections also suggest that the north west European shelf seas will become more strongly stratified (quantified in terms of the Potential Energy Anomaly, a measure of the amount of mechanical mixing energy required to completely mix a stratified water column) (reviewed in Sharples et al. 2020, Quante & Colijn 2016)).
IPPC (2019) note that the annual mean density stratification of the top 200m, averaged between 60°S and 60°N, is projected to increase by 12–30% for RCP8.5 and 1–9% for RCP2.6, for 2081–2100 relative to 1986–2005 (very likely), inhibiting vertical nutrient, carbon and oxygen fluxes. Inferences from oceanic observations suggest that the 20-year mean stratification averaged between 60°S and 60°N and over the top 200m very likely increased by between 2.18% and 2.42% from (1971-1990) to (1998-2017).
There is current consensus that strengthening stratification will reduce the upward mixing of nutrients, and so lead to a reduction in primary production (Chust et al. 2014). Extending the period of stratification will likely result in further reduction of bottom water oxygen concentrations which will be exacerbated by lower initial oxygen concentrations in winter arising from a warming sea (Sharples et al. 2020, Mahaffey et al. 2020).
A1d.12.3 North Atlantic circulation patterns
To underpin the MCCIP 2020 report card, McCarthy et al. (2020) reviewed the effects of climate change on the Atlantic Heat Conveyor relevant to the UK. The Atlantic Meridional Ocean Circulation (AMOC) is the engine of heat transport in the Atlantic. The largest heat transport of any ocean of 1.3PW (1PW = 1,015 W) occurs at approximately 30ºN in the North Atlantic (Johns et al. 2011, McCarthy et al. 2015a), just north of the RAPID array at 26ºN. This heat is released from the ocean to the atmosphere north of 30ºN and by 57°N at the OSNAP array the heat transport has reduced to 0.45PW (Lozier et al. 2019), implying a heat flux to the atmosphere of 0.85PW. This heat is carried by the atmosphere in the direction of north-west Europe by prevailing south-westerly winds, leading to a milder climate than other maritime climates at similar latitudes (McCarthy et al. 2015b).
There is a growing body of evidence that the Atlantic is entering a cool phase associated with a weakened AMOC (Robson et al. 2014, Smeed et al. 2018, Caesar et al. 2018). The Atlantic is

Offshore Energy SEA 4: Appendix 1 Environmental Baseline
A1d.58
a region of large multi-decadal variability, most prominently manifested in Atlantic Multidecadal Variability (AMV) where SSTs in the North Atlantic, focused on the subpolar gyre, show periods of multiple decades of anomalous warmth or coolness relative to the global average (Sutton et al. 2017). The leading hypothesis for AMV is that AMOC-driven heat transport controls the phases of the AMV by controlling the export of heat into the subpolar gyre. The AMV was in a relatively cool period through the 1970s and 1980s, before rapidly warming during the 1990s (Robson et al. 2012). There is growing evidence that this warm period came to an end in the mid-2000s with the reversal of warming (salinifying) trends to cooling (freshening) trends focused on the subpolar gyre (Robson et al. 2016, Frajka-Williams et al. 2017). In addition the direct observations from the RAPID array that support a declining AMOC (Smeed et al. 2014, 2018), indirect measurements of the AMOC based on a combination of sea surface height and either Argo data at 41ºN (Willis 2010, Baringer et al. 2018) or Florida Straits transport at 26.5ºN (Frajka-Williams 2015) support a decline in the AMOC since the mid-2000s. There is broad agreement that the AMOC has weakened since the mid-2000s with most literature pointing to this being part of a multi-decadal cycle that could potentially be superimposed on a long-term decline that is predicted due to climate change.
IPCC (2019) indicates that there is insufficient data to quantify the magnitude of the weakening of the AMOC, or to properly attribute it to anthropogenic forcing due to the limited length of the observational record. Although attribution is currently not possible, CMIP5 model simulations of the period 1850–2015, on average, exhibit a weakening AMOC when driven by anthropogenic forcing (IPCC 2019).
One of the most dramatic manifestations of Atlantic climate variability in recent years was the 2015 cold anomaly (see Section A1d.11.1 above). Record cold SSTs were recorded south of Greenland in 2015, persisted through 2016, disappeared in 2017 but returned in 2018. These extreme cold anomalies were a combination of extreme heat loss and ocean re-emergence (Josey et al. 2018). The atmospheric domination of this interannual cold event in the subpolar gyre was notably different from the cool anomalies in the subtropical gyre in 2009–10, which were dominated by AMOC variations (Bryden et al. 2014, Cunningham et al. 2013). Atmospheric control of this recent interannual event in the subpolar gyre does not contradict the decadal timescale cooling and slowdowns that have been observed in the Atlantic but does serve as a note of caution for interpreting SST variability as being solely due to AMOC variations.
Similarly, since 2010, freshening has been noted throughout the eastern subpolar gyre with data from the Ellett line between Scotland and Iceland, showing a freshening from 0.15g/kg in the Iceland basin to 0.1g/kg in the Rockall Trough. This freshening has in many cases been in concert with a cooling ranging from 1.0ºC in the Iceland Basin to 0.5ºC in the Rockall Trough (McCarthy et al. 2020). Holliday et al. (2020) has shown that the basin-scale freshening of the subpolar North Atlantic between 2012–2016 was more rapid and of a larger magnitude than any changes observed in the previous five decades. Additionally, the salinity in the eastern basins reached a level lower than any records have shown for the past 120 years. This massive and rapid increase in freshwater content of the region resulted primarily from large scale changes in ocean circulation driven by atmospheric forcing (Holliday et al. 2020).
A1d.12.4 North Sea circulation
North Sea oceanographic conditions are determined by the inflow of saline Atlantic Water (AW) and the ocean–atmosphere heat exchange. Inflow through the northern entrances (and, to a lesser degree, through the English Channel) can be strongly influenced by the NAO. Numerical model simulations also demonstrate strong differences in North Sea circulation depending on the state of the NAO. The AW mixes with river run-off and lower-salinity Baltic

Offshore Energy SEA 4: Appendix 1 Environmental Baseline
A1d.59
out flow along the Norwegian coast. A balance of tidal mixing and local heating forces the development of a seasonal stratification from April/May to September in most parts of the North Sea (González-Pola et al. 2019).
The North Sea is characterised by very high variability due to the alternating dominance of the maritime climate of the North Atlantic and the continental climate (e.g. Backhaus 1989, Hawkins & Sutton 2009). The large natural variability has a greater impact on the local North Sea wind field than potential anthropogenic-induced trends, and strong natural climate variability from annual to multi-decadal scales (e.g. Arguez et al. 2009) is a particular challenge when developing projections of climate change in the North Sea (Quante & Colijn 2016). Holt et al. (2018) describe downscaling shelf sea model experiments that demonstrate the potential for a substantial reduction in the North Sea circulation arising from changes in the North Atlantic and Arctic Oceans in the second half of the 21st century. The reduction in circulation arises from several causes relating to increased density layering at the continental shelf edge, changes in the large-scale ocean circulation and salinity, and disruption of the density-driven circulation of the North Sea.
A1d.12.5 Wave climate
Inter-annual variability in the modern wave climate in the UK is strongest in the winter and can be related to atmospheric modes of variability, most notably the North Atlantic Oscillation. Winter wave heights significantly correlate with the NAO index and other measures of the strength of the westerly winds in the west and Irish Sea (Regional Seas 4-6). This correlation is particularly strong in the north-west (Regional Seas 7-11). The characteristics of fluctuations in the westerly winds in the temperate northern hemisphere may also be described as an ‘annular mode’35, the Northern Annular Mode (NAM) (Solomon et al. 2007). Thus the increased mid-latitude westerlies in the North Atlantic can largely be viewed as reflecting either NAO or NAM changes (Solomon et al. 2007). The recent strong trend in the NAO (towards stormier conditions) is apparently unique in its history, but it is controversial whether this is a response to greenhouse gas forcing (Osborn 2004). Many Global Climate Models suggest a general trend towards the stormier tendency of NAO/NAM in the 21st century (e.g. Terray et al. 2004; Miller et al. 2006). However, alternative analyses suggest different and mostly weaker changes in winds and storminess (e.g. Hulme et al. 2002; Barnett et al. 2006). Typically, climate models predict a decrease in the total number of extra-tropical cyclones but an increase in the number of intense events (Lambert & Fyfe 2006). Either a strengthening of the storm track or an increase in intense cyclones will result in a deterioration of wave conditions (Wolf & Woolf 2006). This is a likely outcome in the wintertime in western and northern UK waters (Tsimplis et al. 2005) but there can be only low confidence in this prediction. However, the 2020 MCCIP report card concludes that predicting future changes to the strength, frequency and track of storms is difficult, and there is still uncertainty as to what could happen. Most model projections suggest that winters may become a little windier, but not any more than the variability in winds we currently experience.
There have been significantly more severe storms over the UK since the 1950s (Alexander et al. 2005). However, trends in winds around the UK are much weaker than for wave heights. Most of the increase in wave heights is attributed to “swell” responding to changes in the persistence of westerly winds over the North Atlantic rather than locally generated waves. The offshore oil and gas industry has collected data on wave heights over the last 40 years. The data for the northern North Sea indicate that mean significant wave heights during the period
35 Annular modes are hemispheric scale patterns of climate variability caused by internal atmospheric dynamics in the middle latitudes. They are the most important patterns of climate variability in mid to high latitudes.

Offshore Energy SEA 4: Appendix 1 Environmental Baseline
A1d.60
January–March have risen between 1973-1995 by about 5-10% (0.2-0.3m), with a decrease thereafter. This general increase in wave height was also observed between 1960 and 1990 in the north east Atlantic and between 1966-1982 (0.02m/yr increase) at the Seven Stone Light Buoy off Lands End (Bacon & Carter 1991). However, there is no clear pattern in results since 1990 suggesting no significant long-term trend superimposed on significant interannual variability. New re-analysis of longer data sets have however suggested a general increase over the whole 20th Century, with the strongest increase between 1958-2001 (Woolf & Wolf 2013).
There is as yet no consensus on the future storm and wave climate, stemming from diverse projections of future storm track behaviour, but there is considerable effort currently underway to determine the magnitude and causes of long-term changes in wave climate and storm frequency around the UK.
Downscaling from global to regional climate change models has allowed greater resolution of future projections of wave climate around the UK (see Bircheno & Wolf 2018, Palmer et al. 2018, Wolf et al. 2020). Figure A1d.28 shows modelled significant wave height (SWH) at points along the coastline of the British mainland which has been ‘unwrapped’ anticlockwise, starting and ending in the Bristol Channel. The top panel shows historical (1981-2000) conditions of mean and extreme (AnnMax) SWH which shows that the largest waves are seen on western facing coasts, dominated by long swell waves. The lowest wave heights are found in more enclosed seas (e.g. Irish Sea, North Sea), where windsea waves are generated by local winds with a short fetch (Palmer et al. 2018). There is a projected decrease in the mean SWH for the majority of the projections, particularly in the North Sea. The extreme wave heights are much more variable between projections with lower confidence in the projected changes. Increases in extreme wave height are seen in the exposed southwest (Cornwall) and northwest approaches (Western Isles of Scotland), whereas more sheltered areas show mixed results, with largest discrepancies between RCPs and time horizons for the east coast of England and Scotland and the Irish Sea. There is no consistent direction of change along the North Sea coast, with RCP4.5 and RCP8.5 forecasting alternately increases/decreases at the same point (Bircheno & Wolf 2018).

Offshore Energy SEA 4: Appendix 1 Environmental Baseline
A1d.61
Figure A1d.28: Coastal strip plots of historical wave climate and projected future changes for UK mainland
Note: The top panel shows the mean SWH (dotted line) and mean AnnMax (solid line) from the historical simulation (1981-2000). The middle and bottom panels show percentage changes in mean SWH and AnnMax respectively, relative to the baseline period. The four coloured lines represent “mid-21st century” (2041-2060) and “end-21st century” (2081-2100) change signals for RCP4.5 and RCP8.5. Source: Palmer et al. (2018).
A1d.12.6 pH
To inform the MCCIP 2020 report card, Humphreys et al. (2020) reviewed air-sea CO2 exchange and ocean acidification in UK seas and adjacent waters. Ocean acidification is closely linked with climate change, with increasing atmospheric CO2 being a driving factor in both cases. The uptake of CO2 by the global oceans is estimated to total ~25% of all anthropogenic CO2 emissions (Le Quéré et al. 2018), with a corresponding reduction of surface pH by ~0.1 units from the pre-industrial values (Royal Society 2005). Ocean time series station and transects corroborate these changes, with an anthropogenically induced surface pH decrease of ~0.002 units per year since 1990 (Williamson et al. 2013). However, within the North Atlantic, this decrease has not been uniform, with ocean acidification occurring more rapidly in the European Region (both on-shelf and in deeper waters), than the central Atlantic or Caribbean (Schuster et al. 2009).
Although high resolution, decadal scale records of pH are not available for UK waters, Cefas, Marine Scotland and other partners have implemented a spatially comprehensive observation programme of pH related parameters. Recent surveys have added to that data and initial results suggest there is marked vertical and horizontal variability within UK waters, with significant seasonal and interannual variability superimposed on the longer term trends. For example, Figure A1d.29 highlights the observed variability in seawater pH (a measure of ocean acidification, inversely related to hydrogen ion concentration on a logarithmic scale) over a

Offshore Energy SEA 4: Appendix 1 Environmental Baseline
A1d.62
range of spatial and temporal scales. Spatial variability in pH can occur across distances of 10-100km on the horizontal scale at the sea surface, and 10-100m on the vertical scale in the water column. However, the greatest change can be over ~1cm in the top layer of sediment, reflecting changes in other conditions (e.g. oxygen). Temporal variability in the pH of surface seawater can occur from day to day, month to month, and year to year. These patterns of variability are important to understanding the responses of marine organisms and ecosystems to future ocean acidification (Kröger et al. 2018).
Figure A1d.29: Recent observations of pH and its variability in the northwest European continental shelf sea
Notes: (a) July-August data, showing strong horizontal gradients in surface layer pH. The dashed black contour (at 200m depth) marks the edge of the shelf sea. Locations of sampling sites A, L4 and Stonehaven (Sh) labelled. (b) Site A in summer in the Celtic Sea shows vertical changes in pH in the water column and underlying sediment. (c) Time-series observations at site L4 off Plymouth reveal a strong seasonal cycle in surface layer pH. All data from 2009 to 2015 are shown, normalised to each year’s annual mean pH. (d) The strength of the seasonal cycle in surface layer pH at L4 appears to have increased over the period measured, and the seasonal pattern varies from year to year. The mean pH has decreased over the same time period. Sources: As described by Humphreys et al. (2020).
As part of the UK ocean acidification (UKOA) research programme (2010-2016)36, a coupled physical-ecosystem model was used to project future pH and aragonite saturation state across
36 https://www.oceanacidification.org.uk/

Offshore Energy SEA 4: Appendix 1 Environmental Baseline
A1d.63
the north-west European shelf sea. Under a high CO2 emissions scenario (RCP 8.5), the ROAM (Regional Ocean Acidification Modelling) model projected pH decreasing at a mean rate of 0.0036/yr, leading to a drop in mean pH across the shelf of about 0.366 from the present day to the year 2100. Significant spatial variability in the rate of pH decline was projected, with changes as fast as 0.005/yr in some coastal areas like the Bristol Channel and the west coast of Denmark, and as slow as 0.002/yr in the Celtic Sea (Humphreys et al. 2020).
A1d.12.7 Sea level
The special report on the ocean and cryosphere in a changing climate (IPCC 2019) indicates that global mean sea level (GMSL) is rising (virtually certain) and accelerating (high confidence). The sum of glacier and ice sheet contributions is now the dominant source of GMSL rise (very high confidence). GMSL from tide gauges and altimetry observations increased from 1.4mm yr–1 over the period 1901–1990 to 2.1mm yr–1 over the period 1970–2015 to 3.2mm yr–1 over the period 1993–2015 to 3.6mm yr–1 over the period 2006–2015 (high confidence). The dominant cause of GMSL rise since 1970 is anthropogenic forcing (high confidence) (IPCC 2019).
Sea-level change at any particular location depends on many geophysical processes operating across a range of time and space scales. Regional variability is affected by ocean-and atmosphere-circulation processes, and local changes in seawater temperature and salinity (Horsburgh et al. 2020). Over the Atlantic, the regional sea level variability at interannual to multi-decadal time scales, is generated by surface wind anomalies and heat fluxes associated with the NAO (Han et al. 2017) and also by ocean heat transport due to changes in the Atlantic meridional overturning circulation (McCarthy et al. 2015a). Both mechanisms are not independent as heat fluxes and wind stress anomalies associated with NAO can induce changes in the AMOC (Schloesser et al. 2014, Yeager & Danabasoglu 2014, IPCC 2019).
Tidal gauge records from around the UK show a rise of 1.4 ± 0.5mm yr-1 (Horsburgh & Lowe 2013), broadly consistent with the global value. However, significant multi-decadal variability is seen in numerous long term tidal gauge records, with accelerations in global mean sea level rise seen in 1920-1950 and 1990-present and decelerations in 1910-1920 and 1955-1980 (Rhein et al. 2013). Despite this cyclic variation there is evidence for an increase in sea level rise from the 19th to 20th Century (Horsburgh & Lowe 2013). All shorelines of the UK are presently experiencing some sea-level rise and this is expected to continue into the future. When vertical land movement is included, then relative rates of sea level are lower in much of Scotland, Northern Ireland and the north of England, and up to 1mm per year greater for the south of England, Channel Islands, Isles of Scilly, and the Shetland Isles (Horsburgh et al. 2020).
Extreme coastal water levels (e.g. storm surges) around the UK are caused by a combination of exceptionally high tides and severe weather events due to meteorological effects such as winds and changes in atmospheric pressure, alongside mean sea level increases. They can last from a couple of hours to multiple days and are very hard to predict. While changes in storminess could contribute to changes in sea-level extremes, there is little or no observational evidence for either systematic long-term changes in storminess or any detectable change in storm surge magnitude (IPCC 2012). The findings of IPCC (2013) are that at most locations, mean sea-level change is the main factor influencing observed changes to sea-level extremes (although large-scale modes of ocean variability, such as the North Atlantic Oscillation may also be important). The scientific consensus is overwhelmingly that any changes in extreme sea levels for the UK and worldwide, and any observed increases in actual flooding, have been driven by the rise in mean sea level (as reviewed by Horsburgh et al. 2020).

Offshore Energy SEA 4: Appendix 1 Environmental Baseline
A1d.64
Global mean sea level rise under RCP2.6 is projected to be 0.39m (0.26–0.53m, likely range) for the period 2081–2100, and 0.43m (0.29–0.59m, likely range) in 2100 with respect to 1986–2005. For RCP8.5, the corresponding GMSL rise is 0.71m (0.51–0.92m, likely range) for 2081–2100 and 0.84m (0.61–1.10m, likely range) in 2100. Mean sea level rise projections are higher by 0.1m compared to AR5 under RCP8.5 in 2100, and the likely range extends beyond 1m in 2100 due to a larger projected ice loss from the Antarctic Ice Sheet (medium confidence). The uncertainty at the end of the century is mainly determined by the ice sheets, especially in Antarctica (IPCC 2019). Projected UK-average sea-level rise (as shown by UKCP18, Palmer et al. 2018) is slightly lower than global mean sea-level rise across all RCP scenarios (Horsburgh et al. 2020). Sea level rise is not expected to be spatially consistent around the UK (see Figure A1d.30), due to the effect of isostatic adjustment which is expected to add 1.2mm/yr to sea level in SW England and reduce sea level by 2mm/yr in parts of Scotland (Robins et al. 2016). As a result coastal areas and estuaries in SE England are most at risk of a combination of land sinking and seas rising.
Global mean sea level rise will cause the frequency of extreme sea level events at most locations to increase. Local sea levels that historically occurred once per century (historical centennial events) are projected to occur at least annually at most locations by 2100 under all RCP scenarios (high confidence). The year when the historical centennial event becomes an annual event in the mid-latitudes occurs soonest in RCP8.5, next in RCP4.5 and latest in RCP2.6. The increasing frequency of high water levels can have severe impacts in many locations depending on the level of exposure (high confidence) (IPCC 2019).

Offshore Energy SEA 4: Appendix 1 Environmental Baseline
A1d.65
Figure A1d.30: Time series of modelled UK-average sea level projections
Note: The solid line and shaded regions represent the central estimate and ranges for each RCP scenario as indicated in the legend. The dashed lines indicate the overall range across RCP scenarios. (right) the spatial pattern of change at 2100 associated with the central estimate of each RCP scenario. All projections are presented relative to a baseline period of 1981-2000. Source: Palmer et al. (2018)

Offshore Energy SEA 4: Appendix 1 Environmental Baseline
A1d.66
A1d.13 Environmental issues
A1d.13.1 Eutrophication
Phytoplankton growth is regulated by light and the availability of nutrient forms of nitrogen and phosphorus and to a lesser extent silicate and carbon. Excessive plant growth in response to an increased supply of nutrients is termed eutrophication and measures have been taken to reduce inputs of nutrients to avoid this occurring (OSPAR 2000, Defra 2004). Common assessment procedures have been developed by OSPAR to guide decisions on where such measures are required. These set normal and elevated levels for dissolved inorganic nitrogen (DIN) and dissolved inorganic phosphorus (DIP), and a guideline that states chlorophyll concentrations should be no more than 50% higher than historical offshore background for the area concerned.
The common assessment procedures criteria for DIN and DIP relate to winter concentrations and trends in inputs of nutrients reported as part of the UK’s third application of the procedures indicate that that total inputs of DIN (1990 to 2014) decreased significantly by 0.8 to 2.8 % per year in all regional seas apart from the English Channel, where inputs decreased but were not significant, and that total inputs of DIP decreased significantly by 2 to 6.1 % per year in all regions except the northern North Sea, where inputs decreased but were not significant. These decreases in input were reflected in decreasing concentrations in some, but not all, regional seas coastal areas especially where the inputs are high. In regions to the north of the UK, there were small but significant increases in parameter concentrations which may indicate changing oceanographic conditions (Painting et al. 2016).
The third application of the OSPAR Common Procedure resulted in 100% of the marine waters in the 8 regional sea areas around the UK assessed as Non Problem Areas. In the transitional and coastal waters around the UK, subject to the provisions of the Water Framework Directive (WFD), Urban Waste Water Treatment Directive (UWWTD) and Nitrates Directive, there are 21 Problem Areas (see Figure A1d.31) and 11 Potential Problem Areas.
The Problem Areas and Potential Problem Areas in transitional and coastal waters are found on the north east and southern coasts of the UK and on the south-west coasts of England and Wales and in Northern Ireland. These small areas are estuaries or harbours with restricted water circulation. The Problem Areas represent a small proportion of the total area of UK waters (0.03%) and of transitional and coastal waters (0.41%). The number of Problem Areas has decreased (from 23 to 21) and the number of Potential Problem Areas has increased (from 6 to 11). This results from the continued development of surveillance, monitoring and assessment being undertaken for transitional and coastal waters. It does not, necessarily, represent an increase in eutrophication problems.

Offshore Energy SEA 4: Appendix 1 Environmental Baseline
A1d.67
Figure A1d.31: Results from the third application of the Common Procedure
Notes: Results from the third application of the Common Procedure using data from 2006-2014. Insets show all water bodies assessed as Problem Areas (red). Insets include Potential Problem Areas (PPAs) which may be present; other PPAs are too small to be visible on the overall map. Non Problem Areas are shown in green. Grey lines indicate boundaries for regional seas and WFD water bodies. Source: Painting et al. (2016)
A1d.13.2 Plastic pollution
The issue of marine plastics (which represent ~70% of all marine litter) has attracted increasing scientific, media and societal attention in recent years (Thompson 2017). The potential negative consequences to marine fauna of entanglement and ingestion of macro-plastic (i.e. >5mm in size) in the North-east Atlantic continue to be reported (e.g. Unger et al. 2016, Lusher et al. 2018), while there is a growing body of evidence on the global prevalence of microplastic pollution (<5mm in size, including fibres and particles). In brief, microplastics have become ubiquitous - being observed in almost all marine environments and organisms where investigated, often in high concentrations (Galloway et al. 2017).
Campaigning by several pressure groups and growing public concern is now being met with new government strategies to reduce plastic pollution and marine litter (e.g. HM Government 2018, European Commission 2018). However, due to their persistence and increasing global annual production, levels of plastic in the marine environment are presumed to be rising and likely to do so for years to come, albeit with trends varying geographically and by type of plastic (e.g. Maes et al. 2018). In particular, the quantity of microplastic is likely to increase, as

Offshore Energy SEA 4: Appendix 1 Environmental Baseline
A1d.68
existing marine litter is eroded into increasingly small fragments and accumulations in river systems are flushed into the sea (e.g. Hurley et al. 2018).
The biological consequences of microplastic ingestion and their entry into the human food chain are largely unknown, and are the subject of increasing research. Concerns relate to their physical presence in smaller organisms, which has been shown to impede feeding (e.g. Cole et al. 2015), that plastics may contain chemical additives which cause endocrine disruption, and that harmful contaminants may bind to the surface (Galloway et al. 2017). A review of evidence from modelling studies, laboratory experiments, and quantitative assessments revealed a current consensus that the net contribution of plastics to the bioaccumulation of hydrophobic contaminants by marine organisms is likely to be small in comparison with direct uptake from water (Koelmans et al. 2016). While the quantities of microplastics in seafood are typically low, more work is needed to establish the potential human health risks from microplastics (Thompson 2017).

Offshore Energy SEA 4: Appendix 1 Environmental Baseline
A1d.69
References
ABPmer, The Met Office & Proudman Oceanographic Laboratory (2008). Atlas of UK marine renewable energy resources. Department for Business, Enterprise & Regulatory Reform.
Adams JA & Martin JHA (1986). The hydrography and plankton of the Moray Firth. Proceedings of the Royal Society of Edinburgh 91B: 37-56.
Alexander LV, Tett SFB & Jonsson T (2005). Recent observed changes in severe storms over the United Kingdom and Iceland. Geophysical Research Letters 32: L13704.
Arguez A, O’Brien JJ & Smith SR (2009). Temperature impacts over Eastern North America and Europe associated with low-frequency North Atlantic SST variability. International Journal of Climatology 29:1–10
Bacon S & Carter DJT (1993). A connection between mean wave height and atmospheric pressure gradient in the North Atlantic. International Journal of Climatology 13: 423-436.
Backhaus JO (1989). The North Sea and the climate. Dana 8: 69-82.
Bailey H, Senior B, Simmons D, Rusin J, Picken G & Thompson PM (2010). Assessing underwater noise levels during pile-driving at an offshore windfarm and its potential effects on marine mammals. Marine Pollution Bulletin 60: 888-897
Bailly du Bois P, Rozet M, Thoral K & Salomon JC (1997). Improving knowledge of water-mass circulation in the English Channel using radioactive tracers. Radioprotection – Colloques 32: 63-69.
Bailly du Bois P, Salomon JC, Gandon R & Guéguéniat P (1995). A quantitative estimate of English Channel water fluxes into the North Sea from 1987 to 1992 based on radiotracer distribution. Journal of Marine Systems 6: 457-481.
Baines PG (1986). Internal tides, internal waves, and near inertial motions. In: CNK Mooers Ed. Baroclinic Processes on Continental Shelves: Coastal and Estuarine Sciences 3: 19-31. American Geophysical Union, Washington DC.
Baringer MO, Willis J, Smeed DA, Moat B, Dong S, Hobbs WR, Rayner D, Johns WE, Gonil G, Lankhorst M & Send U (2018). Meridional overturning and oceanic heat transport circulation observations in the North Atlantic Ocean. Bulletin of the American Meteorological Society 99: supplement state of the climate in 2017, s91-S94.
Barne JH, Robson CF, Kaznowska SS, Doody JP, Davidson NC & Buck AL (1996). Coasts and seas of the United Kingdom Region 10 South-west England: Seaton to the Roseland Peninsula. Joint Nature Conservation Committee, Peterborough, UK, 217pp.
Barne JH, Robson CF, Kaznowska SS, Doody JP, Davidson NC & Buck AL (Eds.) (1997a). Coasts and Seas of the United Kingdom. Region 14 South-west Scotland: Ballantrae to Mull. Joint Nature Conservation Committee, Peterborough, UK, 229pp.
Barne JH, Robson CF, Kaznowska SS, Doody JP, Davidson NC & Buck AL (Eds.) (1997b). Coasts and Seas of the United Kingdom. Regions 15 & 16 North-west Scotland: The Western Isles and west Highland. Joint Nature Conservation Committee, Peterborough, UK, 261pp
Barnett, C, Hossell J, Perry M, Procter C & Hughes G (2006). Patterns of climate change across Scotland: Technical Report. SNIFFER Project CC03, Scotland & Northern Island Forum for Environmental Research, 102pp.
Baxter JM, Boyd IL, Cox M, Cunningham L, Holmes P & Moffat CF Eds (2008). Scotland's Seas: Towards Understanding their State. Fisheries Research Services, Aberdeen, 174pp.
Bean TP, Greenwood N, Beckett R, Biermann L, Bignell JP, Brant JL, Copp GH, Devlin MJ, Dye S, Feist SW, Fernand L, Foden D, Hyder K, Jenkins CM, van der Kooij J, Kröger S, Kupschus S, Leech C, Leonard KS, Lynam CP, Lyons BP, Maes T, Nicolaus EEM, Malcolm SJ, McIlwaine P, Merchant ND, Paltriguera L, Pearce DJ, Pitois SG, Stebbing PD, Townhill B, Ware S, Williams O & Righton D (2017). A review of the tools used for marine monitoring in the UK: combining historic and contemporary methods with modeling and socioeconomics to fulfill legislative needs and scientific ambitions. Frontiers in Marine Science 4:263. doi: 10.3389/fmars.2017.00263.
Becker GA (1990). Die Nordsee als physikalisches System. In: JL Lozan, W Lenz, E Rachor, B Watermann & H Westerhagen Eds. Warnsignale aus der Nordseewissenschafteliche Fakten. Paul Parey, Berlin and Hamburg, 428pp.
Berx B & Hughes SL (2009). Climatology of surface and near-bed temperature and salinity on the north-west European continental shelf for 1971-2000. Continental Shelf Research 29(19): 2286-2292.

Offshore Energy SEA 4: Appendix 1 Environmental Baseline
A1d.70
Berx B (2012). The hydrography and circulation of the Faroe-Shetland Channel: A century of research. Ocean
Challenge 19: 15-19.
Berx B, Hansen B, Østerhus S, Larsen KM, Sherwin T & Jochumsen K (2013). Combining in-situ measurements and altimetry to estimate volume, heat and salt transport variability through the Faroe Shetland Channel. Ocean Science Discussions 10: 153-195.
Bricheno LM & Wolf J (2018). Future wave conditions of Europe, in response to high-end climate change scenarios. Journal of Geophysical Research: Oceans 123: 8762–8791.
Blindheim J (1990). Arctic intermediate water in the Norwegian Sea. Deep Sea Research Part A. Oceanographic Research Papers 37: 1475-1489.
BODC (1998). An atlas of seas around the British Isles. 3rd Edition. NERC.
Booth DA & Ellett DJ (1983). The Scottish Continental-Slope Current, Continental Shelf Research 2: 127-146.
Booth DA (1981). Oscillatory currents in the Rockall Trough. SMBA marine physics report 15, 27pp.
Booth DA (1988). Eddies in the Rockall Trough. Oceanologica Acta 11: 213-219.
Bowden KF (1980). Physical and dynamical oceanography of the Irish Sea, in The North-West European Shelf Seas: The Sea Bed and the Sea in Motion II; Physical and Chemical Oceanography, and Physical Resources. Elsevier Oceanography Series 24B. Edited by Banner FT, Collins MB & Massie KS, pp. 391-413, Elsevier, New York.
Bringedal C, Eldevik T, Skagseth Ǿ, Spall MA & Ǿsterhus S (2018). Structure and Forcing of Observed Exchanges across the Greenland–Scotland Ridge. Journal of Climate 31: 9881-9901.
Broadbridge MB & Toumi R (2015). The deep circulation of the Faroe-Shetland Channel: Opposing flows and topographic eddies. Journal of Geophysical Research: Oceans 120: 5983-5996.
Brown J & Gmitrowicz EW (1995). Observations of the transverse structure and dynamics of the low frequency flow through the North Channel of the Irish Sea. Continental Shelf Research 15: 1133-1156.
Brown J, Hill AE, Fernand L & Horsburgh KJ (1999). Observations of a seasonal jet-like circulation at the central North Sea cold pool margin. Estuarine and Coastal Shelf Science 48: 343-355.
Brown J, Fernand L, Horsburgh KJ, Hill AE & Read JW (2001). Paralytic shellfish poisoning on the east coast of the UK in relation to seasonal density-driven circulation. Journal of Plankton Research 23(1): 105-116.
Brown J, Carillo L, Fernand L, Horsburgh KJ, Hill AE & Young EF (2003). Observations of the physical structure and seasonal jet-like circulation of the Celtic Sea and St. George’s Channel of the Irish Sea. Continental Shelf Research 23: 533-561.
Bryden HL, King BA, McCarthy GD & McDonagh EL (2014). Impact of a 30% reduction in Atlantic meridional overturning during 2009–2010. Ocean Science 10: 683–691.
Burrows M & Thorpe SA (1999). Drifter observations of the Hebrides slope current and nearby circulation patterns. Annales Geophysicae-Atmospheres Hydrospheres and Space Sciences 17: 280-302.
Caesar L, Rahmstorf S, Robinson A, Feulner G & Saba V (2018). Observed fingerprint of a weakening Atlantic Ocean overturning circulation. Nature 556: 191.
Caston VND (1972). Linear sandbanks in the southern North Sea. Sedimentology 18: 63-78.
Caston VND and Stride AH (1970). Tidal sand movement between some linear sand banks in the North Sea off northeast Norfolk. Marine Geology 9: M38-M42.
CEFAS (2006). Towards a consensus concerning the persistence of pathways governing the fate of contaminants and nutrient dynamics – Final report. Cefas Project AE1225. 20pp.
Chafik L (2012). The response of the circulation in the Faroe-Shetland Channel to the North Atlantic Oscillation. Tellus A: Dynamic Meteorology and Oceanography 64: 18423.
Channel Coastal Observatory (2015). Coastal wave network annual report 2014. www.coastalmonitoring.org
Channel Coastal Observatory (2019). Annual wave report 2018 – Morecambe Bay, https://www.channelcoast.org/reports/
Charlton JA, McNicoll W & West JR (1975). Tidal and freshwater induced circulation in the Tay Estuary. Proceedings of the Royal Society of Edinburgh 75B: 11-27.
Cheng L & Zhu J (2018). 2017 was the warmest year on record for the global ocean. Advances in Atmospheric Sciences 35: 261–263.

Offshore Energy SEA 4: Appendix 1 Environmental Baseline
A1d.71
Chust G, Allen JI, Bopp L, Schrum C, Holt J, Tsiaras K, Zavatarelli M, Chifflet M, Cannaby H, Dadou I, Daewel U, Wakelin SL, Machu E, Pushpadas D, Butenschon M, Artioli Y, Petihakis G, Smith C, Garçon V, Goubanova K, Le Vu B, Fach BA, Salihoglu B, Clementi E & Irigoien X (2014). Biomass changes and trophic amplification of plankton in a warmer ocean. Global Change Biology 20: 2124–2139, doi:10.1111/gcb.12562
Clark RA, Fox CJ, Ben-Hamadou R & Planque B (2001). A directory of hydrograhic and atmospheric datasets for the north east Atlantic and UK shelf seas. CEFAS Science Series, Technical Report 113. Centre for Environment, Fisheries and Aquaculture Science, Lowestoft.
Cole M, Lindeque P. Fileman E, Halsband C & Galloway T (2015). The impact of polystyrene microplastics on feeding, function and fecundity in the marine copepod Calanus helgolandicus. Environmental Science & Technology 49: 1130–1137.
Collins MB, Shimwell SJ, Gao S, Powell H, Hewitson C and Taylor JA (1995). Water and sediment movement in the vicinity of sandbanks: the Norfolk Banks, southern North Sea. Marine Geology 123: 125-142.
Connor DW, Gilliland PM, Golding N, Robinson P, Todd D & Verling E (2006). UKSeaMap: the mapping of seabed and water column features of UK seas. Joint Nature Conservation Committee, Peterborough, UK, 107pp.
Cooper LHN (1958). Sea temperatures in Plymouth Sound. Journal of the Marine Biological Association of the United Kingdom 37: 1-3.
Craig RE (1959). Hydrography of Scottish Coastal Waters. Marine Research Series No. 2. HMSO, London.
Cunningham SA, Christopher EF-W, Roberts D, Johns WE, Hobbs W, Palmer MD, Rayner D, Smeed DA & McCarthy G (2013). Atlantic Meridional Overturning Circulation slowdown cooled the subtropical ocean. Geophysical Research Letters 40: 6202–6207.
Davies AM & Xing J (2003). The influence of wind direction upon flow along the west coast of Britain and in the North Channel of the Irish Sea. Journal of Physical Oceanography 33(1): 55-74.
Defra (2000). Quality Status Report of the Marine and Coastal Areas of the Irish Sea and Bristol Channel 2000. Chapter 2 Geography and physical oceanography. Department of Environment, Food and Rural Affairs. http://www.defra.gov.uk/environment/water/marine/uk/science/irishbristol/03.htm
DEFRA (2004). Charting Progress – an Integrated Assessment of the State of the UK Seas. Department for Environment, Food and Rural Affairs on behalf of the UK Government and Devolved Administrations in March 2005. 5. Integrated Regional Assessment. Region 2: Southern North Sea.
Defra (2010a). Charting Progress 2 - Feeder report: Ocean processes. Department for Environment Food and Rural Affairs, London, 290pp.
Defra (2010b). Charting Progress 2 - Feeder report: Clean and safe seas. Department for Environment Food and Rural Affairs, London, 366pp.
Defra (2010c). Charting Progress 2 – The state of UK seas. Prepared by the UK Marine Monitoring and Assessment Strategy (UKMMAS) community, 194pp.
Defra (2019). Marine Strategy Part One: UK updated assessment and Good Environmental Status. October 2019, 107pp.
Dickson RR, Gould WJ, Griffiths C, Medler KJ & Gmitrowicz EM (1986). Seasonality in currents of the Rockall Trough. Proceedings of the Royal Society of Edinburgh 88B: 103–125.
Dooley HD & Meincke J (1981). Circulation and water masses in the Faroese Channels during Overflow ’73. Deutsche Hydrgraphische Zeitschrift 34: 41-55.
Dooley HD (1973). Currents off the north east of Scotland. Scottish Fisheries Bulletin 39: 48-52.
Dye SR, Holliday NP, Hughes SL, Inall M, Kennington K, Smyth T, Tinker J, Andres O & Beszczynska-Möller A (2013). Climate change impacts on the waters around the UK and Ireland: Salinity. MCCIP Science Review 2013, pp. 60-66.
Edwards A, Baxter MS, Ellet DJ, Martin JHA, Meldrum DT & Griffiths CR (1986). Clyde Sea hydrography. Proceedings of the Royal Society of Edinburgh 90B: 67-83.
Ellett DJ (1979). Some oceanographic features of Hebridean water. Proceedings of the Royal Society of Edinburgh 77B: 61-74.
Ellett DJ (1998). Norwegian Sea deep water overflow across the Wyville Thomson Ridge during 1987-1988. ICES Cooperative Research Report 225: 195-205.
Ellett DJ & Edwards A (1978). A volume transport estimate for Norwegian Sea overflow across the Wyville Thomson Ridge. ICES CM 1978/C 19.

Offshore Energy SEA 4: Appendix 1 Environmental Baseline
A1d.72
Ellett DJ & Edwards A (1983). Oceanography and inshore hydrography of the Inner Hebrides. Proceedings of
the Royal Society of Edinburgh 83B: 143-160.
Ellett DJ & Martin JHA (1973). The physical and chemical oceanography of the Rockall Channel. Deep Sea Research 20: 585-625.
Ellett DJ & Roberts DG (1973). The overflow of Norwegian Sea deep water across the Wyville Thomson Ridge. Deep Sea Research 29: 1021-1033.
Ellett DJ, Edwards A & Bowers R (1986). The hydrography of the Rockall Channel - an overview. Proceedings of the Royal Society of Edinburgh 88B: 61-81.
European Commission (2018). A European strategy for plastics in a circular economy, 18pp.
Evans GL, Hardman-Mountford NJ, Hartnoll RG, Kennington K, Mitchelson-Jacob EG, Shammon T & Williams PJ le B (2003). Long-term environmental studies in the Irish Sea: a review. Marine Environmental Change Network: Irish Sea. DEFRA 11/03.
Fernand L (2006). Understanding the UK’s seas: marine pathways and oceanography structure. Defra funded project AE1225 - Towards a consensus concerning the persistence of pathways governing the fate of contaminants and nutrient dynamics - Leaflet. Cefas, Lowestoft, 6pp.
Flather R (1987). Estimates of extreme conditions of tide and surge using a numerical model of the north-west European continental shelf. Estuarine, Coastal and Shelf Science 24: 69-93.
Frajka-Williams E (2015). Estimating the Atlantic overturning at 26°N using satellite altimetry and cable measurements. Geophysical Research Letters 42: 3458-3464.
Frajka-Williams E, Beaulieu C & Duchez A (2017). Emerging negative Atlantic Multidecadal Oscillation index in spite of warm subtropics. Scientific Reports 7: 11224.
Gallego A, O'Hara Murray R, Berx B,. Turrell WR, Beegle-Krause CJ, Inall M, Sherwin T, Siddorn J, Wakelin S, Vlasenko V, Hole LR, Dagestad KF, Rees J, Short L, Rønningen P, Main CE, Legrand S, Gutierrez T, Witte U & Mulanaphy N (2018). Current status of deepwater oil spill modelling in the Faroe-Shetland Channel, Northeast Atlantic, and future challenges. Marine Pollution Bulletin 127: 484–504.
Galloway TS, Cole M & Lewis C (2017). Interactions of microplastic debris throughout the marine ecosystem. Nature Ecology & Evolution 1: 0116.
Gammelsrød T, Østerhus S & Godoy O (1992). Decadal variations of the ocean climate in the Norwegian Sea observed at ocean station Mike. ICES Marine Science Symposium 195: 68-75.
Gatliff RW, Richards PC, Smith K, Graham CC, McCormac M, Smith NJP, Long D, Cameron TDJ, Evans D, Stevenson AG, Bulat J & Ritchie JD (1994). United Kingdom Offshore Regional Report: the geology of the Central North Sea. HMSO, London.
Gillibrand PA, Sammes PJ, Slesser G & Adams RD (2003). Seasonal water column characteristics in the Little and North Minches and the Sea of the Hebrides. I. Physical and chemical parameters. Fisheries Research Services Internal Report No 08/03.
Gilvear DJ, Heal KV & Stephen A (2002). Hydrology and the ecological quality of Scottish river ecosystems. The Science of the Total Environment 294: 131-159.
Gmitrowicz EM & Brown (1993). The variability and forcing of currents within a frontal region off the northeast coast of England. Continental Shelf Research 13: 836-890.
González-Pola C, Larsen KMH, Fratantoni P & Beszczynska-Möller A. (Eds) (2019). ICES Report on Ocean Climate 2018. ICES Cooperative Research Report 349, 122pp.
González-Pola C, Larsen KMH, Fratantoni P & Beszczynska-Möller A. (Eds) (2020). ICES Report on Ocean Climate 2019. ICES Cooperative Research Report 350, 136pp.
Gould WJ, Loynes J & Backhaus J (1985). Seasonality in slope current transports NW of Shetland. ICES CM/1985/C 7.
Government Laboratory (Isle of Man) (2020). https://www.gov.im/about-the-government/departments/environment-food-and-agriculture/government-laboratory/marine-water-monitoring/
Graham CC (1990a). Foula, 60°N-04°W, Seabed Sediments. British Geological Survey.
Graham CC (1990b). Judd, 60°N-06°W, Seabed Sediments. British Geological Survey.
Grant C, Dwyer R & Leggett I (1995). Development of a new Metocean design basis for the NW Shelf of Europe. Offshore Technology Conference Paper No 7685.
Green MJA, Simpson JH, Legg S & Palmer MR (2008). Internal waves, baroclinic energy fluxes and mixing at the European shelf edge. Continental Shelf Research 28: 937-950.

Offshore Energy SEA 4: Appendix 1 Environmental Baseline
A1d.73
Hall RA, Berx B & Inall ME (2017). Observing internal tides in high-risk regions using co-located ocean gliders and moored ADCPs. Oceanography 30:51–52.
Hall RA, Huthnance JM & Williams RG (2011). Internal tides, nonlinear internal wave trains, and mixing in the Faroes-Shetland Channel. Journal of Geophysical Research 116: C03008.
Hall RA, Huthnance JM & Williams RG (2013). Internal wave reflection on shelf slopes with depth-varying stratification. Journal of Physical Oceanography 43: 248-258.
Han W, Meehl GA, Stammer D, Hu A, Hamlington B, Kenigson J, Palanisamy H & Thompson P (2017). Spatial patterns of sea level variability associated with natural internal climate modes. Surveys in Geophysics 38: 217-250.
Hansen B (1985). The circulation of the northern part of the north east Atlantic. Rit Fiskideildar 9: 110-126.
Hansen B & Østerhus S (2000). North Atlantic – Nordic Seas exchanges. Progress in Oceanography 45: 109-208.
Hansen B & Østerhus S (2007). Faroe Bank Channel overflow 1995–2005. Progress in Oceanography 75: 817-856.
Hansen B, Larsen KM, Hátún H & Østerhus S (2016). A stable Faroe Bank Channel overflow 1995–2015. Ocean Science 12: 1205–1220.
Hansen B, Poulsen T, Larsen KMH, Hátún H, Østerhus S, Darelius E, Berx B, Quadfasel D & Jochumsen K (2017). Atlantic water flow through the Faroese Channels. Ocean Science 13: 873–888.
Harland EJ, Jones SAS & Clarke T (2005). SEA 6 Technical report: Underwater ambient noise. Report no. QINETIQ/SandE/MAC/CR050575
Hawkins E & Sutton R (2009). The potential to narrow uncertainties in regional climate predictions. Bulletin of the American Meteorological Society 90:1095–1107.
Hawkins SJ, Southward AJ & Genner MJ (2003). Detection of Environmental Change – Evidence from the Western English Channel. http://www.mba.ac.uk/MECN/MECN_MEMBERS/downloads/MECN%20publications/Western%20English%20Channel%20review.pdf
Heath MR, Adams RD, Brown F, Dunn J, Fraser S, Hay SJ, Kelly MC, Macdonald EM, Robertson MR, Robinson S & Wilson C (1999). Plankton monitoring off the east coast of Scotland in 1997 and 1998. Fisheries Research Services Report, No */99.
Hildebrand JA (2009). Anthropogenic and natural sources of ambient noise in the ocean. Marine Ecological Progress Series 395: 5-20.
Hill AE & Simpson JH (1989). On the interaction of thermal and haline fronts: The Islay front revisited. Estuarine, Coastal and Shelf Science 28(5): 495-505.
Hill AE, Brown J & Fernand L (1996). The western Irish Sea gyre: a retention system for Norway lobster (Nephrops norvegicus)? Oceanologica Acta 19(3-4): 357-368.
Hill AE, Horsburgh KJ, Garvine RW, Gillibrand PA, Slesser G, Turrell WR & Adams RD (1997). Observations of a density-driven recirculation of the Scottish coastal current in the Minch. Estuarine, Coastal and Shelf Science 45: 473-484.
Hill AE, Brown J, Fernand L, Holt J, Horsburgh KJ, Proctor R, Raine R & Turrell WR (2008). Thermohaline circulation of shallow tidal seas. Geophysical Research Letters 35: L11605.
HM Government (2018). Our waste, our resources: a strategy for England, 146pp.
Holliday NP (2003). Extremes of temperature and salinity during the 1990s in the northern Rockall Trough: results from the ‘Ellett line’. ICES Marine Science Symposia 219: 95-101.
Holliday NP, Bersch M, Berx B, Chafik L, Cunningham S, Florindo-López C, Hátún H, Johns W, Josey SA, Larsen KMH, Mulet S, Oltmanns M, Reverdin G, Rossby T, Thierry V, Valdimarsson H & Yashayae I (2020). Ocean circulation causes the largest freshening event for 120 years in eastern subpolar North Atlantic. Nature Communications https://doi.org/10.1038/s41467-020-14474-y
Holliday NP, Pollard RT, Read JF & Leach H (2000). Water mass properties and fluxes in the Rockall Trough, 1975-1998. Deep Sea Research I 47: 1303-1332.
Holliday NP, Yell MJ, Pascal R, Swail VR, Taylor PK, Griffiths CR & Kent E (2006). Were extreme waves in the Rockall Trough the largest ever recorded? Geophysical Research Letters 33: L05613.
Holmes R, Cooper R & Jones S (2003). DTI Strategic Environmental Assessment Area 4 (SEA 4): Continental shelf seabed geology and processes. British Geological Survey Commercial Report CR/03/081.

Offshore Energy SEA 4: Appendix 1 Environmental Baseline
A1d.74
Holmes R, Bulat J, Fraser J, Gillespie E, Holt J, James C, Kenyon N, Leslie A, Musson R, Pearson S & Stewart H (2004). Superficial geology and processes. British Geological Survey Commercial Report No. CR/04/06N. Report for DTI Strategic Environmental Assessment Area (SEA 5).
Holt J, Butenschön M, Wakelin SL, Artioli Y & Allen JI (2012). Oceanic controls on the primary production of the northwest European continental shelf: model experiments under recent past conditions and a potential future scenario. Biogeosciences 9: 97–117.
Holt J, Polton J, Huthnance J, Wakelin S, O’Dea E, Harle J, Yool A, Artioli Y, Blackford J, Siddorn J, & Inall M (2018). Climate-driven change in the North Atlantic and Arctic Oceans can greatly reduce the circulation of the North Sea. Geophysical Research Letters 45: https://doi.org/10.1029/2018GL078878
Holt J & Proctor R (2008). The seasonal circulation and volume transport on the northwest European continental shelf: A fine-resolution model study. Journal of Geophysical Research 113: C06021, 20pp.
Horsburgh K & Lowe J (2013). Impacts of climate change on sea level. MCCIP Science Review 2013, pp. 27-33.
Horsburgh K, Hill AE & Brown J (1998). A summer jet in St George’s Channel of the Irish Sea. Estuarine Coastal and Shelf Science 47: 285-294.
Horsburgh K, Rennie A & Palmer M (2020). Impacts of climate change on sea-level rise relevant to the coastal and marine environment around the UK. MCCIP Science Review 2020, 116-131.
Houpert L, Cunningham S, Fraser N, Johnson C, Holliday NP, Jones S, Moat B & Rayner D (2020). Observed variability of the North Atlantic Current in the Rockall Trough from four years of mooring measurements. Journal of Geophysical Research https://doi.org/10.1029/2020JC016403
Howarth M J (1982). Non-tidal flow in the North Channel of the Irish Sea. In: JCJ Nihoul Ed. Hydrodynamics of Semi-enclosed Shelf Sea. Elsevier, pp. 205–241.
Howarth MJ (2001). North Sea circulation. Encyclopaedia of Ocean Sciences, pp. 1912-1921. Oxford Academic Press
Howarth MJ (2005). Hydrography of the Irish Sea SEA 6 Technical Report. Proudman Oceanographic Laboratory, Liverpool.
Howarth MJ & Huthnance JM (1984). Tidal and residual currents around a Norfolk sandbank. Estuarine and Coastal Shelf Science 19: 105-117.
Hughes & Turrell (2004). The slope current on the Shetland shelf of the Faroe-Shetland channel – Statistics and trends. ICES CM2004/N:08, 23pp.
Hughes SL, Tinker J, Dye SD, Andres O, Berry DI, Hermanson L, Hewitt H, Holliday NP, Kent EC, Kennington K, Inall M & Smyth T (2017). Temperature. MCCIP Science Review 2017, 22–41.
Hulme M, Jenkins GJ, Lu X, Turnpenny JR, Mitchell TD, Jones RG, Lowe J, Murphy JM, Hassell D, Boorman P, McDonald R & Hill S (2002). Climate Change Scenarios for the United Kingdom: The UKCIP02 Scientific Report. Tyndall Centre, UEA, Norwich, April 2002.
Humphreys MP (2017). Climate sensitivity and the rate of ocean acidification: future impacts, and implications for experimental design. ICES Journal of Marine Science 74: 934–940
Humphreys MP, Artioli Y, Bakker DCE, Hartman SE, León P, Wakelin S, Walsham P and Williamson P (2020). Air–sea CO2 exchange and ocean acidification in UK seas and adjacent waters. MCCIP Science Review 2020, 54–75.
Hurley R, Woodward J & Rothwell JJ (2018). Microplastic contamination of river beds significantly reduced by catchment-wide flooding. Nature Geoscience 11: 251-257.
Huthnance JM (1973). Tidal current asymmetries over the Norfolk sandbanks. Estuarine and Coastal Marine Science 1: 89-99.
Huthnance JM (1983). Sub-tidal motion on the Scottish continental shelf, August-September 1971. Continental Shelf Research 1: 221-236.
Inall M & Griffiths C (2003). The Tiree Passage Time Series: 1981-2003. Report to DEFRA. Scottish Association for Marine Science, Dunstaffnage Marine Laboratory, Oban, UK, 22pp.
Inall M, Gillibrand P, Griffiths C, MacDougal N & Blackwell K (2009). On the oceanographic variability of the North-West European Shelf to the West of Scotland. Journal of Marine Systems 77: 210-226.
Inall ME & Sherwin TJ (2006). SEA 7 Technical Report – Hydrography. Report to the DTI. SAMS Research Services Ltd.

Offshore Energy SEA 4: Appendix 1 Environmental Baseline
A1d.75
Inter-Agency Committee on Marine Science and Technology (IACMST) (2005). Marine processes and climate. The 2nd of 5 reports produced to support Charting Progress – an Integrated Assessment of the State of UK Seas. Department for Environment, Food and Rural Affairs.
IPCC (2012). Managing the risks of extreme events and disasters to advance climate change adaptation. A Special Report of Working Groups I and II of the Intergovernmental Panel on Climate Change [Field CB, Barros V, Stocker TF, Qin D, Dokken DJ, Ebi KL, Mastrandrea MD, Mach KJ, Plattner G-K, Allen SK, Tignor M & Midgley PM (Eds.)]. Cambridge University Press, and New York, NY, USA, 582pp.
IPCC (2013). Climate Change 2013: The Physical Science Basis. Contribution of Working Group I to the Fifth Assessment Report of the Intergovernmental Panel on Climate Change. Cambridge University Press, Cambridge, United Kingdom & New York, NY, USA, 1535pp.
IPPC (2019). IPCC special report on the ocean and cryosphere in a changing climate [Pörtner H-O, Roberts DC, Masson-Delmotte V, Zhai P, Tignor M, Poloczanska E, Mintenbeck K, Alegría A, Nicolai M, Okem A, Petzold J, Rama B & Weyer NM (Eds.)]. A special report of the Intergovernmental Panel on Climate Change, 765pp.
James C, Coggan RA, Blyth-Skyrme VJ, Morando A, Birchenough SNR, Bee EJ, Limpenny DS, Verling E, Vanstaen K, Johnston CM, Rocks K, Philpott SL & Rees HL (2007). The eastern English Channel marine habitat map. Lowestoft, UK, CEFAS, 191pp. (Science series technical report, 139).
Johns WE, Baringer MO, Beal LM, Cunningham SA, Kanzow T, Bryden HL, Hirschi JJM, Marotzke J, Meinen CS, Shaw B & Curry R (2011). Continuous, array-based estimates of Atlantic Ocean heat transport at 26.5°N. Journal of Climate 24: 2429–2449, doi:10.1175/2010JCLI3997.1
Johnson C, Sherwin T, Smythe-Wright D, Shimmield T & Turrell W (2010). Wyville Thomson Ridge Overflow Water: Spatial and temporal distribution in the Rockall Trough. Deep Sea Research Part I: Oceanographic Research Papers, 57 (10): 1153-1162.
Johnson, MA, Kenyon, NH, Belderson, RH, and Stride, AH (1982). Sand Transport. In: AH Stride Ed. Offshore Tidal Sands - Processes And Deposits. Chapman & Hall, London, pp.58-94.
Jones LA, Coyle MD, Evans D, Gilliland PM & Murray AR (2004). Southern North Sea Marine Natural Area Profile: A contribution to regional planning and management of the seas around England. English Nature, Peterborough.
Jones S, Cottier F, Inalla M & Griffiths C (2018). Decadal variability on the Northwest European continental shelf. Progress in Oceanography 161: 131–151.
Jones S, Inall M, Porter M, Graham JA & Cottier F (2020). Storm-driven across-shelf oceanic flows into coastal waters. Ocean Science 16: 389-403.
Josey SA, Hirschi JJ-M, Sinha B, Duchez A, Grist JP & Marsh R (2018). The recent Atlantic cold anomaly: causes, consequences, and related phenomena. Annual Review of Marine Science 10: 475-501.
Kenyon NH (1986). Evidence from bedforms for a strong poleward current along the upper continental slope of northwest Europe. Marine Geology 72: 187-198.
Knight PJ & Howarth MJ (1999). The flow through the North Channel of the Irish Sea. Continental Shelf Research 19: 693-716.
Koelmans AA, Bakir A, Burton GA & Janssen CR (2016). Microplastic as a vector for chemicals in the aquatic environment: critical review and model-supported reinterpretation of empirical studies. Environmental Science & Technology 50: 3315–3326.
Kröger S, Parker R, Cripps G & Williamson P (Eds.) (2018). Shelf seas: The engine of productivity. Policy report on NERC-Defra Shelf Sea Biogeochemistry programme. Cefas, Lowestoft. DOI: 10.14465/2018.ssb18.pbd
Kurekin A, Land P & Miller PI (2017). Remote sensing for estimating impact of internal waves on the seabed. Phase 2: Implementation. Report for the Department for Business, Energy & Industrial Strategy, 46pp.
Lambert SJ & Fyfe JC (2006). Changes in winter cyclone frequencies and strengths simulated in enhanced greenhouse warming experiments: results from the models participating in the IPCC diagnostic exercise. Climate Dynamics 26: 713-728
Larsen KMH, Hátún H, Berx B & Rossby T (2017). Workshop on currents and transports across the Iceland-Faroe-Scotland Ridge. Havstovan no. 17-01. Technical report, 60pp.
Lavender KL, Owens WB & Davis RE (2005). The mid-depth circulation of the subpolar North Atlantic Ocean as measured by subsurface floats. Deep Sea Research I 52: 767-785.

Offshore Energy SEA 4: Appendix 1 Environmental Baseline
A1d.76
Lee AJ & Ramster JW (1981). Atlas of the seas around the British Isles. Ministry of Agriculture, Fisheries and Food, Lowestoft.
Le Quéré C, Andrew RM, Friedlingstein P, Sitch S, Hauck J, Pongratz J, Pickers PA, Korsbakken JI, Peters GP, Canadell JGP, Arneth A, Arora VK, Barbero L, Bastos A, Bopp L, Chevallier F, Chini LP, Ciais P, Doney SC, Gkritzalis T, Goll DS, Harris I, Haverd V, Hoffman FM, Hoppema M, Houghton RA, Hurtt G, Ilyina T, Jain AK, Johannessen AT, Jones CD, Kato E, Keeling RF, Goldewijk KK, Landschützer P, Lefèvre N, Lienert S, Liu Z, Lombardozzi D, Metzl N, Munro DR, Nabel JEMS, Nakaoka S, Neill C, Olsen A, Ono T, Patra P, Peregon A, Peters W, Peylin P, Pfeil B, Pierrot D, Poulter B, Rehder G, Resplandy L, Robertson E, Rocher M, Rödenbeck C, Schuster U, Schwinger J, Séférian R, Skjelvan I, Steinhoff T, Sutton A, Tans PP, Tian H, Tilbrook B, Tubiello FN, van der Laan-Luijkx IT, van der Werf GR, Viovy N, Walker AP, Wiltshire AJ, Wright R, Zaehle S & Zheng B (2018). Global Carbon Budget 2018. Earth System Science Data 10: 2141–2194, https://doi.org/10.5194/essd-10-2141-2018, 2018.
Li G, Cheng L, Zhu J, Trenberth KE, Mann, ME & Abraham JP (2020). Increasing ocean stratification over the past half-century. Nature Climate Change https://doi.org/10.1038/s41558-020-00918-2
Livingstone HD, Bowen VT & Kupferman SL (1982). Radionuclides from Windscale discharges 2: their dispersion in Scottish and Norwegian coastal circulation. Journal of Marine Research. 40(4): 1227-1258.
Lonsdale P & Hollister CD (1979). A near-bottom traverse of the Rockall Trough: hydrographic and geologic inferences. Oceanologica Acta 2: 91-105.
Lozier MS, Li F, Bacon S, Bahr F, Bower AS, Cunningham SA, de Jong MF, de Steur L, deYoung B, Fischer J, Gary SF, Greenan BJW, Holliday NP, Houk A, Houpert L, Inall ME, Johns WE, Johnson HL, Johnson C, Karstensen J, Koman G, Le Bras IA, Lin X, Mackay N, Marshall DP, Mercier H, Oltmanns M, Pickart RS, Ramsey AL, Rayner D, Straneo F, Thierry V, Torres DJ, Williams RG, Wilson C, Yang J, Yashayaev I & Zhao J (2019). A sea change in our view of overturning in the subpolar North Atlantic. Science 363: 516-521.
Lusher AL, Hernandez-Milian G, Berrow S, Rogan E & O'Connor I (2018). Incidence of marine debris in cetaceans stranded and bycaught in Ireland: Recent findings and a review of historical knowledge. Environmental Pollution 232: 467e476.
Lwiza KMM, Bowers DG & Simpson JH (1991). Residual and tidal flow at a mixing front in the North sea. Continental Shelf Research 11: 1379-1395.
Mackenzie AB, Scott RD & Williams TM (1987). Mechanisms for northwards dispersal of Sellafield waste. Nature 329 3: 42-44.
Maes T, Barry J, Leslie HA, Vethaak AD, Nicolaus EEM, Law RJ, Lyons BP, Martinez R, Harley B & Thain JE (2018). Below the surface: Twenty-five years of seafloor litter monitoring in coastal seas of North West Europe (1992–2017). Science of the Total Environment 630: 790–798
Mahaffey C, Palmer M, Greenwood N & Sharples J (2020). Impacts of climate change on dissolved oxygen concentration relevant to the coastal and marine environment around the UK. MCCIP Science Review 2020, 31–53.
Marsh R, Haigh ID, Cunningham SA, Inall ME, Porter M & Moat BI (2017). Large-scale forcing of the European Slope Current and associated inflows to the North Sea. Ocean Science 13: 315–335.
McCarthy GD, Gleeson E & Walsh S (2015b). The influence of ocean variations on the climate of Ireland. Weather 70: 242–245.
McCarthy GD, Jackson LC, Cunningham SA, Holliday NP, Smeed DA & Stevens DP (2020). Effects of climate change on the Atlantic Heat Conveyor relevant to the UK. MCCIP Science Review 2020,190–207.
McCarthy GD, Smeed DA, Cunningham SA & Roberts CD (2017). Atlantic Meridonal Overturning Circulation. Marine Climate Change Impacts Partnership Science Review, 7pp.
McCarthy GD, Smeed DA, Johns WE, Frajka-Williams E, Moat BI, Rayner D, Baringer MO, Meinen CS, Collins J & Bryden HL (2015a). Measuring the Atlantic Meridional Overturning Circulation at 26°N. Progress in Oceanography 31: 91–111.
MCCIP (2013). Marine climate change impacts on report card 2013. (Eds. Frost M, Baxter JM, Bayliss-Brown GA, Buckley PJ, Cox M & Withers Harvey N) Summary report, MCCIP, Lowestoft, 12pp.
MCCIP (2020). Marine climate change impacts report card 2020 [Stoker B, Turrell WR, Robinson KA, Howes EL, Buckley P, Maltby K & Matear L (Eds.)]. Summary report, MCCIP, Lowestoft, 28pp.
McIntyre F, Fernandes PG & Turrell WR (2012). Clyde ecosystem review. Scottish Marine and Freshwater Science, Volume 3, No. 3. Scottish Government, Edinburgh, 123pp.
McKay WA, Baxter MS, Ellett DJ & Meldrum DT (1986). Radiocaesium and circulation patterns west of Scotland. Journal of Environmental Radioactivity 4: 205-232.

Offshore Energy SEA 4: Appendix 1 Environmental Baseline
A1d.77
McKenna C, Berx B & Austin WEN (2016). The decomposition of the Faroe-Shetland Channel water masses using Parametric Optimum Multi-Parameter analysis. Deep-Sea Research I 107: 9-21.
McKinley IG, Baxter MS, Ellet DJ & Jack W (1981). Tracer applications of radiocaesium in the sea of the Hebrides. Estuarine, Coastal and Shelf Science 13: 69-82.
Meincke J (1986). Convection in the oceanic waters west of Britain. Proceedings of the Royal Society of Edinburgh 88B: 127-139.
Merchant N (2018). Continuous low frequency sound (ambient noise) in UK seas. UK Marine Online Assessment Tool, available at: https://moat.cefas.co.uk/pressures-from-human-activities/underwater-noise/ambient-noise/
Merchant ND, Brookes KL, Faulkner RC, Bicknell AWJ, Godley BJ & Matthew JW (2016). Underwater noise levels in UK waters. Scientific Reports 6: 36942; doi: 10.1038/srep36942
Miller RL, Schmidt GA & Shindell DT (2006). Forced annular variations in the 20th century Intergovernmental Panel on Climate Change Fourth Assessment Report models. Journal of Geophysical Research 111: D18101.
Miller PI, Xu W & Carruthers M (2015). Seasonal shelf-sea front mapping using satellite ocean colour and temperature to support development of a marine protected area network. Deep Sea Research Part II: Topical Studies in Oceanography 119: 3-19.
Morris DM, Pinnegar JK, Maxwell DL, Dye SR, Fernand LJ, Flatman S, Williams OJ & Rogers SI (2018). Over 10 million seawater temperature records for the United Kingdom Continental Shelf between 1880 and 2014 from 17 Cefas (United Kingdom government) marine data systems. Earth System Science Data 10: 27-51.
Nauw J, de Haas H & Rehder (2015). A review of oceanographic and meteorological controls on the North Sea circulation and hydrodynamics with a view to the fate of North Sea methane from well site 22/4b and other seabed sources. Marine and Petroleum Geology 68B: 861-882.
Nedwell J, Langworthy J & Howell D (2003). Assessment of sub-sea acoustic noise and vibration from offshore wind turbines and its impact on marine wildlife; initial measurements of underwater noise during construction of offshore windfarms, and comparison with background noise. Report No. 544 R 0424 to COWRIE, 68pp.
Nedwell JR, Parvin SJ, Edwards B, Workman R, Brooker AG and Kynoch JE (2007). Measurement and interpretation of underwater noise during construction and operation of offshore windfarms in UK waters. Subacoustech Report No. 544R0738 to COWRIE Ltd. ISBN: 978-0-9554279-5-4.
Neil C, Cunningham A, McKee D & Polton JA (2012). Remote sensing of seasonal stratification dynamics in the southern Irish Sea. Remote Sensing of Environment 127: 288-297.
New AL (1988). Internal tidal mixing in the Bay of Biscay. Deep Sea Research 35: 691-709.
New AL & Smythe-Wright D (2001). Aspects of the circulation in the Rockall Trough. Continental Shelf Research 21: 777–810.
New AL, Barnard S, Herrmann P & Molines J-M (2001). On the origin and pathway of the saline inflow to the Nordic Seas: insights from models. Progress in Oceanography 48: 255-289.
Osborn TJ (2004). Simulating the winter North Atlantic Oscillation: the roles of internal variability and greenhouse gas forcing. Climate Dynamics 22: 605-623.
OSPAR (2000). Quality Status Report 2000. OSPAR Commission, London, 108pp.
OSPAR (2010). Quality Status Report 2010. OSPAR Commission, London, 176pp
Østerhus S, Gammelsrød T & Hogstad R (1996). Ocean weather ship station M (66ºN, 2ºE), the longest homogeneous time series from the deep ocean. International WOCE Newsletter 24: 31-33.
Østerhus S, Turrell WR, Jónsson S & Hansen B (2005). Measured volume, heat, and salt fluxes from the Atlantic to the Arctic Mediterranean. Geophysical Research Letters 32: L07603, doi:10.1029/2004GL022188.
Owens NJP (2014). Sustained UK marine observations. Where have we been? Where are we now? Where are we going? Philosophical Transactions of the Royal Society A 372: 20130332. http://dx.doi.org/10.1098/rsta.2013.0332
Painting S, Garcia L & Collingridge K (2016). Common procedure for the identification of the eutrophication status of the UK maritime area - UK National Report. https://www.ospar.org/site/assets/files/37302/national_common_procedure_report_2016_united_kingdom_and_annexes.zip
Palmer M, Howard T, Tinker J, Lowe J, Bricheno L, Calvert D, Edwards T, Gregory J, Harris G, Krijnen J, Pickering M, Roberts C & Wolf J (2018). UKCP18 marine report, 133pp.

Offshore Energy SEA 4: Appendix 1 Environmental Baseline
A1d.78
Pantin HM (1991). The sea-bed sediments around the United Kingdom: their bathymetric and physical environment, grain size, mineral composition and associated bedforms. British Geological Survey Research Report SB/90/1.
Pingree RD & Griffiths DK (1978). Tidal fronts on the shelf seas around the British Isles. Journal of Geophysical Research 83: 4615-4622.
Pingree RD, Sinha B & Griffiths CR (1999). Seasonality of the European slope current (Goban Spur) and ocean margin exchange. Continental Shelf Research 19: 929-975.
Pizzamei M (2002). Seasonal modelling of circulation and transport on the Scottish west coast. Unpublished PhD thesis, University of Wales, Bangor, 267pp.
Pollard RT, Griffiths MJ, Cunningham SA, Read JF, Perez FF & Rios AF (1996). Vivaldi 1991 - A study of the formation, circulation and ventilation of Eastern North Atlantic Central Water. Progress in Oceanography 37: 167-192.
Pollard RT, Read JF & Holliday NP (2004). Water masses and circulation pathways through the Iceland Basin during Vivaldi 1996. Journal of Geophysical Research 109: C04004.
Pontin RA & Reid JA (1975). The freshwater input to the Tay Estuary. Proceedings of the Royal Society of Edinburgh 75B: 1-9.
Polton JA, Palmer MR & Howarth MJ (2011). Physical and dynamical oceanography of Liverpool Bay. Ocean Dynamics 61(9): 1421-1439.
Porter M, Dale AC, Jones S, Siemering B & Inall ME (2018). Cross-slope flow in the Atlantic Inflow Current driven by the on-shelf deflection of a slope current. Deep-Sea Research Part I 140: 173–185
Poulton CVL, Philpott EJ, James JWC, Tasong WA, Graham C & Lawley RS (2002). Framework for the identification of seabed habitats and features within offshore English Waters to 12 nautical miles. British Geological Survey Commissioned Report CR/02/134.
Prandle D (1976). Wind-induced flow through the North Channel of the Irish Sea. Geophysical Journal of the Royal Astromonical Society 45: 437–442.
Prandle D & Matthews JP (1990). The dynamics of near-shore surface currents generated by tides, wind and horizontal density gradients. Continental Shelf Research 10: 665-681.
Quante M & Colijn F (Eds.) (2016). North Sea region climate change assessment. Springer Open, 555pp.
Ramsay DL & Brampton AH (2000). Coastal cells in Scotland: Cell 2 – Fife Ness to Cairnbulg Point. SNH Research, Survey & Monitoring Report No. 144.
Reynaud J-Y & Dalrymple RW (2012). Shallow-marine tidal deposits. In: Principles of tidal sedimentology [Davis RA & Dalrymplpe RW (Eds.)]. Springer Science+Business Media B.V.
Rhein, M, Rintoul SR, Aoki S, Campos E, Chambers D, Feely RA, Gulev S, Johnson GC, Josey SA, Kostianoy A, Mauritzen C, Roemmich D, Talley LD & Wang F (2013). Observations: Ocean. In: Climate Change 2013: The Physical Science Basis. Contribution of Working Group I to the Fifth Assessment Report of the Intergovernmental Panel on Climate Change [Stocker TF, QinD, Plattner G-K, Tignor M, Allen SK, Boschung J, Nauels A, Xia Y, Bex V & Midgley PM (Eds.)]. Cambridge University Press, Cambridge, United Kingdom and New York, NY, USA.
Robins PE, Skov MW, Lewis MJ, Giménez L, Davies AG, Malham SK, Neill SP, McDonald JE, Whitton TA, Jackson SE & Jago CF (2016). Impact of climate change on UK estuaries: A review of past trends and potential projections. Estuarine, Coastal and Shelf Science 169: 119-135
Robinson IS (1979). The tidal dynamics of the Irish and Celtic Seas. International Geophysical Journal 56: 159-197.
Robson J, Hodson D, Hawkins E & Sutton R (2014). Atlantic overturning in decline? Nature Geoscience 7: 2–3.
Robson J, Ortega P & Sutton R (2016). A reversal of climatic trends in the North Atlantic since 2005. Nature Geoscience 9: 513–517.
Robson J, Sutton R, Lohmann K, Smith D & Palmer MD (2012). Causes of the rapid warming of the North Atlantic Ocean in the mid-1990s. Journal of Climate 25: 4116–4134.
Rodhe J (1998). The Baltic and North Seas. In: AR Robison & KH Brink Eds. The Sea, Volume 11. John Wiley & Sons Inc., New York, pp. 699-732.
Royal Society (2005). Ocean acidification due to increasing atmospheric carbon dioxide. Policy document 12/05 The Royal Society, London, 60pp.

Offshore Energy SEA 4: Appendix 1 Environmental Baseline
A1d.79
SAMS (2006). SEA 7 Technical Report – Hydrography (Draft). Report to the DTI. Scottish Association for Marine Science (SAMS), Dunstaffnage Marine Laboratory, Oban.
Santo H, Taylor PH & Gibson R (2016). Decadal variability of extreme wave height representing storm severity in the northeast Atlantic and North Sea since the foundation of the Royal Society. Proceedings of the Royal Society A 472: 20160376.
Saunders PM (1990). Cold outflow from the Faroe Bank Channel. Journal of Physical Oceanography 20: 28-43.
Schloesser F, Furue R, McCreary J & Timmermann A (2014). Dynamics of the Atlantic meridional overturning circulation. Part 2: Forcing by winds and buoyancy. Progress in Oceanography 120: 154–176.
Schmitz WJ & McCartney MS (1993). On the North Atlantic circulation. Reviews of Geophysics 31: 29-49.
Schuster U, Watson AJ, Bates NR, Corbiere A, Gonzalez-Davila M, Metz N, Pierrot D & Santana-casiano M (2009). Trends in North Atlantic sea surface fCO2 from 1990 to 2006. Deep Sea Research Part II: Topical Studies Oceanography 56: 620-629.
Sharples J, Holt J & Wakelin S (2020). Impacts of climate change on shelf-sea stratification relevant to the coastal and marine environment around the UK. MCCIP Science Review 2020, 103–115.
Sharples J, Ross ON, Scott BE, Greenstreet SPR & Fraser H (2006). Inter-annual variability in the timing of stratification and the spring bloom in the North-western North Sea. Continental Shelf Research 26: 733–751
Sheehan PMF, Berx B, Gallego A, Hall RA, Heywood KJ & Hughes SL (2017). Thermohaline forcing and interannual variability of northwestern inflows into the northern North Sea. Continental Shelf Research 138: 120–131.
Sherwin TJ (1991). Evidence of a deep internal tide in the Faroe-Shetland Channel. In: BB Parker Ed. Tidal Hydrodynamics. John Wiley & Sons Inc., New York, pp. 469-488.
Sherwin TJ & Turrell WR (2005). Mixing and advection of a cold water cascade over the Wyville Thomson Ridge. Deep- Sea Research I 52: 1392-1413.
Sherwin TJ, Griffiths CR, Inall ME & Turrell WR (2008). Quantifying the overflow across the Wyville Thomson Ridge into the Rockall Trough. Deep- Sea Research I 55: 396-404.
Sherwin TJ, Aleynik D, Dumont E & Inall ME (2015). Deep drivers of mesoscale circulation in the central Rockall Trough. Ocean Science 11: 343-359.
Simpson J, Mitchelson-Jacob HEG & Hill AE (1990). Flow structure in a channel from an acoustic Doppler current profiler. Continental Shelf Research 10(6): 589-603.
Simpson JH & Hill AE (1986). The Scottish coastal current. NATO ASI Series G7: 295-308.
Simpson JH, Edelstein DJ, Edwards A, Morris NCG & Tett PB (1979). The Islay Front: Physical structure and phytoplankton distribution. Estuarine, Coastal and Shelf Science 9: 713-726.
Smale DA, Wernberg T, Oliver ECJ, Thomsen M, Harvey BP, Straub SC, Burrows MT, Alexander LV, Benthuysen JA, Donat MG, Feng M, Hobday AJ, Holbrook NJ, Perkins-Kirkpatrick SE, Scannell HA, Gupta AS, Payne BL & Moore PJ (2019). Marine heatwaves threaten global biodiversity and the provision of ecosystem services. Nature Climate Change 9: 306-312.
Small J, Hallock Z, Pavey G & Scott J (1999). Observations of large amplitude internal waves at the Malin Shelf edge during SESAME 1995. Continental Shelf Research 19(11): 1389-1436.
Smeed DA, Josey SA, Beaulieu C, Johns WE, Moat BI, Frajka-Williams E, Rayner D, Meinen CS, Baringer MO, Bryden HL & McCarthy GD (2018). The North Atlantic Ocean is in a state of reduced overturning. Geophysical Research Letters 45: 1527–1533.
Smeed DA, McCarthy GD, Cunnigham SA, Frajka-Williams E, Rayner D, Johns WE, Meinen CS, Baringer MO, Moat BI, Duchez A & Bryden HL (2014). Observed decline of the Atlantic Meridional Overturning Circulation 2004 to 2012. Ocean Science 10: 38–39.
Solomon S, Qin D, Manning M, Alley RB, Berntsen T, Bindoff NL, Chen Z, Chidthaisong A, Gregory JM, Hegerl GC, Heimann M, Hewitson B, Hoskins BJ, Joos F, Jouzel J, Kattsov V, Lohmann U, Matsuno T, Molina M, Nicholls N, Overpeck J, Raga G, Ramaswamy V, Ren J, Rusticucci M, Somerville R, Stocker TF, Whetton P, Wood RA & Wratt D (2007). Technical Summary. In: S Solomon, D Qin, M Manning, Z Chen, M Marquis, KB Averyt, M Tignor & HL Miller. Climate Change 2007: The Physical Science Basis. Contribution of Working Group I to the Fourth Assessment Report of the Intergovernmental Panel on Climate Change. Cambridge University Press, Cambridge, United Kingdom and New York, NY, USA.

Offshore Energy SEA 4: Appendix 1 Environmental Baseline
A1d.80
Southward AJ, Langmead O, Hardman-Mountford NJ, Aiken J, Boalch GT, Dando PR, Genner MJ, Joint I, Kendall MA & Halliday NC (2005). Long-term oceanographic and ecological research in the western English Channel. Advances in Marine Biology 47: 1-115.
Souza AJ, Simpson JH, Harikrishnan M & Malarkey J (2001). Flow structure and seasonality in the Hebridean slope current. Oceanologica Acta 24: S63-S76.
Stanev EV, Badewien TH, Freund H, Grayek S, Hahner F, Meyerjurgens J, Ricker M, Schöneich-Argentb RI, Wolff J-O & Zielinski O (2019). Extreme westward surface drift in the North Sea: Public reports of stranded drifters and Lagrangian tracking. Continental Shelf Research 177: 24–32.
Stapleton C & Pethick J (1996). Coastal processes and management of Scottish estuaries I: The Dornoch, Cromarty and Beauly/Inverness Firths. SNH Review Report No. 50.
Stashchuk N, Vlasenko V & Sherwin TJ (2011). Numerical investigation of deep water circulation in the Faroese Channels. Deep Sea Research I 58: 787–799.
Strachan P & Stevenson AG (1990). Miller, 61°N-02°W, Seabed Sediments. British Geological Survey.
Suberg LA, Miller PI & Wynn RB (2019). On the use of satellite-derived frontal metrics in time series analyses of shelf-sea fronts, a study of the Celtic Sea. Deep-Sea Research Part I 149: 103033.
Sutton RT, McCarthy GD, Robson J, Sinha B, Archibald AT & Gray LJ (2017). Atlantic Multi-decadal Variability and the UK ACSIS Programme. Bulletin of the American Meteorological Society 99: 415-425.
Terray L, Demory M-E, Déqué M, Coetlogon G de & Maisonnave E (2004). Simulation of late-21st-century changes in wintertime atmospheric circulation over Europe due to anthropogenic causes. Journal of Climate 17: 4630-4635.
Thompson RC (2017). Future of the sea: plastic pollution. Foresight – Future of the Sea Evidence Review, 39pp.
Thomson CW (1874). The depths of the sea. Macmillan and & Co, London.
Thorpe SA & White M (1988). A deep intermediate nepheloid layer. Deep Sea Research 35: 1665-1671.
Tinker JP & Howes EL (2020). The impacts of climate change on temperature (air and sea), relevant to the coastal and marine environment around the UK. MCCIP Science Review 2020, 1–32.
Trivedi A & Toumi R (2017). Mechanisms of bottom boundary fluxes in a numerical model of the Shetland shelf. Ocean Dynamics 67: 1-21.
Tsimplis MN, Woolf DK, Osborn T, Wakelin S, Woodworth P, Wolf J, Flather R, Blackman D, Shaw AGP, Pert F, Challenor P & Yan Z (2005). Towards a vulnerability assessment of the UK and northern European coasts: the role of regional climate variability. Philosophical Transactions: Mathematical, Physical and Engineering Sciences.
Turrell WR & Henderson EW (1990). Transport events within the Fair Isle current during the autumn circulation experiment (ACE). Estuarine, Coastal and Shelf Science 31: 25-44.
Turrell WR, Henderson EW, Slesser G, Payne R & Adams RD (1992). Seasonal changes in the circulation of the northern North Sea. Continental Shelf Research 12: 257-286.
Turrell WR, Slesser G, Adams RD, Payne R & Gillibrand PA (1999a). Decadal variability in the composition of the Faroe Shetland Channel bottom water. Deep Sea Research I 46: 1-25.
Turrell WR, Hansen B, Østerhus S, Hughes S, Ewart K & Hamilton J (1999b). Direct observation of inflow to the Nordic seas through the Faroe Shetland Channel. ICES CM 1999/L 1.
Unger B, Rebolledo ELB, Deaville R, Gröne A, IJsseldijk LL, Leopold MF, Siebert U, Spitz J, Wohlsein P & Herr H (2016). Large amounts of marine debris found in sperm whales stranded along the North Sea coast in early 2016. Marine Pollution Bulletin 112: 134–141.
Urick RJ (1983). Principles of underwater sound. McGraw-Hill, New York.
van Leeuwen S, Tett P, Mills D & van der Molen J (2015). Stratified and nonstratified areas in the North Sea: Long-term vairiability and biological and policy implications. Journal of Geophysical Research: Oceans 120: 4670-4686.
Vlasenko V & Stashchuk N (2018). Tidally induced overflow of the Faroese Channels bottom water over the Wyville Thomson Ridge. Journal of Geophysical Research: Oceans 123: 6753–6765.
WaveNet – CEFAS website [accessed October 2019]. https://www.cefas.co.uk/cefas-data-hub/wavenet/
Werner F, Unsold G, Koopman B & Stefanon A (1980). Field observations and flume experiments on the nature of comet marks. Sedimentary Geology 26: 233-262.

Offshore Energy SEA 4: Appendix 1 Environmental Baseline
A1d.81
White M (1994). Tidal and subtidal variability in the sloping benthic boundary layer. Journal of Geophysical
Research 99: 7851-7864.
Williamson P, Turley C, Brownlee C, Findlay H, Ridgwell A, Schmidt D, Schroeder D, Blackford J, Tyrrell T & Pinnegar J (2013). Impacts of ocean acidification. MCCIP Science Review 2013, pp. 34-48.
Willis JK (2010). Can in situ floats and satellite altimeters detect long‐term changes in Atlantic Ocean overturning? Geophysical Research Letters 37: L06602, doi:10.1029/2010GL042372.
Winther NG & Johannessen JA (2006). North Sea Circulation: Atlantic inflow and its destination. Journal of Geophysical Research 111: 1-36.
Wolf J, Woolf D & Bricheno L (2020). Impacts of climate change on storms and waves relevant to the coastal and marine environment around the UK. MCCIP Science Review 2020, 132–157.
Wolf J & Woolf DK (2006). Waves and climate change in the north-east Atlantic. Geophysical Research Letters 33: L06604.
Wolf J, Yates N, Brereton A, Buckland H, De Dominici M, Gallego A & O’Hara Murray R (2016). The Scottish shelf model. Part 1: Shelf-wide domain. Scottish Marine and Freshwater Science Vol 7 No 3, 155pp.
Woolf D & Wolf J (2013). Impacts of climate change on storms and waves. MCCIP Science Review 2013, pp. 20-26.
Woolf DK, Challenor PG & Cotton PD (2002). The variability and predictability of North Atlantic wave climate. Journal of Geophysical Research 107: 3145.
Xing J & Davies AM (1996). Application of turbulence energy models to the computation of tidal currents and mixing intensities in shelf edge regions. Journal of Physical Oceanography 26: 417-447.
Yeager S & Danabasoglu G (2014). The origins of late-twentieth-century variations in the large-scale North Atlantic circulation. Journal of Climate 27: 3222–3247.
Young EF & Holt JT (2007). Prediction and analysis of long-term variability of temperature and salinity in the Irish Sea. Journal of Geophysical Research 112: C01008.
Zenk W (1980). Advected near bottom temperature structures at the FIA? JASIN News 17: 8-9.