Collinear Generation of Ultrashort UV and XUV Pulses for Pump/probe Spectroscopy
Upload
independentCategory
view
5download
0
1 February 1996
OPTICS COMMUNICATIONS
ELSE?AER Optics Communications 123 (1996) 777-789
Full length article
Using low and high prepulses to enhance the J= O-l transition at 19.6 nm in the Ne-like germanium XUV laser
G.F. Cairns a, C.L.S. Lewis a, M.J. Lamb a, A.G. MacPhee a, D. Neely d, P. Norreys d, M.H. Key bvd, S .B . Healy ‘, P.B. Holden ‘, G.J. Pert ‘, J.A. Plowes ‘, G.J. Tallents e,
A. Demir e a Department of Pure and Applied Physics, Queen’s University of Belfast, Belfast BT7 INN, Ireland
b Clarendon Laboratory, University of Oxford, O.@ora!, OXI 3PlJ. UK
’ Department of Physics, York University, York, YOl5DD, UK ’ Central Loser Facility, Rutherford Appleton Laboratory, Chilton, Didcot, Oxon, OX11 OQX, UK
e Department of Physics, University of Essex, Colehester, CO4 3SQ, UK
Received 10 April 1995; revised version received 7 August 1995
Abstract
We report a study of the effect of prepulses on XUV lasing of Ne-like germanium for an irradiation geometry where = 20 mm long germanium slab targets were irradiated at = 1.6X 1OL3 W cm-* using = 0.7 ns ( 1.06 p,m) pulses from the VULCAN glass laser. Prepulses were generated at fractional power levels of = 2 X 10e4 (low) and =2 X lo-* (high) and arrived on target 5 and 3.2 ns respectively in advance of the main heating pulse. For both the low and high prepulses the output of the 3p- 3s, .I = O-1, line at 19.6 nm was enhanced such that the peak radiant density (J/St) for this line became greater than that for the normally stronger J= 2-l lines at 23.2 and 23.6 nm. The J=O-1 line, whose FWHM duration was reduced from ~450 ps to = 100 ps, delivered = 6 x more power ( W) than the average for the combined J= 2-l lines, whose FWHM duration was =: 500 ps for both levels of prepulse. The higher prepulse was more effective, yielding = 2 X more radiant density and = 7 X more power on both the .I = 0- 1 and J = 2- 1 transitions compared to the low prepulse case. The most dramatic observation overall was the = 40 x increase of power in the J= O-l line for the high prepulse ( = 2%) case compared with the zero prepulse case. These observations, coupled with measurements of beam divergence and beam deviation through refractive bending, as well as general agreement with modelling, lead us to conclude that, for germanium, the main influence of the prepulse is (a) to increase the energy absorbed from the main pulse, (b) to increase the volume of the gain zone and (c) to relax the plasma density gradients, particularly in the .I = 0- 1 gain zone.
1. Introduction
Collisional X-ray lasers have been made to work for
Ne-like ions spanning atomic numbers Z= 2247 [ l- 81. Typically foil or stripe targets are irradiated with 0.5-l .O ns pulses at 0.53 or 1.06 p,rn laser wavelength. Lasing is observed on several J-J transitions with the J = 0- 1 line (%*2p, &?p$23pl 12 J= 0 t0 2S22pl 122p&2
3sJ= 1) andtheJ=2-1 lines (2s22p:,,2p:,,3p,,2J=2
to 2s22p:,,2p;,, J= 1 and 2S22p,,,2p;,,3p,,, J=2 to
2s22p,,,2p$,3s J= 1) being the main ones of interest. However, it remains one of the outstanding anomalies in Ne-like collisional XUV laser schemes that relatively weak lasing on the J = 0- 1 transitions [ 1 ] is observed compared with that on the J = 2- 1 lines. Modelling con- sistently suggests that the gain on the J = 0- 1 transition
0030-4018/96/$12.00 0 1996 Elsevier Science B.V. All rights reserved
S.SDIOO30-4018(95)00500-5
778 G.F. Cairns et al. /Optics Communications I23 (1996) 777-789
should be markedly greater than on the J = 2- 1 transi- tions. In our previous germanium experiments [5,9] the 5=2-l transitions at 23.2 and 23.6 nm have been dominant, with the J= O-l transition at 19.6 nm being relatively weak. For the lower Z elements the J = 0- 1 line tends to be emitted only when a prepulse is applied. A number of possible explanations [ 81 have been pro- posed, but the most plausible from recent reported results [lo] is related to the adverse effects of refiac- tion due to high electron density gradients. Refraction deflects the lasing signal out of the gain region. Mod- elling predicts that the gain region for the J= 0- 1 line
lies in a higher density region [ 111 and for slab targets this corresponds to a region deeper into the plasma where gradients are steeper. However, in order to repro- duce the low gain observed on the J = 0- 1 line in sim-
ulations, the monopole excitation rate into the upper lasing level is reduced to 59% of the value given by the R-matrix calculation [ 11,191.
One proposal to compensate for refraction effects was to use a low energy prepulse delivered early onto target to preform a low temperature plasma and then to reheat it with the main pulse at a suitable time in the
expansion. This in theory, can give a more relaxed expansion and shallower density gradients in the plasma when the gain coefficient is optimised.
Throughout this paper the prepulse level is expressed
as a fraction of the total energy in the main drive pulse arriving on target. We present results from two different experiments using prepulse levels which differed by two orders of magnitude. In one of our experiments the prepulse was 2X 10m4 (0.02%) of the main pulse which we define arbitrarily as “low”; the other exper- iment had a prepulse that was 0.018 (1.8%) of the main which we define as “high?‘. The purpose of our experiments was to observe the effect of different pre- pulse intensities when applied to the germanium XUV
laser and whether an enhancement of the J= 0- 1 output intensity could be achieved. This work supports our
overall aim of efficiently producing a bright, coherent and monochromatic beam suitable for application experiments. Preliminary modelling results [ 111 from the hydrodynamics-atomic kinetics code EHYBRID [ 18,191, using prepulses of l-7% delivered 5 ns early onto target, predict that the density gradients are indeed relaxed and the observable gain on the J= O-l and J= 2-l lines significantly improved. This is consistent
with modelling predictions from LASNEX [ lo].
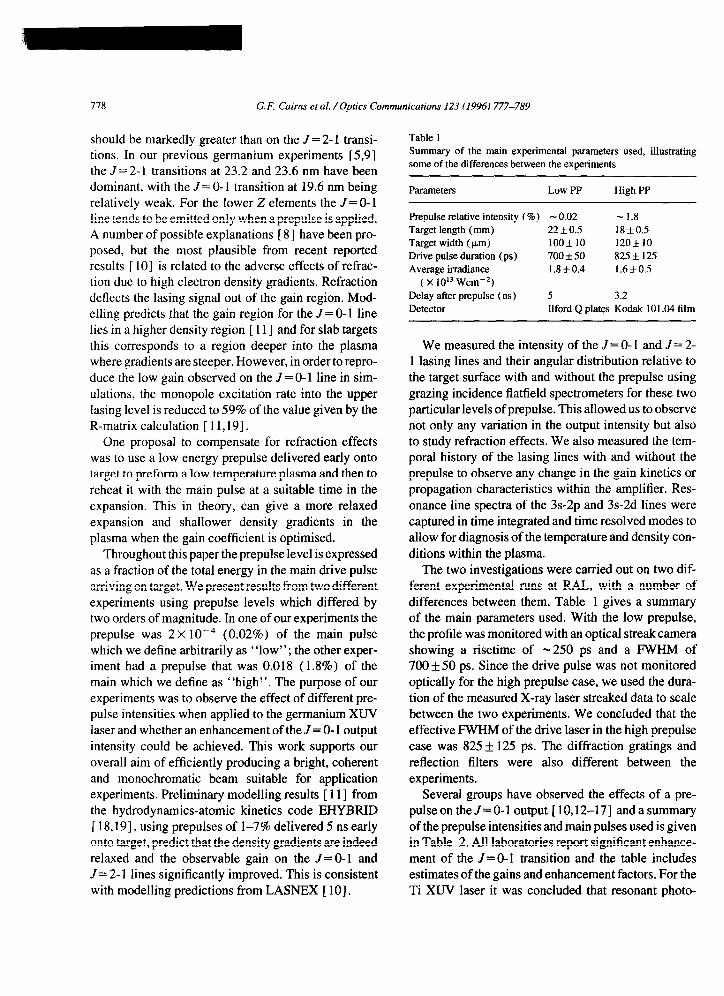
Table 1 Summary of the main experimental parameters used, illustrating some of the differences between the experiments
Parameters Low PP High PP
Prep&e relative intensity (%) - 0.02 - 1.8
Target length (mm) 22kO.5 18f0.5
Target width (pm) lOOk 10 120* 10
Drive pulse duration (ps) 700 f 50 825 f 12.5
Average irradiance 1.850.4 1.6f0.5
( X 1013 Wcm-*)
Delay after prepulse (ns)
Detector
5 3.2
Ilford Q plates Kodak 10 1.04 film
We measured the intensity of the J= 0- 1 and J= 2- 1 lasing lines and their angular distribution relative to the target surface with and without the prepulse using
grazing incidence flatfield spectrometers for these two particular levels of prepulse. This allowed us to observe not only any variation in the output intensity but also to study refraction effects. We also measured the tem- poral history of the lasing lines with and without the
prepulse to observe any change in the gain kinetics or propagation characteristics within the amplifier. Res-
onance line spectra of the 3s-2p and 3s-2d lines were captured in time integrated and time resolved modes to
allow for diagnosis of the temperatureand density con-
ditions within the plasma. The two investigations were carried out on two dif-
ferent experimental runs at RAL, with a number of differences between them. Table 1 gives a summary of the main parameters used. With the low prepulse,
the profile was monitored with an optical streak camera showing a risetime of -250 ps and a FWHM of 700 f 50 ps. Since the drive pulse was not monitored
optically for the high prepulse case, we used the dura- tion of the measured X-ray laser streaked data to scale between the two experiments. We concluded that the
effective FWHM of the drive laser in the high prepulse case was 82.5 f 125 ps. The diffraction gratings and
reflection filters were also different between the
experiments. Several groups have observed the effects of a pre-
pulse on the J=O-1 output [ 10,12-171 and a summary of the prepulse intensities and main pulses used is given in Table 2. All laboratories report significant enhance- ment of the J= O-l transition and the table includes estimates of the gains and enhancement factors. For the
Ti XUV laser it was concluded that resonant photo-
G.F. Cairns et al. /Optics Communications 123 (1996) 777-789 119
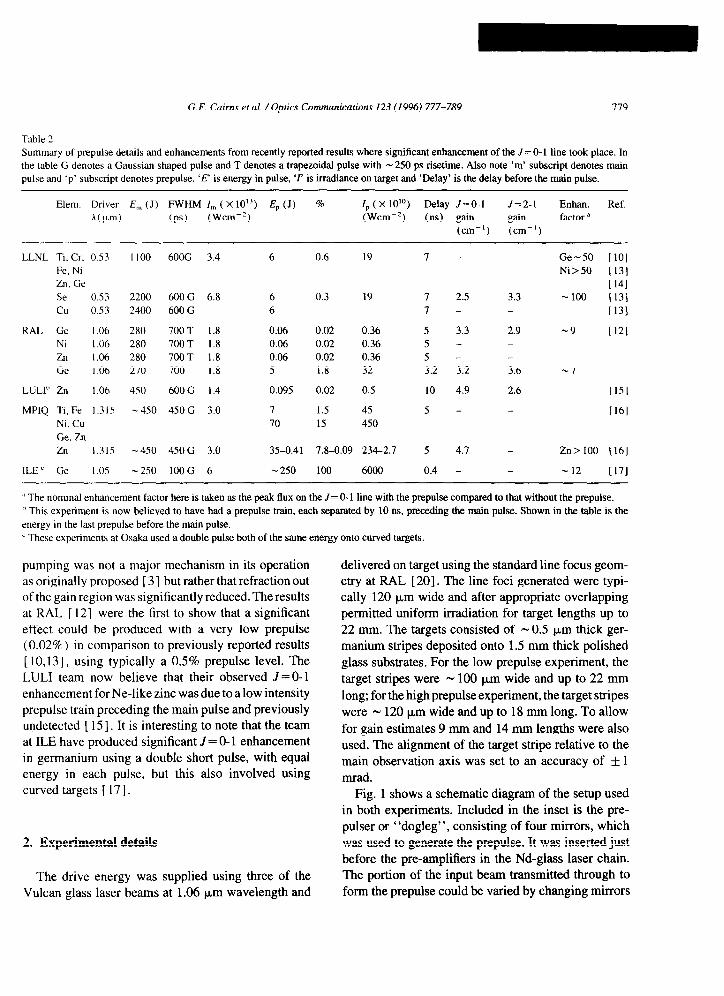
Table 2
Summary of prep&e details and enhancements from recently reported results where significant enhancement of the J=O-1 line took place. In
the table G denotes a Gaussian shaped pulse and T denotes a trapezoidal pulse with - 250 ps risetime. Also note ‘m’ subscript denotes main
pulse and ‘p’ subscript denotes prepulse. ‘E’ is energy in pulse, ‘I’ is irradiance on target and ‘Delay’ is the delay before the main pulse.
Elern. Driver E,,, (J) FWHM I, ( X 10’3) E,, (J)
A( pm) (PS) (Wcm-‘)
% Ip ( X 10”) Delay ./=0-l J=2-1 Enhan. Ref. (Wcm-‘) (ns) gain gain factor a
(cm-‘) (cm-‘)
LLNL Ti. Cr. 0.53 1100 600G 3.4 6 0.6 19 I - _ Ge-50 [lo]
Fe, Ni Ni>50 [13]
Zn. Ge 1141
Se 0.53 2200 600 G 6.8 6 0.3 19 I 2.5 3.3 -100 I131
cu 0.53 2400 600 G 6 I - I131
RAL Ge 1.06 280 700T 1.8 0.06 0.02 0.36 5 3.3 2.9 -9 ]121 Ni 1.06 280 IOOT 1.8 0.06 0.02 0.36 5 -
Zn 1.06 280 IOOT 1.8 0.06 0.02 0.36 5 -
Ge 1.06 270 700 1.8 5 1.8 32 3.2 3.2 3.6 -1
LULl” Zn I .06 450 600G 1.4 0.095 0.02 0.5 10 4.9 2.6 1151
MPlQ Ti,Fe I.315 -450 450 G 3.0 7 1.5 45 5 - I161 Ni, Cu 70 15 450
Ge, Zn
Zn 1.315 -450 450G 3.0 35-0.41 7.8-0.09 234-2.7 5 4.7 - Zn> 100 1161
1LE’ Ge 1 .os -250 100G 6 - 250 100 6000 0.4 - _ - 12 ]I71
” The nominal enhancement factor here is taken as the peak flux on the J= O-l line with the prepulse compared to that without the ptepulse.
h This experiment is now believed to have had a prepulse train, each separated by 10 ns, preceding the main pulse. Shown in the table is the
energy in the last prepulse before the main pulse.
’ These experiments at Osaka used a double pulse both of the same energy onto curved targets.
pumping was not a major mechanism in its operation as originally proposed [ 31 but rather that refraction out of the gain region was significantly reduced. The results
at RAL [ 121 were the first to show that a significant effect could be produced with a very low prepulse (0.02% ) in comparison to previously reported results
[ 10,131, using typically a 0.5% prepulse level. The LULI team now believe that their observed J = 0- 1
enhancement for Ne-like zinc was due to a low intensity prepulse train preceding the main pulse and previously undetected [ 151. It is interesting to note that the team
at ILE have produced significant J = 0- 1 enhancement in germanium using a double short pulse, with equal
energy in each pulse, but this also involved using curved targets [ 171,
2. Experimental details
The drive energy was supplied using three of the
Vulcan glass laser beams at 1.06 p,rn wavelength and
delivered on target using the standard line focus geom- etry at RAL [ 201. The line foci generated were typi- cally 120 p,m wide and after appropriate overlapping
permitted uniform irradiation for target lengths up to
22 mm. The targets consisted of m 0.5 Frn thick ger-
manium stripes deposited onto 1.5 mm thick polished
glass substrates. For the low prepulse experiment, the
target stripes were N 100 km wide and up to 22 mm
long; for the high prepulse experiment, the target stripes
were - 120 p.m wide and up to 18 mm long. To allow
for gain estimates 9 mm and 14 mm lengths were also used. The alignment of the target stripe relative to the
main observation axis was set to an accuracy of + 1
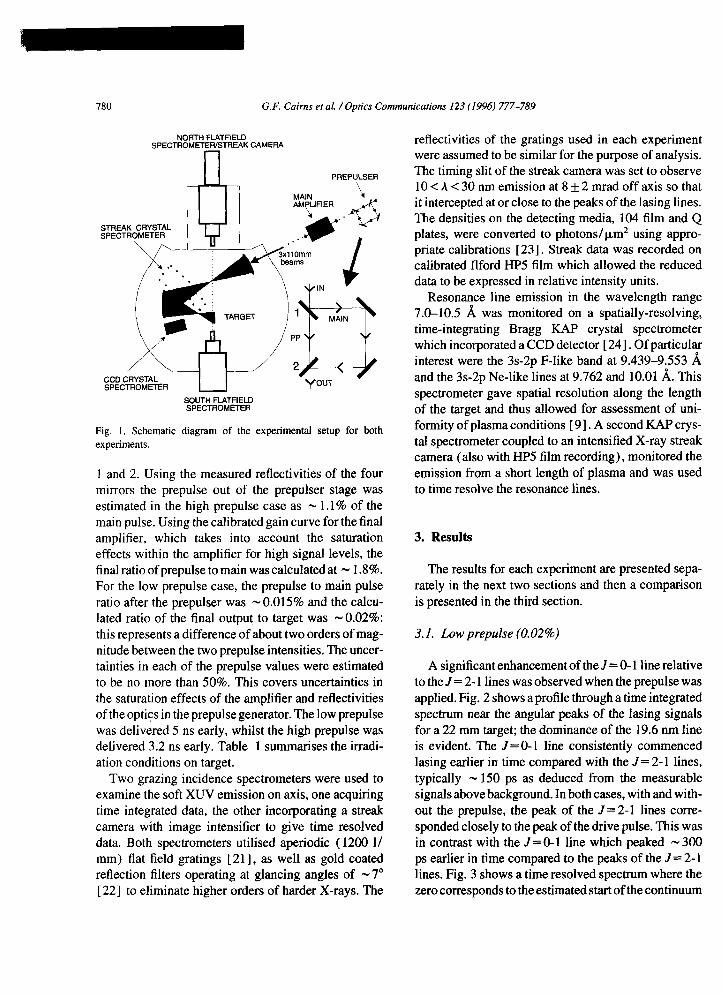
mrad. Fig. 1 shows a schematic diagram of the setup used
in both experiments. Included in the inset is the pre-
pulser or “dogleg”, consisting of four mirrors, which
was used to generate the prepulse. It was inserted just before the pre-amplifiers in the Nd-glass laser chain.
The portion of the input beam transmitted through to
form the prepulse could be varied by changing mirrors
3
780 G.F. Cairns et al. /Optics Communications I23 (1996) 777-789
NORTH FLATFIELD SPECTROMETER/STREAK CAMERA
PREPULSER \
SOUTH FLATFIELD SPECTROMETER
Fig. 1. Schematic diagram of the experimental setup for both experiments.
1 and 2. Using the measured reflectivities of the four mirrors the prepulse out of the prepulser stage was estimated in the high prepulse case as m 1.1% of the main pulse. Using the calibrated gain curve for the final amplifier, which takes into account the saturation effects within the amplifier for high signal levels, the final ratio of prepulse to main was calculated at w 1.8%. For the low prepulse case, the prepulse to main pulse ratio after the prepulser was u 0.015% and the calcu- lated ratio of the final output to target was -0.02%: this represents a difference of about two orders of mag- nitude between the two prepulse intensities. The uncer- tainties in each of the prepulse values were estimated to be no more than 50%. This covers uncertainties in the saturation effects of the amplifier and reflectivities of the optics in the prepulse generator. The low prepulse was delivered 5 ns early, whilst the high prepulse was delivered 3.2 ns early. Table 1 summarises the irradi- ation conditions on target.
Two grazing incidence spectrometers were used to examine the soft XUV emission on axis, one acquiring time integrated data, the other incorporating a streak camera with image intensifier to give time resolved data. Both spectrometers utilised aperiodic (1200 l/ mm) flat field gratings [ 211, as well as gold coated reflection filters operating at glancing angles of -7” [ 221 to eliminate higher orders of harder X-rays. The
reflectivities of the gratings used in each experiment were assumed to be similar for the purpose of analysis. The timing slit of the streak camera was set to observe 10 < A < 30 nm emission at 8 f 2 mrad off axis so that it intercepted at or close to the peaks of the lasing lines. The densities on the detecting media, 104 film and Q plates, were converted to photons/Pm’ using appro- priate calibrations [ 231. Streak data was recorded on calibrated Ilford HP5 film which allowed the reduced data to be expressed in relative intensity units.
Resonance line emission in the wavelength range 7.0-10.5 8, was monitored on a spatially-resolving, time-integrating Bragg RAP crystal spectrometer which incorporated a CCD detector [ 241. Of particular interest were the 3s-2p F-like band at 9.439-9.553 A and the 3s-2p Ne-like lines at 9.762 and 10.01 A. This spectrometer gave spatial resolution along the length of the target and thus allowed for assessment of uni- formity of plasma conditions [ 91. A second KAP crys-
tal spectrometer coupled to an intensified X-ray streak camera (also with HP5 film recording), monitored the emission from a short length of plasma and was used to time resolve the resonance lines.
3. Results
The results for each experiment are presented sepa- rately in the next two sections and then a comparison is presented in the third section.
3.1. Low prep&e (0.02%)
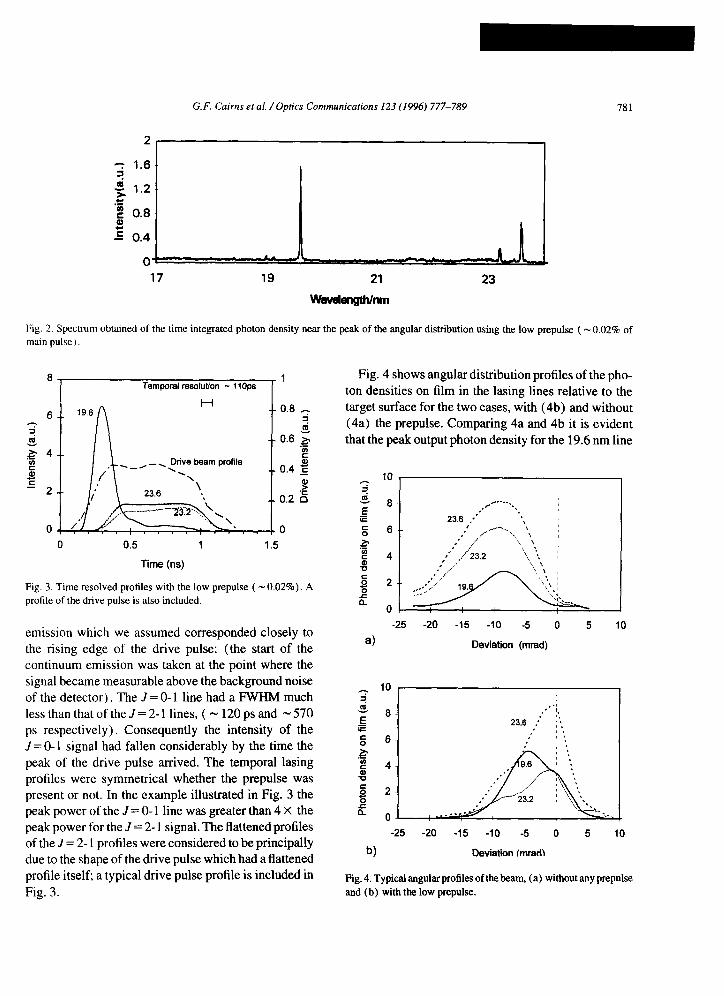
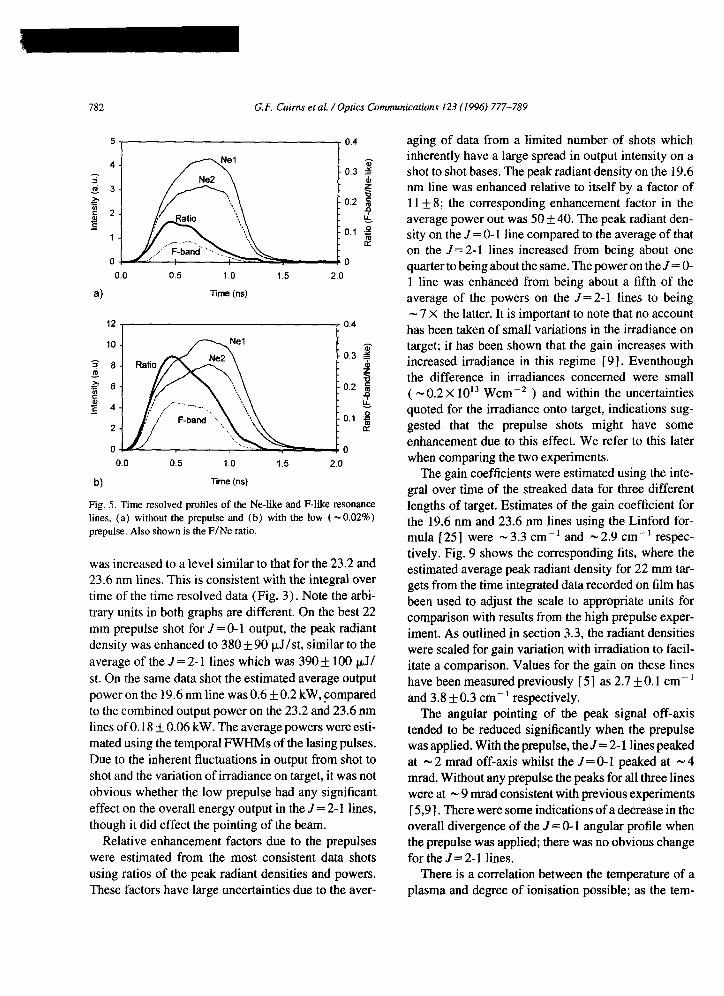
A significant enhancement of the J = 0- 1 line relative to the J = 2- 1 lines was observed when the prepulse was applied. Fig. 2 shows a profile through a time integrated spectrum near the angular peaks of the lasing signals for a 22 mm target; the dominance of the 19.6 nm line is evident. The J=O-1 line consistently commenced lasing earlier in time compared with the J= 2-l lines, typically N 150 ps as deduced from the measurable signals above background. In both cases, with and with- out the prepulse, the peak of the J= 2-l lines corre- sponded closely to the peak of the drive pulse. This was in contrast with the J= 0- 1 line which peaked N 300 ps earlier in time compared to the peaks of the J = 2- 1 lines. Fig. 3 shows a time resolved spectrum where the zero corresponds to the estimated start of the continuum
2 1.6
f 1.2 .C g 0.8 E = 0.4
0
G. F. Cairns et al. /Optics Communications 123 (I 996) 777-789 781
17 19 21 23
-engthlm
Fig. 2. Spectrum obtained of the time integrated photon density near the peak of the angular distribution using the low prepulse ( - 0.02% of
main pulse)
1 Temporal resolution - 1 lops
H 6 19.6 /j
z _ , _. Drive beam profile
0.8 3
0.6 5 I’ ‘P
s 0.4 5
!z 0.2 z
-1 0 0 0.5 1 1.5
Time (ns)
Fig. 3. Time resolved profiles with the low prepulse ( - 0.02%). A
profile of the drive pulse is also included.
emission which we assumed corresponded closely to
the rising edge of the drive pulse: (the start of the
continuum emission was taken at the point where the
signal became measurable above the background noise
of the detector). The J= 0- 1 line had a FWHM much
less than that of the J = 2- 1 lines, ( - 120 ps and - 570
ps respectively). Consequently the intensity of the J = 0- 1 signal had fallen considerably by the time the
peak of the drive pulse arrived. The temporal lasing profiles were symmetrical whether the prepulse was
present or not. In the example illustrated in Fig. 3 the peak power of the J = O-l line was greater than 4 X the
peak power for the J = 2- 1 signal. The flattened profiles of the J = 2- 1 profiles were considered to be principally due to the shape of the drive pulse which had a flattened
profile itself; a typical drive pulse profile is included in
Fig. 3.
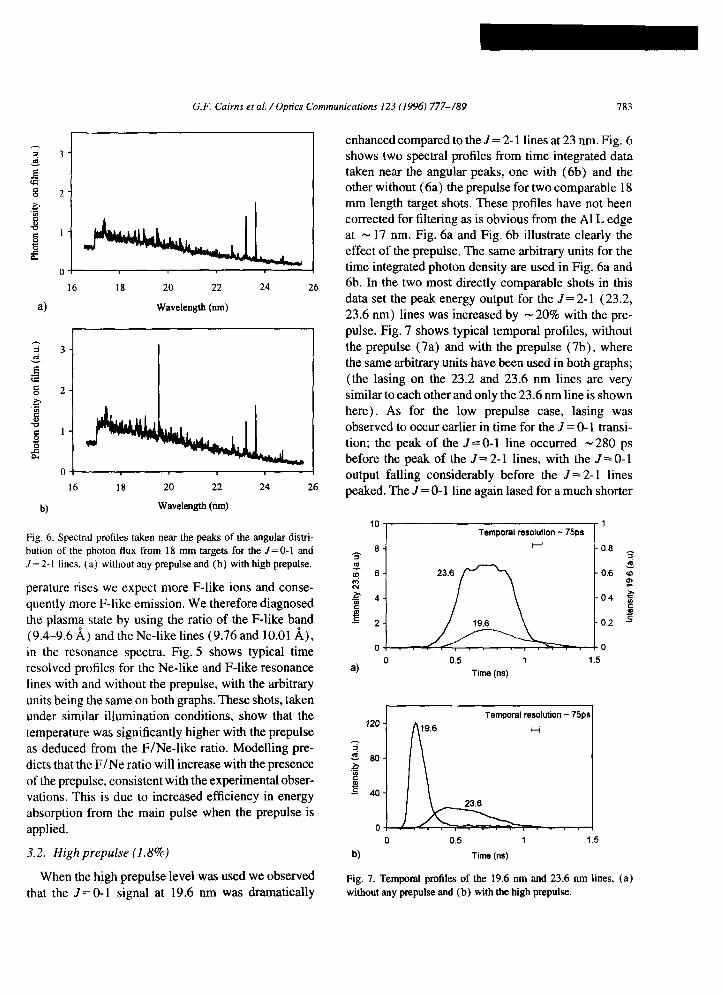
Fig. 4 shows angular distribution profiles of the pho-
ton densities on film in the lasing lines relative to the
target surface for the two cases, with (4b) and without
(4a) the prepulse. Comparing 4a and 4b it is evident
that the peak output photon density for the 19.6 nm line
-25 -20 -15 -10 -5 0 5 10
a) Deviation (mrad)
10
8
6
4
2
0 4.
-25 -20 -15 -10 -5 0 5 10
b) Deviation fmradl
Fig. 4. Typical angular profiles of the beam, (a) without any prepulse
and (b) with the low prepulse.
782 G.F. Cairns et al. /Optics Communications 123 (1996) 777-789
0.0 0.5 1.0 1.5 2.0
a) Time (ns)
12 0.4
0.0 0.5 1.0 1.5 2.0
b) Time (ns)
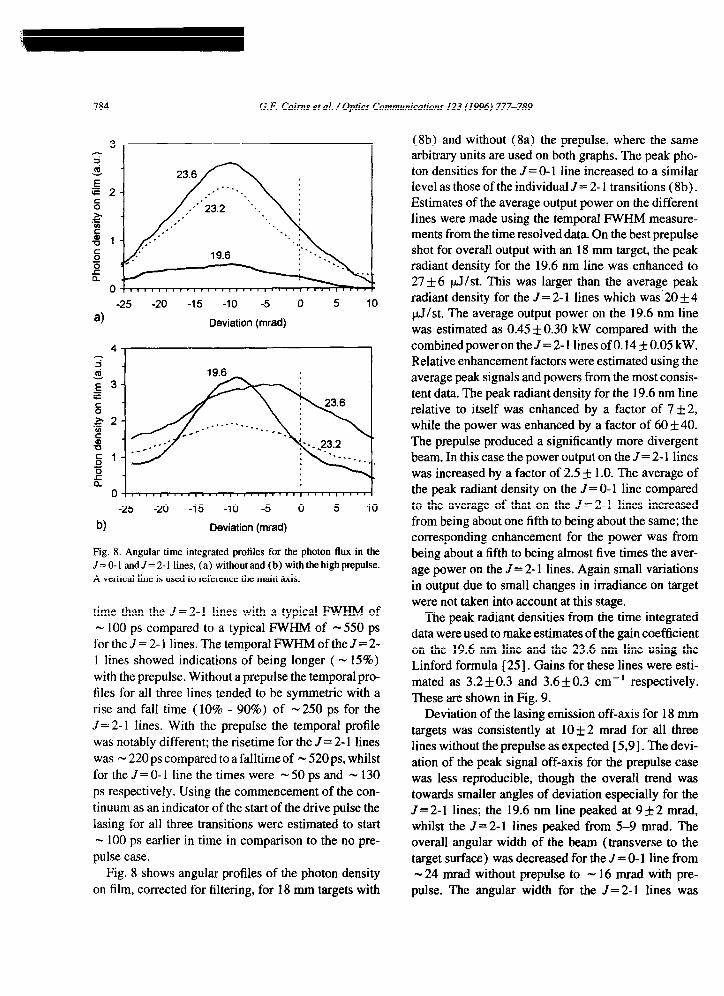
Fig. 5. Time resolved profiles of the Ne-like and F-like resonance
lines. (a) without the prep&e and (b) with the low ( -0.02%) prepulse. Also shown is the F/Ne ratio.
was increased to a level similar to that for the 23.2 and 23.6 nm lines. This is consistent with the integral over
time of the time resolved data (Fig. 3). Note the arbi-
trary units in both graphs are different. On the best 22
mm prepulse shot for J = 0- 1 output, the peak radiant density was enhanced to 380 f 90 p,J/st, similar to the
average of the J= 2- 1 lines which was 390 f 100 p,J/
st. On the same data shot the estimated average output
power on the 19.6 nm line was 0.6 + 0.2 kW,compared
to the combined output power on the 23.2 and 23.6 nm lines of 0.18 + 0.06 kW. The average powers were esti-
mated using the temporal FWHMs of the lasing pulses.
Due to the inherent fluctuations in output from shot to
shot and the variation of h-radiance on target, it was not
obvious whether the low prepulse had any significant
effect on the overall energy output in the J = 2- 1 lines,
though it did effect the pointing of the beam.
Relative enhancement factors due to the prepulses
were estimated from the most consistent data shots
using ratios of the peak radiant densities and powers.
These factors have large uncertainties due to the aver-
aging of data from a limited number of shots which inherently have a large spread in output intensity on a shot to shot bases. The peak radiant density on the 19.6 nm line was enhanced relative to itself by a factor of 11 f 8; the corresponding enhancement factor in the average power out was 50 + 40. The peak radiant den- sity on the J = 0- 1 line compared to the average of that on the J= 2- 1 lines increased from being about one quarter to being about the same. The power on theJ= O- 1 line was enhanced from being about a fifth of the average of the powers on the J= 2- 1 lines to being - 7 X the latter. It is important to note that no account has been taken of small variations in the irradiance on target; it has been shown that the gain increases with increased it-radiance in this regime [ 91. Eventhough the difference in irradiances concerned were small ( u 0.2 X lOI Wcm-’ ) and within the uncertainties quoted for the it-radiance onto target, indications sug- gested that the prepulse shots might have some
enhancement due to this effect. We refer to this later
when comparing the two experiments. The gain coefficients were estimated using the inte-
gral over time of the streaked data for three different
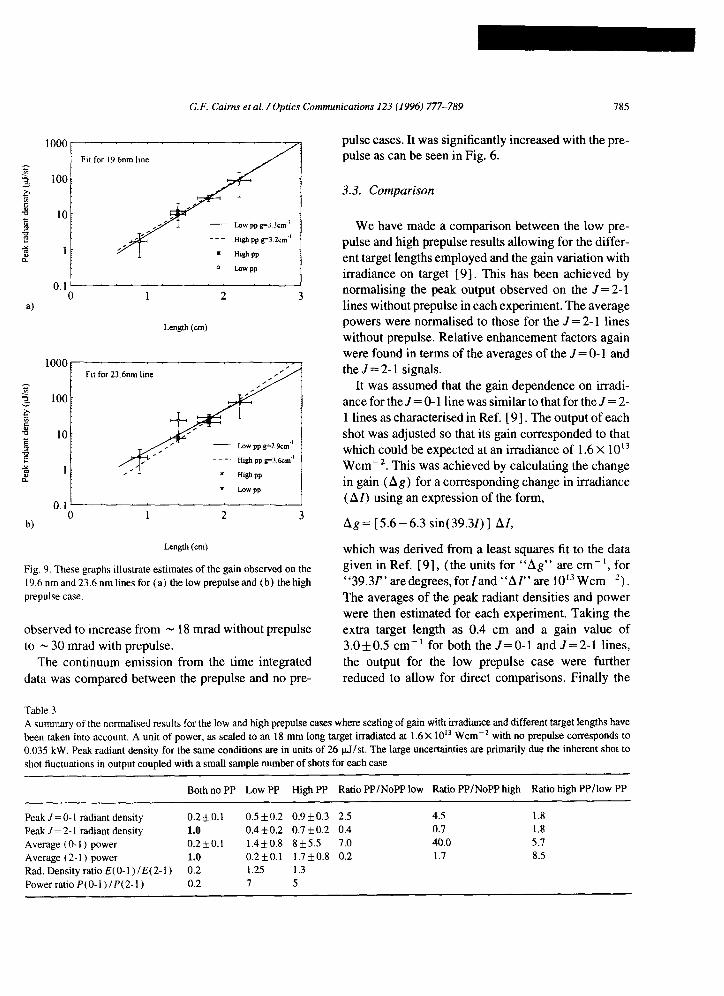
lengths of target. Estimates of the gain coefficient for the 19.6 nm and 23.6 nm lines using the Linford for- mula [25] were -3.3 cm-’ and -2.9 cm-’ respec- tively. Fig. 9 shows the corresponding fits, where the
estimated average peak radiant density for 22 mm tar- gets from the time integrated data recorded on film has been used to adjust the scale to appropriate units for comparison with results from the high prepulse exper- iment. As outlined in section 3.3, the radiant densities
were scaled for gain variation with irradiation to facil- itate a comparison. Values for the gain on these lines
have been measured previously [ 51 as 2.7 f 0.1 cm- ’ and 3.8 f 0.3 cm-’ respectively.
The angular pointing of the peak signal off-axis
tended to be reduced significantly when the prepulse was applied. With the prepulse, the J = 2- 1 lines peaked
at _ 2 mrad off-axis whilst the J=O-1 peaked at -4
mrad. Without any prepulse the peaks for all three lines were at m 9 mrad consistent with previous experiments
[ 5,9]. There were some indications of a decrease in the overall divergence of the J = 0- 1 angular profile when the prepulse was applied; there was no obvious change
for the J = 2- 1 lines. There is a correlation between the temperature of a
plasma and degree of ionisation possible; as the tem-
G. F. Cairns et al. /Optics Communications 123 (1996) 777-789 783
16 18 20 22
Wavelength (am)
24 26
b)
16 18 20 22
Wavelength (nm)
24 26
Fig. 6. Spectral profiles taken near the peaks of the angular distri-
bution of the photon flux from 18 mm targets for the J=O-1 and
J= 2- I lines. (a) without any prepulse and (b) with high prepulse.
perature rises we expect more F-like ions and conse-
quently more F-like emission. We therefore diagnosed the plasma state by using the ratio of the F-like band
(9.4-9.6 A) and the Ne-like lines (9.76 and 10.01 A), in the resonance spectra. Fig. 5 shows typical time resolved profiles for the Ne-like and F-like resonance
lines with and without the prepulse, with the arbitrary units being the same on both graphs. These shots, taken under similar illumination conditions, show that the
temperature was significantly higher with the prepulse as deduced from the F/Ne-like ratio. Modelling pre-
dicts that the F/Ne ratio will increase with the presence
of the prepulse, consistent with the experimental obser- vations. This is due to increased efficiency in energy absorption from the main pulse when the prepulse is
applied.
3.2. High prep&se (1.8%)
When the high prepulse level was used we observed
that the J= O-1 signal at 19.6 nm was dramatically
enhanced compared to the J = 2- 1 lines at 23 nm. Fig. 6 shows two spectral profiles from time integrated data taken near the angular peaks, one with (6b) and the other without (6a) the prepulse for two comparable 18 mm length target shots. These profiles have not been corrected for filtering as is obvious from the Al L edge at _ 17 nm. Fig. 6a and Fig. 6b illustrate clearly the effect of the prepulse. The same arbitrary units for the time integrated photon density are used in Fig. 6a and 6b. In the two most directly comparable shots in this
data set the peak energy output for the J= 2-l (23.2, 23.6 mn) lines was increased by N 20% with the pre- pulse. Fig. 7 shows typical temporal profiles, without
the prepulse (7a) and with the prepulse (7b), where the same arbitrary units have been used in both graphs; (the lasing on the 23.2 and 23.6 nm lines are very similar to each other and only the 23.6 nm line is shown
here). As for the low prepulse case, lasing was observed to occur earlier in time for the J = 0- 1 transi- tion; the peak of the J= O-l line occurred - 280 ps before the peak of the J= 2- 1 lines, with the J = O-l output falling considerably before the J= 2- 1 lines peaked. The J = 0- 1 line again lased for a much shorter
10 1 Temporal resolution - 75~s
a- t-l - 0.8 3 s
a) 0 0.5 1 1.5
Time (ns)
Temporal resolution - 75~~
H
0 0.5 1 1.5
b) Time (ns)
Fig. 7. Temporal profiles of the 19.6 nm and 23.6 nm lines, (a)
without any prepulse and (b) with the high prepulse.
3
784 C. F. Cairns et al. /Optics Communications 123 (1996) 777-789
-25 -20 -15 -10 -5 0 5 10
4 Deviation (mrad)
-25 -20 -15 -10 -5 0 5 10
W Deviation (mrad)
Fig. 8. Angular time integrated profiles for the photon flux in the J = 0- 1 and J = 2- 1 lines, (a) without and (b) with the high prepulse. A vertical line is used to reference the main axis.
time than the J = 2- 1 lines with a typical FWHM of _ 100 ps compared to a typical FWHM of N 550 ps for the J = 2- 1 lines. The temporal FWHM of the J= 2- 1 lines showed indications of being longer ( N 15%) with the prepulse. Without a prepulse the temporal pro- files for all three lines tended to be symmetric with a rise and fall time ( 10% - 90%) of _ 250 ps for the J= 2- 1 lines. With the prepulse the temporal profile was notably different; the risetime for the J = 2- 1 lines was N 220 ps compared to a falltime of N 52Ops, whilst for the J = 0- 1 line the times were _ 50 ps and - 130 ps respectively. Using the commencement of the con- tinuum as an indicator of the start of the drive pulse the lasing for all three transitions were estimated to start * 100 ps earlier in time in comparison to the no pre- pulse case.
Fig. 8 shows angular profiles of the photon density on film, corrected for filtering, for 18 mm targets with
(8b) and without (8a) the prepulse, where the same arbitrary units are used on both graphs. The peak pho- ton densities for the J = 0- 1 line increased to a similar level as those of the individual J = 2- 1 transitions ( 8b). Estimates of the average output power on the different lines were made using the temporal FWHh4 measure- ments from the time resolved data. On the best prepulse shot for overall output with an 18 mm target, the peak radiant density for the 19.6 nm line was enhanced to 27 f6 JLJ/st. This was larger than the average peak radiant density for the J= 2- 1 lines which was’20 f 4 p.J/st. The average output power on the 19.6 nm line was estimated as 0.45 f0.30 kW compared with the combined power on theJ= 2- 1 lines of 0.14 f 0.05 kW. Relative enhancement factors were estimated using the average peak signals and powers from the most consis- tent data. The peak radiant density for the 19.6 nm line relative to itself was enhanced by a factor of 7 f 2, while the power was enhanced by a factor of 60 f 40. The prepulse produced a significantly more divergent beam. In this case the power output on the J= 2- 1 lines was increased by a factor of 2.5 f 1.0. The average of the peak radiant density on the J= O-l line compared to the average of that on the J = 2- 1 lines increased from being about one fifth to being about the same; the corresponding enhancement for the power was from being about a fifth to being almost five times the aver- age power on the J= 2-l lines. Again small variations in output due to small changes in irradiance on target were not taken into account at this stage.
The peak radiant densities from the time integrated data were used to make estimates of the gain coefficient on the 19.6 nm line and the 23.6 nm line using the Linford formula [ 251. Gains for these lines were esti- mated as 3.2 f0.3 and 3.6f0.3 cm-’ respectively. These are shown in Fig. 9.
Deviation of the lasing emission off-axis for 18 mm targets was consistently at lo&2 mrad for all three lines without the prepulse as expected [ 5,9]. The devi- ation of the peak signal off-axis for the prepulse case was less reproducible, though the overall trend was towards smaller angles of deviation especially for the J= 2-l lines; the 19.6 nm line peaked at 9 i- 2 mrad, whilst the 5=2-l lines peaked from 5-9 mrad. The overall angular width of the beam (transverse to the target surface) was decreased for the J-O-1 line from u 24 mrad without prepulse to - 16 mrad with pre- pulse. The angular width for the J= 2-l lines was
G.F. Cairns et al. /Optics Communications 123 (1996) 777-789 785
pulse cases. It was significantly increased with the pre- pulse as can be seen in Fig. 6.
3.3. Comparison
We have made a comparison between the low pre- pulse and high prepulse results allowing for the differ-
ent target lengths employed and the gain variation with irradiance on target [ 91. This has been achieved by normalising the peak output observed on the J= 2-l lines without prepulse in each experiment. The average powers were normalised to those for the J = 2- 1 lines without prepulse. Relative enhancement factors again were found in terms of the averages of the J = 0- 1 and the J = 2- 1 signals.
It was assumed that the gain dependence on irradi- ante for the J = 0- 1 line was similar to that for the J = 2- 1 lines as characterised in Ref. [ 91. The output of each
shot was adjusted so that its gain corresponded to that which could be expected at an irradiance of 1.6 X 10L3 Wcm-*. This was achieved by calculating the change in gain ( Ag) for a corresponding change in it-radiance (AZ) using an expression of the form,
Ag= [5.6-6.3 sin(39.31)] AZ,
which was derived from a least squares fit to the data given in Ref. [9], (the units for ‘ ‘Ag" are cm- ‘, for “39.3Z”aredegrees,forZand“AZ”are 10’3Wcm-‘).
The averages of the peak radiant densities and power were then estimated for each experiment. Taking the
extra target length as 0.4 cm and a gain value of 3.0f0.5 cm-’ for both the J=O-1 and 5=2-l lines,
the output for the low prepulse case were further reduced to allow for direct comparisons. Finally the
0 !Am PP
U 1 2 3 a)
1000
s 3 100
2
8 P 10
! d 1
I
x *a PP
v Low PP
-1
3 2 b)
Fig. 9. These graphs illustrate estimates of the gain observed on the
19.6 nm and 23.6 nm lines for (a) the low prepulse and (b) the high
prepulse case.
observed to increase from _ 18 mrad without prepulse
to - 30 mrad with prepulse.
The continuum emission from the time integrated
data was compared between the prepulse and no pre-
Table 3
A summary of the normalised results for the low and high prepulse cases where scaling of gain with h-radiance and different target lengths have
been taken into account. A unit of power, as scaled to an 18 mm long target irradiated at 1.6X lOI Wcm-* with no prepulse corresponds to
0.035 kW. Peak radiant density for the same conditions are in units of 26 cJ/st. The large uncertainties are primarily due the inherent shot to
shot fluctuations in output coupled with a small sample number of shots for each case
Both no PP Low PP High PP Ratio PPlNoPP low Ratio PP/NoPP high Ratio high PP/low PP
Peak J = 0- 1 radiant density 0.2rto.1 0.5 f0.2 0.9f0.3 2.5 4.5 1.8
Peak J = 2- 1 radiant density 1.0 0.4kO.2 0.7 kO.2 0.4 0.7 1.8
Average (O- 1) power 0.2*0.1 1.4iO.8 8f5.5 7.0 40.0 5.7
Average (2- 1) power 1.0 0.2fO.l 1.7f0.8 0.2 1.7 8.5
Rad. Density ratio E(O-l)/E(2-1) 0.2 1.25 1.3
PowerratioP(O-l)IP(2-1) 0.2 7 5
786 G.F. Cairns et al. /Optics Communications 123 (1996) 777-789
values in each experiment were normalised to those for the J = 2- 1 lines. The normalised results from both experiments are summarised in Table 3.
The results show a significant enhancement of the J = 0- 1 output for high and low levels of prepulse. The J= 0- 1 peak photon energy was increased to a similar level as that on the J= 2- 1 lines. The average power on the J= 0- 1 line was increased to typically six times the average power in the J = 2- 1 lines in both cases. The overall enhancement of the J = 0- 1 line when compared
with itself was larger for the high prepulse case, with an estimated increase in peak energy of 4.5 f: 2.1 and in power of 40 + 34. The output power on the J = 2- 1 lines also increased with the high prepulse. This increase in power for the J = 2- 1 lines was most evident in the larger divergence observed in the output beams.
4. Modelling
Some preliminary modelling results using the EHY-
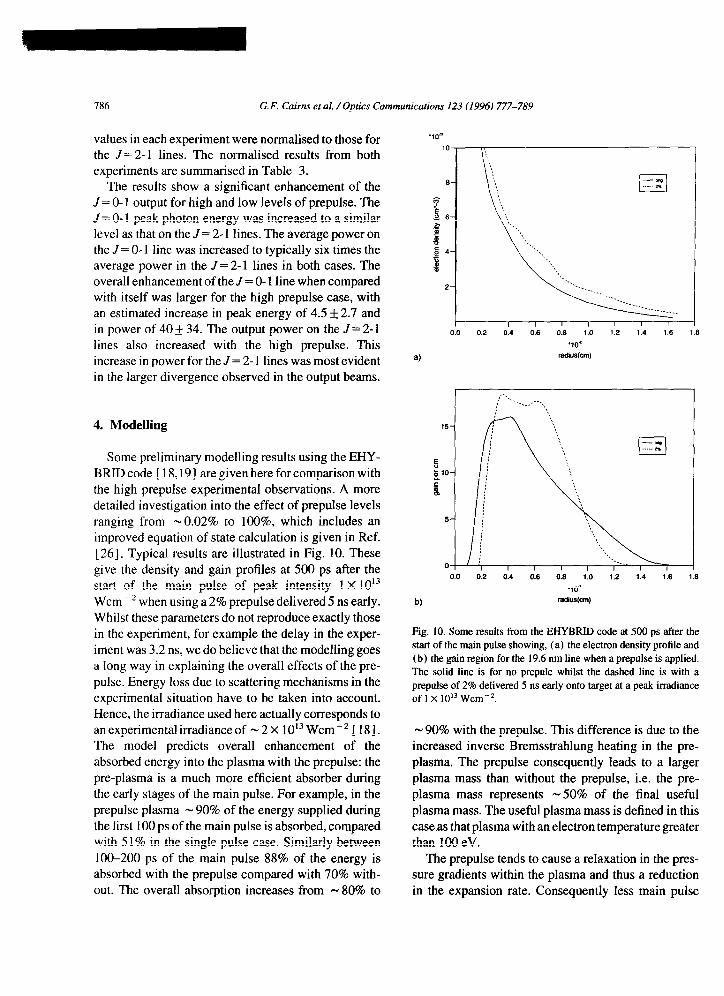
BRID code [ 18,191 are given here for comparison with the high prepulse experimental observations. A more detailed investigation into the effect of prepulse levels
ranging from -0.02% to lOO%, which includes an
improved equation of state calculation is given in Ref. [ 261. Typical results are illustrated in Fig. 10. These give the density and gain profiles at 500 ps after the start of the main pulse of peak intensity 1 X 10¹³
Wcm-’ when using a 2% prepulse delivered 5 ns early. Whilst these parameters do not reproduce exactly those in the experiment, for example the delay in the exper-
iment was 3.2 ns, we do believe that the modelling goes a long way in explaining the overall effects of the pre- pulse. Energy loss due to scattering mechanisms in the
experimental situation have to be taken into account. Hence, the irradiance used here actually corresponds to an experimental it-radiance of - 2 X 10¹³ Wcm-* [ 181. The model predicts overall enhancement of the absorbed energy into the plasma with the prepulse: the pre-plasma is a much more efficient absorber during the early stages of the main pulse. For example, in the
prepulse plasma - 90% of the energy supplied during the first 100 ps of the main pulse is absorbed, compared with 51% in the single pulse case. Similarly between
100-200 ps of the main pulse 88% of the energy is absorbed with the prepulse compared with 70% with- out. The overall absorption increases from - 80% to
0.0 0.2 0.4 0.6 0.6 1.0 1.2 1.4 1.6
'10'
6) radius(cm)
W
‘10’
radius(cm)
Fig. 10. Some results from the EHYBRID code at 500 ps after the start of the main pulse showing, (a) the electron density profile and (b) the gain region for the 19.6 nm line when a prepulse is applied. The solid line is for no prepule whilst the dashed line is with a prepulse of 2% delivered 5 ns early onto target at a peak irradiance of 1 X lOI Wcm-‘.
- 90% with the prepulse. This difference is due to the increased inverse Bremsstrahlung heating in the pre-
plasma. The prepulse consequently leads to a larger plasma mass than without the prepulse, i.e. the pre-
plasma mass represents -50% of the final useful plasma mass. The useful plasma mass is defined in this
case as that plasma with an electron temperature greater than 100 eV.
The prepulse tends to cause a relaxation in the pres- sure gradients within the plasma and thus a reduction
in the expansion rate. Consequently less main pulse
G. F. Cairns et al. /Optics Communications 123 (1996) 777-789 181
energy is expended in expansion cooling when the pre- pulse is applied. This is advantageous compared with the single pulse case where expansion is more explosive due to the very high pressures generated early on. As a result the prepulse leads to more efficient coupling into the electron thermal energy.
In general the model shows the electron density gra- dients to be smaller with the prepulse (lOa), and the
gains ( IOh) to be higher, particularly for the 19.6 nm line. (Although it is worth noting that the interaction between the slow moving plasma formed during the
prepulse and the plasma formed during the main pulse can result in fluctuations in the density profiles which are not apparent in the single pulse simulations.) From 3D raytracing calculations a significant enhancement across the FWHM of the far-field pattern for both the J = 0- 1 and J = 2- 1 lines was apparent. The intensity on the 19.6 nm line increased from - 2% of the 23.6 nm line without the prepulse to -50% of the 23.6 nm
signal with the prepulse. The code predicts little change in the deflected angle which is - 12 mrad with and
without the prepulse. However, it does suggest that the deflected angle will be reduced for shorter length tar-
gets. This is not unreasonable as those rays which expe-
rience the largest gain-lengths for shorter targets can be expected to deflect less in comparison to the corre- sponding rays in longer targets. Whilst the code sug- gests lasing slightly earlier in time for the J= O-l line, it does not predict it to occur as significantly early, nor to lase for as short of time, as observed experimentally.
Modelling of very low prepulses ( -0.02%)
requires a more sophisticated equation of state which
is currently being developed. More detailed modelling results will be presented in a future publication [ 261.
5. Discussion
It is perhaps surprising that similar enhancement effects should occur for prepulse levels differing in intensity by two orders of magnitude. The time resolved
profiles are strikingly similar with lasing tending to be
initiated earlier in time by - 100 ps in both cases for
all three lines. The J= O-l line lases earlier in time
relative to the J = 2- 1 lines and for a considerably shorter time for both prepulse levels, with similar esti-
mates for their FWHMs. However, one apparent dif-
ference was the asymmetry in the temporal profiles when the high prepulse level was used.
The time integrated data in both cases shows the photon flux output on the J= O-l line increased to a similar level as that observed on the J= 2-l lines. In terms of average power out, the power on the J = 0- 1 line was enhanced relative to that on the J = 2- 1 lines
to exceed it by approximately a factor of - 6 X in both cases. The results also show that the integrated output energy on the J = 2- 1 lines was larger with the high
prepulse. The increased divergence of the beams for the J = 2- 1 lines with the high prepulse, typically from
18 mrad to 30 mrad, is probably due to the relatively large pre-plasma formed. According to the modelling this leads to increased absorption of energy and con-
sequently to a larger plasmamass. Thus, whilst the peak energy observed may increase relatively little, a signif- icant increase in the overall output is possible.
The high prepulse was more effective in increasing the absolute output on all three lines, with a dramatic increase in the power on the J = 0- 1 line of - 40 X It
has been shown in the case of the zinc laser that signif- icant increases in output can be achieved by increasing the delay of the prepulse from 2 ns to 4.5 ns [ 271. Thus it may be possible to increase the output in the high prepulse case still further by increasing the delay beyond the 3.2 ns value used.
Modelling and experiments show similar trends with the modelling for the high (2%) level giving plausible reasons for the overall effect of that level of prepulse. It is not so clear for the low level case where a much
smaller pre-plasma is expected. However, as the exper- imental evidence suggests significant enhancement in
the energy absorption in both cases, it would appear that sufficient ionised plasma is produced even with the
ultra-low level to significantly enhance the initial absorption of the drive beam. Achieving the necessary conditions for observing significant gain on the J = O- 1 transition appears to be strongly dependent on the presence or absence of a prepulse; these conditions occur early in the drive pulse and for a significantly shorter time than those for the J = 2- 1 transitions. With
a single pulse it is likely that the high pressure generated within the plasma in the early stages causes a rapid expansion which destroys the necessary conditions for amplification before any significant lasing can occur. Later in time when the plasma is more relaxed the
densities and temperatures will have dropped below
3
788 G.F. Cairns et al. /Optics Communications 123 (1996) 777-789
those required. To recover the optimum conditions again, with the energy supplied later in the drive pulse, may well prove impossible, as this energy is absorbed over a greater plasma volume. Whilst serving to drive the gain on those transitions which require lower den- sities and higher temperatures (e.g. the J= 2- 1 transi- tions) , it would fail to regenerate the higher densities and lower temperatures required for the J = 0- 1 transi- tion. If the prepulse leads to a more relaxed plasma earlier in time then the expansion velocities will be reduced giving a less rapid expansion and thereby pro- ducing a higher density region for a significantly longer
time. A corresponding relaxation in the density gradient would reduce refraction effects, and allow for greater amplification in the gain region. This is consistent with the experimentally observed reduction in the deviation
of the beams: it is not clear why this should appear most noticeable for the low prepulse case. The modelling also predicts significant enhancement of the J= 2-l
peak output energy with a prepulse but experimentally we observe little enhancement and at best, is still com-
parable to the output with zero prepulse. Due to the limited number of data shots and the inherent shot to shot fluctuations in output signal, we are unable to conclude whether this discrepancy is real or simply due
to a poor sample.
6. Conclusion
Brightness of the J = 0- 1 lasing line at 19.6 nm has
been considerably enhanced using high ( 1.8%) and low (0.02%) prepulse levels. This shows that the enhancement effect can be produced over a wide range
of prepulse intensities, greater than two orders of mag- nitude, and that there is likely some optimum level of prepulse and delay for this effect. Preliminary data from
a collaborative experiment to look for optimum con- ditions using the LULI laser supports this view [ 271.
The J = 0- 1 line lased earlier and for a considerably shorter time compared with the J = 2- 1 lines with both high and low prepulses. In both cases the average out- put power in the J = 0- 1 line was nominally - 6 X that of the average of the J= 2- 1 lines, and the peak radiant density on the J= O-l line increased to a level similar to that of the J = 2- 1 lines. Compared to the zero pre- pulse case, the output on the 19.6 nm line was increased
more with the higher level of prepulse. Its peak energy
was estimated to increase by a factor - 4.5 X and its
peak power by a factor of - 40 X . The output power for the J=2-1 lines was also increased with the high level of prepulse. There was - 2 X more radiant den- sity and - 7 X more power for both J= 0- 1 and J= 2- 1 lines with the high prepulse compared with the low prepulse.
The observations suggest that the prepulse leads to (a) enhanced absorption of the drive pulse energy ear- lier in time, (b) increase in the volume of the gain zone, and (c) a relaxation in the electron density gradients. This produces the necessary conditions for more effi- ciently accessing gain on the J= 0- 1 line. These obser- vations are consistent with preliminary modelling.
Acknowledgements
The authors gratefully acknowledge the technical and operational support given by the staff of the Central Laser Facility at the Rutherford Appleton Laboratory. This work was supported by the Science and Engi- neering Research Council through a number of research grants.
References
[ 11 D.L. Mathews, P.L. Hagelstein. M.D. Rosen, M.J.Eckart, N.M. Ceglio, A.U. Hazi, H. Medecki, B.J. MacGowan, J.E. Trebes, B.L. Whitten, E.M. Campbell, C.W. Hatcher, A.M. Hawryluk, R.L. Kauffman, L.D. Pleasance, G. Rambach, J.H. Scofield, G. Stone and T.A. Weaver, Phys. Rev. Len. 54 ( 1985) 110.
[2] T.N. Lee, E.A. McLean and R.C. Elton, Phys. Rev. Lett. 59 (1987) 1185.
[3] T. Boehly, M. Rusotto, R.S. Craxton, R. Epstein, B. Yaakobi, L.B. DaSilva, J. Nilsen, E.A. Chandler, D.J. Fields, B.J. MacGowan, D.L. Mathews, J.H. Scofield, and G. Shimkaveg, Phys. Rev. A 42 ( 1990) 6962.
[4] C.J. Keane, D.L. Mathews, M.D. Rosen, T.W. Phillips, B.J. MacGowan, B.L. Whitten, M. Louis-Jacquet, J.L. Bourgade, A. DeCoster, S. Jacquemot, D. Naccache and G. Thiell, Phys. Rev. A 42 (1990) 2327.
[5] D.M. O’Neill, C.L.S. Lewis, D. N&y, J. Uhoimoibhi, M.H. Key, A.G. MacPhee, G.J. Tallents, S.A. Ramsden, A. Rogoyski, E.A. McLean and G.J. Pert, Optics Comm. 75 (1990) 406.
[6] J. Nilsen, J.L. Porter, L.B. DaSilva and B.J. MacGowan, Proc. 3rd ht. Colloquium on X-Ray lasers, Schlierse, Germany (1992) p. 53.
G. F. Cairns et al. /Optics Communications 123 (1996) 777-789 789
17 I D.J. Fields, R.S. Walling, G.M. Shimkaveg, B.J. MacGowan,
L.B. DaSilva, J.H. Scofield, A.L. Osterheld, T.W. Phillips,
M.D. Rosen, D.L. Mathews, W.H. Goldstein and R.E. Stewart,
Phys. Rev. A 46 ( 1992) 1606.
18 I R.C. Elton. X-Ray Lasers (Academic, San Diego, 1990) pp. 118-124.
[ 9 I D. Neely, C.L.S. Lewis, D.M. O’Neill, J.H. Uhoimoibhi, M.H.
Key, S.J. Rose, G.J. Tallents and S.A. Ramsden, Optics Comm.
87 (1992) 231.
1101 J. Nilsen, B.J. MacGowan, L.B. DaSilva and J.C. Moreno,
Phys. Rev. A 48 ( 1993) 4682.
I 11 I P.B. Holden, YorkUniversity, privatecommunication (1993).
1121 G.F. Cairns. C.L.S. Lewis, M.J. Lamb, A.G. MacPhee, D.
Neely, P. Norreys, M.H. Key. C. Smith, P.B. Holden, G.J. Pert
and J.A. Plowes, Proc. 4th Intern. Colloquium on X-Ray
Lasers. Williamsburg, Virginia, USA (1994).
I 13 I J. Nilsen. J.C. Moreno. B.J. MacGowan and J.A. Koch, Appl.
Phys. B. 57 ( 1993) 309; J. Nilsen and J.C. Moreno, Optics
Lett. 19 (1994) 1137.
114) J. Nilsen. J.C. Moreno, J.A. Koch, J.H. Scofield, B.J.
MacCowan and L.B. DaSilva, Proc. 4th Intern. Colloquiumon
X-Ray Lasers, Williamsburg, Virginia, USA ( 1994).
I 15 I B. Rus, A. Carillon, B. Gauthe, P. Goedkindt, P. Jaegle, G.
Jamelot. A. Klisnick, A. Sureau and P. Zeitoun, J. Opt. Sot. A.
B I1 (1994)564:
B. Rus, A. Carillon, P. Dhez, B. Gauthe, P. Goedtkindt, P.
Jaegle, G. Jamelot. A. Klisnick, A. Sureau and P. Zeitoun, Proc.
4th Intern. Colloquium on X-Ray Lasers, Williamsburg,
Virginia. USA ( 1994).
I 16 I E.E. Fill, Y. Li, D. Schogl, J. Steingruber and J. Nilsen, Optics
Lett. 20 4 f 1995) 374:
E.E. Fill, private communications.
[ 171 H. Daido, Y. Kato, R. Kodama, K. Murai, G. Yuan, M. Takagi,
H. Takabe, S. Nakai, C.H. Nam, I.W. Choi, D. Neely and A.G.
MacPhee, Proc. 4th Intern. Colloquium on X-ray lasers,
Williamsburg, Virginia, USA ( 1994).
[ 181 G.J. Pert. J. Fluid Mech. 131 (1983) 401.
[ 191 P.B. Holden, S.B. Healy, M.T.M. Lightbody, G.J. Pert, J.A.
Plowes, A.E. Kingston, E. Robertson, C.L.S. Lewis and D.
Neely, J. Phys. B: At. Mol. Opt. Phys. 27 ( 1994) 341.
[201 1.N. Ross, 0. Willi,G.P. Kiehn,R. Corbett, C.L.S. Lewis,L.D.
Shorrock, M.H. Key and C.J. Hooker, Appl. Optics 26 (1987)
1584.
[ 211 N. Nakano, H. Ku&a, T. Kita and T. Harada, Appl. Optics 23
(1984) 23686-23692.
[22] D. Neely, PhD Thesis, An Experimental study of ASE soft X-
ray laser action exhibiting high gain-length products, Queen’s
University Belfast ( 1992).
[23] J. Krishnan, D. Neely, C. Damon, L. Dwivedi, C.L.S. Lewis
and G.J. Tallents, Central Laser Facility Annual Report, RAL
(1992).
[24] A.G. MacPhee, and C.L.S. Lewis, Central Laser Facility
Annual Repott, RAL ( 1993);
D.M. O’Neill and C.L.S. Lewis, Laser Focus World ( 1994).
[ 25 ] G.J. Linford, E.R. Peressini, W.R. Sooy and M.L. Spaeth, Appl.
Optics 13 (1974) 379.
[26] S.B. Healy, G.F. Cairns, C.L.S. Lewis, G.J. Pert and J.A.
Plowes, IEEE, J. Quantum Electron., accepted for publication
(1995).
[27] A. Klisnick, ACarillon, P. Dhez, P. Goedkindt, P. Jaegle, G.
Jamelot, M. Name), B. Rus, P. Zeitoun, C.L.S. Lewis, A.G.
MacPhee, M. Holden, J. Krishnan, G.J. Tallents, R. Cauble.
L.B. DaSilva, D.L. Mathews and H. Baldis, Proc. Intern. Conf.
on Lasers’94, Quebec, Canada ( 1994).
Copyright © 2022 FDOKUMEN