Using digital repeat photography and eddy covariance data to model grassland phenology and...
13
Please cite this article in press as: Migliavacca, M., et al., Using digital repeat photography and eddy covariance data to model grassland phenology and photosynthetic CO 2 uptake. Agric. Forest Meteorol. (2011), doi:10.1016/j.agrformet.2011.05.012 ARTICLE IN PRESS G Model AGMET-4433; No. of Pages 13 Agricultural and Forest Meteorology xxx (2011) xxx–xxx Contents lists available at ScienceDirect Agricultural and Forest Meteorology jou rn al h om epa g e: www.elsevier.com/locate/agrformet Using digital repeat photography and eddy covariance data to model grassland phenology and photosynthetic CO 2 uptake Mirco Migliavacca a,b,∗ , Marta Galvagno b,c , Edoardo Cremonese c , Micol Rossini b , Michele Meroni b,d , Oliver Sonnentag e , Sergio Cogliati b , Giovanni Manca f , Fabrizio Diotri c , Lorenzo Busetto b , Alessandro Cescatti a , Roberto Colombo b , Francesco Fava b,g , Umberto Morra di Cella c , Emiliano Pari h , Consolata Siniscalco h , Andrew D. Richardson e a European Commission, DG-JRC, Institute for Environment and Sustainability, Climate Change and Air Quality Unit, Ispra, Via Fermi 2749, 21027 Ispra, Italy b Remote Sensing of Environmental Dynamics Laboratory, DISAT, Università degli Studi Milano-Bicocca, Piazza della Scienza 1, 20126 Milan, Italy c Agenzia Regionale per la Protezione dell’Ambiente della Valle d’Aosta, Sez. Agenti Fisici, Aosta, Italy d European Commission, DG-JRC, Institute for Environment and Sustainability, Monitoring Agricultural Resources Unit, Via Fermi 2749, 21027 Ispra, Italy e Department of Organismic and Evolutionary Biology, Harvard University, Cambridge, MA 02138, USA f Institute for Atmospheric Pollution, Consiglio Nazionale delle Ricerche, 87036 Rende, Italy g Desertification Research Group (NRD), Università degli Studi di Sassari, Viale Italia 57, 07100 Sassari, Italy h Plant Biology Department, Università degli Studi di Torino, Viale Pier Andrea Mattioli, 25, 10125 Torino, Italy a r t i c l e i n f o Article history: Received 4 January 2011 Received in revised form 17 May 2011 Accepted 19 May 2011 Keywords: Digital repeat photography Phenology Growing Season Index Color indices Gross primary production Subalpine grasslands a b s t r a c t The continuous and automated monitoring of canopy phenology is of increasing scientific interest for the multiple implications of vegetation dynamics on ecosystem carbon and energy fluxes. For this purpose we evaluated the applicability of digital camera imagery for monitoring and modeling phenology and physiology of a subalpine grassland over the 2009 and 2010 growing seasons. We tested the relationships between color indices (i.e. the algebraic combinations of RGB brightness levels) tracking canopy greenness extracted from repeated digital images against field measurements of green and total biomass, leaf area index (LAI), greenness visual estimation, vegetation indices computed from continuous spectroradiometric measurements and CO 2 fluxes observed with the eddy covariance technique. A strong relationship was found between canopy greenness and (i) structural parameters (i.e., LAI) and (ii) canopy photosynthesis (i.e. Gross Primary Production; GPP). Color indices were also well correlated with vegetation indices typically used for monitoring landscape phenology from satellite, suggesting that digital repeat photography provides high-quality ground data for evaluation of satellite phenology products. We demonstrate that by using canopy greenness we can refine phenological models (Growing Sea- son Index, GSI) by describing canopy development and considering the role of ecological factors (e.g., snow, temperature and photoperiod) controlling grassland phenology. Moreover, we show that canopy greenness combined with radiation use efficiency (RUE) obtained from spectral indices related to photo- chemistry (i.e., scaled Photochemical Reflectance Index) or meteorology (i.e., MOD17 RUE) can be used to predict daily GPP. Building on previous work that has demonstrated that seasonal variation in the structure and function of plant canopies can be quantified using digital camera imagery, we have highlighted the potential use of these data for the development and parameterization of phenological and RUE models, and thus point toward an extension of the proposed methodologies to the dataset collected within PhenoCam Network. © 2011 Elsevier B.V. All rights reserved. ∗ Corresponding author at: European Commission, DG Joint Research Centre, Insti- tute for Environment and Sustainability, Climate Change and Air Quality Unit – TP290, Via E. Fermi, 2749, I-21027 Ispra, VA, Italy. Tel.: +39 0332 78 9448. E-mail address: [email protected] (M. Migliavacca). 1. Introduction Phenology is the study of the timing of recurring biological events and the causes of their temporal change regarding biotic and abiotic forces (Lieth, 1976). Since the timing of the main plant phenological events and their interannual variability are controlled by meteorological and 0168-1923/$ – see front matter © 2011 Elsevier B.V. All rights reserved. doi:10.1016/j.agrformet.2011.05.012
Transcript of Using digital repeat photography and eddy covariance data to model grassland phenology and...

G
A
Up
MOAEa
b
c
d
e
f
g
h
a
ARRA
KDPGCGS
tT
0d
ARTICLE IN PRESS Model
GMET-4433; No. of Pages 13
Agricultural and Forest Meteorology xxx (2011) xxx– xxx
Contents lists available at ScienceDirect
Agricultural and Forest Meteorology
jou rn al h om epa g e: www.elsev ier .com/ locate /agr formet
sing digital repeat photography and eddy covariance data to model grasslandhenology and photosynthetic CO2 uptake
irco Migliavaccaa,b,∗ , Marta Galvagnob,c , Edoardo Cremonesec , Micol Rossinib , Michele Meronib,d ,liver Sonnentage, Sergio Cogliatib, Giovanni Mancaf, Fabrizio Diotri c, Lorenzo Busettob,lessandro Cescatti a, Roberto Colombob, Francesco Favab,g, Umberto Morra di Cellac,miliano Parih, Consolata Siniscalcoh, Andrew D. Richardsone
European Commission, DG-JRC, Institute for Environment and Sustainability, Climate Change and Air Quality Unit, Ispra, Via Fermi 2749, 21027 Ispra, ItalyRemote Sensing of Environmental Dynamics Laboratory, DISAT, Università degli Studi Milano-Bicocca, Piazza della Scienza 1, 20126 Milan, ItalyAgenzia Regionale per la Protezione dell’Ambiente della Valle d’Aosta, Sez. Agenti Fisici, Aosta, ItalyEuropean Commission, DG-JRC, Institute for Environment and Sustainability, Monitoring Agricultural Resources Unit, Via Fermi 2749, 21027 Ispra, ItalyDepartment of Organismic and Evolutionary Biology, Harvard University, Cambridge, MA 02138, USAInstitute for Atmospheric Pollution, Consiglio Nazionale delle Ricerche, 87036 Rende, ItalyDesertification Research Group (NRD), Università degli Studi di Sassari, Viale Italia 57, 07100 Sassari, ItalyPlant Biology Department, Università degli Studi di Torino, Viale Pier Andrea Mattioli, 25, 10125 Torino, Italy
r t i c l e i n f o
rticle history:eceived 4 January 2011eceived in revised form 17 May 2011ccepted 19 May 2011
eywords:igital repeat photographyhenologyrowing Season Indexolor indicesross primary productionubalpine grasslands
a b s t r a c t
The continuous and automated monitoring of canopy phenology is of increasing scientific interest for themultiple implications of vegetation dynamics on ecosystem carbon and energy fluxes. For this purposewe evaluated the applicability of digital camera imagery for monitoring and modeling phenology andphysiology of a subalpine grassland over the 2009 and 2010 growing seasons.
We tested the relationships between color indices (i.e. the algebraic combinations of RGB brightnesslevels) tracking canopy greenness extracted from repeated digital images against field measurements ofgreen and total biomass, leaf area index (LAI), greenness visual estimation, vegetation indices computedfrom continuous spectroradiometric measurements and CO2 fluxes observed with the eddy covariancetechnique. A strong relationship was found between canopy greenness and (i) structural parameters (i.e.,LAI) and (ii) canopy photosynthesis (i.e. Gross Primary Production; GPP). Color indices were also wellcorrelated with vegetation indices typically used for monitoring landscape phenology from satellite,suggesting that digital repeat photography provides high-quality ground data for evaluation of satellitephenology products.
We demonstrate that by using canopy greenness we can refine phenological models (Growing Sea-son Index, GSI) by describing canopy development and considering the role of ecological factors (e.g.,snow, temperature and photoperiod) controlling grassland phenology. Moreover, we show that canopygreenness combined with radiation use efficiency (RUE) obtained from spectral indices related to photo-chemistry (i.e., scaled Photochemical Reflectance Index) or meteorology (i.e., MOD17 RUE) can be used
to predict daily GPP.Building on previous work that has demonstrated that seasonal variation in the structure and functionof plant canopies can be quantified using digital camera imagery, we have highlighted the potential useof these data for the development and parameterization of phenological and RUE models, and thus pointtoward an extension of the proposed methodologies to the dataset collected within PhenoCam Network.
Please cite this article in press as: Migliavacca, M., et al., Using digital repeatand photosynthetic CO2 uptake. Agric. Forest Meteorol. (2011), doi:10.101
∗ Corresponding author at: European Commission, DG Joint Research Centre, Insti-ute for Environment and Sustainability, Climate Change and Air Quality Unit –P290, Via E. Fermi, 2749, I-21027 Ispra, VA, Italy. Tel.: +39 0332 78 9448.
E-mail address: [email protected] (M. Migliavacca).
168-1923/$ – see front matter © 2011 Elsevier B.V. All rights reserved.oi:10.1016/j.agrformet.2011.05.012
© 2011 Elsevier B.V. All rights reserved.
1. Introduction
Phenology is the study of the timing of recurring biological
photography and eddy covariance data to model grassland phenology6/j.agrformet.2011.05.012
events and the causes of their temporal change regarding bioticand abiotic forces (Lieth, 1976).
Since the timing of the main plant phenological events andtheir interannual variability are controlled by meteorological and

ING Model
A
2 nd For
e2t
taoiagmcotpgeptV
dfefhJio
(flscrdiprMm
hshBe
ciGafiwl
atsm2oreii
ARTICLEGMET-4433; No. of Pages 13
M. Migliavacca et al. / Agricultural a
nvironmental forcing (e.g. Chuine et al., 2004; Penuelas et al.,009), phenology has been shown to be an important indicator forhe biological impacts of climate change (e.g. IPCC, 2007).
The European Alps are assumed to be particularly sensitiveo changes in climate (e.g. Beniston, 2005; Rammig et al., 2010),lthough much uncertainty still exists as to the possible effectsf such changes on ecosystems. It is therefore particularly press-ng to disentangle the ecological and climatic factors controllinglpine and subalpine grassland phenology, to quantify changes inrowing season length and also the effect that phenological changesay have on the ecosystem carbon balance. Some effects of climate
hange on the Alps have already been observed such as migrationf species to higher elevations (Walther et al., 2005) and trendsoward longer growing seasons (e.g. Stockli and Vidale, 2004). Inarticular, the impacts of climate change on alpine and subalpinerasslands will be very likely stronger than on other mountain veg-tation because they are highly diverse (Körner, 2005), because ofasture abandonment and the wide range of microclimatic condi-ions that occur over short distances (e.g. Motta and Nola, 2001;ittoz et al., 2008; Wohlfahrt et al., 2003; Zeeman et al., 2010).
Most of the studies conducted on the Alps dealing with theevelopment of strategies for long-term phenological monitoringocus on tree species (Ahrends et al., 2008; Busetto et al., 2010; Fontit al., 2010; Migliavacca et al., 2008; Moser et al., 2010), while onlyew studies on grassland phenology of the subalpine and alpine beltave been reported (e.g. Cernusca et al., 2008; Fontana et al., 2008;
onas et al., 2008). This is primarily due to the difficulty in develop-ng a protocol for field observation of grassland phenology focusedn the whole canopy and not on a single species.
The relationships between the timing of key phenological eventsbud-burst, senescence, etc.), climate and, more recently carbonuxes have been the subject of intense research, while the relation-hips between sub-seasonal variations of canopy development andlimate have received little attention. The lack of understanding iseflected in the unsatisfactory description of phenology and canopyevelopment in ecosystem models and the resulting, often unreal-
stic estimation of carbon fluxes. This is particularly true for grossrimary production (GPP), which is largely dependent on the accu-ate description of canopy development (e.g. Kucharik et al., 2006;igliavacca et al., 2009; Ryu et al., 2008). Thus, we ask how can weore accurately predict and model seasonal canopy development.The use of “near-surface” remote sensing with digital cameras
as great potential in improving phenological monitoring becauseuch observations make it possible to collect automated data atigh temporal resolution and in a broad range of ecosystems (e.g.radley et al., 2010; Garrity et al., 2010; Ryu et al., 2010; Richardsont al., 2009; Sonnentag et al., 2011).
The use of repeated digital images collected by conventionalameras has been shown to be promising for phenological researchn various ecosystems including forests (Ahrends et al., 2008, 2009;raham et al., 2010; Nagai et al., 2010; Richardson et al., 2007, 2009)nd arid grasslands (e.g. Kurc and Benton, 2010). In the agriculturaleld several authors have shown the potential of complete roboticeed control systems based on digital images in achieving a high
evel of automation (e.g. Slaughter et al., 2008).However, to the best of our knowledge, there has been no
ttempt to use these data for the development and optimiza-ion of diagnostic and prognostic phenological models. Recently,ome phenological models aimed at describing canopy develop-ent have been proposed (e.g. Arora and Boer, 2005; Jolly et al.,
005; Choler et al., 2010; Knorr et al., 2010) and few attempts toptimize these models against remotely sensed products have been
Please cite this article in press as: Migliavacca, M., et al., Using digital repeatand photosynthetic CO2 uptake. Agric. Forest Meteorol. (2011), doi:10.101
eported (Stockli et al., 2008; Knorr et al., 2010). Among these mod-ls the Growing Season Index (GSI) developed by Jolly et al. (2005)s one of the most increasingly used (e.g. Stockli et al., 2008). GSIs a bioclimatic index that predicts foliar phenology of vegetation
PRESSest Meteorology xxx (2011) xxx– xxx
throughout the year as a consequence of three drivers: minimumtemperature, evaporative demand and daylength.
Furthermore, the direct linkage between observations of canopygreenness through color indices (i.e. the algebraic combinations ofRGB brightness levels) obtained from digital camera imagery, CO2flux measurements and vegetation indices related to canopy struc-ture (e.g. Normalized Difference Vegetation Index, NDVI (Rouseet al., 1974); MERIS Terrestrial Chlorophyll Index, MTCI (Dash andCurran, 2004)) and functioning (e.g. Photochemical ReflectanceIndex, PRI (Gamon et al., 1992)) might be useful for several rea-sons: firstly, in investigating the impact of phenology on carbonsequestration (Piao et al., 2008; Richardson et al., 2010); secondly,in improving the description of carbon fluxes at site level throughthe use of radiation use efficiency (RUE) models (e.g. Monteithand Unsworth, 1990). RUE models assume that carbon fixation is alinear function of the incident photosynthetically-active radiationabsorbed by vegetation (APAR) and RUE, which represents the con-version efficiency of absorbed energy to fixed carbon. The APAR canbe described by using vegetation indices related to canopy struc-ture while RUE is estimated from daily meteorology (e.g. Heinschet al., 2006; Veroustraete et al., 2002) or by using spectral VIs relatedto photosynthetic efficiency or photochemistry (e.g. Gamon et al.,1992, 1997).
In this paper, we analyze a time series of color indices obtainedfrom digital camera imagery collected over a subalpine grasslandduring 2009 and 2010 with the primary goal of addressing the fol-lowing research questions: (i) can we use digital camera imageryto monitor the seasonal canopy development of a subalpine grass-land? (ii) Can we use digital camera imagery as additional sourceof information for improving phenological and RUE models?
In order to address these questions we firstly compare colorindices against other field measurements (e.g. LAI, green and totalbiomass), spectral vegetation indices (e.g. NDVI, MTCI, etc.) col-lected using high resolution spectrometers and against carbon fluxmeasurements collected with the eddy covariance technique. Sec-ondly, we use two years of color indices and meteorology to attestseveral versions of the GSI model regarding their application oversubalpine grasslands. Finally, we combine color indices, meteorol-ogy (through the use of RUE models) and spectral vegetation indices(VIs) related to canopy structure, green vegetation biomass (NDVI,MTCI) and to photochemistry (PRI) with the aim of describing thetemporal variability of GPP.
2. Material and methods
2.1. Site description
The study site is an abandoned pasture of the subalpine beltcomposed mainly of matgrass (Nardus stricta, Arnica montana,Trifolium alpinum and Carex sempervirens as dominant species),located at 2160 m a.s.l. (45◦50′40′′ N, 7◦34′41′′ E), in the North-Western Italian Alps (Aosta Valley – Torgnon).
The area is classified as an intra-alpine region with semi-continental climate with an annual mean temperature of 3.1 ◦C andmean annual precipitation of about 920 mm. The snow-free periodlasts generally from late May to early November. The 2009 growingseason was considerable less rainy than that of 2010 with a totalamount of precipitation during the snow-free period of 172 mmand 362 mm respectively.
2.2. Digital camera set-up and image analysis
photography and eddy covariance data to model grassland phenology6/j.agrformet.2011.05.012
Canopy images were collected with a Campbell digital camera(model CC640 Campbell Scientific, Logan, UT, USA) installed in aweatherproof enclosure at a height of 2.5 m above the ground. The

ARTICLE IN PRESSG Model
AGMET-4433; No. of Pages 13
M. Migliavacca et al. / Agricultural and Forest Meteorology xxx (2011) xxx– xxx 3
640 C
chwtd
a0m1““
mtuct(
rNyte
TA
of the ROI was selected to provide a reasonably extended spatialsampling of foreground canopy while avoiding the inclusion of thearea in the background that might be exposed to different lightconditions (e.g. scattered low clouds and fog in the background).
Fig. 1. Example of digital JPEG images collected by the CC
amera was pointed north, and set at an angle of about 20◦ beloworizontal following Richardson et al. (2007). Camera focal lengthas 3.5 mm and the field of view was approximately 79.8◦. Because
he camera position was fixed, the scene was identical from day toay.
The camera was connected to a CR1000 Campbell data-loggernd provided JPEG images of the same scene (resolution 640 × 480,.3 megapixels, with three color channels of 8-bit RGB color infor-ation, i.e. digital numbers ranging from 0 to 255) every hour from
0 am to 4 pm. The camera–JPEG compression mode was set toNone”, to produce the best quality JPEG files with no artifacts fromlossy” compression algorithms.
The camera operated with automatic exposure and apertureode, responding to ambient light levels using the entire image
o adjust the exposure settings. Thus, the brightness of any individ-al pixel was not a direct measure of surface radiance per se. Theamera did not record the exposure setting along with the image,hus preventing the conversion of the images into digital numbersDN) proportional to radiance.
The present study was based on the analysis of 1940 imagesecorded between the 21st May 2009 (DOY 141) and the 20thovember 2010 (DOY 324). Sample images from throughout theear 2009 are presented in Fig. 1. To minimize the angular effect ofhe canopy’s hemispherical directional reflectance function (Chen
Please cite this article in press as: Migliavacca, M., et al., Using digital repeatand photosynthetic CO2 uptake. Agric. Forest Meteorol. (2011), doi:10.101
t al., 2000) only the images taken from 11 am to 1 pm were used.We developed an R script (R version 2.11.1, R Development Core
eam, 2009) to process and analyze the archived digital image files.nalyses were based on time series extracted from one specific
ampbell digital camera during the 2009 growing season.
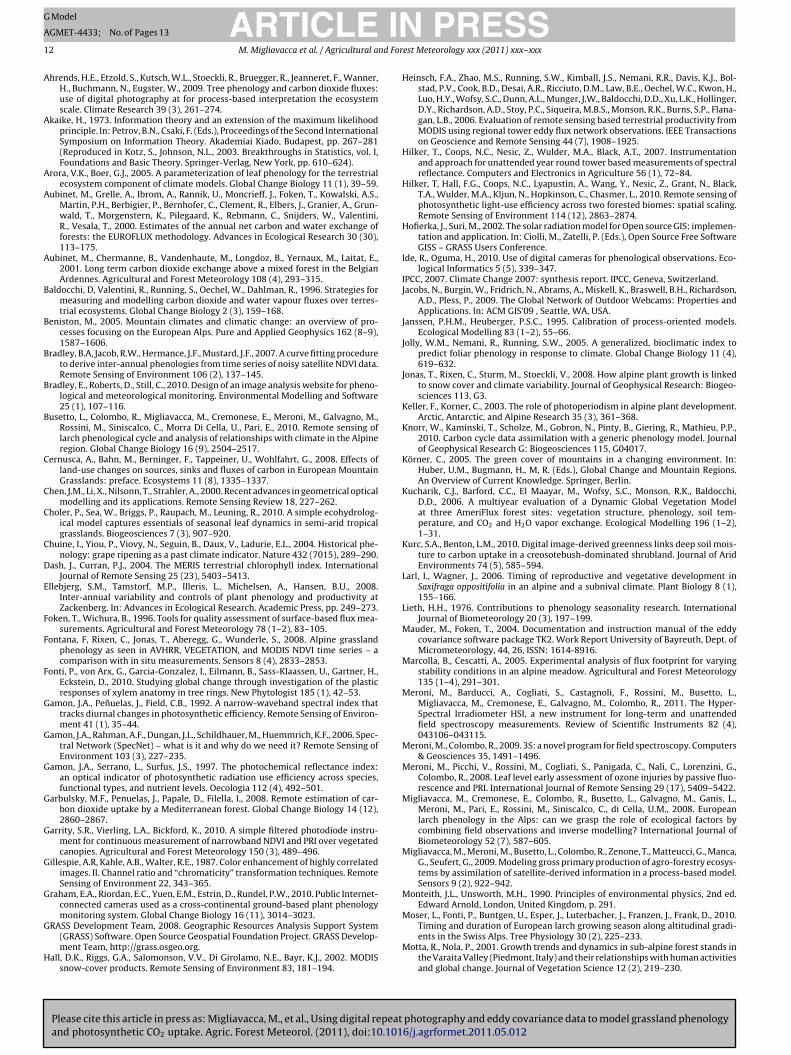
“Region of Interest” (ROI) as illustrated in Fig. 2. The dimension
photography and eddy covariance data to model grassland phenology6/j.agrformet.2011.05.012
Fig. 2. Digital image collected by the CC640 Campbell camera the 16th July 2009.Blue box denotes the static Region of Interest (ROI) selected for the study. The greyreference panel is visible on the bottom right portion of the image.

ING Model
A
4 nd For
teceG
T
R
G
B
weCicnceti
R(
G
Tbd
tpcwc
atibffiodafiiwt�Timpr
2m
s
ARTICLEGMET-4433; No. of Pages 13
M. Migliavacca et al. / Agricultural a
The color indices were computed on each archived image:he red, blue and green digital numbers (DN) of each pixel werextracted and averaged over the ROI for each image. Then, the per-ent of relative brightness (RGB chromatic coordinates in Gillespiet al., 1987) of each channel were computed as in Eqs. (2)–(4) (RI,I and BI):
otalDN = RDN + GDN + BDN (1)
I = RDN
TotalDN(2)
I = GDN
TotalDN(3)
I = BDN
TotalDN(4)
here RDN, GDN, BDN are the red, green and blue DN values ofach color channel respectively. As mentioned above, the CampbellC640 automatically optimizes the exposure time without record-
ng it. Therefore it is not possible to compute the number of digitalounts in the unit time, the physical quantity needed to correctlyormalize the images for the incident irradiance. The use of RGBhromatic coordinates (Eqs. (2)–(4)) instead of RGB brightness lev-ls suppresses the influence of changes in scene illumination dueo cloud cover, solar illumination, as well as image exposure andnternal camera processing.
An additional color index, the greenness excess index (GEI,ichardson et al., 2009; Woebbecke et al., 1995), was also computedEq. (5)):
EI = 2 · GDN − (RDN − BDN) (5)
Color indices were computed for the selected ROI for each image.hen, the color indices computed for the three images recordedetween 11 am and 1 pm on each day were averaged to get a meanaily value of each color indices.
To assess the overall quality of the retrieved signal and the day-o-day stability of the imagery color balance, one ROI from the greyanel (Fig. 2) was extracted. The coefficient of variation of the RGBhromatic coordinates (Eqs. (2)–(4)) during the two growing seasonas 3.9%, 1.8% and 3.3% for RI, GI and BI respectively, giving us
onfidence to the quality of the retrieved signal.Image quality was sometimes adversely affected by rain, snow,
erosols, fog and uneven illumination due to the presence of scat-ered clouds. The result is that smooth trajectories of the colorndices related to canopy greenness were sometimes interruptedy a sharp increase or decrease in VI values, lasting for one or aew days. The time series of daily average color indices were thusltered to suppress unusual high or low values with a recursiveutlier removal filtering. A cubic smoothing spline, with variableegrees of freedom (df) set to the ratio between time series lengthnd 10 (i.e. for time series of 300 days, df was set equal to 30), wastted to GI and GEI data. Then, the residuals between daily color
ndices and the smoothing spline were calculated. A particular dayas considered as ‘good’ and then retained for further analysis if
he absolute value of the daily residual was less than � + 3�, where is the mean of the residuals and � is their standard deviation.he algorithm described above was recursively applied to the colorndices time series until no outliers were detected (with a maxi-
um of 10 loops). We selected a smoothing spline because it wasreviously found to be useful to extract phenological patterns fromemotely sensed observations (Bradley et al., 2007).
.3. Eddy covariance flux measurements and
Please cite this article in press as: Migliavacca, M., et al., Using digital repeatand photosynthetic CO2 uptake. Agric. Forest Meteorol. (2011), doi:10.101
icrometeorological data
CO2, water and energy fluxes between vegetation and atmo-phere were measured using the eddy covariance (EC) technique
PRESSest Meteorology xxx (2011) xxx– xxx
(e.g. Baldocchi et al., 1996). Wind velocity components weremeasured using a three-dimensional sonic anemometer (CSAT-3Campbell Scientific Inc., Logan, UT, USA) positioned at a height of2.5 m above the surface. Water vapor and CO2 fluctuations weremeasured with a fast-responding open-path infrared gas analyzer(IRGA, LI-7500, LI-COR Inc., Lincoln NE, USA). Eddy fluxes werecalculated with a time step of 30 min according to EUROFLUXmethodology (Aubinet et al., 2000).
Along with EC fluxes, the main meteorological variables weremeasured every 30 min, among these photosynthetically activeradiation (PAR), air temperature (TAir) and relative humidity (RH)were measured above the grassland by means of a quantum sensor(LI-190s, LI-COR Inc.) and a shielded thermo-hygrometer (HMP45C,Vaisala Inc., Woburn, MA, USA) respectively. The vapor pressuredeficit (VPD) was computed from TAir and RH. Precipitation wasmeasured using a tipping bucket rain gauge (CS700, Campbell Sci-entific, Logan, UT, USA); soil water content (SWC) was measuredwith water content reflectometers (CS-616, Campbell Scientific,Logan, UT, USA), installed at two different depths (5–30 cm) whilesnow height was measured with an ultrasonic distance sensor(SR50, Campbell Scientific, Logan, UT, USA). Day length was com-puted using potential incoming solar radiation modeled by the r.sunroutine (Hofierka and Suri, 2002) implemented in GRASS OpenSource GIS (GRASS Development Team, 2008) with a 2-min timestep. Day length was computed as the sum of the time steps withpotential radiation values higher than 20 W m−2.
In order to discard doubtful half-hourly data, in which the the-oretical requirements of the eddy covariance technique are notfulfilled, we performed the tests for stationarity and integral tur-bulent characteristics following Foken and Wichura (1996). Resultsfrom integral turbulence and stationarity tests were combined toget the overall quality flag for each half-hour period using the stan-dard procedure followed in Carboeurope-IP project (Mauder andFoken, 2004). Data belonging to class 2 (questionable data quality,gap filling necessary) were discarded.
In order to avoid the possible underestimation of fluxes in stableconditions, data with friction velocity (u*) lower than an appropri-ate threshold were filtered. A critical u* threshold of 0.050 m s−1
was estimated using a procedure similar to Papale et al. (2006).Quality control tests rejected 10.37% of the measured data while
data below the critical u* threshold were about 11.37%. In the fol-lowing analyses, we only used the flux data which passed the abovedescribed tests.
To assess the consistency of the EC measurements, we analyzedthe energy balance closure (Aubinet et al., 2001) by computing theslope of the linear relationship between half-hourly sums of latentheat, sensible heat and their storage, measured with the EC system,and the sums of half-hourly net radiation and soil heat flux obtainedwith independent methods. The heat storages of biomass and soilwere not considered in this analysis. The energy balance closure forthe snow-free period in the 2 measurement years was 0.69.
For the gap-filling and partitioning of fluxes, the marginaldistribution sampling (MDS) method and the partitioning methoddescribed in Reichstein et al. (2005), implemented in the onlinetool (http://www.bgc-jena.mpg.de/bgc-mdi/html/eddyproc/),were used.
2.4. Estimation of flux footprint
The footprint of eddy covariance flux measurements was deter-mined through the analytical model of Schuepp et al. (1990) whichmeasures the cumulative normalized contribution to the surface
photography and eddy covariance data to model grassland phenology6/j.agrformet.2011.05.012
flux from an upwind source areaThe target ecosystem is represented in the area in Fig. 3. Con-
sidering all the data belonging to the quality class 0 and 1 (Mauderand Foken, 2004) above the critical u* threshold, the median of the

ARTICLE IN PRESSG Model
AGMET-4433; No. of Pages 13
M. Migliavacca et al. / Agricultural and Forest Meteorology xxx (2011) xxx– xxx 5
Fig. 3. (a) Site map with the polar plot of the distribution of the peak flux footprint (XMAX) computed by 11.25◦ sectors for the growing seasons 2009 and 2010. The isolinesa lar seb ector
fi
vdii2
eTmob
2
eAbtAsm2(t
hooHt25
nd different colors represent the percentiles of the distribution of XMAX in a particuy 11.5◦ wind sectors for the growing seasons 2009 and 2010. The colors in each sgure legend, the reader is referred to the web version of the article.)
alues of the peak flux footprint (XMAX) was 17.8 m (Fig. 3a). Duringaytime the median of XMAX was lower (14.23 m). These values are
n agreement with other analysis conducted with a similar exper-mental set-up over alpine grasslands (e.g. Marcolla and Cescatti,005).
Considering the daytime fluxes about the 90% of the fluxes wasmitted by an area within 40 m around the eddy covariance system.he distribution of the XMAX position (Fig. 3) confirmed that theeasured scalar flux was representative of the area we are focusing
n and that the contribution of fluxes from the target ecosystem isy far dominating the overall budget.
.5. Ancillary and radiometric measurements
During 2009 and 2010 growing seasons additional data on veg-tation structure and phenology were periodically collected. Leafrea Index (LAI), green and total (green and dry) abovegroundiomass were measured every two weeks by sampling the phy-omass at 12 selected plots of 40 cm × 40 cm in the study area.t each sampling date LAI was estimated at each plot by using acanning device and the average value was computed. The maxi-um LAI was reached in July (2.7 m2 m−2 in 2009 and 2.8 m2 m−2 in
010). In the same 12 plots, visual observations of canopy greennessgreenness visual estimation, GVE) were collected and averaged forhe estimation of canopy GVE.
Canopy spectral properties were measured with an automaticyperspectral system named HSI (HyperSpectral Irradiometer)perating in the spectral range 400–1000 nm with a spectral res-lution of 1 nm (Meroni et al., 2011; Meroni and Colombo, 2009).
Please cite this article in press as: Migliavacca, M., et al., Using digital repeatand photosynthetic CO2 uptake. Agric. Forest Meteorol. (2011), doi:10.101
SI was installed at the site and operated continuously for almosthe entire growing seasons (130 days in 2009 and 148 days in010), collecting spectral signatures of the canopy about every
min. Spectral data were used to compute vegetation indices (VIs)
ctor. (b) Wind rose: wind frequencies are expressed in percentages and computedindicate the wind speed class. (For interpretation of the references to color in this
related to canopy structure such as the Normalized Difference Veg-etation Index (NDVI, Rouse et al., 1974, Eq. (6)) and the MTCI (MerisTerrestrial Chlorophyll Index, Dash and Curran, 2004, Eq. (7)). ThePhotochemical Reflectance index (PRI, Gamon et al., 1992), relatedto canopy functioning, was also computed. PRI was scaled (sPRI)according to Rahman et al. (2001) in a range of 0–1 for use as anefficiency factor (Eq. (8)):
NDVI = �800 − �600
�800 + �680(6)
MTCI = �753.75 − �708.75
�708.75 − �681.25(7)
sPRI =(
(�531 − �570)/(�531 + �570) + 1)
2(8)
where �x is the reflectance computed at the x wavelength in nm.For consistency with color indices, midday VIs (average of all
data collected from 11 am to 1 pm) were computed and used forfurther analyses.
2.6. Using color indices for model development
We assessed the potential for using color indices to develop andparameterize phenological and RUE models.
2.6.1. Growing Season Index (GSI) modelCanopy development was modeled using the GSI (Growing Sea-
son Index, Jolly et al., 2005). In its original formulation, GSI assumedthat canopy development was driven by three climatic controls:
photography and eddy covariance data to model grassland phenology6/j.agrformet.2011.05.012
minimum daily temperature TMIN (◦C), day length or photoperiodPh (h) and mean day-light VPD (h Pa). The daily value of GSI wascomputed as the 21-day running average of the index iGSI. iGSIwas calculated daily as the product of three factors (f(TMIN), f(Ph)

ARTICLE ING Model
AGMET-4433; No. of Pages 13
6 M. Migliavacca et al. / Agricultural and For
Table 1Summary of different Growing Season Index (GSI) formulations tested (describedin Section 2.6.1 in the text). Grey areas represent the environmental factors used bythe different model formulations for the calculation of the daily GSI value: f(TMIN)represents the constrain of minimum temperature, f(Ph) represents the day-lengthconstraint, f(VPD) represents the constraint of vapor pressure deficit (VPD), f(SNOW)represents the constraint due by the presence of snow cover while f(SWC) representsthe constraint of the soil water content.
GSI formulation f(TMIN) f(Ph) f(VPD) f(SNOW) f(SWC)
GSIGSIPh+SNOW
GSISNOW
aobVPc
ta
•
•
teiiop
Ptoas
odtfbas
2
a
(poPs
G
GSISWC
GSISWC+SNOW+Ph
nd f(VPD)) that vary linearly between 0 and 1 as a consequencef the constraining limits. The constraining limits were describedy the empirical climate parameters Tmmax, Tmmin, Phmax, Phmin,PDmax, and VPDmin representing maximum and minimum TMIN,h and VPD ranges above/below which canopy development is fullyonstrained or unconstrained.
Given the importance of snow cover and SWC in determininghe canopy development of subalpine grasslands, we included twodditional factors in the model:
f(SNOW): a flag that assumes a value of 0 when the canopy iscovered by snow and 1 during the snow-free period;f(SWC): this scalar function was specified as sigmoidal functions(Eq. (9)) constrained to the interval [0,1].
f (SWC) = 11 + e(�1−�2·SWC) (9)
Five different model formulations based on different combina-ions of the limiting factors were then tested (Table 1): GSI as in Jollyt al. (2005) (‘GSI’), GSI with f(SNOW) included for the calculation ofGSI (‘GSIPh+SNOW’), GSI with f(SNOW) included for the calculation ofGSI in place of f(Ph) (‘GSISNOW’), the ‘GSISNOW’ with f(SWC) in placef f(VPD) (i.e. ‘GSISWC’) and finally the ‘GSIPh+SNOW’ with f(SWC) inlace of f(VPD) (i.e. ‘GSISWC+SNOW+Ph’).
For each model formulation, model parameters (i.e. Tmmax, Tmmin,hmax, Phmin, VPDmax, VPDmin, �1 and �2) were estimated againsthe daily GI derived from digital camera imagery for the entirebservation period (i.e. growing seasons 2009 and 2010). The mainim of this analysis was to test which model formulation was bestupported by data at the hand.
To create a continuous time series of GI for the optimizationf the GSI we fitted cubic smoothing splines with degrees of free-om (df) set to the ratio between time series length and 10 (i.e. forime series of 300 days, df was set equal to 30). The spline was pre-erred to well-known growth models (e.g. logistic model) first of allecause of the strongly asymmetric (fast spring growth and slowutumn decrease) shape of the retrieved color index (i.e. GI) andecond because it was more flexible than a prescribed function.
.6.2. Radiation use efficiency (RUE) modelsFor modeling canopy functioning we tested two different RUE
pproaches.The first was based on the widely used RUE model MOD 17
Heinsch et al., 2006), which is the algorithm of the MODIS dailyhotosynthesis product (MOD17). MOD17 is driven by meteorol-gy (air temperature and VPD), PAR and the fraction of absorbed
Please cite this article in press as: Migliavacca, M., et al., Using digital repeatand photosynthetic CO2 uptake. Agric. Forest Meteorol. (2011), doi:10.101
AR (fAPAR). Here, MOD17 was driven by the GI as a proxy of fAPAR,o that daily GPP (GPPi) was modeled as in Eq. (10):
PPi = RUEMAX · (a0 + a1GI) · PAR · f (VDP)f (TMIN) (10)
PRESSest Meteorology xxx (2011) xxx– xxx
where RUEMAX is the maximum radiation use efficiency (gC MJ−1);f(TMIN) and f(VPD) varied linearly between 0 and 1 as a consequenceof suboptimal temperatures and water availability for photosyn-thesis, PAR is the incident PAR expressed in MJ m−2, a1 and a0 arethe coefficients relating GI and fAPAR. RUEMAX, a1, a0 and the param-eters of f(TMIN) and f(VPD) were estimated against observed dailyGPP.
The second approach was based on Rossini et al. (2010) whichshowed that the midday GPP can be effectively estimated using onlyPAR and a combination of structural (e.g. NDVI, MTCI) and function-related (e.g. sPRI) VIs computed using high resolution spectral data.Here we extended this approach by including the color index (GI)as a descriptor of canopy greenness. We thus investigated whethercolor indices and spectral VIs could be combined to predict mid-day GPP, without relying on meteorological data for determiningphotosynthetic uptake. We tested two different sets of models forthe description of midday GPP (Rossini et al., 2010). The first modelset (PV, Eq. (11)) assumed that GPP can be estimated with constantRUE and deriving APAR as the product of PARi and a linear functionof VIs related to the biomass and photosynthetic pigments (i.e. GI,NDVI, MTCI). The second set of models (E, Eq. (12)) assumed thatGPP can be estimated by deriving both the absorbed PAR (APAR)and RUE directly from spectral indices. Hence, model set E com-bined indices related to photosynthetic components of fAPAR (i.e.GI, NDVI, MTCI) with indices related to RUE (sPRI).
GPPi = (a0 + a1PVi) · PARi Model set PV (11)
GPPi = (a0 + a1sPRIi) · (a2 + a3PVi) · PARi Model set E (12)
where GPPi, PARi, PVi and sPRIi are the midday GPP, PAR, VI relatedto photosynthetic fAPAR (i.e. NDVI, MTCI and GI) and sPRI of thei-th DOY, respectively. Model parameters were derived by fittingthe model against midday observed GPP.
2.7. Model parameter estimates and evaluation of modelperformances
Best-fit model parameters were estimated using either simu-lated annealing (for GSI and MOD17) or the quasi-Newton method(for parameters in Eqs. (11) and (12)), implemented in the R “optim”routine belonging to the R stats package (R, version 2.11.1). Forboth methods the residual sum of squares between observed andmodeled data (RSS) was used as cost function of the optimization.
The main fitting statistics (r2, the root mean square error, RMSE,and the modeling efficiency, EF) between observed and modeleddata were computed to evaluate the overall accuracy of fitted mod-els (Janssen and Heuberger, 1995).
To identify the best model supported by data among differentGSI formulations and RUE models we computed the Akaike Infor-mation Criterion (AIC, Akaike, 1973). The AIC is a useful indicatorsince it considers the trade-off between model complexity (i.e.number of parameters, p) and maximum likelihood (here calcu-lated as RSS). The lower the AIC, the better is the model considered.AIC essentially balances better model explanatory power againstincreasing complexity.
3. Results
3.1. Analysis of color indices, CO2 fluxes, meteorological fluxesand ancillary data
Time series of midday chromatic coordinates (RI, GI and BI)
photography and eddy covariance data to model grassland phenology6/j.agrformet.2011.05.012
across the ROI computed for the year 2009 show distinct seasonalsignals (Fig. 4a). Both RI and BI were more variable from day-to-daythan GI. The time series of GI and GEI computed for the growingseason 2009 are reported as example in Fig. 4b and c.

ARTICLE IN PRESSG Model
AGMET-4433; No. of Pages 13
M. Migliavacca et al. / Agricultural and Forest Meteorology xxx (2011) xxx– xxx 7
0.30
0.31
0.32
0.33
0.34
0.35
0.36
0.37
% B
right
ness
a
0.33
00.
335
0.34
00.
345
0.35
0
GI
b
150 200 250 300
50
1015
20
GE
I
c
Fig. 4. (a) Time series of relative brightness (% Brightness) of each channel (Eqs. (2)–(4) in the manuscript) for the year 2009: green dots represent greenness indices GI,b x, GI (m the das legen
2ccbb
tmw
TPcIV
t
lue dots blue indices BI, red dots red indices (RI). (b) Time series of Greenness Indeanuscript). In the x axis the day of the year are reported. Vertical lines highlight
nowfall event in spring. (For interpretation of the references to color in this figure
The correlation between ancillary data collected in 2009 and010 and color indices is reported in Table 2. Results show a positiveorrelation with green biomass, LAI and GVE, while a not signifi-ant correlation was observed with total biomass (dry plus greeniomass) indicating that the color indices are not sensitive to dryiomass.
A summary of meteorological data, daily GPP and the smoothedime series of GI, GEI, MTCI, NDVI and sPRI for the entire measure-
Please cite this article in press as: Migliavacca, M., et al., Using digital repeatand photosynthetic CO2 uptake. Agric. Forest Meteorol. (2011), doi:10.101
ent period are reported in Fig. 5. GI was slightly better correlatedith the ancillary data than GEI, although the differences were
able 2earson’s correlation coefficient calculated between ancillary data and color indicesomputed for the days in which the ancillary data were collected. GI is the Greennessndex, GEI is the Greenness Excess Index, LAI is the Leaf Area Index, GVE is the Greenisual Estimation.
Total biomass Green biomass LAI GVE
GI n.s. 0.68* 0.77** 0.72***
GEI n.s. 0.67* 0.74*** 0.70***
* Represent significant correlations (p < 0.01).** Represent significant correlations (p < 0.001).
*** Represent significant correlation (p = 0), n.s. represents not significant correla-ion.
Eq. (2) in the manuscript). (c) Time series of Greenness Excess Index (Eq. (3) in they of snowmelt in spring and snowfall in autumn. Vertical dashed line represent a
d, the reader is referred to the web version of the article.)
almost negligible. For this reason we further discuss the resultsonly in terms of GI.
GI (Fig. 5d) began rising slowly immediately after the snowmelt(around DOY 150 and 140 for 2009 and 2010, respectively) andat faster rate after DOY 165–170, reaching its maximum at earlyJuly (around DOY 190–200 for both years). Over the subsequentweeks, GI showed a steady decline due to autumn yellowing andsenescence. In 2009, by DOY 270, however, a pronounced increasein GI was observed (Fig. 5d). Spectral VIs (i.e. NDVI, MTCI) and colorindices were in accordance during late spring and early summer(DOY 150–200 in Fig. 5d); although in 2010 both NDVI and MTCIwere higher than color indices. In late summer and autumn 2009and 2010 (around DOY 200–280), MTCI and color indices were againin agreement, although GI was more sensitive to the second green-up in 2009 and also noisier than MTCI. In autumn 2009, sPRI showedan increase that highlighted an increase of photosynthetic activity.NDVI decreased more slowly than color indices and than other VIs.
In springtime we observed measurable photosynthetic CO2uptake at DOY 150, immediately after snowmelt (Fig. 5c). In bothyears springtime increases in GPP started synchronous with GI
photography and eddy covariance data to model grassland phenology6/j.agrformet.2011.05.012
(Fig. 5e), but afterwards GPP tended to lead changes in canopygreenness (GI). During late summer/autumn, canopy developmentand functioning showed similar responses to meteorological con-ditions before DOY 250. The increase in GI occurred in autumn 2009

ARTICLE IN PRESSG Model
AGMET-4433; No. of Pages 13
8 M. Migliavacca et al. / Agricultural and Forest Meteorology xxx (2011) xxx– xxx
Fig. 5. (a) Time series of observed mean daily air temperature (TAir). (b) Time series of precipitation and soil water content (SWC) at 10 cm. (c) Time series of daily cumulatedgross primary production (GPP). (d) Time series of smoothed Greenness Index (GI) – solid line – Greenness Excess Index (GEI) – dashed line – derived from digital camerai strialR ontinuG ). The
rsii
tiw
TCeIsNC
model selected by AIC was the GSISWC+SNOW+Ph. The GSISWC+SNOW
magery. Normalized Difference Vegetation Index (NDVI) – crosses – MERIS Terreeflectance Index (sPRI) – grey line – computed from spectral signatures collected creenness Index (GI) – solid line – and Gross Primary Production (GPP) – crosses (e
eflected a weaker but detectable increase in GPP (Fig. 5e) in corre-pondence to a rain pulse (DOY 260–270) and a subsequent increasen SWC (Fig. 5b). Finally, after DOY 306 the snow covered the canopyn both years.
Correlations between spectral VIs (computed from HSI spec-ra), GPP and color indices are reported in the correlation matrix
Please cite this article in press as: Migliavacca, M., et al., Using digital repeatand photosynthetic CO2 uptake. Agric. Forest Meteorol. (2011), doi:10.101
n Table 3. MTCI and color indices are strongly correlated (r = 0.82ith GI) while NDVI is less correlated (r = 0.69 with GI).
able 3orrelation matrix between color indices derived from digital camera imagery, veg-tation indices computed from spectral signatures collected with the Hyperspectralrradiometer (HSI) and midday Gross Primary Production (GPP). All correlations areignificant (p < 0.01). GI is the Greenness Index; GEI is the Greenness Excess Index;DVI is the Normalized Difference Vegetation Index; MTCI is the MERIS Terrestrialhlorophyll Index.
NDVI MTCI GI GEI GPP
NDVI 1 0.87 0.69 0.67 0.83MTCI 1 0.82 0.80 0.95GI 1 0.99 0.79GEI 1 0.78GPP 1
Chlorophyll Index (MTCI) – dotted and dashed line – and scaled Photochemicalously in the field by the Hyperspectral Irradiometer (HSI). Time series of smoothed
left panel represents 2009 while the right panel is the 2010 growing season.
3.2. The GSI model
The statistics for the different formulations of the GSI model fit-ted against the time series of daily GI are reported in Table 4. Despitehigher complexity (i.e. a larger number of parameters), the best
photography and eddy covariance data to model grassland phenology6/j.agrformet.2011.05.012
showed a performance comparable to the best model, while the
Table 4Fitting statistics of the different formulations of Growing Season Index (GSI) model(Table1). MEF is the modeling efficiency, RMSE is the root mean square error, r2 isthe determination coefficient, dAIC is the difference between the Akaike Informa-tion Criterion (AIC) computed for the model and the minimum AIC across models(i.e. dAIC of 0 represents the best model formulation). p is the number of modelparameters. ‘GSISWC+SNOW+Ph’ (please see description in Section 2.6.1) is the bestmodel according to the AIC criterion, the parameters estimated are: Tmmin = −5.66 ◦C,Tmmax = 7.24 ◦C, Phmin = 6.8 h, Phmax = 14.71 h, �1 = 8.92 and �2 = 0.69.
Model r2 MEF RMSE dAIC P
GSI 0.6 0.55 0.20 315.28 6GSISNOW 0.59 0.59 0.18 200.85 6GSIPh+SNOW 0.82 0.80 0.13 42.95 8GSISWC+SNOW 0.80 0.79 0.14 52.85 6GSISWC+SNOW+Ph 0.86 0.84 0.12 0 8

ARTICLE IN PRESSG Model
AGMET-4433; No. of Pages 13
M. Migliavacca et al. / Agricultural and Forest Meteorology xxx (2011) xxx– xxx 9
Fig. 6. The seasonal index values for minimum temperature f(TMIN), soil water content f(SWC), snow f(SNOW) and day length (photoperiod, f(Ph)) showing the seasonal limitsof each variable. Indices are presented as a 21-day running average to better depict seasonal trends. The white area represents the Growing Season Index (GSI) while crossesrepresent the Greenness Index (GI) derived from digital camera imagery. The green areas represent the relative importance of temperature as limiting factor, the grey areasr ue toc g seasr
om
TFaiDta
3
ews
aaE
bsppssts
4
4
fgaaia
climatic drivers.As was found by other authors, we observed a strong control of
snowfall and snowmelt on phenology (Jonas et al., 2008; Ellebjerg
Table 5Summary of statistics in fitting (determination coefficient, r2, root mean squareerror, RMSE, and Akaike Information Criterion, AIC) of different models tested inthis study.GI is the Greenness Index; NDVI is the Normalized Difference VegetationIndex; MTCI is the MERIS Terrestrial Chlorophyll Index (MTCI); sPRI is the scaledPhotochemical Reflected Index; RUEMAX is the maximum Radiation Use Efficiency.Model set PV assumed that GPP can be estimated with constant RUE and deriv-ing absorbed photosynthetically active radiation (APAR) as the product of incidentPAR and a linear function of vegetation indices related to the biomass and photo-synthetic pigments (i.e. GI, NDVI, MTCI). The model set E assumed that GPP can beestimated by deriving both the APAR and RUE directly from remotely sensed data.The best-performing models of PV and E set are in bold print. MOD17 represents thealgorithm of the MODIS photosynthesis product (MOD17).
Modelset
Driver r2 RMSE(gCm−2 d−1)
AIC
fAPAR RUE
PV GI 0.54 3.01 592.2NDVI 0.47 3.22 628.1MTCI 0.58 2.85 563.2
E GI sPRI 0.57 2.90 576.4
epresent the limitation due to presence of snow, the orange areas the limitation donditions. The left panel represents 2009 while the right panel is the 2010 growineferred to the web version of the article.)
riginal formulation and the GSISNOW showed a poorer perfor-ance. The time series of GSISWC+SNOW+Ph is reported in Fig. 6.Individual daily color index values of the relative influence for
MIN, SWC, day length and snow for 2009 and 2010 are shown inig. 6. During spring, snow (grey area) and temperatures (greenrea) were the primary limiting factors while day length was moremportant in 2010 when the snow-melt occurred before (aroundOY 140). Autumn phenology was driven by soil water availability,
emperature and photoperiod in 2009 while in 2010 water avail-bility was not a limiting factor.
.3. Performance of RUE models
Results of the statistical analysis of the performance of the differ-nt RUE models showed that color indices (i.e. GI), when combinedith meteorology or remotely sensed estimation of RUE can be
uccessfully used for the description of the GPP (Table 5).The MOD17 model results showed that by using meteorology
nd color indices it was possible to describe the temporal vari-bility of daily GPP quite well (RMSE = 0.87 gC m−2 d−1; r2 = 0.87;F = 0.85).
Overall, results of model set E (i.e., RUE described by sPRI) wereetter than those obtained with model set PV (i.e., RUE is con-tant and GPP is dependent only on VIs related to the presence ofhotosynthetic material). Results show an improvement in modelerformances on adding the sPRI, and thus a term related to photo-ynthetic efficiency, to models driven only by VIs related to canopytructure. According to AIC, the model that used MTCI and sPRI washe best descriptor of daily GPP among the models based on thepectral VIs.
. Discussion
.1. Seasonal variations of canopy phenology
This study shows that digital camera imagery are well-suitedor monitoring the development and phenology of a subalpinerassland. Color indices derived from these images provide reli-
Please cite this article in press as: Migliavacca, M., et al., Using digital repeatand photosynthetic CO2 uptake. Agric. Forest Meteorol. (2011), doi:10.101
ble information on canopy status with daily temporal resolutionnd offer the possibility of continuous and unattended monitor-ng of timing and rate of canopy development. These achievementsre not feasible with traditional phenological observations in such
day length while the red area the limitation due to suboptimal soil water contenton. (For interpretation of the references to color in this figure legend, the reader is
ecosystems, often located in remote areas. This is particularly inter-esting considering also the current rapid development of webcamsand digital cameras, the development of new promising method-ologies for monitoring phenology (e.g. Ryu et al., 2010) as well asthe development and refining of image processing techniques (e.g.Sonnentag et al., 2011).
Moreover, with digital camera imagery we obtained an inte-grated indicator of canopy development, which is difficult to obtainwith traditional phenological campaigns because of the high biodi-versity of subalpine grasslands and because the definition of a fieldprotocol for plant phenology is not inconsequential.
The ecosystem studied is an interesting test-case for pheno-logical and productivity models because of the fast dynamics ofgreening, carbon fluxes and physiological activity in response to
photography and eddy covariance data to model grassland phenology6/j.agrformet.2011.05.012
NDVI sPRI 0.59 2.82 561.5MTCI sPRI 0.60 2.80 557.8
MOD17 GI Meteorology,RUEMAX
0.88 0.87 −73.40

ING Model
A
1 nd For
ettcsapivftc
acpw2tvttli
dolt(ws
nbtdrvrutrdiaitabs
deoio
4m
ttlc
ARTICLEGMET-4433; No. of Pages 13
0 M. Migliavacca et al. / Agricultural a
t al., 2008): once snow disappeared the canopy suddenly startedo sequester carbon and to green-up. The lag observed betweenhese two processes (GPP led GI) was related to the pattern ofanopy green-up: matgrass, which is the dominant graminaceouspecies at the site, starts to green-up from the bottom, below the drynd brown dead biomass of the previous year, thus not completelyerceptible by the camera low view angle. Color indices track the
ncrease in canopy greenness only when green starts to be moreisible from above. The result of this mechanism was a delay of aew days (6–7 days) between GPP and GI which may have an impor-ant influence on the extraction of phenological metrics from theolor indices signal.
In 2009, during late summer–autumn, when senescence mech-nisms were already active and the canopy was yellowing, twolimatic events were observed: a warm week associated with lowrecipitation first (DOY 225–235) and a rain pulse associated witharmer temperature in late September (Fig. 5a and b from DOY
70). These peculiar conditions allow us to highlight the poten-ial usefulness of digital repeat photography in tracking weeklyariations in canopy greenness (Fig. 5d). In fact, the analysis ofime courses of color indices showed a rebound of GI that followedhe rain pulse and the stimulation of photosynthetic activity high-ighted by the concomitant increase in GPP and a more pronouncedncrease in sPRI.
Conversely to spring, in autumn we observed a more rapidecrease in color indices than in GPP. During senescence webserved an increase in dry (and yellow) matter on the top canopyayer which led to a reduction in color indices. However, duringhis phase there was photosynthetically active vegetation materiali.e. green biomass mainly localized on the bottom of the canopy)hich maintained photosynthetic activity as detected by GPP and
PRI.The effect of the rain pulse in autumn 2009 was to cause a pro-
ounced greening of the canopy detected by the color indices andy MTCI but not by NDVI. In both years autumn MTCI reacts fasterhan NDVI to variations in chlorophyll content and green biomassue to the fact that the MTCI index is based on wavelengths in theed-edge region which is more sensitive to chlorophyll and greenariations (Dash and Curran, 2004). NDVI instead is by far moreelated to structure, LAI and total biomass. Therefore, NDVI val-es during autumn were less dynamic and decreased more slowlyhan MTCI and color indices. NDVI was less able to follow the rapidesponse of green vegetation and, contrary to MTCI and GI in 2009,id not show any sign of rebound after the rain pulse. The sPRI
nstead showed a clear rebound in autumn in 2009, thus indicatingn increase in RUE as a consequence of the improved meteorolog-cal conditions. In fact, sPRI is able to track the interconversion ofhe xanthophyll cycle pigments in intact leaves (Gamon et al., 1992)nd it is increasingly used to assess photosynthetic rates and RUEoth at leaf (Gamon et al., 2006; Meroni et al., 2008) and canopycale (Garbulsky et al., 2008; Hilker et al., 2007, 2010).
Jacobs et al. (2009) have shown how a distributed network ofigital cameras might be used for phenological monitoring andvaluation of satellite phenological products; our results expandn this work by demonstrating strong correlations between colorndices and both the radiometric properties and biological activityf the surface vegetation.
.2. Using color indices for improving phenological and GPPodeling
The GSI proposed by Jolly et al. (2005) was reformulated for
Please cite this article in press as: Migliavacca, M., et al., Using digital repeatand photosynthetic CO2 uptake. Agric. Forest Meteorol. (2011), doi:10.101
he application to alpine grasslands. The best model selected byhe AIC was the one including the occurrence of snow, SWC, dayength and minimum temperature as ecological factors controllinganopy development. The accuracy of the models including the VPD
PRESSest Meteorology xxx (2011) xxx– xxx
and SWC as driver of water availability was almost comparable (i.e.GSIPh+SNOW and GSISWC+SNOW+Ph in Table 4). Although the use ofSWC is suggested, this result allowed the use of VPD as a surrogatefor water availability, as also suggested by Jolly et al. (2005) with themain advantage that VPD is easily computable from temperaturefor the spatial application of the model.
The main environmental cues controlling the grasslands phe-nology were snow-melting and temperature during spring with asecondary role of day length. Autumn phenology was the resultof the combined effect of cold temperatures and decreasing daylength (Fig. 6). However, in 2009, the drier year, water availabil-ity played an important role in controlling summer and autumnalcanopy development (red area in Fig. 6).
For spring these results are in agreement with other field studieswhich show that alpine grasslands are primarily limited by tem-perature and the date of snowmelt (e.g. Larl and Wagner, 2006).During spring we also observed a not negligible role of day length,particularly relevant in 2010 when the snow disappeared earlier inthe season. This finding is supported by Keller and Korner (2003)who suggested that several alpine species of grasses are sensi-tive to photoperiod and may not be able to fully utilize periodsof earlier snowmelt. This leads to a rearrangement of communitycomposition in response to warmer and earlier snow-melt (Kellerand Korner, 2003). On the basis of our results we then supportthe hypothesis that any attempts at predicting or modeling futuresubalpine grass phenology based on warming scenarios needs toaccount for photoperiod constraints. However, we suggest furtheranalyses to reinforce our results, bearing in mind that they arebased on two years of data from a single site.
In terms of model development, we believe that the dates ofsnow melting in spring and snowfall in autumn have to be includedas additional drivers of phenological models for grasslands. In fact,the sole use of photoperiod, as in the original model formulationand in many phenological models, leads to poor performance andan unsatisfactory description of the phenological cycle. For spatialapplications the dates of snow presence and snow-melt might bederived from satellite data through the use of the MODIS snow-cover product (Hall et al., 2002).
The analysis conducted with RUE models highlighted that GPPcan be modeled by combining color indices with meteorologi-cal data or spectral VIs related to photosynthetic efficiency. Thecolor indices were strongly related to GPP in spring when vari-ations in photosynthetic rates were largely driven by phenology.Later in the season, the inclusion of predictors of radiation use effi-ciency was necessary for the description of carbon uptake. For thesereasons, although more complex, models including meteorologyor sPRI were selected according to the AIC criterion. Consideringthe models of the class PV, a better description of the GPP wasobserved using the MTCI and GI rather than the NDVI. This canbe explained by the close relation between MTCI and GI and greenbiomass (Table 2), which controls the energy absorbed by photo-synthetic pigments and thus effectively used for photosyntheticprocesses.
We demonstrate (Fig. 6 and Table 5) that color indices arehighly valuable for developing and testing RUE models aimed atthe description of GPP and phenological models for the descrip-tion of the canopy development. These findings point towards amore generic application of the methodology that exploits thetime series of color indices collected by the PhenoCam Network(http://klima.sr.unh.edu/). The combination of color indices col-lected by the network over different biomes and phenologicalmodels might help to gain insights into the description of seasonal
photography and eddy covariance data to model grassland phenology6/j.agrformet.2011.05.012
canopy development. The main implication is the improvementof the poor representation of phenology in process-based or landsurface models that might lead to erroneous estimation of carbonfluxes (Kucharik et al., 2006; Migliavacca et al., 2009; Ryu et al.,

ING Model
A
nd For
22
4
vqpt
ntSI
(biaompcooA(wfimo
oivttawtahom
gtpisvtbtsapfrtud
ii
ARTICLEGMET-4433; No. of Pages 13
M. Migliavacca et al. / Agricultural a
008) and biosphere-atmosphere interactions (Abramowitz et al.,008).
.3. Uncertainty and limitations in using digital camera imagery
Building on previous work that has demonstrated that seasonalariation in the structure and function of plant canopies can beuantified using digital camera imagery, we have highlighted theotential use of these data for the development and parameteriza-ion of phenological and RUE models
Nevertheless, some limitations and uncertainties still exist andeed to be addressed in order to improve the reliability of theime series of vegetation status derived by RGB color indices (e.g.onnentag et al., 2011; Bradley et al., 2010; Richardson et al., 2009;de and Oguma, 2010; Ahrends et al., 2008).
These limitations are mainly related to the image quality issuee.g. digital camera used and experimental set-up), as highlightedy Sonnentag et al. (2011), and to the post processing of color
ndices (e.g. filtering to minimize variation due to solar elevationnd zenith angle, as well as atmospheric conditions). A comparisonf the phenological information extracted from different com-ercial digital cameras installed over the same ecosystem could
rovide important information about the importance of camerahoice (Sonnentag et al., 2010). Moreover, Ide and Oguma (2010)bserved firstly a year-to-year drift in color balance and sec-ndly that color balance differed between camera manufacturers.s highlighted by Richardson et al. (2009) and Ide and Oguma
2010), noise in color indices values are due mainly to exposure andeather conditions and can be diminished by setting cameras toxed white balance rather than to auto white balance. The develop-ent of calibration protocols and standards to ensure congruence
f long-term data sets from multiple sites is essential.Another source of uncertainty is related to the post-processing
f color indices time series. Different methods for filtering colorndices time series, removing questionable daily values due to unfa-orable meteorological conditions, might introduce uncertainty forraceability of the canopy seasonal variation and for the extrac-ion of robust phenological metrics (e.g. green-up dates). Here wepplied an approach based on a simple outlier removal that workedell at this site. However, in literature other methods ranging from
he visual inspection (Ahrends et al., 2008) to the use statisticalnalysis of pixel brightness or sky color (e.g. Ide and Oguma, 2010),ave been proposed. Future efforts should be focused on the devel-pment of robust and widely applicable filtering and gap-fillingethods (e.g. Sonnentag et al., 2010).Finally, Richardson et al. (2009) and Ide and Oguma (2010) sug-
ested the use of a grey reference panel placed in the corner ofhe image for the normalization. Here, we mounted a vertical greyanel and we used the ROI extracted from the grey panel for assess-
ng the overall quality of the retrieved signal and the day-by-daytability of the imagery color balance. However, for the use of theertical panel for normalization purposes, the different illumina-ion and viewing geometries of canopy and reference panel shoulde taken into account. This is particularly important over horizon-al canopies such as grasslands. In these conditions the differentun-target-sensor and sun-panel-sensor geometries may introducen additional source of uncertainty and the use of a normalizationanel with the same viewing geometry of the target would be pre-erred. Sonnentag et al. (2011) proposed a promising approach toeconstruct hypothetical horizontal RGB reference that might helpo overcome such limitation. Future efforts should be addressed innderstanding the correct experimental set-up of the panel over
Please cite this article in press as: Migliavacca, M., et al., Using digital repeatand photosynthetic CO2 uptake. Agric. Forest Meteorol. (2011), doi:10.101
ifferent ecosystems and, in particular, over horizontal canopies.These uncertainties need to be considered, and minimized, to
mprove long-term phenological monitoring with RGB cameramagery. We showed that color indices can be used to constrain
PRESSest Meteorology xxx (2011) xxx– xxx 11
models of canopy phenology and functioning. However, the useof these indices for the analysis of interannual variability (e.g.Sonnentag et al., 2011) and spatial variability (i.e. across site) ofcanopy structure is still challenging and future efforts should befocused to overcome the uncertainties and limitations discussedabove.
5. Summary
The present study shows that digital repeat photography pro-vide reliable information on canopy greenness with a high temporalresolution and can be considered as a useful and relatively low-costtool for monitoring canopy development of subalpine grasslands.
We show that by combining color indices with a refined phe-nological model able to describe canopy development (GSI) itis possible to identify the main ecological factors controllingsubalpine grassland phenology. The main environmental cuesidentified were snow-melt and temperature during spring whileautumn phenology was found to be driven by temperatures, daylength and water availability during the drier years. During springwe also observed a significant role of day length particularly rele-vant when snow-melt occurred earlier (i.e. 2010). This suggests thatany attempt at predicting or modeling future alpine plant phenol-ogy based on warming scenarios needs to account for photoperiodas additional constraints.
We show that by combining information derived by colorindices and meteorological or remotely-sensed information relatedto photosynthetic efficiency in radiation use efficiency (RUE)scheme it is possible to describe well the temporal variability ofcarbon uptake.
We conclude that digital camera imagery can provide impor-tant information at site level to gain insights into the descriptionof the seasonal canopy development. Digital camera imagery canbe consider as a promising tool for testing different models anddifferent hypotheses on the main ecological factors controlling phe-nology and canopy functioning. However, further work is necessaryto overcome limitations related to the image quality issue and pro-cessing. In fact, while digital camera imagery are very useful formonitoring the seasonal development of the canopy greenness, alot uncertainty still exists concerning the use of color indices formonitoring the interannual variability of canopy structural param-eters and future efforts should be focused to address this issue.
Acknowledgments
This work was supported by the PhenoALP project, an Inter-reg project co-funded by the European Regional DevelopmentFund, under the operational program for territorial cooperationItaly–France (ALCOTRA) 2007–2013. MM acknowledges the Uni-versity of Milano-Bicocca who supported the visiting scientistperiod at the Harvard University (OEB Department). ADR acknowl-edges support from the Northeastern States Research Cooperative.We thank the anonymous reviewers for their constructive com-ments that substantially improved the manuscript. The authorsacknowledge Jasper Bloemen for the relevant comments duringwriting and data analysis; Sara D’Alessandro, Michele Lonati, Gio-vanni Pavia, Martina Petey, Paolo Pogliotti and Emily Solly for thesupport during field campaigns.
References
Abramowitz, G., Leuning, R., Clark, M., Pitman, A., 2008. Evaluating the performance
photography and eddy covariance data to model grassland phenology6/j.agrformet.2011.05.012
of land surface models. Journal of Climate 21 (21), 5468–5481.Ahrends, H.E., Brugger, R., Stockli, R., Schenk, J., Michna, P., Jeanneret, F., Wanner,
H., Eugster, W., 2008. Quantitative phenological observations of a mixed beechforest in northern Switzerland with digital photography. Journal of GeophysicalResearch: Biogeosciences 113, G4.
ING Model
A
1 nd For
A
A
A
A
A
B
B
B
B
B
C
C
C
C
D
E
F
F
F
G
G
G
G
G
G
G
G
H
ARTICLEGMET-4433; No. of Pages 13
2 M. Migliavacca et al. / Agricultural a
hrends, H.E., Etzold, S., Kutsch, W.L., Stoeckli, R., Bruegger, R., Jeanneret, F., Wanner,H., Buchmann, N., Eugster, W., 2009. Tree phenology and carbon dioxide fluxes:use of digital photography at for process-based interpretation the ecosystemscale. Climate Research 39 (3), 261–274.
kaike, H., 1973. Information theory and an extension of the maximum likelihoodprinciple. In: Petrov, B.N., Csaki, F. (Eds.), Proceedings of the Second InternationalSymposium on Information Theory. Akademiai Kiado, Budapest, pp. 267–281(Reproduced in Kotz, S., Johnson, N.L., 2003. Breakthroughs in Statistics, vol. I,Foundations and Basic Theory. Springer-Verlag, New York, pp. 610–624).
rora, V.K., Boer, G.J., 2005. A parameterization of leaf phenology for the terrestrialecosystem component of climate models. Global Change Biology 11 (1), 39–59.
ubinet, M., Grelle, A., Ibrom, A., Rannik, U., Moncrieff, J., Foken, T., Kowalski, A.S.,Martin, P.H., Berbigier, P., Bernhofer, C., Clement, R., Elbers, J., Granier, A., Grun-wald, T., Morgenstern, K., Pilegaard, K., Rebmann, C., Snijders, W., Valentini,R., Vesala, T., 2000. Estimates of the annual net carbon and water exchange offorests: the EUROFLUX methodology. Advances in Ecological Research 30 (30),113–175.
ubinet, M., Chermanne, B., Vandenhaute, M., Longdoz, B., Yernaux, M., Laitat, E.,2001. Long term carbon dioxide exchange above a mixed forest in the BelgianArdennes. Agricultural and Forest Meteorology 108 (4), 293–315.
aldocchi, D, Valentini, R., Running, S., Oechel, W., Dahlman, R., 1996. Strategies formeasuring and modelling carbon dioxide and water vapour fluxes over terres-trial ecosystems. Global Change Biology 2 (3), 159–168.
eniston, M., 2005. Mountain climates and climatic change: an overview of pro-cesses focusing on the European Alps. Pure and Applied Geophysics 162 (8–9),1587–1606.
radley, B.A, Jacob, R.W., Hermance, J.F., Mustard, J.F., 2007. A curve fitting procedureto derive inter-annual phenologies from time series of noisy satellite NDVI data.Remote Sensing of Environment 106 (2), 137–145.
radley, E., Roberts, D., Still, C., 2010. Design of an image analysis website for pheno-logical and meteorological monitoring. Environmental Modelling and Software25 (1), 107–116.
usetto, L., Colombo, R., Migliavacca, M., Cremonese, E., Meroni, M., Galvagno, M.,Rossini, M., Siniscalco, C., Morra Di Cella, U., Pari, E., 2010. Remote sensing oflarch phenological cycle and analysis of relationships with climate in the Alpineregion. Global Change Biology 16 (9), 2504–2517.
ernusca, A., Bahn, M., Berninger, F., Tappeiner, U., Wohlfahrt, G., 2008. Effects ofland-use changes on sources, sinks and fluxes of carbon in European MountainGrasslands: preface. Ecosystems 11 (8), 1335–1337.
hen, J.M., Li, X., Nilsonn, T., Strahler, A., 2000. Recent advances in geometrical opticalmodelling and its applications. Remote Sensing Review 18, 227–262.
holer, P., Sea, W., Briggs, P., Raupach, M., Leuning, R., 2010. A simple ecohydrolog-ical model captures essentials of seasonal leaf dynamics in semi-arid tropicalgrasslands. Biogeosciences 7 (3), 907–920.
huine, I., Yiou, P., Viovy, N., Seguin, B., Daux, V., Ladurie, E.L., 2004. Historical phe-nology: grape ripening as a past climate indicator. Nature 432 (7015), 289–290.
ash, J., Curran, P.J., 2004. The MERIS terrestrial chlorophyll index. InternationalJournal of Remote Sensing 25 (23), 5403–5413.
llebjerg, S.M., Tamstorf, M.P., Illeris, L., Michelsen, A., Hansen, B.U., 2008.Inter-annual variability and controls of plant phenology and productivity atZackenberg. In: Advances in Ecological Research. Academic Press, pp. 249–273.
oken, T., Wichura, B., 1996. Tools for quality assessment of surface-based flux mea-surements. Agricultural and Forest Meteorology 78 (1–2), 83–105.
ontana, F, Rixen, C., Jonas, T., Aberegg, G., Wunderle, S., 2008. Alpine grasslandphenology as seen in AVHRR, VEGETATION, and MODIS NDVI time series – acomparison with in situ measurements. Sensors 8 (4), 2833–2853.
onti, P., von Arx, G., Garcia-Gonzalez, I., Eilmann, B., Sass-Klaassen, U., Gartner, H.,Eckstein, D., 2010. Studying global change through investigation of the plasticresponses of xylem anatomy in tree rings. New Phytologist 185 (1), 42–53.
amon, J.A., Penuelas, J., Field, C.B., 1992. A narrow-waveband spectral index thattracks diurnal changes in photosynthetic efficiency. Remote Sensing of Environ-ment 41 (1), 35–44.
amon, J.A., Rahman, A.F., Dungan, J.L., Schildhauer, M., Huemmrich, K.F., 2006. Spec-tral Network (SpecNet) – what is it and why do we need it? Remote Sensing ofEnvironment 103 (3), 227–235.
amon, J.A., Serrano, L., Surfus, J.S., 1997. The photochemical reflectance index:an optical indicator of photosynthetic radiation use efficiency across species,functional types, and nutrient levels. Oecologia 112 (4), 492–501.
arbulsky, M.F., Penuelas, J., Papale, D., Filella, I., 2008. Remote estimation of car-bon dioxide uptake by a Mediterranean forest. Global Change Biology 14 (12),2860–2867.
arrity, S.R., Vierling, L.A., Bickford, K., 2010. A simple filtered photodiode instru-ment for continuous measurement of narrowband NDVI and PRI over vegetatedcanopies. Agricultural and Forest Meteorology 150 (3), 489–496.
illespie, A.R, Kahle, A.B., Walter, R.E., 1987. Color enhancement of highly correlatedimages. II. Channel ratio and “chromaticity” transformation techniques. RemoteSensing of Environment 22, 343–365.
raham, E.A., Riordan, E.C., Yuen, E.M., Estrin, D., Rundel, P.W., 2010. Public Internet-connected cameras used as a cross-continental ground-based plant phenologymonitoring system. Global Change Biology 16 (11), 3014–3023.
RASS Development Team, 2008. Geographic Resources Analysis Support System
Please cite this article in press as: Migliavacca, M., et al., Using digital repeatand photosynthetic CO2 uptake. Agric. Forest Meteorol. (2011), doi:10.101
(GRASS) Software. Open Source Geospatial Foundation Project. GRASS Develop-ment Team, http://grass.osgeo.org.
all, D.K., Riggs, G.A., Salomonson, V.V., Di Girolamo, N.E., Bayr, K.J., 2002. MODISsnow-cover products. Remote Sensing of Environment 83, 181–194.
PRESSest Meteorology xxx (2011) xxx– xxx
Heinsch, F.A., Zhao, M.S., Running, S.W., Kimball, J.S., Nemani, R.R., Davis, K.J., Bol-stad, P.V., Cook, B.D., Desai, A.R., Ricciuto, D.M., Law, B.E., Oechel, W.C., Kwon, H.,Luo, H.Y., Wofsy, S.C., Dunn, A.L., Munger, J.W., Baldocchi, D.D., Xu, L.K., Hollinger,D.Y., Richardson, A.D., Stoy, P.C., Siqueira, M.B.S., Monson, R.K., Burns, S.P., Flana-gan, L.B., 2006. Evaluation of remote sensing based terrestrial productivity fromMODIS using regional tower eddy flux network observations. IEEE Transactionson Geoscience and Remote Sensing 44 (7), 1908–1925.
Hilker, T., Coops, N.C., Nesic, Z., Wulder, M.A., Black, A.T., 2007. Instrumentationand approach for unattended year round tower based measurements of spectralreflectance. Computers and Electronics in Agriculture 56 (1), 72–84.
Hilker, T, Hall, F.G., Coops, N.C., Lyapustin, A., Wang, Y., Nesic, Z., Grant, N., Black,T.A., Wulder, M.A., Kljun, N., Hopkinson, C., Chasmer, L., 2010. Remote sensing ofphotosynthetic light-use efficiency across two forested biomes: spatial scaling.Remote Sensing of Environment 114 (12), 2863–2874.
Hofierka, J., Suri, M., 2002. The solar radiation model for Open source GIS: implemen-tation and application. In: Ciolli, M., Zatelli, P. (Eds.), Open Source Free SoftwareGISS – GRASS Users Conference.
Ide, R., Oguma, H., 2010. Use of digital cameras for phenological observations. Eco-logical Informatics 5 (5), 339–347.
IPCC, 2007. Climate Change 2007: synthesis report. IPCC, Geneva, Switzerland.Jacobs, N., Burgin, W., Fridrich, N., Abrams, A., Miskell, K., Braswell, B.H., Richardson,
A.D., Pless, P., 2009. The Global Network of Outdoor Webcams: Properties andApplications. In: ACM GIS’09 , Seattle, WA, USA.
Janssen, P.H.M., Heuberger, P.S.C., 1995. Calibration of process-oriented models.Ecological Modelling 83 (1–2), 55–66.
Jolly, W.M., Nemani, R., Running, S.W., 2005. A generalized, bioclimatic index topredict foliar phenology in response to climate. Global Change Biology 11 (4),619–632.
Jonas, T., Rixen, C., Sturm, M., Stoeckli, V., 2008. How alpine plant growth is linkedto snow cover and climate variability. Journal of Geophysical Research: Biogeo-sciences 113, G3.
Keller, F., Korner, C., 2003. The role of photoperiodism in alpine plant development.Arctic, Antarctic, and Alpine Research 35 (3), 361–368.
Knorr, W., Kaminski, T., Scholze, M., Gobron, N., Pinty, B., Giering, R., Mathieu, P.P.,2010. Carbon cycle data assimilation with a generic phenology model. Journalof Geophysical Research G: Biogeosciences 115, G04017.
Körner, C., 2005. The green cover of mountains in a changing environment. In:Huber, U.M., Bugmann, H., M, R. (Eds.), Global Change and Mountain Regions.An Overview of Current Knowledge. Springer, Berlin.
Kucharik, C.J., Barford, C.C., El Maayar, M., Wofsy, S.C., Monson, R.K., Baldocchi,D.D., 2006. A multiyear evaluation of a Dynamic Global Vegetation Modelat three AmeriFlux forest sites: vegetation structure, phenology, soil tem-perature, and CO2 and H2O vapor exchange. Ecological Modelling 196 (1–2),1–31.
Kurc, S.A., Benton, L.M., 2010. Digital image-derived greenness links deep soil mois-ture to carbon uptake in a creosotebush-dominated shrubland. Journal of AridEnvironments 74 (5), 585–594.
Larl, I., Wagner, J., 2006. Timing of reproductive and vegetative development inSaxifraga oppositifolia in an alpine and a subnival climate. Plant Biology 8 (1),155–166.
Lieth, H.H., 1976. Contributions to phenology seasonality research. InternationalJournal of Biometeorology 20 (3), 197–199.
Mauder, M., Foken, T., 2004. Documentation and instruction manual of the eddycovariance software package TK2. Work Report University of Bayreuth, Dept. ofMicrometeorology, 44, 26, ISSN: 1614-8916.
Marcolla, B., Cescatti, A., 2005. Experimental analysis of flux footprint for varyingstability conditions in an alpine meadow. Agricultural and Forest Meteorology135 (1–4), 291–301.
Meroni, M., Barducci, A., Cogliati, S., Castagnoli, F., Rossini, M., Busetto, L.,Migliavacca, M., Cremonese, E., Galvagno, M., Colombo, R., 2011. The Hyper-Spectral Irradiometer HSI, a new instrument for long-term and unattendedfield spectroscopy measurements. Review of Scientific Instruments 82 (4),043106–043115.
Meroni, M., Colombo, R., 2009. 3S: a novel program for field spectroscopy. Computers& Geosciences 35, 1491–1496.
Meroni, M., Picchi, V., Rossini, M., Cogliati, S., Panigada, C., Nali, C., Lorenzini, G.,Colombo, R., 2008. Leaf level early assessment of ozone injuries by passive fluo-rescence and PRI. International Journal of Remote Sensing 29 (17), 5409–5422.
Migliavacca, M., Cremonese, E., Colombo, R., Busetto, L., Galvagno, M., Ganis, L.,Meroni, M., Pari, E., Rossini, M., Siniscalco, C., di Cella, U.M., 2008. Europeanlarch phenology in the Alps: can we grasp the role of ecological factors bycombining field observations and inverse modelling? International Journal ofBiometeorology 52 (7), 587–605.
Migliavacca, M., Meroni, M., Busetto, L., Colombo, R., Zenone, T., Matteucci, G., Manca,G., Seufert, G., 2009. Modeling gross primary production of agro-forestry ecosys-tems by assimilation of satellite-derived information in a process-based model.Sensors 9 (2), 922–942.
Monteith, J.L., Unsworth, M.H., 1990. Principles of environmental physics, 2nd ed.Edward Arnold, London, United Kingdom, p. 291.
Moser, L., Fonti, P., Buntgen, U., Esper, J., Luterbacher, J., Franzen, J., Frank, D., 2010.Timing and duration of European larch growing season along altitudinal gradi-
photography and eddy covariance data to model grassland phenology6/j.agrformet.2011.05.012
ents in the Swiss Alps. Tree Physiology 30 (2), 225–233.Motta, R., Nola, P., 2001. Growth trends and dynamics in sub-alpine forest stands in
the Varaita Valley (Piedmont, Italy) and their relationships with human activitiesand global change. Journal of Vegetation Science 12 (2), 219–230.

ING Model
A
nd For
N
P
P
P
R
R
R
R
R
R
R
R
R
ARTICLEGMET-4433; No. of Pages 13
M. Migliavacca et al. / Agricultural a
agai, S., Nasahara, K.N., Muraoka, H., Akiyama, T., Tsuchida, S., 2010. Field exper-iments to test the use of the normalized-difference vegetation index forphenology detection. Agricultural and Forest Meteorology 150 (2), 152–160.
apale, D, Reichstein, M., Aubinet, M., Canfora, E., Bernhofer, C., Kutsch, W., Longdoz,B., Rambal, S., Valentini, R., Vesala, T., Yakir, D., 2006. Towards a standardizedprocessing of Net Ecosystem Exchange measured with eddy covariance tech-nique: algorithms and uncertainty estimation. Biogeosciences 3 (4), 571–583.
enuelas, J., Rutishauser, T., Filella, I., 2009. Phenology Feedbacks on Climate Change.Science 324 (5929), 887–888.
iao, S., Ciais, P., Friedlingstein, P., Peylin, P., Reichstein, M., Luyssaert, S., Margolis,H., Fang, J., Barr, A., Chen, A., Grelle, A., Hollinger, D.Y., Laurila, T., Lindroth, A.,Richardson, A.D., Vesala, T., 2008. Net carbon dioxide losses of northern ecosys-tems in response to autumn warming. Nature 451 (7174), 49–52.
Development Core Team, 2009. R: A Language and Environment for StatisticalComputing. R Foundation for Statistical Computing, Vienna, ISBN: 3-900051-07-0, http://www.R-project.org.
ahman, A.F., Gamon, J.A., Fuentes, D.A., Roberts, D.A., Prentiss, D., 2001. Modelingspatially distributed ecosystem flux of boreal forest using hyperspectral indicesfrom AVIRIS imagery. J. Geophys. Res. 106 (D24), 33579–33591.
ammig, A., Jonas, T., Zimmermann, N.E., Rixen, C., 2010. Changes in alpine plantgrowth under future climate conditions. Biogeosciences 7 (6), 2013–2024.
eichstein, M., Falge, E., Baldocchi, D., Papale, D., Aubinet, M., Berbigier, P., Bern-hofer, C., Buchmann, N., Gilmanov, T., Granier, A., Grunwald, T., Havrankova, K.,Ilvesniemi, H., Janous, D., Knohl, A., Laurila, T., Lohila, A., Loustau, D., Matteucci,G., Meyers, T., Miglietta, F., Ourcival, J.M., Pumpanen, J., Rambal, S., Rotenberg,E., Sanz, M., Tenhunen, J., Seufert, G., Vaccari, F., Vesala, T., Yakir, D., Valentini,R., 2005. On the separation of net ecosystem exchange into assimilation andecosystem respiration: review and improved algorithm. Global Change Biology11 (9), 1424–1439.
ichardson, A.D., Black, T.A., Ciais, P., Delbart, N., Friedl, M.A., Gobron, N., Hollinger,D.Y., Kutsch, W.L., Longdoz, B., Luyssaert, S., Migliavacca, M., Montagnani, L.,Munger, J.W., Moors, E., Piao, S.L., Rebmann, C., Reichstein, M., Saigusa, N., Tomel-leri, E., Vargas, R., Varlagin, A., 2010. Influence of spring and autumn phenologicaltransitions on forest ecosystem productivity. Philosophical Transactions of theRoyal Society B: Biological Sciences 365 (1555), 3227–3246.
ichardson, A.D., Braswell, B.H., Hollinger, D.Y., Jenkins, J.P., Ollinger, S.V., 2009.Near-surface remote sensing of spatial and temporal variation in canopy phe-nology. Ecological Applications 19 (6), 1417–1428.
ichardson, A.D., Jenkins, J.P., Braswell, B.H., Hollinger, D.Y., Ollinger, S.V., Smith,M.L., 2007. Use of digital webcam images to track spring green-up in a deciduousbroadleaf forest. Oecologia 152 (2), 323–334.
ossini, M., Meroni, M., Migliavacca, M., Manca, G., Cogliati, S., Busetto, L., Picchi,V., Cescatti, A., Seufert, G., Colombo, R., 2010. High resolution field spectroscopy
Please cite this article in press as: Migliavacca, M., et al., Using digital repeatand photosynthetic CO2 uptake. Agric. Forest Meteorol. (2011), doi:10.101
measurements for estimating gross ecosystem production in a rice field. Agri-cultural and Forest Meteorology 150 (9), 1283–1296.
ouse, J.W., Haas, R.H., Schell, J.A., Deering, D.W., Harlan, J.C. (Eds.), 1974. Monitoringthe Vernal Advancements and Retro Gradation of Natural Vegetation. Greenbelt,MD, USA.
PRESSest Meteorology xxx (2011) xxx– xxx 13
Ryu, S.R., Chen, J., Noormets, A., Bresee, M.K., Ollinger, S.V., 2008. Comparisonsbetween PnET-Day and eddy covariance based gross ecosystem production intwo Northern Wisconsin forests. Agricultural and Forest Meteorology 148 (2),247–256.
Ryu, Y., Baldocchi, D.D., Verfaillie, J., Ma, S., Falk, M., Ruiz-Mercado, I., Hehn, T.,Sonnentag, O., 2010. Testing the performance of a novel spectral reflectance sen-sor, built with light emitting diodes (LEDs), to monitor ecosystem metabolism,structure and function. Agricultural and Forest Meteorology 150 (12), 1597–1606.
Schuepp, P.H., Leclerc, M.Y., MacPherson, M.Y., Desjardins, R.L., 1990. Footprintprediction of scalar fluxes from analytical solutions of the diffusion equation.Boundary–Layer Meteorology 50 (1), 355–373.
Slaughter, D.C., Giles, D.K., Downey, D., 2008. Autonomous robotic weed controlsystems: a review. Computers and Electronics in Agriculture 61 (1), 63–78.
Sonnentag, O., Hufkens, K., Teshera-Sterne, C., Young, A.M., Richardson, A.D., 2010.Phenological research using digital image archives: how important is camerasystem choice? Abstract B41C-0324 presented at 2010 Fall Meeting, AGU, SanFrancisco, Calif., 13–17 Dec.
Sonnentag, O., Detto, M., Vargas, R., Ryu, Y., Runkle, B.R.K., Kelly, M., Baldocchi,D.D., 2011. Tracking the structural and functional development of a perennialpepperweed (Lepidium latifolium L.) infestation using a multi-year archive ofwebcam imagery and eddy covariance measurements. Agricultural and ForestMeteorology 151, 916–926.
Stockli, R., Rutishauser, T., Dragoni, D., O’Keefe, J., Thornton, P.E., Jolly, M., Lu, L., Den-ning, A.S., 2008. Remote sensing data assimilation for a prognostic phenologymodel. Journal of Geophysical Research: Biogeosciences 113, G4.
Stockli, R., Vidale, P.L., 2004. European plant phenology and climate as seen in a 20-year AVHRR land-surface parameter dataset. International Journal of RemoteSensing 25 (17), 3303–3330.
Veroustraete, F., Sabbe, H., Eerens, H., 2002. Estimation of carbon mass fluxes overEurope using the C-Fix model and Euroflux data. Remote Sensing of Environment83 (3), 376–399.
Vittoz, P., Bodin, J., Ungricht, S., Burga, C., Walther, G.R., 2008. One century of veg-etation change on Isla Persa, a nunatak in the Bernina massif in the Swiss Alps.Journal of Vegetation Science 19 (5), 671–728.
Walther, G.R., Beissner, S., Burga, C.A., 2005. Trends in the upward shift of alpineplants. Journal of Vegetation Science 16 (5), 541–548.
Woebbecke, D.M., Meyer, G.E., VonBargen, K., Mortensen, D.A., 1995. Color indicesfor weed identification under various soil, residue, and lightning conditions.Transactions of the ASAE (American Society of Agricultural Engineers) 38,259–269.
Wohlfahrt, G., Bahn, M., Newesely, C., Sapinsky, S., Tappeiner, U., Cernusca, A., 2003.Canopy structure versus physiology effects on net photosynthesis of mountain
photography and eddy covariance data to model grassland phenology6/j.agrformet.2011.05.012
grasslands differing in land use. Ecological Modelling 170 (2–3), 407–426.Zeeman, M.J., Hiller, R., Gilgen, A.K., Michna, P., Pluss, P., Buchmann, N., Eugster, W.,
2010. Management and climate impacts on net CO2 fluxes and carbon budgetsof three grasslands along an elevational gradient in Switzerland. Agriculturaland Forest Meteorology 150 (4), 519–530.