Phenology and growth adjustments of oil palm (Elaeis ...
12
Phenology and growth adjustments of oil palm (Elaeis guineensis) to photoperiod and climate variability S. Legros 1 , I. Mialet-Serra 2, *, J.-P. Caliman 1,3 , F. A. Siregar 3 , A. Cle ´ment-Vidal 2 and M. Dingkuhn 2 1 CIRAD, UPR Syste `me de Pe ´rennes, 2 UPR A ¯ IVA, F-34398 Montpellier cedex 5, France and 3 SMART Research Institute, Pekanbaru 28112, Riau Indonesia Received: 13 May 2009 Returned for revision: 13 July 2009 Accepted: 31 July 2009 Published electronically: 11 September 2009 † Background and Aims Oil palm flowering and fruit production show seasonal maxima whose causes are unknown. Drought periods confound these rhythms, making it difficult to analyse or predict dynamics of pro- duction. The present work aims to analyse phenological and growth responses of adult oil palms to seasonal and inter-annual climatic variability. † Methods Two oil palm genotypes planted in a replicated design at two sites in Indonesia underwent monthly observations during 22 months in 2006–2008. Measurements included growth of vegetative and reproductive organs, morphology and phenology. Drought was estimated from climatic water balance (rainfall – potential eva- potranspiration) and simulated fraction of transpirable soil water. Production history of the same plants for 2001– 2005 was used for inter-annual analyses. † Key Results Drought was absent at the equatorial Kandista site (0855 0 N) but the Batu Mulia site (3812 0 S) had a dry season with variable severity. Vegetative growth and leaf appearance rate fluctuated with drought level. Yield of fruit, a function of the number of female inflorescences produced, was negatively correlated with photoperiod at Kandista. Dual annual maxima were observed supporting a recent theory of circadian control. The photoperiod- sensitive phases were estimated at 9 (or 9 þ 12 n) months before bunch maturity for a given phytomer. The main sensitive phase for drought effects was estimated at 29 months before bunch maturity, presumably associ- ated with inflorescence sex determination. † Conclusion It is assumed that seasonal peaks of flowering in oil palm are controlled even near the equator by photoperiod response within a phytomer. These patterns are confounded with drought effects that affect flowering (yield) with long time-lag. Resulting dynamics are complex, but if the present results are confirmed it will be possible to predict them with models. Key words: Photoperiodism, Elaeis guineensis, flowering, phyllochron, drought, radiation use efficiency, sink– source relationships, phenotypic plasticity. INTRODUCTION Oil palm (Elaeis guineensis) is by far the highest yielding oil crop with mean fresh fruit yield equal to 13 t ha 21 year 21 or to 10 t ha 21 year 21 palm oil under favourable conditions (Esteulle and Perennes, 2007). However, oil palm is sensitive to drought (Bredas and Scuvie, 1960; Maillard et al., 1974; Nouy et al., 1999), and it is thus strongly affected by the increasing frequency of climate anomalies such as El Nin ˜o causing drought in south-east Asia. Intra- and inter-annual yield variations are reportedly increasing (Henson, 1999). This observation is difficult to interpret because even the phys- iological causes of general seasonal variation of yield are largely unknown (Henson, 2006). Annual production is con- tinuous but generally shows marked seasonal peaks which can neither be explained by carbon assimilation nor by phenol- ogy alone (Henson, 2006). Overall little is known about the environmental or endogenous control of periodic events in tropical trees (Rivera and Borchert, 2001). Oil palm is a perennial, arborescent, monocotyledonous crop. Plants have a single woody stem without secondary growth. A single apical stem meristem produces new phytomers in regular succession consisting of an internode, a leaf and a male or female inflorescence on its axil. The devel- opment duration of a phytomer beginning with leaf initiation and ending with maturity of its axillary female inflorescence is around 4 years (Corley, 1977). Vegetative growth and devel- opment are continuous and constant under favourable con- ditions despite strong seasonal variations of reproductive growth (Corley and Tinker, 2003; Henson, 2007). It was there- fore suggested that vegetative growth and development of oil palm constitute priority sinks for assimilates (Henson, 2007). Flowering and maturity dates show a marked yearly rhythm but the control of their periodicity is not well understood. The main yield components of oil palm are the number and the weight of harvested bunches per month (Corley, 1977; Corley and Tinker, 2003). They are determined by (in chrono- logical order): sex ratio (female:total inflorescence number), fraction of aborted inflorescences, bunch failure (leading to absence of fruit set) and mesocarp:total bunch dry mass ratio (Corley, 1977). Given the long development duration (4 years) of female inflorescences and the resulting large number of infloresences having different developmental stage on a plant at any given time, the effects of climatic variability on yield components are complex. The effects of a drought period on yield components occur with long time-lags * For correspondence. E-mail [email protected] # The Author 2009. Published by Oxford University Press on behalf of the Annals of Botany Company. All rights reserved. For Permissions, please email: [email protected] Annals of Botany 104: 1171–1182, 2009 doi:10.1093/aob/mcp214, available online at www.aob.oxfordjournals.org Downloaded from https://academic.oup.com/aob/article/104/6/1171/185054 by guest on 02 August 2022
-
Upload
khangminh22 -
Category
Documents
-
view
0 -
download
0
Transcript of Phenology and growth adjustments of oil palm (Elaeis ...

Phenology and growth adjustments of oil palm (Elaeis guineensis) to photoperiodand climate variability
S. Legros1, I. Mialet-Serra2,*, J.-P. Caliman1,3, F. A. Siregar3, A. Clement-Vidal2 and M. Dingkuhn2
1CIRAD, UPR Systeme de Perennes, 2UPR AIVA, F-34398 Montpellier cedex 5, Franceand 3SMART Research Institute, Pekanbaru 28112, Riau Indonesia
Received: 13 May 2009 Returned for revision: 13 July 2009 Accepted: 31 July 2009 Published electronically: 11 September 2009
† Background and Aims Oil palm flowering and fruit production show seasonal maxima whose causes areunknown. Drought periods confound these rhythms, making it difficult to analyse or predict dynamics of pro-duction. The present work aims to analyse phenological and growth responses of adult oil palms to seasonaland inter-annual climatic variability.† Methods Two oil palm genotypes planted in a replicated design at two sites in Indonesia underwent monthlyobservations during 22 months in 2006–2008. Measurements included growth of vegetative and reproductiveorgans, morphology and phenology. Drought was estimated from climatic water balance (rainfall – potential eva-potranspiration) and simulated fraction of transpirable soil water. Production history of the same plants for 2001–2005 was used for inter-annual analyses.† Key Results Drought was absent at the equatorial Kandista site (08550N) but the Batu Mulia site (38120S) had adry season with variable severity. Vegetative growth and leaf appearance rate fluctuated with drought level. Yieldof fruit, a function of the number of female inflorescences produced, was negatively correlated with photoperiodat Kandista. Dual annual maxima were observed supporting a recent theory of circadian control. The photoperiod-sensitive phases were estimated at 9 (or 9 þ 12 � n) months before bunch maturity for a given phytomer. Themain sensitive phase for drought effects was estimated at 29 months before bunch maturity, presumably associ-ated with inflorescence sex determination.† Conclusion It is assumed that seasonal peaks of flowering in oil palm are controlled even near the equator byphotoperiod response within a phytomer. These patterns are confounded with drought effects that affect flowering(yield) with long time-lag. Resulting dynamics are complex, but if the present results are confirmed it will bepossible to predict them with models.
Key words: Photoperiodism, Elaeis guineensis, flowering, phyllochron, drought, radiation use efficiency, sink–source relationships, phenotypic plasticity.
INTRODUCTION
Oil palm (Elaeis guineensis) is by far the highest yielding oilcrop with mean fresh fruit yield equal to 13 t ha21 year21 or to10 t ha21 year21 palm oil under favourable conditions(Esteulle and Perennes, 2007). However, oil palm is sensitiveto drought (Bredas and Scuvie, 1960; Maillard et al., 1974;Nouy et al., 1999), and it is thus strongly affected by theincreasing frequency of climate anomalies such as El Ninocausing drought in south-east Asia. Intra- and inter-annualyield variations are reportedly increasing (Henson, 1999).This observation is difficult to interpret because even the phys-iological causes of general seasonal variation of yield arelargely unknown (Henson, 2006). Annual production is con-tinuous but generally shows marked seasonal peaks whichcan neither be explained by carbon assimilation nor by phenol-ogy alone (Henson, 2006). Overall little is known about theenvironmental or endogenous control of periodic events intropical trees (Rivera and Borchert, 2001).
Oil palm is a perennial, arborescent, monocotyledonouscrop. Plants have a single woody stem without secondarygrowth. A single apical stem meristem produces new
phytomers in regular succession consisting of an internode, aleaf and a male or female inflorescence on its axil. The devel-opment duration of a phytomer beginning with leaf initiationand ending with maturity of its axillary female inflorescenceis around 4 years (Corley, 1977). Vegetative growth and devel-opment are continuous and constant under favourable con-ditions despite strong seasonal variations of reproductivegrowth (Corley and Tinker, 2003; Henson, 2007). It was there-fore suggested that vegetative growth and development of oilpalm constitute priority sinks for assimilates (Henson, 2007).
Flowering and maturity dates show a marked yearly rhythmbut the control of their periodicity is not well understood. Themain yield components of oil palm are the number and theweight of harvested bunches per month (Corley, 1977;Corley and Tinker, 2003). They are determined by (in chrono-logical order): sex ratio (female:total inflorescence number),fraction of aborted inflorescences, bunch failure (leading toabsence of fruit set) and mesocarp:total bunch dry mass ratio(Corley, 1977). Given the long development duration (4years) of female inflorescences and the resulting largenumber of infloresences having different developmental stageon a plant at any given time, the effects of climatic variabilityon yield components are complex. The effects of a droughtperiod on yield components occur with long time-lags* For correspondence. E-mail [email protected]
# The Author 2009. Published by Oxford University Press on behalf of the Annals of Botany Company. All rights reserved.
For Permissions, please email: [email protected]
Annals of Botany 104: 1171–1182, 2009
doi:10.1093/aob/mcp214, available online at www.aob.oxfordjournals.org
Dow
nloaded from https://academ
ic.oup.com/aob/article/104/6/1171/185054 by guest on 02 August 2022

because drought-sensitive processes such as floral sex determi-nation or early inflorescence abortion take place months oryears before the maturity of a given bunch (Dufour et al.,1988; Caliman and Southworth, 1998). The same stressperiod may thus cause different responses on different phyto-mers (Jones, 1997) depending on their physiological ages atthe time of stress. These phytomers in turn are not independentof each other because they depend on shared resources withinthe plant, probably causing complex feedbacks on the scale ofthe plant.
Large fluctuations in whole-plant assimilate sink–sourcerelationships can be expected because of climate and seasonal-ity in particular drought periods. While some adjustment pro-cesses may be rapid, particularly changes in assimilate sourcestrength, some responses in phenology, organ growth rate andfinal organ size have long time-lag periods and may thus notbe able to compensate for sink–source discrepancies in theshort term (Jones, 1997). For coconut, biologically and structu-rally close to oil palm, such transitory imbalances are, in smallpart, buffered by carbohydrate reserves and, to a greater extent,by fluctuations in radiation use efficiency (Mialet-Serra et al.,2008). In this case, the magnitude of plastic responsesdiffered among compartments: low for above-ground vegetativecompartments, high for the reproductive compartment.
The present study attempted to relate seasonal and inter-annual variations in vegetative and reproductive growth,phenology and yield components to environmental variableswhile estimating the lag periods at which they respond to situ-ations of sink–source imbalances. Adult populations of twogenotypes reputed to differ in productivity and droughtresponse were observed during 2 years at two sites inIndonesia, one of them prone to seasonal drought periods.The overall aim is to provide a conceptual basis to build acrop model for oil palm.
MATERIALS AND METHODS
Experimental site
The study was conducted on two experimental plantations ofthe SMART Research Institute (SMARTRI, SMART Tbk.)located in Kandista Estate (Riau province, Sumatra island,Indonesia, 08550000N, 1018210000E, 100 m a.s.l.) and BatuMulia Estate (South Kalimantan province, Borneo island,Indonesia, 3812015.40’S, 116801046.900E, 15 m a.s.l.). Bothsites have a tropical humid climate. In Kandista, the rainyseason occurs between November to January, in Batu Muliabetween March and May with a monthly mean rainfall of240 mm month21 (averages for 1993–2005 in Kandista and2001–2005 in Batu Mulia). A drier season usually occursfrom June to August in Kandista and from August toOctober in Batu Mulia. The dry season in Batu Mulia(67 mm month21) is more pronounced than in Kandista.Mean daily global radiation (Rg) during the dry season (wetseason) in Kandista and in Batu Mulia is, respectively, 18.9MJ m22 d21 and 17.2 MJ m22 d21 (16.9 MJ m22 d21 and16.1 MJ m22 d21); mean air temperature is 27.4 8C and 27.68C (27.0 8C and 27.8 8C), mean relative humidity is 79.0 %and 75.8 % (81.1 % and 81.5 %), mean vapour pressuredeficit is 0.98 kPa and 1.25 kPa (0.84 kPa and 0.93 kPa) and
mean evapotranspiration (Penman-Monteith) 4.5 mm and4.1 mm (3.9 mm and 3.6 mm). Kandista is considered as afavourable (drought free) site for oil palm with regular butshort water-deficit periods and a climatic water balance(CWB) not falling below 150 mm month21 (see CWB inFig. 1). Batu Mulia is characterized by a longer and sometimessevere dry season.
Plant material
Two genotypes of Elaeis guineensis Jacq.were studied(hybrids 63 and 83). Both are tenera high-yielding hybridsand results of crosses between dura deli origin (fruits withthin mesocarp, thick endocarp and large kernel) and pisiferaavros origin (fruits with thick mesocarp, small endocarp andsmall kernel) varieties. Genotype 63 has higher productivityand a supposedly greater drought resistance than 83 accordingto practioners. The genotypes were also chosen because ofdifferent crown characteristics (more profuse for 83).
Experimental design
The experimental plots were part of two larger, long-termgenetic trials covering 30 ha in Kandista and 9 ha in BatuMulia. Populations were 136 plants ha21 in a 9.5-m equilateral,triangular pattern. Plants were 13 years old at the onset of thestudy (July 2006). The present experiment took advantage ofthe replicated block design already in place. Six plants (or repli-cates) per genotype were selected randomly in plots, locatedsufficiently far from the plot border to avoid border effects.
In Kandista the soil is a sandy loam (78.0 % sand, 11.1 % siltand 10.8 % clay) of homogeneous texture with .3 m depth. Thevolumetric soil water content at field capacity and at permanentwilting point is 0.17 and 0.06 m3 m23, respectively. The soil inBatu Mulia is a silty clay loam soil (25.1 % sand, 44.1 % siltand 30.8 % clay) with 2 m depth. The volumetric soil watercontent is 0.48 m3 m23 at field capacity and 0.29 m3 m23 atwilting point.
For each site, fertilization was managed according to leafletnutrient contents which is general practice in oil palm cultiva-tion; other field management practices were uniform betweenboth sites.
Calculation of photoperiod (PP), CWB and fraction oftranspirable soil water (FTSW)
Photoperiod (PP) or day length was defined and calculatedas the duration between sunrise and sunset including civil twi-light, the time from when the centre of the sun is 68 below thehorizon before sunrise until the centre of the sun is 68 belowthe horizon after sunset (Forsythe et al., 1995; Almoroxet al., 2005).
To evaluate drought extent, two integrative variables werecalculated: the CWB calculated as monthly rainfall minuspotential evapotranspiration is the core indicator for thelength of the growing period in agro-ecological zoning forrainfed systems (FAO, 1996). Potential evapotranspiration(mm month21) was calculated according to FAO guidelines(Allen et al., 1998). The second indicator of drought was theFTSW simulated at a daily time step. It estimates the soil
Legros et al. — Oil palm responses to climate1172
Dow
nloaded from https://academ
ic.oup.com/aob/article/104/6/1171/185054 by guest on 02 August 2022

water available to the plant and, unlike CWB, takes intoaccount cumulative effects of continuous drought such asdepletion of the soil water reserve.
The model used to calculate FTSW was ‘EcoPalm 2008’(http://ecotrop.cirad.fr) and will not be presented here in fullbecause only its water balance was used. Only essentials ofthis routine are described in the following because it is anadaptation of a generic FAO model (Allen et al., 1998)described in more detail in Sultan et al. (2005) and inMishra et al. (2008).
Two layers of soil were defined: a top layer (with a zS depthor thickness) and a deep layer (with a zD thickness) with theroot front located at zS þ zD. Based on observations inseveral trenches dug on each plot (data not shown) about80 % of oil palm roots were present within 3 m depth inKandista and 2 m in Batu Mulia.
FTSW was calculated by using the following equationdefined by Sinclair and Ludlow (1986):
FTSWðtÞ ¼AWSðtÞ þ AWDðtÞ
TAWS þ TAWD
where TAWS and TAWD are the maximum available soil waterin the surface and the deep layers, respectively. AWS(t) isdefined as the daily water storage in the top layer of soil,AWD(t) as the daily water storage in the deep layer of soil.
In the top layer, AWS(t) is calculated as:
AWSðtÞ ¼ AWSðt � 1Þ þ RðtÞ
� RfðtÞ þ EsðtÞ þ TrPðtÞZS
ZS þ ZD
� �
where AWS(t – 1) is the water storage in the top layer of soil cal-culated during the previous day; R(t), daily rainfall (mm d21);Rf(t), run-off (mm d21); ES(t), soil evaporation (mm d21) calcu-lated as described by Allen et al. (1998); and TrP is planttranspiration (mm d21).
In the deep layer, AWD(t) is calculated as:
AWDðtÞ ¼ AWDðt � 1Þ þ RðtÞ � DrðtÞ þ TrPðtÞZD
ZS þ ZD
� �
where AWD(t – 1) is the water storage in the deep layer of soilcalculated for the previous day; Dr(t), the drainage (mm d21)after run-off, soil evaporation and plant transpiration; and TrP
is plant transpiration (mm d21). Deep drainage was consideredequal to the fraction of precipitation not allocated to runoff,soil water replenishment in the root zone and transpiration.This water balance does not take into account the water inter-cepted and stored by the canopy. Rainfall interception of oilpalm canopies is ,5 % for a daily precipitation of 30 mmand even smaller at higher rainfall intensity (Dufrene, 1989).
Stem growth rate
Oil palm stems have no secondary growth and thereforehave roughly constant diameter but variable height due to pro-duction of new phytomers. Stem structural dry mass growthrate (kgDM month21) was assumed to consist of two com-ponents: (1) height increase due to addition of stem segmentsassociated with apical production of new phytomers; and (2)density increase due to lignification as stem tissues age.
Apical stem mass growth was estimated from the stemheight increment per month (number of new phytomers �internode length per phytomer), stem diameter and the empiri-cal density of newly formed ‘wood’ (dry mass:wet volumeratio equal to 0.10 g cm23). The dry mass increment of exist-ing stem parts were assumed to undergo a gradual weightincrease due to lignification equal to 0.00074 g cm23
month21 (Corley and Tinker, 2003).
Leaf growth rate
The total number of fully expanded leaves, newly appearedleaves and pruned or broken leaves were recorded twice a
20010
50
100
150
200
250
Experimental period
A Kandista B Batu Mulia500
400
300
200
100
0
–100
–2002002
Num
ber
of h
arve
sted
bun
ches
(ha
–1 m
onth
–1)
CW
B (m
m m
onth–1)
2003 2004Year Year
2005 2006 2007 2008 2001 2002 2003 2004 2005 2006 2007 2008
Experimental period
CWBProgency 63Progency 83
FI G. 1. Dynamics of monthly number of mature bunches and climatic water balance (CWB ¼ monthly rainfall – potential evapotranspiration) for oil palmgenotypes 63 and 83 at (A) Kandista and (B) Batu Mulia sites in Indonesia from January 2001 to April 2008. Data source: SMARTRI database.
Legros et al. — Oil palm responses to climate 1173
Dow
nloaded from https://academ
ic.oup.com/aob/article/104/6/1171/185054 by guest on 02 August 2022

month from July 2006 onwards. When leaves were pruned tofacilitate bunch harvest (which is the general practice in oilpalm cultivation) leaves were ranked up to 33 (in ascendingrank from the crown top) and their morphology (i.e. theirlength and leaflet number) described. Dry mass of the petiole,rachis and the leaflets and leaflet number were measured.Individual new leaf growth rate (kgDM month21) was assumedto be linear (function forced with its final dry mass) over 3months – time of rapid growth after a leaf’s appearance (onrank 1). To estimate the aggregate dry mass growth rates fornew leaves growing during a given month, the monthly growthrate was calculated for all such leaves on the plant.
Reproductive growth rate and yield components
Anthesis (defined as spathe opening date of female inflores-cences) and maturity (defined as harvest date for maturebunch) were monitored twice monthly. At maturity the follow-ing parameters were measured: the numbers of fertilized andunfertilized fruits per harvested bunch, the dry masses of theharvested bunch stalk, the spikelets, and the two major fruitcompartments (mesocarp and nut composed of endocarp andkernel) and oil:mesocarp dry mass ratio. Growth rate (kgDM
month21) of each harvested bunch was assumed to follow alinear function (forced with the final mass of the harvestedbunch) over 10 months, time of rapid growth before maturity(i.e. harvest). To estimate the aggregate dry mass growthrates for all bunches growing during a given month, themonthly growth increments was calculated for each of them.
Partitioning of above-ground dry matter production to fruitswas assessed as harvest index (entire fruit dry mass productiondivided by total above-ground dry mass production).
Statistical analysis
Two-way analysis of variance (ANOVA using Statistix,version 8.1 software, Tallahassee, FL, USA) was performed toevaluate the effect of genotype (genotypes 63 and 83) and site(Kandista and Batu Mulia) on yield and growth parameters.
Given the fact that environmental effects on production involvelong lag periods in oil palm due to the long development durationof a phytomer (Corley, 1977; Adam et al., 2005), the 22 months ofdetailed observations on plants were augmented with monthlyrecords on bunch production for the same populations (plots)since 2001, obtained from the plantation’s management. Theresulting continuous data for 8 years were used to test hypotheseson effects of PP and FTSW on bunch production using linearregression analyses (Statbox, version 6.5, Grimmersoft) forthese two environmental variables versus monthly yield. The dur-ation of the phenological lag of the environmental effects onmonthly number of harvested bunches was estimated by search-ing for the temporal shift between predictor and predicted vari-ables giving the strongest effect in terms of slope coefficient.
RESULTS
Distribution of historic production on the experimental plots
Mean annual production statistics are shown in Table 1. Dryfruit yield was significantly higher in genotype 63 than in 83and higher in Kandista than in Batu Mulia. Differences inyield were mainly due to bunch number and not to meanbunch weight which was similar for both genotypes.
After the 10th year after planting, corresponding to late2003, regular seasonal peaks of production occurred inKandista, resulting from seasonal concentration of floweringevents (Fig. 1). At the same time production dynamicsbecame synchronized between the two cultivars. In BatuMulia, production dynamics of the cultivars were synchronizedfrom early 2003 onwards, but no clear seasonal recurrentpattern was observed.
In Kandista, seasonal production peaks were observed earlyin the 2nd half of the year (August to October). This patternwas associated with the absence of marked dry and rainyseasons as shown by the CWB in Fig. 1; rarely, was theCWB negative in two consecutive months and when this didoccur it was not during a recurrent time of year. In BatuMulia marked minima of production occurred for both
TABLE 1. Mean annual yield and yield components of oil palm genotypes 63 and 83 at Kandista and Batu Mulia sites in Indonesiafor 2000–2005
Site EffectNumber of maturebunches (plant21 year21)
Total bunch dry massyield (kg plant21 year21) Mean bunch dry mass (kg bunch21)
GenotypeKandista Genotype 63 14.26+0.25 a 122.2+2.0 a 8.6+0.1
Genotype 83 12.97+0.24 b 114.4+1.8 b 8.9+0.1P *** ** n.s.
Batu Mulia Genotype 63 12.65+0.44 a 98.5+3.5 a 7.9+0.1 bGenotype 83 9.75+0.28 b 81.7+1.9 b 8.5+0.2 aP *** *** **SiteP (genotype 63) ** *** ***P (genotype 83) *** *** n.s.Genotype � siteP n.s. n.s. n.s.
Values are means+ standard error of the mean. of 64 plants.Significance level of effects (ANOVA): n.s., not significant; **, very significant (0.01 . P . 0.001); ***, highly significant (P . 0.001). Different letters
within a column indicate a significant difference at P , 0.05 (Tukey’s test).
Legros et al. — Oil palm responses to climate1174
Dow
nloaded from https://academ
ic.oup.com/aob/article/104/6/1171/185054 by guest on 02 August 2022

cultivars around August 2003, March 2004, March 2005 andNovember 2006 (Fig. 1). These temporal dynamics wereassociated with the occurrence of a marked dry season earlyin the second half of the year (i.e. August to October), as indi-cated by clusters of months having negative CWB. However,this dry season varied among years in intensity and durationand was completely absent in 2003. Neither the peaks northe minima of production coincided consistently with dry orhumid periods.
Climatic conditions during the period of detailed plantobservations
In Kandista, climatic conditions during the experimentalperiod (from July 2006 to May 2008; Fig. 2) were similar tothe average recorded for the previous 12 years. The beginning
of this period was characterized by a 2-month drought spell(July and August 2006) followed by mostly abundant rainfall.In Batu Mulia, however, 2006 and 2007 were unusual years;2006 having a severe dry season with only 51 mm fromAugust to October and 2007 being a wet year with heavy rain-fall in June and July (750 mm) followed by a mild dry season.Mean monthly vapour pressure deficit to which oil palm isknown to be sensitive (Dufrene and Saugier, 1993), fluctuatedbetween 0.7 and 1.0 kPa in Kandista and 0.8 and 1.2 kPa inBatu Mulia except during the severe dry season of 2006when it attained 1.7 kPa. In Batu Mulia, maximum temperaturewas around 33.2 in 2006, i.e. 1 8C higher than in 2007 whereasminimum temperatures were similar among years (22.5 8C). InKandista, mean monthly FTSW dropped to 0.4 in August 2006constituting a mild stress. In Batu Mulia, during the 2006 dryseason, mean monthly FTSW dropped to 0.25 and remained
2·030
C
Kandista
D
A B
E F
Batu Mulia
29
28
27
26
400
300
200
100
013·01·0
0·8
0·6
0·4
0·2FTSWPPCWB
0·0
12·6
12·8
12·4
12·2
12·0
PP
(ho
ur)
CW
B (m
m m
onth–1)
FT
SW
Mon
thly
rai
nfal
l (m
m) M
onthly rainfall (mm
)V
PD
(kPa)
Tem
pera
ture
(°C
)
1·8
1·6
1·4
1·2
1·0
0·8
0·6
0·4
0·2
0·0
400
300
200
100
0
300
200
100
–100
–2006
2006 2007
Year Year
20072008 2006 20089312 6 9312 6 9312 6 9312 312312
0
TemperatureVPD
FI G. 2. Monthly dynamics of daily mean air temperature and vapour pressure deficit (VPD) at (A) Kandista and (B) Batu Mulia; monthly cumulative rainfall at(C) Kandista and (D) Batu Mulia; temporal dynamics of photoperiod (PP), simulated fraction of transpirable soil water (FTSW) and climatic water balance
(CWB ¼ monthly rainfall – potential evapotranspiration) at (E) Kandista and (F) Batu Mulia.
Legros et al. — Oil palm responses to climate 1175
Dow
nloaded from https://academ
ic.oup.com/aob/article/104/6/1171/185054 by guest on 02 August 2022
for 3 months below 0.5 whereas it barely dropped to 0.5 duringthe 2007 dry season.
Plant and canopy structure
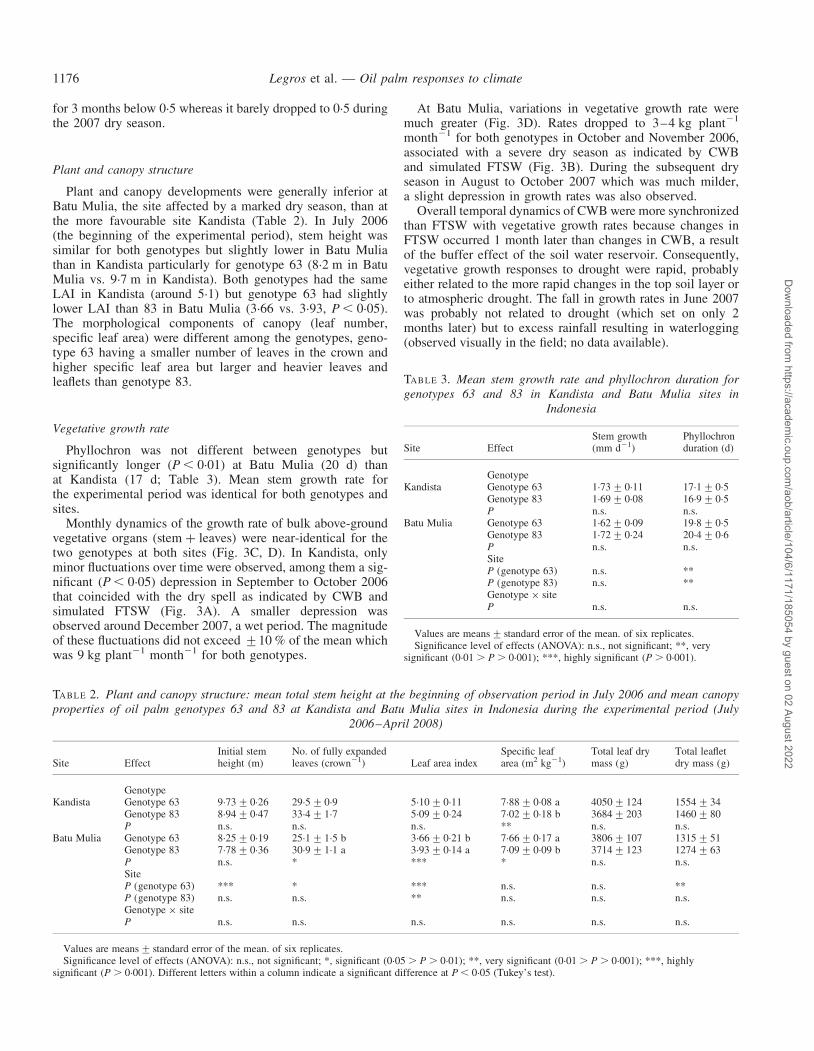
Plant and canopy developments were generally inferior atBatu Mulia, the site affected by a marked dry season, than atthe more favourable site Kandista (Table 2). In July 2006(the beginning of the experimental period), stem height wassimilar for both genotypes but slightly lower in Batu Muliathan in Kandista particularly for genotype 63 (8.2 m in BatuMulia vs. 9.7 m in Kandista). Both genotypes had the sameLAI in Kandista (around 5.1) but genotype 63 had slightlylower LAI than 83 in Batu Mulia (3.66 vs. 3.93, P , 0.05).The morphological components of canopy (leaf number,specific leaf area) were different among the genotypes, geno-type 63 having a smaller number of leaves in the crown andhigher specific leaf area but larger and heavier leaves andleaflets than genotype 83.
Vegetative growth rate
Phyllochron was not different between genotypes butsignificantly longer (P , 0.01) at Batu Mulia (20 d) thanat Kandista (17 d; Table 3). Mean stem growth rate forthe experimental period was identical for both genotypes andsites.
Monthly dynamics of the growth rate of bulk above-groundvegetative organs (stem þ leaves) were near-identical for thetwo genotypes at both sites (Fig. 3C, D). In Kandista, onlyminor fluctuations over time were observed, among them a sig-nificant (P , 0.05) depression in September to October 2006that coincided with the dry spell as indicated by CWB andsimulated FTSW (Fig. 3A). A smaller depression wasobserved around December 2007, a wet period. The magnitudeof these fluctuations did not exceed +10 % of the mean whichwas 9 kg plant21 month21 for both genotypes.
At Batu Mulia, variations in vegetative growth rate weremuch greater (Fig. 3D). Rates dropped to 3–4 kg plant21
month21 for both genotypes in October and November 2006,associated with a severe dry season as indicated by CWBand simulated FTSW (Fig. 3B). During the subsequent dryseason in August to October 2007 which was much milder,a slight depression in growth rates was also observed.
Overall temporal dynamics of CWB were more synchronizedthan FTSW with vegetative growth rates because changes inFTSW occurred 1 month later than changes in CWB, a resultof the buffer effect of the soil water reservoir. Consequently,vegetative growth responses to drought were rapid, probablyeither related to the more rapid changes in the top soil layer orto atmospheric drought. The fall in growth rates in June 2007was probably not related to drought (which set on only 2months later) but to excess rainfall resulting in waterlogging(observed visually in the field; no data available).
TABLE 2. Plant and canopy structure: mean total stem height at the beginning of observation period in July 2006 and mean canopyproperties of oil palm genotypes 63 and 83 at Kandista and Batu Mulia sites in Indonesia during the experimental period (July
2006–April 2008)
Site EffectInitial stemheight (m)
No. of fully expandedleaves (crown21) Leaf area index
Specific leafarea (m2 kg21)
Total leaf drymass (g)
Total leafletdry mass (g)
GenotypeKandista Genotype 63 9.73+0.26 29.5+0.9 5.10+0.11 7.88+0.08 a 4050+124 1554+34
Genotype 83 8.94+0.47 33.4+1.7 5.09+0.24 7.02+0.18 b 3684+203 1460+80P n.s. n.s. n.s. ** n.s. n.s.
Batu Mulia Genotype 63 8.25+0.19 25.1+1.5 b 3.66+0.21 b 7.66+0.17 a 3806+107 1315+51Genotype 83 7.78+0.36 30.9+1.1 a 3.93+0.14 a 7.09+0.09 b 3714+123 1274+63P n.s. * *** * n.s. n.s.SiteP (genotype 63) *** * *** n.s. n.s. **P (genotype 83) n.s. n.s. ** n.s. n.s. n.s.Genotype � siteP n.s. n.s. n.s. n.s. n.s. n.s.
Values are means+ standard error of the mean. of six replicates.Significance level of effects (ANOVA): n.s., not significant; *, significant (0.05 . P . 0.01); **, very significant (0.01 . P . 0.001); ***, highly
significant (P . 0.001). Different letters within a column indicate a significant difference at P , 0.05 (Tukey’s test).
TABLE 3. Mean stem growth rate and phyllochron duration forgenotypes 63 and 83 in Kandista and Batu Mulia sites in
Indonesia
Site EffectStem growth(mm d21)
Phyllochronduration (d)
GenotypeKandista Genotype 63 1.73+0.11 17.1+0.5
Genotype 83 1.69+0.08 16.9+0.5P n.s. n.s.
Batu Mulia Genotype 63 1.62+0.09 19.8+0.5Genotype 83 1.72+0.24 20.4+0.6P n.s. n.s.SiteP (genotype 63) n.s. **P (genotype 83) n.s. **Genotype � siteP n.s. n.s.
Values are means+ standard error of the mean. of six replicates.Significance level of effects (ANOVA): n.s., not significant; **, very
significant (0.01 . P . 0.001); ***, highly significant (P . 0.001).
Legros et al. — Oil palm responses to climate1176
Dow
nloaded from https://academ
ic.oup.com/aob/article/104/6/1171/185054 by guest on 02 August 2022

Yield components
During the experimental period of July 2006 to April 2008,yield components (Table 4) showed the same trends asobserved for records between years 2001–2005 (Table 1)
with inferior yield and bunch number for genotype 83 inBatu Mulia. Harvest index was similar for both genotypes –between 44 % and 48 %. Lower yields observed in BatuMulia, the climatically less favourable site, were in part due
400 1·0
0·8
0·6
0·4
0·2
0·0
300
200
100
0
–100
–20014
12
10
8
6
4
2
0
2006 2007Year Year
2008 2006 2007 2008
12 3 6 9 12 3 6 9 12 3 6
Progeny 63
Progeny 83
12 3 6 9 12 3 6 9 12 3 6
Kandista Batu Mulia
CWB
CW
B (
mm
mon
th–1
)
FTSW
FT
SW
Str
uctu
ral v
eget
ativ
e gr
owth
(kg D
M p
lant
–1 m
onth
–1)
A B
C D
FI G. 3. Monthly dynamics of drought indicators, climatic water balance (CWB) and simulated fraction of transpirable soil water (FTSW), provided as potentialexplanatory environmental variables at (A) Kandista and (B) Batu Mulia; monthly dynamics of structural above-ground vegetative growth for oil palm genotypes63 and 83 at (C) Kandista and (D) Batu Mulia sites in Indonesia from July 2006 to April 2008. Values are means of six replicates and bars indicate standard error
of the mean for genotypes 63 and 83 over the observation period, as indicated.
TABLE 4. Mean yield components for oil palm genotypes 63 and 83 at Kandista and Batu Mulia sites in Indonesia during theexperimental period (July 2006–April 2008)
Site Effect
No. of harvestedbunches (plant21
month21)
Total harvested bunchdry mass (kgDW
plant21 month21)Mean bunch dry mass(kgDW bunch21)
Harvestindex (%)
Unfertilized fruit rate(per bunch) (%)
Mean fruit drymass (g fruit21)
GenotypeKandista Genotype 63 0.86+0.02 8.5+0.3 9.9+0.5 47.7+1.6 27.3+2.8 a 6.6+0.2 a
Genotype 83 0.73+0.1 7.9+1.1 10.8+0.5 45.2+3.4 18.5+1.2 b 5.8+0.2 bP n.s. n.s. n.s. n.s. * *
BatuMulia
Genotype 63 0.75+0.05 7.1+0.7 9.5+0.3 b 45.2+2.6 35.0+3.0 5.6+0.3 b
Genotype 83 0.63+0.07 6.5+0.7 10.4+0.2 a 44.3+2.7 36.8+1.4 6.6+0.3 aP n.s. n.s. * n.s. n.s. *SiteP (genotype 63) n.s. n.s. n.s. n.s. n.s. *P (genotype 83) n.s. n.s. n.s. n.s. *** *Genotype � siteP n.s. n.s. n.s. n.s. * **
Values are means+ standard error of the mean. of six replicates.Significance level of effects (ANOVA): n.s., not significant; *, significant (0.05 . P . 0.01); **, very significant (0.01 . P . 0.001); ***, highly
significant (P . 0.001). Different letters within a column indicate a significant difference between genotypes in one site at P , 0.05 (Tukey’s test).
Legros et al. — Oil palm responses to climate 1177
Dow
nloaded from https://academ
ic.oup.com/aob/article/104/6/1171/185054 by guest on 02 August 2022

to a higher rate of unfertilized fruits per bunch, in particularfor genotype 83, whereas mean bunch dry mass was not sig-nificantly different between sites. Mean mature fertilizedfruit dry mass was higher in Kandista for genotype 63 andhigher in Batu Mulia for genotype 83 associated with astrong (P , 0.01) genotype � site interaction.
Reproductive growth rate
Monthly growth rates of reproductive organ dry matter(Fig. 4C, D) varied strongly at both sites and for both geno-types. In Kandista growth rates varied between 3 and 15 kgplant21 month21 for genotype 63 (mean: 8.5 kg plant21
month21) and between 4 and 13 kg plant21 month21 for gen-otype 83 (mean: 7.9 kg plant21 month21; Fig. 4C). Temporaldynamics of the genotypes had some similarities, e.g. amaximum at the beginning of the observation period and aminimum in mid-2007.
In Batu Mulia, reproductive growth rate (Fig. 4D) showed asimilar magnitude of monthly variations but at a slightly lowerlevel (means: 7.1 kg plant21 month21 for genotype 63 and6.5 kg plant21 month21 for genotype 83). Again, temporaldynamics were similar for the two genotypes with maximain mid-2007 and late 2007 and pronounced minima in late2006 and early 2008. The number of female inflorescenceswas the main determinant of yield fluctuations at both sitesand for both genotypes (data not shown). In contrast to vege-tative growth rates, peaks or depressions of reproductive
growth rate did not coincide consistently with drought level(FTSW) or PP minima (Fig. 4A, B).
Bunch production frequency vs. PP and FTSW
Possible effects of PP on frequency of fruit bunch pro-duction were analysed for the Kandista site (years 2001–2005) where confounding effects of drought stress are unlikelywith simulated FTSW never decreasing below 0.5. Regressionslope coefficient of PP from the linear regression betweenmature bunch number and PP, determined for hypotheticallags between 1 and 36 months, gave an oscillating patternthat was nearly identical for both genotypes (Fig. 5A). Bestcorrelations (r2 ¼ 0.28 to 0.35, with P , 0.0001) wereobserved for lags of 9–10, 21–22 and 33–34 months. In allcases, the best correlations were negative as can be expectedfor a tropical and therefore short-day plant (r2 for the positivemaxima of the slope coefficient varied between 0.15 and 0.20).The best correlations between mature bunch number (i.e.maturity) and PP were thus associated with a lag of 9–10months plus 0, 1 or 2 years (corresponding to a lag for flower-ing of 3 months plus 0, 1 or 2 years). In the following analyses,for convenience it is assumed that the photoperiodic lag forflowering is 3 months, without discarding the possibility thatit is actually 15 or 27 months
As can be expected from the variable intensity of dryseasons and comparatively irregular seasonal peaks of pro-duction observed at Batu Mulia (Fig. 1), the same analysis
Kandista
A B
C D
Batu Mulia
FT
SW
2006 2007Year Year
2008 2006 2007 2008
12 3 6 9 12 3 6 9 12 3 6 12 3 6 9 12 3 6 9 12 3 6
Rep
rodu
ctiv
e gr
owth
(kg D
M p
lant
–1 m
onth
–1)
PP
(ho
ur)
13·1
13·0
1·0
0·8
0·6
0·4
0·2
0·0
12·9
12·8
12·7
12·6
12·520181614121086420
PPFTSW
Progeny 63Progeny 83
FI G. 4. Monthly dynamics of photoperiod (PP) and simulated fraction of transpirable soil water (FTSW), provided as potential explanatory environmental vari-ables at (A) Kandista and (B) Batu Mulia; monthly dynamics of bulk growth rate of reproductive organs for oil palm genotypes 63 and 83 at (C) Kandista and(D) Batu Mulia sites in Indonesia from July 2006 to April 2008. Values are means of six replicates and bars indicate standard error of the mean for genotypes 63
and 83 over the observation period, as indicated.
Legros et al. — Oil palm responses to climate1178
Dow
nloaded from https://academ
ic.oup.com/aob/article/104/6/1171/185054 by guest on 02 August 2022

conducted for that site produced much poorer correlationsbetween bunch number and PP (data not shown).
Regressing mature bunch number frequency against FTSW(Fig. 5B), however, resulted in significant correlations for alag of 29 months (P , 0.05) and 35 months (P , 0.05). Asmay be expected, the positive correlations are physiologicallymeaningful, the negative ones being their mirror images at a
shift of +6 months because drought is a yield-reducingfactor in oil palm (Hemptinne and Ferwerda, 1961; Calimanand Southworth, 1998).
The correlation of maturing bunch number with the FTSWobserved 29 months earlier at Batu Mulia improved furtherwhen PP at a 9-month lag (the lag estimated for Kandista)was used as co-variable in a multiple linear regression analysis(Fig. 5C). The correlations combining a 9-month lag for PPand a 29-month lag for FTSW effects were highly significant(P , 0.01 for genotype 63 and P , 0.0001 for genotype 83),although they explained only a fraction of the observed varia-bility (only 16 % for genotype 63 and 35 % for genotype 83).
This model was graphically applied to the available bunchproduction data from 2001 to 2008 (Fig. 6). For Kandista,where drought was considered to be a negligible factor, it wasobserved that each of the two annual minima of PP (a phenom-enon that is specific to locations near the equator) was eachassociated with a peak of production. The peaks thus occurredin pairs except for 2005 where a single peak was observed.Coincidentally or not, the missing second peak in 2005 wasassociated with a lag of 29 months with the most pronouncedamong the many short dry spells observed at the site.
In Batu Mulia, each dry season was associated with adepression in mature bunch number 29 months later. The great-est depression (early 2005) was associated at a lag of 29 monthswith the lowest FTSW simulated for the time series. Conversely,only a very small dip in bunch production was observed in early2006 associated with an exceptionally mild dry season 29months earlier. Several peaks of bunch production coincidedat a 9-month lag with PP minima but this association was lessregular than in Kandista probably because of the dominanceof minima presumably associated with drought.
DISCUSSION
This study used two climatic environments, characterized bydifferent severity of dry seasons, to explain the variable pat-terns of phenology, growth and fruit bunch production of oilpalm. The choice of observation periods (22 months, augmen-ted with 5 years of historical production records on the samepopulations) and sites provided sufficient natural variabilityto develop causal hypotheses derived from parameter corre-lations. The choice of the two genotypes recommended byexperts for their different productivity and assumed sensitivityto drought was less meaningful because the genotypes, despitedifferent absolute levels of productivity and some morphologi-cal differences, responded similarly to the environment. Theirsimilar growth and phenological dynamics therefore strengthenthe results in terms of repeatability but provided little insightinto genotypic differences.
Photoperiodism as a possible cause of baseline rhythmsof flowering?
Observations confirmed numerous previous reports (Bredasand Scuvie, 1960; Corley, 1977; Henson and Mohd Tayeb,2004) indicating pronounced, regular, seasonal baselinerhythms of production dynamics in the absence of environ-mental stresses and the modification of these baselinerhythms when plants are affected by drought periods.
600
400
200
100
80
60
40
20
0
–20
–40
–60
–80
–100
100
80
60
40
20
0
–20
–40
–60
–80
–1000 3 6 9 12 15 18
Lag (Months)21 24 27 30 33 36
0
–200
–400
–600
Reg
ress
ion
slop
e co
effic
ient
Reg
ress
ion
slop
e co
effic
ient
Reg
ress
ion
slop
e co
effic
ient
PP effect, Kandista
FTSW effect, Batu MuliaB
C
A
Progeny 63Progeny 83
****** ******
******
**********
***
**
**
****
** **
**
******
*** *********
****
******
****
** * *
***
***
******
***
******
****
***
*
******
*
***
*****
*
*** *
*
**
*
****** **
**
**
***
******
******
******
******
***
*
*
* **
* **
*
***
*
FTSW+PP 9-month effects
FI G. 5. Analysis of possible lag periods for photoperiod (PP) and simulatedfraction of transpirable soil water (FTSW) effects on dynamics of fruitbunch production for oil palm genotypes 63 and 83. (A) Regression slopecoefficient values of the linear correlation ‘mature bunch number vs. PP’with a hypothetical n-month lag, using n ¼ 1–36, for the Kandista site;(B) regression slope coefficient values of the linear correlation ‘mature bunchnumber vs. FTSW’ using the same range lag periods, for the Batu Mulia site;and (C) regression slope coefficient values of the linear and multiple correlation‘mature bunch number vs. FTSW and PP at 9 months time-lag’. Significancelevel of correlations: *, significant (0.05 . P . 0.01); **, very significant
(0.01 . P . 0.001); ***, highly significant (P , 0.001).
Legros et al. — Oil palm responses to climate 1179
Dow
nloaded from https://academ
ic.oup.com/aob/article/104/6/1171/185054 by guest on 02 August 2022

The seasonal rhythms of bunch production at the favourablesite, Kandista, showed no clear pattern initially but becameregular in 2003 when the plants were 9 years old (Fig. 6).Oil palm usually shows such rhythms from about 10 yearsafter planting onwards (Corley and Gray, 1976). The pro-duction rhythms observed were mainly due to the number offruit bunches harvested per month and thus a function of flow-ering events on female inflorescences. Such phenological sea-sonal rhythms in tropical perennial plants can be either relatedto recurrent climatic patterns or to photoperiodism. For tropi-cal dicotyledon trees, Singh and Krushwaha (2006) distin-guished among five flowering types: summer flowering (onfoliated shoots), rainy-season flowering (on foliated shoots fol-lowing significant rains), autumn flowering (on shoots withmature leaves), winter flowering (on shoots undergoing leaffall), and dry-season flowering (on leafless shoots). Seasonalclimatic patterns are sometimes responsible for these patterns,e.g. in the rubber tree where flowering seems to be synchro-nized by periods of high solar radiation intensity observednear the equator (Yeang, 2007). This author argues that photo-periodism is unlikely to be involved in such cases because daylength varies little or not at all, although Rivera and Borchert
(2001) reported that several tropical trees are sensitive toannual variations in PP of l ,30 min. More recently, Borchertet al. (2005) postulated that, even at the equator, plants areable to sense the small seasonal changes in day and night dur-ations by means of a mechanism called the circadian clock, anendogenous timekeeping mechanism based upon several inter-connected negative feedback loops (Jackson, 2009).
Photoperiodic control of flowering at equatorial latitudes isthus physiologically possible and should result in two flower-ing peaks per year (Borchert et al., 2005) because of thepeculiar biphasic pattern of day length prevailing there. Thisis what was observed at Kandista, the equatorial (0855.00N)and climatically favourable site. The present analysis andresulting hypothesis on the photoperiodic nature of the dualannual maxima of flowering in Kandista, however, representsimplifications of a complex system and require further confir-mation. The linear-regression-based correlation of monthlybunch number with PP which indicated that the photoperiodicstimulus for flowering happens about 9, 21 or 33 monthsbefore bunch harvest did not take into account the non-linearresponse commonly observed. It was also assumed that oilpalm is a short-day plant like most tropical plants (Rivera
No drought
PP effect
9-monthlag
13·1A
Kandista
B
C D
E F
Batu Mulia
13·0
12·9
12·8
12·7
12·6
1·0
0·6
0·8
0·4
0·2
0·02001 2002
FT
SW
PP
(ho
ur)
2003 2004 2005
Year Year
2006 2007 2008 2001 2002 2003 2004 2005 2006 2007 2008
200
150
100
50
0
9-monthlag
29-month lag29-month lag
PP effect
Drought effect
Mild dryseason
Experimental period Experimental period
Num
ber
of h
arve
sted
bun
ches
(ha–1
mon
th–1
)
FI G. 6. Schematic diagram of assumed relationships between monthly dynamics of mean harvested bunch number at (C) Kandista and at (D) Batu Mulia andphotoperiod (PP) at 29 months lag at (A) Kandista and (B) Batu Mulia or with FTSW at 229 months lag, at (E) Kandista (drought-free site) and at (F) BatuMulia (site characterized by a longer and sometimes severe dry season). Arrows indicate hypothetical environment effects (PP or drought) on peaks (enhanced by
grey circles for PP effects) and minima (enhanced by grey squares for drought effects) of harvested bunch number. Data source: SMARTRI database.
Legros et al. — Oil palm responses to climate1180
Dow
nloaded from https://academ
ic.oup.com/aob/article/104/6/1171/185054 by guest on 02 August 2022

and Borchert, 2001; Kouressy et al., 2008) but would also haveobtained significant (although less good) correlations with theopposite assumption which would result in a stimulus occur-ring 6 months earlier. The present model also assumes thatthe stimulus is effective at the phytomer scale and not transfer-able to other phytomers (that are necessarily n plastochronsearlier or later in development) which is an unproven hypoth-esis. Lastly, it is not necessarily the minima of day length thatconstitute the effective stimulus but any parameter of the day-length dynamics that the plant can theoretically perceive.Clerget et al. (2004) and Borchert et al. (2005) elaboratedseveral alternative models that can be considered. Thepresent results render photoperiodic explanations of floweringcontrol in oil palm likely and should motivate further investi-gation into the question.
Different lag periods for drought effects on vegetativeand reproductive growth?
The observations at the drought-prone site of Batu Muliasuggested the presence of flowering peaks associated withminima of PP in accordance with the model developed forKandista but this pattern was confounded by other more domi-nant sources of variation. Annual drought periods recurring withvariable intensity were the most likely explanation. Droughtintensity was estimated by CWB and simulated FTSW. Theformer is an established agro-climatic term (Benoit, 1977; Karand Verma, 2005) commonly used in agro-ecological zoning(FAO, 1996) but has the disadvantage of not taking intoaccount the cumulative effects of continuous drought such asdepletion of the soil water reserve. FTSW considers this effectbut on a hypothetical basis because profiles of water infiltration,deep drainage and extraction by roots were not measured and themodel thus not validated in this respect. Despite this uncertaintywe preferred using simulated FTSW as a reference for soil waterresources because oil palm root systems are quite dense in the0–1.5 m horizon (Jourdan and Rey, 1997a) resulting in waterdepletion in this horizon during drought. It is known,however, that not only soil water resources but also atmosphericdrought affects gas exchange (Dufrene, 1989; Cornaire et al.,1994) and growth of oil palm. Within the soil profile havingroots, their main activity is located in the upper 80 cm of thesoil and particularly in the surface horizon (Jourdan and Rey,1997b). Water extraction occurs preferentially and rapidly inthis zone (Nelson et al., 2006). Consequently, both the instan-taneous parameter CWB and the cumulative parameter FTSWwere considered in the analysis.
The present results suggest that drought affected vegetativegrowth and development very differently from that of thereproductive system. Leaf and stem mass gain, as well asleaf expansion rates, were affected in real time by drought(within the temporal resolution of sampling which wasmonthly). Phyllochron of oil palm has been reported to bevery sensitive to water deficit followed by rapid appearanceand expansion of leaves as the stress subsides (Corley, 1977;Nouy et al., 1999), a behaviour that has been termed develop-mental plasticity (Tesfaye et al., 2006).
In contrast, reproductive organ growth and its main develop-mental component, the frequency of appearance of fertile,female inflorescences, was affected by drought with an estimated
lag of 29 months before bunch harvest. The seemingly irregularfluctuations of reproductive growth (Corley, 1977; Dufour et al.,1988) have been attributed to several drought-sensitive phasesduring the approx. 4 years of development from phytomerinitiation to bunch maturity, each sensitive phase correspondingto a different yield component (Corley, 1977; Dufour et al., 1988;Adam et al., 2005). The main yield components of oil palm arebunch number per palm, bunch weight and oil content. Bunchnumber depends on sex differentiation (determined 30–32months before bunch harvest) and rate of inflorescence abortion(9–11 months before harvest; Corley, 1976, 1977; Dufour et al.,1988). Bunch weight is determined by fruit number and finally byoil synthesis (3–4 months before harvest). Environment thusaffects yield by modifying developmental events largely beforethe main reproductive growth processes take place. The presentconclusion that strong drought effects on bunch numberhappen 29 months before harvest are supported by Dufouret al. (1988) who reported one of several sensitive phases tooccur 30 months before harvest. Dufour et al. (1988) andCaliman and Southworth (1998) found a sensitive periodaround 10 months before harvest in Ivory Cost and theLampung province in Indonesia. The two sensitive phasesprobably correspond to sexual differentiation (approx. 29 or 30months before harvest) and abortion (approx. 10 months beforeharvest; Corley, 1976, 1977; Dufour et al., 1988). The seconddrought-sensitive phase may coincide with the PP-sensitivephase as estimated here, making their distinction difficult.
How does the plant cope with seasonal sink–source imbalances?
The long lag periods of drought stress effects on reproduc-tive growth and development, combined with the apparentabsence of such lag periods for vegetative growth, are boundto cause sink–source imbalances in the plant. Mialet-Serraet al. (2008) recently addressed this problem for coconut,hypothesizing that sugar reserves may buffer such imbalances.They found, however, that the main adjustment at the whole-plant level was variable total growth and, in particular, repro-ductive growth. The most marked period of high growth rate(high assimilate demand for structural vegetative and fruitgrowths) followed a severe dry season and was associatedwith humid conditions when photosynthetically active radi-ation is low. Remarkably, during this period of high demandfor assimilates and comparatively low photosyntheticallyactive radiation, storage of starch was high (data not shown),possibly indicating that assimilates were not limiting, associ-ated with high rates of photosynthesis (data not shown), con-flicting with the view that oil palm yields are mostly sourcelimited (Henson, 2007).
Perspectives for an integrative model of oil palm
The present results provide crucial elements for the develop-ment of a model for oil-palm development and growth. Nomodel currently exists that captures the specificities of thisplant shared in part with other members of the palm familysuch as coconut (Mialet-Serra, 2005; Mialet-Serra et al.,2008): regular successions of phytomers on a single axis thateach potentially produces an inflorescence, a range of pheno-logical adjustment processes to environmental events during
Legros et al. — Oil palm responses to climate 1181
Dow
nloaded from https://academ
ic.oup.com/aob/article/104/6/1171/185054 by guest on 02 August 2022

specific sensitive stages of phytomer development along itsmulti-annual phenology, sink–source imbalances, to someextent, stored reserves and, to be confirmed by furtherstudies, photoperiodic control of flowering resulting inlatitude-specific, seasonal maxima of flowering and fruiting.Such a model would not only be of interest to oil palm agro-nomists and breeders but also encapsulate the physiologicaland developmental organization of a plant type that differsmarkedly from other cultivated plants such as cereals,legumes and dicotyledonous trees.
ACKNOWLEDGEMENTS
The authors would like to thank SMARTRI. We gratefullyacknowledge the estate managers of Kandista and BatuMulia for their logistic and technical support in the fieldwithout which this study could not have been undertakenand in particular, Ms Reni, Ms Rosna, Mr Rinto,Mr Pujianto and Mr Agus for their precious help with datacollecting during field experiments. Lastly, we wish to thankPT SMART Tbk. for partial funding of this study.
LITERATURE CITED
Adam H, Jouannic S, Escoute J, Duval Y, Verdeil J-L, Tregear JW. 2005.Reproductive developmental complexity in the African oil palm (Elaeisguineensis, Arecaceae). American Journal of Botany 92: 1836–1852.
Allen RG, Pereira LS, Raes D, Smith M. 1998. Crop evapotranspiration –guidelines for computing crop water requirements. FAO irrigation anddrainage paper no. 56. Rome: Food and Agriculture Organization of theUnited Nations.
Almorox J, Hontoria C, Benito M. 2005. Statistical validation of daylengthdefinitions for estimation of global solar radiation in Toledo, Spain.Energy Conversion and Management 46: 1465–1471.
Benoit P. 1977. The start of the growing season in Northern Nigeria.Agricultural Meteorology 18: 91–99.
Borchert R, Renner SS, Calle Z, et al. 2005. Photoperiodic induction of syn-chronous flowering near the Equator. Nature 433: 627–629.
Bredas J, Scuvie L. 1960. Apercu des influences climatiques sur les cycles deproduction du palmier a huile. Oleagineux 15: 211–222.
Caliman JP, Southworth A. 1998. Effect of drought and haze on the perform-ance of oil palm. IOPRI international oil palm conference: commodity ofthe past, today and the future. Bali, Indonesie, 23–25 September.Montpellier: CIRAD-CP.
Clerget B, Dingkuhn M, Chantereau J, Hemberger J, Louarn G,Vaksmann M. 2004. Does panicle initiation in tropical sorghumdepend on day-to-day change in photoperiod? Field Crops Research88: 21–37.
Corley RHV. 1976. Inflorescence abortion and sex differentiation. In: CorleyRHV, Hardon JJ, Wood BJ. eds. Oil palm research. Amsterdam: ElsevierScientific Publishing Company.
Corley RHV. 1977. Oil palm yield components and yield cycles. In: Earp DA,Newall W. eds. International developments in oil palm. Kuala Lumpur,Malaysia: Incorporated Society of Planters, 116–129.
Corley RHV, Gray BS. 1976. Yield and yield components. In: Corley RHV,Woods BJ. eds. Developments in crop science. 1. Oil palm research.Amsterdam: Elsevier Scientific Publishing Company.
Corley RHV, Tinker PB. 2003. The oil palm, 4th edn. Oxford: BlackwellScience.
Cornaire B, Daniel C, Zuily-Fodil Y, Lamade E. 1994. Le comportement dupalmier a huile sous stress hydrique: donnees du probleme, premiersresultats et voies de recherche. Oleagineux 49: 1–11.
Dufour O, Frere JL, Caliman JP, Hornus P. 1988. Presentation d’unemethode simplifiee de prevision de la production d’une plantation de pal-miers a huile a partir de la climatologie. Oleagineux 43: 271–282.
Dufrene E. 1989. Photosynthese, consommation en eau, et modelisation de laproduction chez le palmier a huile (Elaeis guineensis Jacq.). Doctorat esSciences, Universite de Paris-Sud, Centre d’Orsay.
Dufrene E, Saugier B. 1993. Gas exchange of oil palm in relation to light,vapour pressure deficit, temperature and leaf age. Oleagineux 48: 347–356.
Esteulle B, Perennes J. 2007. Chronique des huiles vegetales et de leursderives. Groupe DAGRIS 3.
FAO. 1996. Soil Resources, Management and Conservation Service. FAOSoils Bulletin 73. Rome.
Forsythe WC, Rykiel EJ, Stahl RS, Wu H-i, Schoolfield RM. 1995.A model comparison for daylength as a function of latitude and day ofyear. Ecological Modelling 80: 87–95.
Hemptinne J, Ferwerda JD. 1961. Influence des precipitations sur les pro-ductions du palmier a huile (Elaeis Jacq.). Oleagineux 16: 431–437.
Henson IE. 1999. Notes on oil palm productivity. V. Evaluation of alternativemechanisms for supporting seasonal variation in dry matter production.Journal of Oil Palm Research II: 41–52.
Henson IE. 2006. Modelling the impact of climatic and climate-related factorson oil palm growth and productivity. MPOB Technology 28: 1–43.
Henson IE. 2007. Modelling the effects of physiological and morphological char-acters on oil palm growth and productivity. Oil Palm Bulletin 54: 1–26.
Henson IE, Mohd Tayeb D. 2004. Seasonal variation in yield and developmen-tal processes in an oil palm density trial on a peat soil. I. Yield and bunchnumber components. Journal of Oil Palm Research 16: 88–105.
Jackson SD. 2009. Plant responses to photoperiod. New Phytologist 181:517–531.
Jones LH. 1997. The effects of leaf pruning and other stresses on sex deter-mination in the oil palm and their representation by a computer simu-lation. Journal of Theoretical Biology 187: 241–260.
Jourdan C, Rey H. 1997a. Architecture and development of the oil-palm(Elaeis guineensis Jacq.) root system. Plant and Soil 189: 33–48.
Jourdan C, Rey H. 1997b. Modelling and simulation of the architecture anddevelopment of the oil palm (Elaeis guineensis Jacq.) root system. Plantand Soil 190: 217–233.
Kar G, Verma HN. 2005. Climatic water balance, probable rainfall, rice cropwater requirements and cold periods in AER 12.0 in India. AgriculturalWater Management 72: 15–32.
Kouressy M, Dingkuhn M, Vaksmann M, Clement-Vidal A, Chantereau J.2008. Potential contribution of dwarf and leaf longevity traits to yieldimprovement in photoperiod sensitive sorghum. European Journal ofAgronomy 28: 195–209.
Maillard G, Daniel C, Ochs R. 1974. Analyse des effets de la secheresse surle palmier a huile. Oleagineux 29: 397–404.
Mialet-Serra I, Clement-Vidal A, Sonderegger N, et al. 2005. Assimilatestorage in vegetative organs of coconut (Cocos nucifera). ExperimentalAgriculture 41: 161–174.
Mialet-Serra I, Clement-Vidal A, Roupsard O, Jourdan C, Dingkuhn M.2008. Whole-plant adjustments in coconut (Cocos nucifera) in responseto sink–source imbalance. Tree Physiology 28: 1199–1209.
Mishra A, Hansen JW, Dingkuhn M, et al. 2008. Sorghum yield predictionfrom seasonal rainfall forecasts in Burkina Faso. Agricultural and ForestMeteorology 148: 1798–1814.
Nelson PN, Banabas M, Scotter DR, Webb MJ. 2006. Using soil waterdepletion to measure spatial distribution of root activity in oil palm(Elaies guineensis Jacq.) plantations. Plant and Soil 286: 109–121.
Nouy B, Baudouin L, Djegui N, Omore A. 1999. Le palmier a huile en con-ditions hydriques limitantes. Plantation, Recherche, Developpement,Janvier–Fevrier 1999: 31–40.
Rivera G, Borchert R. 2001. Induction of flowering in tropical trees by a30-min reduction in photoperiod: evidence from field observations andherbarium specimens. Tree Physiology 21: 201–212.
Sinclair TR, Ludlow MM. 1986. Influence of soil water supply on the plantwater balance of four tropical grain legumes. Australian Journal of PlantPhysiology, 13: 329–341.
Singh KP, Kushwaha CP. 2006. Diversity of flowering and fruiting phenol-ogy of trees in a tropical deciduous forest in India. Annals of Botany97: 265–276.
Sultan B, Baron C, Dingkuhn M, Sarr B, Janicot S. 2005. Agriculturalimpacts of large-scale variability of the West African monsoon.Agricultural and Forest Meteorology 128: 93–110.
Tesfaye K, Walker S, Tsubo M. 2006. Radiation interception and radiationuse efficiency of three grain legumes under water deficit conditions in asemi-arid environment. European Journal of Agronomy 25: 60–70.
Yeang H-Y. 2007. Synchronous flowering of the rubber tree (Hevea brasilien-sis) induced by high solar radiation intensity. New Phytologist 175:283–289.
Legros et al. — Oil palm responses to climate1182
Dow
nloaded from https://academ
ic.oup.com/aob/article/104/6/1171/185054 by guest on 02 August 2022