Sediment transport and channel adjustments associated with dam removal: Field observations
14
Sediment transport and channel adjustments associated with dam removal: Field observations Fang Cheng 1,2 and Tim Granata 1 Received 20 May 2005; revised 4 August 2006; accepted 31 August 2006; published 31 March 2007. [1] This study documents changes in channel geometry, bed level profile, and bed grain size distribution and their relations with the sediment transport at the reach scale, following the removal of a low-head dam. After the removal, net sediment deposition occurred downstream of the dam, and net erosion occurred in the reservoir, but approximately less than 1% of the sediment stored in the reservoir was transported downstream. No bank erosion was evident either upstream or downstream of the dam. Bed deposition and scouring in the reservoir accounted for a decrease in the bed slope of 30%. The stations downstream of the dam had surface bed material sizes at least 40% finer than preremoval conditions. However, the sediment transport rates downstream of the dam were not significantly different from predam to postdam removal or from an upstream control. Overall, the removal of the dam had only minor effects on the channel adjustment downstream of the dam. A simple analysis linking transport to channel geometry explains this effect. Citation: Cheng, F., and T. Granata (2007), Sediment transport and channel adjustments associated with dam removal: Field observations, Water Resour. Res., 43, W03444, doi:10.1029/2005WR004271. 1. Introduction [2] Approximately 75,000 dams over 1.8 m high have been registered in the United States [Graf, 1999; Heinz Center, 2002]. More than 80% of them will be beyond the designed life span (50 years) by 2020 [Evans et al., 2000]. Removal of the aging dams has gathered national attention during the past decade. During the past 20 years over 550 dams have been removed in the United States [Granata et al., 2007] and more may be removed in the future as dams age [Doyle et al., 2005]. Part of the interest and enthusiasm in dam removal is as a restoration tool [Grant, 2001]. Many dam removal studies have focused on ecolog- ical impacts of dam removal [Shuman, 1995; Scruton et al., 1998; Bednarek, 2001; Bushaw-Newton et al. , 2002; Stanley et al., 2002; Pollard and Reed, 2004; Sethi et al., 2004; Ahearn and Dahlgren, 2005; Downward and Skinner, 2005; Gillette et al., 2005; Graf, 2005; Thomson et al., 2005; Tiemann et al., 2005a, 2005b]. One of the key issues surrounding restoration is sediment transport after dam removal and has been addressed in a series of papers being published in a conference proceeding on sediment transport after dam removal [Moglen, 2005]. Other studies have also been done to compare predam and postdam removal conditions to address mechanisms of channel recovery [Bushaw-Newton et al., 2002; Doyle et al., 2003]. Flushing of bed sediments from the reservoir after the removal is the main concern [Pizzuto, 2002] given the large uncertainty of how these sediments are transported. Hart et al. [2002] documented that 15 of 15 studies reported increased bed material transport after sediment was released from reser- voirs, and Doyle et al. [2002] reported an additional four studies on removals or dam failures with high sediment loading. The major factors regulating sediment transport from a reservoir are discharge rate and duration, sediment size and type, and sediment supply [Wohl and Cenderelli, 2000; Doyle et al., 2003], however, the effects of transport on channel adjustment are varied [Bushaw-Newton et al., 2002]. For dams impoundments filled with sediment, the current theories on channel adjustment suggest that after dam re- moval there could be incision of dam fill and widening of the river channel via headcutting of dam fill [Doyle et al., 2003], fill dispersion [Lisle et al., 1997, 2001; Pizzuto, 2002], and coarsening of fill [Bushaw-Newton et al., 2002]. Flume studies of noncohesive sediments behind a model dam showed incision of fill but narrowing of the channel after the removal [Cantelli et al., 2004; Wong et al., 2004]. Reservoirs of many low-head dams (<5 m in height) are not filled with sediment [MacBroom, 2005], however, and transport associated with these dam removals may differ. For example, Granata et al. [2007] showed minor suspended sediment loading during the removal of a low-head dam which had sediment deposits farther upstream in the im- poundment but not directly behind the dam, but which may be typical of most small dam removals. [3] The general goal of this study was to resolve uncer- tainties in the removal of a low-head dam where sediments accumulated far upstream in the dam impoundment but not immediately behind the dam (hence no headcutting occurred at the dam). For 10 months following the removal of the St. John Dam, repeated observations documented the changes in channel geometry and bed material relative to sediment transport by comparing a control reach to reaches in the reservoir and downstream of the dam. Specifically, 1 Department of Civil and Environmental Engineering and Geodetic Science, Ohio State University, Columbus, Ohio, USA. 2 CDM, Columbus, Ohio, USA. Copyright 2007 by the American Geophysical Union. 0043-1397/07/2005WR004271 W03444 WATER RESOURCES RESEARCH, VOL. 43, W03444, doi:10.1029/2005WR004271, 2007 1 of 14
Transcript of Sediment transport and channel adjustments associated with dam removal: Field observations

Sediment transport and channel adjustments associated
with dam removal: Field observations
Fang Cheng1,2 and Tim Granata1
Received 20 May 2005; revised 4 August 2006; accepted 31 August 2006; published 31 March 2007.
[1] This study documents changes in channel geometry, bed level profile, and bed grainsize distribution and their relations with the sediment transport at the reach scale,following the removal of a low-head dam. After the removal, net sediment depositionoccurred downstream of the dam, and net erosion occurred in the reservoir, butapproximately less than 1% of the sediment stored in the reservoir was transporteddownstream. No bank erosion was evident either upstream or downstream of the dam. Beddeposition and scouring in the reservoir accounted for a decrease in the bed slope of 30%.The stations downstream of the dam had surface bed material sizes at least 40% finer thanpreremoval conditions. However, the sediment transport rates downstream of the damwere not significantly different from predam to postdam removal or from an upstreamcontrol. Overall, the removal of the dam had only minor effects on the channel adjustmentdownstream of the dam. A simple analysis linking transport to channel geometry explainsthis effect.
Citation: Cheng, F., and T. Granata (2007), Sediment transport and channel adjustments associated with dam removal: Field
observations, Water Resour. Res., 43, W03444, doi:10.1029/2005WR004271.
1. Introduction
[2] Approximately 75,000 dams over 1.8 m high havebeen registered in the United States [Graf, 1999; HeinzCenter, 2002]. More than 80% of them will be beyond thedesigned life span (50 years) by 2020 [Evans et al., 2000].Removal of the aging dams has gathered national attentionduring the past decade. During the past 20 years over550 dams have been removed in the United States [Granataet al., 2007] and more may be removed in the future asdams age [Doyle et al., 2005]. Part of the interest andenthusiasm in dam removal is as a restoration tool [Grant,2001]. Many dam removal studies have focused on ecolog-ical impacts of dam removal [Shuman, 1995; Scruton et al.,1998; Bednarek, 2001; Bushaw-Newton et al., 2002;Stanley et al., 2002; Pollard and Reed, 2004; Sethi et al.,2004; Ahearn and Dahlgren, 2005; Downward and Skinner,2005;Gillette et al., 2005; Graf, 2005; Thomson et al., 2005;Tiemann et al., 2005a, 2005b]. One of the key issuessurrounding restoration is sediment transport after damremoval and has been addressed in a series of papers beingpublished in a conference proceeding on sediment transportafter dam removal [Moglen, 2005]. Other studies have alsobeen done to compare predam and postdam removalconditions to address mechanisms of channel recovery[Bushaw-Newton et al., 2002; Doyle et al., 2003]. Flushingof bed sediments from the reservoir after the removal is themain concern [Pizzuto, 2002] given the large uncertainty ofhow these sediments are transported. Hart et al. [2002]
documented that 15 of 15 studies reported increased bedmaterial transport after sediment was released from reser-voirs, and Doyle et al. [2002] reported an additional fourstudies on removals or dam failures with high sedimentloading. The major factors regulating sediment transportfrom a reservoir are discharge rate and duration, sedimentsize and type, and sediment supply [Wohl and Cenderelli,2000;Doyle et al., 2003], however, the effects of transport onchannel adjustment are varied [Bushaw-Newton et al., 2002].For dams impoundments filled with sediment, the currenttheories on channel adjustment suggest that after dam re-moval there could be incision of dam fill and widening of theriver channel via headcutting of dam fill [Doyle et al., 2003],fill dispersion [Lisle et al., 1997, 2001; Pizzuto, 2002], andcoarsening of fill [Bushaw-Newton et al., 2002]. Flumestudies of noncohesive sediments behind a model damshowed incision of fill but narrowing of the channel afterthe removal [Cantelli et al., 2004; Wong et al., 2004].Reservoirs of many low-head dams (<5 m in height) arenot filled with sediment [MacBroom, 2005], however, andtransport associated with these dam removals may differ. Forexample, Granata et al. [2007] showed minor suspendedsediment loading during the removal of a low-head damwhich had sediment deposits farther upstream in the im-poundment but not directly behind the dam, but which maybe typical of most small dam removals.[3] The general goal of this study was to resolve uncer-
tainties in the removal of a low-head dam where sedimentsaccumulated far upstream in the dam impoundment but notimmediately behind the dam (hence no headcuttingoccurred at the dam). For 10 months following the removalof the St. John Dam, repeated observations documented thechanges in channel geometry and bed material relative tosediment transport by comparing a control reach to reachesin the reservoir and downstream of the dam. Specifically,
1Department of Civil and Environmental Engineering and GeodeticScience, Ohio State University, Columbus, Ohio, USA.
2CDM, Columbus, Ohio, USA.
Copyright 2007 by the American Geophysical Union.0043-1397/07/2005WR004271
W03444
WATER RESOURCES RESEARCH, VOL. 43, W03444, doi:10.1029/2005WR004271, 2007
1 of 14

the study addresses: (1) the adjustment in channel geometryfrom predam to postdam removal; (2) the changes intransport rates; (3) the changes in the size of the bedmaterial; and (4) the link between sediment transport andchannel adjustment.[4] This paper is organized into six sections. Section 2 is
a description of the study site, the dam removal, and thelocations of the sampling stations. Section 3 explains thesampling design, methods, and data analysis. The designincluded predam and postdam removal surveys to determinechanges in (1) bed levels of cross sections, longitudinalprofiles of the bed, and reach scale elevations using digitalelevation models (DEMs), (2) sediment loading rates (esti-mated from sediment traps and bed volumes fromdifferenced DEMs), and (3) the size distributions of thematerial on the surface and subsurface of the bed and in thesediment traps. Section 4 presents the results from prere-moval to postremoval showing that the reservoir degradedafter the removal yet only small volume of fine sandaggraded downstream. Estimated rates of transport werelow and confirmed the morphological data. Section 5 is adiscussion of the results and of past studies. The sizedistribution of surface and subsurface sediments fromupstream to downstream of the dam indicate that only finesediments were transported downstream. An analytical
equation was derived and used to explain how channelwidth and elevation are related to sediment transport post-dam removal for this and other studies. Finally, the con-clusions in section 6, restate the major themes in the paper,namely, that (1) downstream sediments are finer after theremoval, (2) the bed slope in the reservoir decreased as sanddeposits in the reservoir were eroded and reservoir depres-sions were filled, and (3) the decrease in channel slopepromoted low sediment transport rates downstream.
2. Site Description
[5] The Sandusky River Watershed is a coastal watershedthat drains 3637 km2 in the predominately (80%) agricul-tural region of north central Ohio. The St. Johns Dam was a46 m long, 2.2 m high concrete structure located on theSandusky River at river kilometer (RKm) 80 (Figure 1). Thedam was constructed during the early 1900s for power andwater supply. The drainage area at St. Johns Dam is1974 km2, the average river width downstream of the damis 20 m, and the slope of downstream channel is 0.06%. Thereservoir impounded by the dam extended 13 km with anaverage width of 30 m and a channel slope of 0.01%. Totalreservoir area and storage was approximately 0.38� 106 m2,and 0.56 � 106 m3, respectively. Sediment did not fill theimpoundment from the dam to 1 km upstream of thestructure. Rather, sediments in the impoundment accumu-lated 1 to 12 km upstream of the dam and were mostlycomposed of sand and gravel. The average thickness of theimpounded sediments was 1 m, determined using a staff toprobe to the underlying bedrock in 10 locations throughoutthe reservoir. The volume of sediment in the impoundmentwas estimated as 0.2 � 106 m3. Throughout the study regionthe underlying material was limestone bedrock, however itwas only exposed at the dam site, 50 m upstream and 50 mdownstream of the dam. The St. Johns Dam was partiallybreached in March 2003 and removed completely inNovember 2003 [Granata et al., 2007]. Prior to the breachand removal, a series of seven sampling stations wereestablished, three upstream of the dam (UP3, UP2 andUP1) and four downstream (DN1, DN2, DN3, and DN4)of the dam (Figure 1). Stations UP3, UP2 and UP1 werelocated at distances of �12.5 km, �2.3 km, and �50 mupstream of the dam and stations DN1, DN2, DN3 and DN4were located at distances of 75 m, 200 m, 600 m, and 3.6 kmdownstream of the dam (Table 1). The criteria for choosingthe stationswere (1) easy access, (2) no log jamswithin 300m(i.e., >10 times river width) upstream and downstream,(3) smooth cross-channel slope change, and (4) no majortributaries flowing into the river section between the farthestupstream station (UP3) and the farthest downstream station(DN4). The upstream most station (UP3) was beyond thebackwater influence of the dam and therefore acted as acontrol to determine the natural variability of the river. Onlystation DN3 was located in a meandering reach; the otherstations were in relatively straight runs. Table 1 lists thevariables sampled and sampling dates for each station.
3. Methods
3.1. Cross Sections and Topographic Channel Surveys
[6] The bed elevation was surveyed at all seven stationsbefore and after the dam removal. At each station, 2 to
Figure 1. Diagram of the study site with the location ofthe stations upstream and downstream of the dam. Theinsets show the location of the dam within the state of Ohioand the Sandusky River watershed.
2 of 14
W03444 CHENG AND GRANATA: DAM REMOVAL, SEDIMENT TRANSPORT, AND CHANNEL ADJUSTMENT W03444
6 cross sections were surveyed, spaced 2 m to 3 m apart inthe downstream direction. When water level permitted,stations DN1, DN2, DN3, DN4, and UP3 were surveyedwith a Trimble1 5700 GPS receiver (rover) sampled at1 Hz. By slowly traversing the cross section perpendicularto the bank, the GPS produced a horizontal spacingbetween points of <5 cm. The stream banks (boundaries)and floodplains were surveyed using a SOKKIA Set5Etotal station. At higher water levels (i.e., in the reservoir atUP1 and UP2), the GPS was integrated with an acousticDoppler profiler (ADP) deployed from a canoe, where theGPS measured the water surface elevation and the ADPmeasured the depth from the submerged ADP to thechannel bed. Total water depth was determined by addingthe depth from the ADP to the bed, to the water depthabove the ADP, measured using a pressure sensor in theADP housing. GPS data were averaged over a 5 s windowto match the sampling frequency of the ADP (0.2 Hz). Thebed elevation of the channel was computed by subtractingthe total water depth from the averaged water surfaceelevation. Water depth was verified using a calibratedstaff. A description of the principles of the ADP can befound in Rennie et al. [2002] and the SonTek user manual(SonTek, San Diego, California). GPS rover data werereferenced to the National Geodetic Survey base stationat Tiffin, Ohio (7 km baseline distance) using TrimbleGeometrics Office1 in the postkinematic mode giving avertical accuracy of 1 cm.[7] The ADP-GPS system was also used to measure
longitudinal profiles of the thalweg elevation in the reser-voir. This was done by repeatedly crossing the thalwegwhile navigating downstream and mapping bed elevation
relative to the downstream distance. Unfortunately, eleva-tion (GPS) data from the preremoval profile were corruptedand unusable. Thus the preremoval profile only gave depthas a function of longitudinal distance. Further, the surveycould not be repeated prior to the removal. Instead, apreremoval profile was used from a total station surveydone in 1998 by the Geologic Survey, Ohio Department ofNatural Resources (ODNR). Bed elevations taken at selectstations in 2003 verified the 1998 profile was similar to the2003 profile. This was done by comparing the elevationsand depths in the 1998 profile to elevations from crosssections taken prior to the removal and to the longitudinaldepth distribution from the preremoval ADP survey.[8] DEMs were produced at DN1, DN3, and UP1
stations. At each station, DEMs with a 0.25 m grid sizewere generated by Kriging interpolation in ArcGISTM. Allthe surveyed points within the grid were averaged, and themean represented the elevation value of that grid location.The averaged survey point density was greater than2 points/m2, except for the UP1 preremoval survey whichhad 0.1 points/m2 due to the ADP sampling frequency of0.2 Hz. The resolution of the DEMs were much higher inthe cross-stream direction than in the downstream direc-tion, which was acceptable since it was assumed thatchannel adjustments were more pronounced in the crossstream direction than in the longitudinal direction. Theareas surrounding the DEMs were blanked by settingthe elevation to zero, such that the area of interest wasthe same area of the river bed for each pair of DEMs. Inthis way, potential edge problems were eliminated [Lane etal., 2003].
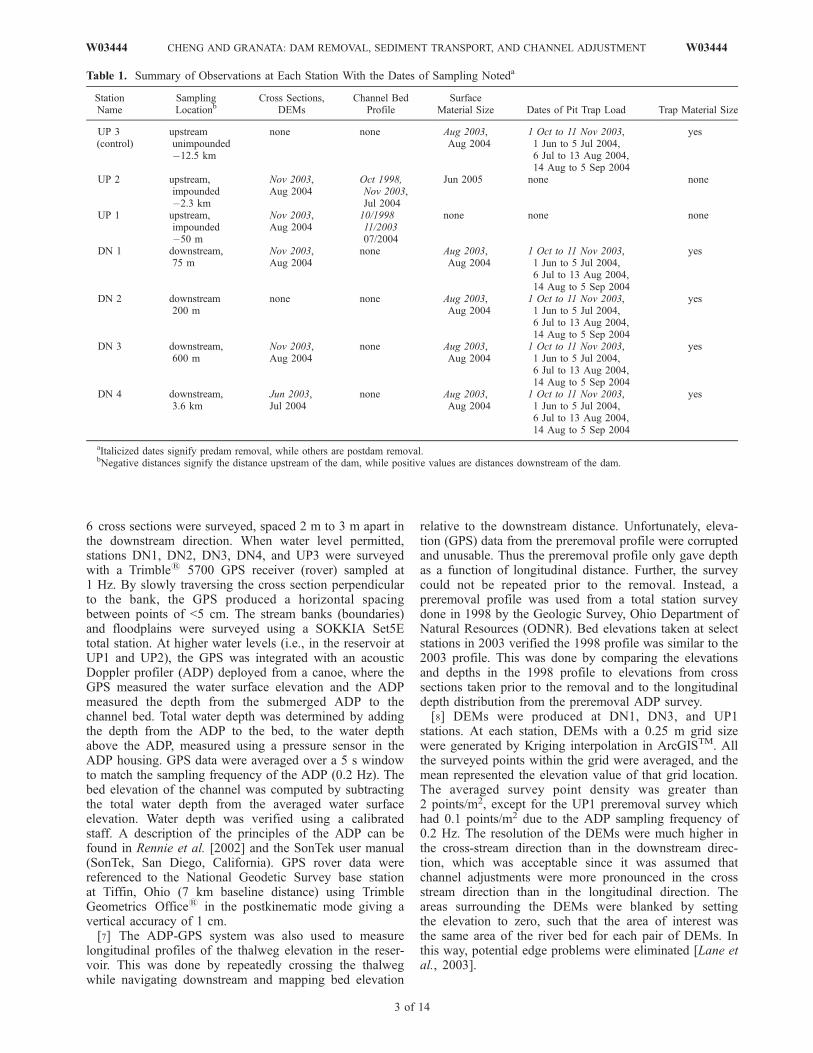
Table 1. Summary of Observations at Each Station With the Dates of Sampling Noteda
StationName
SamplingLocationb
Cross Sections,DEMs
Channel BedProfile
SurfaceMaterial Size Dates of Pit Trap Load Trap Material Size
UP 3(control)
upstreamunimpounded�12.5 km
none none Aug 2003,Aug 2004
1 Oct to 11 Nov 2003,1 Jun to 5 Jul 2004,6 Jul to 13 Aug 2004,14 Aug to 5 Sep 2004
yes
UP 2 upstream,impounded�2.3 km
Nov 2003,Aug 2004
Oct 1998,Nov 2003,Jul 2004
Jun 2005 none none
UP 1 upstream,impounded�50 m
Nov 2003,Aug 2004
10/199811/200307/2004
none none none
DN 1 downstream,75 m
Nov 2003,Aug 2004
none Aug 2003,Aug 2004
1 Oct to 11 Nov 2003,1 Jun to 5 Jul 2004,6 Jul to 13 Aug 2004,14 Aug to 5 Sep 2004
yes
DN 2 downstream200 m
none none Aug 2003,Aug 2004
1 Oct to 11 Nov 2003,1 Jun to 5 Jul 2004,6 Jul to 13 Aug 2004,14 Aug to 5 Sep 2004
yes
DN 3 downstream,600 m
Nov 2003,Aug 2004
none Aug 2003,Aug 2004
1 Oct to 11 Nov 2003,1 Jun to 5 Jul 2004,6 Jul to 13 Aug 2004,14 Aug to 5 Sep 2004
yes
DN 4 downstream,3.6 km
Jun 2003,Jul 2004
none Aug 2003,Aug 2004
1 Oct to 11 Nov 2003,1 Jun to 5 Jul 2004,6 Jul to 13 Aug 2004,14 Aug to 5 Sep 2004
yes
aItalicized dates signify predam removal, while others are postdam removal.bNegative distances signify the distance upstream of the dam, while positive values are distances downstream of the dam.
W03444 CHENG AND GRANATA: DAM REMOVAL, SEDIMENT TRANSPORT, AND CHANNEL ADJUSTMENT
3 of 14
W03444

[9] Sediment deposition or erosion was estimated fromDEMs by differencing predam and postdam removal imagesand applying equation (1),
ie ¼ rs 1� eð ÞVA
ð1Þ
e ¼ 0:4665D�0:2150 � 0:0333 ð2Þ
where ie is the estimated sediment storage (expressed inkg/m2), rs is the sediment density (rs = 2650 kg/m3), e isthe sediment porosity, which is estimated from equation (2)[Carling and Reader, 1982], V is the volume of deposition(m3), A is the area of deposition or erosion (m2) and D50 isthe median particle size of the bed surface material. DEMsediment storage (ie) was converted to a storage rate, qe, asieA/T, where T is the duration of the study in seconds.
3.2. Size Distribution of Bed Surface and SubsurfaceMaterial and Bed Load
[10] Bed surface material size at UP3, DN1, DN2, DN3,and DN4 were estimated using the pebble count method[Wolman, 1954] by randomly walking the cross section. Thesurface layer was defined by the maximum substrate size.Measurements were repeated by the same operator at thesame locations at least twice before and after the damremoval to avoid bias [Wohl et al., 1996]. Subsurfacematerials were also collected. Enough substrates sampleswere collected so that the largest particle in the sampleweighed no more than 5% of the total sample weight[Church et al., 1987]. Substrate maps of the river bed(<3 m horizontal resolution) were provided by the GeologicSurvey of the Ohio Department of Natural Resources.[11] Pit traps were deployed at some cross sections to
simultaneously sample transport of bed material over thecourse of the study [Lisle, 1995; Wilcock et al., 1996]. Trapswere made from PVC pipes, 0.2 m in diameter and 0.3 mdeep. Pit traps have a higher trapping efficiency than theHelley-Smith sampler for materials larger than 0.8 mm[Wilcock, 2001; Sterling and Church, 2002]. The pit trapswere emptied when less than 50% full, which improved thetrapping efficiency because of their low width:depth aspectratio. Sampled in this manner, pit traps do not clog or biassampling, as do Helley-Smith samplers [Vericat et al.,2006]. Three to six pit traps were installed across thechannel at three stations DN1, DN2, and UP3. However,some of them were inaccessible during high flows at DN1,and DN2, therefore only the traps at the shallow positions ateach station were analyzed. The peak discharge during eachrain event (see discharge description later in this section)was taken as the discharge for bed load transport [Wilcock,2001]. All the pit traps were under water when dischargewas greater than 3.4 m3/s (measured with a FlowTrackervelocimeter). The particles captured in the traps were driedat a temperature under 60�C and sieved using US standardsieves. The transport rate of the material was based onsediment accumulated in the pit traps and was computed asqb (g/s) = AcSMb/NAtT, where SMb is the total mass of theparticles collected in the pit traps (in g), T is the duration ofsampling period (in s), N is the number of traps at thestation, and Ac/At is a scaling factor of the ratio of channel
area, Ac to trap area, At, where At = pD2/4 and Ac = WD orthe channel width multiplied by the trap diameter (D).[12] Velocity profiles were measured just upstream of the
pit trap via a handheld Sontek1 FlowTracker acousticDoppler velocimeter. Five to six velocities were measuredat water depths from 13 cm to 50 cm from the surface.Relationships of u(z) vs. ln(z) were plotted for each profile,and a least squares fit applied based on equation (3)[Wilcock, 1996].
u
u�¼ 1
kln
z
z0
� �ð3Þ
[13] Depth-averaged velocities (U) were calculated fromthe fitted lines and then averaged within each station. Theaveraged U was considered to be the mean velocity for theaveraged water depth.
U
u*¼ 1
kln
h
ez0
� �ð4Þ
u* was calculated from equation (4), where u* is shearvelocity (u* = (t0/r)
1=2 ); h is the water depth; k is the vonKarman constant (k = 0.4); z0 is bed roughness elevationwhen u = 0, t0 is bed shear stress, and r is the density ofwater. Because, z0 approximately equals 0.1 D84 [Whitingand Dietrich, 1990], equation (4) was written as
U
u*¼ 1
kln
h
ez0
� �¼ 3:256þ 2:5� ln
h
D84
� �ð5Þ
where D84 is the size for which 84% (by weight) of theparticle distribution is finer. Finally, the Shields parameter,t*, was calculated from equation (6) [Buffington andMontgomery, 1997],
t* ¼ t0rs � rð ÞgD50
¼ru2
*rs � rð ÞgD50
ð6Þ
where g is the gravitational acceleration. It was assumedthat the incipient motion occurred for t* > tc*.[14] Discharge near station UP3 was calculated by the
minimum width:depth ratio method using historic USGSgauge station records. Discharges at stations DN1 andDN2 were calculated using Manning Equation with channelcross sections [Williams, 1978] and a Manning’s coefficientof n = 0.03.
4. Results
4.1. Cross Sections, Bed Profiles, and DEMs
4.1.1. Cross Sections[15] Ten months after the removal of the St. Johns Dam,
channel cross sections showed the river bed was slightlyaggraded at two downstream stations and degraded in thereservoir but had no appreciable change in channel width(Figure 2). At the downstream most station, DN4, there wasno substantial change in bed level from the predam topostdam removal period (Figure 2a). However, closer tothe dam site, stations DN2 and DN3 showed the bedaggraded (Figures 2b and 2c). The upstream and down-
4 of 14
W03444 CHENG AND GRANATA: DAM REMOVAL, SEDIMENT TRANSPORT, AND CHANNEL ADJUSTMENT W03444

stream sections near the dam site, DN1 and UP1 degradedslightly (Figures 2d and 2e), while within the reservoir at,UP2, the channel degraded by nearly 0.5 m (Figure 2f).4.1.2. Channel Bed Profiles[16] A comparison of bed level profiles from the dam site
to �5 km (i.e., upstream) showed both erosion and depo-sition at different locations in the reservoir after the damwas removed. The bed was eroded 20 cm to 40 cm atdistances of �3 km to �4 km upstream of the dam(section A, Figure 3) and by 25 cm to 40 cm at �1 km to
�2.5 km upstream (section C, Figure 3). In contrast, theriver bed degraded by at least 30 cm at �2.5 km to �3 kmupstream (section B, Figure 3). Within, �500 m upstream ofthe dam (section D, Figure 3), bed level had not changedsubstantially. Substrate maps (not shown) indicated thatsands dominated sections A, B, and D, while section Chad mostly gravel. Overall, the average bed slope in thethalweg of the reservoir (from �1000 m to �4500 mupstream of the dam) decreased from 10�4 m/m to
Figure 2. Cross-sectional channel elevation for predam and postdam removal conditions at stations(a) DN4, (b) DN3, (c) DN2, (d) DN1, (e) UP1, and (f) UP2. The predam removal is the dashed line, andthe postdam removal is the solid line.
W03444 CHENG AND GRANATA: DAM REMOVAL, SEDIMENT TRANSPORT, AND CHANNEL ADJUSTMENT
5 of 14
W03444

0.07 � 10�3 m/m, a 30% decrease, excluding the poolsbetween �2300 m and �3100 m.4.1.3. Digital Elevation Models[17] The digital elevation models (DEMs) at three sta-
tions showed that bed level changes in the 3-D topographicsurfaces were highly variable upstream to downstream andfrom bank to bank. Stations DN3 and DN1 showed slightlyaggraded reaches with volumes changes of 9 m3 and 20 m3,respectively (Table 2 and Figures 4a and 4b). (Detailsof volume calculations and errors are discussed inAppendix A.) A bar formed on the left bank of DN1,25 cm above the old bed, while downstream the channeldegraded (Figure 4b). From the dam site to 50 m upstream(UP1), there was one section where the bed aggradedfrom bank to bank forming a riffle, and other areas nearthe bank that degraded (Figure 4c). When volume changeswere averaged over the area of the DEM, the averagenominal elevations changes were less than 5 cm.[18] For DN1, the sediment transport calculated from the
volume change in the DEM was i.e. = 3.5 � 103 g/m2
(based on equations 1 and 2 where D50 = 32 mm, V =8.9 m3, A = 483 m2) giving a net sediment storage rate ofqe = 7.2 � 10�2 g/s over the study period. The estimatedsediment transport at DN3 was 6.2 � 103 g/m2 (D50 =40 mm, V = 20 m3, A = 580 m2), giving a storage rate ofqe = 0.15 g/s.
4.2. Bed Material Size and Transport
4.2.1. Bed and Bed Load Size Distributions[19] After the dam removal, the size distribution of
surface bed material decreased at downstream stations
DN1, DN2, and DN3 (Figures 5b, 5c, and 5d). However,the size distributions for the predam and postdam removalfor stations DN4 and UP3 had little change (Figures 5eand 5a). Prior to the removal, most of the stations had wellsorted sediments except for a riffle on the right bank ofUP3 and the bed at DN1. After the removal, all stations hadwell sorted sediments (Table 3). Despite the evenness insediment sorting at the stations, for all the downstreamstations, except the last one (DN4), the size of the finestfraction decreased (between 34 and 58%) as did the size ofthe coarsest fraction (between 33 and 55%). At thesestations, the median size after the removal decreasedbetween 43%, at DN2 and DN3, up to 60%, at DN1(Table 3). In contrast, the control (UP3) was <9.1% finerand the station farthest downstream (DN4) was only8.5% finer.4.2.2. Total Material Transport[20] Generally, the median size of the materials trans-
ported into the pit traps was smaller after the removal at thetwo downstream stations, DN1 and DN2 (Table 4). At UP3,however, there was no difference in the median size ofthe materials trapped after the removal (Table 4). For allstations except the UP3 (right bank), the median size of thesubsurface material was less than that of the trappedmaterial (Table 4). The size distribution of the trappedmaterial at UP3 remained unchanged over time, except fora coarsening of material in the July sample and a fining inthe August sample (Figure 6a). This was not true of thematerials trapped at DN1 and DN2 where size distributionsshifted to both finer and coarser sediments after the removal(Figures 6b and 6c). Despite this temporal variability, there
Table 2. Summary of DEM Calculations
StationSection Length,
mChannel Width,
mElevation Change,
mmVolume Change,
m3Storage Rate qe,
g/s
UP1, 50 m upstream 60 43 �40 �94 ± 0.7 N/ADN1, 75 m downstream 21 23 24 8.9 ± 0.3 0.07DN3, 600 m downstream 20 29 35 20 ± 0.5 0.15
Figure 3. Profiles of the bed elevation in the thalweg of the reservoir before and after dam removal. Themoving average is a five-point mean of the bed level after the removal. Sections A and C signifydegraded regions, and section B indicates an aggraded region.
6 of 14
W03444 CHENG AND GRANATA: DAM REMOVAL, SEDIMENT TRANSPORT, AND CHANNEL ADJUSTMENT W03444

was a trend in fining of material for the <20% fraction atDN1 over time.[21] Transport rates at the upstream control and stations
downstream of the dam were generally low (�0.1 g/s) andthere were no clear trends in transport rate as a function ofdischarge or time (Figures 7a and 7b). Prior to the damremoval, transport rates were lower at the downstreamstations than at the station upstream, which coincided withlarger size bed materials downstream (Figure 7b). After theremoval, transport rates increased at DN1 and DN2, thendecreased to rates less than those of the control station(UP3). For this sampling period, maximum transport valuesoccurred at DN2 and UP3 while minimum values occurredat DN1 (Figure 7b). The D50 of the sediment transportedincreased with discharge at downstream stations, butremained relatively constant with discharge at the upstreamstation (Figure 7c). Prior to the removal, the downstreamstation trapped coarser material than the control (Figure 7d).The D50 of trapped material at the upstream stationremained relatively constant over time compared to down-stream stations, which tended to decrease in size over timewith some fluctuations (Figure 7d). Despite these fluctua-tions in particle sizes, the D50 values of the trapped materialat the downstream stations attained the size of the materialof the upstream station some 10 months after the removal.[22] The Shields number increased with discharge
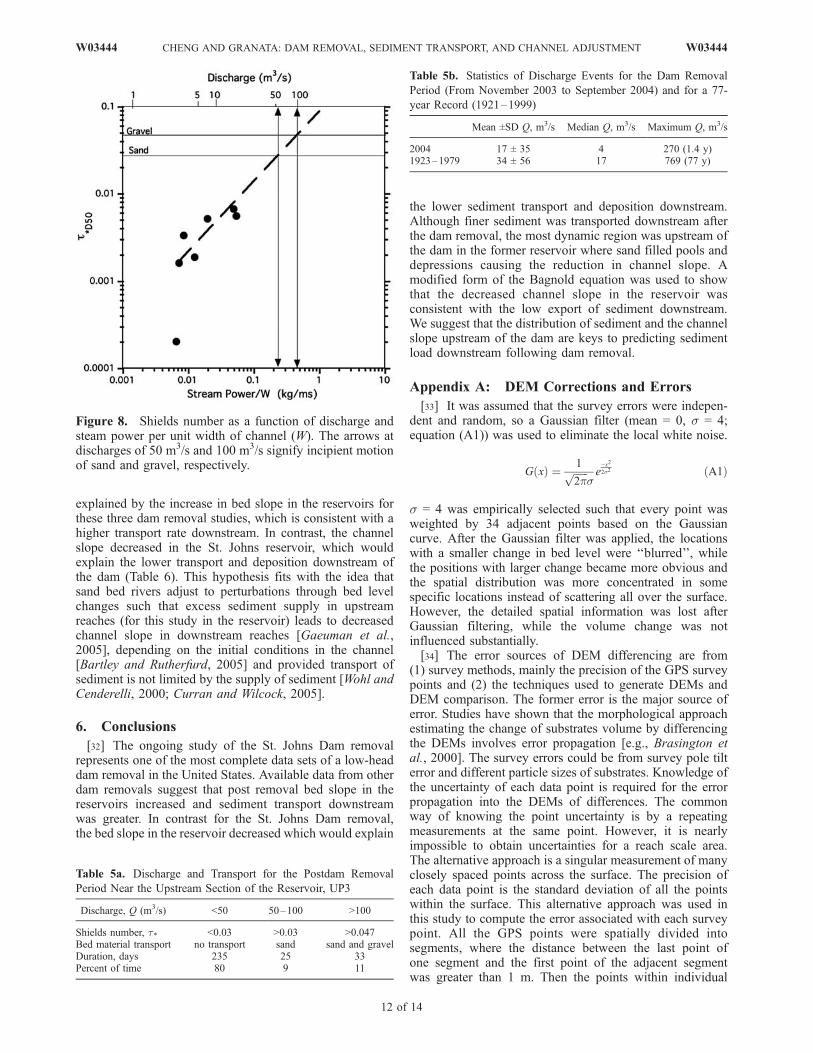
(Figure 8) and, when extrapolated to peak discharges,revealed that sand transport was initiated at 50 m3/s andsand mixed with gravel at >100 m3/s. For the 10 monthperiod after the dam removal (November 2003 to September2004), 80% of the discharge events resulted in critical shearlevels too low to contribute to transport of bed materialbased on the Shields number (Table 5a). The remaining20% of the time, only 12 % of the events were capable oftransporting only sand and another 8% of transporting sandand gravel combined. The most extreme event in 2004 had apeak discharge of 270 m3/s with a 1.4 year return period.The average discharge of 17 m3/s (S.D. of 35 m3/s) fromNovember 2003 to September 2004, the postremoval period,was lower than the 77 year mean of 34 m3/s (S.D. of56 m3/s), but was within one standard deviation (p = 0.68)of the historical mean, indicating that flows were slightlyskewed toward lower values (Table 5b).
5. Discussion
5.1. Postdam Removal Changes in the Sandusky River
[23] Ten months after the low-head dam removal onSandusky River, downstream cross sections within 600 mof the dam became aggraded with at least 40% finer bedmaterial. Still the changes in volume of sediment and bedlevel downstream were minor compared to the changes inthe reservoir. Channel adjustments were restricted to theriver bed and accounted for a moderate decrease in bedslope. The reduced channel slope over the length ofthe reservoir indicated that depressions in the reservoirappeared to act as sinks for much of the sand in thereservoir. Thus, within the reservoir, sand beds weredegraded while gravel beds were aggraded with materialstransported from further upstream in the reservoir. Thoughthe reservoir was a source of sediment, increased storageand the decrease in slope probably restricted the total
Figure 4. Digital elevation maps (DEMs) of the change inthe elevation of the channel bed at stations (a) downstream600 m (DN3), (b) downstream 50 m (DN 1), and(c) upstream �50 m (UP1). DEMs are oriented withdownstream to the top of the image. The right bank of thechannel is oriented to the right of the image (indicated bythe letter R), and the arrows indicate the flow direction.
W03444 CHENG AND GRANATA: DAM REMOVAL, SEDIMENT TRANSPORT, AND CHANNEL ADJUSTMENT
7 of 14
W03444

amount of sediment moving from the reservoir to down-stream reaches. Transport of material out of the reservoirwas limited to a distance of no more than 3.6 km down-stream of the dam, which was confirmed by both the stablecross section and unchanged surface size distributions atDN3. Digital elevation models (DEMs) also showed lowtransport and downstream deposition and provided moredetailed information on erosion and deposition patterns overspatial scales of O(10–100 m), giving a better estimate ofsubstantial bed level changes [Brasington et al., 2000].However, small changes in the bed level (<5 cm) mightnot be detected due to the heterogeneity in river bathometryand substrate size.
[24] On the basis of discharge and shear measurements,transport in 2004 was low but within the historical mean.Despite this, transport based on cross sections, DEMs andsediment trap data showed only small amounts of sand weretransported from the reservoir to downstream sections.Observations that the size of the sand at the upstreamcontrol station was the same as that in the reservoir, thesubsurface material at the downstream stations were lessthan 30% sand (D < 2 mm), and the particles collected inthe traps were 65% sands, support the notion that sedimenttransport during the study period was mainly fine sand.Since the transport of this material had a temporal variationindependent of discharge, it was likely a result of the
Figure 5. Size distributions of surface bed material for predam and postdam removal from upstream todownstream stations. (a) UP3, (b) DN1, (c) DN2, (d) DN3, and (e) DN4.
8 of 14
W03444 CHENG AND GRANATA: DAM REMOVAL, SEDIMENT TRANSPORT, AND CHANNEL ADJUSTMENT W03444

disturbed balance of sediment supply and transport capacity.A conservative estimate of transport of sediment from thedam to 3 km downstream of the dam is 1024 m3, whichconstitutes about 1% of the reservoir sediments (100 �1024 m3/0.2 � 106 m3).[25] Bed material load is known to have temporal vari-
ability and some researchers believed that the temporalvariation in bed load is independent of variations in dis-charge [Gomez et al., 1989; McLean et al., 1999] anddepends on the shear stress history [Monteith and Pender,2005]. Whiting and King [2003] suggested that increasingthe supply of the finer material is not likely to lead tochannel aggradation because the stream has some capacityto transport more material of these sizes. However, aggra-dation could coincide with the increased supply of finematerials [Lane et al., 1995] and lead to bar formationdownstream [Bushaw-Newton et al., 2002]. Indeed, morerecent studies have shown that increased sand suppliescaused channel widening and decreased bed slopes[Bartley and Rutherfurd, 2005; Curran and Wilcock,2005; Gaeuman et al., 2005]. However, laboratory investi-gation have found when sand is released as a pulse frombehind a dam, the channel may rapidly incise and narrow,followed by a slow widening process [Cantelli et al., 2004;Wong et al., 2004]. Therefore the initial conditions ofthe sediment distribution behind the dam [Cui et al.,2006] and channel stability [Bartley and Rutherfurd,2005] are extremely important to subsequent channeladjustments after the release of a sediment pulse.[26] After a pulse of sediment, aggradation may be
transient as finer materials deposited within the downstreamreaches could be entrained and transported further down-stream over time [Lane et al., 1995; Wohl and Cenderelli,2000; Cui and Parker, 2005]. In their study, Wohl andCenderelli [2000] argued that loading rate and dischargeshowed no relationship because fine sediments were depleted
in downstream pools after a pulsed reservoir release. Theyalso attributed the trend of increasing sediment size withdischarge to depletion of finer sediment. The fact thatloading rate did not vary with discharge downstream of thedam, but remained nearly constant at the upstream station,could also indicate that fine material was depleted down-stream. This would also explain why downstream transportrates approached upstream rates then subsequently divergedto lower values. Before the removal of the St. Johns Dam,the river bed below the dam had been scoured, leavingcoarse gravels, probably a result of a limitation in sedimentsupply at DN1 to DN3 [Leopold et al., 1964]. In contrast,after the removal sand had been deposited downstreamcausing surface particles to become finer and the gravelbar downstream of the dam substantially aggraded as a resultof deposition of fine bed materials from the reservoir.Because of the low sediment transport rates, limited supplyof material, and limited extent of deposition (less than 3 kmdownstream), the removal did not adversely affect habitat inthe downstream areas. The variations in the distribution offine sand from the reservoir is consistent with the idea thatthe temporal variation in sand transport was caused bymigration of bed forms and release of sand stored in poolsand other depressions [Lisle et al., 2000; Wohl andCenderelli, 2000]. Part of the reason for the low transportout of the reservoir was a result of the large depressions inthe impoundment which effectively trapped material. Otherreasons might be that the impoundment was not filled withsediment immediately behind the dam and the low frequencyof high discharges in the months after the removal.[27] Bed evolution in the reservoir did not show an
obvious upstream migration of a headcut. In fact, head-cuts in dammed sediments may not be that common[Moglen, 2005]. Headcutting has been noted in otherdam removal cases [Pizzuto, 2002; Doyle et al., 2003].Nearly one year after two dam removals, Doyle et al. [2003]
Table 4. Summary of D50 Values of Trapped Materials for Predam and Postdam Removal Compared to Bed Materials
Station
Trap Material D50, mm Surface Material D50, mm
Subsurface Material D50, mmPreremoval Postremoval Preremoval Postremoval
UP3-LBa 0.5 0.5 0.55 0.51 0.9UP3-RBa ND ND 68 64 0.9DN1 0.8 0.3 80 32 12DN2 0.8 0.4 71 40 10
aSubstrates were collected on the left (LB) and right bank (RB). ND indicates not determined.
Table 3. Sorting of Surface Particles Before and After Dam Removal
Preremoval Size/Postremoval Size
daPercent dDecreaseD16, mm
Percent D16
Decrease D84, mmPercent D84
Decrease
Upstream �12.5 km (UP1)b 46.6/37.8 18 106/96 9 1.51/1.59 �5Upstream �12.5 km (UP1, RB)b 0.28/0.34 �21 1.4/1 28 2.24/1.71 23Downstream 75 m (DN1) 50/21 58 100/45 55 2.24/1.46 34Downstream 200 m (DN2) 49/23 53 90/60 33 1.36/1.62 �19Downstream 600 m (DN3) 42/27.6 34 82/46 43 1.40/1.29 7Downstream 3.6 km (DN4) 38/42 �10 92/92 0 1.56/1.48 5
aHere d =ffiffiffiffiffiffiD84
D16
qis standard error (bed materials are considered to be poorly sorted if d > 2).
bSubstrates were collected on the left (LB) and right bank (RB).
W03444 CHENG AND GRANATA: DAM REMOVAL, SEDIMENT TRANSPORT, AND CHANNEL ADJUSTMENT
9 of 14
W03444

found (1) channel degradation and widening followed byaggradation in the reservoir, (2) temporary or little aggra-dation in downstream sections, and (3) downstream trans-port that was greater for the reservoir with fine sediments(silt and sand) than for the reservoir with consolidatedsediments (sand and gravel). In the Manatawny Creek studyof Bushaw-Newton et al. [2002], no headcut was evidentand while erosion and deposition occurred in different areas,there was channel incision of about 0.50 m at 3 cross-sections upstream of the dam. Bed material in the reservoirwas composed of gravel (cobble-sized sediments) withpatches of sandy pebbly sediments. Silt and clay depositswere limited to the margins of the reservoir. Although it islikely that transport rates in the Manatawny Creek studywere low (J. Pizzuto, personal communication, 2005),sediment transport rates were not measured so there is nobasis for comparison to our study, Still, observations fromother dam removals for similar types of low-head dams arein stark contrast to those of this study where sedimenttransport and bed incision near and below the dam are low.
5.2. Linking Channel Adjustment to SedimentTransport
[28] The two most notable differences of the St. JohnsDam study, compared similar dam removals, are the redis-tribution of reservoir sediments, which reduced the overallbed slope, and the minor amounts of sediments transporteddownstream of the dam. To reconcile the St. Johns Damobservations with other studies, the following analysis ofchannel adjustment is proposed.[29] The slope in the reservoir has the form S0 = �dz/dx
where dz is the change in bed elevation from upstream todownstream sites, and dx is the longitudinal distancebetween the sites. If the bed elevations at the cross sectionsare denoted as zU and zD, then the channel slope is definedby the difference formula: S0 = �(zU0 � zD0)/Dx, where the0 subscript indicates at time, t = 0, which is defined as
the time when dewatering of the reservoir is complete(2–5 hours for most low-head dams [Granata et al., 2007]).At this time the water surface slope is the same as the bedslope which should reflect the preremoval channel slopeunless extensive adjustment occurs for the entire impound-ment. After a dam removal, the bed elevation changes canbe represented as ST = �(zUT � zDT)/Dx at sometime, t = T.On the basis of these equations, three responses are possiblefor the adjustment of the reservoir slope. The slope canincrease, decrease, or remain the same, which can beexpressed in the ratio of ST/S0. For example, the slope willincrease (ST/S0 > 1) if the upstream bed is aggraded, thedownstream bed is degraded, or both. The slope willdecrease (ST/S0 < 1) if the upstream bed is degraded, thedownstream bed is aggraded, or both. Lastly, the slope willremain the same (ST/S0 = 1) if both sites are aggraded ordegraded at the same rate or there is no change in slope overtime.[30] Bed slope is related to sediment transport as, qs =
(rQS/W)3/2 H�2/3 D�1/2, where Q is discharge, S is bedslope, W is the channel width, H is water level, and D issediment size [Bagnold, 1986]. The ratio qST/qSO can beused to assess changes in sediment transport following damremoval. Expanding this ratio gives
qST
qS0¼ rQS=Wð Þ3=2T H
�2=3T D
�1=2T
rQS=Wð Þ3=20 H�2=30 D
�1=20
ð7Þ
If water density, discharge, water level and sediment sizeremain the same after the removal, the equation reduces to
qST
qS0¼ S=Wð Þ3=2T H
�2=3T
S=Wð Þ3=20 H�2=30
ð8Þ
On the basis of the Manning equation, H is
related to S as, QT
Q0¼ WH
5=3T
S1=2T
n�1
WH5=3T
S1=2T
n�1for a wide, rectangular
Figure 6. Size distributions of bed material in pit traps at stations (a) UP3 (upstream �12.5 km),(b) DN1 (downstream 75 m), and (c) DN2 (downstream 200 m).
10 of 14
W03444 CHENG AND GRANATA: DAM REMOVAL, SEDIMENT TRANSPORT, AND CHANNEL ADJUSTMENT W03444

channel. Evaluating the ratio of postdam to predam removalfor the same flow conditions gives a ratio of unity (i.e.,QT/Q0 = 1). The same is true of n andW if it is assumed they donot change, as is the case of the St. John Reservoir. Makingthese substitutions and rearranging the Manning ratio gives
HT
H0
� ��5=3
¼ ST
S0
� �1=2
or simplyHT
H0
� �¼ ST
S0
� ��3=10
ð9Þ
Substituting this expression into the sediment discharge ratioproduces an a relationship based only on W and S,
qST
qS0¼
S=Wð Þ3=2T S�3=10
T
� ��2=3
S=Wð Þ3=20 S�3=10
0
� ��2=3¼ W
3=20 S
3=2T S
1=5T
W3=2T S
3=20 S
1=50
ð10Þ
or simplyqST
qS0¼ W0
WT
� �1:5ST
S0
� �1:7
ð11Þ
[31] Using this equation, the change in bed slope in thereservoir can be related to the change in sediment transportrate. For example if slope were to double, sediment trans-port would increase 3.2 times. If slope were to decrease byhalf, transport would be reduced 3.2 times. A similarapproach was used by Doyle and Harbor [2003] to analyzetimescales of degradation, although it is different in that theEinstein equation, not the Bagnold equation, was used andfocused on knickpoint evolution. Still, their results showthat the reservoir slope will increase toward some equilib-rium, as the headcut moves upstream. Table 6 compareschanges in the reservoir slope for preremoval and postre-moval for the St. Johns Dam and three other reservoirswhere both slope and transport rates could be estimated[Williams, 1977; Doyle et al., 2003]. These other studiesfound increased sediment transport following dam removal,which are in contrast to the low transport rates for theSt. Johns Dam removal. The apparent difference can be
Figure 7. Sediment transport rates (g/s) as a function of (a) discharge (m3/s) and (b) date. D50 fortrapped material (mm) as a function of (c) discharge (m3/s) and (d) date. The shaded symbols in Figures7a and 7c are for the preremoval sampling period. The shaded area at 11/18 in Figures 7b and 7d indicatessampling period before the dam removal.
W03444 CHENG AND GRANATA: DAM REMOVAL, SEDIMENT TRANSPORT, AND CHANNEL ADJUSTMENT
11 of 14
W03444
explained by the increase in bed slope in the reservoirs forthese three dam removal studies, which is consistent with ahigher transport rate downstream. In contrast, the channelslope decreased in the St. Johns reservoir, which wouldexplain the lower transport and deposition downstream ofthe dam (Table 6). This hypothesis fits with the idea thatsand bed rivers adjust to perturbations through bed levelchanges such that excess sediment supply in upstreamreaches (for this study in the reservoir) leads to decreasedchannel slope in downstream reaches [Gaeuman et al.,2005], depending on the initial conditions in the channel[Bartley and Rutherfurd, 2005] and provided transport ofsediment is not limited by the supply of sediment [Wohl andCenderelli, 2000; Curran and Wilcock, 2005].
6. Conclusions
[32] The ongoing study of the St. Johns Dam removalrepresents one of the most complete data sets of a low-headdam removal in the United States. Available data from otherdam removals suggest that post removal bed slope in thereservoirs increased and sediment transport downstreamwas greater. In contrast for the St. Johns Dam removal,the bed slope in the reservoir decreased which would explain
the lower sediment transport and deposition downstream.Although finer sediment was transported downstream afterthe dam removal, the most dynamic region was upstream ofthe dam in the former reservoir where sand filled pools anddepressions causing the reduction in channel slope. Amodified form of the Bagnold equation was used to showthat the decreased channel slope in the reservoir wasconsistent with the low export of sediment downstream.We suggest that the distribution of sediment and the channelslope upstream of the dam are keys to predicting sedimentload downstream following dam removal.
Appendix A: DEM Corrections and Errors
[33] It was assumed that the survey errors were indepen-dent and random, so a Gaussian filter (mean = 0, s = 4;equation (A1)) was used to eliminate the local white noise.
G xð Þ ¼ 1ffiffiffiffiffiffi2p
pse�x2
2s2 ðA1Þ
s = 4 was empirically selected such that every point wasweighted by 34 adjacent points based on the Gaussiancurve. After the Gaussian filter was applied, the locationswith a smaller change in bed level were ‘‘blurred’’, whilethe positions with larger change became more obvious andthe spatial distribution was more concentrated in somespecific locations instead of scattering all over the surface.However, the detailed spatial information was lost afterGaussian filtering, while the volume change was notinfluenced substantially.[34] The error sources of DEM differencing are from
(1) survey methods, mainly the precision of the GPS surveypoints and (2) the techniques used to generate DEMs andDEM comparison. The former error is the major source oferror. Studies have shown that the morphological approachestimating the change of substrates volume by differencingthe DEMs involves error propagation [e.g., Brasington etal., 2000]. The survey errors could be from survey pole tilterror and different particle sizes of substrates. Knowledge ofthe uncertainty of each data point is required for the errorpropagation into the DEMs of differences. The commonway of knowing the point uncertainty is by a repeatingmeasurements at the same point. However, it is nearlyimpossible to obtain uncertainties for a reach scale area.The alternative approach is a singular measurement of manyclosely spaced points across the surface. The precision ofeach data point is the standard deviation of all the pointswithin the surface. This alternative approach was used inthis study to compute the error associated with each surveypoint. All the GPS points were spatially divided intosegments, where the distance between the last point ofone segment and the first point of the adjacent segmentwas greater than 1 m. Then the points within individual
Figure 8. Shields number as a function of discharge andsteam power per unit width of channel (W). The arrows atdischarges of 50 m3/s and 100 m3/s signify incipient motionof sand and gravel, respectively.
Table 5a. Discharge and Transport for the Postdam Removal
Period Near the Upstream Section of the Reservoir, UP3
Discharge, Q (m3/s) <50 50–100 >100
Shields number, t* <0.03 >0.03 >0.047Bed material transport no transport sand sand and gravelDuration, days 235 25 33Percent of time 80 9 11
Table 5b. Statistics of Discharge Events for the Dam Removal
Period (From November 2003 to September 2004) and for a 77-
year Record (1921–1999)
Mean ±SD Q, m3/s Median Q, m3/s Maximum Q, m3/s
2004 17 ± 35 4 270 (1.4 y)1923–1979 34 ± 56 17 769 (77 y)
12 of 14
W03444 CHENG AND GRANATA: DAM REMOVAL, SEDIMENT TRANSPORT, AND CHANNEL ADJUSTMENT W03444

segments were divided into 1 m length subsegments. Itwas assumed that all the points within each subsegmenthave the same precision. The uncertainty of the subsegment,si, was calculated by equation (A2). Then the uncertainty ofall the GPS points, s, is the arithmetic mean of the segmentuncertainties (equation (A3)),
si ¼
ffiffiffiffiffiffiffiffiffiffiffiffiffiffiffiffiffiffiffiffiffiffiffiffiPnj¼1
xj � x� �
n
2vuuut
ðA2Þ
s ¼
Pmi¼1
si
mðA3Þ
where n is the number of points within the subsegment,(xj � x) is the uncertainty of each individual GPS point, andm is the number of the subsegments within the entire surface.Finally, the uncertainty associated with the computation ofvolume change was computed by equation (A4)
sv ¼ d2 s21 � s2
2
� �� N
� �0:5 ðA4Þ
where s1 and s2 is the uncertainty of each cell of the DEM,respectively, N is the number of cells within the surface, d isthe cell size. The volume change is 8.9 ± 0.3 m3 atthe downstream 75 m station, 20 ± 0.5 m3 at downstream600 m, and �94 ± 0.7 m3 at upstream 50 m station,respectively (Table 2).
[35] Acknowledgments. The authors thank Bob Vargo and BobGable of the Scenic Rivers program (Ohio Department of Natural Resour-ces-ODNR) for their logistical support during this project, Connie Livchakand Ryan Murphy (Geological Survey, ODNR) for their data on surfacesubstrate distributions, and Michael Eberle (U.S. Geological Survey) forproviding historical water data. We also thank members of our group, JasonPeterson, Matthew Nechvatal, Daniel Gillenwater, Ryan Wensink, DaleWhite, Ralph Greco, and Christopher Tomsic, for their help in the field.Finally, the authors are indebted to Martin Doyle, Jim Pizzuto, LauraWildman, and Ellen Wohl for their constructive comments on earliermanuscripts. This research was supported by grant 671 from the GreatLakes Protection Fund.
ReferencesAhearn, D. S., and R. A. Dahlgren (2005), Sediment and nutrient dynamicsfollowing a low-head dam removal at Murphy Creek, California, Limnol.Oceanogr., 50, 1752–1762.
Bagnold, R. A. (1986), Transport of solids by natural-water flow—Evidence of a worldwide correlation, Proc. R. Soc. London, Ser. A,405, 369–374.
Bartley, R., and I. Rutherfurd (2005), Re-evaluation of the wave model as atool for quantifying the geomorphic recovery potential of streams dis-turbed by sediment slugs, Geomorphology, 64, 221–242.
Bednarek, A. T. (2001), Undamming rivers: A review of the ecologicalimpacts of dam removal, Environ. Manage., 27, 803–814.
Brasington, J., B. T. Rumsby, and R. A. McVey (2000), Monitoring andmodeling morphological change in a braided gravel-bed river using highresolution GPS-based survey, Earth Surf. Processes Landforms, 25,973–990.
Buffington, J. M., and D. R. Montgomery (1997), A systematic analysis ofeight decades of incipient motion studies, with special reference to grav-el-bedded rivers, Water Resour. Res., 33, 1993–2029.
Bushaw-Newton, K. L., et al. (2002), An integrative approach towardsunderstanding ecological responses to dam removal: The ManatawnyCreek Study, J. Am. Water Resour. Assoc., 38, 1581–1599.
Cantelli, A., C. Paola, and G. Parker (2004), Experiments on upstream-migrating erosional narrowing and widening of an incisionalchannel caused by dam removal, Water Resour. Res., 40, W03304,doi:10.1029/2003WR002940.
Carling, P. A., and N. A. Reader (1982), Structure, composition and bulkproperties of upland stream gravels, Earth Surf. Processes Landforms, 7,349–365.
Church, M. A., D. G. McLean, and J. F. Wolcott (1987), River bed gravels:Sampling and analysis, in Sediment Transport in Gravel-Bed Rivers,edited by C. R. Thorne et al., pp. 43–79, John Wiley, Hoboken, N. J.
Cui, Y., and G. Parker (2005), Numerical model of sediment pulses andsediment supply disturbances in mountain rivers, J. Hydraul. Eng., 131,646–656.
Cui, Y., C. Braudrick, W. E. Dietrich, B. Cluer, and G. Parker (2006), Damremoval express assessment models DREAM, part 2: Sample runs/sen-sitivity tests, J. Hydraul. Res., 44, 308–323.
Curran, J. C., and P. R. Wilcock (2005), Effect of sand supply on transportrates in a gravel-bed channel, J. Hydraul. Eng., 131, 961–967.
Downward, S., and K. Skinner (2005), Working rivers: The geomorpholo-gical legacy of English freshwater mills, Area, 37, 138–147.
Doyle, M. W., and J. M. Harbor (2003), A scaling approximation of equili-brium timescales for sand-bed and gravel-bed rivers responding to base-level lowering, Geomorphology, 54, 217–223.
Doyle, M. W., E. H. Stanley, and J. M. Harbor (2002), Geomorphic analo-gies for assessing probable channel response to dam removal, J. Am.Water Resour. Assoc., 38, 1567–1579.
Doyle, M. W., E. H. Stanley, and J. M. Harbor (2003), Channel adjustmentsfollowing two dam removals in Wisconsin, Water Resour. Res., 39(1),1011, doi:10.1029/2002WR001714.
Doyle, M. W., E. H. Stanley, C. H. Orr, A. R. Selle, S. A. Sethi, and J. M.Harbor (2005), Stream ecosystem response to small dam removal:Lesions from the heartland, Geomorphology, 71, 227–244.
Evans, J. E., S. D. Mackey, J. F. Gottgens, and W. M. Gill (2000), Lessonsfrom a dam failure, Ohio J. Sci., 100, 121–131.
Gaeuman, D., J. C. Schmidt, and P. R. Wilcock (2005), Complex channelresponses to changes in stream flow and sediment supply on the lowerDuchesne River, Utah, Geomorphology, 64, 185–206.
Gillette, D. P., J. S. Tiemann, D. R. Edds, and M. L. Wildhaber (2005),Spatiotemporal patterns of fish assemblage structure in a river im-pounded by low-head dams, Copeia, 3, 539–549.
Gomez, B., R. L. Naff, and D. W. Hubbell (1989), Temporal variations inbedload transport rates associated with the migration of bedforms, EarthSurf. Processes Landforms, 14, 135–156.
Graf, W. L. (1999), Dam nation: A geographic census of American damsand their large-scale hydrologic impacts, Water Resour. Res., 35, 1305–1311.
Graf, W. L. (2005), Geomorphology and American dams: The scientific,social, and economic context, Geomorphology, 71, 3–26.
Granata, T. C., F. Cheng, and M. Nechvatal (2007), Discharge and sus-pended sediment transport during deconstruction of a low-head dam,J. Hydraul. Eng., in press.
Grant, G. (2001), Dam removal: Panacea or Pandora for rivers?, Hydrol.Processes, 15, 1531–1532.
Hart, D. D., T. E. Johnson, K. L. Bushaw-Newton, R. J. Horwitz, A. T.Bednarek, D. F. Charles, D. A. Kreeger, and D. J. Velinsky (2002), Dam
Table 6. Comparison of Bed Slope and Sediment Transport for Dam Removal Studies
S0, m/m ST, m/m ST/S0 qST/qS0 Reference
St. John Dam Reservoir 0.1 � 10�3 0.07 � 10�3 0.7 0.5 this studyRockdale Dam Reservoir 0.7 � 10�3 1 � 10�3 1.4 1.8 Doyle et al. [2003]La Valle Dam Reservoir 0.7 � 10�3 2 � 10�3 2.8 5.7 Doyle et al. [2003]Washington Power Dam Reservoir 0.6 � 10�3 1 � 10�3 1.7 2.5 Williams [1977]
W03444 CHENG AND GRANATA: DAM REMOVAL, SEDIMENT TRANSPORT, AND CHANNEL ADJUSTMENT
13 of 14
W03444

removal: Challenges and opportunities for ecological research and riverrestoration, BioScience, 52, 669–681.
Heinz Center (2002), Dam removal: Status and prospects, report, 151 pp.,Washington, D. C.
Lane, S. N., K. S. Richards, and J. H. Chandler (1995), Morphologicalestimation of the time-integrated bed load transport rate, Water Resour.Res., 31, 761–772.
Lane, S. N., R. M. Westaway, and D. M. Hicks (2003), Estimation oferosion and deposition volumes in a large, gravel-bed, braided river usingsynoptic remote sensing, Earth Surf. Processes Landforms, 28, 249–271.
Leopold, L. D., M. G. Wolman, and J. P. Miller (1964), Fluvial Processes inGeomorphology, W. H. Freeman, New York.
Lisle, T. E. (1995), Particle size variations between bed load and bedmaterial in natural gravel bed channels, Water Resour. Res., 31, 1107–1118.
Lisle, T. E., J. E. Pizzuto, H. Ikeda, F. Iseya, and Y. Kodama (1997),Evolution of a sediment wave in an experimental channel, Water Resour.Res., 33, 1971–1981.
Lisle, T. E., J. M. Nelson, J. Pitlick, M. A. Madej, and B. L. Barkett (2000),Variability of bed mobility in natural, gravel-bed channels and adjust-ments to sediment load at local and reach scales, Water Resour. Res., 36,3743–3755.
Lisle, T. E., Y. Cui, G. Parker, J. E. Pizzuto, and A. M. Dodd (2001), Thedominance of dispersion in the evolution of bed material waves in gravelbed rivers, Earth Surf. Processes Landforms, 26, 1409–1420.
MacBroom, J. G. (2005), Evolution of channels upstream of dam removalsites, in Managing Watersheds for Human and Natural Impacts [CD-ROM], doi:10.1061/40763(178)26, Am. Soc. of Civ. Eng., Reston, Va.
McLean, D. G., M. Church, and B. Tassone (1999), Sediment transportalong lower Fraser River: 1. Measurements and hydraulic computations,Water Resour. Res., 35, 2533–2548.
Moglen, G. E. (Ed.) (2005), Watershed Management 2005: ManagingWatershed for Human and Natural Impacts: Engineering, Ecological,and Economic Challenges, Proceedings of the 2005 Watershed Manage-ment Conference held in Williamsburg, VA, July 19–22, 2005, Am. Soc.of Civ. Eng., Reston, Va.
Monteith, H., and G. Pender (2005), Flume investigations into the influenceof shear stress history on a graded sediment bed, Water Resour. Res., 41,W12401, doi:10.1029/2005WR004297.
Pizzuto, J. E. (2002), Effects of dam removal on river form and process,BioScience, 52, 683–692.
Pollard, A. I., and T. Reed (2004), Benthic invertebrate assemblage changefollowing dam removal in a Wisconsin stream, Hydrobiologia, 513, 51–58.
Rennie, C. D., R. G. Millar, and M. A. Church (2002), Measurement of bedload velocity using an Acoustic Doppler Current Profiler, J. Hydraul.Eng., 128, 473–483.
Scruton, D. A., T. C. Anderson, and L. W. King (1998), Pamehac Brook: Acase study of the restoration of a Newfoundland, Canada, river impactedby flow diversion for pulpwood transportation, Aquat. Conserv., 8, 145–157.
Sethi, S. A., A. R. Selle, M. W. Doyle, E. H. Stanley, and H. E. Kitchel(2004), Response of unionid mussels to dam removal in KoshkonongCreek, Wisconsin (USA), Hydrobiologia, 525, 157–165.
Shuman, J. R. (1995), Environmental considerations for assessing damremoval alternatives for river restoration, Reg. Rivers Res. Manage.,11, 249–261.
Stanley, E. H., M. A. Luebke, M. W. Doyle, and D. W. Marshall (2002),Short-term changes in channel form and macro invertebrate communitiesfollowing low-head dam removal, J. N. Am. Benthol. Soc., 21, 172–187.
Sterling, S. M., and M. Church (2002), Sediment trapping characteristics ofa pit trap and the Helley-Smith sampler in a cobble gravel bed river,Water Resour. Res., 38(8), 1144, doi:10.1029/2000WR000052.
Thomson, J. R., D. D. Hart, D. F. Charles, T. L. Nightengale, and D. M.Winter (2005), Effects of removal of a small dam on downstream macro-invertebrate and algal assemblages in a Pennsylvania stream, J. N. Am.Benthol. Soc., 24, 192–207.
Tiemann, J. S., D. P. Gillette, M. L. Wildhaber, and D. R. Edds (2005a),Effects of lowhead dams on riffle-dwelling fishes and macroinvertebratesin a midwestern river, Trans. Am. Fish. Soc., 133, 705–717.
Tiemann, J. S., D. P. Gillette, M. L. Wildhaber, and D. R. Edds (2005b),Effects of lowhead dams on the ephemeropterans, plecopterans, andtrichopterans group in a North American river, J. Freshwater Biol., 20,519–525.
Vericat, D., R. J. Batalla, and C. Garcia (2006), Breakup and reestablish-ment of the armour layer in a large gravel-bed river below dams: Thelower Ebro, Geomorphology, 76, 122–136.
Whiting, P. J., and W. E. Dietrich (1990), Boundary shear-stress and rough-ness over mobile alluvial beds, J. Hydraul. Eng., 116, 1495–1511.
Whiting, P. J., and J. G. King (2003), Surface particle sizes on armouredgravel streambeds: Effects of supply and hydraulics, Earth Surf. Pro-cesses Landforms, 28, 1459–1471.
Wilcock, P. R. (1996), Estimating local bed shear stress from velocityobservations, Water Resour. Res., 32, 3361–3366.
Wilcock, P. R. (2001), Toward a practical method for estimating sediment-transport rates in gravel-bed rivers, Earth Surf. Processes Landforms, 26,1395–1408.
Wilcock, P. R., A. F. Barta, C. C. Shea, G. M. Kondolf, W. V. GrahamMatthews, and J. Pitlick (1996), Observations of flow and sedimententrainment on a large gravel-bed river, Water Resour. Res., 32, 2897–2909.
Williams, D. T. (1977), Effects of dam removal: An approach to sedimenta-tion, Tech. Rep. 50, 31 pp., Hydraul. Eng. Cent., U.S. Army Corps ofEng., Vicksburg, Miss.
Williams, P. G. (1978), Bankfull discharge of rivers,Water Resour. Res., 14,1141–1154.
Wohl, E. E., and D. A. Cenderelli (2000), Sediment deposition and trans-port patterns following a reservoir sediment release, Water Resour. Res.,36, 319–333.
Wohl, E. E., D. J. Anthony, S. W. Madson, and D. M. Thompson (1996), Acomparison of surface sampling methods for coarse fluvial sediments,Water Resour. Res., 32, 3219–3226.
Wolman, M. G. (1954), A method of sampling coarse river-bed material,Eos Trans. AGU, 35, 951–956.
Wong, M., A. Cantelli, C. Paola, and G. Parker (2004), Erosional narrowingafter dam removal: Theory and numerical model, in Proceedings of theASCE World Water and Environmental Resources Conference [CD-ROM], doi:10.1061/40737(2004)435, Am. Soc. of Civ. Eng., Reston, Va.
����������������������������F. Cheng and T. Granata, Department of Civil and Environmental
Engineering and Geodetic Science, Ohio State University, Columbus, OH43210, USA. ([email protected])
14 of 14
W03444 CHENG AND GRANATA: DAM REMOVAL, SEDIMENT TRANSPORT, AND CHANNEL ADJUSTMENT W03444