First assessment of the plant phenology index (PPI) for ... - arXiv
12
A.M. Abdi a, b, ⁎ , N. Boke-Olén b , H. Jin a , L. Eklundh a , T. Tagesson a , V. Lehsten a, c , J. Ardö a a Department of Physical Geography and Ecosystem Science, Lund University, Sölvegatan 12, SE-223 62 Lund, Sweden b Centre for Environmental and Climate Research, Lund University, Sölvegatan 37, SE-223 62 Lund, Sweden c Swiss Federal Institute for Forest, Snow and Landscape research (WSL), Zürcherstr. 11, CH-8903 Birmensdorf, Switzerland ARTICLE INFO ABSTRACT The importance of semi-arid ecosystems in the global carbon cycle as sinks for CO 2 emissions has recently been highlighted. Africa is a carbon sink and nearly half its area comprises arid and semi-arid ecosystems. However, there are uncertainties regarding CO 2 fluxes for semi-arid ecosystems in Africa, particularly savannas and dry tropical woodlands. In order to improve on existing remote-sensing based methods for estimating carbon uptake across semi-arid Africa we applied and tested the recently developed plant phenology index (PPI). We developed a PPI-based model estimating gross primary productivity (GPP) that accounts for canopy water stress, and com- pared it against three other Earth observation-based GPP models: the temperature and greenness (T-G) model, the greenness and radiation (G–R) model and a light use efficiency model (MOD17). The models were evaluated against in situ data from four semi-arid sites in Africa with varying tree canopy cover (3–65%). Evaluation re- sults from the four GPP models showed reasonable agreement with in situ GPP measured from eddy covariance flux towers (EC GPP) based on coefficient of variation (R 2 ), root-mean-square error (RMSE), and Bayesian infor- mation criterion (BIC). The G–R model produced R 2 = 0.73, RMSE = 1.45 g C m −2 d −1 , and BIC = 678; the T-G model produced R 2 = 0.68, RMSE = 1.57 g C m −2 d −1 , and BIC = 707; the MOD17 model produced R 2 = 0.49, RMSE = 1.98 g C m −2 d −1 , and BIC = 800. The PPI-based GPP model was able to capture the magnitude of EC GPP better than the other tested models (R 2 = 0.77, RMSE = 1.32 g C m −2 d −1 , and BIC = 631). These results show that a PPI-based GPP model is a promising tool for the estimation of GPP in the semi-arid ecosystems of Africa. 1. Introduction The uptake of CO 2 by terrestrial vegetation through photosynthe- sis, termed gross primary productivity (GPP), is the largest flux of the global carbon cycle (Le Quere et al., 2009). Globally, GPP accounts for around 120 Pg of carbon (PgC) and its spatiotemporal variability is not fully understood due to complex processes related to plant physiology and environmental controls on photosynthesis (Xia et al., 2015). Several modeling approaches attempted to describe the process whereby car- bon is assimilated by plants through photosynthesis (Anav et al., 2015; McCallum et al., 2009). Vegetation indices derived from remote sens- ing have been used to estimate GPP empirically and upscale it at re- gional or continental scales (Sjöström et al., 2011, 2009). Two com- monly used empirical models based on remotely-sensed enhanced veg etation index (EVI) are the temperature-greenness (T-G) model (Sims et al., 2008) and the greenness-radiation (G–R) model (Gitelson et al., 2006). The popularity of these models lies in their simplicity and the fact that they are not dependent on site measurements. Another pop- ular approach, first described by Monteith (1972), is based on the ef- ficiency with which absorbed solar radiation is converted into photo- synthesized carbon (light use efficiency, LUE). Presently, the MODer- ate resolution Imaging Spectroradiometer (MODIS) onboard the Terra and Aqua satellites is the only Earth-observation (EO) platform that pro- vides near-real-time estimates of terrestrial carbon uptake using the LUE method. At the core is the MOD17 algorithm (Running et al., 2004) that uses MODIS spectral data and climatic drivers in an LUE model (Heinsch et al., 2003). In a recent review, Tang et al. (2016) expressed concern whether spectral vegetation indices can really capture the primary productivity cycle since they represent the endpoint of plant physiological processes ⁎ Corresponding author at: Department of Physical Geography and Ecosystem Science, Lund University, Sölvegatan 12, SE-223 62 Lund, Sweden. Email address: [email protected] (A.M. Abdi) First assessment of the plant phenology index (PPI) for estimating gross primary productivity in African semi-arid ecosystems
-
Upload
khangminh22 -
Category
Documents
-
view
2 -
download
0
Transcript of First assessment of the plant phenology index (PPI) for ... - arXiv

A.M. Abdia, b, ⁎, N. Boke-Olénb, H. Jina, L. Eklundh a, T. Tagesson a, V. Lehsten a, c, J. Ardöa
a Department of Physical Geography and Ecosystem Science, Lund University, Sölvegatan 12, SE-223 62 Lund, Swedenb Centre for Environmental and Climate Research, Lund University, Sölvegatan 37, SE-223 62 Lund, Swedenc Swiss Federal Institute for Forest, Snow and Landscape research (WSL), Zürcherstr. 11, CH-8903 Birmensdorf, Switzerland
A R T I C L E I N F O A B S T R A C T
The importance of semi-arid ecosystems in the global carbon cycle as sinks for CO2 emissions has recently beenhighlighted. Africa is a carbon sink and nearly half its area comprises arid and semi-arid ecosystems. However,there are uncertainties regarding CO2 fluxes for semi-arid ecosystems in Africa, particularly savannas and drytropical woodlands. In order to improve on existing remote-sensing based methods for estimating carbon uptakeacross semi-arid Africa we applied and tested the recently developed plant phenology index (PPI). We developeda PPI-based model estimating gross primary productivity (GPP) that accounts for canopy water stress, and com-pared it against three other Earth observation-based GPP models: the temperature and greenness (T-G) model,the greenness and radiation (G–R) model and a light use efficiency model (MOD17). The models were evaluatedagainst in situ data from four semi-arid sites in Africa with varying tree canopy cover (3–65%). Evaluation re-sults from the four GPP models showed reasonable agreement with in situ GPP measured from eddy covarianceflux towers (EC GPP) based on coefficient of variation (R2), root-mean-square error (RMSE), and Bayesian infor-mation criterion (BIC). The G–R model produced R2 = 0.73, RMSE = 1.45 g C m−2 d−1, and BIC = 678; the T-Gmodel produced R2 = 0.68, RMSE = 1.57 g C m−2 d−1, and BIC = 707; the MOD17 model produced R2 = 0.49,RMSE = 1.98 g C m−2 d−1, and BIC = 800. The PPI-based GPP model was able to capture the magnitude of ECGPP better than the other tested models (R2 = 0.77, RMSE = 1.32 g C m−2 d−1, and BIC = 631). These resultsshow that a PPI-based GPP model is a promising tool for the estimation of GPP in the semi-arid ecosystems ofAfrica.
1. Introduction
The uptake of CO2 by terrestrial vegetation through photosynthe-sis, termed gross primary productivity (GPP), is the largest flux of theglobal carbon cycle (Le Quere et al., 2009). Globally, GPP accounts foraround 120 Pg of carbon (PgC) and its spatiotemporal variability is notfully understood due to complex processes related to plant physiologyand environmental controls on photosynthesis (Xia et al., 2015). Severalmodeling approaches attempted to describe the process whereby car-bon is assimilated by plants through photosynthesis (Anav et al., 2015;McCallum et al., 2009). Vegetation indices derived from remote sens-ing have been used to estimate GPP empirically and upscale it at re-gional or continental scales (Sjöström et al., 2011, 2009). Two com-monly used empirical models based on remotely-sensed enhanced veg
etation index (EVI) are the temperature-greenness (T-G) model (Simset al., 2008) and the greenness-radiation (G–R) model (Gitelson et al.,2006). The popularity of these models lies in their simplicity and thefact that they are not dependent on site measurements. Another pop-ular approach, first described by Monteith (1972), is based on the ef-ficiency with which absorbed solar radiation is converted into photo-synthesized carbon (light use efficiency, LUE). Presently, the MODer-ate resolution Imaging Spectroradiometer (MODIS) onboard the Terraand Aqua satellites is the only Earth-observation (EO) platform that pro-vides near-real-time estimates of terrestrial carbon uptake using the LUEmethod. At the core is the MOD17 algorithm (Running et al., 2004) thatuses MODIS spectral data and climatic drivers in an LUE model (Heinschet al., 2003).
In a recent review, Tang et al. (2016) expressed concern whetherspectral vegetation indices can really capture the primary productivitycycle since they represent the endpoint of plant physiological processes
⁎ Corresponding author at: Department of Physical Geography and Ecosystem Science, Lund University, Sölvegatan 12, SE-223 62 Lund, Sweden.Email address: [email protected] (A.M. Abdi)
First assessment of the plant phenology index (PPI) for estimatinggross primary productivity in African semi-arid ecosystems

PROO
F
A.M. Abdi et al. International Journal of Applied Earth Observations and Geoinformation xxx (2019) xxx-xxx
Fig. 1. Location of the sites and the aridity zones in the study region.
such as assimilation, respiration and phytomass accretion. These con-cerns underscore the notion that vegetation indices are not reduced tozero during periods of drought and thus do not explicitly show whenphotosynthesis ends (Walther et al., 2016). On the other hand, ac-tual LUE has large spatial and temporal heterogeneity that may notbe captured at regional or continental scales. Furthermore, the lack ofhigh-resolution gridded meteorological data limits the derivation of en-vironmental scalars such as temperature (Turner et al., 2003; Zhao etal., 2005). Primary productivity estimates provided by MODIS may notbe representative of field conditions as demonstrated by Sjöström et al.(2013). They found that the MOD17 algorithm underestimated maxi-mum LUE by an average of 1.2 g C MJ−1 for most of the sites in theirstudy.
Considering these shortcomings, Jin and Eklundh (2014) developeda physically-based vegetation index in an effort to achieve a higher con-sistency of EO-based vegetation indices that better explain the relation-ship between canopy development and GPP. This index, called the plantphenology index (PPI), is near-linear to green leaf area of the vegetationcanopy and thus may be able to better represent carbon assimilation.It has proven superior to other established indices for estimating springphenology over the northern hemisphere (Jin et al., 2017; Karkauskaiteet al., 2017).
The importance of semi-arid regions in the global carbon cycle hasrecently been highlighted by Ahlström et al. (2015). Excluding the hy-per-arid Sahara desert, most of Africa comprises arid and semi-aridzones (Abdi et al., 2016). These zones are classified as grassland (39%),savanna (23%) or woody savanna (5%) according to the MODIS landcover product (Sulla-Menashe and Friedl, 2015). Around 11% of sub-Sa-haran Africa is classified as tropical forest. Africa is a carbon sinkof around 0.6 Pg C yr−1 (Keenan and Williams, 2018), but there aregaps in our knowledge, particularly about the role of savannas anddry tropical woodlands (Valentini et al., 2014). Observational carboncycle studies are underrepresented in Africa relative to other regions(Ciais et al., 2011; Valentini et al., 2014). For example, of the six eddycovariance flux tower sites in Africa that are presently freely avail-able in the FLUXNET2015 dataset (http:/fluxnet.fluxdata.org/data/fluxnet2015-dataset/), only four are in arid or semi-arid ecosystems. Itis, therefore, important to test new observational data over Africa thathave the potential to be extended across large scales. The core objectiveof this study is to derive an empirical GPP model based on the recentlydeveloped PPI and evaluate its performance against other GPP modelswithout the use of ground-based meteorological data. This will be thefirst derivation and assessment of a PPI-based model that estimates GPPin African semi-arid ecosystems.
2

A.M. Abdi et al. International Journal of Applied Earth Observations and Geoinformation xxx (2019) xxx-xxx
Table 1Descriptions and physical characteristics of the sites included in this study.
Site, Country(Lon, Lat)
EcosystemType (TreeCover, %)
MAP(mm)
MAT(°C)
MeasurementYears
SiteReferences
Demokeya,Sudan(30.47,13.28)
Sparseacaciasavanna(7%)
320 30 2007 – 2009 Ardö et al.(2005-2009);Ardö et al.(2008)
Dahra,Senegal(-15.43,15.40)
Openwoodysavanna(3%)
416 29 2010 – 2013 Tagesson etal.(2010-2013);Tagesson etal. (2015)
Skukuza,SouthAfrica(31.49,-25.01)
Woodedgrassland(30%)
547 22 2001 – 2005 Archibald etal. (2009);Scholes(2000-2013)
Mongu,Zambia(23.25,-15.43)
Miombowoodland(65%)
879 25 2008 – 2009 Kutsch et al.(2000-2009);Merbold etal. (2009)
Table 2In situ measurements extracted from the FLUXNET2015 dataset for each of the four sites.
Variables Description Units
GPP_DT_CUT_MEAN Gross primary production using the daytimepartitioning method from Lasslop et al. (2010),average of GPP versions.
g Cm−2
d-1
VPD_F Vapor pressure deficit consolidated fromVPD_F_MDS and VPD_ERA methods
hPa
SWC_F_MDS_1 Volumetric soil water content of the upper layer,gap-filled with MDS
%
SW_IN_POT Potential incoming shortwave radiation (top ofatmosphere)
Wm−2
2. Data and methods
2.1. Study sites
This study focused on four eddy covariance flux tower sites, two inthe Sahel and two in southern Africa (Fig. 1). These sites were selectedbecause they were: (1) in either arid or semi-arid ecosystems in Africa,(2) they were harmonized and standardized, thus reducing data process-ing-related errors, (3) they were easily accessible and freely available,and (4) they had at least two years of reasonably continuous data (i.e.no long periods of no-data values). The sites are located in a climatolog-ical gradient with a mean annual precipitation (MAP) ranging between320–879 mm and mean annual temperature (MAT) between 22–30 °Cand are generally representative of arid and semi-arid savanna ecosys-tems in Africa (Table 1).
2.2. Eddy covariance flux tower data
The field data are part of the FLUXNET2015 dataset which is a har-monized and standardized global dataset of micrometeorological, en-ergy, and net ecosystem exchange of CO2 between the atmosphere andterrestrial biosphere (FLUXNET, 2015). The data processing pipeline inthe FLUXNET2015 dataset ensures inter-comparison and quality assur-ance and control across multiple sites (Vuichard and Papale, 2015).
The four eddy covariance flux tower sites (Table 1) consisted of 14site-years and covered two main ecosystem types: savanna (SAV) andwoody savanna (WSA). Daily measurements for four variables were ex-tracted for each site (Table 2) and averaged into 8-day intervals. Vari-ables were screened using quality flags so that only samples that areeither measured (flag = 0) or good quality (flag = 1) were retained.These data are all Tier-1 level under the fair-use data policy ofFLUXNET, meaning that the data are open and free for scientific pur-poses (http://fluxnet.fluxdata.org/data/data-policy/).
2.3. Earth observation data and models
2.3.1. The plant phenology indexLeaf area index (LAI), the one-sided area of leaf per unit area of
ground surface (m2 m−2), represents the total leaf surface area that in-tercepts incoming radiation. It denotes leaf area that is potentially avail-able for the exchange of gases between the atmosphere and vegetatedland surfaces (Cowling and Field, 2003). Depending on the phenologi-cal stage, LAI can be split into photosynthetic and non-photosyntheticportions. Photosynthetic (green) LAI is closely related to canopy chloro-phyll content (Ciganda et al., 2008) while non-photosynthetic (brown)LAI is linked to dry or senescing vegetation (Pinter et al., 1983). PPI isnearly linear to green LAI and was expressed by Jin and Eklundh (2014)as:
(1)
where PPI is in LAI units (m2 m−2); K is a gain factor that is de-pendent on sun zenith angle, geometry of leaf angular distribution, andthe instantaneous diffuse fraction of solar radiation (Jin and Eklundh,2014); NIR and RED are sun-sensor geometry-corrected near infraredand red bands, respectively; the subscript “max” indicates per-pixelcanopy maximum calculated from satellite observations covering2000–2014; the subscript “soil” is soil reflectance, which was derivedfrom ASTER Spectral Library (Baldridge et al., 2009) and comprises 41reflectance samples representing major global soil types. See Jin andEklundh (2014) for a detailed description of PPI.
PPI was downloaded from the DataGURU open access repository ofLund University (https://dataguru.lu.se/). This is the initial version ofthe index developed by Jin and Eklundh (2014) based on Collection 5.1(C5.1) MODIS spectral data and is arranged under the MODIS tiling sys-tem. We downloaded four tiles corresponding to the location of eachsite. PPI values were averaged over approximately 3 km x 3 km aroundthe coordinates of each flux tower to facilitate comparability with theMODIS data acquired from the Oak Ridge National Laboratory Distrib-uted Active Archive Center (ORNL DAAC, 2008).
2.3.2. The PPI GPP modelLeaf chemical processes are likely to be influenced by the feed-
back between canopy, near-surface air temperature and relative hu-midity (Hashimoto et al., 2008). EO-derived land surface temperature(LST) correlates reasonably well with vapor pressure deficit (VPD),which has been used as down-regulating mechanism in modeling GPP(Hashimoto et al., 2008; Wu et al., 2010). VPD is the difference be-tween the amount of moisture in the air and the amount of moisture theair could hold at saturation. According to Fick’s first law of diffusion,particle fluxes move from regions of high concentration to regions oflow concentration. High VPD indicates the atmosphere is low in mois-ture, which causes water to exit the plant during transpiration. Hence,plants may close their stomata as a physiological response to high VPDin order to prevent water loss (Meinzer et al., 1993). With the stomataclosed, plants cannot absorb CO2 and photosynthesis declines (Lamberset al., 2008; Slot and Winter, 2017). Here, VPD was derived from the
3

PROO
F
A.M. Abdi et al. International Journal of Applied Earth Observations and Geoinformation xxx (2019) xxx-xxx
Fig. 2. Seasonality and inter-annual variability of 8-day averaged PPI and MOD11A2 LST, and the FLUXNET2015 derived EC GPP and VPD for (a) Demokeya, (b) Dahra, (c) Skukuza, (d)Mongu.
MODIS daytime LST product (MOD11A2, C5.1) using Eq. 2. This wasbased on the observed relationship between MODIS daytime LST andin situ VPD from flux towers across all 14 site-years. The rationale forderiving VPD from LST was to facilitate a fully EO-based estimation ofGPP.
(2)
where VPDLST is vapor pressure deficit (hPa) derived from LST;LSTDay (oC) is the 8-day MOD11A2 product. GPP in arid and semi-aridecosystems has been shown to decline when VPD exceeds 20 hPa (Abdiet al., 2017; Rezende et al., 2016; Sjöström et al., 2013; Whitley et al.,2011; Zhang et al., 2007). Mean in situ GPP across all four sites was3.87 ± 3.15 g C m−2 d-1 at VPD values less than 20 hPa, and at VPD val-ues greater than 20 hPa mean GPP was 1.21 ± 1.04 g C m−2 d-1. Stom-atal conductance was not measured in this study, however, it is likelythat increase in VPD can cause stomatal closure (Meinzer et al., 1993),thereby reducing GPP. Therefore, we used VPDLST as a down-regulatingscalar on GPP by scaling VPDLST so that GPP declines with increasingVPDLST.
(3)
where VPDscaled is a defined as an inversely normalized function ofVPDLST.
The calibration procedure influences model accuracy as it is whenthe relationship between GPP and PPI is established and is detailed in
Section 2.4. Briefly, parameterization was performed using 1000 boot-strapped permutations of ordinary least-squares regression between PPIand EC GPP. Bootstrapping is a procedure in which the calibrationdataset is randomly sampled n times with replacement to empiricallyestimate the sampling distribution (Efron, 1979). This results in the re-gression statistics that define the PPI – EC GPP relationship. Then, GPPwas defined as the product of parameterized PPI and VPDScaled:
(4)where m is the slope coefficient of the parameterization of PPI and
has the units of g C m−2 d-1. The underlying assumption of the modeldepicted in Eq. 4 is that green LAI is directly linked to GPP as a proxyfor canopy chlorophyll content, and that GPP is reduced by an increasein VPD.
2.3.3. MODIS GPPLUE is based on the premise that GPP is proportional to the product
of photosynthetically active radiation (PAR), the fraction of PAR that isabsorbed by the vegetation canopy (fPAR), and a parameter that trans-lates absorbed energy into assimilated carbon. Production efficiencymodels such as MOD17 have to include ingenious workarounds to ac-count for LUE, which is not directly measured. The adoption of a max-imum LUE (εmax) parameter is one such workaround. This parameteris defined as the hypothetical biome-specific ideal condition (Monteith,1972). MOD17 utilizes a Biome Properties Look-Up Table (BPLUT) thatdefines εmax for 11 general plant functional types (PFT) based on the as-sumption that εmax varies little within a particular PFT (Monteith and
4

PROO
F
A.M. Abdi et al. International Journal of Applied Earth Observations and Geoinformation xxx (2019) xxx-xxx
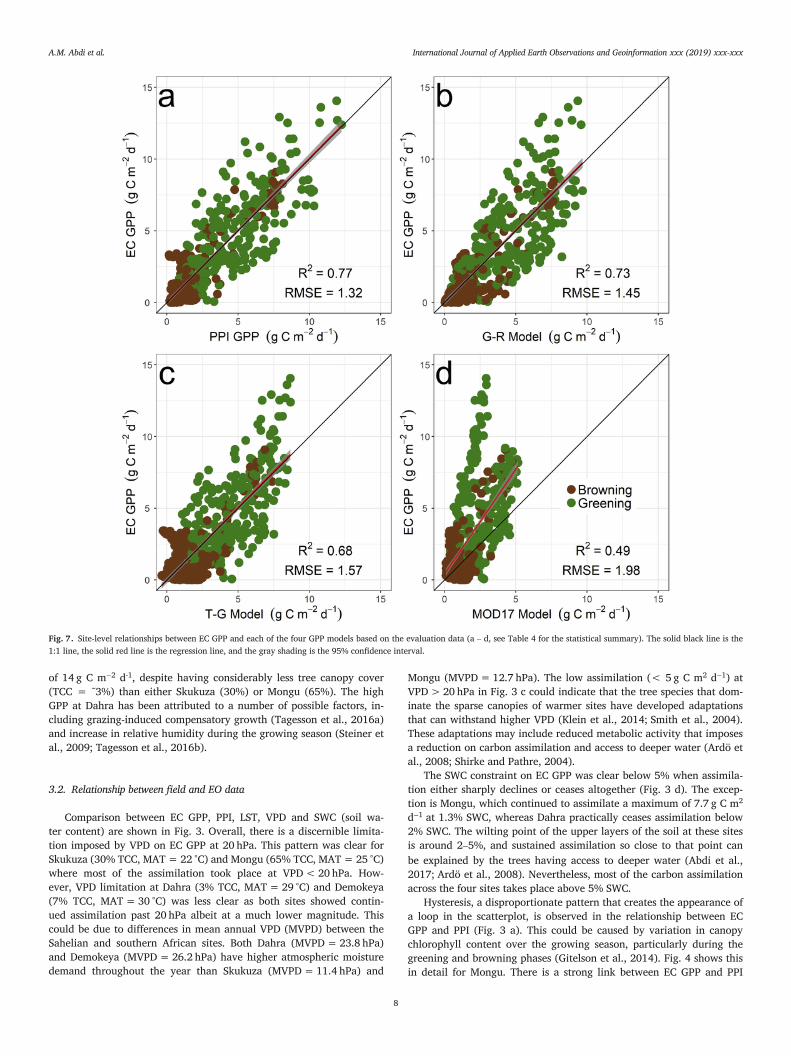
Fig. 3. Scatterplots of individual site-based relationships between 8-day EC GPP and LST, VPD and SWC.
Fig. 4. Close-up of the seasonal hysteresis in the relationship between EC GPP and PPI at Mongu. The gray shading indicates the 95% confidence interval.
Moss, 1977).(5)
where Tmin is minimum temperature that reduces photosynthesis incolder climates; VPD is vapor pressure deficit, which reduces photo-synthesis when temperature is high and relative humidity is low. TheMOD17 8-day GPP product (MOD17A2, C5.1) within a 3 km x 3 km areaaround each flux tower site was downloaded for each of the four sitesfrom ORNL DAAC.
2.3.4. T-G GPP modelThe temperature and greenness model (Sims et al., 2008) uses the
product of scaled LST and the enhanced vegetation index (EVI) to esti-mate GPP. It is based on the idea that GPP has a generally strong corre-lation with EVI, and that LST accounts for temperature controls on GPP.
(6)
5

PROO
F
A.M. Abdi et al. International Journal of Applied Earth Observations and Geoinformation xxx (2019) xxx-xxx
Fig. 5. Individual and all-site (inset) relationships between 8-day in situ VPD derived from flux towers and 8-day daytime LST from the MOD11A2 product. The solid line is the regressionline with 95% confidence intervals in shaded gray.
Table 3Summary of regression statistics resulting from the bootstrapping of EC GPP and PPI across the four sites. β0 is the intercept, β1 is the slope, R2 is the coefficient of determination, F is theF-statistic, DF is the degrees of freedom, SE is the standard error, and RMSE is the root-mean-square error in g C m−2 d-1, P is the probability value, and BIC is the Bayesian informationcriterion.
Response: EC GPP β0 β1 R2 F DF SE RMSE P BIC
PPI Calibration 0.516 6.166 0.77 1354 468 0.175 1.45 <0.001 1707Evaluation 0.017 0.999 0.75 571 185 0.042 1.41 <0.001 673
where m is the slope coefficient of the parameterization of the T-Gmodel and EC GPP, and has the units of g C m−2 d-1.
EVIscaled reduces GPP to zero when EVI ≈ 0.1 (Eq. 7). LSTscaled re-duces to 1 when LST = 30 °C, and to 0 when LST = 0 or when it reaches50 °C (Eq. 8).
(7)
(8)
2.3.5. G–R GPP modelThe greenness and radiation model (Gitelson et al., 2006) is based on
the idea that total chlorophyll content of a canopy is the primary factorinfluencing the amount of PAR absorbed by green vegetation. Chloro-phyll is an important pigment for absorbing PAR and is crucial for plantproductivity (Whittaker and Marks, 1975). The G–R model was origi-nally formulated GPP as the product of total canopy chlorophyll (Chl)and incoming PAR at the top of the canopy (PARin):
(9)
6

A.M. Abdi et al. International Journal of Applied Earth Observations and Geoinformation xxx (2019) xxx-xxx
Fig. 6. Bootstrap distribution histogram and density curve of the EC GPP – PPI slope basedon 1000 replicates (bias = 0.005). The dashed lines represent the 2.5% (β1 = 5.73) and97.5% (β1 = 6.64) confidence intervals.
In Eq. 9, quantification of Chl was done by measuring in situ bi-weekly reflectance, green and total LAI, and PARin was measured usingpoint quantum sensors (Gitelson et al., 2006). The model was later ex-tended by substituting in situ Chl with a remotely sensed vegetation in-dex that is closely related to chlorophyll content such as EVI. PARin wasreplaced with potential (top of atmosphere) incoming PAR (PARpot) toeliminate the dependence on in situ measurements and reduce fluctua-tions present in PARin that introduce uncertainty and noise to the model(Gitelson et al., 2012; Peng et al., 2013):
(10)where m is the slope coefficient of the parameterization of the G–R
model and EC GPP, and has the units of g C m−2 d-1. PARpot is calculatedas 40% of potential incoming shortwave radiation at the top of the at-mosphere (SW_IN_POT, Table 2). PARpot can also be independently cal-culated using the method described in Monteith and Unsworth (2013).
2.4. Model calibration and statistical analysis
All the EO data were smoothed with a Savitzky-Golay filter (Savitzkyand Golay, 1964) in the software package TIMESAT (Jönsson andEklundh, 2004) using a window size of 11 points, and assuming a sin-gle growing season. The remaining statistical analysis and visualiza-tion were done in R 3.4.3 (R Core Team, 2017). In order to assess the
model performance and provide an independent evaluation, the datawere split into two portions based on the year of measurement. Thiswas done by randomly assigning 70% of the dataset (10 site-years, ˜463samples) for calibration and using the remaining 30% (4 site-years, ˜184samples) for evaluation. This combination was permuted in 1000 boot-strap replicates in order to get robust estimates of the regression coef-ficients. We used an ordinary least-squares regression to compare theGPP models against site-based GPP acquired from eddy covariance fluxtowers. We used the coefficient of determination (R2) to measure vari-ance explained by each model and the root-mean-square error (RMSE,Eq. 11) to assess the absolute fit of models to the data.
(11)
where OBS is EC GPP (g C m−2 d-1), PRED is model-estimated GPP (g Cm−2 d-1), and n is the number of sample points.
We also computed the Bayesian information criterion (BIC, Eq. 12)in order to account for the variations in sample sizes in the models(Burnham and Anderson, 2004; Schwarz, 1978). Differences in samplesize between the different models were caused by a combination ofsome years having slightly more data than others due to missing valuesand the random splitting of site-years into calibration and evaluationsubsets. BIC estimates the posterior probability of a model based on thelog of the marginal likelihood for data with an uninformative prior sothat the lower the BIC, the close a model is to being “true”.
(12)where L is the maximum of the likelihood function, q is the parameternumber, and n is the sample size. BIC levies a penalty term qln(n) onincreasing parameters and sample sizes to prevent over-fitting.
3. Results and discussion
3.1. Inter-annual and seasonal variations in the eddy covariance-derivedvariables
VPD seasonality corresponded well with seasonal and inter-annualpattern of EC GPP (Fig. 2). LST seasonality matched that of VPD at allsites except at the southernmost site, Skukuza (Fig. 2c), where VPD vari-ability was high. The quick decrease in carbon assimilation at the Sa-helian sites at the start of the dry season is probably due to the senes-cence of the herbaceous layer and the limited assimilation during thedry season is due to the sparse tree cover that can access deeper wa-ter (Ardö et al., 2008). A more gradual decrease in EC GPP was ob-served at the woodland site, Mongu, due to the higher density of treesat this site. PPI followed the seasonal progression of EC GPP generallywell across all sites, however the green-up and brown-down phases hada distinct offset that contributed to seasonal hysteresis (discussed in thenext section). Maximum GPP during the growing season was between7.5–9.5 g C m−2 d-1 at most sites except Dahra, which had a maximum
Table 4Summary of the analyses between EC GPP and each of the four GPP models across all sites based on 8-day time series. β0 is the intercept, β1 is the slope, R2 is the coefficient of determina-tion, F is the F-statistic, DF is the degrees of freedom, SE is the standard error, and RMSE is the root-mean-square error in g C m−2 d-1, P is the probability value, and BIC is the Bayesianinformation criterion.
Response: EC GPP β0 β1 R2 F DF SE RMSE P BIC
PPI GPP Calibration 0.006 1.000 0.76 1505 456 0.026 1.38 <0.001 1615Evaluation 0.004 1.011 0.77 677 180 0.039 1.32 <0.001 631
G-R Model Calibration 0.005 1.006 0.72 1211 463 0.029 1.51 <0.001 1723Evaluation −0.038 1.029 0.73 524 183 0.045 1.45 <0.001 678
T-G Model Calibration −0.015 1.007 0.65 902 459 0.033 1.67 <0.001 1795Evaluation −0.115 1.061 0.68 434 183 0.052 1.57 <0.001 707
MOD17 Model Calibration 0.403 1.466 0.45 404 468 0.074 2.09 <0.001 2047Evaluation −0.234 1.116 0.49 224 185 0.082 1.98 <0.001 800
7
PROO
F
A.M. Abdi et al. International Journal of Applied Earth Observations and Geoinformation xxx (2019) xxx-xxx
Fig. 7. Site-level relationships between EC GPP and each of the four GPP models based on the evaluation data (a – d, see Table 4 for the statistical summary). The solid black line is the1:1 line, the solid red line is the regression line, and the gray shading is the 95% confidence interval.
of 14 g C m−2 d-1, despite having considerably less tree canopy cover(TCC = ˜3%) than either Skukuza (30%) or Mongu (65%). The highGPP at Dahra has been attributed to a number of possible factors, in-cluding grazing-induced compensatory growth (Tagesson et al., 2016a)and increase in relative humidity during the growing season (Steiner etal., 2009; Tagesson et al., 2016b).
3.2. Relationship between field and EO data
Comparison between EC GPP, PPI, LST, VPD and SWC (soil wa-ter content) are shown in Fig. 3. Overall, there is a discernible limita-tion imposed by VPD on EC GPP at 20 hPa. This pattern was clear forSkukuza (30% TCC, MAT = 22 °C) and Mongu (65% TCC, MAT = 25 °C)where most of the assimilation took place at VPD < 20 hPa. How-ever, VPD limitation at Dahra (3% TCC, MAT = 29 °C) and Demokeya(7% TCC, MAT = 30 °C) was less clear as both sites showed contin-ued assimilation past 20 hPa albeit at a much lower magnitude. Thiscould be due to differences in mean annual VPD (MVPD) between theSahelian and southern African sites. Both Dahra (MVPD = 23.8 hPa)and Demokeya (MVPD = 26.2 hPa) have higher atmospheric moisturedemand throughout the year than Skukuza (MVPD = 11.4 hPa) and
Mongu (MVPD = 12.7 hPa). The low assimilation (< 5 g C m2 d−1) atVPD > 20 hPa in Fig. 3 c could indicate that the tree species that dom-inate the sparse canopies of warmer sites have developed adaptationsthat can withstand higher VPD (Klein et al., 2014; Smith et al., 2004).These adaptations may include reduced metabolic activity that imposesa reduction on carbon assimilation and access to deeper water (Ardö etal., 2008; Shirke and Pathre, 2004).
The SWC constraint on EC GPP was clear below 5% when assimila-tion either sharply declines or ceases altogether (Fig. 3 d). The excep-tion is Mongu, which continued to assimilate a maximum of 7.7 g C m2
d−1 at 1.3% SWC, whereas Dahra practically ceases assimilation below2% SWC. The wilting point of the upper layers of the soil at these sitesis around 2–5%, and sustained assimilation so close to that point canbe explained by the trees having access to deeper water (Abdi et al.,2017; Ardö et al., 2008). Nevertheless, most of the carbon assimilationacross the four sites takes place above 5% SWC.
Hysteresis, a disproportionate pattern that creates the appearance ofa loop in the scatterplot, is observed in the relationship between ECGPP and PPI (Fig. 3 a). This could be caused by variation in canopychlorophyll content over the growing season, particularly during thegreening and browning phases (Gitelson et al., 2014). Fig. 4 shows thisin detail for Mongu. There is a strong link between EC GPP and PPI
8

PROO
F
A.M. Abdi et al. International Journal of Applied Earth Observations and Geoinformation xxx (2019) xxx-xxx
Fig. 8. Time series comparison between the four GPP models (see Table 3 for model statistics) at each site: (a) Demokeya, (b) Dahra, (c) Skukuza, and (d) Mongu. The gray shadingindicates the area under EC GPP.
Fig. 9. Comparison of two PPI GPP models, one using scaled VPD derived from MODIS LST (a) and one using eddy covariance flux tower VPD (b). The solid black line is the 1:1 line, andthe gray shading is the 95% confidence interval.
during the greening phase as the soil moisture is replenished and VPDdrops. The start of the browning phase is evidenced by decrease insoil moisture levels and an increase in VPD. Leaf senescence duringthis phase is a gradual process and plants undergo slower change ofcanopy chlorophyll relative to greening phase due to the process of leafaging (Jenkins et al., 2007; Muraoka et al., 2013; Richardson et al.,2013). Canopy chlorophyll is linearly related to PPI during the green-ing phase as indicated in the tight coupling of EC GPP and PPI (Fig. 4),but the relationship turns non-linear during the browning phase. Thisindicates that the contribution of canopy chlorophyll to GPP differs be-tween phases, and Gitelson et al. (2014) suggested that it is possibly dueto the vertical distribution of green LAI and chlorophyll content dur-ing the growing season. Another reason for this hysteresis is the com-bined effect of SWC and VPD during the greening and browning phases.During the greening phase, SWC is replenished, VPD decreases and the
stomata fully opens to take up carbon. During the browning phase, SWCdeclines and VPD increases with increasing temperature causing thestomata gradually close in order to conserve water (Abdi et al., 2017;Pingintha et al., 2010).
The relationship between EC GPP and LST exhibited a triangular fea-ture space that slopes towards lower temperatures with increasing ECGPP (Fig. 3 b). Approximately half of the total carbon uptake acrossall four sites took place between 30 °C and 40 °C. There was a 40% re-duction in EC GPP at LST ≥ 45 °C (1.13 ± 1.20 g C m−2 d-1) relativeto LST < 45 °C (2.86 ± 2.81 g C m−2 d-1). VPD and LST have a gener-ally strong relationship across all the sites (R2 = 0.67) (Fig. 5), due tothe connection of LST with surface moisture conditions and the parti-tioning of latent and sensible heat fluxes. Generally, the rainy season inthese ecosystems has a lower LST than the dry season due to increased
9

A.M. Abdi et al. International Journal of Applied Earth Observations and Geoinformation xxx (2019) xxx-xxx
vegetative cover, and the incoming energy is rapidly utilized by evapo-transpiration (Nutini et al., 2014).
The parameterization summary of PPI is show in Table 3 and thebootstrap distribution histogram of the slope is shown in Fig. 6. Over-all, PPI correlated strongly with EC GPP (R2 = 0.77; RMSE = 1.45 g Cm2 d−1; BIC = 1707) in the calibration phase. Similarly, in the evalua-tion phase PPI exhibited a strong correlation with EC GPP (R2 = 0.75;RMSE = 1.41 g C m2 d−1; BIC = 673), indicating that the spatiotempo-ral variability in EC GPP can be captured by PPI across the four sites.The linear regression model for parametrizing PPI is:
(13)
3.3. Comparison of GPP models
The PPI GPP model demonstrated an overall better performance inpredicting EC GPP than the three other models (Table 4). In the eval-uation, the explained variance was highest for PPI GPP (R2 = 0.77,Fig. 7a) followed by the G–R model (R2 = 0.73, Fig. 7b) and T-Gmodel (R2 = 0.68, Fig. 7c). The MOD17 model had the lowest accu-racy (R2 = 0.49) and underestimated EC GPP. The MOD17 model dis-played two distinct clusters, a higher slope at β1 = 4.5 and a lower oneat β1 = 1.74 (Fig. 7d). The data points within the higher slope belongto the two Sahelian sites, and the lower slope includes the two south-ern African sites. This split could be attributed to MOD17’s relianceon the MOD12Q1 land cover product to populate the biome propertieslook-up table (BPLUT) that serves as the basis for establishing optimumLUE for each biome type (Friedl et al., 2010; Zhao et al., 2011). MOD-12Q1 classifies Mongu as “Savanna”, a class that has a maximum possi-ble tree canopy cover of 30% according to Hansen et al. (2000), which isroughly half of the actual canopy cover at the site. Indeed, classificationaccuracies of MOD12Q1 for the land cover types that dominate our foursites are rather poor. The producer’s and user’s accuracies of MOD12Q1for woody savanna are 45.2 ± 4.1% and 34.3 ± 4.5%, respectively, andfor savanna they are 22.6 ± 4.4% and 39 ± 6%, respectively (Friedl etal., 2010).
A time series comparison of the four GPP models (PPI, G–R, T-G, andMOD17) and EC GPP for each site is shown in Fig. 8. The widely-usedMOD17 model underestimated GPP at all sites but was able to con-sistently follow the greening and browning phases of Skukuza (30%canopy cover) and Mongu (65% canopy cover), suggesting that thismodel does better in tree-dominated areas than savanna. The T-G modeleither underestimated or overestimated peak GPP at most sites. The PPIGPP model tracked the seasonal and inter-annual development of ECGPP and captured its amplitude reasonably well. At Demokeya, the PPImodel over-estimated GPP during the dry season, but captured the startand end of the growing season for all sites in-line with EC GPP exceptat Mongu. The final PPI GPP model used is shown in Eq. 14. This modelis based on Eq. 4 and it accounts for the observed relationship betweenEC GPP and VPD (Fig. 3c).
(14)
3.4. VPD as a down-regulation scalar instead of LST
The configuration of the T-G model should theoretically account forwater stress because of the direct inclusion of LST. The model has beenfound to perform poorly in water-limited woody savanna, savanna andgrasslands, and the application of a Markov Chain Monte Carlo op-timization by Dong et al. (2017) did not improve its performance inthose ecosystems. The PPI GPP model outperformed the T-G model in
both the calibration and evaluation datasets (Table 4). The sites clas-sified as “drought sites” in Sims et al. (2008) are considerably coolerthan Sahelian sites (12 °C vs 30 °C), so the LST scaling factor in the T-Gmodel cannot account for the environmental conditions in this warm re-gion. However, the T-G model performed well at Skukuza (R2 = 0.73)and Mongu (R2 = 0.79), probably because these sites have a lower meanannual temperatures (29 °C and 25 °C, respectively) that is within thethreshold set in the T-G model (Sims et al., 2008).
Substituting VPDLST with scaled site-based VPDTOWER improves ECGPP variance that is explained by the model (Fig. 9). An explanationfor the reduced performance of VPDLST relative to VPDTOWER is that theuncertainty in VPDLST, which is a function of the relationship betweensatellite-derived LST and VPD (Eq. 2), is disseminated in the PPI GPPmodel as per the law of error propagation. This is not surprising con-sidering the fact that VPDLST has an average RMSE of 4.31 hPa acrossall four sites (Fig. 5). This highlights the tradeoff between model perfor-mance and upscaling land surface processes (Leitão et al., 2018).
Generally, the inclusion of LST allows for a GPP model to captureheat stress, however the direct effect of LST (i.e. actual canopy temper-ature) on photosynthesis is rather unclear (Wu et al., 2010). The mech-anism through which high canopy temperatures affect photosynthesisis not well understood. There is evidence that decrease in photosynthe-sis at high canopy temperatures is caused by high leaf-to-air VPD thanby direct negative effects of temperature on photosynthetic metabolism(Lloyd and Farquhar, 2008). Indeed, the physiological response of vege-tation is strongly linked to the terrestrial surface energy balance (Chapinet al., 2011; Duveiller et al., 2018). There is also some indication thatincreasing LST over a vegetation canopy is linked to looming droughtdue to decrease in latent heat flux (stomatal closure) and increase insensible heat flux (Wan et al., 2004).
According to Fick’s first law of diffusion, plants lose water to theatmosphere with increasing VPD if the stomata remain open (Farquharand Sharkey, 1982). Therefore, it is reasonable to assume that there willbe a decrease in transpiration with rising VPD because plants will optto conserve water. This means that for each of our four sites, there willbe a reduction in the amount of energy leaving the canopy in the formof latent heat. Because energy fluxes must balance, there will be a cor-responding increase in sensible heat that raises leaf temperature. It isplausible that this increase in sensible heat manifests as increase in LST.As leaf temperature increases, a weakening of the biochemical processesthat occur during photosynthesis and can further reduce GPP. Thus,plant physiological response to increased VPD may trigger a process thatis captured in the remotely-sensed LST signal.
4. Conclusions
The terrestrial carbon flux drives several ecosystem functions andestimating it at large scales is a necessary undertaking in global envi-ronmental change research. The plant phenology index (PPI) was origi-nally designed for boreal coniferous forests as a solution to suppressingthe influence of snow in phenology metrics, however, due to its gen-eral formulation it works in other environments as well. In this study,we developed and evaluated the performance of a PPI-based model inpredicting the gross primary productivity (GPP) at four semi-arid sitesin sub-Saharan Africa with a wide canopy cover range (3–65%). Wefound that the PPI GPP model captured the magnitude of eddy covari-ance flux tower-measured GPP relatively well compared to the othertested models (R2 = 0.77 and RMSE = 1.32 g C m−2 d-1) due to its sen-sitivity to green LAI, and therefore canopy chlorophyll content. The bet-ter performance of the PPI GPP model is also due to the inclusion of awater stress variable (VPD) as a down-regulating scalar. The greennessand radiation (G–R) model does not have a direct water stress scalar,and the temperature and greenness (T-G) model uses LST as an indirectsubstitute to water stress that does not capture the direct physiological
10

A.M. Abdi et al. International Journal of Applied Earth Observations and Geoinformation xxx (2019) xxx-xxx
response to that stress. The MOD17 production efficiency model in-cludes VPD as a down-regulating scalar, however the model is depen-dent on the MODIS land cover product for its look-up table parameterallocation, which performs poorly in savanna and woody savanna bio-mes. Further research is needed to explore the strong link between PPIand green LAI, and develop robust models for semi-arid ecosystems us-ing PPI as an indicator of photosynthetic capacity.
Author contributions
AMA conceived and designed the study, conducted the analysis, in-terpreted the results, and drafted the manuscript. HJ, LE, and JA as-sisted with the study design. NBO and TT contributed to the interpreta-tion of the results. NBO and VL processed the PPI data and approved thefinal draft. All authors extensively discussed the results and revised themanuscript.
Acknowledgments
AMA acknowledges support from the Lund University Center forStudies of Carbon Cycle and Climate Interactions (LUCCI) and the RoyalPhysiographic Society in Lund. Additional funding for this project wasprovided by the Swedish National Space Board (contract no. 100/11 toJA) and by the Department of Physical Geography and Ecosystem Sci-ence of Lund University. The authors would like to thank the reviewersfor their time in providing detailed and constructive comments that im-proved the quality of the manuscript.
References
Abdi, A.M., Vrieling, A., Yengoh, G.T., Anyamba, A., Seaquist, J.W., Ummenhofer, C.C.,Ardö, J., 2016. The El Niño – La Niña cycle and recent trends in supply and demandof net primary productivity in African drylands. Clim. Change 138, 111–125.
Abdi, A., Boke-Olén, N., Tenenbaum, D., Tagesson, T., Cappelaere, B., Ardö, J., 2017. Eval-uating water controls on vegetation growth in the semi-arid sahel using field and earthobservation data. Remote Sens. 9, 294.
Ahlström, A., Raupach, M.R., Schurgers, G., Smith, B., Arneth, A., Jung, M., Reichstein,M., Canadell, J.G., Friedlingstein, P., Jain, A.K., Kato, E., Poulter, B., Sitch, S., Stocker,B.D., Viovy, N., Wang, Y.P., Wiltshire, A., Zaehle, S., Zeng, N., 2015. The dominantrole of semi-arid ecosystems in the trend and variability of the land CO2 sink. Science348, 895–899.
Anav, A., Friedlingstein, P., Beer, C., Ciais, P., Harper, A., Jones, C., Murray-Tortarolo, G.,Papale, D., Parazoo, N.C., Peylin, P., Piao, S., Sitch, S., Viovy, N., Wiltshire, A., Zhao,M., 2015. Spatiotemporal patterns of terrestrial gross primary production: a review.Rev. Geophys. 53, 785–818.
Archibald, S., Kirton, A., Van der Merwe, M., Scholes, R., Williams, C., Hanan, N., 2009.Drivers of inter-annual variability in Net Ecosystem Exchange in a semi-arid savannaecosystem, South Africa. Biogeosciences 6, 251–266.
Ardö, J., Molder, M., El-Tahir, B.A., Elkhidir, H.A., 2008. Seasonal variation of carbonfluxes in a sparse savanna in semi arid Sudan. Carbon Balance Manag. 3, 7.
Ardö, J., El Tahir, B.A., El Khidir, H.A., 2005. FLUXNET2015 SD-Dem Demokeya. In L.University (Ed.). 2009. .
Baldridge, A.M., Hook, S.J., Grove, C.I., Rivera, G., 2009. The ASTER spectral library ver-sion 2.0. Remote Sens. Environ. 113, 711–715.
Burnham, K.P., Anderson, D.R., 2004. Multimodel inference: understanding AIC and BICin model selection. Sociol. Methods Res. 33, 261–304.
Chapin, F.S., Matson, P.A., Vitousek, P.M., 2011. Principles of Terrestrial Ecosystem Ecol-ogy, 2nd ed. Springer, New York.
Ciais, P., Bombelli, A., Williams, M., Piao, S.L., Chave, J., Ryan, C.M., Henry, M., Brender,P., Valentini, R., 2011. The carbon balance of Africa: synthesis of recent research stud-ies. Philos. Trans. R. Soc. A: Math. Phys. Eng. Sci. 369, 2038–2057.
Ciganda, V., Gitelson, A., Schepers, J., 2008. Vertical profile and temporal variation ofchlorophyll in maize canopy: quantitative “Crop vigor” Indicator by means of re-flectance-based techniques. Agron. J. 100, 1409–1417.
Cowling, S.A., Field, C.B., 2003. Environmental control of leaf area production: impli-cations for vegetation and land-surface modeling. Global Biogeochem. Cycles 17,7-1-7-14.
Dong, J., Li, L., Shi, H., Chen, X., Luo, G., Yu, Q., 2017. Robustness and uncertainties ofthe “Temperature and greenness” model for estimating terrestrial gross primary pro-duction. Sci. Rep. 7, 44046.
Duveiller, G., Hooker, J., Cescatti, A., 2018. The mark of vegetation change on Earth’s sur-face energy balance. Nat. Commun. 9, 679.
Efron, B., 1979. Bootstrap methods: another look at the jackknife. Ann. Stat. 7, 1–26.Farquhar, G.D., Sharkey, T.D., 1982. Stomatal conductance and photosynthesis. Annu.
Rev. Plant Physiol. 33, 317–345.FLUXNET, 2015. The FLUXNET2015 Dataset. Lawrence Berkeley National Laboratory.
Friedl, M.A., Sulla-Menashe, D., Tan, B., Schneider, A., Ramankutty, N., Sibley, A., Huang,X., 2010. MODIS Collection 5 global land cover: Algorithm refinements and charac-terization of new datasets. Remote Sens. Environ. 114, 168–182.
Gitelson, A.A., Viña, A., Verma, S.B., Rundquist, D.C., Arkebauer, T.J., Keydan, G., Leavitt,B., Ciganda, V., Burba, G.G., Suyker, A.E., 2006. Relationship between gross primaryproduction and chlorophyll content in crops: implications for the synoptic monitoringof vegetation productivity. J. Geophys. Res. Atmos. 111, n/a-n/a.
Gitelson, A.A., Peng, Y., Masek, J.G., Rundquist, D.C., Verma, S., Suyker, A., Baker, J.M.,Hatfield, J.L., Meyers, T., 2012. Remote estimation of crop gross primary productionwith Landsat data. Remote Sens. Environ. 121, 404–414.
Gitelson, A.A., Peng, Y., Arkebauer, T.J., Schepers, J., 2014. Relationships between grossprimary production, green LAI, and canopy chlorophyll content in maize: implicationsfor remote sensing of primary production. Remote Sens. Environ. 144, 65–72.
Hansen, M., DeFries, R., Townshend, J.R., Sohlberg, R., 2000. Global land cover classifi-cation at 1 km spatial resolution using a classification tree approach. Int. J. RemoteSens. 21, 1331–1364.
Hashimoto, H., Dungan, J.L., White, M.A., Yang, F., Michaelis, A.R., Running, S.W., Ne-mani, R.R., 2008. Satellite-based estimation of surface vapor pressure deficits usingMODIS land surface temperature data. Remote Sens. Environ. 112, 142–155.
Heinsch, F.A., Reeves, M., Bowker, C., Votava, P., Kang, S., Milesi, C., Zhao, M., Glassy, J.,Nemani, R., Running, S., 2003. GPP and NPP (MOD17A2/A3) Products NASA MODISLand Algorithm. MOD17 User's Guide. 1–57.
Jenkins, J.P., Richardson, A.D., Braswell, B.H., Ollinger, S.V., Hollinger, D.Y., Smith, M.L.,2007. Refining light-use efficiency calculations for a deciduous forest canopy usingsimultaneous tower-based carbon flux and radiometric measurements. Agric. For. Me-teorol. 143, 64–79.
Jin, H., Eklundh, L., 2014. A physically based vegetation index for improved monitoringof plant phenology. Remote Sens. Environ. 152, 512–525.
Jin, H., Jönsson, A.M., Bolmgren, K., Langvall, O., Eklundh, L., 2017. Disentangling re-motely-sensed plant phenology and snow seasonality at northern Europe using MODISand the plant phenology index. Remote Sens. Environ. 198, 203–212.
Jönsson, P., Eklundh, L., 2004. TIMESAT—a program for analyzing time-series of satellitesensor data. Comput. Geosci. 30, 833–845.
Karkauskaite, P., Tagesson, T., Fensholt, R., 2017. Evaluation of the plant phenology index(PPI), NDVI and EVI for start-of-Season trend analysis of the Northern Hemisphere Bo-real Zone. Remote Sens. 9, 485.
Keenan, T.F., Williams, C.A., 2018. The terrestrial carbon sink. Annu. Rev. Environ. Re-sour. 43, 219–243.
Klein, T., Yakir, D., Buchmann, N., Grünzweig, J.M., 2014. Towards an advanced assess-ment of the hydrological vulnerability of forests to climate change-induced drought.New Phytol. 201, 712–716.
Kutsch, W.L., Merbold, L., Kolle, O., 2000. FLUXNET2015 ZM-Mon Mongu. In M.-P.I.f.Biogeochemistry (Ed.). 2009. .
Lambers, H., Chapin, F.S., Pons, T.L., 2008. Plant Water Relations. Plant PhysiologicalEcology. Springer New York, New York, NY, 163–223.
Lasslop, G., Reichstein, M., Papale, D., Richardson, A.D., Arneth, A., Barr, A., 2010. Sep-aration of net ecosystem exchange into assimilation and respiration using a light re-sponse curve approach: critical issues and global evaluation: separation of nee intoGPP and Reco. Glob. Change Biol. 16.
Le Quere, C., Raupach, M.R., Canadell, J.G., Marland, G., et al., 2009. Trends in thesources and sinks of carbon dioxide. Nat. Geosci. 2, 831–836.
Leitão, P.J., Schwieder, M., Pötzschner, F., Pinto, J.R.R., Teixeira, A.M.C., Pedroni, F.,Sanchez, M., Rogass, C., van der Linden, S., Bustamante, M.M.C., Hostert, P., 2018.From sample to pixel: multi-scale remote sensing data for upscaling aboveground car-bon data in heterogeneous landscapes. Ecosphere 9, e02298.
Lloyd, J., Farquhar, G.D., 2008. Effects of rising temperatures and CO2 on the physiologyof tropical forest trees. Philos. Trans. R. Soc. B: Biol. Sci. 363, 1811–1817.
McCallum, I., Wagner, W., Schmullius, C., Shvidenko, A., Obersteiner, M., Fritz, S., Nils-son, S., 2009. Satellite-based terrestrial production efficiency modeling. Carbon Bal-ance Manag. 4.
Meinzer, F.C., Goldstein, G., Holbrook, N.M., Jackson, P., Cavelier, J., 1993. Stomatal andenvironmental control of transpiration in a lowland tropical forest tree. Plant Cell En-viron. 16, 429–436.
Merbold, L., Ardö, J., Arneth, A., Scholes, R., Nouvellon, Y., De Grandcourt, A., Archibald,S., Bonnefond, J., Boulain, N., Brueggemann, N., 2009. Precipitation as driver of car-bon fluxes in 11 African ecosystems. Biogeosciences 6, 1027–1041.
Monteith, J.L., 1972. Solar radiation and productivity in tropical ecosystems. J. Appl. Ecol.9, 747–766.
Monteith, J.L., Moss, C.J., 1977. Climate and the efficiency of crop production in Britain.Philos. Trans. R. Soc. Lond., B, Biol. Sci. 281, 277–294.
Monteith, J.L., Unsworth, M.H., 2013. Chapter 5 - Radiation environment. Principles ofEnvironmental Physics, fourth edition Academic Press, Boston, 49–79.
Muraoka, H., Noda, H.M., Nagai, S., Motohka, T., Saitoh, T.M., Nasahara, K.N., Saigusa,N., 2013. Spectral vegetation indices as the indicator of canopy photosynthetic pro-ductivity in a deciduous broadleaf forest. J. Plant Ecol. 6, 393–407.
Nutini, F., Boschetti, M., Candiani, G., Bocchi, S., Brivio, P., 2014. Evaporative fractionas an Indicator of moisture condition and water stress status in semi-arid rangelandecosystems. Remote Sens. 6, 6300.
ORNL DAAC, 2008. In: DAAC, O. (Ed.), MODIS Collection 5 Land Products Global Subset-ting and Visualization Tool, Oak Ridge, Tennessee, USA.
Peng, Y., Gitelson, A.A., Sakamoto, T., 2013. Remote estimation of gross primary produc-tivity in crops using MODIS 250m data. Remote Sens. Environ. 128, 186–196.
Pingintha, N., Leclerc, M.Y., Beasley Jr, J.P., Durden, D., Zhang, G., Senthong, C., Row-land, D., 2010. Hysteresis response of daytime net ecosystem exchange duringdrought. Biogeosciences 7, 1159–1170.
Pinter, P.J., Jackson, R.D., Idso, S.B., Reginato, R.J., 1983. Diurnal patterns of wheat spec-tral reflectances. IEEE Trans. Geosci. Remote. Sens. 156–163, GE-21.
Rezende, L.F.C., Arenque, B.C., Aidar, S.T., Moura, M.S.B., Von Randow, C., Tourigny, E.,Menezes, R.S.C., Ometto, J.P.H.B, 2016. Is the maximum velocity of carboxylation
11

A.M. Abdi et al. International Journal of Applied Earth Observations and Geoinformation xxx (2019) xxx-xxx
(Vcmax) well adjusted for deciduous shrubs in DGVMs? A case study for the Caatingabiome in Brazil. Model. Earth Syst. Environ. 2, 42.
R Core Team, 2017. R: A Language and Environment for Statistical Computing. R Founda-tion for Statistical Computing, Vienna, Austria.
Richardson, A.D., Keenan, T.F., Migliavacca, M., Ryu, Y., Sonnentag, O., Toomey, M.,2013. Climate change, phenology, and phenological control of vegetation feedbacksto the climate system. Agric. For. Meteorol. 169, 156–173.
Running, S.W., Nemani, R.R., Heinsch, F.A., Zhao, M., Reeves, M., Hashimoto, H., 2004.A continuous satellite-derived measure of global terrestrial primary production. Bio-Science 54, 547–560.
Savitzky, A., Golay, M.J.E., 1964. Smoothing and differentiation of data by simplified leastsquares procedures. Anal. Chem. 36, 1627–1639.
Scholes, B., 2000. FLUXNET2015 ZA-Kru Skukuza. In U.o.t. Witwatersrand (Ed.). 2013. .Schwarz, G., 1978. Estimating the dimension of a model. Ann. Stat. 6, 461–464.Shirke, P.A., Pathre, U.V., 2004. Influence of leaf-to-air vapour pressure deficit (VPD) on
the biochemistry and physiology of photosynthesis in Prosopis juliflora*. J. Exp. Bot.55, 2111–2120.
Sims, D.A., Rahman, A.F., Cordova, V.D., El-Masri, B.Z., Baldocchi, D.D., Bolstad, P.V.,Flanagan, L.B., Goldstein, A.H., Hollinger, D.Y., Misson, L., Monson, R.K., Oechel,W.C., Schmid, H.P., Wofsy, S.C., Xu, L., 2008. A new model of gross primary produc-tivity for North American ecosystems based solely on the enhanced vegetation indexand land surface temperature from MODIS. Remote Sens. Environ. 112, 1633–1646.
Sjöström, M., Ardö, J., Eklundh, L., El-Tahir, B., El-Khidir, H., Hellström, M., Pilesjö, P.,Seaquist, J., 2009. Evaluation of satellite based indices for gross primary productionestimates in a sparse savanna in the Sudan. Biogeosciences 6, 129–138.
Sjöström, M., Ardö, J., Arneth, A., Boulain, N., Cappelaere, B., Eklundh, L., De Grandcourt,A., Kutsch, W., Merbold, L., Nouvellon, Y., 2011. Exploring the potential of MODISEVI for modeling gross primary production across African ecosystems. Remote Sens.Environ. 115, 1081–1089.
Sjöström, M., Zhao, M., Archibald, S., Arneth, A., Cappelaere, B., Falk, U., de Grandcourt,A., Hanan, N., Kergoat, L., Kutsch, W., Merbold, L., Mougin, E., Nickless, A., Nouvel-lon, Y., Scholes, R.J., Veenendaal, E.M., Ardö, J., 2013. Evaluation of MODIS grossprimary productivity for Africa using eddy covariance data. Remote Sens. Environ.131, 275–286.
Slot, M., Winter, K., 2017. In situ temperature relationships of biochemical and stomatalcontrols of photosynthesis in four lowland tropical tree species. Plant Cell Environ. 40,3055–3068.
Smith, S.D., Naumburg, E., Niinemets, , Germino, M.J., 2004. Leaf to landscape. In: Smith,W.K., Vogelmann, T.C., Critchley, C. (Eds.), Photosynthetic Adaptation: Chloroplast toLandscape. Springer New York, New York, NY, pp. pp. 262–294.
Steiner, A.L., Pal, J.S., Rauscher, S.A., Bell, J.L., Diffenbaugh, N.S., Boone, A., Sloan, L.C.,Giorgi, F., 2009. Land surface coupling in regional climate simulations of the WestAfrican monsoon. Clim. Dyn. 33, 869–892.
Sulla-Menashe, D., Friedl, M., 2015. MCD12C1 MODIS/Terra+Aqua Land Cover TypeYearly L3 Global 0.05 Deg CMG V006. In N.E.L.P. DAAC (Ed.).
Tagesson, T., Fensholt, R., Guiro, I., Rasmussen, M.O., Huber, S., Mbow, C., Garcia, M.,Horion, S., Sandholt, I., Holm-Rasmussen, B., Göttsche, F.M., Ridler, M.-E., Olén, N.,Lundegard Olsen, J., Ehammer, A., Madsen, M., Olesen, F.S., Ardö, J., 2015. Ecosys-tem properties of semiarid savanna grassland in West Africa and its relationship withenvironmental variability. Glob. Change Biol. 21, 250–264.
Tagesson, T., Ardö, J., Guiro, I., Cropley, F., Mbow, C., Horion, S., Ehammer, A., Mougin,E., Delon, C., Galy-Lacaux, C., Fensholt, R., 2016. Very high CO2 exchange fluxes atthe peak of the rainy season in a West African grazed semi-arid savanna ecosystem.Geografisk Tidsskrift-Dan. J. Geogr. 116, 93–109.
Tagesson, T., Fensholt, R., Cappelaere, B., Mougin, E., Horion, S., Kergoat, L., Nieto, H.,Mbow, C., Ehammer, A., Demarty, J., Ardö, J., 2016. Spatiotemporal variability incarbon exchange fluxes across the Sahel. Agric. For. Meteorol. 226–227, 108–118.
Tagesson, T., Ardö, J., Fensholt, R., 2010. FLUXNET2015 SN-Dhr Dahra. In L. University(Ed.). 2013. .
Tang, J., Körner, C., Muraoka, H., Piao, S., Shen, M., Thackeray, S.J., Yang, X., 2016.Emerging opportunities and challenges in phenology: a review. Ecosphere 7,e01436-n/a.
Turner, D.P., Urbanski, S., Bremer, D., Wofsy, S.C., Meyers, T., Gower, S.T., Gregory, M.,2003. A cross-biome comparison of daily light use efficiency for gross primary pro-duction. Glob. Change Biol. 9, 383–395.
Valentini, R., Arneth, A., Bombelli, A., Castaldi, S., Cazzolla Gatti, R., Chevallier, F., 2014.A full greenhouse gases budget of Africa: synthesis, uncertainties, and vulnerabilities.Biogeosciences. 11.
Vuichard, N., Papale, D., 2015. Filling the gaps in meteorological continuous data mea-sured at FLUXNET sites with ERA-Interim reanalysis. Earth Syst. Sci. Data 7, 157–171.
Walther, S., Voigt, M., Thum, T., Gonsamo, A., Zhang, Y., Köhler, P., Jung, M., Varla-gin, A., Guanter, L., 2016. Satellite chlorophyll fluorescence measurements reveallarge-scale decoupling of photosynthesis and greenness dynamics in boreal evergreenforests. Glob. Change Biol. 22, 2979–2996.
Wan, Z., Wang, P., Li, X., 2004. Using MODIS land surface temperature and normalizeddifference vegetation index products for monitoring drought in the southern GreatPlains, USA. Int. J. Remote Sens. 25, 61–72.
Whitley, R.J., Macinnis-Ng, C.M.O., Hutley, L.B., Beringer, J., Zeppel, M., Williams, M.,Taylor, D., Eamus, D., 2011. Is productivity of mesic savannas light limited or waterlimited? Results of a simulation study. Glob. Change Biol. 17, 3130–3149.
Whittaker, R.H., Marks, P.L., 1975. Methods of assessing terrestrial productivty. In: Lieth,H., Whittaker, R.H. (Eds.), Primary Productivity of the Biosphere. Springer Berlin Hei-delberg, Berlin, Heidelberg, pp. 55–118.
Wu, C., Munger, J.W., Niu, Z., Kuang, D., 2010. Comparison of multiple models for esti-mating gross primary production using MODIS and eddy covariance data in HarvardForest. Remote Sens. Environ. 114, 2925–2939.
Xia, J., Niu, S., Ciais, P., Janssens, I.A., Chen, J., Ammann, C., Arain, A., Blanken, P.D.,Cescatti, A., Bonal, D., 2015. Joint control of terrestrial gross primary productivity byplant phenology and physiology. Proc. Natl. Acad. Sci. 112, 2788–2793.
Zhang, W.L., Chen, S.P., Chen, J., Wei, L., Han, X.G., Lin, G.H., 2007. Biophysical regula-tions of carbon fluxes of a steppe and a cultivated cropland in semiarid Inner Mongo-lia. Agric. For. Meteorol. 146, 216–229.
Zhao, M., Heinsch, F.A., Nemani, R.R., Running, S.W., 2005. Improvements of the MODISterrestrial gross and net primary production global data set. Remote Sens. Environ.95, 164–176.
Zhao, M., Running, S., Heinsch, F.A., Nemani, R., 2011. MODIS-derived terrestrial primaryproduction. In: Ramachandran, B., Justice, C.O., Abrams, M.J. (Eds.), Land RemoteSensing and Global Environmental Change. Springer, New York, pp. pp. 635–660.
12