Mature semiarid chaparral ecosystems can be a significant sink for atmospheric carbon dioxide

Phenology and carbon dioxide sourcesink strength of a subalpine grassland in response to
an exceptionally short snow season
This article has been downloaded from IOPscience Please scroll down to see the full text article
2013 Environ Res Lett 8 025008
(httpiopscienceioporg1748-932682025008)
Download details
IP Address 149132236
The article was downloaded on 19042013 at 0630
Please note that terms and conditions apply
View the table of contents for this issue or go to the journal homepage for more
Home Search Collections Journals About Contact us My IOPscience
IOP PUBLISHING ENVIRONMENTAL RESEARCH LETTERS
Environ Res Lett 8 (2013) 025008 (10pp) doi1010881748-932682025008
Phenology and carbon dioxide sourcesinkstrength of a subalpine grassland inresponse to an exceptionally short snowseason
M Galvagno1 G Wohlfahrt2 E Cremonese1 M Rossini3 R Colombo3
G Filippa1 T Julitta3 G Manca4 C Siniscalco5 U Morra di Cella1 and
M Migliavacca6
1 Environmental Protection Agency of Aosta Valley ARPA VdA Climate Change Unit Aosta Italy2 Institute of Ecology University of Innsbruck Innsbruck Austria3 Remote Sensing of Environmental Dynamics Laboratory University of Milano-Bicocca Milano Italy4 European CommissionmdashJoint Research Centre Institute for Environment and Sustainability Air and
Climate Unit Ispra (VA) Italy5 Department of Life Sciences and Systems Biology University of Torino Torino Italy6 European CommissionmdashJoint Research Centre Institute for Environment and Sustainability
Climate Risk Management Unit Ispra (VA) Italy
E-mail mgalvagnoarpavdait
Received 23 December 2012
Accepted for publication 25 March 2013
Published 18 April 2013
Online at stacksioporgERL8025008
Abstract
Changes in snow cover depth and duration predicted by climate change scenarios are expected
to strongly affect high-altitude ecosystem processes This study investigates the effect of an
exceptionally short snow season on the phenology and carbon dioxide sourcesink strength of
a subalpine grassland An earlier snowmelt of more than one month caused a considerable
advancement (40 days) of the beginning of the carbon uptake period (CUP) and together with
a delayed establishment of the snow season in autumn contributed to a two-month longer
CUP The combined effect of the shorter snow season and the extended CUP led to an increase
of about 100 in annual carbon net uptake Nevertheless the unusual environmental
conditions imposed by the early snowmelt led to changes in canopy structure and functioning
with a reduction of the carbon sequestration rate during the snow-free period
Keywords carbon uptake period snowmelt eddy covariance net ecosystem exchange
extreme events
S Online supplementary data available from stacksioporgERL8025008mmedia
1 Introduction
Understanding the processes affecting the carbon dioxide
(CO2) exchange between the ecosystems and the atmosphere
Content from this work may be used under the terms of
the Creative Commons Attribution 30 licence Any further
distribution of this work must maintain attribution to the author(s) and the
title of the work journal citation and DOI
is crucial to evaluate the future impacts of climate change on
the biosphere and the consequent feedbacks on climate system
(Cao and Woodward 1998 Denman et al 2007 Heimann and
Reichstein 2008)
Mountain ecosystems in the European Alps are expected
to be particularly impacted by future rising temperatures
changes in precipitation patterns duration of the snow-pack
11748-932613025008+10$3300 ccopy 2013 IOP Publishing Ltd Printed in the UK
Environ Res Lett 8 (2013) 025008 M Galvagno et al
(Beniston 2005a Solomon et al 2007) and by the increase in
extreme events (eg summer and winter heat spells summer
droughts ) (eg Beniston 2005b Alcamo et al 2007) In
seasonally snow-covered ecosystems such as high-altitude
grasslands the snow lying on the ground fully limits the
length of the growing season and overshadows the relative
influence of other environmental factors (photoperiod and
temperature) Future warming of the Alpine region (Foppa
and Seiz 2012) will likely result in earlier snowmelt dates
thus reducing the period in which grasslands act as a net
carbon source Although several studies have investigated the
effect of snow manipulation on the phenology and growth of
alpine plants (Wipf and Rixen 2010) little is known about
the effects of shortened snow seasons on the annual carbon
budget of high-altitude ecosystems due to the high variability
of species responses Various studies have used the eddy
covariance method which has been proven to be an effective
tool for (i) measuring CO2 exchanges at the ecosystem level
and across a spectrum of time scales (Baldocchi 2003) and
(ii) evaluating the impacts of extreme events on water and
carbon cycle of different ecosystems (eg Yi et al 2012 Ciais
et al 2005) Nevertheless only a few studies (eg Humphreys
and Lafleur 2011) have focused on the effects of changes in
snow season duration on the ecosystem carbon budget
In this study we analysed three years of continuous mea-
surements of CO2 exchange across the biosphereatmosphere
interface collected in a subalpine grassland by means of the
eddy covariance technique The hypothesis was tested that
smaller CO2 losses during a shorter snow cover period and
more net CO2 uptake during the subsequent longer growing
period may cause an overall larger net CO2 uptake during
years with a shorter snow season For this purpose we took
advantage of a lsquonatural experimentrsquo in which phenology and
ecosystem CO2 fluxes observed during a year (2011) marked
by one of the shortest snow seasons on record (83 years)
were compared to those observed during average years (2009
2010)
The following main questions were addressed did the
extremely short snow season increase the length of the carbon
uptake period in the investigated ecosystem If so what is the
effect on the ecosystem carbon uptake
To answer these questions (i) phenological indicators
were extracted from the CO2 flux time-series (ii) the
relationships between timing and length of the phenophases
and the carbon balance of the ecosystem were investigated
and (iii) a modelling approach was used to disentangle the
influence of functional changes from the direct effect of
weather on the ecosystem carbon uptake
2 Materials and methods
21 Site description
The study was carried out in a subalpine unmanaged
grassland in the northwestern Italian Alps from January
2009 to December 2011 The site is an abandoned pasture
located a few kilometres from the village of Torgnon in
the Aosta Valley region at an elevation of 2160 m asl
(4550prime40primeprimeN 734prime41primeprimeE)
Dominant vegetation consists of Nardus stricta L
Festuca nigrescens All Arnica montana L Carex semper-
virens Vill Geum montanum L Anthoxanthum alpinum L
Potentilla aurea L Trifolium alpinum L The terrain
slopes gently (4) and the soil is classified as Cambisol
(FAOISRICISS) The site is characterized by an intra-alpine
semi-continental climate with mean annual temperature of
31 C and mean annual precipitation of about 880 mm On
average from the end of October to late May the site is
covered by a thick snow cover (90ndash120 cm) which limits the
growing period to an average of five months
22 Eddy covariance data
The eddy covariance technique was used to measure the fluxes
of CO2 and H2O between the ecosystem and the atmosphere
Measurement of wind speed in the three components
(u v w) was performed by a CSAT3 three-dimensional sonic
anemometer (Campbell Scientific Inc) while CO2 and H2O
vapour air densities were measured by a LI-7500 open-path
infrared gas analyzer (LI-COR Inc) Instruments were placed
25 m above the ground and measurements were performed at
a frequency of 10 Hz
Eddy fluxes were obtained by computing the mean
covariance between vertical wind velocity and CO2 and H2O
densities with a half-hour time step (Baldocchi 2003) The
stored raw 10 Hz records were processed according to the
Euroflux methodology (Aubinet et al 2000) The effect of
temperature and humidity fluctuations on fluxes was corrected
using the methodology described in Webb et al (1980) and
Kramm et al (1995) Moreover in order to correct CO2 and
H2O fluxes for the effect of instrument surface heating on flux
measurements the method described in Burba et al (2008)
(model 4) was applied
The storage term was estimated from the time rate
of change of the CO2 mixing ratio at the measurement
height (25 m) and CO2 net ecosystem exchange (NEE) was
calculated as
NEE = Fc + Sc (21)
where Fc represents the corrected flux of CO2 and Sc is the
storage term By convention negative fluxes represent a net
mass movement from the atmosphere to the biosphere and
positive values the reverse
Results from integral turbulence and stationarity tests
(Foken and Wichura 1996) were combined to obtain an overall
quality flag (Qc classes from 0 high quality to 2 low quality)
for each half-hour period using the standard procedure
followed in Carboeurope-IP project (Mauder and Foken
2004) The eddy covariance flux footprint was determined
through the analytical model of Schuepp et al (1990) and the
main results of this analysis for the site were presented in
Migliavacca et al (2011)
The filtering procedure applied to half-hourly CO2 fluxes
to remove data measured during unfavourable micrometeoro-
logical conditions the evaluation of energy balance closure
2
Environ Res Lett 8 (2013) 025008 M Galvagno et al
and the uncertainty associated with flux calculations are
described in the supplementary data (available at stacks
ioporgERL8025008mmedia) The gap-filling method
(wwwbgc-jenampgdesim MDIworkeddyproc) described in
Reichstein et al (2005) was used to produce daily seasonal
and annual sums of CO2 exchange
23 Meteorological radiometric and ancillary measurements
Air (Tair) and soil (Tsoil) temperature were measured
respectively by a HMP45 (Vaisala Inc) and with temperature
probes type therm107 (Campbell Scientific Inc) at different
depths (2 10 25 and 35 cm) Soil water content (SWC)
was assessed with soil water reflectometers model CS616
(Campbell Scientific Inc) and soil heat flux (G) was
measured by HFP01 plates (Hukseflux) Net radiation was
measured with a CNR4 (Kipp and Zonen Corp) net
radiometer Photosynthetically active radiation (PAR) was
assessed by a LI-190 (LI-COR Inc) sensor Snow height
(HS) was measured with a sonic snow depth sensor (SR50A
Campbell Scientific Inc) which was used to determine
snowmelt and snow season onset dates for years 2009ndash2011
Long-term snowmelt snow season onset and Tair averages
were computed on the basis of data collected since 1928 at
a site (Cignana 4552prime31primeprimeN 735prime19primeprimeE) located nearby the
Torgnon site and at the same altitude
An automatic spectrometric system (HyperSpectral
Irradiometer Meroni et al 2011) was installed to collect high
temporal resolution spectral signatures of canopy-reflected
radiation The instrument hosts a spectrometer (HR4000
OceanOptics) operating in the visible and near-infrared
region of the solar spectrum (range 400ndash1000 nm) with a
spectral resolution of 1 nm which allows the computation of
different vegetation indices In this study the meris terrestrial
chlorophyll index (MTCI) (Dash and Curran 2004) was
used to infer the variation of chlorophyll content (Chl)
during the growing season MTCI values were converted
to Chl concentrations using a linear regression model
calibrated using Chl concentrations extracted from leaf
samples collected every ten days at 12 plots during 2010
(Rossini et al 2012) The relationship (R2 = 083) between
MTCI and total Chl used to estimate chlorophyll content for
the three years was
Chl(microg gminus1) = 116MTCI minus 117 (22)
Finally leaf area index (LAI) was determined as described in
Migliavacca et al (2011)
24 Extraction of grassland phenophases
Information about the phenology of net CO2 uptake was
extracted from the seasonal time-series of NEE (Richardson
et al 2010) We focused on different phases of the vegetative
period the beginning of the carbon uptake period (BGScup)
the peak season the end of the carbon uptake period (EGScup)
and the derived length of carbon uptake period (CUP)
BGScup and EGScup represent the dates in which the
ecosystem switched from a source to a sink in spring and
vice versa in autumn Three different approaches were used to
identify these dates in the first approach we identified BGScup
and EGScup as the first zero-crossing date after which NEE
turned from daily positive values to negative ones in spring
and from negative to positive values in autumn in the second
approach zero-crossing dates were defined as above but using
a moving average with a 5-day window (Richardson et al
2009) in the last approach a regression line was fitted between
NEE and DOYs (day of the year) using a subset of spring and
autumn data (15 days for each period) The BGScup or EGScup
date was identified by the DOY at which the fitted line passed
through 0 (Baldocchi et al 2005) The average of the BGScup
and EGScup extracted applying the three methods was used in
the analysis
25 Analysis of lightndashresponse curve of photosynthesis
In order to evaluate the impact of the anomalous 2011
snowmelt on NEE we used a modelling approach to
disentangle the effect of biotic response to early spring
environmental conditions from the direct effect of the
growing season weather (eg Richardson et al 2007 Marcolla
et al 2011 Wu et al 2012) The lightndashresponse curve of
photosynthesis was analysed to describe the relationship
between NEE and PAR in the different years The rectangular
hyperbolic lightndashresponse function (Falge et al 2001) was
used
NEE =AmaxαPAR
αPAR + Amax+ Reco (23)
where PAR (micromolphotons mminus2 sminus1) is the incident photosyn-
thetically active radiation Amax (micromolCO2 mminus2 sminus1) is the
light-saturated rate of CO2 uptake α (micromolCO2micromolphotons)
is the apparent quantum yield and Reco (micromolCO2 mminus2 sminus1)
is the ecosystem respiration Amax α and Reco were estimated
by fitting equation (23) to non gap-filled half-hourly NEE
with a 15-days moving window shifted each 5 days The
model parameters estimated for each year were compared and
used to model NEE In detail by running the model with one
yearrsquos PAR and the model parameters of the other years and
vice versa using fixed model parameters and varying PAR
datasets we evaluated the biotic response (embedded in the
values of the parameters) against direct effects of weather
(ie PAR) In particular NEE simulated during a summer
period representing for all the three years a portion of the
BGScupndashpeak phase (DOY 176ndash190) was analysed
3 Results
31 Long-term climatic conditions and weather during thestudy period
Figure 1 shows the mean annual course of HS and Tair
averaged over the period 1928ndash2010 and the annual courses
of HS Tair Tsoil PAR and SWC observed during the study
period 2009ndash2011
The snow season lasted on average 7 months during
the 1928ndash2010 period and less than 5 months in 2011
(figure 1(a)) In detail in spring 2011 snowmelt (14 April
3
Environ Res Lett 8 (2013) 025008 M Galvagno et al
Figure 1 Annual course of the major meteorological variables Thefollowing colour codes are used black line for long-term data(average of the period 1928ndash2010) and grey area for the variabilityrange green line light-green line and red line for the study years2009 2010 and 2011 respectively (a) Snow height (cm) long-termdata are presented as the daily median and the variability range iscomputed as 25th and 75th percentiles (b) daily air temperature(C) variability range is computed as standard deviation and data forthe 3 study years are presented as 5 day running mean (c) dailymean soil temperature (C) (d) midday PAR (micromol mminus2 sminus1)presented as 5 day running mean (e) daily SWC ()
DOY 104) occurred 33 days earlier than the long-term mean
(17 May DOY 137) and was the earliest snowmelt since
1945 Instead the 2009 and 2010 snowmelt dates (26ndash24
May DOY 146ndash144 in 2009 and 2010 respectively) fell
well within the variability range of the long-term period and
therefore are considered as average years In autumn 2011
the snow season onset (establishment of continuous winter
snow cover) occurred 29 days later compared to the long-term
average and 32ndash35 days later compared to 2009 and 2010
leading to the longest snow-free period on record (83 years)
Specifically the snow-free period lasted on average 170 days
during the 1928ndash2010 period 160 days in 2009 159 days in
2010 and 234 days in 2011 Maximum HS differed across
study years maximum height measured in 2009 was 174 m
while in both 2010 and 2011 was similar ranging around
090 m Winter 2009 was particularly snowy compared to the
long-term average (107 m for the period 1928ndash2010)
As expected for an alpine ecosystem Tair (figure 1(b))
showed large fluctuations from winter to summer and varied
from a minimum of minus10 plusmn 40 C (1928ndash2010 average plusmn sd)
Figure 2 Cumulative NEE during the 3 study years Colouredareas represent uncertainty on the flux computation Vertical solidlines represent the snowmelt (left side) and snow onset (right side)dates in each year (green light-green and red for 2009 2010 and2011 respectively) vertical dashed lines represent the BGScup andEGScup the black triangles indicate the peak dates
in January to a maximum of 17 plusmn 39 C in July (1928ndash2010
average plusmn sd) Regarding 2011 the main discrepancies
compared to previous years were observed in the period
MarchndashApril characterized by a mean temperature 22 C
warmer than the 1928ndash2010 average and 27ndash30 C warmer
than the mean temperature of previous study yearsmdasha
difference that was very likely responsible for the early
snowmelt
Soil temperature (figure 1(c)) under snow cover showed
constant values above 0 C Immediately after snowmelt Tsoil
exhibited a characteristic rise In spring 2009 and 2010 this
rise was fast and in a few days Tsoil reached temperature
values similar to those of Tair In 2011 the increase in Tsoil
after snowmelt was slower
The seasonal pattern of midday (1100ndash1300) mean
values of incident PAR (figure 1(d)) was similar among the
different years
The snow-free period SWC (figure 1(e)) showed mean
values of 263 and 251 in 2011 and 2010 respectively and
a lower mean of 164 in 2009 SWC in all years exhibited
a typical peak around the day of snowmelt when the highest
seasonal value was reached
32 Phenology and CO2 sourcesink strength
Figure 2 shows the time course of cumulative NEE in the
three years analysed in this study The seasonal variation of
CO2 fluxes (see also figure 1 in supplementary data available
at stacksioporgERL8025008mmedia) exhibited different
dynamics in 2009 and 2010 as compared to 2011 NEE
in 2009 and 2010 sharply increased in spring just after
snowmelt rapidly reaching peak values in early July (18ndash13
DOY 199 and 194 respectively) In contrast the NEE increase
in 2011 occurred earlier but at lower rate The grassland turned
to a sink on 8 June in 2009 (DOY 159) 1 June in 2010
(DOY 152) and 29 April in 2011 (DOY 119) In 2011 BGScup
occurred 33ndash40 days in advance compared to the previous two
years and the time lag between snowmelt and BGScup was
slightly larger than in 2009 and 2010 (13 8 and 16 days in
4
Environ Res Lett 8 (2013) 025008 M Galvagno et al
Table 1 NEE sums (gC mminus2 plusmn uncertainty range see supplementary data available at stacksioporgERL8025008mmedia) and averagerates (ie NEE sum in each phenophase divided by number of days) partitioned by phenophase and associated with the correspondingaverages of the meteorological variables (Tair C SWC PAR micromol mminus2 sminus1 Tsoil C)
1 Jan-snowmeltSnowmelt-BGScup BGScupndashpeak PeakndashEGScup
EGScup-snowonset
Snow onset-31Dec
Days Days Days Days Days Days
2009 146 13 41 83 26 602010 144 9 43 85 26 632011 104 16 67 116 39 28
NEE Sum Rate Sum Rate Sum Rate Sum Rate Sum Rate Sum Rate
2009 1162 plusmn 309 08 71 plusmn 04 054 minus1087 plusmn 06 minus265 minus1270 plusmn 53 minus153 70 plusmn 21 027 383 plusmn 118 0632010 1037 plusmn 402 072 501 plusmn 01 055 minus949 plusmn 18 minus23 minus1278 plusmn 63 minus151 63 plusmn 09 024 498 plusmn 202 0792011 626 plusmn 206 060 45 plusmn 04 028 minus852 plusmn 09 minus127 minus1335 plusmn 29 minus115 105 plusmn 34 026 198 plusmn 60 070
Tair Mean Mean Mean Mean Mean Mean
2009 minus173 760 1025 999 281 minus2722010 minus296 713 1042 900 213 minus3892011 minus113 160 765 892 175 minus283
SWC
2009 mdash 278 180 140 157 mdash2010 mdash 345 305 220 228 mdash2011 mdash 304 287 239 279 mdash
PAR
2009 mdash 14288 15470 13617 8971 60852010 mdash 13259 13935 13070 9217 55072011 mdash 12370 1370 12515 6977 4883
Tsoil
2009 069 815 120 1124 39 0252010 minus008 81 119 1116 43 0592011 044 495 1024 109 076 minus012
2009 2010 and 2011 respectively) NEE peaked 40 days after
BGScup in 2009 and 2010 and 65 days in 2011 The ecosystem
turned to a net source on 7 October (DOY 281) 4 October
(DOY 278) and 26 October (DOY 300) in 2009 2010 and
2011 respectively In 2011 the CUP lasted 55 and 59 days
longer than the two previous years
Annual cumulative NEE in 2011 (minus118 plusmn 31 gC mminus2
yrminus1) doubled 2009 (minus62 plusmn 52 gC mminus2 yrminus1) and 2010
(minus55 plusmn 60 gC mminus2 yrminus1) values In contrast despite
the two-month longer CUP observed in 2011 seasonal
cumulative NEE between BGScup and EGScup (ie the
CUP cumulative) were similar among years minus230 plusmn
6 gC mminus2 in 2009 minus218 plusmn 8 gC mminus2 in 2010 and
minus215 plusmn 4 gC mminus2 in 2011 Moreover in 2011 NEE
did not reach the peak daily values of previous years
(minus50 gC mminus2 dminus1 minus47 gC mminus2 dminus1 minus34 gC mminus2 dminus1 in
2009 2010 and 2011 respectively)
Table 1 shows the differential contributions of the
considered phenophases to the annual cumulative NEE in
terms of sums and average rates (ie NEE sum in each
phenophase divided by the number of days) The averages of
the environmental variables measured in each period are also
reported The peculiarities of 2011 were the overall shorter
snow season lower respiration during the January-snowmelt
and snowmelt-BGScup periods a longer time for net CO2
uptake (ie longer CUP) but the latter was associated with
reduced rates during the developing phases (ie BGScup to
peak)
The lower cumulative NEE from January to snowmelt in
2011 was mainly a result of the shorter duration of that period
and of the slightly lower (16) respiration rate (figure 2
table 1) compared to the same period in 2009 and 2010
Lower rates of CO2 losses in 2011 together with lower mean
Tsoil Tair and midday PAR were also observed in the period
between snowmelt and BGScup (in figure 2 the maximum
cumulative NEE after snowmelt reached lower positive values
in 2011) Less CO2 was taken up in 2011 compared to
20092010 during the longer period between the BGScup and
the peak value because of a lower NEE rate (sim50) as
highlighted by the less steep slope in 2011 (figure 2) This
period was again associated with lower mean Tair Tsoil and
PAR compared to previous years This pattern is also evident
in figure 3(a) showing the mean diurnal patterns of NEE from
the BGScup to peak period Maximum diurnal NEE in this
period reached minus94 and minus81 micromolCO2 mminus2 sminus1 in 2009
and 2010 while it was minus52 micromolCO2 mminus2 sminus1 in 2011
Moreover figures 4(a) and (b) showing seasonal courses
of LAI and Chl revealed that also biophysical parameters
related to canopy development were lower in 2011 compared
to 20092010 LAI showed maximum values of 27 m2 mminus2
5
Environ Res Lett 8 (2013) 025008 M Galvagno et al
Figure 3 (a) Mean diurnal variation of NEE during theBGScupndashpeak and (b) peakndashEGScup phases Different coloursrepresent the different years (green light-green and red for 20092010 and 2011 respectively)
Figure 4 Seasonal course of (a) leaf area index LAI (m2 mminus2)and (b) chlorophyll content (microg gminus1) during the three years of study(green light-green and red for 2009 2010 and 2011 respectively)Chlorophyll content was derived fitting a linear regression model tomeris terrestrial chlorophyll index (MTCI) values calibrated usingChl concentrations extracted from leaf samples at the study site
and 28 m2 mminus2 in 2009 and 2010 respectively and only
218 m2 mminus2 in 2011 Not only leaf area but also maximum
chlorophyll content attained in 2011 was lower with a peak
value of 22 and 21 microg gminus1 in 2009 and 2010 and of
17 microg gminus1 in 2011
During the long period separating the peak value and the
EGScup in 2011 the ecosystem CO2 uptake was higher than
in previous years even if the average rate remained slightly
lower (table 1 figure 3(b))
Finally respiratory rates after EGScup were similar
among years (table 1) as highlighted in figure 2 by the similar
slopes of NEE The lower cumulative CO2 loss in 2011 during
this phase was therefore mainly related to the shorter period
Table 2 Summary of lightndashresponse curve analysis results(a) Average and standard deviation of the model parameters(absolute values are reported) estimated for each year with thelightndashresponse curve analysis (b) Estimated NEE sums (gC mminus2) inthe period DOY 176ndash190 Each column represents the cumulativeNEE predicted using a fixed PAR dataset and varying physiologyparameters Each row represents the cumulative NEE predictedusing the model parameters obtained for the considered year andvarying PAR dataset
(a)
α Amax Reco
2009 0027 plusmn 001 2428 plusmn 21 246 plusmn 0132010 0022 plusmn 001 2056 plusmn 09 170 plusmn 0122011 0017 plusmn 001 1630 plusmn 153 162 plusmn 028
(b)
PAR 2009 PAR 2010 PAR 2011
Physiology parameters
2009 minus6073 minus6105 minus66632010 minus5793 minus5854 minus62382011 minus412 minus4171 minus4429
The results of the modelling analysis (table 2) clarified
whether in 2011 the ecosystem was unable to reach NEE
values and rates similar to previous years as a consequence
of changes in canopy structural and physiological properties
(eg lower Chl and LAI) due to the early development or as
a direct effect of unfavourable summer weather conditions
The analysis showed that (i) model parameters (ie α Amax
and Reco) obtained from lightndashresponse curve in 2011 were
significantly lower compared to 2009 and 2010 (p lt 005
WilcoxonndashMannndashWhitney test) (ii) using fixed PAR and
varying physiology parameters (ie using PAR data of one
year for all three physiology parameter sets) predicted NEE
sums using the 2011 parameters were always higher (ie
lower uptake ranging from minus412 to minus4429 gC mminus2) than
those obtained using 2009 (from minus6073 to minus6663 gC mminus2)
or 2010 (from minus5793 to minus6238 gC mminus2) parameters (iii)
using fixed physiology parameters with varying PAR dataset
NEE sums simulated using the 2011 PAR dataset were always
lower (ie higher uptake) than those obtained using 2009 or
2010 PAR dataset This underlined that the NEE reduction
observed in 2011 can be attributed to changes in grassland
structural and physiological properties rather than to direct
limiting weather conditions in this period
4 Discussion
In seasonally snow-covered ecosystems earlier snowmelt
and later establishment of snow cover potentially reduce the
continuous off-season CO2 losses and may result in longer
periods of CO2 uptake and growth In this study we took
advantage of a natural experiment (ie an exceptionally short
snow season) to test the hypothesis that shorter snow-covered
periods may enhance the CUP and the annual net CO2 uptake
of subalpine grasslands Results confirmed this assumption
Nevertheless two different effects were observed less CO2
6
Environ Res Lett 8 (2013) 025008 M Galvagno et al
losses took place during the shorter snow season and lower
CO2 uptake rates occurred during the longer CUP
Did the extremely short snow season increase the CUP in
the investigated ecosystem
We observed that a variation of more than one month (43 days)
in the date of snowmelt caused a similar shift (35ndash40 days)
in the beginning of the CUP However the earlier snowmelt
was followed by a slower increase of the biological activity
compared to years with average snowmelt This observation
was supported by the larger time lag between the date of
snowmelt and the beginning of the subsequent phenological
phases in 2011 ie the ecosystem processes were slower in
reaching the different thresholds considered
The date of snowmelt imposes a clear physical limit
to canopy spring development of high-altitude grasslands
When the snowpack-imposed decoupling between vegetation
ambient light and temperature finishes biological processes
quickly take advantage of favourable weather conditions
optimizing the short snow-free period available for growth
(Korner 2003 Monson et al 2005) This dynamic pattern
is typical of warm-season vegetation types for which
photosynthesis in spring recovers generally faster than the
senescence at the end of the season (Gu et al 2009) In alpine
ecosystems extreme climate events such as particularly warm
spring spells and the subsequent early snowmelt could change
this typical pattern The result is a lengthening of the CUP but
also an exposure of the vegetation to early spring unfavourable
weather conditions (eg lower PAR and temperature colder
than usual) and an increased risk of cold damage When
snowmelt occurred around the end of May in 2009 and 2010
weather conditions (Tair and Tsoil photoperiod PAR) at the
study site were already at optimal level and as a consequence
the up-regulation of photosynthetic activity was fast On
the contrary the early snowmelt recorded at the beginning
of April 2011 led to the advancement of each phenophase
but caused the ecosystem to face less favourable weather
conditions typical of an earlier time of the year characterized
by shorter day-length lower PAR and colder temperatures
While the effect of recent warming trends on the onset
of plant activity in spring has been outlined in several works
(Richardson et al 2013) uncertainties exist on how climate
change may affect autumn phenology and CO2 fluxes (eg
Wu et al 2013 Piao et al 2008) Moreover the end of
CUP variability and its environmental drivers are poorly
investigated within grassland sites In 2011 we observed a late
snow onset in autumn due to a prolonged period of warm
temperatures and absence of precipitation As a consequence
the ecosystem turned to a source about 20 days later than in
previous years further contributing to the increase of the CUP
duration
What is the effect on the ecosystem CO2 uptake
The two-month longer CUP observed in 2011 (figure 5(a))
did not lead to higher but rather similar seasonal cumulative
carbon uptake compared to average years as a result of
the compensation between a longer CUP and a lower NEE
rate (figure 5(c) table 1) In 2011 daily NEE rate during
the CUP was generally lower compared to previous years
especially during the spring development and reached a peak
Figure 5 (a) Duration of the off-season (ie snow-covered andnon-snow-covered periods with NEE gt0) (blue) and CUP periods(green) (b) cumulative NEE (gC mminus2) during the off-season (blue)CUP (green) and yearly periods (orange) (c) NEE average rateduring the off-season (blue) and CUP periods (green)
value lower than other years We observed that environmental
conditions during the summer period were fairly similar
among years and thus unlikely to account for the observed
differences in physiology parameters and photosynthetic
rates The lower summer CO2 uptake appears to be the result
of the biotic response of the ecosystem to an exceptional
climate event the early spring weather that the ecosystem
experienced as a consequence of early snowmelt changed the
typical trajectory of canopy development and physiological
responses of the ecosystem to environmental conditions
Compared to previous years plants developed in unusual
spring conditions may have adjusted their physiological
7
Environ Res Lett 8 (2013) 025008 M Galvagno et al
responses to lower PAR shorter day-length and lower
temperature experienced during the early development and
were unable to capitalize on later growing season weather
conditions (Monson et al 2005) The snowmelt observed in
2011 is the third earliest snowmelt in 83 years and hence
represents an unusual event for plants that are very likely
acclimated to a narrower range of weather conditions This
observation was also supported by LAI and Chl data since
the ecosystem modifies its photosynthetic capacity through
variations in LAI and chlorophyll content in relation to
changes in limiting factors (Dawson et al 2003) To our
knowledge there are few studies highlighting similar findings
Indeed although shifts in structural or reproductive phenology
as a result of variations in snow cover depth and duration
have clearly been described in several experimental studies
of snow manipulation (eg Wipf and Rixen 2010) results
concerning the effects on growth and productivity are less
clear and differ among species growth forms and habitats
(snowbeds fellfields meadows ) Moreover most studies
have focused on the effect of a delayed rather than an
earlier snowmelt (Wipf and Rixen 2010) For example Wipf
and Rixen (2010) found that a delayed snowmelt decreased
productivity (peak season biomass) On the contrary there is
evidence (Walker et al 1995 Wipf et al 2009) that the growth
of some alpine species was reduced in years with advanced
snowmelt as a consequence of unfavourable conditions that
plants experienced in early spring Moreover if reproductive
and vegetative phases are partially influenced by different
environmental factors an early snowmelt can determine
in some species an early flowering causing differences in
reproductive and vegetative resource allocation compared to
standard snowmelt date (Inouye 2008 Korner and Basler
2010) resulting in a decrease in vegetative development
Changes in snow cover amount and duration cause also
a change in nutrient supply in spring (Korner 2003) Our
results suggest that the timing of soluble N availability
may be more likely of concern than the total amount of
N in melted water (Smith et al 2012) 2010 and 2011 had
indeed similar HS and SWC at the time of snowmelt but
different NEE rates and canopy properties (LAI and Chl)
during the CUP Since there is evidence that plants may
take up N maximally after snowmelt (Jaeger et al 1999
Bardgett et al 2007) nutrient uptake in 2011 may have been
limited by the low Tsoil following early snowmelt (Karlsson
and Nordell 1996) Moreover Brooks and Williams (1999)
suggested that the availability of soil N is strongly regulated
by the timing and duration of the snow cover with higher N
immobilization under long-lasting snowpacks and consequent
higher net N conservation in the soil pool Following this
interpretation less N may have been immobilized in soil
during shorter winter 2011 and subsequently available in early
spring 2011 thus contributing to suboptimal conditions for
plant development
We hypothesized that shorter snow seasons potentially
enhance the annual net CO2 uptake of seasonally snow-
covered ecosystems Since the two-month longer CUP alone
cannot explain the twice as high annual uptake observed in
2011 (figure 5(b)) explanations were found in the short 2011
off-season period (ie snow-covered and non-snow-covered
periods with continuous respiration ie NEE gt0) during
which the ecosystem lost less CO2 than in previous years
The off-season period lasted 245 and 242 days in 2009 and
2010 and was 58ndash52 days shorter in 2011 (figure 5(a)) The
shortened snow season translated in a 40 reduction of the
off-season cumulative CO2 loss compared to average years
Conversely differences in CUP cumulative NEE amounted to
less than 5 since despite the longer CUP the average 2011
NEE rate was lower (figure 5(c)) compared to 20092010
Taken together these observations confirm that the higher
annual net CO2 uptake in 2011 was mainly caused by a shorter
period of off-season respiration rather than by an enhanced
CO2 uptake during a longer CUP
5 Conclusion
During a year characterized by an extremely short snow
season a 100 increase in the annual net CO2 uptake was
observed at a subalpine grassland The larger carbon sink was
attributable to smaller cumulative CO2 loss during the shorter
snow season as lower CO2 uptake rates during the longer
CUP resulted in similar cumulative NEE during the vegetation
period as compared to average years If an increase of future
occurrence of events such as the observed is assumed this
trade-off between reduced CO2 losses during shorter winters
and lower uptake during longer summers will be crucial in
determining the annual NEE
Acknowledgments
This study was supported by the PhenoALP project
an Interreg project co-funded by the European Regional
Development Fund under the operational program for
territorial cooperation ItalyndashFrance (ALCOTRA) 2007ndash13
We thank the staff of the Remote Sensing of Environmental
Dynamics Laboratory (DISAT UNIMIB) and Martina Petey
(ARPA VdA) for their support during the field campaigns We
acknowledge the Centro Funzionale della Regione Autonoma
Valle drsquoAosta for providing access to the Cignana long-term
weather data and the people who contributed to collect them
References
Alcamo J Moreno J Novaky B Bindi M Corobov R Devoy RGiannakopoulos C Martin E Olesen J and Shvidenko A 2007Climate Change 2007 Impacts Adaptation and Vulnerability
Contribution of Working Group II to the Fourth Assessment
Report of the Intergovernmental Panel on Climate Change
ed M L Parry O F Canziani J P PalutikofP J van der Linden and C E Hanson (Cambridge CambridgeUniversity Press) pp 541ndash80
Aubinet M et al 2000 Estimates of the annual net carbon and waterexchange of forests the EUROFLUX methodology Adv Ecol
Res 30 113ndash75Baldocchi D 2003 Assessing the eddy covariance technique for
evaluating carbon dioxide exchange rates of ecosystems pastpresent and future Glob Change Biol 9 479ndash92
8
Environ Res Lett 8 (2013) 025008 M Galvagno et al
Baldocchi D et al 2005 Predicting the onset of net carbon uptake bydeciduous forests with soil temperature and climate data asynthesis of FLUXNET data Int J Biometeorol 49 377ndash87
Bardgett R Van Der Wal R Jonsdottir I Quirk H and Dutton S 2007Temporal variability in plant and soil nitrogen pools in ahigh-arctic ecosystem Soil Biol Biochem 39 2129ndash37
Beniston M 2005a Mountain climates and climatic change anoverview of processes focusing on the European Alps Pure
Appl Geophys 162 1587ndash606Beniston M 2005b Warm winter spells in the Swiss Alps strong
heat waves in a cold season A study focusing on climateobservations at the Saentis high mountain site Geophys Res
Lett 32 L01812Brooks P and Williams M 1999 Snowpack controls on nitrogen
cycling and export in seasonally snow-covered catchmentsHydrol Process 13 2177ndash90
Burba G McDermitt D Grelle A Anderson D and Xu L 2008Addressing the influence of instrument surface heat exchangeon the measurements of CO2 flux from open-path gasanalyzers Glob Change Biol 14 1854ndash76
Cao M and Woodward F 1998 Dynamic responses of terrestrialecosystem carbon cycling to global climate change Nature
393 249ndash52Ciais P et al 2005 Europe-wide reduction in primary productivity
caused by the heat and drought in 2003 Nature 437 529ndash33Dash J and Curran P 2004 The MERIS terrestrial chlorophyll index
Int J Remote Sens 25 5403ndash13Dawson T North P Plummer S and Curran P 2003 Forest
ecosystem chlorophyll content implications for remotelysensed estimates of net primary productivity Int J Remote
Sens 24 611ndash7Denman K L et al 2007 Couplings between changes in the climate
system and biogeochemistry Climate Change 2007 The
Physical Science Basis Contribution of Working Group I to the
Fourth Assessment Report of the Intergovernmental Panel on
Climate Change ed S Solomon D Qin M Manning Z ChenM Marquis K B Averyt M Tignor and H L Miller (CambridgeCambridge University Press) pp 499ndash587
Falge E et al 2001 Gap filling strategies for defensible annual sumsof net ecosystem exchange Agric Forest Meteorol 107 43ndash69
Foken T and Wichura B 1996 Tools for quality assessment ofsurface-based flux measurements Agric Forest Meteorol
78 83ndash105Foppa N and Seiz G 2012 Inter-annual variations of snow days over
Switzerland from 2000ndash2010 derived from MODIS satellitedata Cryosphere 6 331ndash42
Gu L Post W Baldocchi D Black T Suyker A Verma SVesala T and Wofsy S 2009 Characterizing the seasonaldynamics of plant community photosynthesis across a range ofvegetation types Phenology of Ecosystem Processes (BerlinSpringer) pp 35ndash58
Heimann M and Reichstein M 2008 Terrestrial ecosystem carbondynamics and climate feedbacks Nature 451 289ndash92
Humphreys E and Lafleur P 2011 Does earlier snowmelt lead togreater CO2 sequestration in two low arctic tundra ecosystemsGeophys Res Lett 38 L09703
Inouye D 2008 Effects of climate change on phenology frostdamage and floral abundance of montane wildflowers Ecology
89 353ndash62Jaeger C III Monson R Fisk M and Schmidt S 1999 Seasonal
partitioning of nitrogen by plants and soil microorganisms inan alpine ecosystem Ecology 80 1883ndash91
Karlsson P and Nordell K 1996 Effects of soil temperature on thenitrogen economy and growth of mountain birch seedlings nearits presumed low temperature distribution limit Ecosci
Sainte-Foy 3 183ndash9
Korner C 2003 Alpine Plant Life Functional Plant Ecology of High
Mountain Ecosystems (Berlin Springer)
Korner C and Basler D 2010 Phenology under global warming
Science 327 1461ndash2
Kramm G Dlugi R and Lenschow D 1995 A re-evaluation of the
Webb correction using density-weighted averages J Hydrol
166 283ndash92
Marcolla B Cescatti A Manca G Zorer R Cavagna M Fiora A
Gianelle D Rodeghiero M Sottocornola M and Zampedri R
2011 Climatic controls and ecosystem responses drive the
inter-annual variability of the net ecosystem exchange of an
alpine meadow Agric Forest Meteorol 151 1233ndash43
Mauder M and Foken T 2004 Documentation and Instruction
Manual of the Eddy Covariance Software Package TK2
(Bayreuth Abteilung Mikrometeorologie Universitat
Bayreuth)
Meroni M et al 2011 The hyperspectral irradiometer a new
instrument for long-term and unattended field spectroscopy
measurements Rev Sci Instrum 82 043106
Migliavacca M et al 2011 Using digital repeat photography and
eddy covariance data to model grassland phenology and
photosynthetic CO2 uptake Agric Forest Meteorol
151 1325ndash37
Monson R Sparks J Rosenstiel T Scott-Denton L Huxman T
Harley P Turnipseed A Burns S Backlund B and Hu J 2005
Climatic influences on net ecosystem CO2 exchange during the
transition from wintertime carbon source to springtime carbon
sink in a high-elevation subalpine forest Oecologia
146 130ndash47Piao S et al 2008 Net carbon dioxide losses of northern ecosystems
in response to autumn warming Nature 451 49ndash52Reichstein M et al 2005 On the separation of net ecosystem
exchange into assimilation and ecosystem respiration reviewand improved algorithm Glob Change Biol 11 1424ndash39
Richardson A Hollinger D Aber J Ollinger S and Braswell B 2007Environmental variation is directly responsible for short-butnot long-term variation in forestndashatmosphere carbon exchangeGlob Change Biol 13 788ndash803
Richardson A Hollinger D Dail D Lee J Munger J and Okeefe J2009 Influence of spring phenology on seasonal and annualcarbon balance in two contrasting New England forests Tree
Physiol 29 321Richardson A et al 2010 Influence of spring and autumn
phenological transitions on forest ecosystem productivity Phil
Trans R Soc B 365 3227Richardson A D Keenan T F Migliavacca M Ryu Y
Sonnentag O and Toomey M 2013 Climate change phenologyand phenological control of vegetation feedbacks to the climatesystem Agric Forest Meteorol 169 156ndash73
Rossini M et al 2012 Remote sensing-based estimation of grossprimary production in a subalpine grassland Biogeosciences
9 1711ndash58Schuepp P Leclerc M MacPherson J and Desjardins R 1990
Footprint prediction of scalar fluxes from analytical solutionsof the diffusion equation Bound-Layer Meteorol 50 355ndash73
Smith J Sconiers W Spasojevic M Ashton I and Suding K 2012Phenological changes in alpine plants in response to increasedsnowpack temperature and nitrogen Arctic Antarc Alpine
Res 44 135ndash42Solomon S Qin D Manning M Chen Z Marquis M Averyt K B
Tignor M and Miller H L (ed) 2007 Climate Change 2007 The
Physical Science Basis Contribution of Working Group I to
the Fourth Assessment Report of the Intergovernmental Panel
on Climate Change (Cambridge Cambridge University Press)Walker M Ingersoll R and Webber P 1995 Effects of interannual
climate variation on phenology and growth of two alpine forbsEcology 76 1067ndash83
9
Environ Res Lett 8 (2013) 025008 M Galvagno et al
Webb E Pearman G and Leuning R 1980 Correction of fluxmeasurements for density effects due to heat and water vapourtransfer Q J R Meteorol Soc 106 85ndash100
Wipf S and Rixen C 2010 A review of snow manipulationexperiments in Arctic and alpine tundra ecosystems Polar Res
29 95ndash109Wipf S Stoeckli V and Bebi P 2009 Winter climate change in alpine
tundra plant responses to changes in snow depth and snowmelttiming Clim Change 94 105ndash21
Wu C et al 2013 Interannual variability of net ecosystemproductivity in forests is explained by carbon flux phenology inautumn Glob Ecol Biogeogr at press (doi101111geb12044)
Wu J van der Linden L Lasslop G Carvalhais N Pilegaard KBeier C and Ibrom A 2012 Effects of climate variability andfunctional changes on the interannual variation of the carbonbalance in a temperate deciduous forest Biogeosciences9 13ndash28
Yi C et al 2012 Climate extremes and grassland potentialproductivity Environ Res Lett 7 035703
10

Environ Res Lett 8 (2013) 025008 M Galvagno et al
Figure 1 Annual course of the major meteorological variables Thefollowing colour codes are used black line for long-term data(average of the period 1928ndash2010) and grey area for the variabilityrange green line light-green line and red line for the study years2009 2010 and 2011 respectively (a) Snow height (cm) long-termdata are presented as the daily median and the variability range iscomputed as 25th and 75th percentiles (b) daily air temperature(C) variability range is computed as standard deviation and data forthe 3 study years are presented as 5 day running mean (c) dailymean soil temperature (C) (d) midday PAR (micromol mminus2 sminus1)presented as 5 day running mean (e) daily SWC ()
DOY 104) occurred 33 days earlier than the long-term mean
(17 May DOY 137) and was the earliest snowmelt since
1945 Instead the 2009 and 2010 snowmelt dates (26ndash24
May DOY 146ndash144 in 2009 and 2010 respectively) fell
well within the variability range of the long-term period and
therefore are considered as average years In autumn 2011
the snow season onset (establishment of continuous winter
snow cover) occurred 29 days later compared to the long-term
average and 32ndash35 days later compared to 2009 and 2010
leading to the longest snow-free period on record (83 years)
Specifically the snow-free period lasted on average 170 days
during the 1928ndash2010 period 160 days in 2009 159 days in
2010 and 234 days in 2011 Maximum HS differed across
study years maximum height measured in 2009 was 174 m
while in both 2010 and 2011 was similar ranging around
090 m Winter 2009 was particularly snowy compared to the
long-term average (107 m for the period 1928ndash2010)
As expected for an alpine ecosystem Tair (figure 1(b))
showed large fluctuations from winter to summer and varied
from a minimum of minus10 plusmn 40 C (1928ndash2010 average plusmn sd)
Figure 2 Cumulative NEE during the 3 study years Colouredareas represent uncertainty on the flux computation Vertical solidlines represent the snowmelt (left side) and snow onset (right side)dates in each year (green light-green and red for 2009 2010 and2011 respectively) vertical dashed lines represent the BGScup andEGScup the black triangles indicate the peak dates
in January to a maximum of 17 plusmn 39 C in July (1928ndash2010
average plusmn sd) Regarding 2011 the main discrepancies
compared to previous years were observed in the period
MarchndashApril characterized by a mean temperature 22 C
warmer than the 1928ndash2010 average and 27ndash30 C warmer
than the mean temperature of previous study yearsmdasha
difference that was very likely responsible for the early
snowmelt
Soil temperature (figure 1(c)) under snow cover showed
constant values above 0 C Immediately after snowmelt Tsoil
exhibited a characteristic rise In spring 2009 and 2010 this
rise was fast and in a few days Tsoil reached temperature
values similar to those of Tair In 2011 the increase in Tsoil
after snowmelt was slower
The seasonal pattern of midday (1100ndash1300) mean
values of incident PAR (figure 1(d)) was similar among the
different years
The snow-free period SWC (figure 1(e)) showed mean
values of 263 and 251 in 2011 and 2010 respectively and
a lower mean of 164 in 2009 SWC in all years exhibited
a typical peak around the day of snowmelt when the highest
seasonal value was reached
32 Phenology and CO2 sourcesink strength
Figure 2 shows the time course of cumulative NEE in the
three years analysed in this study The seasonal variation of
CO2 fluxes (see also figure 1 in supplementary data available
at stacksioporgERL8025008mmedia) exhibited different
dynamics in 2009 and 2010 as compared to 2011 NEE
in 2009 and 2010 sharply increased in spring just after
snowmelt rapidly reaching peak values in early July (18ndash13
DOY 199 and 194 respectively) In contrast the NEE increase
in 2011 occurred earlier but at lower rate The grassland turned
to a sink on 8 June in 2009 (DOY 159) 1 June in 2010
(DOY 152) and 29 April in 2011 (DOY 119) In 2011 BGScup
occurred 33ndash40 days in advance compared to the previous two
years and the time lag between snowmelt and BGScup was
slightly larger than in 2009 and 2010 (13 8 and 16 days in
4
Environ Res Lett 8 (2013) 025008 M Galvagno et al
Table 1 NEE sums (gC mminus2 plusmn uncertainty range see supplementary data available at stacksioporgERL8025008mmedia) and averagerates (ie NEE sum in each phenophase divided by number of days) partitioned by phenophase and associated with the correspondingaverages of the meteorological variables (Tair C SWC PAR micromol mminus2 sminus1 Tsoil C)
1 Jan-snowmeltSnowmelt-BGScup BGScupndashpeak PeakndashEGScup
EGScup-snowonset
Snow onset-31Dec
Days Days Days Days Days Days
2009 146 13 41 83 26 602010 144 9 43 85 26 632011 104 16 67 116 39 28
NEE Sum Rate Sum Rate Sum Rate Sum Rate Sum Rate Sum Rate
2009 1162 plusmn 309 08 71 plusmn 04 054 minus1087 plusmn 06 minus265 minus1270 plusmn 53 minus153 70 plusmn 21 027 383 plusmn 118 0632010 1037 plusmn 402 072 501 plusmn 01 055 minus949 plusmn 18 minus23 minus1278 plusmn 63 minus151 63 plusmn 09 024 498 plusmn 202 0792011 626 plusmn 206 060 45 plusmn 04 028 minus852 plusmn 09 minus127 minus1335 plusmn 29 minus115 105 plusmn 34 026 198 plusmn 60 070
Tair Mean Mean Mean Mean Mean Mean
2009 minus173 760 1025 999 281 minus2722010 minus296 713 1042 900 213 minus3892011 minus113 160 765 892 175 minus283
SWC
2009 mdash 278 180 140 157 mdash2010 mdash 345 305 220 228 mdash2011 mdash 304 287 239 279 mdash
PAR
2009 mdash 14288 15470 13617 8971 60852010 mdash 13259 13935 13070 9217 55072011 mdash 12370 1370 12515 6977 4883
Tsoil
2009 069 815 120 1124 39 0252010 minus008 81 119 1116 43 0592011 044 495 1024 109 076 minus012
2009 2010 and 2011 respectively) NEE peaked 40 days after
BGScup in 2009 and 2010 and 65 days in 2011 The ecosystem
turned to a net source on 7 October (DOY 281) 4 October
(DOY 278) and 26 October (DOY 300) in 2009 2010 and
2011 respectively In 2011 the CUP lasted 55 and 59 days
longer than the two previous years
Annual cumulative NEE in 2011 (minus118 plusmn 31 gC mminus2
yrminus1) doubled 2009 (minus62 plusmn 52 gC mminus2 yrminus1) and 2010
(minus55 plusmn 60 gC mminus2 yrminus1) values In contrast despite
the two-month longer CUP observed in 2011 seasonal
cumulative NEE between BGScup and EGScup (ie the
CUP cumulative) were similar among years minus230 plusmn
6 gC mminus2 in 2009 minus218 plusmn 8 gC mminus2 in 2010 and
minus215 plusmn 4 gC mminus2 in 2011 Moreover in 2011 NEE
did not reach the peak daily values of previous years
(minus50 gC mminus2 dminus1 minus47 gC mminus2 dminus1 minus34 gC mminus2 dminus1 in
2009 2010 and 2011 respectively)
Table 1 shows the differential contributions of the
considered phenophases to the annual cumulative NEE in
terms of sums and average rates (ie NEE sum in each
phenophase divided by the number of days) The averages of
the environmental variables measured in each period are also
reported The peculiarities of 2011 were the overall shorter
snow season lower respiration during the January-snowmelt
and snowmelt-BGScup periods a longer time for net CO2
uptake (ie longer CUP) but the latter was associated with
reduced rates during the developing phases (ie BGScup to
peak)
The lower cumulative NEE from January to snowmelt in
2011 was mainly a result of the shorter duration of that period
and of the slightly lower (16) respiration rate (figure 2
table 1) compared to the same period in 2009 and 2010
Lower rates of CO2 losses in 2011 together with lower mean
Tsoil Tair and midday PAR were also observed in the period
between snowmelt and BGScup (in figure 2 the maximum
cumulative NEE after snowmelt reached lower positive values
in 2011) Less CO2 was taken up in 2011 compared to
20092010 during the longer period between the BGScup and
the peak value because of a lower NEE rate (sim50) as
highlighted by the less steep slope in 2011 (figure 2) This
period was again associated with lower mean Tair Tsoil and
PAR compared to previous years This pattern is also evident
in figure 3(a) showing the mean diurnal patterns of NEE from
the BGScup to peak period Maximum diurnal NEE in this
period reached minus94 and minus81 micromolCO2 mminus2 sminus1 in 2009
and 2010 while it was minus52 micromolCO2 mminus2 sminus1 in 2011
Moreover figures 4(a) and (b) showing seasonal courses
of LAI and Chl revealed that also biophysical parameters
related to canopy development were lower in 2011 compared
to 20092010 LAI showed maximum values of 27 m2 mminus2
5
Environ Res Lett 8 (2013) 025008 M Galvagno et al
Figure 3 (a) Mean diurnal variation of NEE during theBGScupndashpeak and (b) peakndashEGScup phases Different coloursrepresent the different years (green light-green and red for 20092010 and 2011 respectively)
Figure 4 Seasonal course of (a) leaf area index LAI (m2 mminus2)and (b) chlorophyll content (microg gminus1) during the three years of study(green light-green and red for 2009 2010 and 2011 respectively)Chlorophyll content was derived fitting a linear regression model tomeris terrestrial chlorophyll index (MTCI) values calibrated usingChl concentrations extracted from leaf samples at the study site
and 28 m2 mminus2 in 2009 and 2010 respectively and only
218 m2 mminus2 in 2011 Not only leaf area but also maximum
chlorophyll content attained in 2011 was lower with a peak
value of 22 and 21 microg gminus1 in 2009 and 2010 and of
17 microg gminus1 in 2011
During the long period separating the peak value and the
EGScup in 2011 the ecosystem CO2 uptake was higher than
in previous years even if the average rate remained slightly
lower (table 1 figure 3(b))
Finally respiratory rates after EGScup were similar
among years (table 1) as highlighted in figure 2 by the similar
slopes of NEE The lower cumulative CO2 loss in 2011 during
this phase was therefore mainly related to the shorter period
Table 2 Summary of lightndashresponse curve analysis results(a) Average and standard deviation of the model parameters(absolute values are reported) estimated for each year with thelightndashresponse curve analysis (b) Estimated NEE sums (gC mminus2) inthe period DOY 176ndash190 Each column represents the cumulativeNEE predicted using a fixed PAR dataset and varying physiologyparameters Each row represents the cumulative NEE predictedusing the model parameters obtained for the considered year andvarying PAR dataset
(a)
α Amax Reco
2009 0027 plusmn 001 2428 plusmn 21 246 plusmn 0132010 0022 plusmn 001 2056 plusmn 09 170 plusmn 0122011 0017 plusmn 001 1630 plusmn 153 162 plusmn 028
(b)
PAR 2009 PAR 2010 PAR 2011
Physiology parameters
2009 minus6073 minus6105 minus66632010 minus5793 minus5854 minus62382011 minus412 minus4171 minus4429
The results of the modelling analysis (table 2) clarified
whether in 2011 the ecosystem was unable to reach NEE
values and rates similar to previous years as a consequence
of changes in canopy structural and physiological properties
(eg lower Chl and LAI) due to the early development or as
a direct effect of unfavourable summer weather conditions
The analysis showed that (i) model parameters (ie α Amax
and Reco) obtained from lightndashresponse curve in 2011 were
significantly lower compared to 2009 and 2010 (p lt 005
WilcoxonndashMannndashWhitney test) (ii) using fixed PAR and
varying physiology parameters (ie using PAR data of one
year for all three physiology parameter sets) predicted NEE
sums using the 2011 parameters were always higher (ie
lower uptake ranging from minus412 to minus4429 gC mminus2) than
those obtained using 2009 (from minus6073 to minus6663 gC mminus2)
or 2010 (from minus5793 to minus6238 gC mminus2) parameters (iii)
using fixed physiology parameters with varying PAR dataset
NEE sums simulated using the 2011 PAR dataset were always
lower (ie higher uptake) than those obtained using 2009 or
2010 PAR dataset This underlined that the NEE reduction
observed in 2011 can be attributed to changes in grassland
structural and physiological properties rather than to direct
limiting weather conditions in this period
4 Discussion
In seasonally snow-covered ecosystems earlier snowmelt
and later establishment of snow cover potentially reduce the
continuous off-season CO2 losses and may result in longer
periods of CO2 uptake and growth In this study we took
advantage of a natural experiment (ie an exceptionally short
snow season) to test the hypothesis that shorter snow-covered
periods may enhance the CUP and the annual net CO2 uptake
of subalpine grasslands Results confirmed this assumption
Nevertheless two different effects were observed less CO2
6
Environ Res Lett 8 (2013) 025008 M Galvagno et al
losses took place during the shorter snow season and lower
CO2 uptake rates occurred during the longer CUP
Did the extremely short snow season increase the CUP in
the investigated ecosystem
We observed that a variation of more than one month (43 days)
in the date of snowmelt caused a similar shift (35ndash40 days)
in the beginning of the CUP However the earlier snowmelt
was followed by a slower increase of the biological activity
compared to years with average snowmelt This observation
was supported by the larger time lag between the date of
snowmelt and the beginning of the subsequent phenological
phases in 2011 ie the ecosystem processes were slower in
reaching the different thresholds considered
The date of snowmelt imposes a clear physical limit
to canopy spring development of high-altitude grasslands
When the snowpack-imposed decoupling between vegetation
ambient light and temperature finishes biological processes
quickly take advantage of favourable weather conditions
optimizing the short snow-free period available for growth
(Korner 2003 Monson et al 2005) This dynamic pattern
is typical of warm-season vegetation types for which
photosynthesis in spring recovers generally faster than the
senescence at the end of the season (Gu et al 2009) In alpine
ecosystems extreme climate events such as particularly warm
spring spells and the subsequent early snowmelt could change
this typical pattern The result is a lengthening of the CUP but
also an exposure of the vegetation to early spring unfavourable
weather conditions (eg lower PAR and temperature colder
than usual) and an increased risk of cold damage When
snowmelt occurred around the end of May in 2009 and 2010
weather conditions (Tair and Tsoil photoperiod PAR) at the
study site were already at optimal level and as a consequence
the up-regulation of photosynthetic activity was fast On
the contrary the early snowmelt recorded at the beginning
of April 2011 led to the advancement of each phenophase
but caused the ecosystem to face less favourable weather
conditions typical of an earlier time of the year characterized
by shorter day-length lower PAR and colder temperatures
While the effect of recent warming trends on the onset
of plant activity in spring has been outlined in several works
(Richardson et al 2013) uncertainties exist on how climate
change may affect autumn phenology and CO2 fluxes (eg
Wu et al 2013 Piao et al 2008) Moreover the end of
CUP variability and its environmental drivers are poorly
investigated within grassland sites In 2011 we observed a late
snow onset in autumn due to a prolonged period of warm
temperatures and absence of precipitation As a consequence
the ecosystem turned to a source about 20 days later than in
previous years further contributing to the increase of the CUP
duration
What is the effect on the ecosystem CO2 uptake
The two-month longer CUP observed in 2011 (figure 5(a))
did not lead to higher but rather similar seasonal cumulative
carbon uptake compared to average years as a result of
the compensation between a longer CUP and a lower NEE
rate (figure 5(c) table 1) In 2011 daily NEE rate during
the CUP was generally lower compared to previous years
especially during the spring development and reached a peak
Figure 5 (a) Duration of the off-season (ie snow-covered andnon-snow-covered periods with NEE gt0) (blue) and CUP periods(green) (b) cumulative NEE (gC mminus2) during the off-season (blue)CUP (green) and yearly periods (orange) (c) NEE average rateduring the off-season (blue) and CUP periods (green)
value lower than other years We observed that environmental
conditions during the summer period were fairly similar
among years and thus unlikely to account for the observed
differences in physiology parameters and photosynthetic
rates The lower summer CO2 uptake appears to be the result
of the biotic response of the ecosystem to an exceptional
climate event the early spring weather that the ecosystem
experienced as a consequence of early snowmelt changed the
typical trajectory of canopy development and physiological
responses of the ecosystem to environmental conditions
Compared to previous years plants developed in unusual
spring conditions may have adjusted their physiological
7
Environ Res Lett 8 (2013) 025008 M Galvagno et al
responses to lower PAR shorter day-length and lower
temperature experienced during the early development and
were unable to capitalize on later growing season weather
conditions (Monson et al 2005) The snowmelt observed in
2011 is the third earliest snowmelt in 83 years and hence
represents an unusual event for plants that are very likely
acclimated to a narrower range of weather conditions This
observation was also supported by LAI and Chl data since
the ecosystem modifies its photosynthetic capacity through
variations in LAI and chlorophyll content in relation to
changes in limiting factors (Dawson et al 2003) To our
knowledge there are few studies highlighting similar findings
Indeed although shifts in structural or reproductive phenology
as a result of variations in snow cover depth and duration
have clearly been described in several experimental studies
of snow manipulation (eg Wipf and Rixen 2010) results
concerning the effects on growth and productivity are less
clear and differ among species growth forms and habitats
(snowbeds fellfields meadows ) Moreover most studies
have focused on the effect of a delayed rather than an
earlier snowmelt (Wipf and Rixen 2010) For example Wipf
and Rixen (2010) found that a delayed snowmelt decreased
productivity (peak season biomass) On the contrary there is
evidence (Walker et al 1995 Wipf et al 2009) that the growth
of some alpine species was reduced in years with advanced
snowmelt as a consequence of unfavourable conditions that
plants experienced in early spring Moreover if reproductive
and vegetative phases are partially influenced by different
environmental factors an early snowmelt can determine
in some species an early flowering causing differences in
reproductive and vegetative resource allocation compared to
standard snowmelt date (Inouye 2008 Korner and Basler
2010) resulting in a decrease in vegetative development
Changes in snow cover amount and duration cause also
a change in nutrient supply in spring (Korner 2003) Our
results suggest that the timing of soluble N availability
may be more likely of concern than the total amount of
N in melted water (Smith et al 2012) 2010 and 2011 had
indeed similar HS and SWC at the time of snowmelt but
different NEE rates and canopy properties (LAI and Chl)
during the CUP Since there is evidence that plants may
take up N maximally after snowmelt (Jaeger et al 1999
Bardgett et al 2007) nutrient uptake in 2011 may have been
limited by the low Tsoil following early snowmelt (Karlsson
and Nordell 1996) Moreover Brooks and Williams (1999)
suggested that the availability of soil N is strongly regulated
by the timing and duration of the snow cover with higher N
immobilization under long-lasting snowpacks and consequent
higher net N conservation in the soil pool Following this
interpretation less N may have been immobilized in soil
during shorter winter 2011 and subsequently available in early
spring 2011 thus contributing to suboptimal conditions for
plant development
We hypothesized that shorter snow seasons potentially
enhance the annual net CO2 uptake of seasonally snow-
covered ecosystems Since the two-month longer CUP alone
cannot explain the twice as high annual uptake observed in
2011 (figure 5(b)) explanations were found in the short 2011
off-season period (ie snow-covered and non-snow-covered
periods with continuous respiration ie NEE gt0) during
which the ecosystem lost less CO2 than in previous years
The off-season period lasted 245 and 242 days in 2009 and
2010 and was 58ndash52 days shorter in 2011 (figure 5(a)) The
shortened snow season translated in a 40 reduction of the
off-season cumulative CO2 loss compared to average years
Conversely differences in CUP cumulative NEE amounted to
less than 5 since despite the longer CUP the average 2011
NEE rate was lower (figure 5(c)) compared to 20092010
Taken together these observations confirm that the higher
annual net CO2 uptake in 2011 was mainly caused by a shorter
period of off-season respiration rather than by an enhanced
CO2 uptake during a longer CUP
5 Conclusion
During a year characterized by an extremely short snow
season a 100 increase in the annual net CO2 uptake was
observed at a subalpine grassland The larger carbon sink was
attributable to smaller cumulative CO2 loss during the shorter
snow season as lower CO2 uptake rates during the longer
CUP resulted in similar cumulative NEE during the vegetation
period as compared to average years If an increase of future
occurrence of events such as the observed is assumed this
trade-off between reduced CO2 losses during shorter winters
and lower uptake during longer summers will be crucial in
determining the annual NEE
Acknowledgments
This study was supported by the PhenoALP project
an Interreg project co-funded by the European Regional
Development Fund under the operational program for
territorial cooperation ItalyndashFrance (ALCOTRA) 2007ndash13
We thank the staff of the Remote Sensing of Environmental
Dynamics Laboratory (DISAT UNIMIB) and Martina Petey
(ARPA VdA) for their support during the field campaigns We
acknowledge the Centro Funzionale della Regione Autonoma
Valle drsquoAosta for providing access to the Cignana long-term
weather data and the people who contributed to collect them
References
Alcamo J Moreno J Novaky B Bindi M Corobov R Devoy RGiannakopoulos C Martin E Olesen J and Shvidenko A 2007Climate Change 2007 Impacts Adaptation and Vulnerability
Contribution of Working Group II to the Fourth Assessment
Report of the Intergovernmental Panel on Climate Change
ed M L Parry O F Canziani J P PalutikofP J van der Linden and C E Hanson (Cambridge CambridgeUniversity Press) pp 541ndash80
Aubinet M et al 2000 Estimates of the annual net carbon and waterexchange of forests the EUROFLUX methodology Adv Ecol
Res 30 113ndash75Baldocchi D 2003 Assessing the eddy covariance technique for
evaluating carbon dioxide exchange rates of ecosystems pastpresent and future Glob Change Biol 9 479ndash92
8
Environ Res Lett 8 (2013) 025008 M Galvagno et al
Baldocchi D et al 2005 Predicting the onset of net carbon uptake bydeciduous forests with soil temperature and climate data asynthesis of FLUXNET data Int J Biometeorol 49 377ndash87
Bardgett R Van Der Wal R Jonsdottir I Quirk H and Dutton S 2007Temporal variability in plant and soil nitrogen pools in ahigh-arctic ecosystem Soil Biol Biochem 39 2129ndash37
Beniston M 2005a Mountain climates and climatic change anoverview of processes focusing on the European Alps Pure
Appl Geophys 162 1587ndash606Beniston M 2005b Warm winter spells in the Swiss Alps strong
heat waves in a cold season A study focusing on climateobservations at the Saentis high mountain site Geophys Res
Lett 32 L01812Brooks P and Williams M 1999 Snowpack controls on nitrogen
cycling and export in seasonally snow-covered catchmentsHydrol Process 13 2177ndash90
Burba G McDermitt D Grelle A Anderson D and Xu L 2008Addressing the influence of instrument surface heat exchangeon the measurements of CO2 flux from open-path gasanalyzers Glob Change Biol 14 1854ndash76
Cao M and Woodward F 1998 Dynamic responses of terrestrialecosystem carbon cycling to global climate change Nature
393 249ndash52Ciais P et al 2005 Europe-wide reduction in primary productivity
caused by the heat and drought in 2003 Nature 437 529ndash33Dash J and Curran P 2004 The MERIS terrestrial chlorophyll index
Int J Remote Sens 25 5403ndash13Dawson T North P Plummer S and Curran P 2003 Forest
ecosystem chlorophyll content implications for remotelysensed estimates of net primary productivity Int J Remote
Sens 24 611ndash7Denman K L et al 2007 Couplings between changes in the climate
system and biogeochemistry Climate Change 2007 The
Physical Science Basis Contribution of Working Group I to the
Fourth Assessment Report of the Intergovernmental Panel on
Climate Change ed S Solomon D Qin M Manning Z ChenM Marquis K B Averyt M Tignor and H L Miller (CambridgeCambridge University Press) pp 499ndash587
Falge E et al 2001 Gap filling strategies for defensible annual sumsof net ecosystem exchange Agric Forest Meteorol 107 43ndash69
Foken T and Wichura B 1996 Tools for quality assessment ofsurface-based flux measurements Agric Forest Meteorol
78 83ndash105Foppa N and Seiz G 2012 Inter-annual variations of snow days over
Switzerland from 2000ndash2010 derived from MODIS satellitedata Cryosphere 6 331ndash42
Gu L Post W Baldocchi D Black T Suyker A Verma SVesala T and Wofsy S 2009 Characterizing the seasonaldynamics of plant community photosynthesis across a range ofvegetation types Phenology of Ecosystem Processes (BerlinSpringer) pp 35ndash58
Heimann M and Reichstein M 2008 Terrestrial ecosystem carbondynamics and climate feedbacks Nature 451 289ndash92
Humphreys E and Lafleur P 2011 Does earlier snowmelt lead togreater CO2 sequestration in two low arctic tundra ecosystemsGeophys Res Lett 38 L09703
Inouye D 2008 Effects of climate change on phenology frostdamage and floral abundance of montane wildflowers Ecology
89 353ndash62Jaeger C III Monson R Fisk M and Schmidt S 1999 Seasonal
partitioning of nitrogen by plants and soil microorganisms inan alpine ecosystem Ecology 80 1883ndash91
Karlsson P and Nordell K 1996 Effects of soil temperature on thenitrogen economy and growth of mountain birch seedlings nearits presumed low temperature distribution limit Ecosci
Sainte-Foy 3 183ndash9
Korner C 2003 Alpine Plant Life Functional Plant Ecology of High
Mountain Ecosystems (Berlin Springer)
Korner C and Basler D 2010 Phenology under global warming
Science 327 1461ndash2
Kramm G Dlugi R and Lenschow D 1995 A re-evaluation of the
Webb correction using density-weighted averages J Hydrol
166 283ndash92
Marcolla B Cescatti A Manca G Zorer R Cavagna M Fiora A
Gianelle D Rodeghiero M Sottocornola M and Zampedri R
2011 Climatic controls and ecosystem responses drive the
inter-annual variability of the net ecosystem exchange of an
alpine meadow Agric Forest Meteorol 151 1233ndash43
Mauder M and Foken T 2004 Documentation and Instruction
Manual of the Eddy Covariance Software Package TK2
(Bayreuth Abteilung Mikrometeorologie Universitat
Bayreuth)
Meroni M et al 2011 The hyperspectral irradiometer a new
instrument for long-term and unattended field spectroscopy
measurements Rev Sci Instrum 82 043106
Migliavacca M et al 2011 Using digital repeat photography and
eddy covariance data to model grassland phenology and
photosynthetic CO2 uptake Agric Forest Meteorol
151 1325ndash37
Monson R Sparks J Rosenstiel T Scott-Denton L Huxman T
Harley P Turnipseed A Burns S Backlund B and Hu J 2005
Climatic influences on net ecosystem CO2 exchange during the
transition from wintertime carbon source to springtime carbon
sink in a high-elevation subalpine forest Oecologia
146 130ndash47Piao S et al 2008 Net carbon dioxide losses of northern ecosystems
in response to autumn warming Nature 451 49ndash52Reichstein M et al 2005 On the separation of net ecosystem
exchange into assimilation and ecosystem respiration reviewand improved algorithm Glob Change Biol 11 1424ndash39
Richardson A Hollinger D Aber J Ollinger S and Braswell B 2007Environmental variation is directly responsible for short-butnot long-term variation in forestndashatmosphere carbon exchangeGlob Change Biol 13 788ndash803
Richardson A Hollinger D Dail D Lee J Munger J and Okeefe J2009 Influence of spring phenology on seasonal and annualcarbon balance in two contrasting New England forests Tree
Physiol 29 321Richardson A et al 2010 Influence of spring and autumn
phenological transitions on forest ecosystem productivity Phil
Trans R Soc B 365 3227Richardson A D Keenan T F Migliavacca M Ryu Y
Sonnentag O and Toomey M 2013 Climate change phenologyand phenological control of vegetation feedbacks to the climatesystem Agric Forest Meteorol 169 156ndash73
Rossini M et al 2012 Remote sensing-based estimation of grossprimary production in a subalpine grassland Biogeosciences
9 1711ndash58Schuepp P Leclerc M MacPherson J and Desjardins R 1990
Footprint prediction of scalar fluxes from analytical solutionsof the diffusion equation Bound-Layer Meteorol 50 355ndash73
Smith J Sconiers W Spasojevic M Ashton I and Suding K 2012Phenological changes in alpine plants in response to increasedsnowpack temperature and nitrogen Arctic Antarc Alpine
Res 44 135ndash42Solomon S Qin D Manning M Chen Z Marquis M Averyt K B
Tignor M and Miller H L (ed) 2007 Climate Change 2007 The
Physical Science Basis Contribution of Working Group I to
the Fourth Assessment Report of the Intergovernmental Panel
on Climate Change (Cambridge Cambridge University Press)Walker M Ingersoll R and Webber P 1995 Effects of interannual
climate variation on phenology and growth of two alpine forbsEcology 76 1067ndash83
9
Environ Res Lett 8 (2013) 025008 M Galvagno et al
Webb E Pearman G and Leuning R 1980 Correction of fluxmeasurements for density effects due to heat and water vapourtransfer Q J R Meteorol Soc 106 85ndash100
Wipf S and Rixen C 2010 A review of snow manipulationexperiments in Arctic and alpine tundra ecosystems Polar Res
29 95ndash109Wipf S Stoeckli V and Bebi P 2009 Winter climate change in alpine
tundra plant responses to changes in snow depth and snowmelttiming Clim Change 94 105ndash21
Wu C et al 2013 Interannual variability of net ecosystemproductivity in forests is explained by carbon flux phenology inautumn Glob Ecol Biogeogr at press (doi101111geb12044)
Wu J van der Linden L Lasslop G Carvalhais N Pilegaard KBeier C and Ibrom A 2012 Effects of climate variability andfunctional changes on the interannual variation of the carbonbalance in a temperate deciduous forest Biogeosciences9 13ndash28
Yi C et al 2012 Climate extremes and grassland potentialproductivity Environ Res Lett 7 035703
10
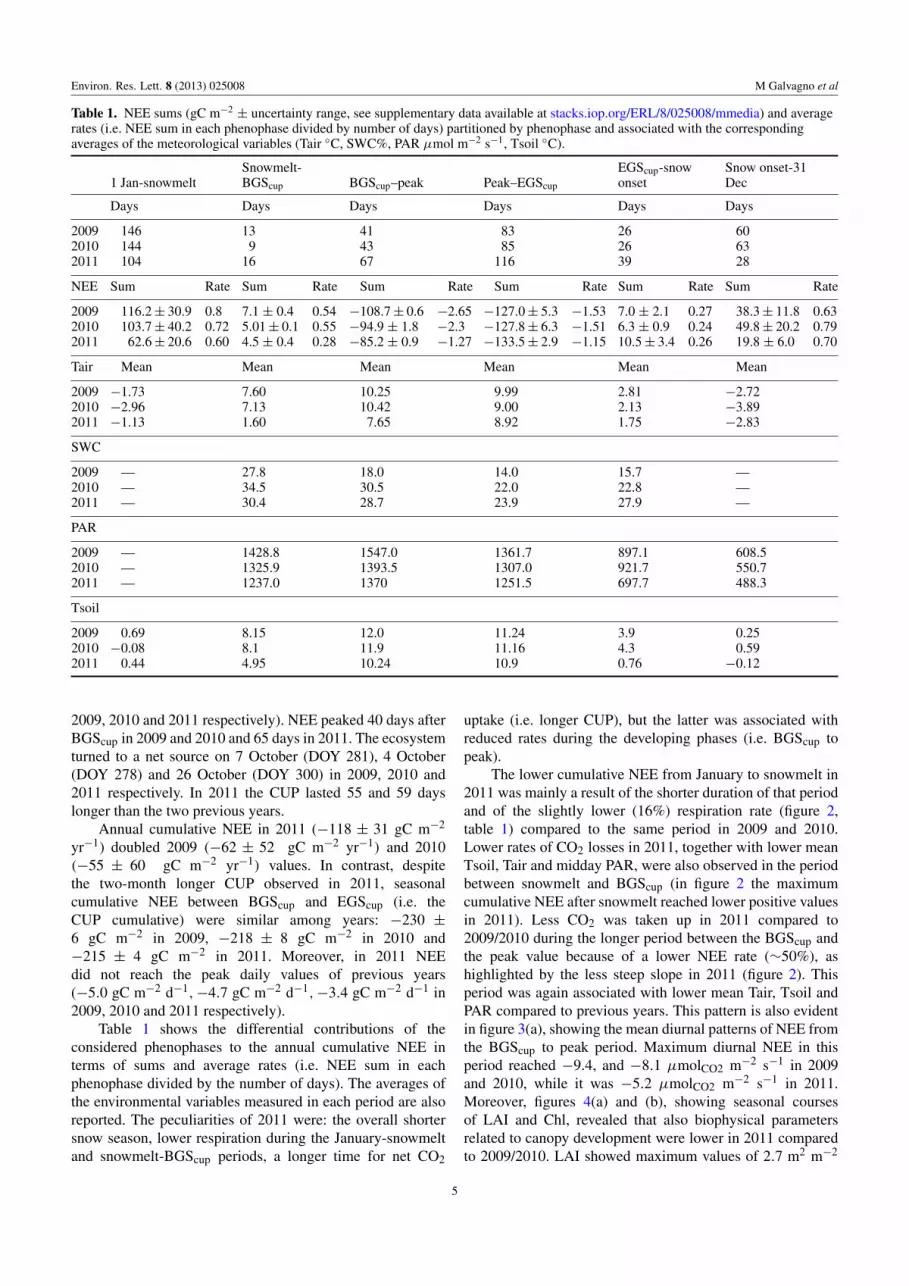
Environ Res Lett 8 (2013) 025008 M Galvagno et al
Webb E Pearman G and Leuning R 1980 Correction of fluxmeasurements for density effects due to heat and water vapourtransfer Q J R Meteorol Soc 106 85ndash100
Wipf S and Rixen C 2010 A review of snow manipulationexperiments in Arctic and alpine tundra ecosystems Polar Res
29 95ndash109Wipf S Stoeckli V and Bebi P 2009 Winter climate change in alpine
tundra plant responses to changes in snow depth and snowmelttiming Clim Change 94 105ndash21
Wu C et al 2013 Interannual variability of net ecosystemproductivity in forests is explained by carbon flux phenology inautumn Glob Ecol Biogeogr at press (doi101111geb12044)
Wu J van der Linden L Lasslop G Carvalhais N Pilegaard KBeier C and Ibrom A 2012 Effects of climate variability andfunctional changes on the interannual variation of the carbonbalance in a temperate deciduous forest Biogeosciences9 13ndash28
Yi C et al 2012 Climate extremes and grassland potentialproductivity Environ Res Lett 7 035703
10
Copyright © 2022 FDOKUMEN