Successful Weight-loss Maintenance in Relation to Method of Weight Loss
ArticleCode : dnl_2508
Using a Hybrid Evolutionary Method for Optimal Planning, and
Reducing Loss of Distribution Networks
L.Mohammadian, A.Mohammadian, S.khani, M.Tarafdare Hagh, E.Babaei
Tabriz University, Tabriz, Iran
Keywords: distribution system, conductor size, capacitor placement, loss reduction, optimization.
Abstract
In this paper the practical planning of distribution system includes the selection of optimal conductor size and capacitor placement in radial distribution network considering increasing rate of loads. Technical operational constraints are available conductors and capacitors, voltage limit, maximum permissible carrying current of conductors and maximum reactive power could be i�ected. The power loss minimization problem is solved using a hybrid method of GA and PSO, which is called HGAPSO. By applying the proposed method, final cost of network planning, losses and their cost are considerably reduced and voltage profile of the network has improved to a semi flat shape. Simulation results are investigated on a sample radial distribution network. At last the effectiveness of proposed hybrid method is proved comparing the results with obtained results from PSO.
I. Introduction
The close propinquity of distribution network to the consumers of electricity, has made it a necessity to explore the area of practical planning of distribution system[I]. Because of the growing effort to reduce system losses, many papers have been published in recent years referring to optimal distribution planning, but in all these attempts, its significant sub problems of optimal conductor size selection, optimal place of capacitors to obtain minimum possible loss, still need to be further studied. Some articles have been
published dealing with optimal planning of distribution networks [3,5,6,7], in general have focused on reducing cost through optimizing the conductor profile, capacitor cost, and in some cases cost of losses. But in these all, increasing rate of load for future years is not considered. In addition, in most articles there is not any special way to solve power flow problem in distribution system and they simultaneously have solved power flow problem and minimized the objective function. In this paper a software package is developed to determine radial distribution system parameters just having line data matrix, and technical data for available capacitors and conductors. Furthermore, a HGAPSO method for solving optimization problem, which uses both GA and PSO's benefits simultaneously, is presented.
The proposed method is tested on a sample radial distribution network, with 5-types of available conductors and 11 different sizes of capacitors, considering 8 years for load growth.
II. Problem Formulation
Power flow Load flow is very important and fundamental tool for analysis of any power system and is used in the operational as well as planning stages. Certain application, particularly in distribution automation and optimization of power system, requires repeated load flow solution. In these applications, it is very important to solve the load flow problem as efficiently as possible. The Newton-Raphson
and the fast decoupled power flow solution techniques and a host of their derivatives have efficiently solved for "well behaved" power systems. Researchers however have been aware of the shortcomings of these algorithms when they are generally implemented and applied to ill conditioned power systems. Power flow in a distribution system obeys physical laws such as (Kirchhoff laws and Ohms law) which became part of the constraints in the capacitor placement problem. The distribution system power flow solution is to be used as a subroutine in each iteration. Therefore, it is essential to have a computationally efficient and numerically robust method for solving the distribution system power flow. By radial distribution system, we mean a system which has a single simultaneous path of power flow to the load. We have used a method, that exploits the radial structure of the distribution network and the relationship between the bus powers and branch powers is expressed as a non-singular square matrix known as element incidence matrix. The power flow equations for a radial
distribution system are derived as the relationship between the specified complex bus powers and the bus voltages. Let Sij is the complex power flowing from
bus 'i' to bus 'j', so we have:
Sij = Pij + jQij = Vi(vt - I.j*)�j (1)
The 'i'th bus powers are expressed as:
Pi + Qi = I Pij + Qij iEk(i)
+ I Vi(Vi - V;)Vij (2) iEk(i)
Where, k(i) is the set of nodes connected to node i, and Pi and Qi denote the real and reactive power at node i, respectively. The above complex non linear equations are to be solved to determine the bus voltages. The real and imaginary parts of the equations are separated and solved using numerical methods.
Formulation o/proposed method The formulation of proposed method is based on this fact that an N bus radial distribution
network has only N -1 lines (elements) and the branch currents (powers) can be expressed in terms of bus currents (powers). For an element ij connected between nodes 'i' and 'j' the bus current of node j can be expressed by a linear equation as follows:
(3)
Where, K CD is the set of nodes connected to node j. For the slack bus the power is not specified so it is excluded and the relationship between bus currents and branch currents are derived as a non-singular square matrix as follows:
The matrix K is element incidence matrix. It is a non singular square matrix of order N-l .The elemental incidence matrix is constructed in a simple way similar to bus incidence matrix. In matrix K each row describes the element incidences. The elements are numbered in conventional way i.e. the no. of element 'ij' is j-l . 1. The diagonal elements of matrix K are one. The variable j is denoting the element number. KG, j)=l 2. For each 'j' th element let m CD is the set of element numbers connected at its receiving end. KG, m G)) = -1 3. All the remaining elements are zero. It can be observed that all below the main diagonal elements of matrix K are zero.
(5)
The relationship between the branch currents and bus currents can be extended to complex branch powers and bus powers. The sending end power and the receiving end powers are not same due to the line loss. The line loss is included as the difference between the sending end, and receiving end powers. The relationship between branch powers and bus powers is established in same way of bus, and branch currents. Multiplying both sides by element incidence matrix K:
S - K[ssending T'L ] bus - branch - branch
(6)
The power flow equations are complex quadratic equations. These are solved as [2] and the results we can get are voltage magnitude, voltage angle, active and reactive losses, complex current of branches. The advantage of this method is that it does not require a flat start. The formulation can be extended to unbalanced three-phase networks. The reactive power injections at multiple ends can be effectively calculated to improve the voltage profile.
Objective Function In each optimization problem, objective function should be defined. In the proposed approach, objective function can be formulated as following equation; the proposed objective function aims at minimizing the total annual cost due to capacitor placement, conductor selection and power losses considering load growth in period of instrument life, with constraints that include limits on voltage, maximum permissible carrying current of conductors, size of installed capacitors and type of selected conductors, and maximum permissible reactive current to be injected to avoid over voltage.
n J J = tLI x C(conl) + 'LK; xQ; +
1=0 )=1 N .
+ 'Ll1osSi xCE xP� x 8760xLSF; + i=1 '
m 2 2 + 'L {max(O, Vmin - Vk) + max(O, Vk - Vmax) } + k=1 n, 1 2 m c 2 + 'L(11 - ImaJ + 'L(Q) - TQloss) 1=1 )=1
Where:
Pw = ( 1 + �nt r ) l + mf r
(7)
(8)
According to mentioned constraints we should have:
1 . Imax (ConTypel) � 11,1 Imax (Con Type, -1) � if I' =
ConType, 7:- 1 max
Imax(ConTypel) � else
(9)
Vmin ::; IVi l ::; Vmax I I ::; I max(l)
(10)
(11)
Where: ns: Number of sections in the feeder, Lj: Length of section} (km), C(Conj): Cost of used conductor in section} ($/km), J: the buses in which the capacitor is installed, m : the number of buses, K{ the capacitor annual cost per kvar, Q/ : the shunt capacitor size placed at bus}, V max, Vmin : minimum and maximum permissible bus voltages, II max: maximum permissible carrying current of installed conductors in llh section, ConType{: type of installed conductor in llh section
N: Life period of lines (year) Ploss,i: Real power loss in the ith year (kW) CE: Cost of energy ($/kWh) Pw: Present worth factor LSFi: Loss factor in ith year Intr: The interested rate Infr: The inflation rate
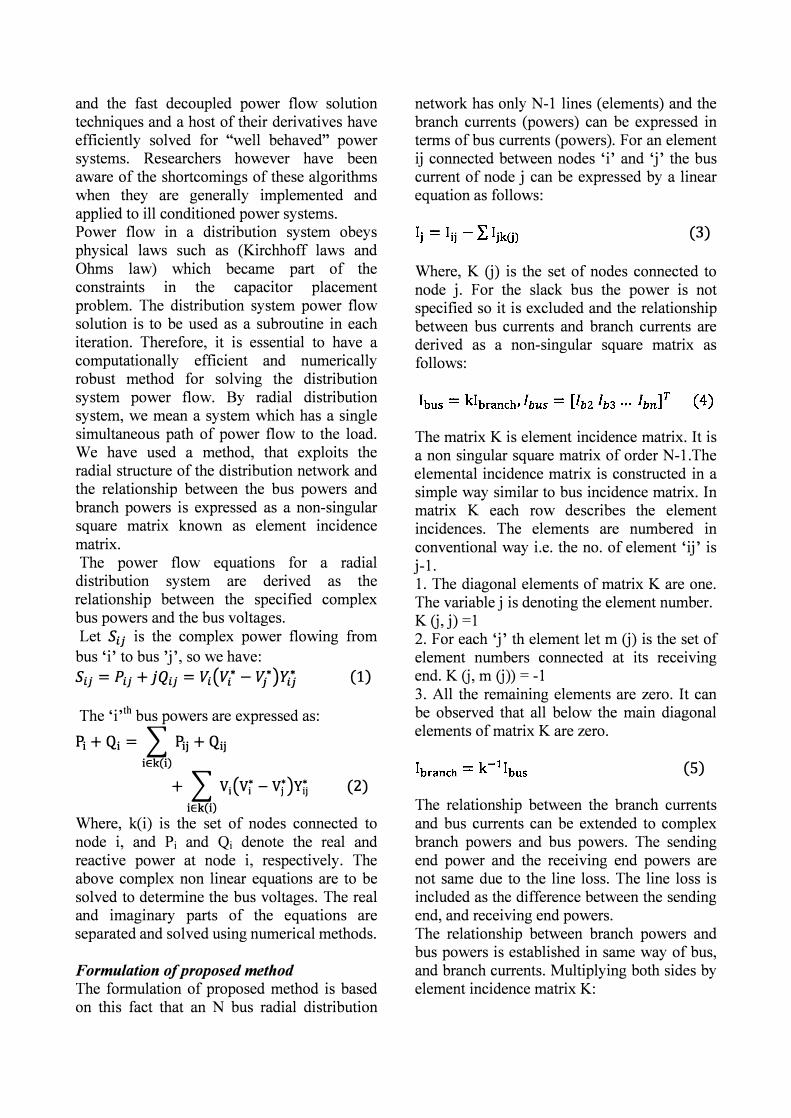
While computing the cost by defined objective function, load growth is considered as: (12)
I d. = { load x (1 + rr � i = 1,2,3'00" M oa 1 M . load x (1 + r) � I = M + 1,00', N
Where, load i is the load in i'th year, r is the annual growth rate and M is a plan period up to which the feeder can take load growth. The peak load growth during the planning peif is illustrated in below figure.
) 1 23 M N year
fig. 1 : Peak load growth during planning period
Variation of load is considered with loss factor parameter in objective function. The objective function includes six statements which are described as followed: Statementl: The cost of power losses considering load growth, Statement2: the cost of the installed capacitors, Statement3: the cost of the installed conductors, Statement4: the constraint of voltage limit, Statement5: the constraint of maximum permissible carrying current of the conductors, Statement6: the constraint to avoid over voltage, or having sufficient capacitor installation.
III. PROPOSED COMPUTATIONAL
ALGORITHM
In GA, a candidate solution for a specific problem is called an individual or a chromosome, and consists of a linear list of genes. Each individual represents a point in the search space, and hence a possible solution to the problem. A population consists of a finite number of individuals. Each individual is decided by an evaluation mechanism to obtain its fitness value. Based on this fitness value and undergoing genetic operators, a new population is generated iteratively with each successive population referred to as a generation. The GAs uses three basic operators (reproduction, crossover, and mutation) to manipulate the genetic composition of a population. The PSO conducts searches using a population of particles which correspond to individuals in GA. A population of particles is randomly generated, initially. Each particle represents a potential solution and has a posItion represented by a position vector � , A swarm of particles moves through the problem space, with the moving velocity of each particle represented by a velocity vector � ,At each time step, a function Ii representing a quality measure is calculated by using Xi as input. Each particle keeps track of its own best position, which is associated with the best fitness it has achieved so far in a vector vi' Further, the best position among all the
particles obtained so far in the population is kept track of as Pg' At each time step t, by using the individual best position Pi(t) and global best position pg(t), a new velocity for particle i is updated as follows: V;(t+l) = X[(V; (t) + Cl� {Pi (t) - X; (t)} (13)
+C2912 {p g (t) - X; (t)}]
Where c 1 and c2 are positive constants, q> 1 and q>2 are uniformly distributed random numbers in [0,1] interval, and X controls the magnitude
of v. Changing velocity in this way enables the particle i to search around its individual best position, Pi, and global best position, Pg . Based on the updated velocities, each particle changes its position according to the following equation: X;(t+l) = X;(t)+V;(t+l) (14)
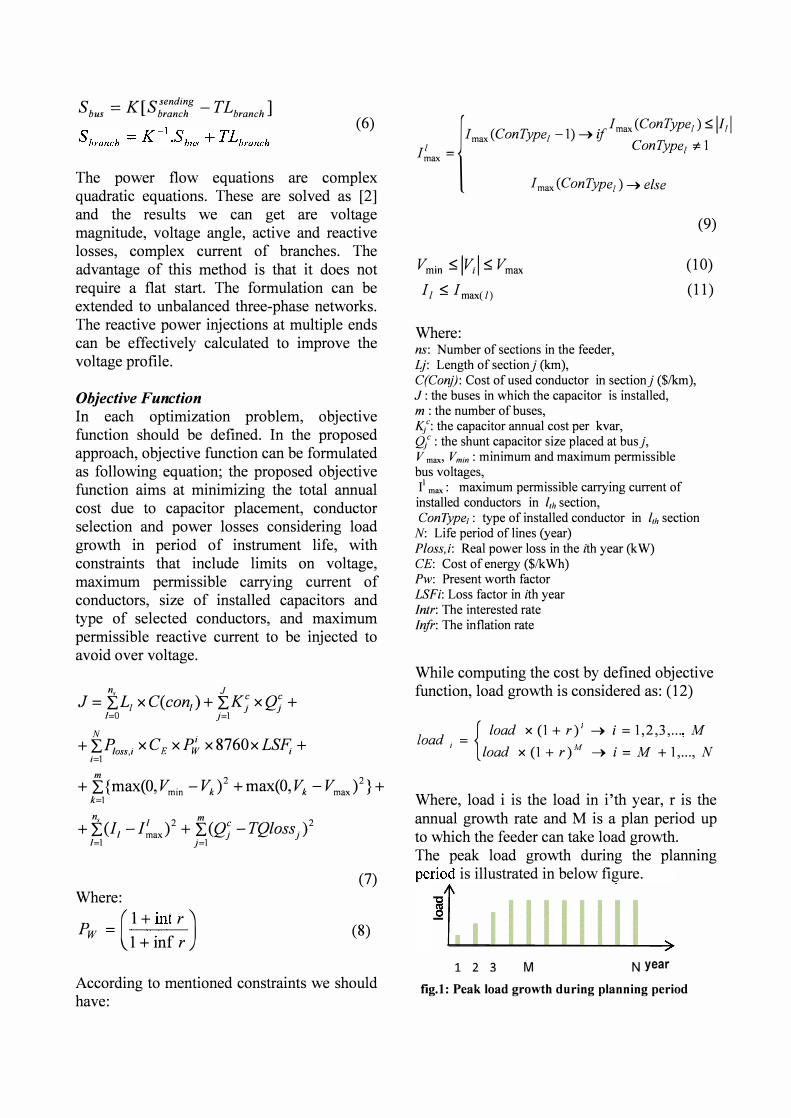
The computation of PSO is easy and adds only a slight computation load when it is incorporated into GA. The detailed design algorithm of HGAPSO consists of three major operators: enhancement, crossover and mutation[4]. In HGAPSO, GA and PSO both work with the same population. Based on the encoding scheme, Ps individuals forming the population are randomly generated. These individuals may be regarded as chromosomes in terms of GA, or as particles in terms of PSO. Then, new individuals on the next generation are created by enhancement, crossover and mutation operations [4]. For clarity, the flow of these operations is illustrated in figure 2: rank old population
ind?
• • • •
• •
• • • •
• •
New
Enhanced
fig.2: Flowchart of the HGAPSO method
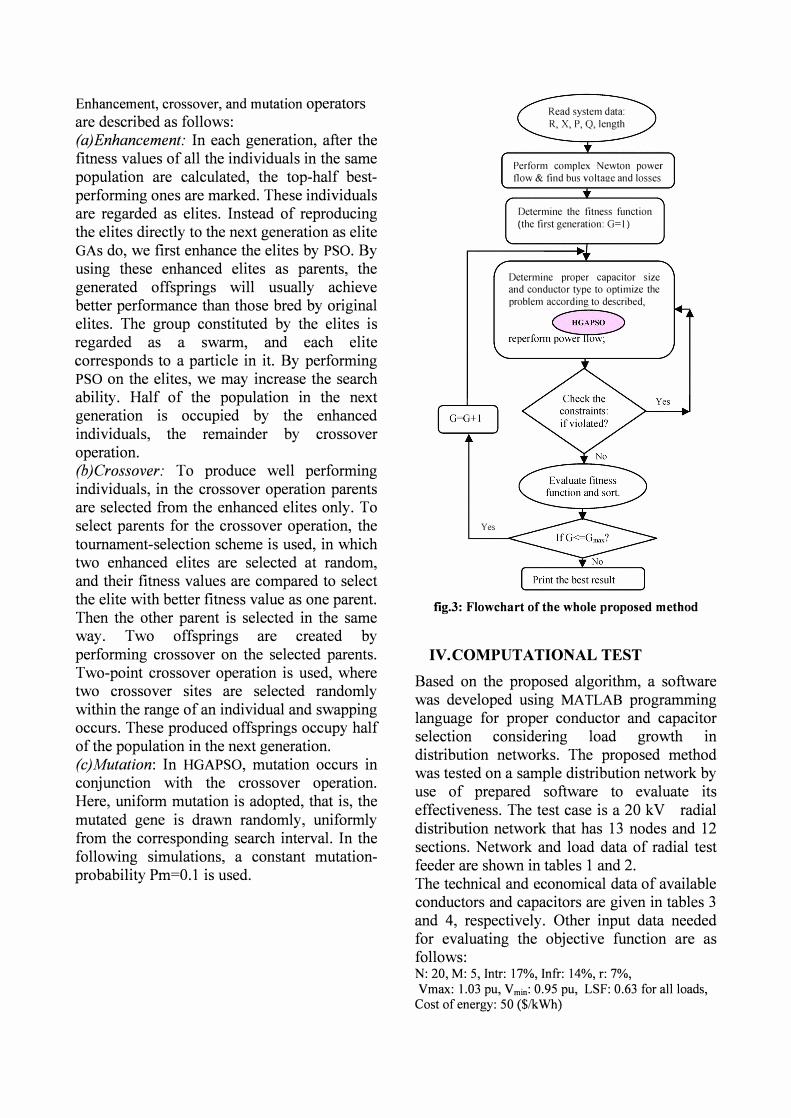
Enhancement, crossover, and mutation operators are described as follows: (a)Enhancement: In each generation, after the fitness values of all the individuals in the same population are calculated, the top-half bestperforming ones are marked. These individuals are regarded as elites. Instead of reproducing the elites directly to the next generation as elite GAs do, we first enhance the elites by PSO. By using these enhanced elites as parents, the generated offsprings will usually achieve better performance than those bred by original elites. The group constituted by the elites is regarded as a swarm, and each elite corresponds to a particle in it. By performing PSO on the elites, we may increase the search ability. Half of the population in the next generation is occupied by the enhanced individuals, the remainder by crossover operation. (b) Crossover: To produce well performing individuals, in the crossover operation parents are selected from the enhanced elites only. To select parents for the crossover operation, the tournament-selection scheme is used, in which two enhanced elites are selected at random, and their fitness values are compared to select the elite with better fitness value as one parent. Then the other parent is selected in the same way. Two offsprings are created by performing crossover on the selected parents. Two-point crossover operation is used, where two crossover sites are selected randomly within the range of an individual and swapping occurs. These produced offsprings occupy half of the population in the next generation. (c)Mutation: In HGAPSO, mutation occurs in conjunction with the crossover operation. Here, uniform mutation is adopted, that is, the mutated gene is drawn randomly, uniformly from the corresponding search interval. In the following simulations, a constant mutationprobability Pm=O.l is used.
Yes
Read system data:
R, X, P, Q, length
Perform complex Newton power flow & find bus volta2.e and losses
Determine the fitness function
(the first generation: G= I)
Determine proper capacitor size and conductor type to optimize the problem according to described,
� reperform �
fig.3: Flowchart of the whole proposed method
IV. COMPUTATIONAL TEST
Based on the proposed algorithm, a software was developed using MA TLAB programming language for proper conductor and capacitor selection considering load growth in distribution networks. The proposed method was tested on a sample distribution network by use of prepared software to evaluate its effectiveness. The test case is a 20 kV radial distribution network that has 13 nodes and 12 sections. Network and load data of radial test feeder are shown in tables 1 and 2. The technical and economical data of available conductors and capacitors are given in tables 3 and 4, respectively. Other input data needed for evaluating the objective function are as follows: N: 20, M: 5, Intr: 17%, Infr: 14%, r: 7%, Vrnax: l.03 pu, Vrnin: 0.95 pu, LSF: 0.63 for all loads,
Cost of energy: 50 ($/kWh)
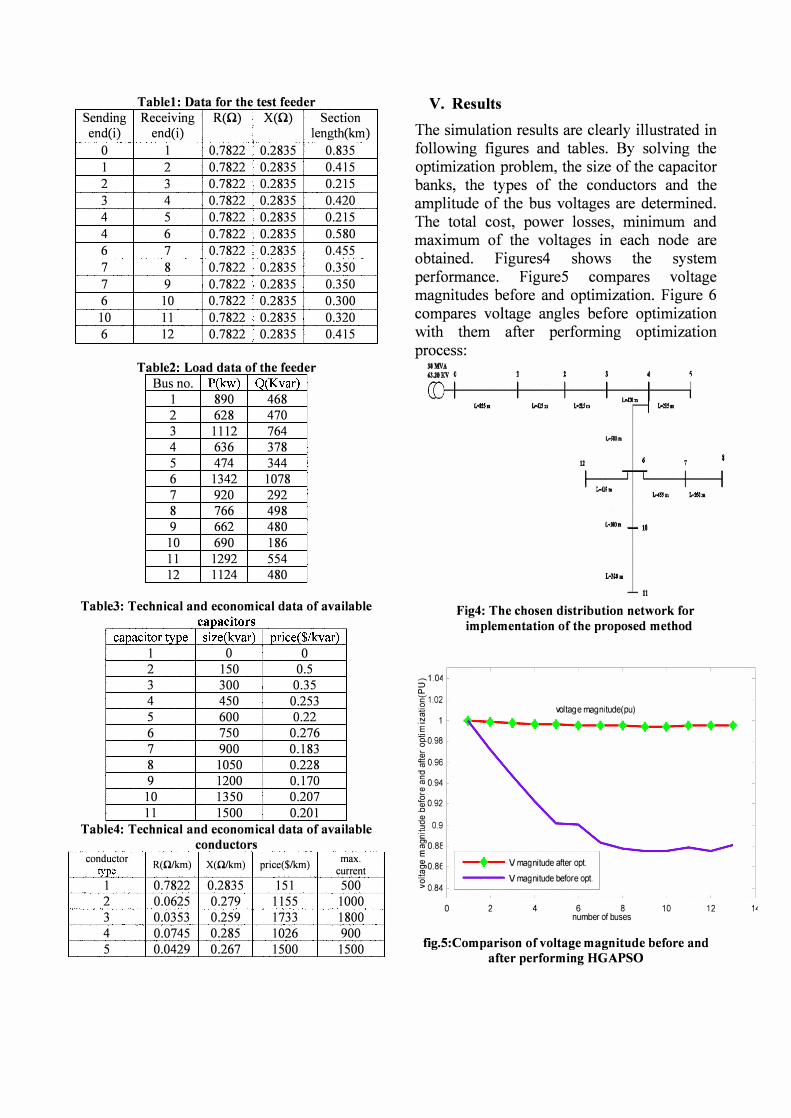
Table1 : Data for the test feeder Sending Receiving R(O) X(O) Section end(i) end(i) length(km)
0 1 0.7822 0.2835 0.835
1 2 0.7822 0.2835 0.415 2 3 0.7822 0.2835 0.215
3 4 0.7822 0.2835 0.420 4 5 0.7822 0.2835 0.215 4 6 0.7822 0.2835 0.580
6 7 0.7822 0.2835 0.455 7 8 0.7822 0.2835 0.350
7 9 0.7822 0.2835 0.350 6 10 0.7822 0.2835 0.300
10 11 0.7822 0.2835 0.320 6 12 0.7822 0.2835 0.415
Table2' Load data of the feeder Bus no. P(kw) Q(Kvar)
1 890 468 2 628 470 3 1112 764 4 636 378 5 474 344 6 1342 1078 7 920 292 8 766 498 9 662 480
10 690 186 11 1292 554 12 1124 480
Table3: Technical and economical data of available capacItors
capacitor type size(kvar) price($lkvar) 1 0 0 2 150 0.5 3 300 0.35 4 450 0.253 5 600 0.22 6 750 0.276 7 900 0.183 8 1050 0.228 9 1200 0.170
10 1350 0.207 11 1500 0.201
Table4: Technical and economical data of available conductors
conductor R(nlkm) X(nlkm) price($/km) max. type current
1 0.7822 0.2835 151 500 2 0.0625 0.279 1155 1000 3 0.0353 0.259 1733 1800 4 0.0745 0.285 1026 900 5 0.0429 0.267 1500 1500
V. Results
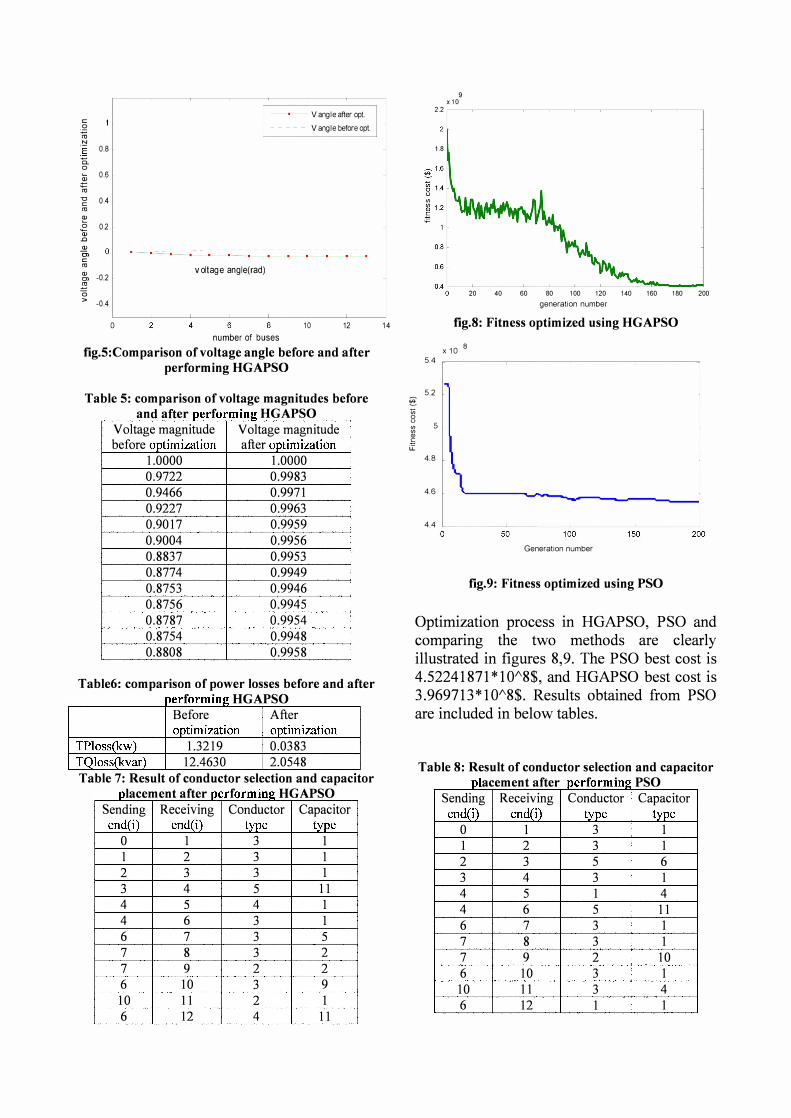
The simulation results are clearly illustrated in following figures and tables. By solving the optimization problem, the size of the capacitor banks, the types of the conductors and the amplitude of the bus voltages are determined. The total cost, power losses, minimum and maximum of the voltages in each node are obtained. Figures4 shows the system performance. FigureS compares voltage magnitudes before and optimization. Figure 6 compares voltage angles before optimization with them after performing optimization process:
SUIV! Il.ltKV 0
_1.04 ::::> "-g102 � .!::! 1 E g.0.98 Q; 'iij 0.96
"0 c: C\] 0.94 � �0.92 .0 Q) � 0.9
'c gO.8E E Q) $'08E "0
> 0.84 o
WIG.
11
It
Fig4: The chosen distribution network for implementation of the proposed method
I.oItage magnitude(pu)
• V mag nitude after opt. --- V mag nitude before opt.
2 4 6 8 number of buses
10 12
fig.5:Comparison of voltage magnitude before and after performing HGAPSO
l'
I Vangie after opt I Vangie before opt. <= .Q iii .!:! 0.8 § C. 0 2 0.6 ro -g 0.4 co Q) � 0.2 Q) .c Q)
C, <= co � -0.2 2 o
> -0.4
o
voltage angle(rad)
10 12 number of buses
fig.5:Comparison of voltage angle before and after performing HGAPSO
Table 5: comparison of voltage magnitudes before an d ft � HGAPSO a er per ormm�
V oltage magnitude Voltage magnitude before optimization after optimization
1.0000 1.0000 0.9722 0.9983 0.9466 0.9971 0.9227 0.9963 0.9017 0.9959 0.9004 0.9956 0.8837 0.9953 0.8774 0.9949 0.8753 0.9946 0.8756 0.9945 0.8787 0.9954 0.8754 0.9948 0.8808 0.9958
Table6: comparison of power losses before and after
TPloss(kwl TQlos�kva!l
� . HGAPSO per ormmg Before After optimization �timization
1.3219 0.0383 12.4630 2.0548
Table 7: Result of conductor selectIon and capacItor I t ft � HGAPSO 1>. acemen a er per ormmg
Sending Receiving Conductor Capacitor endlU. end(i) �e type
0 1 3 1 1 2 3 1 2 3 3 1 3 4 5 11 4 5 4 1 4 6 3 1 6 7 3 5 7 8 3 2 7 9 2 2 6 10 3 9
10 11 2 1 6 12 4 11
14
§: u; 0 u '" '" Q) c if
9 x 10
2.2 ,----�-�-��-�-��-�-�___,
1.6
20 40 60 60 100 120 140 160 160 200 generation number
fig.8: Fitness optimized using HGAPSO
x 10 8 5.4 r------,---------,---------.---------,
5.2
5
4.8
4.6
4.4 .L-__ -----::":-___ :-::-:-___ -::;': ___ --;::;:: o 50 100 150 200
Generation number
fig.9: Fitness optimized using PSO
Optimization process in HGAPSO, PSO and comparing the two methods are clearly illustrated in figures 8,9. The PSO best cost is 4.52241871 *1Q!\8$, and HGAPSO best cost is 3.969713*10/\8$. Results obtained from PSO are included in below tables.
Table 8: Result of conductor selection and capacitor I t ft � . PSO pi acemen a er per ormmg
Sending Receiving Conductor Capacitor en@ end(i) type type
0 1 3 1 1 2 3 1 2 3 5 6 3 4 3 1 4 5 1 4 4 6 5 11 6 7 3 1 7 8 3 1 7 9 2 10 6 10 3 1
10 11 3 4 6 12 1 1
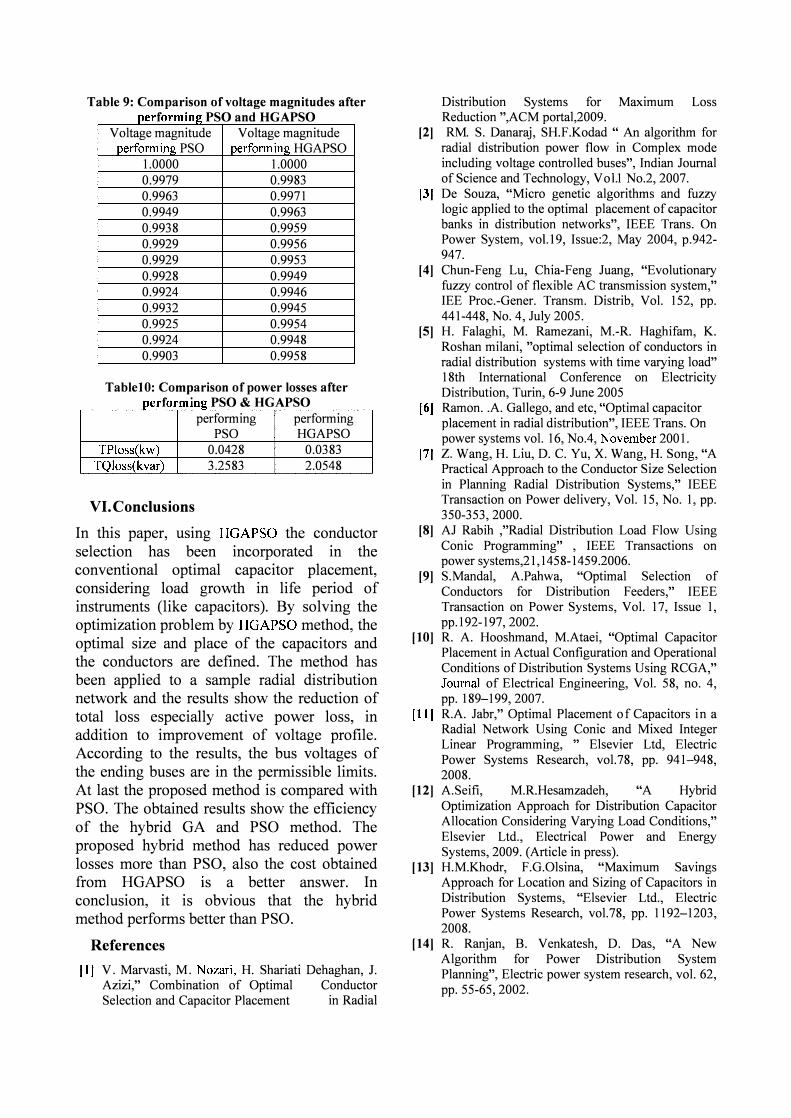
Table 9: Comparison of voltage magnitudes after � PSO d HGAPSO per ormmg an
Voltage magnitude Voltage magnitude performing PSO performing HGAPSO
1.0000 1.0000 0.9979 0.9983 0.9963 0.9971 0.9949 0.9963 0.9938 0.9959 0.9929 0.9956 0.9929 0.9953 0.9928 0.9949 0.9924 0.9946 0.9932 0.9945 0.9925 0.9954 0.9924 0.9948 0.9903 0.9958
Table10: Comparison of power losses after � . PSO & HGAPSO per ormmg
performing performing PSO HGAPSO
TPloss(kw) 0.0428 0.0383 TQloss(kvar) 3.2583 2.0548
VI. Conclusions
In this paper, using HGAPSO the conductor selection has been incorporated in the conventional optimal capacitor placement, considering load growth in life period of instruments (like capacitors). By solving the optimization problem by HGAPSO method, the optimal size and place of the capacitors and the conductors are defined. The method has been applied to a sample radial distribution network and the results show the reduction of total loss especially active power loss, in addition to improvement of voltage profile. According to the results, the bus voltages of the ending buses are in the permissible limits. At last the proposed method is compared with PSO. The obtained results show the efficiency of the hybrid GA and PSG method. The proposed hybrid method has reduced power losses more than PSG, also the cost obtained from HGAPSO IS a better answer. In conclusion, it is obvious that the hybrid method performs better than PSO.
References
111 V. Marvasti, M. Nozari, H. Shariati Dehaghan, 1. Azizi," Combination of Optimal Conductor Selection and Capacitor Placement in Radial
Distribution Systems for Maximum Loss Reduction ",ACM portal,2009.
12) RM. S. Danaraj, SH.F.Kodad " An algorithm for radial distribution power flow in Complex mode including voltage controlled buses", Indian Journal of Science and Technology, VoLl No.2, 2007.
13) De Souza, "Micro genetic algorithms and fuzzy logic applied to the optimal placement of capacitor banks in distribution networks", IEEE Trans. On Power System, vo1.l9, Issue:2, May 2004, p.942-947.
[4] Chun-Feng Lu, Chia-Feng Juang, "Evolutionary fuzzy control of flexible AC transmission system," IEE Proc.-Gener. Transm. Distrib, Vol. 152, pp. 441-448, No. 4, July 2005.
[5] H. Falaghi, M. Ramezani, M.-R. Haghifam, K. Roshan milani, "optimal selection of conductors in radial distribution systems with time varying load" 18th International Conference on Electricity Distribution, Turin, 6-9 June 2005
(6) Ramon . . A. Gallego, and etc, "Optimal capacitor placement in radial distribution", IEEE Trans. On power systems vol. 16, No.4, November 2001.
(7) z. Wang, H. Liu, D. C. Yu, X. Wang, H. Song, "A Practical Approach to the Conductor Size Selection in Planning Radial Distribution Systems," IEEE Transaction on Power delivery, Vol. 15, No. 1, pp. 350-353, 2000.
[8] AJ Rabih ,"Radial Distribution Load Flow Using Conic Programming" , IEEE Transactions on power systems,21, 1458-1459.2006.
[9] S.Mandal, A.Pahwa, "Optimal Selection of Conductors for Distribution Feeders," IEEE Transaction on Power Systems, Vol. 17, Issue 1, pp.192-197, 2002.
(10) R. A. Hooshmand, M.Ataei, "Optimal Capacitor Placement in Actual Configuration and Operational Conditions of Distribution Systems Using RCGA," Journal of Electrical Engineering, Vol. 58, no. 4, pp. 189-199, 2007.
(1 1 ( R.A. Jabr," Optimal Placement of Capacitors in a Radial Network Using Conic and Mixed Integer Linear Programming, " Elsevier Ltd, Electric Power Systems Research, vol.78, pp. 941-948, 2008.
[12] A.Seifi, M.R.Hesamzadeh, "A Hybrid Optimization Approach for Distribution Capacitor Allocation Considering Varying Load Conditions," Elsevier Ltd., Electrical Power and Energy Systems, 2009. (Article in press).
(13) H.M.Khodr, F.G.Olsina, "Maximum Savings Approach for Location and Sizing of Capacitors in Distribution Systems, "Elsevier Ltd., Electric Power Systems Research, vol.78, pp. 1192-1203, 2008.
[14] R. Ranjan, B. Venkatesh, D. Das, "A New Algorithm for Power Distribution System Planning", Electric power system research, vol. 62, pp. 55-65, 2002.

This document was created with Win2PDF available at http://www.daneprairie.com. The unregistered version of Win2PDF is for evaluation or non-commercial use only.
Copyright © 2022 FDOKUMEN