Pisupati, Balakrishna and Renata Rubian (2008) MDG on Reducing Biodiversity Loss, UNU-IAS Report
40
MDG on Reducing Biodiversity Loss and the CBD ‘ s 2010 Target UNU-IAS Report
-
Upload
mammalwatching -
Category
Documents
-
view
0 -
download
0
Transcript of Pisupati, Balakrishna and Renata Rubian (2008) MDG on Reducing Biodiversity Loss, UNU-IAS Report

MDG on Reducing Biodiversity Loss and the CBD‘s 2010 Target
UNU-IAS Report
This report was written byBalakrishna Pisupati and Renata Rubian
Balakrishna Pisupati was the coordinator of the UNU-IAS Biodiplomacy Programme. He is currently with the Division for Environmental Law and Conventions, United Nations Environment Programme, Nairobi.Renata Rubian is currently with the Bureau for Development Policy, United Nations Development Programme, based in New York.
AcknowledgmentsThe authors wish to thank Dr. Charles McNeill and Linda Ghanim of UNDP, participants at the Global Biodiversity Forum session held in Curitiba, Brazil in 2006, Prof. Hamid Zakri and Rachel Schutte of UNU-IAS for their valuable comments, inputs and suggestions. The ideas, views and opinions expressed in this paper remain the responsibility of the authors alone and not of the organisations they represent.
Design and Layout: Jose Badelles

MDG on Reducing Biodiversity Loss
and the CBD‘s 2010 Target
Balakrishna Pisupati
Renata Rubian
Not everything that can be counted counts, and not everything that counts can be counted.
Albert Einstein
UNU-IAS Report


3
5
7
88
8
8
1010
10
11
11
13
15
1616
17
18
21
2626
26
26
27
29
31
33
36
Foreword
1. Introduction
2. The MDGs Review 2.1 How scientific are the MDGs?
2.2 Global Targets: Pros and Cons
2.3 Global versus Local
3. The 2010 Target up to now 3.1 Policy Development versus Implementation
3.2 Developing the 2010 Indicators
3.3 The Millennium Assessment Report: Evidence of Biodiversity Loss
3.4 Biodiversity vis-à-vis Environment
4. Linking MDGs and the Global Biodiversity Target
5. Comparative Analysis
6. Using the Indicators 6.1 MDGs progress so far: Country Report Assessments
6.2 The 2010 Target: Assessing achievement through the CBD Third National Reports
7. The Challenge
8. Policy Options
9. Way Forward 9.1 Mainstreaming environment across MDGs
9.2 Supporting better implementation of MEAs to achieving MDGs
9.3 Local actions to achieving MDGs
References
Annex I — Official Indicators for Monitoring the Millennium Development Goals (MDGs)
Annex II — Indicators Relevant to the 2010 Goals and Sub-targets
Annex III — CBD Third National Reports on the 2010 Target
Endnotes
4
12
11
14
18
21
16
17
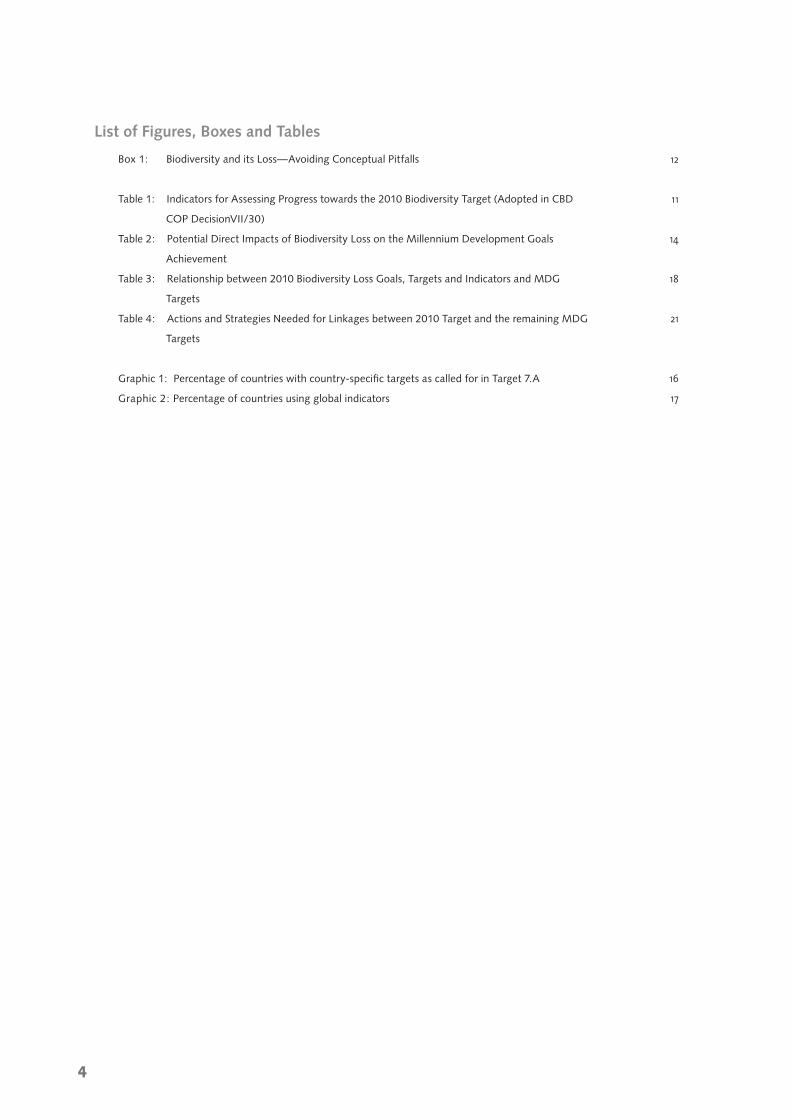
List of Figures, Boxes and Tables
Box 1: Biodiversity and its Loss—Avoiding Conceptual Pitfalls
Table 1: Indicators for Assessing Progress towards the 2010 Biodiversity Target (Adopted in CBD
COP DecisionVII/30)
Table 2: Potential Direct Impacts of Biodiversity Loss on the Millennium Development Goals
Achievement
Table 3: Relationship between 2010 Biodiversity Loss Goals, Targets and Indicators and MDG
Targets
Table 4: Actions and Strategies Needed for Linkages between 2010 Target and the remaining MDG
Targets
Graphic 1: Percentage of countries with country-specific targets as called for in Target 7.A
Graphic 2: Percentage of countries using global indicators
5
Foreword
This year, 2008, is very important to all of us who are working on conservation and development! We are at the mid-point of assessing our progress on achieving the Millennium Development Goals (MDGs) as well as preparing for the 2010 Year of Biological Diversity with more emphasis on realizing the Convention on Biological Diversity (CBD) targets to reduce the rate of loss of biological diversity for poverty alleviation (popularly called the 2010 targets).
In September 2008, Heads of State from around the world will meet in New York to discuss progress towards achieving the MDGs, a commitment they undertook in 2000. The focus will be not to ascertain progress on a few goals or targets but to look at all goals and targets as a holistic package to deal with sustainable development. A quick review of the national reports on MDGs from countries around the world indicates one significant gap both in terms of available information and assessment of a specific target under MDG 7 on environmental sustainability. The shortfall is related to the target 7 B on reducing biodiversity loss by 2010.
We all agree that biological diversity has a lot to contribute to human well-being and sustainable development. As quoted by McNeil and Schie in 2002, biodiversity is the life insurance policy for life itself. Progress under the CBD work programmes to realize the 2010 targets have been progressive, though slow. A number of indicators were developed under the aegis of the CBD since 2002 when the 2010 targets were adopted during the Sixth Conference of Parties (COP6). However, there seems to be a gap in terms of linking them with the MDG 7 (target 7B in particular) making it difficult for countries to report progress and assess the realization of MDG 7. This paper attempts to provide such a link between the CBD 2010 targets and MDG target 7 in a manner that can be used by governments and policy makers to understand the linkages and assess progress to be made under both the platforms viz. the CBD and MDGs in order to achieve mutually supportive implementation of the work programmes at national levels.
UNU-IAS is pleased to lead the discussion on this issue through the presentation of this report and we hope that in coming years countries can use elements of this report to ascertain ways and means of dealing with the MDG target 7B as well as link actions to CBD processes so that conservation and development agendas can be better realized.
A. H. ZakriDirector , UNU-IASSeptember 2008

7
Beginning with the 1972 Stockholm Summit on Sustainable Development, the links between economic, social and environmental aspects to achieving sustainable development have received increasing attention. The Rio Conventions (biodiversity, climate change and desertification) infused new life into providing global and national frameworks to integrate environment into national development. Efforts to advance such commitments, to make this planet a better place to live and to ensure that development does not deprive people of their basic minimum livelihood needs, has led countries to develop a set of measurable goals and targets to achieve sustainable development during the United Nations General Assembly (UNGA) in 2000. These goals, termed the Millennium Development Goals (MDGs), currently form the basis of all debates and discussions on development around the world. In 2005, the UNGA adopted a set of detailed targets related to Goal 7 on environmental governance which aimed at significantly reducing the rate of loss of biodiversity by the year 2010 (Target 7 B)1. This Target is supported by two indicators for monitoring progress, namely, the proportion of terrestrial and marine areas protected and the proportion of species threatened with extinction. While there has been eagerness from the UN Member States to achieve the eight MDGs by the year 2015 since the Millennium Declaration was signed in 2000 (see Annex I, 5: Indicators for monitoring the MDGs), concerns are mounting as to whether the goals, targets and indicators set out are realistic in terms of measuring and monitoring for concrete results.
Parallel to the MDGs process is the adoption of the 2010 Global Biodiversity Challenge and the subsequent development of targets and indicators under the Convention on Biological Diversity (CBD), as expressed by decision VI/26 of the sixth meeting of the Conference of the Parties in April 2002. This decision commits Parties to an effective and coherent implementation of the three objectives of the Convention and to achieve by 2010 a significant reduction of the current rate of biodiversity loss at the global, regional and national level, as a contribution to poverty alleviation and to the benefit of all life on earth. This commitment and the 2010 target were also endorsed by the World Summit on Sustainable Development (WSSD) in its Plan of Implementation (PoI) in paragraph 44.2 The 2010 target is now recognized by the international community beyond the framework of the CBD, representing an important achievement in putting biodiversity back on the international agenda (See Annex II, Table 6: Indicators relevant to the 2010 goals and sub-targets).
This paper attempts to verify the hypotheses that there is a greater likelihood that initiatives under the CBD process to achieve the 2010 target are more tangible than at the MDG level; that there is a need to link the targets and indicators of the 2010 commitments of the CBD with those of the MDGs; and that the MDGs can use the programme of work under the CBD as an interim indicator of successful national implementation in relation to sustainable development, not just with respect
to measuring progress on Goal 7 on environmental sustainability, but for other Goals as well. In order to further investigate these assumptions, the first and second sections of the paper will provide a background and a blueprint of the current state of MDGs and the 2010 target in general. The third section will focus on synergies and potential for aligning the achievements of the MDGs and the 2010 target, and the likely trade-offs. The fourth section compares the goals, targets and indicators set under each of these frameworks and reverts back to the main hypothesis of the paper. The fifth and sixth sections further advance the debate by stressing the methods of using the indicators and highlighting prospects for attaining the MDGs and the 2010 sub-targets. Finally, the last section identifies some policy actions for dealing with challenges that lies ahead.
This paper will not attempt to exhaust all resources and literature available on the MDGs and the 2010 target, but to engage readers in a broad discussion on the validity of the indicators, the need for cross-cutting references and analysis, and the need for reviewing and/or generating newer indicators.
1. Introduction
8
2.1 How scientific are the MDGs?
The Millennium Development Goals demonstrate a package of commitments countries have renewed to celebrate the Millennium. None of the goals are new except that they are re-packaged with time bound targets and indicators.
Questions have been raised about the rationale of some of the goals as well as the ease with which countries can use the indicators. Review of MDG 7 indicates that the goal, targets and indicators were developed without much thought of todays realities requiring enormous efforts to put the environmental agenda back into the development mainstream. Some even argue that the scientific basis for developing and realizing the MDGs is weak. Additionally, Target 7 B has such a simplified, generic set of indicators that use of these targets has been very limited at the country level, as indicted by the country reports of 2006 and 2007. The MDG Report of 2008 has very little information on the progress made towards the target of reducing the rate of loss of biodiversity by 2010. The report indicates that in response to the loss of global biodiversity, 21 million square kilometers of protected areas, including land and sea, were created in 2007.3 In addition, there has been a slowing down in deforestation, or net loss of forest area, patterns. However, the report notes that protection alone is insufficient, as those areas need to be sustainably managed in order to attain the maximum benefits for the environment and local communities. The MDG Report recognizes that data on the number of species threatened with extinction is most comprehensive for birds, although imperfect indicators of trends in other forms of biodiversity are also available. With the global agreement and political commitment to realise the MDGs, we now have a responsibility to ensure that as many MDGs targets are met as possible.
2.2 Global Targets: Pros and Cons
Mainstreaming the MDGs into the international agenda has its pros and cons. Jolly (2003) anticipates criticisms by academics and development practitioners regarding the setting of global goals, which may: (1) favour a top down process of planning and implementation of goals, creating a burden on local communities at the expense of their own interests; (2) create a bias in the selection of development goals, favouring those that are supported by donors, as opposed to goals tailored to local needs; (3) generate excessive concerns with quantitative results, while overlooking qualitative measurements; (4) lead national and local government agencies to produce statistics that are not consistent with the reality, in order to conceal the unavailability of data or failure in meeting the goals; and (5) encourage exaggerated expectations, which may lead to disappointment when goals are not met. Notwithstanding these criticisms, Jolly (2003) points out that rather than using these arguments against the MDGs, they should be taken into account on their implementation.
On other hand, setting global goals such as the MDGs may compel countries to commit to higher standards of development, freeing technical and financial resources and leading developed countries to allocate additional financial aid towards the achievement of agreed goals. However, countries may not be properly guided or supportedthrough the provision of tools and methodologiesto evaluate their actions to deal with the MDGs, especially MDG 7. Such a limitation is visible with regard to target 7 B.
Progress on implementation of the MDGs so far is influenced by a variety of factors including cost estimates. As Reddy and Heuty (2005) indicate, cost estimates can directly determine the choice of strategies. There is more than one plausible strategy to achieve each of the goals. Therefore, it is crucial to identify the costs of realizing the MDGs through alternative means in order to adopt the most efficient approach. Costing data for dealing with some MDGs such as Goal 2, 3, 4 and 5 are now available but costing for dealing with MDG 7 is still unclear resulting in weak economic arguments and planning for investing into achieving this MDG.
The review of country status reports on achieving the MDGs submitted to the 60th UN General Assembly (UNGA) session indicates that there is a clear variation in the way countries have used the targets and indicators set by the MDGs. While many of the countries faithfully used the targets and indicators provided to ascertain the progress they made, several of them adjusted or proposed adding new indicators to address country needs and priorities. This marks a clear shift in the way countries ought to look at MDG targets and indicators given the decisions at the 60th UNGA to use MDGs as the national reporting framework from 2006 onwards. It is necessary to re-evaluate the use of MDG targets and indicators as rigid set of guidance to being opportunities for tailoring national level targets and indicators to measure local success in achieving the MDGs.
2.3 Global versus Local
A number of MDGs are phrased as global goals. There is an implicit interpretation that the MDGs are to be attained globally, which may risk disregarding the level of achievement in individual countries. For instance, given that 65% of the worlds poor currently live in Asia, a strategy focused on achieving poverty reduction (MDG-1) in India and China is believed to be crucial for attaining the targets under this goal. No one will dispute that by eliminating poverty in Asia the world would be closer to meeting the MDG-1. However, this achievement cannot be translated in a tangible improvement in the lives of poor people elsewhere. Therefore, focusing on achieving quantifiable absolute numbers for certain MDG targets could lead to a fallacious belief that there has been a significant improvement in meeting the commitments made on the ground.
2. The MDGs Review

9
Furthermore, one should consider that data gathered for each country often does not capture the diversity of outcomes for each national region across the various social indicators and the MDG targets. According to an assessment on the achievement of MDGs conducted by the World Bank in Sri Lanka, the report concluded that the findings draw attention to the unpalatable truth that even if the country as a whole attains a particular MDG, some regions in the country might still fall way below the expected outcomes.4 The report also puts emphasis on the need to systematically monitor MDG outcomes and the impact of social assistance programs by generating reliable data, as a way to decide what set of interventions are better equipped to effectively work towards attaining the goals.
This example indicates that monitoring and achieving the goals is a multilevel process, which implicates different scenarios and stages of development, increasing the complexity of effectively measuring the indicators. Moreover, the technical and human capacity of countries to implement the MDGs varies broadly, leading to discrepancies between regions and further increasing the challenge of building a comparative framework to analyse data gathered for all indicators across countries. Standardization of available data without generating further burden on countries and data deficiency are de facto a major challenge in this task.
The eight MDG goals agreed upon in 2000 evolved into 21 time-bound targets and 60 quantifiable indicators (see Annex I, Table 5: Indicators for monitoring the MDGs). The MDGs were conceptualized as a guiding framework and, as such, they are expected to be flexible. Therefore, countries were invited to adapt the measuring indicators to their own reality. This is further discussed in section IV.
10
3.1 Policy Development versus Implementation
The life cycle of multilateral environmental agreements (MEAs) is divided between policy development and implementation phases. After a decade invested in policy development, the CBD at its sixth meeting of the Conference of the Parties (COP-6) initiated a transition of its processes, mechanisms and instruments to focus on implementation. The adoption of the 2010 target, under the CBD process by decision VI/26 of the COP, and its subsequent endorsement by the Johannesburg Plan of Implementation, lay down the foundation for the new phase of the Biodiversity Convention. In decision VI/26 the strategic plan of the Convention is presented. In its mission, Parties commit themselves to a more effective and coherent implementation of the three objectives of the Convention, to achieve by 2010 a significant reduction of the current rate of biodiversity loss at the global, regional and national level as a contribution to poverty alleviation and to the benefit of all life on earth.
In COP decision VII/30, countries agreed on a framework to enhance the evaluation of achievements and progress in the implementation of the Strategic Plan and, in particular, its mission to achieve a significant reduction of biodiversity loss. The Strategic Plan of the Convention seeks to promote coherence among the various programmes of work and to provide a flexible framework within which national and regional targets may be set, and indicators identified. This framework includes seven focal areas: (1) reducing the rate of loss of the components of biodiversity; (2) promoting sustainable use of biodiversity; (3) addressing the major threats to biodiversity, including those arising from invasive alien species, climate change, pollution, and habitat change; (4) maintaining ecosystem integrity, and the provision of goods and services provided by biodiversity in ecosystems, in support of human well-being; (5) protecting traditional knowledge, innovations and practices; (6) ensuring the fair and equitable sharing of benefits arising out of the use of genetic resources; and (7) mobilizing financial and technical resources, especially for developing countries, for implementing the Convention and the Strategic Plan.
For each of the focal areas, goals and sub-targets were identified as well as indicators for assessing progress towards the 2010 target.5 The goals and sub-targets are expected to be integrated into the programmes of work of the Convention, while providing a flexible framework for national and/or regional targets to be developed. In this regard, the Convention invites Parties to establish their own targets and to identify indicators that can measure national progress towards the 2010 target (See Annex II, Table 6: Indicators relevant to the 2010 goals and sub-targets).
3.2 Developing the 2010 Indicators
In decision VII/30, the Conference of the Parties (COP) provided specific guidance on the characteristics of the indicators to be identified or developed by the Ad Hoc Technical Expert Group (AHTEG) on Indicators for Assessing Progress Towards the 2010 Biodiversity Target6 such as: (1) indicators should not be used to evaluate the level of implementation of the Convention in individual Parties or regions; (2) the same indicators may be used at the global, regional, national and local levels; (3) indicators should relate to one or more of the various programmes of work of the Convention; (4) indicators should take into consideration relevant MDGs and indicators developed by other relevant international processes; and (5) existing data sets should be used. The development of indicators should also consider availability of data and suitable technologies, and existing discrepancies in technical and human capacity among countries.
Initially, the COP agreed on eight indicators for immediate testing (listed in column B, see Table 1) and another 13 indicators which required further development (listed in column C, see Table 1). A process for further testing and developing the indicators was agreed by the COP, requiring inputs from the Subsidiary Body on Scientific, Technical and Technological Advice (SBSTTA), the Ad Hoc Working Groups on ABS and Article 8(j), and the Ad Hoc Technical Expert Group (AHTEG) on Indicators for Assessing Progress Towards the 2010 Biodiversity Target.
Within the CBD process, there is a gradual shift from focusing on the implementation of individual programmes of work (POWs) to a general process based on the 2010 target and indicators. Such an approach is also taken by other multilateral environmental agreements (MEAs) such as the Convention on Migratory Species (CMS), the Convention on International Trade on Endangered Species (CITES) and others.
3. The 2010 Target up to now
11
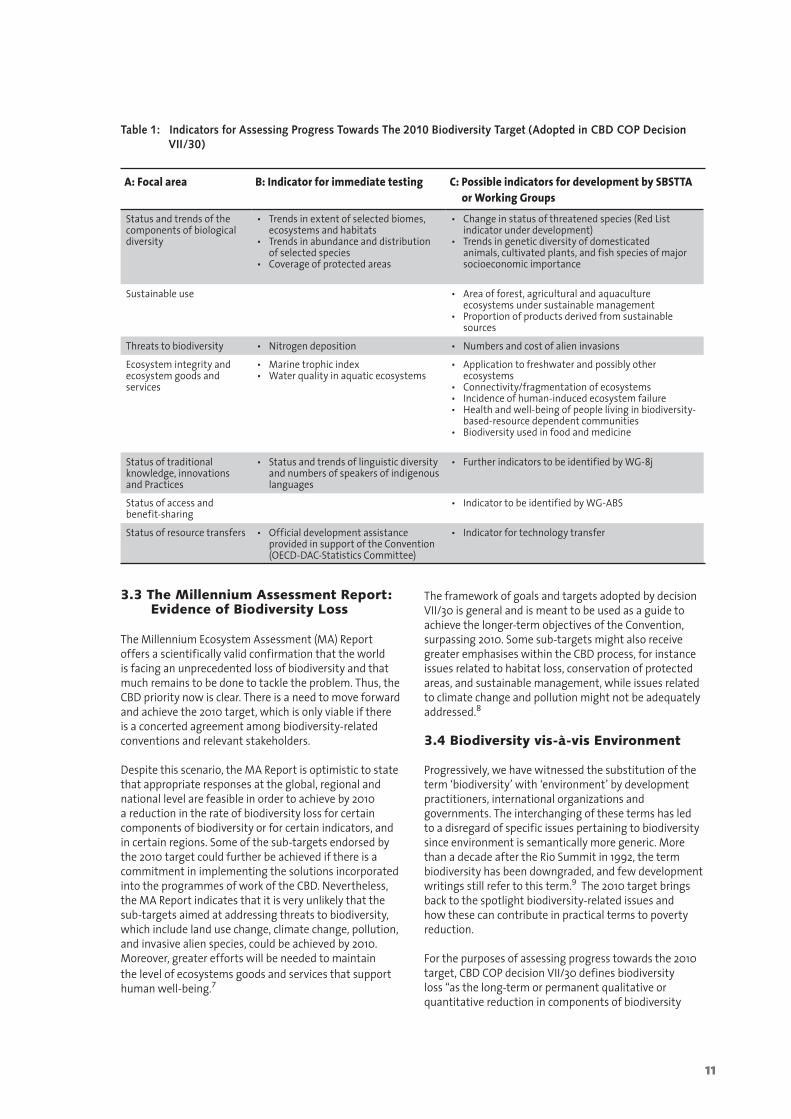
Table 1: Indicators for Assessing Progress Towards The 2010 Biodiversity Target (Adopted in CBD COP Decision VII/30)
A: Focal area B: Indicator for immediate testing C: Possible indicators for development by SBSTTA or Working Groups
Status and trends of the components of biological diversity
Trends in extent of selected biomes, �ecosystems and habitats Trends in abundance and distribution �of selected species Coverage of protected areas �
Change in status of threatened species (Red List �indicator under development) Trends in genetic diversity of domesticated �animals, cultivated plants, and fish species of major socioeconomic importance
Sustainable use Area of forest, agricultural and aquaculture �ecosystems under sustainable management Proportion of products derived from sustainable �sources
Threats to biodiversity Nitrogen deposition � Numbers and cost of alien invasions �
Ecosystem integrity and ecosystem goods and services
Marine trophic index �Water quality in aquatic ecosystems �
Application to freshwater and possibly other �ecosystems Connectivity/fragmentation of ecosystems �Incidence of human-induced ecosystem failure �Health and well-being of people living in biodiversity- �based-resource dependent communities Biodiversity used in food and medicine �
Status of traditional knowledge, innovations and Practices
Status and trends of linguistic diversity �and numbers of speakers of indigenous languages
Further indicators to be identified by WG-8j �
Status of access and benefit-sharing
Indicator to be identified by WG-ABS �
Status of resource transfers Official development assistance �provided in support of the Convention (OECD-DAC-Statistics Committee)
Indicator for technology transfer �
3.3 The Millennium Assessment Report: Evidence of Biodiversity Loss
The Millennium Ecosystem Assessment (MA) Report offers a scientifically valid confirmation that the world is facing an unprecedented loss of biodiversity and that much remains to be done to tackle the problem. Thus, the CBD priority now is clear. There is a need to move forward and achieve the 2010 target, which is only viable if there is a concerted agreement among biodiversity-related conventions and relevant stakeholders.
Despite this scenario, the MA Report is optimistic to state that appropriate responses at the global, regional and national level are feasible in order to achieve by 2010 a reduction in the rate of biodiversity loss for certain components of biodiversity or for certain indicators, and in certain regions. Some of the sub-targets endorsed by the 2010 target could further be achieved if there is a commitment in implementing the solutions incorporated into the programmes of work of the CBD. Nevertheless, the MA Report indicates that it is very unlikely that the sub-targets aimed at addressing threats to biodiversity, which include land use change, climate change, pollution, and invasive alien species, could be achieved by 2010. Moreover, greater efforts will be needed to maintain the level of ecosystems goods and services that support human well-being.7
The framework of goals and targets adopted by decision VII/30 is general and is meant to be used as a guide to achieve the longer-term objectives of the Convention, surpassing 2010. Some sub-targets might also receive greater emphasises within the CBD process, for instance issues related to habitat loss, conservation of protected areas, and sustainable management, while issues related to climate change and pollution might not be adequately addressed.8
3.4 Biodiversity vis-à-vis Environment
Progressively, we have witnessed the substitution of the term biodiversity with environment by development practitioners, international organizations and governments. The interchanging of these terms has led to a disregard of specific issues pertaining to biodiversity since environment is semantically more generic. More than a decade after the Rio Summit in 1992, the term biodiversity has been downgraded, and few development writings still refer to this term.9 The 2010 target brings back to the spotlight biodiversity-related issues and how these can contribute in practical terms to poverty reduction.
For the purposes of assessing progress towards the 2010 target, CBD COP decision VII/30 defines biodiversity loss as the long-term or permanent qualitative or quantitative reduction in components of biodiversity

12
and their potential to provide goods and services, to be measured at global, regional and national levels.10
While measuring biodiversity loss, the MA Report indicates that there are conceptual pitfalls that need to be avoided (see box 1, below) given that biodiversity has many components and different levels, comprising of diversity among organisms (i.e. plants, animals or
microorganisms), diversity within and among species and populations, and diversity among ecosystems. Therefore, as the report concludes, no single component, whether genes or ecosystems, is consistently a good indicator of overall biodiversity, as the components can vary independently.11 This further complicates the quest to develop indicators that are scientifically accurate and measurable.
Box 1. BIoDIvERSITy AND ITS LoSS—AvoIDING CoNCEPTUAL PITFALLS
Different interpretations of several important attributes of the concept of biodiversity can lead to confusion in understanding both scientific findings and their policy implications. Specifically, the value of the diversity of genes, species, or ecosystems per se is often confused with the value of a particular component of that diversity. Species diversity in and of itself, for example, is valuable because the presence of a variety of species helps to increase the capability of an ecosystem to be resilient in the face of a changing environment. At the same time, an individual component of that diversity, such as a particular food plant species, may be valuable as a biological resource. The consequences of changes in biodiversity for people can stem both from a change in the diversity per se and a change in a particular component of biodiversity. Each of these aspects of biodiversity deserves its own attention from decision-makers, and each often requires its own (albeit connected) management goals and policies.Second, because biodiversity refers to diversity at multiple scales of biological organization (genes, populations, species, and ecosystems) and can be considered at any geographic scale (local, regional, or global), it is generally important to specify the specific level of organization and scale of concern. For example, the introduction of widespread weedy species to a continent such as Africa will increase the species diversity of Africa (more species present) while decreasing ecosystem diversity globally (since the ecosystems in Africa then become more similar in species composition to ecosystems elsewhere due to the presence of the cosmopolitan species). Because of the multiple levels of organization and multiple geographic scales involved, any single indicator, such as species diversity, is generally a poor indicator for many aspects of biodiversity that may be of concern for policy-makers. These two considerations are also helpful in interpreting the meaning of biodiversity loss. For the purposes of assessing progress toward the 2010 targets, the Convention on Biological Diversity defines biodiversity loss to be the long-term or permanent qualitative or quantitative reduction in components of biodiversity and their potential to provide goods and services, to be measured at global, regional and national levels (CBD COP VII/30). Under this definition, biodiversity can be lost either if the diversity per se is reduced (such as through the extinction of some species) or if the potential of the components of diversity to provide a particular service is diminished (such as through unsustainable harvest). The homogenization of biodiversitythat is, the spread of invasive alien species around the worldthus also represents a loss of biodiversity at a global scale (since once-distinct groups of species in different parts of the world become more similar) even though the diversity of species in particular regions may actually increase because of the arrival of new species.
Source: Ecosystem and Human Well-Being (Biodiversity Synthesis), 2005.
13
As affirmed in the Johannesburg Plan of Implementation, the strong links that exist between biodiversity conservation and poverty alleviation are not always recognized or understood.12 Given the importance of ecosystems goods and services for the maintenance of human well-being, it is important to recognize that the environment, or more specifically, biodiversity, is a cross-cutting issue. Therefore, environment underpins all MDGs not only the MDG-7 on environmental sustainability, as illustrated in Table2, given the symbiotic relationship between poverty, human well-being and ecosystem services.
Taking into account the relevance of the issue, UNEP launched an initiative on mainstreaming environment beyond MDG-7. This initiative is expected to further enhance the profile of MEAs and their compliance by Party Governments, as MEAs can play a significant role in the implementation of the MDGs. Overall, three levels of linkages between MEAs and the MDGs can be identified: (1) formal decisions in MEAs processes and work programmes that are of direct relevance to MDGs; (2) MEAs priority activities that have direct impact to MDGs; (3) MEAs decisions that identify areas of cooperation that could be used to interlink with the MDGs. Conversely, there is a need for the MDGs to play a role in dealing with MEA implementation. However, this link is visibly absent within the MDG debates.
As the carrying capacity of ecosystems is gradually impaired and the capacity of ecosystems to provide goods and services is affected, inevitably biodiversity loss will directly affect human well-being. There are important linkages between the objectives of the CBD, particularly the 2010 target, and the MDGs that cannot be disregarded.13 The Millennium Assessment Report, for instance, identifies the loss of ecosystem services as being a major barrier to the achievement of poverty, hunger and disease reduction as set out by the MDGs.
However, CBD goals and the MDGs implementation should be coordinated so that initiatives targeted to promote the conservation of biodiversity do not limit the benefits that could accrue to local communities, and so that the attainment of MDGs through short-term economic development does not harm biodiversity. Therefore, likely trade-offs and synergies between these development processes have to be taken into account seriously in order to inform decision-makers.
This approach is consistent with paragraph 1 of decision VII/32 of the Conference of the Parties, which urges Parties, Governments, international financial institutions, donors and relevant intergovernmental organizations to implement development activities in ways that are consistent with, and do not compromise, the achievement of the objectives of the CBD and the 2010 target, as a contribution towards the MDG process.
Given the likely trade offs between development activities and biodiversity conservation, Governments and relevant interested individuals should consider mitigation actions in order to guarantee the reduction of biodiversity loss, which will otherwise negatively impact human livelihoods. Regrettably, the current political thinking is such that countries still regard environmental issues as constraints to achieving sustainable development. For instance, out of 100 countries assessed by the UNDP, almost two-thirds of the cases indicated this type of view.14 Nonetheless countries also reported on the positive impacts of improving environmental conditions to achieve other development priorities.15
UNDP (2007) reviewed MDG Country Reports (MDGRs) in order to assess to what extent environmental issues were taken into consideration in the implementation of other MDGs beyond MDG-7, highlighting linkages between environment and other areas of development. From the analysis, two main findings emerge: (1) There is no clear reference to environmental issues outside of MDG-7. Environment is not mainstreamed into other development processes, a weak correlation between poverty and environment is identified and response systems have not been developed to address both concerned areas simultaneously. (2) Emphasis on environmental issues is given to water availability and sanitation issues, particularly regarding health development goals. Scattered references to food security, climate change variations and natural hazards can be found outside of MDG-7 reporting and; (3) There is limited or no clear reporting from countries on the 2010 target that is measurable.
UNDP (2005) indicates that a majority of countries linked environment to poverty and hunger eradication (MDG-1), followed by child mortality (MDG-4) and diseases (MDG-6). Maternal health (MDG-5) and education (MDG-2) were goals considered to have the least connection with environment.
4. Linking MDGs and the Global Biodiversity Target

14
Table 2: Potential Direct Impacts of Biodiversity Loss on the Millennium Development Goals Achievement
MILLENNIUM DEVELOPMENT GOALS: BIODIVERSITY LOSS AS A CROSS-CUTTING ISSUE
MDG Some examples of links with biodiversity loss
Eradicate extreme poverty and hunger (Goal 1)
Biodiversity guaranteeing human well-being:As 40% of the global economy is based on biological products and ecosystem processes, �a reduction of its components will directly affect the world economy, increasing poverty levels16;Currently only 30 crop species dominate the worldwide food production and 90% of �animal food supply comes from 14 mammal and bird species - species which themselves rely on biodiversity for their productivity and survival. Continuous biodiversity loss will significantly threaten food security and income, through the reduction of crop genetic diversity and extinction of many livestock breeds.900 million extremely poor men, women and children who live in rural areas are the most �vulnerable to suffer the negative impacts from biodiversity loss.17
Achieve universal primary education (Goal 2)
Biodiversity guaranteeing human well-being:Shortage of wood fuel imposes time and financial costs on poor households, putting a �particular burden on those that are short of labour and making it harder for children to attend school.
Promote gender equality and empower women (Goal 3)
Women as users and custodians of biodiversity:The marginalization of women leads to the marginalization of the traditional knowledge �(TK) that they preserve, which is indispensable for maintaining livelihood security and conserve biological diversity.18 TK can be used in order to ensure food availability during periods of crisis such as civil conflicts, natural calamities or disabling diseases.Degradation of biodiversity reduces the availability of fuel, non-timber forest resources �(NTFRs) and potable water, increasing the time women spend in collecting these resources everyday. This may lead to a decline in the quality of livelihood for the entire family.
Health related goals:reduce child mortality (Goal 4) �improve maternal health (Goal 5) �combat major diseases (Goal 6) �
Biodiversity regulates pests and diseases:Low-income rural people depend on the consumption of traditional wild foods � 19, medicine and fuels for meeting daily needs of micronutrient and protein.The WHO suggests that 80% of the worlds people rely on traditional medicines and �traditional systems of medicine for day-to-day health care. In addition, medicinal plants can provide an important source of income for the rural poor, especially for women. A decline in biodiversity components will adversely impact on the protection of traditional knowledge, innovations and practices. Many widely used products, such as plant-based medicines and cosmetics, are derived from TK. Biodiversity loss as well as loss of traditional knowledge from globalisation will directly impact communities dependent on traditional medicine. Ecosystem alterations will lead to a decreased control of disease vectors (i.e. malaria �mosquito vector).Wetlands, for instance, are needed as water regulators to protect us from floods and �storm surges, to help in moderating climatic change with other ecosystems such as forests, and to act as living filters for pollutants and excess fertilizers.Biological control can reduce the dependency and costs associated with pesticides. �Environmental-related diseases (i.e. diarrhoea, acute respiratory infections, leukaemia, �etc) are primary causes of child mortality.
Ensure environmental sustainability(Goal 7)
Biodiversity providing ecosystem services:Biodiversity loss will directly affect the quality and quantity of ecosystem services �providedsuch as watershed protection, biodiversity habitat, carbon storage, soil fertility, recycling of nutrients, control of erosion and pollinating crops and trees.Soil microorganisms maintain soil fertility and structure for crop production. Reduction of �these microorganisms will lead to poor soil quality and disruption of soil food webs.The MA Report in its findings indicates that two-thirds of ecosystem services are in �decline, many of them to a level that cannot be restored (i.e. global fisheries stocks20).
Global partnership for development(Goal 8)
The Global Biodiversity Challenge: Develop income generation opportunities through sustainable livelihoods using Public- �Private Sector partnerships with supporting policies and investments at local levels.
From all biodiversity-related and Rio Conventions, the CBD has been the most proactive in its work on interlinkages and on making its contribution to the MDGs clear. As mentioned previously, the Conference of the Parties to the CBD, in its decision VII/32, recognizes that achievement of the Millennium Development Goals, in particular MDG-1 (Combating poverty and hunger), MDG-6 (Combating HIV/AIDS, malaria and other diseases), and MDG-7 (Ensuring environmental sustainability), are
dependent on the effective conservation of biological diversity, the sustainable use of its components, and the fair and equitable sharing of the benefits arising out of the utilization of genetic resources.
Other biodiversity related conventions are also collaborating with the CBD to achieve the 2010 target on biodiversity loss, as well as other related activities to the MDGs.
15
Comparison between the levels of discussions made on CBD indicators with the level of discussions on the MDGs is beginning to happen both within the CBD as well as within the MDG processes. However, it is important to understand some fundamental differences between the processes before attempting comparisons. These differences include:
(1) Pressure and response processes vs. result based: Most of the CBD related indicators discussed have pressure and response processes where actions related to conservation are measured based on the pressure the biodiversity is under as well as the manner in which the ecosystems and species respond to such pressures. This is because ecosystems and species are dynamic and changing. These two sets of indicators are later linked to result indicators in order to develop the work programmes. Thus, the basis for arriving at results on whether countries are moving towards achieving the 2010 targets are principally based on the pressures that exist on the ecosystems and species (including gene based variability). This often becomes a challenge for countries to use the 2010 indicators at local and specific levels. Unlike the CBD indicators, the MDG indicators are result based. The responses of countries to measure sustainable development are based on specific results. From the synthesis report presented by countries to the UNGA, it is clear that there was very little focus on pressure and response components.21 Attaran (2005), Reddy and Huety (2005) indicate the fact that several of the MDG related targets are difficult to measure since countries tend to be handicapped by the lack of pressure and response indicators.
(2) Limited social focus: Several of the indicators for measuring progress of the MDGs are socio-centric while the 2010 indicators are not. This lack of focus on social components of indicators by the CBD is well recognised in the recent review reports of the 2010 programme of work as well as in reports on CBD implementation. Though use of the ecosystem approach to conservation is central to CBD implementation, countries are still unclear on how to mainstream social dimensions into conservation action.
(3) Limited environmental focus: Though several initiatives and reports are being developed to address the need to mainstream environment across the MDGs, the environmental dimension to several MDG targets and indicators are still lacking.22 This will pose a challenge for those who seek to ensure that MEAs in general, and the CBD in particular, are mainstreamed across the MDGs to achieve the best results not just in managing local environments but in achieving real actions on sustainable development. Studies related to development of indicators to bring in the linkages are often biased towards using biodiversity related indicators and fail to link them with development indicators.
In spite of the above differences, both the MDGs and 2010 targets have some commonalities when it comes to assessing progress towards implementation. These include the lack of specific and validated data on baseline information. While countries were to design
the development of National Biodiversity Strategies and Action Plans (NBSAPs) on baseline information, it is clearly acknowledged that many countries still lack specific data when it comes to the status of biodiversity at local and national levels, with countries often at different stages of national reporting. This is similar for information related to components of the MDGs, such as data and information on malaria.23 The second similarity is the focus on country level implementation of actions. While the CBD processes stressed this from the beginning (and to a major extent achieved this through national reports), focus on national level implementation of action towards achieving the MDGs and review of progress is a recent phenomenon within the MDG process. However, the big challenge for MDG related reporting is the need for appropriate guidance to countries on how to measure progressnot just in statistical terms of assessing the information but also in generating information and doing a qualitative analysis.
5. Comparative Analysis
16
6.1 MDGs progress so far: Country Report Assessments
Assessment of national reports conducted by UNDP on MDGs indicate that only 89% of countries used MDGs indicators and 14% of countries made some changes to the indicators. However, there is very little analysis on the practical use of indicators for MDGs.24
Countries were encouraged to modify the global targets and select indicators relevant to those targets within the MDG process. Adopting country-specific
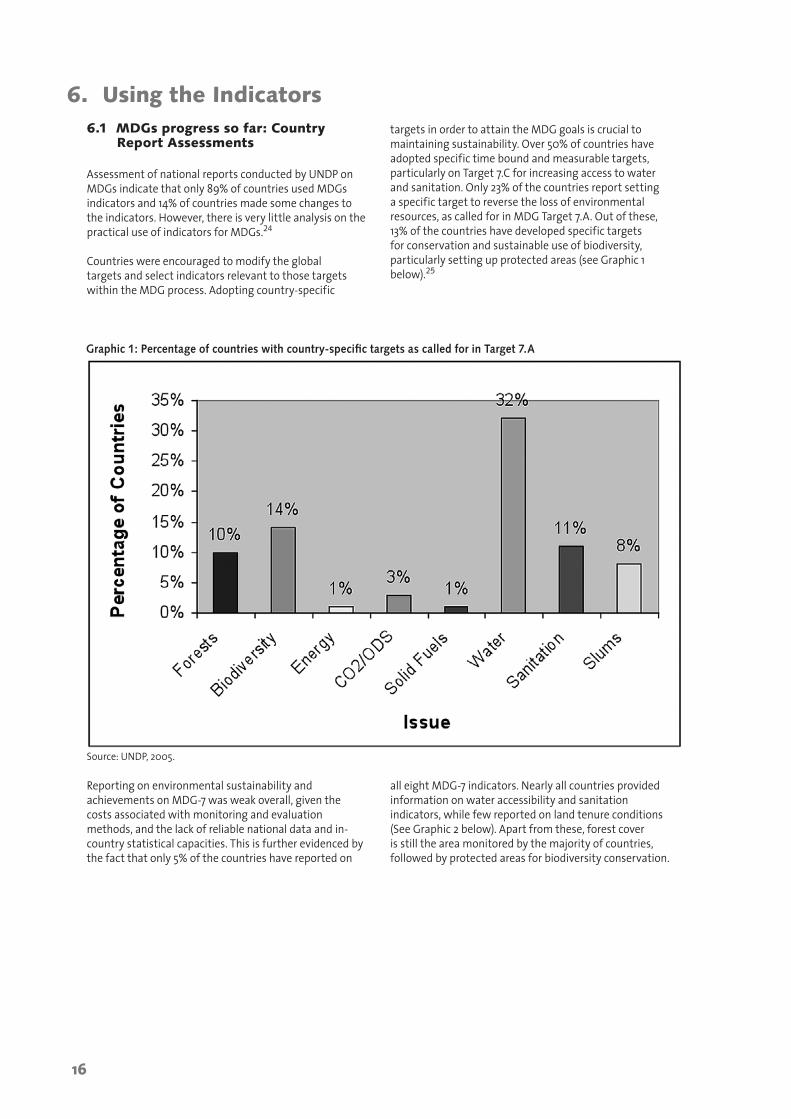
targets in order to attain the MDG goals is crucial to maintaining sustainability. Over 50% of countries have adopted specific time bound and measurable targets, particularly on Target 7.C for increasing access to water and sanitation. Only 23% of the countries report setting a specific target to reverse the loss of environmental resources, as called for in MDG Target 7.A. Out of these, 13% of the countries have developed specific targets for conservation and sustainable use of biodiversity, particularly setting up protected areas (see Graphic 1 below).25
6. Using the Indicators
Graphic 1: Percentage of countries with country-specific targets as called for in Target 7.A
Reporting on environmental sustainability and achievements on MDG-7 was weak overall, given the costs associated with monitoring and evaluation methods, and the lack of reliable national data and in-country statistical capacities. This is further evidenced by the fact that only 5% of the countries have reported on
all eight MDG-7 indicators. Nearly all countries provided information on water accessibility and sanitation indicators, while few reported on land tenure conditions (See Graphic 2 below). Apart from these, forest cover is still the area monitored by the majority of countries, followed by protected areas for biodiversity conservation.
Source: UNDP, 2005.

17
6.2 The 2010 Target: Assessing achievement through the CBD Third National Reports
The CBD through the 2010 target invited Parties and Governments to develop their own targets within the flexible framework provided in COP decision VII/30, annex II. An assessment of the Third National Reports submitted to the CBD reveals the stage of progress towards achieving the 2010 target in respondent countries (see Annex III, Graphic 3 and 4). Countries were required to inform whether a national target had been established corresponding to each of the 2010 global targets (see Annex III, Matrix 1). From responses received, it is clear that a significant majority of countries have not set out targets to address issues pertaining to access and benefit-sharing (Target 10.2), the protection of traditional knowledge (Target 9.2), redressing the impact of invasive alien species (Target 6.2), facilitating the transfer of technology (Target 11.2) and financial resources (Target 11.1) for the implementation of the Convention (see Annex III, Graphic 3). Therefore, achievements in these focal areas are likely to be impaired. At the same time, the results from the assessment of the national reports are consistent with the outputs from the Ad Hoc Open-ended Working Group on the Review of Implementation of the Convention held in September 2005, where the meeting
indicated the prospects for attaining the targets and sub-targets agreed under the 2010 initiative. 26
Countries were also requested to inform the CBD Secretariat whether the global or national targets established had been incorporated into relevant plans, programmes and strategies (see Annex III, Graphic 4). Once again, the majority of countries indicated a lack of coordination of activities for matters related to access and benefit-sharing (Target 10.2), protection of traditional knowledge (Target 9.2), transfer of technology (Target 11.2) and financial resources (Target 11.1), since neither the global or national targets had been incorporated into other national development strategies (see Annex III, Graphic 4).
Assessment of national reports submitted by Parties to the CBD indicates that several countries have started to mainstream elements of the 2010 targets into sectoral plans, programmes and strategies. This was possible because of specific provisions to do so under Article 6(b) of the CBD, as well as the provision of suitable guidance on mainstreaming biodiversity conservation across sectors. It is important for countries to receive such similar guidance on mainstreaming environment across the MDGs.
Graphic 2: Percentage of countries using global indicators
Source: UNDP, 2005.
18
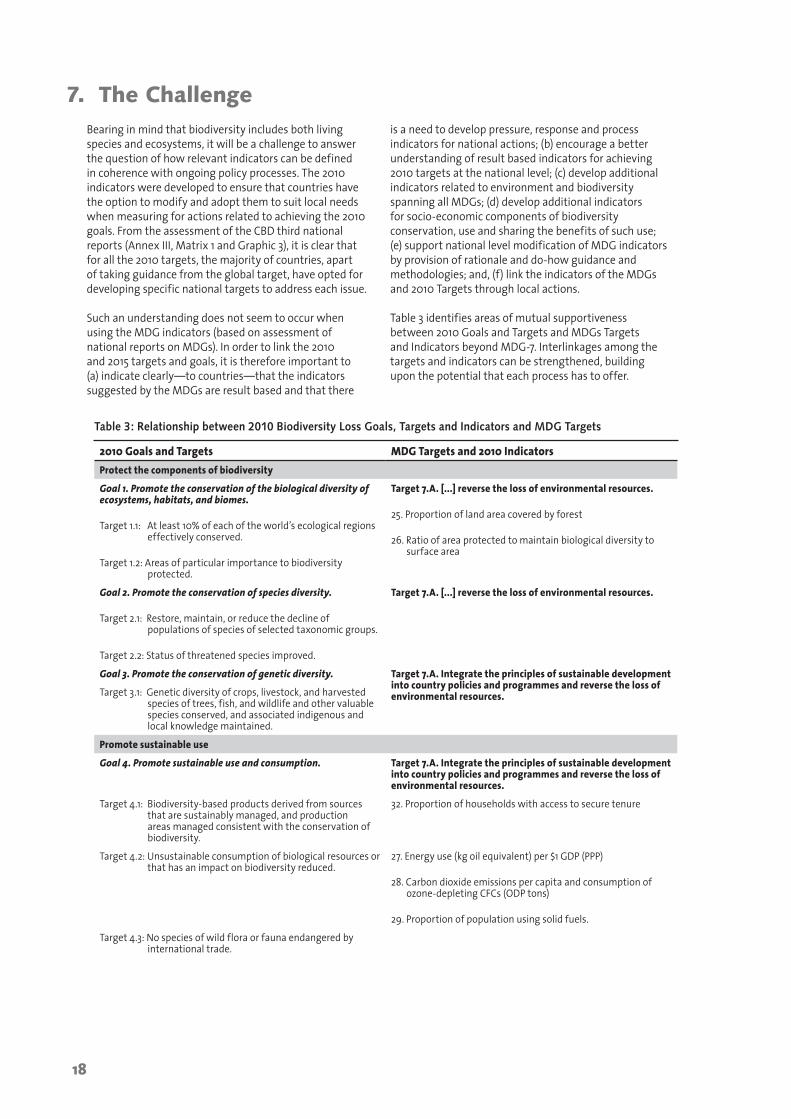
Bearing in mind that biodiversity includes both living species and ecosystems, it will be a challenge to answer the question of how relevant indicators can be defined in coherence with ongoing policy processes. The 2010 indicators were developed to ensure that countries have the option to modify and adopt them to suit local needs when measuring for actions related to achieving the 2010 goals. From the assessment of the CBD third national reports (Annex III, Matrix 1 and Graphic 3), it is clear that for all the 2010 targets, the majority of countries, apart of taking guidance from the global target, have opted for developing specific national targets to address each issue.
Such an understanding does not seem to occur when using the MDG indicators (based on assessment of national reports on MDGs). In order to link the 2010 and 2015 targets and goals, it is therefore important to (a) indicate clearlyto countriesthat the indicators suggested by the MDGs are result based and that there
is a need to develop pressure, response and process indicators for national actions; (b) encourage a better understanding of result based indicators for achieving 2010 targets at the national level; (c) develop additional indicators related to environment and biodiversity spanning all MDGs; (d) develop additional indicators for socio-economic components of biodiversity conservation, use and sharing the benefits of such use; (e) support national level modification of MDG indicators by provision of rationale and do-how guidance and methodologies; and, (f) link the indicators of the MDGs and 2010 Targets through local actions.
Table 3 identifies areas of mutual supportiveness between 2010 Goals and Targets and MDGs Targets and Indicators beyond MDG-7. Interlinkages among the targets and indicators can be strengthened, building upon the potential that each process has to offer.
7. The Challenge
2010 Goals and Targets MDG Targets and 2010 IndicatorsProtect the components of biodiversity
Goal 1. Promote the conservation of the biological diversity of ecosystems, habitats, and biomes.
Target 1.1: At least 10% of each of the worlds ecological regions effectively conserved.
Target 1.2: Areas of particular importance to biodiversity protected.
Target 7.A. [...] reverse the loss of environmental resources.
25. Proportion of land area covered by forest
26. Ratio of area protected to maintain biological diversity to surface area
Goal 2. Promote the conservation of species diversity.
Target 2.1: Restore, maintain, or reduce the decline of populations of species of selected taxonomic groups.
Target 2.2: Status of threatened species improved.
Target 7.A. [...] reverse the loss of environmental resources.
Goal 3. Promote the conservation of genetic diversity. Target 7.A. Integrate the principles of sustainable development into country policies and programmes and reverse the loss of environmental resources.Target 3.1: Genetic diversity of crops, livestock, and harvested
species of trees, fish, and wildlife and other valuable species conserved, and associated indigenous and local knowledge maintained.
Promote sustainable use
Goal 4. Promote sustainable use and consumption. Target 7.A. Integrate the principles of sustainable development into country policies and programmes and reverse the loss of environmental resources.
Target 4.1: Biodiversity-based products derived from sources that are sustainably managed, and production areas managed consistent with the conservation of biodiversity.
32. Proportion of households with access to secure tenure
Target 4.2: Unsustainable consumption of biological resources or that has an impact on biodiversity reduced.
27. Energy use (kg oil equivalent) per $1 GDP (PPP)
28. Carbon dioxide emissions per capita and consumption of ozone-depleting CFCs (ODP tons)
29. Proportion of population using solid fuels.
Target 4.3: No species of wild flora or fauna endangered by international trade.
Table 3: Relationship between 2010 Biodiversity Loss Goals, Targets and Indicators and MDG Targets

19
2010 Goals and Targets MDG Targets and 2010 IndicatorsAddress threats to biodiversity
Goal 5. Pressures from habitat loss, land use change and degradation, and unsustainable water use reduced.
Target 7.C. Halve, by 2015, the proportion of people without sustainable access to safe drinking water and basic sanitation.
30. Proportion of population with sustainable access to an improved water source, urban and rural
31. Proportion of population with access to improved sanitation, urban and rural
32. Proportion of households with access to secure tenure
Target 5.1: Rate of loss and degradation of natural habitats decreased
Target 7.A. Integrate the principles of sustainable development into country policies and programmes and reverse the loss of environmental resources.
Goal 6. Control threats from invasive alien species.
Target 6.1: Pathways for major potential alien invasive species controlled.
Target 6.2: Management plans in place for major alien species that threaten ecosystems, habitats, or species.
Target 7.A. Integrate the principles of sustainable development into country policies and programmes and reverse the loss of environmental resources.
Goal 7. Address challenges to biodiversity from climate change and pollution.
Target 7.A. Integrate the principles of sustainable development into country policies and programmes and reverse the loss of environmental resources.
Target 7.1: Maintain and enhance resilience of the components of biodiversity to adapt to climate change.
27. Energy use (kg oil equivalent) per $1 GDP (PPP)
28. Carbon dioxide emissions per capita and consumption of ozone-depleting CFCs (ODP tons)
29. Proportion
Target 7.2: Reduce pollution and its impacts on biodiversity.
Maintain goods and services from biodiversity to support human well-being
Goal 8. Maintain capacity of ecosystems to deliver goods and services and support livelihoods.
Target 1.C. Halve, between 1990 and 2015, the proportion of people who suffer from hunger.
4. Prevalence of underweight children under 5 years of age
5. Proportion of population below minimum level of dietary energy consumption
Target 8.1: Capacity of ecosystems to deliver goods and services maintained.
Target 8.2: Biological resources that support sustainable livelihoods, local food security, and health care, especially of poor people, maintained.
Target 5.A. Reduce by three quarters, between 1990 and 2015, the maternal mortality ratio.
Target 6.C. Have halted by 2015 and begun to reverse the incidence of malaria and other major diseases.
Target 7.A. Integrate the principles of sustainable development into country policies and programmes and reverse the loss of environmental resources.
Target 7.C. Halve, by 2015, the proportion of people without sustainable access to safe drinking water and basic sanitation.
Protect traditional knowledge, innovations and practices
Goal 9. Maintain sociocultural diversity of indigenous and local communities.
Target 7.A. Integrate the principles of sustainable development into country policies and programmes […]
Target 9.1: Protect traditional knowledge, innovations, and practices.
Target 9.2: Protect the rights of indigenous and local communities over their traditional knowledge, innovations, and practices, including their rights to benefit sharing.
32. Proportion of households with access to secure tenure
20
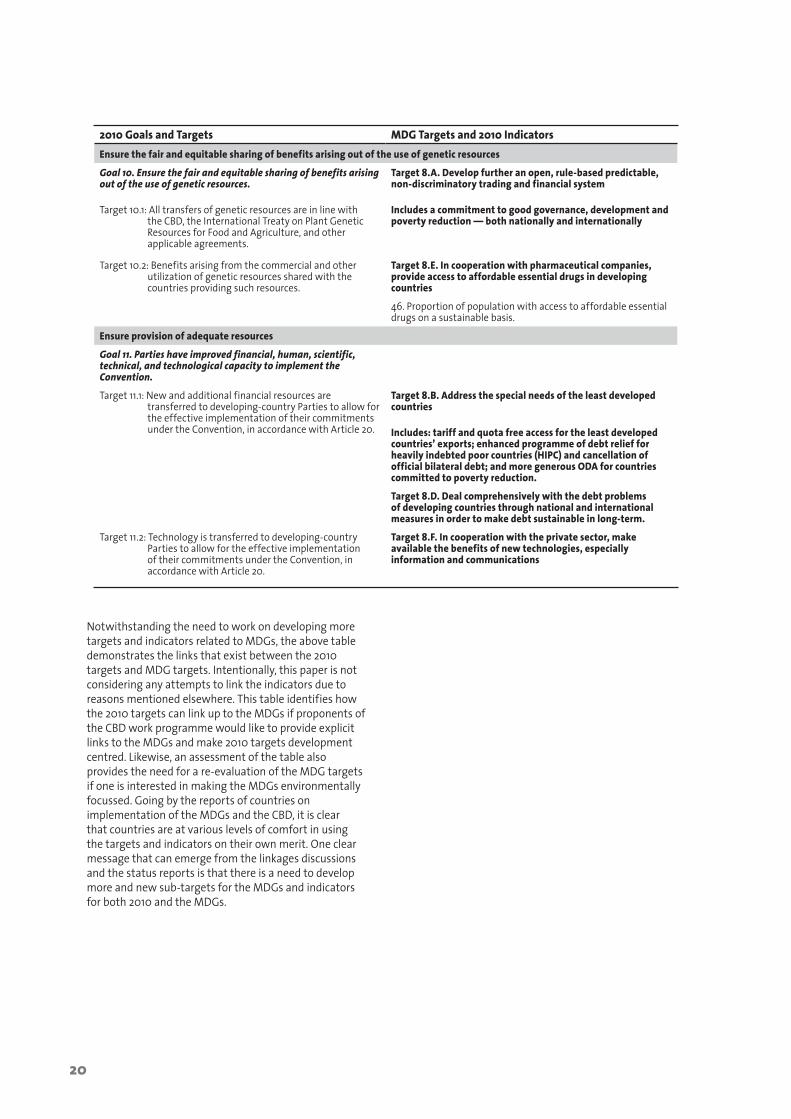
2010 Goals and Targets MDG Targets and 2010 IndicatorsEnsure the fair and equitable sharing of benefits arising out of the use of genetic resources
Goal 10. Ensure the fair and equitable sharing of benefits arising out of the use of genetic resources.
Target 10.1: All transfers of genetic resources are in line with the CBD, the International Treaty on Plant Genetic Resources for Food and Agriculture, and other applicable agreements.
Target 8.A. Develop further an open, rule-based predictable, non-discriminatory trading and financial system
Includes a commitment to good governance, development and poverty reduction both nationally and internationally
Target 10.2: Benefits arising from the commercial and other utilization of genetic resources shared with the countries providing such resources.
Target 8.E. In cooperation with pharmaceutical companies, provide access to affordable essential drugs in developing countries
46. Proportion of population with access to affordable essential drugs on a sustainable basis.
Ensure provision of adequate resources
Goal 11. Parties have improved financial, human, scientific, technical, and technological capacity to implement the Convention.
Target 11.1: New and additional financial resources are transferred to developing-country Parties to allow for the effective implementation of their commitments under the Convention, in accordance with Article 20.
Target 8.B. Address the special needs of the least developed countries
Includes: tariff and quota free access for the least developed countries exports; enhanced programme of debt relief for heavily indebted poor countries (HIPC) and cancellation of official bilateral debt; and more generous ODA for countries committed to poverty reduction.
Target 8.D. Deal comprehensively with the debt problems of developing countries through national and international measures in order to make debt sustainable in long-term.
Target 11.2: Technology is transferred to developing-country Parties to allow for the effective implementation of their commitments under the Convention, in accordance with Article 20.
Target 8.F. In cooperation with the private sector, make available the benefits of new technologies, especially information and communications
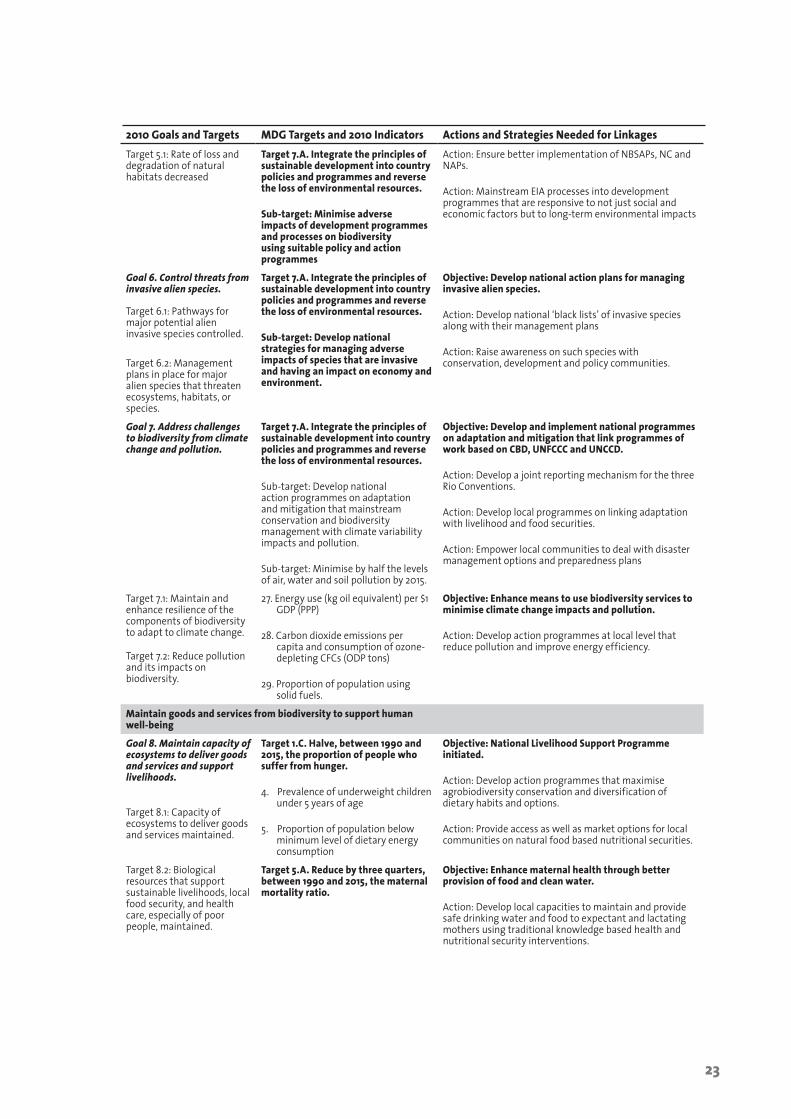
Notwithstanding the need to work on developing more targets and indicators related to MDGs, the above table demonstrates the links that exist between the 2010 targets and MDG targets. Intentionally, this paper is not considering any attempts to link the indicators due to reasons mentioned elsewhere. This table identifies how the 2010 targets can link up to the MDGs if proponents of the CBD work programme would like to provide explicit links to the MDGs and make 2010 targets development centred. Likewise, an assessment of the table also provides the need for a re-evaluation of the MDG targets if one is interested in making the MDGs environmentally focussed. Going by the reports of countries on implementation of the MDGs and the CBD, it is clear that countries are at various levels of comfort in using the targets and indicators on their own merit. One clear message that can emerge from the linkages discussions and the status reports is that there is a need to develop more and new sub-targets for the MDGs and indicators for both 2010 and the MDGs.
21
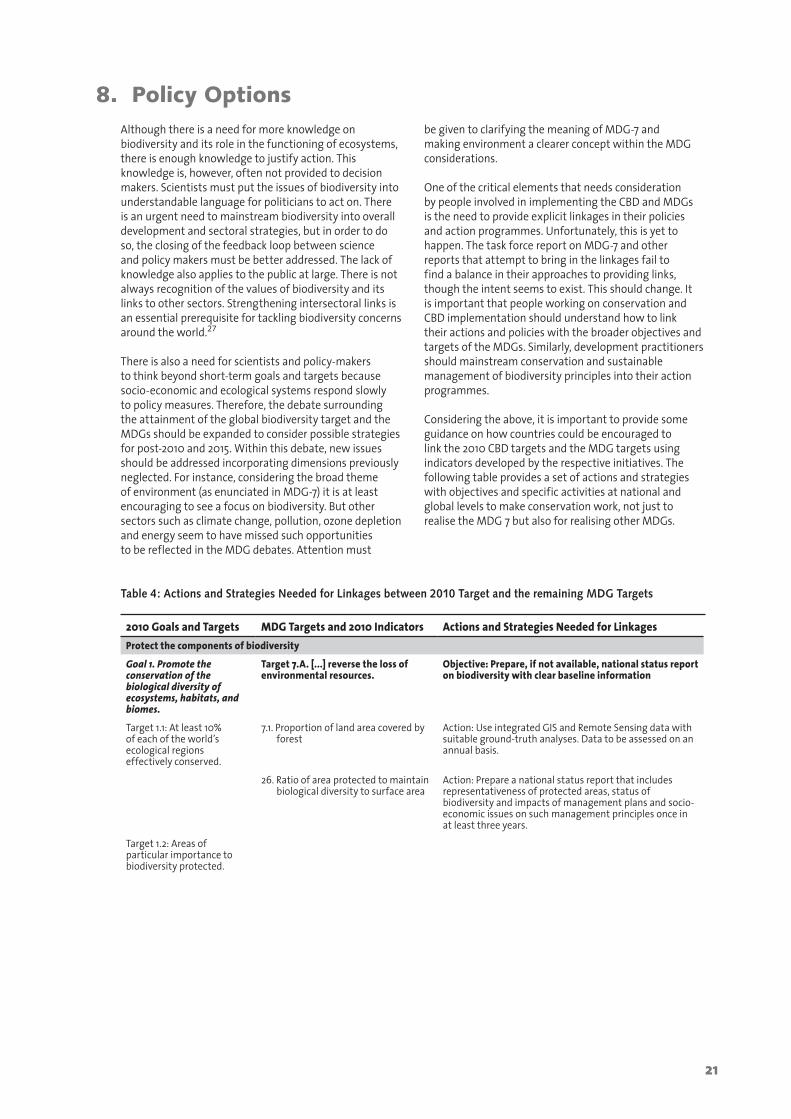
Although there is a need for more knowledge on biodiversity and its role in the functioning of ecosystems, there is enough knowledge to justify action. This knowledge is, however, often not provided to decision makers. Scientists must put the issues of biodiversity into understandable language for politicians to act on. There is an urgent need to mainstream biodiversity into overall development and sectoral strategies, but in order to do so, the closing of the feedback loop between science and policy makers must be better addressed. The lack of knowledge also applies to the public at large. There is not always recognition of the values of biodiversity and its links to other sectors. Strengthening intersectoral links is an essential prerequisite for tackling biodiversity concerns around the world.27
There is also a need for scientists and policy-makers to think beyond short-term goals and targets because socio-economic and ecological systems respond slowly to policy measures. Therefore, the debate surrounding the attainment of the global biodiversity target and the MDGs should be expanded to consider possible strategies for post-2010 and 2015. Within this debate, new issues should be addressed incorporating dimensions previously neglected. For instance, considering the broad theme of environment (as enunciated in MDG-7) it is at least encouraging to see a focus on biodiversity. But other sectors such as climate change, pollution, ozone depletion and energy seem to have missed such opportunities to be reflected in the MDG debates. Attention must
be given to clarifying the meaning of MDG-7 and making environment a clearer concept within the MDG considerations.
One of the critical elements that needs consideration by people involved in implementing the CBD and MDGs is the need to provide explicit linkages in their policies and action programmes. Unfortunately, this is yet to happen. The task force report on MDG-7 and other reports that attempt to bring in the linkages fail to find a balance in their approaches to providing links, though the intent seems to exist. This should change. It is important that people working on conservation and CBD implementation should understand how to link their actions and policies with the broader objectives and targets of the MDGs. Similarly, development practitioners should mainstream conservation and sustainable management of biodiversity principles into their action programmes.
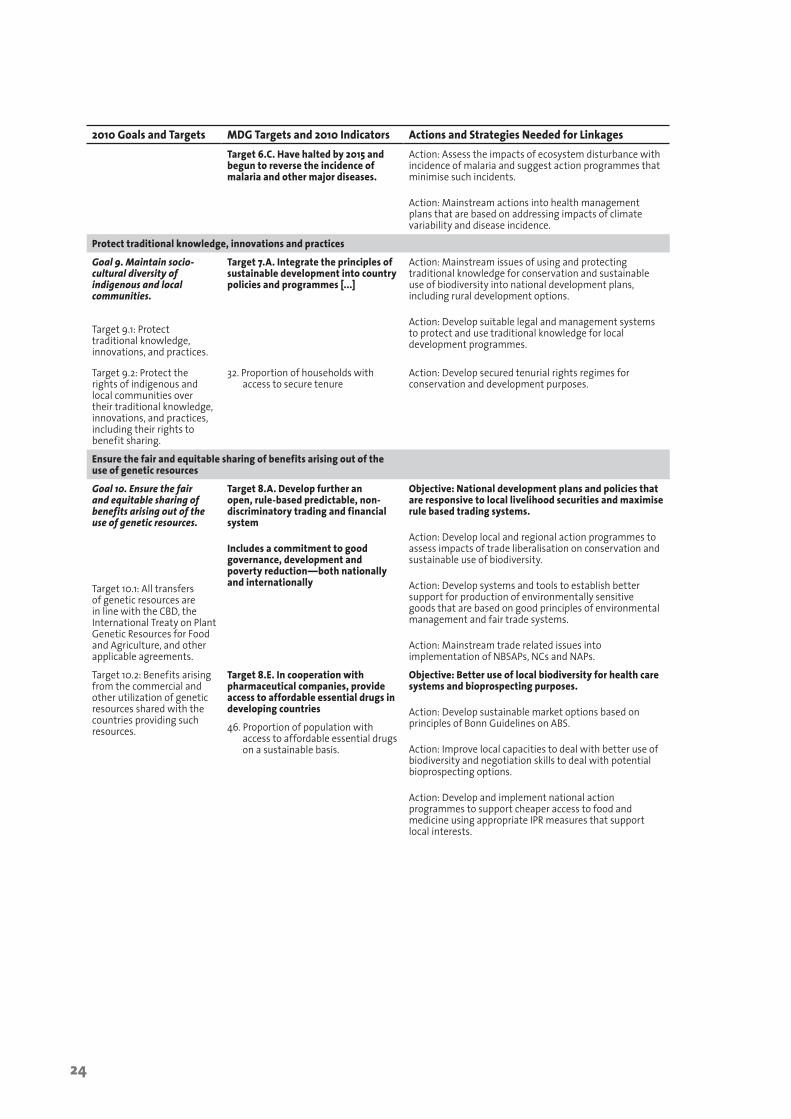
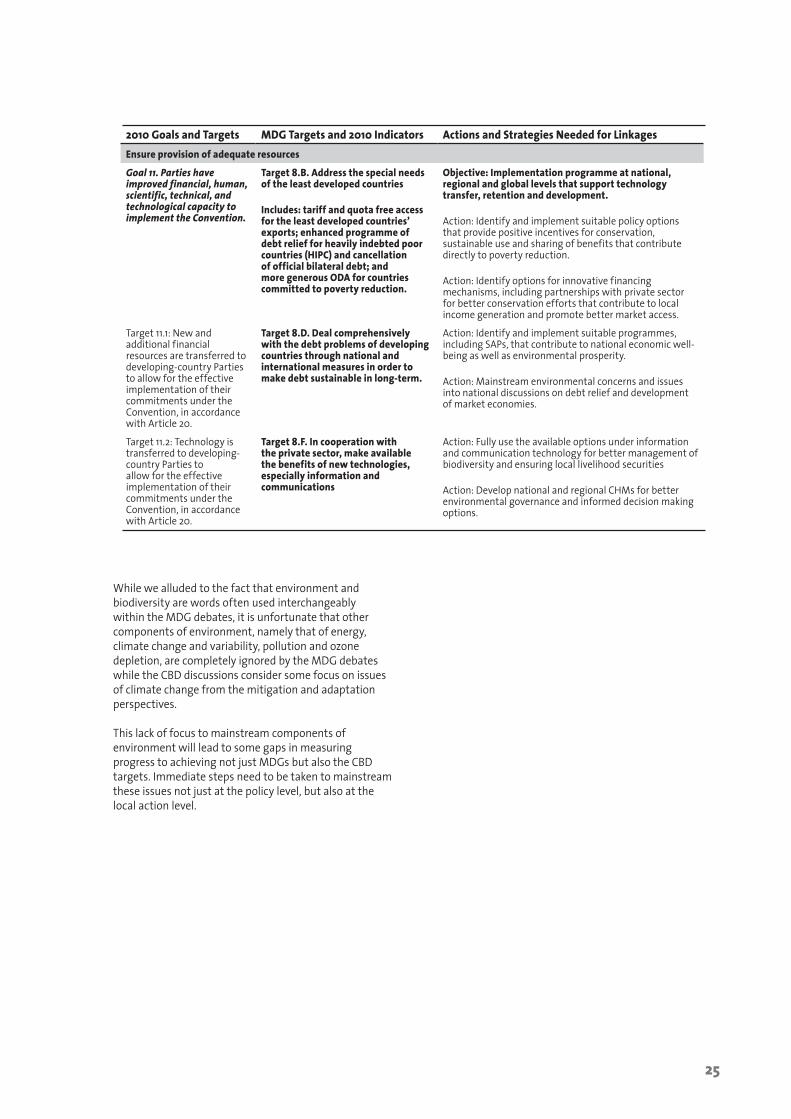
Considering the above, it is important to provide some guidance on how countries could be encouraged to link the 2010 CBD targets and the MDG targets using indicators developed by the respective initiatives. The following table provides a set of actions and strategies with objectives and specific activities at national and global levels to make conservation work, not just to realise the MDG 7 but also for realising other MDGs.
8. Policy options
Table 4: Actions and Strategies Needed for Linkages between 2010 Target and the remaining MDG Targets
2010 Goals and Targets MDG Targets and 2010 Indicators Actions and Strategies Needed for LinkagesProtect the components of biodiversity
Goal 1. Promote the conservation of the biological diversity of ecosystems, habitats, and biomes.
Target 7.A. [...] reverse the loss of environmental resources.
Objective: Prepare, if not available, national status report on biodiversity with clear baseline information
Target 1.1: At least 10% of each of the worlds ecological regions effectively conserved.
7.1. Proportion of land area covered by forest
Action: Use integrated GIS and Remote Sensing data with suitable ground-truth analyses. Data to be assessed on an annual basis.
26. Ratio of area protected to maintain biological diversity to surface area
Action: Prepare a national status report that includes representativeness of protected areas, status of biodiversity and impacts of management plans and socio-economic issues on such management principles once in at least three years.
Target 1.2: Areas of particular importance to biodiversity protected.
22
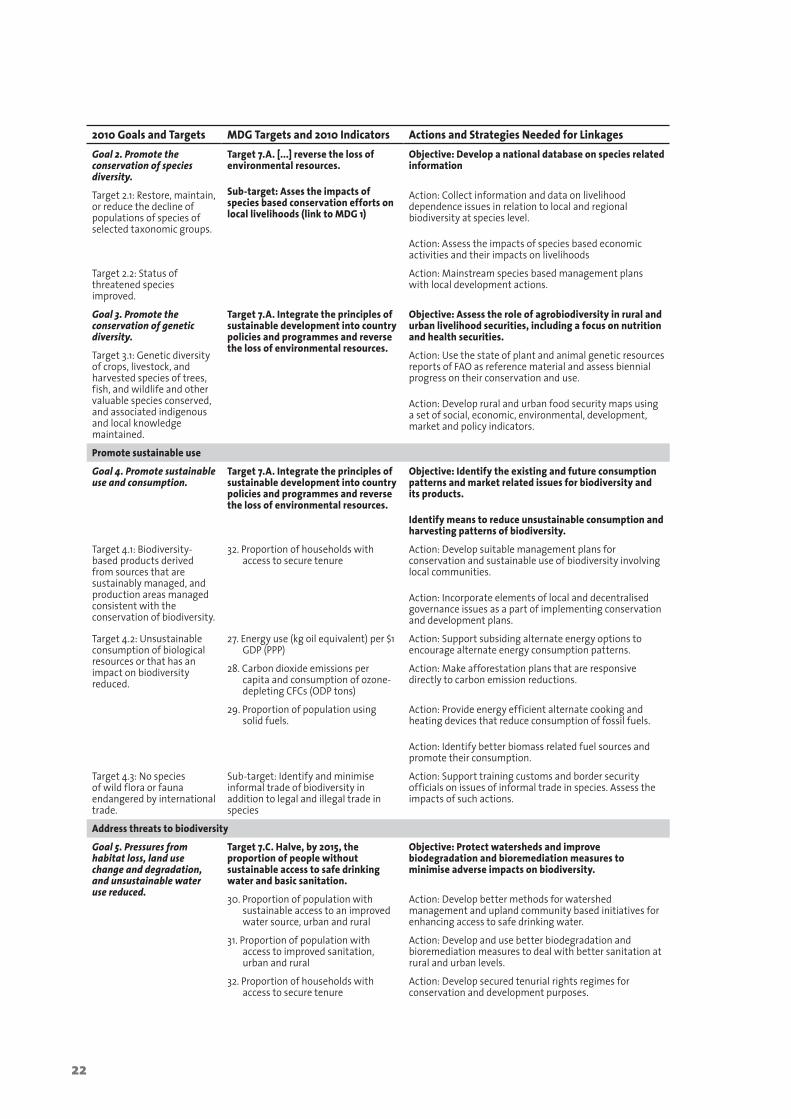
2010 Goals and Targets MDG Targets and 2010 Indicators Actions and Strategies Needed for LinkagesGoal 2. Promote the conservation of species diversity.
Target 7.A. [...] reverse the loss of environmental resources.
Sub-target: Asses the impacts of species based conservation efforts on local livelihoods (link to MDG 1)
Objective: Develop a national database on species related information
Target 2.1: Restore, maintain, or reduce the decline of populations of species of selected taxonomic groups.
Action: Collect information and data on livelihood dependence issues in relation to local and regional biodiversity at species level.
Action: Assess the impacts of species based economic activities and their impacts on livelihoods
Target 2.2: Status of threatened species improved.
Action: Mainstream species based management plans with local development actions.
Goal 3. Promote the conservation of genetic diversity.
Target 7.A. Integrate the principles of sustainable development into country policies and programmes and reverse the loss of environmental resources.
Objective: Assess the role of agrobiodiversity in rural and urban livelihood securities, including a focus on nutrition and health securities.
Target 3.1: Genetic diversity of crops, livestock, and harvested species of trees, fish, and wildlife and other valuable species conserved, and associated indigenous and local knowledge maintained.
Action: Use the state of plant and animal genetic resources reports of FAO as reference material and assess biennial progress on their conservation and use.
Action: Develop rural and urban food security maps using a set of social, economic, environmental, development, market and policy indicators.
Promote sustainable use
Goal 4. Promote sustainable use and consumption.
Target 7.A. Integrate the principles of sustainable development into country policies and programmes and reverse the loss of environmental resources.
Objective: Identify the existing and future consumption patterns and market related issues for biodiversity and its products.
Identify means to reduce unsustainable consumption and harvesting patterns of biodiversity.
Target 4.1: Biodiversity-based products derived from sources that are sustainably managed, and production areas managed consistent with the conservation of biodiversity.
32. Proportion of households with access to secure tenure
Action: Develop suitable management plans for conservation and sustainable use of biodiversity involving local communities.
Action: Incorporate elements of local and decentralised governance issues as a part of implementing conservation and development plans.
Target 4.2: Unsustainable consumption of biological resources or that has an impact on biodiversity reduced.
27. Energy use (kg oil equivalent) per $1 GDP (PPP)
Action: Support subsiding alternate energy options to encourage alternate energy consumption patterns.
28. Carbon dioxide emissions per capita and consumption of ozone-depleting CFCs (ODP tons)
Action: Make afforestation plans that are responsive directly to carbon emission reductions.
29. Proportion of population using solid fuels.
Action: Provide energy efficient alternate cooking and heating devices that reduce consumption of fossil fuels.
Action: Identify better biomass related fuel sources and promote their consumption.
Target 4.3: No species of wild flora or fauna endangered by international trade.
Sub-target: Identify and minimise informal trade of biodiversity in addition to legal and illegal trade in species
Action: Support training customs and border security officials on issues of informal trade in species. Assess the impacts of such actions.
Address threats to biodiversity
Goal 5. Pressures from habitat loss, land use change and degradation, and unsustainable water use reduced.
Target 7.C. Halve, by 2015, the proportion of people without sustainable access to safe drinking water and basic sanitation.
Objective: Protect watersheds and improve biodegradation and bioremediation measures to minimise adverse impacts on biodiversity.
30. Proportion of population with sustainable access to an improved water source, urban and rural
Action: Develop better methods for watershed management and upland community based initiatives for enhancing access to safe drinking water.
31. Proportion of population with access to improved sanitation, urban and rural
Action: Develop and use better biodegradation and bioremediation measures to deal with better sanitation at rural and urban levels.
32. Proportion of households with access to secure tenure
Action: Develop secured tenurial rights regimes for conservation and development purposes.
23
2010 Goals and Targets MDG Targets and 2010 Indicators Actions and Strategies Needed for LinkagesTarget 5.1: Rate of loss and degradation of natural habitats decreased
Target 7.A. Integrate the principles of sustainable development into country policies and programmes and reverse the loss of environmental resources.
Sub-target: Minimise adverse impacts of development programmes and processes on biodiversity using suitable policy and action programmes
Action: Ensure better implementation of NBSAPs, NC and NAPs.
Action: Mainstream EIA processes into development programmes that are responsive to not just social and economic factors but to long-term environmental impacts
Goal 6. Control threats from invasive alien species.
Target 7.A. Integrate the principles of sustainable development into country policies and programmes and reverse the loss of environmental resources.
Sub-target: Develop national strategies for managing adverse impacts of species that are invasive and having an impact on economy and environment.
Objective: Develop national action plans for managing invasive alien species.
Action: Develop national black lists of invasive species along with their management plans
Action: Raise awareness on such species with conservation, development and policy communities.
Target 6.1: Pathways for major potential alien invasive species controlled.
Target 6.2: Management plans in place for major alien species that threaten ecosystems, habitats, or species.
Goal 7. Address challenges to biodiversity from climate change and pollution.
Target 7.A. Integrate the principles of sustainable development into country policies and programmes and reverse the loss of environmental resources.
Sub-target: Develop national action programmes on adaptation and mitigation that mainstream conservation and biodiversity management with climate variability impacts and pollution.
Sub-target: Minimise by half the levels of air, water and soil pollution by 2015.
Objective: Develop and implement national programmes on adaptation and mitigation that link programmes of work based on CBD, UNFCCC and UNCCD.
Action: Develop a joint reporting mechanism for the three Rio Conventions.
Action: Develop local programmes on linking adaptation with livelihood and food securities.
Action: Empower local communities to deal with disaster management options and preparedness plans
Target 7.1: Maintain and enhance resilience of the components of biodiversity to adapt to climate change.
27. Energy use (kg oil equivalent) per $1 GDP (PPP)
28. Carbon dioxide emissions per capita and consumption of ozone-depleting CFCs (ODP tons)
29. Proportion of population using solid fuels.
Objective: Enhance means to use biodiversity services to minimise climate change impacts and pollution.
Action: Develop action programmes at local level that reduce pollution and improve energy efficiency.
Target 7.2: Reduce pollution and its impacts on biodiversity.
Maintain goods and services from biodiversity to support human well-being
Goal 8. Maintain capacity of ecosystems to deliver goods and services and support livelihoods.
Target 1.C. Halve, between 1990 and 2015, the proportion of people who suffer from hunger.
4. Prevalence of underweight children under 5 years of age
5. Proportion of population below minimum level of dietary energy consumption
Objective: National Livelihood Support Programme initiated.
Action: Develop action programmes that maximise agrobiodiversity conservation and diversification of dietary habits and options.
Action: Provide access as well as market options for local communities on natural food based nutritional securities.
Target 8.1: Capacity of ecosystems to deliver goods and services maintained.
Target 8.2: Biological resources that support sustainable livelihoods, local food security, and health care, especially of poor people, maintained.
Target 5.A. Reduce by three quarters, between 1990 and 2015, the maternal mortality ratio.
Objective: Enhance maternal health through better provision of food and clean water.
Action: Develop local capacities to maintain and provide safe drinking water and food to expectant and lactating mothers using traditional knowledge based health and nutritional security interventions.
24
2010 Goals and Targets MDG Targets and 2010 Indicators Actions and Strategies Needed for LinkagesTarget 6.C. Have halted by 2015 and begun to reverse the incidence of malaria and other major diseases.
Action: Assess the impacts of ecosystem disturbance with incidence of malaria and suggest action programmes that minimise such incidents.
Action: Mainstream actions into health management plans that are based on addressing impacts of climate variability and disease incidence.
Protect traditional knowledge, innovations and practices
Goal 9. Maintain socio-cultural diversity of indigenous and local communities.
Target 7.A. Integrate the principles of sustainable development into country policies and programmes [...]
Action: Mainstream issues of using and protecting traditional knowledge for conservation and sustainable use of biodiversity into national development plans, including rural development options.
Action: Develop suitable legal and management systems to protect and use traditional knowledge for local development programmes.
Target 9.1: Protect traditional knowledge, innovations, and practices.
Target 9.2: Protect the rights of indigenous and local communities over their traditional knowledge, innovations, and practices, including their rights to benefit sharing.
32. Proportion of households with access to secure tenure
Action: Develop secured tenurial rights regimes for conservation and development purposes.
Ensure the fair and equitable sharing of benefits arising out of the use of genetic resources
Goal 10. Ensure the fair and equitable sharing of benefits arising out of the use of genetic resources.
Target 8.A. Develop further an open, rule-based predictable, non-discriminatory trading and financial system
Includes a commitment to good governance, development and poverty reductionboth nationally and internationally
Objective: National development plans and policies that are responsive to local livelihood securities and maximise rule based trading systems.
Action: Develop local and regional action programmes to assess impacts of trade liberalisation on conservation and sustainable use of biodiversity.
Action: Develop systems and tools to establish better support for production of environmentally sensitive goods that are based on good principles of environmental management and fair trade systems.
Action: Mainstream trade related issues into implementation of NBSAPs, NCs and NAPs.
Target 10.1: All transfers of genetic resources are in line with the CBD, the International Treaty on Plant Genetic Resources for Food and Agriculture, and other applicable agreements.
Target 10.2: Benefits arising from the commercial and other utilization of genetic resources shared with the countries providing such resources.
Target 8.E. In cooperation with pharmaceutical companies, provide access to affordable essential drugs in developing countries
Objective: Better use of local biodiversity for health care systems and bioprospecting purposes.
Action: Develop sustainable market options based on principles of Bonn Guidelines on ABS.
Action: Improve local capacities to deal with better use of biodiversity and negotiation skills to deal with potential bioprospecting options.
Action: Develop and implement national action programmes to support cheaper access to food and medicine using appropriate IPR measures that support local interests.
46. Proportion of population with access to affordable essential drugs on a sustainable basis.
25
2010 Goals and Targets MDG Targets and 2010 Indicators Actions and Strategies Needed for LinkagesEnsure provision of adequate resources
Goal 11. Parties have improved financial, human, scientific, technical, and technological capacity to implement the Convention.
Target 8.B. Address the special needs of the least developed countries
Includes: tariff and quota free access for the least developed countries exports; enhanced programme of debt relief for heavily indebted poor countries (HIPC) and cancellation of official bilateral debt; and more generous ODA for countries committed to poverty reduction.
Objective: Implementation programme at national, regional and global levels that support technology transfer, retention and development.
Action: Identify and implement suitable policy options that provide positive incentives for conservation, sustainable use and sharing of benefits that contribute directly to poverty reduction.
Action: Identify options for innovative financing mechanisms, including partnerships with private sector for better conservation efforts that contribute to local income generation and promote better market access.
Target 11.1: New and additional financial resources are transferred to developing-country Parties to allow for the effective implementation of their commitments under the Convention, in accordance with Article 20.
Target 8.D. Deal comprehensively with the debt problems of developing countries through national and international measures in order to make debt sustainable in long-term.
Action: Identify and implement suitable programmes, including SAPs, that contribute to national economic well-being as well as environmental prosperity.
Action: Mainstream environmental concerns and issues into national discussions on debt relief and development of market economies.
Target 11.2: Technology is transferred to developing-country Parties to allow for the effective implementation of their commitments under the Convention, in accordance with Article 20.
Target 8.F. In cooperation with the private sector, make available the benefits of new technologies, especially information and communications
Action: Fully use the available options under information and communication technology for better management of biodiversity and ensuring local livelihood securities
Action: Develop national and regional CHMs for better environmental governance and informed decision making options.
While we alluded to the fact that environment and biodiversity are words often used interchangeably within the MDG debates, it is unfortunate that other components of environment, namely that of energy, climate change and variability, pollution and ozone depletion, are completely ignored by the MDG debates while the CBD discussions consider some focus on issues of climate change from the mitigation and adaptation perspectives.
This lack of focus to mainstream components of environment will lead to some gaps in measuring progress to achieving not just MDGs but also the CBD targets. Immediate steps need to be taken to mainstream these issues not just at the policy level, but also at the local action level.

26
9.1 Mainstreaming environment across MDGs
It has been amply demonstrated that environment management and conservation action is critically important to achieving all of the MDGs and not just MDG-7.28 Linking conservation and development planning is therefore important at the national level. Outcomes of the UNGA 60th session and review of MDG implementation, 5 years after adoption, indicated that beginning in 2006, countries have been encouraged to report on national development planning using economic, social and environmental indicators. Therefore, a set of tools and procedures for countries to use on tracking development efforts that consider using environmental indicators as well is long overdue.
Given the experience from countries reporting on implementation of CBD decisions and moving towards achieving the 2010 targets (based on third national reports of countries to the CBD), it is clear that countries will be better placed to monitor progress and evaluate the results of local action on issues such as conservation of species and ecosystems rather than assessing impacts of action on cross cutting issues such as access and benefit sharing, impacts of climate change and variability and social impacts of conservation. One of the reasons for this lack of focus from countries is due to the absence of guidance for countries to establish links using cross cutting issues.
Countries will face similar challenges for reporting or assessing impacts of local action on achieving MDGs, unless unambiguous indicators and tools are made available to them to monitor both baseline and incremental actions to achieving MDGs. This is where the experience of the CBD in relation to development and monitoring of achieving the 2010 targets could be of help for the MDG processes. Countries should understand that the indicators adopted through the MDGs at the global level are only for providing guidance and it is important for them to develop their own national and local indicators for measuring impacts as well as progress.
9.2 Supporting better implementation of MEAs to achieving MDGs
The Millennium Ecosystem Assessment (MEA, 2005) indicated the impacts of development on environment and cautions countries on ways forward. Clear experiences are available around the world to demonstrate the fact that better implementation of multilateral environmental agreements will provide the needed impetus to achieve several targets of the MDGs. Better implementation of MEAs as well as compliance mechanisms that are rationale and monitoring of the environment on a regular basis will be important for countries to ensure better progress towards sustainable development.
It would be useful to establish an inter-agency task force that comprises of representatives of MEA secretariats
and development agencies to provide guidance for countries to link environmental management plans with development plans.
9.3 Local actions to achieving MDGs
Experience has shown that unless there is public understanding and awareness of the impact of development planning on local livelihood securities, little can be achieved at national and/or global levels. There is a need to ensure that local actions for achieving MDGs be clearly identifiedat the country levelto make sure that realising the MDGs is not the mandate of UN agencies or Ministries of Planning but the stakeholders at large.
Local actions also provide the needed platform for countries to experiment with synergistic action that drives integration of development and conservation planning.
9. Way Forward
27
ReferencesAdams, William M. et. Al. (2004). Biodiversity
Conservation and the Eradication of Poverty, Science, vol. 306, 12 November 2004, 1146-1149.
Agrawal, Arun and Kent Redford (2005). Poverty Alleviation and Biodiversity conservation: Shooting in the Dark, unpublished paper.
Attaran, Amir (2005). An Immeasurable Crisis? A Criticism of the Millennium Development Goals and Why they cannot be measured, PloS Medicine 2(10):e318.
Attaran, Amir (2005). MDGs must not be political playthings for world leaders, SciDev.Net, 14 September 2005.
Balakrishna Pisupati and Emilie Warner (2003). Biodiversity and the Millennium Development Goals. IUCN Regional Biodiversity Programme, Asia and UNDP.
Balakrishna Pisupati (2004). Synergies between Conventions: An Assessment. IUCN Regional Biodiversity Programme, Asia.
Balakrishna Pisupati (2005). Sustainable Development Strategies: Towards Better Integration. Agorra Foundation, Colombo.
Balmford, Andrew et al. (2005a). The Convention on Biological Diversitys 2010 Target, Science, vol 307, 14 January 2005.
Balmford, Andrew et al. (2005b). The 2010 challenge: data availability, information needs and extraterrestrial insights, Philosophical Transactions Royal Society (2005) 360, 221-228.
Buckland, S. T. (2005). Monitoring change in biodiversity through composite indices, Philosophical Transactions Royal Society (2005) 360, 243-254.
Butchart, S.H.M et. Al (2005). Using Red List Indices to measure progress towards the 2010 target and beyond, Philosophical Transactions Royal Society (2005) 360, 255-268.
Chape, S. (2005). Measuring the extent and effectiveness of protected areas as an indicators for meeting global biodiversity targets, Philosophical Transactions Royal Society (2005) 360, 443-455.
Conway, Gordon (2003). The Paradoxes of Integrated Development, Keynote address at the ECOSOC Brainstorming Dialogue Sessions: Promoting an integrated approach to rural development in developing countries for poverty eradication and sustainable development, UN Headquarters, New York, 24 March 2003.
Deda, Paola and Renata Rubian (2004). Women and biodiversity: The long journey from users to policy-makers, Natural Resources Forum 28 (2004).
Dobson, Andy (2005). Monitoring global rates of biodiversity change: the Convention on Biological Diversity (CBD) 2010 goals, Philosophical Transactions Royal Society (2005) 360, 229-241.
Heer, M. de (2005). Biodiversity trends in Europe: development and testing of a species trend indicator for evaluating progress towards the 2010 target, Philosophical Transactions Royal Society (2005) 360, 297-308.
IISD (2005). A summary report of the Poverty-Environment Partnership Events, Environment for the MDGs Bulletin, vol. 114, no.1, Monday, 19 September 2005. Available online at http://www.iisd.ca/sd/pei.
Jahan, Selim and Alvaro Umana (2003). The Environment-poverty nexus, Development Policy Journal, March 2003, vol:3, pp.53-70.
Jolly, R. (2003). Global Goalsthe UN experience. Backgorund paper for HDR 2003. Occasional Paper, January 3, 2003.
Koziell, Izabella and Charles McNeill (2003). Reducing Poverty by Using Biodiversity Sustainably, Development Policy Journal, March 2003, vol:3, pp.71-80.
Koziell, Izabella and Ian R. Swingland (2002). Collateral biodiversity benefits associated with free-market approaches to sustainable land use and forestry activities, Philosophical Transactions Royal Society (2002) 360, 1807-1816.
Mace, Georgina M. (2005). An Index of Intactness, Nature, vol. 434, 3 March 2005.
Marchisio, Matteo (2005). Environmental considerations in achieving the Millennium Development Goals, UNDP-BDP/EEG, New York.
McArthur, J., Jeffrey Sachs and Guido Schmidt-Traub (2005). Millenium Development Goals not doomed to fail, SciDev.Net, 13 September 2005.
Millennium Ecosystem Assessment (MA) (2005). Ecosystem and Human Well-Being: Synthesis. Washington, D.C: MA.
Pearce, David (2005). Managing Environmental Wealth for Poverty Reduction, Poverty and Environment Partnership MDG7 InitiativeEconomics, July 2005.
Sala, Osvaldo E. et al. (2000). Global Biodiversity Scenarios for the Year 2100, Science, vol 287, 10 March 2000.
Scherr, Sara J. (2003). Hunger, Poverty and Biodiversity in Developing Countries, A paper for the Mexico Action Summit, Mexico City, Mexico, June 2-3, 2003.

28
Scholes, R. J. and R. Biggs (2005). A biodiversity intactness index, Nature, vol. 434, March 2005.
Suderlin, William D., et al. (2005). Livelihoods, Forests, and Conservation in Developing Countries: An Overview, World Development, vol.33, no.9, pp.1383-1402.
UN (2008). The Millennium Development Goals Report, United Nations, New York.
UN (2005). The Millennium Development Goals Report, 2005. United Nations, New York.
UNDP (2005). Environmental Sustainability in 100 Millennium Development Goals Country Reports, New York.
UNDP (2004). Millennium Development Goal 7 Summary Review: 67 Country MDG Reports, New York.
UNDP (2004). Practice Note: Monitoring Country Progress toward MDG-7: Ensuring Environmental Sustainability, UNDP-BDP/EEG, New York.
UNDP (2003). Human Development ReportMillennium Development Goals: A Compact among Nations to end Human Poverty, Oxford University Press, Oxford.
UNDP, UNEP, IIED, IUCN and WRI (2005a). Assessing Environments Contribution to Poverty Reduction, Environment for the MDGs. Prepared on behalf of the Poverty-Environment Partnership, September 2005.
UNDP, UNEP, IIED, IUCN and WRI (2005b). Sustaining the Environment to Fight Poverty and Achieve the MDGs, Environment for the MDGs. Prepared on behalf of the Poverty-Environment Partnership, September 2005.
UNEP, (2005a). Implementation of the Convention and the Strategic Plan and Progress Towards the 2010 Target, UNEP/CBD/WG-RI/1/2, Ad-Hoc Open-Ended Working Group on Review of Implementation of the Convention, First Meeting, Montreal, 5-9 September 2005.
UNEP, (2005b). Implications of the Findings of the Millennium Ecosystem Assessment for the Future Work of the Convention, UNEP/CBD/SBSTTA/11/7, Subsidiary Body on Scientific, Technical and Technological Advice, Eleventh Meeting, Montreal, 28 November to 2 December 2005.
UNEP, (2005c). Implications of the Findings of the Millennium Ecosystem Assessment for the Future Work of the Convention, Addendum, Summary for Decision Makers of the Biodiversity Synthesis Report, UNEP/CBD/SBSTTA/11/7/Add.1, Subsidiary Body on Scientific, Technical and Technological Advice, Eleventh Meeting, Montreal, 28 November to 2 December 2005.
UNEP, (2005d). Mainstreaming Environment beyond MDG-7, High Level Workshop, 13-14 July 2005, Discussion Paper, United Nations Environment Programme, Division of Environmental Conventions.
United Nations (2002). The United Nations and the MDGs: a Core Strategy. United Nations: New York.
Watson, Robert T. (2005). Turning science into policy: challenges and experiences from the science-policy interface, Philosophical Transactions Royal Society (2005) 360, 471-477.
World Bank (2002). The Environment and the Millennium Development Goal, The World Bank, Washington D.C.
World Resources Institute (WRI) in collaboration with the United nations Development Programme, United Nations Environment Programme, and World Bank (2005). World Resources 2005: The Wealth of the PoorManaging ecosystems to Fight Poverty. Washington, DC: WRI.
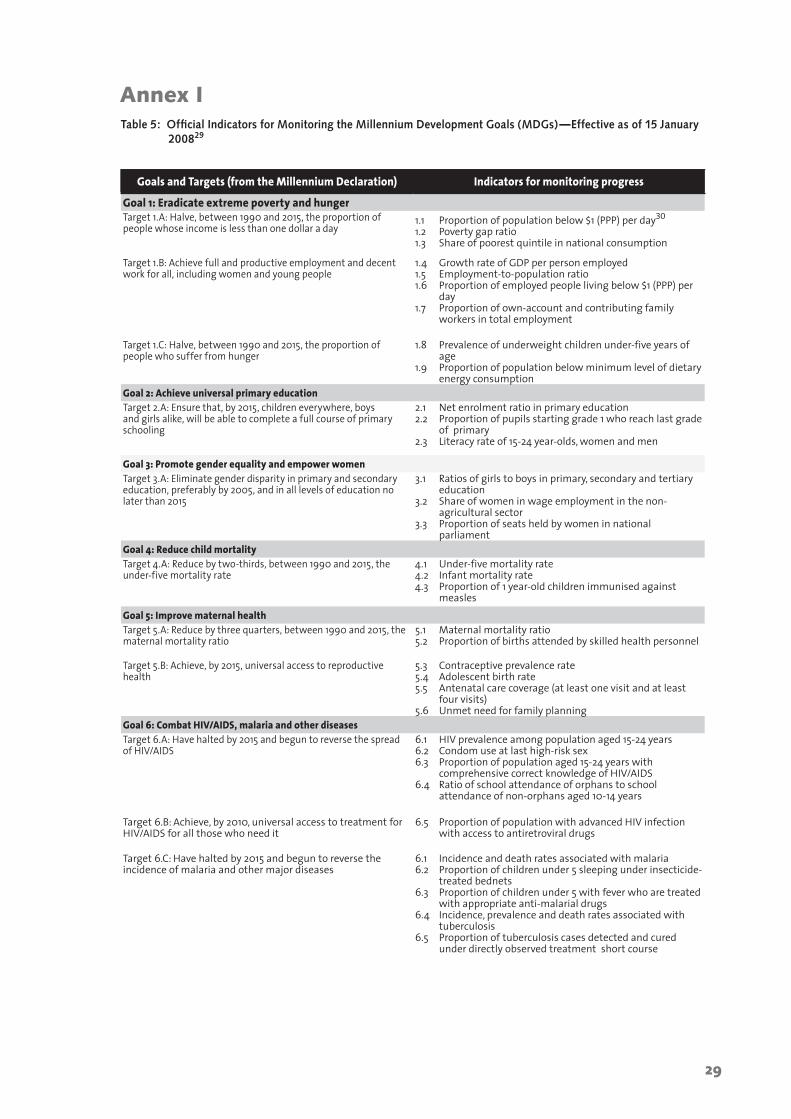
29
Table 5: Official Indicators for Monitoring the Millennium Development Goals (MDGs)Effective as of 15 January 200829
Goals and Targets (from the Millennium Declaration) Indicators for monitoring progress
Goal 1: Eradicate extreme poverty and hungerTarget 1.A: Halve, between 1990 and 2015, the proportion of people whose income is less than one dollar a day
1.1 Proportion of population below $1 (PPP) per day30
1.2 Poverty gap ratio 1.3 Share of poorest quintile in national consumption
Target 1.B: Achieve full and productive employment and decent work for all, including women and young people
1.4 Growth rate of GDP per person employed1.5 Employment-to-population ratio1.6 Proportion of employed people living below $1 (PPP) per
day1.7 Proportion of own-account and contributing family
workers in total employment
Target 1.C: Halve, between 1990 and 2015, the proportion of people who suffer from hunger
1.8 Prevalence of underweight children under-five years of age
1.9 Proportion of population below minimum level of dietary energy consumption
Goal 2: Achieve universal primary educationTarget 2.A: Ensure that, by 2015, children everywhere, boys and girls alike, will be able to complete a full course of primary schooling
2.1 Net enrolment ratio in primary education2.2 Proportion of pupils starting grade 1 who reach last grade
of primary 2.3 Literacy rate of 15-24 year-olds, women and men
Goal 3: Promote gender equality and empower womenTarget 3.A: Eliminate gender disparity in primary and secondary education, preferably by 2005, and in all levels of education no later than 2015
3.1 Ratios of girls to boys in primary, secondary and tertiary education
3.2 Share of women in wage employment in the non-agricultural sector
3.3 Proportion of seats held by women in national parliament
Goal 4: Reduce child mortality Target 4.A: Reduce by two-thirds, between 1990 and 2015, the under-five mortality rate
4.1 Under-five mortality rate4.2 Infant mortality rate4.3 Proportion of 1 year-old children immunised against
measlesGoal 5: Improve maternal health Target 5.A: Reduce by three quarters, between 1990 and 2015, the maternal mortality ratio
5.1 Maternal mortality ratio5.2 Proportion of births attended by skilled health personnel
Target 5.B: Achieve, by 2015, universal access to reproductive health
5.3 Contraceptive prevalence rate 5.4 Adolescent birth rate5.5 Antenatal care coverage (at least one visit and at least
four visits)5.6 Unmet need for family planning
Goal 6: Combat HIV/AIDS, malaria and other diseasesTarget 6.A: Have halted by 2015 and begun to reverse the spread of HIV/AIDS
6.1 HIV prevalence among population aged 15-24 years 6.2 Condom use at last high-risk sex6.3 Proportion of population aged 15-24 years with
comprehensive correct knowledge of HIV/AIDS6.4 Ratio of school attendance of orphans to school
attendance of non-orphans aged 10-14 years
Target 6.B: Achieve, by 2010, universal access to treatment for HIV/AIDS for all those who need it
6.5 Proportion of population with advanced HIV infection with access to antiretroviral drugs
Target 6.C: Have halted by 2015 and begun to reverse the incidence of malaria and other major diseases
Incidence and death rates associated with malaria6.1 Proportion of children under 5 sleeping under insecticide-6.2 treated bednetsProportion of children under 5 with fever who are treated 6.3 with appropriate anti-malarial drugsIncidence, prevalence and death rates associated with 6.4 tuberculosisProportion of tuberculosis cases detected and cured 6.5 under directly observed treatment short course
Annex I

30
Goals and Targets (from the Millennium Declaration) Indicators for monitoring progress
Goal 7: Ensure environmental sustainabilityTarget 7.A: Integrate the principles of sustainable development into country policies and programmes and reverse the loss of environmental resources Target 7.B: Reduce biodiversity loss, achieving, by 2010, a significant reduction in the rate of loss
7.1 Proportion of land area covered by forest7.2 CO2 emissions, total, per capita and per $1 GDP (PPP)7.3 Consumption of ozone-depleting substances7.4 Proportion of fish stocks within safe biological limits7.5 Proportion of total water resources used 7.6 Proportion of terrestrial and marine areas protected7.7 Proportion of species threatened with extinction
Target 7.C: Halve, by 2015, the proportion of people without sustainable access to safe drinking water and basic sanitation
7.8 Proportion of population using an improved drinking water source
7.9 Proportion of population using an improved sanitation facility
Target 7.D: By 2020, to have achieved a significant improvement in the lives of at least 100 million slum dwellers
7.10 Proportion of urban population living in slums31
Goal 8: Develop a global partnership for developmentTarget 8.A: Develop further an open, rule-based, predictable, non-discriminatory trading and financial system
Includes a commitment to good governance, development and poverty reductionboth nationally and internationally
Target 8.B: Address the special needs of the least developed countries
Includes: tariff and quota free access for the least developed countries exports; enhanced programme of debt relief for heavily indebted poor countries (HIPC) and cancellation of official bilateral debt; and more generous ODA for countries committed to poverty reduction
Target 8.C: Address the special needs of landlocked developing countries and small island developing States (through the Programme of Action for the Sustainable Development of Small Island Developing States and the outcome of the twenty-second special session of the General Assembly)
Target 8.D: Deal comprehensively with the debt problems of developing countries through national and international measures in order to make debt sustainable in the long term
Some of the indicators listed below are monitored separately for the least developed countries (LDCs), Africa, landlocked developing countries and small island developing States.
Official development assistance (ODA)Net ODA, total and to the least developed countries, as 8.1 percentage of OECD/DAC donors gross national incomeProportion of total bilateral, sector-allocable ODA 8.2 of OECD/DAC donors to basic social services (basic education, primary health care, nutrition, safe water and sanitation)Proportion of bilateral official development assistance of 8.3 OECD/DAC donors that is untiedODA received in landlocked developing countries as a 8.4 proportion of their gross national incomesODA received in small island developing States as a 8.5 proportion of their gross national incomes
Market accessProportion of total developed country imports (by value 8.6 and excluding arms) from developing countries and least developed countries, admitted free of dutyAverage tariffs imposed by developed countries on 8.7 agricultural products and textiles and clothing from developing countriesAgricultural support estimate for OECD countries as a 8.8 percentage of their gross domestic productProportion of ODA provided to help build trade capacity8.9
Debt sustainabilityTotal number of countries that have reached their HIPC 8.10 decision points and number that have reached their HIPC completion points (cumulative)Debt relief committed under HIPC and MDRI Initiatives8.11 Debt service as a percentage of exports of goods and 8.12 services
Target 8.E: In cooperation with pharmaceutical companies, provide access to affordable essential drugs in developing countries
Proportion of population with access to affordable 8.13 essential drugs on a sustainable basis
Target 8.F: In cooperation with the private sector, make available the benefits of new technologies, especially information and communications
Telephone lines per 100 population 8.14 Cellular subscribers per 100 population8.15 Internet users per 100 population8.16
The Millennium Development Goals and targets come from the Millennium Declaration, signed by 189 countries, including 147 heads of State and Government, in September 2000 (http://www.un.org/millennium/declaration/ares552e.htm) and from further agreement by member states at the 2005 World Summit (Resolution adopted by the General Assembly - A/RES/60/1, http://www.un.org/Docs/journal/asp/ws.asp?m=A/RES/60/1). The goals and targets are interrelated and should be seen as a whole. They represent a partnership between the developed countries and the developing countries to create an environmentat the national and global levels alike which is conducive to development and the elimination of poverty.
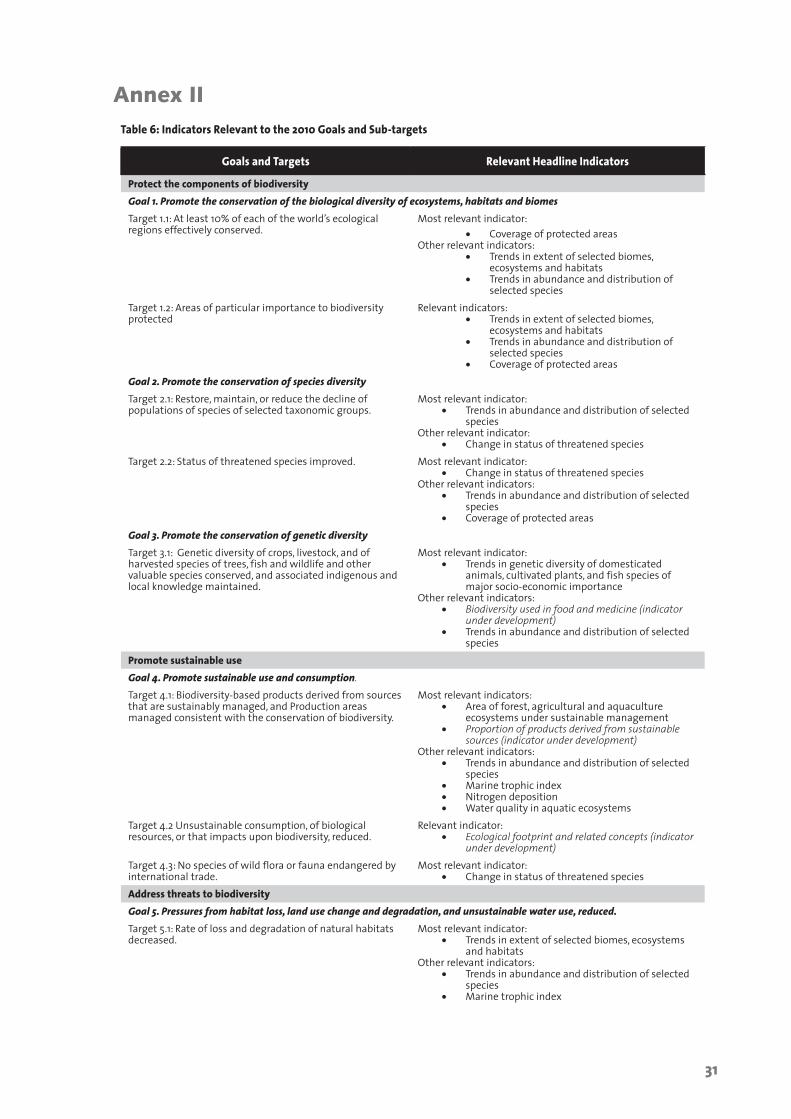
31
Table 6: Indicators Relevant to the 2010 Goals and Sub-targets
Goals and Targets Relevant Headline Indicators
Protect the components of biodiversityGoal 1. Promote the conservation of the biological diversity of ecosystems, habitats and biomesTarget 1.1: At least 10% of each of the worlds ecological regions effectively conserved.
Most relevant indicator:Coverage of protected areas•
Other relevant indicators:Trends in extent of selected biomes, •ecosystems and habitatsTrends in abundance and distribution of •selected species
Target 1.2: Areas of particular importance to biodiversity protected
Relevant indicators:Trends in extent of selected biomes, •ecosystems and habitatsTrends in abundance and distribution of •selected species Coverage of protected areas•
Goal 2. Promote the conservation of species diversityTarget 2.1: Restore, maintain, or reduce the decline of populations of species of selected taxonomic groups.
Most relevant indicator:Trends in abundance and distribution of selected •species
Other relevant indicator:Change in status of threatened species•
Target 2.2: Status of threatened species improved. Most relevant indicator:Change in status of threatened species•
Other relevant indicators:Trends in abundance and distribution of selected •speciesCoverage of protected areas•
Goal 3. Promote the conservation of genetic diversityTarget 3.1: Genetic diversity of crops, livestock, and of harvested species of trees, fish and wildlife and other valuable species conserved, and associated indigenous and local knowledge maintained.
Most relevant indicator:Trends in genetic diversity of domesticated •animals, cultivated plants, and fish species of major socio-economic importance
Other relevant indicators:Biodiversity used in food and medicine• (indicator under development)Trends in abundance and distribution of selected •species
Promote sustainable useGoal 4. Promote sustainable use and consumption.Target 4.1: Biodiversity-based products derived from sources that are sustainably managed, and Production areas managed consistent with the conservation of biodiversity.
Most relevant indicators:Area of forest, agricultural and aquaculture •ecosystems under sustainable management Proportion of products derived from sustainable •sources (indicator under development)
Other relevant indicators:Trends in abundance and distribution of selected •speciesMarine trophic index•Nitrogen deposition•Water quality in aquatic ecosystems•
Target 4.2 Unsustainable consumption, of biological resources, or that impacts upon biodiversity, reduced.
Relevant indicator:Ecological footprint and related concepts (indicator •under development)
Target 4.3: No species of wild flora or fauna endangered by international trade.
Most relevant indicator:Change in status of threatened species•
Address threats to biodiversityGoal 5. Pressures from habitat loss, land use change and degradation, and unsustainable water use, reduced.Target 5.1: Rate of loss and degradation of natural habitats decreased.
Most relevant indicator:Trends in extent of selected biomes, ecosystems •and habitats
Other relevant indicators:Trends in abundance and distribution of selected •speciesMarine trophic index•
Annex II

32
Goals and Targets Relevant Headline Indicators
Goal 6. Control threats from invasive alien speciesTarget 6.1: Pathways for major potential alien invasive species controlled.
Relevant indicator:Trends in invasive alien species•
Target 6. 2: Management plans in place for major alien species that threaten ecosystems, habitats or species.
Relevant indicator:Trends in invasive alien species•
Goal 7. Address challenges to biodiversity from climate change, and pollutionTarget 7.1: Maintain and enhance resilience of the components of biodiversity to adapt to climate change.
Relevant indicator:Connectivity/fragmentation of ecosystems•
Target 7.2: Reduce pollution and its impacts on biodiversity. Nitrogen depositionWater quality in aquatic ecosystems
Maintain goods and services from biodiversity to support human well-beingGoal 8. Maintain capacity of ecosystems to deliver goods and services and support livelihoodsTarget 8.1: Capacity of ecosystems to deliver goods and services maintained.
Relevant indicators:Biodiversity used in food and medicine (indicator •under development)Water quality in aquatic ecosystems•Marine trophic index•
Target 8.2: biological resources that support sustainable livelihoods, local food security and health care, especially of poor people maintained.
Most relevant indicator:Health and well-being of communities who •depend directly on local ecosystem goods and services
Other relevant indicator:Biodiversity used in food and medicine•
Protect traditional knowledge, innovations and practicesGoal 9 Maintain socio-cultural diversity of indigenous and local communitiesTarget 9.1 Protect traditional knowledge, innovations and practices.
Most relevant indicator:Status and trends of linguistic diversity and •numbers of speakers of indigenous languages
Other relevant indicator:Additional indicators to be developed•
Target 9.2: Protect the rights of indigenous and local communities over their traditional knowledge, innovations and practices, including their rights to benefit-sharing.
Indicator to be developed
Ensure the fair and equitable sharing of benefits arising out of the use of genetic resourcesGoal 10. Ensure the fair and equitable sharing of benefits arising out of the use of genetic resourcesTarget 10.1: All transfers of genetic resources are in line with the Convention on Biological Diversity, the International Treaty on Plant Genetic Resources for Food and Agriculture and other applicable agreements.
Indicator to be developed
Target 10.2: Benefits arising from the commercial and other utilization of genetic resources shared with the countries providing such resources.
Indicator to be developed
Ensure provision of adequate resourcesGoal 11: Parties have improved financial, human, scientific, technical and technological capacity to implement the ConventionTarget 11.1: New and additional financial resources are transferred to developing country Parties, to allow for the effective implementation of their commitments under the Convention, in accordance with Article 20.
Most relevant indicator:Official development assistance provided in •support of the Convention
Target 11.2: Technology is transferred to developing country Parties, to allow for the effective implementation of their commitments under the Convention, in accordance with its Article 20, paragraph.
Indicator to be developed
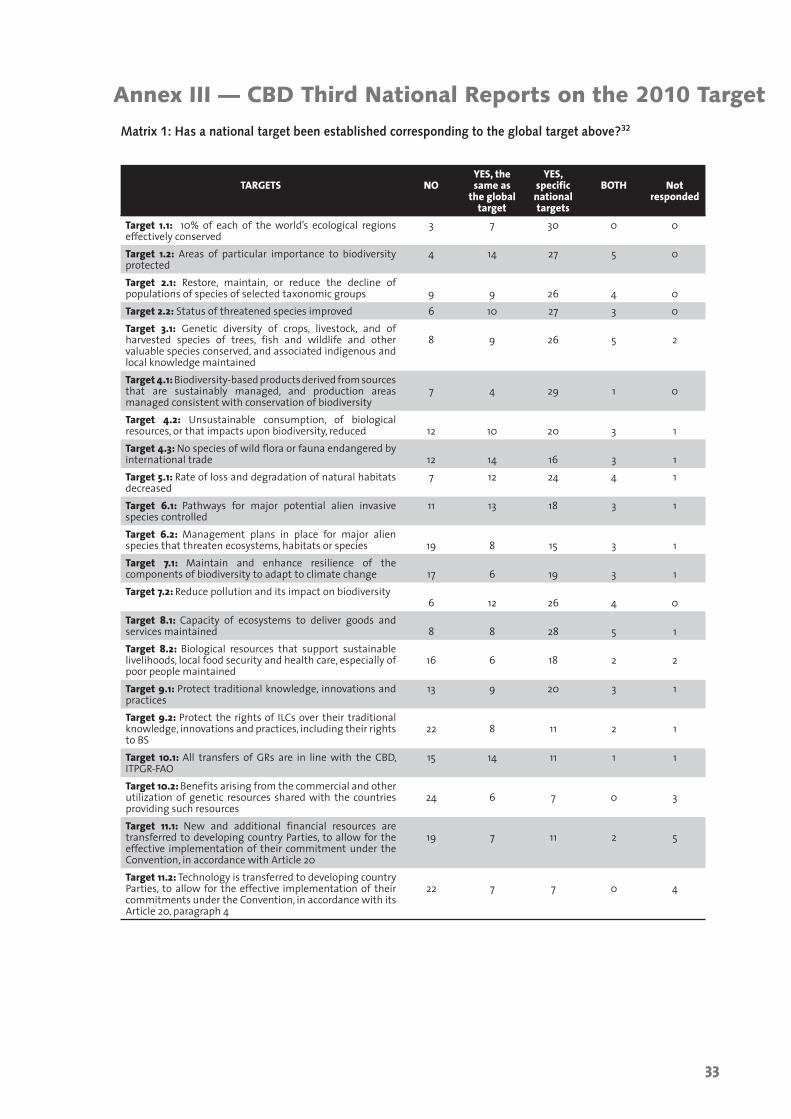
33
Matrix 1: Has a national target been established corresponding to the global target above?32
TARGETS NOYES, the same as
the global target
YES, specific national targets
BOTH Not responded
Target 1.1: 10% of each of the worlds ecological regions effectively conserved
3 7 30 0 0
Target 1.2: Areas of particular importance to biodiversity protected
4 14 27 5 0
Target 2.1: Restore, maintain, or reduce the decline of populations of species of selected taxonomic groups 9 9 26 4 0Target 2.2: Status of threatened species improved 6 10 27 3 0Target 3.1: Genetic diversity of crops, livestock, and of harvested species of trees, fish and wildlife and other valuable species conserved, and associated indigenous and local knowledge maintained
8 9 26 5 2
Target 4.1: Biodiversity-based products derived from sources that are sustainably managed, and production areas managed consistent with conservation of biodiversity
7 4 29 1 0
Target 4.2: Unsustainable consumption, of biological resources, or that impacts upon biodiversity, reduced 12 10 20 3 1Target 4.3: No species of wild flora or fauna endangered by international trade 12 14 16 3 1Target 5.1: Rate of loss and degradation of natural habitats decreased
7 12 24 4 1
Target 6.1: Pathways for major potential alien invasive species controlled
11 13 18 3 1
Target 6.2: Management plans in place for major alien species that threaten ecosystems, habitats or species 19 8 15 3 1Target 7.1: Maintain and enhance resilience of the components of biodiversity to adapt to climate change 17 6 19 3 1Target 7.2: Reduce pollution and its impact on biodiversity
6 12 26 4 0Target 8.1: Capacity of ecosystems to deliver goods and services maintained 8 8 28 5 1Target 8.2: Biological resources that support sustainable livelihoods, local food security and health care, especially of poor people maintained
16 6 18 2 2
Target 9.1: Protect traditional knowledge, innovations and practices
13 9 20 3 1
Target 9.2: Protect the rights of ILCs over their traditional knowledge, innovations and practices, including their rights to BS
22 8 11 2 1
Target 10.1: All transfers of GRs are in line with the CBD, ITPGR-FAO
15 14 11 1 1
Target 10.2: Benefits arising from the commercial and other utilization of genetic resources shared with the countries providing such resources
24 6 7 0 3
Target 11.1: New and additional financial resources are transferred to developing country Parties, to allow for the effective implementation of their commitment under the Convention, in accordance with Article 20
19 7 11 2 5
Target 11.2: Technology is transferred to developing country Parties, to allow for the effective implementation of their commitments under the Convention, in accordance with its Article 20, paragraph 4
22 7 7 0 4
Annex III — CBD Third National Reports on the 2010 Target
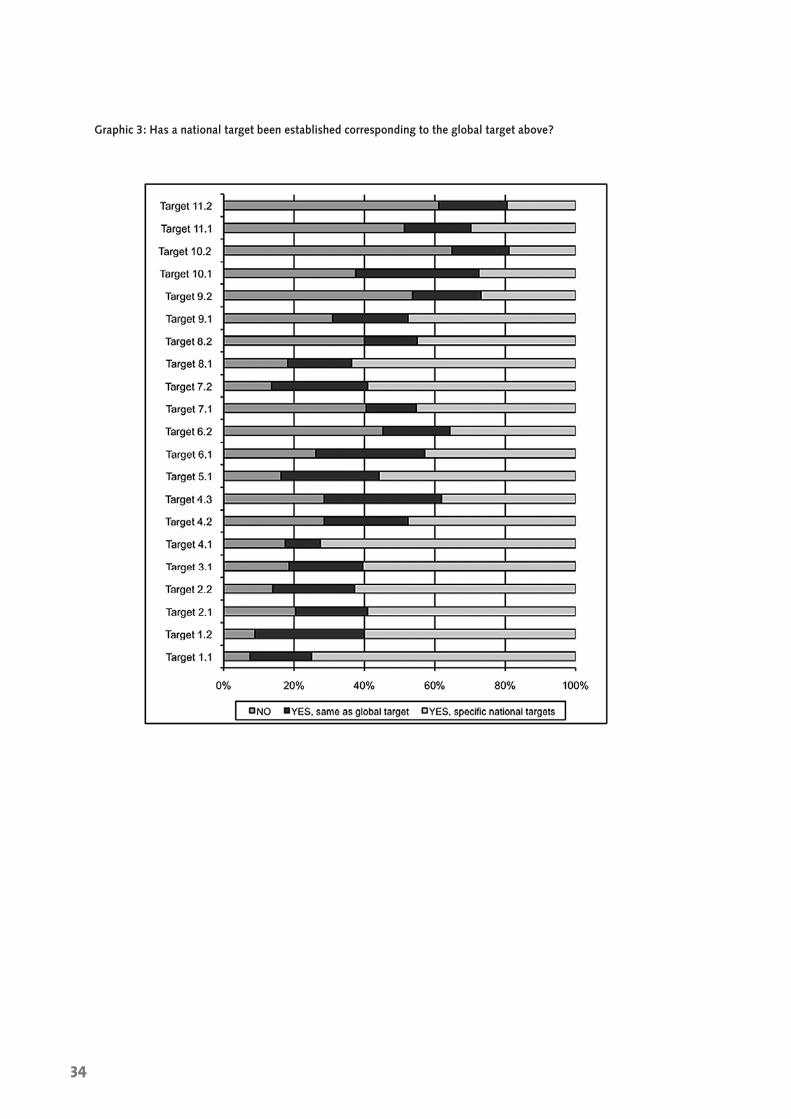
34
Graphic 3: Has a national target been established corresponding to the global target above?
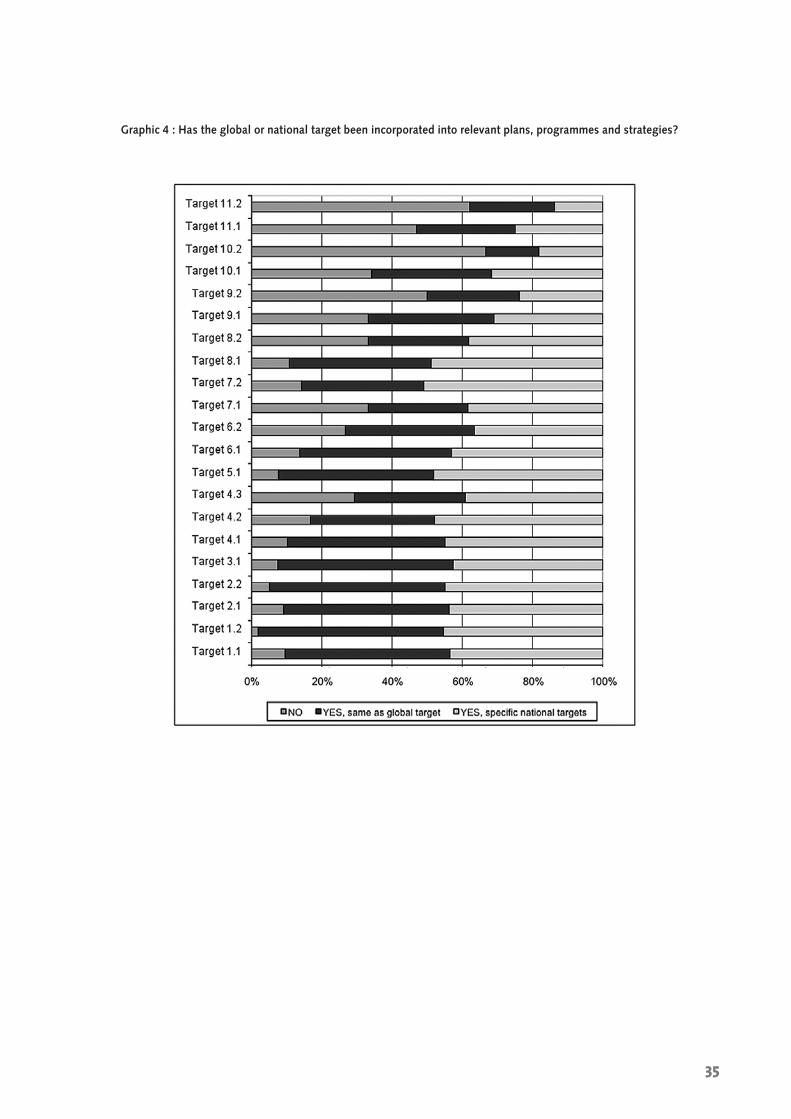
35
Graphic 4 : Has the global or national target been incorporated into relevant plans, programmes and strategies?
36
The United Nations University Institute of Advanced Studies (UNU-IAS) is a global think tank whose mission is “to advance knowledge and promote learning for policy-making to meet the challenges of sustainable development.” UNU-IAS undertakes research and postgraduate education to identify and address strategic issues of concern for all humankind, for governments, decision makers and, particularly, for developing countries.
The Institute convenes expertise from disciplines such as economics, law, social and natural sciences to better understand and contribute creative solutions to pressing global concerns, with research focused on the following areas:
• Biodiplomacy• Sustainable Development Governance• Science Policy for Sustainable Development• Education for Sustainable Development• Ecosystems and People• Urban Futures• Global Marine Governance• Traditional Knowledge
![Diva Rivalry for Fun and Profit: An Examination of Diva [Mis-] Conceptions via the Rivalry of Maria Callas and Renata Tebaldi](https://static.fdokumen.com/doc/165x107/631a5fdbd43f4e1763046af6/diva-rivalry-for-fun-and-profit-an-examination-of-diva-mis-conceptions-via-the.jpg)