Combined analysis of different logs in quantification of ...
Upload
independentCategory
view
3download
0
Use of Native Plants and Coir Fiber Logs for Nitrogen Uptake in
Waimānalo Stream.
A THESIS SUBMITTED TO THE GRADUATE DIVISION OF THE UNIVERSITY OF HAWAI‘I IN PARTIAL FULFILLMENT OF THE
REQUIREMENTS FOR THE DEGREE OF
MASTER OF SCIENCE
IN
NATURAL RESOURCES AND ENVIRONMENTAL MANAGEMENT
MAY 2009
By Carolyn H. Unser
Thesis Committee:
Greg Bruland, Chairperson
Creighton Litton Traci Sylva

ii
We certify that we have read this thesis and that, in our opinion, it is satisfactory in scope
and quality as a thesis for the degree of Master of Science in Natural Resources and
Environmental Management.
THESIS COMMITTEE
_____________________________________
Chairperson
_____________________________________
_____________________________________

iii
Acknowledgements
I would like to express my sincere appreciation to my advisor, Dr. Greg Bruland,
for direction and guidance throughout this project, as well as, being a constant source of
positive feedback. I also thank Andrew Hood and Kristin Duin, of Sustainable Resources
Group International, Inc. (SRGII), for the opportunity to work with them on this project
and for their guidance and patience in the process. I would also like to express gratitude
to Dr. Creighton Litton and Dr. Traci Sylva for their service as committee members, and
their valuable input on the content and direction of this thesis.
A special thanks to Dr. Dennis Gonsalves, Norma Ross, and Dr. Russell Yost for
their role and support in inspiring me to pursue graduate school. Thanks to Roy Camara,
Pauline Chinn, Guy Porter, Meris Bantilan-Smith, Dana Ogle, Gwen DeMent, Chad
Browning, Christina Speed, Matthew Saunter, Ali‘i Garcia, Matthew Bauer, Peter and
Lisa Opert, Chad Durkin, Margot Chase, Leena Muller, and all the volunteers who have
helped with stream implementation.
I am grateful to Dr. Halina Zaleski for statistical guidance, Rick and Hui Ku
Maoli Ola nursery for their assistance with plants and logistics, Servillano Lamer for
mesocosm assistance and security, Dr. Travis Idol for access to weather station
information, and Pono Pacific, LLC, for their services.
I would like to recognize SRGII and the Hawai‘i Department of Health’s (DOH)
319(h) Clean Water Act Grant for funding this project. Although the research described
in this thesis has been funded by Hawai‘i’s DOH, it has not been subjected to any DOH
review and therefore does not necessarily reflect the views of the Department, and no
official endorsement should be inferred.

iv
Finally, I would like to thank my family and friends, especially my mom and dad,
and Kenny for their unconditional love and support.

v
Abstract
Many of Hawai‘i’s streams are currently on the State’s 303(d) list of impaired
water bodies for which levels of nutrients and suspended solids exceed that of
Environmental Protection Agency (EPA) allowable loads. Waimānalo Watershed,
located within the Ko’olaupoko region of Oahu, is listed as a top priority watershed for
restoration. The high nitrogen (N) concentration of surface waters was identified as a
priority concern for the middle reaches of both Waimānalo and Kahawai Stream, with N
concentrations being consistently greater in Kahawai Stream. This research investigates
best management practices (BMPs) that can be used to increase N accumulation from
surface water by riparian plants and to enhance stream structure and function.
Specifically, an innovative approach using native sedges planted in coconut fiber coir
logs was first studied in a controlled experimental mesocosm setting and then in a field
experiment with a large-scale installation of pre-planted coir logs along riparian zones of
Waimānalo and Kahawai Streams. While coir logs have been successfully employed in
continental streams for restoration purposes, they have not been used for streams in
Hawai‘i. Identification of appropriate species and the successful installation of pre-
planted coir logs along stream banks have the potential to accumulate N while protecting
plants from high flows for successful root anchoring into stream-bank substrate as the
logs degrade. The following species, Cladium jamaicense, Cyperus javanicus, Cyperus
laevigatus, and Cyperus polystachyos were tested in experimental mesocosms for their
ability to survive in coir log media with exposure to differing N concentrations. It was
hypothesized that the selected species would have significantly different tissue total
nitrogen (TN) concentrations, aboveground biomass, and TN accumulation rates because

vi
of habitat preference and physiological growth differences among species. A general
linear model (GLM) analysis of variance (ANOVA) revealed that species accounted for
the greatest proportion of variance in tissue TN concentration, aboveground biomass
growth, and accumulation rates. A post hoc test of means demonstrated that C.
jamaicense had substantially higher tissue TN concentration, aboveground biomass
growth, and accumulation rates than the other species under all N levels. It was also
hypothesized that tissue TN concentrations and biomass growth would increase in plants
exposed to elevated N levels. While the data from the mesocosm experiment did not
support this hypothesis, the data from the field installations partially supported the
hypothesis for C. jamaicense as tissue TN concentration, aboveground biomass growth,
and accumulation rates in Kahawai Stream were significantly higher than in Waimānalo
Stream. Results from this study suggest that those attempting to remediate impaired
Hawaiian streams should consider using pre-planted coir logs with native species that
produce abundant biomass and have the ability to store substantial TN in their tissues.

vii
Table of Contents Acknowledgements ............................................................................................................ iii Abstract ............................................................................................................................... v List of Tables ................................................................................................................... viii List of Figures .................................................................................................................... ix List of Abbreviations ........................................................................................................ xii Chapter 1: Introduction and Background ............................................................................ 1
Waimānalo Stream .......................................................................................................... 1 Riparian ecosystems ........................................................................................................ 7 Constructed Wetlands ..................................................................................................... 9 Phytoremediation .......................................................................................................... 10 Native Species ............................................................................................................... 12 Coconut Fiber Coir Logs ............................................................................................... 14 Objectives ...................................................................................................................... 14
Chapter 2: Planted Coir Log Nutrient Addition Experiment ............................................ 18 Introduction ................................................................................................................... 18 Objectives and Hypothesis ............................................................................................ 20 Materials and Methods .................................................................................................. 21 Statistical Analyses ....................................................................................................... 35 Results ........................................................................................................................... 36 Discussion and Conclusions .......................................................................................... 54
Chapter 3: Field Installation of Pre-Planted Coir Logs in Waimānalo Stream ................. 65 Introduction ................................................................................................................... 65 Objectives and Hypothesis ............................................................................................ 68 Materials and Methods .................................................................................................. 69 Statistical Analyses ....................................................................................................... 77 Results ........................................................................................................................... 78
Chapter 4: Discussion and Conclusions ............................................................................ 99 Appendix A. .................................................................................................................... 107 Appendix B. .................................................................................................................... 109 References ....................................................................................................................... 110

viii
List of Tables Table Page
2.1. List of species used for the experiment (in alphabetical order), the status groups to which these species belong, and other important traits. .................................................... 22
2.2. Mean water physiochemical characteristics in the mesocosms as recorded by the YSI probe during nutrient adjustment period January-February (n = 3). ................................. 29
2.3. Results from the combined GLM ANOVA testing mesocosm species tissue TN concentrations from December through May. .................................................................. 39
2.4. A comparison of mean tissue total N concentrations (percent ± standard deviation) in aboveground tissue for the four species over all sampling dates from all three N treatments. [(***) n = 1, (**) n = 2, (*) n = 3]. ............................................................... 43
2.5. Results from the combined GLM ANOVA testing mesocosm species aboveground biomass. ............................................................................................................................ 48
2.6. Total nitrogen accumulation rates (mean ± standard deviation) in June 2008 for different species and treatment mesocosms. The different letters represent the significant differences according to Waller-Duncan K-ratio t test (P<0.05) in the same species (n = 4, n = 3 for C. laevigatus, n = 2 for C. laevigatus in High). ............................................. 51
2.7. Results from the combined GLM ANOVA testing mesocosm species TN accumulation rates. ........................................................................................................... 52
3.1. Mean stream physiochemical characteristics of Kahawai and Waimānalo streams at locations upstream and downstream of remediation site from September 2007 through February 2009 (n = 15). .................................................................................................... 79
3.2. Mean concentration (mg L-1) of Total Nitrogen (TN) and Nitrate- + Nitrite-Nitrogen collected in Kahawai and Waimānalo Streams from September 2007 through February 2009, and compared with the State water quality standards* during the wet and dry season** and during storm event***. ............................................................................... 80
3.3. Results from the combined GLM ANOVA testing mesocosm species tissue TN concentration (%). ............................................................................................................. 83
3.4. Results from the combined GLM ANOVA testing mesocosm species tissue biomass growth (g DW m2). ........................................................................................................... 86
3.5. Results from the combined GLM ANOVA testing mesocosm species tissue TN accumulation rates (g TN m2 y-1). ..................................................................................... 89
A.1. Chemical composition of the Growmore © 10-8-22 Hydroponic Fertilizer hydroponic fertilizer used in the mesocosm experiment. ............................................... 109
ix
List of Figures
Figure Page
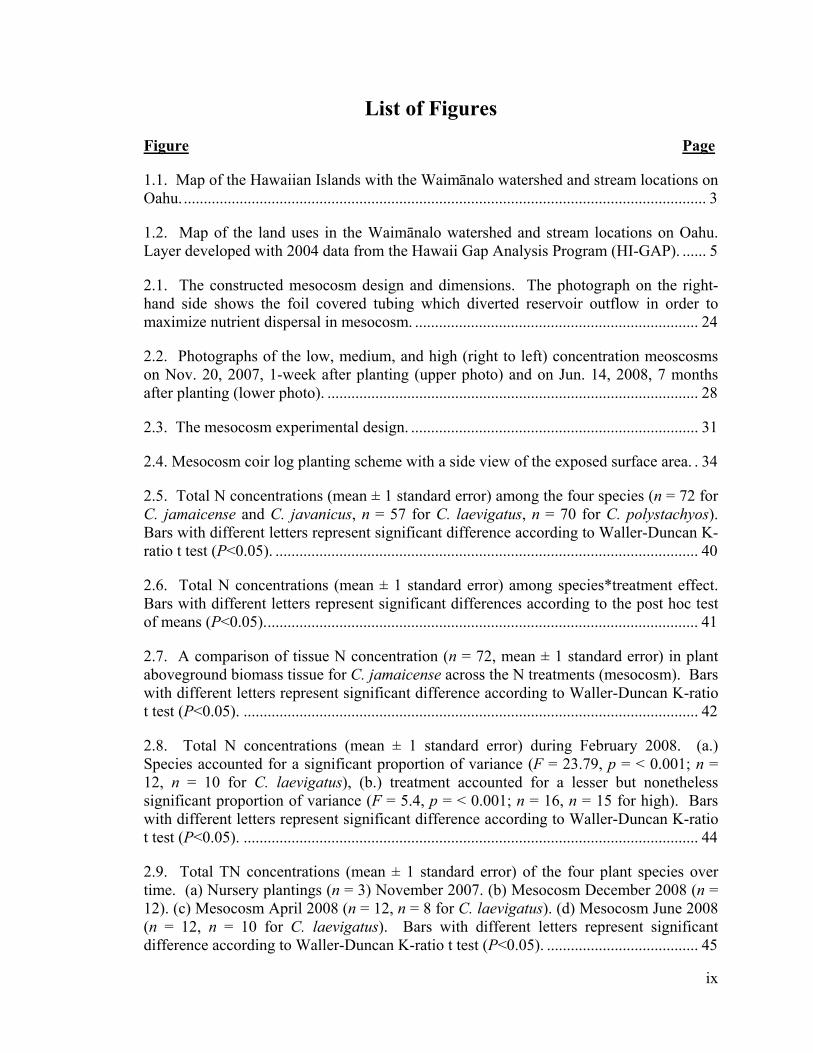
1.1. Map of the Hawaiian Islands with the Waimānalo watershed and stream locations on Oahu. ................................................................................................................................... 3
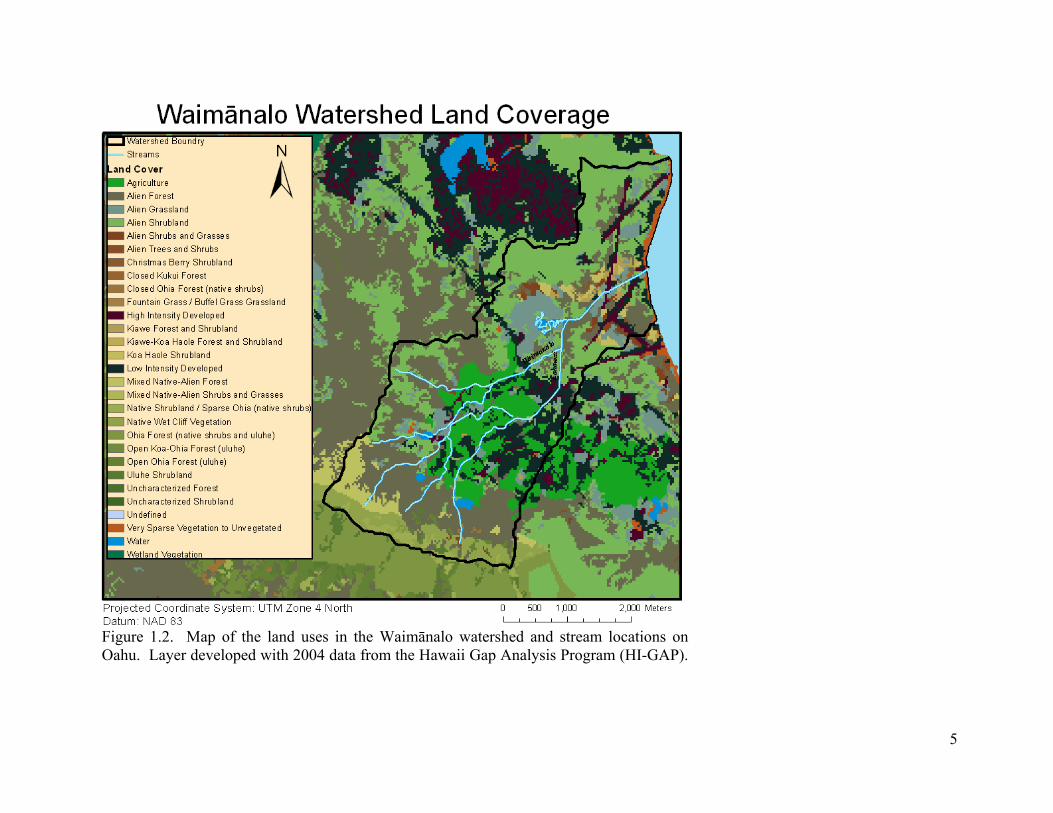
1.2. Map of the land uses in the Waimānalo watershed and stream locations on Oahu. Layer developed with 2004 data from the Hawaii Gap Analysis Program (HI-GAP). ...... 5
2.1. The constructed mesocosm design and dimensions. The photograph on the right-hand side shows the foil covered tubing which diverted reservoir outflow in order to maximize nutrient dispersal in mesocosm. ....................................................................... 24
2.2. Photographs of the low, medium, and high (right to left) concentration meoscosms on Nov. 20, 2007, 1-week after planting (upper photo) and on Jun. 14, 2008, 7 months after planting (lower photo). ............................................................................................. 28
2.3. The mesocosm experimental design. ........................................................................ 31
2.4. Mesocosm coir log planting scheme with a side view of the exposed surface area. . 34
2.5. Total N concentrations (mean ± 1 standard error) among the four species (n = 72 for C. jamaicense and C. javanicus, n = 57 for C. laevigatus, n = 70 for C. polystachyos). Bars with different letters represent significant difference according to Waller-Duncan K-ratio t test (P<0.05). .......................................................................................................... 40
2.6. Total N concentrations (mean ± 1 standard error) among species*treatment effect. Bars with different letters represent significant differences according to the post hoc test of means (P<0.05). ............................................................................................................ 41
2.7. A comparison of tissue N concentration (n = 72, mean ± 1 standard error) in plant aboveground biomass tissue for C. jamaicense across the N treatments (mesocosm). Bars with different letters represent significant difference according to Waller-Duncan K-ratio t test (P<0.05). .................................................................................................................. 42
2.8. Total N concentrations (mean ± 1 standard error) during February 2008. (a.) Species accounted for a significant proportion of variance (F = 23.79, p = < 0.001; n = 12, n = 10 for C. laevigatus), (b.) treatment accounted for a lesser but nonetheless significant proportion of variance (F = 5.4, p = < 0.001; n = 16, n = 15 for high). Bars with different letters represent significant difference according to Waller-Duncan K-ratio t test (P<0.05). .................................................................................................................. 44
2.9. Total TN concentrations (mean ± 1 standard error) of the four plant species over time. (a) Nursery plantings (n = 3) November 2007. (b) Mesocosm December 2008 (n = 12). (c) Mesocosm April 2008 (n = 12, n = 8 for C. laevigatus). (d) Mesocosm June 2008 (n = 12, n = 10 for C. laevigatus). Bars with different letters represent significant difference according to Waller-Duncan K-ratio t test (P<0.05). ...................................... 45

x
2.10. Mean aboveground biomass (mean ± 1 standard error) of the four plant species across the treatments (mesocosms) (n = 4). Bars with different letters represent significant differences according to the post hoc test of means (P<0.05). ....................... 49
2.11. Mean aboveground TN accumulation (mean ± 1 standard error) of the four plant species across the treatments (mesocosms) (n = 4, n = 3 for C. laevigatus). Bars with different letters represent significant differences according to the post hoc test of means (P<0.05). ........................................................................................................................... 53
2.12. Total aboveground biomass (mean ± 1 standard error) across the N addition treatments (n = 15). ........................................................................................................... 60
2.13. This photo illustrates the creeping rhizomatous growth of Cyperus laevigatus observed in some of the mesocoms. ................................................................................. 61
3.1. The Waimānalo Stream reach with coir log layout and experimental log placement............................................................................................................................................ 72
3.2. The Kahawai Stream reach with coir log layout and experimental log placement. . 73
3.3. Rainfall data during the December 2008 storm event. Data obtained from the National Weather Service (NWS) Waimānalo station (HI13). ......................................... 74
3.4. The experimental coir log layout after the December 28, 2008 flood event. ........... 75
3.5. Mean values of Total Nitrogen (TN), Total Dissolved Nitrogen (TDN), and Nitrate+Nitrite-Nitrogen (NO3
—N+NO2--N) from September 2007 through February
2009. Figure A shows results from the Waimānalo Stream section and Figure B shows Kahawai Stream section (n = 2, n = 1 for storm event). ................................................... 81
3.6. Mean total TN concentrations (percent ± 1 standard error) by species (n = 24, n = 16 for C. polystachyos). Bars with different letters represent significant difference according to Waller-Duncan K-ratio t test (P<0.05). ........................................................................ 84
3.7. Mean aboveground biomass (mean ± 1 standard error) of the three plant species. Bars with different letters represent significant differences according to Waller-Duncan K-ratio t test (P<0.05) (n = 24, n = 16 for C. polystachyos). ............................................ 87
3.8. Mean total N accumulation rates (mean ± 1 standard error) by species (n = 24, n = 16 for C. polystachyos). Bars with different letters represent significant difference according to Waller-Duncan K-ratio t test (P<0.05). ....................................................... 90

xi
3.9. Mean values of the three species (mean ±1 standard error) in the two stream sections. (a) Total nitrogen (TN) concentrations. (b)Aboveground biomass. (c) Total nitrogen (TN) accumulation rates. Bars with different letters represent significant differences according to the post hoc LSD test of means (P<0.05). (n = 8 in Waimānalo Stream; n = 16, n = 8 for C. polystachyos in Kahawai Stream) ........................................ 91
A.1. Total daily rainfall (mm) recorded from November 11, 2007 through June 22, 2008.......................................................................................................................................... 107
A.2. Mean daily temperate range (°C) recorded from November 11, 2007 through June 22, 2008........................................................................................................................... 107
A.3. Daily total solar radiation (W/m2) recorded from November 11, 2007 through June 22, 2008........................................................................................................................... 108
A.4. Daily mean relative humidity (%) recorded from November 11, 2007 through June 22, 2008........................................................................................................................... 108

xii
List of Abbreviations ADSC Agricultural Diagnostic Service Center ANOVA Analysis of Variance BMP Best Management Practice CW Constructed Wetland CWA Clean Water Act DOH Department of Health DIN Dissolved Inorganic Nitrogen EPA Environmental Protection Agency GLM General Linear Model LSD Lease Significant Difference MSAL Marine Science Analysis Laboratory N Nitrogen P Phosphorus TN Total Nitrogen TDN Total Dissolved Nitrogen TKN Total Kjeldahl Nitrogen TMDL Total Daily Maximum Load

1
Chapter 1: Introduction and Background
The presence of nutrients such as nitrogen (N) and phosphorus (P) are essential
for healthy surface waters. For example, waterways with adequate N and P support a
diverse assemblage of aquatic organisms such as algae, aquatic plants, insects and fish.
However, increases in the supply of N and P into waterways can promote deleterious
conditions in these ecosystems. One common result of nutrient enrichment is
eutrophication (Nixon 1995; Andersen, Schluter et al. 2006). Eutrophication often results
in a host of undesirable responses that degrade estuaries and coastal waters such as
increased algal production, reduced sunlight penetration into the water column, anoxia,
fish kills, and increased pathogens and toxins (Clement, Bricker et al. 2001; Laws and
Ferentinos 2003). On a global scale, nutrient and sediment pollution have contributed to
the decline of estuaries, seagrass beds, coastal wetlands, coral reefs, and other coastal
ecosystems (Vitousek, Aber et al. 1997; Laws and Ferentinos 2003; Bruland 2008).
Intact freshwater ecosystems, which are vital to human health and economies worldwide,
are rapidly diminishing as a consequence of human manipulations and the scale and
extent of these human impacts on freshwater systems have risen precipitously during the
last two decades (Abramovitz 1996; Vitousek, Mooney et al. 1997).
Waimānalo Stream
The Waimānalo Watershed, located in the Ko’olaupoko region of Eastern Oahu,
drains approximately 16 km2 area into Waimānalo Bay and onto a reef with submerged
margins (KBAC 2002). Waimānalo Stream is the primary drainage for the basin and the
watershed’s only true perennial stream, which stretches about 5.5 km in length. The

2
stream consists of two main tributaries: Kahawai Stream to the southeast and Waimānalo
Stream to the northwest, which merge roughly 0.5 km below the Kalaniana’ole Highway
(Harrigan and Burr 2001; KBAC 2002; Laws and Ferentinos 2003) (Figure 1.1). Unless
otherwise noted, the term “Waimānalo Stream” will include both Waimānalo and
Kahawai tributaries.
Waimānalo translates to potable, or sweet water in the native Hawaiian language
(Pukui and Elbert 1986). Unfortunately, in a recent report issued by the Hawai‘i State
Department of Health (DOH), Waimānalo Stream was described as an impaired, highly-
altered waterway that no longer functions as a natural stream as sediments and nutrients
from the watershed enter the stream at a rate faster than they can be assimilated (HIDOH
1998; Harrigan and Burr 2001; KBAC 2002; Laws and Roth 2004).
Waimānalo Stream was first listed as an impaired water body in Hawai‘i’s 1998
Clean Water Act (CWA) 303(d) List (HIDOH 1998; KBAC 2002). In a standard
response to the official priority listing, a Total Maximum Daily Load (TMDL)
assessment for Waimānalo Stream was conducted (Harrigan and Burr 2001). This
assessment was prepared by the U.S. Environmental Protection Agency (EPA) and DOH
to determine the maximum amount of pollutants that can enter Waimānalo Stream
without violating the State’s Water Quality Standards. The TMDL identified the reaches
of Waimānalo Stream where sediments and nutrients exceeded the stream’s capacity for
assimilation and recycling of pollutants. The largest concern in the TMDL was the need
for substantial reduction of nitrate (NO3-) loads in the middle segments of the watershed
(Harrigan and Burr 2001). Following this assessment, a report

3
Figure 1.1. Map of the Hawaiian Islands with the Waimānalo watershed and stream locations on Oahu.

4
for implementation recommendations was ordered (USEPA 2001). This implementation
report described in further detail Waimānalo Stream’s many problems, including poor
water quality, degraded habitat, and altered flow regimes. This report also identified
potential ways to reduce the inputs of pollutants to the stream and ways to improve the
stream’s ability to assimilate these pollutants. Since placement on the EPA’s 303(d) list
of impaired water bodies of Hawai‘i, both local residents and environmental groups have
recognized the need for restorative action to address point and nonpoint source pollutants
effecting the health of Waimānalo Stream.
Many factors have contributed to the degradation of Waimānalo Stream’s
ecosystem. Urban development and land-use changes over the last century have
drastically altered the stream’s waterways and landscapes resulting in a shift leading to
the degradation of natural ecosystem functions and processes (Laws, 2003; KBAC,
2002). The primary land use for the two tributaries includes a high proportion of
agriculture and intensified development along Kahawai Stream, whereas Waimānalo
Stream’s tributary mainly consists of some agriculture with the upper forested
conservation area (Figure 1.2). Past and present water quality data has been consistent
when showing Kahawai tributary to contain higher surface water N concentrations than
Waimānalo tributary (Laws and Ferentinos 2003)(Table 3-2). Modifications of
Waimānalo Stream habitat include the hardening of the stream channel bed, reduction of
riparian buffer zones to accommodate flood control, and increased run-off from urban
development (Laws and Ferentinos 2003; Laws and Roth 2004). Erosion of stream
banks, including the toe area, is one of the major contributors to sediment pollution in
streams and near shore marine waters of Hawai‘i (USEPA 2004) and Waimānalo Stream
5
Figure 1.2. Map of the land uses in the Waimānalo watershed and stream locations on Oahu. Layer developed with 2004 data from the Hawaii Gap Analysis Program (HI-GAP).

6
is no exception to this general trend (USEPA 1998). Other contributors of stream
pollution include surface runoff generated from agricultural and residential areas,
leaching of nutrients from fertilizers, cess pools, and animal wastes into the groundwater
and eventually into the stream systems. These pollutants are then transported
downstream where they are either deposited in or along streams, or in receiving marine
waters. Land-based sources of pollutants, such as sediment, nutrients, and heavy metals,
are one of several factors threatening the quality of coral reef ecosystems in Hawai`i
(USEPA 2001; USEPA 2004). Poor-quality lotic habitat with non-existent or degraded
riparian buffer zones generally exacerbate the negative effects of residual nutrient
concentrations by reducing riparian uptake of nutrients and diminishing filtration rates
(Sabater, Butturini et al. 2000; Laws and Roth 2004; Ghermandi, Vandenberghe et al.
2009). Management and continued monitoring of these pollutants is important for
sustaining Hawai‘i’s terrestrial and aquatic habitats, as well as ensuring the future of
healthy aquifers.
The practice of restoring degraded ecosystems draws on both the intellectual
framework of ecological theory and the application of the scientific method in restoration
ecology (Palmer, Falk et al. 2006). This project attempts to bridge the gap between
structural attributes that can be easily measured and ecosystem function (Zedler 2000).
Past demonstration projects at Waimānalo Stream have employed bioengineering
techniques for the protection of stream banks (HuiKuMaoliOla 2002). This project will
be guided by the State’s initiatives to implement BMPs, will build upon past remediation
efforts, and will utilize principles from constructed wetlands and phytoremediation for N
uptake. Successful establishment of vegetation in riparian areas can significantly

7
decrease sediment loads generated from these areas during storm flows (USEPA 2001).
Native plantings can potentially alien vegetation that decrease stream habitat quality and
often clogs channel ways (Laws and Ferentinos 2003). The use of coconut coir fiber logs
for stream toe protection will be expanded to include the development of pre-planted logs
to decrease the time that the vulnerable area of the stream banks are exposed to erosion
during a restoration project and speed up the establishment of native vegetation in the
riparian zone. Measurement of plant tissue N and biomass can provide a simple index of
N removal efficiency by restored wetlands (Reddy and DeLaune 2008). The effects of
nutrient application on tissue chemistry and biomass will be measured and compared
among species and across different sites
Riparian ecosystems
For purposes of this project, riparian ecosystem will be defined as follows:
A vegetated ecosystem along a water body through which energy,
materials, and water pass. Riparian areas characteristically have a high
water table and are subject to periodic flooding and influence from the
adjacent water body. These systems encompass wetlands, uplands, or
some combination of these two landforms. They will not in all cases have
all the characteristics necessary for them to be also classified as wetlands
(USEPA 2005).
The functions of wetlands and riparian areas include water quality improvement, stream
shading, organic matter supply, flood attenuation, shoreline stabilization, ground water
exchange, and habitat for aquatic, semi-aquatic, terrestrial, migratory, and rare species

8
(Sabater, Butturini et al. 2000; Brennan 2005; USEPA 2005). Ecologically-intact
riparian areas naturally retain and recycle nutrients, modify local microclimates, and
sustain broadly-based food webs that help support a diverse assemblage of fish and
wildlife (NRC 2002). In recent decades, the rates of urbanization and recreational
development along waterways have accelerated and greatly altered many of the nation’s
riparian areas (NRC 2002).
Riparian areas have been studied intensely in recent years because of their critical
functional relationships to stream and wetland ecosystems (Brennan 2005). Large-scale
studies by Likens (1970), Peterson (2001), and Bernhardt et al. (2002) showed that the
loss of wetlands and riparian areas have eliminated important natural N sinks where
much of the entering nitrate is consumed via denitrification. Both Sabater (2000) and
Ghermandi (2009) found, in studies looking at riparian vegetation removal, that
disturbances in small shaded streams have indirect effects on in-stream ecological
features that may lead to changes in stream nutrient retention efficiency. Restoration of
such areas and the construction of artificial wetlands have been shown to be effective at
reducing the transfer of N from agricultural land to adjacent waterways (Vitousek, Aber
et al. 1997). Riparian plantings often act as a sink for nutrients from agricultural field
runoff because they can accumulate some of the nutrients before they enter nearby
waterways (Pinay, Fabre et al. 1992). In Spain, a restored wetland treating agricultural
runoff showed that emergent macrophytes accumulated between 20 and 100 mg N
m−2d−1, which accounted for between 66-100% of the inflowing dissolved inorganic N
(Comín, Romero et al. 1997).
9
Constructed Wetlands
Constructed wetlands (CWs) are engineered systems that have been designed to
utilize the natural processes of wetland vegetation, soils, and their associated microbial
communities for hydrologic and water quality restoration and for mitigating wetland
habitat loss (Mitsch and Gosselink 2007; Vymazal 2007). Constructed wetlands have
become a widely-accepted and cost-efficient way to create a “natural” environment in
which to “clean” polluted waters. The principles and practices behind creating or
restoring a wetland are based on wetland science and ecological design/engineering
(Todd and Todd 1993; Mitsch and Gosselink 2007). Wetlands remove aquatic pollutants
through a variety of biological, physical, and chemical processes. When compared to
unplanted controls, the presence and type of plants in CWs made a significant difference
in the enhancement of N removal efficiency (Gersberg, Elkins et al. 1983; Gersberg,
Elkins et al. 1986; Tanner, Clayton et al. 1995a; Tanner, Clayton et al. 1995b; Bastviken
2006).
Ideally, CWs are designed to maximize removal of a specific pollutant or groups
of pollutants (Horne 2000). For this project, accumulation of N by plants is the primary
focus. In utilizing the concepts of CWs along the riparian banks of Waimānalo Stream,
the selection of species, design, installation method, and mitigation success become
important factors. A quantitative study of native phreatophytes1 for N assimilation will
improve the ability to select the most appropriate species for restoring riparian
ecosystems in Hawai‘i.
1Phreatophytes are plants whose roots are in direct contact with water in vadose zone.

10
Phytoremediation
Phytoremediation is the use of photoautotrophic plants to partially or substantially
remediate contaminated soils, sediments, and water (Cunningham, Shann et al. 1997;
Horne 2000; USGS 2006). Plants and associated microorganisms can degrade,
accumulate, absorb, transform, or immobilize pollutants, thus limiting their spread in the
environment (Pivetz 2001; Vymazal 2007). Restoring riparian vegetation along
Waimānalo stream for the purpose of reducing excessive surface water N will rely on the
phytoremediation capabilities of these riparian plants.
Phytoremediation takes advantage of natural metabolic processes mediated by
solar energy and is a cost-effective alternative to the civil and chemical engineering
technologies developed over the past 20 years (Cunningham, Shann et al. 1997; Horne
2000). Phytoremediation has also shown promise to accumulate pollutants with a higher
rate and efficiency when compared to conventional remedial technologies (Cunningham
and Ow 1996; Terry and Baneulos 2000; Erakhrumen 2007). Although research differs
on the significance of plant assimilation in nutrient removal (Stottmeister, Wießner et al.
2003), data on N transport in CWs suggest that plant uptake is effective at maximizing N
storage and transformation (Tanner, Clayton et al. 1995b; Tanner 1996; Tanner 2001).
To understand the role of plants in the N treatment process, it is important to
consider the role of phreatophytes in the landscape. When comparing the effectiveness of
an ecosystem process, such as N uptake and retention, phreatophytes are only one part of
a complex system. The pollutant removal functions associated with wetlands and
riparian area vegetation combine the physical process of filtering and the biological
processes of nutrient uptake and denitrification (USEPA 2005). Nitrogen reactions in

11
wetlands effectively process inorganic N through nitrification and denitrification,
anammox, ammonia volatilization, and plant uptake (Reddy and DeLaune 2008).
Nitrogen uptake (assimilation) by plants refers to a variety of biological processes that
convert forms of organic and inorganic N into organic compounds that serve as building
blocks for the cells and tissues of plants (Vymazal 2007).
Nutrient concentrations in plant biomass have been widely used to assess the
availability of nutrients to plants and the degree to which particular nutrients are limiting
for plant growth. The Nitrogen concentration in plant tissue is highly variable and is
dependent on age of the plant, N availability and form (i.e. ammonium-N, nitrate-N),
genetic ability of plant to assimilate N, soil type, and environmental condition (Güsewell
and Koerselman 2002; Reddy and DeLaune 2008). Both, Boyd (1970; 1978) and
McJannet (1995) observed significant interspecies variation in nutrient concentrations
among wetland plants with similar ecological growth habits when grown in different
nutrient levels and under identical soil and nutrient conditions. Past studies reveal a
range of tissue N values when comparing emergent wetland plants. For example, a
review of studies on aquatic plants in the United States reported percent N concentration
(% dry weight) in plant tissue to range from 1.37- 2.87 (Boyd 1970). Another study of
wetland plants from in Canada reported mean tissue N concentration to range from ~ 0.7-
2.2 %. Tanner (1996) and Greenway (1997) found aboveground plant tissue N
concentrations in wetland plants from New Zealand and Australia to range from ~ 0.6
and 3.2 % which was similar to Xu’s (2006) range of 1.9 and 4.7 %.for wetland plants in
China.

12
Tissue N concentration is directly related to the amount of available N in water
and soil (Reddy and DeLaune 2008), and has been shown to increase with increased
amounts of applied nutrients (Xu, Yan et al. 2006). The nutrient use efficiency of
vegetation and the C:N ratio of the plant litter generally decreases with increased nutrient
loading (Reddy and DeLaune 2008), and a negative relationship between percent N and
whole-plant biomass has been observed for aquatic macrophytes (Polisini and Boyd
1972; McJannet, Keddy et al. 1995). High levels of nitrate can be stored or translocated
from tissue to tissue without deleterious effects, however this can be harmful to humans
or livestock if the plant material or water with high nitrate concentrations are consumed
in a condition known as methemoglobinemia (Taiz and Zeiger 2002).
A central goal in restoration ecology is to predict the outcomes of specific
restoration actions, and to meet projected objectives such as maximizing removal of a
specific pollutant or groups of pollutants (Zedler 2000; Zedler and Callaway 2000). In
order to evaluate and monitor the success of a created riparian system, a better
understanding of the role plants play in N accumulation and assimilation will enhance
stream management and remediation efforts. Also, should excessive N in stream waters
adversely affect the structure and function of stream ecosystems, a set of guidelines could
be developed for resource managers when conserving and restoring riparian zones for
efficient N accumulation.
Native Species
The isolation of the Hawaiian archipelago has resulted in the development of
unique native flora and fauna. Biologists divide native plants into two groups, those that

13
are endemic and those that are indigenous (Abbot 1992). The term endemic refers to
plants only occurring in the Hawaiian Islands before human arrival; whereas the term
indigenous is used strictly to describe plants occurring both naturally in the Hawaiian
Islands and somewhere outside the Hawaiian Islands before human arrival (Erickson and
Pottock 2006).
Native species are an integral part of local ecosystems and support biodiversity
and provide habitat for other native species such as fish, insects, and birds. Native plant
species typically thrive without a lot of maintenance, and often require considerably less
water and chemical pesticides. Invasive nonnative plants can contribute directly to the
loss of ecosystem services, or interfere with restoration goals (D'Antonio and Chambers
2006). The elimination or reduction of shade provided by riparian vegetation in
Waimānalo Stream has encouraged the growth of channel-clogging California grass
(Brachiaria mutica), wild sugarcane (Saccharum officinarum), and other nonnative
vegetation that takes up water and nutrients, and traps sediments (Laws and Roth 2004).
Selecting for native plants that will survive and restore riparian functions requires an
ecosystem perspective (Ehrenfeld and Toth 1997), that encompasses the current state of
Waimānalo stream. Plants in the riparian zone of this stream need to be able to withstand
periods of low flow and intense episodic periods of high flow (Tomlinson and DeCarlo
2003), and ideally will have physiological adaptations for removing N loads from this
stream.
14
Coconut Fiber Coir Logs
Coconut coir geo-textile logs are made from 100% natural coconut coir fiber and
are bound by coconut coir polyethylene netting. Coir fibers are found between the husk
and the outer shell of the coconut. Coir logs have been used for toe stabilization along
stream banks, helping to both provide energy absorption and habitat for wetland species
(Army 2006). Coir logs can improve water quality and aesthetics with the use of
emergent aquatic plants (phytoremediation) and can also improve non-point pollution
control by intercepting sediment and associated pollutants coming into the stream from
overbank areas (Allen and Leech 1997). Roth’s (2005) study of biofilters for wastewater
treatment systems used five different media, (coral rubble, blue stone, lava rock,
geotextile, and coconut coir) and found that coconut fiber had a significantly higher
dissolved inorganic nitrogen (DIN) removal rate than the other four treatments. Although
pre-planted logs have been successfully used in the continental U.S., this technique has
neither been demonstrated with Hawaiian plants nor under the highly variable flow rates
found in Hawai‘i. To determine whether coir logs are appropriate for Hawai‘i there are
important bioengineering factors that need to be considered, such as proper assessments
of the site and construction design (Allen and Leech 1997).
Objectives
The overall objective of this project was to identify candidate native sedge species
for stream phytoremediation and to demonstrate the use of pre-planted fiber coir logs for
native plant restoration in two Hawaiian streams. An experimental phase was used to
determine the ability of various native plant species to establish in a coconut coir

15
medium, grow at varying N levels, and to quantify assimilation of N in plant biomass.
The second field installation phase was then used to test the installation of coir logs in an
actual stream environment and compare results of the stream with those of the
experimental phase. Linking these phases together in one project provides an intellectual
framework for restoration and offers the opportunity to test and expand theories to
improve the quality and effectiveness of such remediation efforts in Hawai‘i.
Both chapters of original research, the first dealing with the planted coir log N
addition experiment, and the second with the field establishment, have their own specific
objectives. Details regarding the scientific background behind these objectives and
hypotheses will be presented in the introductions of their respective chapters. The
following is an outline of the thesis chapters, objectives, and hypotheses.
Chapter 1: Introduction
Chapter 2: Planted Coir Log Nutrient Addition Experiment
Objective 2-1: Select native wetland/riparian plant species (Cladium jamaicense Crantz,
sawgrass [‘Uki], Cyperus javanicus Houtt, Java sedge [Ahu’awa], Cyperus laevigatus L.,
smooth flatsedge [Makaloa], and Cyperus polystachyos, manyspike flatsedge [Kiolohia])
for their suitability for restoration using a set of pre-determined criteria including native
status, potential ability to grow on coir logs, ease of maintenance, and commercial
availability (full criteria listed under methods).
Objective 2-2: Determine success of coconut coir logs as a medium for plant
establishment prior to field installation.

16
Hypothesis 2-1: Native wetland/riparian plant species will be able to establish, survive,
and develop on coconut coir medium.
Objective 2-3: Expose selected species to varying levels of N (in the form of ammonium
nitrate in surface water) and compare their tissue TN concentration, aboveground
biomass, and TN accumulation rates.
Hypothesis 2-2a: The individual species selected will have significant differences in
tissue TN concentration, aboveground biomass, and TN accumulation rates. Cladium
jamaicense will have higher tissue TN concentration, aboveground biomass, and TN
accumulation rates, followed by C. javanicus, C. javanicus, and C. laevigatus, as habitat
preferences and physiological growth traits differ among species. Cladium jamaicense is
an obligate wetland species, found in resource-poor wet sites with heights of 1-3 m.
Cyperus javanicus is a facultative wetland species, found in resource-rich marsh areas
with heights of 0.4-1.1 m. Cyperus laevigatus is an obligate wetland species, found in
resource-rich coastal edges with heights of 0.2-1 m. Cyperus polystachyos is a
facultative wetland species, found in variable wet and dry soils, with heights of 0.25-0.9
m (Fetters and Van Dyke 1996; Erickson and Pottock 2006).
Hypothesis 2-2b: Within species, tissue N concentration will increase with exposure to
increasing N addition treatments.
Chapter 3: Field Establishment of Planted Coir Logs in Waimānalo Streams
Objective 3-1: Monitor nitrate, ammonium, and total dissolved N from Waimānalo and
Kahawai streams.

17
Objective 3-2: Install and monitor coir logs planted with native species along 92 meters
(m) of each stream.
Hypothesis 3-1: Plants in coir logs of Kahawai stream will have higher tissue N
concentration and aboveground biomass than plants in coir logs of Waimānalo stream as
Kahawai stream has consistently higher surface water N levels than Waimānalo stream.
Chapter 4: Conclusions

18
Chapter 2: Planted Coir Log Nutrient Addition Experiment
Introduction
For over a decade, Waimānalo Stream has remained on Hawai‘i’s 303(d) listing of
impaired waterways which have sediments and nutrients in excess of allowable loads
(USEPA 1998; Harrigan and Burr 2001; HIDOH 2006). Flow diversion, habitat damage,
and stream channel modifications of Waimānalo Stream have resulted in a highly-
impaired condition, in which this system “no longer functions as a stream” (Harrigan and
Burr 2001; Laws and Ferentinos 2003). A mandated TMDL report for Waimānalo
stream identified the need for substantial reduction of surface water nitrate (NO3) loads in
the middle segments of the watershed (Harrigan and Burr 2001). Harrigan (2001) went
on to say that “regardless of how many BMP’s are implemented for sediment and nutrient
control, significant improvement in the water quality of Waimānalo Stream will be
difficult to achieve unless in-stream standards for flows are set to increase the base flow,
and stream channels and riparian wetlands are at least partly restored to their natural
form and function.”. This chapter addresses the major environmental concerns for
Waimānalo stream, as outlined in the TMDL and subsequent reports, by identifying
candidate species for phytoremediation of the riparian zone in order to restore the
functionality of this stream.
Studies have suggested that using plants for phytoremediation in stream
restoration projects helps to improve and potentially enhance the ecological functioning
and aesthetic values of degraded streams (Brennan 2005; Greenway 2005). While some

19
studies have quantified inorganic contaminant uptake by wetland species (McJannet,
Keddy et al. 1995; Tanner 1996; Greenway 1997; Tanner 2001; Browning 2003;
Bastviken 2006; Xu, Yan et al. 2006), few have focused on Hawaiian species (Van-Dyke
2001). Nitrogen uptake by plants is defined as the amount of N that is assimilated in the
aboveground and belowground portions of a plant; and is directly related to the amount of
available N in water and soil (Reddy and DeLaune 2008). Nutrient concentrations in
plant biomass have been widely used to assess the availability of nutrients to plants and
can differ widely among species even when experiencing the same nutrient availability
(McJannet, Keddy et al. 1995; Güsewell and Koerselman 2002).
Constructed riparian wetlands along stream banks utilize the physical, biological
and chemical processes and functions of a natural wetland to improve water quality
(Browning 2003). Experiments carried out in constructed wetlands or the controlled
environment of mesocosms, are designed with the goal of mimicking the living world and
can often provide useful information about rates of nutrient uptake (Todd and Todd 1993;
Tanner 1996; Tanner 2001; NOAA 2009). This project used constructed mesocosms
designed to approximate the natural conditions of Waimānalo stream and exposed
candidate plant species to varying levels of N inputs in a replicated experimental setting.
Several native Hawaiian sedge species were selected and grown hydroponically using a
coconut coir log media. This coir log medium has often been used outside of Hawai‘i for
bank stabilization and stream revegetation (Allen and Fischenich 1999), but no studies
have been conducted in Hawai‘i with species native to the Hawaiian archipelago.

20
Objectives and Hypothesis
The specific objectives and hypotheses of this chapter are outlined below.
Objective 2-1: Select native wetland/riparian plant species (Cladium jamaicense Crantz,
sawgrass [‘Uki], Cyperus javanicus Houtt, Java sedge [Ahu’awa], Cyperus laevigatus L.,
smooth flatsedge [Makaloa], and Cyperus polystachyos, manyspike flatsedge [Kiolohia])
for their suitability for restoration using a set of pre-determined criteria including native
status, potential ability to grow on coir logs, ease of maintenance, and commercial
availability (full criteria listed under methods).
Objective 2-2: Determine success of coconut coir logs as a medium for plant
establishment prior to field installation.
Hypothesis 2-1: Native wetland/riparian plant species will be able to establish, survive,
and develop on coconut coir medium.
Objective 2-3: Expose selected species to varying levels of N (in the form of ammonium
nitrate in surface water) and compare their tissue TN concentration, aboveground
biomass, and TN accumulation rates.
Hypothesis 2-2a: The individual species selected will have significant differences in
tissue TN concentration, aboveground biomass, and TN accumulation rates. Cladium
jamaicense will have higher tissue TN concentration, aboveground biomass, and TN
accumulation rates, followed by C. javanicus, C. javanicus, and C. laevigatus, as habitat
preferences and physiological growth traits differ among species. Cladium jamaicense is
an obligate wetland species, found in resource-poor wet sites with heights of 1-3 m.
Cyperus javanicus is a facultative wetland species, found in resource-rich marsh areas
with heights of 0.4-1.1 m. Cyperus laevigatus is an obligate wetland species, found in

21
resource-rich coastal edges with heights of 0.2-1 m. Cyperus polystachyos is a
facultative wetland species, found in variable wet and dry soils, with heights of 0.25-0.9
m (Fetters and Van Dyke 1996; Erickson and Pottock 2006).
Hypothesis 2-2b: Within species, tissue N concentration will increase with exposure to
increasing N addition treatments.
Materials and Methods
Species Selection
The selection of species for use in remediation projects is generally based on the
goals of the project (Zedler 2000; Zedler and Callaway 2000; D'Antonio and Chambers
2006). Based on our project objectives, candidate species suitable for use needed to meet
the following criteria:
1. Native status (Erickson and Pottock 2006), 2. Wetland indicator status (Erickson and Pottock 2006), 3. Potential ability to establish roots within and grow on coconut fiber coir logs, 4. Pollutant uptake (Van-Dyke 2001), 5. Stream hydraulic tolerance (Erickson and Pottock 2006), 6. Ease of maintenance (Wagner, Herbst et al. 1990; Brimacombe 2002), 7. Wastewater tolerance (FLC 2001; Van-Dyke 2001; Paquin, Campbell et al.
2004; HuiKu 2008), 8. Commercial/Local availability (Barboza 2007).
Based on these criteria, the four species selected were: Cladium jamaicense, Cyperus
javanicus, Cyperus laevigatus, and Cyperus polystachyos (Table 2.1). Selected species
had been mentioned in literature related to constructed wetlands, have been used in
erosion control projects in Hawai‘i, and/or have been recommended by experts in the
fields of native plant propagation, ecosystem restoration, constructive wetland

22
Table 2.1. List of species used for the experiment (in alphabetical order), the status groups to which these species belong, and other important traits.
Cladium jamaicense
Cyperus javanicus
Cyperus laevigatus
Cyperus polystachyos
Hawaiian name 'uki ahu'awa ehu'awa, makaloa kiolohia Common name Saw grass Java sedge Smooth Flat sedge Manyspike flatsedge Native status2 Indigenous Indigenous Indigenous Indigenous Wetland indicator status2 Obligate Facultative Obligate Facultative Coir log potential N/A N/A N/A N/A Pollutant uptake8 N/A N/A High N/A Stream hydraulic tolerance2
N/A
Media-less/Root submersion
Media/Near water
Moist areas/Root submersion
Ease of maintenance1,9 N/A Low maintenance Low maintenance Low maintenance Wastewater tolerance3,4,5,6,8 High High High Medium Commercial/Local availability7
Yes
Yes
Yes
Yes
1Brimacombe (2002)
2Erickson and Puttock (2006). 3Farmers Livestock Cooperative (2001) 4Hui Ku Maoli Ola (2008) 5Lissner, Mendelssohn et al. (2003) 6Paquin, Campbell et al. (2004) 7Rick Barboza (2007) 8Van-Dyke (2001) 9Wagner, Herbst et al. (1990)
23
implementation, and cultural practices. Data were not always available for listed criteria
and attempts were made to best fit descriptions with criteria objectives.
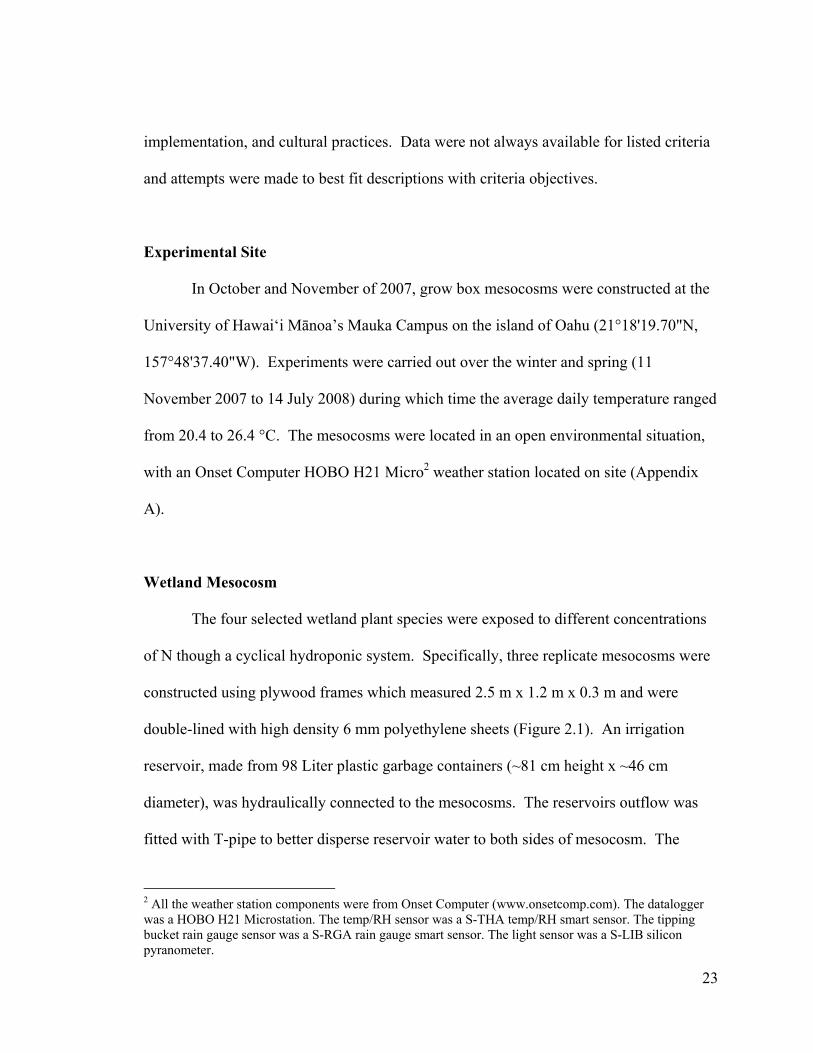
Experimental Site
In October and November of 2007, grow box mesocosms were constructed at the
University of Hawai‘i Mānoa’s Mauka Campus on the island of Oahu (21°18'19.70"N,
157°48'37.40"W). Experiments were carried out over the winter and spring (11
November 2007 to 14 July 2008) during which time the average daily temperature ranged
from 20.4 to 26.4 °C. The mesocosms were located in an open environmental situation,
with an Onset Computer HOBO H21 Micro2 weather station located on site (Appendix
A).
Wetland Mesocosm
The four selected wetland plant species were exposed to different concentrations
of N though a cyclical hydroponic system. Specifically, three replicate mesocosms were
constructed using plywood frames which measured 2.5 m x 1.2 m x 0.3 m and were
double-lined with high density 6 mm polyethylene sheets (Figure 2.1). An irrigation
reservoir, made from 98 Liter plastic garbage containers (~81 cm height x ~46 cm
diameter), was hydraulically connected to the mesocosms. The reservoirs outflow was
fitted with T-pipe to better disperse reservoir water to both sides of mesocosm. The
2 All the weather station components were from Onset Computer (www.onsetcomp.com). The datalogger was a HOBO H21 Microstation. The temp/RH sensor was a S-THA temp/RH smart sensor. The tipping bucket rain gauge sensor was a S-RGA rain gauge smart sensor. The light sensor was a S-LIB silicon pyranometer.

24
Figure 2.1. The constructed mesocosm design and dimensions. The photograph on the right-hand side shows the foil covered tubing which diverted reservoir outflow in order to maximize nutrient dispersal in mesocosm.

25
mesocosms had a slight downward slope and an electronic aquarium pump at the lower
end that conveyed effluent water back to the irrigation reservoir through clear plastic
tubing. This tubing was wrapped with aluminum foil wherever it was exposed to sunlight
in order to minimize algal growth. Because this experiment was exposed to weather
elements, and in order to keep the logs from being fully inundated during rain events, the
mesocosms were filled to a water depth of 0.15 m and were maintained at that level by a
1.9 cm drainage pipe located at the lower end of each box.
Water and Nutrient Additions
The flow rate (L day-1) was estimated using the “bucket stopwatch” method.3 In
this case, an empty 7.57 liter bucket was placed at the outflow of the reservoirs and the
time required to fill the bucket was recorded with a stopwatch. The water flow rate
through the systems was restricted by the output range of the reservoir nozzle, the 436.1
m3 d-1 electric pumps, and the approximate 38 – 45 Liter reservoir holding water head
needed to meet the reservoir outflow of 327 m3 d-1.
The selected species were tested to determine their ability to survive and grow in
the impaired environmental conditions of Kahawai and Waimānalo Streams. The first
baseline water quality samples were collected from Kahawai and Waimānalo Streams
and used to characterize the in-situ conditions to be replicated in the mesocosm study.
Stream sampling began in September 2007 and continued throughout the project on a
quarterly basis. Water quality sampling results from this study were compared to
published water quality data for Waimānalo stream and followed similar patterns
3 The bucket stopwatch method involves recording the amount of time required to fill a container of known volume.

26
(Harrigan and Burr 2001; Laws and Ferentinos 2003; Laws and Roth 2004). On average,
the total dissolved nitrogen (TDN) concentration for the Kahawai Stream following a rain
event was around 4-5 mg L-1, whereas, average concentrations during base-flow ranged
between 6-8 mg L-1 (Laws and Ferentinos 2003).
A hydroponic fertilizer4 (Appendix B) was used as a baseline nutrient solution to
ensure optimal plant growth (Güsewell and Koerselman 2002). To meet the minimal
plant nutrient requirements, this fertilizer was added with a concentration of 60 mg TN L-
1, which was half of Grow More’s © recommended dose and approximately half the
recommended fertilizer rate for hydroponic lettuce in Hawai‘i (Valenzuela, Kratky et al.
2006). A literature search found that studies of constructed and restored wetlands used a
broad range of nutrient concentrations; for example, overall means ranged from ~13 mg
TN L-1 (Greenway 1997) to over 98 mg TN L-1 (Tanner 1996) and ~108 mg Total
Kjeldahl Nitrogen (TKN) L-1 (FLC 2001).
This project worked within the constraints of the hydroponic system and manual
additions which proved to be a challenge during the first few months. Although the
initial baseline concentration was 60 mg TN L-1, this quickly dropped to an average of 14
mg TN liter-1 after the first week and 1.8 mg TN L-1 after the second week due to rapid
plant uptake. Complications with nutrient additions during the initial phase of the
experiment resulted in eutrophic conditions during the first month and prompted
adjustments of baseline concentrations during the first two months and until a better
understanding of the nutrient dynamics in the mesocosm systems was attained.
Mesocosms were initially filled with tap water and baseline nutrient fertilizer for a
1-month plant acclimatization period. After this period, ammonium nitrate was added to 4 Growmore © 10-8-22 Hydroponic Fertilizer

27
increase the aqueous nitrate in the second and third boxes by 4 mg L-1 and 8 mg L-1,
respectively, to reflect an intermediate and high range of N concentrations for the stream.
The two forms of N generally used for assimilation by plants are ammonia- and nitrate-N
(Vymazal 2007). Because ammonia N is more reduced than nitrate, it is the preferable
source of N for assimilation (Kadlec and Knight 1996).
Mesocosm water was changed every two weeks by completely emptying and
refilling each mesocosm with tap water, after which both the baseline hydroponic
fertilizer and the ammonium nitrate additions were administered into the reservoirs.
During the last three months, ammonium nitrate was re-administered at weekly intervals
due to water samples signaling a significant decrease in available aqueous N after only a
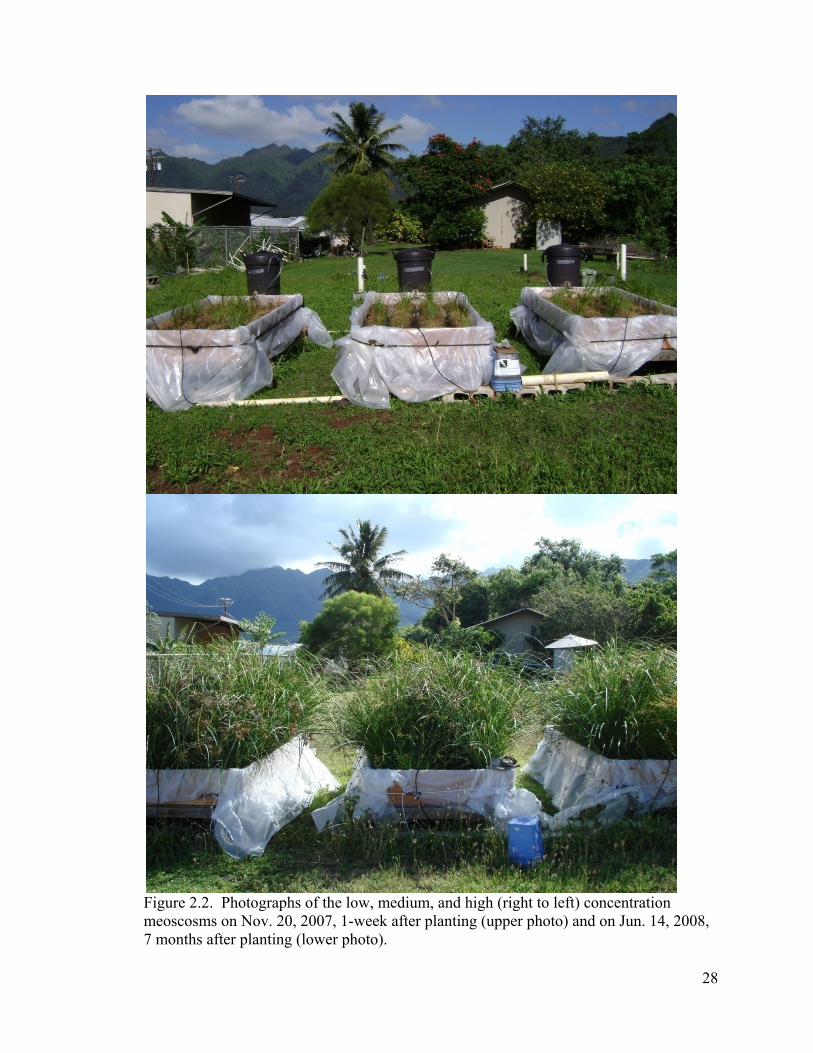
week, likely due to the increased plant biomass (Figure 2.2).
Mesocosm Sample Collection and Laboratory Analysis
Water samples from the mesocosms were collected in 50-mL plastic centrifuge
tubes and immediately put in an ice chest. Physical and chemical properties of the water
in the mesocosm, such as pH, temperature, etc., were closely monitored using a handheld
YSI Model 556 Multi probe system (YSI Instruments, Yellow Springs, OH) to ensure no
major differences occurred across the treatments. Mean characteristics of the grow box
water can be found in Table 2.2. Water samples were sent to the Marine Science
Analytical Lab (MSAL) at UH Hilo to be analyzed for total dissolved nitrogen (TDN),
nitrate+nitrite nitrogen (NO3-N + NO2--N) through the use the ASTM Method D5176
(ASTM 1995), and ammonium nitrogen (NH4-N). Quality Assurance/Control water
samples were collected from the mesocosms at 24 hours, one week, and two weeks
28
Figure 2.2. Photographs of the low, medium, and high (right to left) concentration meoscosms on Nov. 20, 2007, 1-week after planting (upper photo) and on Jun. 14, 2008, 7 months after planting (lower photo).

29
Table 2.2. Mean water physiochemical characteristics in the mesocosms as recorded by the YSI probe during nutrient adjustment period January-February (n = 3).
Mesocosm
Parameter Control Intermediate High
Dissolved Oxygen (mg L-1) 4.35 3.81 3.63
Temperature (oC) 23.89 24.19 23.74
pH 7.19 7.12 7.07
Conductivity (us cm-1) 0.77 0.70 0.75
Total Dissolved Solids (g L-1) 0.50 0.46 0.49
Salinity (ppt) 0.37 0.34 0.37

30
following the addition of baseline and nutrients. The 24-hour sample was used to
measure the estimated calculation of initial N concentrations derived via mass volume
calculations. The one and two week samples were used to quantify how concentrations
in the mesocosms changed over time.
Experimental Procedures
The three mesocosms were designed to mimic the toe area of Waimānalo Stream
where pre-planted coconut coir logs were scheduled to be installed. The hydroponic
mesocosm environment was used to investigate how the four native plant species would
respond to being grown in a coconut coir log media within different surface water N
levels. Due to lack of immediately available material for the mesocosm phase, woven
coconut coir matting was obtained which was then rolled into logs and tied off with
polyethylene string. The coir logs measured 2.13 m long with a 25 cm diameter and were
placed vertically into each mesocosm (Figure 2.3). Three of the selected species, C.
jamaicense, C. javanicus, and C. polystachyos, were grown in 10 cm pots obtained from
Hui Ku Maoli Ola5 nursery, while 10 cm square potted C. laevigatus were supplied by
Dennis Kim’s6 nursery. Cyperus laevigatus plants which came from the nursery were
much younger than other species and had the lowest belowground and aboveground
biomass. Plants were established in the coir logs on November 20, 2007 by pulling coir
from the log to make a hole large enough to accommodate the belowground rooting
biomass and potting material. Plants were positioned in a randomized complete block
5 Hui Ku Maol Ola, Hawaiian plant specialists, 46-403 Ha'iku Rd in Kaneohe on Oahu. 6 Landscape architect and planning consultant, Waimānalo,Oahu.

31
Figure 2.3. The mesocosm experimental design.

32
design to minimize effects from position, distance, shading, or species interaction; this
design was replicated in each mesocosm. Two replicate plantings were planted at each
position in the coir logs. In this design, blocks were defined either by plant distance from
irrigation reservoir (row) or by each log itself (column).
Vegetation Sampling
Tissue collection
Plants obtained for the mesocosm experiment were sub-sampled for aboveground
tissue TN on a monthly basis beginning in December 2007 and continuing through June
2008. Each species from each log was subsampled during tissue collection (16 samples
per box, 48 samples per month). Representative subsamples were composited from
clippings of plants on each log. Initial clippings were taken one month after
acclimatization period (19 December 2007), and ammonium nitrate additions were added
after collection that same day. Clippings were as unobtrusive as possible, using whole
leaves (including stems for Cyperus polystachyos) and taking < 5% of total aboveground
biomass and obtained in the same manner each month. Clippings were brought back to
the laboratory and dried to a constant weight in a forced draft oven at 40°C for 48-72
hours and then ground into a homogeneous powder using a ball mill. Total N
concentration of the tissues were determined via combustion with a LECO CN2000
analyzer (LECO, Warriewood, Australia) at the University of Hawai‘i Mānoa Agriculture
Diagnostic Service Center (ADSC) Laboratory.

33
Biomass collection
During the final month of the experiment, a destructive harvest was used to
quantify aboveground plant biomass. Biomass sampling consisted of randomly selecting
a replicate of each species from every coir log. Only aboveground tissue material was
collected for this project due to inability to separate belowground root mass from coconut
coir netting. The aboveground biomass was collected and dried to a constant weight in a
forced draft oven at 40°C for 48-72 hours. Dry weight (DW) was recorded and compared
for differences within species and between nutrient levels. Biomass growth was
determined by surface area rather than vegetative clump diameter for consistency and
practical purposes. The natural clumping growth characteristic of C. jamaicense, C.
javanicus, and C. polystachyos typically encourages an increase in abundant canopy
growth and a wider distribution of individual plants. The surface area of harvest (m2) for
each plant was not assumed to be flat but was calculated using the top half of the
cylindrical coir logs which was exposed to the atmosphere (Figure 2.4). Weed and
senescent aboveground biomass was removed from growing area and from collected
samples.

34
Figure 2.4. Mesocosm coir log planting scheme with a side view of the exposed surface area.
Water Level

35
Aboveground Tissue TN Concentration and Uptake Rates
Average species accumulation rates (g TN m2 yr-1) were calculated using TN data
from the final month of the experiment. To determine uptake per year, the TN
concentration of each plant was multiplied by the aboveground biomass and N
accumulation rates were calculated based on the 7-month plant establishment period in
the mesocosms. Calculating accumulation per year was considered to be the most
practical and economic rate for use when determining large-scale remediation projects.
Statistical Analyses
Analysis of the data involved a general linear model (GLM) analysis of variance
(ANOVA). A randomized complete block design over the three mesocosms was used for
analysis with time, species, and N level as main effects. Blocks were also tested for
position of individuals in logs placed both horizontally as columns and by distance from
reservoir as rows. Blocks were tested individually using species averages over time.
Differences in main effects were tested using a GLM ANOVA and the Waller-Duncan K-
ratio t test to determine effects from exposure to elevated N levels. Species*Treatment
effects were analyzed using a post hoc test of means (lease significant difference [LSD]).
All statistical analysis were conducted with SAS version 9.1.3 (SAS Institute, Cary, N.C.
U.S.A.).

36
Results
Growth/survival:
During the eight-month trial, ending in July 2008, C. jamaicense, C. javanicus,
and C. polystachyos had 100% survival rate in coir logs across all three nutrient levels.
Cyperus laevigatus, on the other hand, had a significantly lower final survival rate (F =
19.11, p < 0.001) of 54% in June 2008.
Tissue TN Concentration
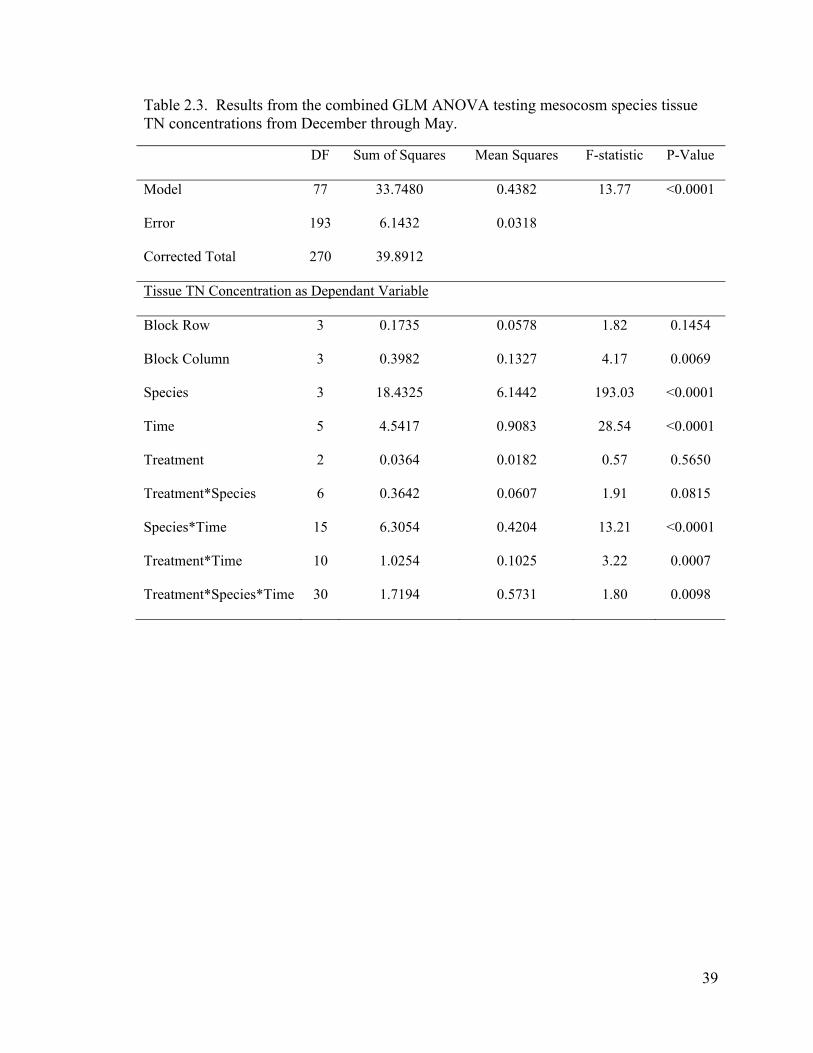
A repeated measures GLM ANOVA revealed that species accounted for the
greatest proportion of variance in the tissue TN concentration data (F = 193.03, p <
0.0001) (Table 2.3, Figure 2.5) with mean TN concentrations ranging from ~1% for C.
laevitigus to ~1.62% for C. jamaicense. According to the ANOVA, tissue TN
concentration changed significantly over time (F = 28.54, p < 0.0001). Accumulated
tissue TN varied markedly between species over time as the time*species interaction was
significant (F = 13.21, p < 0.0001). Although treatment was not shown to be significant
when combined over time, species*treatment effects had a p value of 0.08 (F = 1.91),
suggesting that there were marginal interaction effects (Figure 2.6). Further analysis
revealed that C. jamaicense showed significant differences across the N treatments (F =
6, p = 0.0041) (Figure 2.7).
Blocks (row and column) were tested via the combined ANOVA and column
blocking accounted for a significant portion of variance (F = 4.17, p = 0.0069). The
Waller-Duncan t-Test revealed that coir logs on the western edge of each mesososm had
a minimal significant TN difference of +0.06% over the subsequent logs mean when run

37
in the combined ANOVA. Although column blocking carried a low F-value, this
blocking variable was included for each month’s linear ANOVA and, when analyzed,
revealed no significance during any individual month. The mean aboveground tissue TN
concentration for the four species over the six month trial is presented in Table 2.4.
The effect of time was somewhat confounded due to complications during the
first few months of nutrient additions and the need to adjust hydroponic baseline
additions (see Methods). Although the baseline concentrations were altered during the
first months, the increased N additions were maintained at a consistent low, intermediate,
and high exposure across the mesocosms. For this reason, further results dealing with
time variance will focus on analysis from within each month. A GLM ANOVA was run
for each month using species, treatment, block (column), and the species*treatment
interaction. Treatment was significant during January and February 2008, and although
baseline nutrient levels were fluctuating during this period, a significant linear pattern
was observed across the N treatments (Figure 2.8).
Results from the beginning, middle, and end time periods of the experiment
revealed unique trends in tissue TN concentration by species which are discussed in
further detail below.
November 2007; Nursery plantings
Plant tissue TN concentrations from the original nursery stock were found to
exhibit significant differences among species (F = 189.45, p < 0.0001).

38
December 2007; Initial month sampling
During the one-month acclimation period, plants were exposed to the same level
of nutrients across treatments from the baseline fertilizer additions. Plant species
accounted for a significant proportion of variance (F = 32.73, p < 0.0001) in the initial
TN concentrations. Specifically, TN concentrations in C. polystachyos were significantly
lower than the other three species.
April 2008; Month 4 sampling
Beginning in April 2008, the additions of intermediate and high ammonium-N
were increased to a bi-weekly schedule. Species continued to account for a significant
proportion of variance in the tissue N data (F = 32.73, p < 0.0001). Specifically, Cladium
jamaicense, C. laevitagus, and C. polystachyos continued to show increased TN
concentrations, whereas TN in C. javanicus decreased. May 2008 showed the same
pattern of species tissue TN concentrations and significance with an even higher F-value
(F = 57.10, p < 0.0001).
June 2008; Month 6 sampling
The final month of sampling revealed a similar, but more exaggerated, pattern of
TN concentrations among species. Species again accounted for a significant proportion
of variance in tissue N (F = 32.73, p < 0.0001), however, the mean tissue TN
concentrations for all species dropped slightly compared to the previous months.
39
Table 2.3. Results from the combined GLM ANOVA testing mesocosm species tissue TN concentrations from December through May.
DF Sum of Squares Mean Squares F-statistic P-Value
Model 77 33.7480 0.4382 13.77 <0.0001
Error 193 6.1432 0.0318
Corrected Total 270 39.8912
Tissue TN Concentration as Dependant Variable
Block Row 3 0.1735 0.0578 1.82 0.1454
Block Column 3 0.3982 0.1327 4.17 0.0069
Species 3 18.4325 6.1442 193.03 <0.0001
Time 5 4.5417 0.9083 28.54 <0.0001
Treatment 2 0.0364 0.0182 0.57 0.5650
Treatment*Species 6 0.3642 0.0607 1.91 0.0815
Species*Time 15 6.3054 0.4204 13.21 <0.0001
Treatment*Time 10 1.0254 0.1025 3.22 0.0007
Treatment*Species*Time 30 1.7194 0.5731 1.80 0.0098

40
Figure 2.5. Total N concentrations (mean ± 1 standard error) among the four species (n = 72 for C. jamaicense and C. javanicus, n = 57 for C. laevigatus, n = 70 for C. polystachyos). Bars with different letters represent significant difference according to Waller-Duncan K-ratio t test (P<0.05).
0
0.5
1
1.5
2
C. jamaicense C. javanicus C. laevigatus C. polystachyos
Tota
l N (%
)
Species
c b a a

41
Figure 2.6. Total N concentrations (mean ± 1 standard error) among species*treatment effect. Bars with different letters represent significant differences according to the post hoc test of means (P<0.05).
0.00
0.25
0.50
0.75
1.00
1.25
1.50
1.75
2.00
C. jamaicense C. polystachyos C. javanicus C. laevigatus
Tota
l N (%
)
Species
Control
Intermediate
High
b a ab a ab a c c c d de e

42
Figure 2.7. A comparison of tissue N concentration (n = 72, mean ± 1 standard error) in plant aboveground biomass tissue for C. jamaicense across the N treatments (mesocosm). Bars with different letters represent significant difference according to Waller-Duncan K-ratio t test (P<0.05).
1.40
1.45
1.50
1.55
1.60
1.65
1.70
1.75
Control Intermediate High
Tota
l N (%
)
Mesocosm
a ab bc

43
Table 2.4. A comparison of mean tissue total N concentrations (percent ± standard deviation) in aboveground tissue for the four species over all sampling dates from all three N treatments. [(***) n = 1, (**) n = 2, (*) n = 3].
Plant Species and Treatment Growth
C. jamaicense C. javanicus C. laevigatus C. polystachyos TN TN TN TN
Initial Control 1.05 ± 0.06 1.14 ± 0.09 0.85 ± 0.24 1.14 ± 0.09 Intermediate 1.04 ± 0.09 1.17 ± 0.13 0.64 ± 0.18 1.17 ± 0.13 High 1.10 ± 0.06 1.08 ± 0.19* 0.65 ± 0.06 1.08 ± 0.19* Month 1 Control 1.17 ± 0.17 1.42 ± 0.08* 1.17 ± 0.08 1.42 ± 0.08* Intermediate 1.22 ± 0.09 1.31 ± 0.08 0.55 ± 0.29 1.31 ± 0.08 High 1.15 ± 0.10 1.50 ± 0.15 0.70 ± 0.26 1.50 ± 0.15 Month 2 Control 0.79 ± 0.06 1.15 ± 0.08 0.67 ± 0.24 1.15 ± 0.08 Intermediate 1.22 ± 0.09 1.32 ± 0.10 0.55 ± 0.29 1.32 ± 0.10 High 1.10 ± 0.13 1.41 ± 0.22 0.92 ± 0.65 1.41 ± 0.22 Month 4 Control 0.87 ± 0.10 1.33*** 1.48 ± 0.30 1.33*** Intermediate 0.90 ± 0.05 1.53 ± 0.12 1.20 ± 0.51 1.53 ± 0.12 High 0.83 ± 0.08 1.38 ± 0.34* 1.31 ± 0.13 1.38 ± 0.34* Month 5 Control 1.00 ± 0.05 1.57 ± 0.01** 1.23 ± 0.44 1.57 ± 0.01** Intermediate 0.92 ± 0.09 1.48 ± 0.04 1.55 ± 0.27 1.48 ± 0.04 High 0.85 ± 0.10 1.36 ± 0.24** 1.35 ± 0.11** 1.36 ± 0.24** Month 6 Control 0.96 ± 0.06 1.50 ± 0.08* 1.05 ± 0.18 1.50 ± 0.08* Intermediate 0.87 ± 0.09 1.36 ± 0.13 1.21 ± 0.19 1.36 ± 0.13 High 1.05 ± 0.16 1.42 ± 0.03 1.31 ± 0.26 1.42 ± 0.03

44
Figure 2.8. Total N concentrations (mean ± 1 standard error) during February 2008. (a.) Species accounted for a significant proportion of variance (F = 23.79, p = < 0.001; n = 12, n = 10 for C. laevigatus), (b.) treatment accounted for a lesser but nonetheless significant proportion of variance (F = 5.4, p = < 0.001; n = 16, n = 15 for high). Bars with different letters represent significant difference according to Waller-Duncan K-ratio t test (P<0.05).
0.000.200.400.600.801.001.201.401.601.802.00
C. jamaicense C. javanicus C. laevigatus C. polystachyos
Species
0.000.200.400.600.801.001.201.401.601.802.00
Control Intermediate High
Tot
al N
(%)
a.
b.
a b b
d cb a

45
Figure 2.9. Total TN concentrations (mean ± 1 standard error) of the four plant species over time. (a) Nursery plantings (n = 3) November 2007. (b) Mesocosm December 2008 (n = 12). (c) Mesocosm April 2008 (n = 12, n = 8 for C. laevigatus). (d) Mesocosm June 2008 (n = 12, n = 10 for C. laevigatus). Bars with different letters represent significant difference according to Waller-Duncan K-ratio t test (P<0.05).

46
0
0.5
1
1.5
2
0
0.5
1
1.5
2
0
0.5
1
1.5
2
0.0
0.5
1.0
1.5
2.0
C. jamaicense C. javanicus C. laevigatus C. polystachyos
Species
Tot
al N
(%)
b c d
d b a c
a
ba b c
b b a b
a.
b.
c.
d.

47
Aboveground Biomass
After 7 months of growth in the mesocosms, aboveground biomass DW had a
minimum value of ~ 0.86 g m-2 for C. laevigatus and a maximum value of ~ 5,494 g m-2
C. jamaicense. The ANOVA indicated that species accounted for the highest proportion
of the variance in the biomass data (F = 87.05, p < 0.0001) (Table 2.5) with mean species
biomass ranging from 52 g m-2 for C. laevigatus to ~ 3,452 g m-2 for C. jamaicense. The
ANOVA revealed that a significant proportion of variance was attributed to the
species*treatment interaction (F = 3.25, p = 0.014) (Figure 2.10). Further ANOVA
analysis within species, which included blocking by column, revealed that treatment was
nearly significant for C. jamaicense with a p-value of 0.0574, with a significant increase
in biomass with exposure to the high N level. Although C. polystachyos did not show
significant differences across the N treatments, mean biomass followed a decreasing
trend with values of ~603, ~408, and, ~ 200 g m-2 in the control, intermediate, and high N
concentration mesocosms, respectively.

48
Table 2.5. Results from the combined GLM ANOVA testing mesocosm species aboveground biomass.
DF Sum of Squares Mean Squares F-statistic P-Value
Model 14 904807323.78 6462908.84 20.49 <0.0001
Error 30 9461343.67 315378.12
Corrected Total 44 99942067.45
Biomass as Dependant Variable
Block (Column) 3 648558.88 216186.29 0.69 0.5679
Species 3 82364895.41 27454965.14 87.05 <0.0001
Treatment 2 10226698.07 511349.03 1.62 0.2145
Species*Treatment 6 6143013.54 1023835.59 3.25 0.0140

49
Figure 2.10. Mean aboveground biomass (mean ± 1 standard error) of the four plant species across the treatments (mesocosms) (n = 4). Bars with different letters represent significant differences according to the post hoc test of means (P<0.05).
0
1000
2000
3000
4000
5000
6000
C. jamaicense C. javanicus C. laevigatus C. polystachyos
g m
-2
Species
Control
Intermediate
High
bc d c cd a a c b a a a a

50
N Accumulation Rates
The mean calculated aboveground N accumulation rates (Table 2.6) ranged across
species from ~ 1.4 g TN m2 yr-1 for C. laevigatus to ~ 96.2 g TN m2 yr-1 for C.
jamaicense. The ANOVA showed a significant proportion of the variance was accounted
for by species (F = 111.01, p < 0.0001) and treatment (F = 4.77, p = 0.02) (Table 2.7).
The ANOVA also indicated that a significant proportion of variance was attributed to the
species*treatment interaction (F = 4.05, p = 0.005) (Figure 2.11).

51
Table 2.6. Total nitrogen accumulation rates (mean ± standard deviation) in June 2008 for different species and treatment mesocosms. The different letters represent the significant differences according to Waller-Duncan K-ratio t test (P<0.05) in the same species (n = 4, n = 3 for C. laevigatus, n = 2 for C. laevigatus in High).
Mesocosm Treatment (g TN m2 yr-1)
Species Control Intermediate High
C. jamaicense 81.28 ± 5.48a 79.02 ± 17.47a 128.26 ± 31.82b
C. javanicus 38.07 ± 4.44 28.65 ± 11.67 37.84 ± 17.61
C. laevigatus 0.1 ± 0.05a 1.46 ± 1.04ab 3.25 ± 3.96b
C. polystachyos 11.35 ± 8.81 8.76 ± 7.44 4.99 ± 5.65

52
Table 2.7. Results from the combined GLM ANOVA testing mesocosm species TN accumulation rates.
DF Sum of Squares Mean Squares F-statistic P-Value
Model 14 69132.27149 4938.0193 26.87 <0.0001
Error 29 5329.1474 183.7637
Corrected Total 44 74461.4189
Biomass as Dependant Variable
Block (Column) 3 625.0046 208.3349 1.13 0.3518
Species 3 61198.5806 20399.5269 111.01 <0.0001
Treatment 2 1751.3058 875.6529 4.77 0.0162
Species*Treatment 6 4468.1986 744.6998 4.05 0.0045

53
Figure 2.11. Mean aboveground TN accumulation (mean ± 1 standard error) of the four plant species across the treatments (mesocosms) (n = 4, n = 3 for C. laevigatus). Bars with different letters represent significant differences according to the post hoc test of means (P<0.05).
0
20
40
60
80
100
120
140
160
180
C. jamaicense C. javanicus C. laevigatus C. polystachyos
g T
N m
2y-1
Species
Control
Intermediate
High
b b b a a a a a a c c d

54
Discussion and Conclusions
Survival and Growth
At the conclusion of the experiment, C. jamaicense, C. javanicus, and C. polystachyos
had 100% survival rate in each of the three mesocosms, while C. laevigatus had considerably
lower survival rate. After one year in a field study by Brimacombe (2002), C. javanicus, C.
polystachyos, and C. laevigatus had survival rates of 96.5%, 59.3% and 76%, respectively.
Brimacombe (2002) stated that the physical appearance of C. laevigatus was quite poor and
showed that varying planting density or competition for C. laevigatus did not significantly affect
percent survival or health. Across the treatments, the mean biomass of Cyperus laevigatus
ranged from~3.72 g m-2 in the control treatment to ~90.64 g m-2 in the high treatment, however,
these differences were not significant. In Van Dyke’s (2001) study, which investigated the
potential use of C. laevigatus for wastewater treatment, C. laevigatus plants exposed to higher
nutrient levels were substantially taller and darker green in color than those in lower nutrient
levels. The difference in this study may have been due to the coconut coir logs. This indicated
that C. laevigatus was unsuccessful at establishing in this type of media and therefore did not
support Hypothesis 2.1. The November planting may have been another negative factor in C.
laevigatus performance as it is listed as a perennial in Erickson and Pottock’s (2006) Field
Guide. In addition, Van Dyke (2001) observed a cyclic dieback for C. laevigatus beginning in
October. Cyperus laevigatus seemed to be at a disadvantage from the start due to the young age
of the available nursery plant material which lacked substantial above and belowground biomass.
Brimacombe’s (2002) study started with “weak and spindly” C. laevigatus nursery plants and
achieved a 76% survival rate after a year; however these were out-planted in a field trial which

55
consisted of different wetland habitat soils and survivors were described as having quite poor
physical appearance. The successful establishment and survival of native riparian species C.
jamaicense, C. javanicus, and C. polystachyos in coconut coir log media supported Hypothesis
2-1.
Tissue TN Concentration
Hypothesis 2.2a was supported throughout the study as species continually accounted for
the greatest proportion of variance in tissue TN concentration. While differences in TN
concentration among species were apparent from nursery samples and continued throughout the
study, the pattern of accumulation changed over time as each species developed. This variation
among species and their tissue N concentration is supported by previous studies that investigated
the nutrient concentration among wetland plants in constructed wetland environments
(McJannet, Keddy et al. 1995; Greenway 1997); and by Boyd (1970; 1978) who observed
significant interspecific variation of aquatic plants in his field study. Differences in the nursery
TN concentrations likely represented the age difference among species and the highly variable
growing situation of different nurseries and their likely different nutrient addition rates.
Although data collection ended in June, a slight decline in combined species TN concentration
was observed from May to June. A longer study with regular temporal sampling would be
necessary to identify thresholds and long-term accumulation patterns of individual species.
The blocking effect from the combined ANOVA revealed that coir logs in position four,
located on the western edge of each mesososm, had a lesser but significant effect on TN
concentration. An explanation for this result includes the fact that the project site was located in
a valley where the early hours of sunlight were blocked by cliffs to the east. An edge effect was

56
also found in Tanner’s (1996) constructed wetland study which he equated to the exposure of
lateral as well as downward solar radiation. There may have also been a flow effect from the
reservoir t-pipe fittings which diverted more reservoir outflow to the western side of mesocosms.
During the first two months, treatment was a significant factor in the ANOVA which
might have been the result of higher N uptake into tissue by species at an early age. This was
supported by claims that during initial establishment (when nutrient storage compartments were
still expanding), net nutrient storage will be significant in removing N from constructed wetlands
(Tanner 1996). Shaver and Milillo (1984) have demonstrated that the efficiency of N uptake for
wetland plant species tends to decrease over time as available nutrient inputs increase. Tanner
(1996) suggested that long-term studies of tissue nutrient levels will likely reflect key ecological
traits of species, such as nutrient use efficiency, with either increasing growth to maximize
production or tending towards a more conservative strategy of nutrient accumulation. Overall,
the N addition treatment was not significant and therefore this did not support hypothesis 2-2b.
However, C. jamaicense showed significantly higher tissue TN concentrations in the highest
nutrient addition treatment. Cladium jamaicense Crantz, also native to the Florida Everglades, is
a slow-growing rhizomatous, perennial sedge commonly found in nutrient-poor freshwater
marshes. Miao (1997) and Lissner (2003) have studied C. jamaicense Crantz in Florida and
speculate that due to this species adaptability to low resource environments, it grows slowly, has
low population growth, long life cycles, low reproductive yield, and responds to resource
changes slowly; resulting in high nutrient storage to maximize benefits during times of stress.
Inter-species differences became even more significant in the latter part of the experiment
(Spring 2008). April results showed Cladium jamaicense, C. laevitagus, and C. polystachyos
with increased TN concentrations, whereas TN concentrations in C. javanicus had decreased.
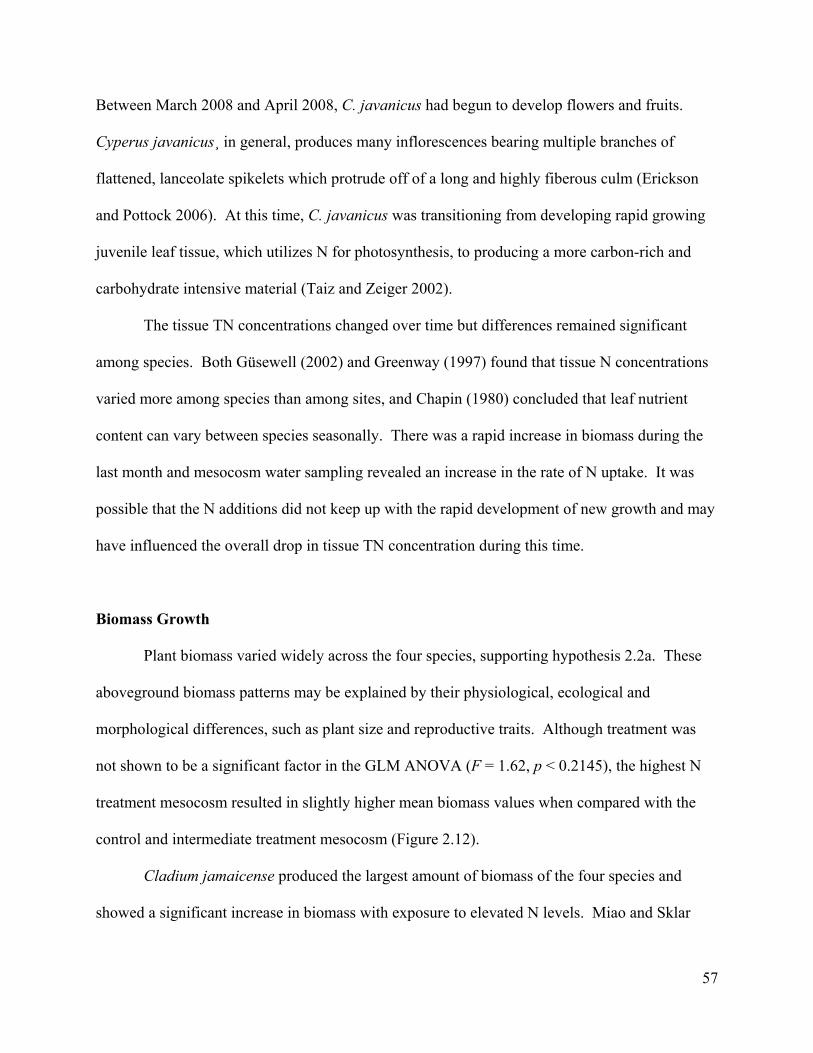
57
Between March 2008 and April 2008, C. javanicus had begun to develop flowers and fruits.
Cyperus javanicus¸ in general, produces many inflorescences bearing multiple branches of
flattened, lanceolate spikelets which protrude off of a long and highly fiberous culm (Erickson
and Pottock 2006). At this time, C. javanicus was transitioning from developing rapid growing
juvenile leaf tissue, which utilizes N for photosynthesis, to producing a more carbon-rich and
carbohydrate intensive material (Taiz and Zeiger 2002).
The tissue TN concentrations changed over time but differences remained significant
among species. Both Güsewell (2002) and Greenway (1997) found that tissue N concentrations
varied more among species than among sites, and Chapin (1980) concluded that leaf nutrient
content can vary between species seasonally. There was a rapid increase in biomass during the
last month and mesocosm water sampling revealed an increase in the rate of N uptake. It was
possible that the N additions did not keep up with the rapid development of new growth and may
have influenced the overall drop in tissue TN concentration during this time.
Biomass Growth
Plant biomass varied widely across the four species, supporting hypothesis 2.2a. These
aboveground biomass patterns may be explained by their physiological, ecological and
morphological differences, such as plant size and reproductive traits. Although treatment was
not shown to be a significant factor in the GLM ANOVA (F = 1.62, p < 0.2145), the highest N
treatment mesocosm resulted in slightly higher mean biomass values when compared with the
control and intermediate treatment mesocosm (Figure 2.12).
Cladium jamaicense produced the largest amount of biomass of the four species and
showed a significant increase in biomass with exposure to elevated N levels. Miao and Sklar

58
(1997) also showed C. jamaicense biomass to increase along a nutrient gradient of impacted and
referenced sites of the Florida Everglades. As mentioned for tissue TN concentration, this
species is adapted to low nutrient environments and to areas of frequent disturbance thus, the
response of increased growth during exposure to increased N levels may be an adaptation to
maximize benefits during times of stress (Chapin 1980; Miao and Sklar 1997). Cladium
jamaicense never produced flowers during the length of the experiment. However, numerous
new shoots from vegetative reproduction were observed to push easily through the coir log.
During the last few months, the erect caulines of C. jamaicense began to form a canopy.
Cyperus javanicus had the next highest biomass and produced new vegetative leaf
sheaths directly after planting. During the first few months of the experiment when baseline
nutrient additions were being adjusted for the mesocosms, C. javanicus responded quickly to a
decrease in nutrient level by ceasing growth and by senescence of older tissue material. After
nutrients were raised, this species quickly rejuvenated and persisted with competitive growth. At
the time of the biomass harvest, C. javanicus had produced multiple reproductive stems of which
a majority was in seed ripening, seed setting, and in the senescent stage of reproduction
(Brimacombe 2002). The proportion of reproductive material for C. javanicus likely influenced
final biomass results.
Interestingly, C. polystachyos had an inverse correlation with biomass growth and N
nutrient additions, which McJannet (1995) found to be a trend among 41 wetland plants. This
downward trend in biomass growth may reflect the nutrient tolerance level and/or growth habits
(i.e. reproductive characteristics) of this species. C. polystachyos was successful overall in
biomass growth and was able to compete in close quarters with C. jamaicense and C. javanicus
which, on average, produced ~ 9X more biomass. Cyperus polystachyos also developed a

59
distinct morphological feature throughout the study--the growth of reproductive stems and
flowers verses basal leaves. In the majority of individuals, reproductive material seemed to
outweigh basal leaf growth. Brimacombe (2002) reported 99% of out-planted C. polystachyos
individuals produced reproductive stems after one month. A more complete understanding of the
uptake potential for C. polystachyos would benefit from further study of its different
physiological components, for example, leaf verses stem nutrient concentrations. There was a
snail infestation in May 2008 which seemed to mainly affect C. polystachyos. This was quickly
brought under control through intensive hand removal. Other studies mentioned that Cyperus
polystachyos can have moderate pest issues, mainly aphids; however these did not appear to
affect the health of the plant (FLC 2001).
Cyperus laevigatus had the least biomass growth of all the species. This was not
surprising nor was it an indication of the lack of success for this species. This species is
generally much smaller in stature than the other species and tends to grow on the edge of water
bodies (Erickson and Pottock 2006). Position in mesocosm was not determined significant and,
during the latter part of the experiment, the most prolific culms of C. laevigatus were produced
by creeping rhizomes found in the interior of the mesocosms which were found through the thick
canopy of C. jamaicense and C. javanicus (Figure 2.13). Historically, C. laevigatus was used in
Hawai‘i for weaving mats and was recorded to reach lengths of 1-2 m.; today, however, most
culms in Hawai‘i fall within the range of 10-45 cm. (Van-Dyke 2001). Although our study did
not record length, observation and photographs show species within this range. Cyperus
laevigatus biomass growth generally increased with N additions but the differences across the
treatments were not significant.
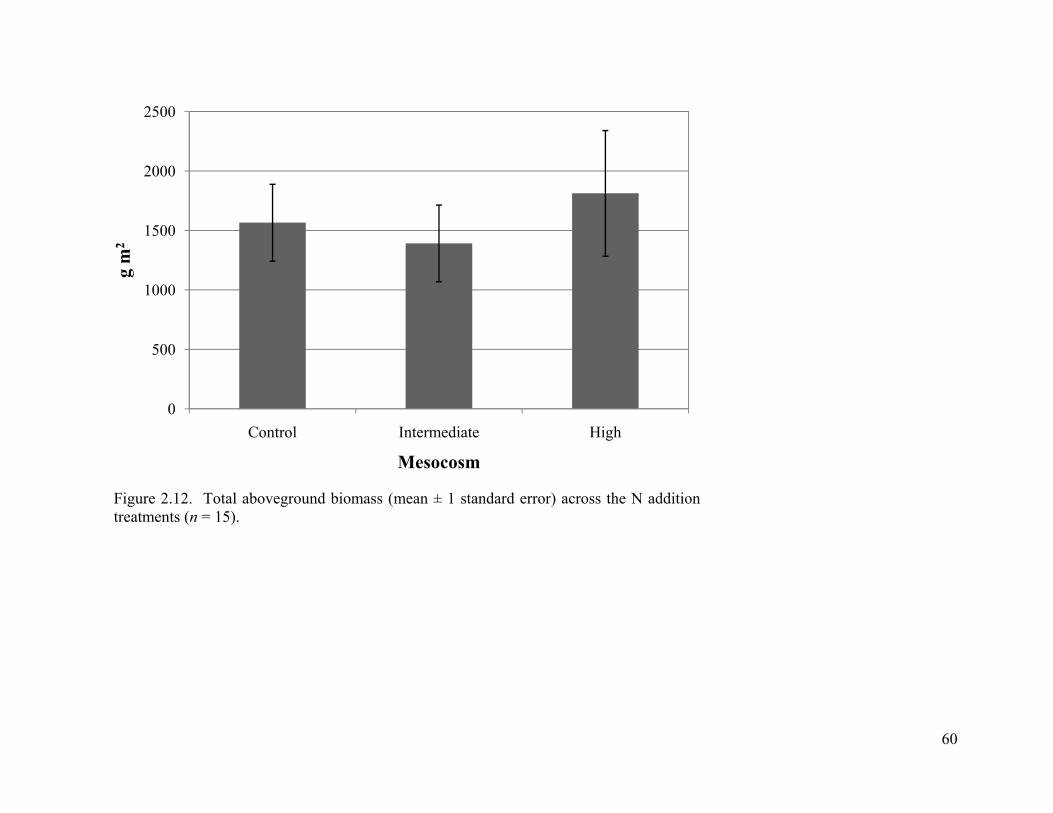
60
Figure 2.12. Total aboveground biomass (mean ± 1 standard error) across the N addition treatments (n = 15).
0
500
1000
1500
2000
2500
Control Intermediate High
g m
2
Mesocosm
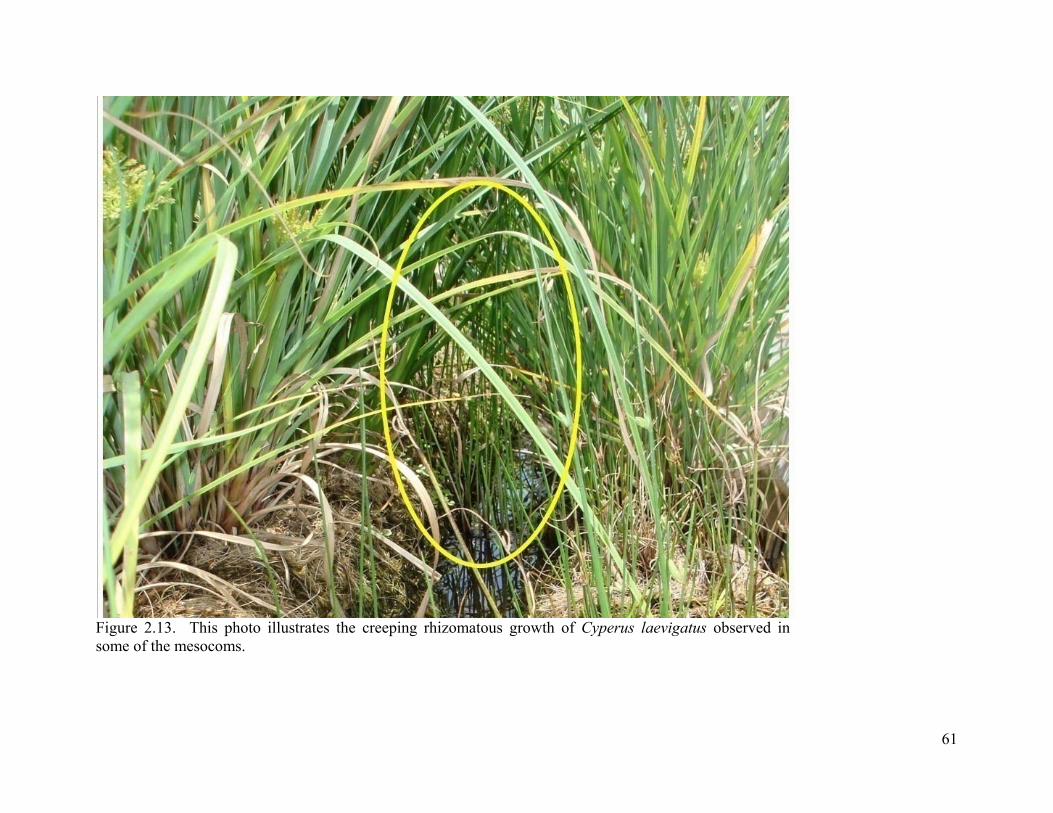
61
Figure 2.13. This photo illustrates the creeping rhizomatous growth of Cyperus laevigatus observed in some of the mesocoms.
62
Interestingly, this species has been a preferred candidate for wastewater treatment in
Hawai‘i (FLC 2001; Van-Dyke 2001). Our results, in agreement with Brimacombe’s
(2002) findings, showed that C. laevigatus requires high maintenance, dense planting,
and higher nutrients to attain successful establishment.
N Accumulation Rates
Tissue N accumulation rates varied widely among the four species, supporting
hypothesis 2.2a, but were not shown to vary significantly across N treatments. Nitrogen
accumulation for C. jamiacense was within a similar range of others studies (Miao and
Sklar 1997; Lissner, Mendelssohn et al. 2003), as well as, for Cyperus species (McJannet,
Keddy et al. 1995; Tanner 1996; Greenway 1997; Xu, Yan et al. 2006). Mean TN
accumulation rates for each species largely reflected the pattern shown with biomass
growth. Accumulation rates were calculated based on this seven-month trial in order to
best represent nutrient removal for restoration projects utilizing young nursery plants.
There was significant variation across species and maximum accumulation rates were
recorded in the larger species. Cladium jamaicense and Cyperus laevigatus showed the
most promise for N accumulation with increasing biomass growth, however, survival,
biomass growth, and accumulation rates need to be considered when making
management decisions for stream restoration. Cyperus laevigatus has shown promise for
its ability to treat wastewater with high removal rates (FLC 2001; Van-Dyke 2001) and
our study suggests that this species has potential to remove N at a competitive rate when
sufficient biomass is produced.

63
Tissue N accumulation rates were achieved under conditions of abundant N
supply and likely reflected key ecological traits of the species (Tanner 1996). Chapin
(1980) theorized that the differences in biomass and nutrient assimilation in plant tissue
are associated with different functions of plant growth and with plant responses to
contrasting resource habitats; plants seem to adjust resource allocation in response to
their immediate environment. Chapin (1980) also concluded that as soil nutrient levels
increase there is a corresponding increase in growth rate of species from fertile sites,
whereas species from infertile sites maintain lower growth rates with a combined increase
in tissue nutrient concentration. Multiple studies have supported this theory, and further
suggest that patterns of assimilation and storage may not be a universal feature of plants
from certain sites and that the developmental state of propagules may be more important
than biomass of the propagule (McJannet, Keddy et al. 1995; Tanner 1996; N. J. Willby
2001). McJannet’s (1995) study tested Chapin’s theory by using tissue nutrient content
of 41 wetland plants to predict the responses of groups of species to perturbations such as
fertilization and found that, in respect to N content, there was no significant difference
between infertile and fertile sites.
Cladium jamiacense was not reproductive during this trial, rather it concentrated
its growth on new shoots and developing leaf biomass. This species is adapted to low
nutrient environments and its overall success in biomass growth and TN accumulation
may relate to indirect correlations with morphological traits, such as the ratio of light
harvesting to supportive tissue, that confer a competitive advantage in particular
environments (Chapin, 1980).

64
This mesocosm experiment provided an ideal environment for a study using a coir
log medium and desired species with potential to accumulate excess N found in the
polluted surface waters of Waimānalo Stream. This experiment showed that TN was
assimilated into the tissues of the selected species at significantly different concentrations
throughout the experiment. Although the tissue TN concentrations were greatest with C.
jamaicense and C. laevatigus, the effect of biomass growth had an overwhelming effect
on accumulation potential and resulted in accumulation rates to be the greatest for C.
jamaicense and lowest for C. laevatigus. Selection of species for restoration in the field
should consider species that will produce abundant biomass and have the ability to store
substantial TN in its tissue.

65
Chapter 3: Field Installation of Pre-Planted Coir Logs in
Waimānalo Stream
Introduction
Waimānalo Stream, located in eastern Oahu, has remained on Hawai‘i’s 303(d)
listing of impaired waterways for over the past 10 years (HIDOH 1998; HIDOH 2006).
This listing is in large part due to excess nitrogen (N) loading from both point and non-
point sources within the Waimānalo watershed (Harrigan and Burr 2001; USEPA 2001;
Laws and Ferentinos 2003). In Hawai‘i and elsewhere, changes in land-use patterns such
as agricultural intensification, urban expansion, and stream hardening for flood control
have increased sediment and nutrient loading in streams and coastal regions (Peierls,
Caraco et al. 1991; Vitousek, Aber et al. 1997; Laws and Roth 2004; Bruland 2008).
Although point- and non-point sources account for substantial amounts of sediment and
nutrient delivery to Waimānalo’s aquatic ecosystems, an important component of this
problem is associated with the degradation and destruction of riparian buffer zones which
would normally help to minimize impacts of land runoff (Laws and Ferentinos 2003).
In an effort to improve the degraded condition of Waimānalo Stream, a Total
Maximum Daily Load (TMDL) assessment of pollutants was conducted to identify areas
where sediments and nutrients exceed the stream’s capacity for assimilation and
recycling (Harrigan and Burr 2001). Following this assessment, a report for an effective
implementation program concluded that the highest priority projects would be ones that:
1) directly benefit the immediate proximity of the stream (i.e. instream, riparian, or
adjacent to stream) and/or, 2) reduce pollutants in the identified segments of the
watershed where the TMDL’s are currently not being met (USEPA 2001).

66
The field installation phase focused on sections along Waimānalo Stream’s two
main tributaries: Kahawai Stream to the southeast and Waimānalo Stream to the
northwest, which merge roughly 0.5 km below the Kalaniana’ole Highway (Harrigan and
Burr 2001; KBAC 2002; Laws and Ferentinos 2003) (Figure 1.1). Unless otherwise
noted, the term “Waimānalo Stream” will include both Waimānalo and Kahawai
tributaries. The stream channel of this reach is managed as a floodway to convey water
off of land and to the sea. Stream banks are regularly ‘maintained’ by being sprayed with
herbicide down to the water edge to eliminate vegetation (USEPA 1998). This repeated
removal of vegetation is necessary only because of the current riparian vegetation
consists mostly of non-native species such as Pennisetum purpureum (cane grass),
Panicum maximum (guinea grass), and Coix lachryma-jobi (Job’s tears). The clearing of
riparian trees has reduced the shading and has lead to the proliferation of herbaceous
vegetation within the channel (Laws and Ferentinos 2003). These alien species alter the
function of the stream by creating a thick matt of biomass that restricts stream flow and
causes flooding during heavy rains as well as lowering vegetative diversity (Laws and
Ferentinos 2003). Selecting native vegetation for establishment on the riparian banks of
Waimānalo stream will support both species richness and composition. The number,
relative abundance, identity, and interaction of species all affect ecosystem processes
(Chapin, Matson et al. 2002). Riparian plantings often act as a sink for nutrients from
runoff waters because they can remove nutrients in both surface and shallow groundwater
(Pinay, Fabre et al. 1992).
The streams in Waimānalo watershed, as well as streams throughout Hawai‘i, are
prone to episodic flash floods and prolonged periods of low flows (Tomlinson and

67
DeCarlo 2003). The combined effects of riparian tree removal, repeated herbicide
application, and flash floods have decreased the stream’s physical structure which has led
to substantial bank erosion and increased sediment loss to surface waters. This presents a
challenge for restoration projects attempting to establish vegetation in affected and
exposed riparian substrate.
An EPA Bioassessment Report for Hawai‘i rated the health of riparian areas
based upon the width of the vegetated zone and understory coverage, stating that
vegetative protection is most critical within five meters of the water’s edge (Kido 2002).
Ecologically-intact riparian areas naturally prevent erosion, retain and recycle nutrients,
modify local microclimates, and sustain food webs that help support a diverse
assemblage of fish and wildlife (NRC 2002). Restoring riparian vegetation along
Waimānalo stream is a viable, cost-effective, and ‘natural’ surface water treatment
technology known as phytoremediation. Phytoremediation can be defined as the clean-up
of pollutants primarily mediated by photosynthetic plants (Horne 2000). Studies which
quantify the efficiency of wetland plants for phytoremediation purposes do so by
analyzing the nutrient concentrations in plant biomass. Many of these studies have
shown that nutrient uptake rate by species can vary widely even when experiencing the
same nutrient availability (McJannet, Keddy et al. 1995; Tanner 1996; Tanner 2001;
Greenway 2005; Xu, Yan et al. 2006). Different nutrient accumulation rates may be due
to inherent physiological and key ecological traits (Chapin, Bloom et al. 1987). In
utilizing the concepts of phytoremediation along the riparian banks of Waimānalo
Stream, the selection of species, design, installation method, and mitigation success
become important factors. Quantifying nutrient accumulation rates by species can

68
indicate how a species or group of species will perform in varying nutrient levels (Miao
and Sklar 1997; N. J. Willby 2001), and will provide further guidance for the
management of stream remediation efforts.
Selection of native species that will survive and restore valuable functions
requires an ecosystem perspective that encompasses the concepts that define the current
state of Waimānalo stream (Ehrenfeld and Toth 1997). Plants were selected based on
results from the previous chapter, Planted Coir Log Nutrient Addition Experiment. The
field design implemented stream bioengineering techniques with the use of coconut coir
logs. Pre-planted coir logs have been successfully used in the continental U.S. for toe
stabilization along stream banks to prevent erosion and establish vegetation (Allen and
Leech 1997), however this technique has neither been demonstrated with Hawaiian plants
nor under the highly variable flow rates found in Hawai‘i. Installation of pre-planted coir
logs along stream banks will take advantage of log stability and bank protection to
encourage roots to grow into the bank as the coir material degrades while hopefully being
able to withstand Hawai‘i’s intense flash floods.
The main purpose of this chapter is to test the utilization of pre-planted coir logs
in the toe zone and along the banks of Waimānalo stream. The toe zone is the portion of
the stream bank between the bed and average normal stage flow and is a zone of high
stress often undercut by currents and resulting in bank failure unless preventative or
corrective measures are taken (Allen and Leech 1997).
Objectives and Hypothesis
The specific objectives and hypotheses of this chapter are outlined below.

69
Objective 3-1: Monitor nitrate, ammonium, and total dissolved N from Waimānalo and
Kahawai streams.
Objective 3-2: Install and monitor coir logs planted with native species along 92 meters
(m) of each stream.
Hypothesis 3-1: Plants in coir logs of Kahawai stream will have higher tissue N
concentration and aboveground biomass than plants in coir logs of Waimānalo stream as
Kahawai stream has consistently higher surface water N levels than Waimānalo stream.
Materials and Methods
Species Selection
The previous chapter evaluated candidate species for the field installation phase
of this project. Based on these results, the following three species were selected for field
installation on coir logs due to their survival rate, aboveground biomass growth, and
tissue TN accumulation: Cladium jamaicense, Cyperus javanicus, and Cyperus
polystachyos.
Pre-Planted Coir Logs
Sixty coconut coir logs, made from 100% coconut coir and measuring 3.05 m in
length with a diameter of 0.20 m, were planted in February 2008 at the Hui Ku Maoli Ola
Nursery located in Kaneohe, (21°24'42.58"N, 157°49'4.61"W). Each log was planted
with one of the three species with an individual every 0.15 m, totaling 18 plants per log.
Logs were cared for at the nursery through June 2008 with overhead irrigation and

70
occasional fertilization. Cyperus polystachyos was replanted during this time at the
nursery due to a snail infestation which decreased aboveground biomass.
Experimental Site and Procedures
In June 2008, coir logs were installed in both Waimānalo Stream and Kahawai
Stream sites. Thirty logs per stream covered 92 m of each stream. Logs were installed
along the toe of the stream ensuring that the bottoms of the logs were either partly
submerged or were at least touching the water. Logs were secured to the toe using 0.61 x
0.05 m wooden stakes, typically using 6 – 8 stakes per log. Logs were placed in a
randomized design along each bank, where blocks were based upon bank side to account
for any differences in slope, shading, water depth, or weeds. Erosion matting was laid
out along the bank and individual native plants were planted in the riparian area between
the installed coir logs and before the bank’s rising slope to impede competition from
weeds during the establishment phase.
Challenges Encountered
A major set-back for the field experiment arose when personnel from the
Department of Land and Natural Resources (DLNR) performed their regular herbicide
application and sprayed through the designated restoration sites and installed coir logs.
Waimānalo Stream was sprayed in early June and Kahawai Stream was sprayed in late
August. Due to the lethal effects of the herbicides on the native plants growing in the
coir logs at both experimental sites, the decision was made to attempt to utilize existing
log material for replanting. However, the existing coir logs were showing signs of

71
degradation and instability from water and solar exposure. Thus, new coir logs were
purchased for planting and reinstallation in both streams on November 28, 2008. Due to
budgetary limitations, 12 new coir logs were used to replace 12 of the existing logs for a
scaled down version of the original experimental design (Figures 3.1, 3.2). New logs,
which were 3.05 m in length and 0.25 m in diameter, were planted with the same method
as the original logs and installed along each stream section. Individual plants were also
planted in degraded coir logs and in the riparian zone between logs and bank slope;
however these were not analyzed for biomass or tissue concentration.
New logs and plants were installed in stream sections on November 28th, 2008.
After this installation, a significant rainfall event occurred on December 11th, 2008.
Rainfall data were acquired from the Waimānalo sampling station (National Weather
Service, station HI-13) (Figure 3.3). On this day a flash flood event occurred on which
the streams were filled to capacity and restorated stream reaches were inundated by
several meters of water. This flood event led to the loss of three logs along one of the
banks of Waimānalo stream, and although Kahawai stream did not lose any logs, one log
was covered with heavy sediment which suffocated the C. javanicus plants (Figure 3.4).

72
Figure 3.1. The Waimānalo Stream reach with coir log layout and experimental log placement.

73
Figure 3.2. The Kahawai Stream reach with coir log layout and experimental log placement.

74
Figure 3.3. Rainfall data during the December 2008 storm event. Data obtained from the National Weather Service (NWS) Waimānalo station (HI13).

75
Figure 3.4. The experimental coir log layout after the December 28, 2008 flood event.

76
Stream Sample Collection and Laboratory Analysis
Water Collection
Surface water was sampled from both upstream and downstream areas of the two
stream sections. Samples were collected in 50 mL plastic centrifuge tubes and
immediately put in a cooler with ice. Stream physical and chemical water properties,
such as pH and temperature were monitored using a handheld YSI Model 556 Multi
probe system (YSI Instruments, Yellow Springs, OH). Water samples were analyzed for
total nitrogen (TN), total dissolved nitrogen (TDN), nitrate + nitrite nitrogen (NO3--N +
NO2--N), and ammonium nitrogen (NH4-N). Quarterly water samples were sent to the
Marine Science Analytical Lab (MSAL) at UH Hilo for TDN analysis determined
through the use the ASTM Method D5176 (ASTM 1995). Bi-monthly samples were
analyzed at the University of Hawai‘i Mānoa Agriculture Diagnostic Service Center
(ADSC) Laboratory for TN analysis using the micro-Kjeldahl method (CTAHR 2000).
Vegetation Sampling
Biomass and Tissue Collection
Due to the set-back with the herbicide application, plants in the experimental coir
logs grew for three months before a destructive harvest was used to measure tissue TN
concentration, aboveground biomass, and determine TN accumulation. Biomass
sampling consisted of randomly selecting 8 replicates from each remaining experimental
coir log. The aboveground biomass was collected and dried to a constant weight in a
forced draft oven at 40°C for 48-72 hours. After biomass weights were recorded, dried

77
material was subsampled and ground into a homogeneous powder using a ball mill. Total
N values of the plant tissues were determined via combustion with a LECO CN2000
analyzer (LECO, Warriewood, Australia) at the ADSC.
Tissue TN Concentration and Accumulation Rates
Aboveground tissue TN accumulation rates (g TN m2 yr-1) for each species were
calculated using TN data from the final month of the experiment. The TN concentration
was multiplied by the aboveground biomass (g m-2), and accumulation rates were
calculated based on the three-month plant establishment period in the streams.
Statistical Analyses
Tissue TN concentration and biomass were compared among species and between
stream locations. The surface area of harvest (m2) for each plant was not assumed to be
flat but was calculated using the top half of the cylindrical coir log as in Chapter 2
(Figure 2.4). Analysis of the data involved a general linear model (GLM) analysis of
variance (ANOVA) using the main effects of species, stream, and their interaction
(species*stream). A randomized complete block design over two streams was used for
analysis, however, the loss of logs along one of the banks of Waimānalo Stream and the
loss of one species in Kahawai Stream compromised the blocking effect. Differences in
main effects were tested using a GLM ANOVA and the Waller-Duncan K-ratio t test to
determine effects from exposure to elevated N levels. Species*treatment effects were
tested using a post hoc test of means (LSD). All statistical analysis were conducted with
SAS version 9.1.3 (SAS Institute, Cary, N.C. U.S.A.).

78
Results
Water Sampling
The physiochemical characteristics of the surface water in both streams were
monitored throughout the project beginning in September 2007 and continuing through
January 2009. The mean physiological characteristics ensured no major differences
between upstream and downstream, but certain showed trends for the differences between
each stream (Table 3.1). Waimānalo Stream consistently had lower water temperatures
and had higher pH and DO than Kahawai Stream. Surface water N levels were
consistently greater in Kahawai Stream than in Waimānalo Stream. Nitrate- + Nitrite-
Nitrogen accounted for most of the TDN at all times, with a median ratio (Nitrate +
Nitrite / TDN) of 100% for Kahawai Stream and 74% for Waimānalo Stream. The mean
N data of the samples collected were compared with the State’s inland water quality
standards as defined by Hawai‘i’s Administrative Rules (HIDOH 2004)(Table 3.2). For
both streams, surface water N data exceeded that of the State’s water quality standards
for TN (0.25 mg L-1 for the wet season and 0.18 mg L-1 for the dry season) and for
Nitrate+Nitrite-Nitrogen (0.07 mg L-1 for the wet season and 0.03 mg L-1 for the dry
season) (Figure 3.5).

79
Table 3.1. Mean stream physiochemical characteristics of Kahawai and Waimānalo streams at locations upstream and downstream of remediation site from September 2007 through February 2009 (n = 15).
Stream Kahawai Waimānalo Parameter Upstream Downstream Upstream Downstream Dissolved Oxygen (%) 25.51 36.62 46.43 33.53 Temperature (oC) 28.22 28.31 27.57 27.75 pH 7.67 7.73 8.60 8.53 Conductivity (us cm-1) 0.46 0.42 0.41 0.40 Total Dissolved Solids (g L-1) 0.30 0.27 0.27 0.26 Salinity (‰) 0.22 0.20 0.20 0.19

80
Table 3.2. Mean concentration (mg L-1) of Total Nitrogen (TN) and Nitrate- + Nitrite-Nitrogen collected in Kahawai and Waimānalo Streams from September 2007 through February 2009, and compared with the State water quality standards* during the wet and dry season** and during storm event***.
Stream Nitrogen (mg L-1)
Standard* Waimānalo Kahawai
Wet Dry Wet Dry Storm Wet Dry Storm
TN 0.25 0.18 1.18 0.30 N/A 5.50 2.49 N/A
NO3-+NO2
+ 0.07 0.03 1.06 0.22 2.94 5.47 4.09 5.10
* DOH (2004) Chapter 11-54; Inland water criteria. Geometric mean not to exceed the given value (HIDOH 2004) ** Wet Season = November 1 - April 30 (n = 10)
Dry Season = May 1 - October 31 (n = 4) *** Storm Event on December 11, 2008
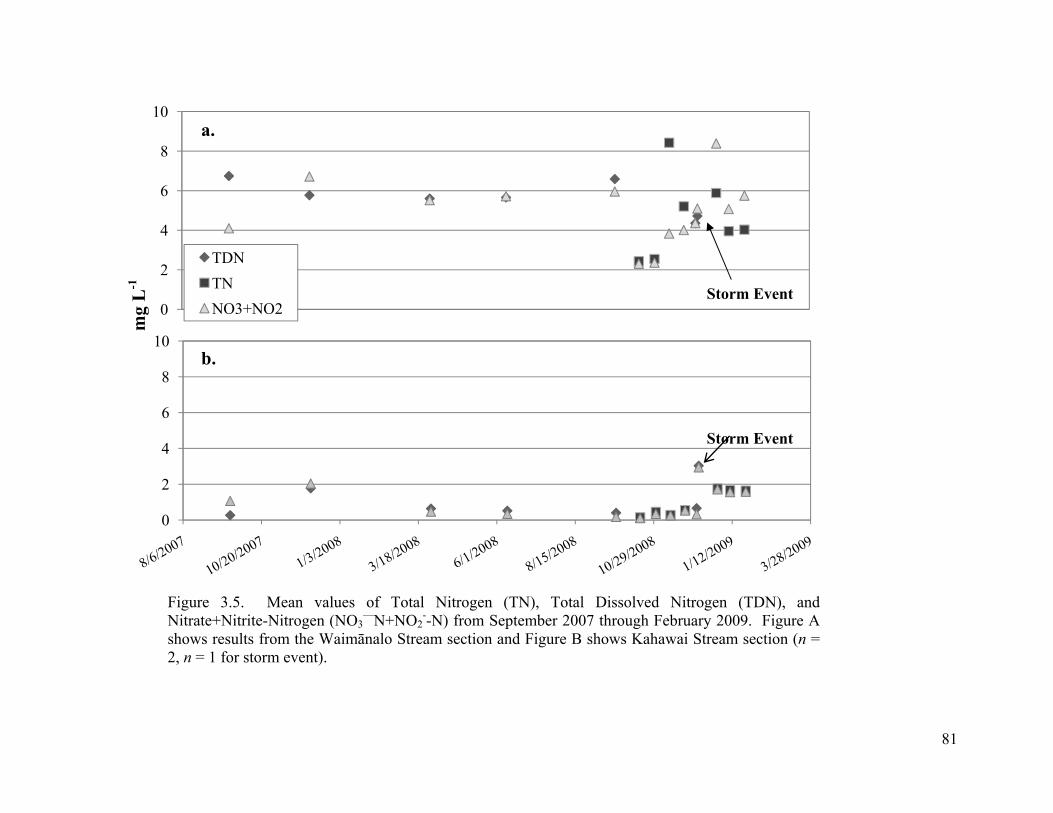
81
Figure 3.5. Mean values of Total Nitrogen (TN), Total Dissolved Nitrogen (TDN), and Nitrate+Nitrite-Nitrogen (NO3
—N+NO2--N) from September 2007 through February 2009. Figure A
shows results from the Waimānalo Stream section and Figure B shows Kahawai Stream section (n = 2, n = 1 for storm event).
0
2
4
6
8
10
TDNTNNO3+NO2
0
2
4
6
8
10
mg
L-1
a.
b.
Storm Event
Storm Event

82
Vegetation Sampling
Growth and Survival:
Root establishment in the coir logs at the nursery was successfully accomplished
using overhead irrigation and the pre-planted coir log survival rate was 100%. The
success of the coir log installation in stream was affected by the mid-December flooding
event. While this rainfall event occurring 13 days after plant establishment into the new
coir logs, survival rates of three species in the remaining logs were 96, 93, and 79% for,
C. jamaicense, C. javanicus, and C. polystachyos, respectively. Cyperus polystachyos
had a survival rate of 100% in Waimānalo Stream, compared to 57% survival rate in
Kahawai Stream. C. jamaicense had a survival rate of 100% in Waimānalo Stream and
93% in Kahawai Stream. C. javanicus had a 93% survival rate for both Waimānalo and
Kahawai Streams.
Tissue TN Concentration
An analysis of the data from both streams with a GLM ANOVA revealed that
stream location accounted for the greatest proportion of variance in the tissue N
concentration data (F = 21.55, p < 0.0001) (Table 3.3, Figure 3.6). According to the
ANOVA, species also accounted for a lesser but significant proportion of the data (F =
17.16, p < 0.0001), as did the stream*species interaction (F = 4.38, p < 0.0169). The post
hoc LS means test (P<0.05), indicated that C. polystachos had significantly higher tissue
TN than all other species in Kahawai Stream, whereas C. javanicus had significantly

83
Table 3.3. Results from the combined GLM ANOVA testing mesocosm species tissue TN concentration (%).
DF Sum of Squares Mean Squares F-statistic P-Value
Model 5 4.2477 0.8495 11.35 <0.0001
Error 58 4.3418 0.07489
Corrected Total 63 8.5895
Tissue TN Concentration as Dependant Variable
Species 2 2.5696 1.2848 17.16 <0.0001
Stream 1 1.6135 1.6135 21.55 <0.0001
Species*Stream 2 0.6556 0.3278 4.38 0.0169
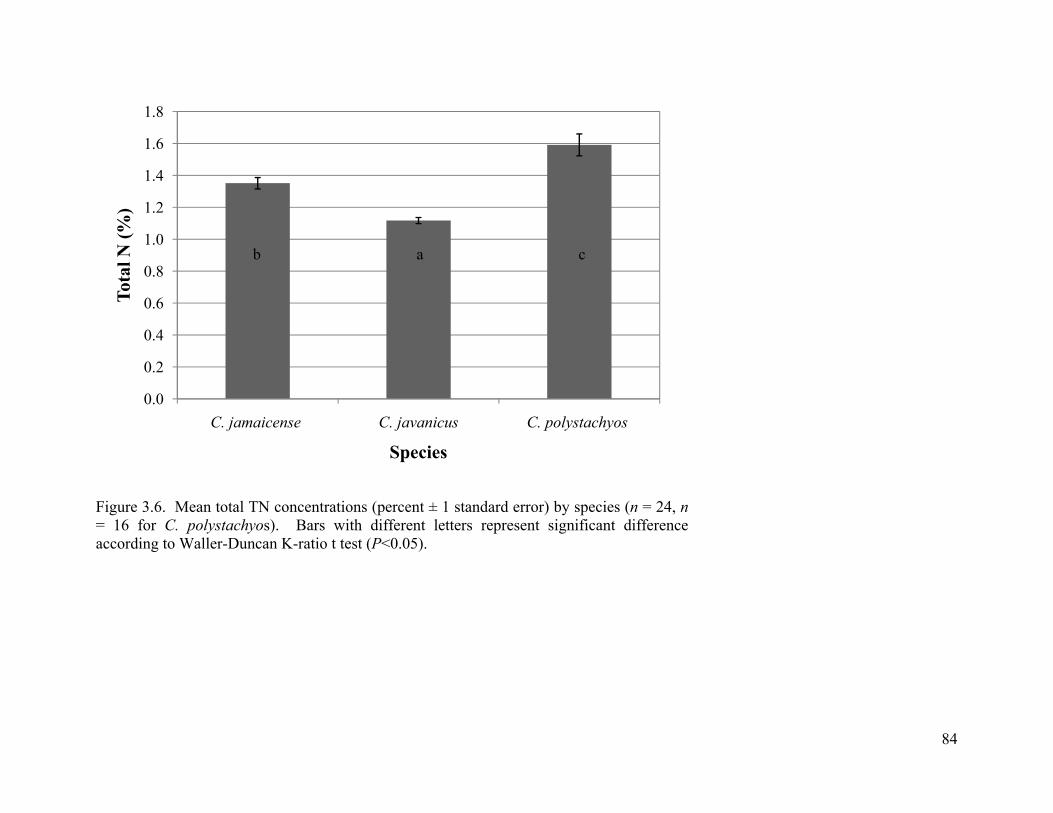
84
Figure 3.6. Mean total TN concentrations (percent ± 1 standard error) by species (n = 24, n = 16 for C. polystachyos). Bars with different letters represent significant difference according to Waller-Duncan K-ratio t test (P<0.05).
0.0
0.2
0.4
0.6
0.8
1.0
1.2
1.4
1.6
1.8
C. jamaicense C. javanicus C. polystachyos
Tota
l N (%
)
Species
a cb

85
lower tissue TN than the other species in both Waimānalo Stream and Kahawai Stream
(Figure 3.9a).
Biomass Growth
After three months in the streams, the minimum value for aboveground biomass
growth was 2.2 g m-2 for C. jamaicense while the maximum growth value was 304.4 g m-
2 for C. javanicus. Across both streams, the GLM ANOVA indicated that species
accounted for the highest proportion of the variance in the biomass data (F = 13.05, p <
0.0001) (Table 3.4, Figure 3.7), with mean species biomass ranging from 16.6 g m-2 for
C. jamaicense and 82.35 g m-2 for C. javanicus. The post hoc test of means (P<0.05),
indicated that Cyperus javanicus had significantly higher mean values within each stream
in comparison to C. jamaicense and C. polystachyos, and showed significant differences
in biomass with greater growth in Kahawai Stream (Figure 3.9b).

86
Table 3.4. Results from the combined GLM ANOVA testing mesocosm species tissue biomass growth (g DW m2).
DF Sum of Squares Mean Squares F-statistic P-Value
Model 5 81915.2750 16383.0550 7.05 <0.0001
Error 58 134688.2606 2322.2114
Corrected Total 63 216603.5356
Biomass (g DW m2) as Dependant Variable
Species 2 60623.6169 30311.8084 13.05 <0.0001
Stream 1 238.8834 238.8834 0,10 0.7496
Species*Stream 2 9053.8868 4526.9434 1.95 0.1516
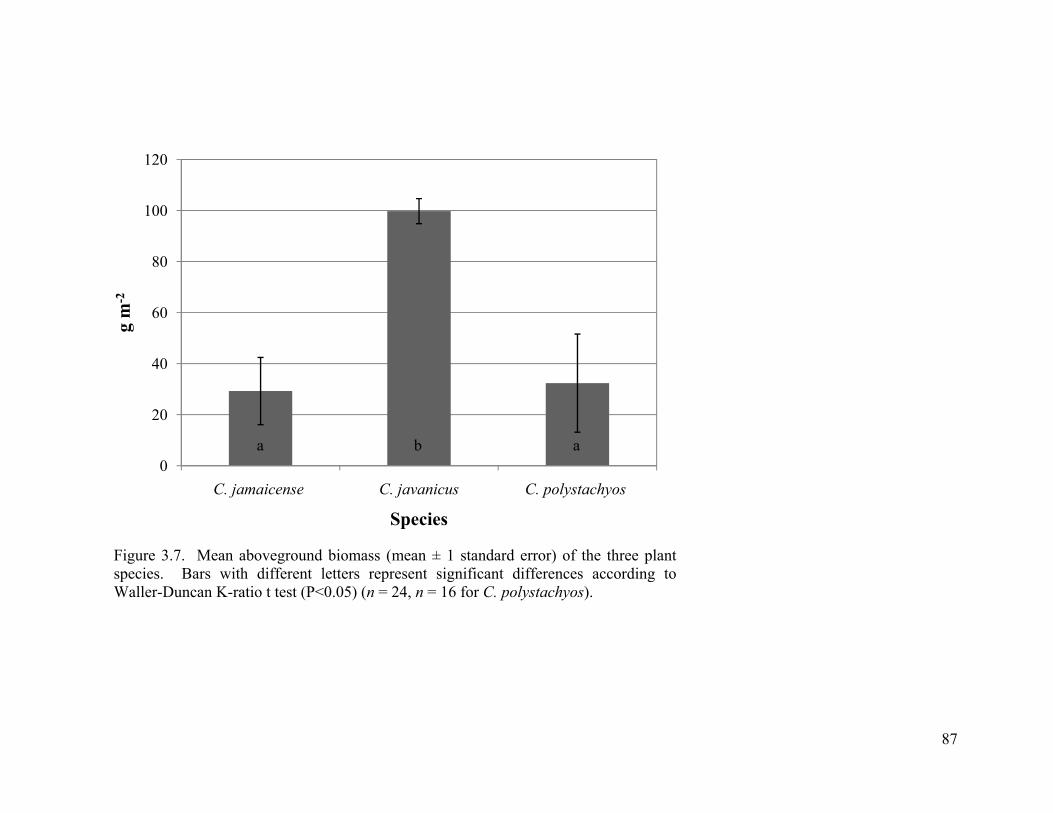
87
Figure 3.7. Mean aboveground biomass (mean ± 1 standard error) of the three plant species. Bars with different letters represent significant differences according to Waller-Duncan K-ratio t test (P<0.05) (n = 24, n = 16 for C. polystachyos).
0
20
40
60
80
100
120
C. jamaicense C. javanicus C. polystachyos
g m
-2
Species
b a a

88
Total N accumulation rates
The combined GLM ANOVA revealed that species accounted for the greatest
proportion of variance in the TN accumulation rates (g TN m-2 yr-1) (F = 6.93, p < 0.02)
(Table 3.5). According to Waller Duncan’s t-test (P<0.05), total tissue TN accumulation
rates C. javanicus were significantly greater than the two other species (Figure 3.8). The
post hoc LS means test (P<0.05) also indicated that C. javanicus had significantly greater
accumulation rates in than the other species in both stream, and the accumulation rate for
C. javanicus in Kahawai Stream indicated only slight significance (P=0.09) over
Waimānalo Stream. (Figure 3.9c).

89
Table 3.5. Results from the combined GLM ANOVA testing mesocosm species tissue TN accumulation rates (g TN m2 y-1).
DF Sum of Squares Mean Squares F-statistic P-Value
Model 5 1553842.183 310768.437 4.54 0.0015
Error 58 3974304.982 68522.500
Corrected Total 63 5528147.167 4.54
Tissue TN accumulation (g TN m2 y-1) rate as Dependant Variable
Species 2 945664.7433
Stream 1 44724.4642
Species*Stream 2 236545.0631

90
Figure 3.8. Mean total N accumulation rates (mean ± 1 standard error) by species (n = 24, n = 16 for C. polystachyos). Bars with different letters represent significant difference according to Waller-Duncan K-ratio t test (P<0.05).
0
100
200
300
400
500
600
C. jamaicense C. javanicus C. polystachyos
g T
N m
-2yr
-1
Species
aba

91
Figure 3.9. Mean values of the three species (mean ±1 standard error) in the two stream sections. (a) Total nitrogen (TN) concentrations. (b)Aboveground biomass. (c) Total nitrogen (TN) accumulation rates. Bars with different letters represent significant differences according to the post hoc LSD test of means (P<0.05). (n = 8 in Waimānalo Stream; n = 16, n = 8 for C. polystachyos in Kahawai Stream)

92
0.0
0.5
1.0
1.5
2.0
2.5
Tota
l N (%
)
Waimānalo Stream
Kahawai Stream
0
20
40
60
80
100
120
140
g m
-2
0
100
200
300
400
500
600
700
C. jamaicense C. javanicus C. polystachyos
g T
N m
-2yr
-1
a. b.
c.
a b b b b c
b c ab a a a
a b b b b c

93
Discussion and Conclusions
Water Sampling
Total dissolved N levels in surface water of Kahawai Stream were consistently
higher than levels in Waimānalo Stream. Nitrate+Nitrite accounted for the majority of
TN in both streams, however much more so in Kahawai Stream. This increase is likely
due to the land use in the area being primarily intensified agriculture and greenhouse
nurseries. An increase of TDN was observed in Waimānalo Stream during the December
storm event. These results followed the same patterns reported in Laws and Ferentino’s
(2003) study of Waimānalo Stream, where they acknowledged that the likely sources for
the elevated inorganic N are from animal waste, cesspool seepage, and fertilizer use, and
that high nitrate levels were not surprising given the oxidizing stream environments.
Laws and Roth (2004) considered the effects of stream modification and the hardening of
the stream bed in Waimānalo Stream to which the absence of sediments has shifted
metabolism toward autotrophy and stated that the absence of riparian shading vegetation
has further enhanced this ecosystems deterioration.
Vegetation Sampling
Survival and Growth:
During the nursery pre-planting phase, there was a snail infestation with C.
polystachyos, which required this plant to be replaced due to the heavy grazing of
aboveground biomass. This same type of snail infestation occurred during the mesocosm
experiment, but due to the low number of plants in the mesocosm this problem was

94
controlled by persistent hand removal. Cyperus polystachyos has been reported to have
moderate pest issues (mainly from aphids) (FLC 2001). This snail infestation proved to
be a problem at the nursery, which was likely due to the controlled environment which
lacks predation and allowed snail populations to multiply.
Hawai‘i experiences a wet season from November through April and a dry season
from May through October (Almanac 2009). Major widespread rains account for the
bulk of the precipitation and occur several times during each wet season, but are
infrequent in the dry season. Approximately 50% of the normal annual rainfall occurs in
the three months of December through February, and 80% in the six months of the wet
season; June and July are generally the driest months for most areas (Almanac 2009). In
the original experimental design, coir logs were installed in June to allow roots to
penetrate the logs and anchor plants to the bank before the wet season. Installing logs
and plants in the stream during the wet season was not ideal, and although four out of
twelve coir logs were lost in the December 2008 storm event, plant survival on the
existing logs was successful. The wet season in Hawai‘i experiences shorter day lengths
and increased high cloud cover which may have impeded photosynthetic rates and
biomass growth. The previous mesocosm experiment observed a tremendous increase in
biomasss growth during the spring months. A longer-term stream evaluation which
lasted through the spring and summer months may have shown growth patterns similar to
that of the mesocosm growth in which C. jamaicence would have had the highest
biomass growth.
Survival rates of plants in the coir logs were similar to those observed in the
mesocosm experiment. The high survival rates in the field installation were impressive

95
given the challenging conditions. For example, Waimānalo watershed received a high
intensity rainfall event in mid-December that resulted in a flash flood which exceeded the
holding capacity of the stream. This extreme event occurred only three weeks after coir
log and plant re-installation which tested the plants and their newly establishment roots.
These developing plant roots had not yet penetrated into the riparian substrate and the
coir logs proved to be a valuable method for young plants to rapidly and successfully stay
attachment to the stream bank.
Tissue TN Concentration
Tissue TN concentration varied widely for the three test species. This
interspecific variability followed similar trends to that of the mesocosm experiment and is
supported by multiple studies (McJannet, Keddy et al. 1995; Tanner 1996; Greenway
1997). Stream location accounted for the greatest proportion of the variability in tissue N
which was likely due to the difference in TN exposure within the two streams, as well as,
to the young age of the plant material. Tissue TN levels from the mesocosm experiment
showed marginally significant correlation with N exposure, which was more pronounced
for C. jamaicense. The young age of planted individuals in stream may have exaggerated
N uptake capacity due to the developing nutrient storage compartments which were still
expanding in young tissues (Tanner 1996). Vegetation nutrient concentrations tend to be
highest early in the growing season, decreasing as the plants mature and senesce
(Vymazal 2007).
Cladium jamaicense responded to the different stream locations with significantly
increased tissue TN tissue concentration in Kahawai Stream. This was supported by its

96
performance across the increasing N treatments of the mesocosm experiment.
Interestingly, C. polystachos developed significantly greater biomass in Waimānalo
Stream than the other species and had significantly higher TN concentration than the
other species in Kahawai Stream. In comparison with stream, survival, and biomass data,
C. polystachos’s exposure to elevated N levels increased its tissue TN concentration and
negatively affected survival rate and biomass growth. This was supported by the
mesocosm results, where C. polystachos had an inverse correlation with biomass growth
and N exposure.
Aboveground Biomass
Biomass growth followed similar trends found in the mesocosm experiment,
where C. polystachyos produced less biomass in the higher N environments and C.
javanicus has high growth across varying N levels. Growth for C. polystachyos was
significantly less in Kahawai than in Waimānalo Stream, with no indication of pest
problems for plants in either stream. Cyperus polystachyos planted outside of coir logs
were observed to proliferate and spread into the riparian zone of Waimānalo Stream.
Erickson and Puttock (2006) describe C. polystachyos as growing well in dry or wet soils,
particularly in open disturbed mesic coastal zones. Cladium jamaicense did not produce
the high biomass results which were observed in the mesocosm experiment. This may be
due to the climatic effect of the wet season or to the short duration of the field
experiment. This also may have been due to the theory that C. jamaicense is adapted to
low nutrient environments (Miao and Sklar 1997; Lissner, Mendelssohn et al. 2003).
Chapin (1980) hypothesized that the physiology of a species adjusted to an infertile

97
environment will have inherently low growth rates as it functions closer to its optimal
growth and metabolic rate. Further investigation of the belowground biomass may reveal
that this species had significant root development and might have emerged with abundant
vegetative growth in the spring, as was observed in the mesocosm experiment.
N Accumulation Rates
Mean TN accumulation rate for the three tested species reflected the same pattern
as shown with biomass growth where C. jamaicense and C. javanicus was higher in
Kahawai Stream than in Waimānalo Stream and C. polystachyos showed the opposite
trend. Unfortunately, these plant N accumulation rates represent a short duration in the
stream environment, and may not be representative of the species annual accumulation.
However, recognition that biomass had a strong effect on TN uptake by species was
supported by both the mesocosm and the field experiments. Vymazal (2007) stated that
the potential rate of nutrient uptake by plants is limited by its net productivity (growth
rate) and the concentration of nutrients in the plant tissue. Reddy and DeBusk (1987)
recommend the desirable traits of a plant used for nutrient assimilation and storage would
include rapid growth, high tissue nutrient concentration, and the capability to attain a
high standing crop.
Tanner (1996) discussed how, during initial establishment of plants, net nutrient
storage will be significant in removing N from surface waters. Sartoris’s (Sartoris,
Thullen et al. 1999) constructed wetland study found during the first year when the
vegetation was actively developing an average of 76% of the NH4-N in surface water was
removed, whereas one and one-half years later the mean NH4-N removal dropped to 4%.

98
Chapin (1980) concluded that leaf nutrient content can vary between species on a
seasonal basis. Further investigation into the plant components and of stream nutrient
fluctuations would test generalizations regarding these species TN accumulation rates.
The results of this chapter showed that the higher N concentration in the surface
water of Kahawai Stream were reflected in a higher TN accumulation by C. jamaicense
and C. javanicus and therefore supported hypothesis 3.1 for these species. Hypothesis 3-
1 was partially supported with C. polystachyos, although tissue TN concentration was
significantly higher in Kahawai Stream, there was a significant inverse response between
stream location and biomass growth. Testing these species first in a controlled system
helped to determine species selection while the field portion took into consideration
important installation methods. Bringing the experiment to the field also helped to
illustrate the many challenges which exist when implementing remediation projects,
including land management issues and extreme weather events.

99
Chapter 4: Discussion and Conclusions
As stated in previous chapters, Waimānalo Stream has been recognized as a
waterway which carries sediment and nutrient loads greater than the streams ability to
assimilate them. The ecological impact of this impaired waterway affects not only the
health of the stream, but extends to the receiving waters of Waimānalo Bay. Local
residents need to take caution when using this waterway for recreational purposes
because of the potential health risks associated with polluted waters. The current
management of Waimānalo Stream perpetuates the problems identified in the TMDL by
removing riparian shade vegetation and applying herbicide on a seemingly never-ending
and costly routine ‘maintenance’ schedule (USEPA 1998; USEPA 2001; Laws and Roth
2004). The application of BMPs in the riparian zone of Waimānalo Stream has the
potential to improve water quality, enhance biodiversity, and to support a more
sustainable approach to managing this stream corridor. Planting native species in
coconut fiber coir logs is an innovative BMP that can improve water quality in an
environmentally-friendly, socially-acceptable, and cost-effective manner.
The identification of candidate native sedge species for surface water N uptake
was successfully demonstrated through a mesocosm experiment and field
implementation. The constructed mesocosm was used to determine species responses to
coconut coir log media and to the varying N levels that mimicked the conditions found in
Waimānalo Stream. This seven month trial met the stated objectives with the four
selected species, Cladium jamaicense Crantz, Cyperus javanicus, Cyperus laevigatus,
and Cyperus polystachyos. Hypothesis 2-1, the ability to survive in the coconut coir log
100
medium, was supported for three out of the four species, C. jamaicense, C. javanicus, and
C. polystachyos. Because of their highly successful survival rate, these three species
were selected for use in the field implementation phase. Installing these species in coir
logs in a real stream environment tested their ability to survive in Waimānalo Stream
where they were exposed to the varying hydrologic flow rates and nutrient levels
common to many of Hawai‘i’s streams.
Tissue TN concentration, aboveground biomass, and N accumulation rates varied
widely among the species that were grown in the mesocosm experiment and in the field
installation, supporting hypothesis 2-2a. The significant interspecies variation in nutrient
concentration was supported by other studies that attributed differences to initial
propagule vigor, as well as ecotype growth characteristics (Boyd 1970; Boyd 1978;
McJannet, Keddy et al. 1995; Tanner 1996; Greenway 1997). Biomass growth was an
overriding factor in determining nutrient accumulation rates, as the highest TN
accumulation rates were observed in the species with the greatest biomass growth.
Physiological and developmental differences may have also affected accumulation rates,
as the selected species exhibited variable reproductive behaviors and changing tissue TN
concentrations over time. Miao (1997) found that tissue nutrient concentration is an
integrated expression of many plant functions, such as nutrient uptake, growth defense,
and storage. Hypothesis 2-2b considered that the increased N treatments across
mesocosms would lead to an increase in tissue TN concentration in plants, however this
was not strongly supported as species*treatment effects were marginal. Hypothesis 3-1,
which considered that the heightened N levels in Kahawai Stream would lead to higher

101
plant tissue TN concentrations, was strongly supported. Listed below are some specific
points of discussion and conclusions for each of the four species tested in this project.
Cladium jamaicense Crantz
Cladium jamaicense Crantz, also known as ‘Uki in the Hawaiian language, is an
indigenous species commonly found in Hawai’i’s marshlands (Erickson and Pottock
2006). This is a perennial herb in the Cyperaceae family that produces long, thick
horizontal rhizomes. Cladium jamaicense has erect cauline leaves with scabrous margins
that are sharp to the touch and give this species its English name, saw-grass. These plants
are adapted to low resource environments, grow slowly, have low population growth,
long life cycles, low reproductive yield, and respond to resource changes slowly (Miao
and Sklar 1997).
Cladium jamaicense was the most successful species from the mesocosm
experiment in terms of tissue TN concentration, biomass growth, and TN accumulation
rate. Miao and Sklar (1997) and Lissner (2003) found C. jamaicense to have higher
tissue TN values than the competing invasive species in the same area; it was noted by
Davis (1991) that this may be a result of its adaptation to low resource or fluctuating
environments. It has been shown that C. jamaicense has a lesser degree of plasticity
when compared to other species invading its native territory in the Florida Everglades,
has a low demand for nutrients, depends less on a high uptake affinity in an infertile
environment, and has a high retention capacity for acquired resources (Newman, Grace et
al. 1996; Richardson, Ferrel et al. 1997; Lissner, Mendelssohn et al. 2003). During the
three months in the Waimānalo Stream environment, C. jamaicense had the least biomass

102
growth which resulted in the lowest TN accumulation rates. However, tissue TN
concentration for C. jamaicense was greater than C. javanicus in both streams. Despite
this slow initial development in the stream, hypothesis 3 was supported for C. jamaicense
as biomass growth and N accumulation rates were significantly higher in Kahawai
Stream than in Waimānalo Stream. Cladium jamaicense eventually produced the greatest
biomass in the mesocosms, and given enough time in the streams, this species had the
potential to have shown N accumulation similar to the other tested species.
Cyperus javanicus Houtt
Cyperus javanicus, also known as ahu’awa in the Hawaiian language, is a
perennial and facultative wetland species that is found in marshes, streams, ditches, and
taro patches in coastal, cliff-side, and disturbed sites in the Hawaiian Islands (Erickson
and Pottock 2006). During the mesocosm experiment, C. javanicus showed initial
increases in shoot density and within a few months (in April) produced reproductive
material consisting of compound umbels bearing branches of seeds on the tips of large
erect culms. These culms were pounded smooth by the early Hawaiians and used as
cordage and to strain Piper methysticum, also known as ‘awa (Abbot 1992). At the time
of the stream harvest there was no indication of reproductive development with C.
javanicus, in agreement with Brimaecombe’s (2002) study that reported no new
reproductive material for this species was produced between January and April.
Cyperus javanicus produced significantly greater biomass compared to C.
polystachyos and C. laevitagus in the mesocosms, and to C. polystachyos and C.
jamaicense within streams. However, hypothesis 2-2b was not supported for C.

103
javanicus as there were no significant differences in tissue N concentration across
treatment levels in the mesocosms or between stream locations. Cyperus javanicus had
significantly greater tissue TN concentration in Kahawai Stream than in Waimānalo
Stream, which supported hypothesis 3. Interestingly, C. javanicus had significantly
lower tissue TN concentration then the other species in Waimānalo Stream which
followed the same trend as the mesocosm results for C. jamaicense, but not for C.
polystachyos. Although C. javanicus showed the lowest tissue TN concentration in both
streams, the abundant biomass growth resulted in this species having the highest TN
accumulation rates.
Cyperus laevigatus
Cyperus laevigatus, also known as makaloa in the Hawaiian language, is
commonly found on the edges of freshwater, brackish or salt ponds, mudflats and other
sandy coastal areas in Hawai‘i (Erickson and Pottock 2006). The smooth culms were
traditionally used use for finely woven hats and were rated by Sir Peter Buck7 to be the
finest sleeping mats in Polynesia (Abbot 1992). This species has been successfully used
in various remediation efforts across the state (FLC 2001; Van-Dyke 2001). Many of
these projects, which include natural wetlands, golf course ponds, and aboveground
constructed mesocosms, treat wastewater in environments with relatively steady surface
water level. Different media types, such as crushed basalt and ‘bio-barrels’, have been
used for C. laevigatus with varying levels of success (FLC 2001; Van-Dyke 2001). The
type of media used in this project may have accounted for the lack of substantial biomass
achieved in constructed mesocosm coir logs. Arleone Dibben-Young, of Ahupua’a 7 Sir Peter Buck, author of the definitive 1957 study of Hawaiian plaiting.

104
Natives in Moloka’i, has extensive experience with C. laevigatus in the field environment
and stated that this species does not survive even short periods of inundation (personal
communication, July 2008). Hawai‘i’s streams in general are subject to changing surface
levels, especially during the wet season. As demonstrated with the December flood
event, candidate species for stream remediation purposes need to be tolerant of periods of
low flow, as well as, episodic flash flood events. For this reason, as well as the poor coir
log survival rate, C. laevigatus was not considered to be a good candidate for the field
trial. Hypothesis 2-2b was not supported for C. laevigatus in the mesocosm trial.
Cyperus polystachyos Rottb.
Cyperus polystachyos is called ‘Kiolohia’ in the Hawaiian language. It is an
annual or perennial herb which produces flat basal leaf-blades and flowers borne on
many erect stiff culms (Erickson and Pottock 2006). Cyperus polystachos has been used
in wastewater treatment pilot projects (FLC 2001) and has been given a medium score for
tolerance of salt and toxic chemicals and for remediation potential (Paquin, Campbell et
al. 2004). Cyperus polystachos exhibited high survival rates in the mesocosm trial which
supported hypothesis 2-1 for this species. The trends demonstrated in biomass growth
and nutrient uptake by C. polystachos were distinctive when compared with the other test
species in both the mesocosm and field experiments.
In both the mesocosm experiment and in the field, C. polystachos showed an
inverse response to the increased nutrient exposure by producing less biomass.
Hypothesis 2-2b was not supported in the mesocosms for C. polystachos for tissue TN
concentration, biomass growth, or accumulation rate as there was an obvious downward
105
trend across increasing N levels. Hypothesis 3 was both supported and not supported in
the field trial of C. polystachos. A significant response was observed with biomass
growth between stream locations with greater growth in Waimānalo Stream. The
reduced biomass growth in Kahawai Stream combined with the significantly high tissue
TN concentration indicated that this species was sensitive to surface water N loads which
may have affected its growth. It was possible that Kahawai Stream carried surface water
TN levels which exceeded an N threshold for this species and limited its biomass growth.
As seen throughout this study, perhaps the largest effect on the potential rate of nutrient
uptake by plants is its net productivity (Vymazal 2007). Although C. polystachos had
high tissue TN concentrations in Kahawai stream, low biomass growth resulted in quite
low accumulation rates.
Management Considerations
Waimānalo Stream would benefit from management practices that attempt to
utilize ecologically-, socially-, and economically-sound practices. The current
management practice of ‘cut-and-spray’ perpetuates the degradation of this riparian
ecosystem and has potential offsite and downstream effects on other desirable organisms
(i.e. seagrasses, corals) that are harmed by these herbicides (Chapin 1980). Biological
engineering, in this case through the use of pre-planted coconut coir logs, can begin to
restore stream structure and function to address the problem of pollution of surface
waters and underlying issues, such as the loss of biodiversity. Phytoremediation has
shown promise for the treatment of impaired waters in projects locally here in Hawai‘i
and globally. Selection of species for restoration in the field should consider species that

106
will produce abundant biomass and have the ability to store substantial TN in its tissue.
The results of this experiment support the use of certain native species for stream
remediation purposes and the use of the coir log bioengineering method for plant
installation in Hawai‘i’s highly variable stream environment.

107
Appendix A. Mesocosm Weather Data.
Figure A.1. Total daily rainfall (mm) recorded from November 11, 2007 through June 22, 2008.
Figure A.2. Mean daily temperate range (°C) recorded from November 11, 2007 through June 22, 2008.
0
10
20
30
40
50
60
70
80m
m
0
5
10
15
20
25
30
35
°C
Maximum
Minimum

108
Figure A.3. Daily total solar radiation (W/m2) recorded from November 11, 2007 through June 22, 2008.
Figure A.4. Daily mean relative humidity (%) recorded from November 11, 2007 through June 22, 2008.
02000400060008000
100001200014000160001800020000
W/m
2
0
20
40
60
80
100
120
Tota
l RH
%

109
Appendix B.
Table A.1. Chemical composition of the Growmore © 10-8-22 Hydroponic Fertilizer hydroponic fertilizer used in the mesocosm experiment.
Component PercentTotal Nitrogen (N) 10 Ammonical Nitrogen 0.5 Nitrate Nitrogen 3.5Available Phosphate (P2O5) 8Soluble Potash (K2O) 22Calcium (Ca) 4.5Mg 1S 1Boron 0.05CU 0.05Iron (Fe) 0.2Mn 0.1Mo 0.01Zn 0.05

110
References
Abbot, I. A. (1992). La'au Hawai`i: Traditional Hawaiian Uses of Plants. Honolulu, Bishop Museum Press. Abramovitz, J. N. (1996). Imperiled Waters, Impoverished Future: The Decline of Freshwater Ecosystems. Worldwatch Institute. Washington, DC. Allen, H. H. and J. Fischenich (1999). "Coir geotextile roll and wetland plants for streambank erosion control." EMRRP Technical Notes Collection (ERDC TN-EMRRP-SR-04). Allen, H. H. and J. R. Leech (1997). Bioengineering for Streambank Erosion Control. Vicksburg, MS, U.S. Army Corps of Engineers; Waterways Experiment Station. Almanac, F. (2009). "Farmers' Almanac Weather Outlook for Hawai`i." from http://www.farmersalmanac.com. Andersen, J. H., L. Schluter, et al. (2006). "Coastal eutrophication: recent developments in definitions and implications for monitoring strategies." J. Plankton Res. 28(7): 621-628. Army (2006). Lessons Learned: Streambank Stabilization On Army Training Lands. Army, U.S. Army Corps of Engineers. Public Works Technical Bulletin, No. 200-3-41. ASTM (1995). "Annual Book of ASTM Standards." Water and Environmental Technology 11.02(Water (I)). Barboza, R. (2007). Native Plant Availability. C. Unser. Honolulu, Hui Ku Maoli Ola nursery. Bastviken, S. (2006). Nitrogen Removal in treatment wetlands - Factors influencing spatial and temporal variations. Department of Biology, IFM. Linkoping, Sweden, Linkoping Technical University. Bernhardt, E. S., R. O. Hall, et al. (2002). "Whole-System Estimates of Nitrification and Nitrate Uptake in Streams of the Hubbard Brook Experimental Forest." Ecosystems 5(5): 419-430. Boyd, C. E. (1970). "Vascular Aquatic Plants for Mineral Nutrient Removal from Polluted Waters." Economic Botany 24(1): 95-103. Boyd, C. E. (1978). Chemical Composition of Wetland Plants. Freshwater Wetlands: Ecological Processes and Management Potential. Proceedings of the Symposium Freshwater Marshes: Present Status, Future Needs, New Brunswick, New Jersery, Academic Press.

111
Brennan, J. S., and Hilary Culverwell (2005). Marine Riparian: An Assessment of Riparian Functions in Marine Ecosystems. Seattle, UW Board of Regents 34. Brimacombe, K. (2002). ANNUAL REPORT II: Applied Research on Use of Native Plants for Coastal Wetland Restoration on O’ahu. Department of Botany. Honolulu, University of Hawaii, Manoa. Browning, C. (2003). Nutrient Removal and Plant Growth in a Subsurface Flow Constucted Wetland in Brisbane, Australia. Environmental Engineering, Griffith University. Bruland, G. L. (2008). Coastal wetlands: Function and role in reducing impact of land-based management. Coastal Watershed Management. A. Fares and A. I. El-Kadi. Boston, WIT Press: 432. Chapin, F. S., A. J. Bloom, et al. (1987). "Plant Responses to Multiple Environmental Factors." Bioscience 37(1): 49-57. Chapin, F. S., III (1980). "The Mineral Nutrition of Wild Plants." Annual Review of Ecology and Systematics 11: 233-260. Chapin, F. S., P. A. Matson, et al. (2002). Principles of Terrestrial Ecosystem Ecology. New York, Springer Science and Business Media, LLC. Clement, C., S. B. Bricker, et al. (2001). "Eutrophic Conditions in Estuarine Waters. In: NOAA's State of the Coast Report. Silver Spring, MD: National Oceanic and Atmospheric Administration.". from http://state-of-coast.noaa.gov/bulletins/html/eut_18/eut.html. Comín, F. A., J. A. Romero, et al. (1997). "Nitrogen removal and cycling in restored wetlands used as filters of nutrients for agricultural runoff." Water Science and Technology 35(5): 255-261. CTAHR (2000). Plant Nutrient Management in Hawai'i's Soils. Honolulu, College of Tropical Agriculture and Human Resources, University of Hawaii at Manoa. Cunningham, S. D. and D. W. Ow (1996). "Promises and Prospects of Phytoremediation." Plant Physiol. 110(3): 715-719. Cunningham, S. D., J. R. Shann, et al. (1997). Phytoremediation of Contaiminated Water and Soil. Phytoremediation of Contaminated Water and Soil. E. L. Kruger, T. A. Anderson and J. R. Coats. Washington D.C., American Chemical Society.

112
D'Antonio, C. M. and J. C. Chambers (2006). Using Ecological Theory to Manage or Restore Ecosystems Affected by Invasive Plant Species. Foundations of Restoration Ecology. M. A. P. a. J. B. Z. D. A. Falk, Wachington D.C., Island Press: 260-279. Davis, S. M. (1991). "Growth, decomposition, and nutrient retention of Cladium jamaicense Crantz and Typha domingensis Pers. in the Florida Everglades." Aquatic Botany 40(3): 203-224. Ehrenfeld, J. G. and L. A. Toth (1997). "Restoration Ecology and the Ecosystem Perspective." Restoration Ecology 5(4): 307-317. Erakhrumen, A. A. (2007). "Phytoremediation: an environmentally sound technology for pollution prevention, control and remediation in developing countries." Educational Research and Review 2(7): 151-156. Erickson, T. A. and C. F. Pottock (2006). Hawai`i Wetland Field Guide: an ecological and identification guide to wetlands and wetland plants in the Hawaiian Islands. Honolulu, Bess Press Books. Fetters, K. and P. Van Dyke (1996). "Analysis of Environmental Conditions that favor the vigorous Growth of Makaloa (Cyperus laevigatus)." Bishop Museum and Amy B.H. Greenwell Ethnobotanical Garden. FLC (2001). Remediation of Slaughterhouse Wastewater in Hawai`i Using 'Living Machine' Ecological Technology. Honolulu, Farmers Livestock Cooperative. Final Report. Submitted to: Pacific International Center for High Technology Research. Gersberg, R. M., B. V. Elkins, et al. (1983). "Nitrogen removal in artificial wetlands." Water Research 17(9): 1009-1014. Gersberg, R. M., B. V. Elkins, et al. (1986). "Role of aquatic plants in wastewater treatment by artificial wetlands." Water Research 20(3): 363-368. Ghermandi, A., V. Vandenberghe, et al. (2009). "Model-based assessment of shading effect by riparian vegetation on river water quality." Ecological Engineering 35(1): 92-104. Greenway, M. (1997). "Nutrient content of wetland plants in constructed wetlands receiving municipal effluent in tropical australia." Water Science and Technology 35(5): 135-142. Greenway, M. (2005). "The role of constructed wetlands in secondary effluent treatment and water reuse in subtropical and arid Australia." Ecological Engineering 25(5): 501-509.

113
Güsewell, S. and W. Koerselman (2002). "Variation in nitrogen and phosphorus concentrations of wetland plants." Perspectives in Plant Ecology, Evolution and Systematics 5(1): 37-61. Harrigan, J. and S. Burr (2001). Total Maximum Daily Loads Estimated for Waimānalo Stream. Honolulu, Hawaii State Department of Health and Environmental Protection Agency. HIDOH (1998). Hawai`i’s Water Quality-Limited Waters: The 1997 Assessment and 1998 CWA §303(d) List of Water Quality-Limited Segments: 34. HIDOH (2004). WATER QUALITY STANDARDS: Amendment and Compilation of Chapter 11-54; Hawaii Administrative Rules. Honolulu, Department of Health. HIDOH (2006). State of Hawai‘i Water Quality Monitoring and Assessment Report: Integrated Report To The U.S. Environmental Protection Agency and The U.S. Congress Pursuant To Sections §303(D) and §305(B) Clean Water Act (P.L. 97-117). Horne, A. J. (2000). Phytroremediation by constructed wetlands. Phytoremediation of Contaminated Soil and Water. N. Terry and G. Banuelos. Boca Raton, CRC Press. HuiKu (2008). Hui Ku Maoli Ola Hawaiian Plant Specialists Company Profile. http://plantnativehawaii.com/. HuiKuMaoliOla (2002). Waimānalo Watershed Restoration Plan. Prepared for the US Fish and Wildlife Service, Honolulu, Hawai`i. Kadlec, R. H. and R. L. Knight (1996). Treatment Wetlands: Theory and Implementation. Boca Raton, CRC Press. KBAC (2002). Ko'olaupoko Water Quality Action Plan. Kailua, Kailua Bay Advisory Council. Kido, M. H. (2002). The Hawai`i Stream Bioassessment Protocol. C. f. C. R. a. T. The Hawai`i Stream Research Center, University of Hawai`i. 3.01. Laws, E. A. and L. Ferentinos (2003). Human impacts on fluxes of nutrients and sediment in Waimānalo Stream, O'ahu, Hawaiian Islands. Pacific Science. E. A. Laws. 57: 119. Laws, E. A. and L. Roth (2004). "Impact of stream hardening on water quality and metabolic characteristics of Waimānalo and Kane'ohe Streams, O'ahu, Hawaiian Islands." Pacific Science 58(2): 261-280.

114
Laws, E. A. and L. Roth (2004). "Impact of stream hardening on water quality and metabolic characteristics of Waimānalo and Kane'ohe Streams, O'ahu, Hawaiian Islands." Pacific Science 58(2): 261-280. Likens, G. E., F. H. Bormann, et al. (1970). "Effects of Forest Cutting and Herbicide Treatment on Nutrient Budgets in the Hubbard Brook Watershed-Ecosystem." Ecological Monographs 40(1): 23-47. Lissner, J., I. A. Mendelssohn, et al. (2003). "Interactive effects of redox intensity and phosphate availability on growth and nutrient relations of Cladium jamaicense (Cyperaceae)." Am. J. Bot. 90(5): 736-748. McJannet, C. L., P. A. Keddy, et al. (1995). "Nitrogen and Phosphorus Tissue Concentrations in 41 Wetland Plants: A Comparison Across Habitats and Functional Groups." Functional Ecology 9(2): 231-238. Miao, S. L. and F. H. Sklar (1997). "Biomass and nutrient allocation of sawgrass and cattail along a nutrient gradient in the Florida Everglades." Wetlands Ecology and Management 5(4): 245-264. Mitsch, W. J. and J. G. Gosselink (2007). Wetlands. Hoboken, John Wiley & Sons, Inc. N. J. Willby, I. D. P., T. H. Flowers, (2001). "Tissue nutrient signatures predict herbaceous-wetland community responses to nutrient availability." New Phytologist 152(3): 463-481. Newman, S., J. B. Grace, et al. (1996). "Effects of nutrients and hydroperiod on Typha, Cladium, and Eleocharis: implications for Everglades restoration." Ecological Applications 6(774-783). Nixon, S. W. (1995). "Coastal marine eutrophication: a definition, social causes, and future concerns." Ophelia 41: 199-219. NOAA (2009). Coral Reef Information System US Coral Reef Task Force, US National Oceanic and Atmospheric Administration (NOAA) NRC (2002). Riparian Areas, Functions and Strategies for Management. Washington, DC, National Academy Press. Palmer, M. A., D. A. Falk, et al. (2006). Ecological Theory and Restoration Ecology: The Science and Practice of Ecological Restoration. Foundations of Restoration Ecology. D. A. Falk, M. A. Palmer and J. B. Zedler. Wachington D.C., Island Press: 1-10. Paquin, D. G., S. Campbell, et al. (2004). "Phytoremediation in subtropical Hawai`i - A review of over 100 plant species." Remediation Journal 14(2): 127-139.
115
Peierls, B. L., N. F. Caraco, et al. (1991). "Human influence on river nitrogen." Nature 350(6317): 386-387. Peterson, B. J., W. M. Wollheim, et al. (2001). "Control of Nitrogen Export from Watersheds by Headwater Streams." Science 292(5514): 86-90. Pinay, G., A. Fabre, et al. (1992). "Control of C,N,P distribution in soils of riparian forests." Landscape Ecology 6(3): 121-132. Pivetz, B. E. (2001). Phytoremediation of Contaminated Soil and Ground Water at Hazardous Waste Sites. Ground Water Issue. Ada, Oklahoma, ManTech Environmental Research Services Corporation. Polisini, J. M. and C. E. Boyd (1972). "Relationships between Cell-Wall Fractions, Nitrogen, and Standing Crop in Aquatic Macrophytes." Ecology 53(3): 484-488. Pukui, M. K. and S. H. Elbert (1986). Hawaiian Dictionary. Honolulu, University of Hawaii Press. Reddy, K. R. and W. F. DeBusk (1987). Nutrient storage capabilities of aquatic and wetland plants. Aquatic plants for water treatment and resource recovery. R. KR and S. WH. Orlando, Florida, Magnolia Publishing Inc.: 337-357. Reddy, K. R. and R. D. DeLaune (2008). Biogeochemistry of Wetlands: Science and Applications. New York, CRC PRess. Richardson, C. J., G. M. Ferrel, et al. (1997). Effects of N and P additions on stand structure, nutrient resorption efficiency and secondary compounds of sawgrass (Cladium jamaicense Crantz) in the subtropical Everglades. 1996-1997 biennial report. Effects of phosphorus and hydroperiod alterations on ecosystem structure and function in the Everglades. C. J. Richardson. Durham, North Carolina, Duke Wetland Center publication, Duke Wetland Center, Nicholas School of the Environment: 1-20. Roth, L. (2005). Design and Comparison of DIN Removal Rates Between Five 'Low-Tech' Fixed Film Biological Reactors Treating Aquaculture Wastewater on Coconut Island Oceanography. Manoa, University of Hawai`i, Manoa. Master's of Science. Sabater, F., A. Butturini, et al. (2000). "Effects of Riparian Vegetation Removal on Nutrient Retention in a Mediterranean Stream." Journal of the North American Benthological Society 19(4): 609-620. Sartoris, J. J., J. S. Thullen, et al. (1999). "Investigation of nitrogen transformations in a southern California constructed wastewater treatment wetland." Ecological Engineering 14(1-2): 49-65.

116
Shaver, G. R. and J. M. Melillo (1984). "Nutrient Budgets of Marsh Plants: Efficiency Concepts and Relation to Availability." Ecology 65(5): 1491-1510. Stottmeister, U., A. Wießner, et al. (2003). "Effects of plants and microorganisms in constructed wetlands for wastewater treatment." Biotechnology Advances 22(1-2): 93-117. Taiz, L. and E. Zeiger (2002). Plant Physiology. Sunderland, Massachusetts, Sinauer Associates, Inc. Tanner, C. C. (1996). "Plants for constructed wetland treatment systems - A comparison of the growth and nutrient uptake of eight emergent species." Ecological Engineering 7: 59-83. Tanner, C. C. (2001). "Growth and nutruent dynamics of soft-stem bulrush in constructed wetlands treating nutrient-rich wastewaters." Wetlands Ecology and Management(9): 49-73. Tanner, C. C., J. S. Clayton, et al. (1995a). "Effect of loading rate and planting on treatment of dairy farm wastewaters in constructed wetlands--I. Removal of oxygen demand, suspended solids and faecal coliforms." Water Research 29(1): 17-26. Tanner, C. C., J. S. Clayton, et al. (1995b). "Effect of loading rate and planting on treatment of dairy farm wastewaters in constructed wetlands--II. Removal of nitrogen and phosphorus." Water Research 29(1): 27-34. Terry, N. and G. Baneulos (2000). Phytoremediation of Contaminated Soil and Water, CRC Press. Todd, J. and N. J. Todd (1993). From Eco-Cities to Living Machines: Principles of Ecological Design. Berkeley, California, North Atlantic Books. Tomlinson, M. S. and E. H. DeCarlo (2003). "The Need for High Resolution Time Series Data to Characterize Hawaiian Streams." Journal of the American Water Resources Association 39(1): 113-123. USEPA (1998). Biological Assessment and Habitat Characterization of Waimānalo Stream:Establishing Environmental Goals and a TMDL for Watershed Management. Honolulu, Hawai`i Department of Health: Stream Bioassessment Program. USEPA (2001). Waimānalo Stream TMDL Implementation Plan. DOH, Environmental Planning Office: 18. USEPA (2004). Hawai`i’s Local Action Strategy to Address Land-Based Pollution Threats to Coral Reefs.

117
USEPA (2005). National Management Measures to Protect and Restore Wetlands and Riparian Areas for the Abatement of Nonpoint Source Pollution: 204. USGS (2006). "Phytoremediation." Toxic Substances Hydrology Program. 2009, from http://toxics.usgs.gov/definitions/phytoremediation.html. Valenzuela, H., B. Kratky, et al. (2006). Lettuce Production Guidelines for Hawai`i. Crop Production Guidelines. Manoa, CTAHR, University of Hawaii. Van-Dyke, P. (2001). Growing Makaloa (Cyperus laevigatus L.) in Constructed Wetlands for Weaving and Treating Wastewater. Honolulu, Bishop Museum. Vitousek, P. M., J. D. Aber, et al. (1997). "Human Alteration of the Global Nitrogen Cycle: Sources and Consequenses." Ecological Applications 7(3): 737-750. Vitousek, P. M., H. A. Mooney, et al. (1997). "Human Domination of Earth's Ecosystems." Science 277(5325): 494-499. Vymazal, J. (2007). "Removal of nutrients in various types of constructed wetlands." Science of The Total Environment 380(1-3): 48-65. Wagner, W. L., D. R. Herbst, et al. (1990). Manual of the Flowering Plants of Hawai`i. Honolulu, Bishop Museum Press. Xu, Z., B. Yan, et al. (2006). "Effect of nitrogen and phosphorus on tissue nutrition and biomass of freshwater wetland plant in Sanjiang Plain, Northeast China." Chinese Geographical Science 16(3): 270-275. Zedler, J. B. (2000). "Progress in Wetland Restoration Ecology." Tree 15(10). Zedler, J. B. and J. C. Callaway (2000). "Evaluating the progress of engineered tidal wetlands." Ecological Engineering 15(3-4): 211-225.
Copyright © 2022 FDOKUMEN