Utilisation of Coir Geotextiles for Unpaved Roads and ... - Dyuthi
258
UTILISATION OF COIR GEOTEXTILES FOR UNPAVED ROADS AND EMBANKMENTS A THESIS submitted by K.K.BABU for the av.·'ard of the degree DOCTOR OF PHILOSOPHY DIVISION OF CIVUJ ENGINEERING SCHOOL OF ENGINEERING COCHIN UNIVERSITY OF SCIENCE AND TECHNOLOGY KOCHI, 682022. INDIA MAY 2007
-
Upload
khangminh22 -
Category
Documents
-
view
2 -
download
0
Transcript of Utilisation of Coir Geotextiles for Unpaved Roads and ... - Dyuthi
UTILISATION OF COIR GEOTEXTILES FOR UNPA VED ROADS AND EMBANKMENTS
A THESIS
submitted by
K.K.BABU
for the av.·'ard of the degree
DOCTOR OF PHILOSOPHY
DIVISION OF CIVUJ ENGINEERING SCHOOL OF ENGINEERING
COCHIN UNIVERSITY OF SCIENCE AND TECHNOLOGY KOCHI, 682022.
INDIA
MAY 2007
Dedicated to
My parents
Krishnan & Kallyani
CERTIFICATE
This is to certify that the thesis entitled "UTILISATION OF COIR
GEOTEXTILES FOR UNPAVED ROADS AND EMBANKMENTS" is a report
of the original work done by Shri . K. K. Babu, under my supervision and guidance in
School of Engineering. No part of this thesis has been presented for any other degree
from any other institution.
Kochi Guide:
Date: i- 5 - ri..oo1
/'
Dr. K S. Beena.
Reader in Civil Engineering.
School of Engineering,
Cochin University of Science and Technology,
Kochi . 682022

DECLARA TION
I hereby declare that the work presented in the thesis entitled
"UTILISATION OF COIR GEOTEXTILES FOR UNPAVED ROADS AND
EMBANKMENTS" is based on the original work done by me under the supervision
and guidance of Dr. K. S. Beena, Reader in Civil Engineering, School of Engineering,
Cochin University of Science and Technology. Kochi, 682022. No pm1 of this thesis
has been presented for any other degree from any other institution.
Kochi
Date: 07- CJ!i,. 6200}
ACKNOWLEDGEMENTS
I am extremely grateful to my supervising guide Dr. K.S. Beena, Reader in Civil
Engineering, School of Engineering, Cochin University of Science and Technology
for her inspiring guidance, invaluable help, and encouragement during all phases of
this research work. Her comments, criticisms and suggestions during the preparation
of this thesis are gratefully acknowledged. Her patience, availability for help when
needed, and hospitality are also acknowledged.
I am gratefully indebted to my colleagues Or. E.K. Kunhanandan Nambiar, Dr. A. K.
Raji and Mrs Lathi Karthi, who were always willing to help and exchange valuable
infonnations of mutual interest.
I thankfully acknowledge the help rendered by the Principal, members of the Civil
Engineering division, and administrative staff of the School of Engineering, CUSA T.
I am grateful to Dr. Benny Mathews Abraham, Professor and Head of the Civil
Engineering Division for the facilities extended.
I express my sincere gratitude to the authorities of N. S. S. College of Engineering,
Palakkad for permitting me to do the doctoral work on part time basis. The help given
by the Principal and Faculty members of the Civil Engineering Department is
gratefully acknowledged.
The help and assistance rendered by the laboratory staff of N. S. S. College of
Engineering and CUSAT is gratefully acknowledged.
I express my sincere thanks to Prof K. P. S. Nair and Prof M. Radhakrishna Panicker
of Mechanical Engineering Division, CUSAT for their help.
I thank Mr. M. D. Nair, Mls AIMIL Ltd. for the help rendered during the setting up of
the testing facilities. I also thank MrsJayasree, Research scholar, Mr.Viswanathan,
Postgraduate student, Miss Preethy, project staff and Mr. Rajesh for their help.
I could complete enormous experimental work using the laboratory infrastructure
developed at N.S.S College of Engineering, Palakkad with the financial assistance
received by me through a sponsored project from All India Council for Technical
Education, Ministry of Human Resource Development, Government of India. I
thankfully acknowledge the same.
The facilities enjoyed from the collaborative project on Coir Bhoovastra by Coir
Board, Kochi, at School of Engineering, CUSA T is gratefully acknowledged.
Eternal gratitude is expressed to my family members. Very special and sincere thanks
to my daughter, Amrutha, for her love, patience and support.
Last, but no means least, I am extremely indebted to my wife, Sindhu Babu, who with
limitless patience offered me her help and support throughout this work, sacrificing
her ideals for the sake of mine and bearing my occasional bad temper moods for faults
that were not hers. I sincerely hope that I will prove worthy of her dedication.
K.K.BABU
11

ABSTRACT
KEY WORDS: Bearing capacity, California Bearing Ratio, coir fibre, coir geotextile, embankment, ground improvement, interface friction, soil- fibre composite, unpaved roads, vet1ical drains.
The increasing tempo of construction activity the world over creates heavy pressure
on existing land space. The quest for new and competent site often points to the needs
for improving existing sites, which are otherwise deemed unsuitable for adopting
conventional foundations. This is accomplished by ground improvement methods,
which are employed to improve the quality of soil incompetent in their natural state.
Among the construction activities, a well-connected road network is one of the basic
infrastructure requirements, which play a vital role for the fast and comfortable
movement of inter- regional traffic in countries like India.
One of the innovative ground improvement techniques practised all over the world is
the use of geosynthetics, which include geotextiles, geomembranes, geogrids, etc ..
They offer the advantages such as space saving, enviromnental sensitivity, material
availability, technical superiority, higher cost savings, less construction time, etc ..
Because of its fundamental properties, such as tensile strength, filtering and water
permeability, a geotextile inserted between the base material and sub grade can
function as reinforcement, a filter medium, a separation layer and as a drainage
medium. Though polymeric geotextiles are used in abundant quantities, the use of
natural geotextiles (like coir, jute, etc.) has yet to get momentum. This is primarily
due to the lack of research work on natural geotextilcs for ground improvement,
particularly in the areas of un paved roads. Coir geotextiles are best suited for low cost
applications because of its availability at low prices compared to its synthetic
counterparts. The proper utilisation of coir geotextilcs in various applications
111
demands large quantities of the product, which in turn can create a boom in the coir
industry. The present study aims at exploring the possibilities of utilising coir
geotextiles for unpaved roads and embankments.
The properties of coir geotextiles used have been evaluated. The properties studied
include mass per unit area, puncture resistance, tensile strength, secant modulus, etc ..
The interfacial friction between soils and three types of coir geotextiles used was also
evaluated. It was found that though the parameters evaluated for coir geotextiles have
low values compared to polymeric geotextiles, the former are sufficient for use in
unpaved roads and embankments. The frictional characteristics of coir geotextile - soil
interfaces are extremely good and satisfy the condition set by the International
Geosynthetic Society for varied applications.
The performance of coir geotextiles reinforced subgrade was studied by conducting
California Bearing Ratio (CBR) tests. Studies were made with coir geotextiles placed
at different levels and also in multiple layers. The results have shown that the coir
geotextile enhances the subgrade strength. A regression analysis was perfonned and a
mathematical model was developed to predict the CBR of the coir geotextile
reinforced subgrade soil as a function of the soil properties, coir geotextile properties,
and placement depth of reinforcement.
The effects of coir geotextiles on bearing capacity were studied by perfonning plate
load tests in a test tan1e This helped to understand the functioning of geotextile as
reinforcement in unpaved roads and embankments. The perfonnance of different
types of coir geotextiles with respect to the placement depth in dry and saturated
conditions was studied. The results revealed that the bearing capacity of coir-
IV

reinforced soil is increasing irrespective of the type of coir geotextiles and saturation
condition.
The rut behaviour of unreinforced and coir reinforced unpaved road sections were
compared by conducting model static load tests in a test tank and also under repetitive
loads in a wheel track test facility. The results showed that coir geotextiles could
fulfill the functions as reinforcement and as a separator, both under static and
repetitive loads. The rut depth was very much reduced whik placing coir geotextiles
in between sub grade and sub base.
In order to study the use of COlr geotextiles in improving the settlement
characteristics, two types of prefabricated COlf geotextile vertical drains were
developed and their time - settlement behaviour were studied. Three different
dispositions were tried. It was found that the coir geotextile drains were very effective
in reducing consolidation time due to radial drainage. The circular drains in triangular
disposition gave maximum beneficial effect.
In long run, the degradation of coir geotextile is expected, which results in a soil -
fibre matrix. Hence, studies pertaining to strength and compressibility characteristics
of soil - coir fibre composites were conducted. Experiments were done using coir
fibres having different aspect ratios and in different proportions. The results revealed
that the strength of the soil was increased by 150% to 200% when mixed with 2% of
fibre having approximately 12mm length, at all compaction conditions. Also, the
coefficient of consolidation increased and compression index decreased with the
addition of coir fibre.
Typical design charts were prepared for the design of coir geotextile reinforced
unpaved roads. Some illustrative examples are also given. The results demonstrated
v

that a considerable saving in subase / base thickness can he achieved with the use of
eoir geotextiles, which in turn, would save large quantities of natural aggregates.
VI
CONTENTS
Certificate
Declaration Page No
Acknowledgements ...................................................................................... i
Abstract ........................................................................................................ iii
List of Tables ................................................................................................ xiii
List of Figures ............................................................................................... xiv
Nomenclature ............................................................................................... xviii
1 INTRODUCTION
1.1 GeneraL ..................................................................................... 1
1.2 Motivation ................................................................................ 4
1.3 Organisation of the Thesis ........................................................ 5
2 OBJECTIVES AND SCOPE OF THE INVESTIGATION
2.1 General ...................................................................................... 8
2.2 Objectives ................................................................................. 9
2.3 Scope ........................................................................................ 10
3 REVIEW OF LITERATURE
3.1 Introduction ................................................................................. 11
3.2 Interfacial Friction ....................................................................... 12
3.3 Geotextiles for Unpaved Roads ................................................... 14
3.3.1 Reinforcement Mechanisms ...................................... 15
3.3.2 Laboratory and Field Studies ..................................... 17
3.3.3 Theoretical Studies .................................................... 20
304 Geotextiles for Foundations and Ernbankments .......................... 22
304.1 Bearing Capacity ....................................................... 23
304.2 Geotexti1es for Drains ................................................ 25
3.5 Summary ...................................................................................... 29
vu

4. COIR GEOTEXTILES
4.1 Introduction ................................................................................. 30
4.2 Coir Fibre ..................................................................................... 31
4.2.1 Composition of Coir Fibre ......................................... 31
4.2.2 Properties of Coir Fibre ............................................. 32
4.2.3 Fibre Production ........................................................ 32
4.3 Coir Geotextiles .......................................................................... 34
4.3.1 Terminology .............................................................. 34
4.3.2 Production .................................................................. 36
4.3.3 Properties of Coir Geotextiles ................................... 37
4.4 Applications of Coir Geotextiles ................................................ 39
4.4.1 Unpaved Roads .......................................................... 39
4.4.2 Embankments and Slopes .......................................... 40
4.4.3 Retaining Walls ......................................................... 40
4.4.4 French Drains ............................................................ 41
4.4.5 Vertical Drains ........................................................... 41
4.5 Review of Previous Investigations .......................................... .41
4.6 Case Studies .............................................................................. 45
4.6.1 Protection of Mine Waste Dumps in Goa .................. 45
4.6.2 Pullangode Estate Erosion Control.. ......................... .46
4.6.3 Muvattupuzha Canal Protection ................................ 47
4.7 Need for Present Study ............................................................ .48
5 MATERIAL CHARACTERISATION
5.1 Introduction .............................................................................. 50
5.2 Materials Used ......................................................................... 51
5.2.1 Soil ............................................................................. 51
5.2.2 Aggregates and Screenings ........................................ 53
5.2.3 Coir Geotextiles and Coir Fibres .............................. 56
5.3 Summary ................................................................................... 59
VIlI
6 INTERFACE FRICTION CHARACTERISTICS OF COIR GEOTEXTILES
6.1 Introduction .............................................................................. 60
6.2 Test Description ........................................................................ 62
6.3 Specimen Preparation and Test Procedure ............................... 64
6.4 Test Programmes ...................................................................... 64
6.5 Results and Discussion ............................................................. 66
6.5.1 Shear Stress - Normal Stress Relationship ................ 66
6.5.2 Direct Sliding Coefficient and Friction Coefficient .. 69
6.5.3 Effect of Types of Coir Geotextile ............................ 71
6.5.4 Effect of Type of Soil ................................................ 73
6.5.5 Effect of Density ........................................................ 74
6.5.6 Effect of Water Content.. ........................................... 75
6.6 Theoretical Analysis ................................................................. 76
6.7 Summary ................................................................................... 77
7 STRENGTH BEHAVIOUR OF COIR GEOTEXTILE REINFORCED SUBGRADE
7.1 Introduction .............................................................................. 78
7.2 Experimental Programme ......................................................... 79
7.2.1 Preparation of Specimen ............................................ 80
7.2.2 Testing ....................................................................... 81
7.3 Results and Discussion ............................................................. 82
7.3.1 General. ...................................................................... 82
7.3.2 Type of Soil .............................................................. 82
7.3.3 Type ofCoir Geotextile ............................................. 85
7.3.4 Effect of Soaking ....................................................... 88
7.3.5 Effect of Placement Depth ......................................... 88
7.3.6 Effect of Multiplc Layers .......................................... 91
7.4 Soil - Aggregate System ........................................................... 93
7.5 CBR Prediction Model ............................................................. 95
7.5.1 General. ...................................................................... 95
7.5.2 Multiple Linear Regression Analysis ........................ 96
7.5.3 Development of Model .............................................. 97
1X
7.6 Summary ................................................................................... 100
8 EFFECT OF COIR GEOTEXTILES ON BEARING CAPACITY
8.1 General ...................................................................................... 102
8.2 Background ............................................................................... 102
8.3 Experimental Set - up ............................................................... 105
8.4 Preparation of Test Bed ............................................................ 106
8.5 Testing Procedure ..................................................................... 107
8.6 Test Results and Discussion ..................................................... 108
8.6.1 Variation of Bearing Capacity with z/B .................... 109
8.6.2 Effect of Types of Coir Geotextile ............................ 114
8.6.3 Effect of Saturation .................................................... 115
8.7 Summary ................................................................................... 119
9 RUT BEHAVIOUR OF COIR GEOTEXTILE REINFORCED UNPAVED ROADS
9.1 General ...................................................................................... 120
9.2 Rut Behaviour Under Static Wheel Loads ............................... 121
9.2.1 Experimental Set - up ................................................ 121
9.2.2 Preparation of Test Bed ............................................. 122
9.2.3 Testing Procedure ...................................................... 123
9.2.4 Results and Discussion ............................................. 123
9.3 Rut Behaviour under Repetitive Loads .................................... 128
9.3.1 Wheel Tracking Apparatus ........................................ 128
9.3.2 Testing Programme .................................................... 130
9.3.3 Test Results and Discussion ...................................... 131
9.4 Summary ................................................................................... 136
10 DESIGN OF UNPAVED ROADS
10.1 Introduction ............................................................ 137
10.2 Giroud and Noiray Method .......................................... 140
10.2.1 General. ....................................................................... 140
10.2.2 Unpaved Road without Geotextile by Quasi - S tatic Analysis .............................................. 141
x
10.2.3 Unpaved Road with Geotextile by Quasi - Static Analysis ............................................. 142
10.2.4 Reduction in Aggregate Thickness by the Use of Geotextile ............................................ 143
10.2.5 Unpaved Roads without Geotextiles under Traffic Loading ................................................ 148
10.2.6 Design Procedure ....................................................... 151
10.2.7 Design Examples ....................................................... 1St
10.3 IRC Method .............................................................................. 153
10.3.1 General. ...................................................................... l53
10.3.2 Design Steps .............................................................. 155
10.3.3 Design Examples ....................................................... 155
10.4 US Army Method ..................................................................... 159
10.4.1 General ...................................................................... 159
10.4.2 Design Steps .............................................................. 160
1004.3 Design Example ......................................................... 161
10.5 Summary ................................................................................... 161
11 PREFABRICATED COIR GEOTEXTILE VERTICAL DRAINS
11.1 Introduction .............................................................................. 162
11.2 Application of Vertical Drains ................................................. 163
11.3 Preparation of Coir Geotextile Drains ...................................... 164
11.4 Testing Programme ................................................................... 165
11.4.1 Preparation of Test Set - up ...................................... 167
11.4.2 Installation of Vertical Drains ................................... 168
11.4.3 Testing ....................................................................... 170
11.5 Results and Discussion ............................................................. 174
11.5.1 Type of Drain ............................................................ 174
11.5.2 Pattern of Arrangement ............................................. 178
11.5.3 Type of Coir Geotextiles ........................................... 180
11.6 Summary ................................................................................... 182
Xl

12 CHARACTERISATION OF SOIL - FIBRE COMPOSITE
12.1 General. ..................................................................................... 183
12.2 Laboratory Investigations ......................................................... 184
12.2.1 Compaction Test.. ...................................................... 184
12.2.2 Unconfined Compression Test .................................. 184
12.2.3 Triaxial Shear Test.. ................................................... 185
12.2.4 Consolidation Test.. ................................................... 185
12.3 Results and Discussion ............................................................. 186
12.3.1 Moisture Content Dry - Density Relationship ........ 186
12.3.2 Unconfined Compressive Strength ......................... 189
12.3.3 Triaxial Shear Strength ........................................... 194
12.3.4 Volume Change Behaviour .................................... 196
12.4 Summary ................................................................................ 202
13 CONCLUSIONS AND SCOPE FOR FURTHER RESEARCH
13.1 General. .................................................................................. 203
13.2 Conclusions ........................................................................... 203
13.2.1 Properties of Coir Geotextiles ................................ 203
13.2.2 Strength ofCoir Reinforced Subgrade ................... 205
13.2.3 Bearing Capacity .................................................... 206
13.2.4 Rut Behaviour of Unpaved Roads .......................... 207
13.2.5 Design of Un paved Road Sections ......................... 208
13.2.6 Prefabricated Coir Geotextile Vertical Drains ........ 209
13.2.7 Soil- Coir Fibre Composites .................................. 210
13.3 Concluding Remarks ............................................................. 211
13.4 Scope for Further Research ................................................... 212
REFERENCES AND BIBLIOGRAPHY .................................................. 214
PUBLICATIONS BASED ON THE RESEARCH ................................... 232
Xll
LIST OF TABLES Page No
4.1 Chemical composition of coir. ..................................................................... 32
4.2 Engineering properties of coir fibre ............................................................ 33
4.3 Constructional details of coir geotextiles .................................................... 37
5.1 Selection of soils for different experimental programmes .......................... 51
5.2 Properties of soils collected from different locations .................................. 53
5.3 Properties of sand (soil - 4) and rock dust (soil - 5) .................................. 54
5.4 Grading requirements of coarse ag.gregates for WBM ................................ 54
5.5 Grading of screenings .................................................................................. 55
5.6 Properties of aggregates used for WBM ...................................................... 55
5.7 Properties of coir geotextiles used ............................................................... 58
6.1 Details of test series ..................................................................................... 65
6.2 Summary of interface friction angles .......................................................... 67
6.3 Summary of direct sliding coefficients ........................................................ 69
6.4 Friction Enhancement Factor ....................................................................... 70
7.1 Parameters varied in laboratory experiments .............................................. 80
7.2 Summary of CBR test results ...................................................................... 83
7.3 Increase in CBR due to additional layer of eoir geotextile .......................... 91
7.4 CBR values for soil-aggregate system ......................................................... 95
8.1 Details of model tests conducted ................................................................. 108
8.2 Percentage reductions in load carrying capacity due to saturation .............. 117
9.1 Summary details of tests conducted to study rut behaviour ........................ 124
ILl Summary of experiments conducted ........................................................... 166
11.2 Performance comparison of drains in terms of settlement and time ........... 175
12.1 Optimum values of fibre content and fibre length for maximum U CC ....... 194
Xlll

LIST OF FIGURES Page No
3.1 Schematic representation of separation function ...................................... 16
3.2 Lateral restraint function showing four mechanisms of improvement ............................................................................................. 17
3.3 Tensioned membrane function showing displacement and resultant ....... 18
4.1 Fully automatic power loom ..................................................................... 36
4.2 Mine waste dumps in Goa ........................................................................ 46
4.3 Muvattupuzha canal protection ................................................................ 48
5.1 Particle size distribution curves ................................................................ 52
5.2 Types of coir geotextiles used .................................................................. 56
6.1 Type A and Type B modes of shear ......................................................... 63
6.2 Schematic diagram for test set - up .......................................................... 63
6.3 Coir Geotextile test specimens for interfacial friction measurement ....... 64
6.4 Variation of peak shear stress with normal stress for coir geotextile interface .................................................................................................... 68
6.5 Variation of direct sliding coefficient....................................................... 71
6.6 Variation of interface friction coefficient ................................................. 72
6.7(a) Variation of friction coefficient with density for sand ............................ 74
6.7(b) Variation of friction coefficient with density for rock dust.. .................... 75
6.8 Variation of friction coefficient with water content ................................. 76
6.9 Comparison of theoretical and experimental values of direct sliding coefficient ................................................................................................. 77
7.1 Schematic representation of CBR test samples ........................................ 81
7.2 Load penetration curves with coir geotextiles placed at Hi4 iTom top .............. 84
7.3(a) Effect of type of coir geotcxtile for clayey silt.. ....................................... 86
7.3(b) Effect of type of coir geotextile for red soil ............................................. 87
7.4 Effect of soaking on geotextiles placed at H/4 and H/2 from top ............ 89
7.5 Effect of placement depth of coir geotextiles ........................................... 90
7.6 Effect of multiple layers of coir geotextiles ............................................. 92
7.7 Effect of Coir Geotextiles in soil- aggregate system ................................ 94
7.8 Linear scatter diagram for CBR prediction model ................................... 100
8.1 Square footing supported by coir geotextile reinforced sand bed ............ 104
xiv

8.2 Typical pressure - settlement curves for unreinforced and coir geotextile reinforced sand supporting a square tooting .......................... 104
8.3 Schematic test set - up .............................................................................. 105
8.4 Sequence of load test ................................................................................ ) 06
8.5 Coir geotexti1e specimen for plate load test ............................................. 107
8.6 Settlement behaviour of coir geotextile reinforced sand bed in dry condition ................................................................................................... 1 ) 0
8.7 Settlement behaviour of coir geotextile reinforced sand bed in saturated condition .................................................................................... 111
8.8 Variation ofBCRs with z/B (H2M8 - dry condition) .............................. 112
8.9 Variation of average BCR with z/B ......................................................... 113
8.10 Variation ofBCRu with z/B .................................................................... 113
8.11 Effect of types of coir geotextile on settlement behaviour (zlB = 0.5) .......... 114
8.12 Effect of saturation on coir geotextile reinforced sand ............................. 116
8.13 Percentage increase in bearing capacity with z/B .................................... 118
9.1 Schematic test set - up to study rut behaviour under static loads ............ 122
9.2 Rut depth due to wheel load stress in WBM with red soil subgrade ........ 125
9.3 Rut depth due to wheel load stress in WBM with clayey silt subgrade .................................................................................................... 126
9.4 Effect of additional layer of coir geotextile .............................................. 127
9.5 Wheel tracking apparatus ......................................................................... 129
9.6 Photograph of wheel tracking apparatus .................................................. 130
9.7 Locations of rut measurements ................................................................ 131
9.8 Transverse rut profile for control section ................................................. 133
9.9 Rut profiles for reinforced sections after 1750 wheel passes ................... 133
9.10 Variation of rut depth with number of wheel passes ............................... 134
9.11 Effect of coir geotextiles on rut depth ..................................................... 135
9.12 Longitudinal rut profile ........................................................................... 135
10.1 Load distribution through sub base (after Giroud and Noiray, 1981) .......... 140
10.2 Aggregate thickness ho vs. subgrade CBR (Quasi-static analysis for case without geotextile ........................................................................ 142
10.3(a) Aggregate thickness vs. subb'Tade CBR (Quasi-static analysis for case with geotextile), rut depth = 30mm .................................................. 144
1O.3(b)Aggregate thickness vs. subgrade CBR (Quasi-static analysis for case with geotextile), rut depth = 50mm .................................................. 145
xv
10.4(a)Variation of reduction in aggregate thickness with sub.!:,'Tade CBR (for quasi static analysis for case with geotextilc), rut depth = 30mm ........................................................................................................ 146
10.4(b)Variation of reduction in aggregate thickness with subgrade CBR (for quasi static analysis for case with geotextile), rut depth = SOmm ........................................................................................................ 147
1O.S(a)Aggregate thickness hol vs. subgrade CBR (for case without geotextile when traffic is taken into account), rut depth = 30mm ............ 149
10.S(b)Aggregate thickness hol vs. subgrade CBR (for case without geotexti1e when traffic is taken into account), rut depth = 50mm ............ 150
10.6 Pavement thickness design charts (IRe: 37 - 2001) ................................ 154
10.7 Design curves for rural roads (Rural Roads Manual} ............................... 155
10.8 Design curves using US Anny method .................................................... 160
11.1 Cross section of coir geotextile drains ...................................................... 165
11.2 Disposition of coir geotextile vertical drains ............................................ 167
11.3 Installation of circular type coir geotextile vertical drains ....................... 169
11.4 Installation of rectangular type coir geotextile vertical drains ................. 170
11.5 Schematic test set - up for vertical drain .................................................. 171
11.6 Sequence of testing programme ............................................................... 172
11.7 Effect of type of drain on the time - settlement behaviour (Single drain at centre) .......................................................................................... 176
11.8 Effect of type of drain on the time - settlement behaviour (Three drains in triangular disposition) .................................................... 177
11.9 Effect of type of drain on the time - settlement behaviour (Four drains in rectangular disposition) ............................................................. 178
11.10 Effect of drain disposition on time - settlement behaviour (Circular drains) ....................................................................................................... 179
11.11 Effect of drain disposition on time - settlement behaviour (Rectangular drains) ................................................................................. 180
11.12 Influence of type of coir geotextiles on the behaviour of drains (one drain at centre) .................................................................................. 181
11.13 Influence of type of coir geotexti1es on behaviour of drains (Triangular layout) .................................................................................... 181
11.14 Influence of type of coir geotexti1es on behaviour of drains (Rectangular layout) ................................................................................. 182
12.1 Variation ofOMC with Fibre Content .................................................... 186
12.2 Variation of OMC with Fibre Length ...................................................... 187
12.3 Variation ofMDD with Fibre content ...................................................... 188
XVl

12.4 Variation ofMDD with Fibre length ........................................................ 189
12.5 Response surface for OMC and MDD ..................................................... 190
12.6 Variation ofUCC with Fibre Content for clayey silt ............................... 191
12.7 Variation ofUCC with Fibre Length for Red soiL ................................. 192
12.8 Response surfaces for UCC ..................................................................... 193
12.9 Variation of Shear strength with Fibre content ....................................... 195
12.10 Variation of Shear strength with Fibre Length ........................................ 195
12.11 Response surfaces for triaxial shear strength ........................................... 196
12.12 (e - log p) curve for soil mixed with 10mm fibre ..................................... 197
12.13 Effect of fibre length on (e -log p) characteristics .................................. 198
12.14 Variation of void ratio with fibre length .................................................. 199
12.15 Variation of Compression index with fibre content ................................. 200
12.16 Variation of coefficient of consolidation with fibre content .................... 201
XVll

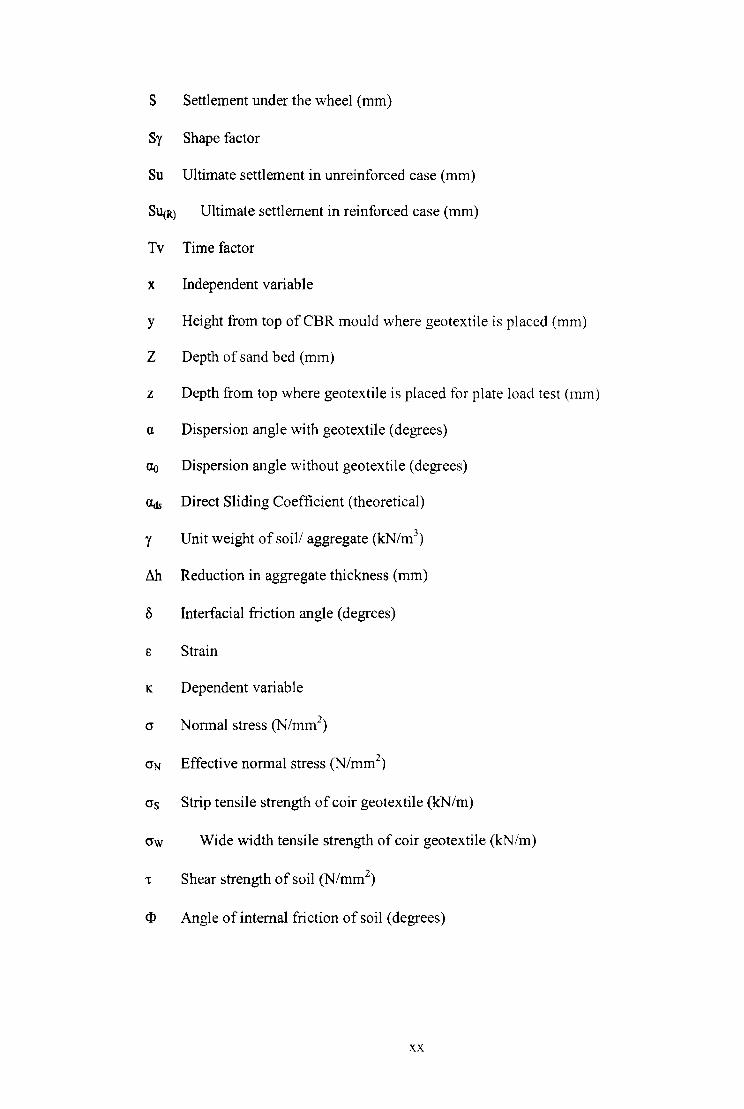
NOMENCLATURE Symbols
The notations listed below are for general reference. Symbols, which do not appear
here, are explained in the text where they first occur.
A Tyre contact area (mm2)
a Regression coefficients of independent variables
ao Regression constant
as Fraction of grid surface area (mm2)
B Width of footing (mm)
C Traffic in tenus of coverage
Cc Compression index
Cds Coefficient of direct sliding
Cu Undrained cohesion (N/mm2)
Cv Coefficient of consolidation (mm2/s)
c Cohesion intercept(N/mm2)
D Depth of coir geotextile from surface (mm)
Es Secant Modulus of Coir Geotextile (N/m)
e Void ratio of soil
f Fibre content (%)
H Total height of CBR sample (mm)
h Thickness of aggregate base with geotextile using quasi - static
analysis (mm)
h' Aggregate thickness in base course for the reinforced condition (mm)
ho' Thickness of aggregate layer, without geotextile when traffic
XVlll

is considered (mm)
ho Thickness of aggregate base without geotextile using
quasi- static analysis (mm)
L Stationary length of geotextile (mm)
Lf Length of coir fibre (mm)
Ni Number of passes of any axle load
Ns Number of passes of standard axle load
Ny Bearing capacity factor
n Number of observations
P Axle load (kN)
Pc Tyre inflation pressure (kN/m2)
Pi Any axle load (kN)
Ps Standard axle load (kN)
p Stress on the soil sub grade with geotextile (Nimm2)
Pec Wheel load pressure (kN/m2)
pg Function of tension in geotextile
po Stress on the soil subgrade without geotextile (N/mm2)
q Load per unit area for unreinforced soil (N/mm2)
qR Load per unit area of reinforced case at any settlement level (N/mm2)
qu Ultimate bearing capacity ofunreinforced case (N/mm2)
qu(R) Ultimate bearing capacity of reinforced case (N/mm2)
R Hydraulic radius (m)
R2 Coefficient of detennination
Rds Maximum shear resistance (Nimm 2)
r Rut depth (mm)
xix
S Settlement under the wheel (mm)
Sy Shape factor
Su Ultimate settlement in unreinforced case (mm)
SU(R) Ultimate settlement in reinforced case (mm)
Tv Time factor
x Independent variable
y Height from top ofCBR mould where geotextile is placed (mm)
Z Depth of sand bed (mm)
z Depth from top where geotextile is placed for plate load test (mm)
a Dispersion angle with geotextile (degrees)
ao Dispersion angle without geotextile (degrees)
<lds Direct Sliding Coefficient (theoretical)
y Unit weight of soil! aggregate (kN/m3)
~ Reduction in aggregate thickness (mm)
8 Interfacial friction angle (degrees)
e Strain
K Dependent variable
(J Nonnal stress (N/mm2)
(IN Effective normal stress (N/mm2)
(Js Strip tensile strength of coir geotextile (kN/m)
(Jw Wide width tensile strength of coir geotextile (kN/m)
't Shear strength of soil (N!mm2)
<D Angle of internal friction of soil (degrees)
xx

Abbreviations
ASTM American Society for Testing Materials
BCR Bearing Capacity Ratio
BCRu Bearing Capacity Ratio (ultimate settlement)
BCRs Bearing Capacity Ratio (any settlement)
BIS Bureau of Indian Standards
BS British Standards
CBR California Bearing Ratio
CBRM Modified CBR
CCRI Central Coir Research Institute
CRRI Central Road Research Institute
CVPD Commercial Vehicles Per Day
ESWL Equivalent Single Wheel Load
FEM Finite Element Method
HOPE High Density Poly Ethylene
IRC Indian Roads Congress
IS Indian Standards
LED Light Emitting Diode
LVDT Linear Variable Displacement Transducer
MOO Maximum Dry Density
MORO Ministry of Rural Development, Government of India
msa Million Standard Axle
NW Non Woven coir geotextile
OMC Optimum Moisture Content
XXI
PVC Poly Vinyl Chloride
PVD Prefabricated Vertical Drains
RH Relative Humidity
SPSS Statistical Package for Social Sciences
UCC Unconfined Compressive strength
WBM Water Bound Macadam
WMM Wet Mix Macadam
XXll
CHAPTER 1
INTRODUCTION
1.1 GENERAL
The development of transportation infrastructure is the key to overall development of
a country. For countries like India, where resources are limited, the importance of
rural / unpaved roads is to be highly emphasised. The sub grade, which is the bottom
most layer of the pavement, is made up of compacted soil and so also for the highway
and railway embankments. The road alignment is decided hased on many factors of
which one is the availability of good soil along the proposed alignment. In early days,
areas having weak soil deposits were avoided while fixing up the alignment. But with
scarcity of land and other resources, we do not have the choice of land and hence
roads and embankments have to be built on weak soil deposits. These problematic
soils have one or more of the short comings viz., low shear strength, high
compressibility, low hydraulic conductivity, swelling and shrinkage, susceptibility to
frost action etc., and hence are associated with problems such as low bearing capacity,
high settlement, high seepage loss, liquefaction during earthquake and instability of
foundation excavation. In such cases, it is often impossible to build a stable base
course over soft subgrade, without loosing expensive hase material which penetrate
into the soft sub grade soil and hence a ground improvement method has to be resorted
to.
Ground improvement is a general term used for the modification of soil to enhance
the strength and other engineering properties. There are many methods of ground
improvement such as using additives (like cement, lime etc.), compaction (both static
and dynamic), thennal stabilisation etc .. One of the methods, which got momentum in
recent years, is the concept of reinforced soil. Though the principle was not clearly
enunciated, people have used techniques of reinforcing earth for centuries. The
modern concept of reinforced soil was however coined by Henri Vidal in 1963 (Vidal,
1969). The reinforced earth system proposed by Vidal used metal strips as
reinforcements. With the development in the field of polymer technology, a wide
variety of geosynthetic materials have come up. Geosynthetics, both natural and
polymeric, establish a family of geomaterials, which are used in a wide variety of civil
engineering applications.
According to ASTM D4439 (2004) a geosynthetic is defined as "a planar product
manufactured from polymeric material, used with soil, rock, earth or other
geotechnical related materials, as an integral part of a human made project, structure
or system". There are eight types of geosynthetics, namely, geotextiles, geogrids,
geonets, geomembranes, geosynthetic clay liners, geopipes, geofoams and geo
composites (Koemer, 2005). These products generally have a long life and do not
undergo biological degradation, but are liable to create environmental problems in
long run.
Geotextiles form one of the largest groups of geosynthetics. Its growth rate in the
industry during the past fifteen years has been nothing short of awesome. They are
indeed textiles in the traditional sense, consisting mainly of synthetic fibres, though
natural fibres are also used for manufacturing. They can be Woven or Non-woven
type. There are enormous specific application areas for geotextiles. even though the
fabric always perfonns at least one of the five discrete functions. viz., separation,
reinforcement, filtration, drainage and moisture barrier (when impregnated). One of
2
the most popular applications of these materials is in the construction of pavements
and embankments on soft soil.
The consumption of polymeric geotextiles in India is insignificant compared to the
worldwide consumption. The main factor inhibiting the use of geotextilcs on a large
scale in India is their high cost (Rao and Salan, 1994). In addition to the low cost of
natural fibres, the growing concern over the impact of the use and disposal of
synthetic materials has recently led to a renowned interest in the possible advantages
of natural geotextiles. In many ground-engineering problems, geosynthetics are
mainly required to perform its function in full capacity, only for a limited duration:
for example, within temporary haul roads, basal reinforcements for new
embankments, vertical drainage to increase shear strength, etc .. In most of the cases,
the geosynthetic capacity is surplus to the requirements during the later periods of the
working life of such systems. In such situations, the deliberate and designed use of a
geosynthetic system, which has a predictable reduction of capacity with time, is a
good engineering practice. Natural geotextiles made of coconut fibre, jute fibre, sal,
etc. can be used as an alternative to polymeric geosynthetic materials. It is even
possible to have tailor made composites of natural fibres to produce a material with
required strength - time profile.
Coir geotextiles with Indianised connotation "eoiT Bhoovastra", a generic member of
the geosynthetic family, is made from coconut fibre extracted from the husks of
coconut fruit. Like their polymeric counter parts, coir geotextiles can also be
synthesised for specific applications in civil engineering like erosion control, ground
improvement, etc. (Rao and Balan, 2000). The use of biode&rradable natural materials
is gaining popularity in rehabilitation of areas damaged either by natural or industrial
3
causes, especially in the light of growing awareness of sustainable development
throughout the world.
1.2 MOTIVATION
India is one of the leading COlr producing countries. eoir industry provides
employment to people belonging to weaker sections of the society in rural and coastal
areas. To protect the traditional coir industry and to makc it possihle to meet the
challenges in structured development of the nation, the dcvelopment of new products
and new horizons of varied applications of the existing products is necessary. At
present, coir geotextiles account for only a fractional share of the global market of
geotextiles. While the world focus is shifting to natural geotextiles, India as a
producer of coir geotextiles, has much to gain by using it for meeting the domestic as
well as global demands. The country's limited exposure to engineering projects using
geotextiles, limited eco sensibility, priority resource constraints for environmental
issues are reasons for coir geotextiles not being consumed for engineering
applications in the country. The potential end users, designers and. rather. the decision
makers are not fully aware of the product availahility and its applicahility in different
areas. More research works need to be carried out to explore the possibilities of
utilising coir fibre based products. eoir geotextile is one among them, which has wide
and versatile application in civil engineering and infrastructure development. The
proper utilisation of coir geotextiles in various applications demands large quantities
of the product, which in turn, can create a boom in the coir industry.
Though huge amount of research work has been done and reported in the area of
unpaved roads and embankments using polymeric geotextiles, only very limited work
has been reported in the area using natural geotextiles. Even in the area of natural
4
geotextiles, work utilizing coir geotextiles are comparatively less. The majority of
works carried out in the field of coir geotextiles are related to erosion control and
watershed management. Only a few works have been reported regarding the
utilisation of coir geotextiles for roads and embankments and a systematic research
work in this area is lacking.
The present work alms at establishing the potentiality of coir geotextiles for the
construction of unpaved roads and embankments, by analysing its various engineering
properties, including the strength and drainage aspects.
1.3 ORGANISATION OF THE THESIS
In chapter I, a brief introduction is presented where the statc-of- the art technology of
using geotextiles is highlighted. The motivation behind the work is also discussed.
Chapter 2 discusses the objectives and scope of the investigations. The significance of
the work also fonns a part of this chapter.
Chapter 3 presents a comprehensive summary of the literature associated with the
present study. Use of geotextiles, both polymeric and natural. for pavements and
embankments are reviewed in detail. Analytical and experimental investigations
dealing with frictional characteristics of coir geotextiles, strength aspects in terms of
California Bearing Ratio, unconfined compressive strength, bearing capacity,
drainage aspects and behaviour of soil- fibre composites are given due attention.
In chapter 4, a detailed description of coir geotextiles is glven. All aspects of
production, properties and application areas of coir geotextiles are discussed.
5
The property characterisation of the various materials used in the study is discussed in
chapter 5. The properties of soils, coir geotextiles and aggregates are also detailed.
Chapter 6 presents the details of the laboratory experimental works conducted to
study the interface friction characteristics of coir geotextiles with different subgrade
materials used in unpaved road construction. The test set-up developed and fabricated
for the present study is well explained. The procedure for experiments conducted is
also explained in detail.
The experimental works to obtain the strength parameters, particularly CBR, of the
coir-reinforced soil under varied conditions are detailed in chapter 7. A regression
model is built to estimate the modified CBR of the sub grade soil, in tenns of the
strength characteristics of the soil and the coir geotextiles, which is also discussed
here.
Chapter 8 presents the study related to the bearing capacity of coir reinforced soil.
Details of the experimental set - up, the test procedure and the results in terms of
bearing capacity ratio in dry and saturated conditions are discussed.
In chapter 9, the rut behaviour of coir reinforced unpaved road sections are dealt with.
Effects of wheel loads were studied by conducting tests on water bound macadam
sections with coir geotextiles at subgrade - base interface. The experimental set - ups
for both static and repetitive loading conditions along with discussion of the results
are gIven.
Preparation of design charts and design methods of unpaved roads usmg COlr
geotextiles are described in chapter 10. Design charts are prepared for the design of
6

unpaved roads for different rut depths. Step by step procedure for three design
methods are explained with illustrative design examples.
Effects of coir geotextiles on the drainage aspect in road embankm~nts in the fonn of
vertical drains are discussed in chapter 11. Fabrication and installation of two
different types of drains are discussed along with different configurations, their time -
settlement behaviour and efficiency.
Chapter 12 contains the details of the experimental work done on soil - coir fibre
composites, which forms the part of the subgrade after degradation of coir geotextiles.
Effects of fibres on strength and compressibility characteristics of soil are studied and
the results are discussed.
Major conclusions drawn from the present investigations, and a mention about the
scope of future works are presented in chapter 13. This chapter is followed by
references and bibliography.
7

CHAPTER 2
OBJECTIVES AND SCOPE OF THE INVESTIGATION
2.1 GENERAL
Availability of good subgrade soil 1S of pnmary concern In the design and
construction of highway projects. Indian Roads Congress (IRC: 37-2001) specifies
that the subgrade soil should have a California Bearing Ratio (CBR) of minimum two
per cent. Also, where the California Bearing Ratio of the sub!,Tfade is less than two per
cent, a capping layer of 150mm thickness of material with a minimum CBR of ten per
cent shall be provided m addition to the sub base layer. Ground improvement
technology has played a very important role in solving many of the major
geotechnical problems in highway constructions as well as in other civil engineering
fields. The uses of geosynthetic reinforcement as a basal reinforcement in the
construction of embankments over soft soils and basal mattresses for the construction
of roads over fills and shallow soft deposits have been well established. Over the last
two decades, the use of geotextiles has received a tremendous application in the
highway construction in many developing and developed nations of the world. The
main functions which geotextile serve in highway construction are separation,
reinforcement and filtration / drainage. The major disadvantage with polymeric
geotextiles is that they are liable to pose environmental problems in the long run.
The availability and low cost of coir fibre make it an eco-friendly material, which
suits geotechnical applications. To protect this need based / appropriate technology
for rural development, more research work in this area with well-documented
laboratory studies are warranted.
A number of published works are available which deal with different types of
geosynthetics being used for separation, filtration, reinforcement, etc .. But the data
related to natural geotextiles is only very limited. This is particularly true with respect
to the application of coir geotextiles used in road construction. Most of the works with
coir geotextiles consist of applications in slope protection and erosion control. Hence
there is a need for conducting studies to exploit the potential use of coir geotextiles as
a highway construction material. The objectives and scope of the present study have
been outlined in the following sections.
2.2 OBJECTIVES
The objective of the present study is to explore the possibility of utilising COlr
geotextiles for the construction of unpaved roads and embankments, after studying the
functions and mechanism of coir geotextiles as separators, reinforcement, and for
filtration / drainage.
This is achieved by conducting extensive laboratory investigations, which include the
following:
• Estimation of the interface friction characteristics of eoir geotextiles when
placed in sub grade.
• Study of the strength behaviour of coir geotextile reinforced subgrades.
• Study of the effect of coir geotextiles on bearing capacity of soil.
• Analysis of the rut behaviour of coir geotextile reinforced unpaved road
sections under static as well as repetitive wheel loads.
• Study of the performance characteristics of coir geotextile vertical drains.
9
• Evaluation of the strength and compressibility characteristics of coir fibre
reinforced soil.
1.3 SCOPE
The present study focuses mainly on the applicability of coir geotextiles in satisfying
the different functions of coir geotextiles, with respect to the unpaved roads and
embankments. Coir geotextiles are widely used for'i m-V(O\l t', the slope stability and
slope protection of embankment. However, this aspect is not considered in the present
investigation since sufficient studies have already been reported in this area.
The scope of the study is limited to the following with respect to materials used:
• The study is restricted to the use of three types of coir geotextilcs designated
as H2M6, H2M8 (both Woven type) and AGL C!20 1 (Non - woven type)
procured from Mls Aspinwall Pvt. Ltd, Alappuzha, Kerala.
• Four types of soil (red earth from Palakkad and Kochi, clayey silt from Kochi
and river sand from Pattambi), granite aggregates and screenings from a local
quarry in Palakkad were used for the experiments.
IQ
CHAPTER 3
REVIEW OF LITERATURE
3.1 INTRODUCTION
The advent of geosynthetics in the recent past has brought in new dimensions to the
solutions of various difficult problems in the area of geotechnical engineering. The
majority of geosynthetics, covering a wide variety of woven and non - woven
geotextiles, geogrids, geonets, geomembranes, geopipes, geofoams, geocomposites
and geosynthetic clay liners are mainly polymeric, although natural materials can also
be used. The polymeric materials used in the manufacture of geosynthetic are
polypropylene, polyester, polyethylene and polyamide. They are manufactured from
the byproducts of petroleum, a raw material that might become scarce with the
passage of time. These products generally have long life and do not undergo
biological degradation, but are liable to create environmental problems in the long
run. However, ecological and environmental engineering considerations have imposed
restrictions on the extensive use of geosynthetics. eoir, Bamboo and Jute are some of
the natural materials exploited as an alternative to polymeric geosynthetic materials.
Kaniraj and Rao (1994) reviewed the trends in the use of geotextiles and the related
products in civil engineering applications in India. The potential for growth in the use
of geotextiles in India has been highlighted by discussing five themes VIZ.,
manufacture, properties and testing equipment, specifications, research and
applications, and the use of geotextiles made of natural fihres. The dcvelopment and
potential of jute geotextiles has been detailed by Ranganathan ( I 994).
In most of the cases, geotextiles, be it polymeric or natural, their function as
separators, as reinforcement and for drainage I filtration remains the same for a
particular project. These functions are examined in this work, in relation to unpaved
roads and embankments, while exploring the possibility of utilizing coir geotextiles.
The literature pertaining to the present work is reviewed in this chapter.
3.2 INTERFACIAL FRICTION
Geotextiles can fulfill its functions (reinforcement, separation, filtration etc.), only if
the force in the soil is transferred to the material and vice versa. This is achieved by
the interfacial friction acting in the plane of the material. This transfer of load is a
prerequisite for satisfactory functioning.
In addition to laboratory testing, finite element studies such as the ones performed by
Burd and Brocklehurst (1990) and subsequently Burd and Brocklehurst (1992) have
emphasised the importance of the friction shear characteristics in soil I geosynthetic
friction tests. Their work highlighted the importance of these parameters in overall
behaviour of reinforced unpaved road.
Experimental studies on friction of granular material along an interface have been
reported by Paikowsky and Player (1994). The test results showed that the !:,'Tain shape
and surface roughness, rather than the grain size, are the primary parameters
controlling the interfacial shear at a given stress level. The use of a modified direct
shear box for the evaluation of interfacial friction seems to be influenced by the
boundary condition resulting in interface friction angles exceeding those that would
develop along unrestricted interface.
12

A critical examination of the past studies on the interfacial tl'iction in terms of data
generation techniques used and the conclusions drawn, have been made by Subba Rao
et a1. (1996), Two types of situation exist in practice: the structure is placed on the
free surface of a prepared fill (type A) and the fill is placed against the material
surface (type B), The friction angle depends on the surface roughness of construction
materiaL It was pointed out that in type A situation, it is independent of density of fill
and its limiting maximum value is the critical state friction angle, whereas in type B
situation, it is dependent on density of fill and its limiting value is the peak angle of
internal friction of the fill. Subba Rao et al. (1998) again reported that type B
apparatus has the advantage of yielding friction angle values applicable to both type A
and type B situation.
A comparison of displacement-induced mobilisation of frictional resistance between
different types of reinforcements on coarse and fine sand has been reported by
Jayadeep (1997). The results indicated that mobilised mction parameters of
reinforced soil system are lower than those of soil itself and are affected by surface
texture, thickness and type of fabrics.
It is reported that the ratio of interfacial friction angle to the angle of internal friction
of the soil is independent of over consolidation ratio and this ratio increases with
roughness (Subba Rao et al., 2000). The ratio of interface friction angle to the angle of
internal friction is unity for very rough surfaces.
Studies on the geotextile - soil interface shear behaviour carried out by Mahmood et
al. (2000) concluded that the shear strength of organic clay - geotextile interfaces
were increasing with the increase of geotextile tensile strength. Similar findings were
13

obtained by Burd (1995) while performing FEM analysis on the frictional behaviour
of soil - geotextile interface.
Different types of apparatus used for the interfacial friction measurement reported in
the literature have been reviewed in detail by Subba Rao et a1. (200 I). The factors
affecting interfacial friction were also reviewed.
Estimates of interfacial friction angle, coefficient of shear stress interaction and
coefficient of direct sliding are necessary for the design of retaining structures and
deep foundations and in many geotechnical problems involve estimation of stresses
transferred along the interface between soils and structures.(Koerner, 2005)
Interface friction depends on many parameters such as pressure, grain size, shape,
surface roughness of geotextile and presence of water. The amount of tnction
mobilised between the soil and reinforcement has a significant inf1uence on the
internal and external stability of mechanically stabilised earth structures (Tateyana,
1999).
3.3 GEOTEXTILES FOR UNPA VED ROADS
Providing good road network is very essential for the development of any country.
The rural roads are the basic infrastructure required for the development of rural
areas. A road continuously deteriorates under the combined action of traffic loading
and the environment. The ability of the road to satisfy the demands of traffic and the
environment over its design life is known as its perf()[l11ance. Various researchers
studied the use of geosynthetics in improving the performance of roads in different
angles. In general geosynthetics perform at least one or more of the functions viz.,
separation, reinforcement and filtration / drainage in improving the road performance.
14

The benefit of using geosynthetics in flexible pavement depends largely on the quality
and thickness of the granular base and location of the gcosynthetics within the
pavement structure (Chan et aI., 1989).
3.3.1 Reinforcement Mechanisms
Three fundamental reinforcement mechanisms have been identified involving the use
of geotextiles in unpaved road applications. These are: a) separation, b) lateral
restraint, and c) tensioned membrane effect (Perkins and Ismeik, 1997).
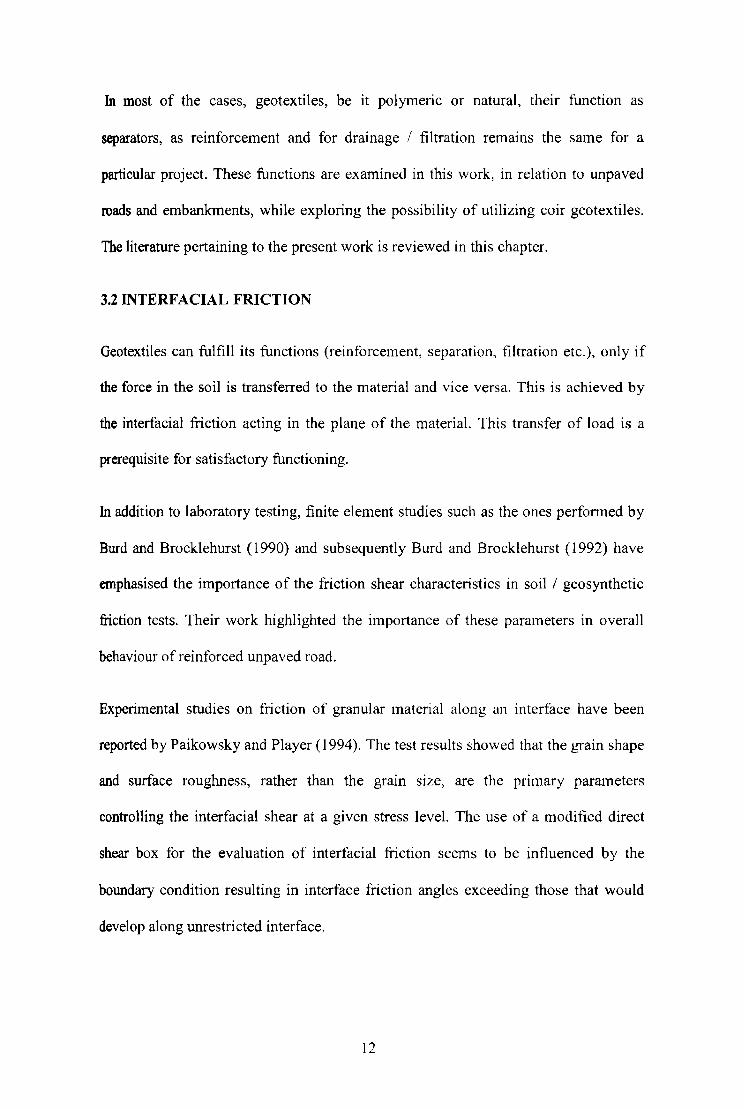
3.3.1.1 Separation
One of the reasons for distress or failure of roads is migration or mixing of fines from
the subgrade to overlying granular layer. High wheel load stresses acting on the road
surface combined with a weak/saturated subgrade, typically cause a base and
subgrade mix. This mixing causes a reduction in the effective base thickness by
reducing the actual modulus of the granular base as well as its physical thickness.
Mixing is best pictured as granular material is pushed down into the soft subgrade
and/or soft sub grade is pumped up into the overlying granular layer (Tensar Design
Manual, 1998). Fig. 3.1 shows the schematic diab'Tam that represents both the mixed
and separated situations.
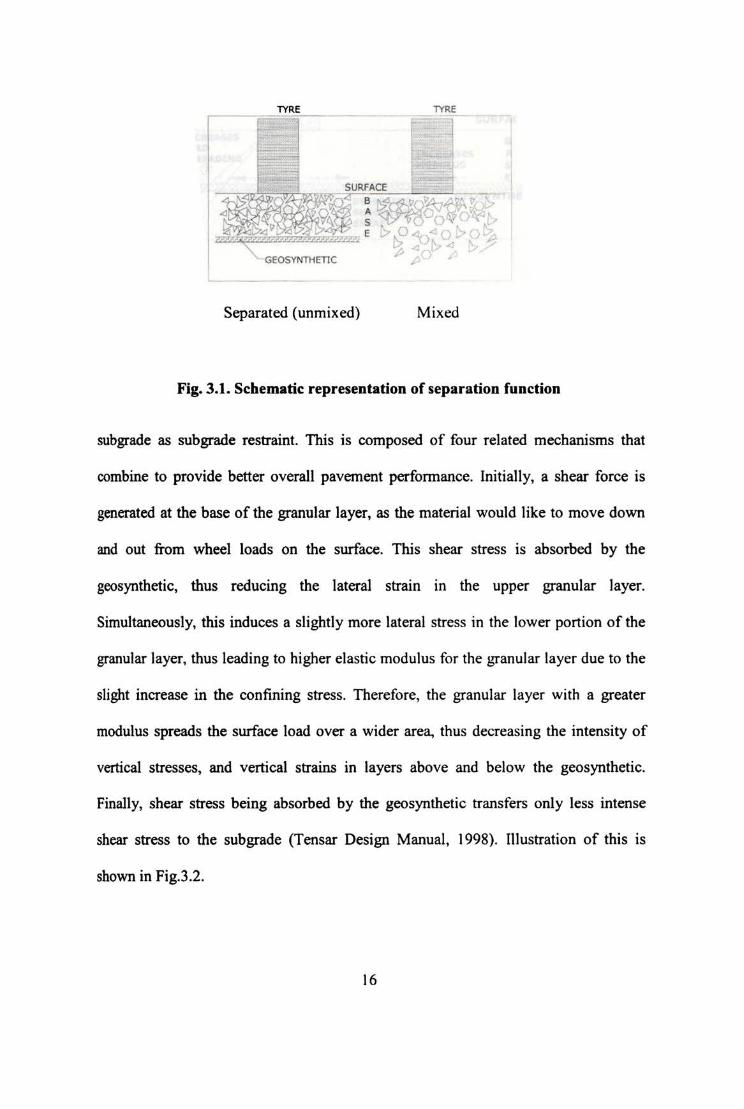
3.3.1.2 Lateral restraint
Lateral restraint reduces the horizontal defonnation of the base course and the
subgrade, when these are in contact with the geosynthetic. It has been reported that
geosynthetics hold the base material and the subgrade together by developing friction
forces between it and the other two materials. This action of the geosynthetic and the
base material is referred to as base restraint and that betv..'cen the geosynthetic and
15
TIRE TIRE
I '~
SURfACE
GEOSYNTHETlC ,
Separated (unmixed) Mixed
Fig. 3.1. Schematic representation of separation function
subgrade as subgrade restraint. This is composed of four related mechanisms that
combine to provide better overall pavement perfonnance. Initially, a shear force is
generated at the base of the granular layer, as the material would like to move down
and out from wheel loads on the surface. This shear stress is absorbed by the
geosynthetic, thus reducing the lateral strain in the upper granular layer.
Simultaneously. this induces a slightly more lateral stress in the lower portion of the
granular layer, thus leading to higher elastic modulus for the granular layer due to the
slight increase in the confining stress. Therefore, the granular layer with a greater
modulus spreads the surface load over a wider area, thus decreasing the intensity of
vertical stresses, and vertical strains in layers above and below the geosynthetic.
Finally. shear stress being absorbed by the geosynthetic transfers only less intense
shear stress to the subgrade (Tensar Design Manual , 1998). l1Iustration of this is
shown in Fig.3.2.
16

· "'9 __ TY ••
Fig.3.2. Lateral restraint function showing four mechanisms of improvement
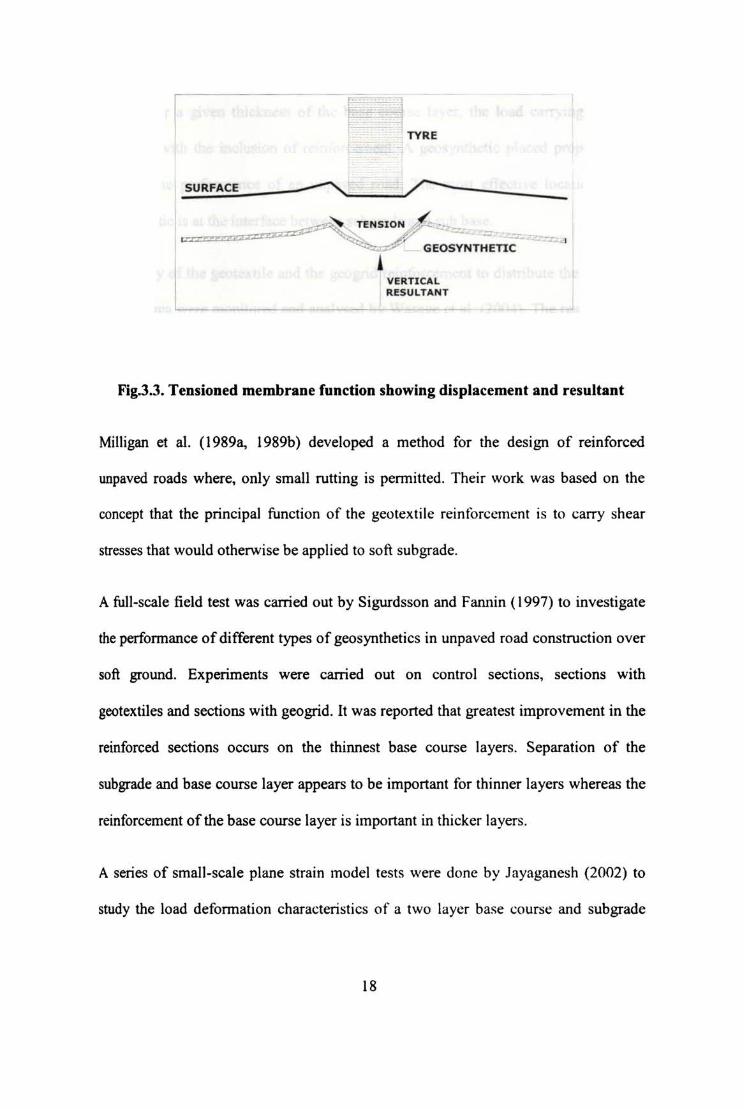
3.3.1.3 Tensioned membrane effect
Membrane reinforcing is mobilised when the subgrade detonns. As the suh!,'Tade
deforms under loading. the geosynthetic material stretches like a membrane. The
loading is distributed over a wider area as a result of the vertical component of the
tension, which develops in the material. This was first described by Giroud et al.
(1981) and is applicable to cases where rut depth is more like in unpaved roads.
Fig.3.3 schernatically shows the mechanisms. The tension in a highly distorted
membrane at the base of an overlying granular layer provides a reaction with a
vertical component that contributes to support the wheel load at the surface and
confines the soft subgrade below.
3.3.2 Laboratory and Field Studies
From the plate load tests conducted on highway pavement, Mc Leod (1956)
developed a method for the design of unpaved roads based on detlection criteria. He
considered 30 cm diameter standard plate and a deflection of O.5cm at ten repetitions
as standard for the preparation of design curves.
17
E TYRE
~S~UR~F~AC~E _____ ~~ ____ ~~--______ __
VERTICAL RESUl.TANT
Fig.3.3. Tensioned membrane function showing displacement and resultant
MiIIigan et al. (1989a, 1989b) developed a method for the design of reinforced
unpaved roads where, only small rutting is pemitted. Their work was based on the
concept that the principal function of the geotextile reinforcement is to carry shear
stresses that would otherwise be applied to soft subgrade.
A full-scale field test was carried out by Sigurdsson and Fannin (1997) to investigate
the perfonnance of different types of geosynthetics in unpaved road construction over
soft ground. Experiments were carried out on control sections, sections with
geotextiles and sections with geogrid. It was reponed that greatest improvement in the
reinforced sections occurs on the thinnest base course layers. Separation of the
subgrade and base course layer appears to be important for thinner layers whereas the
reinforcement of the base course layer is important in thicker layers.
A series of small-scale plane strain model tests were done by Jayaganesh (2002) to
study the load defonnation characteristics of a two layer base course and sub grade
18
system. It was concluded from the test results that as the thickness of the aggregate
layer increases, the load carrying capacity of the pavement system also increases.
Further, for a given thickness of the base course layer, the load carrying capacity
increased with the inclusion of reinforcement. A geosynthetic placed properly does
improve the performance of an unpaved road. The most effective location of the
geosynthetic is at the interface between sub grade and sub base.
The ability of the geotextile and the geogrid reinforcement to distribute the load over
a wider area were monitored and analysed by Wasage et al. (2004). The results of the
reinforced specimens were compared with unreinforced specimens to assess the
advantages of using geosynthetics in increasing the rut resistance of flexible
pavement. The test results obtained from this experimental research programme
demonstrated that a geogrid reinforcement placed at the surface course I base course
interface effectively increased the rutting resistance of flexible pavement, hence
would be beneficial in increasing the service life of the flexible pavement. The results
also showed that the base course aggregates were found to intrude into the subgrade
layer causing stone losses in the specimens if geotextiles were not placed at the
subgrade- sub base interface.
Koerner (2005) proposed a laboratory method for modeling the field situation to
arrive at the influence of the geotextile. The method involves conducting CBR test on
specimen of soil and on soil-aggregate system. Reinforcement ratios were defined as
the load resisted by the unreinforced and the reinforced specimens. Maximum
reinforcement ratio multiplied by the actual CBR was tenned as modified CBR. US
Anny Corps of Engineers used this modified CBR to find the thickness of flexible
pavement
19
Edil (2006) conducted large-scale experiments on working platfonns of crushed rock
overlying simulated soft subgrade. Tests were conducted with and without
geosynthetic reinforcement to evaluate the deflection characteristics of the working
platfonn. Four types of geosynthetics were tried and it was found that the reinforced
working platfonns defonned at a slower rate, and in most of the cases this
defonnation ceased after nearly 200 loading cycles.
3.3.3 Theoretical Studies
Though many design methodologies have emerged which address geotextiles in
pavement, two theories based on original work contributed greatly to a better
understanding of geosynthetic applications for pavements. These methods were
suggested by Barenburg et a1. (1975) and Giroud and Noiray (1981).
3.3.3.1 Barenburg method
Barenburg et a1. (1975) presented a method, which make use of different bearing
capacity factors for the unpaved roads application with and without geotextiles.
Lateral restraint action of the geotextiles is the backbone of this theory. Soft cohesive
soils were used as subgrade, and load repetitions less than 100 were assumed. The
work based on small-scale laboratory test showed that the bearing capacity factors
(Ne) of 6.0 and 3.3 were appropriate for loading with and without the inclusion of
geotextile respectively.
3.3.3.2 Giroud and Noiray method
Giroud and Noiray (1981) presented the first method that utilises geotextiles' modulus
and tensile strength. They considered undrained soft saturated clay sub grade. Giroud
and Noiray initially followed the lateral restraint theory by Barenburg (1975), but
20
added the tensioned membrane concept later. Details of this method are given in
chapter 10.
3.3.3.3. Other design methods
Sellmeijer et al. (1982) developed an analytical model for the design of reinforced
unpaved roads. They asswned, the same pyramidal distribution of load as was
assumed by Giroud and Noiray (1981) but followed the principle of limit equilibrium
to derive their analytical equation.
Haliburton and Baren (1983) developed a pavement design for unsurfaced roads using
geosynthetic reinforcements. They observed that the optimum depth of ag!:,'Tegate
placed on geotextile significantly increases the strength and dcfonnation resistance of
aggregate cover.
Holtz and Sivakungan (1987) developed design charts to detennine the aggregate
thickness for geotextile-reinforced roads using the Giroud and Noiray (1981)
approach. They prepared charts for rut depths of 75mm, 100mm, 150mm, 200mm and
300 mm for an axle load of 80kN and with tyre pressures of 480MPa and 620MPa.
A new method for the design of reinforced unpaved roads without considering tension
membrane effect has been proposed by Houlsby and lewell (1990). The role of shear
stress on reinforcement is given primary importance. OeSib'11 charts were presented
which give the necessary depth of !:,'Tanular fill and the required reintorcement tension.
Dixit and Mandal (1993) applied variational method to detennine the bearing pressure
of geosynthetic soil. The shape of the failure surface and distribution of nonnal
stresses were obtained using minimizing theorems of variational calculus.
21
A new analytical design model has been proposed by Surd (1995). This new model is
based on a membrane reinforcement mechanism and is appropriate for cases of large
surface deformations as is the case of unpaved roads.
A theoretical design method to find the thickness of the base course of unpaved roads
has been developed by Giroud and Han (2004a). This method considers distribution
of stress, strength of base course materials, interlock between geosynthetic and base
course material, and geosynthetic stiffness in addition to the conditions stipulated in
the earlier study (Giroud and Noiray, 1981) viz., traffic volume, wheel loads, tyre
pressure, sub grade strength, rut depth and influence of the presence of a reinforcing
geosynthetic on the failure mode of the unpaved road. The advantage of this method
is that the thickness can be obtained by using a unique equation. The equation was
developed for geogrid reinforced unpaved roads, but can be used for roads reinforced
with geotextiles, with appropriate modifications for the relevant parameters. The
calibration of this design method has been done (Giroud and Han, 2004b) using data
from field wheel load tests and laboratory cyclic plate loading tests on unreinforced
and reinforced base courses.
3.4 GEOTEXTILES FOR FOUNDATIONS AND EMBANKMENTS
In many places the formation of embankment and its foundation beneath becomes an
integral part of the construction of unpaved roads especially through swampy areas.
Hence the role of geotextile in these aspects should be considered. The previous
investigations conducted in these lines are reviewed in this section. Mainly two
aspects of ground improvement are considered in this context: one, the bearing
capacity and the other, the stabilisation by accelerating the drainage using vertical
drains.
22

3.4.1 Bearing Capacity
Binquet and Lee (1975a, 1975b) proposed an analytical approach for the design of
footing on sand deposits. Mathematical models for bearing capacity were developed
by Hopkins (1991) and Slepak and Hopkins (1993 and 1995a, 1995b). Analytical
research works have also been reported by Beena (1993), Y ctimuglu et al. (1994),
Otani et a!. (1998), and Kumar and Saran (2003a and 2003b).
Using the laboratory model tests, Guido et al. (1986) has compared geogrid and
geotextile reinforced earth slabs and it was observed that bearing capacity was
increased directly with increase in tensile strength of the geotextile.
The applicability of predicting the bearing capacity Increase In reinforced sandy
ground was examined by Haung and Tatsuoka (1990) using tests performed under
various conditions.
The study conducted by Mandal and Sah (1992) pertains to the efficiency of
horizontal geogrid reinforcement in improving clay subgradcs. The maXImum
percentage reduction in settlement with the use of geogrid reinforcement below
compacted saturated clay was reported as 45% and it occurs at a distance of one
fourth of the width of foundation from its base.
Khing et a1. (1993) studied the variation of bearing capacity ratio with respect to
ultimate bearing capacity at levels oflimited settlements of foundations by conducting
laboratory model tests on strip foundation supported by sand layer reinforced with
layers of geogrids. They found that reinforcement founde·d at a depth greater than 2.25
times the width of foundation did not contribute to any increase in bearing capacity.
23
Also, the bearing capacity ratio calculated on the basis of limited settlement appears
to be about 67% -70% of the ultimate bearing capacity ratio.
Based on experimental tests Omar et al. (1993) showed that for the development of
maximum bearing capacity, the effective depth of reinforcement is about twice the
foundation width for strip footing and about 1.4 times the tooting width in the case of
square foundation. It was also showed that the mean depth of the placement of first
layer of geogrid should be less than approximately the foundation width to take
advantage of reinforcement.
In another laboratory study, Omar et al. (1993) postulated that, for certain type of
geogrid, and for a given sand at a given density of compaction, the critical depth of
reinforcement for mobilisation of maximum possible ultimate bearing capacity ratio
decreases with the width to length ratio of the f()undation.
Potential benefits of geosynthetic reinforced soil foundation have been investigated
using large-scale model footing tests by Adams and CoBin (1997). It was observed
that maximum improvement in bearing capacity at low strains occurs at a depth of
one-fourth width of the footing from the bottom of footing.
Shin and Das (2000) conducted reduced scale model tests on strip foundation
supported by medium dense sand reinforced by multiple layers of geogrid. The study
revealed that for a given thickness of reinforcement zone, the bearing capacity ratio
increases when the foundation is placed at a depth below ground level. Critical
reinforcement ratio is approximately two for multiple layers of geogrid reintorcement.
Gabr and Hart (2000) used data from plate load test to determine the elastic modulus
of sand reinforced bed. Comparison between the perfonnance of reinforced and
24
unreinforced cases has also been made. The study focused mainly on estimating the
elastic modulus, rather than the bearing capacity of the soil.
A new method of ground improvement by using semi flexible vertical reinforcing
element was studied by Puri et al. (2005). It \vas found that, for significant
improvement in the ultimate bearing capacity of loose and medium dense sand,
spacing of vertical reinforcement used should be about 0.15 to 0.2 times the width of
the footing. Length of the reinforcement should be at least equal to the width of the
fOoting and preferably 1.5 times the footing width.
3.4.2 Geotextiles for Drains
The rapid increase in popUlation and associated developmental activities has resulted
in the scarcity of good sites for construction. The activities are now forced to
concentrate in low land areas having very low strength and high compressibility. Thus
it is very essential to modify the soft soil before commencing construction activities,
to prevent undue settlement and in turn, the failures - both functional and structural.
Ground improvement by drainage has been found to be the most economical for soft
deposits, but this approach still requires considerable time for preloading and
subsequent consolidation.
In many cases to pace with the speed of construction activities, preloading, which is a
well-established method of ground improvement, may not be always a viable solution.
In such cases, the presence of vertical drain can greatly reduce the preloading period.
Installation of vertical drains results in the reduction of the length of drainage path in
radial direction. Since the consolidation time is inversely proportional to the square of
the length of drainage path, the period of loading required to achieve stabilisation in
soft soil is considerably reduced.
25
The function of Prefabricated Vertical Drains (PVD) is to allow drainage to take place
in the horizontal (radial) direction over a much shorter drainage path so that the rate
of consolidation can be accelerated and thereby the time for consolidation can be
greatly reduced. However, when PVDs are installed, there is a chance that the soil
surrounding the PVDs is disturbed after the installation of PVDs. As a result, the
penneability of the soil in the disturbed zone called smear zone is reduced
(Hausmann, 1990).
The first vertical drain, developed by Kjellmann (1948) made of corrugated card
board covered by a paper sheath measuring 100mm x 3mm, was found to be
convenient and more effective than sand drains, and gradually replaced them.
Subsequent developments in materials and manufacturing processes led to the
evolution of synthetic drains in 1970's made of polymeric materials. PVDs gained
popularity due to their ease in storage and transport, rapid installation, lighter
installing equipment, high discharge capacity and non clogging potential (Hausmann,
1990; Holtz et. al., 1991)
Holtz et a1. (1991) reported that the discharge capacity of prefabricated vertical drains
could vary from 100 to 800m3/year. The discharge capacity of PVD is a tunction of its
filter permeability, core volume or cross sectional area, lateral confining pressure, and
drain stiffuess controlling its deformation characteristics. (Hansbo, 1979 and Holtz et
al.,1991). For long vertical drains that are vulnerable to well resistance, Hansbo
(1981) pointed out that in the field, the actual reduction of the discharge capacity can
be attributed to: (a) reduced flow in drain core due to increased lateral earth pressure,
(b) folding and crimping of drain due to excessive settlements, and (c) infiltration of
fine silt or clay particles through filter.
26

A numerical method was developed to predict the consolidation behaviour of very
soft soil with horizontal drains under the action of the gravity pressure by Jang et al.
(1999). They compared the numerical analysis for the soil with horizontal drains with
the case of self·weight consolidation. The influence of design factors, such as lateral
spacing and the depth of installation of drains, on consolidation process were studied.
As a result of the analysis, it was reported that the time to reach 95% degree of
consolidation using horizontal drains takes only nine times less than that of self
weight consolidation. The settlement of clay with drains occurred more than three
times compared with the case without drains. Hawlader et al. (2002) conducted a
parametric study to identify the influence of viscosity and smear on the consolidation
process of clays with vertical drain.
Chai et al. (2004) studied long term drainage capacities of four types of PVDs and
three types of prefabricated horizontal drains. It was found that the rate of water flow
per unit drainage area increases with hydraulic radius of the drainage channel
approximately with R 1.2 and RL7 for elapsed time of 1 and 3 months respectively. For
all geosynthetic drains, the drainage capacity ratio was increased almost linearly with
the hydraulic radius.
Chew et al. (2004) has conducted some laboratory tests and field trials with electric
vertical drains. The field trial has shown that the soft clay, beneath the sand fill, can
be reached effectively by PVD.
More than 140 million meters of prefabricated vertical drains have been installed for
the soil improvement work for the Changi East Land Reclamation Project in
Singapore. Chu et al. (2004), described the factors controlling the selection of PVDs,
quality control test for them, selection of design parameters, adaptability of some of
27

the design criteria, smear effect etc., based on expenence of Changi East Land
Reclamation and other soil improvement projects in Singapore. It was concluded that,
the success of a soil improvement project using prefabricated vertical drains depends
not only on the design calculations, but also on controlling the quality of the drain, the
selection of soil parameters and the method of installation.
Studies carried out by Lorenzo et al. (2004) on embankments at different locations of
the site of the second Bangkok International Airport and at the campus of Asian
Institute of Technology, Thailand, confirmed that PVD installation not only
accelerated and facilitated unifonn consolidation, but also aided in recharging the
subsoil.
Consolidation process of geotextile tube filled with fine-grained materials has been
reported by Shin and Oh (2004). They examined several issues associated with the
prediction of the tube shape and mechanical properties of the filling materials inside
the tube during and after the consolidation process. The variations of mechanical
properties of internal filled material during the consolidation process are also
reported.
Analysis of field performance of embankments constructed on clay deposits with and
without PVDs, conducted by Shen et a1. (2005), shO\ved that PVDs increased bulk
vertical hydrau1ic conductivity of soft subsoil by about 30 times. Discharge capacity
is an important parameter that controls the perfonnance of prefabricated vertical
drains. Only PVDs with sufficient discharge capacity can function well. Bo (2004)
developed a single basic equation to obtain the required average discharge capacity
and found that the required discharge capacity was in the order of 10-6 rn/s for 100
mm width drain.
28

3.5 SUMMARY
In the preceding sections, application of geosynthetics in the context of unpaved roads
and embankments were discussed by reviewing the inYestigations conducted by
different researchers in this field. The increasing application of geosynthetics,
however, has the disadvantage of having high cost and of being petroleum based.
They are not eco friendly also (Lee et al., 1994). With the increasing environmental
awareness and sustainability, along with the high cost of petroleum products, the
developing countries have lead to investigations of substitutes using natural products.
The utilisation of coir geotextiles in unpaved roads and embankments, being the topic
of research, additional importance is given to review the works on coir geotextiles
right from its manufacturing. Hence a separate chapter, "Coir geotextiles", which
follows, is provided to review its production, properties and its general application in
civil engineering projects.
29
CHAPTER 4
COIR GEOTEXTILES
4.1 INTRODUCTION
Coir is derived from the exocarp of the fruit of the coconut tree "Cacos nucifera
Lynn" grown in the tropical countries mainly for the high oil content of the endosperm
(copra). Large production areas, in particular, can be found along the coastal regions
in the wet tropical areas of Asia, in the Philippines, Indonesia, India, Sri Lanka, and
Malaysia. Total world production of coconut increased substantially from nearly 35
million tons in 1980 to more than 50 million tons today. Yield varies from region to pty titt..
region with an average of 70 to 100 nuts and a maximum of 150 nuts per year. The
" kernel (copra, coconut water and shell) comprises 65% of the total weight, while the
husk contributes only 35%. Despite their low trade value, the fibres provide
significant economic support to populations especially to weaker sections in specific
areas of the coir producing countries, for example in southern states of India viz.,
Kerala, Kamataka, Tamilnadu, Andhrapradesh and also in the west and south of
Sri Lanka.
Coir being a biodegradable and environment friendly material is virtually
irreplaceable by any of the modem polymeric substitutes. With the diversification of
the products and evolvement of new technologies for the production of fibres, the
export of coir products has been increased tremendously. Though the demand for coir
geotextiles is increasing, the total COif exports from India comprises only less than 3%
of it. The close involvement of the local governments, with the support of the public
research institutions and private enterprises is required for innovation, manufacturing
and marketing of coir.
4.2 COIR FIBRE
Coir fibres are extracted from the husks surrounding the coconut . There are two
distinct varieties of coir fibre based on the extraction process viz., white coir and
brown coir. The average fibre yield depends on geographical area and the variety of
coconut tree. In southern states of India and in Sri Lanka, where the best quality fibres
are produced, the average yield is 80 to 90 grams per husk. Husks are composed of
70% of pith and 30% of fibre on a dry weight basis. The maximum total world
production of coir fibre is estimated to be between S and 6 million tons per year
(Dam, 1999).
4.2.1 Composition of Coir Fibre
Cellulose fibres are obtained from fruit (e.g. coir), seed (e.g. cotton), stem (e.g. sisal),
leaf(e.g. banana and pineapple) and so on. eoir - the "golden fibre', is a 100 per cent
organic fibre. Coir is a strong cellulose fibre with high lignin content. It is a multi -
cellular fibre containing 30-300 or more cells in its cross section, which is polygonal
and round in shape. Each cell is made of concentric layers consisting primary wall,
outer secondary wall, middle secondary wall and inner secondary wall. In between the
primary cell walls is situated the intercellular cementing non-crystalline material
comprising of lignin, pectines and hemi cellulose which holds the cells together.
(Kulkarni et al. 1983).
Coir fibre is hard and tough and its length ranges from lS0mm to 280mm and the
diameter from O.1mm to O.Smm. It is one of the hardest natural fibres because of its
31
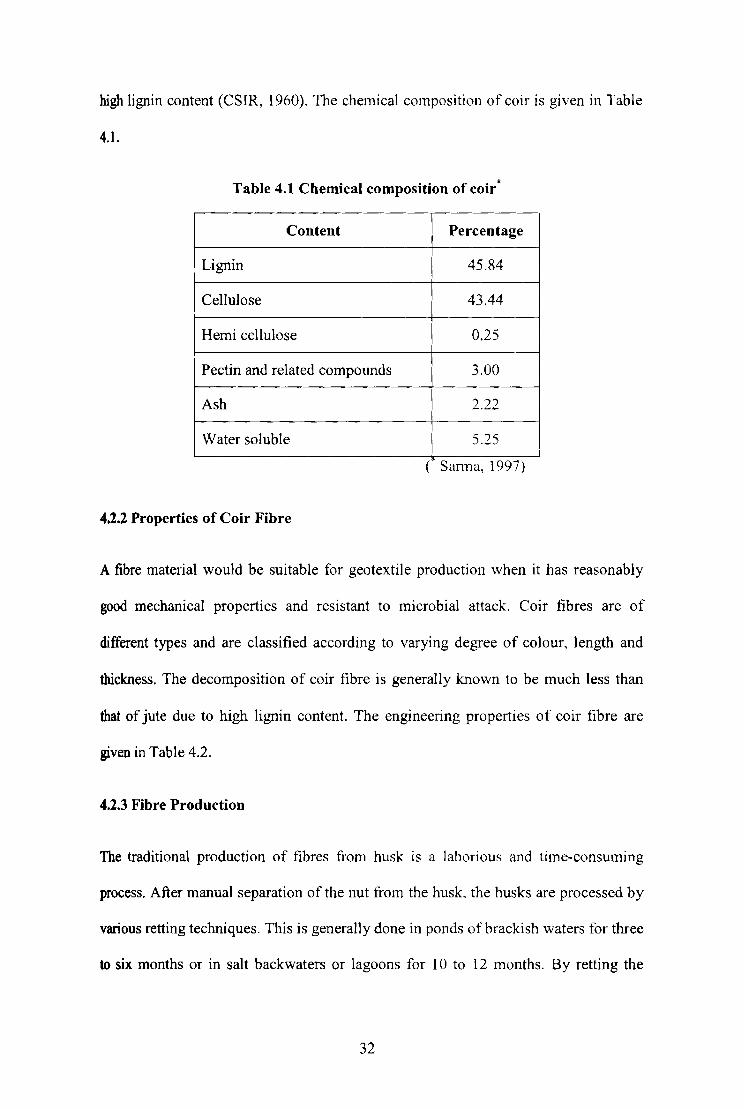
high lignin content (CSIR, 1960). The chemical composition of coir is given in Table
4.1.
Table 4.1 Chemical composition of coir *
Content Percentage
Lignin 45.84
Cellulose 43.44
Hemi cellulose 0.25
Pectin and related compounds 3.00
Ash 2.22
Water soluble 5.25
( Sanna, 1997)
4.2.2 Properties of Coir Fibre
A fibre material would be suitable for geotextile production when it has reasonably
good mechanical properties and resistant to microbial attack. eoir fibres are of
different types and are classified according to varying debJfee of colour, length and
thickness. The decomposition of coir fibre is generally known to be much less than
that of jute due to high lignin content. The engineering properties of coir fibre are
given in Table 4.2.
4.2.3 Fibre Production
The traditional production of fibres from husk is a laborious and time-consuming
process. After manual separation of the nut from the husk, the husks are processed by
various retting techniques. This is generally done in ponds of brackish waters for three
to six months or in salt backwaters or lagoons for 10 to 12 months. By reUing the
32

fibres are softened and can be decorticated and extracted by beating, which is usually
done by hand. After hacking, washing and drying in shade the fibres are loosened
manually and cleaned. Traditional practices of this kind yield the highest quality of
white fibre for spinning and weaving
Table 4.2 Engineering properties of coir fibre *
Property Value
Length (mm) 15 - 280
Densi ty (g/ cc) 1.15 - lA
Tenacity (gltex) 10.0
Breaking elongation (%) 30.0
Diameter (mm) 0.1 -1.5
Rigidity modulus (dynes/cmL) 1.8924
Swelling in water (diameter)-(%) 5.0
Moisture at 65% RH (%) 10.5
Specific gravity i
1.15
Young's modulus (GNim 2) I 4.5
Specific heat 0.27
(* Ayyar et aI., 2002.)
Alternatively, mechanical process using either defibering or decorticating equipment
needs only five days of immersion in water to process the husks. Crushing the husks
in a breaker opens the fibres. By using revolving drums the coarse long fibres are
separated from the short woody parts and the pith. The stronger fibres are washed,
cleaned, dried, hackled and combed. The quality of the fi bre is greatly affected by
these processes.
New environment friendly novel methods of fibre production have developed by
Central Coir Research Institute (CCRI) using a biotechnological approach with
33

specific microbial enzymes. This has substantia1ly reduced the retting time to as low
as three to five days. High quality production has been maintained (Coir Board,
1996).
4j COIR GEOTEXTILES
COiT geotextiles with its Indianised connotation "Coir Bhoovastra", a generic member
of the geosynthetic family, are made from the coconut fibre extracted from the husk
ofthe coconut fruit as explained in the following section. Like their polymeric counter
parts, coir geotextiles can be synthesised for specific applications in geotechnical
engineering practice. Coir geotextiles is not a consumer product, but a technology
based product. A range of different mesh matting is available, meeting varying
requirements.
Coir fibres can be converted into fabric both by woven and non-woven process. Coir
mesh matting of different mesh sizes is the most established coir geotextiles. Mesh
matting having different specifications is available under quality code numbers H2Ml
to H2MIO. These qualities represent coir geotextiles of different mesh sizes ranging
from 3.175mm to 25.4mm. Several types of non-woven gcotextiles also exist. Most of
the non-woven mats are made from loose fibres, which are interlocked by needling or
rubberising. Non-woven geotextiles are available in several dimensions and have a
minimum thickness of 2mm.
4.3.1 Terminology
Cross machine direction: Direction of the geosynthetic in a direction perpendicular
to its long manufacturing or machine direction.
Ends: The threads, which lie along the length of woven fabric
34
Machine direction: Direction of the geosynthetic In a direction of its long
manufacturing
Permittivity: the amount of water moving across a geotextile in unit time through unit
area at unit head.
Picks: Weft or filling yam, which lies across the length of a fabric
Runnage: It is the length of the yam in metres to weigh one kilogram
Scorage: It is the indication of thickness or thinness of yam. It is the number of
strands that can be accommodated in a span of (900mm) 36 inches without
overlapping divided by 20
Secant modulus: The ratio of change in load per unit width to a stated value of strain,
usually 10%
Staple: Short fibres in the range of7mm to 70mm
Tenacity: The fibre strength as force per linear density
Tex: This is the universal unit for yam count; it is the weight in grams per kilometer
of yarn
Transmittivitty: the product of water penneability along the geotextile plane and
thickness of the geotextile.
Warp: Set of yams running length-wise of a fabric
Weft: Set of yams running width-wise of a fabric
35

4.3.2 Production
After fibre is produced. the process of spinning extracts yams. This can be done by
wheel spinning, by mechanical spinning or by hand spinning. Wheel spin yams are of
unifonn good quality . The quality of yam is judged by the thickness. colour.
appearance. unifonnity in twist. strength. fineness. texture. etc .. Yams are named after
the places of production like Anjengo. Vycome. Aratory. etc ..
ecir geotextiles are manufactured from mainly four types of eair yam viz .. Aratary.
Anjengo. Vycome and Beach. The yarn is wound on bobbins and transferred to a
creel. Warping is done between sticks or by means of a peg board. the yarn from the
bobbins being passed on to the warping drum and the requisite width is prepared by
warping the sections on a weavers beam. Weaving is similar to the pit loom weaving
without the fly shuule arrangement Two treadle. three treadle. four treadle or multi
treadle weaving can be done. The pholOgraph of a fully automatic power loom is
shown in Fig. 4. 1. Constructional details of coir geotex.tiJes are given in Table. 4.3.
Fig. 4.1 Fully automatic power loom
36

Table 4.3 Constructional details of coir geotextiles*
Type of Scorage Ends Types Picks Mass Mesh size
Designation warp of warp Per of weft Per (glm2) (mmxmm)
yarn yarn dm yarn dm
H2Ml Anjengo 14 9.0 Vycome 8 650 -
H2M2 Beach 9 8 Beach I 7 ! 700 10 x lO
H2M3 Aratory 15 14 Aratory 14 875 -
H2M4 Anjengo 12 19 Aratory 11 1400 -
H2MS Vycome 13 9.0 Vycome 8 740 9x9
H2M6 Vycome 12 4.6 Vycome 4 400 20 x 20
H2M7 Beypore 12 4.0 Beypore 6 1250 15 x 15
H2M8 Anjengo 12 11 Aratory 7 700 7 x 10
H2M9 Anjengo 11 13 Aratory 7 900 -
H2MI0 Anjengo 11 18 Anjengo 9 1300 -(*Coir Board)
4.3.3 Properties of Coir GeotextiJes
Testing and evaluation of coir geotextiles is a key issue, which can answer the
question of successful performance in the field. Most of the properties of coir
geotextiles are obtained in the same way as that of polymeric geotextiles. No separate
testing procedures have evolved so far. Again, though cOlr geotextiJes are classified
based on the type of yarn and other parameters, standardisation of coir geotextiles is
yet to be evolved. The properties of geotextiles can be b'Touped into five categories as
given below (Mandal and Divshikar, 2002).
1. Physical Properties
• Mass per unit area
37

• Thickness
• Specific gravity
2. Mechanical Properties
• Strip tensile strength
• Wide width tensile strength
• Trapezoidal tear strength
• Grab tensile strength
• Drop cone penetration resistance
• Puncture resistance
• Burst strength
• Interface friction
• Pull out resistance
• Sewn seam strength
3. Hydraulic Properties
• Cross plane permeability (Permittivity)
• In plane permeability (Transmittivity)
• Apparent opening size
• Porosity
4. Endurance Properties
• Creep
• Gradient ratio (Clogging)
5. Degradation Properties
• Biological degradation
• Ultraviolet degradation
38

Among the above properties, physical, mechanical and hydraulic properties play
major role in design of reinforced soil structures.
4.4 APPLICATION OF COIR GEOTEXTILES
Coir geotextiles find application in a number of situations in geotechnical engineering
practice. Coir geotextiles can be used as an overlay or interlay, the former protecting
the surface from run off and the latter performing the functions of separation,
reinforcement, filtration and drainage. Soil bio - engineering with coir geotextiles
finds effective application in the following field situations.
• Separation application in unpaved roads, railways, parking and storage areas
• Shore line stabilisation
• Storm water channels
• Slope stabilisation in railway and highway cuttings and embankments
• Water course protection
• Reinforcement of un paved roads and temporary walls
• Providing sub base layer in road pavement
• Filtration in road drains and land reclamation
• Mud wall reinforcement
• Soil stabilisation
Some of the major application areas are detailed below.
4.4.1 Unpaved Roads
Unpaved roads are mainly low volume roads constructed in rural areas. The
Wlsatisfactory performance of roads arises mainly from two factors, namely, the poor
quality of sub grades and the insufficient thickness and quality of sub base and base
39
courses. All these factors can be mitigated by the use of coir geotextiles either alone
or in conjunction with other products / materials. In cohesionless soil lateral
confinement by coir geotextiles can improve the shear resistance and the bearing
capacity of the subgrade soil and consequently reduces the thickness of the pavement
material. In cohesive soils adequate drainage of the subgradc can be achieved by
depressing the water table by use of coir geotextile drains. In very poor soil the use of
coir geotextile composite blankets, and strip drains can help in quickening the
consolidation of non-expansive clays and reducing the construction time of high
embankments. Coir geotextiles can also be used in pavement layer to reduce
thickness, increase fatigue resistance and reduce reflection cracking due to traffic.
4.4.2 Embankments and Slopes
Constructions of bunds in marshy areas pose the problem of inadequate shear strength
of soil to support the soil fill for the required height. Coir geotextiles can be used both
for the foundation support and also within the fill, particularly for tilter and separation
function, so that the erosion of the sides can be prevented. Use of coir geotextile in
protecting natural slopes is well established. Coir fibres are effective in preventing
failures due to reversal of pore pressures, through drainage without removal of soil
particles. Also with the provision of reinforcements, the stabilisation of the side faces
can be improved which otherwise would be very difficult to maintain the slope.
4.4.3 Retaining Walls
Retaining walls are conventionally built to withstand lateral pressure of soil fill
through the action of gravity, which involves additional vertical force on soil. This
necessitates a strong foundation or large base width and hence costly. Coir geotextiles
can be used in the fill itself so that no additional facing wall is required to resist the
40
lateral pressure. This is particularly suited to walls having low height and where
foundation soil is weak:. The use of coir geotextiles is not advisable for construction of
tall retaining walls because of their low tensile strength.
4.4.4 French Drains
These are drainage measures for sub grade soil to lower the water table to protect road
fonnations without the use of slotted pipes to take thc collected \vater. Coir
geotextiles with high transmittivity like needled felt with mesh core can be used in the
place of pipes and thicker layers can be used to reduce the quantity of pervious sand
surrounding the drain.
4.4.5 Vertical Drains
Construction of embankment over soft and sensitive clays reqUIres accelerated
consolidation. Several methods such as sand drains, metal drains, geosynthetic
prefabricated vertical drains (PVD) etc., are used for this purpose. Instead of this, coir
geotextile drains can be used. Two types of such drains are investigated and
documented in this report. In such cases, even if the coir dC(,:C1YS in (.:ourse of time, the
initial period helps in consolidation and long-tenn stability is not atfected due to the
presence of fibres.
4.5 REVIEW OF PREVIOUS INVESTIGATIONS
Coir geotextiles can perfonn functions VIZ., separation, reinforcement, filtration,
erosion control, pore fluid transmission and dissipation of pressure. Most of the
previous works in the field deals with bearing capacity and slope stability I erosion
control aspects. A few studies have been reported in the area of subgrade stabilisation
and durability aspects also.
41

Ramaswamy and Aziz (1982 and 1983) have conducted some studies on jute
geotextiles and their applications. The laboratory test results conclusively showed that
the stress- strength characteristics of the soil are better with the jute fabric than
without it. The study also showed the beneficial effects of natural jute geotextiles for
subgrade stabilisation.
Prasad et a1. (1983) have studied treatment of COlr fibres for COlr polyester
composites. It was reported that the tensile strength of fibres was increased by 15%
when fibres were soaked in 5% sodium hydroxide aqueous solution at 28°C for 72 to
76 hours and thereafter showed a reduction in strength.
Beena (1986) and Ayyar et a1. (1988) conducted model studies on reinforced sand bed
using coir rope reinforcement along with bamboo strips as anchorages. A parametric
study was conducted to determine the efTect of horizontal spacing, number of
reinforcing layers, region of confinement and pattern of reinforcement. Depending on
the arrangement, it was found that BCR could be increased up to 2.5.
The properties and durability of coir geotextiles can be increased by several means.
Datye (1988) has reviewed the various methods of treatments such as: a)
impregnation with water and oil preservatives, b) impregnation with synthetic
polymers, c) coating with cold setting liquid resins, d) coatings with synthetic melts,
and e) encasement in concrete when used for reinforcement.
With regard to natural geotextiles, durability is not a matter of concern where a short
service life is required, as for drainage and consolidation of soft compressible deposits
(Datye and Gore, 1994). Usually, if the geotextiles survives the construction-induced
stresses, it will also withstand the in-service stresses (Bonaparte et aI, 1988).
42
A geosynthetic vertical drain, using organic fibres trom jute and coir, to improve thick
soft clay deposits, known as fibre drain has been developed by Lee et a!. (1994). In
addition, it was required to withstand the application of high-energy impact on surface
fills constructed as part of improvement works. The study showed that the axial and
filter permeability of this drain were more than 10-4 m/s and 10-5 m/s, respectively, for
consolidation pressure up to 100 kN/m2.
Banerjee (1996) has developed a machine to manufacture strip drains by braiding jute
yams enclosing coir yarns. An important feature of the braided jute sheath is its
swelling nature resulting in a clog resistant drain. The discharge capacities of these
drains were less than that of synthetic drains, however, it docs satisfy the
requirements.
Coir geotextiles are produced from naturally occurring coir fibre, which is available at
relatively low cost in tropical countries. These are found to last for four to six years
within the soil environment depending on the physical and chemical properties of the
soil and pore fluid (Ramakrishna, 1996).
Ayyar and Dipu (1997) conducted studies on the effect of coir composites on the
bearing capacity of sand. It was shown that the coir fabrics could be used
economically for improving bearing capacity of sand subgrade significantly.
A study on coir reinforcement for stabilising soft soil subgradc has been carried out
by Rajagopal and Ramakrishna (1998). The test results clearly indicated the capability
of coir geotextiles in improving the stiffness and bearing capacity of soft subgrade.
They concluded that the coir geotextiles are suitable for cost etIective field
applications.
43

Use of coir geotextiles in erosion control measures has been reported by Cammack
(1988) and Lekha (2004). North American experiences with coir geotextiles for bank
stabilisation have reported by Lanier (1991) and White (1991).
In a study carried out by Ayyar and Girish (2000) for finding the possibility of
improving the durability of soil reinforcement system, load penetration test and plate
load test were done on sand beds reinforced with coir-needled felt, with and without
treatments. It was observed that there exist increased strength and durability with the
use of coir.
The use of coir products on ground improvement have been studied by Sheeba et al.
(2000). Two aspects were mainly considered in their work, one was to examine the
load defonnation behaviour of needled felt in clays, and the other was to examine the
durability of coir in sandy sub grade. While the cement-coated non-woven felt is seen
to be the most effective among fabrics studied, even the plain-needled felt improved
the resistance of clay slope.
A comprehensive summary of the production, properties and applications of coir
geotextiles were provided by Rao and Balan (2000) and Ayyar et al. (2002). The
biggest advantage of coir geotextile~ is its availability, economic price range, and eco
compatibility. It can be tailor made to end users' technical requirements like
porometry, pennittivity, strength, etc. (Rao and Baian, 20(0).
Sampath Kumar et al. (2000) reported the development of jute - coir braided PVD. It
was reported that the core prepared out of more number of thin coir yams showed
better perfonnance than a smaller number of thick yarns.
44
Coir is an abundantly available and renewable resource, which is more durable than
jute as its lignin content is higher. Under water, eoir has heen shown to retain its
strength for about 8 to 10 years. Though the survivability concept is more important
in the case of geotextile functions, studies indicate that, in most of the separation
applications, the critical period in the life of a geotextile is during the construction,
rather than during the service life (Koemer, 2005).
4.6 CASE STUDIES
Though less in number compared to polymeric geotextiles, COif geotextiles have been
tried for different civil engineering applications. A few case studies are described
below.
4.6.1 Protection of Mine Waste Dumps in Goa
Mine waste dumps of iron ore mines in Goa are a perennial problem faced by all
mines in Goa. Severe surface erosion takes place along the open mine waste dumps
during the monsoon season and creates a lot of environmental problems in the
surrounding area. Hillocks are being made, using the mine waste dump of very loose
density. Once rainfall starts, small gullies will be fonned along the slope, which will
lead to large gullies in the subsequent rain, and even deep-seated slope failure may
take place. In order to prevent the surface erosion and to increase the slope stability of
the dumps coir geotextiles were tried (Ayyar et al., 2002).
Usually the erosion problems in mine waste dumps were addressed hy traditional bio
engineering techniques such as planting of acacia plants or cashew plants over a small
cover of lateritic soil. However this traditional solution becomes very difficult owing
to the high transportation cost for movement of lateritic soils to the dump areas.
45

Application of new generation coir erosion control blankets with special design
features could be an effective alternative la provide solutions and to speed up the
vegetation process.
Non-woven coir geotextiles with medium thick polypropylene net on top and bottom
were used to protect the surface of the dump. The tensile strength of the non-woven
coir geotextile was 3.5 kN/m. Geotextiles were kept in position using wooden planks
of 25mm thick and having a length of more than 1000 mm (Fig. 4.2). Length of the
planks was so selected that it has to cut the probable slip circle at top and bottom
region of the slope. The sites treated with the blankets are perfonning satisfactorily
with stabilisation of the slopes. controlling the soil loss and reduction in pollution.
Fig. 4.2 Mine waste dumps in GOB
4.6.2 Pullangod. Estat. Erosion Control
One of the imponant field studies carried out successfully using coir fabrics has been
reponed by Rao and Balan (2000). The work was carried out in 1994 and was stable
enough for vegetation to grow till the matting degrades. which was expected in one
year. The location of the site was a rubber plantation near Nilambur in Kerala. The
46

site consists of an area of 583m2 abandoned plantation over a length of 50m with side
slopes of 49° - 66° suffered severe erosion with formation of wide gullies presented an
ideal area for the study.
Coir mattings were chosen and two varieties of white coir yams manufactured by
Aspinwall, H2M8 and H2M6, were used. Rolls of the coir matting were first anchored
in the top trench and then unrolled along the slope. Overlaps of 15cm minimum
between adjacent ones were given. The anchoring of the matting was made with mild
steel staples spaced to form a grid of 2m x 2m. Coir ropes of 20mm diameter were
used to tie the coir matting in a criss cross pattern at 900, making a grid of Im x Im
size. Steel staples were driven at each joint in the rope. Type A matting (91Sglm2)
was used on the upper half of the slope of 66° while type B matting (440glm2) was
used for the lower half of the slope of 49° since the thicker matting helped in
preventing rain splash.
The highlight of this study is the fact that the soil protected is lateritic. Peniseltum
purpureum grass was adopted, which is suitable for high elevations and steep slopes.
Also coir mesh matting of smaller aperture was more effective than the areas with
coarse opemngs.
4.6.3 Muvattupuzha Canal Protection
Sarma (1997) reported the details of this project which is situated on the 23.20 km of
the left bank main canal of the Muvattupuzha Valley Irrigation Project (MVIP) near
the main central road crossing between Muvattupuzha and Koothattukulam in Kcrala
state. This stretch of canal was one of the most highly crod~d stretches due to high
stream velocity in the major rainy season. Turfing 1:,'Tass protection was unsuccessful
since the time taken for grass to take root was more than successive monsoon periods.
47

The soil is also acidic with pH 4.3. The details of the coir netting are not reported but
it is mentioned that there is sufficient space for proper growing of grass. Possibly it is
a coarser net and the monitoring of the strength of net showed 50% decrease in six.
months. It was assumed that complete degradation would take place in five years .
Lemon grass having rOOls 45cm long was found to be the choice of vegetation in the
area and the coir fabric was very conducive to its growth. The case has been reported
as a success story for control of erosion. The photograph of a short stretch is shown in
Fig. 4.3.
Fig. 4.3 Muvattupuzha canal protection
4.7 NEED FOR PRESENT STUDY
The review of literature shows that the polymeric geotex.tiles is a versatile material
with attractive characteristics and advantages. and as a result. this material is now
being used abundantly all over the world. At the same time. these materials have got
the disadvantages that it is non-biodegradable. petroleum based and is cosily. The
review here also shows that . the use of natural geote)(tiles has not gained popularity.
48

even though some studies have been reported in this area. Though India produces
large quantities of coir geotextile, their use for geotechnical and highway engineering
applications has not gained confidence due to limited studies undertaken. An
elaborate and systematic study, covering different aspects and functions of coir
geotextiles, in the context of unpaved roads and embankments is lacking and so also
the design methods and procedures for the range of materials having properties that of
coir geotextiles. It is in this context, that an in-depth study in the utilisation of coir
geotextiles for unpaved roads and embankments are deemed necessary and hence
attempted herein.
49

CHAPTERS
MATERIAL CHARACTERISATION
5.1 INTRODUCTION
The subgrade soil and other materials, which we use for the construction of roads and
embankments, play major roles in deciding the method of design and construction. It
is always recommended to use the locally available materials if their strenf:,rth and
hydraulic characteristics pennit. Use of geotextiles for improvement of engineering
properties of soil is a proven method, which allows the utilisation of local materials to
a certain extent, even though the available materials are not so competent in view of
design considerations. This can be achieved only at some additional cost and the
relation between price and performance is significant in the choice of the material. A
geotextile can perform one or several functions to improve the mechanical and / or
hydraulic behaviour of the structure in which it is incorporated. The utility of coir
geotextiles for performing different functions to improve the engineering behaviour of
soil and the structure as such is studied here.
The soil available in nature varies widely in its physical and engineering behaviour. In
a study like this, it becomes necessary to limit the analysis to certain types of soil.
Two types of red soil (collected from two different sources), a soil of type clayey silt
and river sand are the basic materials selected at different stages for the investigations
on soil-geotextile matrix. Similarly, out of the different varieties of coir geotextiles
available, only three types of them (Woven - H2M6 & H2M8 and Non-woven - AGL
C/201) are selected for this study, which are expected to be more suitable for the use
in roads and embankments. Other construction materials used herein are granite
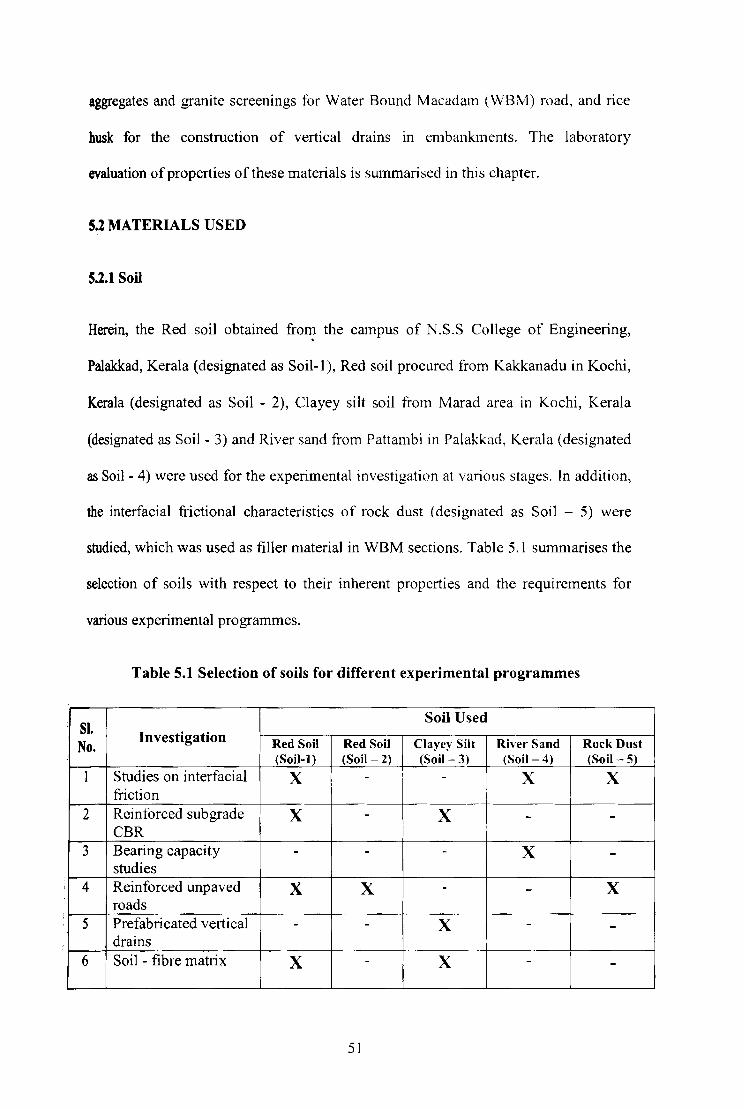
aggregates and granite screenings for Water Bound Macadam (\VBM) road, and rice
husk for the construction of vertical drains in embankments. The laboratory
evaluation of properties of these materials is summarised in this chapter.
5.2 MATERIALS USED
5.2.1 Soil
Herein, the Red soil obtained fron; the campus of N .S.S College of Engineering,
Palakkad, Kerala (designated as Soil-I), Red soil procured from Kakkanadu in Kochi,
Kerala (designated as Soil - 2), Clayey silt soil from Marad area in Kochi, Kerala
(designated as Soil - 3) and River sand from Pattambi in Palakkad, Kerala (designated
as Soil - 4) were used for the experimental investigation at various stages. In addition,
the interfacial frictional characteristics of rock dust (designated as Soil - 5) were
studied, which was used as filler material in WBM sections. Table 5.1 summarises the
selection of soils with respect to their inherent properties and the requirements for
various experimental programmes.
Table 5.1 Selection of soils for different experimental programmes
I
SI. Soil Used
No. Investigation Red Soil Red Soil Clayey Silt Rh'er Sand Rock Dust
(Soil-l) (Soil- 2) (Soil - 3) (Soil- 4) (Soil- 5)
1 Studies on interfacial X - I - X X friction i
2 Reinforced sub grade X - X ! - -I
CBR 3 Bearing capacity - - - X -
studies , 4 Reinforced unpaved X X - - X
roads 5 Prefabricated vertical - - X - -
drains 6 Soil - fibre matrix X - X - -
51

The relevant properties of all the soils selected were determined in the laboratory as
per current Bureau of Indian Standard Specifications (IS: SP: 36(Pan - I). 1987).
Table 5.2 summarises the properties of Soil-I. Soil-2 and Soil-3. Soil-4 being river
sand the physical properties of which are reported in Table 5.3 along with rock dust.
Grain size distribution curves for the soils are shown in Fig. 5.1
.~ ...
J
1 00 r-~: -'1 ~: :~" "'O--r 90 1 ~So;j-l
i ~Soi l -2 80 -.
-o- Soil - 3
70 1 -+-- Soil - 4
60 --e-- Soil - 5 I
50 '
40
30
I I I' I I I)
20 ~--I-+t4tt-
~LJJj J.L_~ j : Ijl,l
10 100 1000 10000
Particle lize (micronel,
Fig. 5.1 Particle size distribution curves
51.1.1 Rock dust
These are waste materials obtained during the crushing of rock masses and are
available in different sizes and gradations. This material was used as a filler material
while modeling the WBM sections. In the present investigation rock dust was
procured from a nearby rock-crushing unit at Palakkad. the properties of which are
given in Table 5.3.
52

5.2.2 Aggregates and Screenings
These are used to simulate sub base and base courses in unpaved roads. In India sub
base and base courses are made of Water Bound Macadam (WBM) or Wet Mix
Macadam (WMM). The properties of sub base and base courses are very significant,
as they have to bear the stresses induced by moving traffic. The strength of this layer
depends on the interlocking and lateral confinement of the layer. Granite aggregates
and screenings were procured from a local crusher unit at Palakkad. Coarse
aggregates used for WBM was Grading No.2 and screenings were of Grading A and
Grading B. The grading of aggregates and screenings \vas selected based on the
Specifications for Rural Road, published by the Ministry of Rural development
(MORD), which are detailed in Table 5.4 and Table 5.5.
Table 5.2 Properties of soils collected from different locations
Property Soil- 1 Soil - 2 Soil- 3
Type Red Soil Red Soil Clayey Silt
Classification Cl CH ML
Specific gravity 2.62 2.5 2.76
Liquid limit (%) 51 73 32
Plasticity index (%) 20 23 10
Shrinkage limit (%) 22 35 ! 18 -, --
Free swell index (%) 0 () 8.25
Soaked CBR (%) 3.35 1.50 0.95
OMC (%) 17 15.8 24
Max. dry density (kN/mJ) 11.7 14.6 15.2
53
i
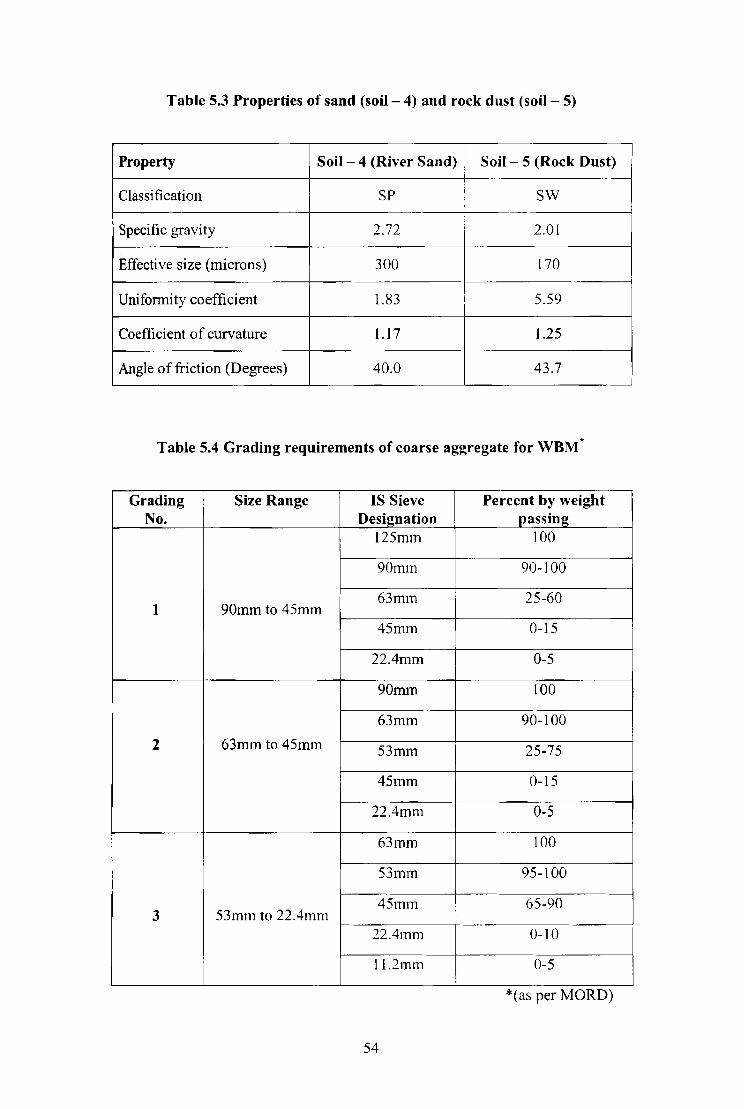
Table 5.3 Properties of sand (soil- 4) and rock dust (soil - 5)
Property Soil - 4 (River Sand) I Soil- 5 (Rock Dust)
Classification SP ;
SW
Specific gravity 2.72 , 2.01
Effective size (microns) 300 170
Uniformity coefficient 1.83 5.59
Coefficient of curvature 1.17 1.25
Angle of friction (Degrees) 40.0 43.7
Table 5.4 Grading requirements of coarse aggregate for WBM*
Grading Size Range IS Sieve I
Percent by weight No. Designation passing
125mm 100
90mm 90-100
63mm 25-60 1 90mm to 45mm
45mm 0-15
22.4mm 0-5
90mm 100
63mm 90-100
2 63mm to 45mm 53mm 25-75
45mm 0-15
22.4mm 0-5
63mm 100
53mm 95-100
45mm 65-90 3 53mm to 22.4mm ..
22.4mm 0-10
11.2mm 0-5
*(as per MORD)
54
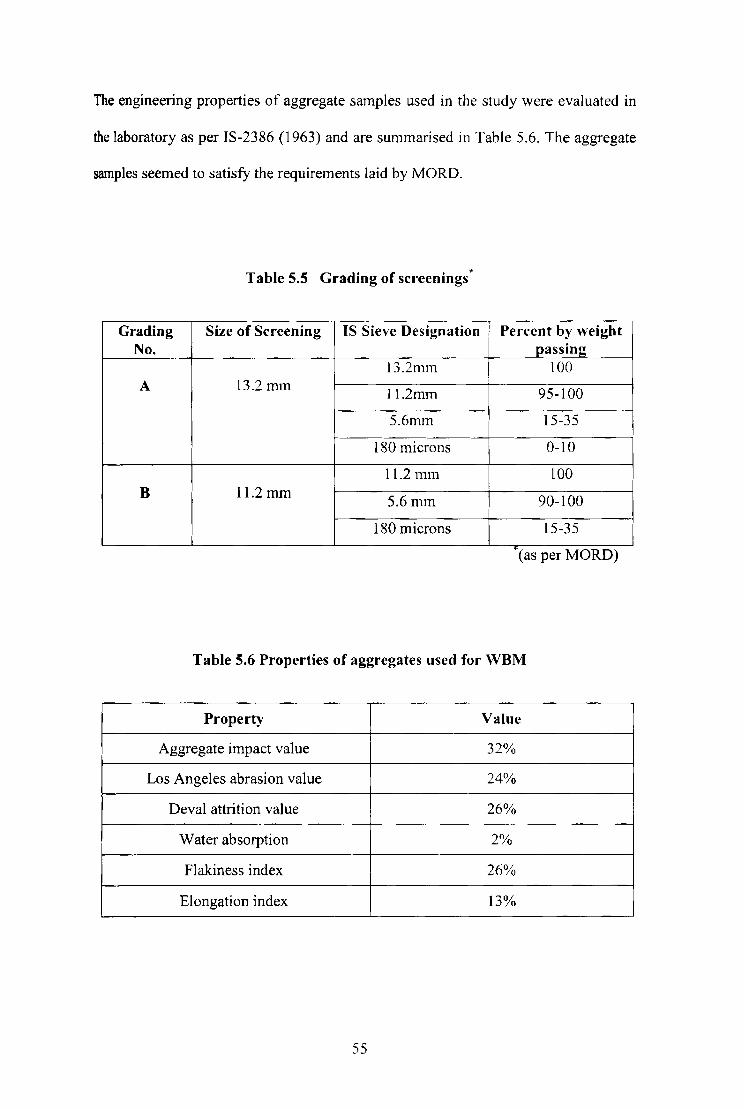
The engineering properties of aggregate samples used in the study were evaluated in
the laboratory as per IS-2386 (1963) and are summarised in Table 5.6. The aggregate
samples seemed to satisfy the requirements laid by MORO.
Table 5.5 Grading of screenings *
--Grading Size of Screening IS Sieve Designation i Percent b~ weight
No. __ passmg 13.2mm ! 100
A 13.2 mm I
11.2mm 95-100
5.6mm 15-35
180 microns 0-10
11.2 mm 100 B 11.2 mm
5.6mm 90-100
180 microns 15-35 ~
(as per MORD)
Table 5.6 Properties of aggregates used for WBM
-Property Value
Aggregate impact value 32%
Los Angeles abrasion value 24%
Deval attrition value 26%
Water absorption 2%
Flakiness index 26%
Elongation index 13%
55

5.2.3 Coir Geotextiles and Coir Fibres
Natural geotextiles (synthesised by man). such as. eoir meshing and jute fabrics are
being used in many civil engineering projects including roads and railways. These
geott!'xtiles are generally classified by manufacturing process and by the type of yam I
fibre used. and is often separated into two sub categories. namely. Woven and Non
woven. For the present work three types of eoir geotextiles. [wO woven types
(designaled as H2M6 and H2M8) and one variety of Non-woven (designated as AGL
C1201) were used which are shown in Fig. 5.2 . Mixed fibres having different lengths
were used for making soil - fibre composites for studying consolidation and strength
characteristics of soil -tibre matrix.
<a) H2M8 <b) H2M6 (c) Non·woven
Fig. S.2 Types of coir geotextiles used
5.2.11 Evaluation of properties
The properties of coir geotextiles were detennined as per standard specifications (85;
6906 and ASTM. 1993) in the geotextile testing fadlity available in the Geotechnical
engineering laboratory of Cochin University of Science and Technology. A brid
outline of the test procedure followed is given below.
56

The basic property of the geotextile, mass per unit area, was determined by accurately
weighing four pieces of coir geotextile having size 200mm x 200mm. The average
weight in g/m2 was reported as the mass per unit area.
The thickness of the coir geotextile was measured using a thickness gauge, which
~ consists of a base plate, a surcharge plate and dial gauges. Four specimens of 200mm
x 200mm size were taken. The overall thickness was found out under a surcharge load
of 0.02 kg/cm2• From the total thickness the average thickness of one piece of coir
geotextile was found out.
In order to determine the puncture resistance, the coir geotextile specimen was
properly clamped on the top side of the CBR mould by means of the clamping strip.
The mould was kept in a compression testing machine and the load was applied
through a plunger of 50mm diameter. The rate of deformation was kept at 60 mm per
minute. The puncture resistance was reported as the peak value of load in Newton.
The cross plane permeability was measured as in the case of soil, using a constant
head assembly. The specimen was clamped in the penneability cell properly. The
discharge was noted and penneability was calculated.
The tensile strength of coir geotextile was detennined uSlIlg a wide specimen of
200mm width for wide width tensile test and a narrow specimen of 100mm width for
strip tensile test. The specimens were cut both in the machine direction and cross
machine direction. The specimens were connected by means of the clamping
arrangement devices and adapter in a tension testing machine. The distance between
the top and bottom clamping was kept respectively as 75mm and 1 OOmm for strip test
and wide width test. The loading rate was 300mm/minute for strip test and
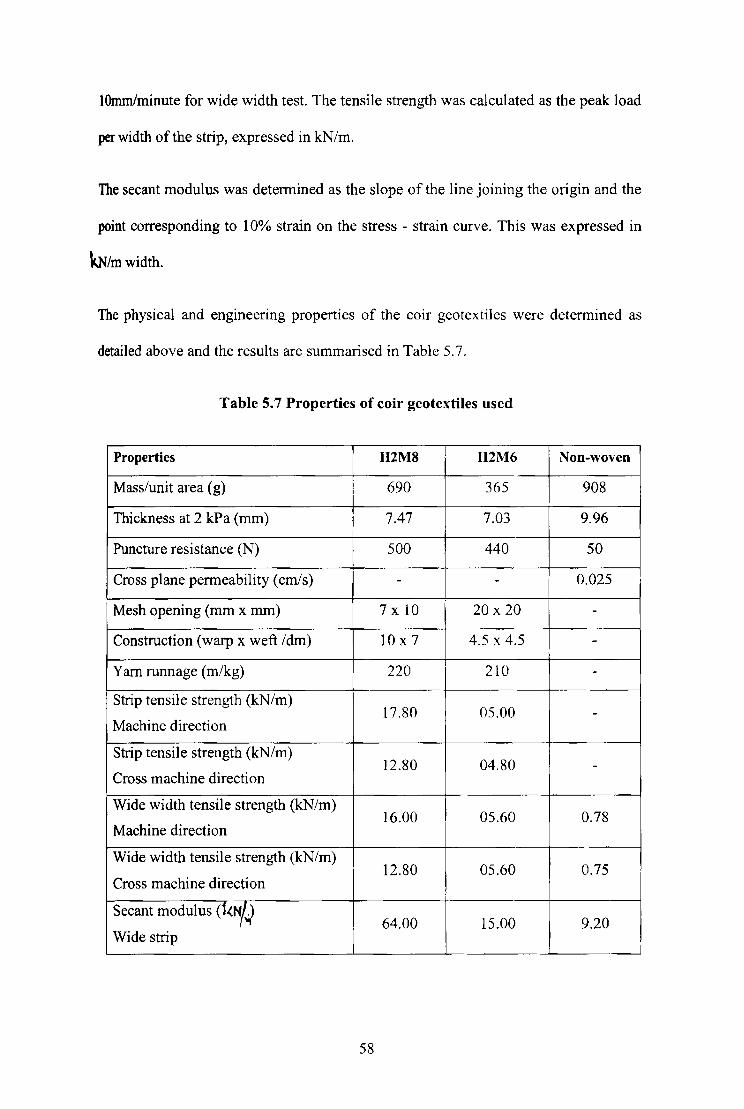
10000minute for wide width test. The tensile strength was calculated as the peak load
per width of the strip, expressed in kN /m.
The secant modulus was determined as the slope of the line joining the origin and the
point corresponding to 10% strain on the stress - strain curve. This was expressed in
kN/m width.
The physical and engineering properties of the coir gcotextiles were determined as
detailed above and the results are summarised in Table 5.7.
Table 5.7 Properties of coir geotextiles used
Properties H2MS H2M6 Non-woven
Mass/unit area (g) 690 365 908
Thickness at 2 kPa (mm) 7.47 7.03 9.96
Puncture resistance (N) 500 440 50
Cross plane permeability (cm/s) - - 0.025
Mesh opening (mm x mm) 7 x 10 20 x 20 -
Construction (warp x weft /dm) 10 x 7 4.5 x 4.5 -
Yarn runnage (m/kg) 220 210 -Strip tensile strength (kN/m)
17.80 05.00 -Machine direction
Strip tensile strength (kN/m) 12.80 04.80 -
Cross machine direction
Wide width tensile strength (kN/m) 16.00 05.60 0.78
Machine direction
Wide width tensile strength (kN/m) 12.80 05.60 0.75
Cross machine direction
Secant modulus (1'(N/~ 64.00 15.00 9.20
Wide strip
58
5.3 SUMMARY
Deterrnination of physical and engineering properties of different basic materials used
in the investigation were described in this chapter. The results of further investigation
would certainly depend on the properties detennined in this section. Due to various
constraints, the study was limited to the use of four types of soil and three varieties of
coir geotextiles even though the types and properties of soil encountered in nature
vary vastly. However, an assessment of general behaviour could be obtained by
studying these typical materials.
59
CHAPTER 6
INTERFACE FRICTION CHARACTERISTICS OF COIR GEOTEXTILES
6.1 INTRODUCTION
Reinforcement is one of the most important functions of geotextiles in mechanically
improving the soil properties, whether it is used in slopes, embankmcnts, retaining
walls, or pavements. Reinforcement achieves this mechanii,:al improvement by
withstanding tensile axial force and thereby enhancing the shearing resistance of the
soil. The reinforcement acts efficiently when it is Oliented in the direction in which
tensile strain develops in the deforming soil. The benefit of reinforcement is derived
from the tangential and normal components of the tensile reinforcement force acting
on the shear surface.
When reinforcement is placed in soil it can develop bond through frictional contact
between the soil particles and the planar surface areas of the reinforcement, and from
bearing stresses and transverse stresses, which exist in grids or ribbed strips.
Defonnation in the soil mobilises tensile OT comprcssive force in the reinforcement
depending on the inclination of the latter and is ultimately limited by the available
bond between soil and reinforcement. The stiffness properties of the reinforcement
also influence the soil shear deformation of the composite material, which is required
to mobilise the reinforcement force. Hence the shear frictional behaviour of soil -
geotextile interfaces plays a pivotal role in the overall perfOlmance of geotextile
reinforced constructions.

The interfacial friction depends upon a large number of parameters such as pressure,
grain size and shape, surface roughness of gcotextilc, etc .. The frictional resistance
mobilised between the soil and the reinforcement has a significant role while
analysing the internal and an external stability of the mechanically stabilised earth
structures. Hence the properties of the interaction between soil and reinforcement
such as coefficient of friction must be detennined as an indispensable factor along
with the individual properties of the soil and reinforcement, in order to arrive at the
load conditions on the geotextile and for the detennination of design factors such as
spacing and extent of reinforcement.
There are two limiting modes of interaction viz., direct sliding, in which a block of
soil slides over a layer of reinforcement, and pull 0111, in which a layer of
reinforcement pulls out from the soil once its maximum available bond stress is
overcome. Modified direct shear tests are suitable ft)r measuring the coefficient of
direct sliding between soil and any type of reinforcement materials and pull out tests
to model the development of bond stresses. It is reported that the results of the pull
out test are difficult to interpret and can be greatly intluenced by the conditions in the
test, even though special apparatus is used for modeling (Palmeira and Milligan,
1989). For design, it is usually sufficient to calculate the bond coefficient from the
theoretical analysis (Jewell, 1996). Hence in this present study it is limited only to
direct sliding tests.
Five series of modified direct shear tests on the soil - coir gcotextile interfaces were
conducted under monotonic loading. The purposes of the tests were to examine the
behaviour of interfaces between the four types of soil and three types of coir
geotextiles under different test conditions. The results would provide a better
61

understanding of the shear frictional mechanism of soil coir geotextile interface to use
in the design of unpaved roads and embankments utilising coir geotextiles. Details of
the testing programme, test results and discussions of the test results are presented in
this chapter.
6.2 TEST DESCRIPTION
The direct shear test apparatus consisted of 60mm x 60mm x 40mm deep box which
can be split horizontally at mid height with displacement controlled loading system.
The rate of shear displacement was 0.02mm Isecond. The constant normal stress was
applied by dead load.
The size of the direct shear box in this study was relatively small. The boundary
effects could affect the test results to some degree. However test results with the
60mm square direct shear box were expected to have insignificant boundary effects
for two reasons. First, the dimensions of the direct shear box were approximately
hundred times the mean grain size of the soil specimen. This was in the range
recommended by ASTM 03080 and by other researchers (Jcwell and Wroth, 1987;
Palmeira, 1988). Second, it was confirmed by O'Rourke et a1. (1990) that when the
60mm square direct shear apparatus was used for Ottawa sand and High Density Poly
Ethylene (HDPE) to find the interface friction, it gave results similar to those obtained
from large size direct shear apparatus.
In order to determine the interfacial friction, several modifications have been made by
different researchers (Subba Rao et aI., 1996). Basically two types of arrangements
have been tried. The solid material can be placed over prepared soil bed (type A mode
of shear) or the soil can be prepared over the solid material (type B mode of shear).
62
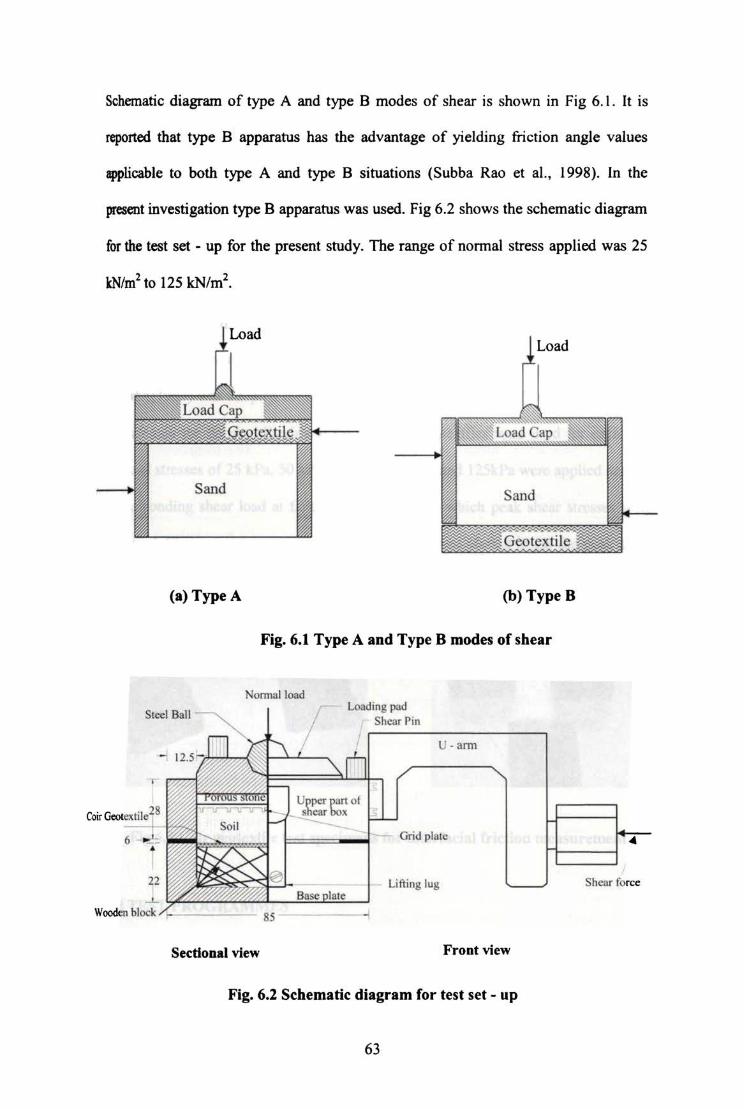
Schematic diagram of type A and type B modes of shear is shown in Fig 6.1 . It is
reported that type B apparatus has the advantage of yielding fiiction angle values
applicable to both type A and type B situations (Subba Rao et aI., 1998). In the
present investigation type B apparatus was used. Fig 6.2 shows the schematic diagram
for the test set - up for the present study. The range of nonnal stress applied was 25
kN/m'to 125 kN/m'.
Load
(a) Type A (b) Type B
Fig. 6.1 Type A and Type B modes or shear
Nomlal lo.1d
Sleel Ball
SecdODal view
/ Loading pad
Shear Pin
Up"" """ 01 shear box --
U - ann
Grid plale
Lifting lUll
Front view
Fig. 6.2 Schematic diagram for test set - up
63
Shear force

6.3 SPECIMEN PREPARATION AND TEST PROCEDURE
Wooden blocks were cut to size so as to fit into (he bottom half of the direct shear
box. eair geotextiles cut into 60mmx 60nun sizes were glued in the lOp surface of the
rigid wooden block (Fig. 6.3). The rigid wooden block with ecir geotextile was fitted
inside the lower half of the direct shear box. The upper part of the shear box was
placed over the lower pan and pins were placed at the corners to keep the two pans
intact. Calculated quantity of soil was placed in the upper pan of the shear box and
tampings were given to get the required density. The test procedure laid in IS: SP: 36
- Pan 1(1987) was adopted for the entire series of experiments. Great care was taken
to maintain the density . Fresh soil samples and geotextiles were used for each test.
Normal stresses of 25 kPa. 50 kPa 75 kPa. 100 kPa and 125kPa were applied and the
corresponding shear load at failure was noted from which peak shear stresses were
obtained. Shear stress versus normal stress graphs were plotted to get the peak angle
of internal friction.
Fig 6.3 Coir geotextile test specimens for interfacial friction measurement
6.4 TEST PROGRAMMES
Five series of ex.periments were done using three types of soil (sand. rock dust. and
red earth) and three types of eoir geotextiles (woven - H2M6 and H2M8 and Non -
woven). 68 sets of experiments were done in different combinations 10 get frictional
64

characteristics of different interfaces. Interface friction characteristics of sand and
rock dust in natural and in different graded states were studied in addition to the red
soil. The effect of water content was studied in red soil and in all other cases the
material was kept in dry state. Test programmes for th~ direct shear test are presented
in Table 6.1.
Table 6.1 Details of test series
Series Type of Subgrade soil Type of GeotextiIe Unit weight!
Water content
I Sand (Soil - 4) Nil, H2M6, H2M8 15kN/m3
and Non - woven 16kN/m3
. 1 7kN/ffi"~
i-n Graded sand (2mm to 4.75mm) I
Graded sand (1 mm to 2mm) Nil, H2M6, H2M8 16kN/m3
and Non - woven
Graded sand (lmm to 425 microns)
IIJ Rock dust (Soil - 5) Nil, H2M6, H2M8 15.1kN/m3
and Non - woven 16.5kN/m3
17.6kN/m3
IV Graded rock dust (2mm to 4.75mm)
Nil, H2M6, H2M8
Graded rock dust (1 mm to 2mm) and Non - woven 16.5kN/m3
I Graded rock dust I (lmm to 425 microns) I
V Red soil (Soil - 1) I Nil, H2M6, H2M8 '~5.() k;-~-1 and Non - woven I 10%, 15% and
20%
65

6.5 RESULTS AND DISCUSSION
The results of the direct shear tests conducted are presented and discussed in the
following sessions. The relationship between peak shear stress and nonnal stress was
plotted for different soil and coir geotextile interfaces. Failure state was defined as the
peak shear stress. Values of direct sliding coefficient (C,J were calculated as:
--------------------(6.1)
where, Rds = Maximum shear resistance in kN/m,
L := Stationary length of geosynthetic in m,
(j N = Effective nonnal stress in kN/m2, and
t/J := Effective soil friction angle in degrees.
The values of interface friction angles (8) obtained for different series of experiments
are summarised in Table 6.2 in order to have a quantitativ~ analysis.
6.5.1 Shear Stress - Normal Stress Relationship
The shearing characteristics of different materials used in unpaved roads and
embankments show vast variations. Hence it is required to understand the shear
behaviour when coir geotextiles have to perfonn in conjunction with different
materials during and after the construction. Fig.6.4 shows the failure envelopes
obtained by plotting peak shear stresses and normal stresses for typical cases.
Analysing the similar plots it can be observed that the introduction of geotextile
increases the shear resistance invariably in all cases studied. [t could also be seen that
66

the maximum shear strength by way of interfacial frictilln is developed with soil
having larger particle size at high density, even though the normal stress - shear stress
relation was identical for all the cases of soil - coir geotextilc interfaces studied.
Table 6.2 Summary of interface friction angles
Test Angle of Interface Friction angle (li)
Series Description internal (degrees)
friction (<D) No.
(degrees) H2M6 H2M8 NW
1 Sand @15.0 kN/m3 36.98 38.79 41.26 43.35 "
2 Sand @16.0 kN/m3 41.00 43.63 44.65 47.12
3 Sand @17.0 kN/m 3 44.94 I 46.88 I 50.02 52.32 -,
I I 4 Graded sand 4.75 -2mm
45.19 47.46 49.50 52.45 @16.0kN/m3
5 Graded sand 2mm - 1 mm,
44.97 46.85 48.47 49.43 @ 16.0kN/m3
6 Graded sand 1 mm -0.425mm,
39.63 44.90 46.33 46.97 @ 16.0kN/m3
7 Rock dust @15.1kN/m3 39.63 40.56 41.48 44.17
8 Rock dust @ 16.5kN/m3 43.69 43.80 46.33 50.00
9 Rock dust @ 17.5kN/m3 46.72 47.77 50.39 52.98
10 Graded rock dust >4.75mm,
57.28 57.92 59.26 59.48 @16.5kN/m3
11 Graded rock dust, 4.75 - 2mm,
54.90 55.98 56.86 57.23 @16.5kN/m3
12 Graded rock dust, 2mm - Imm,
50.02 51.23 52.07 53.08 @16.5kN/m3
i i 13
Graded rock dust, 1 - 0.425mm, 46.82 ! 47.68
I 50.18 50.05
@16.5kN/m3 I I
Graded rock dust, <0.425mm, ,
I 14 @16.5kNim3 42.52 42.63 43.84 45.00
15 Red soil @15.0kN/mJ
42.49 44.31 47.91 49.21 w/c =10%
16 Red soil @15.0kN/m
j
41.98 42.36 39.05 43.48 wlc = 15%
17 Red soil @15.0kN/m .l
30.95 34.47 38.18 38.77 w/c= 20%
67

180 r--===-c-, o sand only I
160 c with H2~
- 140 6 with H2M6 : ;1 20 ~ o withNW
• ! 100 ;;;
I 80
i 60
: 40
20
o o 50 100
Normal stre ss (kPa)
(a) Sand at 16.0 kN/ mJ
180 c:C'::::=. i 0 rock dus-t only 160 ~ 0 With H2t.e
to with H2M6 . 140 - o withNW
~ -; 120 1 ! 100 1/)
- 80 j
L0 1 " I 40
20
o o 50 100
Normalltre_(kPa)
150
150
(c) Rock dust at 16.5 kN/mJ
180
160 o graded sand Of"Ity 0
o withH2MJ
~ 140 t::. with H2rv'6 .... o with NW -; 120 e
~ ': 1 2 e 60 " i 40
20
o o 50 100
Normal stress (kPa)
150
(b) Graded sand (4.7Smm to 2mm size)
at 16.0kN/mJ
180 . 160 ~ 0 red soi 0fVj
C with H2~
ca 140 0. to wiltl H2M3
" ~120 e ~ 100 VI -80 m .c w 60 ' " e 40 , ~ 0.
20
0 0 50 100 150
Normal Sire. (kPa)
(d) Red soil at 10% water content
at lS.OkN/mJ
Fig. 6.4 Variation of peak shear stress with normal stress Cor eoir geotextile interface
68
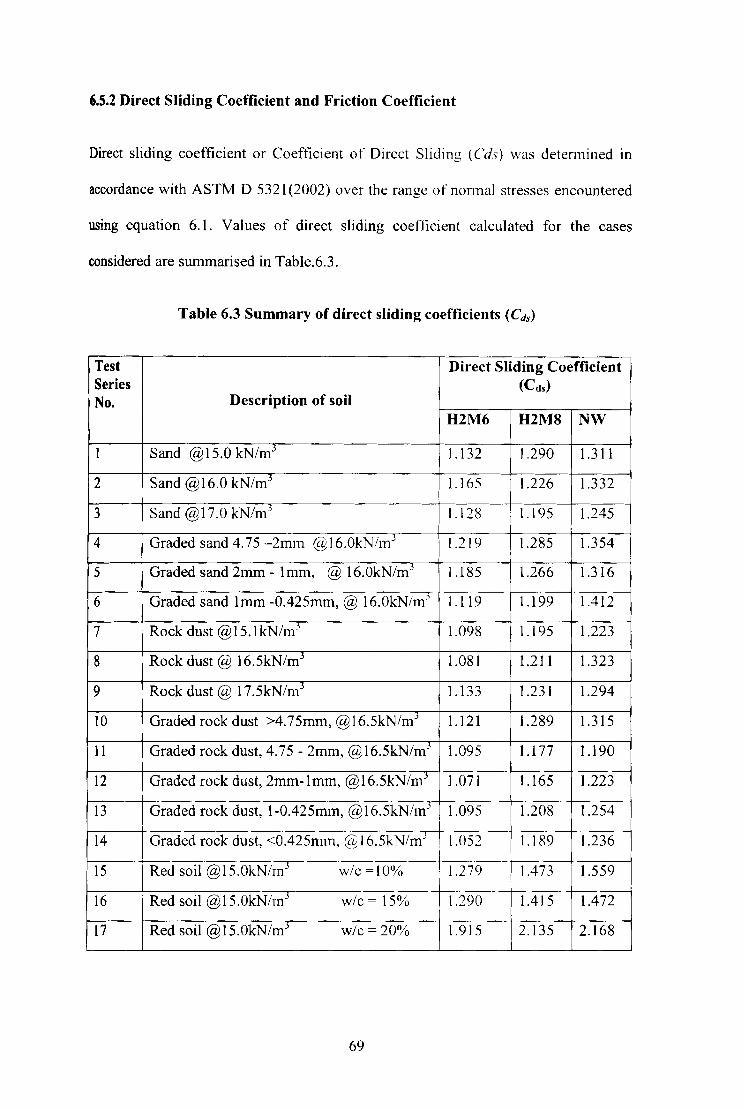
6.5.2 Direct Sliding Coefficient and Friction Coefficient
Direct sliding coefficient or Coefficient of Direct Sliding (Cds) was detcnnined in
accordance with ASTM D 5321 (2002) over the range of nonnal stresses encountered
using equation 6.1. Values of direct sliding coefficient calculated for the cases
considered are summarised in Table.6.3.
Table 6.3 Summary of direct sliding coefficients (Cds)
Test Direct Sliding Coefficient Series (Cds)
No. Description of soil H2M6 H2M8 NW
I Sand @15.0 kN/mj 1.132 1.290 1.311
2 Sand @16.0 kN/mJ 1.165 1.226 1.332
3 Sand @17.0kN/m-' 11.128 -- 1.195 1.245
4 Graded sand 4.75 -2mm @16.0kN/mj 1.219 1.285 1.354
5 Graded sand 2mm - 1 mm, @ 16.0kN/mJ 1.185 1.266 1.316
6 Graded sand 1 mm -0.425mm, @ 16.0kN/m-' 1.119 1.199 lA12
7 Rock dust @15.1kN/mj 1.098 1.195 1.223
8 Rock dust @ 16.5kN/mJ 1.081 1.211 1.323
9 Rock dust @ 17.5kN/mJ 1.133 1.231 1.294
to Graded rock dust >4.75mm, @16.5kN/mJ 1.121 1.289 1.315
11 Graded rock dust, 4.75 - 2mm, @16.5kN/mj 1.095 1.177 1.190
12 Graded rock dust, 2mm-lmm, @16.5kN/mJ 1.071 1.165 1.223
13 Graded rock dust, 1-OA25mm, @ 16.5kN/m3 1.095 1.208 1.254
14 Graded rock dust, <OA25mm, @16.5kN/m-' , I.OS2 1.189 1.236 I
15 Red soil @15.0kN/m3 w/e =10% h279 I . /IA73 1.559
16 Red soil @15.0kN/m J w/e = 15% ! 1:290 IA15 1.472 I
17 Red soil @15.0kN/m3 w/e = 20% 1.915 2.135 2.168
69
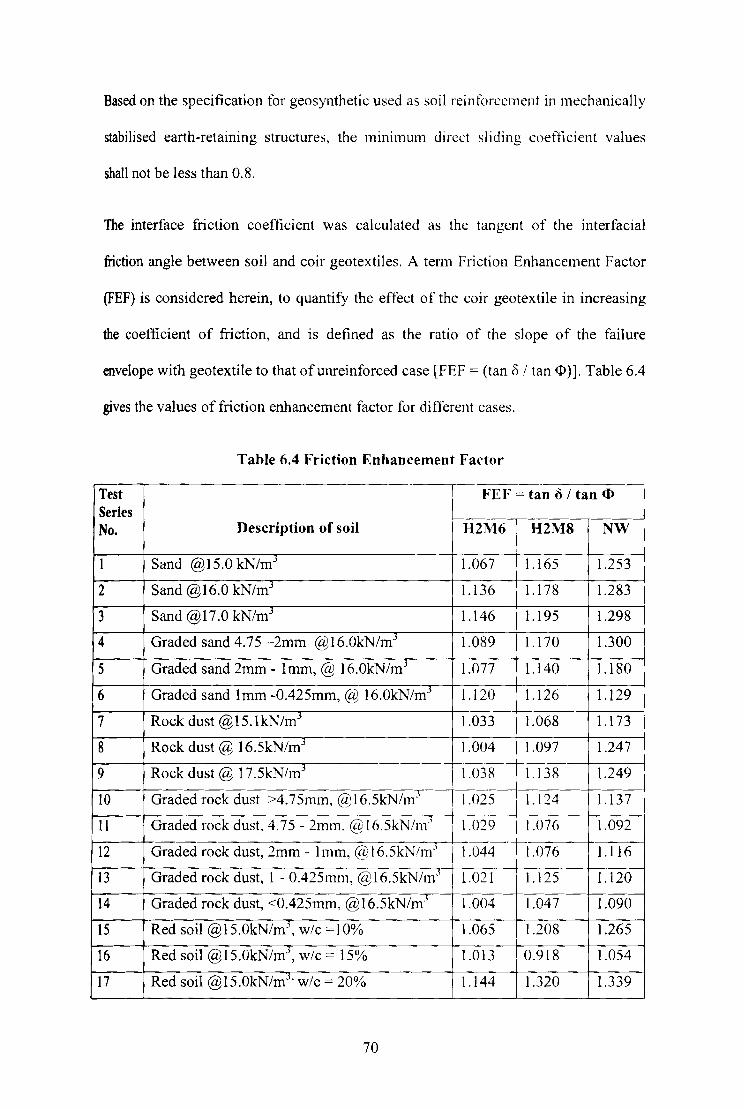
Based on the specification for geosynthetic used as soil reinforcemcnt in mechanically
stabilised earth-retaining structures, the minimum direct sliding coefficicnt values
shall not be less than 0.8.
The interface friction coefficient was calculated as the tangent of the interfacial
friction angle between soil and coir geotextiles. A tenn Friction Enhancement Factor
(FEF) is considered herein, to quantify the effect of the coir geotextile in increasing
the coefficient of friction, and is defined as the ratio of the slope of the failure
envelope with geotextile to that ofunreinforced case [FEF = (tan 8/ tan $)]. Table 6.4
gives the values of friction enhancement factor for different cases.
Test Series No.
2
3
4
5
6
7
8
9
10
11
12
13
14
15
16
17
Table 6.4 Friction Enhancement Factor
i -~~n () I tan <I>
Description of soil . H2M6 H2M8 NW
Sand @15.0kN/m) 1.067
Sand @16.0 kN/mJ 1.136
Sand @17.0 kN/mJ 1.146
Graded sand 4.75 -2mm @16.0kN/m3 1.089
Graded sand 2mm - 1 mm, @ 16.0kN/mj
1.077
Graded sand 1 mm -0.425mm, @ 16.0kN/mj
1.120
Rock dust @15.1kN/m3 1.033
Rock dust @ 16.5kN/mj
1.004
Rock dust @ 17.5kN/mj
1.038
Graded rock dust >4.75mm, @16.5kN/mj -----rlm,5 , i
Graded rock dust, 4.75 - 2mm, (£~'16.5kN/mj 1.029
Graded rock dust, 2mm - 1 mm, @16.5kNilnJ I 1.044
Graded rock dust, 1 - 0.425mm, @16.5kN/m .l 1.021
Graded rock dust, <0.425mm, @16.5kN/ml 1.004
Red soil @15.0kN/mJ, w/c =10% 1.065
Red soil @15.0kN/m" w/c = 15% 1.013
Red soil @15.0kN/m3. w/c = 20% 1.144
70
1.165
1.178
1.195
1.170
1.140
1.126
1.068
1.097
1.138
I 1.124
I 1.076
'11.076
1.125
1.047
1.208
0.918
1.320
1.253
1.283
1.298
1.300
1.180
1.129
1.173
1.247
1.249
1.137
1.092
1.116
1.120
1.090
1.265
1.054
1.339
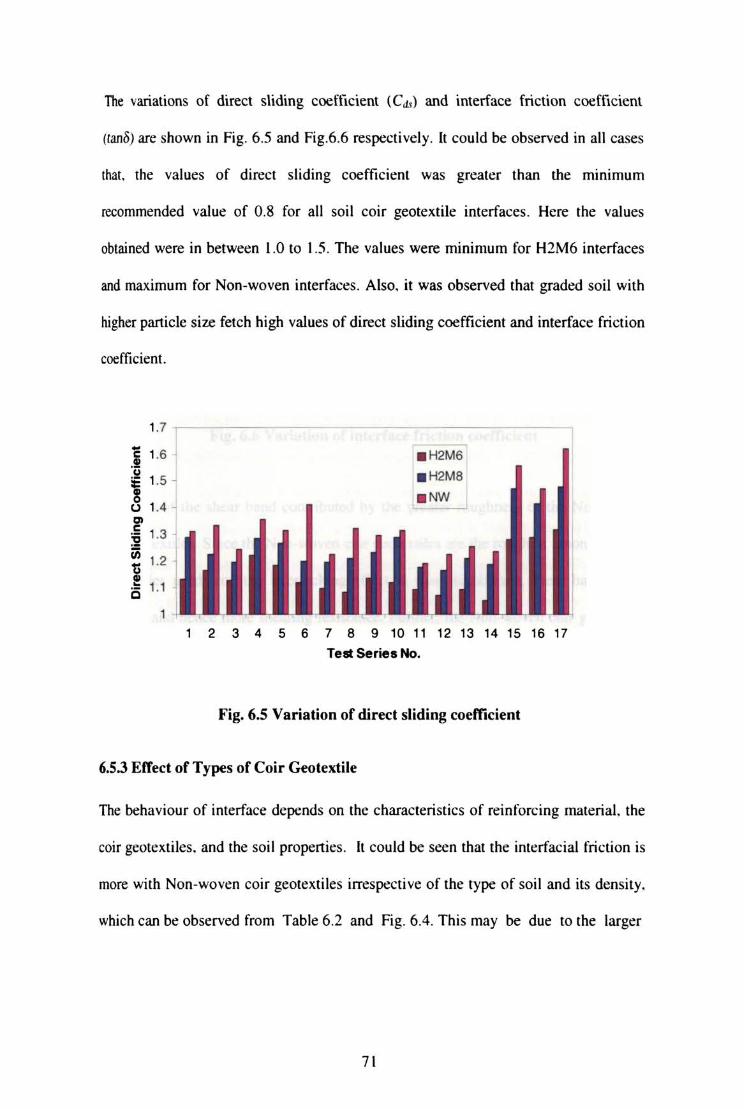
The variations of direct sliding coefficient (Cd.,) and interface friction coefficient
(tanS) are shown in Fig. 6.5 and Fig.6.6 respectively. It could be observed in all cases
Ihar. the values of direct sliding coefficient was greater than the minimum
recommended value of 0 .8 for all soil coir geote:<tile interfaces. Here the values
obtained were in between 1.0 to 1.5. The values were minimum for H2M6 interfaces
and maximum for Non-woven interfaces. Also. it was observed that graded soil with
higher particle size fetch high values of direct sliding coefficient and interface friction
coefficient.
1.7 ~
1.6 .!!
i 1.5 j
u 1.4 .j .. < ~ Ul 1.2
~ 1.1 is 1
. H2M6
. H2MB
. NW
2 3 4 5 6 7 8 9 10 11 12 13 14 15 16 17
Tell: Series No.
Fig. 6.S Variation of direct sliding coefficient
6.5.3 Eltect of Types of Coir Geotextile
The behaviour of interface depends on the characteristics of reinforcing material. the
coir geotextiles. and the soil propenies. It could be seen that the interfacial friction is
more with Non-woven coir geotextiles irrespect ive of the type of soil and its density,
which can be observed from Table 6.2 and Fig. 6.4. This may be due to the larger
7 1
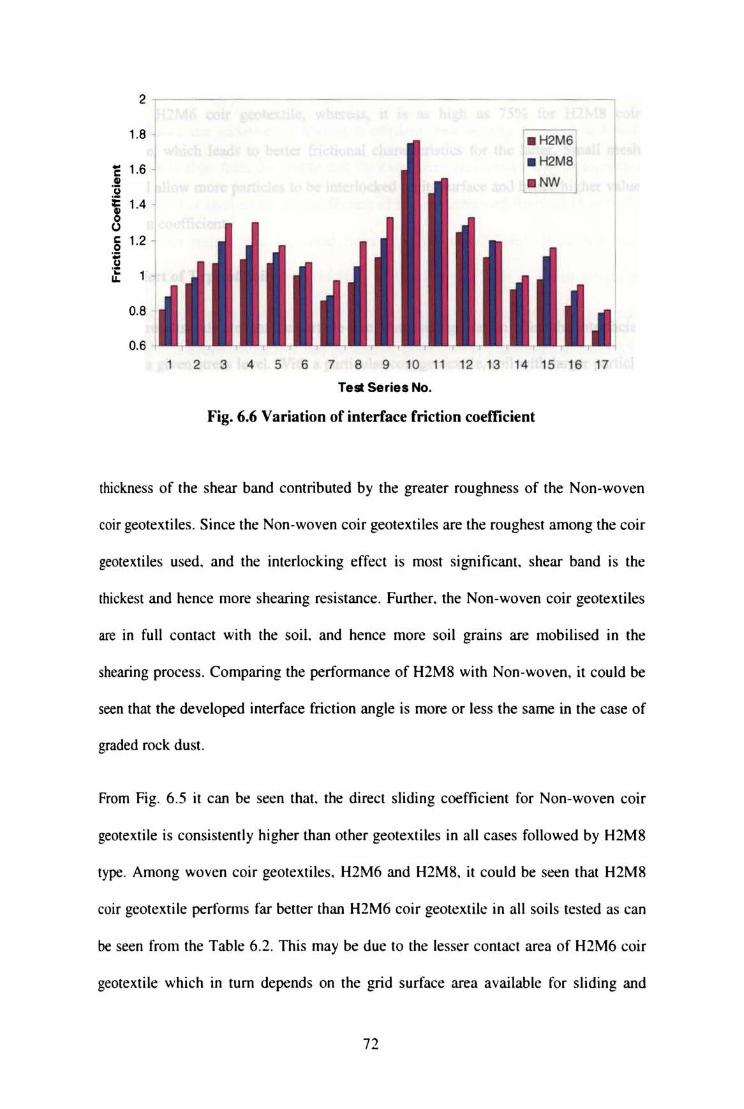
2 ~
1.B
16 j < .! ~ 1.4 J 8 " < .g .~ "-
O.B
0.6
I . H2M6
.H2MJ c!NW
, 2 3 4 5 6 7 8 9 10 11 12 13 14 15 16 17
Tell Series No.
Fig. 6.6 Variation of interface friction coefficient
thickness of the shear band contributed by the greater roughness of the Non-woven
coir geotexti les. Since the Non-woven coir geolextiles are the roughest among the coir
geotextiles used. and the interlocking effect is most significant. shear band is the
thickest and hence. more shearing resistance. Funher. the Non-woven cci r geote)(tiles
are in full contact with the soil. and hence more soil grains are mobilised in the
shearing process. Comparing the perfonnance of H2M8 with Non-woven. it could be
seen that the developed interface friction angle is more or less the same in the case of
graded rock dust.
From Fig. 6.5 it can be sec::n that the direct sliding coefficient for Non-woven coir
geotexti le is consistently higher than other geotextilcs in all cases followed by H2M8
type. Among woven coir geotextiies. H2M6 and H2M8. it could be seen that H2M8
coir geOlextile perfonns far better than H2M6 coir geotcxtiie in all soils tested as can
be seen from the Table! 6.2. This may be due to the lesser contact area of H2M6 coir
geotext ile which in turn depends on the grid surface area availab le for sliding and
72
hence the mesh size opening. The effective grid surface area available for sliding is
42% for H2M6 coir geotextile, whereas, it is as high as 75% for H2M8 coir
geotextile, which leads to better frictional characteristics for the latter. Small mesh
sizes will allow more particles to be interlocked on its surface and hence higher value
of friction coefficient.
6.5.4 Effect of Type of Soil
The test results indicate that the particle size, shape and gradation atfect the interfacial
shear at a given stress level. With a particular coir geotextile, soil with larger particle
size gave higher friction. For example, for sand at a unit weight of 15 kN/m3, the Cds
with H2M6, H2M8 and NW coir geotextiles were respectively 1.132, 1.290 and 1.311
whereas, for rock dust with lesser effective size than sand at a unit weight of
15.lkN/m3, the values were respectively 1.098, 1.195 and 1.223. This could be due to
the fact that the width of the shear band was atfected by particle size. The area of
shear zone increases as the particle size increases. Larger amount of energy is needed
to transfonn the larger area. The frictional resistance was more in the same order of
area of sheared zone, that is, in the same tone of the grain size.
The interfacial friction coefficients for sand at a unit weight of 15.0 kN/m3 were
0.804, 0.879 and 0.944 for H2M6, H2M8 and Non-woven respectively, whereas the
corresponding values for rock dust at a comparable unit weight were 0.856, 0.884 and
0.972 respectively. This shows that the interface friction coeflicient of rock dust is
higher than that of sand.
73
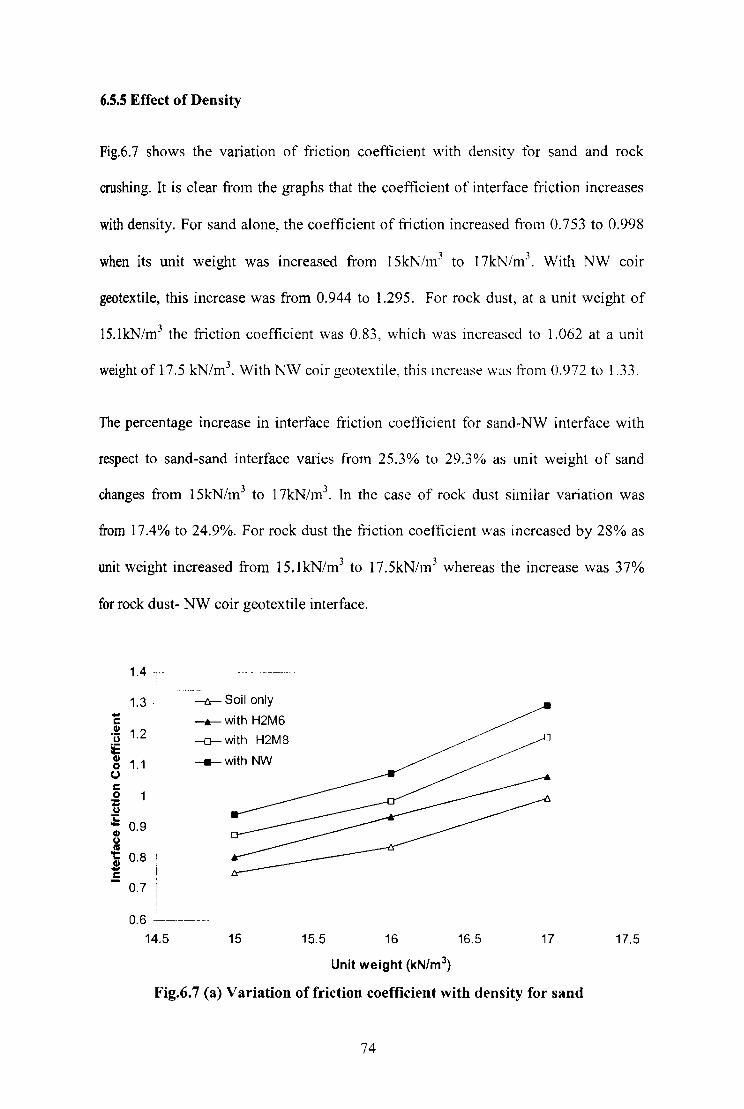
6.S.S Effect of Density
Fig.6.7 shows the variation of friction coefficient with density for sand and rock
crushing. It is clear from the graphs that the coefficient of interface friction increases
with density. For sand alone, the coefficient of tnction increased from 0.753 to 0.998
when its unit weight was increased from 15kNim3 to I 7kN/m3• With NW coir
geotextile, this increase was from 0.944 to 1.295. For rock dust, at a unit weight of
15.lkN/m3 the friction coefficient was 0.83, which was increased to 1.062 at a unit
weight of 17.5 kN/m 3. With NW coir geotextile, this increase was from 0.972 to 1.33.
The percentage increase in interface friction coefficient for sand-NW interface with
respect to sand-sand interface varies from 25.3% to 29.3% as unit weight of sand
changes from 15kN/m3 to 1 7kN/m3• In the case of rock dust similar variation was
from 17.4% to 24.9%. For rock dust the friction coefficient was increased by 28% as
unit weight increased from 15.1kN/m3 to 17.5kN/m3 whereas the increase was 37%
for rock dust- NW coir geotextile interface.
1.4 -r-
1.3 -.... I:: Cl) '0 1.2 :E 8 1.1 U I:: o ~ i ID 0.9 u ~ .! 0.8
.5 0.7
14.5
-t:r- Soil only
--.- with H2M6
-0-- with H2M8
___ with NW
15 15.5 16
Unit weight (kN/m 3)
16.5 17
Fig.6.7 (a) Variation of friction coefficient with density for sand
74
17.5
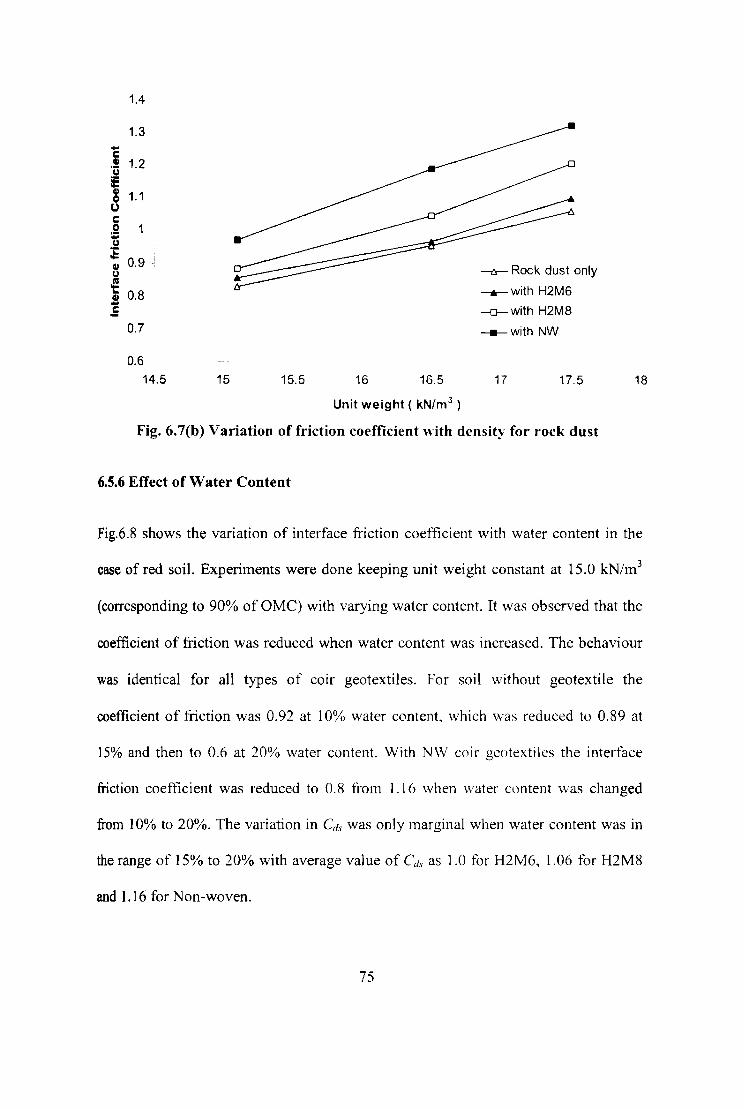
1.4
1.3 -c G) 1.2 'ij
~ 1.1 0 (.)
c 0 1 ;: u .;: .... 0.9 G) u ~ QI 0.8 .. .5
0.7
0.6 14.5 15 15.5 16 16.5
Unit weight ( kN/m 3 )
-fr- Rock dust only
--....- with H2M6
--0-- with H2M8
____ with NW
17 17.5
Fig. 6.7(b) Variation of friction coefficient with densit~· for rock dust
6.5.6 Effect of Water Content
18
Fig.6.8 shows the variation of interface friction coefficient with water content in the
case of red soil. Experiments were done keeping unit weight constant at 15.0 kN/m3
(corresponding to 90% of OMC) with varying water content. It was observed that the
coefficient of friction was reduced when water content was increased. The behaviour
was identical for all types of coir geotextiles. For soil without geotextile the
coefficient of friction was 0.92 at 10% water content, which was reduced to 0.89 at
15% and then to 0.6 at 20% water content. With NW coir gcotexti1cs the interface
friction coefficient was reduced to 0.8 from 1.16 when water content \vas changed
from 10% to 20%. The variation in C,fs was only marginal when water content was in
the range of 15% to 20% with average value of Cds as 1.0 for H2M6, 1.06 for H2M8
and 1.16 for Non-woven.
75
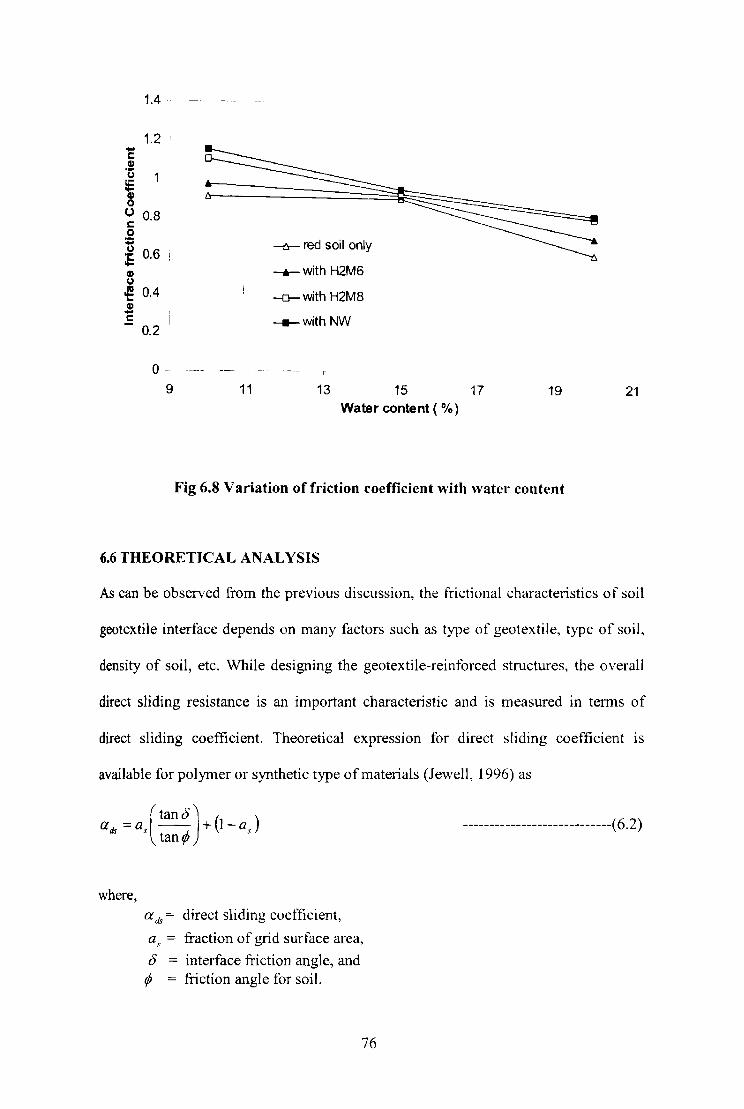
1.4 -
1.2 .. c ~
'u :;: ~ 0
(,) 0.8 c 0 ;; u 0.6 ;S I
~
----fr- red soil only
---.- with H2M6 U
~ 0.4 ----er- with H2M8 ~ .. c
0.2 _____ with NW
0- T
9 11 13 15 17 19 21 Water content ( %)
Fig 6.8 Variation of friction coefficient with water conte" t
6.6 THEORETICAL ANALYSIS
As can be observed from the previous discussion, the frictional characteristics of soil
geotextile interface depends on many factors such as type of geotextile, type of soil,
density of soil, etc. While designing the geotextile-reinforced structures, the overall
direct sliding resistance is an important characteristic and is measured in terms of
direct sliding coefficient. Theoretical expression for direct sliding coefficient is
available for polymer or synthetic type of materials (Jewel!, 1996) as
ads::: as ( tan 0
) + (1 - a J tan~
where, ads = direct sliding coefficient,
as = fraction of !,rrid surface area,
o = interface friction angle, and rjJ = friction angle for soil.
76
----------------------------(6.2)
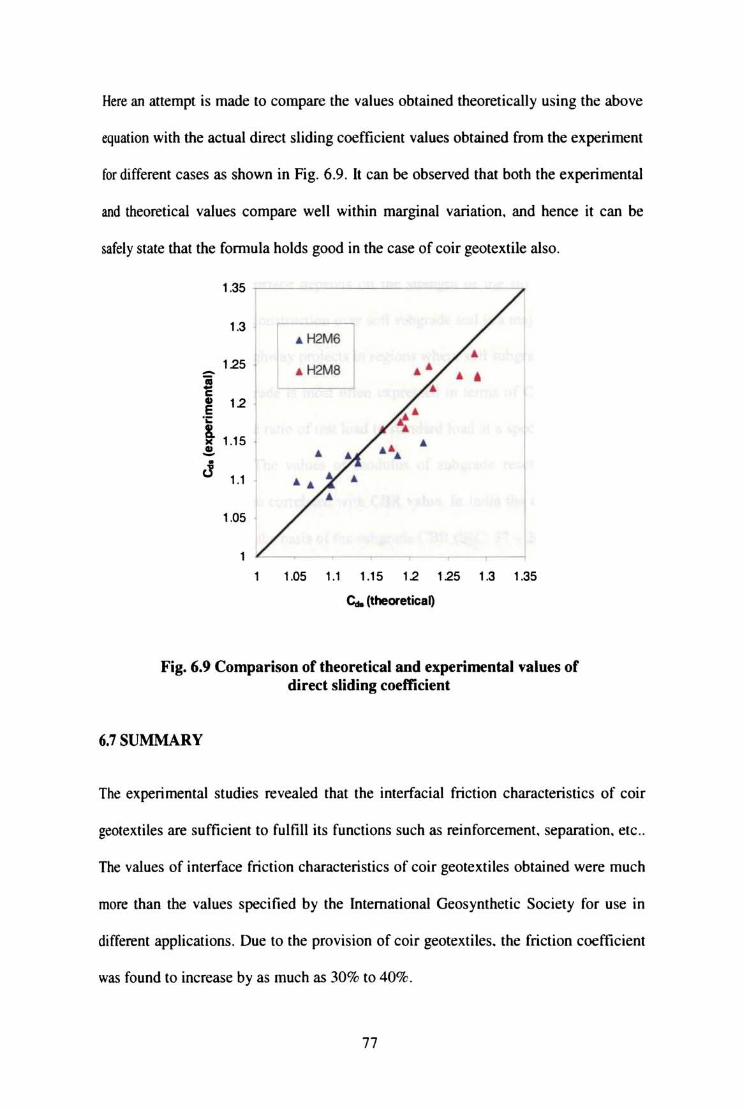
Here an attempt is made to compare the values obtained theoretically using the above
equation with the actual direct sliding coefficient values obtained from the experiment
for different cases as shown in Fig. 6.9. It can be observed that both the experimental
and theoretical values compare well within marginal variation. and hence it can be
safely state that the fonnula holds good in the case of coi r geotextlle also.
1.35
1.3
125 -~ c • 12 E ." S.
1.15 • .!.
J 1.1
1.05
9 .' •
• • •
1.05 1.1 1.15 12 125 1.3 1.35
C. (theoreticaQ
Fig. 6.9 Comparison of theoretical and experimental values of direct sliding coefficient
6.7 SUMMARY
The experimental studies revealed that the interfacial friction characteristics of coir
geotexti les are sufficient to fulfil! its functions such as reinforcement. separation. etc ..
The values of interface friction characteristics of coir geotexti les obtained were much
more than the val ues specified by the International Geosynthctic Society for use in
different applications. Due to the provision of coir geotextiles. the friction coefficient
was found to increase by as much as 30% to 40%.
77
CHAPTER 7
STRENGTH BEHAVIOUR OF COIR GEOTEXTILE
REINFORCED SUBGRADE
7.1 INTRODUCTION
The behaviour of road surface depends on the strength of the till material and the
subgrade below it. Road construction over soft subgrade soil is a major issue affecting
cost and scheduling of highway projects in regions where soft subgrades are common.
The strength of the subgrade is most often expressed in tenns of California Bearing
Ratio (CBR), which is the ratio of test load to standard load at a specified penetration,
by a standard plunger. The values of modulus of subgrade reaction and resilient
modulus of soil have been correlated with CBR value. In India the design of t1exible
pavement is primarily on the basis of the subgrade CBR (IRe: 37 - 2001).
The CBR method is one of the earlier empirical methods for pavement design
developed during 1928-1929 (Ullidtz, 1986). This method involves detennination of
CBR value of subgrade for the most critical moisture condition. The design thickness
of pavement is read against the CBR value of the subgrade from the design charts,
which were developed from experience on pavement pertonnance after noting and
analysing a number of failed pavement sections and the corresponding sub grade CBR
values. Based on this apparent relationship between the CBR value and thickness of
pavement, the US Corps of Engineers in 1940 adopted the CBR method of design for
airfield pavements (Horonjeff and Mckelvey, \983). It may be noted that this attempt
at designing pavement did not initially involve the number of load repetitions that a

pavement can sustain and hence later, correction factors related to the number of load
repetitions were also introduced.
Many techniques have been evolved to strengthen the highway soil subgrade. Most of
them primarily involve stabilisation using chemical admixtures. One of the recent
techniques is the use of geotextiles. Geotextiles can be placed within subgrade to
strengthen the subgrade and also can be placed at the interface between sub grade and
sub base. Since subgrade CBR is taken as the criterion for the design of flexible
pavements, the thickness of the component layers (sub base and base course) will be
reduced when the subgrade CBR is high. In this section, the results of studies on the
performance characteristics of the subgrade with the provision of coir gcotextiles are
reported.
Two subgrade soils: Red soil (Soil-I) and Clayey silt (Soil-3) and three varieties of
coir geotextiles (H2M6, H2M8 and NW) were used in the study. CBR tests were
conducted with coir geotextiles at depths of H/2, H/3 and H/4 from the top surface of
soil where, H is the depth of CBR specimen. Experiments were also conducted with
multiple coir geotextile layers and with aggregate layer above the coir geotextile
layer. Using multiple linear regression analysis a mathematical model for modified
CBR was obtained in tenns of original CBR of the sub grade soil, and properties and
depth of placement of coir geotextile. The reduction in the required thickness of the
base layer can be computed using US Am1y method, and IRe method, which is
reported elsewhere in this thesis.
7.2 EXPERIMENTAL PROGRAMME
The objective of this study was to find out the increase in strength mobilisation in
tenns of CBR values, by conducting CBR tests on the sub!,Tfade soil when reinforced
79

with coir geotextiles placed at different positions. It was also aimed at in assessing the
saving in aggregate thickness due to the use of coir geotextiles in unpaved roads. The
details of the experimental programme are given in Table 7.1.
Table 7.1. Parameters varied in laboratory experiments
----Parameter Vadables
Subgrade material Clayey silt - with and without aggregate layer Red soil- with and without aghTfegate layer
Soaking condition Soaked Unsoaked
Type of coir geotextile Woven- H2M8 Woven - H2M6
Non-woven - AGL C/201 No geotextile - Control section
Position of goir geotextile At HI2 from surface At H/3 trom surface At H/4 from surface
Multiple layers - at Hi3 and H/2
7.2.1 Preparation of Specimen
The experimental set - up consisted of that required for the standard laboratory CBR
test. It consists of a cylindrical mould of 150 mm inner diameter and 175mm height
and a cylindrical plunger of 50mm diameter. For CBR test on the remoulded sample,
soil is compacted in the CBR mould with moisture content corresponding to OMC.
Compaction of the soil sample was done by static method. In this method, a known
quantity of air-dried soil passing 20mm sieve was taken and mixed with requisite
water to get OMC. Calculated quantity of wet soil was transferred to mould and
compacted to the required height statically using hydraulic jack. Top surface was
scratched and the coir geotextile specimen, cut to the inside dimension of the CBR
mould, was placed over it. Soil was put in the next layer and compacted as in the
80
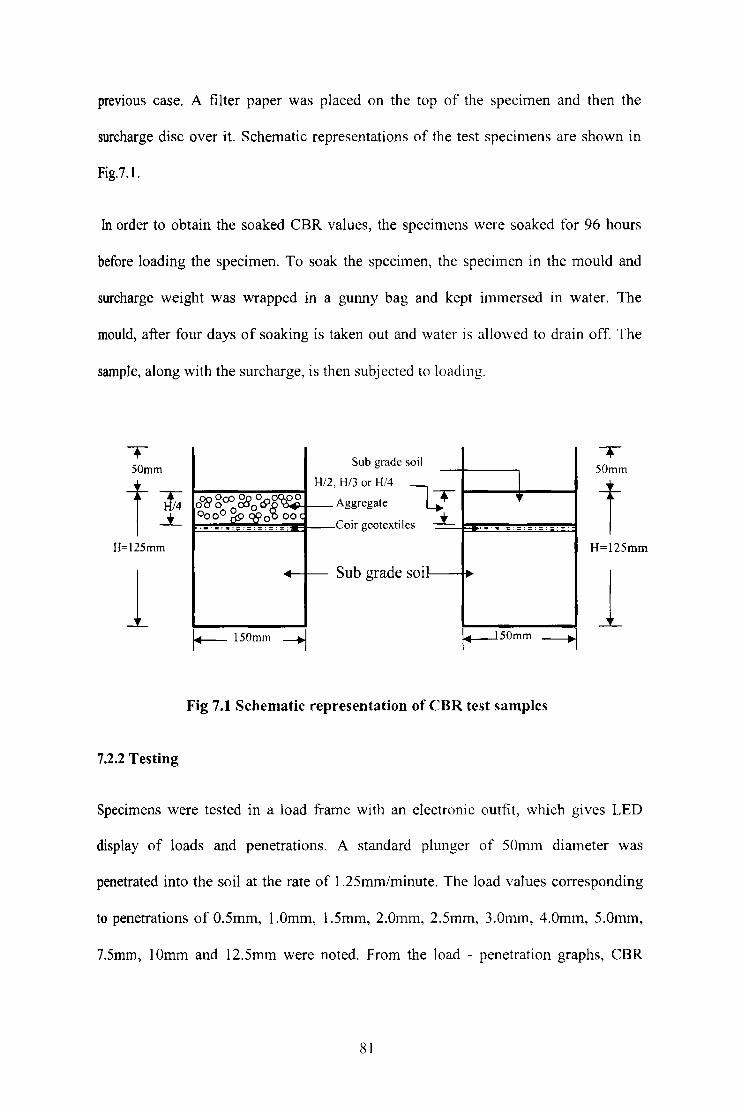
previous case. A filter paper was placed on the top of the specimen and then the
surcharge disc over it. Schematic representations of the test specimens are shown in
Fig.7.1.
In order to obtain the soaked CBR values, the specimens were soaked for 96 hours
before loading the specimen. To soak the specimen, the specimen in the mould and
surcharge weight was wrapped in a gunny bag and kept immersed in water. The
mould, after four days of soaking is taken out and water is allowed to drain off. The
sample, along with the surcharge, is then subjected to loading.
T 50mm
H/2,
oog goo ~oo6l~W~ 0000 ~ ceo~ 00 C 1.:.:.:=:::::::='
Sub grade soil T
50mm H/3 or H!4
~T I
t Aggregate T
Coir geotextiles l ' •• ::=:::::- _.
H=125mm H=125mm
1 Sub grade soil
1 ~ 150mm ---..j ~50mm ---+l
Fig 7.1 Schematic representation of CBR test samples
7.2.2 Testing
Specimens were tested in a load frame with an electronic outfit, which gives LED
display of loads and penetrations. A standard plunger of 50mm diameter was
penetrated into the soil at the rate of 1.25mm/minute. The load values corresponding
to penetrations of O.5mm, I.Omm, 1.5mm, 2.0mm, 2.Smm, 3.0mm, 4.0mm, 5.0mm,
7.Smm, lOmm and 12.5mm were noted. From the load - penetration graphs, CBR
81
value was calculated as the highest value obtained from the ratio of test load divided
by the standard load and expressed in percentage.
CBR (%) = [Test load / Standard Load}x lOO ---------------- (7.1)
The standard loads are 13.7kN, 20.55kN, 26.3kN, 31.8kN.and 36.0kN for 2.5mm,
S.Ornm, 7.5mm, IO.Omm, and 12.5mm respectively.
7.3 RESULTS AND DISCUSSION
7.3.1 General
CBR values expressed in percentage for different cases are summarised in Table 7.2,
in which the initial CBR refers to percentage CBR obtained for soil alone without any
coir geotextiles. The experimental results give a clear indication that the presence of
coir geotextiles influences the California Bearing Ratio (CBR) of the soil. The
improvement in strength of soil due to the placement of coir geotextiles is a function
of interaction of coir geotextiles with the soil. It was observed that there exists
interaction between soil and coir geotextile in soaked and unsoaked condition.
7.3.2 Type of Soil
Fig.7.2 shows the load penetration curves for unsoaked and soaked conditions for
three types of coir geotextiles (H2MS, H2M6 and NW) placed at a depth of H/4 from
top surface for two types of soils tested. It can be ohserved that for hoth the soils
tested, the behaviour was identical when coir geotextiles \\:ere placed at H/4 from top
in the soil mass and tested in soaked and unsoaked conditions. Penetration of the
plunger was more for soil without geotextile in all cases and CBR values were less in
soaked condition. Between the two soils, it was found that the percentage increase in
82
taR for red soil in unsoaked condition was higher than that for clayey silt. On the
contrary, it can be observed that, the coir geotextiles perfonn much better in clayey
toil in soaked condition, the corresponding percentage increase being 100%, 250%
Uld 43% for clayey silt and 36%, 50% and 9% for red soil respectively for Non-
woven, H2M8 and H2M6 coir geotextiles.
Table 7.2 Summary of eBR test results
1. Clayey Silt Unsoaked: Initial CBR = 2.43%
Depth of placement Type of Coir Geotextile
from top Non-woven Woven H2M8 WovenH2M6
H/4 4.25 3.54 3.04
H/3 3.72 3.04 2.89
H/2 3.08 2.93 2.78
2. Clayey Silt Soaked: Initial CBR = 0.95%
Depth of placement Type of Coir Geotextile
from top Non-woven Woven H2M8 Woven H2M6
H/4 1.90 3.35 r 1.36 __ .----1 H/3 1.56 2.74 I 1.08
H/2 1.44 2.58 r 1.06 I
3. Red Soil Unsoaked: Initial CBR = 7.98/10
Depth of placement Type of Coir Geotextilc
from top Non-woven Woven H2M8 WovenH2M6
H/4 25.09 14.52 10.27
H/3 14.83 10.65 9.31
HI2 9.89 9.50 8.67
4. Red Soil Soaked: Initial CBR = 3.35%
Depth of placement Type of Coir Geotextile
from top Non-woven Woven H2M8 Woven H2M6
H/4 4.56 5.02 3.65
H/3 4.11 4.26 3.50 -
! H/2 3.61 3.88 3.42
83
9
8
7
6 -z " 5 -]
4 ... 3
2
o o 2 4
1.6 .6 Red soil
1.4 o with NW x with H2M8
1.2 o with H2M6 .6 Clayey 5ih
- 1 o with NW i z with H2MB -] 0.8
o with H2M6
... 0.6
04 1 0.2
0
0 2
6 8 10
Penetration (mm)
(a) nsoaked condition
• 0
4 6
Penetration (mm)
(b) Soaked condition
11 Red soit
c with NW
lC with H2M8
o with H2M6
IJ, Clayey sih
D with NW
x wilh H2M8
o with H2M6
12 14 16 18
• 0
8 10
Fig. 7.2 Load · penetration curves with coir geotextiles placed at Hl4 Crom top
84

Considering different types of coir geotextiles, H2M8 and Non-woven geotextile
perfonn better in both types of soil. Percentage increase of CBR in non-woven coir
geotextile reinforced case was found to be more in unsoaked condition. Thus in the
case of both soils, maximum CBR was obtained when H2M8 coir geotextiles was
placed at H/4 from top. For both the red soil and clayey soil, in soaked conditions, it
was observed that the load penetration curves are very close to each other when coir
geotextiles ar~ placed at HI2 and H/3 from top irrespective of the type of coir
geotextiles.
7.3.3 Type of Coir Geotextiles
The type of coir geotextile used has a role in the performance of CBR of coir
geotextile reinforced soil. The properties of coir geotextile viz,. its mass density, mesh
size and modulus may affect the strength of the soil. Fig.7.3 (a) shows the comparison
ofload penetration curves for the clayey soil in soaked and unsoaked conditions when
the three types of coir geotextiles were placed at H/3 and H/2 from top. The similar
behaviour of red soil in soaked and un soaked conditions can be observed from Fig. 7.3
(b). It can be observed that, in unsoaked condition, non-\vovcn coir geotextile showed
maximum penetration resistance indicating greater CBR \aluc whereas, in soaked
condition, H2M8 woven geotextile gave higher CBR value. This behaviour was
identical for both in clayey soil and in red soil. Clayey silt in soaked condition with
geotextiles at H/4 from top, the CBR values obtained were 1.9% and 3.35% for NW
and H2M8 respectively. But for the same soil in un-soaked condition, the CBR values
were respectively 4.25% and 3.54% for NW and H2M8. Similarly, for red soil, the
CBR values with geotextile at H/4 from top were 4.56% and 5.02% for NW and
H2M8 respectively in soaked condition and were 25.09% and 14.52% respectively in
85
un-soaked condition. For all placement depth this behaviour was similar. In all cases
it could be seen that the performance of H2M6 in terms of improving the CBR values.
is only marginal when compared to other types of coir geotextiles. Thus it can be
concluded that for the enhancement of CBR. H2MS will be a better option. as the
CBR values were more in soaked condition. which is the condition normally
considered for the design purpose. Non-woven coir geOlextile can be considered when
more or less dry conditions prevail.
1.6 r-::=.;:=: to soil only x with H2Mi to soil only
,.4
z ;- 0.8 I ~ 0.6
0.4 .
0.2 1
0 '
o
x with H2MJ
5
•
•
Soaked Condition Ulsoaked Condtion
10
Penetration (mm)
' 5
(i) Geotextile at Hl3 depth
1.4 ,.---to Soil only x with H2M8
1.2 to Soil only x with H2M8
i" 0.8 1 -'ll o 0.6 .... 0.4
0.2
o o 5
c with NW o with H2M6 [] with NW o with H2M6
• •
c
Unsoaked Condition
Soaked Condition
10
Penetration (mm)
'5
(ii) GeoteKtile at Hl2 depth
20
20
Fig. 7.3 (a) Effect of type of coir geoteKlile for clayey sill
86
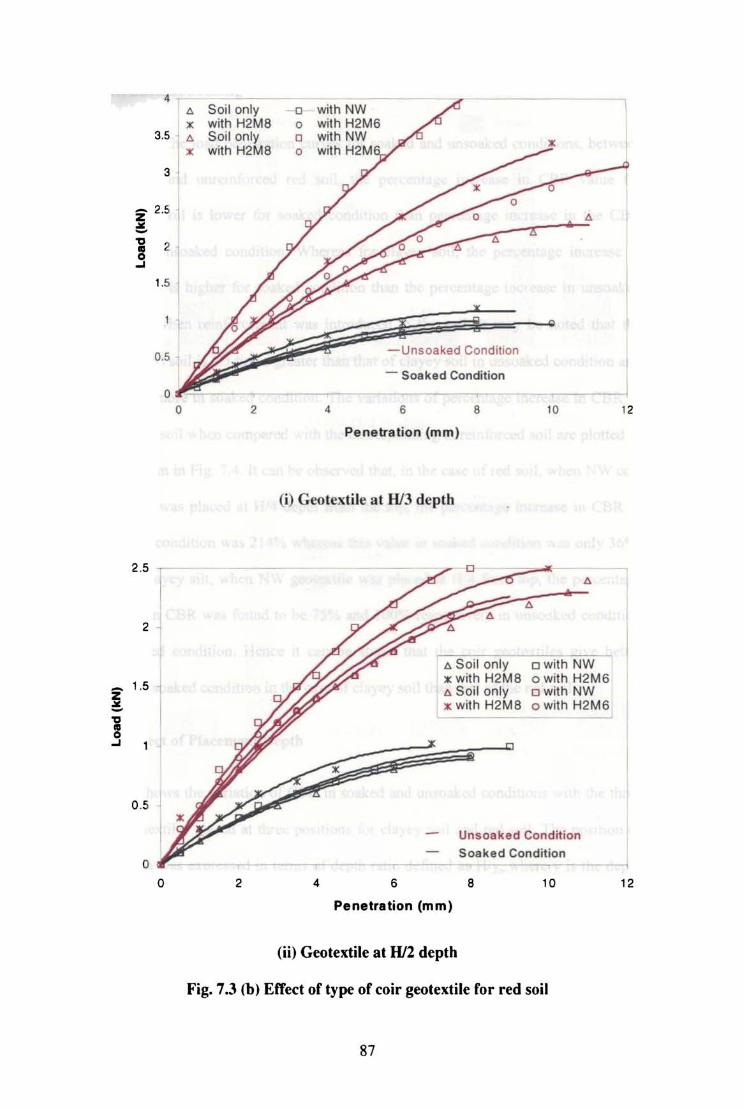
-Z
" -.. 3 -'
4 .0. Soil only x with H2M8
3.5 ~ .o. Soil only 3 1 :1e with H2M8
Z 2.5 j o!!.
1.5
0.5
o o 2
2.5 ~
2
1.5 i
0.5
o o 2
-0 with NW o with H2M6 o with NW o with H2M
•
-Unsoaked Condition
- Soaked Condition
4 6
Penetration (mm )
8
(i) Geolexlile al Hl3 deplh
0
lJ. Soil only x with H2M8 l!. Soil only x with H2M8
x
•
' 0
• •
cwith NW owith H2M6 o with NW o with H2M6
Unsoaked Condition Soaked Condition
~~-
4 6
Penetration (mm)
(ii) GeOlexlile al Hl2 deplh
8 '0
Fig. 7.3 (h) Effeel of Iype of coir geolexlile for red soil
87
j
12
12

7.3.4 Effect of Soaking
Comparing the load penetration curves for soaked and unsoakcd conditions. bctween
reinforced and unreinforced red soil, the percentage increase in CBR value for
reinforced soil is lower for soaked condition than percentage increase in the CBR
value for unsoaked condition. Whereas for clayey soil, the percentage increase in
CBR value is higher for soaked condition than the percentage increase in unsoaked
condition when reinforcement was introduced in the soi1. It may be noted that the
CBR of red soil is 3.3 times greater than that of clayey soil in unsoaked condition and
3.5 times more in soaked condition. The variations of percentagc increase in CBR of
reinforced soil when compared with the corresponding unreinforced soil are plotted in
a chart form in Fig. 7.4. It can be observed that, in the case of red soil, when NW coir
geotextile was placed at H/4 depth from the top, the percentage increase in CBR in
unsoaked condition was 214% whereas this value in soaked condition was only 36%.
But for clayey silt, when NW geotextile was placed at H/4 trom top, the percentage
increase in CBR was found to be 75% and 100% respectively in unsoaked condition
and soaked condition. Hence it can be stated that the coir geotextiles give better
results in soaked condition in the case of clayey soil than that of the red soil.
7.3.5 Effect of Placement Depth
Fig.7.S shows the variation ofCBR in soaked and unsoaked conditions with the three
coir geotextiles placed at three positions for clayey soil and red soil. The position of
geotextile was expressed in tenns of depth ratio defined as Hiy, \vhere y is the depth
of reinforcement from the surface and H is the total depth of the sample in the CBR
mould, denoting the depth ratio as zero for unreinforced case for the purpose of
comparison. It can be clearly seen from the graph that due to the placement of coir
88
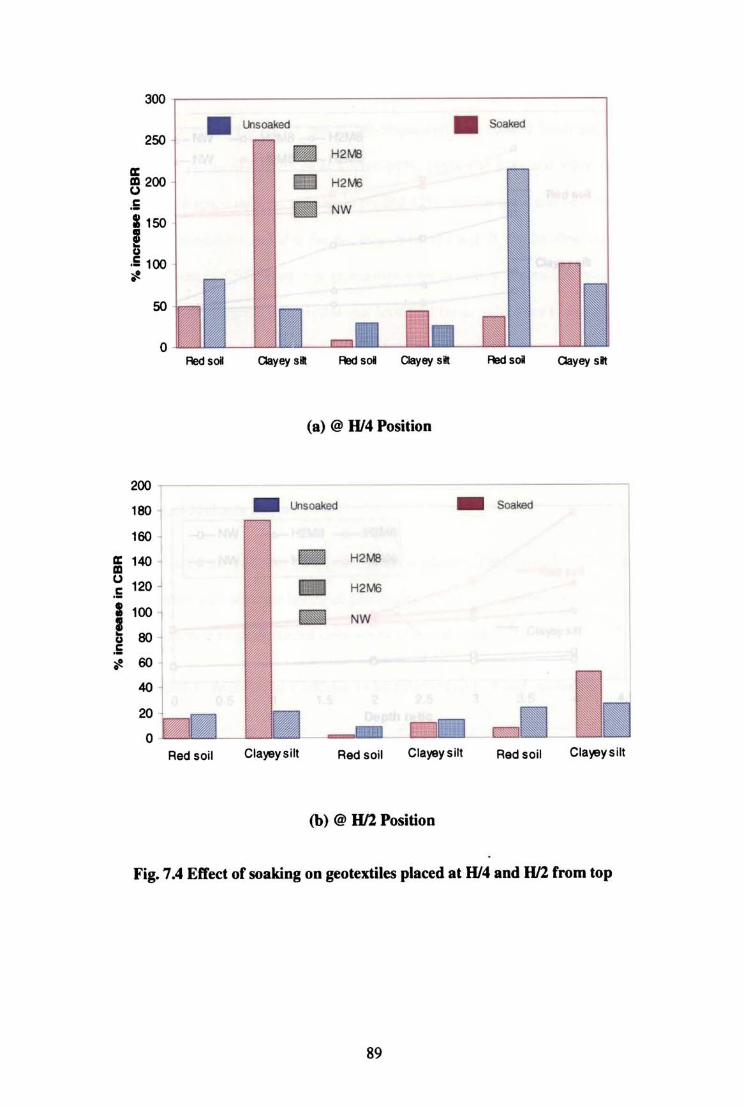
a: ., u .5 I ~ .i ..
~ r---------------------------------------'
250 • U.sooked • Soaked
a: CD 200 H2M) u .5 1150
ft .i 100 ..
200 ,
180 1 160
140
120 J
100
80
60
40
20
0
Red sol
Red soil
m NW
Clayey s. Red sol Clayey sit Red sol
<a) @ 1114 Posilion
_ .... oaJ<ed _ Soaked
H2M6
~ NW
Cla~ysill Red soil Clayey sill Red soil
(b) @ HI2 Position
Clayey sit
Clayey silt
Fig. 7.4 Elfecl or soa king on geolextiles placed al 1114 and HI2 rrom lOp
89

-" -'" ID
"
6
5
4
0 3 ,
2 •
o ~
o
-tr- NVI/ -0- H2MB -0- H2M6
-o- Iffl o H2M8 -0- H2M6 c
~
1 2 3 4
Depth ratio
<aJ Soaked CBR
25 ~, ----
-0-- NW -tr- H2MB --0- H2M6
--e- NW --tr- H2MB --0-- H2M6
Red soil
5 Or-____________ ~o~====~8=;~==~8
o l-I -o 0.5 1.5 2 2.5
Depth ratio
(b) Unsoaked CBR
3 3.5
Fig. 7.S Effect of placement depth of coir geotextiles
4
5
4.5
geotextiles. the CBR value is increased irrespective of type of eoir geotextiles and
placement depth. but the quantum of increase depends on type of eair geotextile and
placement depth. It is observed that. though the CBR values were increased in all
cases. the percentage increase was found to be much higher when Non-woven ecir
geotextile was placed in the upper one-third region. For example. when eair geotextile
90

was placed at H/4 depth, the percentage increase in CBR values were 100%, 252%
and 43% for Non-woven, H2M8 and H2M6 respectively tor soaked conditions. The
corresponding values at a depth of H/3 were 64%, 188% and 14% and when it was
placed at H/2 depth, it reduces to 51 %, 172% and 12%. Similar trend can be observed
for unsoaked conditions and also for the cases with red soil. It can be observed that
the improvement in CBR when coir geotextiks were placed at the middle height of
the mould is only marginal and beyond that level still lesser values arc expected. The
reason for this could be attributed to the fact that the depth through which the
effective pressure bulb passes is a function of the diameter of the plunger and, if the
geotextile is inserted at depths greater than the depth of pressure bulb, no significant
improvement can be witnessed.
7.3.6 Effect of Multiple Layers
In order to study the effect of additional layer of geotextilc in subgrade, CBR tests
were conducted with multiple layers of geotextiles. The percentage increases in CBR
values with respect to unreinforced cases arc tabulated in Table 7.3.
Table 7.3 Increase in CBR due to additional layer of coir geotextile
eBR (%)
Soil Type of
Without With 1
Percentage With
Percentage geotextile layer at additional geotextile
8/3 increase
layer at H/2 increase
Clayey silt NW 0.95 1.56 64 1.98 108
Soaked Clayey silt
NW 2.43 3.72 53 5.25 116 Un-soaked Clayey silt
H2M8 0.95 2.74 188 3.42 260 Soaked
Red NW 7.98 14.83 86 19.80 148
Un-soaked Red
H2M8 7.98 10.65 33 I 12.74 59 Un-soaked i .".-
Red H2M8 3.35 4.26 I 27 5.84 69
Soaked
91
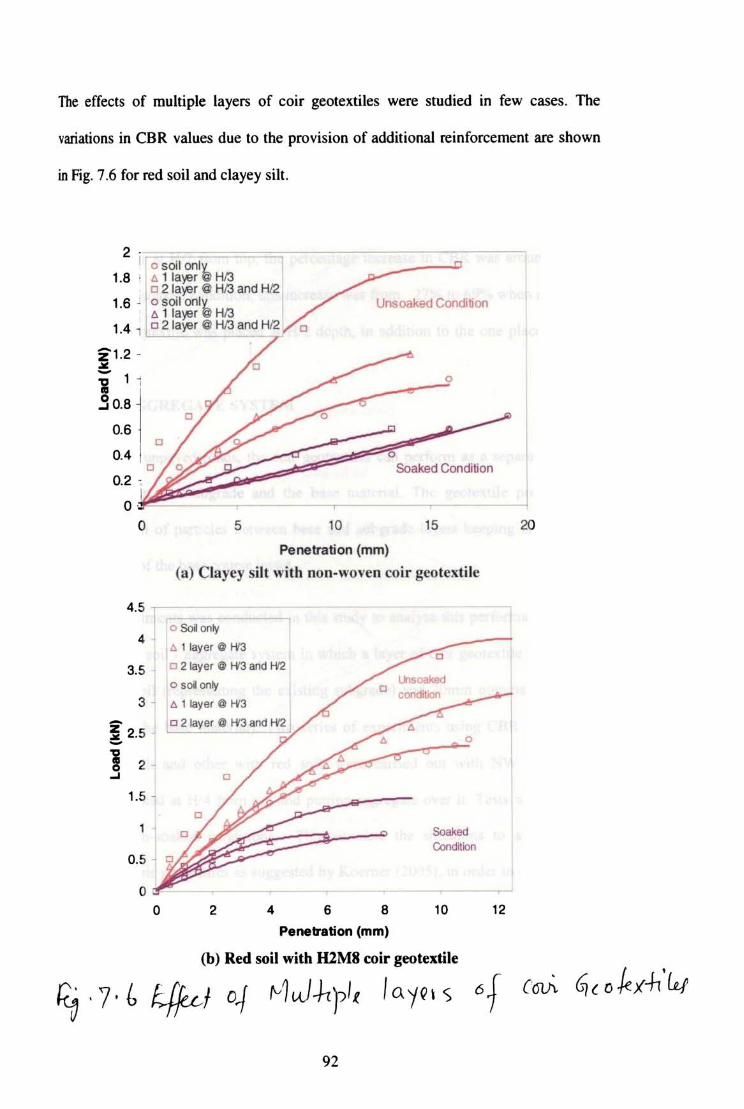
The effects of multiple layers of coir geotextiles were studied in few cases. The
variations in CBR values due to the provision of additional reinforcement are shown
in Fig. 7.6 for red soil and clayey sill.
2 . 1 0 5001 onl,
1.8 · .o. 11a~rUH13 o 2 la~r fit HI3 and HI2
1.6 - '" 5001 onl. .o. 1 Ia~r @ H13 Unsoaked Condibon
1.4 , 0 2 la>yer @ HI3 and HI2 0
z l .2 -... c
j~: l' 0.4
c 0.2 -
-
I O· -
0
4.5
4
3.5
3
~ 2.5 -1 2 .... 1.5
0.5
0 0
o
o Soaked Concition
5 10 15
Penetration (mm)
(a) Clayey silt with non-woven coir gcotexti le
O Solon~
.0. 1 layer 0 Hl3 0
o 2 layer 0 t-V3 and H'2
o solon~ "" """" c ",,"" ~ .o. llayerO~
0
Soaked CmditiOn
2 4 6 8 10
Penetration (mm)
(b) Red soil with H2M8 coir geot .. tile
12
~ ,7' {, 4fu-f o~ rv1 uJ-J..rp't /a.yQ \ S 6f
92
20
CAA ~ { 0 ./ex-h 'w

It can be seen that by providing one additional layer of geotextlle the increase in CBR
was roughly doubled. For instance, the percentage increase in CBR when Non-woven
coir geotextile was placed at a depth of H/3 from top in clayey silt was 64%. With one
additional layer at H/2 from top, the percentage increase in CBR was around 108%.
For red soil in soaked condition, this increase was from 27% to 69% when a layer of
H2M8 coir geotextile was placed at H/2 depth, in addition to the one placed at H/3
location.
7.4 SOIL - AGGREGATE SYSTEM
In the case of unpaved roads, the coir geotextiles can perfoffi1 as a separator if it is
placed between the subgrade and the base material. The geotextile prevents the
interpenetration of particles between base and subb'Tade layers keeping the strength
and thickness of the base course intact.
A set of experiments was conducted in this study to analyse this perfonnance of coir
geotextile in a soil - aggregate system in which a layer of coir geotextile was placed
between the soil (representing the existing sub grade) and 20mm nominal aggregate
(representing the base material). Two series of experiments using CBR mould, one
with clayey silt and other with red soil, were L:urricd out with NW and H2M8
geotextiles placed at H/4 from top and putting aggregate over it. Tests were done in
soaked and un-soaked conditions. This simulate the situations to arrive at the
influence of coir geotextiles as suggested by Koemer (2005), in order to calculate the
thickness of pavement by US Anny Corps Method.
Experimental results on soil - aggregate system have shown definite increase in
strength in tenns ofCBR value. Fig. 7.7 shows load penetration curves for red soil-
93
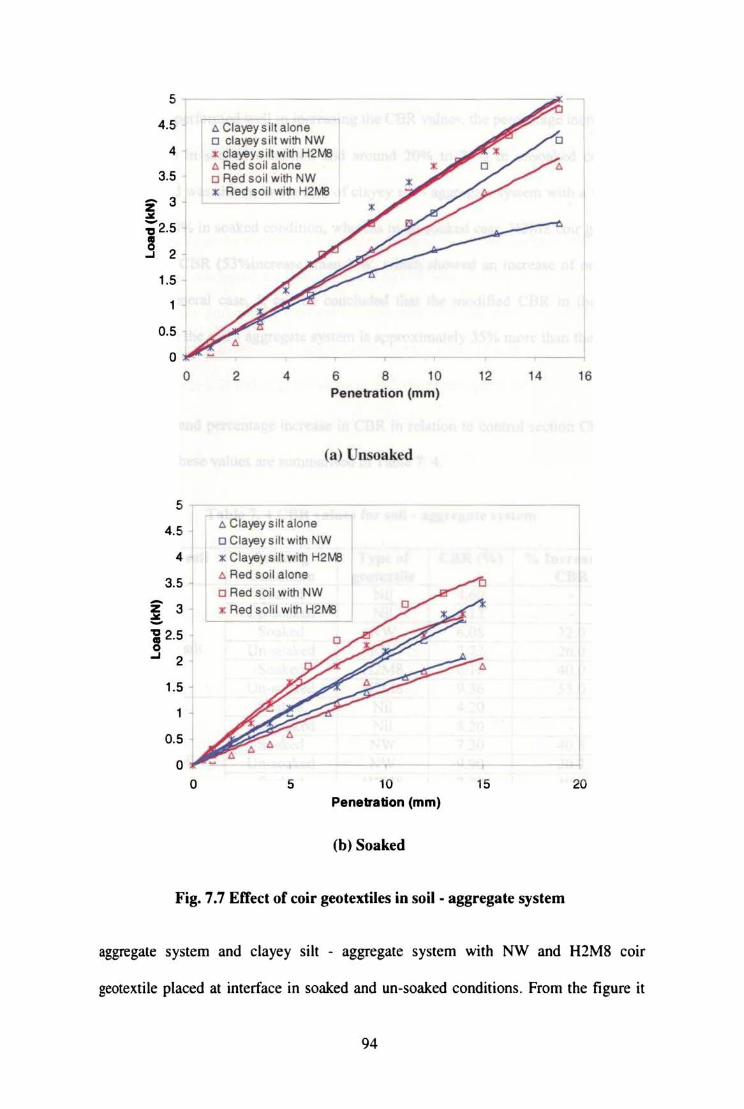
5
4.5
4
3.5
t2:j .... 21
1.5
1 j
0.5 i
o o
5
4: J 3.5 ~
! 3
1 2.5 o .... 2
1.5
o o
tJ. Clayey sill alone c clayey sill with NW :c clayey silt with H2M3 t:. Red soil alone o Red soil with NW :t Red soU with H2M3
2 4 6 8 10 Penetration (mm)
<a) Unsoaked
6 Clayey silt alone
D Clayey sill with NW
x Clayey silt wilh H2Wt3 .c. Red 5011 alone
o Red soil with NW
x Red solil with H2M3
5 10 Penetration (mm)
(b) Soaked
•
12 14
15
Fig. 7.7 Effect or coir geotextiles in soil - aggregate system
16
20
aggregate system and clayey silt - aggregate system with NW and H2M8 coir
geotextile placed at interface in soaked and un-soaked conditions. From the figure it
94

can be seen that in the case of red soil - aggregate system, both NW and H2M8
geotextiles, performed well in increasing the CBR values, the percentage increase was
around 41 % in soaked condition and around 20°,'0 to 25% in unsoaked condition.
Similar trend was shown in the case of clayey silt - aggregate system with a variation
of32% to 40% in soaked condition, whereas in un-soaked case, H2M8 coir geotextile
gave higher CBR (53%increase) than NW, which showed an increase of only 26%.
Still as a general case, it can be concluded that the modified CBR in the soaked
condition for the soil - aggregate system is approximately 35% more than the original
CBR.
CBR values and percentage increase in CBR in relation to control section CBR were
calculated. These values are summarised in Table 7. 4.
Table 7. 4 CBR values for soil- aggregate system
-_. Type of soil Soaking Type of CBR(%) % Increase in
Condition geotextile CBR Soaked Nil 4.60 -
Un-soaked Nil 6.12 -
Soaked NW 6.08 32.0 Clayey silt Un-soaked NW 7.72 26.0
Soaked H2M8 6.16 40.0 Un-soaked H2M8 9.36 53.0
Soaked Nil 4.20 -
Un-soaked Nil 8.20 -Soaked NW 7.20 40.8
Red soil Un-soaked NW 9.90 20.7 Soaked H2M8 7.20 40.8
Un-soaked H2M8 10.0 i 22.0
7.5 CBR PREDICTION MODEL
7.5.1 General
In India the thickness of flexible pavement is desib'lled on the basis of projected
number of standard axle loads during the design life, which is obtained using the
95
current commercial vehicles per day (CVPD) and its growth rate, along with the
subgrade strength in tenns of CBR. In rural roads, the top 30cm of the cutting or
embankment at the fonnation level shall be considered as depth of subgradc (IRC: SP;
20-2002).
From the results of the detailed laboratory investigations on the strength behaviour of
coir geotextile reinforced subgrade soil, it could be seen that the strength in tenns of
the CBR of the soil would increase considerably with the positions of geotextile.
Also, the strength mobilisation depends on many factors like the inherent strength
properties of the soil and also the strength and the placement depth of the geotextile
reinforcement. Hence it is advantageous to develop a model to predict the modified
CBR of the reinforced subgrade, which would respond to the changes in the properties
of the soil and that of the reinforcement.
Modified CBR = / (Soil characteristics, Reinforcement characteristics,
Placement depth) ----------(7.2)
This can be achieved through the principles of multiple linear regression analysis.
The model thus developed can be effectively used for the design of coir reinforced
unpaved roads. The details of design procedure are given in Section 10.3.
7.5.2 Multiple Linear Regression Analysis (10hnson, 200 I)
Multiple linear regression analysis is a statistical technique frequently used to develop
prediction equations to establish the relationship for a variabk, which is known to
respond to changes in two or more other variables. The variable, which is known to
respond (K variable) IS commonly called the dependent variable and the other
variables influencing it are called the independent variables (x variables). The
function will be of the following fonn:
96
where, Xl, X2, Xr----Xm = m independent variables,
ao = regression constant, and
al,a2,---am = regression coefficients of the m independent variables.
The regression coefficients are determined from a given set (n) of observed values of
1C and XI,Xr--,Xm by the method ofleast squares.
The analysis of variance approach is used to test the predictor equation. The total sum
of squares of deviations of the 'n' observations from the mean is a measure of the
degree to which the 'n' observations are spread around their average value. Smaller
the standard error, the better will be the model.
Coefficient of determination (R 2) is another indicator of the strength of relationship. It
is the ratio of regression sum of squares to total sum of squares. R2 lies between 0 and
I. The closer it is to 1, the better is the equation.
The F ratio gives another indication of the adequacy of the equation. It is the ratio of
mean sum of regression squares to mean sum of residual squares. If the F ratio
obtained is greater than the values given in the F tables, then the model is significant.
7.5.3 Development of Model
The most important property of the sub grade soil considered for the design of
pavement is the CBR value. Hence the original CBR for the remoulded soil at OMC
and MDD is taken as a property representing the strength of the soil. The different
properties of coir reinforcement considered are those which can be evaluated in the
97
laboratory or supplied by the manufacturers viz., mass / unit area, puncture resistance,
strip tensile strength, wide tensile strength, secant modulus and mesh size (picks/dm
and ends/dm). CBR tests were conducted by placing coir geotextiles at three depths -
Hl2, H/3 and H/4, where H is the height of the specimen for CBR test and these
heights were taken as the placement characteristics of the geotextile.
Multiple Linear regression analysis was done usmg SPSS software inputting the
laboratory test data obtained. The dependent variable is the modified CBR. The
independent variables considered for regression analysis were:
i) Original CBR of the soil,
ii) Mass per unit area of the geotextile,
iii) Puncture resistance of geotextile,
iv) Strip tensile strength in machine direction of the geotcxtile,
v) Wide tensile strength in machine direction of the geotextile,
vi) Secant modulus of the geotextile,
vii) Picks/dm of the geotextile,
viii) Ends/dm of the geotextile, and
ix) Depth of placement of reinforcement (H/2. H/3 and H/4).
Analyses were done using CBR data separately for soaked and unsoaked conditions
and also putting together. During analysis some of the \"ariables representing the
properties of geotextiles were found insignificant. The equations for modified CBR
values (CBRM ) obtained for different conditions are given below in which,
CBRM = Modified CBR in % (reinforced condition),
eBR = Original CBR in % (unreinforced condition),
D = Depth of coir geotextiles from surface,
(H/2 =6.25cm, H/3 = 4.17cm and H/4 = 3.125cm)
98
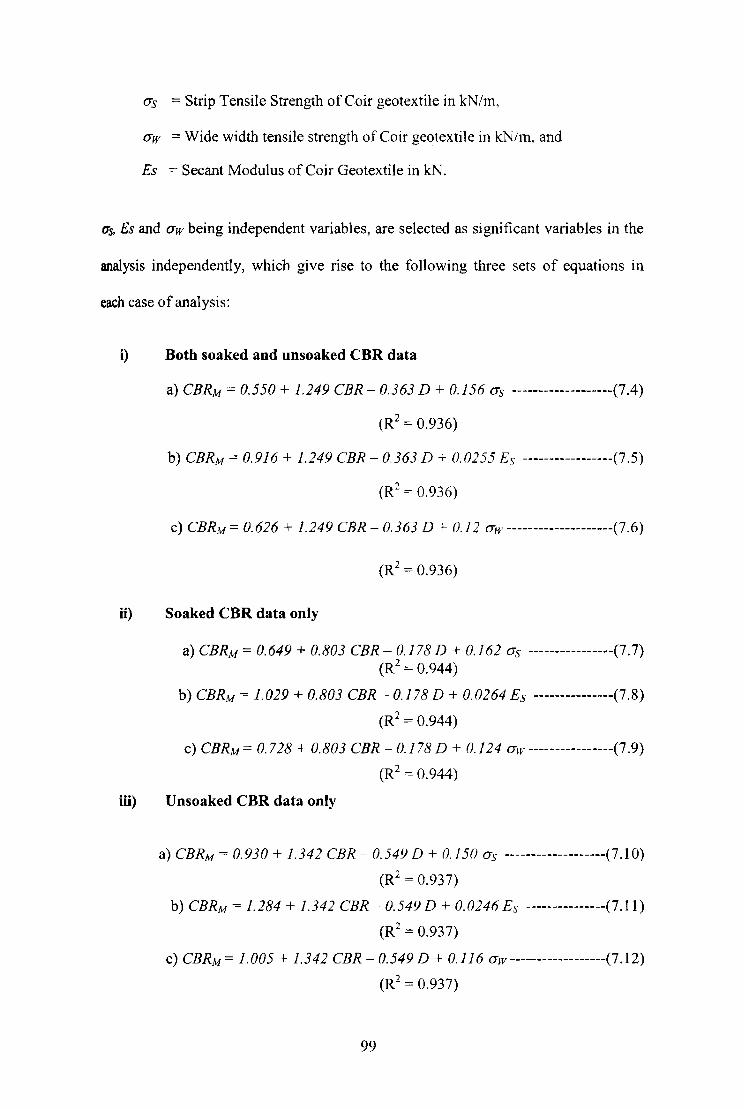
(J's == Strip Tensile Strength of Coir geotextile in kN/m,
(J'w = Wide width tensile strength of Coir geotextile in kN/m, and
Es = Secant Modulus of Coir Geotextile in kN.
Us, Es and (J'w being independent variables, are selected as significant variables in the
analysis independently, which give rise to the following three sets of equations in
each case of analysis:
i) Both soaked and unsoaked CBR data
a) CBRM = 0.550 + 1.249 CBR - 0.363 D + 0.156 (J's -------------------(7.4)
(R2 = 0.936)
b) CBRM == 0.916 + 1.249 CBR - 0.363 D + 0.0255 Es -----------------(7.5)
(R2 = 0.936)
c) CBRM = 0.626 + 1.249 CBR - 0.363 D + 0.12 (J'/y--------------------(7.6)
(R2 = 0.936)
ii) Soaked CBR data only
a) CBRM = 0.649 + 0.803 CBR - 0.178 D + 0.162 (J's ----------------(7.7) (R2 = 0.944)
b) CBRM = 1.029 + 0.803 CBR - 0.178 D + 0.0264 Es ---------------(7.8)
(R2 == 0.944)
c) CBRM = 0.728 + 0.803 CBR - 0.178 D + O. J 24 (J'w ----------------(7.9)
(R2 = 0.944)
ill) Unsoaked CBR data only
a) CBRM = 0.930 + 1.342 CBR - 0.549 D + 0.150 (J's -------------------(7.10)
(R2 = 0.937)
b) CBRM = 1.284 + 1.342 CBR - 0.549 D + 0.0246 Es ---------------(7.11)
(R2 = 0.937)
c) CBRM = 1.005 + 1.342 CBR - 0.549 D + 0.11 6 (J'w ------------------(7.12)
(R2 = 0.937)
99

r Equation 7.~ uses all data and gave higher F values and hence this equation IS
I : recommended for the prediction of the modified CBR for design of coir geotextile
reinforced unpaved roads. The linear scatter diagram using this equation is shown in
. Fig. 7.8, which shows that the deviated points lie on the safer side in terms of design
consideration.
.... 10 al (.)
"0 Cl) I;:
=s 0
:lE -0 U) Cl) ::J
IQ >
"0 4 Cl)
~ Cl) U)
~ 0
o o 2 4 6 .8 10 12
Predicted values of Modified CBR
Fig. 7.8 Linear scatter diagram for the eBR prediction model
7.6 SUMMARY
Elaborate experimental studies were carried out to understand the strength behaviour
of coir geotextile reinforced subgrade in terms of California Bearing Ratio. The CBR
values were found to change with the varying location of reinforcement in the
subgrade soil and also with respect to the type of soil and type of reinforcement. It
was observed that beyond H/2 depth, etfects of coir geotcxtiles were nominal. Effects
100
of multiple layers of coir geotextile reinforcements were also studied and found that
with an additional layer, the percentage increase in CBR was very high.
Depending on the type of soil, type of coir geotcxtile and soaking conditions, the
percentage increase in CBR varies. In general, while it can he stated that H2M8 and
non-woven coir geotextiles perform better, the perfom1ancc of lattcr being found to be
better in unsoaked clayey silt soil. In soaked condition, it was found that H2M8
perfonns better than Non-woven.
With the help of a large number of experimental results, an equation for modified
CBR was formulated, which correlated the properties of soil, properties of geotextiles
and placement depth of coir geotextiles.
101

CHAPTERS
EFFECT OF COIR GEOTEXTILES ON BEARING CAPACITY
8.1 GENERAL
One of the important functions of geotextiles is to increase thc bearing capacity of the
soil. The reinforcement effect is achieved either by micro reinforcement or by macro
reinforcement. In the former, the reinforcement of the soil is achieved by mixing it
with randomly oriented fibres. This aspect has been discussed in detail in Chapter 12.
Macro reinforcement on the other hand, consists of placing reinforcing elements such
as strips, bars, sheets, grids, cells, etc. in the soil. This can be placed in single layer or
in multiple layers. In many cases roads and embankments are subjected to
submergence and the soil will be in saturated conditions. To know the effectiveness of
coir geotextiles in such situations it is necessary to carry out experimental studies in
saturated conditions also. In the present investigation the possibility of utilizing coir
geotextiles as reinforcement is explored by conducting studies on square footings
resting on coir geotextile reinforced sand beds, both in dry and saturated conditions.
8.2 BACKGROUND
Consider a square footing of size B x B resting on coir geotexrile reinforced sand bed,
which is subjected to an intensity of loading' q' as shown in Fig. X.). The depth of the
sand bed is 'Z' and the coif geotextile is placed at a depth 'z' below the footing. The
ultimate bearing capacity of foundation can be givcn by the following equation
(Vesic, 1973)
---------------------- (8.1)
where, y is the unit weight of soil, N y is the bearing capacity factor and Si'is the shape
factor, which may be expressed as
--------------------- (8.2)
Typical nature of settlement curves for unreinforced and reinforced cases is shown in
Fig. 8.2
The improvement in ultimate bearing capacity of a foundation due to soil
reinforcement is generally expressed in a non-dimensional tonn called Bearing
Capacity Ratio, BCRu (Binquet and Lee, 1975) defined as
--------------------- (8.3)
where, qu ( R) is the ultimate bearing capacity with soil reinforcement and qu is the
ultimate bearing capacity without reinforcement. In practice, most of the shallow
foundations are designed for limited settlement. Hence it is essential to determine the
BeR at various levels of settlement. Referring to Fig.8.2, the BCR at a settlement
level S S; Su can be defined as
------------------- (8.4)
where, q(R) is the load per unit area of foundation for reinforced case and q is the load
per unit area for unreinforced soil at a settlement level S.
Eight series of experiments comprising of two plate load tests on unreinforced soil
and 16 plate load tests on coir reinforced soils were carried out. From the observed
103
data. applied pressure versus settlement curves were plotted and presented for each
test. Variations of BeR for different coir geotextiles placed at different levels under
dry and saturated conditions were studied.
q
Foo\in~
r z
1 Fig. 8.1 Square footing supported by coir geotextile reinforced saod bed
s
Su (Rl ~
Load Intensity (q ) q u q R
•
• \ \""
Vnreinforced /' soi l
(
q u\R , -
Coir Geotexti le Reinforced so il
Fig. 8.2 Typical pressure settlement curves (or unrein(orccd and
coir geotextiJe reinforced sand supporting a square rooting
104

83 EXPERIMENTAL SET - UP
A series of model footing tests were conducted in a cubical steel tank measuring Im x
Im x Im made up of mild steel sheets and angles, one side of which was constructed
with perspex sheet. The metallic sidewalls were braced with stiffeners to avoid any
possible lateral yielding during the placement of soil and loading of the model
footing. Inside of the tank was painted and graduated. Control val ves were provided at
the bottom of the tank to facilitate saturation of the so il sample . A standpipe was fixed
outside the tank wall to observe the water level in the soil Fig. R.3 shows the
schematic diagram for the test set - up and the sequence of the test procedure is
shown in Fig. 8.4.
==~~~~;;;jr=t:7:Z=:~1==== Hydraulic Jack ~ /--- Loadille Fmmc
>.., ;::;; ..
____ -- LVDT
___ -- Plate 20cm X 20cm
.----- Sand
___ -- Coir Geotextile
~--Sand
___ --Tank
(ImX Im X Irn)
Fig. 8.3 Schematic test set - up
Model footing used was 25.4 mm thick mild steel plate measuring 200mm x 200mm,
so that there is minimum dimensional effect. Static loads were applied using 200 kN
capacity hydraulic jack, jacked against a reaction frame fabricated using mild steel 1-
sections. Settlements were measured at four corners of the footing using LVDTs.
105

8.4 PREPARA nON OF TEST BED
The test sand used in thi s investi gation was ri ver sand with coeffi cienl of uni fo rmity •
of 1.83. coefficient of curvalUre = 1.34. effecti ve panicle size :::: 300 microns and
s~ci fic gra vity 2.72. All the tests were conducted al a dry unit weight o f 15 kN/m'.
Th ree Iypes of eoir geotex liles (H1M6 and H2M8 and Non-wove n) were used as
reinforcement s . Ex periments were conducted in dry and saturated conditions. To
Fig. 8.4 Sequence of load test
achieve the desired densit y, quanlit y of sand required for 100 mm lift was calculated.
Sand bed was fomlcd by putting calc ula ted amount o f sand in layers and compac ted
to l 00mm thid each. The compaclion was done uSing a wooden malle t to avoid
106
crushing of sand particles. To saturate the soil. water was allowed to tlow in the
upward direction by operating the control valves provided at the bottom of the tank.
Water level in the soil could be seen from the standpipe provided outside the tank
wan. Coir geotextiles cut in the fonn shown in Fig.8.5 was placed at different levels
in each case viz. at lOOmm, 200mm and 300mm from the top corresponding to zIB
ratios 0.5, 1.0 and 1.5 respectively. These vB values were chosen based on the
results of the past studies reported in literature.
0.2 m I 1.0 m
tUF,...i;if
Line of Fold
Fig. 8.S Coir geotextile specimen for plate load test
8.S TESTING PROCEDURE
After filling the tank to the desired height where coir geotextile is to be placed. the fill
surface was levelled and the coir geotextile was placed. Sand was again added in
layers to reach the full height. The footing was placed on a predetennined alignment
so that the loads from the loading jack would be transferred concentrically to the
model footing. Footing settlements were measured through L VDTs placed at four
corners of the testing plate. The average settlement corresponding to the four L VDT
readings were calculated and was reported as the settlement for each load increment.
107
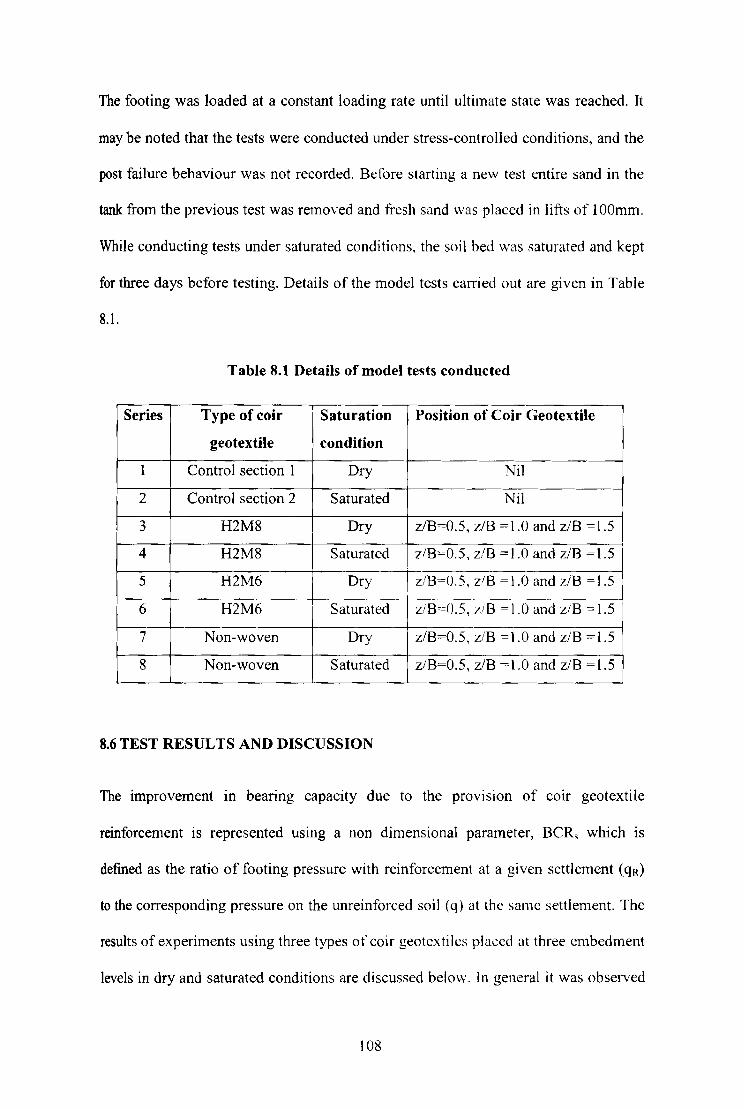
The footing was loaded at a constant loading rate until ultimate state was reached. It
may be noted that the tests were conducted under stress-controJIed conditions, and the
post failure behaviour was not recorded. Before starting a new test entire sand in the
tank from the previous test was removed and fresh sand was placed in lifts of 100mm.
While conducting tests under saturated conditions, the soil bed was saturated and kept
for three days before testing. Details of the model tests carried out are given in Table
8.1.
Table 8.1 Details of model tests conducted
Series Type of coir Saturation Position of Coir Geotextile
geotextile condition
1 Control section 1 Dry Nil
2 Control section 2 Saturated Nil
3 H2M8 Dry z/B=0.5, zlB =1.0 and z/B =1.5
4 H2M8 Saturated z/B=0.5, z/B = 1.0 and zlB =1.5
5 H2M6 Dry I z/B=0.5. zlB =1.0 and z/B =1.5 -----------
6 H2M6 Saturated ziB=O.5, ziB = 1.0 and z/B = 1.5
7 Non-woven Dry z/B=0.5, z/B =1.0 and z/B =1.5
8 Non-woven Saturated z/B=0.5, z/B =1.0 and z/B =1.5
8.6 TEST RESULTS AND DISCUSSION
The improvement in bearing capacity due to the proVISIon of cOlr geotextile
reinforcement is represented usmg a non dimensional parameter, BeRs which is
defined as the ratio of footing pressure with reinforcement at a given settlement (qR)
to the corresponding pressure on the unreinforced soil (q) at the same settlement. The
results of experiments using three types of coir geotextiks placed at three embedment
levels in dry and saturated conditions are discussed belo\v. In general it was observed
108
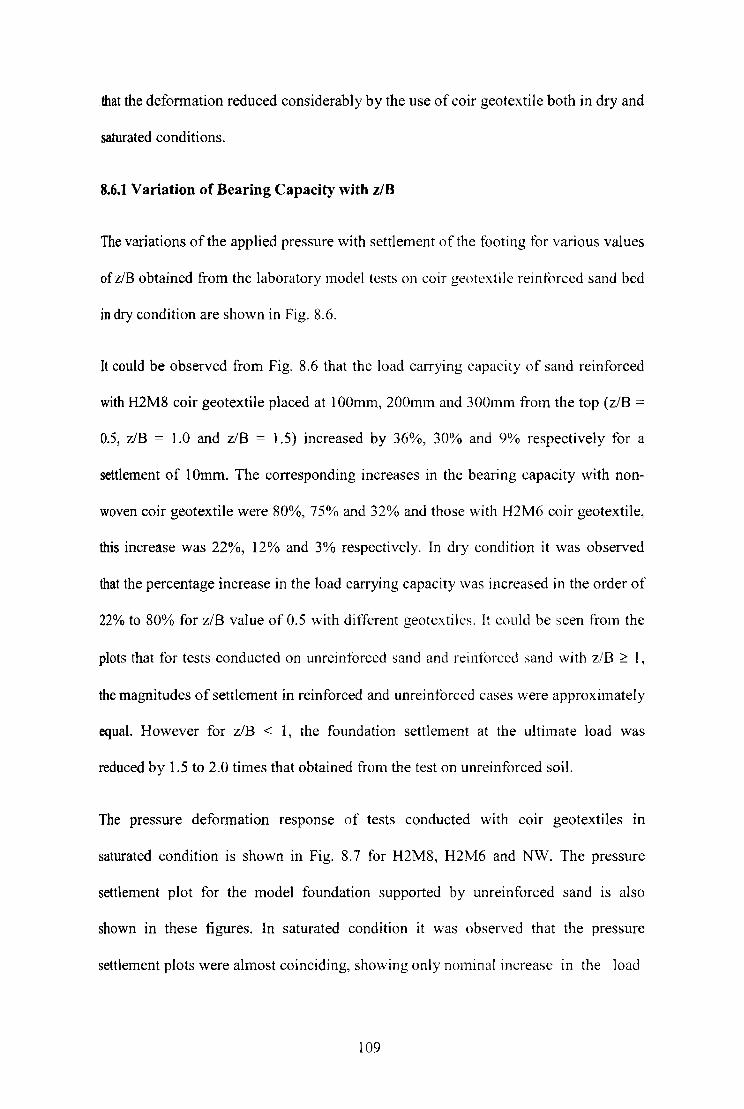
.that the deformation reduced considerably by the use of coir geotcxtile both in dry and
saturated conditions.
8.6.1 Variation of Bearing Capacity with z/B
The variations of the applied pressure with settlement of the footing for various values
ofz/B obtained from the laboratory model tests on coir geokxtik reintorced sand bcd
in dry condition are shown in Fig. 8.6.
It could be observed from Fig. 8.6 that the load carrying capacity of sand reinforced
with H2M8 coir geotextile placed at 100mm, 200mm and 300mm from the top (z/B =
0.5, z/B = J.O and z/B = 1.5) increased by 36%, 30% and 9% respectively for a
settlement of 10mm. The corresponding increases in the bearing capacity with non
woven coir geotextile were 80%, 75% and 32% and thosc with H2M6 coir geotextile,
this increase was 22%, 12% and 3% respectively. In dry condition it was observed
that the percentage increase in the load carrying capacity was increased in the order of
22% to 80% for z/B value of 0.5 with different geotextilcs. It could be seen from the
plots that for tests conducted on unrcinforced sand and reinf()rccd sand with z/B 2:: I,
the magnitudes of settlement in reinforced and unreinforced cases were approximately
equal. However for z/B < 1, the foundation settlement at the ultimate load was
reduced by 1.5 to 2.0 times that obtained from the test on unreinforced soil.
The pressure deformation response of tests conducted with COl[ geotextiles in
saturated condition is shown in Fig. 8.7 for H2M8, H2M6 and NW. The pressure
settlement plot for the model foundation supported by unreinforced sand is also
shown in these figures. In saturated condition it was observed that the pressure
settlement plots were almost coinciding, showing only nominal increase in the load
109

Applied Pressure (kPa) o 100 200 300 400
:~-! ~,-~~~~ E - , ::( Sand dry
E..10 -'E 0 z/B=O.5 Gl -E 15 J CD 0 zl B = 1.0 ;::
~20 i 6z/B = 1.5
25
(a) Using H2M8
Applied Pressure (kPa)
o 50 100 150 200 250 300
~ ~-&--e-~~ ....... E 4 ' !. 6 'E 8-E 10 J
.! 12-t: ~ 14
16 I
18 -
0
5
E E..10 -c Cl)
E 15 ~ q; en 20
25
0
i X Sand only
A~B=O.5
! o~B=1.0
o ~B = 1.5
100
;( Sand only
t.~B=0-5
o zlB = 1.0
o zlB = 1.5
(b) Using H2M6
Applied Pressure (kPa)
200 300 400 500
(c) Using Non-woven
500 600
350 400 450
600 700
Fig. 8.6 Settlement behaviour of coir geotextile reinforced sand bed
in dry condition
110
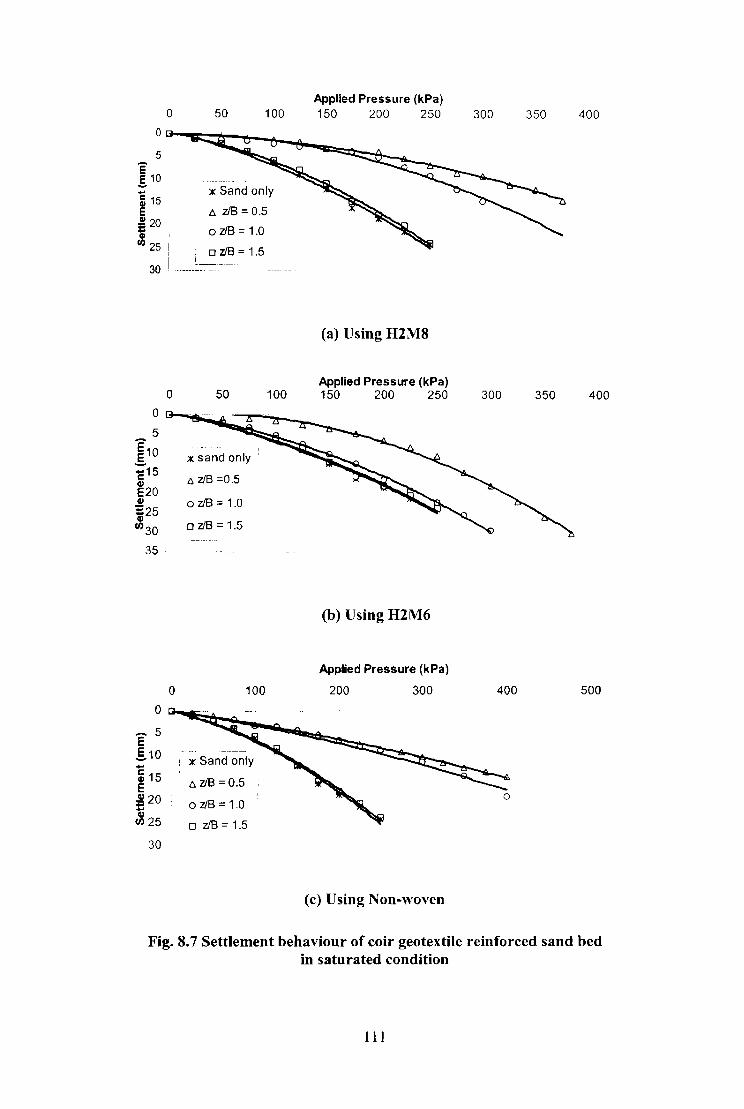
e .§. 10
~ 15 E .!! 20 =
o
GI I
Cl) 25 I I
30 I
o
0
0
5 E .§. 10 -~15 E ~20 -~25
30
50 100
x Sand only
11 zJB;:: 0.5
o zl8;:: 1.0
o zl8 = 1.5
50
x sand only!
11 zl8 =0.5
o zl8;:: 1.0
o zl8;:: 1.5
100
x Sand only
11 zl8 = 0.5 I
o zl8;:: 1.0
o zJB = 1.5
100
Applied Pressure (kPa) 150 200 250
(a) Using H2M8
Applied Pressure (kPa) 150 200 250
(b) Using H2M6
Applied Pressure (kPa)
200 300
(c) Using Non-woven
300 350 400
300 350 400
400 500
o
Fig. 8.7 Settlement behaviour of coir geotextile reinforced sand bed in saturated condition
III

carrying capacity when coir geotextiles were placed at Z/B = 1.5
Fig. 8.8 shows the response curves showing the variation of BCRs with z/B ratio
calculated at settlement levels of 5mm, 10mm and 15mm for dry sand reinforced with
H2M8 coir geotexti1e. It can be observed from the figure that BeR, values
corresponding to 15mm settlement showed higher values compared to those for other
settlements. This indicates that reinforcements are more effective in higher strain
levels owing to high mobilised friction.
1.6
1.5 • H2M8 Dry
• 1.4
I/)
a:: 1.3 (,) ID
• 5m m Settlem en t 1.2
• 10 mm Settlement • , 1.1 • e15m m Settlement
0 0.5 1.5 2
z/B
Fig. 8.8 Variation of BCRs with z/B (H2M8 - dry condition)
It may be noted that a single average curve for the variation of Bearing capacity ratio
(BCR) with z/B, irrespective of settlement values, can be plotted which is also shown
in Fig. 8.8. Similar curves can be plotted for different coir geotextile reinforced sand
bed in dry and saturated conditions (Fig. 8.9) in order to get bearing capacity ratio
(BCR) corresponding to any settlement.
The variation of ultimate bearing capacity ratio (BCRu) with ziB is shown in Fig.
8.10. Comparing Fig. 8.9 and Fig. S.10 it can he noted that the average plot of BeR
112

falls below the plO( of BCRu. This indicates that values taken from the average BeR
variation curve for design purpose bears a higher factor of safety.
3
• H2M8 dry
2.5 c NW dry
A H2M8 saturated
2 c NW saturated a:
" III 1.5
05 I J 0.4 0.6 0.8 1.2 1.4 1.6
zJB
Fig. 8.9 Variation of average Be R with zIB
2.5 -.--
2.3
2.1
1.9
1.7 , a:
15 1 " III 1.3 i 1.1
0 9 j 0.7
A H2M8 dry A H2 M8 sat 0 H2M6 dry
c H2M6 sat c NW dry c NW sat
0.5 0.4 0.6 0.8 1 1.2 1.4 1.6
zIB Ratio
Fig. 8.10 Variation of BCRu with VB
1\3

8.6.2 Effect of Types of Coir Geotextile
In order to understand the beneficial effect of different types of coir geotextile as
reinforcement, applied pressure versus settlement graphs were plotted for a specified
value of z/B. Fig. 8.11 shows the settlement behaviour tor z/B = 0.5 in dry and
saturated condition.
o
5
E I
E 10 I -- I -c
~ eLl 15 ~ en
20
25
o
5
E 10 , .§.. i .... ~ 15-E Cl)
E 20· eLl en
25
30·
100
;( Sand only
lJ.H2MB
oH21V16
o NonWo\en
50 100
~Sandonly
D.H2M3
o H21vO
o Non V\.b\en
Applied Pressure (kPa)
200 300 400 500 600 700
o
(a) Dry condition
Applied Pressure (kPa)
150 200 250 300 350 400 450
(b) Saturated condition
Fig. 8.11 Effect of types of coir geotextiIe on settlement hehaviour (z/B = 0.5)
114

From Fig. 8.11 it could be seen that when coir geotextiles were placed at level
corresponding to z/B = 0.5, the applied pressure for 5mm settlement with non-woven
coir geotextile was 3 12.5kPa showing an increase of 74 %. But this increase was only
39% and 25% with H2M8 and H2M6 coir geotextiles respectively. For higher
settlement the load carrying capacity enhancement was still higher. For example, at
z/B = 0.5, the applied pressure for IOmm settlement to take place when reinforced
with Non-woven and H2M8 gcotextiles were respectively 452.5 kPa and 350kPa, the
corresponding capacity enhancement factor being l. 77 and 1.37 respectively. Similar
variations could be seen for other z/B ratios also. Thus it could be seen that the tensile
strength of the coir geotextile is not the only factor responsible for the bearing
capacity improvement but the interfacial friction also contributes to a great extent.
In saturated condition, corresponding to 5mm settlement the bearing capacities were
210kPa, I 77.5kPa and 165kPa respectively with H2M8, Non-woven and H2M6 coir
geotextiles placed at z/B = 0.5. The bearing capacity improvements is 162 %, 122 %
and 106 % respectively for H2M8, Non-woven and H2M6. Similarly, the increases in
bearing capacity at 10mm settlement was 139 %, 123 %) and 85 ~/;) with H2M8, Non
woven and H2M6 respectively when placed at z/B = 0.5.
For all z/B ratios, both in dry and saturated conditions, H2M6 coir geotextile showed
minimum bearing capacity enhancement. The higher pertonnance of H2M8 coir
geotextile compared to H2M6 coir geotextile may be attributed to higher values of
stiffness, interface friction and secant modulus.
8.6.3 Effect of Saturation
Experiments were done with coir geotextiles placed at different levels both in dry and
saturated condition. Fig. 8.l2 shows the effect of saturation when coir geotextiles
were placed corresponding to z/B values of 0.5, 1.0 and 1.5.
115
o 100
Applied Pressure (kPa)
200 300 400 500 600 700
~ ~~~~~~"-----"-----~~~~;;=;;=~==~, 6. Dry zIB=O.5 1 1:1 Saturated Z/B=O.5 I o Dryz/8=1.O I o Saturated vB=1 .0 o DrytIB::::l .5 o Saturated zIB=1 .5
E :j .§. 8
! 10
j ~! 1 16
18 1 20 ~1----------_.-------,
o ' 00
(a) H2M8 coir geote.tile Applied Pressure (kPa)
200 300 400 500 600 700
o~~~-----------------~~~~-2 II Dry z/B:O.S
4 11 Saturated zlB=O.S
E 6 OOryzlB=1 .0
.s. 8 0 Saturated 218=1.0
110 1 ODryzlB=l .5 I ~ :: DSaturaled~
'6] 18 ro L-________ ~1-___ '_~"_,~ ________ _
o 100
o
(b) H2M6 coir geote.lile Load (kN)
roo 300 400 500 600 700
tJ. Dry z/B:O.5 I:!. Saturated zIB--o.5
:~~~~::~o~o~r;~_~-~I~.O~ __ ~O Saturated 1lB:l .0
6 , E g 8
I ~
10 j 12
14 1 16
1 18
20
\. o Dryz/B.:l .S o SaluraledzlS=l .S
(c) Non-woven coir geotextile
Fig.S.i2 Effect of saturation on coir geotextile reinforced sand
116

It is clear that the bearing capacity reduces upon saturation in all cases with and
without reinforcement. The amount of reduction when the eoir geotextiles are placed
is not uniform but depends on the type of coir geotextile and placement depth (z/B).
For example, the reduction in load carrying capacity due to saturation of the
unreinforced soil tested is 49%. When H2M8 coir geotextiles arc placed at a depth of
IOOmm from the surface (z/B = 0.5), the load carrying crtpacity was reduced by 12%
with respect to the corresponding dry condition. Thc percentage reduction in load
carrying capacity was 24% when H2M8 coir geotextile was introduced at 200mm
(zIB = 1.0) from the surface. In saturated condition it was observed that the settlement
plots for unreinforced case and reinforced case at z/B = 1.5 were almost coinciding,
showing only nominal increase in the load carrying capacity when coir geotextiles
were placed at z/B = 1.5. Thus it can be postulated that, in saturated condition when
coir geotextiles are placed at depths beyond z/B = 1.0, it does not fetch any
appreciable increase in load carrying capacity. Similar computations can be made for
different settlement levels when different types of coir geotextiles are placed. Table
8.2 gives the percentage reduction in load carrying capacity due to saturation for the
unreinforced and reinforced cases at specitied settlements or I Omm and 20mm.
Table 8.2 Percentage reductions in load carrying capacity due to saturation
Reduction in load carrying capacity Geotextile z/B due to saturation (%)
10 mm settlement 20mm settlement Nil - 48.5 48.2
0.5 12.1 10.2 H2M8 1.0 23.9 19.6
1.5 49.5 42.8 0.5 27.5 30.3
H2M6 1.0 48.3 42.7 1.5 50.5 41.4 0.5 35.8 20.6
Non-woven 1.0 43.3 38.5 .-
1.5 61.3 60.0 _____ •• ___ ~_ •• v
117
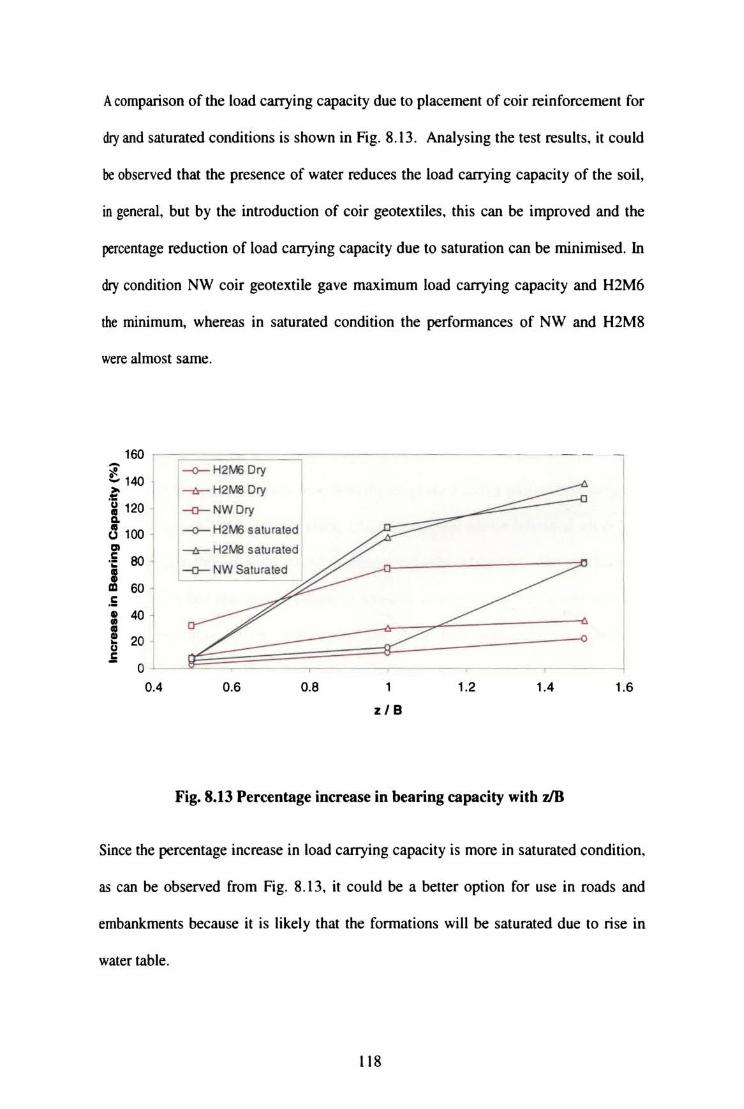
A comparison of the load carrying capacity due to placement of coir reinforcement for
dry and saturated conditions is shown in Fig. 8.13. Ana1ysing the test results. it could
be observed that the presence of water reduces the load carrying capacity of the soil,
in general, but by the introduction of coir geotex.tiles. this can be improved and the
percentage reduction of load carrying capacity due to saturation can be minimised. In
dry condition NW coir geotex.tile gave maximum load carrying capacity and H2M6
me minimum, whereas in saturated condition the performances of NW and H2M8
were almost same.
160 f - --l ~
l,4O I --0-- H2PvE Dry
.~ --tr- H2iV8 Dry
i '20 -o-NWDry
~': j --0- H2MB saturated I --tr- H2M3 saturated
! -0-- NW Saturated
60 .5 40 j : I 20 • u .5
0
0.' 0.6 0.8 '.2 1.4 1.6
z I B
Fig. 8.13 Percentage increase in bearing capacity with :dB
Since the percentage increase in load carrying capacity is more in saturated condition,
as can be observed from Fig. 8.13. it could be a beller option for use in roads and
embankments because it is likely that the formations will be saturated due to rise in
water table.
liS

8.7 SUMMARY
Results clearly demonstrate that coir geotextiles, a natural product, can substantially
increase the bearing capacity of shallow square footing on sand both in dry and
saturated conditions. The performance in saturated condition was even better in some
cases. Both H2M8 and NW coir geotextiles were found suitable for increasing the
bearing capacity in dry condition and the fonner was found more effective in
saturated condition.
119
CHAPTER 9
RUT BEHAVIOUR OF COIR GEOTEXTILE REINFORCED UNPAVED ROADS
9.1 GENERAL
A road continuously deteriorates under the combined action of traffic loading and the
environment. The most common indicators of pavement performance, the ability of
roads to satisfy the demands of traffic and environment over its design life, are
surface rutting, fatigue cracking, riding quality and skid resistance.
Geotextiles increase the stability and improve the perfonnance of weak subgrade soils
primarily by separating the sub base from the subgrade. Placing geotextile at subgrade
- sub base or sub base - base interface, subgrade restraint can be enhanced which will
facilitate the mobilization of heavy construction machinery at site. The mechanisms
attributing to this are increased bearing capacity in addition to lateral restraint and
tension membrane effect. Substantial life cycle cost saving is possible with
geosynthetic reinforced aggregate base course in pavements.
Mechanistic method for flexible pavement design is regarded as the most powerful
pavement desi.~,YJ1 methodology and is becoming increasingly popular amongst various
countries. In India too Indian Roads Congress has updated the specifications for
flexible pavement design by changing the design methodology from empiricism to
mechanistic design principles. In the mechanistic approach, the two design criteria,
the fatigue failure and rutting failure corresponding to the horizontal tensile strain at
the bottom of the bituminous layer and the vertical compression strain on the
subgrade are considered (Chakroborty and Das, 2003).
Rutting is the pennanent defonnation along its wheel path. It is a manifestation of two
different phenomena: i) densification and ii) shear detorrnation of pavement layer
materials and subgrade (Yoder and Witczak, 1975). Rutting is very important because
of its safety implications. The contributions to rutting from various layers could be
different. It is reported that 46% of rutting took place from bituminous surface and
granular base course, while sub base and subgrade contributed 54% of the total rutting
(AASHO, 1962). The vertical strain on the subgrade is assumed as the index of rutting
to occur in a pavement.
In the present study, the rut behaviour of unpaved roads with COlr geotextile
reinforcements placed at sub grade - sub base interface and also between layers of sub
base under the action of static loads and repetitive loads were studied. The details of
the testing programme and discussion of the results obtained are described in this
chapter.
9.2 RUT BEHAVIOUR UNDER STATIC WHEEL LOADS
Plate bearing tests were perfonned to investigate the behaviour of coir geotextile
reinforced unpaved roads under static loads. The test section consisted of 600mm
thick subgrade overlain by water bound macadam (WBM) 150 mm thick.
9.2.1 Experimental Set - up
The experimental set - up consisted of a plate load test facility as described in section
8.3. The loading was done with the help of a 200 kN capacity hydraulic jack and self
reaction frame made of mild steel I sections. The load was applied through 200mm
square mild steel plate, 25.4mm thick to simulate Equivalent Single Wheel Load
121

(ESWL). Rut measurements were made using LVDTs. The schematic arrangement of
the test set - up is shown in Fig, 9, I.
~=~f====;r=r:::7Z~~-~==== Hydraulic Jack W ...----- Loadinl1 Frame
------ LVDT
~-- Plate 20cm X 20cm ___ - WBM
....--- eoir Geotextile
'-----Soil
.-----Tank (101 X 101 X Im)
Fig. 9.1 Schematic test set - up to study rut behaviour under static loads
9.2.2 Preparation of Test Bed
For the present study two types of subgrades. red soil (Soil - I) and Clayey silt soil
(Soil - 3) were used. Three types of coir geotextiles (Woven - H2M6 and H2M8 and
Non - Woven) were used as reinforcing layer. Water bound Macadam was
constructed using granite aggregates and screenings.
The subgrades were prepared at a dry unit weight of 15 kN/m" and with a water
content of I 0% for red soil and 4% for clayey silt soil subgrade. Required quantity of
wet soil was prepared by mixing dry soil with water. Soil was filled in the tank in
layers of compacted thickness of 100 mm each up to a total height of 600mm in all
122
trials. Coir geotextiles cut to the inside dimension of the tank was placed over the
prepared sub grade. Water bound macadam of grade 11 was laid over the compacted
subgrade. The quantities of coarse aggregate and screenings were taken as per MORO
specifications (0.91m3 to 1.07m3 of coarse aggregate and O. 12m3 to O.13mJ of
screening for a compacted thickness of75mm per 10m\
9.2.3 Testing Procedure
The tests were done as per the current Indian Standard test procedure for plate load
tests. The load was applied through the thick square mild steel plate. Rut
measurements were taken by L VDT placed one each at four corners of the plate. Load
was applied at regular intervals and corresponding settlements were noted. Each load
was kept constant until the rate of settlement reduces to less than O.025mm/minute.
Fresh soil samples, aggregates and coir geotextiles were used for each testing. The
details of the different tests carried out are summarised in Table 9.1.
9.2.4 Results and Discussion
The principal criterion for determining the thickness of flexible pavements is the
vertical compressive strain on top of the sub grade imposed by standard axial load. In
India the standard axial load is 8l.7 kN. Excessive vertical subgrade strain causes
permanent deformation in the subgrade, which is manifested in the fonn of rutting on
the pavement surface. Acceptability level of rut dcpth is different in different
countries. IRC: 37-2001 recommended an allowable rut depth of 20 mm to estimate
the rutting life of the pavement in terms of standard load repetition. IRC: SP: 20-2002
recommends that the maximum rutting that can be accepted in rural roads may be
taken as 50 mm before rehabilitation work is needed.
123

Table 9.1 Summary details of tests conducted to study rut behaviour
SI. Type of Sub base (WBM) Type of Location of No. sub grade thickness reinforcement reinforcement
soil I
1 One layer - 150 mm No reinforcement ---y- One layer - 150 mm H2M8 At interface
, ---::----One layer - 150 mm ' 3 H2M6 , At interface '- Soil - 1
,-
4 One layer - 150 mm Non Woven At interface s- Two layers - 75mm H2M8 At interface and
each at mid depth of WBM
~ Two layers - 75mm H2M6 At interface and each at mid depth of
WBM ~ Two layers - 75mm Non Woven At interface and
each at mid depth of WBM
8 One layer- 150 mm No reinforcement -
~ Soil - 3 One layer - 150 mm H2M8 At interface 10 One layer - 150 mm H2M6 At interface -
11 One layer - 150 mm Non Woven At interface
9.2.4.1 Rut behaviour of red soil subgrade
Fig. 9.2 shows the performance variation in terms of rut depth due to applied wheel
loads for unpaved road sections with and without coir gcotextiles placed at sub grade-
sub base interface. It could be observed that the control section without coir geotextile
reinforcement can sustain a wheel load stress of 192.5kPa for a rut depth of 20 mm
and 317.5kPa for a rut depth 50mm. When H2M6 coir geotextile was introduced at
subgrade - sub base interface, this load carrying capacity was increased to 262.5kPa
and 462.5 kPa respectively. Also these values were respectively 325 kPa and 560 kPa
for non-woven coir geotextile and 337.5kPa and 542.5kPa for H2M8 coir geotextiles.
The percentage increase in the load carrying capacity is worked out to be 37%, 69%
and 75% for H2M6, NW and H2M8 eoir geotextiles respectivdy at 20 mm rut depth
and 48%, 77% and 71 % at 50 mm rut depth. Again at greater rut depths the
124
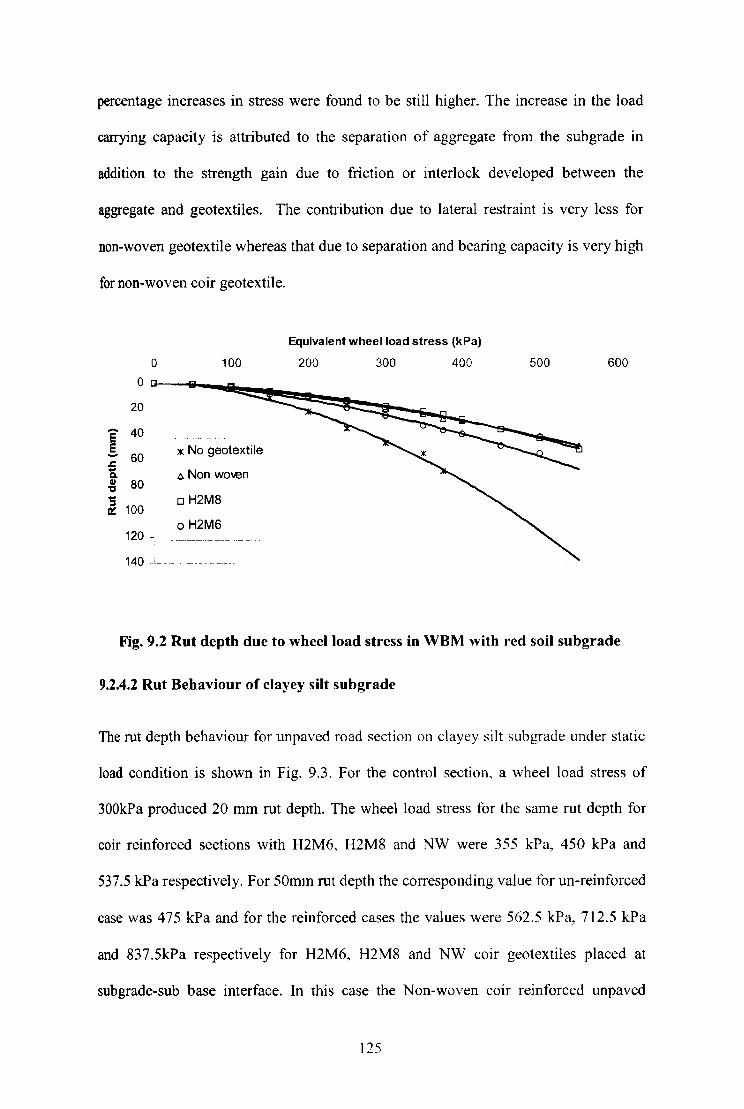
percentage increases in stress were found to be still higher. The increase in the load
carrying capacity is attributed to the separation of aggregate from the sub grade in
addition to the strength gain due to friction or interlock developed between the
aggregate and geotextiles. The contribution due to lateral restraint is very less for
non-woven geotextile whereas that due to separation and bearing capacity is very high
for non-woven coir geotextile.
.... E §. .J:. .. Q. G)
'tI .. :::J ~
0
0
20
40
60
80
100
120 -
140 . .i. ..
100
)I: No geotextile
(:. Non wo-..en
o H2M8
o H2M6
Equivalent wheel load stress (kPa)
200 300 400 500 600
Fig. 9.2 Rut depth due to wheel load stress in WBM with red soil subgrade
9.2.4.2 Rut Behaviour of clayey silt subgrade
The rut depth behaviour for unpaved road section on clayt:y silt subgrade under static
load condition is shown in Fig. 9.3. For the control section, a wheel load stress of
300kPa produced 20 mm rut depth. The wheel load stress for the same rut depth for
coir reinforced sections with H2M6, H2M8 and NW were 355 kPa, 450 kPa and
537.5 kPa respectively. For 50mm rut depth the corresponding value for un-reinforced
case was 475 kPa and for the reinforced cases the values were 562.5 kPa, 712.5 kPa
and 837.5kPa respectively for H2M6, H2M8 and NW coir geotextiles placed at
subgrade-sub base interface. In this case the Non-woven coir reinforced unpaved
125

section is found to be superior to H2M8 and H2M6 reinforced onc. The subb'Tade soil,
being more clayey in nature is expected to be more t1exibIe and the Non-woven
geotextile may be more adaptable to follow the undulations. This may increase the
perfonnance of geotextile as separator and as reinforcement due to membrane effect.
Equivalent wheel load stress (kPa)
o 100 200 300
1:~~~--~~~~~~ __ 20 E E 30 --;: 40 Co Q) 'C 50 .... :::I
D:: 60
70
:.: Without geotextile
o H2M8
6 Non wO'ven
o H2M6
80 ------ ---------- - --
400 500 600
Fig. 9.3 Rut depth due to wheel load stress in WBM with clayey silt subgrade
9.2.4.3 Effect of additional reinforcement layer
In order to explore the possibility of further improving the rut behaviour by using coir
geotextiles, an additional layer of coir geotextile was provided within the subbase and
analysed. When two layers of coir geotcxtilcs were placed (one at suhgrade -- suh hase
interface and other within the sub base itself at mid depth), the load carrying capacity
was further improved as shown in Fig 9.4. A comparison between single layer system
with coir geotextiles at the interface and two-layer system with an additional
reinforcement layer within the WBM section (red soil sub grade) shows that while
126
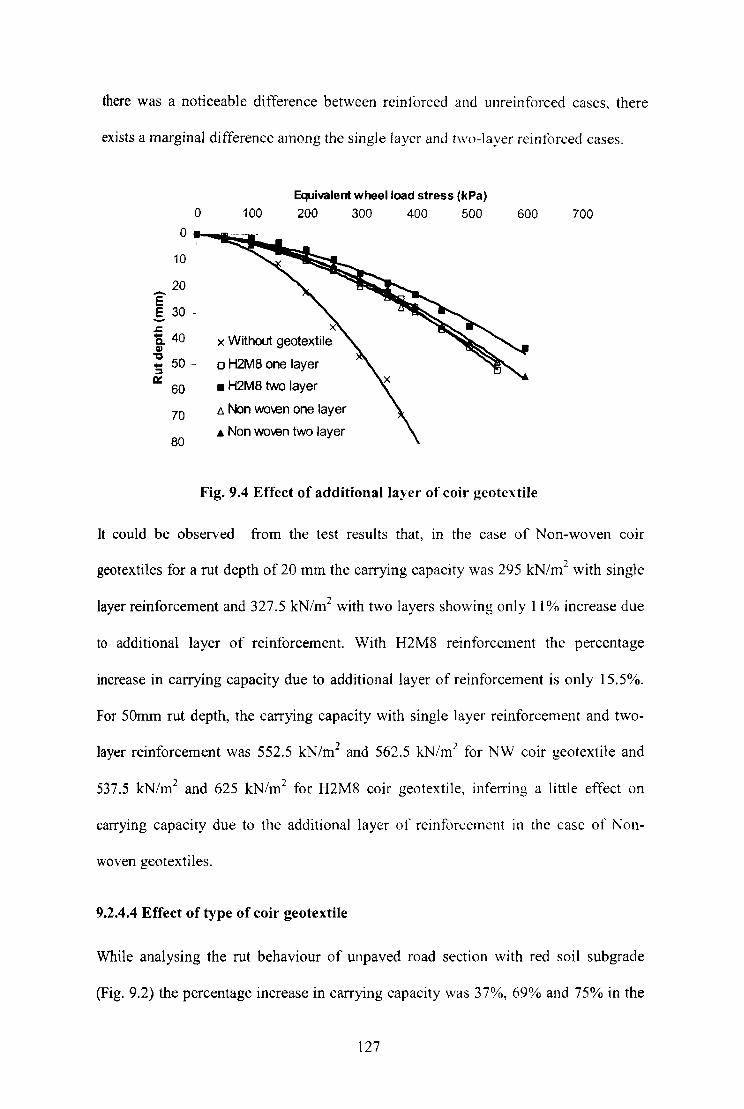
there was a noticeable difference between reinforced and unreinforced cases, there
exists a marginal difference among the single layer and two-layer reinforced cases.
Equivalent wheel load stress (kPa)
o 100 200 300 400 500 600 700
E ..s 30 . ..c: Q. 40 x Without geotextile ell
"0 50 - o H2M8 one layer ..
~
0:: • H2MB two layer 60
70 l:> Non wo\en one layer
80 • Non wO\en two layer
Fig. 9.4 Effect of additional layer of coir gcotextile
It could be observed from the test results that, in the case of Non-woven COlr
geotextiles for a rut depth of 20 mm the carrying capacity was 295 kN/m2 with single
layer reinforcement and 327.5 kN/m2 with two layers showing only 11 % increase due
to additional layer of reinforcement. With H2M8 reinforcement the percentage
increase in carrying capacity due to additional layer of reinforcement is only 15.5%.
For 50mm rut depth, the carrying capacity with single layer reinforcement and two-
layer reinforcement was 552.5 kN/m2 and 562.5 kN/m2 for NW coir geotextile and
537.5 kN/m2 and 625 kN/m2 for H2M8 coir geotextile, inferring a little effect on
carrying capacity due to the additional layer of reinforcement in the case of Non-
woven geotextiles.
9.2.4.4 Effect of type of coir geotextile
While analysing the rut behaviour of unpaved road section with red soil subgrade
(Fig. 9.2) the percentage increase in carrying capacity was 37%, 69% and 75% in the
127

order ofH2M6, NW and H2M8 coir geotextiles for a rut depth of20 mm. For 50 mm
rut depth, the corresponding increases were 46%, 77% and 71 % respectively. For
unpaved section with clayey silt subgrade, the performance was remarkable when
H2M8 and NW coir geotextiles were placed at the interface. For 20 mm rut depth the
percentage increase in load carrying capacity in relation to unrci nforc\:d case was 19
%,50% and 80% with H2M6, H2M8 and NW coir geotextiles whereas at 50 mm rut
depth, the percentage increase in carrying capacity was respective! y 19%, 50% and
77%. When two layers of reinforcements were placed, H2M8 coir geotextile gave the
highest perfonnance and the contribution due to additional layer of NW coir
geotextile was meagre.
9.3 RUT BEHAVIOUR UNDER REPETITIVE LOADS
In order to study the benefits of applying coir geotextile reinforcement in improving
rutting resistance of unpaved roads, laboratory wheel tracking tests were performed.
The details of the study are explained in the following sections.
9.3.1 Wheel Tracking Apparatus
Laboratory wheel tracking tests is the most practical tool to study the rutting
behaviour of pavement materials under simulated moving traffic loads (Wasage et al.,
2004). A wheel-tracking machine was designed and fabricated in the present work to
study the effect of load repetitions. Track bed was made in a steel tank measuring
1.5m x 0.75m x 0.75m. A 0.5 HP constant torque geared motor was used to control
the motion of the wheel. The wheel was 200mm diameter and 45mm wide with a
rubber ring over it. The motor was mountcd on a frame, which mo\'cs on t()U[ 60mm
diameter wheels, on rails provided on the top of two long sidewalls of the tank. The
128

Angle I
Frame--..,
Rail
V- Rail
Dial Gauge
a. Longitudinal Section
~ Weight Support
0 0 , ,,~ ... ,',
... ,,," ... ;:. Wheel. '-::" 't~------ ---- ~; ...
I . - I
I I I I
I I I I
I I I I
I I I I ~'/2HP -"-I \1otor I
I , I ..-" V Reduction -
I I I , I I
Gear I I I , -, I
J ------~, ,""""'-----,~' "' .. " ,
'~" '0' 0 0
L Shaft LChain& Roller. 60111111 Dia J
Spfllckd
<;(7F ()f' T 1\ '" K 1 nnOnll" '\ ;'in 111'" '\ 7,(1 IIITll
h. Plan
Fig. 9.5. Wheel tracking apparatus
129
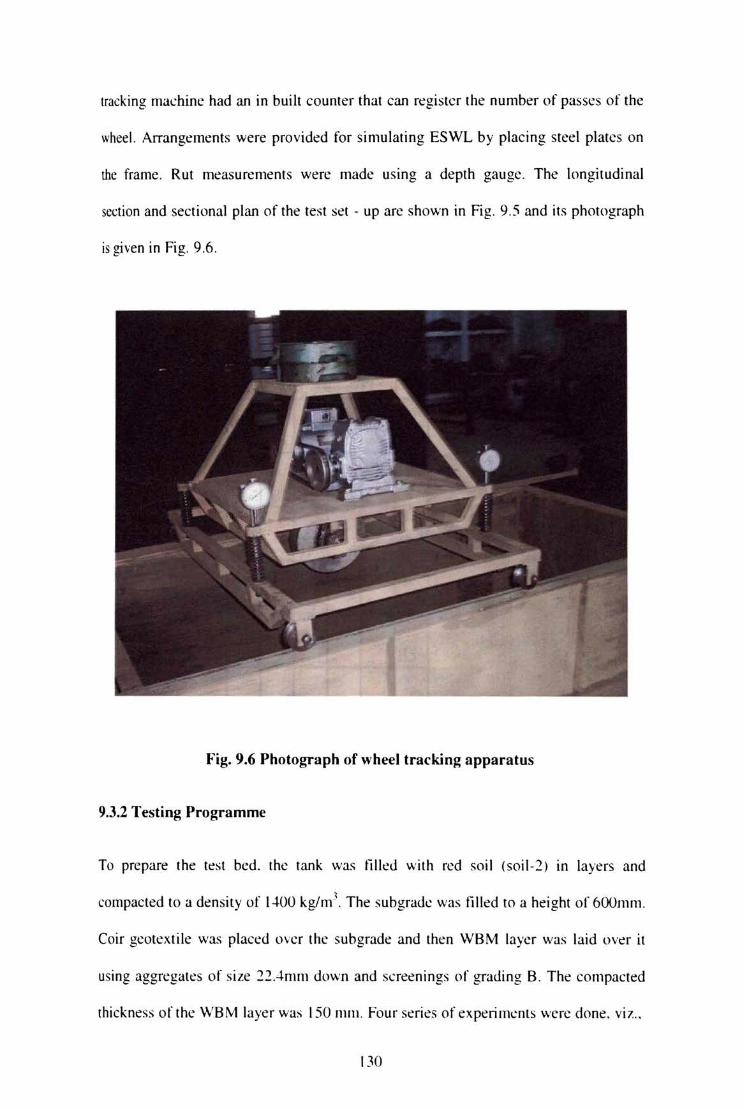
tracki ng mat.:'hi nc: had an in built counter that can register the number of passL:s o f the
",neel. Arrangements were provided for s imulating ESWL by placing steel plates on
the framc . Rut measure ments were made using a depth gauge. The longitudinal
st.'Ction and sectional plan of the test set - up are shown in Fig. 95 and it s photograph
is given in Fig. 9.6.
Fig. 9.6 Photograph of wheel tracking apparatus
9.3.2 Testing Programme
To prepare the test bed. the tank was filled with rcd soil (soil<! ) in laye rs and
compacted to a density of 1-1-00 kg/m '. The suhgrade was filled to a height or bOOIllIll .
Co ir gcotextile was placed ovcr the subgrade and then WBM layer was laid OWl' it
using aggregatt:s of s ize 22Amm down and sneen ings of grading B. The eompat.:'ted
thickness of the WBM layer was 150111111 . Four series of expt:ri mcnts were done. vi?.,
130
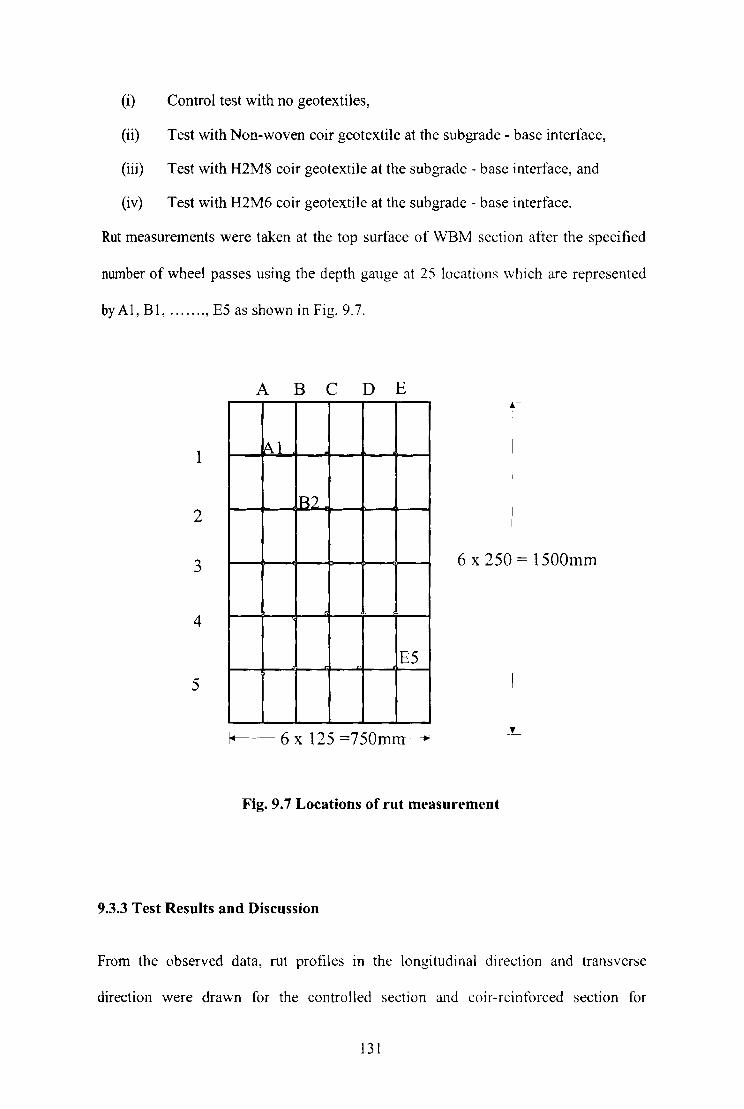
(i) Control test with no geotextiles,
(ii) Test with Non-woven coir geotextile at the subgrade - base interface,
(iii) Test with H2M8 coir geotextile at the subgrade - base interface, and
(iv) Test with H2M6 coir geotextile at the sub grade - base interface.
Rut measurements were taken at the top surface of WBM section after the specified
number of wheel passes using the depth gauge at 25 locations which are represented
by AI, BI, ....... , E5 as shown in Fig. 9.7.
A BeD E
I Al
IR2 2
3 6 x 250 = 1500mm
, .. 4
E5
5
~- 6 x 125 =750mm -.
Fig. 9.7 Locations of rut measurement
9.3.3 Test Results and Discussion
From the observed data, rut profiles in the longitudinal direction and transverse
direction were drawn for the controlled section and coir-reinforced section for
131

different wheel load passes. Fig 9.8 gives the transverse rut profile at center (through
A3, B3, C3, D3 and E3) for the control section. It could he seen that a rut depth of
2Omm, which is the allowable rut depth by the IRC, has occurred at about 55 number
of wheel passes. The development of rut was very fast in the initial stages of wheel
passes and afterwards it was observed that the increase in rut depth was gradual.
Accordingly, a rut depth of 29mm, which was obtained for 500 passes became 49mm
only, after 1750 number of wheel passes. The soil on either side of the wheel was
bulged due to loading, which is manifested as negative settlement in the figure.
Fig.9.9 shows the variation of rut depth after 1750 wheel passes along the centre
(through A3, B3, C3, 03 and E3) for the reinforced and unreinforced cases. It was
observed that due to placement of the coir geotextile the rut depth was reduced
considerably. Thus, when rut measurements were taken at C3 location, on the section
reinforced with Non-woven geotextile, it was only 2mm, whereas it was 48.5mm for
the unreinforced case. Similar effects were noted with other geotextiles like H2M8
and H2M6, which gave maximum rut depths of 24mm and 30mm respectively after
1750 passes of the wheel. The percentage reduction in rut depth amounts to 55%, 50%
and 38% respectively with Non-woven, H2M8 and H2M6 after 1750 wheel passes. At
B3 location the bulging was eliminated when wir geotextiles \verc placed. Thus it can
be concluded that eoir geotextiles function both as separator and as reinforcement in
the case of repetitive loads also. From the profiles drawn it was observed that, heaves
on both sides of the rut had approximately in equal volume to the volume of rut. This
suggests that displacement of the materials rather than densification of the layers
contributed to the rut formation. While comparing reinforced and unreinforced cases,
it was observed that there existed no heaving in coir-reinforced sections.
132
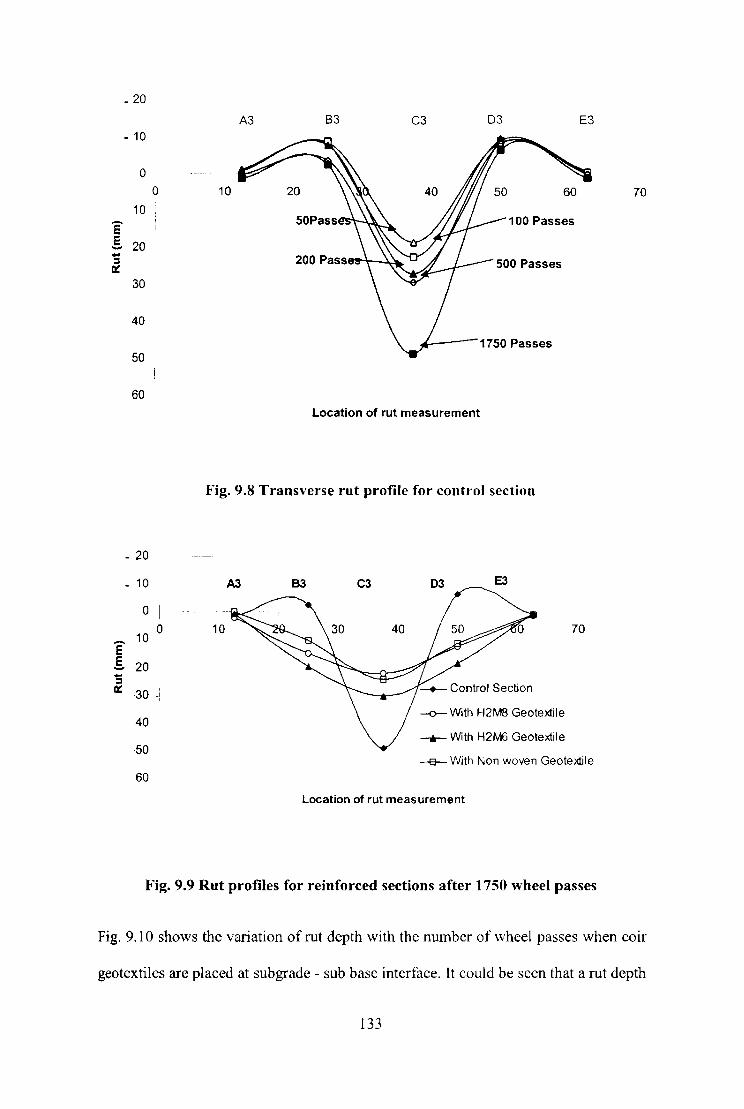
_ 20
- 10
0
0
10
E ! 20 .. := 0::
30
40
50
60
- 20
- 10
0
0
E 10
! 20 .. := Q: ·30 -I
I
40
·50
·60
A3 B3 C3 03 E3
10 20
100 Passes
200 Pass 500 Passes
1750 Passes
Location of rut measurement
Fig. 9.8 Transverse rut profile for control section
A3
10
B3 C3 03 E3
-0--- With H2M8 Geotextile
~ With H2M6 Geotextile
70
--e-- With Non woven Geotextile
Location of rut measurement
Fig. 9.9 Rut profiles for reinforced sections after 1750 wheel passes
70
Fig. 9.10 shows the variation of rut depth with the number of wheel passes when coir
geotextiles are placed at subgrade - sub base interface. It could be seen that a rut depth
133

of20mm was produced due to 55 wheel passes in the case of control section whereas
coir reinforced section with H2M8 coir geotextile needed 1050 passes for the same rut
depth to take place. Also, sections with Non-woven and H2M6 eoir geotextiles
produced 20 mm rut after 950 and 450 number of passes. Variations in rut depth for
500, 1000 and 1500 passes are compared in Fig. 9.11 for different geotextiles. It is
clear from the figure that H2M8 and Non-woven coir geotextile produced similar
perfonnance. Fig. 9.12 shows typical graphs for 1750 wheel passes along the
centreline and along a path 125mm away from the centreline.
E g .c
o o
10
20
C. 30 . Cl)
o '$ 0:::
40
50
60
500 1000
Number of Passes
1500 2000 2500
--er- Control section --With H2M8 -'-With NW -e-With H2M6
At C3 Location
Fig.9.10 Variation of rut depth with number of wheel passes
134
3000

so -
45 D Wnh H2M8
With Non woven 40 j D WlthH2M6
35 • Control Section r-
e-r-
r-
15 t='" r--F :
10
1_. : 5
o 500 Passes 1000 Pa88ell 1500 Passes
Fig. 9.11 Effect of coir gcotcxlile 0 11 rut depth
15 ~ 0 50 100 150
15 _ _ Control Section
20 ~ 10 -0-- With H2M8 Geotextile
-0- With H2M3 Geotextile ... • • • .... 5 _ With Non wown Geotextile 25
• • • • • ~ 0
30 SO 100 150 e- 5 0
!. 3S ~ Control Section e-~ !. 10 • • • • • ~with H2M8 ;
40 -0- with H2M6 0: 15 o--O--C>---<>---.-with NW ~ 45 20
~ 25 50 1 Cl C2 C3 C4 CS
30 ., .2 B3 B4 •• SS -Distance I Poaltlon
35
DI,tance' POIiUon
Ca) along ccntreHne (b) away from ccntreline
Fig. 9.12 Longitudinal rut profile
135
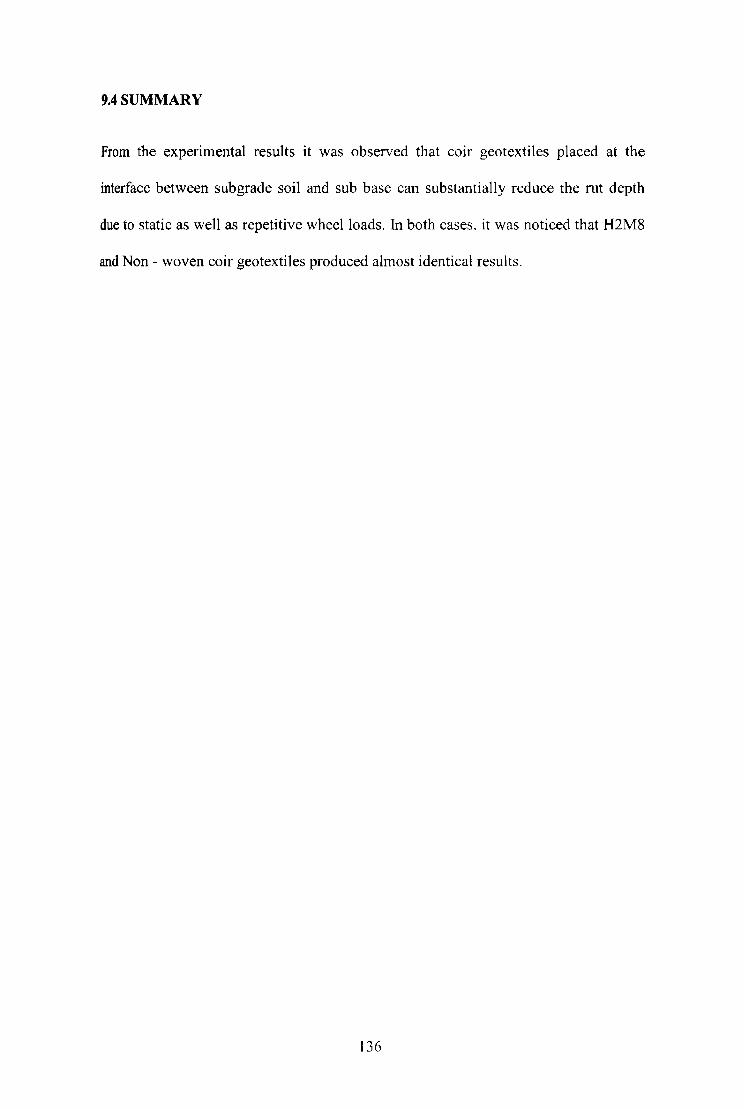
9.4 SUMMARY
From the experimental results it was observed that COif geotcxtiles placed at the
interface between subgrade soil and sub base can substantially reduce the rut depth
due to static as well as repetitive wheel loads. In both cases, it was noticed that H2M8
and Non - woven coir geotextiles produced almost identical results.
136
CHAPTER 10
DESIGN OF UN PAVED ROADS
10.1 INTRODUCTION
Pavement design deals with the techniques of detennining thickness, and laying
configurations for the chosen pavement materials. There exist a number of design
methodologies for the structural design of pavements viz., empirical method with or
without a soil strength test, limiting shear failure method, limiting deflection method,
regressIOn method based on pavement perfonnance, and mechanistic- empirical
method.
The use of empirical method without a strength test dates back to the development of
Public Roads (PR) soil classification system, in which the subgrade was classitied as
unifonn from A-I to A-8 and nonunifonn from B-1 to B-3. This system was later
modified by the Highway Research Board (HRB, 1945) in which soils were grouped
from A-I to A-7 and a group index was added to differentiate the soil within each
group. This index was used to estimate the sub base and total thickness of the
pavement. The empirical method with a strength test was first used by the California
Highway Department in 1929 (Porter, 1950). The thickness of the pavements was
related to the California Bearing Ratio, defined as the penetration resistance of a
subgrade soil relative to standard crushed rock. The CBR method of design was
studied extensively by the US Corps of engineers during the World War II and
became a very popular method of pavement design after the war. The Indian Roads
Congress also used this method to detennine the thickness of individual layers of
pavement. The disadvantage of this empirical method is that it can be applied only to
a given set of environmental, material, and loading conditions.
In the limiting shear failure method the thickness of pavement is detennined so that
shear failures will not occur. The major properties of suhgrade soil considered are
cohesion and angle of internal friction. Mc Leod (1953) advocated the use of
logarithmic spirals to detennine the bearing capacity of pavements.
The limiting deflection method is used to detennine the thickness of pavements so
that the vertical deflection will not exceed the allowable limit. The Kansas State
Highway Commission (I 947) modified Boussinesq's equation and limited the
deflection of subgrade to 0.1 inches (2.54mm). The US Navy (1953) applied
Bunnister's theory (Bunnister, 1943) and limited the surface deflection to 0.25 inches
(6.35mm). The use of deflection as a design criterion has the apparent advantage that
it can be easily measured in the field. Unfortunately pavement failures do occur due to
excessive stress and strain, instead of deflections.
A good example of the use of regression equations for pavement designs is the
AASHTO method based on the results of road tests. The disadvantage of the method
is that the design equation can be applied only to the conditions at the road test site.
The mechanistic - empirical methods of design are based on the mechanics of
materials that relate an input, such as a wheel load, to an output or pavement response
such as stress and strain. The response values are used to predict distress based on
laboratory test and field perfonnance data. Dependence on observed perfonnance is
necessary because theory alone has not proven sutlicicnt to design pavements
realistically.
138

The empirical - mechanistic method is more theoretical in approach, though it needs
calibration based upon the performance of in - service pavements. This approach is
increasingly popular amongst various countries. In India too, the pavement design
guidelines IRC: 37 have updated in 2001 where the design methodology has changed
from empiricism to mechanistic pavement design principles. The empirical -
mechanistic approach is being successfully used in the design of reinforced sections
also, as it tries to relate the stress - strain parameters with the expected life of the
pavement.
In the present study three methods of design of unpaved roads reinforced with coir
geotextiles are discussed: (a) Giroud and Noiray method for designing road sections
with geotextiles placed at sub grade - sub base interface, (b) IRC method for designing
road sections using the modified CBR value t()r the design of road sections with
geotextiles placed within the subgrade, and (c) US Army method using modified CBR
values from laboratory CBR tests on reinforced soil - aggregate systems.
It is expected that normally rural roads will not have more than 450 commercial
vehicles per day. The standard axle load prescribed by the IRe is of 81.7 kN. Since
coir geotextiles are used, the values of moduli are less than those of the polymeric
geotextiles and as such, graphs for geotextiles in the range (10 kN/m to 100 kN/m) are
developed. The limiting strain is taken as 30%. The failure rut depth prescribed by the
IRe for the design of flexible pavements is 30mm in general, whereas it is 50mm for
rural roads.
139

10.2 GIROUD AND NOIRA Y METHOD
10.2.1 General
Giroud and Noiray (1981) use the geometric model shown in Fig. 10.1 for a wheel
load pressure of Pec on an area (8 x L), which dissipates through ' 110 thickness of
aggregate base without geotextile and ' h' thickness of agb'Tcgate base with geotex tile.
The geometry indicated results in a stress of 'po (without geotextiJe) and 'p ' (with
geotextile) on the soil subgrade as follows:
............. ( I 0. 1)
p p= +~
2(8 + 2h lana XL + 2h lana) .............. (10.2)
where,
P = Axle load,
r= Unit weight of aggregate,
a = load dispersion angle for unreinforced case, and
tlQ = load dispersion angle for reinforced case.
r-- 20,- 1
I Without georexri/es :
subgrade
IIIIIIII y-Y..l'-' -li-;;;---.... . ' a p ~ r"
1o-- 2a - 01
With geolextiles ~
" I
Fig. 10.1 Load distribution through sub base (After Giroud and Noiray, 1981)
140

Since the pressure exerted by the axle load through the aggregate into the soil
subgrade is known, the shallow foundation theory of gcotechnical engineering can be
utilized. Assuming that the soil subgrade consists of fine-grained silt and clay in
saturated condition, shear strenbrth is taken as the undrained cohesion. Without
geotextile, it is again assumed that the maximum pressure that can be maintained
corresponds to the elastic limit of the soil, that is,
po = !rC + rha -----------------( I 0.3)
and that with geotextile the limiting pressure can be increased to the ultimate bearing
capacity of the soil, that is,
p* = (n+2) C + rh ------------------( I 0.4)
10.2.2 Unpaved Road without Geotextile by Quasi-Static Analysis (ho vs. CBR)
For the case of no geotextile reinforcement, equation (1 O.l) and (10.3) can be solved,
resulting in equation (10.5), which yields the desired aggregate thickness response
curve without the use of a geotextile:
------------( 10.5)
where,
C = cohesion,
P = axle load,
Pc = tyre inflation pressure,
ha == aggregate thickness, and
141
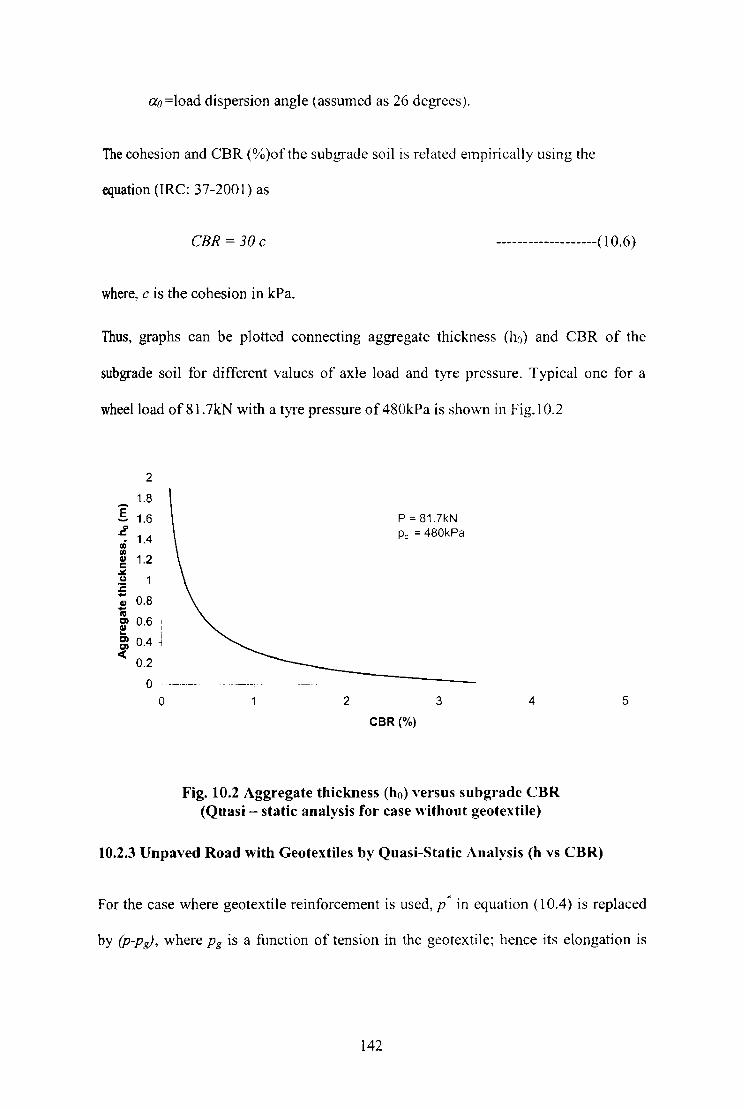
ao=load dispersion angle (assumed as 26 de.blfccs).
The cohesion and CBR (%)ofthe sub.brrade soil is related empirically using the
equation (IRC: 37-2001) as
CBR = 30c -------------------( I 0.6)
where, c is the cohesion in kPa.
Thus, graphs can be plotted connecting aggregate thickness (ho) and CBR of the
subgrade soil for different values of axle load and tyre pressure. Typical one for a
wheel load of 81. 7kN with a tyre pressure of 480kPa is shown in Fig.1 0.2
I
2
1.8
1.6 ~ ri 1.4
~ 1.2 c ~ u 1 :c S 0.8 IV
~ 0.6 I ... ' g 0.4 ~ «
0.2
P = 81.7kN Pc = 480kPa
o --_._-o 2 3 4
CBR (%)
Fig. 10.2 Aggregate thickness (ho) versus subgrade CBR (Quasi - static analysis for case without geotextile)
10.2.3 Unpaved Road with Geotextiles by Quasi-Static Analysis (h vs CBR)
5
For the case where geotextile reinforcement is used, p* in equation (lOA) is replaced
by (p-pg), where pg is a function of tension in the geotcxtile; hence its elongation is
142

significant. On the basis of the probable detlected shape of the geotextile- soil system
pg is expressed as,
---------------( 10.7)
where,
Es = Modulus of coir geotextile,
[;= Strain,
a = geometric property ( Fig.l 0.1), and
S = Settlement under the wheel (rut depth).
Combining equations 10.2, lOA and 10.7 and usingp· = P-Pg, it gives equation 10.8
(n + 2)c = P _ -,=E::::::,,=[; == 2(B + 2h tan a XL + 2h tan a ) aJI + (a 12S)2
-------( 1 0.8)
Using the above equation, response curves connecting hand eBR can be drawn for
different values of rut depth, modulus of coif geotextile, axle load and tyre pressure.
Typical curves for axle load of 81. 7kN and tyre pressure of 480kPa for rut depths of
30mm and SOmm are shown in Fig. 10.3.
10.2.4 Reduction in Aggregate Thickness by the Use of Geotextile (~h vs. CBR)
Having obtained the values of ha from Fig 10.2 and h from Fig 10.3, the reduction of
the base course thickness i1h resulting from the use of geotextile is deduced from
quasi-static analysis by
------------------ (10.9)
143

Curves can be plotted relating Ml and CBR. The typical curves drawn for the rut
depths of 30mm and 50mm are shown in Fig. 10.4 (a) and (b). It may be noted that
1111 obtained above doesn't take traffic into consideration.
0.7 r--...-------------------,
0.6
0.2
0.1
o ~----------------------------------~ o 0.5 1 1.5 2 2.5 3
C,",(%/
(a) rut depth = 30mm
Fig. 10.3 Aggregate thickness versus subgrade eRR Quasi. Static analysis for case with geotextile)
144
3.5
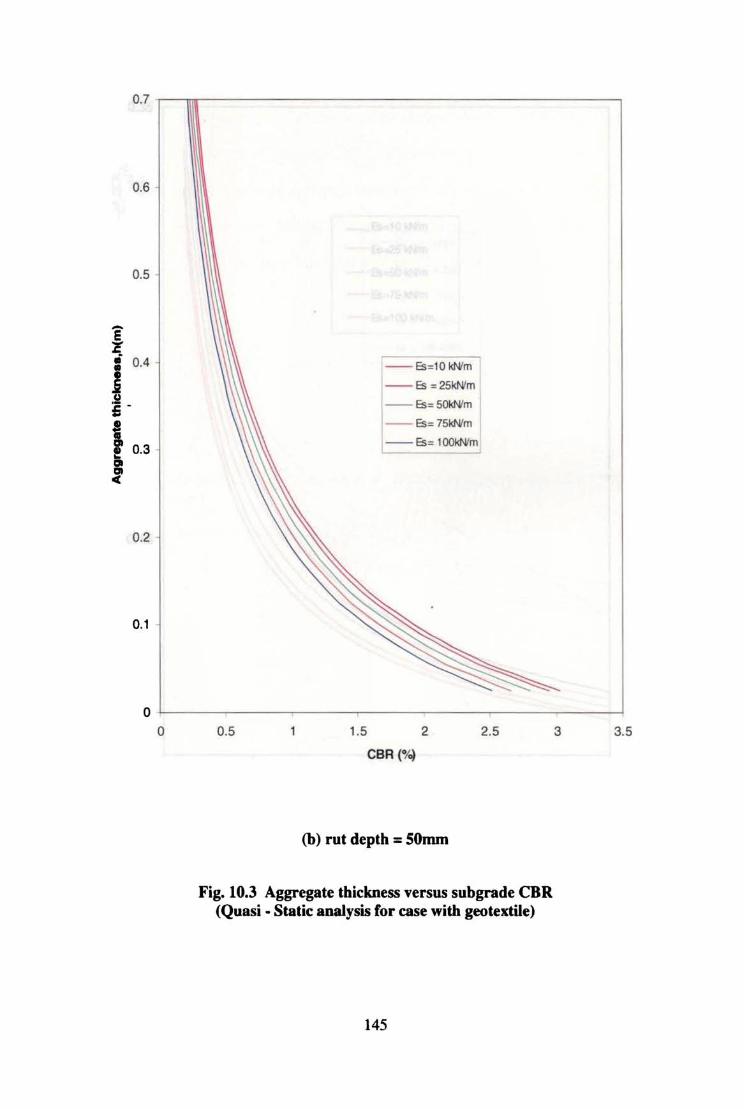
-E
J l! ,; -
t C
0.7
0.6
0.5
0.' - Es=IO kt+'rn ,
-Es:::25~m
- Es=5OI<Wm
- Es=75kWm
0.3 -Es: l()()kfIVm
0.2
0.1
o ~----------------------------------------4 o 0.5 1.5 2 2.5
CBR ("I~
(b) rut depth = sOmm
Fig. 10.3 Aggregate thickness versus subgrade CBR (Quasi. Static analysis (or case with geotextile)
145
3 3.5
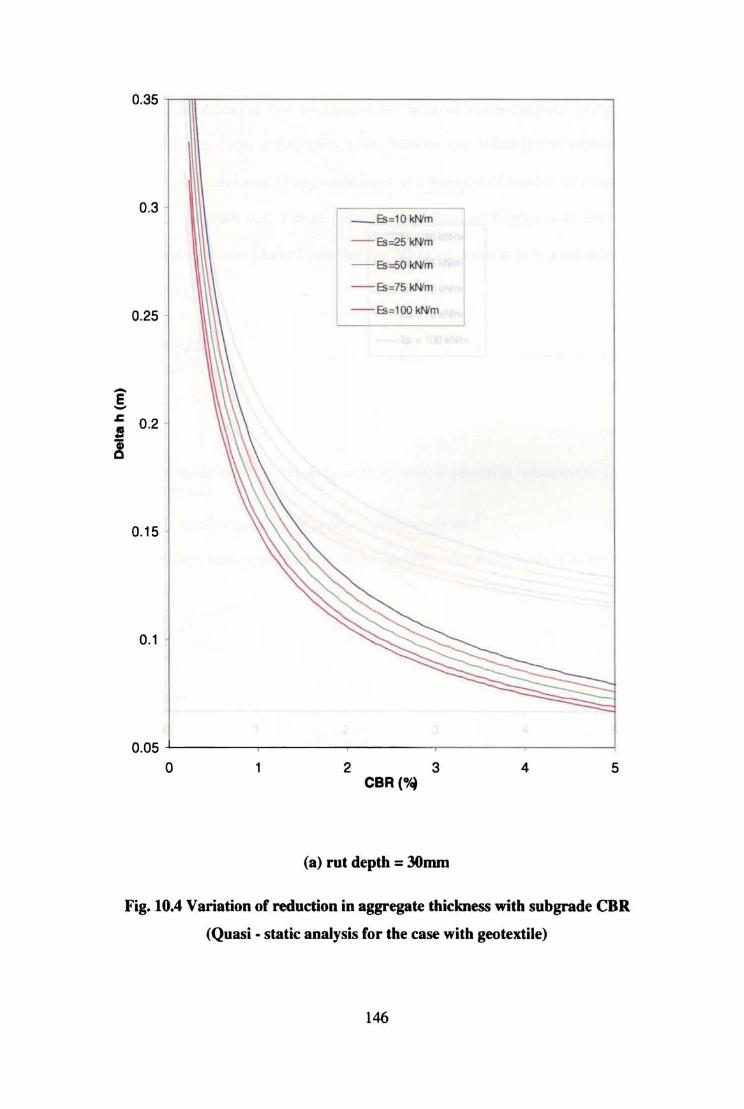
0.35 ,--,.---------------------,
0.3
0.25
_Es:tOkWm
- Es=25kN'm
- Es:50kWm
- Es:z75kWm
- E$ =IOOWm
g ~ 0.2 '
i
0.15
0.1
0.05 L--___ ~---~--_-------~
o 1 2 3 4 5 CBR ("'I
(a) rul deplh = 30nun
Fig. 10.4 Variation or reduclion in aggregate Ihickness wilh subgrade eBR
(Quasi. stalic analysis ror Ihe case wilh geolextile)
146

0.4
0.35
0.3 I -Es: l 0kN'm
- Es :2SkWm
_ fs =50 kN'm
- Es =75 kN'm 0.25
, -Es: l00kN'...:j -e -~ 0.2
i 0.15
0.1
0.05
o ~--------------------------------------~
o 2 3 4 5
caR(%!
(b) rut depth = sOrrun
Fig. 10.4 Variation of reduction in aggregate thickness with subgrade eBR
(Quasi. static analysis (or the case with geotextile)
147
10.2.5 Unpaved Roads without Geotextiles under Traffic Loading (ho'vs. CBR)
Based on the extensive test programme on unpaved roads (without geotextiles)
conducted by the Corps of Engineers., USA, Webster and Alford (1978) established a
chart giving the thickness of aggregate layer as a function of number of passes and
CBR of the subgrade soil. Failure criterion was 75tnm rut depth due to 80kN axle
load. Giroud and Noiray have found that the following equation is in good agreement
with the chart:
O.I91ogNs
CBRo,63
where,
---------------( 10.10)
h' :::: thickness of aggregate layer in m, without geotextile, when traffic is takeninto account, and
N, = number of passes of standard 81.7kN axle load.
This equation is made applicable for other axle loads with the help of the equation
( J3.95
N P._s == _,
Ni ~.
where,
---------------( 10.11 )
N.~ ::::: Number of passages of standard axle load, and
N> number of passages of any other axle load Pi.
The terms log N.~ in the equation 10.11 can be replaced by (log N, - 2.34 (r - 0.075))
for any rut values. Thus the equation is modified as
h i = 0.19~og N s - 2.34(r - .075)}o CBRo.63
148
-------------( 10.12)

Using equation 10.12 chans were prepared for rut depths of 30mm and 50rnm for
different wheel passes ranging from 100 to 1000. which is the expected CVPD for
rural roads. are given in Fig. 10.5 (a) and (b).
1.60 ~, --------------- ------,
1.40
1.20
0.40 '
0.20
0.00 -, ---
o 2 3
' -N:l00
- N :2OQ
N::3OQ
,- N- 500
-N= l000 ,
4 5 6
CBRr/~
(a) rut depth = 30mm
7 8 9
Fig. 10.5 Aggregate thickness ho' vs. subgrade eBR (Case without geotextile when traffic is taken into account)
149
10

-s , ~ ,;
I . ~ ~
1.80 r'----------------------------------
1.80
1.40
1.20
1.00 1 I ~:~: I N:::I300
- N::SOO
-N::l000 , 0.80
0.80
040 I 0.20
0.00 '----
o 1 2 3 4 5 6 7 a 9 CBR (%I
(b) rut depth = SOmm
Fig. 10.5 Aggregate thickness h, 'vs. subgrade CRR (Case without geotextile when traflic is taken into account)
L50
10
10.2.6 Design Procedure
Now making use of the design curves drawn separately, for aggregate thickness
required for unreinforced condition with different wheel passes (Fig. 1 0.5) and the
reduction in thickness obtained due to reinforced condition (Fig. 10.4), the required
thickness of the aggregate layer can be arrived at as per the f()l1owing design steps.
Step 1. Determine the aggregate thickness (h()'} for the base course (Unreinforced
condition) taking traffic into account (in tenns of wheel passes) from Fig. 10.5
(ho' vs. CBR)
Step 2. Determine the reduction in aggregate thickness (tJh) resulting from the use of
coir geotextiles by quasi static analysis from Fig. 10.4 ( !Jh vs. CBR)
Step 3. The required thickness of aggregate in base course for the reinforced condition
is obtained as
h' = ho' - LJh ---------------( 1 0.13)
10.2.7 Design Example
Given 500 passages of 81.7 kN (Standard axle load) single axle load vehicles, at a
tyre pressure of 480 kPa and the allowable rut depth of 0.05m, what is the required
aggregate thickness ofthe unpaved road, if reinforced with
a) Coir geotextile (H2M8) with Es = 64kN/m
b) Coir geotextile (H2M6) with Es = lSkN/m.
Take CBR of subgrade soil as a) 2% and b) 1 %
151
Solution:
Case (a): H2M8 coir geotextile reinforcement
From Fig. 10.5 (b), for N= 500 and CBR = 2%,
and for N = 500 and CBR = 1%,
11(/ = 0.330m
hI)' = O.5IOm
Similarly from Fig. lOA (b) corresponding to Es value of64kN/m and for CBR = 2%,
I1h = 0.I2m
and for CBR = 1 %, I1h = 0.20m.
Therefore aggregate thickness, h' = ho' - LJh
= 0.330 - 0.12 = O.21m for CBR = 2% and
= 0.510 - 0.20 = O.31m for CBR = 1 %
Hence the % saving in aggregate thickness
= 0.12/0.330 x lOO = 36% for CBR = 2% and
= 0.21 0.510 x 100 = 39.2% for CBR = 1%
Case (b): H2M6 coir geotextile reinforcement
From Fig. 1 0.5 (b) for N= 500 and CBR = 2%, ho' = 0.33m
for N = 500 and CBR = 1 %, ho'= 0.51m
Similarly from Fig. 1 O.4(b) corresponding to Es value of 15kN/m and for CBR = 2%,
t1h = 0.1 Om and for CBR = 1 %, I1h = 0.16m.
152

:.h ' = ha' - L1h
= 0.331 - 0.101 = 0.23m for CBR = 2% and
= 0.510 - 0.16 = 0.350m for CBR = 1%
The % saving in aggregate thickness
= 0.1001 0.330 x 100 = 30.5 % for CBR = 2% and
=0.16/0.510x 100=31.4% forCBR= 1%
Discussion: It could be seen from the design values, agb'Tegate thickness is reduced
by about 30% due to the placement of coir geotextiles. Again it was observed that the
saving would be more in the case of poor subgrade soils. The H2M8 type geotextiles
gave more saving in base course thickness compared to H2M6 coir geotextiles.
10.3 IRe METHOD
10.3.1 General
The Indian Roads Congress first brought out a guideline for designing flexible
pavements in 1970, which was based on empirical method, \vhere the thickness of the
pavement was read against the CBR value of the subgrade soil from the design charts.
The guidelines were revised in 1984, where traffic \vas expressed in terms of
cumulative standard axle loads. The present design method (IRe: 37 - 2001) is based
on the mechanistic pavement design principles, which are evolved from theoretical,
laboratory and road performance studies. Design curves and plates are made available
corresponding to the CBR of the soil and the traffic conditions (Fig. 1 0.6). For the
design of rural roads, the design charts are prepared for low traffIC volumes (Fig.l 0.7)
153
E E ..,: z
0
'0 0
10 °v ./
~ 60 °v 0.. u. o /
L,..---
~
~ .......--
~
~ to- -l----" ~
L----I-'
~ L..--- I--.---- --..--- ,---.,-
--- f-- -o~ ~ r---: ~ % ~ f-- -~ C--10-
lOO ~ ~ ~
V
400
100 1 l " S
, DESIGN TRAFFIC, msa
(a) Traffic 1 - 10 msa
lOO 0
()
/ V--90
0 L-----
/ ~
L..-----L/
,..",-- ---~ ~
l.--~ ~ L--~ -
500
V ~ t:::::=== ~ V r:;.......------"
400 JO 20 )0 5 o 100
DESIGN TRAFPIC, msa
(b) Traffic 10 - 150 msa
C8Rn
eRR :114 -IC8R4~ - CBR~ --CBR - CBR~ --- CBR",_ -- CBR"" -- CBfIII t'"'' -
,
• , '0
CBR2%
CBR4'!1o
CBR5~
CBR~
CBR6'!!.
CBRQ'lft CBR10%
-- _.
150
Fig. 10.6 Pavement thickness design chart (IRC: 37 - 2001)
154
CBR (Par Cenl)
4 5 6 7 8 9 10 15 20 100 o
r l I [ 0 ' , ~ I
~ ~ --r~·--r- I
0 ! \ I i !
0 ~~ ~ ~ ~ ~~ ~
, ! 1 ,/ ~ " ~~ Traffic Classification
~ " Curve No. of Commercia:
V ~
~ ~ Vehicles per day I-r- -
/ /' V V / A 0 15
/'/. ~ '/ S 15 . 45 C 45 150 0 150 - 450
By! V
10
20
500
(.;
V ---
r I 700
800
Fig. 10.7 Design curves for rural roads (Rural Roads I\lanual)
10.3.2 Design Steps
In order to design the roads reinforced with coir geotextiles, which are being placed at
sub grade - sub base interface, the CBR of the subbrrade soil is determined first. Then
the properties of the available coir geotextiles were evaluated_ The modified values of
CBR due to the provision of coir geotextiles arc calculated from the regression
equations developed in the present study (section 7.4). The thickness is read from the
graphs given in IRC: 37 or Rural Roads Manual.
10.3.3 Design Examples
10.3.3.1 As per IRe: 37·2001
Design the pavement for construction of a new by pass with the following data:
155

Two lane single carriage way
Initial traffic in the year of completion of construction = 400CVPD
Traffic growth rate per annum = 7.5%
Design life = 15 years
Vehicle damage factor = 2.5
Design CBR of subgrade soil == 2%
Type of coir geotextile available = Woven (H2M8 and H2M6) and
NW (AGL C!201)
Design:
Distribution factor = 0.75 (Para 3.3.5 IRC: 37-200 I), for two lane single carriage way
Cumulative number of Standard axles to be catered
N = 365((1+rl-l) Ax Fx L / r
Where,
n = Design life,
r == Traffic growth rate,
A = Present traffic,
F = Vehicle damage factor, and
L = Lane distribution factor
N = {365 x [(1+ 0.075)15_ 1]! 0.075 } x{ 400 x 0.75 x 2.5)= 7200000
= 7.2 rosa
156

Assuming coir geotextiles are placed at 1,4 sub grade thickness,
according to equation 7.3 modified CBR is expressed as
CBRM = 0.550 + 1.249 CBR - 0.363 D + 0.156 0:5
With H2M8 coir geotextile, 0 =3.125cm Us = 17.8kN/m
CBRM = 0.550 + (1.249 x 2) - (0.363 x 3.125) + 0.156 x 17.8
= 4.69 %
With H2M6 coir geotextile, D =3.125cm and Us = 5.0kN/m
CBRM = 0.550 + (1.249 x 2) - (0.363 x 3.125) + 0.156 x 5
=2.7%
With NW coir geotextile
CBRM = 1.036 + (1.025 x 2) - (0.215 x 3.125)
=2.4%
The values of total pavement thickness obtained from Fig. 10.6 (a) for unreinforced
and reinforced cases are as follows:
h = 815mm (without geotextile)
= 625mm (with H2M8 coir geotextile)
= 750mm (with H2M6 coir geotextile)
= 765mm (with NW coir geotextile)
157
10.3.3.2 As per Rural Roads Manual
A rural road pavement is to be designed for a subgrade CBR of 2% with an initial
traffic of 30 commercial vehicles per day in both directions, with a growth rate of 6%
per annum for a location having annual rainfall of 1200mm. The design life is 10
years. Detennine the thickness of the pavement required if the sub grade is reinforced
with i) woven H2M8 ii) woven H2M6 and iii) Non ~ woven AGL C120l.
Solution:
Initial traffic in both directions = 30 CVPD
Design Traffic = 30 x (l + 0.06)10 (section 5.2.4 IRC:SP: 20~2()02)
= 54 CVPD
For the modified eBR corresponding to original CBR of 2% as obtained in the
previous section, using curve C (corresponding to 45 -150 CVPD) of Fig.lO.7, the
pavement thickness using different coir geotextiles are as follows:
Designed pavement crust thickness = 590mm (without geotextile)
= 350mm (with H2M8 coir geotextile)
= 480mm (with H2M6 cOlr geotextilc)
= 540mm (with NW coir geotextile)
10.3.3.3 Discussion
In the design using IRC: 37 the allowable rut depth is considered as 30mm. It could
be seen from the design example that when H2M8 coir geotextile is used as
158
reinforcement within the subgrade soil at H/4 depth from the top, (CBR = 2%, 400
CVPD) the thickness of pavement can be reduced to 625mm instead of 815mm. This
amounts to 24% saving in thickness of aggregates. The corresponding savings when
H2M6 and non-woven were used are 8% and 6% respectively. which are also
considerable. But, it would be more advantageous in the case of low volume roads ie.
as seen from the example given in Section 10.3.3.2 in which the traffic is 30 CVPD
and CBR is 2%, the saving when H2M8 reinforcement used is 40% whereas it is only
19% and 9% respectively for H2M6 and Non-woven. Further, it can be concluded that
though IRC: 37 - 2001 permits only subgrades with a minimum CBR of 2%, we
could easily enhance the CBR value of weaker subgrades by the provision of coir
geotextiles. In the case of rural roads, the percentage reduction in thickness seems to
be more. With H2M8 coir geotextile the saving in thickness is 41 % whereas for
H2M6 it is only 19%.
10.4 US ARMY METHOD
10.4.1 General
This method involves the determination of CBR in the laboratory on soil - aggregate
system to model the pavement as described in section 7.3. The aggregate thickness is
calculated from the equation
{ P A )0.5
h = (3.2410gC +2.21 ---36CBR 2030
---------------10.14
where,
h = aggregate thickness in mm,
159

C =traffic in terms of coverage..
p= ESWL. and
A =tyre contact area in mm'.
For equation 10.13 design curves were drawn as given in Fig. 10.8.
10.4.2 Design Steps
With the available coir geotextiles placed in between subgrade soil and aggregate
layer.. eBR of the soil - aggregate system was determined as described in section7.4.
From the observations. it was concluded that the modified CBR in the soaked
condition for the soil-aggregate system is approximately 35% more than the CBR of
the soil and hence the determination of CBR of the soil-aggregate system can be
eliminated. For the modified CBR obtained. the thickness of the pavement can be
directly read from the graph (Fig 10.8).
450 --
400
350 ~
e 300E';250•! 200~u:c 150 t-
100
50 --1
o 0--_-
=
109B32 4 5 6 7
Modified CBR (~
Fig.IO.8 Design curves using US Anny method
1
160
10.4.3 Design Example
Using the US Anny Corps of engineers modified CBR design method, calculate the
required stone base thickness for an un paved road canying 500 coverages of 45kN
ESWL using a tyre contact area 450mm x 300mm for
a. Subgrade soil with soaked CBR = 1 % with no geotextile reinforcement and
b. The same condition but with a coir geotextile.
Solution:
From Fig.1 0.8, for CBR = 1 %
The thickness of the unpaved road section without reinforcement = 360mm
Modified CBR = Ix 1.35 = 1.35%
The thickness corresponding to modified CBR = 320mm
Thus saving in thickness of 40mm can be obtained.
10.5 SUMMARY
By making use of the design curves prepared, the thickness of the unpaved roads can
be easily found out. Also, the type of coir geotextiles can be selected based on the
type of soil. In general, it was found that by using coir geotextiles the aggregate
thickness can be reduced and the reduction depends upon the quality of coir
geotextile, properties of soil and placement depth of the reinforcement.
161
CHAPTER 11
PREFABRICATED COIR GEOTEXTILE
VERTICAL DRAINS
11.1 INTRODUCTION
Construction of unpaved roads in rural areas in many of the cases are accomplished
by forming embankments along the banks of the paddy fields or swampy areas and
hence the construction of roads and embankments arc so closely interconnected that
one may not be able to visualise the two constructions independently. One of the
major difficulties in these constructions is the presence of saturated soft clay and only
very poor soil will be available for construction and hence some sort of ground
improvement techniques should be resorted to facilitate speedy and uniform
stabilisation of the soft soil.
Of the various methods of ground improvement techniques available, pre-Ioading is
the most successful one. The main disadvantage of this method is that, the time
required for consolidation is very long and also the surcharge load required is
significantly high. In many cases to pace with the speed of construction activities pre -
loading may not be always a viable solution. In such cases, the presence of vertical
drain can greatly reduce the pre - loading period. Installation of vertical drains results
in the reduction of the length of drainage path in radial direction.
Since it is obvious that the coefficient of consolidation in the horizontal direction is
much higher than that in the vertical direction, and that the vertical drains reduce the
drainage path considerably in the radial direction, the effectiveness of vertical drains
in accelerating the rate of consolidation and improving the strength of soft soil is
remarkably improved. In this chapter, the discussion on the use of coir geotextiles in
accelerating the consolidation process, by way of prefabricated vertical drains are
intended, utilising the drainage and filtration functions of coir geotextile.
The main reason for using the prefabricated vertical drain is its ability to reach the
desired degree of consolidation within a specified time period in which both radial
and vertical consolidation will be considered in calculati ng the settlement. Most of the
prefabricated vertical drains used for ground improvement applications arc of
polymeric type. These are costly and not eco- hiendly also. Thc main disadvantage of
polymeric type of drains is that its capacity may be effectively surplus to the
requirements. In such situations, deliberate and desibTfled use of geosynthetic, which
has a predictable reduction in capacity with time, is a good engineering solution. With
increasing environmental awareness and sustainability, along with high cost of
petroleum products, developing countries lead to investigations of substitutes for
polymeric materials, using natural products.
In the present study two types of prefabricated vertical drains using coir geotextiles
were developed and their effectiveness were studied by conducting experiments as
detailed in the following section.
11.2 APPLICATION OF VERTICAL DRAINS
Vertical drains are artificially created drainage paths which can be installed by one of
the several methods and which can have a variety of physical characteristics. The use
of vertical drains along with pre - compression has the sole purpose of shortening the
drainage path of the pore water, thereby accelerating the rate of primary
163
consolidation. When used in conjunction with pre - compn:SS10I1, the principal
benefits of a vertical drain system are:
• To decrease the overall time required for completion of primary consolidation due to pre - loading.
• To decrease the amount of surcharge required to achieve the desired amount of pre compression in the given time.
• To increase the rate of strength gain due to consolidation of soft soils where stability is of concern
The following characteristics of prefabricated vertical drain (PVO) should be
considered during the design and construction.
• Ability to be installed vertically into compressihk subsurface soil strata under field conditions,
• Ability to permit pore water in the soil to seep into the drain,
• A means by which the collected pore water can be transmitted up and down the length of the drain
The use of PVDs has largely replaced the vertical sand drains for many applications.
The important advantages are economic competitiveness, less disturbance and the
speed and simplicity of installation.
11.3 PREPARATION OF COIR GEOTEXTILE DRAINS
Two types of coir geotextile drains were developed in the present research work. One
is of circular type and the other is of rectangular type. The circular drains \vere made
by wrapping the coir geotextiles twice over 50.8 mm diameter rigid PVC pipes. To
keep the geotextiles in position, it is tied by binding wires at 200 mm to 250 mm
intervals. For easy penetration of these drains a perforated metallic cone was made.
164
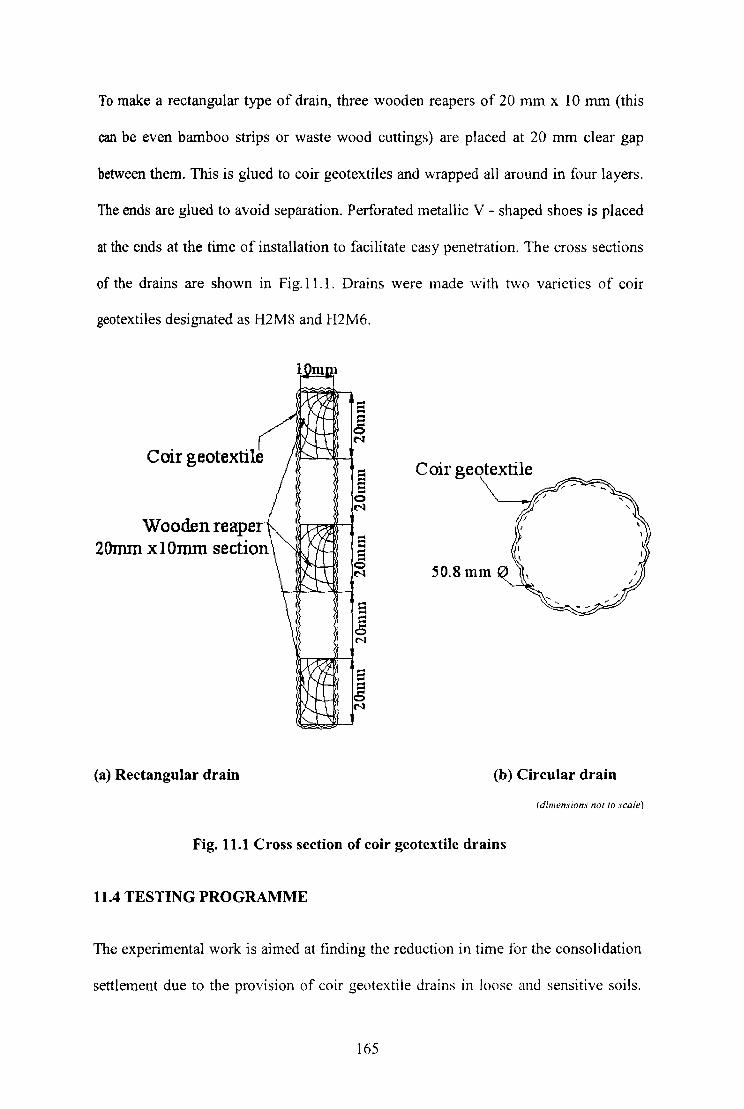
To make a rectangular type of drain, three wooden reapers of 20 mm x 10 mm (this
can be even bamboo strips or waste wood cuttings) are placed at 20 mm clear gap
between them. This is glued to coir geotextiles and wrapped all around in four layers.
The ends are glued to avoid separation. Perforated metallic V - shaped shoes is placed
at the ends at the time of installation to facilitate easy penetration. The cross sections
of the drains are shown in Fig.Il.l. Drains were made with two varieties of coir
geotextiles designated as H2M8 and H2M6.
Coir geotextile
Wooden reape 20mm xl Omm section
(a) Rectangular drain
5 e o M
E 6 o N
... == 6 o
N
e 6 o
M
C oir geotextile
50.8mm
(b) Circular drain
(dimensions not to scale)
Fig. 11.1 Cross section of coir geotextile drains
11.4 TESTING PROGRAMME
The experimental work is aimed at finding the reduction in time for the consolidation
settlement due to the provision of coir geotcxtile drains in loose and sensitive soils.
165
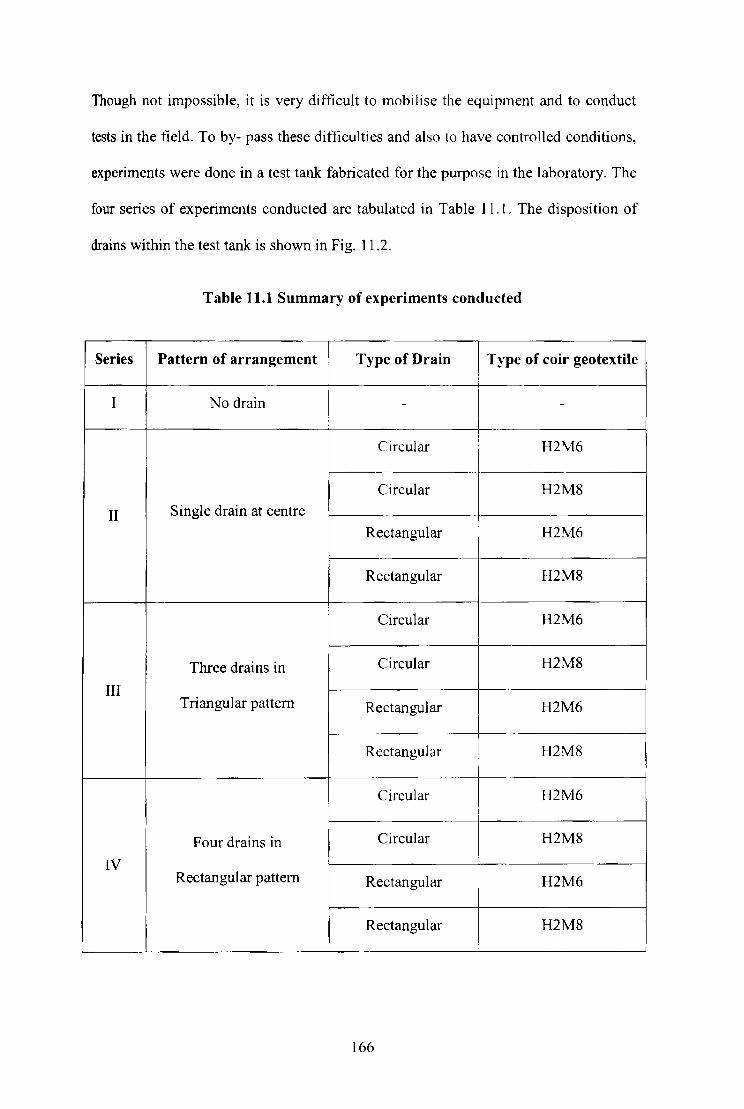
Though not impossible, it is very difficult to mobilise the equipment and to conduct
tests in the field. To by- pass these difficulties and also to have controlled conditions,
experiments were done in a test tank fabricated for the purpose in the laboratory. The
four series of experiments conducted are tabulated in Table I 1.1. The disposition of
drains within the test tank is shown in Fig. 11.2.
Table 11.1 Summary of experiments conducted
Series Pattern of arrangement Type of Drain I Type of coir geotextile ,
I No drain ~--1- -
Circular i
H2M6 ,
Circular H2M8
11 Single drain at centre
Rectangular H2M6
Rectangular H2M8
Circular H2M6
Three drains in Circular H2M8
III Triangular pattern Rectangular H2M6
Rectangular i
H2M8
Circular H2M6 I
Four drains in Circular H2M8
IV Rectangular pattern Rectangular H2M6
Rectangular H2M8
166
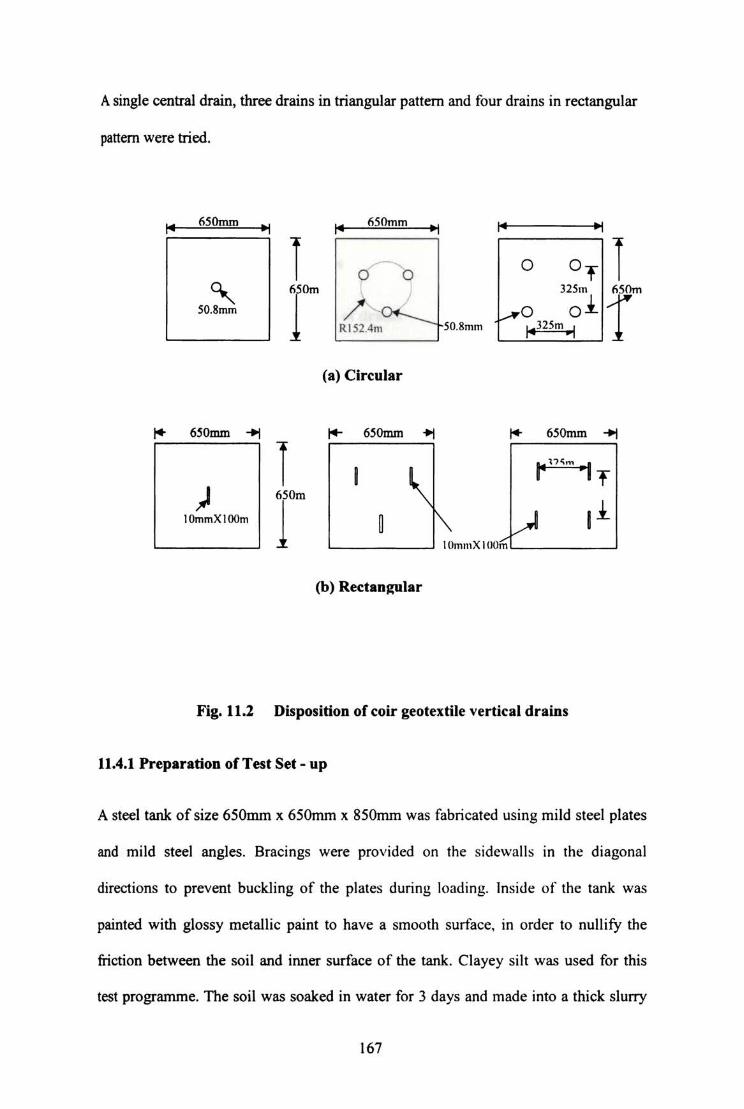
A single central drain, three drains in triangular pattern and four drains in rectangular
panem were tried.
1111 650mm
~ I 1111 1l5Omm
~I 1111 ~I
i 0 0 0 ° T i " r 32Sm 650m
/,,-0.- ".,0 0 1 f SO.8mm
R152.4m -- 50.8mm 11II325m .1
(a) Circular
i+ 650mm -+i !+- 650mm ~ i+ 650mm -+i
i r "'- 1 . T ) MOm
1 11 lOmmXl00m ~ 10mmX1UOfn
(b) Rectangular
Fig. 11.2 Disposition of coir geotextile vertical drains
11.4.1 Preparation of Test Set· up
A steel tank of size 650mm x 650mm x 850mm was fabricated using mild steel plates
and mild steel angles. Bracings were provided on the sidewalls in the diagonal
directions to prevent buckling of the plates during loading. Inside of the tank was
painted with glossy metallic paint to have a smooth surface, in order to nullify the
thclian between the soil and inner surface of the tank. Clayey silt was used for this
test programme. The soil was soaked in water for 3 days and made into a thick sluny
167
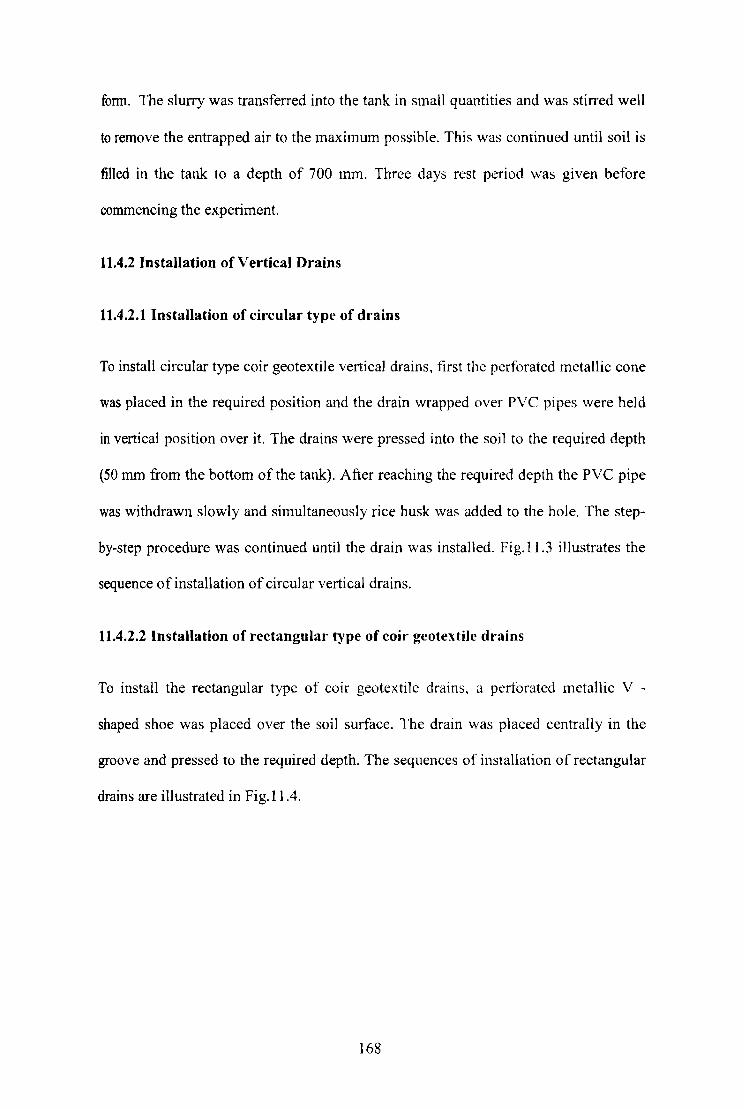
form. The slurry was transferred into the tank in small quantities and was stirred well
to remove the entrapped air to the maximum possible. This was continued until soil is
filled in the tank to a depth of 700 mm. Three days rest period was given before
commencing the experiment.
11.4.2 Installation of Vertical Drains
11.4.2.1 Installation of circular type of drains
To install circular type coir geotextile vertical drains, first the perforated metallic cone
was placed in the required position and the drain wrapped over PVC pipes were held
in vertical position over it. The drains were pressed into the soil to the required depth
(50 mm from the bottom of the tank). After reaching the required depth the PVC pipe
was withdrawn slowly and simultaneously rice husk was added to the hole. The step
by-step procedure was continued until the drain was installed. Fig.l1.3 illustrates the
sequence of installation of circular vertical drains.
11.4.2.2 Installation of rectangular type of coir' gcotextile drains
To install the rectangular type of coir geotextile drains, a perforated metallic V -
shaped shoe was placed over the soil surface. The drain was placed centrally in the
groove and pressed to the required depth. The sequences of installation of rectangular
drains are illustrated in Fig.llA.
168
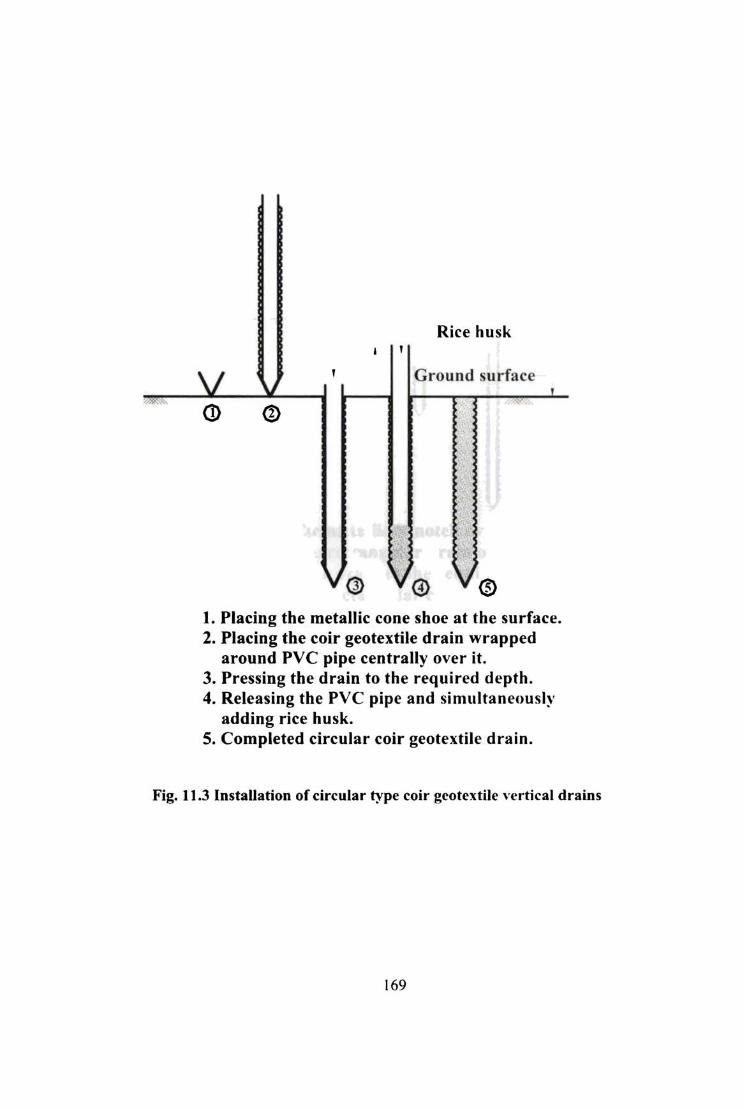
= .•
Rice husk
v Ground surface
CD
I. Placing the metallic cone shoe at the surface. 2. Placing the coir geotextile drain wrapped
around PVC pipe centrally over it. 3. Pressing the drain to the required depth . 4. Releasing the PVC pipe and simllltaneousl~'
adding rice husk. S. Completed circular coir geotextile drain .
Fig. 11.3 Installation of circular type coir geotcxtile vertical drains
169
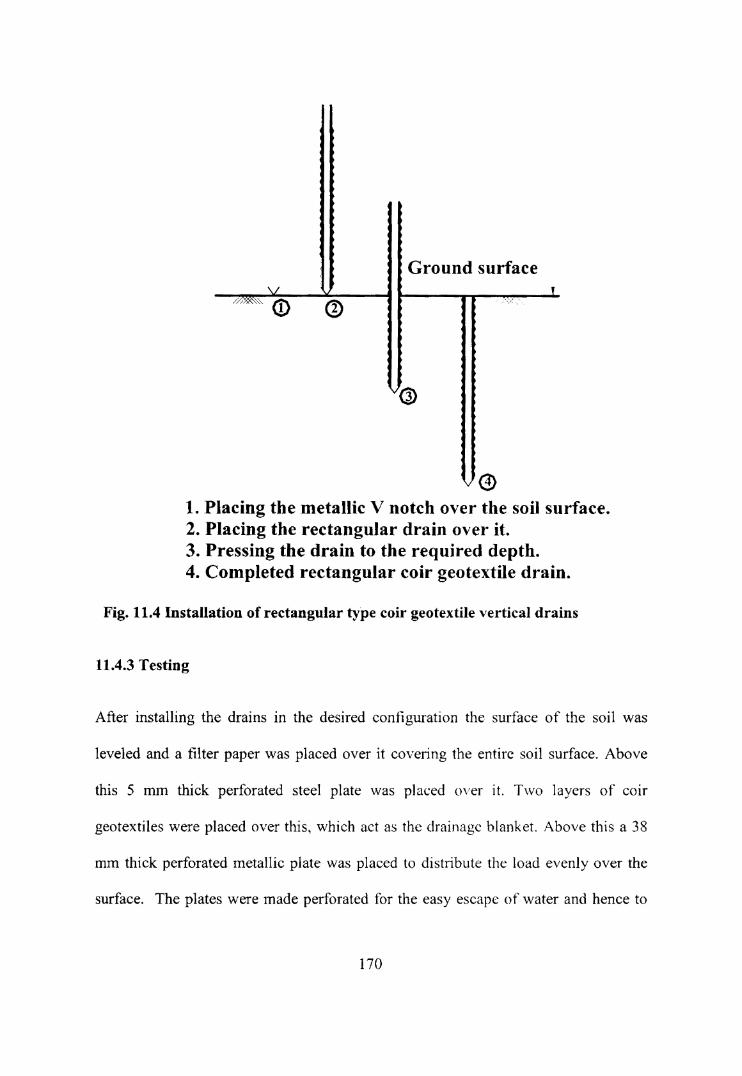
vGround surface ,
e1. Placing the metallic V notch over the soil surface.2. Placing the rectangular drain over it.3. Pressing the drain to the required depth.4. Completed rectangular coir geotextile drain.
Fig. 11.4 Installation of rectangular type coir geotextile vertical drains
11.4.3 Testing
After installing the drains in the desired configuration the surface of the soil was
leveled and a filter paper was placed over it covering the entire soil surface. Above
this 5 mm thick perforated steel plate was placed over it. Two layers of coir
geotextiles were placed over this, which act as the drainage blanket. Above this a 38
mm thick perforated metallic plate was placed to distribute the load evenly over the
surface. The plates were made perforated for the easy escape of water and hence to
170

avoid building up of pore water pressure. Additional load was placed on the top of the
steel plates by putting mild structural steel sections. The details of test set-up are
shown in Fig.11.5. The tests were performed under a pressure of 10 kPa. for which a
total load of 3.60 kN was applied. The loading was done with the help of a tripod and
a differential pulley arrangement.
Loading arrangement
LVDT
Perforated steel plate 38 mm tbick
Coir geotextile
Perforated steel plate 5 mm tbick
paper
I--(: oitr geotextile drain
- Rice husk
Soil
Mild steel tank 650 mm x 650 mm x 850 mm
Fig. II.S Schematic test set - up for vertical drain
The settlement measurements were taken with the help of four digital displacement
sensors having sensitivity of 0.01 mm and the average va lue is recorded. Settlements
were taken at varying time intervals until the settlement is nearly constant.
Photographs showing testing sequences are given in Fig.ll.6.
\7\
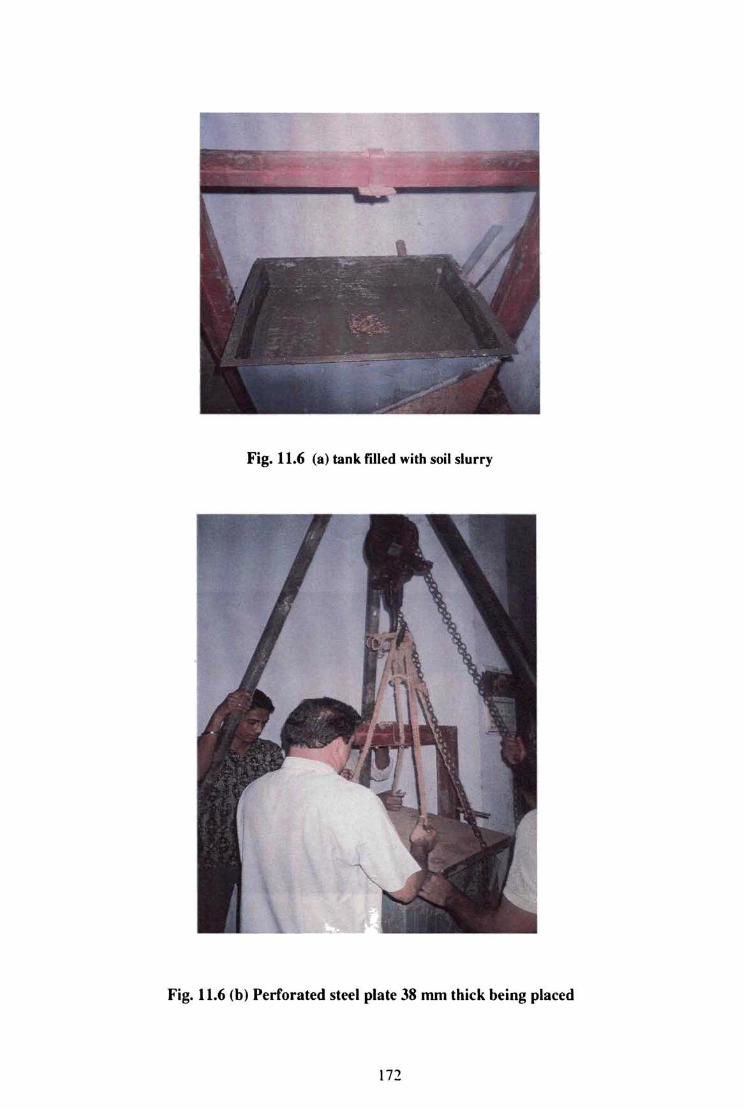
Fig. 11.6 (8) tank filled with soil slurry
Fig. 11.6 (b) Perforated steel plate 38 mm thick being placed
172

Fig. 11.6 (e) Set· up is ready Cor taking readings
Fig. 11.6 (d) Noting down the readings
Fig. 11.6 Sequence of testing programme
17.1

11.5 RESULTS AND DISCUSSION
The behaviour of two types vertical coir geotextile drains made of two varieties of
woven coir geotextiles in different configurations in reducing the time of settlement
were studied. Thirteen experiments were conducted and plimary consolidation
settlement measurements were taken under an applied pressure of IOkPa.The
performance obtained with the provision of coir drains in tenns of percentage increase
in settlement and percentage reduction in time for a settlement of IOmm is
summarised in Table 11.2.
11.5.1 Type of Drain
Two types of drains were considered, one is of circular cross section and the other is
of rectangular cross section. For the circular type the central core pipe is withdrawn
during installation whereas in the case of rectangular drains the full section is driven
and kept as such in the soft ground. Fig.Il.7 shows the comparison of the time
settlement behaviour for single drain (made of H2M8 and H2M6 coir geotextiles) at
centre. Here it is seen that the drain with circular cross section is perfonning better.
Similar trend was observed for other dispositions viz., three drains in triangular
pattern and four drains in rectangular pattern (Fig.ll.S and Fig.ll.9). This may he due
to the fact that the effective area of drain is 50 % more in the case of circular drains
compared to rectangular drains. The percentage increase in settlement after 48 hours
for the circular drains when compared to rectangular drains is 25 to 55%. Another
reason which favours the circular type may be that the drain was filled with rice husk
which is a free draining material. Again, while making rectangular drains, four wraps
were made to get a stable workable drain whereas, two windings only were required
174

in the case of circular drains to get a self-supporting drain. This was possible because
rice husk was added while PVC pipe was withdrawn.
Table 11.2 Performance comparison of drains in terms of settlement and time
% Increase in % Increase in % Reduction in Expt
Description settlement in settlement in time for 10 mm .No.
24 hours 48 hours settlement
1 Soil without drain - - -
2 Circular drain (H2MS)- 64.77 72.73 70.23 I at centre
3 Circular drain (H2M6)- 64.77 6S.18 67.44 1 at centre
4 Circular drain (H2MS)- 112.5 122.73 81.86 3 Nos. - Triangular pattern
5 Circular drain (H2M6)- 64.77 I n.ls i
71.63 3 Nos. - Triangular pattern
I 6 Circular drain (H2MS)- 76.14 I sun 74.42
4 Nos. - Rectangular pattern
7 Circular drain (H2M6)- 64.77 68.18 66.51 4 Nos. - Rectangular pattern
S Rectangular drain (H2MS)- 23.86 21.82 43.26 1 at centre
9 Rectangular drain (H2M6)- 21.59 17.27 43.72 1 at centre
10 Rectangular drain (H2MS)- 50.00 45.45 69.77 3 Nos. - Triangular pattern
11 Rectangular drain (H2M6)- 40.91 34.54 61.S6 3 Nos. - Triangular pattern
12 Rectangular drain (H2M8)- 42.05 I 38.18 62.33 4 Nos. - Rectangular pattern I
13 Rectangular drain (H2M6)- 40.91 T-34.54 . I 55.81 4 Nos. - Rectangular pattern I I
175
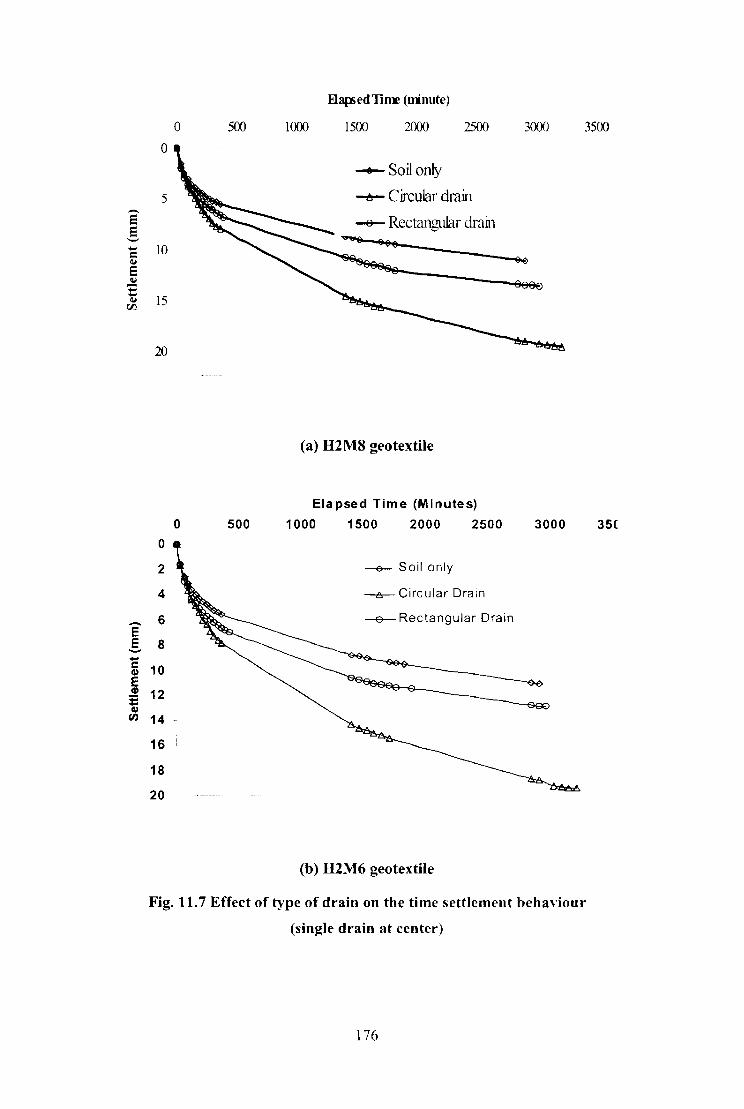
--E e --..... c <11
E ~ ..... .....
<11 IJJ
-E E --c Q)
E Cl)
'E Cl)
Cl)
ElapsedTInr (minute)
0 500 1000 1500 2000 2500 3000 3500
0
~Soilonly
5 -&- Circular drain
~ Rectangular drain
10 ~
15
20
(a) H2M8 geotextile
Elapsed Time (Minutes)
0 500 1000 1500 2000 2500 3000 0
2 ~Soil only
4 -fr- Circular Drain
6 -e-- Rectangular Drain
8
10
12
14
16
18
20
(b) H2M6 geotextile
Fig. 11.7 Effect of type of drain on the time settlement hehaviour
(single drain at center)
176
3S(
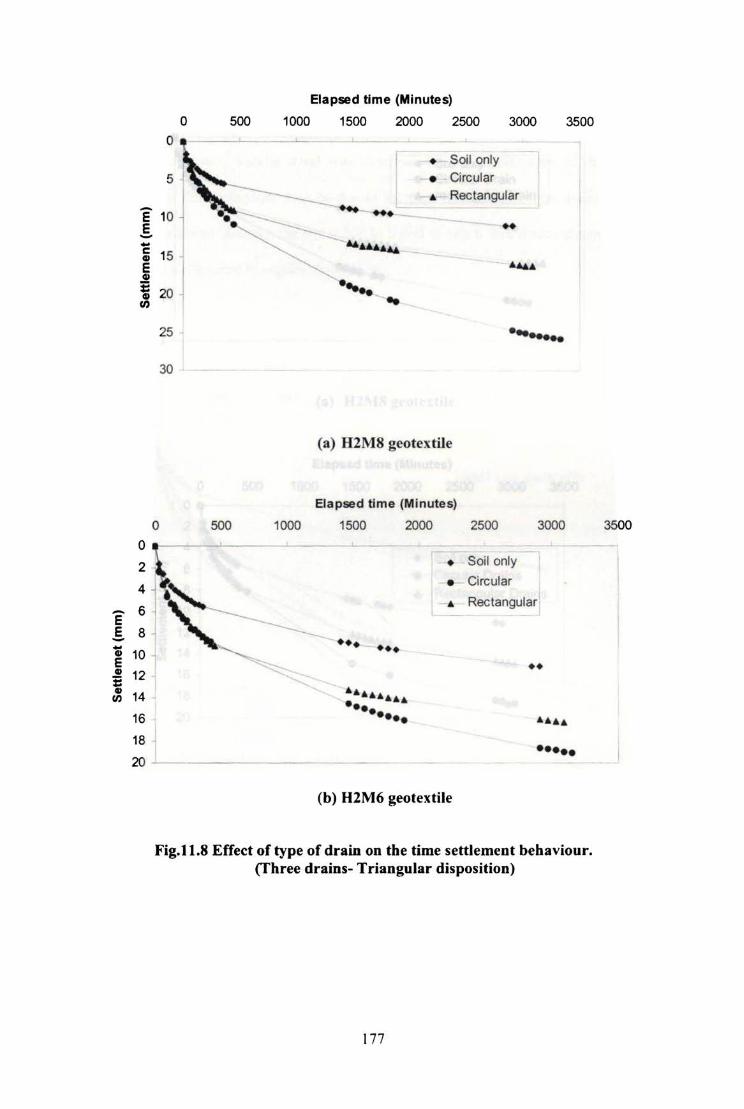
Elapsed time (M inutes)
0 500 1000 1500 2000 2500 3000 3500
0
• Soil only
• Circular
• Rectangular
E ---E .. -- ........ 0 15 • E . ... ~ 20 .... • .. '"
25 .--30
(a) II2M8 gcotcxti le
Elapsed time (Minutes)
o 500 1000 1500 2000 2500 3000
• Soil only ~\ I : j '\-------G 10 E
•••
• Circular
• Rectangular
• •• .! 12 i '" 14
16
18
'" ••••• -.. ••••• (b) H2M6 geotextile
••
•••• •••••
Fig.lt.S Effect of type of drain on the time settlement bebaviour. (fhree drains- Triangular disposition)
177
3500
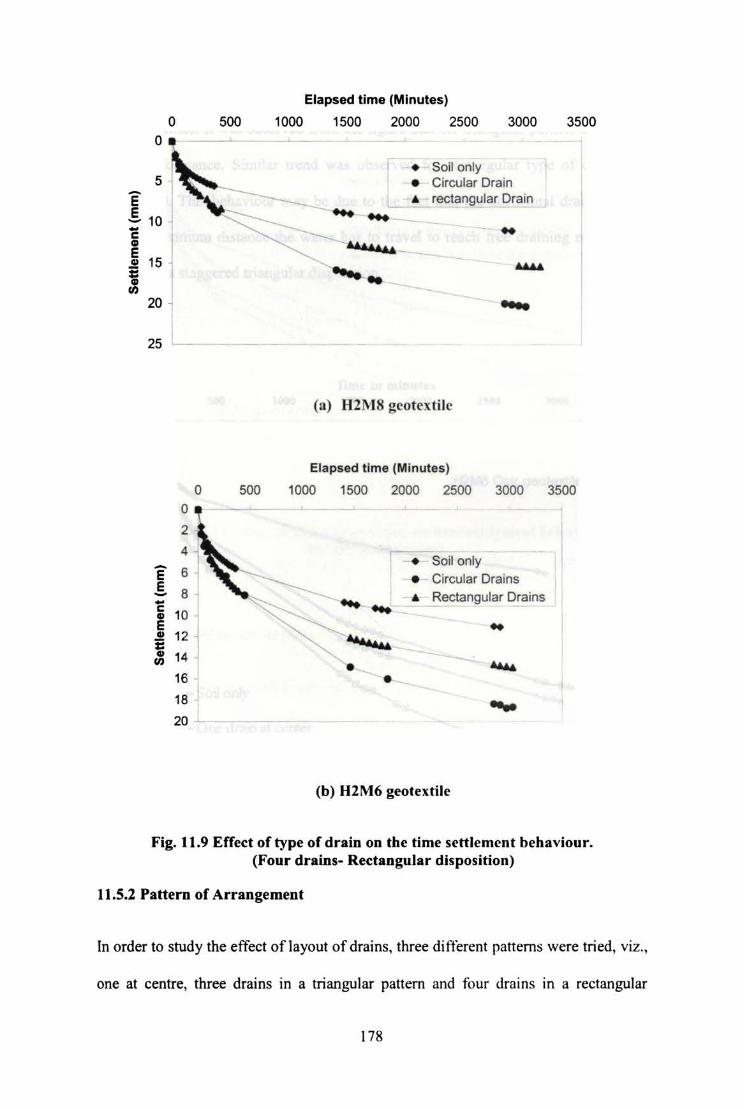
o
25 ~
o
E E -~ c 10
1 • E i 12
• 1. '" 16
18
20
500
Elapsed time (Minutes)
1000 1500 2000 2500 3000
• Soil only • Circular Drain
,-- . rectangu lar Drain
3500
~ ... ....... ~ .. -
(a) H2M8 gco t.x,ilc
Elapsed time (Minutes)
500 1000 1500 2000 2500 3000 3500
-. Soil only
• Circular Drains
• Rectangular Drains .. • -• -
(b) H2M6 g.ot.xti l.
Fig. 11.9 Effect of type of drain OD the time settlement behaviour. (Four drains· Rectangular disposition)
11 .5.2 Patter n of Arrangement
In order to study the effect of layout of drains, three different patterns were tried, viz. ,
one at centre, three drains in a triangular pattern and four drains in a rectangular
178
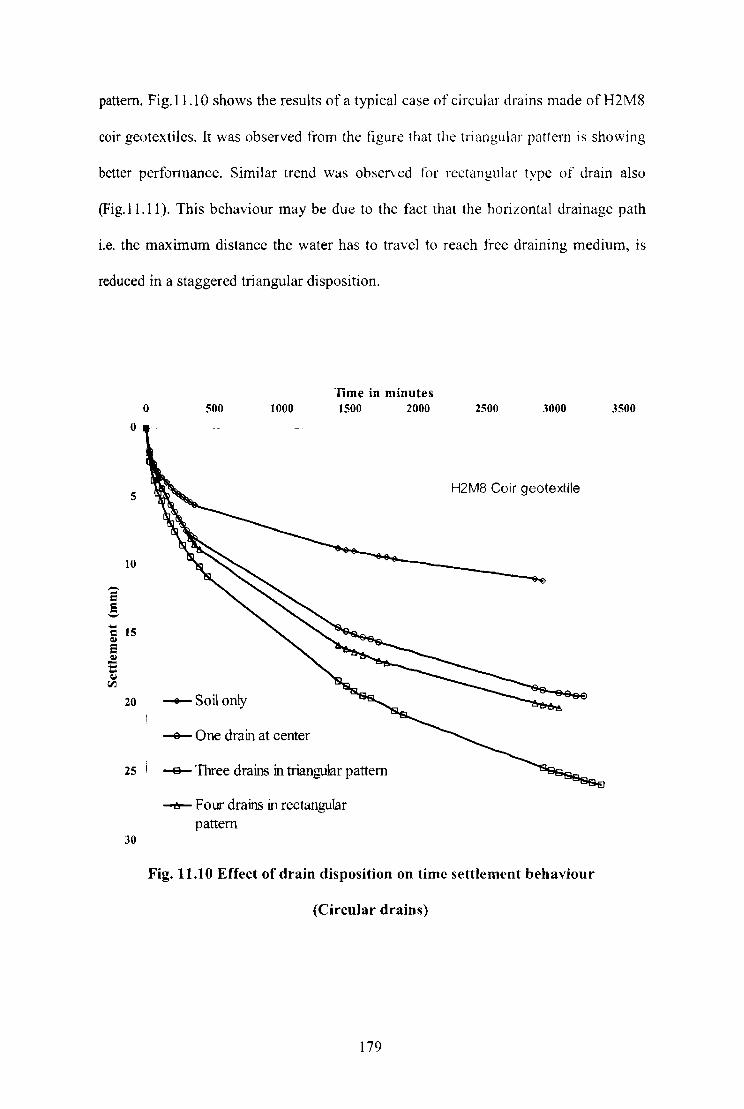
pattern. Fig.I1.1 0 shows the results of a typical case of circular drains made of H2M8
coir geotextiles. It was observed from the figure that the triangular pnttern is showing
better perfonnance. Similar trend was observed for rectangular type of drain also
(Fig.ll.ll). This behaviour may be due to the fact that the horizontal drainage path
i.e. the maximum distance the water has to travel to reach free draining medium, is
reduced in a staggered triangular disposition.
TIme in minutes o 500 1000 1500 2000
o
5
10
20 ......... Soil only
~ One drain at center
25 j ~ Three drains in triangular pattern
30
-t!I- Four drains in rectangular pattern
2500 3000
H2M8 Coir geotextile
Fig. 11. to Effect of drain disposition on time settlement behaviour
(Circular drains)
179
3500
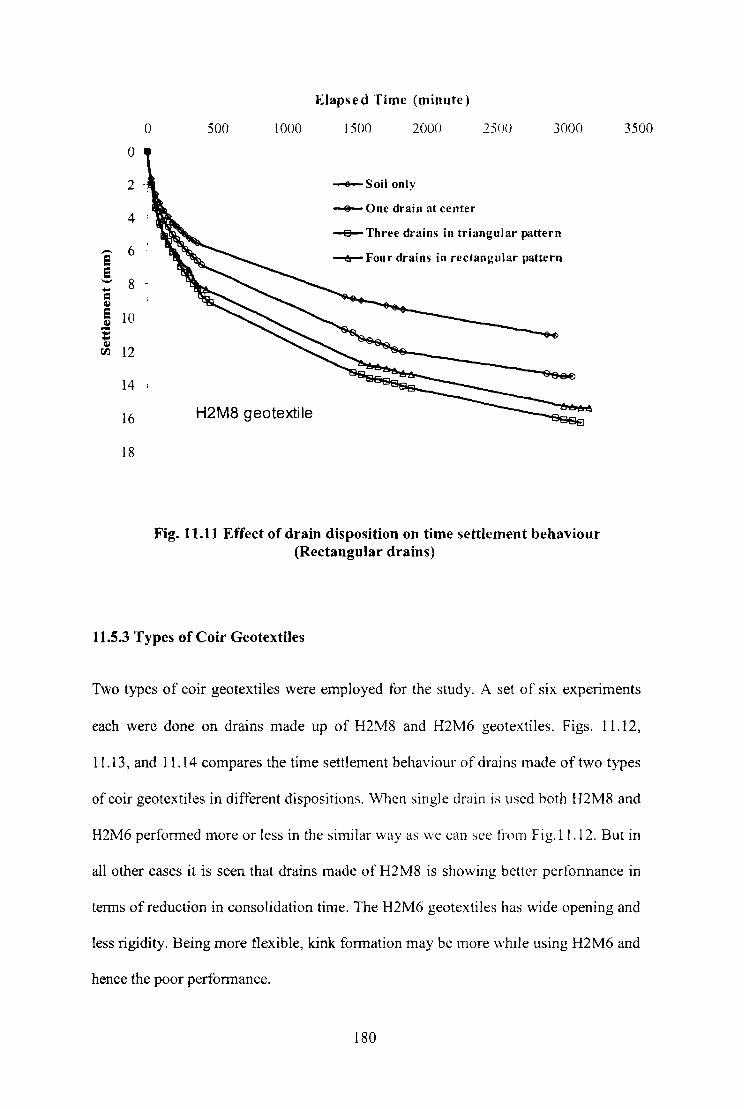
0
0
2
4
,-.. 6 e e '-" 8 .... = ~ e 10 ~
E ~
00 12
14
16
18
Elaps e d Time (minute)
500 1000 ISOO 200n 250() 3000
-.-Soil only
-e- One drain at center
-s-Three drains in triangular pattern
--e-- Fou r drains in rectangular pattern
H2M8 geotextile
Fig. 11.11 Effect of drain disposition on time settlement behaviour (Rectangular drains)
11.5.3 Types of Coir Geotextiles
3500
Two types of eoir geotextiles were employed for the study. A set of six experiments
each were done on drains made up of H2M8 and H2M6 geotextiles. Figs. 11.12,
11.13, and 11.14 compares the time settlement behaviour of drains made of two types
of eoir geotextiles in different dispositions. Whcn single drain is uscd hoth H2M8 and
H2M6 performed more or less in the similar way as we can ~ee n'om Fig.It.12. But in
all other cases it is seen that drains made of H2M8 is showing better performance in
tenns of reduction in consolidation time. The H2M6 geotextiles has wide opening and
less rigidity. Being more flexible, kink formation may be more while using H2M6 and
hence the poor performance.
180
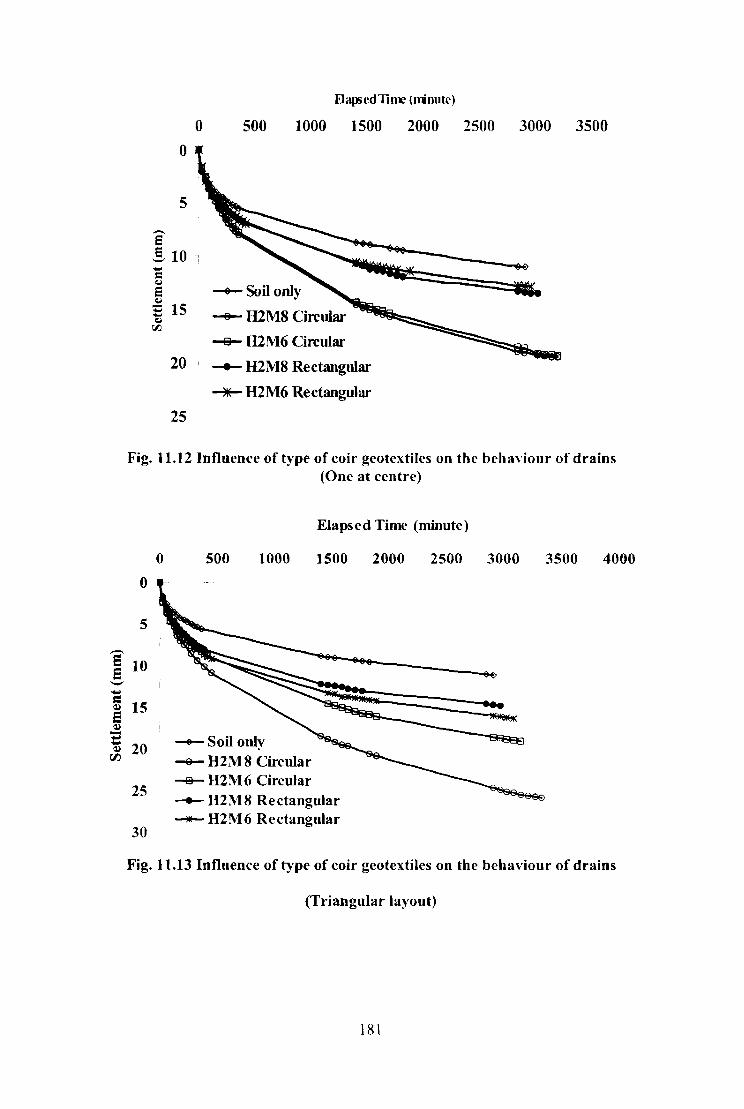
,--,
o o
5
S ! 101 -c ~ s E 15 a.
00
FJapsedliJa' (minute)
500 1000 1500 2000 2500 3000 3500
........... Soil only
~ IUM8 Circular
-S- IUM6 Circular
20 I -+- H2M8 Rectangular
-+- H2M6 Rectangular
25
Fig. 11.12 Influence of type of coir geotextiles on the behaviour of drains (One at centre)
Elapsed Time (minute)
0 500 1000 1500 2000 2500 3000 3500 4000
0
5
e 10 E '-" .... = ~
5 ~ -t ~
rJ'J
15
20
25
30
--+- Soil only -e- H2M8 Circular -e- H2M6 Circular ~H2M8 Rectangular -.-H2M6 Rectangular
Fig. 11.13 Influence of type of coir geotextiles on the behaviour of drains
(Triangular layout)
181
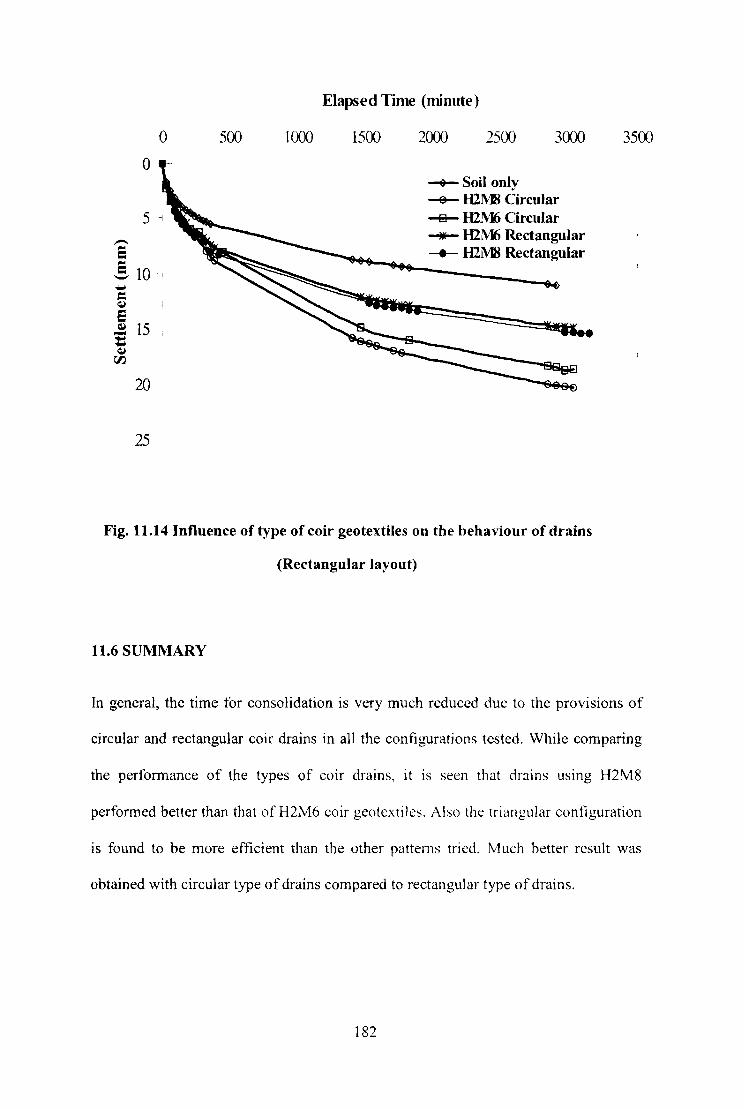
o 500 1000
o
-e -SlO
20
25
Elapsed Time (minute)
1500 2000 2500 3cxx)
~Soilonly
~ H2M8 Circular ...-s- H2.M6 Circular -+- H2M6 Rectangular -+- H2~ Rectangular
Fig. 11.14 Influence of type of coir geotextiles on the behaviour of drains
(Rectangular layout)
11.6 SUMMARY
3500
In general, the time for consolidation is very much reduced due to the provisions of
circular and rectangular coir drains in all the contigurations tested. While comparing
the performance of the types of coir drains, it is seen that drains using H2M8
perfonned better than that of H2M6 eoir geotcxtiles. Also the triangular configuration
is found to be more efficient than the other patterns trit:d. M uch better result was
obtained with circular type of drains compared to rectangular type of drains.
182

CHAPTER 12
CHARACTERISATION OF SOIL - FIBRE COMPOSITE
12.1 GENERAL
When eoir geotextiles are used for the ground improvement either for strengthening
sub grade or embankment, after its life period of 4 to 5 years, it may be gradually
transfonned into fibres of varying length due to degradation. The presence of these
randomly oriented coir fibres in the soil mass may be considered similar to an
admixture for stabiiization. More over, these randomly oriented fibres in soil may
reduce the drainage path during consolidation process and there by dissipate pore
pressure due to the applied load, since the water can find easy way to escape due to
the random orientation of the fibres. Hence the study is also aimed to investigate the
effect of discrete randomly oriented coir fibres on the perfonnance of pavement
supporting soil.
The main idea was to produce a stabilized soil - fibre matrix with enhanced properties
relative to virgin soil and establishing the magnitude of inherent variations in strength
and eompressibility properties. The effect of fibre content and fibre length was
investigated by conducting test on soils with and \vithout coir tibres under different
moisture and stress environments and to arrive at the optimum values.
Experiments were done with fibre contents up to 2.5% and length up to 20mm. Fibre
contents more than 3% was not used in the study due to the difficulty of obtaining an
even distribution of the fibre in the soil. Also the amount of fibre that remain in soil
after degradation of eoir geotextiles is not expected to be more than this value.

12.2 LABORATORY INVESTIGATIONS
12.2.1 Compaction Test
To detennine the effect of reinforcing fibres on the moisture - density relationships,
standard compaction tests were conducted as per Bureau of Indian Standard
specifications on controlled soil (clayey silt and red soil) and soil - fihre mixtures. An
even distribution of fibre and soil was achieved by consistent mixing procedure.
Compaction was done with the help of an automatic compactor. Specimens were
prepared by using both soils mixed with fibre contents of 0%, 0.25%, 0.5%, 1.0% and
2% by weight with different fibre lengths of 10mm, 15mm and 20mm, taking fresh
samples each time. It should be noted that the soil - fibre mixes were less workable
because of the fibre webbing during mixing.
12.2.2 Un confined Compression Test
Red soil and Clayey silt soil fractions passing through 425-micron IS sieve were used
for the preparation of the soil - fibre composite specimens. Fihres having length
lOmm, l5mm and 20mm were mixed with soil in three proportions viz., 0.5%, 1.0%
and 2.0% of dry soil by weight. Specimens were prepared at water contents
corresponding to 95% of maximum dry density of the soils (dry of optimum and wet
of optimum conditions). All specimens tested were of 52 mm diameter and 104 mm
height. To prepare the specimens, calculated amount of soil-fibre mixture, were
compacted in three equal layers. Before compacting the soil in the mould, the inside
of the mould was coated with oil in order to reduce the chance of breaking of
specimens during removal from the mould. The soil mixture was pressed in the mould
by means of hydraulic jack. Any fibres protruding out at the top and bottom of the
specimens were trimmed with scissors.
184

Loading was done in an AIMIL Unconfined Compression testing machine. The strain
was controlled at a rate of 0.5% per minute throughout the testing programme. Peak
values of stresses were noted.
12.2.3 Triaxial Shear Test
Soil - fibre mixes were prepared as in the case of UCC test. Specimens of 26mm
diameter and 52mm height were prepared in split moulds. Unconsolidated undrained
triaxial tests were done at confining pressures of 50 kPa, 100 kPa and 150 kPa. The
shear strength parameters (cohesion and angle ofintemal friction) were found out.
12.2.4 Consolidation Test
Clayey silt soil passing through 425 microns was taken tor the test. Dry soil was
mixed with known percentage of tibre (0.5%, 1.0%.2.0% and 3.(jO;o) having specified
lengths (10 mm and 15 mm). Water was added and mixed thoroughly to get a unifonn
randomly oriented saturated soil - fibre mix. The soil - tibre paste was filled in the
consolidation ring. Proper care was taken while tilling the soil to minimise the
entrapped air.
Conventional oedometer tests were done using a standard consolidation ring of 60mm
diameter and 20mm height. Readings were recorded before and after placing the load.
Each load was kept for 24 hours. Load increment ratio was I: 1. Void ratio for each
pressure was calculated and pressure void ratio variations were plotted to study the
variations in compression index. Time settlement rcadings wcre taken at a pressure of
200 kPa to find Coefficient of consolidation by curve t1itting methods.
185
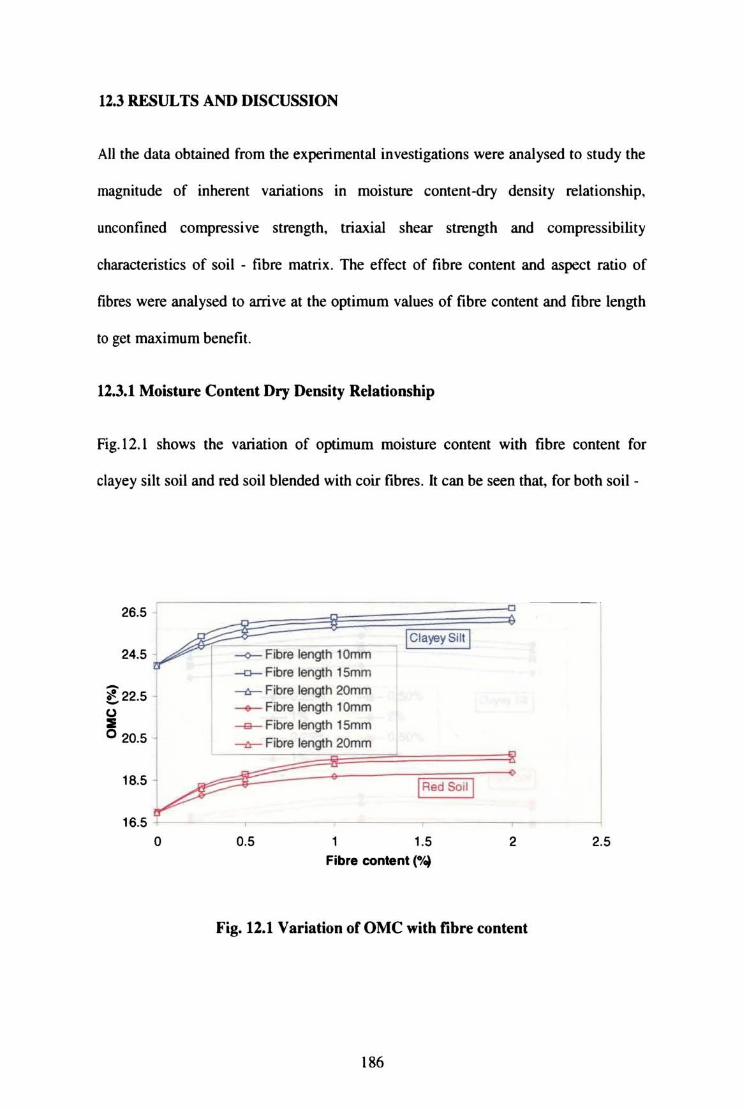
12.3 RESULTS AND DISCUSSION
All the data obtained from the experimental investigations were analysed to study the
magnitude of inherent variations in moisture content-dry density relationship.
unconfined compressive strength, triaxial shear strength and compressibility
characteristics of soil - fibre matrix . The effect of fibre content and aspect ratio of
fibres were analysed to arrive at the optimum values of fibre content and fibre length
to get maximum benefit.
12.3.1 Moisture Content Dry Density Relationsbip
Fig.12.1 shows the variation of optimum moisture content with fibre content for
clayey silt soil and red soil blended with coir fibres. It can be seen that, for both soil -
26.5
!22.5 • u :I! 020.5
18.5
16.5 o
--0- Fibre length 10mm
--0- Fibre length 15mm
---t:r- Fibre length 20mm -+- Fibre length 10mm
~ Fibre length 15mm
-c-- Fibre length 20mm
0.5 1
!ClayeyS'" !
1.5
Fibre content (-la) 2
Fig. 12.1 Variation of OMC with fibre content
186
2.5

fibre mixes. as the fibre content increases the optimum moisture content increases
irrespective of aspect ratio of fibres. The OMC of clayey silt and red soil without coir
fibres was 24% and 17% respectively. Due to addition of 1% fibre the increase in
OMC was 7.5%. 9.6% and 8.75% for clayey silt fibre mixes with fibres of length
IOmm. 15mm and 20mm respectively. The respective increase in OMC for red soil
with 1 % fibre content is 10%, 15% and 14% respectively. Though the OMC increases
with fibre content for all cases of fibre length considered. it was found that the rate of
increase in OMC was not uniform. The maximum increase was for 15mm fibre and
the minimum was for IOmm fibre.
Variation of OMC with fibre length for clayey silt and red soil are shown in Fig.12.2.
It can be observed that. as the aspect ratio of the fibre increases, OMC increases to a
maximum value and then shows a decreasing trend. This behaviour was identical in
both soi ls with all fibre contents.
26.5
25.5
9
--+-0.25%
-.- 1%
--+- 0.25%
-.- 1%
11 13 15 17 19 Fibre longlh (mm)
Fig. 12.2 Variation of OMC with fibre length
187
•
21

The variation of MDD with fibre content for clayey silt and red soil is shown in
Fig.12.3. As the fibre content increases. the maximum dry density decreases
irrespective of fibre length. As can be seen from the plots. MDD decreases sharply
with the addition of 0.25% of fibre and thereafter the decrease is at a low rate. For
instance for clayey silt, MDD decreases to 14.8 kN/m3 from 15.2 kN/mJ with the
addition of IOmm fibre and decreases to 14.7 kN/m' with the addition of 20mm fibre.
The reduction is stiD more in the case of red soil.
The specific gravity of the coir fibre is 1.15 and that of the soil is 2.73. As the fibre
content increases. the lower density fibres replace the higher density soil grains
resulting in a lower density for the soil - fibre composite.
17.4 0----------------------
16.9
_'6.4
} ~ 15.9 1 g ~ 15.4 I
~ Fibre length 10mm -0-- Fibre length 15mm ---6- Fibre length 20mm ~ Fibre length lOmm -e- Fibre length 15mm --{r- Fibre length 20mm
IClayey s;n I
@
1 1.5
Fibre content (./~
Fig. 12.3 Variation of MDD with fibre content
: 2
Fig.12.4 shows the variation of MDD with fibre length. It can be seen that the MDD
decreases initially with increase in fibre length and then increases after reaching the
minimum value.
188

14.85 r, -===?c== "",=e""'''''1 -<>-0.25% -0-0.50% 14 .8 ,
'4.75 j ~ 14.7
.:!!,14 .65
~' :::: Tj -~I"'I ~~.5~;=~;::5';;%=:-<>-5i85~Ci~:'::O~%91 16.2 '
.- " j ~ I
~ '4' j 14.55
,:::1 ~ __ ~ _____ --__ _ 9 14 19
Fibr. length (mm)
(a) Clay
.:!!. 15.8 1 Q
~ 15.' 1 15.4
15 .2
Fibr. length (mm)
(b) Red Soil
Fig. 12.4 Variation of MDD with fibre length
Analysing the results obtained from compaction tests, it is clear that the behaviour of
soil - fibre mixes in terms of OMC and MDD shows a reverse trend. It is clear thallhe
reinforcing fibres impede the compaction process resulting in a lighter composite
material . The response surfaces for OMC and MDD with fibre content and fibre
length are shown in Fig. 12.5 for the two types of soils.
12.3.2 Unconfined Compressi.e Strength
Data were generated at wet of optimum and dry of optimum conditions corresponding
10 water contents at 95% of MDD of soils to clarify whether the variation is due to
lower density and high water content or both. Results of UCC tests showing variations
with fibre content for clayey silt soil are shown in Fig. 12.6.
189
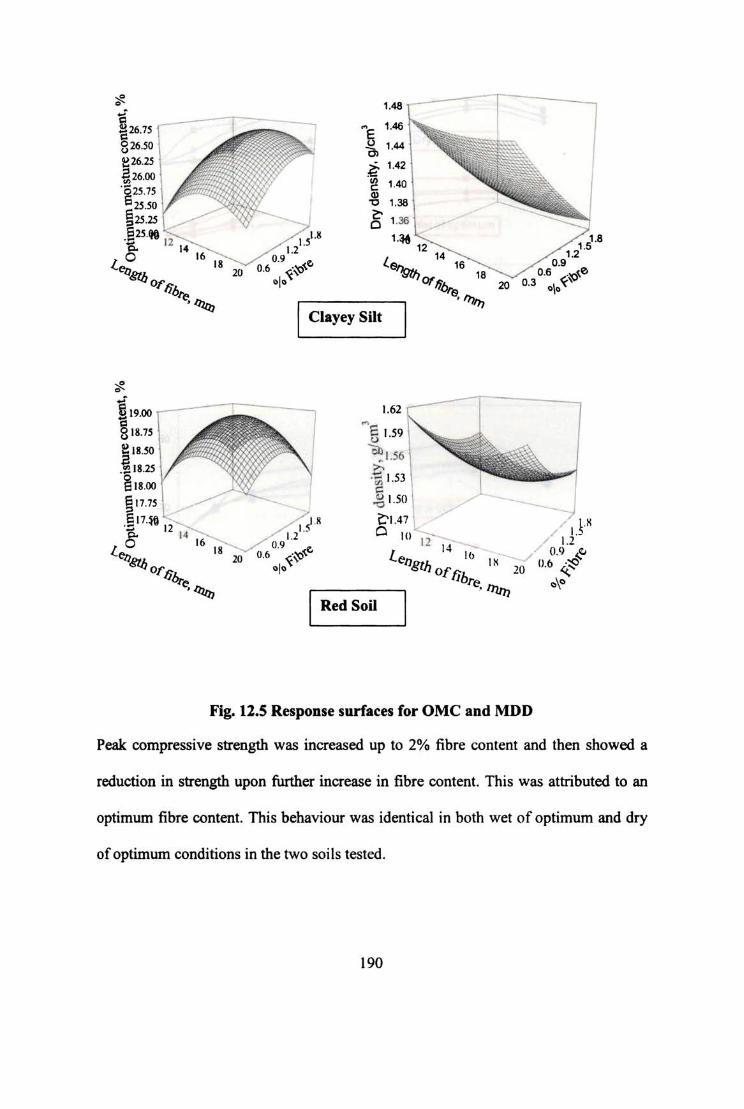
'.48 .----r-------., ... 1.46
~'44 ~ 1.42
~ 1.40
~ 1.38
5 1.36
' .'i6
( 14
""9tJ, Of ~ 1>". """
Clayey Silt
1.62
'"'5 1.59
~ 1 .56 >-
I
.~ 1.53 c .g 1.50
'Cl .47 o 10
Red Soil
I ' I. 1.1
_ " 0.9 t..v IK ---- 06 .~
20 . «:..' -I-
Fig. Il.S RespoDse surfaces for OMC and MDD
Peak compressive strength was increased up to 2% fibre content and then showed a
reduction in strength upon further increase in fibre content. This was attributed to an
optimum fibre content. This behaviour was identical in both wet of optimum and dry
of optimum conditions in the two soils tested.
190
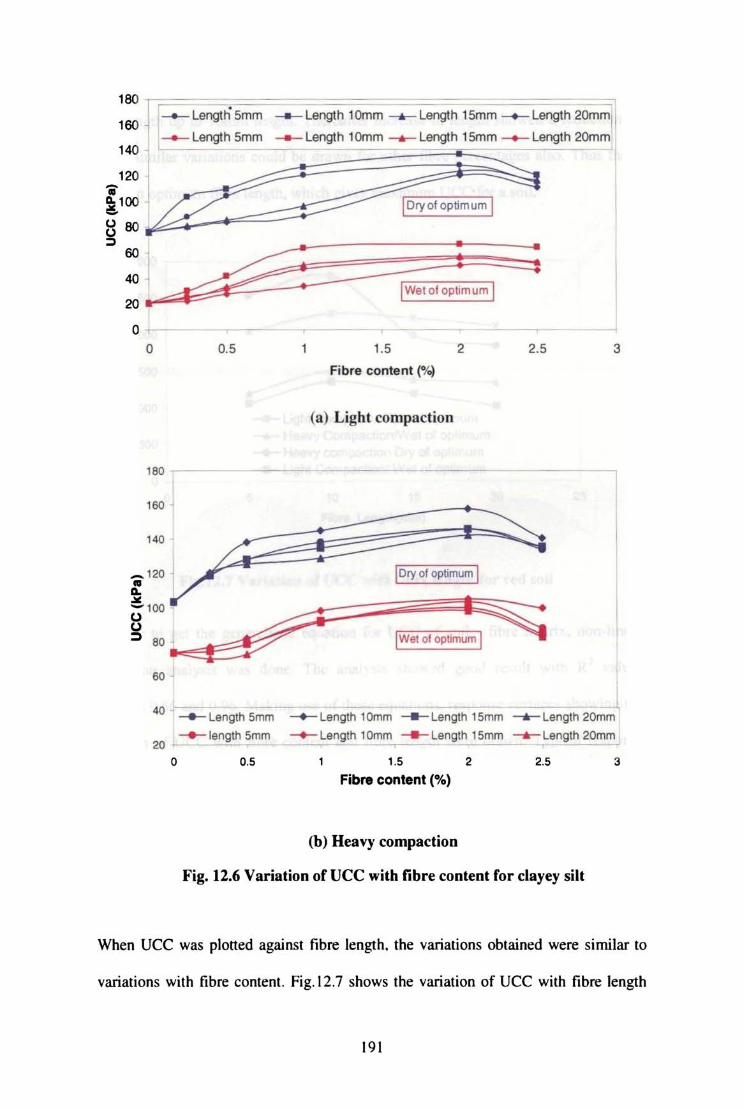
:: r : Le~ti 5mm _ Length5mm
___ Length l Omm --....-Length 15mm --+- Length 2Om, 1 ___ Length lOmm ___ Length 15mm --+- Length 20mm
140 ,~----=-
.120 1 ~100 [Ory of optimum l
g eo -
60 1~ ; 40 1 ~loPlimuml 20 ......... '"
OT'--o 0.5
"" ~---
140
1.5 2
Fibre content (%~
<al Light compactio"
I Dry of optimum I
;
2.5 3
4<l J;---=-. --'-length 5:-m-m----+- ~L.-"-g"lh-:I::Om-m :""-Length 15rnm -+-Lenglh 20~ -+- Iength Smm --+- Length 1 Dmm ......... Length 15mm -+- Length 20mm
2O t.--, ,
o 0.5 1.5 2 2.5 3
Fibre content (%)
(b) Heavy compaction
Fig. 12.6 Variation or UCC with fibre content ror clayey silt
When UCC was ploned against fibre length. the variations obtained were similar to
variations with fibre content. Fig.12.7 shows the variation of VCC with fibre length
191
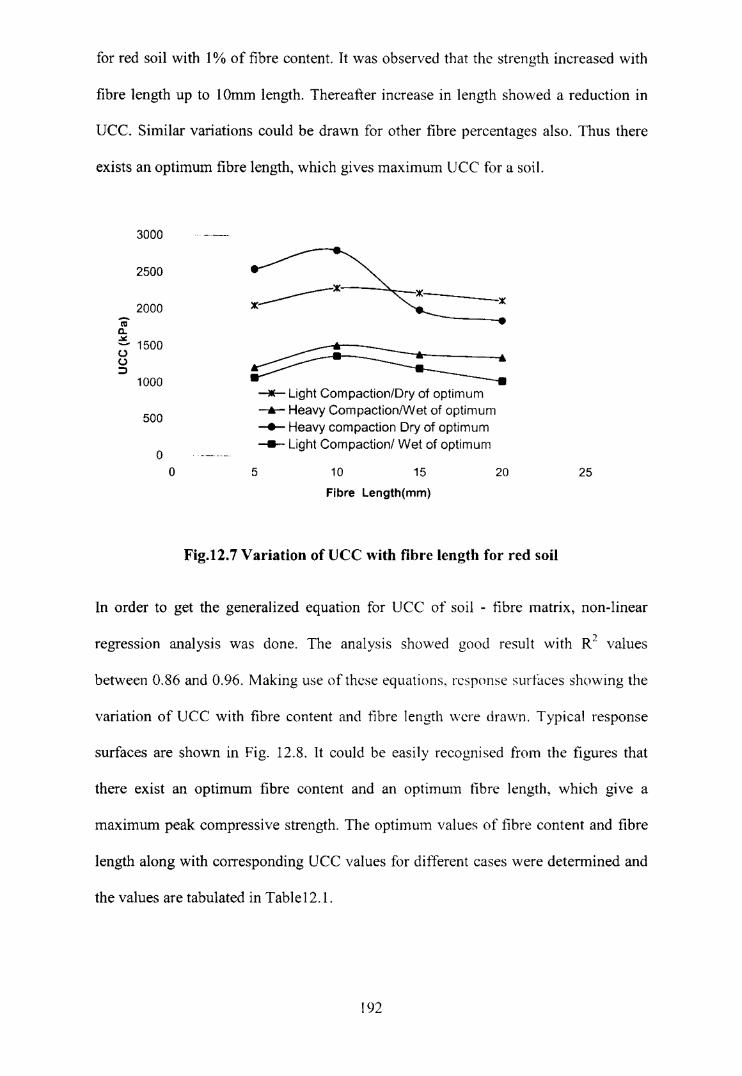
for red soil with I% of fibre content. It was observed that the strength increased with
fibre length up to IOmm length. Thereafter increase in length showed a reduction in
Dec. Similar variations could be drawn for other fibre percentages also. Thus there
exists an optimum fibre length, which gives maximum UCC for a soil.
3000
2500
2000
25201510
--- Light Compaction/Dry of optimum--.- Heavy Compaction/Wet of optimum
- Heavy compaction Dry of optimum--- Light Compaction/ Wet of optimum
5
oo
500
1000
ma..~ 1500oo~
Fibre Length(mm)
Fig.12.7 Variation ofUCC with fibre length for red soil
In order to get the generalized equation for UCC of soil - fibre matrix, non-linear
regression analysis was done. The analysis showed good result with R2 \!alues
between 0.86 and 0.96. Making use of these equations, response surfaces showing the
variation of UCC with fibre content and fibre length were drawn. Typical response
surfaces are shown in Fig. 12.8. It could be easily recognised from the figures that
there exist an optimum fibre content and an optimum fibre length, which give a
maximum peak compressive strength. The optimum values of fibre content and fibre
length along with corresponding UCC values for different cases were determined and
the values are tabulated in Table12.1.
192
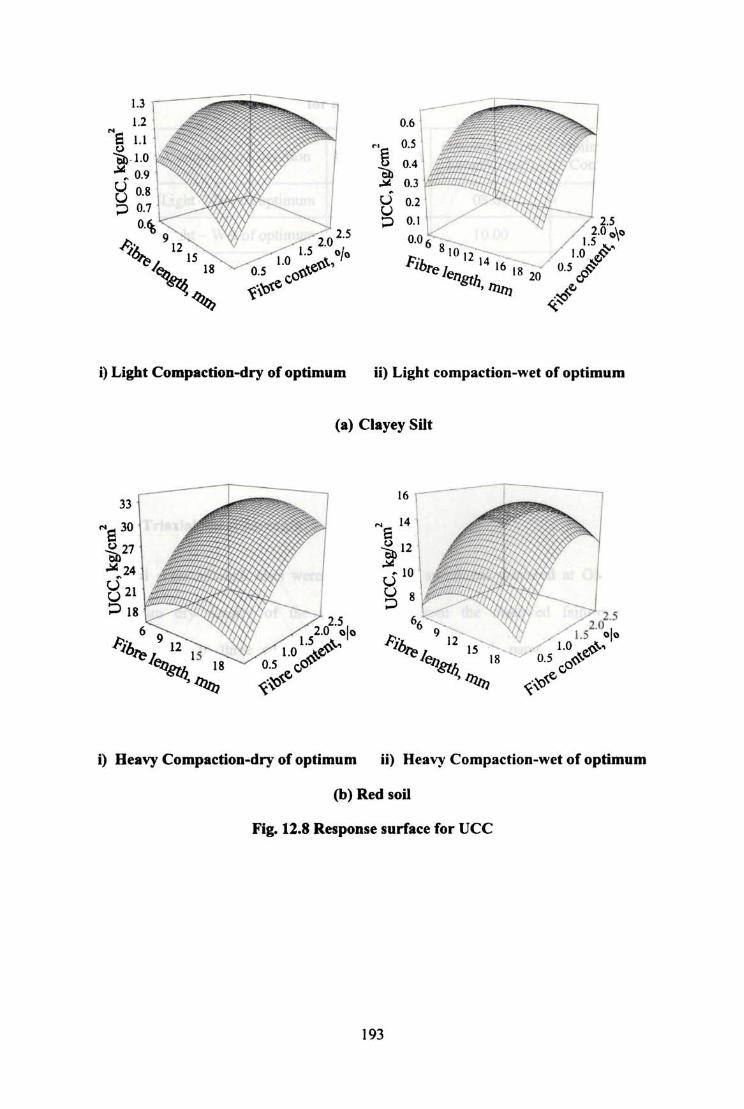
1.2 M 5 1.1 ... . 1.0 -" ... 0.9 e 0.8 ;::> 0.7
O.~ 9
~A- 12 -~ l' I~ 18
'%
0.6
... , O.s i o •
~
1) Light Compaction..<fry of optimum ii) Light compaction~wet of optimum
33
"'s 30
~27 -"24
821 ;::> 18
(a) Clayey Silt
2.' 2.0 cia
U -,," 1.0 ~~,r
o.s \;0
«"'~
I' Ne i12
010 U 8 ;::>
66 9
Fib 're le/] 1
'IfIJ" '%
1.5 00
2.5 2.0 I
1.0 (,<>\.~ o.s o'f:o~
C .-~
~'v
i) Heavy CompactioD-dry of optimum ii) Heavy Compaction-wet of optimum
(b) Red soil
Fig. 12.8 Response surface for UCC
193
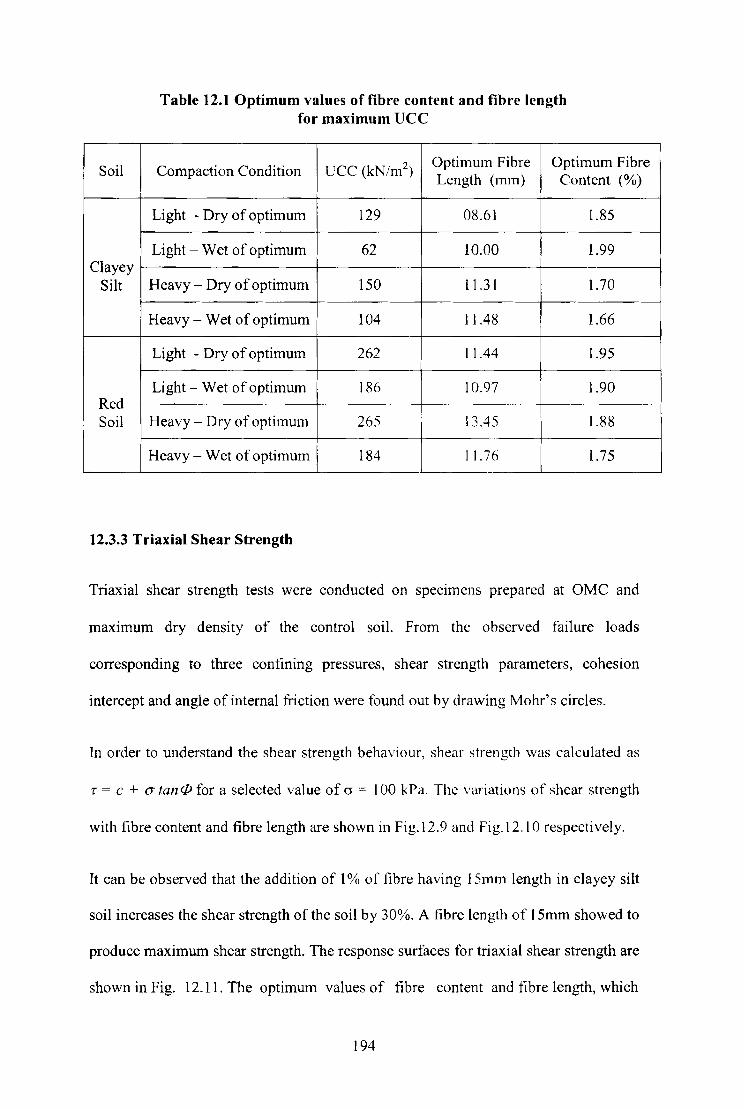
Soil
Clayey Silt
Red Soil
Table 12.1 Optimum values of fibre content and fibre length for maximum UCC
Compaction Condition UCC (kN/m2) Optimum Fibre Optimum Fibre Length (mm) Content (%)
Light - Dry of optimum 129 08.61 1.85
Light - Wet of optimum 62 10.00 1.99
Heavy - Dry of optimum 150 11.31 1.70
Heavy - Wet of optimum 104 11.48 1.66
Light - Dry of optimum 262 11.44 1.95
Light - Wet of optimum 186 10.97 1.90 ---
Heavy - Dry of optimum 265
I
13.45
I
1.88 --
Heavy - Wet of optimum 184 11. 76 1.75
12.3.3 Triaxial Shear Strength
Triaxial shear strength tests were conducted on specImens prepared at OMC and
maXImum dry density of the control soil. From the observed failure loads
corresponding to three confining pressures, shear strength parameters, cohesion
intercept and angle of internal friction were found out by drawing Mohr's circles.
In order to understand the shear strength behaviour, shear strength was calculated as
r = c + a tanifJ for a selected value of (J = 100 kPa. The variations of shear strength
with fibre content and fibre length are shown in Fig.12.9 and Fig.12.1 0 respectively.
It can be observed that the addition of 1 % of fibre having 15mm length in clayey silt
soil increases the shear strength of the soil by 30%. A fibre length of 15mm showed to
produce maximum shear strength. The response surfaces for triaxial shear strength are
shown in Fig. 12.11. The optimum values of fibre content and tibre length, which
194
I
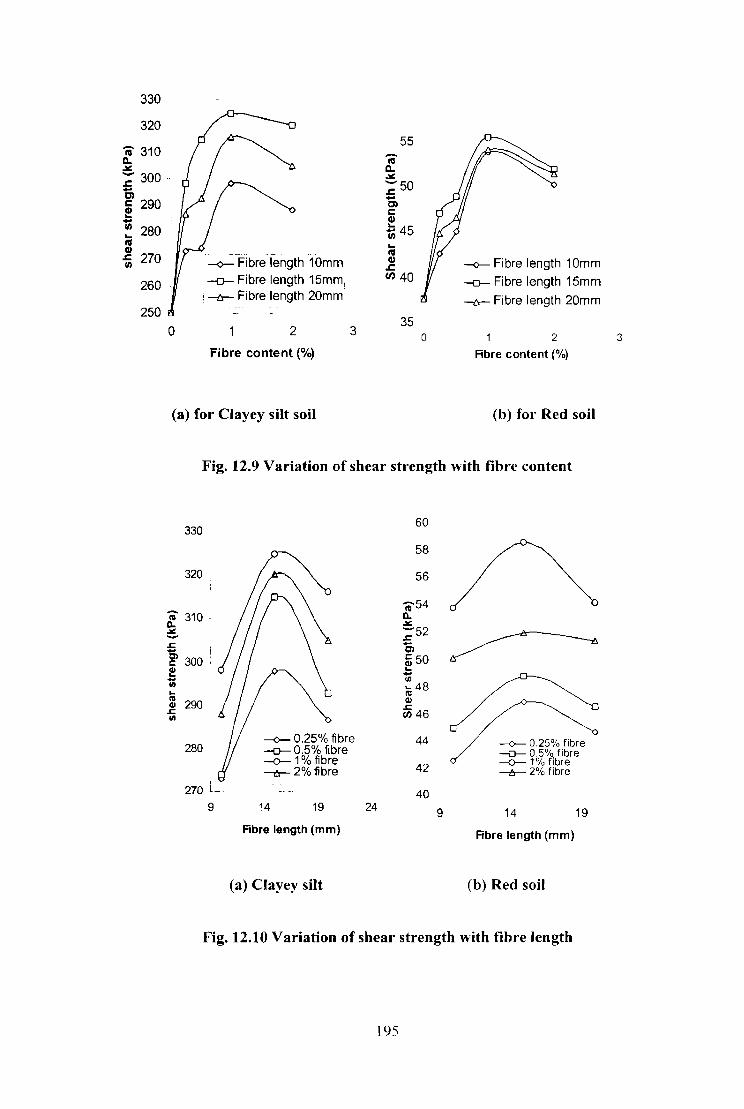
330
320
'ii' 310 c.. ~
;: 300 -C)
~ 290 ! -~ 280 C'II Cl)
.s:::. f/)
270
260
250
55 c;;-c.. ~
:;50 -C) ~ Cl)
!:: 45 f/)
"-C'II Cl)
.s:::. ---<>- Fibre length 10mm ---<>- Fibre length 10mm -0- Fibre length 15mm: Cl) 40 -0- Fibre length 15mm
! -fr- Fibre length 20mm -&- Fibre length 20mm
35 0 0 2 3 2 3
Fibre content (%) Fibre content (%)
(a) for Clayey silt soil (b) for Red soil
Fig. 12.9 Variation of shear strength with fibre content
330 60
58
320 56
cv 310 "ia 54 CL
0.. .lI:
~ ;52 .c -.... : Cl Cl ' c::: 300 ' ~ 50 Qj ... ... .... .... Cl) Cl)
I... 48 ... III III
290 ell 41 ~46 .c
Cl)
---<>- 0.25% fibre 44 280 -0- 0.5% fibre
-0--1% fibre 42 --er-- 2% fibre
---<>- 0.25% fibre -0- 0.5% fibre -0-- 1 % fibre --er-- 2% fibre
, 270 L._ 40
9 14 19 24 9 14 19 Fibre length (mm) Fibre length (mm)
(a) Clayey silt (b) Red soil
Fig. 12.10 Variation of shear strength with fibre length
195
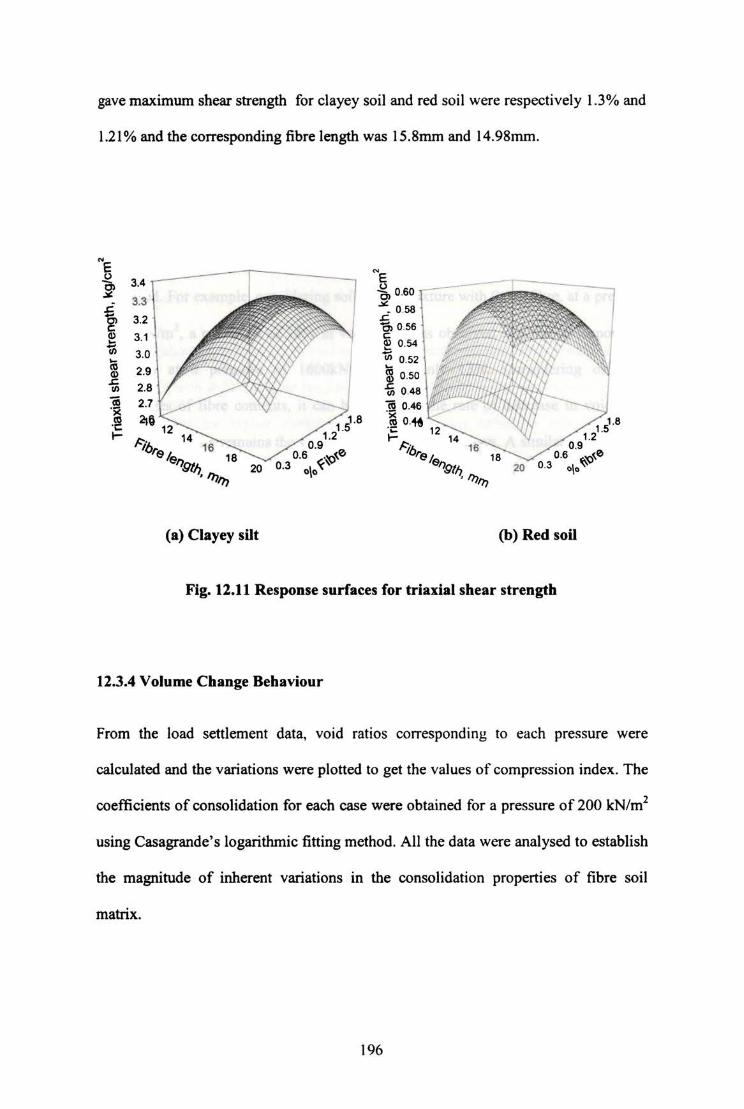
gave maximum shear strength for clayey soil and red soil were respectively 1.3% and
1.21 % and the corresponding fibre length was 15.8rrun and 14.98mm.
"~ ---------,----------~ 3.4
3.3
~ 3.2
i 3.1
3.0
(a) Clayey silt
"5 Cb 0.60 ~. 0,58 .c 1$J 0.56 c ~ 0.54 U; 0,52
m 0.50
-5 0,048
]! 0.046 • ~ 0.i6
176,. ./~h
. "''''
(b) Red soil
Fig. 12.11 Response surfaces for triaxial shear strength
12.3.4 Volume Change Behaviour
From the load settlement data. void ratios corresponding to each pressure were
calculated and the variations were plotted to get the values of compression index. The
coefficients of consolidation for each case were obtained for a pressure of 200 kN/m2
using Casagrande's logarithmic fiUing method. All the data were analysed to establish
the magnitude of inherent variations in the consolidation properties of fibre soil
matrix.
196
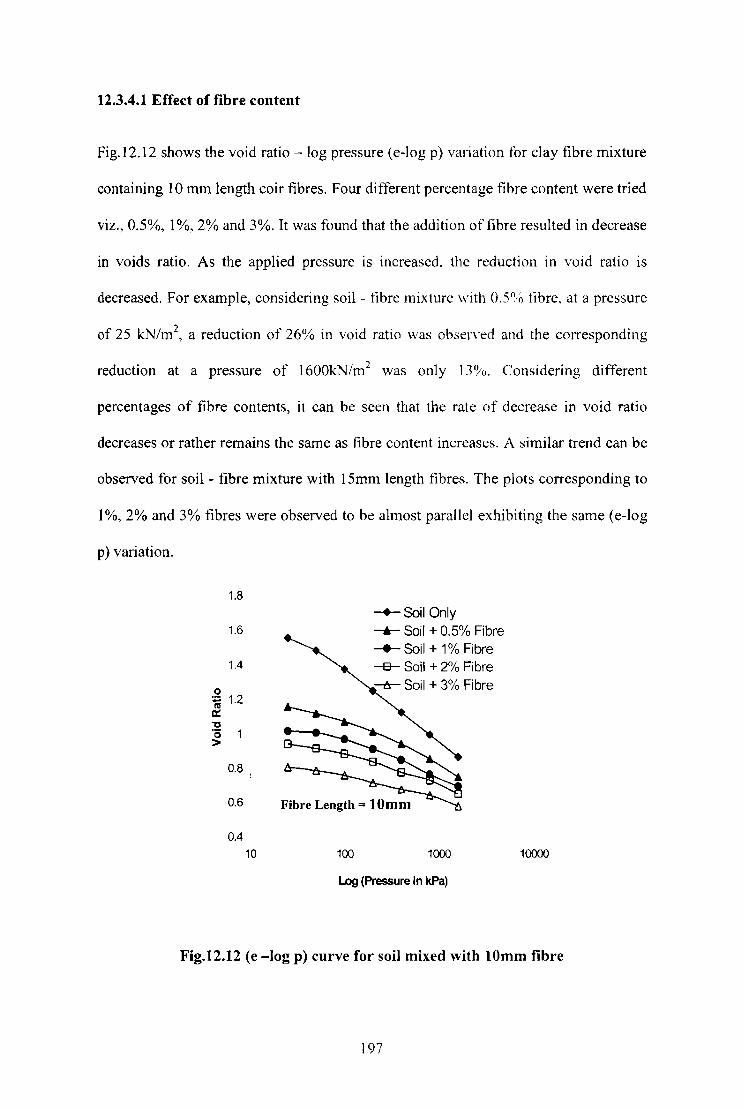
12.3.4.1 Effect of fibre content
Fig.12.12 shows the void ratio - log pressure (e-Iog p) variation for clay fibre mixture
containing 10 mm length coir fibres. Four different percentage fibre content were tried
viz., 0.5%, 1 %,2% and 3%. It was found that the addition of fibre resulted in decrease
in voids ratio. As the applied pressure is increased, the reduction in void ratio is
decreased. For example, considering soil - fibre mixture with 0.5% fibre, at a pressure
of 25 kN/m2, a reduction of 26% in void ratio was observed and the corresponding
reduction at a pressure of 1600kN/m2 was only 13'10. Considering different
percentages of fibre contents, it can be seen that the rate of decrease in void ratio
decreases or rather remains the same as fibre content increases. A similar trend can be
observed for soil - fibre mixture with 15mm length fibres. The plots corresponding to
1%,2% and 3% fibres were observed to be almost parallel exhibiting the same (e-Iog
p) variation.
1.8
1.6
1.4
0 :; 1.2 0:: "tl '0 >
0.8
0.6
0.4
10 100
-+- Soil Only -.- Soil + 0.5% Fibre -.- Soil + 1 % Fibre ~ Soil + 2% Fibre :-tr- Soil + 3% Fibre
1000
Log (Pressure in kPa)
10000
Fig.12.12 (e -log p) curve for soil mixed with lOmm fibre
197
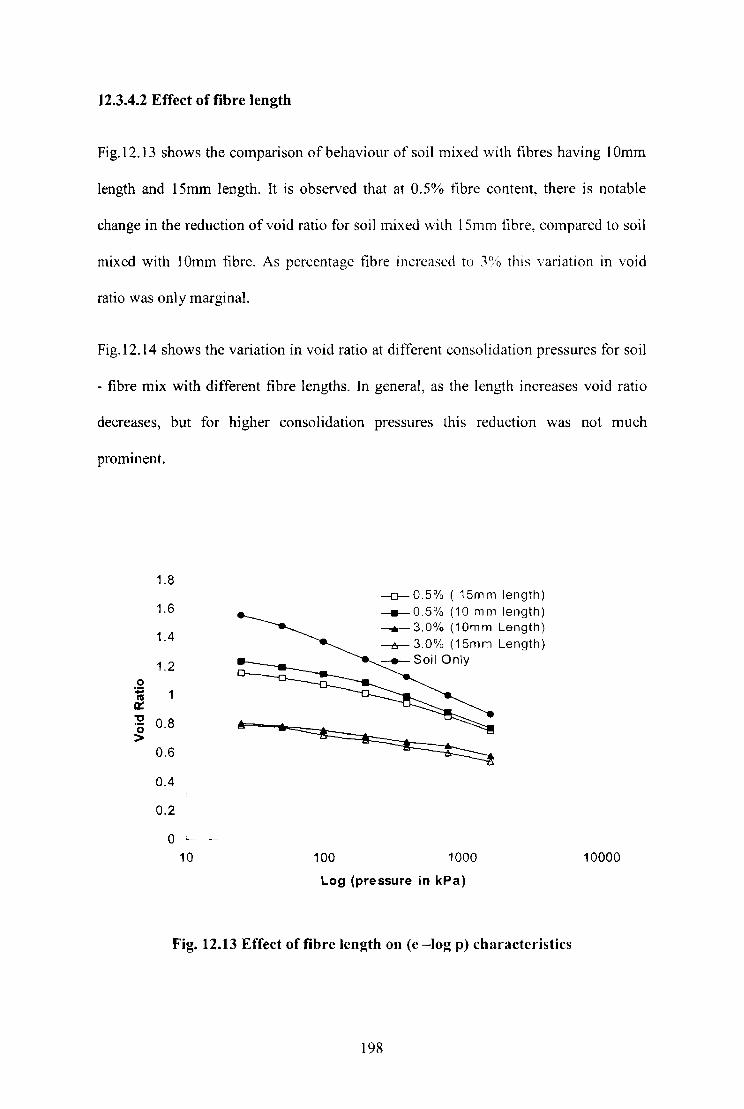
12.3.4.2 Effect of fibre length
Fig.12.13 shows the comparison of behaviour of soil mixed with fibres having 10mm
length and 15mm length. It is observed that at 0.5% fibre content, there is notable
change in the reduction of void ratio for soil mixed with 15mm fibre, compared to soil
mixed with lOmm fibre. As percentage tibre increased to )()/o this variation in void
ratio was only marginal.
Fig.12.14 shows the variation in void ratio at different consolidation pressures for soil
- fibre mix with different fibre lengths. In general, as the length increases void ratio
decreases, but for higher consolidation pressures this reduction was not much
prominent.
1.8 ---D--O.5% ( 15mm length)
1.6 ~0.5% (10 mm length)
1.4 ---....- 3.0% (10mm Length) ---6- 3.0% (15mm Length)
1.2 ____ Soil Only
0 :;; 1 III ex: 3:! 0.8 0 >
0.6
0.4
0.2
0 '-.
10 100 1000 10000
log (pressure in kPa)
Fig. 12.13 Effect of fibre length on (e -log p) characteristics
198
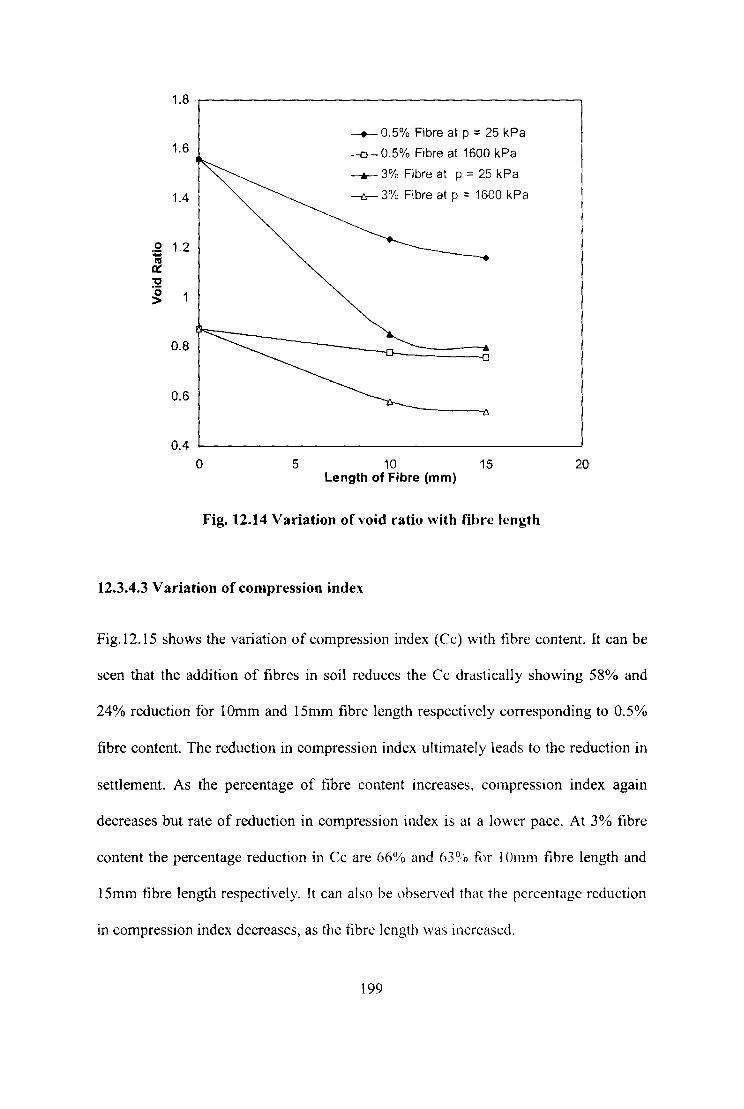
1.8 .
-+- 0.5% Fibre at p ::: 25 kPa 1.6 -0-0.5% Fibre at 1600 kPa
--.- 3% Fibre at p = 25 kPa
1A --{:s- 3% Fibre at p = 1600 kPa
0 1.2 :; I'll
0:: 'C '0 1 >
0.8
0.6
OA 0 5 10 15 20
Length of Fibre (mm)
Fig. 12.14 Variation of void ratio with fibre length
12.3.4.3 Variation of compression index
Fig.12.15 shows the variation of compression index (Cc) \vith fibre content. It can be
seen that the addition of fibres in soil reduces the Cc drastically showing 58% and
24% reduction for 10mm and 15mm fibre length respectively corresponding to 0.5%
fibre content. The reduction in compression index ultimately leads to the reduction in
settlement. As the percentage of fibre content increases, compression index again
decreases but rate of reduction in compression index is at a lower pace. At 3% fibre
content the percentage reduction in Cc are 66% and 63~'O t()r 10mm fibre length and
15mm fibre length respectively. It can also be observed that the percentage reduction
in compression index decreases, as the fibre length was increased.
199

0.45
0.4 ---.-10 mm Length
---- 15 mm Length
)( 0.35 Cl)
"tI C
c 0.3 0 'in VI Cl) 0.25 ... Q. E 0 u 0.2
0.15
0.1
0 0.5 1 1.5 2 2.5 3 3.5
Fibre content (%)
Fig. 12.15 Variation of compression index with fib.'e content
12.3.4.4 Variation of coefficient of consolidation
The variation of coefficient of consolidation (Cv) with tibre content is presented in
Fig. 12.16,The value of Cv increases from 3% to 68% as the fibre content increases
from 0.5% to 3% for 10 mm fibre length. The corresponding increase in Cv with
15mm fibres is 21 % to 147%. Since the time of consolidation is inversely
proportional to the coefficient of consolidation, the addition of fibre in soil reduces
the time of consolidation for attaining a specified degree of consolidation, From the
test results, it can be observed that, the coefficient of consolidation increases as length
of fibre increases. This may be due to the fact that the drainage path becomes more
accessible and continuous.
200
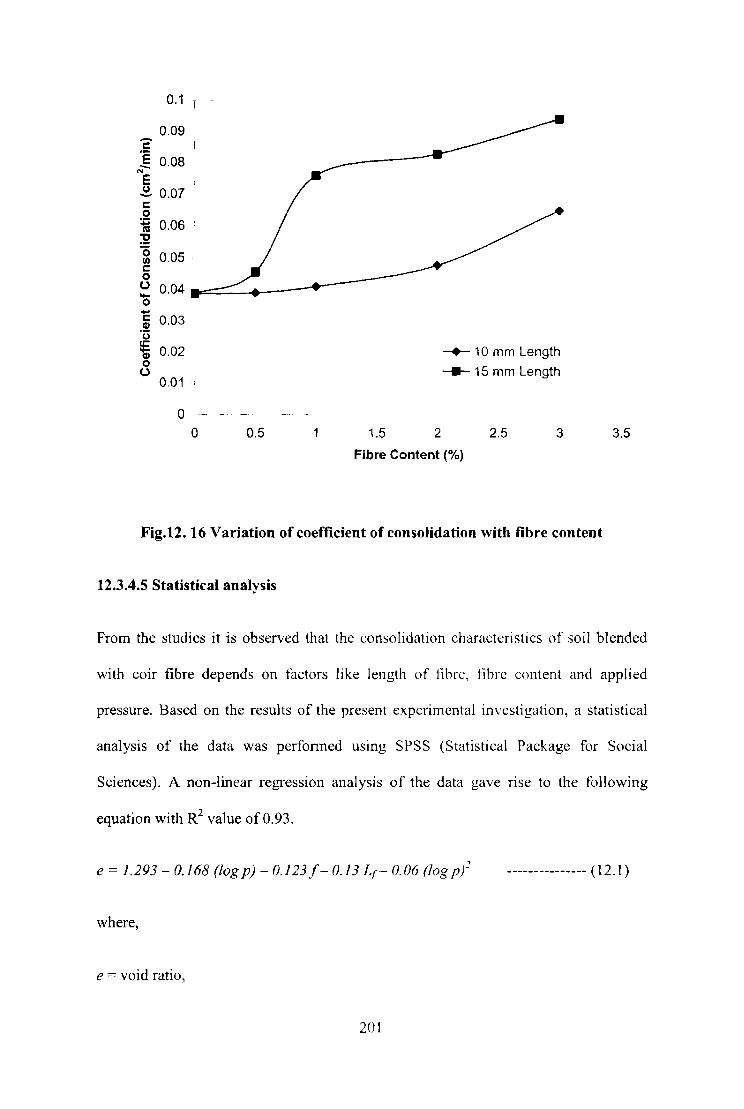
0.1 T -
0.09 -I: 'E 0.08 -N
E i
~ 0.07·· I: 0
i :0:: 0.06 tu :2 '0 0.05 I/) I: 0 0 0.04 .... 0 ... I: 0.03 .~ CJ
~ 0.02 -.-10 mm Length 0 0
0.01 -""'15 mm Length
0 1-·
0 0.5 1.5 2 2.5 3 3.5
Fibre Content (%)
Fig.12. 16 Variation of coefficient of consolidation with fibre content
12.3.4.5 Statistical analysis
From the studies it is observed that the consolidation characteristics of soil blended
with coir fibre depends on factors like length of fihre, tihrc content and applied
pressure. Based on the results of the present experimental investigation, a statistical
analysis of the data was perfonned using SPSS (Statistical Package for Social
Sciences). A non-linear regression analysis of the data gave rise to the following
equation with R2 value of 0.93.
e = 1.293 - 0.168 (log p) - 0.123 f - 0.13 Lr - 0.06 (log p/ --------------- (12.1)
where,
e = void ratio,
201

p:o:: pressure in kg/crn2 (10 kPa),
Lr:o:: length of fibre in cm, and
f = fibre content in %.
12.4 SUMMARY
Two different soils were tested at varying reinforcement - soil ratios and fibre lengths.
The results of the tests proved the positive effects of adding coir fibres in enhancing
the cornpressive strength and shear strength if an optimal reinforcement ratio and fibre
length is adopted. With the addition of fibres it was ohserved that, the optimum
moisture content of the soil generally increased and maximum dry density decreased
resulting in a softer material. The coefticient of consolidation increased considerably
with fibre content and the compression index decreased. Both these variations can be
viewed advantageous in tenns of reduction in consolidation time and the amount of
settlement.
202
CHAPTER 13
CONCLUSIONS AND SCOPE FOR FURTHER RESEARCH
13.1 GENERAL
This thesis is the outcome of the extensive laboratory research work carried out to
explore the possibility of utilising coir geotextiles (with lndianised connotation "Coir
Bhoovastra"), a natural eco friendly material, for the construction of unpaved roads
and embankments in a beneficial manner. Experiments were done to study the four
fold applications of coir geotextiles viz., separation, reinforcement, filtration and
drainage. This was accomplished by perfonning elaborate laboratory investigations in
different aspects. The main focus in the present investigation was to conduct
systematic research work on the use of coir geotextilcs, so that new methods of
application can be evolved which will pave way for the growth of traditional coir
industry.
13.2 CONCLUSIONS
The major conclusions derived from the studies conducted are summarised below in
different subsections treating each aspects of geotextile functions separately.
13.2.1 Properties of Coir Geotextiles
Three types of coir geotextiles were used in this research \vork. Based on the
properties evaluated and the studies on interfacial friction characteristics, the
following conclusions are made:
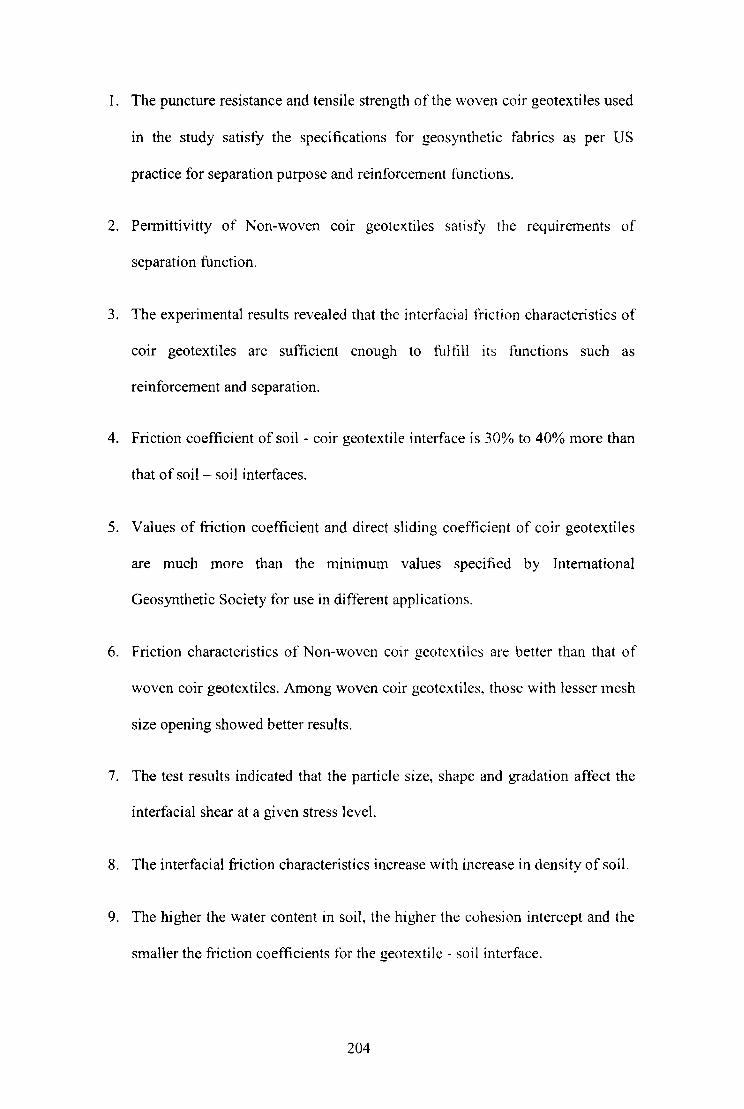
I. The puncture resistance and tensile strength of the woven coir geotextiles used
in the study satisfy the specifications for geosynthctic fabrics as per US
practice for separation purpose and reinforcement functions.
2. Pennittivitty of Non-woven COlr geotextiles satisfy the requirements of
separation function.
3. The experimental results revealed that the interfacial friction characteristics of
coir geotextiles are sufficient enough to fuHill its functions such as
reinforcement and separation.
4. Friction coefficient of soil - coir geotextile interface is 30% to 40% more than
that of soil - soil interfaces.
5. Values of friction coefficient and direct sliding coet1icient of coir geotextiles
are much more than the minimum values specified by International
Geosynthetic Society for use in difterent applications.
6. Friction characteristics of Non-woven cOlr geotextiles are better than that of
woven coir geotextiles. Among woven coir geotextilcs, those with lesser mesh
size opening showed better results.
7. The test results indicated that the particle size, shapc and gradation affect the
interfacial shear at a given stress level.
8. The interfacial friction characteristics increase with increase in density of soil.
9. The higher the water content in soil, the higher the cohesion intercept and the
smaller the friction coefficients for the geotextik - soil interface.
204
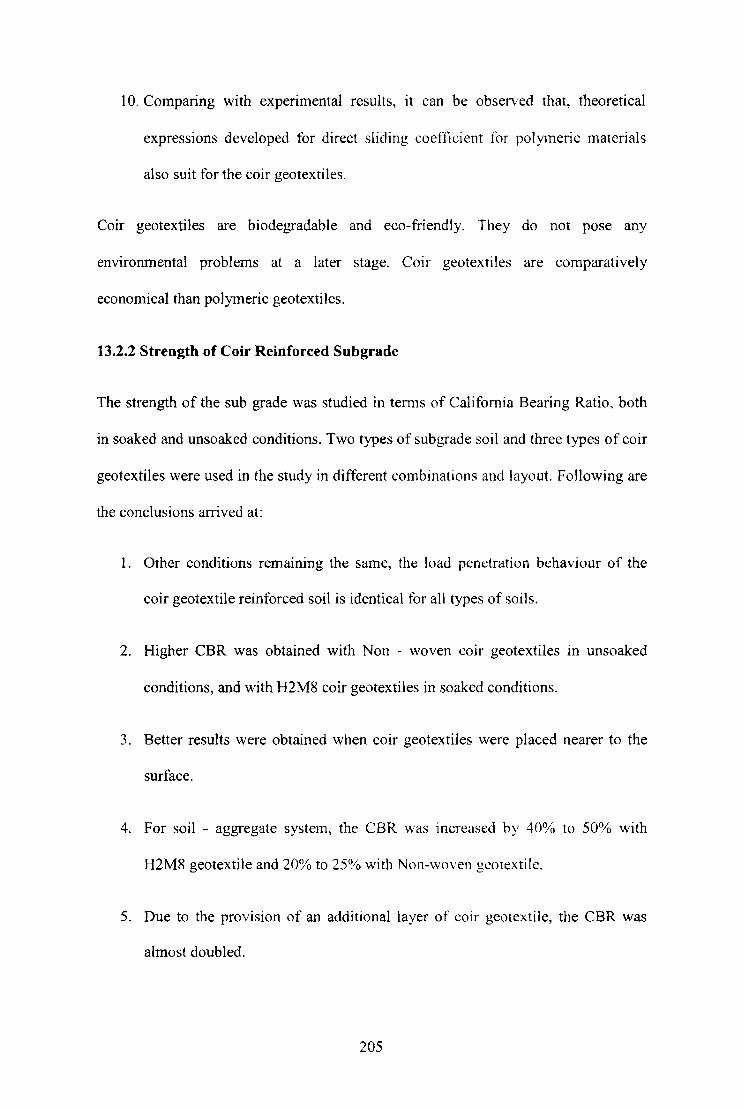
10. Comparing with experimental results, it can be observed that, theoretical
expressions developed for direct sliding coefficient for polymeric materials
also suit for the coir geotextiles.
Coir geotextiles are biodegradable and eco-friendly. They do not pose any
environmental problems at a later stage. Coir geotextiles are comparatively
economical than polymeric geotextiles.
13.2.2 Strength of Coir Reinforced Subgrade
The strength of the sub grade was studied in tenns of California Bearing Ratio, both
in soaked and unsoaked conditions. Two types of subgrade soil and three types of coir
geotextiles were used in the study in different combinations and layout. Following are
the conclusions arrived at:
1. Other conditions remaining the same, the load penetration behaviour of the
coir geotextile reinforced soil is identical for all types of soils.
2. Higher CBR was obtained with Non - woven coir geotextiles in unsoaked
conditions, and with H2M8 coir geotextiles in soaked conditions.
3. Better results were obtained when coir geotextiles were placed nearer to the
surface.
4. For soil - aggregate system, the CBR was increased by 40% to 50% with
H2M8 geotextile and 20% to 25% with Non-woven gcotextile.
5. Due to the provision of an additional layer of coir geotextile, the CBR was
almost doubled.
205

6. The beneficial effect of coir reinforcement is found to he more with poor soil
and that too, in the soaked condition.
7. The CBR of the coir geotextile reinforced subgrade depends on the strength of
sub grade, properties of coir geotextile and the placement depth of coir
geotextile.
8. The equivalent (or modified) CBR for the coir geotextile reinforced subgrade
can be obtained, correlating the properties of soil, properties of coir geotextiles
and placement location of geotextile
13.2.3 Bearing Capacity
To evaluate the bearing capacity and settlement characteristics of reinforced soil,
investigations were done with three types of natural coir geotextiles in reinforced sand
beds. Based on these load tests, the following conclusions are drawn.
1. The results clearly demonstrate that coir geotextiles, a natural product, can
substantially increase the bearing capacity of shallow square footing on sand.
The behaviour was found to be identical in both dry and saturated conditions.
The improved perfonnance can be attrihuted to incrcnsc in shear strength in
reinforced soil mass due to the inclusion of coir gcotextilc reintorcement,
owing to high interfacial friction between the geotextile and soil.
2. The bearing capacity of reinforced sand was found to increase up to 80% in
dry condition and up to 160% in saturation condition depending on the type of
COif geotextiles.
206
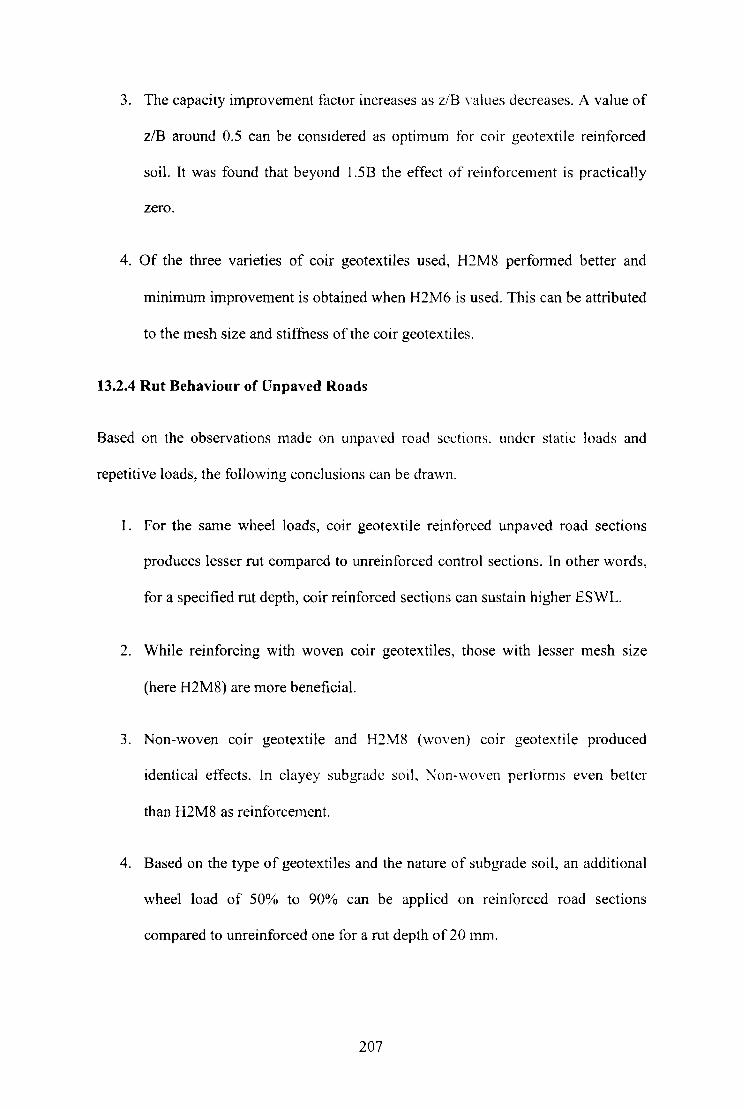
3. The capacity improvement factor increases as z/B values decreases. A value of
zlB around 0.5 can be considered as optimum for coir geotextile reinforced
soil. It was found that beyond I.SB the effect of reinforcement is practically
zero.
4. Of the three varieties of coir geotextiles used, H2MS perfonned better and
minimum improvement is obtained when H2M6 is used. This can be attributed
to the mesh size and stiffuess of the coir geotextiles.
13.2.4 Rut Behaviour of Unpaved Roads
Based on the observations made on unpaved road scdions. under static loads and
repetitive loads, the following conclusions can be drawn.
I. For the same wheel loads, coir geotextile reinforced unpaved road sections
produces lesser rut compared to unreinforced control sections. In other words,
for a specified rut depth, coir reinforced sections can sustain higher ESWL.
2. While reinforcing with woven coir geotextiles, those with lesser mesh size
(here H2MS) are more beneficial.
3. Non-woven cOlr geotextile and H2M8 (woven) cOlr geotextile produced
identical effects. In clayey subgradc soiL Non-woven performs even better
than H2M8 as reinforcement.
4. Based on the type of geotextiles and the nature of sub grade soil, an additional
wheel load of 50% to 90% can be applied on reinforced road sections
compared to unreinforced one for a rut depth of 20 mm.
207

5. From the studies it is observed that an additional reinforcement layer within
the subgrade can produce improvement in the perfonnancc of the system, only
to a limited extent.
6. Coir geotextiles placed between sub grade and sub base can substantially
reduce the rut depth due to repetitive wheel loads
7. The rut behaviour under repetitive loads of unpaved road sections reinforced
with woven H2M8 and non-woven AGL C/201 were found to be identical.
8. The percentage reduction in rut depth was found to be 50(1'0 while using H2M8
or Non-woven coir geotextiles. The corresponding reduction with H2M6 coir
geotextile was found to be 38%.
13.2.5 Design of Unpaved Road Sections
Three different approaches of design were considered in the present work. Design
charts were prepared for easy detennination of pavement thickness. Salient points
derived are given below.
1. It was seen that the thickness of the section is reduced by the introduction of
coir geotextile, whichever be the method applied for finding the base course
aggregate thickness.
2. The reduction in thickness of the aggregate layer is of the ordcr of 40%.
3. If we consider the cost of aggregate saved and cost of coir geotextiles used,
coir reinforced sections are more economical than unreinforced sections.
208

13.2.6 Prefabricated Coir Geotextile Vertical Drains
In order to assess the drainage and filtration characteristics of coir geotextile extensive
laboratory investigations were carried out on two types of coir gcotextile drains with
different configurations and based on that, the following conclusions are made.
1. Of the two types of coir geotextile vertical drains tried, the circular type was
found to be more efficient,
2. Installation of the rectangular type is simple compared to circular type because
there is no withdrawal of casing pipe and filling of the drains.
3. The triangular disposition was found to be more efficient than central and
rectangular dispositions.
4. The performance of drains with H2M8 coir geotextiles was better than that
with H2M6 coir geotextiles.
5. Combining all parameters it is seen that circular type coir geotextile drains
using H2M8 coir geotextiles, installed in triangular pattern, gives maximum
benefit in tenns of consolidation settlement.
6. It is seen that for IOmm settlement to take place under a pressure of 1 OkPa, the
time required was reduced by 50% in the case of circular drains in triangular
pattern.
7. In general the time for consolidation is very much reduced due to the
provisions of the circular and the rectanb'Ular coir geotextile drains in all the
configurations tested. While comparing the perfonnancc of the types of coir
drains, it is seen that, the drains using H2M8 performed better than that of
209
H2M6 coir geotextiles. Again, the triangular configuration is found to be more
efficient than other patterns tried. Much better result was obtained with
circular type of drains compared to rectangular type of drains.
The coir geotextiles are cheap compared to its polymeric counter parts. Besides, coir
geotextiles are eco-friendly and biodegradable and also provide work opportunities to
weaker sections of the society. Hence such types of drains are adaptable to countries
having large production of coconut.
13.2.7 Soil- Coir Fibre Composites
On degradation of the coir geotextile, the coir fibres remain in soil. This part of the
work was aimed at the effect of discrete randomly oriented coir fibres on the
perfonnance of pavement supporting soil. The effect of fibre content and fibre length
was investigated by conducting experiments on soil fibre blend. The major
conclusions from the experimental results are listed below:
1. The UCC increases initially and decreases after a particular value of fibre
content. Similar variation was obtained with change in fibre length.
2. It was established that there exists a definite optimum fihrc content and fibre
length, which give rise to maximum value of UCC. The optimum fibre content
is in the range of 1.75% to 2% and fibre length 10 mm to 12mm.
3. Similarly, the optimum fibre length and fibre content to give maximum triaxial
shear strength were found to be 15mm and 1.25% respectively for the soils
tested at optimum moisture content and maximum dry density.
210

4. Considering the settlement characteristics, in general, void ratio decreases with
the fibre content and this reduction is directly proportional to the applied
pressure. It was also observed that the increase in fibre length causes a
reduction in void ratio, owing to easy drainage path.
5. In tenns of compression index, inclusion of fibre reduces the compression
index leading to lesser settlement. Similarly coefficient of consolidation
increases as the fibre content increases, which in turn reduces the
consolidation time required to achieve a specified degree of consolidation.
6. From the statistical analysis of the results obtained from the laboratory
experiments, an expression for void ratio is developed, which can be used for
predicting the void ratio in terms of consolidation pressure and fibre properties
viz., length and quantity.
13.3 CONCLUDING REMARKS
After considering the above conclusions, the following points in connection with the
utilisation of coir geotextiles in unpaved roads and embankments are established.
(i) Reduces the intensity of stress on the subgrade (Function: Separation),
(ii) Reduces the thickness of aggregate required to stabilize the subgrade
(Function: Separation and Reinforcement),
(iii) Minimises disturbance of the sub grade during and after construction
(Function: Separation and Reinforcement),
(iv) Increases the subgrade strength over time (Function: Filtration),
211

(v) Minimises the differential settlement of the roadway, \vhich helps to
maintain pavement integrity and unit<.mnity (Function: and
Reinforcement),
(vi) Prevents subgrade fines from pumpmg into the base (Function:
Separation),
(vii) Prevents contamination of the base materials allowing more open graded,
free draining aggregates to be considered in the design (Function:
Separation and Filtration),
(viii) Reduces the depth of excavation required for the removal of unsuitable
subgrade materials (Function: Separation and Reinforcement), and
(ix) Minimises the maintenance and extend the life of the pavement
(Functions: Separation, Reinforcement and Filtration)
This work is concluded with a hopeful note that the results obtained here would lead
to more applications of coir geotextiles in the field constructions of unpaved roads
with increased level of confidence.
13.4 SCOPE FOR FURTHER RESEARCH
Though exhaustive, the present study was contined to two types of suhgrade soils and
three types of coir geotextiles. There is suhstantial scope t(lr carrying out further work
in this area. The possible research ideas for future work are summarized below.
1. The present work can be extended considering more varieties of cOlr
geotextiles and soils.
212
2. In the studies concerned with prefabricated drains, the measurement of pore
water pressure and discharge capacity of drains can be made. Again the effect
of smear can be studied.
3. Field tests can be carried out to get the long-tCn11 effects.
4. Studies related to degradation aspects and their effects can be studied.
213
REFERENCES AND BIBLIOGRAPHY
References:
1. AASHO (1962) "AASHO Road Test", Highway Research Board, Report No.
9, 61-£, Washington. D.e.
2. AASHTO (1993) "Guide for design of pavement structures", American
Association o/State Highway and Transportation Officials, Washington DC.
3. Adams, M. T., and Collin, J.G (1997) "Large model spread load test on
geosynthetic reinforced soil foundations", Journal ol Geotechnical and
Geoenvironmental Engineering, ASCE, 123, 66 -72.
4. ASTM (1993) "Standards on geosynthetics" American SocietJ'for Testing and
Materials, Philadelphia. 1-129.
5. ASTM D3080 (2004) "Standard test method for Direct Shear test of soils
under consolidated drained conditions", American SOCiety for Testing and
Materials, Philadelphia.
6. ASTM D4439 (2004) 'Tenninology f()r geotextiles", American SOCiety for
Testing and Materials, Philadelphia.
7. ASTM D5321 (2002) "Test method for detennining the coemcient of soil
and geosynthetic or geosynthetic and geosynthetic friction by the direct shear
method". American societyfor Testing and Materials ", Philadelphia.
8. Ayyar, T. S., and Girish, M. S. (2000) "Improvement of durability of coir
geotextiles", Proceedings of Indian Geotechnical Conferellce, Bombay.

9. Ayyar, T. S. R., and Dipu, V. S. (1997) "Coir geotcxtilcs as reinforcement in
foundation", Proceedings of" Coil' Board Seminar 011 Coir geotextiles,
Coimbatore.
10. Ayyar, T. S. R., Nair, C. G. Rand Nair, N. B. (2002) "Comprehensive
Reference Book on Coir Geotextiles", Centre for Development of Coir
Technology, Thiruvananthapuram, India.
11. Ayyar, T. S. R; Joseph, J., and Beena, K. S. (1988) "Bearing Capacity of
Sand Reinforced with Coir Rope", First fndian Geotextile Conference on
Reinforced soils and Geotextiles, Bombay, All - Al6.
12. Banerjee, P. K., (1996) "Development of new geosynthetic products through
blends of natural fibres" Proceedings of the Jl1fernalional seminar and
Technomeet on Environmental Geotechnology with geo/)ynthetics, New Delhi.
13. Barenburg, E. J., Dowland, J. H., and Hales, H. (1975) "Evaluation of soil
aggregate Systems with Mirafi fabric" Civil Engineering Studies Department
of Civil Engineering, University of lllinois.
14. Beena, K. S. (1986) "Bearing capacity of sand reinforced with coir rope",
M. Tech Thesis submitted to University ofKerala, India
15. Beena, K.S (1993) "Studies on the settlement of reinforced sand in
foundations", PhD thesis submitted to Indian Jnstilllte o/"Tcchl1ology, Madras.
16. Binquet, J., and Lee, K. L. (l975a) "Bcaring capacity tests on reinforced
earth slabs", Journal of Geotechnical Engineering, ASCE, 101, 1241 - 1255.
215
17. Binquet, J., and Lee, K. L. (1975b) "Bearing capacity tests on reinforced
earth slabs", Journal ofGeotechnical Engineering, ASCE, 101, 1257 -1276.
18. Bo, M. W. (2004) "Discharge capacity of prefabricated vertical drain and their
field measurements" . .!ournal olGeotextiles alld Geomcmbrallcs, 22, 37 - 48.
19. Bonaparte, R., Ah~Line, c., Charron, Rand Tisinger, L. (1988)
"Survivability and durability of a non-woven geotextile", Proceedings ol
symposium. GT div.! ASCE National Convention, Nashville.
20. BS 6906 Part 1 to Part 7 (1989, 1990 & 1991) "Methods of testing of
geotextiles and related products", British Standards Institution,
21. Burd, H. J. (1995) "Analysis of membrane action m reinforced unpaved
roads", Canadian Geotechnical Journal, 32, 946 - 956.
22. Burd, H. J., and Brochlehurst, C. J. (1990) "Finite element studies of the
mechanics of reinforced unpaved roads", Proceedings o( the 4,h International
Conference on Geotextiles. Geomembranes and Related Products, A.A
Balkeme, Rotterdam, Netherlands, 217 -222.
23. Burd, H. J., and Brochlehurst, C. J. (1992) "Parametric studies of a soil
reinforcement problem using finite element analysis", Proceedings ol the 7'h
International Conference on Computer Methods and Advances in
Geomechnics, Cairns, Australia. Yol.3, 1783 - 1788.
24. Burmister, D. M. (1943) "The theory of stresses and displacements in layered
systems and applications to the design of airport runways", Proceedings ol
Highway Research board, 23, 126-144.
216
25. Cammack, A. (1988) "A role for coir tibre geofabrics in soil stabilization and
erosion control", Proceedings of the 11'orkshop on coir geogrids and
geofabrics in Civil Engineering Practice, Coimbatore, India, 28 -31.
26. Chai, J. c., Miura, N., and Nomura, T. (2004) "Effect of hydraulic radius
on long term drainage capacity of geosynthetic drains", Journal of Geotextiles
and Geomembranes, 22 , 3 -16.
27. Chakroborty, P., and Das, A. (2003) "Principles of Transportation
Engineering", Prentice - Hall o.flndia Private LimiTed. New Delhi.
28. Chan, F., Barksdale, R. D., and Brown, S. F. (1989) "Aggregate base
reinforcement of surfaced pavements", Journal of' Geotextiles and
Geomembranes, 8,165 -189.
29. Chew, S. H., Karunaratne, G. P., Kuma, V. M., Lirn, L. H., Toh, M. L.
and Hee, A. M. (2004) "A field trial for soft clay consolidation using electric
vertical drains", Journal ofGeotextiles and Geomembranes, 22, 17 - 35.
30. Chu, J., 80, M.W., and Choa.V (2004) "Practical considerations for using
vertical drains in soil improvement projects". JOlll'llal of" Cico(ex(iles and
Geomembranes, 22,101-117.
31. Coir Board (1996) "Hand book on constructional details of coir and COlr
products", Coir Board, Kochi, India.
32. CSIR (1960) " COIR: its extraction, properties and uses", Council of
Scientific and Industrial Research, New Delhi.
217

33. Dam, J. E.G. V. (l999) " Coir Processing Technologies" , Technical Report
Number 6, ATO bv, Wageningen, Netherlands.
34. Datye, K. R. (1988) "Natural materials for soil reinforcement", Proceedings
of the International Geotechnical Symposium on them)' and Practice of earth
reinforcement, Fukuoka, 69 - 74.
35. Datye, K. R., and Gore, V. N. (1994) "Application of Natural geotextiles and
related products", Journal of Geotextilcs and GeolllclJlhrallcs. 13, 371 - 388.
36. Dixit, R. K., and Mandal, J. N. (1993) "Bearing capacity of geosynthetic
reinforced soil using variational method", Journal of Geotextiles and
Geomembranes, 12, 543 - 566.
37. Edil, T. B. (2006) "Deflection of prototype geosynthetic - Reinforced
working platforms over soft sub grad e" , Transportation Research Record,
Washington DC.
38. Gabr, M. A., and Hart, J. H. (2000) "Elastic modulus of geogrid reinforced
sand using plate load tests", Geotechnical Testing J01lrnal, ASTM, 23, 245 -
250.
39. Giroud, J. P., and Han, J. (2004a) "Design methods for geogrid - reinforced
unpaved roads: I. Development of design methods", Journal of Geotechnical
and Geoenvironmental Engineering, ASCE, 130, 775 - 786.
40. Giroud, J. P., and Han, J. (2004b) "Design methods for geogrid - reinforced
unpaved roads: II Calibrations and Applications", Journal of Geotechnical and
Geoenvironmental Engineering, ASCE,130, 787-797.
218

41. Giroud, J.P. and Noiray, L. (1981) "Geotextile reinforced unpaved road
design", Journal of Geotechnical Engineering Division, ASCE, 107, 1233 -
1254.
42. Guido, V.A., Chang, D.K., and Sweeney, M.A. (1986) "Comparison of
geogrid and geotextile reinforced slabs", Canadian gco/cchnicaljournal, 23,
435 - 440.
43. Haliburton, J. A. and Baren, J.V. (1983) "Optimum depth method for
design of fabric reinforced unsurfaced road", Transportation Research
Record, 917.
44. Hansbo, S. (1979) "Consolidation of clay by band shaped prefabricated
drains", Journal of Ground engineering, ] 2, 16 - 25.
45. Hansbo, S. (1981) "Consolidation of fine grained soils by prefabricated
drains", Proceedings of the 10th lnternatonal Conference on Soil Mechanics.
Vo1.3, Stockholm, 677 -682.
46. Haung, C. C., and Tatsuaoka, K (1990) "Bearing capacity of reinforced
horizontal sandy ground", Journal ofGeotextiles and Gcomembranes, 9, 51 -
82.
47. Hausmann, R. M. (1990) "Engineering principles of ground modification",
Mc Graw Hill Publishing Company, Singapore.
48. Hawlader, B. C., Imai, G. and Muhunthan, B. (2002) "Numerical study of
the factors affecting the consolidation of the clay with vertical drains". Journal
of Geotextiles and Geomembrancs, 20, 213 - 239.
219
49. Holtz, R. D., and Sivakugan, N. (1987) "Design charts for roads with
geotextiles", Journal of geotextiles and geomembranes , 5, 191 -199.
50. Holtz, R. D., Jamiolkoweki, M. B., Lancellotto, R., and Pedroni, R. (1991)
"Prefabricated vertical drains: Design and pcrfonnance·'. Buttenvorth
Heinnemann, Stoneham.
51. Hopkins, T. C. (1991) "Bearing capacity analysis of pav'ements, Research
reports" KTC-91-8, University of Kentuclcy Transportation Centre, College of
Engineering, Lexington, Kentucky, UK.
52. Horonjeff, R., and Mckelvey, F. X., (1983) Planning and Desi!:,1J1 of Airports,
Mc Graw-Hill Book Company, New York.
53. Houlsby, G.T and Jewell, R.A (1990) "Design of reinforced unpaved roads
for small rut depths", Geotextiles, Geomembranes and Related Products,
A.A.Balkema, Rotterdam, 171 - 176.
54. HRB, (1945) •. Report of committee on classifi<.:ation of materials for
subgrades and granular types roads", Pro<.:eedings of High\vay Research
Board, 25, 376 - 384.
55. IRC:37 (2001) "Guidelines for the design of f1exible pavements (Second
Revision), Indian Roads Congress, New Delhi, India.
56. IRC:SP:20 (2002) "Rural Roads Manual" Indian Roads Congress, New
Delhi, India.
57. IRC: (2004) "Specifications for Rural Roads", Indian Roads Congress, New
Delhi, India.
220

58. IS: 2386 - 1963 " Methods of test for aggregates for concrete", Bureau of
Indian standards, New Delhi.
59. IS: SP: 36 - Part 1 (1987), "Compendium of Indian Standards on Soil
Engineering- Part 1 Laboratory testing of soils for Civil Engineering
purposes", Bureau of Indian Standards, New Delhi, India.
60. Jang, Y. S., Park, C. S., Park, J. Y., and Kim, S. S (1999) .. A study on
consolidation behaviour of dredged clay 1,1/ith horizontal drains ", 11 th Asian
conference on Soil Mechanics and Geotechnical Engineering, Seoul, Korea.
61. Jayaganesh, K. K (2002) "Studies on Reinforced Unpaved Roads", M.Tech
Thesis submitted to Indian Institute o.fTechnology Madras. Chennai, India
62. Jayadeep, T. (1997) "Comparison of intcrfac~ frictional properties of
synthetic geotextiles and coir mat", Proceedings of Coil' Board seminar on
Coir Geotextiles, Coimbatore, India.
63. Jewell, R. A. (1996) "Soil Rentoecement with Geotextiles" CIRIA
Publication, Thomas Telford, U.K
64. Jewell, R. A., and Wroth, C.P (1987) "Direct shear tests on reinforced sand",
Journal of Geotechnique, 37, 53 -68.
65. Johnson, R. A. (2001) Miller & Freund's Problems and Statistics for
Engineers, 5th Edition, Prentice Hall of India, '0!ew Delhi.
221
66. Kaniraj, S. R., and Rao, G.V. (1994) "Trends in the use of geotextiles in
India", Journal ofgeotextiles and geomembranes, 13389 - 402.
67. Kansas State Highway Commission (1947) "Design of flexible pavement
using the triaxial test", Bulletin 8, Highway Research Board.
68. Khing, K. H., Das, B. M., Puri, V.K., Cook, E.E and Yen, S.c. (\993) '"The
Bearing Capacity of a Strip Foundation on Geogrid Reinforced Sand",journal
of geotextiles and geomembranes, 12,351- -361.
69. Kjellmann, W. (1948) "Accelerating consolidation of fine grained soil by
means of card board wicks", Proceedings of 2,rd international conference on
soil mechanics, Rotterdam, Vol I1, 302 - 305.
70. Koerner, R. M. (2005) "Designing with geosynthetics- 5th ed". Pearson
Prentice Hall, Upper Saddle River, New Jersey.
71. Kulkarni, A. G.,Cherian, K. A., Sathyanarayana, K.G., and Rohatgi, P.
K. (1983) " Studies on Moisture sorption in cOlr fibres (Cocos Nucifera L)",
Journal of Applied Polymer Science, 28, 625-632.
72. Kumar, A. and Saran, S. (2003b) Closely spaced footings on geogrid -
reinforced sand", Journal of Geotechnical and Geoenvironmental
Engineering, ASCE, 7, 660 - 624.
73. Kumar, A., and Saran, S. (2003a) "Bearing capacity of Rectangular footing
on reinforced soil", Journal o(Geotechnicaf and Geological Engineering. 21,
201 -224.
222
74. Kurian, N. P., Beena, K. S., and Krishnakumar, K., (1997) "Settlement of
Reinforced Sand III Foundations", Journal of Geotechnical and
Geoenvironmental Engineering, ASCE, 123. 818 - 827.
75. Lanier, J. (1991) "use of natural Geotextiles in wet land mitigation",
Proceedings of the North American Coil' Geotextile Seminar, USA.
76. Lee, S.L, Karunaratne, G.P., Ramaswamy,S.D., Aziz, M.A and Gupta,
N.C.D (1994) "Natural geosynthetic drain for soil improvemenf', Journal of
Geotextiles and Geomembranes, 13,457 - 474.
77. Lekha (2004) " Field instrumentation and monitoring of soil erosion in Coir
Geotextile stabilsed slope - A case study", Journal of geotextiles and
Geomembranes, 22,399 - 413.
78. Lorenzo, G.A, Bergado, D.T, Bundhai, W., Hormdee, 0 and
Phothiraksanon, P (2004) "Innovations and Performances of PVD and dual
function Geosynthetic Applications", Journal of Geotextiles and
Geomembranes, 22, 75 - 99.
79. Mahmood, A. A., Zakaria, N. A., and Ahmad, F. (2000) "Studies on
geotextile / soil interface shear behaviour", EJGE paper 2000 - 013.
80. Mandal, J. N., and Divshikar, D.G., (2002) A Guide to Geotextile Testing,
New Age International Private Limited. Publishers, New Delhi, India.
81. Mandal, J. N., and Sah, H.S. (1992) .. Bearing capacity tests on geogrid
reinforced clays", Journal ofGeotextiles and Geomebranes. 11,327 - 333.
223
82. Mc Leod, N. W. (1953) "Some basic problems in flexible pavement design",
Proceedings of Highway Research Board. 91 - 118.
83. Mc Leod, N. W. (1956) "Flexible pavement thickness requirements",
Proceedings of the association of asphalt paving technologists, Vol. 25.
84. MilIigan, G. W. E., Jewell, R. A., Houlsby, G.T and Burd, H. J. (1989a) "A
new approach to the design of unpaved roads, Part 1", Ground Engineering,
22,25 -29.
85. MiIligan, G. W. E., Jewell, R. A., Houlsby, G.T and Burd, H. J. (1989b)
"A new approach to the design of unpa\'ed roads, Part 11", Ground
Engineering, 22, 37 - 42.
86. MORD (2004) "Specifications for Rural Roads", Indian Roads Congress,
New Delhi.
87. Mwasha, A., and Sarsby, R. W. (2003) "Time dependent behaviour of
embankment reinforced with limited life geotextiles". Proceedings of the RICS
Foundation construction and building research c011ference, School of Built
Environment, University of Wolverhampton, U.K. 456 - 469.
88. O'Rourke, T. D., Druschel, S. J and NetravaJli, A. N (1990) "Shear strength
characteristics of sand polymer interfaces", Journal 0/ Geotechnical
Engineering, ASCE, 116,451 - 469.
89. Omar, M. T., Das, B. M., Puri,V. K., and Yen, S. C (1993) "Ultimate
bearing capacity of shallow foundations on sand with geogrid reinforcement",
Canadian Geotechnical Journal, 30, 545 - 549.
224

90. Omar, M. T., Das, B. M., Yen, S. c., Puri, V. K., and Cook, E.E (1993)
"Ultimate bearing capacity of rectangular foundations on geogrid reinforced
sand", Geotechnical Testing Journal, ASTM, 16,246 - 252.
91. Otani, J., Ochiai, H., and Yamamoto, K. (1998) "Bearing capacity analysis
of reinforced foundations on cohesive soil", Journal of Geotextiles and
Geomembranes, 16, 195 - 206.
92. Paikowsky, S. G., and Player, C. C. (1994) .. Experimental study on Friction
of Granular material along an Interface", National Science Foundation and the
Air Force.
93. Palmeria, E. M. (1988) "Discussion on Direct shear test on reinforced soil by
lewell and Wroth", Journal ofGeotechnique, 38 146 - 148.
94. Palmeria, E. M., and Milligan, G. W. E. (1989) "Scale and other factors
affecting the results of pull out tests of grids buried in sand", Geotechnique,
39, 511 -524.
95. Perkins, S. W., and Ismeik, M. (1997) "A synthesis and evaluation of
geosynthetic reinforced base layers In flexible pavements: Part 1",
Geosynthetic international, 549 - 604.
96, Porter, O. J. (1950) "Development of the original method for highway
design", Symposium on development of CBR flexible pavement design method
for air fields, Transactions of ASCE, 461 - 467.
225
97. Prasad, S. V., Pavithran, c., and Rohatgi, P. K. (1983) "Alkali treatment of
coir fibres for coir polyester composites", Journal of Materials Science, 18,
1443 - 1454.
98. Puri, V. K., Hsiao, J. K., and Chai, A. J. (2005) "Effect of vertical
reinforcement on ultimate bearing capacity of sand subgrades", EJGE paper
2005-0610.
99. Rajagopal, K., and Ramakrishna, S. (1998) "A study on the COlr
reinforcement for strengthening soft soil subgrade", Sixth International
Conference on Geosynthetics. Atlanta, USA, 919 - 922.
100. Ramakrishna, S. (1996) "Investigations on applications of coir reinforcement
in Geotechnical Engineering", MS Thesis submitted to Indian Institute of
Technology Madras, Chennai.
101. Ramaswamy, S. D., and Aziz, M. A .(1982) "Jute fabric in road
construction", Proceedings of 2nd International Conference on Geotextiles,
Las Vegas, 359 -363
102. Ramaswamy, S. D., and Aziz, M. A .(1983) "An investigation of Jute fabrics
as a geotextile for sub grade stabilization", Proceedings of" the 4,/i Conference
on Road Engineering, Association of Asia and Australia, Jakarta, 3, 145 - 158.
103. Ranganathan, S.R., (1994)" Development and potential of jute geotextiles",
Journal ofGeotextiles and Geomembranes, 13,421 - 433.
226
104. Rao, G. V., Sampath Kumar, J. P., and Banerjee, P. K. (2000)
"Characterization of a braided strip drain with coir and jute yarns", Journal of
Geotextiles and Geomembranes, 18,367 - 384.
105. Rao, G.V and Balan, K (1994) "eoir geotcxtiles -- A perspective".
proceedings of the 2'ld International 11,'orkshop on gcotextiles, New Delhi,
India, 119 -126.
106. Rao, G.V and Balan, K (Eds) (2000) "Coir geotextiles : Emerging tends",
The Kerala State Coil' Corporation Limited, Alappuzha, Kerala, India.
107. Sampathkumar, J. P., Rao, G. V., and Banerjee, P. K. (2000) "Production
method and evaluation of a jute - coir braided prefabricated vertical drains,
Coir geotextiles emerging trends", Kerala Coir COIporation, Alappuzha,
India, 147 -166.
108. Sarma, U. S. (1997) "Eco friendly and versatile cOlr geotextiles,
Geosynthetics Asia-97", Oxford and IBH, New Delhi, India.
109. Sellmeijer, J. B., Kenter,c. J., and Vandenberg, C. (1982) "Calculation
method for a fabric reinforced road", Proceedings 0/ the 2nd International
Conference on Geotextiles, Las Vegas, 393 - 398.
110. Sheeba, K. P., Shoba, S., Santha Leah Paul and Ramadevi, D. (2000)
"Studies on the potential of coir reinforced structures", Journal of Scientific
and Industrial Research, New Delhi, Vo1.59.
227
Ill. Shen, S. L., Chai.J. C., Hong,Z. S., and Cai, F. X (2005) "Analysis of field
perfonnance of embankments on soft clay deposit with and without PVD
improvement", Journal of Geotextiles and Geomembranes. 23, 101-117.
112. Shin, E. c., and Oh, Y. I. (2004) "Consolidation process of gcotextile tube
filled with fine-grained materials". International Journal of Offshore and
Polar Engineering, 14.
113. Shin, E. c., and Das, B. M. (2000) "Experimental study of Bearing capacity
of a strip foundation on geogrid reinforced sand", Journal of Geosynthetics
International, 7, 59 - 71.
114. Sigurdsson, 0., and Fannin, R. J. (1997) "Construction and performance of
a geosynthetic reinforced unpaved road", Journal of Ground improvement
geosystems, Thomas Telford, London, 322 - 328.
115. Slepak, M. E., and Hopkins, T. C. (1993) "Computer prob'Tam for stability
analysis of embankments with tensile elements", Research Report KTC 93-29,
University of Kentucky Transportation Center, College;: of Engineering,
Lexington, Kentucky, UK.
116. Slepak, M. E., and Hopkins, T. C. (1995a) "Personal Computer program for
analysis of embankments with tensile elements", Research report KTC 93-29 ,
University of Kentucky Transportation Center, College of Engineering,
Lexington, Kentucky, UK.
117. Slepak, M. E., and Hopkins, T. C. (1995b) "Modified perturbation method
m stability analysis of reinforced emth structures", Gcosynthetics -95,
Proceedings o/the International Conference, Nashville, Tennessee, USA.
228

118. Subba Rao, K. S., Allam, M. M., and Robinson, R. G (2000), "Drained
shear strength of fine grained soil solid surface interfaces", Proceedings of
Institution of Civil Engineers, Geotechnical Engineering, 143 ,75 - 81.
119. Subba Rao, K. S., Allam, M. M., and Robinson, R. C. (1996) "A note on
the choice of interfacial friction angle", Proceedings of Institution of Civil
Engineers, Geotechnical Engineering, 119,123 - 128.
120. Subba Rao, K. S., Allam, M. M., and Robinson, R. C. (1998). "Interfacial
friction between sands and solid surfaces", Proceedings o(Institutiol1 of Civil
Engineers, Geotechnical Engineering, 131 , 75 - 82.
121. Subba Rao, K. S., AlIam, M. M., and Robinson, R. G. (2001), "Interfacial
friction between cohesionless soils and solid surfaces", Indian Geotechnical
Journal, 31 (2), 107 - 137.
122. Tateyana, M. (1999) "Manual on Geosynthetic ReinforcedSoil Retaining
walls" Japan railway Technical research, Tokyo.
123. The Tensar Corporation (1998) "Tensar Design Manual", Atlanta GA,
30328.
124. Ullidtz, P. (1986) Pavement analysis, Elsivier, New York.
125. US Navy (1953) "Air field pavement, Bureau of yards and docks", Technical
publication, NAVDOCKS.
126. Vesic, A. S., (1973) "Analysis of Ultimate Loads on Shallow foundations",
Journal of the Soil Mechanics and Foundation Division, American society of
Civil Engineers, 99, 45 - 73.
229
127. Vidal, H. (1969) "The principle of reinforced earth". Highway Research
record, 282, 1-16.
128. Wasage, T. L. J., Ong, G. P., Fwa, T. F., and Tan, S. A. (2004) "Laboratory
evaluation of Rutting Resistance of geosynthetics reinforced Asphalt
pavement, Journal of the Institution of Engineers, Singapore, 44, 29 - 44.
129. Webster, S. L., and Alford, S. J. (1978) "Investigations of Constructions
concepts for Pavements across soft Ground", Technical report S - 78 - 6 US
Anny Engineers Waterways Experiment Station, Vicksusburg.
130. Westergaard, H. M. (1938) "A problcm of elasticity suggested by a problem
in soil mechanics, soft material reinforced by numerous strong horizontal
sheers, Mechanics of solids", Timoshenko 60th anniversary volume,
Macmilian, New York, 268 - 277.
131. White, P. W. (1991) "Flood plain dynamics and available erosion control
techniques", Proceedings of the North American Coi,. Geotextile Seminar,
USA.
132. Yetimogulu, T., Wu, J. T. H., and Saglamer, A., (1994) "Bearing capacity
of Rectangular footings on Geogrid reinforced sand", JOlJrnal o/Geotechnical
Engineering. ASCE, 120, 2083 -2099.
133. Yoder, E. J., and Witczak, M. V. (1975) "Principles of Pavement Design, 2nd
edition", John Wi/ey & Sons, INC.
230
Bibliography:
1. IRC: SP:59 (2002) Guidelines for use of geotextile in road pavements and
associated works, Indian Roads Congress. New Delhi. India.
2. IRC: State - of - the Art: applications of gcotextiles in Highway Engineering,
Special report 12, Highway Research Board, Indian Roads Congress. New
Delhi, India.
3. John, N. W. M {l987) Geotextiles, Blackie, London.
4. Jones, C. J. F. P (1985) Earth reinforcement and soil structures, Butterworths,
London
5. Mandal, J. N (Ed) (1994) Geosyhetics world, Ne.\! Age International Private
Ltd., Publishers, New Delhi, India.
6. Montigomery, R. A (2003) Design and Analysis of Experiments, 5th Edition,
John Wiley and Sons (Asia) Pte. Ltd. Singapore.
7. Purushothamaraj, P. (1999) "Ground improvement techniques", Laxmi
Publications (P) Ltd, New Delhi.
8. Rankilor, P. R (1981) Membranes in Ground Engineering, John Wileyand
Sons Ltd. New York.
9. Koerner, R. M. (1985) Construction and Geotechnical Methods in
Foundation Engineering, McGraw - Hill book company, Singapore.
10. Vansantvoort, G. P.T. M (Ed) 1994) Geotexti1cs and Geomembranes in Civil
Engineering, Revised Edition, Oxford & IBH Publishing Company, New
Delhi, India.
231

PUBLICATIONS BASED ON THE RESEARCH
1. Beena, K.S and Babu, K.K "Effectiveness of coir geotextilc vertical drains for
ground improvement", Journal of Ground Improvement, Thomas Telford,
London. (Under Review)
2. Beena, KS and Babu, KK (2003) -'Studies on the perfonnance of eoir
geotextiles in subgrade soil", Golden Jubilee conference on coir gcotextiles,
coir Board, Kochi, India.
3. Babu, K.K., Beena, K.S and Raji, A. K '-Rut behaviour of coir geotextile
reinforced unpaved roads", Indian Roads Conf,'Tess Journal (Under review)
4. Beena, K.S and Babu, K.K "Volume change behaviour of eoir fibre reinforced
silty clay", Journal of Soils and Foundations, Japanese Geotcchnical Society,
Japan (Under review)
232