effectiveness of financial inclusion programme in kerala - Dyuthi
239
EFFECTIV P Cochin U T Sch Cochin Un VENESS OF FINANCIAL INCL PROGRAMME IN KERALA Thesis submitted to University of Science and Tech for the award of the Degree of Doctor of Philosophy under The Faculty of Social Sciences by Raihanath M.P. Under the Guidance of Dr. K. B. Pavithran hool of Management Studie niversity of Science and Tec Kochi – 682022 MAY 2019 LUSION hnology es chnology
-
Upload
khangminh22 -
Category
Documents
-
view
4 -
download
0
Transcript of effectiveness of financial inclusion programme in kerala - Dyuthi

EFFECTIVENESS OF FINANCIAL INCLUSION
PROGRAMME IN KERALA
Cochin University of Science and Technology
The Faculty of Social Sciences
School of Management Studies
Cochin University of Science and Technology
EFFECTIVENESS OF FINANCIAL INCLUSION
PROGRAMME IN KERALA
Thesis submitted to
Cochin University of Science and Technologyfor the award of the Degree of
Doctor of Philosophy under
The Faculty of Social Sciences
by
Raihanath M.P.
Under the Guidance of
Dr. K. B. Pavithran
School of Management StudiesCochin University of Science and Technology
Kochi – 682022
MAY 2019
EFFECTIVENESS OF FINANCIAL INCLUSION
Cochin University of Science and Technology
School of Management Studies Cochin University of Science and Technology

Effectiveness of Financial Inclusion Programme in Kerala
Ph. D Thesis under the Faculty of Social Sciences
Author
Raihanath M.P.
School of Management Studies
Cochin University of Science and Technology
Cochin - 682 022, Kerala, India
email: [email protected]
Supervising Guide
Dr. K. B. Pavithran
Professor (Retired),
School of Management Studies
Cochin University of Science and Technology
Cochin - 682 022, Kerala, India
email: [email protected]
School of Management Studies
Cochin University of Science and Technology
Kochi - 682 022
May 2019

This is to certify that thesis entitled “EFFECTIVENESS OF FINANCIAL
INCLUSION PROGRAMME IN KERALA” is a record of bonafide research work
done by Ms. Raihanath M.P., part-time research scholar, under my supervision and
guidance.
The thesis is the outcome of her original work and has not formed the basis for the
award of any degree, diploma, associateship, fellowship or any other similar title and
is worth submitting for the award of the degree of Doctor of Philosophy under the
Faculty of Social Sciences of Cochin University of Science and Technology.
All the relevant corrections and modifications suggested by the audience during
the pre-synopsis seminar and recommended by the Doctoral committee have been
incorporated in the thesis
Dr. K. B. Pavithran
Research Guide


I hereby declare that this thesis entitled “EFFECTIVENESS OF FINANCIAL
INCLUSION PROGRAMME IN KERALA” is a record of the bonafide research
work done by me and that it has not previously formed the basis for the award of any
degree, diploma, associateship, fellowship, or any other title of recognition.
Raihanath M.P.
Kochi
Date: 29/05/2019


At the outset I bow to my ALMIGHTY for providing me his choicest blessings to
complete this work properly and also for guiding me in all walks of my life.
This research has been made possible by the encouragement, guidance, prayers and
support of many well-wishers. I take this opportunity to acknowledge their support to
this study.
I am deeply indebted and express my sincere gratitude to my supervising guide
Prof.(Dr).K.B Pavithran, Professor(Retd.), School of Management Studies, Cochin
University of Science and Technology, Cochin, who made possible me to initiate,
pursue and complete the study. His constant guidance and encouragement have been
largely responsible for my pursuit of investigation reported here in.
I take this opportunity to express my sincere gratitude to Prof. (Dr). D. Mavoothu,
Professor and Director, School of Management Studies, Cochin University of Science
and Technology, Cochin, for his valuable suggestions and constant inspirations.
I am thankful to Dr. S. Rajitha Kumar, Professor, School of Management Studies,
Cochin University of Science and Technology, Cochin, for his incessant support and
encouragement extended to me during the completion of my work and also for being
my Doctoral Committee Member and giving me necessary advices for the completion
of this study.
My special thanks to Prof. (Dr). Moli P Koshi, Professor, School of Management
Studies, Cochin University of Science and Technology, Cochin, for her
encouragement in doing my thesis work.
I express my gratitude to all the faculty members of SMS: Prof. (Dr.) Sebatian Rupert
Mampilly, Prof. (Dr.) James Manalel, Dr. V. P. Jagathy Raj, Dr. K. Krishnan
Namboothiri, Dr. Sam Thomas, Dr. K. A. Zakkaria, Dr. Manoj Edward, Dr.
Mohammed Aslam, Dr. Sreejesh S, Dr. Santhosh Kumar, Dr. Sangeetha, Dr. Manu
Melwin Joy, and Dr. Devi Soumyaja for giving me valuable support and suggestions
in completing this study.


I am obliged to express my gratitude to all teachers in the PG Department of
Commerce, PRNSS College, Mattanur, Kannur, for giving me the valuable
suggestions and encouragement. I wish to express my gratitude to all members of the
Office of Lead Bank (Syndicate), Kannur, especially to Lead District Manager
Jayaram.
I also extend my hearty thanks to all of the library and office staff of School of
Management Studies, Cochin University of Science and Technology, Cochin, and
Central Library for providing related books and articles.
I also extend my gratitude to my husband Abdul Kalam P, daughters (Fathwima
and Aifa), parents (Safiya & Aboobacker), siblings and other family members
whose prayers are always my encouragement.
Last, but not least I express my sincere thanks to all my friends those who gave their
extended support and for their co-operation.
Raihanath M.P


Abstract
Financial inclusion is a great step to alleviate poverty in India as the core function of
the programme is accessing credit. In India, two states (Kerala and Goa) and three
union territories were declared as hundred percent financially included on 14th
November 2014 by the government of India. Kerala has highest account penetration in
India as per account opening. In narrow approach, financial inclusion can be happen
when a person opens an account in the formal financial sector. Where as in broader
sense, it happens only when the beneficiaries have upliftment from their level of
economic status through income generation, additional employment generation and
asset creation. It is in this situation felt necessary to check to what extend the
programme achieved its overall objective of going beyond mere figures. Thus present
study focuses on the effectiveness of financial inclusion programme from both sides.
That is, from supply side (banks or service providers) as well as demand side
(beneficiaries of Financial Inclusions Programme).
Statement of the Problem:
Majority of the research in the area of financial inclusion is focusing on the
problems of individuals who are excluded and finding measures for reaching to them.
Latest initiative or finding as part of the programme is opening of accounts in the
name ‘Jan-Dhan Yojana’. However, most of the efforts from the government and
Banks have been in the direction of opening of accounts, which is only a technical
step in the process of financial inclusion. There were only few attempts of
comprehensive studies done to look at the financial inclusion process and to what
extend it is achieving its overall objectives going beyond mere figures. Thus it is very
necessary to check the supply side as well as demand side effectiveness of financial
inclusion programme i.e., whether the financially included poor get the benefits
through the scheme. Therefore present study gives more stress on the effectiveness of
financial inclusion programme, which is measured using financial inclusion index as
well as through developing a model based on the perception of the beneficiaries of the
programme.

Objectives
Based on the conceptual focus highlighted in the earlier sections, this study proceeds
to inquire into the following set of objectives and test the hypothesis framed as under
1. To understand the factors associated with Banking policies, Practices and
implementation of Financial Inclusion Programmes (FIP).
2. To study the extent of accessibility, availability and usage of formal financial
services (as part of FIP) by the beneficiaries- Supply side view.
3. To study the factors associated with the beneficiaries in making use of the
financial services to meet their specific needs.
4. To study the effectiveness of Financial inclusion Programme in the holistic
approach- Demand side Perspectives.
5. To make broad suggestions to improve financial inclusion programme in
Kerala.
Research Hypothesis:
H1: There exists a significant relationship between accessibility and usage
H2: There exists a significant improvement in the income of the beneficiaries due to
credit support of the scheme
H3: There exists a significant improvement in the asset position of the beneficiaries
due to credit support of the scheme
H4: There exists a significant improvement in the self-employment of the
beneficiaries due to credit support of the scheme
H5: there exists a significant interaction effect of financial literacy between
accessibility and financial literacy.
Research Design:
The present research has employed both descriptive and explanatory methods in the
study.
Unit of observation: Individual beneficiaries of Financial Inclusion programme,
which constitutes those who had account (credit accessed) in the formal financial
sector as part of financial inclusion programme.

Sample size
Three hundred beneficiaries of financial inclusion programme.
Tools for Data Collection:
Interview Schedule was used as a tool for collecting primary data.
Data Analysis:
Financial Inclusion Index was used to measure the effectiveness of financial inclusion
programme. MS Excel, SPSS & Warp PLS software were also used for analysing
primary data.
Review of literature:
A comprehensive review of literature pertaining to the research work were done. The
major constructs for measuring effectiveness of Financial Inclusion Programme
namely; accessibility, availability, usage, financial literacy, asset creation; income
generation and employment opportunity in relation with financial inclusion
programme which are relevant to the study were extracted through the literature
survey. Based on the literature survey, the model were developed and the model
became a major contribution to the existing theory of Financial Inclusion Programme.
Effectiveness of Financial Inclusion Programme (FIP):
I. Effectiveness of financial inclusion from the supply side were studied
using Financial Inclusion Index (FII). Formula for calculating FII is as
follows:
n
FII = 1/n x ∑ zi
i=1
From supply side, there are three dimensions namely, accessibility, availability and
usage.

II. Effectiveness of Financial Inclusion Programme(FIP) from demand
side:
Effectiveness of financial inclusion programme using the FII from supply side
provides average figures only, because of practical constraints of getting individual’s
or beneficiaries’ actual figures related with their savings and deposits. Therefore for
studying effectiveness of FIP from demand side, developed a conceptual framework
based on the perception of beneficiaries. And the model is tested and validated using
Warp PLS.
Major Findings of the Study:
1. The banks in Kerala performs functions like providing financial literacy and credit
counselling, opening up of ‘No-Frills’ account or Basic Savings Bank Deposits
Accounts (BSBDAs), introduced branch expansion strategies, Kisan Credit Cards
/General Credit Cards (KCC/GCC), other micro credits and mobile banking, micro
insurance & small pensions as part of FIP.
2. The reasons for choosing formal financial services over informal financial services
by the respondents were cost effectiveness, problem handling and compensation, easy
to use and convenience, operational efficiency, speed of service, proper sanctioning of
loans, better customer service & efficiency and responsiveness. (Rank preference)
3. The proposed model was found to have a good fit and the moderating variable
financial literacy was found to be significant.
4. The programme is found effective in Kerala, from the holistic approach of
Financial Inclusion Programme.
5. As the policies and programmes of financial inclusion are same all over India, some
plans like introduction of Business Correspondent model, simplifying KYC norms
were not working in Kerala. Therefore, the policy should be flexible based on the
economic situation, culture, and systems and beliefs prevailing in each States of India.
Practical and theoretical implication:
1. The study takes into consideration the broader approach of financial inclusion
programme, (economic impact) which recently attracted considerable attention from
public authorities, financial sector stakeholders and academia, to reduce or eliminate

the inefficiencies surrounding the conduct of specific types of financial transactions,
and to increase the efficiency of financial inclusion programme.
2. Information about the effectiveness of financial inclusion programme on economic
growth will influence the priority that policy makers and advisors attach to reframing
financial inclusion policies.
3. Academicians can consider the study findings for their future studies connecting
financial literacy as a moderator for the access and use of financial inclusion.
4. The study has also analysed various determinants to choose formal financial
services (mainly for credit accessing) of individual beneficiaries. Thus, the study will
be useful for the practitioners for reducing cumbersome procedures of borrowings
5. The supply side of FIP was also analysed, and reported the practical difficulties of
implementing BC/BF model in Kerala. Thus the policy makers can reframe the said
programmes with suitable instances to the Kerala economy.
6. The model developed and validated can be added in the theory of FIP, to provide a
less perspective environment in which banks are free to pursue the innovations
necessary to reach low income consumers and still make a profit.
Conclusion:
Banking sector has become a major target market for the poor and weaker sections of
the society. In olden days, it was the platform for the upper sections of the society
only. The study has identified determinants in accessing and using formal financial
services as part of the Financial Inclusion Programme and their hindrances in reaching
to the milestone, in the Kerala context. The effectiveness of Financial Inclusion
Programme can be fully achieved through the synergy of banks, government and also
the community. Financial Literacy acts as an interference to the accessibility and
usage variable provided. Increased levels of financial literacy positively (increase the
usage perceptions) moderated the path of accessibility perception and usage
perception.


Contents
Chapter I
Introduction.........................................................................................1-28
I.1 Banks and Financial Inclusion 1
I.2 History of financial inclusion (Evolution of commercial banks) 3
I.3 Financial Inclusion in India 6
I.4 Objectives of financial inclusion programme 8
I.5 Steps taken by banking industry in India 9
I.6 Definitions of financial inclusion 12
I.7 Elements of Financial Inclusion Programme 13
I.8 Institutional structure of financial inclusion 22
I.9 Significance of the study 22
I.10 Theoretical Background 24
I.11 Effectiveness of financial inclusion programme in Kerala 26
I.12 Expected Contributions from the Study 26
I.13 Report Structure 27
Chapter II
Literature Review .........................................................................................29 – 45
II. 1 Financial Inclusion 29
II .2 Accessibility and Availability 32
II. 3 Usage 37
II. 4 Effectiveness of financial inclusion programme 39
II. 4 a Asset creation. 41
II. 4 b Income generation. 42
II. 4 c Employment generation. 42
II. 5 Financial literacy. 42
II. 6 Banking products and services. 44

Chapter III
Research Methodology....................................................................46-68
III. 1 Rationale of the study 46
III. 2 Statement of the Problem 47
III. 3 Objectives 48
III. 4. Conceptual framework 48
III. 5. Research Hypothesis 49
III. 6. Theoretical and operational definitions 49
III. 7. Basic Research design 53
III. 8. Tools for data collection 54
III. 9 Validity Analysis 54
III. 10. Reliability Analysis 59
III. 11. Scope of the Study 60
III. 12. Data Collection 61
III. 13 Selection of unit of observation. 61
III. 14. Sampling Method. 63
III. 15. Sample Size. 63
III. 16. Statistical analysis and Validation 63
III. 17. Limitations of the Study. 67
III. 18. Chapter Summary 68
Chapter IV
Precision and Validation of Measurement Models………………69-90
IV.1. Introduction. 69
IV.2 Items generation. 69
IV.3. Initial validity tests 70
IV.4. Exploratory Factor Analysis: Development of independent
variables for measuring effectiveness of financial inclusion
programme (Demand side perspectives)
71

IV.5. Confirmatory Factor Analysis for validation of the independent
variables of FIP-Measurement model.
75
IV.6. Effectiveness of financial Inclusion Programme- development of
measurement dimensions
78
IV.7 Confirmatory Factor Analysis for validation of the dependent
variable- Effectiveness of FIP-Measurement model
82
IV.8. Exploratory Factor Analysis: Development of moderating
variable- Financial Literacy
84
IV.9. Confirmatory Factor Analysis for validation of the Moderating
variable - Measurement model
86
IV.10. Chapter Summary. 89
Chapter V
Supply-side Analysis of Data……….............................................91-101
V. 1. Banks and FIPs in India 91
V.2. Bank Branches in Kerala 94
V. 3. Access to Credit 97
V. 4. Extent of Accessibility, Availability and Usage (Effectiveness of
FIP using FII).
98
V. 5. Chapter summary 101
Chapter VI
Test of Hypothesis and Analysis of Conceptual Model..............101-127
VI. 1 Data Records 101
VI. 2 Profile of the respondents 101
VI. 3. Classification of respondents based on age 101
VI. 4. Classification of respondents based on gender 103
VI. 5. Classification of respondents based on residential status 104
VI. 6. Classification of respondents based on education 105
VI. 7. Classification of respondents based on marital status. 106
VI. 8. Classification of respondents based on occupation 106
VI. 9. Classification of respondents based on their Average Monthly
Income
107

VI. 10. Classification of respondents based on the number of dependents. 108
VI. 11. Classification of respondents based on Housing condition 109
VI. 12. Classification of respondents based on the type of Bank they are
using.
109
VI. 13 Classification of respondents based on Number of bank accounts
using.
110
VI. 14. Classification of respondents based on Purpose of usage 110
VI. 15. Classification of respondents based on their Sources of
information regarding the banking services.
111
VI. 16. Classification of respondents based on the schemes they are using 112
VI. 17. Descriptive statistics of Variables used in the study 112
VI. 18. Reasons-why the respondents use formal financial services 113
VI. 19. Respondent’s Problems while using formal financial services 114
VI. 20. Classification of respondents based on their Average income from
activity
114
VI. 21 Effectiveness of the FIP at a glance 115
VI. 22 Conceptual model 116
VI. 23. Testing of hypotheses 122
VI. 24 Analysis using Financial Inclusion Index (FII) 126
VI. 25. Chapter summary 127
Chapter VII
Findings and Recommendations..................................................128-135
VII. 1. Summary of findings 128
VII.2. findings of first objective 128
VII. 3. Findings of second objective 129
VII.4. Findings of fourth objective. 130
VII. 5. Holistic approach on the FIP 130
VII. 6. Effectiveness of financial inclusion Programme in the holistic
approach
132
VII. 7. Recommendations 134
VII. 8. Chapter Summary. 135

Chapter VIII
Implications, Suggestions & Conclusion……………………….136-139
VIII. 1. Implications from the study and suggestions for the policy makers 136
VIII.2. Suggestions 137
VIII.3. Limitations and Challenges 138
VIII.4 Scope for future research 138
VIII.5 Conclusion. 138
Bibliography
Appendices:
Appendix- I. Interview schedule.
Appendix- II. Road map villages.
Appendix- III. Detailed list of FLCs.
Appendix- IV. District-wise data on flow of bank credit to minorities as on 30th
September 2017.
Appendix- V. FII supply side dimension details.
Appendix-VI. Calculation of FII of individual Beneficiaries
Appendix-VII. List of Publications


List of Tables
Table No. Table Name Page
No.
Table I. 1 Progress of Financial Inclusion Programme during the last five
years in India (from the year 2013 onwards)
19-21
Table III.1 Discriminant Validity 56
Table III.2 Cross loadings of Latent Variables 56-57
Table III.3 Reliability & Convergent validity of constructs 59
Table III.4. Reliability analysis of different variables of the study 60
Table IV.1 Test of sampling adequacy- KMO and Bartlett's Test 73
Table IV.2 Rotated components with three principal factors after EFA 73-74
Table IV.3. Model fit summary of independent Variables 76
Table IV.4 Reliability Analysis 77
Table IV.5 Exploratory Factor Analysis: Dependent variable–effectiveness
of financial inclusion programme- Development of measurement
model
79
Table IV.6 Rotated Components with Three Principles Factors after EFA 80-81
Table IV. 7 Model fit summary of various dimensions of dependent variable 83
Table IV.8 Reliability Analysis 84
Table IV.9 KMO and Bartlett's Test 86
Table IV.10 Model fit summary of moderating variable 88
Table IV.11 Reliability Analysis 89
Table V.1 Banking statistics -number of bank branches as on 30th
September 2017
94-96
Table V.2 District-wise data on flow of bank credit to minorities as on 30th
September 2017
97-98
Table V.3. Dimensions of FII (Ai-mi/Mi-mi) 99
Table V.4 Calculation of Financial Inclusion Index 100
Table VI.1. Classification of respondents based on their number of
dependence in the family
108

Table VI.2. Classification of respondents based on their housing condition 109
Table VI.3 Classification of respondents based on the type of Bank they are
using
109
Table VI. 4 Classification of respondents based on Number of bank accounts
using
110
Table VI.5 Classification of respondents based on Purpose of usage 110
Table VI. 6 Classification of respondents based on their Sources of
information regarding the Banking services
111
Table VI.7 Classification of respondents based on the schemes they are
using
112
Table V1. 8 Descriptive statistics of Variables used 112
Table VI. 9 Formal financial services-usage reasons 113
Table VI.10 Problems in using formal financial services 114
Table VI.11 Average income from activity 114
Table VI.12 Effectiveness of the FIP at a glance 115
Table VI. 13 Basic features of Warp PLS 5.0 116
Table VI.14 Model fit and quality indices 118
Table VI.15 Model fit and quality indices 121
Table VI.16 Direct relationship of variables with beta coefficients and P
values
122
Table VI.17 Summary of hypotheses test results: Direct relationship between
variables
123
Table VI.18 FII of selected Districts in Kerala 126

List of Figures
Figure No. Figure Name Page
No
Figure I.1 Steps taken by RBI before the Origin of Financial Inclusion
Programme in India.
9
Institutional Structure of FIP. 22
Studying effectiveness of FIP in Kerala. 26
Figure I.2
Figure I.3
Figure III.1 Operationalization of independent variables. 51
Figure III.2 Pictorial presentation of sample selection. 62
Figure IV. 2 Independent variable dimensions - measurement model. 75
Figure IV.2 Dependent variable dimensions - measurement model. 82
Figure IV. 3 Moderating variable - measurement model. 87
Figure: V.1 Channels of implementing FIP in Kerala. 94
Figure VI.3 Distribution of respondents based on Age. 103
Figure VI. 4 Gender-wise Distribution. 104
Figure VI. 5 Residential Status of Respondents. 104
Figure VI. 6 Educational status of Respondents. 105
Figure VI. 7 Marital status of Respondents. 106
Figure VI. 8 Distribution of Respondents based on their Occupation. 107
Figure VI. 9 Distribution of Respondents based on Monthly Income. 108
Figure VI. 8 Measurement Model without Moderation. 117
Figure VI. 9 Conceptual model. 120
Figure VI.10 Effect of moderation- financial literacy. 124


List of Abbreviations
AIRC All-India Rural Credit Survey.
ATM
ATISG
AVE
AVIF
AWEK
Automated Teller Machine.
Access through Innovation Subgroup.
Average Variance Extracted.
Average Variance Inflation Factor.
Association of Women Entrepreneurs.
BBA Basic Bank Account.
BC Business Correspondent.
BF Business Facilitator.
BSNL Bharat Sanchar Nigam Limited.
CDS Centre for development of Society.
CET
CFA
Common Entrance Test.
Confirmatory Factor Analysis.
CFI Committee on Financial Inclusion.
CMIE Centre for Monitoring Indian Economy.
CRM Customer Relationship Management.
DCB &SCB Douglas County Bank and Standard Chartered Bank.
DIC
EFA
District Industrial Centers.
Exploratory Factor Analysis.
FKCCI
FICC
FIP
FII
FSB
Federation of Karnataka chamber of commerce & Industries.
Federation of Indian Chamber of Commerce and Industry.
Financial Inclusion Programme.
Financial Inclusion Index.
Financial Stability Board.
GCC General Credit Card.
GoI
GPFI
Government of India.
Global Partnership for Financial Inclusion.
IT Information Technology.
IVR Interactive Voice Response.
KCC Kisan Credit Card.
KSFC Karnataka State Finance Corporation.

KSIIDC Karnataka State Industrial Investment and Development
Corporation Ltd.
KFC Kerala Financial Corporation.
KVIC Khadi & village industries commission.
LIC
LUC
Life Insurance Company of India.
Laghu Udyami Card.
MGNREGA Mahatma Gandhi National Rural Employment Guarantee Act.
MGNREGP Mahatma Gandhi National Rural Employment Guarantee
Programme.
m-Banking mobile Banking.
MFI Micro Finance Institution.
MSME Micro- Small and Medium Enterprises.
NABARD National Bank for Agriculture and Rural Development.
NGO Non-Governmental Organisations.
NEFT National Electronic Fund Transfor.
NFS Non- Farm Sector.
NMGB North Malabar Gramin Bank.
NSD New Service Development.
OPS Other Priority Sector.
p.a. per annum.
PAN Permanent Account Number.
PIN Personal Identification Number.
PLDB Primary Land Development Bank.
PMEGP Prime Ministers Employment Generation Programme.
PMRY Prime Ministers Rozgar Yojana.
REGP Rural Employment Generation Programme.
PSA Priority Sector Advance.
PSB Public Sector Banks.
RBI Reserve Bank of India.
RDA/C Recurring Deposit Account.
RTGS Real Time Gross Settlement.
SB A/C Savings Bank Account.
SBI State Bank of Travancore.

SC/ ST
SEM
SHG
SGSY
SJSRY
SLBC
SIDBI
SME
SMS
SSIs
SSRN
TAM
TRAI
UK
UIDAI
ULG
USEP
UWSP
Scheduled Caste /Scheduled Tribe.
Structural Equation Modelling.
Self-Help Group.
Swarna Jayanthi Gram Swarozgar Yojana.
Swarna Jayanti Shahahri Rozgar Yojana.
State Level Bankers Committee.
Small industrial development Bank.
Small and Medium Enterprises.
Short Message Service.
Small Scale Industries.
Social Science Research Network.
Technology Acceptance Model.
Telecommunication Regulatory Authority of India.
United Kingdom.
Unique Identification Authority of India.
Urban Local Governments.
United Nations.
Urban Self-Employment Programme .
Urban Women’s Self–Help Programme.
UN


Chapter1 Introduction
Effectiveness of Financial Inclusion Programme in Kerala 1
Chapter I
Introduction This chapter deals with background of financial inclusion programme, the
concept of financial inclusion programme and its evolution, objectives of
financial inclusion programme and its definitions, origin & elements,
progress of financial inclusion programme in India &institutional
framework, significance of the study, theoretical background and
organization of the study,
1.1 Banks and Financial Inclusion
It is time that banks took a comprehensive view of inclusion strategy and all its
elements from customers to products to technology, and arrived at an optimal mix
to drive their agenda in the future. The initiatives of ‘financial inclusion’ was
undertaken to multiply the outreach of banking facilities and increase the flow of credit
to rural areas. Numerous initiatives have taken over time such as nationalization of
banks, prescription of priority sector targets, lending to weaker sections at concessional
rates and initiation of lead bank schemes. Financial inclusion programs could no doubt
offer banks an innovative means of market expansion, customer diversity management
and mass-market life-style enablement. “Financial inclusion programmes should be
implemented on commercial lines and not on a charity basis. It is important that banking
with the poor is perceived and pursued as a sustainable and viable business model. While
poor need not be subsidised, it is important to ensure that they are not exploited. The
need is to ensure that poor people who deserve credit are provided access to timely and
adequate credit in a non-exploitative manner” (Chakrabarthy, 2012). Financial inclusion
has two aspects, one as a welfare aspect and the other as a business strategy of Banks.
Financial inclusion is “the process of ensuring access to financial services and timely
and adequate credit where needed by the vulnerable groups such as weaker sections

Chapter1 Introduction
Effectiveness of Financial Inclusion Programme in Kerala 2
and low income groups at an affordable cost” (Government of India, 2008). The above
definition focuses on the welfare aspect of weaker sections. As far as Banks are
concerned it is possible only if the Government take initiative. Otherwise financial
inclusion will be a paper work.
Over two million adults around the globe do not have an access to formal or semi- formal
financial services. Of this, 90 per cent live in Africa, Latin America, Asia and the
Middle East. It is already becoming more and more clear that, access to a broader set
of financial tools, such as savings products, payment services (domestic and through
international remittances) and insurance (which also includes micro insurance aimed
at the needs of the poor) gives poor people greater capability to increase or stabilize
their income, build assets and become more economic shock-proof. (World Bank, 2012)
Financial inclusion is not a matter of philosophy but can lead to a win-win situation for
the banks and the customers. United Nations define financial inclusion as “a financial
sector that provides access for credit for all bankable people and firms and saving and
payment services to everyone. Inclusive finance does not require that everyone is
eligible to use each of services but they should be able to choose them if desired”. This
definition focuses on the business strategy of Banks.
A Nationwide initiative of National Bank for Agriculture and Rural Development
(NABARD) namely, SHG-Bank linkage programme made vast coverage of formal
financial services to the unbanked rural poor. Thus the programme paved way for a rapid
inclusion in India as far as other programmes are considered.
Financial inclusion has become a buzzword internationally – even in developed
financial markets there are concerns about those excluded from the banking system. The
barriers to access to formal banking system have been identified as relating to culture,
education (especially financial literacy), gender, income and assets, proof of identity,
remoteness of residence, and so on. Efforts are being made by the authorities- especially
banking regulators to improve access to affordable financial services through financial

Chapter1 Introduction
Effectiveness of Financial Inclusion Programme in Kerala 3
education, leveraging technology, and generating awareness. Raghuram Committee on
Financial Sector Reforms (CFSR) defined financial inclusion as “Expanding access to
financial services, such as payments services, savings products, insurance products, and
inflation-protected pensions.” This definition also focuses on the business strategy of
the Banks.
Financial Inclusion is an opportunity to Banks for increasing their business. Kerala is
rapidly becoming the most preferred investment destination of the world (Kerala
Calling, 2013).
Majority of the researches are taking place in financial exclusion and its causes, supply
side of financial inclusion etc. Whether the included people have any growth or the
policy still in paper, had only few attempts. Thus the present study focuses on the
demand side as well as supply side of financial inclusion with respect to effectiveness
of the programme.
I.2. History of Financial Inclusion (Evolution of Commercial Banks):
The term financial inclusion is coined by Dr. Usha Thorat in India, during the annual
meeting of RBI. She was then the deputy governor of RBI. Before that many developed
countries were adopted the programme wholly or partly. A snap short of the history of
financial inclusion is as follows;
1) 1950-70: Consolidation of the banking sector and facilitation of Industry and
Trade
2) 1970-90: Focus on channelling of credit to neglected sectors and weaker
sections.
3) 1990-2005: Focus on strengthening the financial institutions as part of financial
sector reforms.
4) 2005 onwards: Financial Inclusion was explicitly made as a policy objective.
The foundation for building a broad base of agricultural credit structure was laid by the
Report of the All-India Rural Credit Survey (AIRCS) of 1954. The provision of

Chapter1 Introduction
Effectiveness of Financial Inclusion Programme in Kerala 4
cultivator credit in 1951-52 was less than one per cent for commercial banks. It was
observed that agricultural credit fell short of the right quantity, was not of the right type,
did not fit the right purpose and often failed to go to the right people. With a view to
give an impetus to commercial banks, particularly, in the sphere of investment credit,
the nationalization of the Imperial Bank of India and its re-designation as the State Bank
of India (SBI) was recommended.
I.2. 1 Growth in Outreach 1951-91
From the position prevalent in 1951-52, Commercial Banks came a long way with a
substantial spread of thirty two thousand two hundred and twenty four branches in rural
and semi-urban areas comprising 68 per cent of their total outlets as on 31st March 1991.
The outstanding deposits of such branches at sixty seven thousand eight hundred and
fifty five crore rupees as on the same date constituted around 35 per cent of their total
deposits, while loans outstanding at forty three thousand seven hundred and ninety seven
crore rupees comprised 36 percent of outstanding credit. The agricultural advances of
the commercial banking system aggregated sixteen thousand six hundred and eighty
seven crore rupees and constituted 14 percent of total advances in March 1991.
I.2. 2 Growth during 1991-92 to 2003-04
After new economic policies of 1991, has seen a fairly rapid increase of credit to
agriculture. Available data indicate that the flow of credit to agriculture by commercial
banks and RRBs taken together increased to sixty thousand twenty two crore rupees in
2003-04. This implies a compounded annual growth rate of 22.2 per cent. In reality, as
compared with commercial banks (including RRBs); the flow of credit from the
cooperative sector was much slower through this period. The compounded annual
growth rate of credit for agriculture from cooperative institutions was only 13.7 per cent.
Further, the proportion of agriculture credit to total credit came down because of the
rapid growth in non-agriculture credit.

Chapter1 Introduction
Effectiveness of Financial Inclusion Programme in Kerala 5
The Government took some major initiatives during the period to boost agriculture
production and productivity through enhanced credit flow and by way of building
agricultural infrastructure, particularly irrigation and connectivity in rural areas.
The SHG – Bank Linkage Programme was started as a pilot project by NABARD in
1992. It led to the evolution of a set of RBI approved guidelines to banks to enable SHGs
to transact with banks. RBI scaled down its contribution to the Rural Credit funds with
NABARD to a token amount of one crore rupees per annum since 1993-94. However to
enable NABARD to have reasonably strong leverage for accessing market funds, the
share capital of NABARD was strengthened and increased to two thousand crore rupees
(paid up) from hundred crore rupees at the time of its formation in 1982. Contributions
to enhanced share capital have come from Government of India and RBI. By prudent
funds management, the institution has also built a strong base of reserves and has been
using it in its business operations judiciously to keep lending rates to rural financial
institutions at significantly lower than market costs.
Special Agricultural Credit Plan (SACP) was introduced by RBI for Public Sector
Commercial Banks in 1994-95. Rural Infrastructure Development Fund (RIDF) was set-
up in NABARD by Government of India during 1995-96 with an initial corpus of two
thousand crore rupees, to accelerate the completion of on-going projects of rural
infrastructure.
Banks which did not fulfil the priority sector credit requirement and agriculture credit
mandate were required to contribute to this Fund. The fund has been strengthened every
year with additional allocations in the Union Budget.
I.2. 3 Developments – Post 2003-04
Since 2003-04, there has been a substantial increase in the flow of credit to agriculture
through commercial banks. Disbursements have increased from fifty two thousand four
hundred and forty one crore rupees in 2003-04 to one lakh sixteen thousand four
hundred and forty seven crore rupees in 2005-06, reaching an annual growth of forty

Chapter1 Introduction
Effectiveness of Financial Inclusion Programme in Kerala 6
three per cent each year. As envisaged in the Government of India's strategy for
“doubling of credit”, ninety five lakh new farmers have been brought under the
institutional fold and thousand three hundred and eighty three Agri-clinics opened.
Commercial banks have also played a major role in the promotion of the SHG – bank
linkage movement with more than eleven lakh eighty eight groups being linked to banks
for provision of credit. Reforms in the commercial banking system include removal of
procedural and transactional bottlenecks including elimination of Service Area
Approach, reducing margins, redefining overdues to coincide with crop cycles, new debt
restructuring policies, one time settlement and relief measures for farmers indebted to
non-institutional sources
Even though the buzzword started recently, the initiatives taken place from 1969
onwards through the nationalisation of fourteen major commercial Banks, which
facilitated a change in centre of attention of banking from class banking to mass banking.
It was however realised that, despite the wide spread of formal financial institutions,
these institutions were not able to cater the needs of the most poor and weaker sections
of the society. It leads to a search of alternative policies and reforms for reaching out to
the poor to cater their financial needs. Reserve Bank of India adapted Financial Inclusion
approach based on the elementary principle of 5A’s of ensuring Adequacy and
Availability of financial services to all sections of the society through the formal
financial system covering savings, credit, remittance, and insurance. And also an
important strategy is increasing Awareness about such financial services by ensuring
Affordability and Accessibility of the apposite financial products.
I. 3. Financial Inclusion in India
Financial inclusion is a great step to alleviate poverty in India. But to achieve this, the
government should provide a less perspective environment in which banks are free to
pursue the innovations necessary to reach low income consumers and still make a profit.
Kerala stands unique among Indian states with a consistently higher level of human

Chapter1 Introduction
Effectiveness of Financial Inclusion Programme in Kerala 7
development comparable with that of many advanced countries but with a much lower
per capita income. Kerala ranked first among major States in India in the Human
Development Index (HDI) at the four time points of 1981, 1991, 2001, and 2011, but its
per capita income lagged behind the all-India average till recently. The RBI recently
came up with a State-wise Index of Financial Inclusion and the results were rather
surprising, Kerala topped the index. In this survey, RBI considered three basic
dimensions of an inclusive financial system, banking penetration, availability of the
banking services and usage of the banking system. The main reasons for selecting these
dimensions are data availability and recent development in the literature.
The nationalization of major commercial banks in 1969 was an important landmark in
the history of financial inclusion. An imperative development in the last peculiar years
has been the organisation of Self-Help Groups (SHGs) or small groups of people who
could borrow from the banking system. In several ways, the SHGs movement has been
a success. Nevertheless, it also seen that it is concentrated much more in the South and
therefore there is a regional disparity in terms of the growth of the SHGs. The term
"Financial Inclusion" has gained significance since the early 2000s. Financial exclusion
can make poor people exposed to loan sharks. Microfinance is an approach used to
lessen financial exclusion. Government of India constituted a Committee to enhance
Financial Inclusion in India on 22nd June 2006. The Committee presented its report in
January 2008.
The financial sector provides critical financial services to households and
business enterprises which include:
1. Safe saving and range of risk-return trade off services. It mobilizes savings
into formal financial system. It helps accumulation of financial assets which
can provide a cushion against unforeseen events.
2. Additional means beyond privately accumulated savings of help by way of
credit and insurance to absorb shocks of unforeseen circumstances.

Chapter1 Introduction
Effectiveness of Financial Inclusion Programme in Kerala 8
3. It reduces dependence on informal financial sources such as pawn shops,
money lenders or informal groups relating to savings and credit associations
by poor low income vulnerable group of society.
4. Facilitate payment between different parties and make them safer to a cash
transaction.
Financial inclusion can act as an effective instrument to alleviate poverty in the world
particularly in developing and under developed countries by using thrift savings and
better access to credit for the needy at speedy less costly way. The financial inclusion
therefore has become issue of worldwide concern as large section of the population has
no access to financial services and depends on own resources or informal sources of
financial services. All the countries are making conscious efforts to bring vast segment
of population especially under privileged section of the society in rural and urban areas
into the banking fold.
I.4. Objectives of Financial Inclusion Programme
From the definitions given above, it is evident that there are two approaches for
describing the objectives of financial inclusion programme. One is narrow approach and
the other is comprehensive approach or holistic approach.
In narrow approach, the objective of financial inclusion programme is to merely opening
up of accounts in the formal banking sector. A person is said to be statistically
financially included when he just open up an account in the formal banking sector.
In the comprehensive approach, the objective of financial inclusion programme is
getting economic upliftment for the beneficiaries of the programme from one level to
another. That means effectiveness of financial inclusion happens when a person gets
economic benefit through the programme. Economic benefit means whether they get
any additional income generation, asset creation or employment generation through the
programme.

Chapter1 Introduction
Effectiveness of Financial Inclusion Programme in Kerala 9
I.5. Steps taken by Banking Industry in India (Origin of Financial Inclusion
Programme):
Following are the various steps taken by RBI in various stages of banking evolution
before the buzzword of financial inclusion come into practice: it can be clearly specify
with a pictorial representation;
Figure I.1.Steps taken by RBI before the Origin of Financial Inclusion Programme in
India
Introduction of Priority Sector Lending Norms
Bank Nationalisation
Introduction of Lead Bank Scheme.
Differential Rate of Interest Scheme.
Formation of Regional Rural Banks.
Introduction of Service Area Concept.
Adoption of Villages by Bank Branches.
Formation of Regional Rural Banks.
Strengthening of Co-operatives.
.

Chapter1 Introduction
Effectiveness of Financial Inclusion Programme in Kerala 10
I. 5. 1. Priority Sector Lending (1967-68)
Priority Sector includes the following categories:
(i) Agriculture
(ii) Micro, Small and Medium Enterprises
(iii) Export Credit
(iv) Education
(v) Housing
(vi) Social Infrastructure
(vii) Renewable Energy
(viii) Others
I. 5. 2. Bank Nationalisation
Fourteen major commercial banks were nationalised on 19th July 1969- and six more
commercial banks were nationalised on 15th April 1980.
I. 5. 3. Lead Bank Scheme (1969) - Gadgil study group
The National Credit Council was set up in December 1967 to determine the priorities of
bank credit among various sectors of the economy. The NCC appointed a study group
on the organizational framework for the implementation of social objectives in October
1968 under the Chairmanship of Prof. D R Gadgil. The study group found that the
Commercial Banks had penetrated only five thousand villages as of June 1967. The
Banking needs of the rural areas in general and backward in particular were not taken
care of by the Commercial Banks. Besides, the credit needs of Agriculture, SSI and
allied activities remained neglected.
Objectives of Lead Bank Scheme:
1. Eradication of unemployment and under employment
2. Appreciable rise in the standard of living for the poorest of the poor

Chapter1 Introduction
Effectiveness of Financial Inclusion Programme in Kerala 11
3. Provision of some of the basic needs of the people who belong to poor sections
of the society.
I. 5. 4. Differential Rate of Interest Scheme (March 1972)
Government of India had formulated in March, 1972 a scheme for extending financial
assistance at concessional rate of interest @ 4 per cent to selected low income groups
for productive endeavours initially by public sector banks and then by private sector
banks also . The scheme known as Differential Rate of Interest Scheme (DRI) is now
being implemented by all Scheduled Commercial Banks.
I. 5. 5. Regional Rural Banks (RRBs)
A vast majority of the small and marginal farmers and rural artisans remained untouched
by the banking system. Therefore, the range of institutional alternatives was widened in
1975 by adding Regional Rural Banks (RRBs) to the banking scene which would
exclusively cater to the credit demands of the hitherto neglected segment of the rural
economy.
I. 5. 6. Service Area Approach (1989)
The Service Area Approach (SAA) introduced in April 1989, in order to bring about an
orderly and planned development of rural and semi- urban areas of the country, was
extended to all Indian scheduled commercial banks including Regional Rural Banks
(RRBs). Under the SAA, all rural and semi-urban branches of banks were allocated
specific villages, generally in geographical contiguous areas, the overall development
and the credit needs of which were to be taken care of by the respective branches.
I. 5. 7. Social Banking:
Social Banks provides financial services to individuals and organizations that create
social, environmental or sustainability benefits. According to Global Alliance for
Banking on Values, social banking follows triple bottom line approach at the core of the
business model and is grounded in communities, serving the real economy and enabling

Chapter1 Introduction
Effectiveness of Financial Inclusion Programme in Kerala 12
new business models. Social Banks provide long term relationship with clients and
direct understanding of their economic activities and the risks involved.
Social banks look for a blended value return delivering both social and financial
returns. (Weber, 2014)
I. 5. 8. Financial Inclusion Programme (FIP) -from 2005 onwards:
I. 6. Definitions of Financial Inclusion:
I.6.1 "The process of ensuring access to financial services and timely and adequate
credit where needed by vulnerable groups such as weaker sections and low income
groups at an affordable cost. - (Rangarajan committee, 2008) - the Committee on
Financial Inclusion
I.6.2 “Expanding access to financial services, such as payments services, savings
products, insurance products, and inflation-protected pensions.”– (Raghuram
Committee) on Financial Sector Reforms (CFSR)
I.6.3 “A financial sector that provides access for credit for all bankable people and firms
and saving and payment services to everyone. Inclusive finance does not require that
everyone is eligible to use each of services but they should be able to choose them if
desired”. – (United Nations).
I.6.4 “Full financial inclusion is a state in which all people who can use them have access
to a full suite of quality financial services, provided at affordable prices, in a convenient
manner, and with dignity for the clients. Financial services are delivered by a range of
providers, most of them private, and reach everyone who can use them, including
disabled, poor, rural, and other excluded populations.”- (Centre for Financial
Inclusion)
The Centre for Financial Inclusion proposes a simple yet multi-dimensional definition
of Financial Inclusion.

Chapter1 Introduction
Effectiveness of Financial Inclusion Programme in Kerala 13
From the above all definitions, it is clear that there are four core dimensions for Financial
Inclusion Programme. They are:
1) What is provided: A full range of services, which includes a basic product in
each of the four main areas: savings, credit, insurance, and payments.
2) How it is provided: With quality that is-convenience, affordability, safety, and
dignity of treatment—and with client protections operating.
3) Who receives: Everyone who can use the services, including the poor, rural,
informal, and groups who are often discriminated against (women, ethnic
minorities, disabled).
4) Who provides: A range of providers led by mainstream financial institutions,
but also including organizations from the private, social, and government sectors
The above said four dimensions can be treated as the four elements or characteristics of
the financial inclusion.
I.7. Elements of Financial Inclusion Programme:
I. 7. 1. No-frill accounts
In November 2005 RBI advised banks to make available a basic banking “No-frill
Account” with low or nil minimum balances as well as charges to expand the outreach
of such accounts to vast sections of the population.
I. 7. 2. Simplification of KYC norms
In order to ensure that persons belonging to the low income group both rural and urban
areas do not encounter difficulties in opening bank accounts, the Know Your Customer
procedure (KYC) for opening bank account was simplified asking banks to seek only a
photograph of the account holder and self-certification of addresses (the amount of
outstanding balance in these accounts would be limited to fifty thousand rupees and total
transactions would be limited to one lakh rupees in one year.

Chapter1 Introduction
Effectiveness of Financial Inclusion Programme in Kerala 14
I.7. 3. Introduction of Kisan Credit Cards (KCC) and General Credit Cards (GCC)
Banks were asked to introduce a general credit card scheme for issuing GCC to their
constituents in rural and semi-urban areas based on the assessment of income and cash
flow of the household similar to that prevailing under normal credit card without
insisting on security and the purpose or end use of credit (as Point Of Sale-POS and
ATM facilities) with similar products are not feasible or available and limited infra-
structure in rural areas. The limit under GCC is up to twenty five thousand rupees. Banks
were advised to utilize the services of Schools, Primary Health Centre, local government
Functionaries, Farmers’ Association or Clubs, well established community based
agencies etc.
Kisan Credit Card is issued to farmers. The scheme aims at providing adequate and
timely credit for the comprehensive credit requirements of farmers under single window
for the entire year, including the short term credit needs and a reasonable coverage for
consumption needs. The farmers need not visit banks more often to buy seeds, manures,
medicines and other agricultural implements. The validity period of this overdraft
facility is three years subjected to annual review. Keeping in view the unabated price
rise, it is not necessary to avail loans separately for kharif and other seasonal crops or
for medium term crops. Using this card farmers can buy improved seeds, manure
whenever they are available. The benefit of discount is also passed on to borrowers,
direct payment facility is enjoyed.
Fixation of maximum limit depends on total agricultural income. There is no restriction
on number of withdrawals within the quantum of limit fixed. The repayment commences
after harvesting. When certain amount is remitted to loan account in between when
surplus money is held on hand, the interest is rebated. The rate of interest is equal to the
rate of interest on agricultural loans. The processing of loan papers and the nature of
security is similar to that of agricultural loans. KCC card holders are covered under
personal accident insurance up to fifty thousand rupees for death and permanent

Chapter1 Introduction
Effectiveness of Financial Inclusion Programme in Kerala 15
disability. The master policy is valid for three years. The annual premium is fifteen
rupees. Banks pays ten rupees and the card holder has to pay five rupees.
When the loan is sanctioned after the submission of application for loan, the farmer will
be provided with a credit card and a passbook of card cum passbook. The card contains
the photograph of the borrower incorporating name and address, extent of land holding,
borrowing limit, validity period of loan etc. The details of withdrawals and remittances
are recorded in this card cum passbook. The passbook should always accompany the
customer at the time of transaction in the account.
This facility is also extended by banks for agriculture and activities allied to agriculture
like dairy, fisheries, piggery, poultry farming, beekeeping etc.
The short and medium term loans are also extended for individuals, self-help groups,
joint liability groups etc.
The commercial banks have introduced GCC scheme for their constituents to provide
loans for general credit needs in rural and semi urban areas in a hassle free manner based
on the assessment of income and cash flow of the entire house hold without insistence
on security, purpose or end use of the credit. This is in the nature of overdraft or cash
credit with no end use stipulations, not exceeding twenty five thousand rupees.
The scheme would be implemented by both public sector and private sector scheduled
commercial banks. The individual banks have autonomy to determine the rate of interest
to be charged on the loan. The fifty per cent of credit component will be eligible for
being treated as indirect finance to agriculture under priority sector status. It is not
necessary or compulsory that GCC should be linked to purchase of consumer goods.
GCC can be issued in the form of passbook only when the card holder intends to
withdraw cash. The individual banks can incorporate suitable modifications if any with
the prior permission of RBI without altering the original characters of the scheme.

Chapter1 Introduction
Effectiveness of Financial Inclusion Programme in Kerala 16
I. 7. 4. Branch Expansion
Weightage for financial inclusion in branch licensing. In terms of existing provisions of
banking regulation act, 1949 banks are not allowed to open new place of business or
change the locations of the place or villages in India without prior approval of RBI.
While considering the application of banks for opening branches, RBI gives due
weightage to the nature and scope of banking facilities provided to common person,
particularly in unbanked areas, actual flow of credit to the priority sector, pricing of its
products and overall efforts for promoting financial inclusion including introduction of
appropriate new products and enhanced use of technology for delivery of banking
services.
RBI has identified districts were the population per bank office is higher than national
average in rural and semi-urban areas. The lead banks have been advised by RBI to
identify unbanked villages of populations above two thousand and to provide banking
services through a banking outlet in every village by March 2011. Now it is completed
through the lead banks of the concerned districts. Such banking services may not
necessarily be extended through a brick and mortar branch but can be provided through
any of the various forms of Information and Communication Technology (ICT) models,
including through BCs.
a) Identification of under-banked centre.
b) Co-operative banks and RRBs have been allowed to sell insurance and financial
products.
c) RBI has liberalized policy for ATMs. The National Electronic fund transfer
(NEFT) facility is able to offer nationwide ATM linked to NEFT with effect
from 1-04-2009 and can facilitate banking transactions including remittance
through ATMs.
d) RBI has also rationalized service charges for use of electronic products which
would facilitate movement of funds at low cost.

Chapter1 Introduction
Effectiveness of Financial Inclusion Programme in Kerala 17
I. 7. 5. Mobile Banking
Mobile banking is a term used for performing accounting transactions, balance checks,
payments via mobile device such as mobile phone.
Mobile banking enables:
Users to perform banking transaction using mobile phone like balance checks,
fund transfers, bill payment etc.
Purchase goods over internet or phone delivery
Person to person fund transfers
To pay goods at merchant location point of sale.
As the penetration of mobile phones particularly among low income people and
enormous opportunities they afford in extending the banking outreach, RBI has
formulated guidelines on mobile banking. It has encouraged introducing
technology based products and services such as pre-paid cards/debit cards.
I.7.6. Use of Intermediaries: - Adoption of Agency Model (Business
Correspondents or Business Facilitator)
The type of services of Business Facilitator is:
Identification of borrowers and fitment activities.
Creation of awareness of savings and other products.
Collection and preliminary process of loan application.
Processing and submission of application to banks.
Educating, counselling, advice on managing money and debt.
Promotion and nurturing of Self Help group and Joint Liability Group.
Post sanctions monitoring.

Chapter1 Introduction
Effectiveness of Financial Inclusion Programme in Kerala 18
In addition to the activities listed under business facilitator model, the scope of activities
listed to be undertaken by BCs will include:
Disbursement of small value credit.
Recovery of principal or collection of interest.
Collection of small value deposits.
Sale of micro insurance or mutual fund products, pension products and other
third party products.
Receipt and delivery of small value remittances, other payments of instruments.
I.7. 6a: Benefits of Branchless Banking to Customers
Customers need not come to branch for carrying out basic transactions such as
cash deposits, withdrawal (Mini Statement) and saves time and cost of travel
which can be used for his or her occupation or income generation activity.
Access to banking facility in unconnected areas.
Availability of multitude of banking products and services at their location.
Enable micro finance disbursement or micro insurance facilities.
Self Help Groups can be serviced at their doorstep.
Collection of fees in colleges and schools.
Payment of pension at the residence of the pensioner-payment of salary at their
office, factory etc.
Setting stalls, exhibitions, fares, outside locations etc. for catering to the
customers.
Government payment on account of NREGP or subsidy.
Utility payment.
II.7. 6b: Benefits to Banks
Expand reach of bank’s financial inclusion services for people in remote/un-
banked location and inculcate the habit of thrift among rural folks.
Enhance social responsibility of banks by taking technology to common man.

Chapter1 Introduction
Effectiveness of Financial Inclusion Programme in Kerala 19
Economics of operation-low transaction cost vis-à-vis branch based.
Competitive edge in tapping untapped business potential.
Building long-term relationship with customer announcing trust and loyalty
towards bank.
Transaction being handled by devices has greater accuracy and increased
security.
e) Use of post offices.
Above described are the various aspects of Financial Inclusion programme in India.
I.7.7 Progress of Financial Inclusion Programme during Last Five Years in India
Table I. 1 Progress of Financial Inclusion Programme during the last five years in
India (from the year 2013 onwards)
Sl.
No
Supply side factors 2013 2014 2015 2016 2017
1 Banking Outlets in
Villages - Branches
40,837 46,126 49,571 51,830 50,860
2 Banking Outlets in
Villages -
Branchless Mode
2,27,617 3,37,678 5,04,142 5,34,477 5,47,233
3 Banking Outlets in
Villages - Total
2,68,454 3,83,804 5,53,713 5,86,307 5,98,093
4 Urban Locations
covered through
BCs
27,143 60,730 96,847 1,02,552 1,05,402
5 Basic Savings Bank
Deposit Account
101 126 210.3 238 254
through
branches (Number
in millions)
6 Basic Savings
Bank Deposit
Account (BSBDA)
165 273.3 365 474 691

Chapter1 Introduction
Effectiveness of Financial Inclusion Programme in Kerala 20
through
branches (Amount
in rupees billion)
7 Basic Savings Bank
Deposit Account
(BSBDA)
81 116.9 187.8 231 280
through
BCs (Number in
millions)
8 Basic Savings Bank
Deposit Account
(BSBDA)
18 39 75 164 285
through
BCs (Amount in
billion rupees)
9 BSBDA Total (in
millions)
182 243 398.1 469 533
10 BSBDA
Total (Amount in
rupees billion)
183 312.3 439 638 977
11 OD facility availed
in Basic Savings
Bank Deposit
Account (Number
in millions)
4 5.9 7.6 9 9
12 OD facility availed
in Basic Savings
Bank Deposit
Account (Amount
in rupees billion)
2 16 19.9 29 17
13 KCCs-Total
(Number in
millions)
34 39.9 42.5 47 46
14 KCCs-Total
(Amount in rupees
billion)
2,623 3,685 4,382.30 5,131 5,805

Chapter1 Introduction
Effectiveness of Financial Inclusion Programme in Kerala 21
15 GCC-
Total (Number in
millions)
4 7.4 9.2 11 13
16 GCC-
Total (Amount in
rupees billion)
76 1,096.90 1,301.60 1,493 2,117
17 ICT A/Cs-BC
Total
Transactions (Num
ber in
millions)during the
year
250 328.6 477 827 1,159
18 ICT A/Cs-BC Total
Transactions
(Amount in rupees
billion) during the
year
234 524.4 859.8 1,687 2,652
Source: RBI website (www.rbi.org.in)
The above table (Table No: I. 1) clearly exhibits the last five years increase in the
financial inclusion programme in India. A tremendous increase showed in every aspects
(Banking Outlets in Villages – Branches, Branchless Mode, Urban Locations covered
through BCs, Basic Savings Bank Deposit Account (BSBDA) through branches
(Number in millions), Basic Savings Bank Deposit Account (BSBDA) through
branches, Basic Savings Bank Deposit Account (BSBDA) through BCs (Number in
millions), Basic Savings Bank Deposit Account (BSBDA) through BCs (Amount in
Rupees billion), BSBDA Total (in millions), BSBDA Total (Amount in rupees billion),
OD facility availed in Basic Savings Bank Deposit, OD facility availed in Basic Savings
Bank Deposit, KCCs-Total (Number in millions), KCCs-Total (Amt. in rupees billion),
GCC-Total (Number in millions), GCC-Total (Amount in rupees billion), ICT A/Cs
BC Total Transactions (Number in millions), ICT A/Cs-BC Total
Transactions (Amount in rupees) of supply side financial inclusion. There is a

Chapter1 Introduction
Effectiveness of Financial Inclusion Programme in Kerala 22
remarkable increase from first year to second year in the above listed eighteen aspects
and it showed increasing trend till these five years.
1.8 Institutional Structure of Financial Inclusion
Following diagram shows the institutional path through which financial inclusion
practice is going on to the final destination. That means various authorities who are
working for getting the task ahead.
Figure 1.1 Institutional Structure of FIP
I.9 Significance of the study:
The creditworthiness of the beneficiaries when providing financial services should be
verified compulsorily. Similarly “the ‘access to’ and ‘use of’ financial services has to
be demarcated by the policy makers, here access refers to the supply of services, and
use is determined by demand as well as supply” (World Bank, 2008)
Government and Reserve Bank of India
Financial stability development council- technical group on
financial inclusion and financial literacy
Financial inclusion advisory committee
State level bankers committee
Lead banks

Chapter1 Introduction
Effectiveness of Financial Inclusion Programme in Kerala 23
The study is significant from both an application perspective of Banking as well as from
policy maker’s angle. The market for banking products to capture the needs of low
income groups is a highly fragmented one, for specific segments. It is well known in
banking literature that the bulk of the volume of sale of banking products is accounted
for by the minority who are the heavy users. This knowledge might be useful for better
segmentation using psychographic variables as well as for designing specific
advertisement campaigns to target the vulnerable groups of customers. From a
theoretical perspective, the research may contribute to understanding how can be
improve our existing policy of financial inclusion through implementing every aspects
as written in the programme schedule.
Importance of financial inclusion arises from the problem of financial exclusion of
nearly three billion people from the formal financial services across the world (Swami
and Vijayalakshmi, 2010). The annual policy statement of April 2005, while
recognizing the concerns in regard to the banking practices that tend to exclude rather
than attract vast sections of population, urged banks to review their existing practices to
align them with the objective of financial inclusion.
Financial Inclusion programme envisaged by RBI is not a social responsibility and can
be viewed as an opportunity for banks to increase their business.
Indian economy is one of the fastest growing economies in the world (Planning
Commission, 2008). Banks are the corner stone of development. Nationalised Banks
play a vital role in the development of a country like India.
Investigation revealed that no detailed study on financial inclusion as an opportunity
for both banks and the target groups in Kerala has so far been attempted and it is in this
context the present study, to undertake a study on people who are financially included
i.e., who have a bank account in the formal financial sector and checking on the basis of
usage, their accessibility towards, financial services along with the effectiveness of

Chapter1 Introduction
Effectiveness of Financial Inclusion Programme in Kerala 24
financial inclusion programme in Kerala are measured in the study and thus
“effectiveness of financial inclusion programme in Kerala”, is undertaken.
I. 10. Theoretical Background
Following are the theories supporting for the inclusive growth in this study:
In the literature on effectiveness of financial inclusion programme, a number of
theoretical positions were observed aimed at defining this concept and examining its
economic impact on beneficiaries. This research study is based on the theory of financial
development and growth processes as well as unconventional economic theory which
says to offer at the bottom of the pyramid, the products and services they needed
according to an appropriate economic model. Such access helps these people to escape
poverty.
I. 10. 1 Financial Development and Growth Theory
The long-term sustainable economic growth depends on the ability to raise the rates of
accumulation of physical and human capital, to use the resulting creative assets more
efficiently, and to ensure the access of the whole population to these assets. Financial
development and economic growth are thus clearly related, and this relationship has
occupied the minds of economists from Smith to Schumpeter; although the channels and
even the direction of causality have remained unresolved in both theory and empirics.
(Valpy Fitz Gerald, 2006)
I. 10. 2 An Unconventional Economic Theory
One of the main thinkers behind this approach is C.K. Prahalad, a U.S. economist of
Indian descent. He predicted the success of an economy that would be able to offer those
"at the bottom of the pyramid" the products and services they needed according to an
appropriate economic model. Such access helps these people to escape poverty; all while
creating new markets for companies.
The unconventional economic theory is employed by Christel Koehler (2009) towards
financial inclusion strategies. The unconventional economic theory explaining in terms

Chapter1 Introduction
Effectiveness of Financial Inclusion Programme in Kerala 25
of financial exclusion in India is an important concern for excluded disadvantaged
communities in which discrimination has been observed especially in access to finance,
capital, resources, technology, and markets. The basic purpose is to use as far as possible
neoclassical tools in the analysis of discrimination. The lack of financial products, is
concentrated in a small number of deprived people from social group (SC, ST and
Women) and sectoral (agricultural labourers, wage labourers, children, small and
marginal farmers) areas excluded
I. 10. 3. Normative Theory of Social Exclusion
Brian Barry (2010) has made an enormous contribution to the Normative Theory of
Social Exclusion He debated on social exclusion in the areas of welfare and fairness
for the socially excluded people. The normative theory of social exclusion is explain
the discriminatory practices in different forms such as access to finance, access to
quality of technical & medical education, resources, technology and markets.
Seema Khan(2012) developed resource guide which aims to introduce some of the best
literature on the definitions, understandings, causes, and impact of social exclusion, as
well as the ways in which exclusion can be measured and addressed by governments,
civil society actors and international organisations. Therefore, in the Normative theory
emphasizing in the course of human development, exclusion has taken the form of
segregating a group of people from the social, political, economic, cultural, educational,
and religious domains of societal life. But we need to stress that social exclusion does
not limit itself to segregation and deprivation. Social seclusion and isolation provide a
base for a sense of superiority and inferiority among members of the same society or
culture. It also culminates in a system of domination and subjugation.
I. 10. 4 Economic Growth Theories of Development
(World Bank, 2008) advocate that financial development creates enabling conditions for
growth through either ‘supply-leading’ (financial development spurs growth) or a
‘demand-following’ (growth generates demand for financial products) channel. Earlier

Chapter1 Introduction
Effectiveness of Financial Inclusion Programme in Kerala 26
theories of development hypothesised that a rise in inequality was inevitable in the early
stages of development.
I.11. Effectiveness of Financial Inclusion Programme in Kerala:
In the present study, effectiveness of financial inclusion programme in Kerala were
studied from both sides. To measure the effectiveness of FIP from supply side, financial
inclusion index were used. i.e., to study the extent of accessibility, availability and usage
were considered as the independent dimensions and these were taken as the three
dimensions of the index. Demand side of the financial inclusion programme were
measured using the model developed based on the perception of beneficiaries.
1.12. Expected Contributions from the Study:
Contributions from the findings are important due to the following five reasons:
1. Study gives attention from the supply side of Financial Inclusion Programme
(FIP) as well as demand side of the FIP, so the reality can be revealed.
Effectiveness of FIP in Kerala
Demand side Supply side
Measurement model were
developed and used for the study. Financial inclusion index
were used for the study.
Figure I.3: Studying Effectiveness of FIP in Kerala

Chapter1 Introduction
Effectiveness of Financial Inclusion Programme in Kerala 27
2. Study tries to understand the perception of beneficiaries towards the extent of
accessibility, and usage of formal financial services and their enhancement in
personal finance by increasing assets, income and employment opportunity.
3. Financial literacy acts as a moderator in between accessibility and usage
perception
4. Research suggestion can be used by service providers to rethink and make apt
strategies in the reality.
The findings of this study will provide better understanding of the effectiveness of
financial inclusion programme from the demand side based on their usage instead of
looking on merely opening up of accounts. This study will facilitate banking industry
(or similar service providers who use financial inclusion programme) to better
understand the management and control of the major attribute dimensions perceived by
the consumers. It will help policy makers in focusing more attention to those performing
attributes thereby enhancing efficiency. This study will flip some insight in the
measurement and understanding of the extent of perceived accessibility, and usage of
need based financial services as part of the financial inclusion programme and its
effectiveness. This study provides the effect of financial literacy in moderating the
relationship between usage and effectiveness of the programme. The study findings
would aid financial service providers to understand the usage pattern of low income
groups and can modify the existing policy based on the research suggestions.
1.13. Report Structure
The thesis is divided into six chapters. First chapter ‘Introduction’ gives an introduction
to the study by covering various aspects of financial inclusion programme, objectives of
the FIP, theoretical background of the study, significance of the study, and contribution
expected along with organisation of the thesis. Second chapter deals with review of
literature on each variable viz a viz accessibility, availability, usage, financial literacy,
and effectiveness of financial inclusion programme. Third chapter includes
methodology, rationale of the study, statement of the problem, definitions (theoretical

Chapter1 Introduction
Effectiveness of Financial Inclusion Programme in Kerala 28
and operational), conceptual framework, objectives, research hypothesis,
operationalisation of terms used, basic research design, tools of data collection,
interview schedule preparation, validity analysis-content validity, face validity, criterion
validity, reliability analysis, scope of the study, data collection, population of the study,
selection of unit of observation, sample size and sampling method and statistical
analysis and validation and limitations of the study. Fourth chapter deals with data
analysis and interpretation. Fifth chapter includes findings of the study. Sixth chapter
deals with suggestions and recommendations.

Chapter II Review of Literature
Effectiveness of Financial Inclusion Programme in Kerala 29
Chapter II
Review of Literature
A comprehensive review of literature pertaining to the research work is given
in this chapter. The major constructs namely accessibility, availability and
usage in relation with financial inclusion programme, financial literacy and
effectiveness of financial inclusion programme (asset creation; income
generation and employment generation) which are relevant to the study were
extracted through the literature survey.
II.1 Financial Inclusion
The initial step towards determining the extent of financial inclusion is to identify the
indicators that measure the level of accessibility of financial services in a country. Policy
makers need reliable information about the extent of inclusiveness prevalent currently
in order to frame policies and action points to overcome barriers (Gupta et al., 2013).
Delivering financial services through innovative mechanism is cheaper than delivering
financial services through conventional system. (World Bank, 2012). Generic strategies
and rural financial inclusion policy as a focus strategy in bank outreaching are the main
points to overcome financial exclusion. Micro finance banks can employ to enhance
savings in rural areas and survive in a globally competitive environment. (Onaolapo and
Odetayo, 2012). Establishing a bank account, increasing savings, using credit wisely,
avoiding over indebtedness, applying for micro finance loans, adopting new
technologies, reducing chances of fraud, choosing the right insurance are relevant
factors identified for inclusive growth. (Miller and Lee, 2012). Technology readiness,
age and gender moderate the beliefs-intention relationship. Customers with varying
levels of technology-related views and demographics hold different beliefs about
technology. The relationship between usefulness and behaviour was stronger for
younger males with high levels of optimism and innovativeness, at the same time as the
relationship between ease of use and behaviour was stronger for older females with a
high level of discomfort. (Yousafzai and Soriano, 2012).

Chapter II Review of Literature
Effectiveness of Financial Inclusion Programme in Kerala 30
The delay in issue of smart cards, stoppage of enrolments, and limited utility of smart
cards are certain grey areas in implementation of financial inclusion plan. Challenges
such as Financial Inclusion efforts being limited to channelizing welfare benefits at
higher cost to the state, banks viewing it as target oriented government programme
rather than business opportunity, poor viability of the model, problems relating to
technology, and stakeholders' orientation. (Bakshi P, 2012). Customers prefer BC model
due to issues such as convenience and saving on cost with regard to other models of
payments and deposits. (Puhazhendhi, 2012). Financial inclusion needs direct
engagement with the clients, by offering appropriate financial products and services
including financial literacy, and the BC model enables banking to the doorstep (Handoo,
2012).
Micro credit and micro savings have great potential to alleviate poverty in India.
Through the use of technology, innovations and marketing strategies financial inclusion
can prove that small is beautiful. (Joseph, 2011). Common minimum agendas for the
growth of Indian economy are: social protection of agricultural worker, education and
information drive among them, empower with inclusive education and training using
mass media, increase the role of media etc. In the international level, the main
implementing mechanism of the action plan is a new Global Partnership for Financial
Inclusion (GPFI). Financial Stability Board (FSB) is entrusted with the responsibility to
examine the issue in collaboration with other international organizations, and to report
back to the next G20 Summit. (Chatterjee, 2011). Income, inequality, literacy,
urbanization and physical infrastructure for connectivity and information are important
variables for financial inclusion. Health of banking sector does not seem to have a
precise effect on financial inclusion whereas ownership pattern does seem to matter.
Level of human development and financial inclusion in a country move closely with
each other. (Sarma and Pais, 2011).
Greater financial inclusion presents opportunities to enhance financial stability (Hannig
and Jansen, 2010). Majority of UK Muslims are financially excluded due to the absence
of banking products that would meet their needs and would also comply with Shari’a,
main reasons for the low take-up of the existing Shari’a compliant financial products
relate to the strong skepticism about the authenticity of such products. Affordability,

Chapter II Review of Literature
Effectiveness of Financial Inclusion Programme in Kerala 31
acceptability and accessibility of these products remained a real cause for concern for
most of the less affluent UK Muslims. (Hersi, 2009). The importance of Financial
Inclusion to national economies is obvious from the support extended by individual
governments and international bodies around the world (Frost & Sullivan, 2009).
A financial advisor's good sense of humour has a positive impact on the clients'
perceptions of service quality, trust, satisfaction, purchase intentions, and word-of-
mouth propensity. A better understanding of humour is useful for service providers
owing to its mass potential, its low cost, and its positive benefits for customers and
financial advisors alike. (Bergeron and Vachon, 2008). Any financial inclusion solution
must be sensitive and responsive to the varied circumstances and multifarious financial
needs of local communities – one-size-fits-all models of financial inclusion will have
limited success due to the heterogeneous local manifestations of financial exclusions,
the variety of perceived needs, and the variances of both of these over space and across
social groups. (Fuller et al., 2006). With the framing of financial inclusion agenda, many
saw formal financial services as the only long term solution to sustainably reach more
customers (Isern and Porteous, 2005).
The communication of social responsibility in television commercials for banks has
increased by seven percent over the years. (Peterson and Hermans, 2004). “Opening a
bank account, as a positive step, does not move someone from being excluded to being
included. There is a spectrum of financial inclusion” (Regan et al., 2003). Bank-driven
pricing strategies may have an overriding effect on other factors. Profits may be
increased, socio-economic exclusionary effects reduced and social image improved by
voluntarily reconsidering pricing and other bank-driven exclusionary strategies.
(Sharma and Reddy, 2003). Customers expect banks to provide the basic banking
services and they are also expect different levels of services to maximize the value they
can derive from the banks. Hence, customers evaluate competing offers in terms of the
totality of the product and service as well as the relationship that exists between
themselves and the bank. To gain marketing advantage, banks have to exceed
customers’ expectations rather than merely meet the bare minimum. Every interaction
with a customer provides an opportunity to be “unique” and to “go beyond the call of
duty”. (Chang et al. (1997)

Chapter II Review of Literature
Effectiveness of Financial Inclusion Programme in Kerala 32
II .2. Accessibility and Availability
Access to basic financial services such as savings, loans, insurance, credit, etc.,
through financial inclusion has a positive impact on the lives of the poor and help
them to come out of the charges of poverty. (Lal, 2018). Participation has led to
increase in the standard of living, thereby reducing multi-dimensional poverty and
participation does not reduce deprivations in the “education” dimension, whereas in
all other dimensions reduction in deprivations is significant. The programme under
study seems to be seriously improper targeting by allocating the programme to non-
poor sections rather than absolute poor. (Khaki & Sangmi, 2017). Financial
inclusion, or access to and the use of affordable financial services, boosts world
development (Allen et al., 2016; Demirgüç-Kunt and Klapper, 2013; Zins and Weill,
2016).
Criteria to measure the status of financial inclusion in an economy such as (i) outreach
dimension and (ii) actual usage dimension. In terms of outreach dimension, there are
two types of indicators: geographical penetration (number of bank branches or ATMs
per 1000 square kilometers) and demographic penetration (number of bank branches or
ATMs per 100000 people). More bank branches and ATMs per 1,000 square kilometers
indicates smaller distances to nearest physical bank outlets and easier geographical
access. Demographic penetration measures the average number of people served by each
bank branch or ATM. (Mehrotra et. al 2009; Sarma, et. al 2010; and United Nation,
2006).
Access: means the ability to use available financial services and products from formal
institutions (Hannig and Jansen, 2010)
Access to financial services allows the poor to save money safely, prevents the focus of
economic power with a few individuals and helps to lessen the risks that the poor face
as a result of economic shocks or natural calamities (Mehrotra et. al, 2009).
Promoting access to financial services has become a major concern for policymakers in
developing countries and broad access to financial products is interconnected with social
and economic development (World Bank, 2008). Through finances, growth is achieved
because it fuels ‘creative destruction’ by allocating resources more efficiently (Sarma,

Chapter II Review of Literature
Effectiveness of Financial Inclusion Programme in Kerala 33
2008; Aghion, 2008). This implies that through broader access to financial services,
beginners are “empowered and freed from the disadvantages that would otherwise arise
from their lack of inherited wealth and absence of connections to the network of well-
off incumbents” (Rajan et al., 2003). Accessibility leads to usage, and eventually it leads
to upliftment of the poor or economic growth (Amendola et.al, 2017; Chen & Jin, 2017;
Hirschler, 2015; Jones, 2015; Das, 2013; Allan et.al, 2013; Ardic et.al, 2013; Shankar,
2013; Pradhan, 2013; AFI, 2012; Minsk, 2012; Sharma et.al, 2011; AFI, 2010; Roubini
& Bilodeau, 2008;Chavan, 2007; Helms, 2006; United Nations Capital Development ,
2006; Helms, 2006)
It is hard work to pursue financial inclusion from a demand-driven perspective.
(Latortue et.al, 2013). Some of the major factors standing as barriers to accessing proper
financial services by the poor are, (1) socio-economic factors like education, gender and
age, low and irregular income and geography), (2) regulatory factors like provision of
identity documentation, (3) and product design factors like minimum account balances.
On the other hand, the barriers that financial service providers experience in reaching
out to the poor are the cost involved in providing such financial services and also,
finding the regulatory space to innovate. It is a known fact that, transaction size is not
the determining factor for transaction cost. Thus, it is not feasible to serve the poor with
small value services under the existing retail banking or insurance domain.
Providing access to and use of formal financial services has gained a major prominence
in the past few years as a policy objective for national policymakers (CGAP, 2009).
Broad access to financial services and products is consistent with social and economic
development (PRR on Access to Finance, 2006), a developed financial system is vital
for achieving economic growth and poverty alleviation, and to enlarge financial
inclusion (Beck et al., 2000; Beck et al., 2004a).
The focus of the Access through Innovation Subgroup (ATISG) is on innovative
methods of improving access to financial services. With over three million mobile
phones already in use around the world and with rapid increase in its number, the costs
of communications and information technology are reducing. This puts forth a great
opportunity to utilise technology to address financial exclusion.

Chapter II Review of Literature
Effectiveness of Financial Inclusion Programme in Kerala 34
At this outset, financial sector policy and regulation determines the extent of use of
technology for the promotion of financial inclusion. The number of countries depending
increasingly on technology to address this issue is rapidly increasing. Thereby, the
number of poor people who were earlier excluded from using these financial services
are now, largely included by getting access to the basic services. But, innovation in
delivery and design of financial services targeting the poor and the excluded, gives rise
to challenging policy and regulatory issues. The capacity of policy makers is far below
the rapid growth of industrial innovation.
Thus, the ATISG focuses on innovations with the capability of reducing transaction
costs and reaching the excluded. This synthesis report contains the output of the first
phase of work of ATISG till June 2010. During this phase, the main focus was on
analysing the recent experience and lessons learned, and also the introductory
identification of general principles.
The core of the ATISG report is the nine “Principles of Innovative Financial Inclusion”.
These nine principles are,
1. Leadership: cultivate a broad-based government commitment to financial
inclusion to help alleviate poverty.
2. Diversity: implement policy approaches that promote competition and provide
market-based incentives for delivery of sustainable financial access and usage
of a broad range of affordable services (savings, credit, payments and transfers,
insurance) as well as a diversity of service providers.
3. Innovation: promote technological and institutional innovation as a means to
expand financial system access and usage, including by addressing financial
sector weaknesses.
4. Protection: encourage a comprehensive approach to consumer protection that
recognises the roles of government, providers and consumers.
5. Empowerment: develop financial literacy and financial capability.
6. Cooperation: create an institutional environment with clear lines of
accountability and coordination within government; and also encourage
partnerships and direct consultation across government, business and other
stakeholders.

Chapter II Review of Literature
Effectiveness of Financial Inclusion Programme in Kerala 35
7. Knowledge: utilize improved data to make evidence based policy, measure
progress, and consider an incremental “test and learn” approach acceptable to
both regulator and service provider.
8. Proportionality: build a policy and regulatory framework that is proportionate
with the risks involved in such innovative products and services and is based on
an understanding of the gaps and barriers in existing regulation.
9. Framework: consider the following in the regulatory framework, reflecting
international standards, national circumstances and support for a competitive
landscape: an appropriate, flexible risk-based AML/CFT regime; conditions for
the use of agents as a customer interface; a clear regulatory regime for
electronically stored value; and market-based incentives to achieve the long term
goal of broad interoperability and interconnection.
Availability of needed financial services leads to usage of financial inclusion products
and thus to inclusive growth (Rusu, 2017; Zulfiqar et al., 2016; Kablana & Chhikara,
2013; Das, 2013; OECD, 2013; Shankar, 2013; Divya, 2013; Stewart et al., 2012; Cril,
2012; AFI, 2012; Chandra, 2012; Sreenivasan, 2012; Yorulmaz, 2012; Ministry, 2011;
Bisht et al., 2010; Turnham, 2010; FINGroup, 2010; Basavaraja, 2009; United Nations, 2006;
FitzGerald, 2006; Levine, 2005; Jones, 2001)
Income, financial information from various channels and awareness of self-help groups
(SHGs), and education are influential factors significantly contributing to financial
inclusion and were identified using a logistic regression model. Nearness to post office
banks also increases the likelihood of Financial Inclusion. Area terrain and receipt of
government benefit individually do not facilitate inclusion. Recipients of government
benefits in plain areas show increased level of Financial Inclusion (Bhanot, Bapat, &
Bera, 2012).
For increase the credit flow to MSMEs, suggested the introduction of single window
clearance, centralized processing, online chasing of applications, using the services of
NGOs to train micro / tiny sector entrepreneurs, setting up of specialized branches,
review of credit flows in SLBCs, revival of potentially viable sick units, micro
entrepreneurs gathering through SME welfare associations, and mobile banking
services. (Narendra, 2012)

Chapter II Review of Literature
Effectiveness of Financial Inclusion Programme in Kerala 36
The role of regulatory environment which has paved path for the development of
technology led models in the emerging economies of the world (Handoo, 2010). Even
though there is increased spread of formal banking networks in the recent past, access
to basic financial services are still beyond the reach of large sections of the society. Self-
help group bank linkage model displays the potential to provide an alternative
instrument to extend financial services to large unbanked sections of the society
(Badajena and Gundimeda, 2010).
Compatibility, perceived usefulness, and risk are significant indicators for the adoption
of mobile banking services. Compatibility had a strong direct effect and also identified
as an important antecedent for perceived ease of use, perceived usefulness and
credibility. Trust and credibility are vital in decreasing the overall perceived risk of m-
banking (Lewis et al. 2010).
High interest rate on self-help group loan point out towards the affordability of micro
finance for the poor borrowers who in effect are estimated to have a very high rate of
return from their business ventures in order to just cover the interest cost. Micro finance
has to develop as a means of financial inclusion that are accessible and affordable for
the excluded groups/ regions and that can help loosen the grip of informal sources of
finance and bring the excluded sections everlastingly into the ambit of formal finance
(Chavan and Birajdar, 2009).
Becoming unemployed or experiencing a relationship break-up can have an adverse
effect on people’s experience of financial exclusion, in the sense that people may close
down or stop using bank accounts or find it harder to access the mainstream credit. These
exclusionary procedures can be captured in a specific set of barriers that explain why
people decide not to use financial products or facilities on the one hand, or are denied
access to certain financial services by financial institutions on the other. In the literature,
these are broadly divided into institutional (supply-side) and individual-based (demand-
side) hurdles; whereby the latter often, but not completely, explain issues of problems
in using services and the former tends to create strain in accessing financial services”.
(Lederle, 2009).

Chapter II Review of Literature
Effectiveness of Financial Inclusion Programme in Kerala 37
The relation between poverty and access to financial services, explored the unique
banking needs and first choice of the rural poor, assessed the potential that the unbanked
rural segment carries in terms of viable rural banking and carried out a situational
analysis of rural banking practices and savings mobilization and utilization in the rural
areas. Kenyan because of formal financial institutes are concentrated in urban, semi-
urban and cash crop growing zones, most of the rural poor do not have access to their
services. Survey in Botswana showed that the rural poor have different levels of access
to the financial zone. Parallel results of Namibian survey lead to the conclusion that
improved access to financial services can contribute to poverty reduction among the
poor. Refining access to formal financial services can contribute to poverty reduction
among the poor. (Kibua, 2007). Consumers find it hard to obtain access to banking
products. Banking products used by the sample are discussed as well as all their support
motives. It was established that the majority of consumers did have a bank account and
there was a significant link between having an account and various demographics such
as income level, employment status and level of education. Specific strategies are
recommended to bank management. (Saunders et al. 2007). The number of banks
branches in rural areas were used as a measure of bank penetration and the credit access
of farms in rural areas in India. (Binswanger and Khandker, 1995). A critical factor that
facilitates people to exit poverty by enhancing productivity is access to finance
(Banerjee and Newman, 1993).
II.3. Usage
Usage of financial inclusion products leads to inclusive growth (Rusu, 2017; Swamy,
2014; Mor & Ananth, 2013; Mamman, 2013; Srinivasan, 2012; Kanther &
Nagabhushan, 2012; del Mar et al., 2009; Grades & Agrarwissenschaften, 2007; Asian
Development Bank, 2006; United Nations, 2006; Joo & Grable, 2004; Helms, 2006;
Goldberg, 2005; Kamal, 1999)
Usage leads to additional employment, income generation, asset creation (World Bank,
2015; Demirguc-Kunt et al., 2014; Demirgüç-Kunt et al., 2013; Allen et al., 2012;
Kamath, 2010; Cull & Scott, 2010; Ramji, 2007)
The government and RBI’s ambitious financial inclusion plan is not yielding desired
results yet as most of the programmes including no- frills accounts are ineffective. Only

Chapter II Review of Literature
Effectiveness of Financial Inclusion Programme in Kerala 38
three percent of No-frill accounts are operational. (Skoch development, 2011). Out of
the 5000 new branches that were opened in 2011 only 21 percent are in rural areas, and
the number of urban families covered under the no-frill account are twice than that of
rural households (Economic Times, 2011). In spite of having a reasonably large number
of financial institutions, many states hold-up woefully after in financial inclusion, as
measured by percentage of households with outstanding debt. Rural households in some
states exhibit a bias towards non- institutional sources of credit. Increased number of
institutions in such states is unlikely to have any significant impact on financial
inclusion, unless it is accompanied by other measures. Land reforms for reasonable land
distribution and transparent landholding records can play a prodigious role in increasing
access to institutional credit in rural India. (Kamath and Sandstorm, 2010).
beyond the basic adoption of banking services, usage focuses more on the permanence
and depth of financial service and product use(Hannig and Jansen, 2010) Usefulness,
social norms and social risk, are the factors that influence the intention to adopt mobile
banking services the most. Ease of use has a stronger influence on female respondents
than male, whereas relative advantage has a stronger effect on perception of usefulness
on male respondents. (Rios and Riquelme, 2010)
The main reason for rejecting the mobile banking services were explored using
multidimensional scaling, and the chi-square tests were used to measure differences
between socio-demographic variables (Laukkanen et al. 2010). Financial literacy eases
decision making procedures, which improve the savings proportions, credit worthiness
of potential borrowers, and resulting into better access and use of financial services by
the poor (World Bank, 2009; OECD, 2009). Perception of cost, risk, low perceived
relative advantage and complexity were revealed to be the main reasons behind the
reluctance to use the mobile banking service. The influence of other background factors
is less evident. (Gill et al. 2006). Impact of “person-related” service characteristics
(empathy, politeness, and similarity) and “offer-related” service characteristics
(customization, competence, and promptness) by examining business client trust in their
current bank service representatives based on the length of the relationships with their
banks (Coulter and Coulter, 2002).

Chapter II Review of Literature
Effectiveness of Financial Inclusion Programme in Kerala 39
II.4. Effectiveness of Financial Inclusion Programme
Financial inclusion can lead to economic development. (Rastogi & Ragabirunta, 2018).
Financial inclusion can increase growth through the reduction of poverty (Cull et al.,
2014). Economic growth follows financial inclusion, boosting business opportunities
will definitely increase the gross domestic product, which will be reflected in our
national income growth”. (Reddy, 2012). Impact factors of financial inclusion, viz-a-viz
change in income, change in saving, living standard, level of indebtedness, improvement
in occupation/business and level of banking habits. (Kumbher, 2012). In this regard, a
developed financial system is important in achieving economic development and
poverty alleviation (Beck et al., 2000; Beck et al., 2004; Honohan, 2004a; OECD,
2012). A positive correlation exists between financial development and economic
growth. Current development theories suggest that greater financial inclusion can have
a positive impact on the lives of the poor. (King et. al, 1993; Beck et. al, 2000, 2004;
Levine, 2005 and Demirgüc-Kunt et. al, 2008)
Access to a well-functioning financial system, by creating equal opportunities, enables
economically and socially excluded people to integrate better into the economy and
actively contribute to development and protects themselves against economic
shocks.(Swamy, 2014).
Micro-credit customers’ advantage from increased access, improved services and in due
course improved prices due to competition (Porteous, 2009)
There is growing confirmation that financial inclusion leads to poverty eradication and
inequality and hence is crucial for inclusive economic growth (Bruhn and Love, 2014;
Beck et al., 2007a; Beck et al., 2004; Clarke et al. 2003). A few of the literature has
explained some mixed results in contradiction to the time-honoured view point that
financial intermediation programs aid in economic upliftment of the poor families owing
to women participation ( Kabeer, 2001; Montgomery & Weiss, 2011; Mosley, 2001;
Navajas, et.al., 2000) which enthused a detailed scrutiny of the available literature.
Financial services and instruments play an important role in the process of domestic
economic development. While some scholars have focused on the interaction of large
or small enterprises, the most important consumers of financial products are the

Chapter II Review of Literature
Effectiveness of Financial Inclusion Programme in Kerala 40
households due to their influence the scale and asset mix of finance.(Rusu, 2017). Urban
oriented Commercial Banker cannot easily understand or appreciate the inherent
inadequacies of the rural society. RRBs have comparative advantage over Commercial
Banks in terms of readily available extensive rural base, access to low income groups,
good rapport built over the years with small borrowers, and rural oriented human
resource base. (Thingalaya, 2012). Inclusion goes beyond mere access and for including
institutions such as Post Offices, Co-operatives, SHGs and MFIs, that provide
appropriate and adequate services to the vulnerable people in the inclusion framework.
(Srinivasan, 2012). Economic growth follows financial inclusion, boosting business
opportunities will definitely increase the gross domestic product, which will be reflected
in our national income growth. (Reddy, 2012). There is direct and indirect association
between financial deepening and economic growth (Barajas et al., 2012; Masoud and
Hardaker, 2012; Berentsen and Shi, 2008; Rousseau and Wachtel, 2005; Ndebbio,
2004).
Financial inclusion will help strengthen financial deepening and enable resource
mobilization for extending and broadening credit leading to economic development and
accelerate growth. (Banerjee, 2011). There is an urgent need to link all households that
are excluded from formal financial services for inclusive growth. (Cheriyan, 2011). The
act of nationalization of banks way back in 1969 has contributed towards achieving
inclusive growth within the country. Despite nationalization and massive branch
expansion, the challenges of financial inclusion could not be fully met by the banking
sector alone and there is need for identifying new channels to achieve full inclusive
growth in the country. (Rao, 2010). Through graduated credit, the attempt must be to
lift the poor from one level to another, so that they come out of poverty. There is a need
for co-ordinated action between the government and others to facilitate access to bank
accounts among the financially excluded (Swamy and Vijayalakshmi 2010). Financial
inclusion is needed for rural and downtrodden masses that are the future growth engine
of the economy. Government initiatives to support financial inclusion needs to be
backed by progressive policies. This can be achieved only through public private
partnership model powered by ubiquitous technologies (Agarwal. 2010).

Chapter II Review of Literature
Effectiveness of Financial Inclusion Programme in Kerala 41
Financial inclusion is sine qua non for the empowerment of rural households and it is
possible through branchless banking in villages. Existing technology and regulations are
not congenial to prospective rural savers who have marginal savings potential. Better
technology and more flexible regulations are necessary for efficient mobilization of
micro savings. (Barik, 2010)
Financial inclusion aids low-income households to access basic financial services
which, in turn, fosters their financial autonomy and thus intensifies economic growth.
(Sarath Chandra and Manju, 2010; Jalan, 2009; Beck et al., 2007; and Sarma and Pais,
2008).
Financial inclusion has far reaching consequences, which can help many people come
out of abject poverty conditions. The financial markets must act responsibly and ensure
that the spirit of financial inclusion is not breached in the future. (Agarwal, 2008). Critics
of Indian regional rural banks and their prevailing culture have argued that a product-
focused rather than a market-oriented approach to new service development is
responsible for their inadequate performance. (Megicks et al. 2005). The crucial factor
in deciding if the banking industry is working effectively, within correct economic
boundaries, is whether this inclusion agenda is effective and actually helping excluded
people. If people are unaware of what the banking industry is doing, then their work is
ineffective. If the banks are not regulated in a way which promotes good financial
inclusion practice, then this too is ineffective (Chambers, 2004). Financial development
is positively correlated with enhanced economic growth. Sensitivity analysis of the
model indicates that the empirical findings are invariant to the inclusion of other
variables often cited as determinants of economic growth. (Hunter and Hao, 1997).
Effectiveness of financial inclusion from demand side were measured using its
dimensions namely, asset creation, income generation and employment generation.
Detailed reviews regarding these dimensions are given below;
II.4. a. Asset Creation
Financial inclusion programme helps the poor to earn personal assets (Chirkos, 2014;
Moser & Felton, 2007; Wu et.al., 2007; World Bank, 2007; Levine & Levine, 2004;
Kamal, 1999). Participation in asset-building programmes generates credit history and

Chapter II Review of Literature
Effectiveness of Financial Inclusion Programme in Kerala 42
increases credit scores (Birkenmaier et al., 2012). The Self Help Groups help in the
social cause of alleviation of poverty, increase of sustainability, reduction of
vulnerability, improvement of capacity building and help the weaker sections to build
assets (Venkataramany and Bhasin, 2009). Hoarders gained full access to the saved
funds and accumulated funds can be used to buy a house, fund post-secondary education
and start a small business (Boshara, 2005; OECD, 2003). Assets offer a shield against
poverty, since the assets are not immediately consumed but are a stock that bears and
generate economic returns (Ford Foundation, 2004).
II.4. b. Income Generation
An access to a well-functional, formal financial system generates opportunities for
economically disadvantaged people to participate in income-generating activities
(Swamy, 2014). Through accessing credit, beneficiaries of FI programme can generate
income (Pal & Pal, 2012; Ellmer, 2012; Mugabi, 2010; Danish Refugee Council, 2008;
World Bank, 2007; Parvin et. al., 2005). There is a positive relationship between access
to credit and productivity (Akudugu, 2016; Ciaian et al., 2012). The income level has a
positive impact on both credit and deposit penetrations. (Kumar, 2010).
II.4. c. Employment Generation
There is a statistically significant impact of financial inclusion on women
entrepreneurship (Goel and Madan, 2019). Financial inclusion is an effective way for
combating poverty, unemployment and inequality (Lal, 2018). Enlightening the
financial access of low-income households by opening new branches significantly
reduces the unemployment rate and increases income levels. (Bruhn and Love, 2014).
Financial inclusion programme helps the poor to create self-employment (Holmes et al.,
2013; Al-mamun et al., 2012; Kamath, 2010World Bank, 2007). Access to finance is a
pre-requisite for employment, economic growth, poverty reduction and social cohesion,
as it provides them an opportunity to have a bank account, to save and invest, to insure
their homes and enable them to break poverty (Rahman, 2009; Chakrabarty, 2011).
II.5 Financial Literacy
Access to financial services and the ability to manage money effectively can obviously
make a difference to a poor person’s material wellbeing (Bongomin et al., 2019).
Financial Literacy acts as a moderator for the access and usage of financial inclusion

Chapter II Review of Literature
Effectiveness of Financial Inclusion Programme in Kerala 43
programme (Chen & Jin, 2017; Adomako et.al., 2016; Friedline & West, 2016;
Kennedy, 2013; Nye and Hillyard, 2013; OECD, 2013; Sreenivasan, 2012; Chandra,
2012; Cril, 2012; Falahati et.al., 2012; Ministry, 2011; OECD, 2011; & Oecd, 2011;
Turnham, 2010; Hung et.al., 2009; Gouws & Shuttleworth, 2009; Nye et.al., 2009).
Low levels of financial literacy may prevent the take-up of more complicated financial
products and financial literacy significantly moderates in the relationship between
access to finance and growth of SMEs in developing economies (Bongomin et al., 2017)
and financial literacy helps individuals to make intelligent financial decisions and
choices, which develops access and use of financial services (Okello et al., 2016).
Development agencies have documented the importance of financial literacy programs
in promoting access to financial services, among poor households in developing
countries (World Bank, 2014). Financial literacy is intended to facilitate access and,
where appropriate, encourage widening use of pertinent financial products and services
for the benefit of poor individuals (Atkinson and Messy, 2013). Financial inclusion and
financial literacy are two elements of an integral strategy; while financial inclusion
provides access and financial literacy provides awareness” (Subbarao, 2013).
Individuals with financial literacy skills incline to make better financial decisions with
fewer management mistakes than who are financially illiterate. (Njoroge and Gathungu,
2013). Financial literacy significantly moderates in the relationship between access to
finance and growth of SMEs in developing economies
Financial information and education were the vital aspects of success of any financial
inclusion initiatives and government plans (Kumar, 2013; Chakravarty and Pal, 2013;
Bhanot et al., 2012). Financial literacy programs and interventions enhance the take-up
of products such as savings accounts and insurance. It encourages savings by increasing
alertness and knowledge of financial products, plus influences saving activities and
financial planning among the poor (Xu and Zia, 2012).
Financial Literacy and Credit Counselling Centres (FLCCs) are the important
requirement for the economically active poor people for the effective financial inclusion.
(Tanksale, 2012). Providing financial literacy is an important consideration for inclusive
growth. (Cheriyan, 2011). Poor households can progress their financial knowledge and
skills, which empower them to make wise financial decision and choices over

Chapter II Review of Literature
Effectiveness of Financial Inclusion Programme in Kerala 44
associational links (Cohen and Nelson, 2011). Households with higher levels of
financial literacy were more likely to plan for retirement, and consequently, arrive at it
with substantially more assets than non-planners (Lusardi and Mitchell, 2011).
Financial literacy is an important adjunct for promoting financial inclusion and
ultimately financial stability. The focus of any discussion on financial literacy is
primarily on the individual, who usually has limited resources and skills to appreciate
the complexities of financial dealings with financial intermediaries on a day-to-day
basis. (Bihari, 2010). The Banks/RBI should conduct awareness camps about Financial
Inclusion to the bank staff. And also banking to the poor is not poor banking. There is
lot of potential to get business from the people at the bottom, as amply shown by the
self-help group movement in the past ten years or more. (Rao, 2010). Individuals
provided with information on the cost of payday borrowings reduced their probability
of repeating their payday loans (Bertrand and Morse, 2010).
Financial literacy helps the poor by empowering and educating them so that they are
knowledgeable about finance in a way that is relevant to their lives (World Bank, 2009).
Financial literacy that enriches ability to make well-informed financial decisions, helps
the poor to manage their financial affairs. Thus, it has significant implications on
financial security and standard of living of poor households (OECD, 2009) and it can
be an important determinant of access to finance (Cole and Fernando, 2008).
II.6 Banking Products and Services
The positive impacts of financial inclusion and deepening on poverty reduction rise
the need for promoting breadth and depth of public sector banks that could have a
synergistic effect on poverty reduction in India (Inoue, 2018). It is predictable that
Bank Penetration would be positively connected with the household use of formal
financial services (Pal & Pal, 2012). and the banks should diversify their product and
develop instruments so as to meet the aspirations of borrowers and investors in the
context of various saving schemes of other financial institutions, post office etc.
(Malhotra, 1991). Early in the 1970s, various competitive pressures finally led banks to
adopt a marketing concept, both in theory and practice. (Stafford and King, 1983).

Chapter II Review of Literature
Effectiveness of Financial Inclusion Programme in Kerala 45
From the review of earlier studies summarized above it can be concluded that financial
inclusion programme is an opportunity for both Banks (as a business opportunity) and
target groups (as economic opportunity). Financial inclusion is integral to the inclusive
growth process and sustainable development of the country. However, the financial
inclusion models that banks come up with should be replicable and viable across the
country. Investigation revealed that only a few attempts were done about the
effectiveness of financial inclusion programme. Hence a detailed study on the
effectiveness of financial inclusion programme in Kerala from both sides i.e., from the
supply side (banks) as well as from the demand side (target groups) is necessary for the
time being. The financial inclusion index for measuring effectiveness of FIP were
identified through the detailed literature survey and the study also focuses to suggest
measures for improving the procedures of Financial Inclusion programme for the proper
implementation.


Chapter III Research Methodology
Effectiveness of Financial Inclusion Programme in Kerala 46
Chapter III
Research Methodology
This chapter on research methodology tries to give a detailed explanation
regarding research design, type of survey conducted, tools used for the
survey, data collection methods, as well as the terms and the variables which
go into the formulation of basic conceptual framework of the study. The
hypothesised relationship between accessibility to usage, as well as usage to
asset creation, income generation and employment generation is depicted in
this chapter based on the learning deduced from the literature.
III.1 Rationale of the study
Financial inclusion programme is offered by RBI as an opportunity for banks (as a
business opportunity) and as a welfare activity for the target groups (economic
opportunity). It is integral to the inclusive growth process and sustainable development
of the country. Still, the financial inclusion models that banks come up with should be
replicable and viable across the country. Therefore, there is a need to study the financial
inclusion programme practiced by commercial banks and also to study the said
programme as opportunities and constraints for the target groups in Kerala. The study
also focuses to suggest measures for overcoming the constraints in the implementation
of the programme.
Research in financial inclusion from the demand side can help governments and Banks
to craft policies and regulations that enable the introduction of more customer-
responsive products and service delivery, thus facilitating responsible uptake of
services. The study is significant from both an application perspective of banking as
well as from an academic angle. Improving poor people’s access to finance boosts
growth and reduces income inequality and poverty in the country. The prominence of
financial inclusion is clear from the foresaid statement.
Therefore present study focuses on the effectiveness of FIP from both sides i.e., from
supply (banks) side as well as demand side (beneficiaries’) perspective.

Chapter III Research Methodology
Effectiveness of Financial Inclusion Programme in Kerala 47
III.2 Statement of the Problem:
Kerala stands unique among Indian States with a consistently higher level of human
development comparable with that of many advanced countries but with a much lower
per capita income. RBI recently came up with Financial Inclusion Index and Kerala
topped the index. Statistically a person is included when he or she opens an account in
the formal financial sector. But the real financial inclusion happens when there is any
change in their life. That means through graduated credit, the attempts must be to lift
the poor from one level to another.
Majority of the research in the area of financial inclusion is focusing on the problems of
individuals who are excluded and measures for reaching to them. As a result there come
lots of schemes to reach the poor. However, most of the efforts from the government
and banks have been in the direction of opening of accounts, which is only a technical
step in the process of financial inclusion. Statistically, a person is said to be financially
included when he just opens up an account in the formal financial sector, but actual
financial inclusion happens only when they have improvements in their economic
position. As a policy it is very convenient to the vulnerable group to include and improve
their economic status. There has not been any comprehensive study done to look at the
financial inclusion process and to what extend it is achieving its overall objectives going
beyond mere figures. Thus it is very necessary to check the demand side perception of
financial inclusion program i.e., whether the financially included get the benefits
through the scheme. Therefore present study gives more stress on whether financially
included weaker section gets developments through the scheme from the perception of
effectiveness of the FIP.

Chapter III Research Methodology
Effectiveness of Financial Inclusion Programme in Kerala 48
III.3 Objectives
Based on the conceptual focus highlighted in the earlier sections, this study proceeds to
inquire into the following set of objectives and test the hypothesis framed as under
1. To study the factors associated with Banking policies and implementation of
Financial Inclusion Programmes.
2. To study the extent of accessibility, availability and usage of formal financial
services (savings, micro credit, remittance, payments and micro insurance) by
the weaker sections.
3. To study the factors associated with the beneficiaries in making use of the
financial services to meet their specific needs.
4. To study the effectiveness of Financial inclusion Programme in the holistic
approach.
5. To make broad suggestions to improve financial inclusion programme in Kerala.
III.4 Conceptual Framework
Sl. No Variable for the study Descriptions
1 Demographic variables Background
2 Socio-economic variables Background
3 Accessibility Independent
4 Usage Independent
5 Financial Literacy Moderator
6 Effectiveness of financial inclusion:
1. Asset creation
2. Income generation
3. Employment generation
Dependent variable
Dimensions of dependent
variable

Chapter III Research Methodology
Effectiveness of Financial Inclusion Programme in Kerala 49
III.5 Research Hypothesis
H1: There has been a significant relationship between accessibility and usage
H2: There has been a significant improvement in the income of the beneficiaries due to
credit support of the scheme
H3: There has been a significant improvement in the asset position of the beneficiaries
due to credit support of the scheme
H4:There has been a significant improvement in the self-employment of the
beneficiaries due to credit support of the scheme
H5:There has been significant interaction effect of financial literacy between
accessibility and Usage.
III.6 Definitions (Theoretical and Operational)
III.6.1 Financial Inclusion
Theoretical Definition-
1. “A financial sector that provides access for credit for all bankable people and
firms and saving and payment services to everyone. Inclusive finance does not
require that everyone is eligible to use each of services but they should be able
to choose them if desired”. – United Nations (2006).
2. "The process of ensuring access to financial services and timely and adequate
credit where needed by vulnerable groups such as weaker sections and low
income groups at an affordable cost. - Rangarajan committee (GoI, 2008) - the
committee on financial inclusion.
3. “Expanding access to financial services, such as payments services, savings
products, insurance products, and inflation-protected pensions.” – (Raghuram
Committee, 2008) Committee on Financial Sector Reforms (CFSR).
4. “Full financial inclusion is a state in which all people who can use them have
access to a full suite of quality financial services, provided at affordable prices,
in a convenient manner, and with dignity for the clients. Financial services are
delivered by a range of providers, most of them private, and reach everyone who

Chapter III Research Methodology
Effectiveness of Financial Inclusion Programme in Kerala 50
can use them, including disabled, poor, rural, and other excluded populations.”-
(Centre for Financial Inclusion, 2012)
Operational Definition – Financial Inclusion is the process of ensuring access to
various financial services for the needy at speedy and cost effective manner without any
hindrance, and through which they have effectiveness. Financial services include
savings, credits, and insurance services.
III.6. 2 Accessibility
Theoretical Definition
1. Accessibility as being similar to reachability and convenience (While Pirie,
1981).
2. The ability of people to reach and engage in opportunities and activities
(Farrington and Farrington, 2005).
Operational Definition
From Demand Side
Accessibility refers to individual's ability to utilize the available formal financial
services. It includes accessibility to banking outlet/ATM, technology, banking products,
financial services etc.
Accessibility perception is measured by using eight items in a five point scale.
From Supply Side
Accessibility means penetration of banking system given by the number of bank
accounts per 1000 population.
III.6. 3 Availability
Theoretical Definition- availing of banking outlets (offices, branches, ATMs and so
on) (Sarma, 2012).
Operational Definition: (from supply side)
Thus, availability of services can be indicated by the number of bank outlets (per 1000
population) and/or by the number of ATM per 1000 population.

Chapter III Research Methodology
Effectiveness of Financial Inclusion Programme in Kerala 51
III.6. 4 Usage
Operational Definition
From Demand Side
Usage: Ability of individuals to use formal financial services for meeting their specific
financial requirements (need based financial services). It includes the entire range of
financial services such as savings, credit, remittances, payments and insurance.
Usage perception is measured by using eight items in a five point scale.
From supply Side
Volume of credits plus deposits by the beneficiaries.
Individual’s ability to utilize the
available formal financial services. It
includes accessibility to banking
outlet/ATM, technology, banking
products, financial services etc. It is
measured by using eight items in a five
point scale
Summary of operationalisation of independent variables
Supply side
measures
Demand side
measures
Accessibility
Penetration of banking
system given by the number
of bank accounts per 1000
population
Availability
Measured by the number
of bank branches and
ATMs per 1, 00,000
people
Usage Volume of credits plus
deposits.
Ability of individuals to use formal
financial services for meeting their specific
financial requirements (need based
financial services). It includes the entire
range of financial services such as savings,
credit, remittances, payments and
insurance. Usage perception is measured by
using eight items in a five point scale.
Figure III.1 Operationalisation of Independent Variables

Chapter III Research Methodology
Effectiveness of Financial Inclusion Programme in Kerala 52
III.6. 5 Financial Literacy
Theoretical Definitions-
1. Knowledge about personal finance management practices (JJFLCC Trust. 2010)
2. “The ability to make informed decisions and take appropriate actions on matters
affecting one’s financial wealth and well-being” (Piprek et al. 2004)
3. “Understanding how to manage money effectively and having the knowledge
and skills to make informed decisions regarding financial matters” (Turnham,
2010)
4. “A combination of awareness, knowledge, skill, attitude and behaviour
necessary to make sound financial decisions and ultimately achieve individual
financial wellbeing”(Atkinson and Messy, 2012)
Operational Definition-
Ability of a person to deal with personal finance matters in a cost effective and timely
manner.
It is measured by using eight items in a five point scale
III.6. 6 Additional Income Generation
Theoretical Definition
Additional income earned from a specific programme as a beneficiary.
Operational Definition
Generating income through small loans or through savings activity of the financial
inclusion programme.
Income generation is measured by using seven items in a five point scale.
III.6. 7 Employment Generation
Theoretical Definition
Generation of additional employment through a scheme other than usual working days.

Chapter III Research Methodology
Effectiveness of Financial Inclusion Programme in Kerala 53
Operational Definition
Employment generated through the financial inclusion programme in addition to the
usual days of employment.
It is measured by using four items in a five point scale
III.6.8 Asset Creation
Theoretical Definition
Asset acquired by the beneficiaries as a result of the programme
Operational Definition
Any personal asset whether it is long-term, medium-term, or long-term purchased by
utilizing the money from the account opened as part of financial inclusion.
It is measured by using six items in a five point scale.
III.7 Basic Research Design
The present research has employed both descriptive and explanatory methodologies in
the study. The study tries to describe the current phenomenon of financial inclusion
programme from the demand side as well as supply side.
Descriptive research was used in the study to make descriptions of the phenomena and
characteristics associated with the sample. The study, using a sample survey method,
tried to understand the customers’ perceived likelihood of considering accessibility, and
usage of formal financial services as part of the financial inclusion programme among
different demographic groups. The study also identified the characteristics of supply
side of financial inclusion with respect to these variables. Explanatory research aims to
provide a causal explanation of the phenomena. The dominant methodology used in the
study was explanatory as the study examined the relationship between independent
variables (perception on accessibility, and usage) and various dimensions of dependent
variable (asset creation, income generation and employment generation) among
beneficiaries of FIP. Hence, from the perspective of purpose of study, the study was
descriptive as well as explanatory. The combination of the two allowed not only to
describe the phenomena but also to explain the factors that influenced and interacted
with it. The research strategy followed was field study as no variables were manipulated
and the study was carried out in non-contrived settings. From the perspective of time

Chapter III Research Methodology
Effectiveness of Financial Inclusion Programme in Kerala 54
horizon, this study required only one contact with the study population when all the
requisite data could be collected. Therefore, a cross sectional survey was designed for
the study.
III.8 Tools of Data collection
III.8.1 Interview Schedule Preparation
A structured interview schedule was used to collect responses from the beneficiaries of
financial inclusion programme. The interview schedule was structured and formatted
keeping in mind Dillman’s (2000) principles of designing interview schedule. The
Schedule used in the study is attached in Appendix 1. Closed ended questions were used
in the Schedule. With respect to questions and wordings, all the questions were designed
to be short, simple and comprehensible, avoiding ambiguous, vague, leading, double
barrelled and presumptuous questions. Negative worded questions were avoided to
prevent confusion to respondents in answering the questions. Schedule has divided into
four parts: First part contains demographic variables, and socio-economic variables.
Second part includes questions regarding extent of accessibility, and usage (independent
variables). Third part is related with financial literacy (moderating variable) and the
fourth part is related with effectiveness of financial inclusion programme. The drafted
interview schedule were tested as explained below
III.9 Validity Analysis:
Different validity terms are used to illustrate the various aspects of validity. The initial
validity tests namely content validity and face validity were performed for the draft
interview schedule as explained below.
III.9.1 Content Validity
In the case of content validity, the evidence is rational, rather than statistical. Content
validity can be achieved if the items representing the different constructs of the tool are
supported by a detailed review of the pertinent literature. The instrument had been
developed on the basis of a detailed review and analysis of the pragmatic literature, so
as to ensure the content validity.

Chapter III Research Methodology
Effectiveness of Financial Inclusion Programme in Kerala 55
III.9. 2 Face Validity
A measure is considered to have ‘face validity’ if the items are logically related to the
purported purpose of the measure. Generally, ‘face validity’ is ensured if the items are
reasonably related to the perceived purpose of the measure (Kaplan and Scauzzo, 1993).
The draft pool of attribute items were given to senior professionals from the field of
academic and banking sector. They were briefed about the idea and the purpose of
pooling indicative items. The experts were requested to scrutinize the questionnaire
items and give their impressions regarding the relevance of contents of these indicative
items. Based on the feedback from experts, the draft questionnaire items were modified.
This resulted in a new fine-tuned interview schedule.
III. 9 3 Discriminant validity
This validity shows that a test of a construct is not highly correlated with other tests
designed to measure theoretically different constructs. Campbell and Fiske (1959)
introduced the concept of Discriminant validity within their discussion on evaluating
test validity.
For establishing the Discriminant validity of scales used in a model, checking is done to
find out whether the square root of AVE of a construct is greater than the inter-construct
correlation between the construct concerned and other constructs present in the model
(Fornell & Larcker, 1981). Discriminant validity can also be checked at the indicator
level.
Here, absence of cross loadings of indicators shows Discriminant validity, i.e.,
indicators should indeed load on their respective latent constructs only. Discriminant
validity of the measurement model is evaluated at both construct-level and indicator-
level. Discriminant validity is presented first in Table III.1

Chapter III Research Methodology
Effectiveness of Financial Inclusion Programme in Kerala 56
Table III.1: Discriminant Validity
access usage Fn.ltrc ast incm emp
access 0.918 0.449 0.008 0.409 0.349 0.34
usage 0.449 0.914 -0.037 0.767 0.722 0.691
Fn.ltrc 0.008 -0.037 0.897 -0.051 0.063 -0.072
ast 0.409 0.767 -0.051 0.936 0.593 0.585
incm 0.349 0.722 0.063 0.593 0.93 0.486
emp 0.34 0.691 -0.072 0.585 0.486 0.943
Source: Primary Data
The table depicts Discriminant validity analysis at the construct level for the first stage
model. Square root of AVE values of each construct is compared with inter-construct
correlations of all constructs. The diagonal entries in the above table are the square root
of AVE values of the constructs. These are greater than any inter-construct correlations
as shown. Therefore, it is concluded that the measurement model at the first order level
possesses Discriminant validity.
Discriminant validity of a model can be assumed if all indicators in a measurement
model load heavily on their respective latent factor without any substantial loading on
any other factor (Chin, 1998). Table III.2 gives the cross loadings of the latent variables
in the 1st stage measurement model. All indicators show loadings higher than 0.6 on
their respective latent constructs.
Table III.2 Cross Loadings of Latent Variables
access usage Fn.ltrc ast incm emp
FAC1 0.915 -0.108 0.004 -0.059 0.056 0.011
FAC2 0.941 0.042 0.036 0.005 -0.02 -0.082
FAC3 0.912 0.045 0.005 -0.035 0.003 -0.016
FAC4 0.929 0.059 -0.028 0.015 0.001 -0.038
FAC5 0.915 0.07 0.009 0.009 -0.024 0.034
FAC6 0.911 -0.029 -0.003 0.057 -0.011 0.013
FAC7 0.934 -0.007 0.009 -0.004 0.018 0.024
FAC8 0.884 -0.076 -0.034 0.013 -0.025 0.058
FUS1 -0.032 0.903 0.006 -0.072 -0.046 -0.064
FUS2 0.01 0.919 -0.013 -0.1 -0.067 -0.047

Chapter III Research Methodology
Effectiveness of Financial Inclusion Programme in Kerala 57
FUS4 0.019 0.926 0.023 0.101 0.028 0.052
FUS5 -0.007 0.898 -0.005 -0.083 0.03 -0.068
FUS6 0.005 0.918 -0.021 -0.09 -0.079 -0.081
FUS7 0.011 0.916 -0.014 0.032 0.043 0.085
FUS8 0.013 0.931 0.031 0.127 0.008 0.041
FUS11 -0.021 0.9 -0.009 0.081 0.085 0.081
FL1 -0.007 0.019 0.924 0.001 -0.032 -0.031
FL4 0.025 0.059 0.915 0.002 -0.048 -0.01
FL6 0 -0.064 0.904 -0.009 0.033 -0.019
FL7 -0.025 0.124 0.878 -0.135 -0.002 0.011
FL8 -0.014 -0.106 0.871 0.036 0.116 -0.008
FL9 0.001 -0.18 0.872 0.063 0.016 0.094
FL10 0.003 0.051 0.892 0.067 -0.084 0.015
FL11 0.016 0.089 0.917 -0.024 0.006 -0.046
IMPCT1 0 -0.084 0.002 0.938 0.028 0.011
IMPCT2 -0.029 0.037 0.01 0.946 0.005 -0.057
IMPCT3 -0.017 -0.032 -0.017 0.94 0.029 0
IMPCT4 0.006 0.01 -0.031 0.922 -0.024 0.055
IMPCT5 0.046 0.037 -0.014 0.93 0.002 -0.011
IMPCT6 -0.006 0.032 0.049 0.938 -0.04 0.004
IMPCT7 -0.059 0.21 0.024 -0.107 0.877 -0.089
IMPCT8 0.034 0.248 0.016 -0.101 0.914 -0.118
IMPCT9 -0.037 -0.008 -0.011 0.047 0.945 0.022
IMPCT10 0.011 -0.059 -0.008 0.046 0.95 0.003
IMPCT11 0.054 -0.166 0.03 0.047 0.932 0.05
IMPCT12 -0.021 -0.074 -0.029 0.041 0.944 0.034
IMPCT13 0.016 -0.13 -0.018 0.017 0.945 0.09
IMPCT14 0.014 0.082 0.003 -0.007 -0.027 0.934
IMPCT15 0.005 -0.099 -0.014 0.044 0.016 0.943
IMPCT16 0.004 0.009 -0.005 -0.042 -0.022 0.944
IMPCT17 -0.023 0.008 0.016 0.004 0.032 0.949
Source: Primary Data

Chapter III Research Methodology
Effectiveness of Financial Inclusion Programme in Kerala 58
III. 9. 4. Convergent Validity
There are a few measures that are useful for establishing validity and reliability such as
Composite Reliability (CR) and Average Variance Extracted (AVE) as given by Hair et
al. (2010). The thresholds for these values are:
1. Composite Reliability (CR) value > 0.7
2. Average Variance Extracted (AVE) > 0.5
Convergent Validity can be ensured If CR > AVE, provided AVE > 0.5.
Table 3.2 provides the details of validity measures of the constructs. It was found that
all the values of AVE are above 0.5 and the composite reliability values are greater than
0.7
Convergent validity is also assured as the result shows CR>AVE.

Chapter III Research Methodology
Effectiveness of Financial Inclusion Programme in Kerala 59
Table III.3: Reliability & Convergent Validity of Constructs
Sl
No.
Variable Name CR AVE Convergent
validity(CR-AVE)
+ve
1 Accessibility 0.977 0.918 0.059
3 Usage 0.976 0.914 .062
4 Financial Literacy 0.971 0.897 .074
5 Effectiveness of financial
inclusion
a) Asset creation
b) Income generation
c) Employment
generation.
0.977
0.978
0.970
0.936
0.930
0.943
.041
.048
.027
Source: Primary Data
III. 10 Reliability Analysis
High degrees of instrument reliability point out that instrument’s score is stable and
consistent (Creswell, 2005). High degrees of instrument reliability suggest the
occurrence of similar results under rater situations that are comparable, related, or nearly
identical (Neuman, 2006). Reliability measures the degree a test produces identical
results given similar test conditions (Obayashi, Bianchi & Song, 2003). Out of the
several methods to establish the reliability of a measuring instrument, the internal
consistency method is supposed to be the most effective one. In this method, reliability
is defined as internal consistency, which is the extent of inter – correlation among the
items that constitute a scale (Nunnally, 1978). A reliability coefficient called Cronbach’s
alpha is used to calculate internal consistency (Cronbach, 1951). It depicts the extent to
which a tool gives consistent results (Cooper & Schindler, 2003). Posner (1980) reported
that Cronbach’s alpha above .60 represent satisfactory reliability levels.

Chapter III Research Methodology
Effectiveness of Financial Inclusion Programme in Kerala 60
Table III.4. Reliability Analysis of Different Variables of the Study
Sl.
No
Factors No. of
Items
Cronbach’s
alpha
1 Accessibility 8 0.973
3 Usage 8 0.971
4 Financial literacy 8 0.965
5 Effectiveness of financial inclusion
programme
17
1. Asset creation
2. Income generation
3. Employment generation
6
7
4
0.972
0.974
0.958
In the current study, the reliability was tested by computing Cronbach’s alpha for all the
factors as well as for the entire set. The values of Cronbach’s alpha for various factors
are given in the Table III.4. As seen from the table, all the factors had the Cronbach’s
alpha value above .70, which testified the reliability of the entire set.
III. 11. Scope of the Study
The scope of the study defines the boundaries of the research. The four elements
characterizing the scope of the study are defined as below:
Population
Hundred and twenty villages were identified by the State Level Bankers Committee,
Kerala for performing financial inclusion programmes in Kerala. (These villages are
called road-map villages). Therefore, road-map villages are the population for the study.
Detailed list is shown as appendix-1I.

Research Methodology
Effectiveness of Financial Inclusion Programme in Kerala 61
Chapter III
Place of Study
Kerala (Palakkad, Kannur and Idukki)
Period of the study
The research interest was to analyze the present scenario regarding the objectives. The
period of data collection was from September 2015 to February 2016.
Data Sources
Major source of data was primary data collected from those who have opened account
as part of Financial Inclusion Programme.
For review of literature, secondary data related to the variables of study (Accessibility,
availability, usage, financial literacy, asset creation, income generation and employment
opportunity) from social science research networks, various international and national
journal articles, SLBC Websites, RBI websites, and CFI website were considered.
Books from CDS Trivandrum Library, School of Management Studies library and
Department of applied economics library of CUSAT were also consulted.
III. 12 Data Collection
a. Kannur, Palakkad and Idukki districts were taken as representative on the basis
of performance of financial inclusion programme in Kerala.
b. Bank managers of the SLBC, Lead Bank were contacted with a request to take
part in the study.
c. Data collection was coordinated by the researcher with the help of internal
coordinators identified in each team.
III. 13 Selection of Unit of Observation
Individual beneficiaries of Financial Inclusion programme, that means those who are
opened account in the formal financial sector as parts of financial inclusion programme
were the unit of observation. Beneficiaries were selected through following sequences:
Step 1. Selected six villages (five percent of total villages) from the list of
hundred and twenty road map villages from three districts – Palakkad, Kannur
and Idukki- based on the performance of financial inclusion programme.

Chapter III Research Methodology
Effectiveness of Financial Inclusion Programme in Kerala 62
Palakkad from higher performer districts, Kannur from medium performer group
and the lower performer group of districts, Idukki district were selected.
Palakkad District was selected from the higher performing districts (Ernakulum,
Thiruvananthapuram, Thrissur, Palakkad) Kannur District was selected from
medium performing districts (Malappuram, Kannur, Kottayam, Alappuzha,
Kozhikode, Kollam) group and from the lower performing districts (Wayanad,
Idukki, Pathanamthitta, Kasaragod) Idukki District was selected. Selection of
two villages each from these three selected Districts was done to get actual
representation of the entire population of Kerala
Step.2. 50 members from each selected villages were selected based on the
assumption that more than thirty can be considered as large sample as per the
assumption of Statistics, which constituted three hundred samples for the study.
Step. 3. List of beneficiaries were collected from the corresponding Banks
(respective Banks allocated by the SLBC, Kerala) for the final selection of
respondents.
Step 4. From the source list available, respondents were selected randomly.
Snap short of Sample selection- a pictorial representation
Figure: III.2. Pictorial Representation of Sample
Selection

Chapter III Research Methodology
Effectiveness of Financial Inclusion Programme in Kerala 63
III. 14. Sampling Method
Beneficiaries were located all over Kerala. Therefore Multi-stage random sampling
method was applied. However, the study was designed to find out the effectiveness of
financial inclusion programme in Kerala. Multi-stage random sampling method was
used to include all types and category of beneficiaries. Using the services of concerned
Bank managers, addresses of beneficiaries were collected and responses were made
based on the information given by the respondents.
III. 15 Sample Size
Three hundred sample respondents were selected i.e., hundred beneficiaries from each
selected sample districts.
III. 16 Statistical Analysis and Validation
The statistical package SPSS was used for data editing, coding and basic analysis. MS
Excel was used for calculating Financial Inclusion Index (FII) .FII was used for
analysing the extent of accessibility, availability and usage. This index was first
developed by Sharma and Paise in 2008 based on the dimension index of UNDP. It is
constructed as a multidimensional index that captures information on various aspects of
financial inclusion, such as banking penetration, availability of banking services, and
usage of the banking system. The index of financial inclusion incorporates information
in these dimensions in one single number lying between zero and one. Zero denotes
complete financial exclusion and one indicates complete financial inclusion in an
economy. A dimension index for each of these dimensions has been fixed first computed
by using the dimension equation developed by UNDP. After calculating the value of
each individual dimensions, apply the formula of finding FII. Then we will get the index
of each district. (Kodan and Chhikara, 2013). MS Excel was used for doing the analysis
based on FII.
The fifth chapter discusses in detail the analysis of data using FII
The integrative model was tested for studying effectiveness of financial inclusion
programme from the demand side perspective using Structural Equation Modeling with
WARP PLS 5.0 for the analysis of the data and validation of various models. In this
study, PLS-SEM is adopted because the investigated phenomenon is comparatively new

Chapter III Research Methodology
Effectiveness of Financial Inclusion Programme in Kerala 64
and measurement models needed to be newly developed and also it is for prediction
purpose.
III. 16. 1. Data Analysis Strategy
The quality of the data collected from the sample was first ensured. Exploratory factor
analysis to define the underlying structure among variables was carried out and
structural equation modeling using Warp PLS was done to study the linkages among the
variables. These are explained in the sections below.
Secondary data were used for measuring the supply side FIP and the technique used
(FII) were based on the dimension index developed by the UNDP.
III. 16. 2. Data Cleaning
Before analysis was carried out, the quality of data collected was assessed so that results
become generalisable. The beneficiary responses were checked for missing values. To
ensure that only responses from ‘those who are opened account as part of the financial
inclusion programme were considered for analysis, the data entered on Excel was tested
to filter out beneficiaries who did not satisfy the filter question criterion. Outliers were
identified by testing on SPSS 20 and Warp PLS 5.0. The data were also standardized by
the software before analysis was carried out. FII were calculated with the latest available
data.
III. 16. 3 Exploratory Factor Analysis
To identify the factors that make up perceived accessibility, and perceived usage,
financial literacy perception and effectiveness of financial inclusion programme and to
reduce the indicators that form the dimensions, Exploratory Factor Analysis was carried
out in SPSS 20.0. Hair, Black, Babin and Anderson (2009) summarized several
statistical assumptions for factor analysis which include linearity, normality and
homoscedasticity (i.e. the assumption that dependent variable exhibits equal levels of
variance across the range of predictor variables). However, they argued that these
statistical assumptions do not have to be met if the data matrix has sufficient correlation
to produce representative factors and justify the application of factor analysis. To
determine the adequacy of correlations in the data set for factor analysis, the approaches
include: visual examination of the correlation matrix; inspection of the anti-image

Chapter III Research Methodology
Effectiveness of Financial Inclusion Programme in Kerala 65
correlation matrix, Barlett’s Test of Sphericity and Keyser Meyer Olkin Measure of
Sampling Adequacy.
For factor extraction when there are a large set of variables, it is recommended that
factor extraction be done by extracting combinations of variables that explain greatest
amount of variance (Hair et al., 2009). The selection of the method of factor rotation
(between common factor analysis and components analysis) is based on two criteria: (1)
the objectives of the factor analysis and (2) the amount of prior knowledge about the
variance in the variables (Hair et al., 2009). The Component Factor Analysis method,
also known as Principal Components Analysis, was used in the study as it is most
appropriate when the primary concern is data reduction focusing on the minimum
number of factors needed to account for the maximum portion of the total variance
(common, specific and error variances) represented in the original set of variables. To
decide on the number of factors to extract, the latent root criterion technique was used.
The rationale for the latent root criterion is that any individual factor should account for
the variance of at least a single variable if it is to be retained for interpretation (Hair et.
al., 2009). With component analysis only the factors having latent roots or eigen values
greater than 1 are considered significant and using the eigen value for establishing a cut
off is most reliable when the number of variables is between 20 and 50. The scree test
was also used to identify the number of factors that can be extracted before the amount
of unique or specific variance begins to dominate the common variance structure.
Computation of a factor matrix can be rotated orthogonally or obliquely; orthogonal
being the simplest case of rotation in which the axes are maintained at 90 degrees. The
varimax procedure in orthogonal approach maximises the sum of variances of required
loadings of the factor matrix and gives a clearer separation of the factors (Hair et al.,
2009). The varimax rotation was used in this study. In the interpretation of factors, factor
loadings greater than 0.5 were considered as factor loadings 0.5 or greater are considered
practically significant (Hair et al., 2009).
121
III. 16.4 Structural Equation Modeling
Structural equation Modeling (SEM) is a confirmatory technique used to determine
whether the model developed for the research is valid for data and is a combination of

Chapter III Research Methodology
Effectiveness of Financial Inclusion Programme in Kerala 66
confirmatory factor analysis and path analysis. Since the study required the
hypothesized model to be tested for the best-fit of the data, structural equation modeling
was considered the appropriate analysis method.
Structural Equation Modeling includes a number of statistical methodologies meant to
estimate a network of causal relationships, defined according to a theoretical model,
linking two or more latent complex concepts, each measured through a number of
observable indicators. The term structural equation model refers to both the structural
and measurement model together.
In a structural equation modeling (SEM) analysis, the inner model (structural model) is
the part of the model that describes the relationships between the latent variables
considered in the model. The outer model (measurement model) is the part of the model
that describes the relationships between the latent variables and their indicators.
Therefore the path coefficients are inner model parameter estimates whereas weights
and loading are measurement model parameter estimates depending on whether the
measurement model is formative or reflective. Warp PLS 5.0 estimates enable
evaluation of measurement model as well as structural model simultaneously.
All hypotheses were tested using structural equation modelling in Warp PLS 5.0. The
model fit with the data was assessed. The path coefficients and associated p values were
obtained.
III. 16.5. Partial Least Squares Approach
For the analysis of the research model, a variance based approach or Partial Least
Squares (PLS) approach was adopted in this study. Unlike covariance based approach,
the PLS approach, introduced by H. Wold in 1975, focuses on maximizing the variance
of the dependent variables explained by the independent ones instead of reproducing the
empirical covariance matrix (Haenlein & Kaplan, 2004). It is an iterative algorithm that
separately solves out the blocks of the measurement model and then, in a second step,
estimates the path coefficients in the structural model. Therefore, PLS-based Structural
Equation Modeling is claimed to explain at best the residual variance of the latent
variables and, potentially, also of the manifest variables (indicators) in any regression
run in the model (Fornell & Bookstein, 1982).

Chapter III Research Methodology
Effectiveness of Financial Inclusion Programme in Kerala 67
The relationships among variables associated with natural and behavioural phenomena
are usually nonlinear, with U-curve and S-curve relationships being particularly
common (Kock, 2012). Warp PLS 1.0 introduced in 2009 is a powerful Partial Least
Squares (PLS) based SEM software that identifies nonlinear or “warped” relationships
among the latent variables (hence the name of the software) and estimates the path
coefficients accordingly. The Warp PLS 5.0 software released in 2015 was used in the
study. The Warp5 PLS regression algorithm tries to identify a relationship between
latent variables defined by a function whose first derivative is a U-curve and, if that
relationship exists, the algorithm transforms (or “warps”) the scores of the predictor
latent variables so as to better reflect the U-curve relationship in the estimated path
coefficients in the model. The warping takes place during the estimation of path
coefficients, and after the estimation of all weights and loadings in the model. PLS-
based Structural Equation Modeling has several key advantages over covariance-based
Structural Equation Modeling. It has the advantage that it involves no assumptions about
the population or scale of measurement (Fornell & Bookstein, 1982) and therefore
works without assumptions about the distribution and with all types of measurement
scales. The presence of formative indicators in the model can lead to severe
identification problems in covariance based Structural Equation Modeling (MacCullum
& Brown, 1993). The PLS based approach can be used for models with either reflective,
formative or both types of indicators as it does not create such problems (Fornell &
Bookstein, 1982).
III. 17. Limitations of the Study
1. Effectiveness of financial inclusion programme from supply side is measured by
actual figures, but demand side is measured using perceived values. Therefore,
comparison of results was not possible.
2. Limitations of sampling study cannot be avoided in the present study also.
3. Longitudinal study could be better explained the phenomenon as growth comes
gradually.

Chapter III Research Methodology
Effectiveness of Financial Inclusion Programme in Kerala 68
III. 18. Chapter Summary
The chapter explained various aspects of research methodology used in the study, and
outlined the conceptual model prepared based on literature review. It also explained the
preparation of interview schedule, which was edited by experts to improve its content
and face validity. The chapter also outlined the principles underlying the design of the
study and the operational definitions of independent and dependent variables used. The
details regarding the measurement of validity of the constructs used, data sources,
sampling method used, and the statistical tools that are made use of are also brought out
in this chapter. Finally chapter gives the summary of a scientific research has done in
the field of social science.
The chapter also throws light on the format of the interview schedule, the steps and
methods employed for analysis of data and the statistical tools used have also been
discussed. Structural Equation Modeling has been considered the appropriate analysis
method for the study. Partial Least Squares based Structural Equation Modeling using
Warp PLS 5.0 has been used in the study.
Financial Inclusion Index was also used for analysing the extent of accessibility, and
extend of usage to get the result of holistic approach of FIP. This index was first
developed by Sharma and Paise in 2008 based on the dimension index of UNDP. And
it is now a widely accepted tool for measuring financial inclusion used by World Bank,
Reserve Bank and other monitory policy holders all over the world.
The next two chapters discusses in detail the analysis of data.


Chapter IV Precision and Validation of Measurement Models
Effectiveness of Financial Inclusion Programme in Kerala 69
Chapter IV
Precision and Validation of
Measurement Models
This chapter explains the development and validation of measurement models
which explains the relationship of dependent variable and independent
variable and the effect of moderation of financial literacy, between usage and
effectiveness are tested and reported.
IV.1 Introduction
Scales for measuring Independent variables used in the study from the demand side were
not developed in the literature precisely. Therefore, scales for measuring ‘perceived
accessibility’, and ‘perceived usage’ were developed by the using the items developed
through literature survey. Besides, suitable measurement scale items under each of the
sub dimension was recognized by using Exploratory Factor Analysis (EFA) and
validated through Confirmatory Factor Analysis (CFA) method. Two different
approaches, i.e. use of same sample set and two different sample sets, are seen in
confirming the factors explored using EFA method. Jan-Willem and Willem A. (2001)
used single sample for confirming measurement model for EFA, and CFA. Bollen
(1989); Conway & Huffcutt (2003) used two different sets of samples for conducting
EFA and CFA. In this study EFA and CFA were conducted using same sample sets and
got valid results. The details of measurement scale items developed and its validation
with the support of model fit indices are given later in this chapter.
IV. 2 Items Generation
Items used for measuring perceived accessibility, and perceived usage were taken from
the study conducted by the Centre for Financial Inclusion. (Latortue et.al, 2013).
Although they have successfully generated items for accessibility and usage failed to
link with effectiveness of financial inclusion programme. Considering this limitation,

Chapter IV Precision and Validation of Measurement Models
Effectiveness of Financial Inclusion Programme in Kerala 70
and importance of such study scales for measuring independent variables were
developed through the below described steps.
The respondent had to indicate each item on a five point Likert scale (1 – strongly
disagree; 2 - disagree; 3 - neither agree nor disagree; 4 - agree and 5 – strongly agree).
IV. 3 Initial Validity Tests
As referred in chapter III, any research instrument should be tested for validity, so that
it could be used for correct measurement and meaningful analysis. The initial validity
tests, namely content validity and face validity were performed for the pooled item
questions as explained below.
IV. 3.1. Content Validity
In the case of content validity, the evidence is subjective and logical, rather than
statistical. As indicated earlier, content validity can be ensured if the items representing
the various constructs of an instrument are substantiated by a comprehensive review of
the relevant literature.
IV. 3.2. Face Validity
The drafted interview schedule was given to five experts from banking industry (SLBC
convenor Trivandrum, Lead Bank manger Kannur, Canara Bank manager-Mattanur
Branch, SBT manger-Palakkad branch and Network administrator- Canara Bank Calicut
circle), and academic experts from CDS Trivandrum, Central University Kasaragode,
School of Management Studies CUSAT, Department of Applied Economics CUSAT,
Centre for the Study of Social Exclusion and Inclusive Policy (CSSEIP), Rajagiri
College of Social Sciences Cochin, and Department of Applied Economics- Kannur
university. They were briefed about the purpose of the study and its scope. The experts
were requested to scrutinize the interview schedule and to give their impressions
regarding the relevance of the contents of the interview schedule. They were requested
to critically assess the interview schedule and give unbiased feedback and suggestions
with regard to the comprehensiveness/coverage, redundancy level, consistency and
number of items in each variable. They had to suggest necessary changes by simplifying,
re-wording, removing, replacing and supplementing the items. Based on the feedback

Chapter IV Precision and Validation of Measurement Models
Effectiveness of Financial Inclusion Programme in Kerala 71
from experts, the researcher modified the draft interview schedule. This resulted in a
new interview schedule.
IV. 3.3. Discriminant Validity
The Discriminant validity was ensured for each constructs (already explained in
session III.9.3 of Chapter III.
IV.4 Exploratory Factor Analysis: Development of independent variables for
measuring effectiveness of financial inclusion programme. (Demand side
perspectives)
Since little is known with regard to the factors that influence beneficiaries’ Perceptions
and responses to financial inclusion programme (FIP) from the demand side perspective,
the researcher explored the important dimensions of FIP performance after reviewing
the available literature and discussions with senior bank officials in the concerned field
(SLBC, Lead Bank of Kannur district, and regional centre of Canara Bank). For
conducting Exploratory Factor Analysis (EFA), 140 responses were used initially as part
of pre-testing. Final responses were 300 beneficiaries. Statistical Package for Social
Science (SPSS) was used to conduct factor analysis. Principal axis factoring method
with oblique rotation technique vide direct-oblique rotation was used for exploring
factor components since correlations among the items were presumed in this study
(Conway & Huffcutt (2003). To arrive at a range of effectiveness of FIP (demand side)
performance indicators, experts’ opinion were gathered and also based on the various
attributes acknowledged in the literature, thirty items were concurrently congregated.
The attribute items of FIP which were rated by the respondents in 5 point Likert scale
are given below.
Extend of Accessibility
I have access to Services that address my daily needs (Access to affordable and flexible
livelihood financing)
I have access to financial services that help me to invest in economic opportunities
I have access to services that address my long-term needs.
I have Access to sound and pragmatic financial services

Chapter IV Precision and Validation of Measurement Models
Effectiveness of Financial Inclusion Programme in Kerala 72
I have Access to transparent advice on financial services
I have Access to risk mitigation services like health, weather, asset and life insurance
etc
I have Access to vulnerability reducing and economic capacity enhancing financial
service like warehouse Receipt financing, Value Chain financing etc
I find that I have access on the services which are convenient, affordable, and transparent
I have Access to other financial services like micro pensions.
Extend of Usage.
I have the ability to Use savings products in the bank that promotes thrift
Am able to use of transaction banking to manage remittances
I have the Ability to Use credit facilities to smoothen income variations
I can Use insurances services to guard against uncertainties
I find that the services I use are convenient, affordable, and transparent
Am able to Use post office savings service
I have the ability to Use ATM, Kisan Credit Cards, General credit cards, and other
micro credit facilities like SHG-Bank linkage, Agri-gold loan etc. for the financial
transactions
Am able to use mobile banking services for my personal banking transactions
I have the ability to Use banking services to receive govt. Benefits
IV. 4. 1 Test of Sampling Adequacy
Exploratory Factor Analysis (EFA) was conducted using 140 responses using structured
interview schedule. To check the adequacy of the sample used for factor analysis,
Kaiser- Meyer- Oklin (KMO) and Bartlett’s test was used, the results of which indicate
significant values. KMO value 0.870 (Table IV.1) - higher than the threshold value of
0.6, and the correlation matrix diagonal values in anti-image matrices values (above 0.5)

Chapter IV Precision and Validation of Measurement Models
Effectiveness of Financial Inclusion Programme in Kerala 73
also indicated good Measure of Sampling Adequacy (MSA). The correlation index
among factors was also at moderate level and did not exceed the cut-off point of 0.85
(Kline, 2005).
Table IV.1 Test of sampling adequacy- KMO and Bartlett's Test
Kaiser-Meyer-Olkin Measure of Sampling Adequacy. .870
Bartlett's Test of Sphericity Approx. Chi-Square 3927.283
Degree of freedom 253
Significance 0.000
Source: Primary data
IV.4.2 Total Variance Explained and Number of Factors Extracted
Three principal factors were extracted which explained about 74 percent of the variation
after extraction sums of squared loadings based on Eigen values above one. Since the
method used for the analysis was principal axis factoring, Pattern matrix values were
taken for rotated component selection. See Table IV.2 for details.
Table IV.2 Rotated Components with Three Principal Factors after EFA
Pattern matrix
I have access to Services that address my daily needs
(Access to affordable and flexible livelihood financing)
I
.847
II
I have access to financial services that help me to invest in
economic opportunities .911
I have access to services that address my long-term needs. .812
I have Access to sound and pragmatic financial services .876
I have Access to transparent advice on financial services .833
I have Access to risk mitigation services like health,
weather, asset and life insurance etc .892

Chapter IV Precision and Validation of Measurement Models
Effectiveness of Financial Inclusion Programme in Kerala 74
I have Access to vulnerability reducing and economic
capacity enhancing financial service like warehouse
Receipt financing, Value Chain financing etc
.897
I have Access to other financial services like micro
pensions
.855
I have the ability to Use savings products in the bank that
promotes thrift .879
Am able to use of transaction banking to manage
remittances .879
Ability to Use credit facilities to smoothen income
variations .884
Usages of insurances services to guard against
uncertainties .805
I find that the services I use are convenient, affordable, and
transparent .889
Am able to use post office savings service .881
I have the ability to Use ATM, Kisan Credit Cards,
General Credit Cards, and other micro credit facilities
like SHG-Bank linkage, Agri-gold loan etc. for the
financial transactions .771
Usage of mobile and other modes for banking services
to receive government benefits .815
Rotation converged in 5 iterations
IV. 4.3 Interpretation of Factors Extracted
As it was evident from Table IV.2, two principal factor dimensions were extracted. It is
very clear from the factor loadings that (table IV.2) beneficiaries have made clear
demarcation on attribute items and factor I can be logically interpreted as those
underlying attributes which explain the dimension that was closely related to
accessibility, aspects during the course of FIP. Whereas, factor II attributes are directly
linked with the usage aspects of beneficiaries’. Reported output, after the items having

Chapter IV Precision and Validation of Measurement Models
Effectiveness of Financial Inclusion Programme in Kerala 75
Source: Field Survey
factor loading less than 0.50 shall be eliminated (Hair et al, 1996). The factor loadings
of item “I find that I have access on the services which are convenient, affordable, and
transparent” has got low loading (less than 0.5) may be attributed to the fact that it is
almost similar to the above statements. Under the Usage perception-i.e., in Factor II-
also one item deleted because of getting loading less than 0.5. “Am able to use mobile
banking services for my personal banking transactions”
IV.5 Confirmatory Factor Analysis for validation of the Independent Variables of
FIP-Measurement Model
According to Ahire, Golhar and Waller (1996) Confirmatory Factor Analysis (CFA)
provides enhanced control for assessing uni-dimensionality than Exploratory Factor
Analysis and is more in line with the overall process of construct validation. Uni-
dimensionality measures the extent to which all the items in a scale measure the same
construct (Venkatraman, 1989). The measurement model was validated by CFA method
using the same sample data used for EFA. CFA provide information on confirmation of
the measurement model with the dimensions explored by EFA method (Kazi, 2011).
This analysis provided clarity on indicator items which are reflected in a given set of
factor dimensions and its interrelationships are assessed with the goodness of fit indices.
Figure IV.1 explains the hypothesized model followed by summary of model fit indices.
It was found that the two explored underlying dimensions namely accessibility, and
usage attributes were statistically valid, and further there were no statistical evidences
to reject the model.
Figure IV. 1 Independent variable dimensions - measurement model

Chapter IV Precision and Validation of Measurement Models
Effectiveness of Financial Inclusion Programme in Kerala 76
IV.5.1
The fit indices of the SEM model validates the factors explored previously from a
sample of 140 beneficiaries as shown in table IV.3, there was no statistical evidences
to reject the model as per the accepted levels of model fit results (Kazi, 2011). To
assess the model fit with the data, it is recommended that the p-values for both the
Average Path Coefficient (APC) and the Average R-Squared (ARS) be both lower
than 0.05. It is also recommended that the Average Variance Inflation Factor (AVIF)
be lower than 5 (Kock, 2012). Below described figures (Table IV.3) provides the model
fit indices with p values of the estimated model. It was found that, all the three fit
criteria were met and hence it was assumed that the model had acceptable predictive
and explanatory quality as the data is well represented by the model.
Table IV.3. Model Fit Summary of Independent Variables
Particulars Values Range
Average path coefficient (APC) 0.46 P<0.001
Average R-squared (ARS) 0.208 P<0.001
Average adjusted R-squared (AARS) 0.205 P<0.001
Q squared co-efficients 0.205
Average block VIF (AVIF) 1.207 acceptable if <= 5,
ideally <= 3.3
Average full collinearity VIF (AFVIF) 1.690 acceptable if <= 5,
ideally <= 3.3
Tenenhaus GoF (GoF) 0.630, small >= 0.1,
medium >= 0.25,
large >= 0.36
Sympson's paradox ratio (SPR) 1.000 acceptable if >=
0.7, ideally = 1
Source: Primary Data
The above fit indices show indicators best fit the model confirming the independent
variables of financial inclusion programme. P value is significant and all other indices
confirm the model fitness. The R squared coefficient reflects the percentage of explained
Statistical Inferences- Measurement Model

Chapter IV Precision and Validation of Measurement Models
Effectiveness of Financial Inclusion Programme in Kerala 77
variance associated with the latent variable. The R squared coefficient for usage is 0.208
meaning 21 percentage of the variance in Usage is explained by the dimensions in the
study. The Q squared coefficient, which is also known as Stone-Geisser Q squared
coefficient, reflects the predictive validity associated with the latent variable. It is
recommended that accepted predictive validity in connection with an endogenous
variable is suggested by a Q squared coefficient greater than zero (Kock, 2012). The Q
squared coefficient as seen in Figure IV.7 is 0.21 and hence predictive validity of the
model was also established.
IV.5.2 Test of Multi Co-linearity of Factor Dimensions
Cenfetelli and Bassellier (2009) and Petter, Straub and Rai (2007) recommend that the
Variance Inflation Factors (VIFs) of all latent variables be below the threshold 3.3 in
the context of PLS-based SEM in discussions of latent variable measurement (as
cited in Kock, 2012). VIF is a measure of the degree of vertical collinearity or
redundancy among the latent variables that are hypothesized to affect another latent
variable. In reflective latent variables indicators are expected to be redundant.
IV.5.3 Internal Consistency of the Items Extracted
Internal consistency of each factor item was checked using SPSS - reliability analysis
scale items. Cronbach alpha values obtained for Factor I and factor II were above the
threshold limit. As both the values are above the acceptable threshold value of 0.7
(Nunnally, 1978), internal consistency (reliability) of scale items are valid. Moreover,
the squared correlation values are also shown significant in the SEM model
which indicates scale item consistency.
Table No. IV.4 Reliability Analysis
Cronbach's alpha coefficients
Accessibility Usage
0.973 0.972
Source: Primary Data

Chapter IV Precision and Validation of Measurement Models
Effectiveness of Financial Inclusion Programme in Kerala 78
IV.6 Effectiveness of Financial Inclusion Programme- Development of
Measurement Dimensions
Focus in this section was to develop a comprehensive measure to find out the
effectiveness of financial inclusion programme. This variable was applied as
dependent variable in the conceptual model of this study. Items used for measuring
perceived effectiveness of financial inclusion programme (asset creation perception,
income generation perception, and perception on additional employment generation)
were taken from the study 'Analysis of the Role of Microfinance Banks in Financing
of Micro Enterprises in Kaduna State, Nigeria' (Mamman, 2013). Although they
have successfully generated items for asset creation perception, income
generation perception, and perception on employment generation failed to link
with effectiveness of financial inclusion programme. Considering this limitation,
and importance of such study scales for measuring dependent variables were
developed through the below described steps.
The respondent had to indicate each item on a five point Likert scale (1 –
strongly disagree; 2 - disagree; 3 - neither agree nor disagree; 4 - agree and 5 –
strongly agree).
The attribute items of effectiveness of FIP which were rated by the respondents in 5
point Likert scale are given below.
I obtained the initial capital through bank loan
I procure the raw materials used from the bank loan
I procure the machinery used from the bank loan
The credit scheme helps me for increasing my asset position
I procure some short-term assets needed by using the formal credits
I procure some medium-term or long-term assets through the loan amount
Bank loan is helpful for me to increasing my livelihood
Bank loan is helpful to fulfil my practical needs
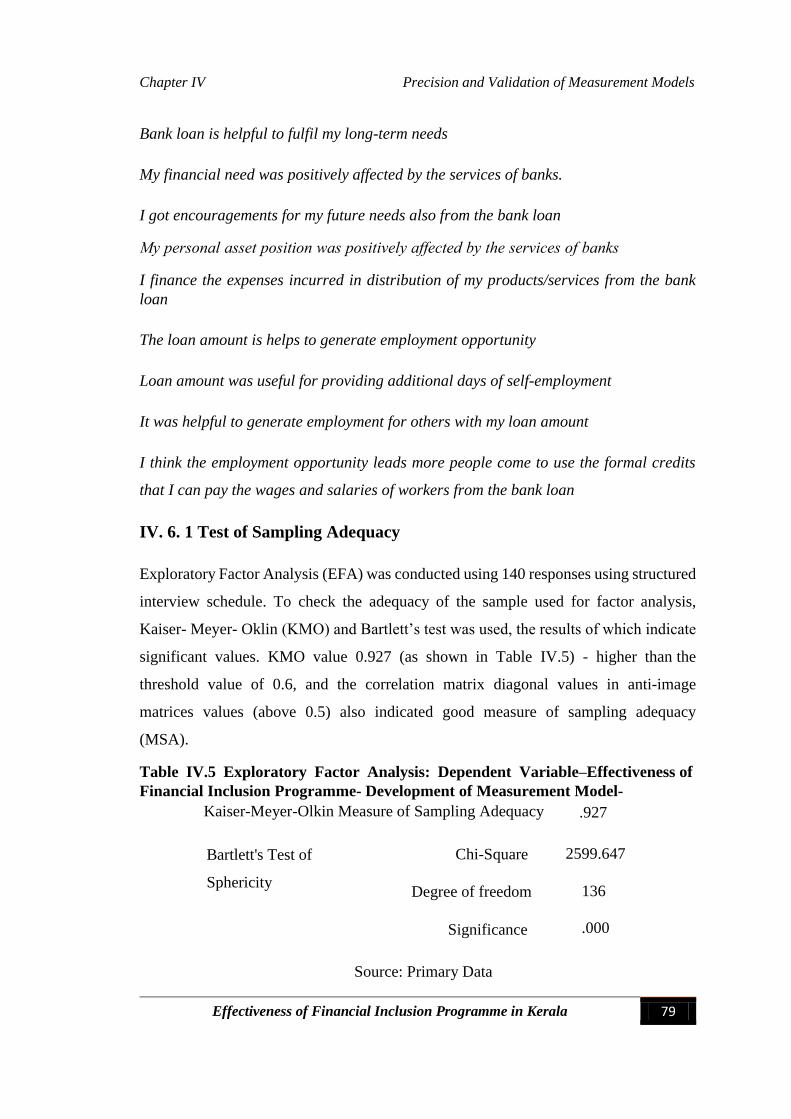
Chapter IV Precision and Validation of Measurement Models
Effectiveness of Financial Inclusion Programme in Kerala 79
Bank loan is helpful to fulfil my long-term needs
My financial need was positively affected by the services of banks.
I got encouragements for my future needs also from the bank loan
My personal asset position was positively affected by the services of banks
I finance the expenses incurred in distribution of my products/services from the bank
loan
The loan amount is helps to generate employment opportunity
Loan amount was useful for providing additional days of self-employment
It was helpful to generate employment for others with my loan amount
I think the employment opportunity leads more people come to use the formal credits
that I can pay the wages and salaries of workers from the bank loan
IV. 6. 1 Test of Sampling Adequacy
Exploratory Factor Analysis (EFA) was conducted using 140 responses using structured
interview schedule. To check the adequacy of the sample used for factor analysis,
Kaiser- Meyer- Oklin (KMO) and Bartlett’s test was used, the results of which indicate
significant values. KMO value 0.927 (as shown in Table IV.5) - higher than the
threshold value of 0.6, and the correlation matrix diagonal values in anti-image
matrices values (above 0.5) also indicated good measure of sampling adequacy
(MSA).
Table IV.5 Exploratory Factor Analysis: Dependent Variable–Effectiveness of
Financial Inclusion Programme- Development of Measurement Model-
Kaiser-Meyer-Olkin Measure of Sampling Adequacy .927
Bartlett's Test of
Sphericity
Chi-Square 2599.647
Degree of freedom 136
Significance .000
Source: Primary Data

Chapter IV Precision and Validation of Measurement Models
Effectiveness of Financial Inclusion Programme in Kerala 80
IV.6.2 Total Variance Explained and Number of Factors Extracted
Three principal factors were extracted which explained about 81 percent of the variation
after extraction sums of squared loadings based on Eigen values above one. Since the
method used for the analysis was principal axis factoring, Pattern matrix values were
taken for rotated component selection. See Table IV.6 for details.
Table IV.6 Rotated Components with Three Principal Factors after EFA
Pattern matrix
Factor
I II III
I obtained the initial capital through bank loan and
The credit scheme helps me for increasing my asset
position
I procure the raw materials used from the bank loan
I procure the machinery used from the bank loan
I procure some short-term assets needed by using
the formal credits
I procure some medium-term or long-term assets
through the loan amount
Bank loan is helpful for me to increasing my
livelihood
Bank loan is helpful to fulfil my practical needs
Bank loan is helpful to fulfil my long-term needs
My financial need was positively affected by the
services of banks
.815
.841
.823
.850
.866
.837
.719
.598
.654

Chapter IV Precision and Validation of Measurement Models
Effectiveness of Financial Inclusion Programme in Kerala 81
I got encouragements for my future needs also
from the bank loan
I finance other expenses incurred of my
products/services from a microfinance bank loan
My personal asset position was positively affected
by the services of banks
The loan amount is helps to generate
employment opportunity
Loan amount was useful for providing additional
days of self-employment
It was helpful to generate employment for
others with my loan amount
I think the employment opportunity leads more
people come to use the formal credits that I can
pay the wages and salaries of workers from the
bank loan
.850
.822
.829
.811
.761
.791
.854
.800
Source: Primary Data
IV. 6. 3. Interpretation of Factors Extracted
As it was evident from Table IV.6, three principal factor dimensions were extracted.
It is very clear from the factor loadings that (Table IV.6) beneficiaries have made
clear demarcation on attribute items and factor I can be logically interpreted as
those underlying attributes which explain the dimension that was closely related to
income generation aspects during the course of FIP. Whereas, factor II
represents those attributes which influence beneficiaries specifically by the Asset
creation feature related

Chapter IV Precision and Validation of Measurement Models
Effectiveness of Financial Inclusion Programme in Kerala 82
aspects. Moreover the factor III attributes are directly linked with the additional
employment generation aspects of beneficiaries.
IV.7 Confirmatory Factor Analysis for Validation of the Dependent Variable- of
Effectiveness of FIP-Measurement Model
Confirmatory Factor Analysis (CFA) provides enhanced control for assessing the
overall process of construct validation. The measurement model was validated by CFA
method using the same sample data used for EFA. This analysis provided clarity on
indicator items which are reflected in a given set of factor dimensions and its
interrelationships are assessed with the goodness of fit indices. Figure IV.2 explains the
hypothesized model followed by summary of model fit indices. It was found that the
three explored underlying dimensions namely asset creation, income generation and
employment opportunity attributes were statistically valid, and further there were no
statistical evidences to reject the model.
Figure IV.2 Dependent Variable Dimensions - Measurement Model
Source: Primary Data

Chapter IV Precision and Validation of Measurement Models
Effectiveness of Financial Inclusion Programme in Kerala 83
Table IV. 7 Model Fit Summary of Various Dimensions of
Dependent Variable
Particulars Values Range
Average path coefficient (APC) 0.739 P<0.001
Average R-squared (ARS) 0. 547 P<0.001
Average adjusted R-squared (AARS) 0.545 P<0.001
Q squared co-efficients – Asset creation
Income generation
Additional Employment
0.593
0.554
0.492
Average full collinearity VIF (AFVIF) 2.646 acceptable if <= 5,
ideally <= 3.3
Tenenhaus GoF (GoF) 0.688 small >= 0.1,
medium >= 0.25,
large >= 0.36
Sympson's paradox ratio (SPR) 1.000 acceptable if >=
0.7, ideally = 1
The above fit indices show indicators best fit the model confirming the various
dimensions of dependent variable used in the model. P value is significant and all other
indices confirm the model fitness. The R squared coefficient reflects the percentage of
explained variance associated with the latent variable. The R squared coefficient for the
dependent variable is 0.547 meaning 55 percentage of the variance in dependent variable
is explained by the dimensions in the study. The Q squared coefficient, which is also
known as Stone-Geisser Q squared coefficient, reflects the predictive validity associated
with the latent variable. It is recommended that accepted predictive validity in
connection with an endogenous variable is suggested by a Q squared coefficient greater
Source: Primary Data

Chapter IV Precision and Validation of Measurement Models
Effectiveness of Financial Inclusion Programme in Kerala 84
than zero (Kock, 2012). The Q squared coefficient as seen in table IV.7 is 0.593 for asset
creation aspect, 0.554 for additional income generation aspects and 0.492 for the
additional employment opportunity aspect and hence predictive validity of the model
was also established.
IV.7. 1 Test of Multi- Colinearity of Factor Dimensions
Recommend that the variance inflation factors (VIFs) of all latent variables in the model
were below the threshold 3.3 in the context of PLS-based SEM in discussions of latent
variable measurement (as cited in Kock, 2012). Therefore it is clear that the model is
free from multi- colinearity.
IV.7.2 Internal Consistency of the Items Extracted
Internal consistency of each factor item was checked using SPSS - reliability analysis
scale items. Cronbach alpha values obtained for Factor I, factor II and factor III were
above the threshold limit. As both the values are above the acceptable threshold value
of 0.7 (Nunnally, 1978), internal consistency (reliability) of scale items are valid.
Moreover, the squared correlation values are also shown significant in the SEM model
which indicates scale item consistency
Table IV.8 Reliability Analysis
Cronbach's alpha coefficients
Asset Usage Income Employment
0.972 0.972 0.974 0.958
Source: Primary Data
IV. 8 Exploratory Factor Analysis: Development of moderating variable- Financial
Literacy
In spite of variety of versions and perspectives of financial literacy in the literature, little
is known about the influences beneficiaries’ perceptions and responses with respect to
its attribute level performance. So an Exploratory Factor Analysis (EFA) was conducted
using data from 140 respondents. Statistical Package for Social Science (SPSS) was
used to conduct factor analysis. As done in the previous measurement model, Principal

Chapter IV Precision and Validation of Measurement Models
Effectiveness of Financial Inclusion Programme in Kerala 85
Axis Factoring (PAF) method with oblique rotation technique vide direct-oblique
rotation was used for exploring factor components since correlations among the items
were presumed in the study. To arrive at a range of degree of financial literacy
performance indicators through literature review eleven items were concurrently
identified (Rao et.al., 2010) (Detailed explanation can see in chapter II) based on the
various attributes acknowledged.
The respondent had to indicate the attribute-degree of financial literacy of each item on
a five point Likert scale (1 – strongly disagree; 2 - disagree; 3 - neither agree nor
disagree; 4 - agree and 5 – strongly agree). The attribute items which were rated by the
respondents in 5 point Likert scale are given below.
Degree of Awareness on Filling up of application
Degree of Awareness on Long-term benefits of savings
Degree of Awareness on Consequences of default
Degree of Awareness on Rate of interest on various deposits and loans
Degree of Awareness on Security required for loan required
Degree of Awareness on Repayment of loans
Degree of Awareness on Availability of market
Degree of Awareness on Online Banking
Degree of Awareness on Mobile banking
Degree of Awareness on Debit Card/Credit card
Degree of Awareness on Internet Banking
IV. 8.1 Test of sampling adequacy
To check the adequacy of the sample used for factor analysis, Kaiser- Meyer- Oklin
(KMO) and Bartlett’s Test is used, results of which indicate significant values. KMO
value 0.956 (see Table IV.9) - higher than the threshold.

Chapter IV Precision and Validation of Measurement Models
Effectiveness of Financial Inclusion Programme in Kerala 86
Table IV.9 KMO and Bartlett's Test
Kaiser-Meyer-Olkin Measure of Sampling Adequacy. .956
Bartlett's Test of Sphericity
Approx. Chi-Square 1082.87
Degree of freedom 28
Significance. .000
Source: Primary Data
Items under Financial literacy came under one variable itself. So there is no need of
table (rotated component matrix) showed as only one component was extracted.
IV.8.2 Total Variance Explained and Number of Factors Extracted
Only one factor was extracted which explained about 77 per cent of the variation after
extraction sums of squared loadings based on Eigen values above one. Since the method
used for the analysis was principal axis factoring, Pattern matrix values were taken for
rotated component selection.
Iv. 8.3 Interpretation of Factors Extracted
Only one factor was extracted. It is very clear from the factor loadings that beneficiaries
have made clear demarcation on attribute items and factor can be logically interpreted
as those underlying attributes which explain the dimension that was closely related to
degree of financial literacy aspect in the course of FIP. The output has been reported
after the items having factor loading less than 0.50 shall be eliminated (Hair et al, 1996).
The factor loadings of items like “Degree of Awareness on Online Banking, degree of
Awareness on Internet Banking and Degree of Awareness on Rate of interest on various
deposits and loans” has got low loading (less than 0.5). Therefore those three items
were eliminated in the final schedule. And the remaining eight items were finalised for
the refined interview schedule.
IV.9 Confirmatory Factor Analysis for validation of the Moderating variable-
Measurement model
As it is a moderating variable, we can confirm the fit indices by using a moderating link.
According to Ahire, Golhar and Waller (1996) Confirmatory Factor Analysis (CFA)
provides enhanced control for assessing uni-dimensionality than Exploratory Factor

Chapter IV Precision and Validation of Measurement Models
Effectiveness of Financial Inclusion Programme in Kerala 87
Analysis and is more in line with the overall process of construct validation. Uni-
dimensionality measures the extent to which all the items in a scale measure the same
construct (Venkatraman, 1989). The measurement model was validated by CFA method
using the same sample data used for EFA. This analysis provided clarity on indicator
items which are reflected in a given set of factor dimensions and its interrelationships
are assessed with the goodness of fit indices. Figure IV.3 explains the hypothesized
model followed by summary of model fit indices. It was found that only one item was
explored underlying dimension namely financial literacy attributes were statistically
valid, and further there were no statistical evidences to reject the model.
Figure IV. 3. Moderating Variable - Measurement Model
IV.9.1 Statistical Inferences – Measurement Model
Here the fit indices of the SEM model validates the factor explored previously from
sample beneficiaries as shown in table IV.3, there was no statistical evidences to reject
the model as per the accepted levels of model fit results (Kazi, 2011). To assess the
model fit with the data, it is recommended that the p-values for both the average path
coefficient (APC) and the average R-squared (ARS) be both lower than 0.05. It is also
recommended that the average variance inflation factor (AVIF) be lower than 5 (Kock,
2012). Below described figures (Table IV.3) provides the model fit indices with p values
of the estimated model. It was found that, all the three fit criteria were met and hence it
was assumed that the model had acceptable predictive and explanatory quality as the
data is well represented by the model.
Source: Primary Data

Chapter IV Precision and Validation of Measurement Models
Effectiveness of Financial Inclusion Programme in Kerala 88
Table IV.10. Model Fit Summary of Moderating Variable
Particulars Values Range
Average path coefficient (APC) 0.264 P<0.001
Average R-squared (ARS) 0.244 P<0.001
Average adjusted R-squared (AARS) 0.218 P<0.001
Q squared co-efficients 0.220
Average block VIF (AVIF) 1.224 acceptable if <= 5,
ideally <= 3.3
Average full collinearity VIF (AFVIF) 1.132 acceptable if <= 5,
ideally <= 3.3
Tenenhaus GoF (GoF) 0.421 small >= 0.1,
medium >= 0.25,
large >= 0.36
Sympson's paradox ratio (SPR) 1.000 acceptable if >=
0.7, ideally = 1
Source: Primary Data
The above fit indices show indicators best fit the model confirming the moderating
variable interacting between Accessibility perception and usage perception of financial
inclusion programme. P value (P<0.001) is significant and all other indices confirm the
model fitness. The R squared coefficient reflects the percentage of explained variance
associated with the latent variable. Even though there is little change in the R squared
value, the moderating path showed positively significant. The R squared coefficient for
usage is 0.244 in the presence of moderating variable and it was 0.20 in the absence of
moderating variable. It means that R square value increased because of the influence of
moderating variable. The Q squared coefficient, which is also known as Stone-Geisser
Q squared coefficient, reflects the predictive validity associated with the latent variable.
It is recommended that accepted predictive validity in connection with an endogenous

Chapter IV Precision and Validation of Measurement Models
Effectiveness of Financial Inclusion Programme in Kerala 89
variable is suggested by a Q squared coefficient greater than zero (Kock, 2012). The Q
squared coefficient as seen in Figure IV.7 is 0.220 and hence predictive validity of the
model was also established.
IV.9.2 Test of Multi Co-linearity of Factor Dimensions:
Cenfetelli and Bassellier (2009) and Petter, Straub and Rai (2007) recommend that the
variance inflation factors (VIFs) of all latent variables be below the threshold 3.3 in the
context of PLS-based SEM in discussions of latent variable measurement (as cited in
Kock, 2012). VIF is a measure of the degree of vertical collinearity or redundancy
among the latent variables that are hypothesized to affect another latent variable. In
reflective latent variables indicators are expected to be redundant. Here the AVIF is
1.132 (table No. IV. 10) means there is no issue of multi- colinearity in the model.
IV.9.3 Internal Consistency of the Items Extracted
Internal consistency of each factor item was checked using SPSS - reliability analysis
scale items. Cronbach alpha values obtained for was above the threshold limit. As both
the values are above the acceptable threshold value of 0.7 (Nunnally, 1978), internal
consistency (reliability) of scale items are valid. Moreover, the squared correlation
values are also shown significant in the SEM model which indicates scale item
consistency.
Table IV.11 Reliability Analysis
Cronbach's alpha coefficients
Financial literacy Access Usage
0.965 0.973 0.972
Source: Primary Data
IV.10 Chapter Summary
In this chapter the scales were validated by satisfying the reliability and validity criteria.
The check for multicollinearity among variables was done by Warp PLS 5.0 software.
No multicollinearity was found to exist. The path coefficients and p values of
relationships among variables were obtained. The independent variable dimensions of
financial inclusion programme, moderating variable and dependent variable dimensions

Chapter IV Precision and Validation of Measurement Models
Effectiveness of Financial Inclusion Programme in Kerala 90
were explored through factor analysis which were then confirmed and validated by
confirmatory factor analysis using structural equation modeling.
As found in the results of factor analysis, measurement items of two constructs are
showing acceptable level of factor loadings and communalities. Correlations between
items observed are also found within the acceptable limits. This shows the independency
of the items used in the scale, while maintaining its construct and convergent validity.
The sub dimensions extracted in the measurement models of each constructs were
validated and these respective scale items were used for further analysis described in the
next chapter.

Chapter V Supply Side Analysis of Data
Effectiveness of Financial Inclusion Programme in Kerala 91
Chapter V
Supply Side Analysis of Data
This chapter explains the supply side analysis of effectiveness of FIP in
Kerala by using Financial Inclusion Index. The Interpretations are
discussed in terms of the relationship with research objectives. The
independent variables of financial inclusion programme were used as the
different dimensions of FII.
V.1 Banks and FIPs in India
Banks in India stands a unique role in the development and control of fiscal sector in
India. They are the corner stone of growth. Banks are now concentrating poor and
weaker sections of the society as part of FIP. Banking to the poor is not poor banking.
It is considered as the duty of Banker to participate bottom line people also for the
continuous growth of nations especially in a developing country like India. Therefore,
Banks are ready to follow the policies and programmes come under FIP. Following are
the important activities that should be carried out by commercial Banks in India as part
of FIP.
V.1.1 Banking Policies and Practices in Relation with Financial Inclusion
Programme
As described in chapter one, the institutional structure follows for implementing
financial inclusion programme: instructions come from RBI to SLBC, SLBC to Lead
Banks and from lead banks to concerned Banks to the door step of the customers.
V.1. 2 Banks and FIPs in Kerala
Following are the comprehensive description of banking policies for the implementation
of financial inclusion policies and practices:
V.1.2.1. Providing Financial Literacy
Providing financial literacy is the core function of financial inclusion, as the main reason
for exclusion is the lack knowledge about formal financial system. Concerned

Chapter V Supply Side Analysis of Data
Effectiveness of Financial Inclusion Programme in Kerala 92
authorities (Lead Banks) allows duty for doing financial literacy and credit counselling
and responsible Banks are working for the purpose of providing credit counselling and
personal finance dealing techniques and leading the people to open a formal bank
account. There are hundred and fifty five Financial Literacy and Credit Counselling
centres (FLCC) all over Kerala (SLBC, Kerala, 2017).
The main functions to be performed by commercial banks in relation with financial
literacy are:
1. Disseminating information regarding financial services and general banking
concepts to various target groups, including school and college going children,
women in rural places and urban poor, senior citizens, etc.
2. Extending financial education which will include:
a) Need for savings,
b) Advantages of banking with formal financial institutions, various financial
products offered by banks relating to deposits, advances.
c) Other financial services through electronic mode such as ATMs, Smart
Cards, mobile banking etc.
d) Method of calculation of interest on savings bank accounts, Fixed Deposits.
e) Benefits of nomination facilities of accounts.
3. Bringing awareness of customer rights under fair practice code.
4. Organizing public awareness campaigns, seminars, press conferences etc.
V.1.2.2. Credit Counselling
There are two types of credit counselling, one is preventive counselling and the other is
curative credit counselling.
Preventive counselling will include bringing awareness regarding cost of credit,
availability of backward and forward linkages, etc., need to avail of credit on the basis
of customer’s repaying capacity. In case of curative counselling the credit counselling
centre will work out individual debt management plans for resolving the unmanageable
debt portfolio of the clients by working out effective debt restructuring plan in
consultation with branch of the bank, taking into account income level and size of the
loans.

Chapter V Supply Side Analysis of Data
Effectiveness of Financial Inclusion Programme in Kerala 93
Detailed list of FLCs is shown in Appendix-III
V.1.2.3. Simplifying of KYC (Know Your Customer) Norms
KYC stands for Know Your Customer. Simplifying KYC norms as part of FIP means
the beneficiaries have to provide only the passport size photograph and self-attested
address proof for opening up of BSBDAs.
V.1.2.4. Introduced BC (Business Correspondent)/ BF (Business Facilitator)
model:
With an effort to focus commercial banks, to reach rural household and farm household,
banks were permitted to use infrastructure of civil society organizations, rural kiosks,
and adopt Business Facilitator (BF) and Business Correspondent (BC) models for
providing financial services. RBI has operators and agents of small saving schemes of
government of India or Insurance companies, retired and authorized functionaries of
well-run SHGs linked to banks as BCs. In January 2006 RBI permitted to utilize the
services of NGOs, SHGs, MFIs and other civil society organizations as intermediaries
in providing finance and banking services through BF and BC which is known as
“Agency model”. (This allows banks to do ‘cash in cash out’ transactions at a location
closer to rural population and facilitate greater financial inclusion and income)
As far as Kerala is concerned BC or BF was not possible in all allocated centres. Only
one or two BC was working. Therefore, SLBC went for Branch Expansion instead of
BCs/BFs. Satellite branches were also used instead of brick and mortar branches for
performing financial inclusion services. Mobile vans were used by KGB in north Kerala
especially in Wayanad.
In Kerala, FIP is led by SLBC Kerala and it delivers duty of FIPs to the Lead Banks and
this lead Bank delivers duty of FIPs to the concerned commercial Banks in each District
then ultimately it reaches to the beneficiaries through the concerned commercial banks.
It can be understood at a glance with the following figure

Chapter V Supply Side Analysis of Data
Effectiveness of Financial Inclusion Programme in Kerala 94
Figure: V.1 Channels of implementing FIP in Kerala
Source: SLBC Kerala
V.2. Bank Branches in Kerala
Following table (Table No: V.1) explains the details regarding the number of Bank
Branches in Kerala in total at the latest. Numbers of Banks are classified on the basis of
its location like Rural, Semi-Urban and Urban.
Table V.1 BANKING STATISTICS - NUMBER OF BANK
BRANCHES AS AT SEPTEMBER 2017
Sl
No. BANK
No. of Branches
Rural Sub Urban Urban Total
A Public Sector Commercial Banks
1 Allahabad Bank 0 11 10 21
2 Andhra Bank 0 19 20 39
3 Bank of Baroda 3 77 30 110
4 Bank of India 7 70 28 105
5 Bank of
Maharashtra 0 3 7 10
6 Canara Bank 23 338 96 457
7 Central Bank of
India 5 88 30 123
8 Corporation Bank 5 82 27 114
SLBC, Kerala
Lead Banks
Concerned Commercial Banks
Local Community (Beneficiaries)

Chapter V Supply Side Analysis of Data
Effectiveness of Financial Inclusion Programme in Kerala 95
9 Dena Bank 0 8 8 16
10 IDBI Bank 0 33 19 52
11 Indian Bank 2 96 44 142
12 Indian Overseas
Bank 6 135 45 186
13 Oriental Bank of
Commerce 0 8 12 20
14 Punjab & Sind Bank 0 0 4 4
15 Punjab National
Bank 8 112 47 167
16 State Bank Of India 60 998 292 1350
17 Syndicate Bank 9 173 50 232
18 UCO Bank 2 32 14 48
19 Union Bank Of
India 12 182 65 259
20 United Bank Of
India 0 5 11 16
21 Vijaya Bank 10 89 32 131
Total- Public
Sector Commercial
Banks
152 2559 891 3602
B R R B - Kerala
Gramin Bank 51 526 39 616
Total- Public
Sector Banks
Including RRB
203 3085 930 4218
C Private Sector Commercial Banks
1 Axis Bank 1 57 40 98
2 Catholic Syrian
Bank 44 187 45 276
3 City Union Bank 0 8 8 16
4 Dhanlaxmi Bank 18 92 41 151
5 Federal Bank 29 493 76 598
6 HDFC Bank 7 106 57 170
7 ICICI Bank 6 104 61 171

Chapter V Supply Side Analysis of Data
Effectiveness of Financial Inclusion Programme in Kerala 96
8 Indus Ind Bank 0 20 17 37
9 Jammu & Kashmir
Bank 0 0 2 2
10 Karnataka Bank 1 10 9 20
11 Karur Vysya Bank 0 10 9 19
12 Kotak Mahindra
Bank 0 18 14 32
13 Lakshmi Vilas Bank 0 6 7 13
14 South Indian Bank 42 345 76 463
15 T.N. Mercantile
Bank 0 12 9 21
16 Yes Bank 0 4 11 15
Total- Pvt Sector
Commercial Banks 148 1472 482 2102
Total - Commercial
Banks + RRB 351 4557 1412 6320
D Co-Operative Banks
1 Dist Co-Operative
Banks 0 0 806 806
2 KSCARDB (Incl.
PCARDBS) 117 28 14 159
3 KSCB 0 0 20 20
Total Co-
Operative Banks 117 28 840 985
Total - Banking Sector 468 4585 2252 7305
Source: RBI website
From the above table (Table No: V.1) it is very clear that, there are 7305 bank branches
in Kerala and it consist of 3602 Public Sector Bank Branches [includes the branches of
Allahabad Bank, Andhra Bank , Bank of Baroda , Bank of India , Bank of Maharashtra,
Canara Bank , Central Bank of India ,Corporation Bank ,Dena Bank , IDBI Bank, Indian
Bank, Indian Overseas Bank, Oriental Bank of Commerce, Punjab & Sind Bank , Punjab
National Bank, State Bank Of India, Syndicate Bank, UCO Bank , Union Bank Of India,
United Bank Of India and Vijaya Bank], 2102 private sector bank branches [includes
the branches of Axis Bank, Catholic Syrian Bank, City Union Bank, Dhanlaxmi Bank,

Chapter V Supply Side Analysis of Data
Effectiveness of Financial Inclusion Programme in Kerala 97
Federal Bank, HDFC Bank , ICICI Bank, Indus Ind Bank, Jammu & Kashmir Bank,
Karnataka Bank, Karur Vysya Bank, Kotak Mahindra, Bank, Lakshmi Vilas Bank,
South Indian Bank, T.N. Mercantile Bank, and Yes Bank] and 616 RRB Branches and
985 Co-operative Bank branches.
V.3. Access to Credit
1. Introduced KCC(Kisan Credit Cards), GCC(General Credit Cards) and other micro
credits
2. Mobile banking, micro insurance, and Islamic banking practices.
District wise classification of last two years data on credit accessed by different
categories of minorities is shown in the following table.
Table No: V.2 District-Wise Data on Flow of Bank Credit to Minorities as
on 30th September 2017
Outstanding (Rupees in Crores)
as on 30.09.2016 as on 30.09.2017
No. Amount No. Amount
TRIVANDRUM 476648 6951.47 570022 7742.09
KOLLAM 49550 5325.30 93481 4390.91
PATHANAMTHITTA 194826 7771.00 335121 2918.00
ALAPPUZHA 113965 2750.79 123218 3882.00
KOTTAYAM 267484 5882.03 263708 5913.32
IDUKKI 262195 6693.35 170259 4034.41
ERANAKULAM 408549 19745.04 412528 15034.89
THRISSUR 255083 8722.35 238694 9380.36
PALAKKAD 369685 7657.77 349024 8343.85
MALAPPURAM 678226 9050.65 548635 10340.61

Chapter V Supply Side Analysis of Data
Effectiveness of Financial Inclusion Programme in Kerala 98
KOZHIKODE 239738 5422.64 231304 6985.54
WAYANAD 260080 2396.38 361239 5459.44
KANNUR 310930 6669.91 242983 6030.93
KASARAGODE 341351 3772.40 353696 4485.00
KERALA (total) 4228310 98811.08 4293912 94941.34
Source: SLBC, KERALA
A detailed table is given in appendix IV.
Table shows detailed description of district wise classification of last two years data on
credit accessed by different categories of minorities (Christians, Muslims, Sikhs, Jains,
Neo Budhists, Zorashtrians) in Kerala. Every fourteen district shows an increasing trend
in the aspects of accessibility of credit.
V.4 Extent of Accessibility, Availability and Usage (Effectiveness of FIP using
FII):
Following are the three dimensions used for measuring the effectiveness
of FIP from the supply side.
Accessibility means penetration of banking system given by the number of bank
accounts per 1000 population
Availability has been measured by the number of bank branches and ATMs per 1,
00,000 people.
Usage denotes by the volume of credits plus deposits.
Formula used for measuring FII is as follows:
Here, n=3
n
FII = 1/n ∑zi
i=1

Chapter V Supply Side Analysis of Data
Effectiveness of Financial Inclusion Programme in Kerala 99
Zi means dimension index
Here dimensions are: D1, D2 and D3
Dimension can be calculated by using the following formula
Zi= (Ai-mi) / (Mi-mi)
Ai= actual value of ith dimension
Mi= Maximum value of ith dimension
mi= Minimum value of ith dimension
D1- Accessibility = (A1-m1) / (M1-m1)
D2- Availability and = (A2-m2) / (M2-m2)
D3- Usage = (A3-m3) / (M3-m3)
Table V.3. Dimensions of FII (Ai-mi/Mi-mi)
Sl.
No
Name of
Districts
D1
Accessibility
D2
Availability
D3
Usage
1 Trivandrum 476541 2976.85 934017
2 Kollam -0.16 827.85 374957
3 Pathanamthitta 241640 938.85 375391
4 Aleppy 29736.8 701.85 321294
5 Kottayam 170227 1252.85 431115
6 Ernakulam 76777.8 218.85 40925
7 Idukki 319047 2483.85 1538492
8 Trichur 145213 1479.85 685810
9 Palakkad 255543 1116.85 58991
10 Malappuram 455154 1301.85 261982
11 Kozhikode 137823 1207.85 352736
12 Wayanad 267758 -0.15 -0.04
13 Kannur 149502 740.85 295608
14 Kasaragod 260215 124.85 66704
15 Kerala 2985176 15372.9 5738021
Source: State Level Bankers Committee, Kerala.
The above table (Table No: V.3) describes the figures representing three dimensions of
financial inclusion index namely Accessibility, Availability and Usage (these
dimensions were represented by D1, D2 and D3). Third column represents Accessibility
dimension in the fourteen districts of Kerala. The column shown the result of the total
penetration of banking system given by the number of bank accounts per 1000
population at every district of Kerala.

Chapter V Supply Side Analysis of Data
Effectiveness of Financial Inclusion Programme in Kerala 100
Calculated dimensions using the equation, actual value minus minimum value divided
by maximum value minus minimum value [D1= (A1-m1) / (M1-m1)].
The fourth column represents Availability dimension and it explains the total number of
bank branches and ATMs in every district of Kerala and the last column denotes by
Usage dimension. This contains the volume of credits plus deposits in every districts of
Kerala.
Dimension details is shown as appendix V.
The last row represents the values of dimensions of Kerala State. Figures are taken from
the websites of RBI and SLBC Kerala.
The detailed table of calculations of FII is described below.
Table: V.4 Calculation of Financial Inclusion Index
Name of
Districts
∑Zi =
D1+D2+D3 1/3 ∑Z3 FII Position
Trivandrum 1413534.64 471178.21 0.47 0.16 II
Kollam 375784.64 125261.55 0.12 0.04 IX
Pathanamthitta 617969.64 205989.88 0.21 0.07 V
Aleppy 351732.64 117244.21 0.12 0.04 X
Kottayam 602594.64 200864.88 0.20 0.07 VI
Idukki 117921.64 39307.21 0.04 0.01 XIV
Ernakulam 1860022.64 620007.55 0.62 0.21 I
Trichur 832502.64 277500.88 0.28 0.10 III
Palakkad 315650.64 105216.88 0.11 0.04 XII
Malappuram 718437.64 239479.21 0.24 0.08 IV
Kozhikode 491766.64 163922.21 0.16 0.06 VII
Wayanad 267757.64 89252.55 0.09 0.03 XIII
Kannur 445850.64 148616.88 0.15 0.05 VIII
Kasargod 327043.64 109014.55 0.11 0.04 XI
Kerala 8738569.97 2912856.66 2.9 1.00
Source: SLBC, Kerala

Chapter V Supply Side Analysis of Data
Effectiveness of Financial Inclusion Programme in Kerala 101
The D1, D2 and D3 columns represent the three dimensions of FII. Here the First column
represents the name of fourteen districts in Kerala. Second column shows the summated
figures of the three dimensions of FII, and the third column shows one divided by the
number of dimensions i.e., three. Fourth column shows the FII acquired by every district
in Kerala and the last column describes the position of districts in their performance of
supply side financial inclusion in the state of Kerala. Table clearly exhibits the position
of each district in the performance of FIP. Ernakulam district stands in first position
followed by Trivandrum district, Trichur district, and Malappuram district respectively
in the second, third and fourth position. Pathanamthitta district, Kottayam district,
Calicut district and Kannur district shows medium performance and they place fifth,
sixth, seventh and eight positions in the performance of FIP. Kollam district, Kasargod
district, Aleppy district, Palkkad district, Wayanad district and Idukki district showed
ninth, tenth, eleventh, twelfth, thirteenth and fourteenth position respectively. Idukki
district showed last position in the performance of FIP in the State of Kerala.
V.5 Chapter Summary
The chapter gives the analysis of financial inclusion programme from the supply side
results of tests using FII carried out to examine the effectiveness financial inclusion
programme in Kerala. Performance of fourteen districts was measured using FII and it
was reported in this chapter in a tabular form. Roles performed by the Banks in Kerala
were explained in detail in the present chapter. FIIs of fourteen districts in Kerala were
described in this chapter. SLBC, Kerala is the foremost authority in the performance of
FIP in Kerala.
The next chapter deals with testing of hypothesis.


Chapter VI Test of Hypothesis and Analysis of Conceptual Model
Effectiveness of Financial Inclusion Programme in Kerala 102
Chapter VI
Test of Hypothesis and Analysis of
Conceptual Model
This chapter explains the profile of the samples, descriptive statistics of the
collected data and its analysis in tune with the objectives and hypotheses set
for the study. Interpretations are discussed in terms of their relationship
with research objectives. The model which explains the relationship
between dependent, independent and moderating variables of financial
inclusion programme from the perception of demand side is depicted in this
chapter.
VI. 1 Data Records
People who are financially included that means to whom have a bank account in the
formal financial sector and checking on the basis of usage, their accessibility towards,
and the availability of financial services were only considered as respondents. After
confirming the appropriateness of the respondents for the sample, three hundred filled-
up interview schedules from the beneficiaries were considered for the study. The survey
was carried out by direct interaction with beneficiaries of financial inclusion
programme. Distributed 300 interview schedule to the selected respondents from the
state of Kerala. With the wholehearted support of the respondents every three hundred
interview schedules were filled and used for the analysis.
VI. 2 Profile of the Respondents
The sampling design was described in section III.14 of chapter III.
VI. 3 Classification of Respondents Based on Age
People of different age groups have different choices, credit needs, savings behaviour
etc. so it is very important to analyse the respondents according to their age. The figure
VI.1 shows the age wise classification of the respondents covered under the study. They
are grouped under five groups namely below 30, 30-40, 40-50, 50-60 and 60& above.

Chapter VI Test of Hypothesis and Analysis of Conceptual Model
Effectiveness of Financial Inclusion Programme in Kerala 103
Out of 300 respondents only 14 (5 Per cent) are in the age group below 30, 48(16 per
cent) are in the 30-40 age group, 111(37 per cent) are in the age group of 40-50, 97(32.3
per cent) are in the age group of 50-60 and 30 (10 per cent) are in the age group of 60&
above. Therefore, majority of the respondents belong to middle (40-50) age groups.
Figure VI.1: Distribution of Respondents Based on Age
Source: Field survey
VI. 4 Classification of Respondents Based on Gender
Gender wise classification of respondents covered under the study is presented in the
figure VI.2. It shows that out of 300 respondents, male respondent constitute 204 (68
per cent) and female respondents constitute only 96 (32per cent). It indicates that
majority of respondents are male.
14
48
111
97
30 20-30
30-40
40-50
50-60
above 60

Chapter VI Test of Hypothesis and Analysis of Conceptual Model
Effectiveness of Financial Inclusion Programme in Kerala 104
Figure VI.2: Gender Distribution
Source: Field survey
VI. 5 Classification of Respondents Based on Residential Status
Figure VI.3: Residential Status of Respondents
Source: Field survey
Locality is another important demographic variable that explains the behavior of
respondents. Based on locality respondents are classified into three groups namely those
204
96Male Female
0
20
40
60
80
100
120
140
160
180
200
Rural Rural hilly Semi-urban Urban

Chapter VI Test of Hypothesis and Analysis of Conceptual Model
Effectiveness of Financial Inclusion Programme in Kerala 105
residing in rural, rural hilly, semi-urban and urban areas. From the figure VI.3 it can be
noted that among 300 respondents, 187 (62.3 per cent) are in the rural area, 77 (25.7 per
cent) in the semi- urban area and the rest 10 (3.3 per cent) are in the urban area. Thus,
majority of the respondents are residing in the rural area. It is because people living in
the rural area are weaker and belongs to low income group, especially small credit needs
than the people in the semi- urban & urban areas.
VI. 6 Classification of Respondents Based on Education
Education that equips a person to make better choices and decisions with confidence is
a very important factor to be analyzed in the savings and credit behavior. The
respondents are grouped according to their educational qualifications such as illiterate,
primary, SSLC, plus two/ PDC, and degree and others. From the figure VI.4, it is
revealed that out of 300 respondents 39(13Percent) are illiterate, 93(31.percent) passed
primary level, 111 (37 per cent) passed their high school level (SSLC), 25(8.3 per cent)
passed plus two level education, 15(5per cent) passed degree education and 17(5.7 per
cent) are having other qualifications. Others include two postgraduates. The table shows
that majority of the respondents possess SSLC level education (38.5 percent).
Figure VI.4: Educational Status of Respondents
Source: Field survey
0
20
40
60
80
100
120
Illiterate Primary SSLC Plus-Two Degree Others

Chapter VI Test of Hypothesis and Analysis of Conceptual Model
Effectiveness of Financial Inclusion Programme in Kerala 106
VI. 7 Classification of Respondents Based on Marital Status
Marital status is an important variable that influence the saving behavior and credit
needs of the low-income group and weaker sections. The figure VI.4 shows the marital
status wise classification of the respondents. From the table it is clear that out of the 300
respondents 238 (79 per cent) are married, 28(9per cent) are single, and 34(11 Percent)
are widowed/divorced/deserted. It is revealed that majority of the respondents covered
under the study are married people. Usually after the marriage, peoples are more
conscious about their savings& credit needs.
Figure VI.5: Marital Status of Respondents
Source: Field survey
VI. 8 Classification of Respondents Based on Occupation
Occupation is another important variable, which affect the management of personal
finance and credit needs of the respondents. The following figure deals with the
occupation wise classification of the respondents. Based on their occupation, they are
grouped into agricultural laborers, farmers, housewives, and others. Out of 300
respondents, 160 (53.3 per cent) are agricultural laborers, 39 (13 per cent) are farmers,
35 (11.7 per cent) are housewives, and 66 (22.per cent) are in the others category. Others
include 3 teachers, 33 ex-military, 1 social worker, 12 business man, 3 military, and 14
beedi workers. Thus, it is revealed that majority of the respondents are agricultural
238
28
34
Married
Unmarried
Widow/Divorced/Deserted

Chapter VI Test of Hypothesis and Analysis of Conceptual Model
Effectiveness of Financial Inclusion Programme in Kerala 107
labourers. These people are more conscious about their future and they are more savers
and needs credit.
Figure VI.6: Distribution of Respondents Based on their Occupation
Source: Field survey
VI. 9 Classification of Respondents Based on their average Monthly Income
Saving behavior of the individuals is very much influenced by their income. The figure
VI.7 Monthly income of the respondents are grouped into five categories such as below
Rs.2500/-, Rs2500/--Rs.5000/-, Rs 5000/-Rs 7500/-, Rs. 7500-Rs.10,000/-, Rs.10,000/-
and above. It is observed from the following figure that out of 300 respondents, 76, (25.3
per cent) are belonging to Below 2500, 81 (27.0percent) belongs to Rs. 2500/-Rs. 5000/,
55 (18.3per cent) are in the income group of Rs. 5000/-Rs. 7500/-, 32 (10.7per cent) are
in the income group of Rs. 7500/-- Rs. 10000/- and 56 (18.7 per cent) are in the income
group of above Rs. 10000/-. It shows that majority of the respondents income come
under Rs. 2500/--Rs. 5000/-, because majority of the respondents are agricultural
labourers.
138
59
54
77 Agricultural Labourers
Farmers
House Wives
Others

Chapter VI Test of Hypothesis and Analysis of Conceptual Model
Effectiveness of Financial Inclusion Programme in Kerala 108
Figure VI.7: Distribution of Respondents based on Monthly Income of
Respondents
Source: Field survey
VI. 10 Classification of Respondents Based on the Number of Dependents
Table No: VI.1. Classification of
respondents based on their number of
dependence in the family
No. of
Dependents
Frequency Percent
2-3 222 74.0
4-5 63 21.0
6-7 15 5.0
Total 300 100.0
Source: Primary Data
Respondents based on the number of dependents (Table No: VI.1) were showed. The
number of respondents listed were 2-3, 4-5, and 6-7. Majority of the respondents had
two - three dependence in their family.
76
8155
32
56
Below 2500
2500-5000
5000-7500
7500-10000
10000&Above

Chapter VI Test of Hypothesis and Analysis of Conceptual Model
Effectiveness of Financial Inclusion Programme in Kerala 109
VI. 11 Classification of Respondents Based on Housing Condition
Table VI.2. Classification of respondents based
on their housing condition
Housing condition Frequency Percent
Own 288 96.0
Rented 12 4.0
Total 300 100.0
Source: Primary Data
The above table (Table No: VI.2) showed Classification of respondents based on their
Housing condition as they are living in Own residence or in Rented home. Majority of
the respondents were residing in own house. Only four percent of beneficiaries were
living in rented house.
VI. 12 Classification of Respondents Based on the Type of Bank they are Using
Table VI.3 Classification of respondents based
on the type of Bank they are using
Type of Bank Frequency Percent
Public Sector
Bank 217 72.3
Private Sector
Bank 33 11.0
Gramin Bank 11 3.7
Co-Operative
Bank 36 12.0
Others 3 1.0
Total 300 100.0
Source: Primary Data

Chapter VI Test of Hypothesis and Analysis of Conceptual Model
Effectiveness of Financial Inclusion Programme in Kerala 110
Type of bank they were using for getting loans showed in the above table (Table No:
VI.3). Public Sector Bank, Private Sector Bank, Gramin Bank, Co-Operative Bank, and
Others were the options given. Majority of the respondents were come under public
sector Banks.
VI. 13 Classification of Respondents Based on Number of Bank Accounts Using
Table VI. 4 Classification of respondents
based on Number of bank accounts using
Number of bank
accounts
Frequency Percent
Only One 131 43.7
Two 135 45.0
Three 28 9.3
Four& Above 6 2.0
Total 300 100.0
Source: Primary data
The above table (Table No: VI.4) shows the number of bank accounts used by the
respondents as they have Only One, Two, Three, Four& Above accounts. Majority of
the respondents had two accounts. They were opened account in the co-operative Banks
also. Even though RBI is not considering Co-operative banks’ deposits, in rural Kerala
co-operative banks play a major role in Kerala.
VI. 14 Classification of Respondents Based on Purpose of Usage
Table VI.5 Classification of
respondents based on Purpose of usage
Usage Frequency Percent
Savings 26 8.7
Credit 300 100.
Both 26 8.7
Others 160 53.3
Source: Primary Data

Chapter VI Test of Hypothesis and Analysis of Conceptual Model
Effectiveness of Financial Inclusion Programme in Kerala 111
From the above table, (Table No: VI.5) it was clear that respondents were classified
based on their usage of bank accounts as for Savings, Credit, Both and Others. As the
respondents were considered on the basis of those who were financially included, all
respondents were using for credit purpose, even then twenty six respondents were using
for savings purpose also. And hundred and sixty respondents were using for other
purpose like receiving government benefits like gas subsidy, pension etc. also.
VI.15 Classification of Respondents Based on their Sources of Information
Regarding the Banking Services:
The following table (Table No: VI.6) shows the classification of respondents based on
their Sources of information regarding Banking services as from Friends and Relatives,
News Paper, TV/Radio, Flex Boards, or through Internet. Majority of the respondents (64.3
percent) get information from their friends and relatives. Only few (35.7 percent) get
information through other sources like TV/Radio, flex board or through Internet.
Table VI. 6 Classification of respondents based
on their Sources of information regarding the
Banking services
Sources of information Frequency Percent
Friends And Relatives 193 64.3
News Paper 64 21.3
TV/Radio 31 10.3
Flex Boards 7 2.3
Internet 5 1.7
Total 300 100.0
Source: Primary Data

Chapter VI Test of Hypothesis and Analysis of Conceptual Model
Effectiveness of Financial Inclusion Programme in Kerala 112
Vi. 16 Classification of Respondents Based on the Schemes they are Using
Table VI.7 Classification of respondents based on
the schemes they are using
Schemes Frequency Percent
KCC 167 55.7
GCC 82 27.3
Other Micro Credits 51 17.0
Total 300 100.0
Source: Primary Data
Table (Table No: VI.7) reveals that, the total respondents were covered under four
categories; the first category belongs to KCC holders and it covers 55.7 percent (167
respondents) of respondents, GCC holders covers 27.3 percent (82 respondents), and the
remaining respondents i.e., 17 percent (51 respondents) comes under the third category
of other micro credits. Other micro credits include micro credits given for starting micro
units as a part of group activities (with SHG-Bank linkage), and loans given for
purchasing cattle, tailoring machines (self-employment facility). Majority of the
respondents (55.7 percent) falls under KCC Scheme.
VI.17 Descriptive Statistics of Variables Used in the Study:
Table: V1. 8. Descriptive statistics of Variables used
Constructs N Minimum Maximum Mean Std.
deviation
Accessibility 300 1 5 3.1321 1.16127
Usage 300 1 5 3.560 .90302
Financial literacy 300 1 5 3.2379 1.10568
Asset creation 300 1 5 3.2592 .89115
Income generation 300 1 5 3.0489 .78731
Employment
generation
300 1 5 3.3419 .80478
Source: Field survey

Chapter VI Test of Hypothesis and Analysis of Conceptual Model
Effectiveness of Financial Inclusion Programme in Kerala 113
Above table (Table No: VI.8) shows the list of entire variables along with Descriptive
statistics of the variables (mean values and standard deviation). These variables were
identified and appropriate measurement scales were adapted through the review of
literature.
VI.18 Reasons-Why the Respondents Use Formal Financial Services
Table: VI. 9. Formal Financial Services-Usage Reasons
S.l No Items Weighted Score Rank
1 Lower interest rate 0.16 1
2 Cost Effectiveness 0.15 2
3 Problem Handling and
compensation 0.14 3
4 Easy to use and convenience &
Operational efficiency 0.11 4
5 Responsiveness 0.1 5
6 Proper sanctioning of loans 0.08 6
7 Better customer service
& Efficiency
0.06
7
8 Speed of service
0.03 8
Source: Primary Data
It is clear from the table that based on the ranking they have given; the reason for using
formal financial service is mainly because of lower interest. So it has got Rank 1. Cost
effectiveness, Problem Handling and compensation, easy to use and convenience &,
Operational efficiency, Speed of service, proper sanctioning of loans. Better customer
service & Efficiency and Responsiveness follows subsequently while comparing with
informal financial services.

Chapter VI Test of Hypothesis and Analysis of Conceptual Model
Effectiveness of Financial Inclusion Programme in Kerala 114
VI.19 Respondent’s Problems while using Formal Financial Services
Table: VI.10. Problems in using formal financial services
Sl. No Items Weighted score Rank
1 Tedious and cumbersome procedures 0.216749468 1
2 Distance to be travelled 0.186515259 2
3. Lack of banker’s interest 0.176721079 3
4 Procedural delay 0.161107168 4
5 Non-business-friendly environment 0.147480483 5
6 Limited know-how of mainstream providers 0.111426544 6
Source: Primary Data
Based on the ranks given by the respondents, the problems in using formal financial
service is mainly because of tedious and cumbersome procedures. So it has got Rank 1.
Distance to be travelled, Lack of banker’s interest, Procedural delay &, Operational
efficiency, Non-business-friendly environment, & Limited know-how of mainstream
providers follows subsequently while comparing with informal financial services.
VI.20 Classification of Respondents Based on their Average Income from Activity
Source: Field survey
From the above table (Table VI.11), it is evident that majority of the respondents has
average income from activity between five to ten per cent of their initial investment.
Hundred and one respondents have below five percent average income from activity,
Table: VI.11 Average income from activity
Average income
from activity
Frequency
Below 5% of
investment
5%-10% of
investment
10%-15% of
investment
Above 15%
of investment
101 146 40 13

Chapter VI Test of Hypothesis and Analysis of Conceptual Model
Effectiveness of Financial Inclusion Programme in Kerala 115
forty respondents have average income from activity between ten to fifteen percent and
the remaining thirteen respondents have average income from activity above fifteen per
cent of their investment.
VI.21 Effectiveness of the FIP at a Glance
Table VI.12 Effectiveness of the FIP at a Glance
Particulars Before availing
the loan
After
availing the
loan
Change (increase/decrease)
frequency
Average monthly
income
Same
-
-
Same
-
-
No change
Increase
Decrease
87
201
12
Average days of
employment
Same
-
-
Same
-
-
No change
Increase
Decrease
87
201
12
Asset position
(personal assets)
Same
-
-
Same
-
-
No change
Increase
Decrease
87
201
12
Source: Primary Data
It is very clear from the above table that, respondents were not ready to disclose their
income, employment and asset position. They had reported only the change before and
after availing the loan like No change, increase or decrease. Majority of the respondents
reported that, they had positive changes due to accessing credit in the three aspects of
economic impact like their monthly income, days of employment and asset position and
only twelve respondents reported they had decrease and the remaining 87 respondents
reported that they have no change on the afore said three aspects due to credit access.
This is the main reason for going to the development of a model based on the perception
of respondents beyond mere figures. Following model will explain clearly the

Chapter VI Test of Hypothesis and Analysis of Conceptual Model
Effectiveness of Financial Inclusion Programme in Kerala 116
perception of respondents on the above three dimensions namely asset creation, income
generation and employment opportunity.
VI.22 Conceptual Model:
VI.22.1 Confirmatory Factor Analysis:
Detailed explanation regarding EFA and CFA of the present model was given in chapter
III Section 9 and 10.
VI.22.2 Measurement Model:
The conceptual model consists of independent variables, moderating variable and
dependent variables. Here, first explaining measurement model without moderating
variable.
Following table illustrates the basic features of Warp PLS 5.0 used for doing Structural
Equation Modeling.
Table VI. 13.Basic Features of Warp PLS 5.0
Missing data imputation algorithm Arithmetic Mean Imputation
Outer model analysis algorithm PLS Regression
Default inner model analysis algorithm Warp3
Multiple inner model analysis algorithms used? No
Re sampling method used in the analysis Stable3
Number of cases (rows) in model data 300
Number of indicators used in model 48
Source Primary Data
There is no need of further explanation about the basic features used for doing SEM
using Warp PLS 5.0 as it is very clear from the above table. For dealing with missing
data imputation algorithm used is Arithmetic mean imputation. Outer model analysis
algorithm was PLS regression; default inner model algorithm was Warp3. There are no

Chapter VI Test of Hypothesis and Analysis of Conceptual Model
Effectiveness of Financial Inclusion Programme in Kerala 117
multiple inner model analysis algorithms used; re sampling method used in the analysis
was Stable3; number of cases in model data was three hundred and the number of
indicators used in the model was forty eight.
Following figure is the graphical representation of measurement model used in the study
without moderation.
Figure VI.8 Measurement Model without Moderation
The statistical significance of relationships among effectiveness of financial inclusion
and its extracted dimensions were of interest to this study. The path coefficients (β) and
p values for the relationships are as shown Figure VI.8 All paths in the model were
significant (p<0.01) and all path coefficients (β) were also positive indicating that an
increase in any of these dimensions results in an increase in perceived effectiveness of
the FIP.

Chapter VI Test of Hypothesis and Analysis of Conceptual Model
Effectiveness of Financial Inclusion Programme in Kerala 118
Table No: VI.14 Model Fit and Quality Indices
Average path coefficient (APC) 0.67 P<0.001
Average R-squared (ARS) 0.46 P<0.001
Average adjusted R-squared (AARS) 0.46 P<0.001
Average block VIF (AVIF) 1.21 acceptable if <= 5 ideally <= 3.3
Average full collinearity VIF
(AFVIF)
2.39 acceptable if <= 5 ideally <= 3.3
Tenenhaus GoF (GoF) 0.63 small >= 0.1
medium >= 0.25
large >= 0.36
Sympson's paradox ratio (SPR) 1.000 acceptable if >=
0.7
ideally = 1
R-squared contribution ratio (RSCR) 1.000 acceptable if
>= 0.9 ideally
= 1
Statistical suppression ratio (SSR) 1.000 acceptable if
>= 0.7
Nonlinear bivariate causality direction ratio
(NLBCDR)
1.000 acceptable if
>= 0.7
Source: Primary Data
To assess the model fit with the data, it is recommended that the p-values for both the
average path coefficient (APC) and the average R-squared (ARS) be both lower than
0.01. It is also recommended that the average variance inflation factor (AVIF) be lower
than 5 (Kock, 2012). Table VI.14 provides the model fit indices with p values of the
estimated model. It was found that, all the three fit criteria were met and hence it was
assumed that the model had acceptable predictive and explanatory quality as the data is
well represented by the model.

Chapter VI Test of Hypothesis and Analysis of Conceptual Model
Effectiveness of Financial Inclusion Programme in Kerala 119
The R squared and Q squared coefficients are provided only for endogenous variables.
The R squared coefficient reflects the percentage of explained variance associated with
the latent variable. In other words, it refers to the percentage of explained variance of
the latent variable that is due to the latent variables pointing at it. The R squared
coefficient for the model is 0.46 meaning 46 percentage of the variance in dependent
variable is explained by the two dimensions in the study.
Q-Squared Coefficients: Asset Income Employment
0.593 0.554 0.492
The Q squared coefficient, which is also known as Stone-Geisser Q squared coefficient,
reflects the predictive validity associated with the latent variable. It is recommended that
accepted predictive validity in connection with an endogenous variable is suggested by
a Q squared coefficient greater than zero (Kock, 2012). The Q squared coefficient as
seen in above is 0.59(Asset), 0.55(Income) and 0.49(Employment) and hence predictive
validity of the model was also established.
VI.22.3 Measurement Model with Moderating Variable:
In the case of moderating variable also CFA was done in chapter III. Section 9 and 10.
Therefore here going directly to the measurement model.
The conceptual model consists of independent variables, moderating variable and
dependent variables. Here, first explaining measurement model with moderating
variable.
The basic features of Warp PLS 5.0 used for doing Structural Equation Modeling are
same as above.
Following figure is the graphical representation of measurement model used in the study
with moderation;

Chapter VI Test of Hypothesis and Analysis of Conceptual Model
Effectiveness of Financial Inclusion Programme in Kerala 120
Source: Primary Data
The path of the SEM pictured above shows statistical significance of the relationships
among effectiveness of financial inclusion programme (three dimensions), its
independent variable (three dimensions), and moderating variable (financial literacy).
The path coefficients (β) and p values for the relationships are as shown clarifies that,
all paths in the model were significant (p<0.01) and all path coefficients (β) were also
positive indicating that an increase in any of these dimensions results in an increase in
perceived effectiveness of the FIP.
VI.22.4 Model Fit and Quality Indices:
Following is the tabular form of various fit indices of the final measurement model used
in the study;
Figure VI.9 Conceptual Model

Chapter VI Test of Hypothesis and Analysis of Conceptual Model
Effectiveness of Financial Inclusion Programme in Kerala 121
Table No: VI.15 Model Fit and Quality Indices
Average path coefficient (APC) 0.58 P<0.001
Average R-squared (ARS) 0.5 P<0.001
Average adjusted R-squared (AARS) 0.5 P<0.001
Average block VIF (AVIF) 1.36 acceptable if <= 5 ideally <= 3.3
Average full collinearity VIF
(AFVIF)
2.273 acceptable if <= 5 ideally <= 3.3
Tenenhaus GoF (GoF) 0.64 small >= 0.1
medium >= 0.25
large >= 0.36
Sympson's paradox ratio (SPR) 1.000 acceptable if >=
0.7
ideally = 1
R-squared contribution ratio (RSCR) 1.000 acceptable if
>= 0.9 ideally
= 1
Statistical suppression ratio (SSR) 1.000 acceptable if
>= 0.7
Nonlinear bivariate causality direction ratio
(NLBCDR)
1.000 acceptable if
>= 0.7
It is very clear from the above table that average path coefficient with moderation is
0.58 and it was 0.67 without moderation and ARS is 0.5 with moderation and it was
0.46 without moderation. Even though the difference in value is very small, the variation
is due to the effect of moderating variable i.e., financial literacy. Also the path showed
positively significant (positive beta coefficient). AVIF is 1.36, it also in the prescribed
threshold limit. All other parameters like Tenenhaus GoF (GoF), Statistical suppression
ratio (SSR), R-squared contribution ratio (RSCR), Sympson's paradox ratio (SPR) were
same in both the models.

Chapter VI Test of Hypothesis and Analysis of Conceptual Model
Effectiveness of Financial Inclusion Programme in Kerala 122
VI.23. Testing of Hypotheses
VI.23. (a) Hypotheses with Direct Relationship between Variables:
The direct relationship between various dimensions of dependent variable and
independent variables used in the study can easily identify from the following figure.
Every path showed positively significant (P<0.01 and beta values showed good
indication of model fitness) and therefore the set hypothesis were not rejected.
Table VI.16 Direct relationship of variables with beta
coefficients and P values
Relationship between variables(Path) Beta
Coefficients
P Value
Accessibility Usage 0.46 <.01
Usage Asset creation 0.77 <.01
Usage Income generation 0.74 <.01
Usage Employment generation 0.70 <.01
Source: Primary Data
Table VI.17 provides the summary of hypotheses test results obtained at a glance for the
direct relationship between variables. All the hypotheses mentioned are tested at 1%
level of significance.

Chapter VI Test of Hypothesis and Analysis of Conceptual Model
Effectiveness of Financial Inclusion Programme in Kerala 123
Table VI.17 Summary of Hypotheses Test Results: Direct Relationship between
Variables
H
No.
Statement of Hypothesis Results
H1 There is significant relationship between beneficiaries perceived
Accessibility and perceived Usage
Supported
H2 There has been a significant relationship between perceived usage and
perceived asset creation
Supported
H3 There has been a significant relationship between perceived usage and
perceived income generation
Supported
H4 There has been a significant relationship between perceived usage and
perceived employment generation
Supported
VI.23. (b) Hypotheses with Moderating Effect of Perceived Financial Literacy
This research hypothesized the role of ‘financial literacy’ as a moderator which
enhances the effect of ‘Usage with Accessibility’. The hypothesis set for the above
moderation situation is provided below:
For testing the above hypothesis, researcher used structural equation modelling
technique with partial least square (Warp- PLS) method. The moderating variable
financial literacy was measured using a five point scale adapted from the literature.
Since the data with respect to financial literacy was continuous in nature PLS (warp)
was used, moreover this software facilitated direct link of moderation to the relevant
paths. The relevant path diagrams representing the concerned variables are taken for the
analysis. Recent studies undertaken in other sectors (Adomako, Danso, & Ofori
Damoah, 2016) provide evidences that financial literacy found to be an important
moderator interfering between access and growth.

Chapter VI Test of Hypothesis and Analysis of Conceptual Model
Effectiveness of Financial Inclusion Programme in Kerala 124
Figure VI.10. Effect of Moderation-Financial Literacy-
Without Moderation
It was clearly evident from the above figures that with moderation, there is increase in
R Squared value than without moderation. It was found that the moderation effect of
financial literacy on the accessibility to usage is significant at 1% level of significance
though the β value (0.14) seemed to be low; the effect of variations explained by
moderation is positive and significant hence supported the hypothesis.
As referred in the review of literature, large number of studies supports the role of
financial literacy in driving customer’s usage levels in a financial inclusion framework.
(Chen & Jin, 2017; Adomako et.al., 2016; Friedline & West, 2016; Kennedy, 2013;
Hillyard, 2013; OECD, 2013; N.Sreenivasan, 2012; Chandra, 2012; Cril, 2012; Falahati
et.al., 2012; Ministry, 2011; OECD, 2011; & Oecd, 2011; Turnham, 2010; Hung et.al.,
With moderation
Source: Primary Data

Chapter VI Test of Hypothesis and Analysis of Conceptual Model
Effectiveness of Financial Inclusion Programme in Kerala 125
2009; Gouws & Shuttleworth, 2009; Nye et.al., 2009) study found out that users
perception of financial literacy interacts between perceived accessibility and perceived
usage.
This research hypothesized the role of ‘perceived financial literacy’ as a moderator
which enhances the variables ‘perceived accessibility’ on the relationship of perceived
usage. The hypothesis set for the above moderation situation is provided below:
H5: There has been a significant interaction between perceived Accessibility and
perceived usage through financial literacy perception.
Statistical Inferences:
Moderation: positively significant, P Value <0.01 β Value= 0.14
It was found that the moderation effect of perceived financial literacy on the Usage
perception is significant at 1% level of significance though the β value (0.14) seemed to
be low; the effect of variations explained by moderation is positive and significant hence
accepted the hypothesis.
Model fit and quality indices from the general results obtained after conducting
structural equation modeling (SEM) analysis using the method of “warped” partial least
squares are given below.
Average path coefficient (APC), Average R-squared (ARS) and Average Adjusted R-
squared (AARS) values were 0.267, 0.224 and 0.218 respectively. The P values obtained
for the above cases were less than 0.001 which was valid. Average block VIF
(AVIF)=1.224 and Average full co linearity VIF (AFVIF) = 1.132 both were acceptable
since the values were less than 5. Tenenhaus GoF (GoF) obtained as 0.421, which was
found suitable for large sample as the value obtained was above 0.36. Sympson's
Paradox Ratio (SPR) equal to 1.000 and Statistical Suppression Ratio (SSR) found to be
equal to 1.000; both the ratios were acceptable since it was greater than 0.7 and R-
squared contribution ratio (RSCR) was 1.000 which was also acceptable since the value
was above 0.9. Nonlinear bivariate causality direction ratio (NLBCDR) is equal to1.000,
which is acceptable since the value is greater than 0.7.

Chapter VI Test of Hypothesis and Analysis of Conceptual Model
Effectiveness of Financial Inclusion Programme in Kerala 126
VI.24 Analysis using Financial Inclusion Index (FII):
Financial inclusion index can be used for measuring the effectiveness of
FIP from both demand side as well as supply side of the programme.
(Kablana, and Chikkara, 2013)
Formula used for measuring FII is as follows:
n
FII =1/ n ∑zi
i=1
Where,
n= Number of dimensions
Zi (Dimension Index) = (Ai-mi) / (Mi-mi)
Ai= actual value of ith dimension
Mi= Maximum value of ith dimension
mi= Minimum value of ith dimension
Financial inclusion index of individual respondents were given in appendix VI.
The table shows the FII of three hundred respondents individually based on their
perception. First column depicts serial numbers, second column D1 (Accessibility
Dimension), second column D2 (Usage Dimension) and the last column shows
individual FII.
The following table shows the FII of selected Districts of Kerala. Palakkad Shows
highest FII, followed by Kannur and Idukki showed the least FII.
Table VI.18 FII of Selected
Districts in Kerala
Districts FII
0.69
0.57
0.43
Palakkad
Kannur
Idukki
Source: Primary Data

Chapter VI Test of Hypothesis and Analysis of Conceptual Model
Effectiveness of Financial Inclusion Programme in Kerala 127
Therefore, from demand side Kerala’s FII is as follows
FII=1/2*(D1+D2)/300=
161.745/300
= 0.54
VI.25 Chapter Summary
The chapter is dealt with the analysis of data and results of data analysis. The results of
research model analysis and that of sub models are discussed in the chapter. Out of the
five hypotheses formulated to examine relationships among variables in the research
model, all were supported. The moderating influence of financial literacy on the link
between perceived accessibility and perceived usage was also supported.
As far as beneficiaries’ perceptions on Financial Inclusion Programme, demographic
profiles and socio economic factors like age, gender, marital status, level of education,
and income level did not explain significant variation. However differences in the
coefficients were observed for different occupation level of respondents in the
effectiveness of FIP.
Individual FII based on the perceptions of respondents as well as FII of Kerala and
selected districts were reported in the present chapter.
The next chapter deals with a discussion on the major findings of the study and the
conclusions drawn from the discussions and findings.

Chapter VII Findings and Recommendations
Effectiveness of Financial Inclusion Programme in Kerala 128
Chapter VII
Findings and Recommendations
This chapter provides the summary of major findings and discussion on
effectiveness of financial inclusion programme as a holistic approach was
considered. Effectiveness of FIP from the supply side was studied. Usage of
financial inclusion products and the relationship between accessibility to
usage as well as the effectiveness of financial inclusion programme (income
generation, employment generation and asset creation) from demand side
were also studied and the model showed positively significant. Effect of
financial literacy perception were studied as a moderator and it showed that
there is positive interference between accessibility and usage.
VII. 1 Summary of Findings
Studying about financial inclusion programme and to what extend it had effectiveness
in the Kerala context was the main objective of the study. For making the study
comprehensive, it was classified into five objectives. Answer to these objectives refined
the focus of the study. Studying about a programme like financial inclusion policy will
not be completed if it studies only from one angle. Therefore, it was decided to look on
both sides of the programme, i.e., from supply side as well as demand side.
Following are the major findings of the study:
VII.2. The first Objective was to study the factors associated with Banking policies
and implementation of Financial Inclusion Programmes: Although there have been a
number of studies on FIP, much of the research has been carried out using the
conventional system of looking on the inclusion-exclusion criteria and its reasons
behind, what all remedies can be used etc. The practical side of FIP were studied as part
of first objective of the study. Answer to the first objectives or findings were as follows:
Mainly the banks in Kerala performs the following functions as part FIP
VII.2.1. Providing financial literacy and credit counselling

Chapter VII Findings and Recommendations
Effectiveness of Financial Inclusion Programme in Kerala 129
VII. 2.2. Simplifying KYC norms
VII. 2.3. Introduction of branch expansion strategies
VII.2.4. Providing KCC/GCC and other Micro credits
VII.2.5. Introduced mobile banking, micro insurance and pensions
VII.2.6. There were seven thousand three hundred and five bank branches working
in Kerala
VII.2.7. Access to credits were made by these branches as per the directions from SLBC,
Kerala and lead Banks of the districts concerned.
VII.3. Second objective of the study was to find out the extent of accessibility,
availability and usage of FIP i.e., to study to what extend the FIP is effective in Kerala
using Financial Inclusion Index, and the findings were as follows:
VII.3.1. Extend of Accessibility means penetration of banking system given by the
number of bank accounts per 1000 population- First dimension used for measuring
effectiveness of FIP. Extend of Availability has been measured by the number of bank
branches and ATMs per 1, 00,000 people- second dimension used for measuring the
effectiveness of FIP. And the third dimension was the Extend of Usage which is
denoted by the volume of credits plus deposits.
VII.3.2. By considering the three dimensions of FIP, the performance of each district
were as follows:
Ernakulam district stands in first position followed by Trivandrum district, Trichur
district, and Malappuram district respectively in the second, third and fourth position.
Pathanamthitta district, Kottayam district, Calicut district and Kannur district shows
medium performance and they place fifth, sixth, seventh and eight positions in the
performance of FIP. Kollam district, Kasargod district, Aleppy district, Palkkad district,
Wayanad district and Idukki district showed ninth, tenth, eleventh, twelfth, thirteenth
and fourteenth position respectively. Idukki district showed last position in the
performance of FIP in the State of Kerala.

Chapter VII Findings and Recommendations
Effectiveness of Financial Inclusion Programme in Kerala 130
VII.4. the third objective of the study was to find out the factors associated with the
beneficiaries in making use of the financial services to meet their specific needs:
It was answered by giving choices of their prioritisation for choosing the reasons for
using formal financial services and their problems in dealing with the same. Based on
the ranks they have given; the reason for using formal financial service is mainly
because of lower interest. So it has got rank 1. Cost effectiveness, problem handling and
compensation, easy to use and convenience &, operational efficiency, speed of service,
proper sanctioning of loans, better customer service & efficiency and responsiveness
follows subsequently while comparing with informal financial services.
It is true that when compared with the past, bank customers today, are more
knowledgeable, expect quality service and are therefore, more than willing to move from
one service provider to another in search of better service or courtesy or for any other
variety of reasons. Therefore, the researcher analysed whether there is any hindrances
or problems in dealing with formal financial services.
Based on the ranks given by the respondents, the problems in using formal financial
services was mainly because of tedious and cumbersome procedures. So it has got Rank
1. Distance to be travelled, Lack of banker’s interest, Procedural delay &, Operational
efficiency, Non-business-friendly environment, & Limited know-how of mainstream
providers follows subsequently while comparing with informal financial services.
VII.5. Holistic approach on the FIP
The forth objective was to study with a holistic approach of FIP: studying the FIP from
a broader perspective was not much an easy task and therefore, it was found necessary to
develop a model based on the usage perception that is able to include customers’ perceptions
on the effectiveness of FIP in the contemporary banking environment. Based on the same,
following were the detailed findings from the conceptual model:
VII. 5.1. Effect of Accessibility on Usage
Although there have been a number of studies on FIP, much of the research has been
carried out using only the supply side data. Holistic approach can be studied only if the
beneficiaries’ were included. It was found necessary to develop a model that is able to

Chapter VII Findings and Recommendations
Effectiveness of Financial Inclusion Programme in Kerala 131
include customer perceptions of effectiveness of FIP in the contemporary banking
environment. In order to identify the dimensions of FIP, those beneficiaries’ of the
programme consider important, the work was carried out in two stages. First, the two
independent variables were identified for measuring the effectiveness of FIP. It was
found that there are two independent variables namely; Accessibility, and Usage. The
first stage involved preparation of a list of indicators from extensive review of literature.
An item pool was identified through extensive review of literature. Accessibility
perception were measured using five point likert scale. During the second stage out of
the sixteen items identified from literature, eight items come under the accessibility
perception, and eight items under usage perception was extracted after EFA. The scale
was validated by testing the convergent and discriminant validities and the reliability
which were all satisfactory. It was found that the two variables accessibility and usage
does not have multi-colinearity with each other also. The validated scale was
conceptualized as a first order reflective construct, and it was confirmed by doing CFA
too.
The statistical significance of the relationships among independent variables of
effectiveness of financial inclusion programme and its extracted dimensions were of
interest to this study. The path coefficients (β) and p values for the relationships were
positively significant. All paths in the model were significant (p<0.01) and all path
coefficients (β) were also positive indicating that an increase in any of these dimensions
results in an increase in perceived effectiveness of the FIP. It was found that, all the
three fit criteria were met and hence it was assumed that the model had acceptable
predictive and explanatory quality as the data is well represented by the model.
The R squared and Q squared coefficients are provided only for endogenous variables.
The R squared coefficient reflects the percentage of explained variance associated with
the latent variable.
In the first phase of Model independent variable Accessibility perception to the Usage
perception had measured. All paths showed positively significant and the set hypotheses
were also accepted.

Chapter VII Findings and Recommendations
Effectiveness of Financial Inclusion Programme in Kerala 132
VII.5.2. Moderating Effect of Financial Literacy:
In the second phase of conceptual model developed the effect of moderating variable
were tested. The degree of awareness on managing personal finance was measured
under the terminology of financial literacy. Perceptions of beneficiaries’ on financial
literacy were measured using five point likert scale with eleven items. But after doing
EFA, the items were confined to eight items. Then the scale was validated by testing
the convergent and discriminant validities and the reliability which were all satisfactory.
The validated scale was conceptualized as a first order reflective construct, and it was
confirmed by doing CFA too.
It was found out that with moderation, there is increase in R Squared value than without
moderation. It was found that the moderation effect of financial literacy on the
accessibility to usage is significant at 1% level of significance though the β value (0.14)
seemed to be low; the effect of variations explained by moderation is positive and
significant hence supported the hypothesis.
In simple terms, it can be concluded that those who have financial literacy have higher
usage perceptions in the formal financial sector.
VII. 6. Effectiveness of Financial Inclusion Programme in the Holistic Approach:
Under holistic approach the effectiveness of FIP were measured based on the Usage
perception. Effectiveness is measured by using its three dimensions; asset creation,
income generation and employment opportunity. To study the effectiveness of FIP, from
demand side, Beneficiaries were asked to respond before and after performance in the
three economic aspects of impact of FIP. But respondents were not ready to disclose
their income, employment and asset position. They had reported only the change before
and after availing the loan like No change, increase or decrease. Majority of the
respondents reported that, they had positive changes due to accessing credit in the three
aspects of economic impact like their monthly income, days of employment and asset
position and only twelve respondents reported they had decrease and the remaining 87
respondents reported that they have no change on the three aspects (asset creation,
income generation and employment generation) due to credit access. This is the main

Chapter VII Findings and Recommendations
Effectiveness of Financial Inclusion Programme in Kerala 133
reason for going to the development of a model based on the perception of respondents
beyond mere figures.
The conceptual model consists of independent variables, moderating variable and
dependent variable. It was measured using Warp PLS 5. The path of the SEM showed
statistical significance of the relationships among effectiveness of financial inclusion
programme (three dimensions), its independent variable (two dimensions), and
moderating variable (financial literacy). The path coefficients (β) and p values for the
relationships are as shown clarifies that, all paths in the model were significant (p<0.01)
and all path coefficients (β) were also positive indicating that an increase in any of these
dimensions results in an increase in perceived effectiveness of the FIP.
The average path coefficient with moderation is 0.51 and it was 0.6 without moderation
and ARS is 0.54 with moderation and it was 0.53 without moderation. Even though the
difference in value is very small, the variation is due to the effect of moderating variable
i.e., financial literacy. Also the path showed positively significant (positive beta
coefficient). AVIF is 1.28, it also in the prescribed threshold limit. All other parameters
like Tenenhaus GoF (GoF), Statistical suppression ratio (SSR), R-squared contribution
ratio (RSCR), Sympson's paradox ratio (SPR) were same in both the models. i.e., model
with moderation and without moderation.
The programme is effective in Kerala, based on the perception or through results of the
study of holistic approach of FIP. Improvement is necessary in the execution of
programmes by considering changing lifestyle and economic needs of the people.
As far as beneficiaries’ perceptions on Financial Inclusion programme, demographic
profiles and socio economic factors like age, gender, marital status, level of education,
and income level did not explain significant variation. However differences in the
coefficients were observed for different occupation level of respondents in the
effectiveness of FIP. Even then all paths were positively significant at various levels of
occupation.
Individual FII based on the perceptions of respondents as well as FII of Kerala and
selected districts were also found out. The FII of selected Districts of Kerala, Palakkad

Chapter VII Findings and Recommendations
Effectiveness of Financial Inclusion Programme in Kerala 134
(0.61) Shows highest effectiveness based on perception of the respondents, followed by
Kannur (0.56) and Idukki (0.49) showed the least FII. And finally Kerala’s FII was 0.55.
Majority of the respondents belong to middle (40-50) age groups and were male,
majority of the respondents are residing in the rural area (62.3 per cent) possessing SSLC
level education (38.5 percent). It was found out that majority of the respondents (79 per
cent) covered under the study were married people and were (53.3 per cent) agricultural
labourers. These people are more conscious about their future and they are more savers
and needs credit. Most of the respondents were under the monthly income brackets of
Rs. 2500/--Rs. 5000/-, because majority of the respondents were agricultural labourers.
Majority of the respondents (74 percent) had two - three dependence in their family.
And most of the respondents (96 per cent) were residing in their own home. Out of the
selected respondents, majority were the customers of Public sector bank having access
to credit and most of the respondents use their formal accounts for both accessing credit
as well as savings purpose.
VII. 7. Recommendations
Important recommendations to improve FIP based on the findings of the study are as
follows;
VII. 7. 1. Issues regarding the enabling policy like cumbersome legal and regulatory
environment are to be revisited and re write to reduce the access barriers in reaching the
lower bottom of economy.
VII. 7. 2. The programme is structured everywhere in India with equal set of policies in
every state all over the country. As far as Kerala economy is concerned the plan should
revisit based on the economic conditions prevailing in every state. Therefore, policy
should be drawn in such a way to make flexibility based on the preference of the needy
people in fixing the target limits.
VII. 7. 3. Appropriate products and services and better staffing policies can enhance the
FIP significantly in contributing inclusiveness and growth of poor people by offering
reliability, convenience, continuity and flexibility. And thus can improve accessibility
to formal finance reduce debt trap by the private sector financial institutions.

Chapter VII Findings and Recommendations
Effectiveness of Financial Inclusion Programme in Kerala 135
VII. 7. 4 Still Kerala people give first preference for money lenders when they are in
urgency. Therefore policies should be flexible enough to meet the urgent requirements
of financial difficulties.
VII.7.5. Public sector Banks should consider natives as officers in the loan sanctioning
sections of their Banks. It will help for reducing Language barriers and makes easier for
the local people to deal with formal financial services through these steps.
VII.7.6. Improving the economic status is possible through the combined efforts of
Banks and the government by giving subsidies and interest relaxation for the income
generating activities like agriculture, or for any other self-employment programmes.
The above described are the recommendations based on the response from the
beneficiaries as well as personal observations of the researcher.
VII. 8. Chapter Summary
This chapter presented the discussion on the research findings of the study. Findings
were discussed in the light of previous studies in the literature and the research
objectives. To sum up the discussion on the findings of the study and conceptual model
analysis were the base, and the results are discussed from the resulted fit indices. FIP in
Kerala is somewhat a success, but what we need is a regular and adequate follow-up
about the execution of the programme.
The study also revealed the moderation effect of financial literacy interfering between
accessibility perception and Usage perception.
Effectiveness of the FIP from the demand side were measured and reported on the basis
of perceptions of the beneficiaries of the programme.
Recommendations are given based on the findings of the study. Some of the
recommendations were done by the respondents themselves based on their experience
on accessing and using formal financial services.

Chapter VIII Implications, Suggestions & Conclusion
Effectiveness of Financial Inclusion Programme in Kerala 136
Chapter VIII
Implications, Suggestions &
Conclusion
This chapter deals with practical implications for the Policy makers and
Banks based on the findings evolved from the study. The limitations of the
present research are provided which will help the future researchers to
design and structure their research work and aid better understanding about
the effectiveness of the financial inclusion programme (dependant variable)
from a different perspective. The scope for future research also provided in
this chapter as a guideline for the future researchers aiming the same field of
study.
The outcome of this research makes certain that Financial Inclusion Programme (FIP)
leads to economic growth of the poor. Financial literacy interferes between access and
usage of formal financial services.
VIII. 1. Implications from the Study and Suggestions for the Policy Makers
VIII. 1. 1 The study takes into consideration the broader approach of financial inclusion
programme, (economic impact) which recently attracted considerable attention from
public authorities, financial sector stakeholders and academia, to reduce or eliminate the
inefficiencies surrounding the conduct of specific types of financial transactions, and to
increase the efficiency of financial inclusion programme.
VIII. 1. 2. Information about the impact of financial inclusion programme on economic
growth will influence the priority that policy makers and advisors attach to reforming
financial inclusion policies.
VIII. 1. 3. Academicians can consider the study findings for their future studies
connecting financial literacy as a moderator for the access and use of financial inclusion.

Chapter VIII Implications, Suggestions & Conclusion
Effectiveness of Financial Inclusion Programme in Kerala 137
VIII. 1. 4. The study has also analysed various determinants to choose formal financial
services (mainly for credit accessing) of individual beneficiaries. Thus, the study will
be useful for the practitioners for reducing cumbersome procedures of borrowings.
VIII.1.5. The supply side of FIP was also analysed, and reported the practical difficulties
of implementing BC/BF model were mentioned. Thus the policy makers can reframe
the said programmes with suitable instances to the Kerala economy
VIII.2. Suggestions
Based on the study findings, following suggestions can be made:
VIII.2.1. Banking regulators should simplify the procedures in handling loans to
improve credit access to affordable financial services through financial education,
leveraging technology, and generating awareness
VIII.2.2 Efforts are being made by the authorities- especially banking regulators to
improve access to affordable financial services through financial education, leveraging
technology, and generating awareness.
VIII.2.3 Senior managers should spend time regularly in direct, structured conversation
with actual and potential customers.
VIII.2.4 Create feedback loops that Enable information from front-line staff to spread
through the organization. Low-cost technology makes this easier than ever before.
VIII.2.5 Recruit front-line staff members that are able to build empathy with the
customers, whether because they come from similar backgrounds, are screened for this
ability or in some case are even former customers.
VIII.2.6 As the policies and programmes of financial inclusion are same all over India,
many plans were not working in Kerala like BC/ BF model. Therefore, it should be
flexible based on the economic situation, culture, and systems and beliefs prevailing in
each State of India.

Chapter VIII Implications, Suggestions & Conclusion
Effectiveness of Financial Inclusion Programme in Kerala 138
VIII.2.7 Government subsidies in the form of crop loans and relaxation for repayment
should be allowed for those who has occurred loss due to natural calamities like
Droughts, flood and cyclone.
VIII.3. Limitations and Challenges
Effectiveness of financial inclusion from demand side is measured using perceived
values. Better results could be expected if it is based on actual figures rather than
perception. Longitudinal research design would perhaps give more clarity on the
explored factors.
Data collection from the beneficiaries of financial inclusion programme created the next
challenge. The senior officials of concerned Banks had been taken into confidence with
regard to the confidentiality and the strictly academic nature of the study. The Bank
officials were promised a consolidated report of the research findings without referring
to any Bank details.
VIII.4 Scope for Future Research
Future research can be carried out on financial inclusion programme based on the
findings of this study and also can focus on the various facets of the programme like
business correspondent or business facilitator model and its implications with a
longitudinal research design. This research study has not extended fully to the various
dimensions of the Financial Inclusion programme, here financial literacy is considered
as one of the interference between accessibility perception and usage perception, and it
was positively significant. The structural model developed in this research can be
adapted by future researchers.
VIII.5 Conclusion
Banking sector has become a major target market for the poor and weaker sections of
the society. In olden days, it was the platform for the upper sections of the society only.
Reaching to the poor was a great milestone in the history of banking sector and it has a
high potential for the growth of nation also. The study has identified determinants in
accessing and using formal financial services as part of the Financial Inclusion
programme and their hindrances in reaching to the milestone, in the Kerala context. The

Chapter VIII Implications, Suggestions & Conclusion
Effectiveness of Financial Inclusion Programme in Kerala 139
effectiveness of Financial Inclusion programme can be fully achieved through the
synergy of Banks, government and also Community. Financial Literacy acts as an
interference to the accessibility and usage variable provided. Increased levels of
financial literacy positively (increase the Usage perceptions) moderated the path of
accessibility perception and usage perception.
The empirically validated structural models grounded in theory and the findings of the
study could be used by practicing managers of banks and policy makers especially those
who are engaged in the activities of financial inclusion programme related strategies.
The study throws light on the effect of Financial Inclusion Programme and usage
variables on the accessibility and availability of beneficiaries. The findings will help the
Banks and Government to formulate strategies to have long lasting customer
relationships with the poor and weaker sections of the society by considering them as
their target customers and thereby enhancing the profitability of the banking sector.
Banking to the poor is not poor banking.
This research was a very significant learning practice for the researcher. Though the
researcher had dealt with the programme through opening a BSBDA (Basic Savings
Bank Deposit Account) for the last ten years to know the actual practices taken place in
the present scenario of Indian context. This research has brought in new dimensions to
the researcher’s understanding. Also, this work helped to appreciate the role and
application of research methodology in the area of banking and customer services.

I
BIBLIOGRAPHY
Books –
1. CGAP (Consultative Group to Assist the Poor). (2009). Financial Access:
Measuring Access to Financial Services around the World. Washington, DC:
CGAP.
2. Chin, W. W. (1998). The partial least squares approach for structural equation
modeling.in G. A.Marcoulides (Ed.), Modern methods for business research (pp.
295–236). London: Lawrence Erlbaum Associates.
3. Cohen, J., P. Cohen, S. G. West, and L. S. Aiken. 2003. Applied Multiple
Regression/Correlation Analysis for the Behavioural Sciences. 3rd ed. New
Jersey, nJ: Lawrence Erlbaum.
4. Cooper, D. R., & Schindler, P. S. (2003). Business research methods (8th ed.).
New York: McGraw Hill.
5. Creswell, J. W. (2005). Educational research: Planning, conducting, and
evaluating quantitative and qualitative research. Upper Saddle River, New
Jersey: Pearson.
6. Christel Koehler. (2009). Financial inclusion: a sustainable growth factor for
Posts:
Making business strategies efficient and ethical. France: Koïnè Conseil.
7. Dillman, D.A. (2007) Mail and Internet Surveys: The Tailored Design Method,
New York: Wiley.
8. Dillman, D. (2000). Mail and internet surveys: The tailored design method. New
York: John Wiley & Sons.
9. Goldberg, N. (2005). Measuring the Impact of Microfi nance: Taking Stock of
What We Know. Grameen Foundation, (December), 56.
10. Hair, J.F., Hult, G.T.M., Ringle, C.M., Sarstedt, M., 2013. A Primer on Partial
Least Squares Structural Equation Modeling (PLS-SEM). Sage, Thousand Oaks.
11. Hair, J., Black, W., Babin, B., and Anderson, R. (2010). Multivariate data
analysis (7th ed.): Prentice-Hall, Inc. Upper Saddle River, NJ, USA.
12. Hair, J. F., Anderson, R. E., Tatham, R. L., & Black, W. C., (1998). Multivariate
Data Analysis, Prentice-Hall International, New Jersey, USA.

II
13. Hair, J. F. Jr., Anderson, R. E., Tatham, R. L., & Black, W. C. (1996).
Multivariate data analysis (5th ed., pp. 276 - 281). New Jersey: Pearson
Education Inc.
14. Helms, B. (2006). Access for All Consultative Group to Assist the Poor.
Retrieved from building inclusive financial systems / Brigit Helms p. cm.
15. JJFLCC�Trust.�(2010).�‘All�about�financial�literacy�and�financial�inclusion’�first�
edition, Jnana Jyothi financial literacy & credit counseling Trust, Manipal.
16. Joshi,� P,� D.� (2011).� ‘The� financial� inclusion� imperative� and� sustainable�
Approaches’� � first�edition,� � �Cambridge�University�Press� India�Pvt.�Ltd,�New
Delhi.
17. Kanther, P., & Nagabhushan, S. (2012). Workshop on Measuring Financial
Inclusion from the Demand Side. Centre for Advanced Financial Research and
Learning.
18. Karmakar, G, K., Banerjee, D, G., and Mohapatra,� P,� N.� (2011).� ‘Towards
Financial Inclusion in India’.�First�edition,�Sage�Publications�India�Pvt�Ltd,�New�
Delhi.
19. Kochar S., Sekhar, C, R., and Chakrabarty, C, K., and Phatak, D. (2009).
‘Financial inclusion’�Academic�Foundation.��New�Delhi.
20. Malhotra R.N. (1991).�Banking�in�the�1990’s.�Financial�system�of�India.�1:1-4.
21. Neuman, W. L. (2006). Social research methods: Qualitative and quantitative
approaches (6th ed.). Boston: Pearson.
22. Nunnally, J. C. (1978). Psychometric theory. New York: McGraw- Hill.
23. Prahalad,�K,�C.�(2005).�‘The Fortune at the Bottom of the Pyramid: Eradicating
Poverty�through�Profits’,�first�edition, Wharton School.
24. Srinivasan, N. (2012). Microfinance in India; state of the sector report 2011.
SAGE Publications India Pvt. Ltd, New Delhi.
25. United Nations. (2006). Building Inclusive Financial Sectors for Development.
Retrieved from http://books.google.com/books?hl=en&lr=&id=
8Q77wsXKLqYC&oi=fnd&pg=PR3&dq=Building+Inclusive+Financial+Sect
ors+for+Development&ots=Xy58okDQtZ&sig=VD3Nx4WnW6rywMPzkg3H
SZfyO0M
26. Valpy FitzGerald. (2006). Financial Development and Economic Growth: A
Critical View. Lodon: Oxford University.

III
27. Zikmund, W. G. (2003). Business research methods, 8th edition, Cincinnati,
Ohio: Thomson/South-Western.
Journals/Articles/Working papers.
1. Adomako, S., Danso, A., & Ofori Damoah, J. (2016). The moderating influence
of financial literacy on the relationship between access to finance and firm growth
in Ghana. Venture Capital, 18(1), 43–61. https://doi.org/10.1080/
13691066.2015. 1079952
2. Agarwal,�A.�(2008).�“The�need for�financial�inclusion�with�an�Indian�perspective”�
Economic Research, March-3.
3. Agarwal,�A.�(2010).�“Financial�inclusion:�challenges�and�opportunities”,�Skoch
publications, 23rd skoch summit. Academic Foundation, New Delhi.
4. Aghion, P. and P. Howitt. (1992). "A Model of Growth through Creative
Destruction", Econometrica, 60: 323-351.
5. Ahire, S. L., Golhar, D. Y., & Waller, M. A. (1996). Development and validation
of TQM implementation constructs. Decision Sciences, 27 (1), 23-56. DOI:
10.1111/j.1540-5915.1996.tb00842.x.
6. Akudugu, M.A. (2016). Agricultural productivity, credit and farm size nexus in
Africa: a case study of Ghana. Agricultural Finance Review, Vol. 76 No. 2, pp.
288-308.
7. Allan,�A.,�Massu,�M.�&�Svarer,�C.� (2013).�Banking�on�Change�:�Breaking� the�
Barriers to Financial Inclusion (Age Discrimination). CARE International, 1–32.
8. Allen, F., Demirgüç-Kunt, A., Klapper, L., & Pería, M. S. M. (2016). The
foundations of financial inclusion: Understanding ownership and use of formal
accounts. Journal of Financial Intermediation, 27, 1–30. doi:10.1016/j.jfi.
2015.12.003.
9. Amendola, A., Boccia, M., Mele, G., & Sensini, L. (2017). An Assessment of the
Access to Credit-Welfare Nexus: Evidence from Mauritania. International
Journal of Business and Management, 12(9), 77–93. https://doi.org/
10.5539/ijbm.v12n9p77.
10. Ardic, O. P., Imboden, K., & Latortue, A. (2013). Financial Access 2012 Getting
to a More Comprehensive Picture. (6), 1–48. Retrieved from www.cgap.org.

IV
11. Asli Demirguc - Kunt and Klapper, L. (2012). Measuring Financial Inclusion,
Policy Research Working Paper, 6025, World Bank, April.
12. Atkinson, A.� and� Messy,� F.� (2013),� “Promoting� financial� inclusion� through�
financial� education:� OECD/� INFE� evidence,� policies� and� practice”,� OECD�
Working Papers No. 34, Finance, Insurance and Private Pensions, OECD
Publishing, Paris, available at: http://dx.doi.org/10.1787/5k3x z6m88smp-en
(accessed November 2016)
13. Audil Rashid Khaki and Mohi-ud-Din Sangmi. (2017). "Does access to
finance alleviate poverty? A case study of SGSY beneficiaries in Kashmir
Valley", International Journal of Social Economics, Vol. 44 Issue: 8,
pp.1032-1045, https://doi.org/10.1108/IJSE-10-2015-0277.
14. Baba,�Y.� (2012).� “Adopting� a� specific� innovation� type� versus� composition� of�
different� innovation� types”� International Journal of Bank Marketing, Vol.30,
No.3.
15. Badajena,�S,�N�and�Prof.�Gundimeda,�H.�(2010).�“Self-help group bank linkage
model�and�financial�inclusion�in�India”.�Skoch publications, 23rd skoch summit.
Academic Foundation, New Delhi.
16. Bakshi,� P� (2012)� ‘.'Financial Inclusion - BC� /� BF� Model� what’s� new?’� Bank
Quest, 83 (2), April-June, 5-11.
17. Banerjee,�A.� (2010).� � “Inclusive India financial inclusion: A viable option for
inclusive�growth”.�The India economy review, Vol.VIII, quarterly issue, May.
18. Banerjee,�A.,�Duflo,�E.,�Glennerster,�R.�and�Kinnan,�C.�(2010).�“The�miracle�of�
microfinance? Evidence from a Ramdomized Evaluation. MIT. Mimeo.
19. Barajas,�A.,�Chami,�R.�and�Yousefi,�S.R.�(2012),�“The�finance�and�growth�nexus�
re-examined:�do�all�countries�benefit�equally?”,�Working�Paper�IMF.
20. Barik� B,� B.� (2010).� “Financial� inclusion� and� empowerment� of� Indian� rural�
households”.� Skoch Publications. 23rd Skoch Summit. Academic Foundation,
New Delhi. Available at: at http://skoch.in/fir/role%20%financial%20%
inclusion%20 in (Retrieved 1/08/11).
21. Beck, T., & De la Torre, A. (2007). The basic analytics of access to financial
services. Financial Markets, Institutions and Instru- ments. 16(2), 79–117.
doi:10.1111/j.1468-0416.2007.00120.x.

V
22. Beck, T., Demirgüç-Kunt,�A.,�and�Levine,�R.�(2004).�“Finance,�Firm�Size,�and�
Growth”.� Working� Paper� W10983.� Cambridge,� Mass:� National Bureau of
Economic Research.
23. Beck, T., Livine, R. and Loayza N. (2000). Finance and the sources of growth.
Journal of Financial Economics. 58:261-300.
24. Berentsen, A. and Shi, S. (2008). Financial deepening, inflation and economic
growth. available at: www. economicdynamics.org/meetpapers/2008/
paper_673.pdf (accessed 15March 2015).
25. Bergeron, J., and Vachon,� A,� M.� (2008).� “The� effects� of� humour� usage� by�
financial�advisors�in�sales�encounters”�International Journal of Bank Marketing,
Vol.26, No.6. Also available at: www.emeraldinsight.com (Retrieved
08/02/2012).
26. Bertrand,�M.�and�Morse,�A.�(2010),�“Information disclosure, cognitive biases and
payday� borrowing”,� working� paper,� University� of� Chicago,� Booth� School� of�
Business, Chicago, IL.
27. Bhanot, D., Bapat, V., & Bera, S. (2012). Studying financial inclusion in north‐
east India. International Journal of Bank Marketing, 30(6), 465–484.
https://doi.org/10.1108/02652321211262221.
28. Bihari,�S,�C.�(2010).�“Financial�literacy- the�key�to�financial�deepening”.�Bank
Quest, Vol-8, No-4, October-December.
29. Birkenmaier,� J.,� Curley,� J.� and� Kelly,� P.� (2012).� “Credit� building in IDA
programs:� early� findings� of� a� longitudinal� study”,� Research� on� Social� Work�
Practice, Vol. 22 No. 6, pp. 605-614..
30. Bisht, S. S., Mishra, V., & Fuloria, S. (2010). Measuring accessibility for
inclusive development: A census based index. Social Indicators Research, 98(1),
167–181. https://doi.org/10.1007/s11205-009-9537-3.
31. Bongomin, G. O. C., Munene, J. C., Ntayi, J. M., & Malinga, C. A. (2018).
Collective action among rural poor. International Journal of Bank Marketing,
Vol. 37, pp. 20–43. https://doi.org/10.1108/ijbm-08-2017-0174.
32. Boshara,�R.�(2005),�“Individual�development�accounts:�policies�to�build�savings�
and�assets�for�the�poor”,�policy�brief,�Welfare�Reforms�and�Beyond�No.�32,�The�
Brookings Institution, 1775 Massachusetts Ave., N.W. Washington, DC 20036,
Policy Brief No. 32.

VI
33. Brian Barry. (2010). The Normative Theory of Social Exclusion: Perspectives
from Political Philosophy. UK: UCL Academe.
34. Bruhn,�M.�and�Love,�I.�(2014),�“The�real�impact�of�improved�access�to�finance:�
evidence�from�Mexico”,�The Journal of Finance, Vol. 69 No. 3, pp. 1347-137
35. Campell, D. T., & Fiske, D. W. (1959). Convergent and discriminant validation
by the multi trait multi method matrix. Psychological Bulletin, 56, 81-105.
36. Candiya Bongomin, G. O., Munene, J. C., Ntayi, J. M., & Malinga, C. A. (2017).
Financial literacy in emerging economies. Managerial Finance, 43(12), 1310–
1331. https://doi.org/10.1108/mf-04-2017-0117.
37. Cenfetelli, T.R & Bassellier. (2009). Interpretation of Formative Measurement in
Information Systems Research. MIS Quarterly 33(4), 689-707.
https://www.jstor.org/stable/20650323.
38. CGAP�(2009).�“Financial�access�Measuring�Access�to�Financial�Services around
the� World.”� October� 2009.� Available� at� http://www.gsma.com/
mobilefordevelopment/wp-content/uploads/2012/06/fa2009_6.pdf (accessed 20
March 2015).
39. Chakrabarty� K.C� (2011),� “Financial� Inclusion� and� Banks:� Issues� and�
Perspectives”,�RBI�Bulletin, November, 2011.
40. Chakravarty,� S.� R.,� &� Pal,� R.� (2010).� Measuring� Financial� Inclusion�:� An�
Axiomatic Approach. Indira Gandhi Institute of Development Research Working
Paper WP-2010-003, (March).
41. Chambers, C. L. (2004). Financial Exclusion and Banking Regulation in the
United Kingdom: A Template Analysis. Bournemouth University.
42. Chang,�Y,�Z.,�Chan,�J.,�and�Leck,�L,�S.�(1997).�“Management�of�market�quality�
for�correspondent�banking�products”.��International Journal of Bank Marketing,
Vol.15, No.1.
43. Chatterjee�S.�(2011).�“The�Road�map�to�financial�inclusion”.�The India Economic
Review, Vol.VIII, quarterly issue 16th May-15th Aug.
44. Chattopadhyay,�S.K.�(2011),�“Financial�inclusion�in�India:�a�case�study�of�West�
Bengal”,�RBI�Working�Paper�Series�No.�8,�Department�of�Economic�and�Policy�
Research.
45. Chavan, P. (2007). Access to bank credit: Implications for dalit rural households.
Economic and Political Weekly, 42(31), 3219–3224. Retrieved from

VII
http://www.scopus.com/inward/record.url?eid=2-s2.0-
74949105283&partnerID=40&md5=afc22a94dd3b6fb5b3438195898bad1b
46. Chavan,� P� and� Birajdar,�B.� (2008).� “Micro� finance� and� financial� inclusion� of�
women:�An�evaluation”.�RBI occasional paper, vol-30. No-2.
47. Chen, Z., & Jin, M. (2017). Financial Inclusion in China: Use of Credit. Journal
of Family and Economic Issues, 0(0), 1–13. https://doi.org/10.1007/s10834-017-
9531-x
48. Cheriyan,� G.� (2011).� “Financial� inclusion� and� inclusive� growth”.� The India
Economic Review, Vol.VIII, quarterly issue 16th May-15th Aug.
49. Chirkos, A. Y. (2014). Impact of microfinance on living standards, empowerment
and poverty alleviation of poor people in Ethiopia. Journal of Finance and
Accounting, 5, 43–67.
50. Ciaian,� P.,� Fałkowski,� J.� and� Kancs,� D.A.� (2012).� Access� to� credit,� factor�
allocation and farm productivity: evidence from the CEE transition economies.
Agricultural Finance Review, Vol. 72 No. 1, pp. 22-4.
51. Clark,�G.,�L.�C.�Xu�and�H.�F.�Zou.�(2003),�“Finance and income inequality: Test
of�alternative�theories”.�World�Bank�Policy�Research�Working�Paper�#�2984.
52. Cohen,�M.�and�Nelson,�C.�(2011),�“Financial�literacy:�a�step�for�clients�towards�
financial�inclusion”,�draft�paper,�Washington,�DC.
53. Cole, S & Fernando, N. (2008). Assessing the importance of financial literacy.
ADB Finance for the Poor 9 (2), 1-6, 2008. 63. https://www.sciencedirect.com/
science/article/pii/S0970389615000956.
54. Coulter, K & Coulter, A, R. (2002). Determinants of Trust in a Service Provider:
The Moderating Role of Length of Relationship. Journal of Services
Marketing 16(1):35-50. DOI: 10.1108/08876040210419406
55. Coughlan, J., Shale,E., and Dyson,� R.� (2010).� “Including� the� customer� in�
efficiency analysis-Evidence of a hybrid relational-transactional� Approach”.��
International Journal of Bank Marketing, Vol.28, No.2.
56. Cronbach, L. J. (1951). Coefficient Alpha and the Internal Structures of Tests.
sychometrika, 16(3), 297-333.
57. Cull, R., & Scott, K. (2010). Measuring household usage of financial services:
Does it matter how or whom you ask? World Bank Economic Review, 24(2), 199–
233. https://doi.org/10.1093/wber/lhq004.

VIII
58. Das, T. K. (2013). Financial Inclusion and Regulation in India. Sambalpur
University, Jyoti Vihar, Department of Business Administration,Sambalpur
University. sambalpur, Odisha. Retrieved 12 28, 2013, from
http://papers.ssrn.com/sol3/papers.cfm?abstract_id=2287414
59. Dasarathi, M. (2011).� “Micro� Finance� Institutions� in� India- Their role and
relevance� in� Financial� Inclusion”.� � Bank Quest, Vol-82, No-4, October-
December.
60. De Aghion B.A. and J. Morduch, 2005, The Economics of Microfinance, MIT
Press, Cam- bridge, Massachusetts and London, England.
61. del Mar Garcia de los Salmones, M., Perez, A., & Rodriguez del Bosque, I.
(2009). The social role of financial companies as a determinant of consumer
behaviour. International Journal of Bank Marketing, 27(6), 467–485.
https://doi.org/10.1108/02652320910988339.
62. Demirguc-Kunt,� Asli� and� Leora� Klapper.� (2013).� “Measuring� Financial�
Inclusion:� The� Global� Findex� Database.”� Brookings Papers on Economic
Activity.
63. Divya, K. H. (2013). A Study On Impact Of Financial Inclusion With Reference
To Daily Wage Earners. Journal of Business Management & Social Sciences
Research, 2(6), 85–92.
64. Dupas, P. and Robinson, J.� (2009).� ‘Savings� constraints� and� microenterprise�
development:�Evidence�from�a�field�Experiment�in�Kenya’.�National Bureau of
Economic Research Working Paper 14693.
65. Dustmann,�C.�and�Kirchkamp,�O.�(2002).�‘The�optimal�migration�duration�and�
activity�choice�after�remigration’.�Journal of Development Economics, Vol. 67,
No.2.
66. Dusuki,� W,� A.� (2008).� “Banking� for� the� poor:� the� role� of� Islamic� banking� in�
microfinance initiatives”,�Humanomics, Vol 24, No.1.
67. Emerging kerala. (2013). Kerala Calling Special Edition (p. 48).
Thiruvananthapurm: KSIDC. Retrieved from www.kerala.gov.in/docs/
publication/2012/kc/ekkcspecial.pd.
68. Ellmer, F. (2012). Improving livelihood of rural women through encome
generation activity in bangladesh. .pp.1-27.

IX
69. Falahati, L., Sabri, M. F., & Paim, L. H. J. (2012). Assessment a model of
financial satisfaction predictors: Examining the mediate effect of financial
behaviour and financial strain. World Applied Sciences Journal, 20(2), 190–197.
https://doi.org/10.5829/idosi.wasj.2012.20.02.1832.
70. Farrington, J., & Farrington, C. (2005). Rural accessibility, social inclusion and
social justice: Towards conceptualization. Journal of Transport Geography,
73(1), 1-12.
71. FICC, & Indian Chamber of Commerce. (2012). promoting financial inclusion.
72. Fitzgerald, V., 2006. Financial Development and Economic Growth. Background
paper for World Economic and Social Survey 2006.
73. Ford�Foundation� (2004),� “Asset� building� for� social� change:�pathways� to� large�
scale�impact”,�available�at:�www.fordfound.org�(accessed�5th February 2015)
74. Fornell, C., Johnson, M. D., Anderson, E.W., Cha, J., & Bryant, B.E. (1996). The
American customer satisfaction index: nature, purpose, and findings. Journal of
Marketing, 60 (4), 7-18
75. Fornell, C., & Larcker, D.F. (1981). Evaluating structural equation models with
unobservable variables and measurement error. Journal of Marketing Research,
18, 39-50.
76. Fornell, C., & Bookstein, F. L. (1982). Two structural equations models: LISREL
and PLS applied to consumer exit-voice theory. Journal of Marketing Research,
19(4), 440-452.
77. Fornell, C., & Wernerfelt, B. (1987). Defensive marketing strategy by customer
complaint management: A theoretical analysis. Journal of Marketing Research,
24, 337–346.
78. Friedline, T., & West, S. (2016). Financial Education is not Enough: Millennials
May Need Financial Capability to Demonstrate Healthier Financial Behaviors.
Journal of Family and Economic Issues, 37(4), 649–671.
https://doi.org/10.1007/s10834-015-9475-y
79. Frost & Suvillian, NCR. (2009). Bringing Financial Services to The Masses,
Dayton, Ohio
80. Funfgeld, B., and Wang,� M.� (2009).� “Attitudes� and� Behavior� in� Every� day�
Finance:�Evidence�from�Switzerland”.�International Journal of Bank Marketing,
Vol.27, No.2.

X
81. Fuller,� D.,� Affleck,� A.,� Dodds,� L.,� and� Mellor,� M.� (2006).� “Consulting� the�
community-Advancing� financial� inclusion� in� Newcastle� upon� Tyne,� UK”,�
International Journal of Sociology and Social Policy, Vol. 26 No. 5/6.
82. Fullerton, G. (2003). When does commitment lead to loyalty? Journal of Service
Research, 5(4), 333-345.
83. Gefen, D. and Straub,�D.�(2000),�“The�relative�importance�of�perceived�ease-of-
use in IS adoption: a study of e-commerce�adoption”,�Journal�of�the�Association�
for Information Systems, Vol. 1 No. 8, pp. 1-30.
84. Gill,�S,�A.,�Flaschner,�B�A.,�and�Shachar,�M.�(2006).�“Factors�that affect the trust
of� business� clients� in� their� banks.”� International Journal of Bank Marketing
Volume: 24 No.6.
85. Goel, N and Madan, P. (2019). Benchmarking financial inclusion for women
entrepreneurship – a study of Uttarakhand state of India. Benchmarking: An
International Journal, Vol. 26 Issue: 1, pp.160-175, https://doi.org/
10.1108/BIJ-01-2018-0023
86. Gouws,� D.� G.,� &� Shuttleworth,� C.� C.� (2009).� Financial� literacy�:� an� interface�
between financial information and decision-makers in organisations. Southern
African Business Review, 13(2), 141–165.
87. Grades, E., & Agrarwissenschaften, D. Der. (2007). Zentrum für
Entwicklungsforschung ( zef ) the impact of microfinance on rural poor
households’�income�and�vulnerability�to�poverty�: case study of makueni district,
kenya Diese Dissertation ist auf dem Hochschulschriftenserver der ULB Bonn
http://hss.ul.
88. Haenlein, M., & Kaplan, A. M. (2004). A Beginner's Guide to Partial Least
Squares Analysis. Understanding Statistics, 3(4), 283-297. http://dx.doi.org/
10.1207/
89. Handoo J. (2012) 'Beyond Hoopla: Simply Financial Inclusion’�Bank�Quest, 83
(2), April-June, 47-49
90. Handoo,�J.�(2010).�“Financial�inclusion�in�India:�Integration�of�technology,�policy�
and�market�at�the�bottom�of�the�pyramid”.
91. Hannig, A., & Jansen, S. (2010). Financial inclusion and financial stability:
current policy issues. In ADBI working paper series. Retrieved from
http://www.adbi.org/working-

XI
paper/2010/12/21/4272.financial.inclusion.stability. policy.issues/.
92. Hersi, W. M. (2009). The role of Islamic finance in tackling financial exclusion
in the UK . Durham University. Durham E-Theses. Retrieved 2013, from
http://etheses.dur.ac.uk/23/
93. Hirschler, S. (2010). Migrants and financial inclusion. 1–16.
94. Honohan,�P.,�(2004a).�“Financial�development,�growth�and�poverty:�How�close�
are� the� links?”.� Policy� Research� Working� Paper� No.� 3203.� World� Bank:�
Washington, DC in
95. Goodhart, C. (2004). Financial Development and Economic Growth: Explaining
the Links. Palgrave, London.
96. Hung,�A.,�Parker,�A.�and�Yoong,�J.�(2009),�“Defining�and�measuring�financial�
literacy”,�RAND�Working�Paper�No.�WR-708
97. Hunter, C, W., and Hao, J. (1997). "A Test of the Impact of Financial Innovation
on Economic Growth". Managerial Finance, Vol. 23, No.11.
98. Inoue, T. (2019). Financial inclusion and poverty reduction in India. Journal of
Financial Economic Policy, Vol. 11, pp. 21–33. https://doi.org/10.1108/JFEP-01-
2018-0012
99. Isern, J. and Porteous, D., (2005). Commercial Banks and Microfinance:
Evolving Models of Success. Washington, DC: CGAP, (Focus Note No.28).
100. Jan-Willem V.P., & Willem, A. (2001). Confirmatory Analysis of Exploratively
obtained Factor Structures. Educational and Psychological Measurement, 61(5),
777-792
101. Joo, S. H., & Grable, J. E. (2004). An exploratory framework of the determinants
of financial satisfaction. Journal of Family and Economic Issues, 25(1), 25–50.
https://doi.org/10.1023/B:JEEI.0000016722.37994.9f
102. Joseph� S.� (2011).� “Financial� inclusion� involving� the� uninvolved� through�
product,� channel� and� marketing� information”.� The India Economic Review,
Vol.VIII, quarterly issue 16th May-15th Aug.
103.Kabeer N. (2001). Conflicts over credit: re-evaluating the empowerment
potential of loans to women in rural Bangladesh, conceptualising and evaluating
empowerment. World Development 29(1): 63-84.
104.Kablana, A. S. K., & Chhikara, K. S. (2013). A Theoretical and Quantitative
Analysis of Financial Inclusion and Economic Growth. Management and Labour

XII
Studies, 38(1–2), 103–133. https://doi.org/10.1177/0258042X13498009.
105.Kamal, M. M. (1999). Measuring Transformation: Assessing and Improving the
Impact of Microcredit, Impact Evaluation Mechanism of the Association for
Social Advancement. (ASA) in Bangladesh.
106.Kamath,�R.,�and�Sandstorm,�M.�(2010).�“Can�rural�India�get�access�to�financial�
services?”.�Economics and political weekly Vol XLV No-37, September.
107.Kanther, P., & Nagabhushan, S. (2012). Workshop on Measuring Financial
Inclusion from the Demand Side. Centre for Advanced Financial Research and
Learning.
108.Kaplan, L., Szybillo, G. J., & Jacoby, J. (1974). Components of Perceived Risk
in Product Purchase: A Cross-Validation. Journal of Applied Psychology, 59,
287-291.
109.Kaplan, R.M., & Scauzzo, D. P. (1993). Psychological Testing: Principles,
applications and issues, Pacific Grove, CA.
110.Kazi, R. (2011). An introduction to SEM techniques: For beginners.
Prabandhan: Indian Journal of Management, 4 (11), 29-43.
111. Kennedy, B. P. (2013). The theory of planned behavior and financial literacy:
A predictive model for credit card debt? ProQuest Dissertations and Theses, 84.
https://doi.org/Paper 480.
112.Kempson, E. and Whyley, C. (1999), Kept out or Opted out? Understanding and
Combating Financial Exclusion, the Policy Press, Bristol.
113.Khandker,� S.� (2005).� “Microfinance� and� poverty:� Evidence� using� panel� data�
from�Bangladesh”.�World Bank Economic Review 19.
114.Khandker, S.R. and O.H. Chowdhury. (1995). Targeted Credit Programs and
Rural Poverty in Bangladesh. World Bank, Washington, W.C.
115.Kibua, T, N. (2007). “Poverty�reduction�through�enhanced�access� to�financial�
services:� case� studies� of� Botswana,� Kenya� and� Namibia”. IPAR Occasional
Paper Series, occasional paper No-010/2007.
116.Kock, N. (2012). WarpPLS 3.0 User Manual. ScriptWarp Systems, Laredo,
Texas. Retrieved online on June 5, 2016 from http://www.scriptwarp
com/warppls/UserManual.pdf.
117.Kumar, N. (2013). Financial inclusion and its determinants: evidence from India.
Journal of Financial Economic Policy, 5(1), 4–19. https://doi.org/

XIII
10.1108/17576381311317754
118.Lal, T. (2018). Impact of financial inclusion on poverty alleviation through
cooperative banks. International Journal of Social Economics, 45(5), 807–827.
https://doi.org/10.1108/IJSE-05-2017-0194.
119.Laukkanen,� T.,� Neto,� F.� B.� L.,� Gallego,� M.� P.,� &Cruz,� P.� (2010).� ‘Mobile�
banking� rollout� in� emerging� markets:� evidence� from� Brazil’.� International
Journal of Bank Marketing. 28 (5), 2010, 342-371.
120.Lederle. (2009). Exploring the impacts of improved Financial Inclusion on the
lives of disadvantaged people. Heriot-Watt University, School of the Built
Environment. Retrieved 2012
121.Legge, K., Y. Hartfree, B. Stafford, M. Magadi, J. Beckhelling, L. Nyhagen
Predelli and S. Middleton (2006). The Social Fund: Current Role and Future
Direction. York, Joseph Rowntree Foundation.
122.Levine, R., & Levine, R. (2004). Finance and growth: theory and evidence.
NBER Working paper series.
123.Leyshon,�A.�and�Thrift,�N.�(1996).�“Financial�exclusion�and�shifting�boundaries�
of the financial�system”,�Environment�and�Planning�A,�Vol.�28�No.�7,�pp.�1150-
6.
124.Lewis,�K,�N.,�Palmer,�A.,�and�Moll,�A.�(2010).�“Predicting�young�consumers'�
take�up�of�mobile�banking�services”.�International Journal of Bank Marketing,
Vol.28, No.5.
125.Lusardi, A. and� Mitchell,� O.S.� (2011),� “Financial� literacy� and� retirement�
planning�in�the�United�States”,�CeRP�Working�Paper�No.�107,�pp.�1-27
126.Mamman, A. (2013). Analysis of the Role of Microfinance Banks in Financing
of Micro Enterprises in Kaduna State, Nigeria. International Journal of
Economics, Business and Finance, 1(11), 420–430. Retrieved from
http://ijebf.com/.
127.Masoud, N.and Hardaker,G. (2012). The impact of financial development on
economic growth: empirical analysis of emerging market countries. Studies in
Economics and Finance, Vol. 29 No. 3, pp. 148-173.
128.Megicks,�P.,�Mishra,�A.,�and�Lean,�J.�(2005).�“Enhancing�microfinance�outreach�
through market-oriented new service development in Indian regional rural
banks”.��International Journal of Bank Marketing, Vol.23, No.6.

XIV
129.Mehrotra, N. Puhashendhi, V., Nair, G. and Sahoo, B. B. (2009). Financial
inclusion - An overview. Occasional Paper-48. Department of Economic
Analysis and Research, National Bank.
130.Mehta, J. S., Ber, S., Bhanot, D., & Bapat, V. (2012). Studying financial
inclusion in north-east India. International Journal of Bank Marketing, 30 (6),
465-484.
131.Miller,�M.,�and�Lee,�R,�N.�(2012).�“Influencing�positive�financial�behaviours:�
the�social�marketing�solution”.�Journal of social Marketing, Volume: 2. Available
at: www.emeraldinsight.com(visited on 09/02/2012).
132.Ministry, O. (2011). Financial Literacy, Grades 9–12: Scope and Sequence of
Expectations, 2011. Literacy.
133.Mohan,� R.� (2006).� � “Agricultural� Credit� in� India:� Status,� Issues� and� Future�
Agenda”.�Economic and Political Weekly (March).
134.Mor, N., & Anand, B. (2013). Inclusive financial systems:Some Principles and
a Case Design Study. 42(13).
135. Moser, C., & Felton, A. (2007). The Construction of an Asset Index Measuring
Asset Accumulation in Ecuador Caroline Moser and Andrew Felton CPRC
Working Paper 87 ISBN 1-904049-86-9. Development, (July). Retrieved from
http://www.mendeley.com/research/construction-asset-index-measuring-asset-
accumulation-ecuador-caroline-moser-andrew-felton-cprc-working-paper-87-
isbn-1904049869/
136.Mosley, P. (2001). Microfinance and poverty in Bolivia. Journal of Development
Studies, 37(4), 101–132.
137.Montgomery, H., & Weiss, J. (2011). Can commercially oriented microfinance
help meet the millennium development goals? Evidence from Pakistan. World
Development, 39(1), 87–10.
138.Mugabi, N. (2010). Micro-credit utilization and its impact on household
income�:�A� comparative� study� of� rural� and� urban� areas� in� Iganga� district� By�
Supervisor�:�Dr . State Andrew Ellias A dissertation submitted to the Department
of Sociology , Faculty of Social Sciences in . (September).
139.Nachiket, M., & Anand,B. (2013). Inclusive financial systems:Some Principles and a Case Design Study. 42(13).
140.Narendra, V. (2012) 'Empowering MSMEs for financial inclusion-Role of
Banks' Bank Quest, 83 (2), April-June, 24-29.

XV
141.Navajas, Sergio. Meyer, Richard. Gonzalez, Claudio. V. Schreiner, Mark. and
Rodriguez,�Jorge.�M.�1999.�“Micro-credit and the Poorest of the Poor: Theory
and�Evidence�from�Bolivia.”�World�Development�28(2):�333-346.
142.Ndebbio (2004). Financial deepening, economic growth and development:
Evidence from selected sub- Saharan African countries. African Economic
Research Consortium (AERC) Research Paper 142, Nairobi, Kenya.
143.Newman,�K.,�Cowling,�A.,�and�Leigh,�S.�(1998).�“Case�study:�service�quality,�
business process re-engineering� and� human� resources:� a� case� in� point?”�
International Journal of Bank Marketing, Vol.16, No.6.
144.Nye,�P.,�&�Hillyard,�C.�(2013).�Personal�Financial�Behavior�:�The�Influence�of�
Quantitative� Literacy� and� Material� Values� Personal� Financial� Behavior�:� The�
Influence of Quantitative Literacy and. Numeracy, 6(1), Article 3.
https://doi.org/http://dx.doi.org/10.5038/1936-4660.6.1.3
145.Njoroge,� C.W.� and� Gathungu,� J.M.� (2013),� “The� effect� of� entrepreneurial�
education and training on development of small and medium size enterprises in
Githunguri District – KENYA”, International Journal ofEducation and Research,
Vol. 1 No. 8, pp. 1-22.
146.Nurkse R. (2010).��“Financial�Inclusion�-Widening�the�Bottom�of�the�Pyramid”.
Skoch publications, 23rd skoch summit. Academic Foundation, New Delhi.
147.Obayashi, S., Bianchi, L. J., & Song, W. O. (2003). Reliability and Validity of
Nutrition Knowledge, Social-Psychological Factors, and Food Label Use Scales
from the 1995 Diet and Health Knowledge Survey. Journal of Nutrition
Education and Behavior, 35(2), 83-92.
148.OECD. (2013). OECD / INFE Toolkit to measure financial literacy and
Financial Inclusion: Guidance, Core Questionnaire and Supplementary
Questions. Financial Affairs Division, (July), 1–68.
149.OECD�(2012).�“Reducing�income�inequality�while�boosting�economic�growth:�
Can� it� be� done?”� Economic Policy Reforms Going for Growth, OECD
Publishing. Available at: https://www.oecd.org/eco/growth/49421421.pdf
(accessed 10 June 2015).
150. OECD (Organisation for Economic Cooperation and Development). 2005.
Improving Financial Literacy: Analysis of Issues and Policies. France: OECD
Publishing. Orton, L. 2007. Financial Literacy.

XVI
151.Okello Candiya Bongomin, G., Mpeera Ntayi, J., Munene, J. C., & Akol
Malinga, C. (2017). The relationship between access to finance and growth of
SMEs in developing economies: Financial literacy as a moderator. Review of
International Business and Strategy, 27(4), 520–538.
https://doi.org/10.1108/RIBS-04-2017-0037.
152.Onaolapo, A. A., & Odetayo, T. A. (2012). Financial Inclusion as Tools for
Survival� in� Globally� Competitive� Environment�:� Lessons� for� Nigerian�
Microfinance Banks. American Journal of Business and Management, 1(4), 241–
247.
153.Pal, R., & Pal, R. (2012). Income Related Inequality in Financial Inclusion and
Role�of�Banks�:�Evidence on Financial Exclusion in India. Indira Gandhi Institute
of Development Research, Mumbai, (June).
154.Peachy,�S.�and�Roe,�A.�(2004).�“Access�to�Finance� - What Does it Mean and
How�Do�Savings�Bank�Foster�Access?”�Brussels:�World�Savings�Bank�Institute.
Skoch publications, 23rd skoch summit. Academic Foundation. New Delhi.
155.Peevers,�G.,�Douglas,�G.,�Marshall,�D.,�and�Jack,�A,�M.�(2011).�“On�the�role�of�
SMS� for� transaction� confirmation�with� IVR� telephone�banking”.� International
Journal of Bank Marketing, Vol.29, No.3.
156.Peterson,� T,� R.,� and� Hermans,� M,� C.� (2004).� “The� communication� of� social�
responsibility�by�US�banks”.��International Journal of Bank Marketing, Vol. 22,
No.3.
157.Petter, S., Straub, D., and Rai, A. (2007). Specifying formative constructs in
information systems research. MIS Quarterly 31 (4), 623-656.
158.Piprek, G, Dlamini, P. & Coetzee, G. (2004). FinMark Trust: Financial Literacy
Scoping Study and Strategy Project. ECI Africa Consulting, Woodmead.
159.Pirie, G. (1981). The possibility and potential of public policy on accessibility.
Transportation Research, 15A(5), 377-381
160.Posner, M. I. (1980). Orienting of attention. Quarterly. Journal of Experimental
Psychology, 41A, 19–45.
161.Pradhan, N. C. (2013). Persistence of Informal Credit in Rural India: Evidence
from�‘All-India�Debt�and�Investment�Survey’�and�Beyond. (April), 1–23.
162.Puhazhendhi,�V.�(2012)�‘Financial Inclusion-Forward step for Micro Finance
Sector' Bank Quest, 83 (2), April-June, 30-36

XVII
163.Püschel,J.,�Mazzon,A,J.,�Mauro,J.,�and�Hernandez,�C.�(2010).“Mobile�banking:�
proposition� of� an� integrated� adoption� intention� framework”.� International
Journal of Bank Marketing, Vol.28, No.5.
164.Rajan, R. G. and L. Zingales. (2003a). Saving Capitalism from the Capitalists,
New York, NY: Random. Random House.
165.Rai,� A� and� Saha,� A.� (2010).� “Financial� inclusion� in� Karnataka- A study of
operationalisation of no-frills�accounts”. Skoch publications, 23rd skoch summit.
Academic Foundation. New Delhi.
166.Ramji,M. (2009). Financial Inclusion in Gulbarga: Finding usage in access.
CMF-IFMR Working Paper.
167.Rangappa,� K.B.,� Bai,� R.� and� Sandesh,� A.L.� (2009),� “SHG-Bank linkage
programme and financial inclusion: rural household study in Davangere district
of Karnataka”,�The�microfinance�Review,�Vol.�1�No.�1,�pp.�171-82.
168.Rao,� N,� N,D,S,V.� (2010).� “Financial� inclusion- Banker’s� perspective”.� Bank
Quest, Vol-8, No-4, October-December.
169.Regan, S. and W. Paxton. (2003). Beyond Bank Accounts: Full Financial
Inclusion. London, Citizens Advice Bureau and Institute for Public Policy
Research.
170.Rao�S,�K.�(2010).�“Nationalisation�of�banks�– an�anchor�for�financial�inclusion”.��
Bank Quest, Vol-8, No-3, July-September.
171.Reddy, K. R. D. (2012). 'Financial Inclusion: Road Ahead' Bank Quest, 83 (2),
Apri-June, 40-46.
172.Rios�E,�R.,�&�Riquelme�E,�H�(2010).�‘The�moderating�effect�of�gender�in�the�
adoption�of�mobile�banking.’� International�Journal�of�Bank�Marketing.� 28 (5),
2010, 328-341
173.Roubini,� N.� and� Bilodeau,� J.� (2008)� “The� Financial Development Index:
Assessing�the�World’sFinancial�Systems”�in�the�Financial�Development�Report�
2008, World Economic Forum, Geneva, Switzerland.
174.Rousseau, P.L. and Wachtel, P. (2005). Economic growth and financial depth:
is the relationship extinct already?. available at SSRN 825744.
175.Rusu,�V.�(2017).�Financial�Inclusion�and�Stability�:�Linkages�Among�Financial�
Development and Economic Growth. Journal of Financial Innovation, Also
available at ibrif.org

XVIII
176.SA-DHAN. (2012). Financial Inclusion: A study on the efficacy of Banking
Correspondent Model. New Delhi: Sa Dhan. Retrieved december 15, 2013, from
http://www.microfinancegateway.org/p/site/m/template.rc/1.1.16372/
177.Salmones,�G,�M,�M.,�Perez,�A.,�and�Bosque,�R,�I.�(2009).��“The�social role of
financial� companies� as� a� determinant� of� consumer� behavior”. International
Journal of Bank Marketing, Vol.27, No.6.
178.Sangwan,� S.S.� (2008).� “Financial� inclusion� and� self-help� groups”,� paper�
presented at Conference on Financial Inclusion at IGIDR, Mumbai, available at:
www.nabard.org/databank/IARD%20Web/csidfiles/Financial%20lnclusion%20
and%20SHGs.pdf (accessed 17 August 2011)
179.Sarma,�M.,�and�Pais,�J.�(2010).�“Financial�inclusion�and�Development”.�Journal
of international development, Vol. 23.
180.Sarma, M. (2008). Index of Financial Inclusion. Indian Council for Research on
International Economic Relations Working Paper No 215, (215), 1–26.
181.Saunders,� G,� S.,� Abratt,� R.,� and� Bendixen,� M.� (2007).� “Banking� patronage
motives� of� the� urban� informal� poor”.� Journal of Services Marketing, Vol 21,
No.1.
182.Shankar,�S.�(2013).�Financial�Inclusion�in�India�:�Do�Microfinance�Institutions�
Address� Access� Barriers�?� Financial� Inclusion�:� Importance� and� Common�
Barriers. ACRN Journal of Entrepreneursip Perspectives, 2(1), 60–74.
183.Sharma,� P.,� and� Reddy,� M.� (2003).� “Empirical� modelling� of� bank� market�
exclusion”,�International Journal of Bank Marketing, Vol. 21 No.6/7.
184.Shahinpoor,� N.� (2009).� “The� link� between� Islamic� banking� and� micro-
financing”,�International Journal of Social Economics, Vol.36, No.10.
185.Sinclair S. P. (2001). Financial exclusion: An introductory survey. Report of
Centre for Research in Socially Inclusive Services, Heriot-Watt University,
Edinburgh.
186.Srinivasan, N (2012) 'Financial Inclusion framework-is it inclusive?' Bank
Quest, 83 (2), April-June, 37-39.
187.Stafford,�D.,�and�King,�S.� (1983).�“Banking�on� the�Unbanked”,� International
Journal of Bank Marketing, Vol 1, No.2.

XIX
188.Stanley,�E.,�Tyler,�K.�(2002).�“The�problem�of�time�in�financial�services�business�
markets:�a�conceptual�approach”.�International Journal of Bank Marketing, Vol:
20, No.5.
189.Stewart, R., Rooyen, C. van, Korth, M., Chereni, A., Silva, N. R. Da, & Wet, T.
de. (2012). Do Micro-credit, Micro-savings and Micro-leasing Serve as Effective
Financial Inclusion Interventions Enabling Poor People, and Especially Women,
to Engage in Meaningful Economic Opportunities in Low- and Middle-income
Countries? A Systematic Review of th. In EPPI-Centre, Social Science Research
Unit. Retrieved from http://r4d.dfid.gov.uk/pdf/outputs/systematicReviews/
Microcredit 2012 Stewart Report.pdf
190.Sumanjeet.� (2010).� “Accelerating� financial� inclusion� through� mobile� phone�
technology:� Opportunities,� challenges� and� policy� option� for� India”. Skoch
publications, 23rd skoch summit. Academic Foundation. New Delhi.
191.Swamy, V. (2014). Financial Inclusion, Gender Dimension, and Economic
Impact on Poor Households. World Development, 56, 1–15.
https://doi.org/10.1016/j.worlddev.2013.10.019.
192.Swamy,�V�and�Vijayalakshmi.�(2010).�“Role�of�financial�inclusion�for�inclusive�
growth in India- issues�and�challenges”.�Academic�Foundation.��New Delhi.
193.Tanksale, V. M. (2012) 'Financial Inclusion and FLCC’�Bank Quest, 83 (2),
April-June, 19-23.
194.Tapanakornvut, A. (2012). The�Future�of�Microfinance�Institutions�:�Fostering�
Financial�Inclusion�for�the�World�’�s�Poor. Wesleyan University.
195.Tarsem Lal. (2018). "Impact of financial inclusion on poverty alleviation
through cooperative banks", International Journal of Social Economics, Vol.
45 Issue: 5, pp.808-828, https://doi.org/10.1108/IJSE-05-2017-0194.
196.Thingalaya,�K.�N.�(2012)�‘Role of Rural Banks in Achieving Financial Inclusion'
Bank Quest, 83 (2), April-June, 12-18
197.Toynbee Hall. (2012). measuring financial inclusion: thinking three
dimensionsionally. Toynbee Hall. Retrieved December 16, 2013, from
http://www.google.co.in/url?sa=t&rct=j&q=&esrc=s&source=web&cd=1&ved
=0CCoQFj
198.Turnham, J. (2010). Attitudes to Savings and Financial Education Among Low-
Income Populations: Findings from the Financial Literacy Focus Groups. Center

XX
for Financial Security WP, 10(October), 7. Retrieved from
http://citeseerx.ist.psu.edu/viewdoc/download?doi=10.1.1.369.4010&rep=rep1
&type=pdf
199.United Nations. (2006). Building inclusive financial sectors for development.
New York: The United Nations Department of Public Information.
200.United Nations Capital Development Fund. (2006). Building Inclusive Financial
Sectors for Development. Retrieved from http://books.google.com/books?
hl=en&lr=&id=8Q77wsXKLqYC&oi=fnd&pg=PR3&dq=Building+Inclusive+
Financial+Sectors+for+Development&ots=Xy58okDQtZ&sig=VD3Nx4WnW6
rywMPzkg3HSZfyO0M.
201.Venkatraman,�M.P.�(1991),�“The�impact�of�innovativeness and innovation type
on�adoption”,�Journal�of�Retailing,�Vol.�67�No.�1,�pp.�51-67.
202.Venkataramany, S., & Bhasin, B. (2011). Path to financial inclusion: The
success of self-help groups-bank linkage program in India. International Business
&�Economics�…, 8(11), 11–20. Retrieved from http://cluteonline.com/journals/
index.php/IBER/article/view/3181
203.Weber, O. (2014). Social Banking, Concepts definitions and practice. Global
social policy.14 (2) 265-281.
204.Wold, H (1975). Soft Modeling by Latent Variables: The Nonlinear Iterative
Partial Least Squares Approach. Journal of Applied Probability 12(S1)
205.World Bank. (2008).� “Access� to� Finance� and� Development:� Theory� and�
Measurement”,�World Bank, Washington.
206.World Bank. (2012). Financial Inclusion Strategies Reference Framework.
(June), 60. Retrieved from http://siteresources.worldbank.org/extfinancialsector/
Resources/282884-1339624653091/8703882-1339624678024/8703850-
1339624695396/FI-Strategies-ReferenceFramework-FINAL-Aug2012.pdf.
207.Wu,� L,� H.,� Chen,� H,� C.,� Shiu,� Y,� F.� (2007).� “The� impact� of� financial�
development and bank characteristics on the operational performance of
commercial�banks� in� the�Chinese� transitional� economy”.�Journal of Economic
Studies, Vol. 34, No. 5.
208.Xu,�L.�and�Zia,�B.�(2012),�“Financial�literacy�around�the�world:�an�overview�of�
the evidence with practical suggestions� for� the�way�forward”,�Policy�Research�
Working Paper No. 6107, The World Bank, Washington.

XXI
209.Yousafzai,�S.,�Soriano,�Y,�M.�(2012).�“Understanding�customer-specific factors
underpinning� internet� banking� adoption”.� International Journal of Bank
Marketing, Vol.30, No.1.
210.Zins,� A.� andWeill,� L.� (2016).� “The� determinants� of� financial� inclusion� in�
Africa”,�Review�of�Development�Finance,�Vol.�6�No.�1,�pp.�46-57.
211.ZULFIQAR, K., CHAUDHARY, ASLAM, M., & ASLAM, A. (2016).
Financial Inclusion and Its Implications for Inclusive Growth in Pakistan.
Pakistan Economic and Social Review, 54(2), 297–325.
1) Basavaraja, M. P., & M.R, S. (2009). Financial Inclusion – An Evaluation of
Initiatives and Impact (A study on select districts in Karnataka state). Belgium.
2) Economic�Times�daily� (2010),� “Financial inclusion plan not yielding desired
results”� 4th June. Available at articles.economictimes.indiatimes.com� ›�
Collections ›�Rural Areas (Retrieved 1/08/11)
3) FICC, & Indian Chamber Of Commerce. (2012). promoting financial inclusion.
4) Jones, P. A. (2001). Access to Credit on a Low Income. In Communities.
5) Policy Research Report (PRR) on Access to Finance: Measurement, Impact and
Policy Concept Note, December, 2006. Available at http://siteresources.
worldbank.org/INTFR/Resources/PRR_on_Access_to_Finance.pdf (accessed
on 14 June 2015).
6) RBI, Government of India (1991), Report of the Narsimham Committee on the
Financial Sector, Ministry of Finance, New Delhi.
7) Shankar, V. (2013). Committee on Comprehensive Financial Services for Small
Businesses and Low IncomeHouseholds.
8) Subbarao, D. (2013), 4 March, available at: www.rbi.org.in/Home/Speeches
www.rbi.org.in;
https://rbidocs.rbi.org.in/rdocs/Speeches/PDFs/03IWS04032013F.pdf
(accessed 20 October 2016).
9) UNDP (2011), Human Development Report 2011, United Nations devpt
programme.
10) World Bank Report. (2008). Finance for All? Policies and Pitfalls in Expanding
Access. The International Bank for Reconstruction and Development/ The
Reports and /News Paper

XXII
World Bank, Washington DC. Available at http://siteresources.worldbank.org/
INTFINFORALL/Resources/4099583-1194373512632/FFA_book.pdf
(accessed 19 June 2015).
11) World Bank. (2006). Policy Research Report (PRR) on Access to Finance:
Measurement, Impact and Policy Concept Note Motivation and Goal. Retrieved
from
.http://siteresources.worldbank.org/INTFR/Resources/PRR_on_Access_to_Fin
ance.pdf.
12) Yorulmaz, R. (2012). Financial inclusion and economic development: a case
study of Turkey and A cross-country analysis of European union.
1. articles.economictimes.indiatimes.com�›�Collections ›�Rural Areas
2. forbestechnosys.com
3. http://skoch.in/fir/role%20%financial.
4. http://mpra.ub.unimuenchen.de/
5. wileyonlinelibrary.com
6. www.economictimes.indiatime.com/articlelist
7. www.emeraldinsight.com
8. www.google.com
9. www.iimb.ernet.in/newsletter/issues.
10. www.iipmthinktank.com (visited on 05/08/11)
11. www.mapsofindia.com�› Maps › Kerala › Districts.
12. www.oecd.org/dataoecd/16/55/40339652.
13. www.sagepublications.com
14. www.scribed.com
15. www.seapren.org/publications/PovertyReduction2008.
16. www.slbckerala.org
17. www.ssrn.com
18. www.rbi.org.in
19. www.wikipedia.org/financial inclusion.
Websites.

XXIIIV
APPENDIX- I
Interview Schedule
I am Raihanath M P, doing research in the School of Management Studies, CUSAT on
the topic of Financial Inclusion. Filling up of the schedule will take 15-20 minutes
approximately. The purpose is purely academic and confidentiality is assured as
providing the name and address is not required.
Demographic variables
1. Age: a).20-30 b) 30-40 c) 40-50 d) 50-60 e) above 60
2. Gender: a)male b)female
3. Residence: a) Rural b)rural hilly c)semi- urban d) Urban
Socio-economic variables
Education, occupation, income, expenditure, housing condition and living status
4. Education: a) Illiterate b) Primary c) SSLC
d) Plus-two/ Pre- degree e) Degree f) others (please specify)
5. Marital status: a) married b) Unmarried c) widow/divorced/deserted
6. Occupation: a) Agricultural labourers b) Farmers c) house wives
d)Others (specify)
7. Average Monthly Income from all sources: a) Below 2500 b) 2500-5000
C) 5000-7500 d) 7500-10000 e) 10000 and above
8. Number of dependent: a)2-3 s b)4-5 c) 6-7 d)7 and above
9. Housing condition: a) Own house b)Rented house

XXIV
10. In which type of Bank do you have your bank account? a)Public sector bank
b) Private sector bank c) Grameen bank d) Co-operative Bank
e) Others
11. Number of bank accounts using: a) only one b)two c)three
d) Four & above
12. Purpose of usage: a) Savings b)Credit c) Both d)Others
13. Do you have savings in the formal financial sector? a)yes b)No
14. If yes specify your average monthly savings a) Below 5 % b) between
5% - 10% c) 10%-15% d) 15% and above
15. Sources of information regarding the Banking services: a)friends & relatives
b)Newspaper c)TV/Radio d) Flex boards e)Internet
16. If Yes, specify the scheme: a)KCC b) GCC C) Other micro-credits
17. Rank your preferences for the following statements
Us R Reasons for usage of formal financial services
1. Speed of service
2. Easy to use and Convenience
3. Cost Effectiveness
4. Better customer service
5. Operational efficiency
6. Responsiveness
7. Proper sanctioning of loans
8. Lower interest rate
9. Efficiency
10. Problem Handling and compensation
Rank

XXV
I
18. Problems while using formal financial services (Rank your problems)
Us R 1. Limited know-how of mainstream providers
2. Non-business-friendly environment
3. Procedural delay
4. Improper sanctioning
5. Lack of banker’s interest
6. Poor customer service
7. Tedious and cumbersome procedures
Distance to be travelled
19. If the amount is utilized for income generating activity, state
a) Nature of activity i.e., whether it is 1) full time 2) part-time
b) Type of the activity:
20. Did you create any additional employment opportunity from the credit you
availed?
a) Yes b) No
21. Measuring effectiveness of financial inclusion programme
Particulars Before availing
the loan
After availing
the loan
Percentage Change
(increase/decrease)
Average
monthly income
Average days of
employment
Asset position
(personal assets)
c) Average
income from
activity
Below 5%
of
investment
5%-10% of
investment
10%-15%
of
investment
Above 15% of
investment

XXVIII
Please mark the extent of agreement/ disagreement for the following statements.
5- Strongly agree, 4- agree, 3- neutral, 2- disagree, 1- strongly disagree
Code Q
No. Financial inclusion measurement variables
5 4 3 2 1
Ac 1 22 Regular financial services:
I have access to services that address my daily
needs. (Access to affordable and flexible
livelihood financing)
Ac 2 23 I have access to financial services that help me
to investing economic opportunities
Ac 3 24 I have access to services that address my long-
term needs
Ac 4 25 I have access to sound and pragmatic financial
services
Ac 5 26 I have access to transparent advice on financial
services
Ac 6 27 Am able to Access risk mitigation services like
health, weather, asset and life insurance etc.
Ac 7 28 I have access to vulnerability reducing and
economic capacity enhancing financial service
like warehouse Receipt financing, Value
Chain financing etc.
Ac 8 29 I have access on other financial services like
micro pensions
Us 1 30
Extend of Usage:
Please mark the frequency for the following
statements (VF- Very Frequently, F-
Frequently, O-Often, NSO-Not So Often, N-
never)
VF
5
F
4
O
3
NSO
2
N
1
I have the ability to use savings products in the
bank that promotes thrift
Us 2 31 I am able to use of transaction banking to
manage remittances
Us 3 32 I have ability to use credit facilities to
smoothen income variations
Us 4 33 Usages of insurances services to guard against
uncertainties
Us 5 34 I find that the services I use are convenient
affordable, and transparent
Us 6 35 I am able to use post office savings service
Us 7 36 I have the ability to use ATM, Kisan Credit
Cards, General Credit Cards, and other micro
credit facilities like SHG- Bank linkage, Agri-
gold loan etc. for the financial transactions
Us 8 37 Usage of mobile and other modes for banking
services to receive government benefits

XXVIIIII
38. Financial literacy – Please mark the extend of awareness on the following statements
(SA-Strongly Aware, FA-Fairley Aware, N-Neutral, PA-Poorly Aware, NA-Not
Aware)
FL1 I have awareness on Filling up of application
SA FA N PA NA
FL2 I am aware of Long-term benefits of savings
FL3 I am aware of Consequences of default
FL4 I am aware of Rate of interest on various deposits
and loans
FL5 I am aware of Security required for loan required
FL6 I am aware of Internet Banking
FL7 I am aware of Debit Card/Credit card
FL8 I am aware of Online Banking
39. Please mark the extend of your agreement or disagreement (income generation, asset
creation, and employment generation) for the following statements (5- Strongly agree,
4- agree, 3- neutral, 2- disagree, 1- strongly disagree)
Sl.
No Items
SA
5
A
4
N
3
SD
2
D
1
1 I obtained the initial capital through bank loan
2 I procure the raw materials used from the bank loan
3 I procure the machinery used from the bank loan
4 The credit scheme helps me for increasing my asset
position
5 I procure some short-term assets needed by using
the formal credits
6 I procure some medium-term or long-term assets
through the loan amount

XXVIII
7 Bank loan is helpful for me to increasing my
livelihood
8 Bank loan is helpful to fulfil my practical needs
9 Bank loan is helpful to fulfil my long-term needs
10 My financial need was positively affected by the
services of banks
11 I got encouragements for my future needs also from
the bank loan
12 My personal asset position was positively affected
by the services of banks
13 I finance other expenses incurred of my
products/services from a microfinance bank loan
14 The loan amount is helps to generate employment
opportunity
15 Loan amount was useful for providing additional
days of self-employment
16 It was helpful to generate employment for others
with my loan amount
17 I think the employment opportunity leads more
people come to use the formal credits that I can pay
the wages and salaries of workers from the bank
loan
Thank you for your kind co-operation

XXIX
APPENDIX-II
Road map villages
Nam
e o
f th
e d
istr
ict
Name of the
block
Name of unbanked
Village
Name of the
Panchayath
Populati
on
Name
of the
bank
Alloca
ted to
the
village
Technolo
gy to be
used by
the bank
AL
AP
PU
ZH
A
Haripad Cheruthana Cheruthana 12944 SBT BC
Model
Ambalapuzha Paravur Punnapara 26964 IOB Branch
Banking
Thycattussery Pallipuram Chennam-
Pallipuram
27307 PNB Branch
Banking
Muthukulam Puthuppally Devikulangara 20758 Fed
Bank
BC
Model
Muthukulam Pathiyoor Muthukulam 22184 Corp
Bank
BC
Model
CA
LIC
UT
Kunnamangal
am
Perumanna Perumanna 28027 SBT Branch
Banking
Perambra Koothali Koothali 10212 Can
Bank
BC
Model
Koduvally Madavoor Madavoor 25358 IOB BC
Model
Perambra Cheruvannur Cheruvannur 22150 Fed
Bank
BC
Model
Panthalayani Chengottukavu Chengottukavu 25293 SMG
B
BC
Model
ER
AN
AK
UL
AM
Kothamangal
am
Iramalloor Nellikuzhy 28223 SBT BC
Model
Edappally Kadamakuddy Kadamakuddy 15824 UBI BC
Model &
Branch
Koovapady Vengoor West Mudakuzha 17318 Fed
Bank
BC
Model
IDU
KK
I
Azhutha Manjumala Vandiperiyar 22629 SBT BC
Model
Idukki Elappally Arakkulam 4849 SBT BC
Model
Adimali Anaveratty Pallivasal &
Vellathoova
5006 UBI BC
Model
Adimali Kanthipara Senapathi 10584 UBI BC
Model
Idukki Upputhode Vathykudi,Mar
iapuram, Ka
10615 UBI BC
Model
Adimali Parathode Nedumkandam 21525 UBI BC
Model

XXX
Adimali Keezhamboor Kanthaloor 3359 UBI BC
Model
Devikulam Kootakambbor Vattavada 2209 UBI BC
Model
Adimali Pallivasal Pallivasal 11759 Fed
Bank
BC
Model
KA
NN
UR
Irikkur Mayyil Puthiyatheru 27605 SBT BC
Model
Irikkur Chelery Kolacherry 10105 NMG
B
Satellite
Branch
Peravoor Kanichar Kanichar 16200 Fed
Bank
BC
Model
Irity Payam Payam 27536 NMG
B
Satellite
Branch
Irity Pattanoor Koodali 14145 Can
Bank
BC
Model
Peravoor Vellarvally Peravoor 7873 Synd
Bank
BC
Model
KA
SA
RA
GO
DE
Manjeswar Pavoor Vorkady 6916 NMG
B
Satelite
Branch
Nileshwar Kodakkad Pilicode 9716 Synd
Bank
BC
Model
Manjeswar Badoor Puthige 5296 NMG
B
Mobile
Van
Manjeswar Kadambar Meenja 2362 NMG
B
Mobile
Van
Manjeswar Bellur Bellur 3335 NMG
B
Mobile
Van
KO
LL
AM
Pathnapuram Alayman Alayman 12869 SBT BC
Model
Pathnapuram Edamulackal Edamulackal 22142 SBT BC
Model
Ithikkara Pallimon Nedumbana 19920 SBT BC
Model
Ithikkara Chirakkara Chirakkara,
meenad
17184 IB Branch
Banking
Pathanapuram Pattazhy
vadakkekka ra
Pattazhy
vadakkekkara
14775 IB Branch
Banking
Chittumala Panayam Panayam 24397 IOB BC
Model
Kottarakkara Kareepra Kareepra 28888 IOB BC
Model
Chavara Vadakkumthala Panmana 19413 BOI BC
Model
Mukathala Kottamkara Kottamkara 43732 SBI Branch
Banking
Vettikavala Mylom Mylom 22425 Fed
Bank
BC
Model
Ochira Pavumba Thazhava 16413 Dhanalaxmi
Bank
BC Model

XXXI
I
KO
TT
AY
AM
Kanjirapally Cheruvally Chirakadavu 5783 SBT BC
Model
Pampady Elikulam Elikulam 10220 SBT BC
Model
Pallom Onamthruthu Neendoor 13621 SBT BC
Model
Pallom Velur Kottayam
muncipality
1600 Can
Bank
BC
Model
Pallom Chengalamsouth Thiruvarpu 15200 PNB BC
Model
Erattupetta Punjar
vadakkekara
Thalanadu 8456 Fed
Bank
BC
Model
MA
LA
PP
UR
AM
Wandoor Karakunnu Thrikkalangode 13992 SBT BC
Model
Tanur Pariyapuram Tanur 22766 SBT BC
Model
Tirur Ananthavoor Tirunavaya 17470 SBI BC
Model
Wandoor Trikkalangode Trikkalangode 12741 Can
Bank
Branch
Banking
Tirurangadi Nannambra Nannambra 35532 Can
Bank
Branch
Banking
Nilambur Kurumbakangod Chungathara 20017 PNB BC
Model
Perinthalman
na
Kariyavattom Vettathoor 13331 PNB BC
Model
Mankada Kootilangadi 31147 SIB BC
Model
Wandoor Vettikattiri Pandikkad 17641 Fed
Bank
BC
Model
Wandoor Chembrasseri Pandikkad 13466 Fed
Bank
BC
Model
Areacode Muthuvallur Muthuvallur 31157 Dhana
laxmi
Bank
BC
Model
Wandoor Perakamanna Perakamanna 17079 Dhana
laxmi
Bank
BC
Model
Tanur Niranaruthur Niranaruthur 25547 Corp
Bank
BC
Model
Tanur Ozhur 29836 CSB Hybrid
ICT
Model
PA
LA
AK
KA
D
Manarcaud Koottopadam Iii Koottopadam 12517 SBT BC
Model
Manarcaud Kumaraputhur Kumaraputhur 15346 SBT BC
Model
Chittur Thekkedesam Nallepally 12871 SBT BC
Model
Kollengode Vadavannur Vadavannur 16378 SBT BC
Model
Kuzhalmannam Kuzhalmannam ii Kuzhalmannam 10073 SBT BC
Model

XXXIIII
Alathur Thenkurissi ii Thenkurissi 12791 SBT BC
Model
Attapadi Sholayur Sholayur 7526 SBI BC
Model
Manarcaud Palakkayam Thachampara 9354 SBI BC
Model
Manarcaud Karakurissi Karakurissi 25161 SBI BC
Model
Sreekrishnapu
ram
Trikaderi ii Trikaderi 14681 SBI BC
Model
Pattambi Onganallur ii Onganallur 20268 SBI BC
Model
Ottapalam Vaniamkulam ii Vaniamkulam 15094 SBI BC
Model
Koozhalmann
am
Kootayi ii Kootayi 8831 SBI BC
Model
Alathur Tarur ii Tarur 8607 Can
Bank
BC
Model
Alathur Kavasseri i Kavasseri 15564 Can
Bank
BC
Model
Alathur Kizhakkancherry ii Kizhakkancherry 16988 Can
Bank
BC
Model
Attapadi Padavayal Agali 6764 Can
Bank
BC
Model
Chittur Perumatty Perumatty 7588 Can
Bank
BC
Model
Manarcaud Kottopadam i Kottopadam 12936 Can
Bank
Branch
Banking
Trithala Thirumattacod-i Thirumattacode 17255 PNB BC
Model
Ottapalam Ambalapparai Ambalappara 12418 PNB BC
Model
Koozhalmann
am
Peringottukurissi i Peringottukurissi 11482 PNB BC
Model
Manarcaud Alanallur ii Alanallur 10997 Fed
Bank
BC
Model Koozhalmaanam Mathur ii Mathur 12324 Fed
Bank
BC
Model
Manarcaud Thachanattukara i Thachanattukara 13232 Vijaya
Bank
BC
Model
Manarcaud Thachanattukara ii Thachanattukar
a
10523 Vijaya
Bank
BC
Model
Alathur Kannambra i Kannambra 13737 Corp
Bank
BC
Model
Attapadi Pudur Agali 5798 Dist
Co-op
Bank
Mobile
Van
PA
TH
AN
AM
TH
ITT
A
Mallapally Perumpatty Kottanad 14581 SBT BC
Model
Kozhipuram Telliyoor Azhumattor 8236 SBT BC
Model
Ranni Chethackal Ranni
pazhavangadi
15781 SBT BC
Model

XXXIIIV
Konni Konni tazham Konni tazham 14666 SBT BC
Model
Ranni Kollamulla Kollamulla 22765 SBI BC
Model
Konni Iravon Aruvappulam 10246 Fed
Bank
BC
Model
Parakode Erathu Erathu 25005 Dhanl
axmi
Bank
BC
Model
Tri
chu
r Pazhayannur Thonoorkkara Chelakkara 6287 Can
Bank
BC
Model
TR
IVA
ND
RU
M
Vellanad Veeranakavu Poovachal 25813 SBT BC
Model
Kazhakuttom Andoorkonam Andoorkonam 14736 SBT BC
Model
Kazhakuttom Melethonnakkal Mangalapuram 16959 SBI BC
Model
Kilimanoor Vellallor Nagaroor 11842 IOB BC
Model
Vamanapuram Kurupuzha Nandiyode 11630 IOB BC
Model Vamanapuram Koliyakode Pothencode 18973 UBI BC
Model Vamanapuram Thennor Peringamala 12972 BOI BC
Model
Parassala Parasuvakkal Parassala 17092 Synd
Bank
BC
Model
Kilimanoor Koduvazhannoor 8411 SIB BC
Model Perumkadavila Vazhichal Amboori 10606 Fed
Bank
BC
Model
WA
YA
NA
D
Kalpetta Achoornam Pozhuthana 9754 SBT BC
Model
Kalpetta Vellarimala Meppady 8730 SBT BC
Model
Kalpetta Trikkaripetta Meppady 10384 SBT BC
Model
Kalpetta Kottathara Kottathara 16816 SBI BC
Model Mananthavady Cherukattur Panamaram 10806 Can
Bank
BC
Model Sultansbathery Krishnagiri Meenangadi 12597 Can
Bank
BC
Model Kalpetta Kuppadithara Padinjarethara 9649 Can
Bank
BC
Model Mananthavady Thirunely Thirunely 11719 PNB BC
Model
Sultansbattery Thomattuchal Ambalavayal 17744 SMGB BC
Model
Kalpetta Thariode Thariode 1859 SMGB BC
Model
Source: State level Bankers Committee, Kerala.


XXXIVV
APPENDIX-III.
FLCs working in Kerala
District
Location (Metro,
Urban, Semi-
Urban, Rural)
Name of
the Bank
Date of
Start of
functioning
Address
Tri
van
dru
m
Trivandrum
Corporation
(Urban) (Other
than SLBC
allotted)
IOB 10.02.2011
FLC [SNEHA] , TC -
14/1609 & 161 (Near
IOB RSETI), Forest
Office Lane,
Vazhuthacaud,
Trivandrum – 695 014
Pothencode (Semi
Urban) SBT 22.12.2012
FLC, C/o State Bank of
Travancore, Jisha
Buildings, Pothencode
P.O., Trivandrum.
Kattakkada (Semi
Urban)
Federal
Bank 28.03.2012
Federal Ashwas FLC,
(In association with,
Malankara Social
Service Society), St.
Mary’s Malankara
Church Compound,
Choondupalaka,
Kattakada P,O
Chirayankeezhu
(Semi Urban)
South
Indian
Bank
18.03.2013
SIB FLC, Akshaya E-
Centre, Galleon,
Chekkalavilakkom
Junction, Kadakkavur,
Trivandrum
Kilimanur (Semi
Urban) SBI 20.03.2013
FLC, C/o. SBI
Thattathumala Branch,
Reema Complex,
Kilimanoor, Trivandrum
- 695601
Nemom (Rural)
Catholic
Syrian
Bank
20.03.2013
Ground Floor, Simon
Building, Convent Road,
Pravachambalam,
Nemom P O,
Thiruvananthapuram.
Athiyannoor Block
(Semi Urban)
Canara
Bank 31.07.2013
FLC, C/o. Canara Bank,
Kamukincode,
Varkala (Semi
Urban) CBI 22.11.2013
CBI-FLC, C/O Akshaya
E- Centre, Punnamoodu,
Varkala (P.O).
Parassala (Semi
Urban)
Indian
Bank 16.12.2013
FLC, C/o. Indian Bank,
Parassala, Trivandrum
Vamanapuram
Block (Semi
Urban)
UBI 23.01.2014
Union Bank FLC, PGM
Building, Pirappencode
P.O, Trivandrum
Perumkadavila
Block
Syndicate
Bank 13.06.2014
Jnana Jyothi FLC,
Perumkadavila Block,
Trivandrum - 695124

XXXVVI
Nedumangad Bank of
India 21.06.2014
FLC, Nedumangad,
Trivandrum K
oll
am
Kollam
Corporation
(Urban)
(Other than SLBC
allotted)
Indian
Bank 09.06.2011
FLC, Indian Bank
Towers, Main Road,
Kollam
Kottarakkara
(Rural)
Federal
Bank 04.03.2013
Federal Ashwas FLC,
Building No. 53/IV/KP,
Govinda Mangalam
Road, Pulamon P.O,
Kottarakkara.
Vettikkavala (Semi
Urban)
Indian
Overseas
Bank
15.03.2013
IOB FLC, Sneha, Melila
Grama Panchayath
Building, Chengamanad
Junction, Chengamanad
P.O, Kollam
Chavara (Semi
Urban)
South
Indian
Bank
18.03.2013
Akshaya E Centre,
Chenankara Jn,
Thevalakara P,O,
Kollam
Keralapuram,
Mukhathala Block
(Semi Urban)
State Bank
of India 15.03.2013
FLC, C/o. SBI,
Keralapuram, Devan's
Plaza, Keralapuram,
Chanthanathope P.O,
Kollam
Pathanapuram
(Semi Urban) SBT 26.03.2013
FLC, C/o. State Bank of
Travancore, Abraham
Complex, K.P.Road,
Pathanapuram
Ithikkara Block
(Semi Urban)
Canara
Bank 31.07.2013
FLC, C/o. Canara Bank,
Adichanalloor, Kollam -
691 573
Bharanikavu /
Sasthamcotta
Catholic
Syrian
Bank
29.01.2014
CSB Viswas FLC,
Bharanikavu,
Sooranadu, Kollam
Anchal (Semi
Urban)
Central
Bank of
India
08.11.2013
CBI-FLC, C/O Akshaya
Jana Seva Kendra, Opp.
Plavilayil Complex,
Market Junction,
Anchal, Kollam
Chadayamangalam
(Semi Urban)
Indian
Bank 16.12.2013
FLC, C/o. Indian Bank,
Chadayamangalam,
Kollam
Chittumala Block
(Semi Urban)
Union Bank
of India 27.01.2014
Union Bank FLC, Block
Office, Chittumala,
Kundara, Kollam
Oachira Block Corporation
Bank 27.03.2014
C/o. Corporation Bank,
Pavumba
Pat
ha
nam
t
hit
ta Konni (Semi
Urban) (Other than
SLBC allotted)
SBT 01.05.2011
SBT- FLC, Lead Bank,
SNDP Yogam Bldg.
Near Collectorate

XXXVIVII
Ranni Block
(Rural)
Federal
Bank 09.04.2012
Federal Ashwas FLC,
Catholic Centre, College
Road, Pazhavangadi
P.O, Ranni,
Pathanamthitta – 689
673
Koipuram Block
(Semi Urban) SIB 18.03.2013
FLC, Akshaya E centre,
Pullavallil Building,
Pullad P.O., Thiruvalla
Pandalam Block
(Semi Urban) KGB 15.06.2013
Gramadeepam FLC,
Ayathilmukku,
Pandalam,
Mudiyoorkonam P.O,
Pathanamthitta
Parakode Block
(Semi Urban) SBI 29.09.2013
FLC, C/o. SBI
Elamanoor, Pournami
Buildings, Elamannur
P.O, Pathanamthitta -
691524
Mallappally Block
(Semi Urban) IOB 27.07.2013
SNEHA FLC, Block
Off Bldg,
Mallappally(W )PO,
Pathanamthitta
Elanthur Block
(Semi Urban)
Catholic
Syrian
Bank
07.11.2013
CSB Viswas FLC, P B
No. 16, A.A.T.T.
Devaswom Building
Opp. Panchayath Bus
Stand Kozhencherry,
Pathanamthitta
Pulikeezhu (Semi
Urban)
Central
Bank of
India
15.11.2013
CBI-FLC, C/O Akshaya
Jana Seva Kendra,
N.S.S. Building,
Podiyadi (P.O),
Thiruvalla,
Pathanamthitta.
Chengannur (Semi
Urban)
Central
Bank of
India
22.11.2013
CBI-FLC, C/O Akshaya
Jana Seva Kendra,
Catholic Building, M.C.
Road, Nandavanam
Junction, Chengannur,
Pathanamthitta
Ala
ppu
zha
Mararikulam
(Rural)
Federal
Bank 11.01.2010
Federal Ashwas FLC,
Gandhi Smaraka Grama
Seva Kendram, S.L.
Puram P.O., Alappuzha.
Alappuzha (Urban) Federal
Bank 15.01.2010
Federal Ashwas FLC,
Gandhi Smaraka Grama
Seva Kendram Sub
center,
Moosariparampil,
District Court Road,
Thathampally P O.

XXXVIIVIII
Kuttanad (Rural) Federal
Bank 10.02.2010
Federal Ashwas FLC,
Gandhi Smaraka Grama
Seva Kendram,
Kuttanad Sub-Centre,
Vezhapra, Ramankary
P.O., Alappuzha
Aryad (Semi
Urban) SBT 01.05.2011
SBT - FLC, Aryad Block
Panchayat Building,
Kalavoor P.O.
Alappuzha – 688 522
Haripad (Semi
Urban) SIB 18.03.2013
FLC, Sreevilasam
Building, Akshaya E
centre, Cheppad
Thycattussery
(Semi Urban)
Punjab
National
Bank
26.08.2013
PNB-FLC, Akshaya, E-
Centre, CSC,
Tputhenveli House,
Manapuram P.O,
Cherthala, Alappuzha
Veliyanad Block
(Rural)
Canara
Bank 31.07.2013
FLC, C/o. Canara Bank,
Pulincunnoo,
Muthukulam
Block (Semi
Urban)
Indian
Overseas
Bank
25.07.2013
SNEHA FLC,
Muthukulam Block
Panchayat Office Bldg,
Muthukulam,
Alappuzha -690506
Mavelikkara (Semi
Urban) UBI 25.02.2014
FLC, C/o Union Bank of
India Mavelikkara
Branch, Alakapuri Jn.
Pattanakad Block Corporation
Bank 27.03.2014
C/o. Corporation Bank,
Vayalar, Alappuzha
Kott
ayam
Pallom (Semi
Urban) SBT 01.05.2011
SBT - FLC, Jawahar
Bala Bhavan,
Thirunakkara, Kottayam
– 686 001
Pala (Semi Urban) Federal
Bank 17.05.2012
Federal Ashwas FLC,
Sreevardhan Bldg. Near
Alphonsa College,
Arunapuram P.O, Pala,
Kottayam
Ettumanoor (Semi
Urban)
State Bank
of India 03.04.2013
FLC, C/o. SBI
Ettumanoor, Pandasseril
Buildings, Near Village
Office, Ettumanoor,
Kottayam
Kaduthuruthy
(Semi Urban) SIB 18.03.2013
FLC, Akshaya E-
Centre, Opp SBT
Kaduthuruthy - 686604
Vazhoor (Semi
Urban)
Union Bank
of India 25.06.2013
Union Bank FLC,
Vattukattu Building
No.IV/66A,
Ponkunnam, Vazhoor,
Kottayam

XXXVIIIX
Erattupeta Block
(Semi-Urban)
Kerala
Gramin
Bank
10.09.2013
Gramadeepam FLC,
Block Office Building
(Annex), Erattupetta
Block, Erattupetta P.O,
Kottayam
Vaikom (Semi
Urban)
Dhanlaxmi
Bank 01.08.2013
FLC, Dhanlaxmi Bank,
NSS Building West
Gate, Vaikkom.
Kanjirappilly
(Semi Urban)
Catholic
Syrian
Bank
31.07.2013
CSB Viswas FLC,
T.M.C. Buildings, P.B.
No. 109, Near Rubber
Board Regional Office,
K.K. Road, Kottayam
Madapally Block
(Semi Urban)
Canara
Bank 31.07.2013
FLC, C/o. Canara Bank,
Madapally, Kottayam-
686 546
Pampady Block
(Semi Urban)
Indian
Overseas
Bank
26.07.2013
SNEHA FLC, I Floor,
Chenattumattam Bldg,
Opp Bus Stand, K K
Road, Pampady,
Kottayam - 686502
Uzhavoor Block
(Semi Urban)
Syndicate
Bank 08.01.2014
FLC, Uzhavoor Block
Office Bldg, Kozha P.O,
Kuravilangad, Kottayam
Ern
akula
m
Perumbavoor,
Koovapady (Semi
Urban)
Union Bank
of India 23.02.2011
Union Bank FLC, I
Floor, Union Bank
Bhavan, A.M.Road,
Perumbavoor,
Ernakulam – 683 542
Mookkannoor
(Semi Urban)
Federal
Bank 27.04.2012
Federal Ashwas FLC,
Pala Junction,
Mookkannoor,
Ernakulam
Kothamangalam
(Semi Urban)
Federal
Bank 04.09.2012
Federal Ashwas FLC,
Bishop House,
Kothamangalam,
Ernakulam
Mulanthuruthy
(Semi Urban)
Union Bank
of India 09.11.2012
Union Bank FLC, Block
Panchayath Building,
Perumpilly, P.O.
Mulanthuruthy,
Ernakulam - 682314
Edappally(Semi
Urban)
Union Bank
of India 14.11.2012
Union Bank FLC, Block
Panchayath Building,
Kusumagiri, P.O.
Kakkanad, Ernakulam.
Vypeen (Semi
Urban)
State Bank
of
Travancore
24.12.2012
C/O State Bank of
Travancore,Cherupully
Buildings,
Nayarambalam,
Ernakulam

XXXIX
Alangad (Semi
Urban)
South
Indian
Bank
18.03.2013
SIB FLC, Akshaya
Centre No. EK-314
Co-operative Bank
Building,
Chettibagham,
Varapuzha.
Parakkadavu
(Semi Urban)
Union Bank
of India 15.02.2013
Union Bank FLC
No7/111L, Near
Telephone Exchange,
Moozhikkulam,
Ernakulam
Palluruthy (Semi
Urban)
Dhanlaxmi
Bank 01.08.2013
FLC, C/o.Dhanlaxmi
Bank, Palluruthy
Branch, No.23, 2642C,
ASB Estate, Palluruthy
Muvattupuzha State Bank
of India 25.03.2013
FLC, C/o. SBI,
Muvattupuzha, Aramana
Complex, Muvattupuzha
Collectorate,
Kakkanad (Urban)
Union Bank
of India 02.09.2013
FLC, C/o. Union Bank
of India RSETI, Ground
Floor, Old Block
Collectorate, Kakkanad
Vaduvacode (Semi
Urban)
Punjab
National
Bank
26.08.2013
PNB-FLC, Akshaya
Centre, Mechirappattu
Building Opp Fact Main
gate, Ambalamedu (PO)
Pampakuda Block
(Semi Urban)
Canara
Bank 31.07.2013
FLC, C/o. Canara Bank,
Ramamangalam.
Parur Block (Semi
Urban)
Bank of
India 20.12.2013
FLC, C/o. Bank of India,
Parur Main Branch, Star
House, Parur.
Vazhakkulam
Block (Rural)
Syndicate
Bank 07.01.2014
FLC, Vazhakkulam
Block Panchayat Office
Bldg, S.Vazhakulam,
Angamaly (Semi
Urban)
Canara
Bank 19.01.2015
FLC, C/o. Canara Bank,
Angamaly, Ernakulam
Idukki
Nedumkandam
(Semi Urban)
Union Bank
of India 19.03.2011
FLC, C/o. Union Bank
of India RSETI, Block
Panchayat Bldg,
Nedumkandam, Idukki -
685553
Thodupuzha (Semi
Urban)
Federal
Bank 28.01.2012
Federal Ashwas FLC,
TM/98A/28,
Aniyaveettil Bldg.,
Vengallur P.O,
Thodupuzha, Idukki -
685608
Azhutha (Semi
Urban)
State Bank
of
Travancore
24.12.2012
FLC, C/o. State Bank of
Travancore, PB. No.1,
Rosappookandam Road,
Kumily.P.O., Idukki-
685509

XL
Devikulam (Semi
Urban)
State Bank
of
Travancore
12.01.2013
FLC, C/o.State Bank of
Travancore, AM
Road,P.B.No.1,
Munnar.P.O., Idukki
District
Udumbanoor,
Elamadesam
State Bank
of India 20.09.2013
FLC, C/o. SBI
Udumbanoor,
Puthenpurayil
Buildings, Udumbanoor,
Idukki - 685595
Kattappana (Semi
Urban)
State Bank
of India 16.08.2013
FLC, C/o. SBI
Kattappana ADB,
Kattappana, Idukki -
685508
Idukki (Semi
Urban)
South
Indian
Bank
18.03.2013
Akshaya E-Centre, Info
world IT centre, Mariya
Towers, Idukki Colony
P.O, Cheruthony
Adimaly (Semi
Urban) UBI 15.09.2013
FLC, Kannattu
Shopping Complex,
Kallarkutty Road,
Adimaly, Idukki
Thodupuzha (Semi
Urban)
Canara
Bank 14.01.2015
FLC, C/o. Canara Bank,
Thodupuzha, Idukki
Thrissur
Ollukara (Urban) Canara
Bank 19.11.2010
AMULYA FLC, T. C.
29/670, Shornur Road,
Near Kousthubham
Auditorium, Thrissur -
680022
Irinjalakkuda
(Semi Urban)
Federal
Bank 15.11.2012
FAFLC, Social Action
Forum, Chathakunnu,
Irinjalakkuda.
Vellangallur (Semi
Urban)
South
Indian
Bank
18.03.2013
FLC, Akshaya Centre
No. 717, Cheradai
Complex, Velukkara
Panchayath Centre, P.O
Chalakudy (Semi
Urban)
State Bank
of India 01.04.2013
FLC, C/o. SBI
Chalakkudy, South
Junction, Chalakudy.
Thalikkulam Block
(Semi Urban)
Kerala
Gramin
Bank
06.09.2013
Gramadeepam FLC,
KGB Thriprayar branch,
Nidhun Shopping
Complex, Nattika P.O.
Cherpu (Semi
Urban)
Dhanlaxmi
Bank 01.08.2013
FLC, Monons Complex,
Kodannur-Ammadam
Road, Palakkal.
Chavakkad (Semi
Urban)
Indian
Overseas
Bank
01.08.2013
Sneha FLC, 7/38E1, N K
Complex, Opp.
Chavakkad Municipal
Bus Stand, Thrissur
Mullassery (Semi
Urban)
Catholic
Syrian
Bank
31.07.2013
FLC CSB Viswas, Near
Catholic Syrian Bank, Q
8 Complex,

XLI
Mecheripady PO,
Velkitalgu.
Mala (Semi Urban) Union Bank
of India 30.09.2013
FLC, C/o. Union Bank
of India, Mala Branch,
Thrissur
Mathilakam (Semi
Urban)
HDFC
Bank 10.09.2013
FLC, Mathilakam
Block, LKB Founders
Memorial Building, Ist
Floor, Sringapuram,
Kodungallur,
Pazhayannur
(Semi Urban)
Punjab
National
Bank
26.08.2013
Akshaya Center,
Pazhayannur Jn,
Ambalanada
Paruthukattil House, PO
Elandu, Thrissur
Chowwannur
Block (Semi
Urban)
Canara
Bank 31.07.2013
FLC, C/o. Canara Bank,
Pazhanji.
Wadakkanchery
(Semi Urban) SBT 20.04.2013
FLC, C/o. SBT, Shornur
Road, Wadakkanchery,
Thrissur
Anthikkad Block
(Semi Urban)
Bank of
India 20.12.2013
FLC, C/o. Bank of India,
Kandassankadavu
Branch, Thrissur
Puzhakkal Block Bank of
Baroda 31.03.2014
Saarthee FLC, Opp.
Bank of Baroda,
Peramangalam, Thrissur
Kodakara Block Syndicate
Bank 11.06.2014
Jnana Jyothi FLC,
Kodakara Block
Panchayat Building,
Puthukkad.
Pal
akkad
Palakkad Block
(Semi Urban)
Canara
Bank 19.11.2010
AMULYA FLC, Room
No. 17; ASR
Plaza; Opp. Priyadarsini
Theatre, RS Road,
Palakkad
Chittur (Rural) Federal
Bank 03.03.2012
Federal Ashwas FLC,
Vision India Foundation
Trust, Chittur, Palakkad
Kuzhalmannam
(Semi Urban)
State Bank
of
Travancore
30.10.2012
FLC, C/o State Bank of
Travancore, KMS
Building,
Kuzhalmannam,
Palakkad
Kollengode (Semi
Urban)
State Bank
of
Travancore
24.12.2012
FLC, C/o State Bank of
Travancore, Gayatri
Complex, Kollengode,
Palakkad
Alathur (Semi
Urban) SIB 18.03.2013
FLC, Akshaya E Centre,
Opp. Supplyco ,
Thrippalur, Palakkad

XLII
Nemmara (Semi
Urban)
Dhanlaxmi
Bank 01.08.2013
FLC, Dhanlaxmi Bank,
I. G. Towers, Vallanghi,
Nemmara P.O.
Sreekrishnapuram
(Semi Urban)
State Bank
of India 23.09.2013
FLC, C/o. SBI
Kadampazhipuram,
Panchayat Bus stand
Building,
Kadampazhipuram,
Palakkad
Pattambi (Semi
Urban)
State Bank
of India 20.09.2013
FLC, C/o. SBI Pattambi,
Amritha Towers, Mele
Pattambi, Palakkad
Thrithala (Semi
Urban)
Catholic
Syrian
Bank
05.08.2013
CSB Viswas FLC,
Cheeran Houses, MGRA
47, Kaniyambal,
Punnakulam PO,
Palakkad
Malampuzha
Block (Rural)
HDFC
Bank 25.08.2013
FLC, Malampuzha
Block, First Floor,
HDFC Bank Building,
12/799, Chembalode,
Thrissur Bye Pass Road,
NH 47, Chandra Nagar.
Attappady Block
(Rural)
Canara
Bank 01.03.2014
FLC, C/o. Canara Bank,
Agali, Palakkad
Ottapalam (Semi
Urban)
Punjab
National
Bank
04.01.2014
PNB-FLC, Akshaya 3-
centre, Techno World
Digital Technologies,
Kudumbashree IT Unit,
Ottapalam, Palakkad.
Mal
appura
m
Malappuram Block
(Urban)
Canara
Bank 19.11.2010
AMULYA FLC, 2nd
Floor; Uphill.
Chungathara
(Rural)
Federal
Bank 03.04.2012
Federal Ashwas FLC,
Eranad Development
Society, Near St. Mary’s
Church, Chungathara
P.O
Perumpadappu
(Semi Urban)
South
Indian
Bank
18.03.2013
FLC, Akshaya Centre,
Kalathil Padi,
Perumpadappu,
Malappuram
Ramapuram,
Mankada Block
(Semi Urban)
Kerala
Gramin
Bank
20.04.2013
FLC, Block Office
Complex, Ramapuram,
Mankada, Malappuram
Kalikavu (Semi
Urban) SBT 27.03.2013
FLC, Pattikadan
Buildings, Kalikavu
Road, Kizhakkethala,
Wandoor Block
(Semi-Urban)
Kerala
Gramin
Bank
30.08.2013
Gramadeepam FLC,
Wandoor Block Office
Building, Wandoor P.O.,
Malappuram
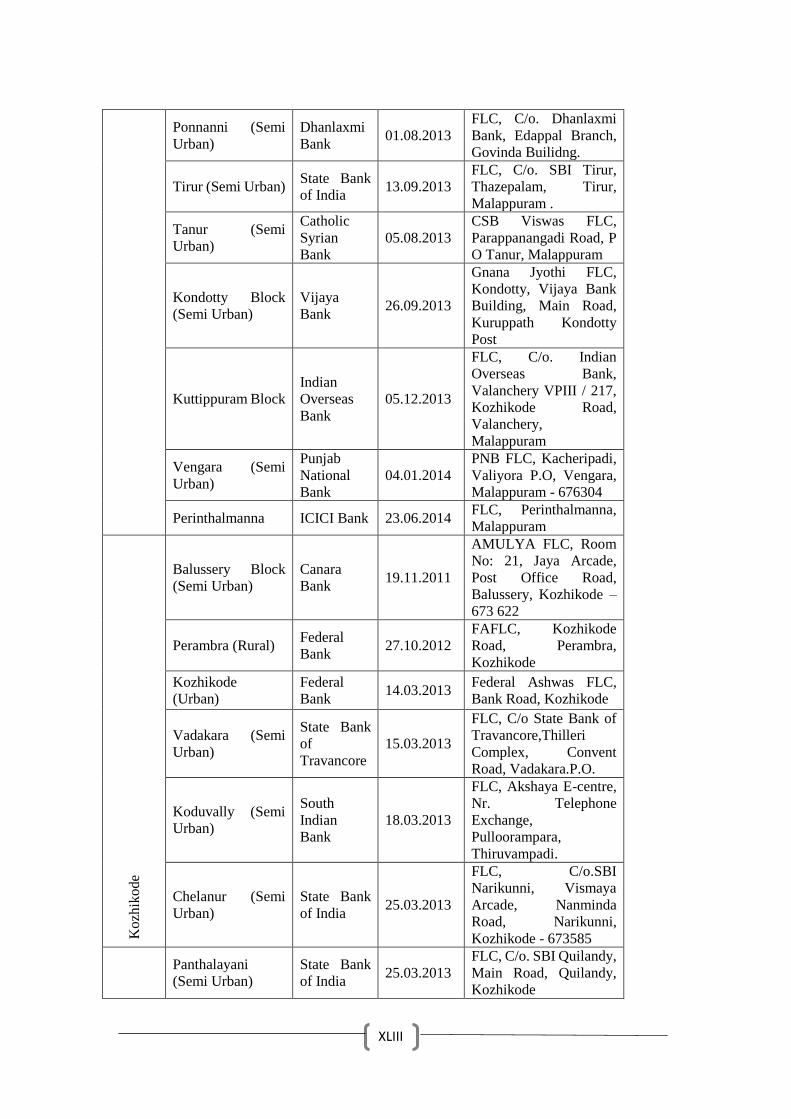
XLIII
Ponnanni (Semi
Urban)
Dhanlaxmi
Bank 01.08.2013
FLC, C/o. Dhanlaxmi
Bank, Edappal Branch,
Govinda Builidng.
Tirur (Semi Urban) State Bank
of India 13.09.2013
FLC, C/o. SBI Tirur,
Thazepalam, Tirur,
Malappuram .
Tanur (Semi
Urban)
Catholic
Syrian
Bank
05.08.2013
CSB Viswas FLC,
Parappanangadi Road, P
O Tanur, Malappuram
Kondotty Block
(Semi Urban)
Vijaya
Bank 26.09.2013
Gnana Jyothi FLC,
Kondotty, Vijaya Bank
Building, Main Road,
Kuruppath Kondotty
Post
Kuttippuram Block
Indian
Overseas
Bank
05.12.2013
FLC, C/o. Indian
Overseas Bank,
Valanchery VPIII / 217,
Kozhikode Road,
Valanchery,
Malappuram
Vengara (Semi
Urban)
Punjab
National
Bank
04.01.2014
PNB FLC, Kacheripadi,
Valiyora P.O, Vengara,
Malappuram - 676304
Perinthalmanna ICICI Bank 23.06.2014 FLC, Perinthalmanna,
Malappuram
Ko
zhik
ode
Balussery Block
(Semi Urban)
Canara
Bank 19.11.2011
AMULYA FLC, Room
No: 21, Jaya Arcade,
Post Office Road,
Balussery, Kozhikode –
673 622
Perambra (Rural) Federal
Bank 27.10.2012
FAFLC, Kozhikode
Road, Perambra,
Kozhikode
Kozhikode
(Urban)
Federal
Bank 14.03.2013
Federal Ashwas FLC,
Bank Road, Kozhikode
Vadakara (Semi
Urban)
State Bank
of
Travancore
15.03.2013
FLC, C/o State Bank of
Travancore,Thilleri
Complex, Convent
Road, Vadakara.P.O.
Koduvally (Semi
Urban)
South
Indian
Bank
18.03.2013
FLC, Akshaya E-centre,
Nr. Telephone
Exchange,
Pulloorampara,
Thiruvampadi.
Chelanur (Semi
Urban)
State Bank
of India 25.03.2013
FLC, C/o.SBI
Narikunni, Vismaya
Arcade, Nanminda
Road, Narikunni,
Kozhikode - 673585
Panthalayani
(Semi Urban)
State Bank
of India 25.03.2013
FLC, C/o. SBI Quilandy,
Main Road, Quilandy,
Kozhikode

XLIV
Melady (Semi
Urban)
State Bank
of
Travancore
22.03.2013
FLC, C/o State Bank of
Travancore(70946),
Benhur Plaza, Perambra
Road, Payyoli.
Thodannur Block KGB 09.09.2013
Gramadeepam FLC,
Thodannur Block Office
Building, Thodannur.
Tuneri Block
Kerala
Gramin
Bank
09.09.2013
Gramadeepam FLC,
Tuneri Block Office
Building Tuneri P.O,
Nadapuram (Via),
Kozhikode.
Kunnamangalam
Block (Semi
Urban)
Canara
Bank 31.07.2013
Amulya FLC, Mukkom
Road, Kunnamangalam,
Kozhikode
Areekode (Semi
Urban) UBI 01.12.2013
FLC, Elattu Plaza,
Pandikkadu Road,
College Post, Manjeri.
Kunnummel (Semi
Urban) PNB 04.01.2014
PNB-FLC, Akshaya e-
centre, Mokeri P.O,
Kozhikode
Way
anad
Kalpetta (Semi
Urban)
Federal
Bank 28.05.2010
Federal Ashwas FLC,
Kainatty Arcade,
Kainatty Junction
Kalpetta.
Sulthan Bathery
Block (Semi
Urban)
Canara
Bank 19.11.2011
AMULYA FLC, High
School Road,
Meenangadi, Wayanad
Sulthan Bathery
(Semi Urban)
(Other than SLBC
allotted)
Federal
Bank 18.02.2012
Federal Ashwas FLC,
Shreyas P B No.77,
Sulthan Bathery,
Wayanad.
Mananthavady
(Semi Urban) SBT 25.03.2013
FLC, C/o SBT, Mysore
Road, Manathavady
Panamaram (Semi
Urban)
State Bank
of India 23.09.2013
FLC, C/o. SBI
Anjukunnu, Anjukunnu,
Kellur, Wayanad.
Kan
nur
Kannur Block
(Rural)
Syndicate
Bank 26.09.2011
FLC, Door No.PPI
262/M.N.O.P, First
Floor, Surag Bldg,
Podikundu, Pallikkunnu
P.O, Kannur - 4
Pilathara (Rural) Federal
Bank 14.03.2012
Federal Ashwas FLC,
Kairos, Holy Spirt
Convent, Pilathara,
Kannur.
Payyannur (Semi
Urban)
State Bank
of
Travancore
28.01.2013
C/O State Bank of
Travancore, Payyannur
(70259) P.B.No.4,
Achuth Building,
Kannur

XLV
Irikkur (Semi
Urban) SIB 18.03.2013
SIB FLC, Akshaya E-
centre, Irikkur Town,
Irikkur P.O, Kannur
Thalasseri (Semi
Urban) SBI 05.05.2013
FLC, C/o. SBI
Thalassery, Gundest
Road, Thalassery,
Kannur - 670101
Taliparamba Block
(Semi-Urban) KGB 14.06.2013
Gramajyothi FLC,
Trichembaram Temple
Road, P.O. Taliparamba.
Panoor (Semi
Urban) IOB 04.09.2013
FLC, C/o IOB Kadirur
Branch, 2/279 C ,
Subaida Building Main
Road, Kadirur, Kannur
Edakkad (Semi
Urban) UBI 30.09.2013
FLC, C/o. Union Bank
of India, Chovva
Branch, Kannur
Irritty Blcok (Semi
Urban)
Canara
Bank 31.07.2013
Amulya FLC, C/o
Canara Bank, Iritty,
Kannur
Nedumpuramchal
Peravoor Block
(Rural)
Vijaya
Bank 08.08.2013
Gnana Jyothi FLC,
Peravoor, Vyapaara
Bhavan Building, Near
Vijaya Bank,
Nedumpuramachal,
Poolakutti Post,
Peravoor Block.
Kuthuparamba
(Semi Urban) PNB 04.01.2014
PNB-FLC, Akshaya e-
centre, Kuthuparamba,
Kannur
Kas
argo
d
Kasargod (Rural) Syndicate
Bank 27.09.2011
Jnana Jyothi FLC,
KMC-VI, 43 C
Anangoor, Kasargod
Chittarikkal
(Rural)
Federal
Bank 05.07.2012
Federal Ashwas FLC,
1st Floor, St. Thomas
Church Shopping
Complex, Chittarikkal
P.O.
Kanhangad (Semi
Urban)
State Bank
of
Travancore
21.03.2013
FLC, P.B.No.13, Main
Road, Hosdurg
(Kanhangad) P.O.,
Cannanore Dt., Kerala -
670315
Manjeswar Block
(Semi-Urban) KGB 29.04.2013
Gramajyothi FLC,
Badariya Towers,
Hosangadi, P.O.
Nileswar (Semi
Urban) IOB 01.08.2013
Sneha FLC, N1/864,
AIWA Complex, Market
Road, Nileswar
Karadka Block Corp.Bank 15.03.2014 C/o. Corporation Bank,
Bovikan.
Source :SLBC Kerala

XLVI
I
APPENDIX-IV
District-Wise Data on Flow of Bank Credit to Minorities as On 30th
September 2017.
Outstanding (Rupees in Crores)
AS ON 30.09.2016 AS ON 30.09.2017
No. Amount No. Amount
TRIVANDRUM
Christians 286820 3545.38 328213 4311.14
Muslims 189686 3386.07 241479 3418.18
Sikhs 72 3.65 227 7.01
Jains 45 0.96 49 0.94
NeoBudhists 18 0.41 47 4.75
Zorashtrians 7 15.00 7 0.07
Total 476648 6951.47 570022 7742.09
KOLLAM
Christians 22150 2115.20 44934 2004.04
Muslims 27400 3210.10 48543 2386.64
Sikhs 0 0.00 4 0.23
Jains 0 0.00 0 0.00
NeoBudhists 0 0.00 0 0.00
Zorashtrians 0 0.00 0 0.00
Total 49550 5325.30 93481 4390.91
PATHANAMTHITTA
Christians 163869 6752.00 239292 2238.00
Muslims 30957 1019.00 95829 680.00
Sikhs 0 0.00 0 0.00
Jains 0 0.00 0 0.00
NeoBudhists 0 0.00 0 0.00
Zorashtrians 0 0.00 0 0.00
Total 194826 7771.00 335121 2918.00
ALAPPUZHA
Christians 67465 1622.50 75119 2533.00
Muslims 46359 1123.78 47965 1346.00
Sikhs 45 0.52 26 0.00

XLVIIII
Jains 0 0.00 34 0.00
NeoBudhists 85 3.26 67 3.00
Zorashtrians 11 0.73 7 0.00
Total 113965 2750.79 123218 3882.00
KOTTAYAM
Christians 219355 4961.28 218462 4934.88
Muslims 48085 920.04 45202 976.73
Sikhs 9 0.09 12 0.45
Jains 4 0.21 1 0.00
NeoBudhists 25 0.32 26 1.18
Zorashtrians 6 0.09 5 0.09
Total 267484 5882.03 263708 5913.32
IDUKKI
Christians 224000 5711.41 133809 3096.64
Muslims 38195 981.94 36450 937.64
Sikhs 0 0.00 0 0.13
Jains 0 0.00 0 0.00
NeoBudhists 0 0.00 0 0.00
Zorashtrians 0 0.00 0 0.00
Total 262195 6693.35 170259 4034.41
ERNAKULAM
Christians 275710 13999.39 293398 10750.65
Muslims 126237 5411.62 118747 4181.63
Sikhs 68 37.04 115 59.05
Jains 41 99.82 77 13.44
NeoBudhists 32 99.32 79 12.82
Zorashtrians 6461 97.85 112 17.30
Total 408549 19745.04 412528 15034.89
THRISSUR
Christians 171954 6708.39 156240 6814.88
Muslims 83070 2012.45 82414 2564.47
Sikhs 25 0.80 14 0.13
Jains 15 0.50 0 0.00
NeoBudhists 11 0.14 12 0.11
Zorashtrians 8 0.07 14 0.77

XLVIII
Total 255083 8722.35 238694 9380.36
PALAKKAD
Christians 104777 2673.68 109179 2633.84
Muslims 264908 4984.09 239845 5710.01
Sikhs 0 0.00 0 0.00
Jains 0 0.00 0 0.00
NeoBudhists 0 0.00 0 0.00
Zorashtrians 0 0.00 0 0.00
Total 369685 7657.77 349024 8343.85
MALAPPURAM
Christians 56961 971.87 53696 1831.98
Muslims 621254 8077.69 494939 8508.63
Sikhs 11 1.09 0 0.00
Jains 0 0.00 0 0.00
NeoBudhists 0 0.00 0 0.00
Zorashtrians 0 0.00 0 0.00
Total 678226 9050.65 548635 10340.61
KOZHIKODE
Christians 68496 1688.17 59600 2209.63
Muslims 163942 3587.56 171656 4773.43
Sikhs 41 5.24 24 1.94
Jains 11 0.07 2 0.07
NeoBudhists 22 0.09 20 0.44
Zorashtrians 7226 141.51 2 0.03
Total 239738 5422.64 231304 6985.54
WAYANAD
Christians 134274 1376.05 164597 2864.99
Muslims 125783 1019.62 196525 2589.45
Sikhs 18 0.54 38 3.00
Jains 2 0.06 0 0.00
NeoBudhists 3 0.11 45 2.00
Zorashtrians 0 0.00 34 0.00
Total 260080 2396.38 361239 5459.44
KANNUR
Christians 162632 2756.57 91096 2970.87

XLIX
Muslims 148070 3903.14 151878 3059.28
Sikhs 13 0.47 2 0.00
Jains 2 0.12 2 0.04
NeoBudhists 24 0.12 4 0.72
Zorashtrians 189 9.49 1 0.02
Total 310930 6669.91 242983 6030.93
KASARGODE
Christians 115882 1715.26 117836 1898.00
Muslims 225353 2054.94 235753 2582.00
Sikhs 16 1.29 17 3.00
Jains 12 0.18 14 1.00
NeoBudhists 87 0.70 0 0.00
Zorashtrians 1 0.03 76 1.00
Total 341351 3772.40 353696 4485.00
GRAND TOTAL 4228310 98811.08 4293912 94941.34
Source: SLBC, Kerala.

L
APPENDIX-V
FII supply side dimension details
Sl.
No
Name of
District
Number
of bank
branches
Volume of Deposits and Credits
Deposits Credit Total
(Amounts in millions)
1 Trivandrum 733 6,25,264 3,76,151 1001415
2 Kollam 389 2,65,505 1,76,850 442355
3 Pattanamthitta 385 3,56,650 86,139 442789
4 Aleppy 385 2,70,705 1,17,987 388692
5 Kottayam 506 3,31,692 1,66,821 498513
6 Idukki 177 51,675 56,648 108323
7 Ernakulam 1,015 8,52,679 7,53,211 1605890
8 Trichur 729 4,99,119 2,54,089 753208
9 Palakkad 422 2,07,853 1,26,389 1,26,389
10 Malappuram 446 2,13,954 1,15,426 329380
11 Kozhikode 448 2,46,416 1,73,718 420134
12 Wayanad 121 29,899 37,499 67398
13 Kannur 390 2,40,367 1,22,639 363006
14 Kasargod 222 75,207 58,895 134102
Kerala 6,368 42,66,986 26,22,463 6889449
Source: RBI website


LI
APPENDIX-VI.
Calculation of FII of individual Beneficiaries
Sl.
No
D1 =A1-m1/
M1-m1
D2= A2-m2/
M2-m2
FII= 1 /2 *
(D1+D2)
1 20 0.63 23 0.74
1.37 0.685
2 28 0.88 24 0.77
1.65 0.825
3 21 0.66 19 0.61
1.27 0.635
4 20 0.63 23 0.74
1.37 0.685
5 23 0.72 23 0.74
1.46 0.73
6 22 0.69 20 0.65
1.34 0.67
7 21 0.66 17 0.55
1.21 0.605
8 20 0.63 18 0.58
1.21 0.605
9 28 0.88 23 0.74
1.62 0.81
10 21 0.66 13 0.42
1.08 0.54
11 20 0.63 23 0.74
1.37 0.685
12 23 0.72 23 0.74
1.46 0.73
13 22 0.69 19 0.61
1.3 0.65
14 21 0.66 23 0.74
1.4 0.7
15 24 0.75 20 0.65
1.4 0.7
16 23 0.72 20 0.65
1.37 0.685
17 22 0.69 23 0.74
1.43 0.715
18 22 0.69 23 0.74
1.43 0.715
19 21 0.66 23 0.74
1.4 0.7

LII
20 21 0.66 19 0.61
1.27 0.635
21 20 0.63 23 0.74
1.37 0.685
22 21 0.66 24 0.77
1.43 0.715
23 20 0.63 23 0.74
1.37 0.685
24 23 0.72 23 0.74
1.46 0.73
25 22 0.69 19 0.61
1.3 0.65
26 21 0.66 6 0.19
0.85 0.425
27 20 0.63 24 0.77
1.4 0.7
28 23 0.72 20 0.65
1.37 0.685
29 20 0.63 17 0.55
1.18 0.59
30 23 0.72 18 0.58
1.3 0.65
31 22 0.69 23 0.74
1.43 0.715
32 21 0.66 10 0.32
0.98 0.49
33 22 0.69 23 0.74
1.43 0.715
34 21 0.66 23 0.74
1.4 0.7
35 21 0.66 19 0.61
1.27 0.635
36 20 0.63 23 0.74
1.37 0.685
37 21 0.66 20 0.65
1.31 0.655
38 20 0.63 20 0.65
1.28 0.64
39 23 0.72 23 0.74
1.46 0.73
40 22 0.69 23 0.74
1.43 0.715
41 21 0.66 23 0.74
1.4 0.7
42 23 0.72 11 0.35
1.07 0.535

LIII
43 24 0.75 20 0.65
1.4 0.7
44 20 0.63 26 0.84
1.47 0.735
45 28 0.88 20 0.65
1.53 0.765
46 21 0.66 23 0.74
1.4 0.7
47 20 0.63 20 0.65
1.28 0.64
48 23 0.72 23 0.74
1.46 0.73
49 22 0.69 20 0.65
1.34 0.67
50 21 0.66 23 0.74
1.4 0.7
51 22 0.69 21 0.68
1.37 0.685
52 21 0.66 23 0.74
1.4 0.7
53 21 0.66 21 0.68
1.34 0.67
54 20 0.63 21 0.68
1.31 0.655
55 21 0.66 21 0.68
1.34 0.67
56 22 0.69 21 0.68
1.37 0.685
57 22 0.69 19 0.61
1.3 0.65
58 21 0.66 17 0.55
1.21 0.605
59 21 0.66 11 0.35
1.01 0.505
60 20 0.63 11 0.35
0.98 0.49
61 21 0.66 23 0.74
1.4 0.7
62 8 0.25 21 0.68
0.93 0.465
63 5 0.16 21 0.68
0.84 0.42
64 8 0.25 21 0.68
0.93 0.465
65 7 0.22 20 0.65
0.87 0.435

LIV
66 22 0.69 21 0.68
1.37 0.685
67 22 0.69 19 0.61
1.3 0.65
68 21 0.66 17 0.55
1.21 0.605
69 21 0.66 11 0.35
1.01 0.505
70 20 0.63 11 0.35
0.98 0.49
71 21 0.66 23 0.74
1.4 0.7
72 11 0.34 23 0.74
1.08 0.54
73 8 0.25 15 0.48
0.73 0.365
74 6 0.19 21 0.68
0.87 0.435
75 8 0.25 21 0.68
0.93 0.465
76 7 0.22 21 0.68
0.9 0.45
77 7 0.22 11 0.35
0.57 0.285
78 10 0.31 23 0.74
1.05 0.525
79 5 0.16 11 0.35
0.51 0.255
80 5 0.16 11 0.35
0.51 0.255
81 23 0.72 11 0.35
1.07 0.535
82 28 0.88 15 0.48
1.36 0.68
83 2 0.06 23 0.74
0.8 0.4
84 7 0.22 23 0.74
0.96 0.48
85 20 0.63 22 0.71
1.34 0.67
86 28 0.88 11 0.35
1.23 0.615
87 21 0.66 15 0.48
1.14 0.57
88 20 0.63 9 0.29
0.92 0.46

LV
89 23 0.72 12 0.39
1.11 0.555
90 22 0.69 7 0.23
0.92 0.46
91 21 0.66 10 0.32
0.98 0.49
92 4 0.13 18 0.58
0.71 0.355
93 3 0.09 20 0.65
0.74 0.37
94 20 0.63 20 0.65
1.28 0.64
95 28 0.88 20 0.65
1.53 0.765
96 21 0.66 28 0.90
1.56 0.78
97 20 0.63 27 0.87
1.5 0.75
98 23 0.72 23 0.74
1.46 0.73
99 22 0.69 23 0.74
1.43 0.715
100 21 0.66 7 0.23
0.89 0.445
101 32 1.00 23 0.74
1.74 0.87
102 23 0.72 15 0.48
1.2 0.6
103 3 0.09 2 0.06
0.15 0.075
104 10 0.31 10 0.32
0.63 0.315
105 4 0.13 18 0.58
0.71 0.355
106 3 0.09 17 0.55
0.64 0.32
107 22 0.69 21 0.68
1.37 0.685
108 21 0.66 23 0.74
1.4 0.7
109 21 0.66 28 0.90
1.56 0.78
110 20 0.63 27 0.87
1.5 0.75
111 21 0.66 27 0.87
1.53 0.765

LVI
112 9 0.28 20 0.65
0.93 0.465
113 20 0.63 0 0.00
0.63 0.315
114 22 0.69 24 0.77
1.46 0.73
115 21 0.66 13 0.42
1.08 0.54
116 21 0.66 19 0.61
1.27 0.635
117 20 0.63 19 0.61
1.24 0.62
118 21 0.66 23 0.74
1.4 0.7
119 28 0.88 29 0.94
1.82 0.91
120 8 0.25 11 0.35
0.6 0.3
121 8 0.25 11 0.35
0.6 0.3
122 23 0.72 11 0.35
1.07 0.535
123 22 0.69 25 0.81
1.5 0.75
124 21 0.66 16 0.52
1.18 0.59
125 21 0.66 26 0.84
1.5 0.75
126 20 0.63 9 0.29
0.92 0.46
127 21 0.66 23 0.74
1.4 0.7
128 26 0.81 4 0.13
0.94 0.47
129 28 0.88 23 0.74
1.62 0.81
130 8 0.25 23 0.74
0.99 0.495
131 13 0.41 7 0.23
0.64 0.32
132 22 0.69 7 0.23
0.92 0.46
133 26 0.81 20 0.65
1.46 0.73
134 9 0.28 7 0.23
0.51 0.255

LVII
135 5 0.16 7 0.23
0.39 0.195
136 26 0.81 23 0.74
1.55 0.775
137 8 0.25 19 0.61
0.86 0.43
138 6 0.19 7 0.23
0.42 0.21
139 4 0.13 21 0.68
0.81 0.405
140 8 0.25 24 0.77
1.02 0.51
141 5 0.16 7 0.23
0.39 0.195
142 4 0.13 15 0.48
0.61 0.305
143 8 0.25 2 0.06
0.31 0.155
144 2 0.06 4 0.13
0.19 0.095
145 13 0.41 21 0.68
1.09 0.545
146 3 0.09 10 0.32
0.41 0.205
147 4 0.13 5 0.16
0.29 0.145
148 6 0.19 3 0.10
0.29 0.145
149 28 0.88 16 0.52
1.4 0.7
150 5 0.16 2 0.06
0.22 0.11
151 4 0.13 6 0.19
0.32 0.16
152 5 0.16 24 0.77
0.93 0.465
153 3 0.09 10 0.32
0.41 0.205
154 3 0.09 3 0.10
0.19 0.095
155 30 0.94 24 0.77
1.71 0.855
156 6 0.19 2 0.06
0.25 0.125
157 5 0.16 9 0.29
0.45 0.225

LVIII
158 28 0.88 11 0.35
1.23 0.615
160 9 0.28 5 0.16
0.44 0.22
161 20 0.63 21 0.68
1.31 0.655
162 1 0.03 3 0.10
0.13 0.065
163 3 0.09 3 0.10
0.19 0.095
164 6 0.19 4 0.13
0.32 0.16
165 8 0.25 15 0.48
0.73 0.365
166 4 0.13 2 0.06
0.19 0.095
167 3 0.09 9 0.29
0.38 0.19
168 25 0.78 7 0.23
1.01 0.505
169 6 0.19 7 0.23
0.42 0.21
170 3 0.09 0 0.00
0.09 0.045
171 20 0.63 23 0.74
1.37 0.685
172 28 0.88 23 0.74
1.62 0.81
173 21 0.66 5 0.16
0.82 0.41
174 20 0.63 9 0.29
0.92 0.46
175 23 0.72 20 0.65
1.37 0.685
176 22 0.69 7 0.23
0.92 0.46
177 21 0.66 7 0.23
0.89 0.445
178 26 0.81 26 0.84
1.65 0.825
179 6 0.19 18 0.58
0.77 0.385
180 11 0.34 7 0.23
0.57 0.285
181 9 0.28 21 0.68
0.96 0.48

LIX
182 11 0.34 7 0.23
0.57 0.285
183 4 0.13 3 0.10
0.23 0.115
184 23 0.72 1 0.03
0.75 0.375
185 10 0.31 1 0.03
0.34 0.17
186 9 0.28 26 0.84
1.12 0.56
187 3 0.09 20 0.65
0.74 0.37
188 3 0.09 11 0.35
0.44 0.22
189 6 0.19 20 0.65
0.84 0.42
190 6 0.19 20 0.65
0.84 0.42
191 28 0.88 18 0.58
1.46 0.73
192 5 0.16 2 0.06
0.22 0.11
193 4 0.13 4 0.13
0.26 0.13
194 7 0.22 18 0.58
0.8 0.4
195 3 0.09 9 0.29
0.38 0.19
196 3 0.09 3 0.10
0.19 0.095
197 30 0.94 23 0.74
1.68 0.84
198 22 0.69 28 0.90
1.59 0.795
199 7 0.22 18 0.58
0.8 0.4
200 27 0.84 20 0.65
1.49 0.745
201 6 0.19 11 0.35
0.54 0.27
202 20 0.63 26 0.84
1.47 0.735
203 1 0.03 4 0.13
0.16 0.08
204 3 0.09 4 0.13
0.22 0.11

LX
205 4 0.13 8 0.26
0.39 0.195
206 3 0.09 7 0.23
0.32 0.16
207 11 0.34 10 0.32
0.66 0.33
208 4 0.13 12 0.39
0.52 0.26
209 1 0.03 25 0.81
0.84 0.42
210 5 0.16 25 0.81
0.97 0.485
211 1 0.03 22 0.71
0.74 0.37
212 0 0.00 9 0.29
0.29 0.145
213 8 0.25 15 0.48
0.73 0.365
214 0 0.00 10 0.32
0.32 0.16
215 0 0.00 11 0.35
0.35 0.175
216 7 0.22 5 0.16
0.38 0.19
217 5 0.16 8 0.26
0.42 0.21
218 26 0.81 24 0.77
1.58 0.79
219 6 0.19 21 0.68
0.87 0.435
220 11 0.34 9 0.29
0.63 0.315
221 9 0.28 21 0.68
0.96 0.48
222 8 0.25 10 0.32
0.57 0.285
223 5 0.16 6 0.19
0.35 0.175
224 3 0.09 1 0.03
0.12 0.06
225 30 0.94 23 0.74
1.68 0.84
226 4 0.13 21 0.68
0.81 0.405
227 20 0.63 3 0.10
0.73 0.365

LXI
228 22 0.69 24 0.77
1.46 0.73
229 21 0.66 11 0.35
1.01 0.505
230 21 0.66 22 0.71
1.37 0.685
231 20 0.63 10 0.32
0.95 0.475
232 21 0.66 23 0.74
1.4 0.7
233 5 0.16 21 0.68
0.84 0.42
234 28 0.88 20 0.65
1.53 0.765
235 5 0.16 7 0.23
0.39 0.195
236 3 0.09 7 0.23
0.32 0.16
237 22 0.69 21 0.68
1.37 0.685
238 21 0.66 7 0.23
0.89 0.445
239 21 0.66 10 0.32
0.98 0.49
240 20 0.63 15 0.48
1.11 0.555
241 21 0.66 15 0.48
1.14 0.57
242 32 1.00 23 0.74
1.74 0.87
243 28 0.88 23 0.74
1.62 0.81
244 25 0.78 19 0.61
1.39 0.695
245 22 0.69 23 0.74
1.43 0.715
246 21 0.66 23 0.74
1.4 0.7
247 21 0.66 20 0.65
1.31 0.655
248 20 0.63 17 0.55
1.18 0.59
249 21 0.66 18 0.58
1.24 0.62
250 28 0.88 23 0.74
1.62 0.81

LXII
251 24 0.75 13 0.42
1.17 0.585
252 30 0.94 23 0.74
1.68 0.84
253 32 1.00 23 0.74
1.74 0.87
254 27 0.84 19 0.61
1.45 0.725
255 28 0.88 23 0.74
1.62 0.81
256 24 0.75 20 0.65
1.4 0.7
257 30 0.94 20 0.65
1.59 0.795
258 27 0.84 23 0.74
1.58 0.79
259 28 0.88 23 0.74
1.62 0.81
260 32 1.00 23 0.74
1.74 0.87
261 28 0.88 19 0.61
1.49 0.745
262 29 0.91 23 0.74
1.65 0.825
263 32 1.00 23 0.74
1.74 0.87
264 32 1.00 23 0.74
1.74 0.87
265 28 0.88 23 0.74
1.62 0.81
266 26 0.81 19 0.61
1.42 0.71
267 32 1.00 6 0.19
1.19 0.595
268 31 0.97 24 0.77
1.74 0.87
269 27 0.84 20 0.65
1.49 0.745
270 29 0.91 17 0.55
1.46 0.73
271 28 0.88 18 0.58
1.46 0.73
272 29 0.91 23 0.74
1.65 0.825
273 20 0.63 10 0.32
0.95 0.475

LXIII
274 30 0.94 23 0.74
1.68 0.84
275 32 1.00 23 0.74
1.74 0.87
276 27 0.84 19 0.61
1.45 0.725
277 28 0.88 23 0.74
1.62 0.81
278 24 0.75 20 0.65
1.4 0.7
279 30 0.94 20 0.65
1.59 0.795
280 29 0.91 23 0.74
1.65 0.825
281 28 0.88 23 0.74
1.62 0.81
282 32 1.00 23 0.74
1.74 0.87
282 23 0.72 11 0.35
1.07 0.535
283 24 0.75 20 0.65
1.4 0.7
284 27 0.84 31 1.00
1.84 0.92
285 23 0.72 23 0.74
1.46 0.73
286 32 1.00 23 0.74
1.74 0.87
287 13 0.41 21 0.68
1.09 0.545
288 7 0.22 23 0.74
0.96 0.48
289 24 0.75 23 0.74
1.49 0.745
290 4 0.13 23 0.74
0.87 0.435
291 6 0.19 23 0.74
0.93 0.465
292 8 0.25 23 0.74
0.99 0.495
293 5 0.16 21 0.68
0.84 0.42
294 9 0.28 21 0.68
0.96 0.48
295 7 0.22 21 0.68
0.9 0.45

LXIV
296 32 1.00 21 0.68
1.68 0.84
297 6 0.19 19 0.61
0.8 0.4
298 8 0.25 17 0.55
0.8 0.4
299 5 0.16 11 0.35
0.51 0.255
300 5 0.16 11 0.35
0.51 0.255
Total 5117 159.91 5071 163.58
323.49 161.745
Source: Field survey
FII of Kerala= 161.745/300= 0.54.

LXV
List of Publications
International/National Journal Publications
1. Raihanath M. P., & Pavithran K.B. (2014). “Financial Inclusion through
MGNREGS- A study of the Roadmap villages of Kannur District”. Business
Sciences International Research Journal, International Multi-disciplinary
Research Foundation Publications. Vol 2, issue 1, July 2014. ISSN: 2321-3191.
2. Raihanath M. P., & Pavithran K.B. (2014). “Role of Commercial Banks in the
Financial Inclusion Programme”. Journal of Business Management and Social
Science Research. Blue Ocean Research Journal. Vol-3 Issue.5, May 2014.
ISSN (Online): 2319-5614.
3. Raihanath M. P., & Pavithran K.B. (2013). “Inclusive growth at the Bottom of
the Pyramid through Financial Inclusion”. Rajagiri Management Journal,
Rajagiri Centre for Business Studies Publications, Vol.7, Issue 2, December
2013. ISSN: 0972-9968.