
Exploring the effects of geotextiles in the performance of highway ...
16
-1- Exploring the effects of geotextiles in the performance of highway filter 1 drains 2 L.A. Sañudo-Fontaneda 1* , S.J. Coupe 2 , S.M. Charlesworth 3 , E.G.Rowlands 4 3 1 Department of Construction and Manufacturing Engineering. University of Oviedo. Polytechnic School 4 of Mieres. Calle Gonzalo Gutierrez Quiros s/n. 33600, Mieres (Asturias), Spain. Email: 5 [email protected] 6 2 Centre for Agroecology, Water and Resilience (CAWR), Coventry University, Ryton Gardens, Wolston 7 Lane, Ryton-on-Dunsmore, CV8 3LG, Coventry, UK. Email: [email protected] 8 3 Centre for Agroecology, Water and Resilience (CAWR), Coventry University, Ryton Gardens, Wolston 9 Lane, Ryton-on-Dunsmore, CV8 3LG, Coventry, UK. Email: [email protected] 10 4 Carnell Group Ltd. Gothic House, Market Place, ST19 5DJ, Penkridge, United Kingdom. Email: 11 [email protected] 12 13 * Corresponding author details: Email: [email protected] 14 15 Abstract 16 Highway Filter Drains (HFD) are one of the most utilised drainage systems for roads, being considered as 17 an environmental solution for sustainable drainage in transport infrastructures. However, little research has 18 been done to understand their performance, representing a significant knowledge gap. This article therefore 19 determines the hydraulic and clogging response of 3 different HFD designs in the laboratory; one standard 20 design with British Standard Type B aggregate, and 2 new designs including a geotextile located at 50 mm 21 and 500 mm depth from the surface of the HFD structure in order to assess the effect of the geotextile. The 22 laboratory models were initially subjected to 9 rainfall scenarios with 3 rainfall intensities (2.5, 5 and 10 23 mm/h) and 3 storm durations (5, 10 and 15 minutes). Subsequently, the equivalent of 2-years’ worth of 24 pollutants were added to test possible clogging issues under the highest intensity rainfall event, 25 corresponding to a 1 in 1 year return period for the West Midlands, UK. No clogging issues were found in 26 any of the models although the majority of the sediments were concentrated in the first 50 mm of the HFD 27
-
Upload
khangminh22 -
Category
Documents
-
view
4 -
download
0
Transcript of Exploring the effects of geotextiles in the performance of highway ...
-1-
Exploring the effects of geotextiles in the performance of highway filter 1
drains 2
L.A. Sañudo-Fontaneda 1*, S.J. Coupe 2, S.M. Charlesworth 3, E.G.Rowlands 4 3
1 Department of Construction and Manufacturing Engineering. University of Oviedo. Polytechnic School 4
of Mieres. Calle Gonzalo Gutierrez Quiros s/n. 33600, Mieres (Asturias), Spain. Email: 5
2 Centre for Agroecology, Water and Resilience (CAWR), Coventry University, Ryton Gardens, Wolston 7
Lane, Ryton-on-Dunsmore, CV8 3LG, Coventry, UK. Email: [email protected] 8
3 Centre for Agroecology, Water and Resilience (CAWR), Coventry University, Ryton Gardens, Wolston 9
Lane, Ryton-on-Dunsmore, CV8 3LG, Coventry, UK. Email: [email protected] 10
4 Carnell Group Ltd. Gothic House, Market Place, ST19 5DJ, Penkridge, United Kingdom. Email: 11
13
*Corresponding author details: Email: [email protected] 14
15
Abstract 16
Highway Filter Drains (HFD) are one of the most utilised drainage systems for roads, being considered as 17
an environmental solution for sustainable drainage in transport infrastructures. However, little research has 18
been done to understand their performance, representing a significant knowledge gap. This article therefore 19
determines the hydraulic and clogging response of 3 different HFD designs in the laboratory; one standard 20
design with British Standard Type B aggregate, and 2 new designs including a geotextile located at 50 mm 21
and 500 mm depth from the surface of the HFD structure in order to assess the effect of the geotextile. The 22
laboratory models were initially subjected to 9 rainfall scenarios with 3 rainfall intensities (2.5, 5 and 10 23
mm/h) and 3 storm durations (5, 10 and 15 minutes). Subsequently, the equivalent of 2-years’ worth of 24
pollutants were added to test possible clogging issues under the highest intensity rainfall event, 25
corresponding to a 1 in 1 year return period for the West Midlands, UK. No clogging issues were found in 26
any of the models although the majority of the sediments were concentrated in the first 50 mm of the HFD 27
-2-
profile, with higher percentages (>90% of the sediment added) in those models with an upper geotextile. 28
Location of the geotextile significantly influenced (p-value = 0.05) the hydraulic performance of the HFD. 29
30
Keywords: Geosynthetics; Clogging; Geotextile; Highway Filter Drains; Road Safety; Sustainable 31
Drainage Systems (SuDS). 32
33
34
1. Introduction 35
Vehicle traffic in the UK has increased dramatically since the 1950s to more than 300 billion vehicle miles 36
in 2014 (UK Department of Transport, 2015). To cope with this high volume of traffic, the UK has a road 37
network of nearly 1.8 km road/km2 of land area with a total length of 419,596 km, of which 3,674 km are 38
motorways and 49,040 km are main roads (Nicodeme et al. 2013). 39
The Strategic Road Network (SRN) (including motorways and A roads) (UK Department for Transport, 40
2012) and local road networks are England’s most valuable infrastructure asset, valued at approximately 41
£344 billion and as well as the roads, includes other infrastructure such as bridges, embankments and 42
drainage systems (House of Commons, 2014). In 2012-2013 public spending on maintaining England’s 43
roads was £4 billion, divided between the UK Department of Transport, the Highways Agency (Highways 44
England since 2015) and Local Authorities. The operation, maintenance and improvement of the SRN, 45
which represents 2% of the total road network (7,080 km), is the responsibility of The Department of 46
Transport through Highways England (House of Commons, 2014). 47
Road drainage systems are therefore a vital asset in transport infrastructure, contributing to the safety of 48
road users by removing surface runoff, improving visibility and mitigating environmental problems to 49
receiving waters. Hence, they are an important part of the maintenance programme developed by Highways 50
England (Ellis and Rowlands, 2007; Coupe et al. 2015). 51
Filter Drains (FD), kerbs and gullies connected to pipes below ground and surface water channels along the 52
pavement edge, are the main methods of dealing with surface runoff (DMRB-UK, 1997a). FD, also known 53
as ‘French Drains’, are not only one of the most used drainage systems in the UK, but are also an historically 54
important engineering technique across the world. FDs when used on highways are defined as Highway FD 55
or HFD, terminology which will be used hereinafter. Approximately 50% of the SRN in England (in total 56
-3-
about 7,000 km accounting for traffic flow in both directions) uses HFD as their main drainage technique 57
(Coupe et al. 2015). 58
HFD are designed to cope with a wide range of storm events, to avoid flooding problems. Thus, the Design 59
Manual for Roads and Bridges (DMRB-UK, 2004), Volume 4 Section 2 (Drainage), stipulates that highway 60
drainage systems should be designed for high intensity events over a few minutes (short durations) with 61
return periods of 1 year (with no surcharge of piped systems or road-edge channels) or 5 years with no 62
flooding on the carriageway. 63
According to DMRB-UK, 1997b, UK HFDs should be a minimum of 0.6 m below the pavement sub-base 64
in order to prevent groundwater entering the pavement structure. Including the full depth of the road 65
structure, the typical depth for an HFD is up to 1 m with a width of approximately 1 m (Figure 1). 66
A perforated pipe is located at a depth of 850 mm in a full-sized HFD, details and recommendations such 67
as its diameter, the type of aggregate used for the bedding layer and the main body of the HFD are all given 68
in the Design Manual for Roads and Bridges (DMRB-UK, 2001) and the UK Highways Agency Manual 69
of Contract Documents for Highway Works (MCDH) (2009). 70
After a long operational life, often 30 to 40 years of service, some HFD may need maintenance and in order 71
to judge this, their performance is monitored using high-speed non-intrusive Ground Penetrating Radar 72
(GPR) surveys, specifically SMARTscan both on verges and central reservations (Carnell, 2015). However, 73
there is a lack of comprehensive understanding of the hydraulic processes that take place in HFDs and how 74
resistant and resilient they are to flooding and clogging. 75
The impact of this research is wider than just the UK as HFD are used in other countries across the world 76
such as the Republic of Ireland where a visual inspection carried by Bruen et al. (2006) on the Irish dual 77
carriageways and motorways found that more than 40% of them had HFD as their main drainage system. 78
Also in Ireland, issues around clogging have been commonly addressed by the use of a geotextile as a 79
barrier to fine material ingress (Bruen et al. 2006; Desta et al. 2007) whilst still allowing water to flow 80
through and into the drainage material and pipe. Other international drainage techniques similar to HFD 81
also use geotextiles such as the so-called “edge drains” in the U.S.A (Kearns, 1992; Koerner et al., 1996) 82
and Canada (Raymond et al. 2000); and also in Spain (Castro-Fresno et al. 2013; Andres-Valeri et al. 2014; 83
Sañudo Fontaneda et al. 2016) where there are specifications including the use of geosynthetic products in 84
drainage structures (AENOR, 2001; Bustos et al. 2007). 85
-4-
Despite the fact that geosynthetics have been included successfully in the structure of other SuDS such as 86
Permeable Pavement Systems (PPS) in the UK (e.g. Pratt et al. 1999), their utilisation in association with 87
HFDs is still viewed with scepticism by some engineers due to concerns over possible blockage of the 88
aggregate layer and/or the pipe, leading to a reduction in infiltration capacity. In order to address these 89
issues, there were 2 aims of this research: 90
1. To determine the effects on HFD hydraulic performance of the inclusion of geotextiles due to its 91
water retention characteristic (WRC). This concept is described by Chinkulkijniwat et al. (2017), 92
who also highlight the lack of knowledge of geotextile WRC. 93
2. To determine the influence of the geotextile on the potential for clogging for short return periods. 94
95
2. Materials and Methods 96
2.1. Experimental preparation and materials 97
Ten plate-glass rigs were set up: 4 replicates of the Standard HFD, and three replicates for each HFD model 98
containing geotextiles at 2 different depths in the profile (50 mm and 500 mm respectively). The rigs had 99
5 mm thick walls and measured 215 mm x 215 mm x 650 mm, thus their volume was 0.030 m3 and surface 100
area was 0.046 m2 (see Figure 2). No lower pipe was used, since the aim was to analyse the hydraulic and 101
clogging performance of the aggregate and to isolate the influence of the geotextile layer on the general 102
performance of the HFD, following the preparation method presented in Sañudo-Fontaneda et al. (2017). 103
The outflow, used to build the hydrographs of performance for every HFD model, was measured using 104
funnels placed at the bottom of each plate-glass rig to direct the outflow to a sample collector (see Figure 105
2). 106
The details of the materials used to replicate the three different HFD designs, as shown in Figure 2, are 107
presented below: 108
1. Standard HFD. Made of Type B aggregate (see Figure 2). 109
2. HFD + Lower Geotextile. As in the Standard HFD plus a geotextile layer at 500 mm depth from 110
the HFD surface and 50 mm from the base (see Figure 3). 111
3. HFD + Upper Geotextile. As in the Standard HFD above plus a geotextile layer at 50 mm depth 112
from the surface (see Figure 3). 113
-5-
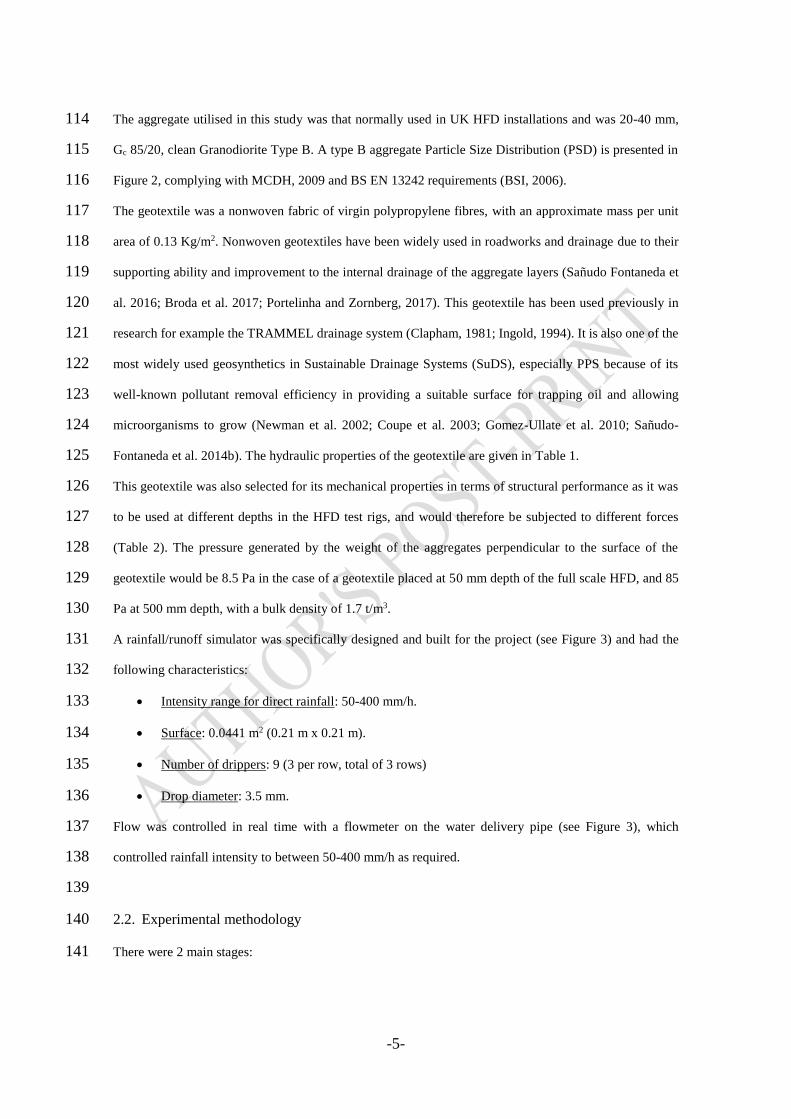
The aggregate utilised in this study was that normally used in UK HFD installations and was 20-40 mm, 114
Gc 85/20, clean Granodiorite Type B. A type B aggregate Particle Size Distribution (PSD) is presented in 115
Figure 2, complying with MCDH, 2009 and BS EN 13242 requirements (BSI, 2006). 116
The geotextile was a nonwoven fabric of virgin polypropylene fibres, with an approximate mass per unit 117
area of 0.13 Kg/m2. Nonwoven geotextiles have been widely used in roadworks and drainage due to their 118
supporting ability and improvement to the internal drainage of the aggregate layers (Sañudo Fontaneda et 119
al. 2016; Broda et al. 2017; Portelinha and Zornberg, 2017). This geotextile has been used previously in 120
research for example the TRAMMEL drainage system (Clapham, 1981; Ingold, 1994). It is also one of the 121
most widely used geosynthetics in Sustainable Drainage Systems (SuDS), especially PPS because of its 122
well-known pollutant removal efficiency in providing a suitable surface for trapping oil and allowing 123
microorganisms to grow (Newman et al. 2002; Coupe et al. 2003; Gomez-Ullate et al. 2010; Sañudo-124
Fontaneda et al. 2014b). The hydraulic properties of the geotextile are given in Table 1. 125
This geotextile was also selected for its mechanical properties in terms of structural performance as it was 126
to be used at different depths in the HFD test rigs, and would therefore be subjected to different forces 127
(Table 2). The pressure generated by the weight of the aggregates perpendicular to the surface of the 128
geotextile would be 8.5 Pa in the case of a geotextile placed at 50 mm depth of the full scale HFD, and 85 129
Pa at 500 mm depth, with a bulk density of 1.7 t/m3. 130
A rainfall/runoff simulator was specifically designed and built for the project (see Figure 3) and had the 131
following characteristics: 132
Intensity range for direct rainfall: 50-400 mm/h. 133
Surface: 0.0441 m2 (0.21 m x 0.21 m). 134
Number of drippers: 9 (3 per row, total of 3 rows) 135
Drop diameter: 3.5 mm. 136
Flow was controlled in real time with a flowmeter on the water delivery pipe (see Figure 3), which 137
controlled rainfall intensity to between 50-400 mm/h as required. 138
139
2.2. Experimental methodology 140
There were 2 main stages: 141
-6-
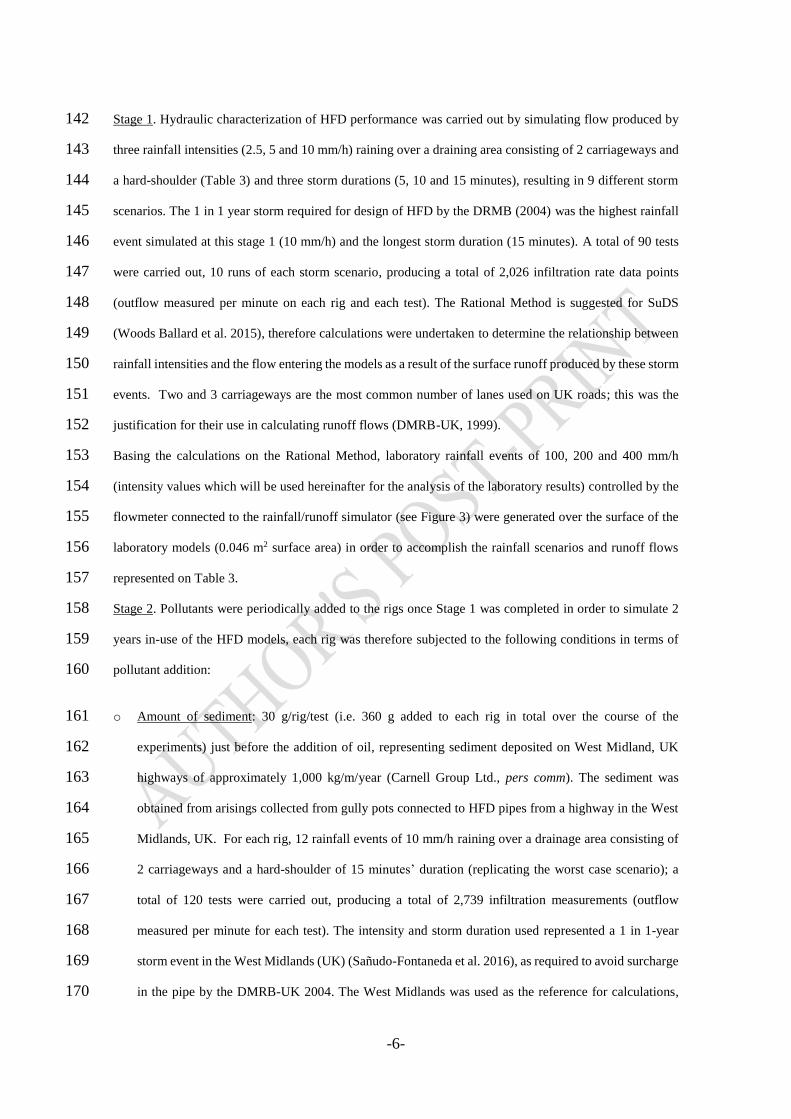
Stage 1. Hydraulic characterization of HFD performance was carried out by simulating flow produced by 142
three rainfall intensities (2.5, 5 and 10 mm/h) raining over a draining area consisting of 2 carriageways and 143
a hard-shoulder (Table 3) and three storm durations (5, 10 and 15 minutes), resulting in 9 different storm 144
scenarios. The 1 in 1 year storm required for design of HFD by the DRMB (2004) was the highest rainfall 145
event simulated at this stage 1 (10 mm/h) and the longest storm duration (15 minutes). A total of 90 tests 146
were carried out, 10 runs of each storm scenario, producing a total of 2,026 infiltration rate data points 147
(outflow measured per minute on each rig and each test). The Rational Method is suggested for SuDS 148
(Woods Ballard et al. 2015), therefore calculations were undertaken to determine the relationship between 149
rainfall intensities and the flow entering the models as a result of the surface runoff produced by these storm 150
events. Two and 3 carriageways are the most common number of lanes used on UK roads; this was the 151
justification for their use in calculating runoff flows (DMRB-UK, 1999). 152
Basing the calculations on the Rational Method, laboratory rainfall events of 100, 200 and 400 mm/h 153
(intensity values which will be used hereinafter for the analysis of the laboratory results) controlled by the 154
flowmeter connected to the rainfall/runoff simulator (see Figure 3) were generated over the surface of the 155
laboratory models (0.046 m2 surface area) in order to accomplish the rainfall scenarios and runoff flows 156
represented on Table 3. 157
Stage 2. Pollutants were periodically added to the rigs once Stage 1 was completed in order to simulate 2 158
years in-use of the HFD models, each rig was therefore subjected to the following conditions in terms of 159
pollutant addition: 160
o Amount of sediment: 30 g/rig/test (i.e. 360 g added to each rig in total over the course of the 161
experiments) just before the addition of oil, representing sediment deposited on West Midland, UK 162
highways of approximately 1,000 kg/m/year (Carnell Group Ltd., pers comm). The sediment was 163
obtained from arisings collected from gully pots connected to HFD pipes from a highway in the West 164
Midlands, UK. For each rig, 12 rainfall events of 10 mm/h raining over a drainage area consisting of 165
2 carriageways and a hard-shoulder of 15 minutes’ duration (replicating the worst case scenario); a 166
total of 120 tests were carried out, producing a total of 2,739 infiltration measurements (outflow 167
measured per minute for each test). The intensity and storm duration used represented a 1 in 1-year 168
storm event in the West Midlands (UK) (Sañudo-Fontaneda et al. 2016), as required to avoid surcharge 169
in the pipe by the DMRB-UK 2004. The West Midlands was used as the reference for calculations, 170
-7-
both from the amount of sediments and the rainfall volumes, due to the fact that there will be field 171
studies undertaken in the future which will use the laboratory studies as comparators. The reason for 172
using 2 years’ worth of sediments was based on previous studies carried out by Mitchell (2015) in 173
Scotland which indicated 2 years until the start of clogging issues, both in the surface layer and the 174
pipe at the bottom of the HFD. 175
o Amount of oil: 6.121 g/rig/test (74.58 g of oil was added to each rig in total over the course of the 176
experiments) was based on Gomez-Ullate et al. (2010), Sañudo-Fontaneda et al. (2014b) and Bayon et 177
al. (2015) who multiplied the suggested 9.27 g/year/m2 by Pratt et al. (1999) by 100 to represent a 178
worst-case scenario such as a catastrophic oil spill from a car sump. The oil was a used part synthetic 179
lubricating oil, mainly composed of high molecular weight fractions, with C21-C40 making up 99.03% 180
of total petroleum hydrocarbons (TPH). 181
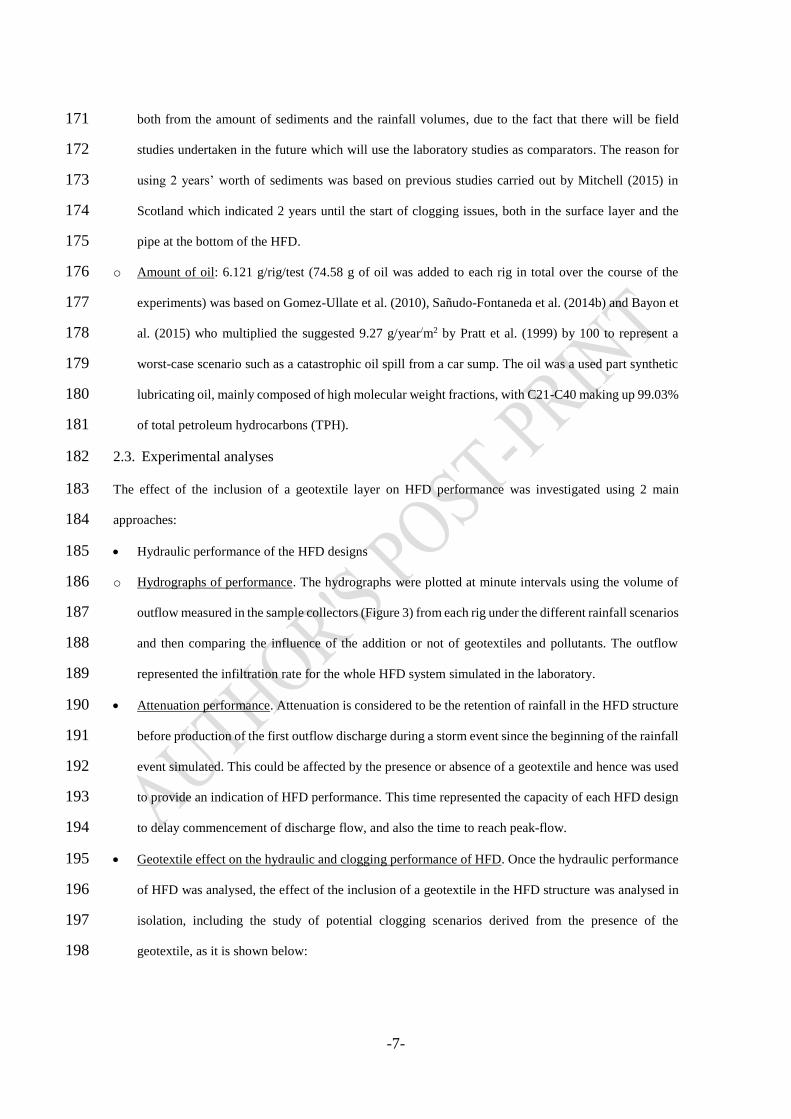
2.3. Experimental analyses 182
The effect of the inclusion of a geotextile layer on HFD performance was investigated using 2 main 183
approaches: 184
Hydraulic performance of the HFD designs 185
o Hydrographs of performance. The hydrographs were plotted at minute intervals using the volume of 186
outflow measured in the sample collectors (Figure 3) from each rig under the different rainfall scenarios 187
and then comparing the influence of the addition or not of geotextiles and pollutants. The outflow 188
represented the infiltration rate for the whole HFD system simulated in the laboratory. 189
Attenuation performance. Attenuation is considered to be the retention of rainfall in the HFD structure 190
before production of the first outflow discharge during a storm event since the beginning of the rainfall 191
event simulated. This could be affected by the presence or absence of a geotextile and hence was used 192
to provide an indication of HFD performance. This time represented the capacity of each HFD design 193
to delay commencement of discharge flow, and also the time to reach peak-flow. 194
Geotextile effect on the hydraulic and clogging performance of HFD. Once the hydraulic performance 195
of HFD was analysed, the effect of the inclusion of a geotextile in the HFD structure was analysed in 196
isolation, including the study of potential clogging scenarios derived from the presence of the 197
geotextile, as it is shown below: 198
-8-
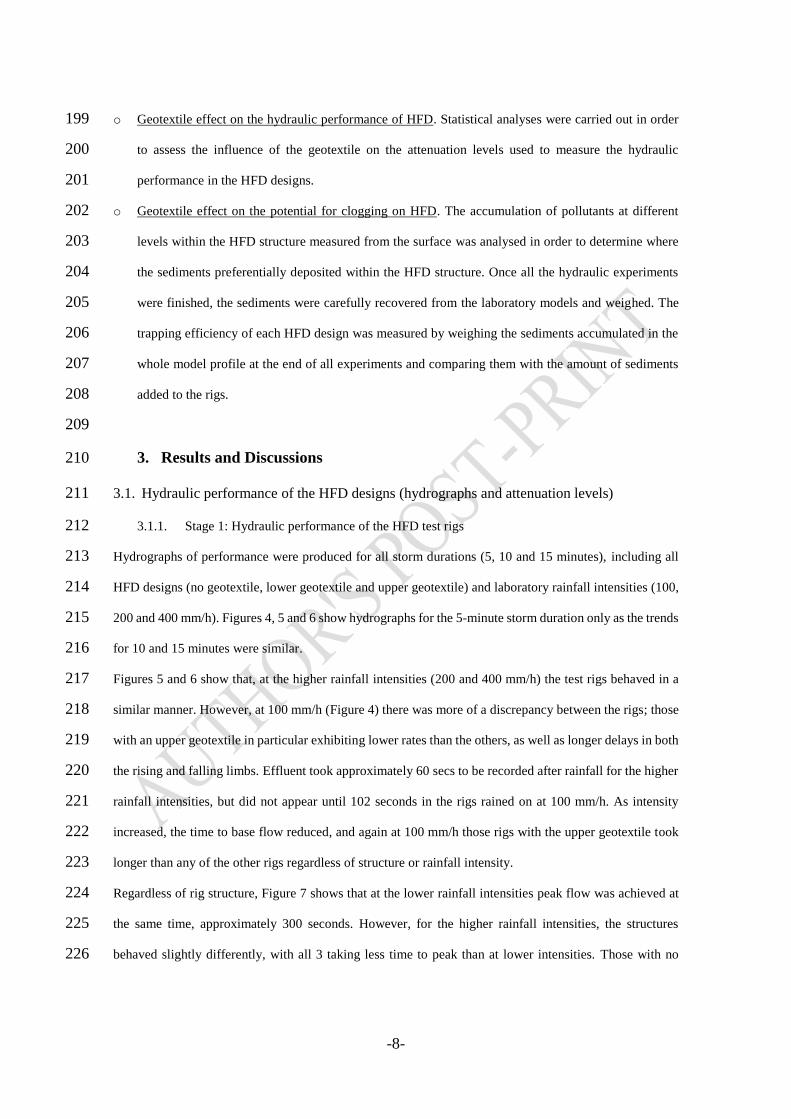
o Geotextile effect on the hydraulic performance of HFD. Statistical analyses were carried out in order 199
to assess the influence of the geotextile on the attenuation levels used to measure the hydraulic 200
performance in the HFD designs. 201
o Geotextile effect on the potential for clogging on HFD. The accumulation of pollutants at different 202
levels within the HFD structure measured from the surface was analysed in order to determine where 203
the sediments preferentially deposited within the HFD structure. Once all the hydraulic experiments 204
were finished, the sediments were carefully recovered from the laboratory models and weighed. The 205
trapping efficiency of each HFD design was measured by weighing the sediments accumulated in the 206
whole model profile at the end of all experiments and comparing them with the amount of sediments 207
added to the rigs. 208
209
3. Results and Discussions 210
3.1. Hydraulic performance of the HFD designs (hydrographs and attenuation levels) 211
3.1.1. Stage 1: Hydraulic performance of the HFD test rigs 212
Hydrographs of performance were produced for all storm durations (5, 10 and 15 minutes), including all 213
HFD designs (no geotextile, lower geotextile and upper geotextile) and laboratory rainfall intensities (100, 214
200 and 400 mm/h). Figures 4, 5 and 6 show hydrographs for the 5-minute storm duration only as the trends 215
for 10 and 15 minutes were similar. 216
Figures 5 and 6 show that, at the higher rainfall intensities (200 and 400 mm/h) the test rigs behaved in a 217
similar manner. However, at 100 mm/h (Figure 4) there was more of a discrepancy between the rigs; those 218
with an upper geotextile in particular exhibiting lower rates than the others, as well as longer delays in both 219
the rising and falling limbs. Effluent took approximately 60 secs to be recorded after rainfall for the higher 220
rainfall intensities, but did not appear until 102 seconds in the rigs rained on at 100 mm/h. As intensity 221
increased, the time to base flow reduced, and again at 100 mm/h those rigs with the upper geotextile took 222
longer than any of the other rigs regardless of structure or rainfall intensity. 223
Regardless of rig structure, Figure 7 shows that at the lower rainfall intensities peak flow was achieved at 224
the same time, approximately 300 seconds. However, for the higher rainfall intensities, the structures 225
behaved slightly differently, with all 3 taking less time to peak than at lower intensities. Those with no 226
-9-
geotextile reached the peak more quickly than those with a lower geotextile which were quicker than rigs 227
with an upper geotextile. 228
In order to assess the statistical significance of geotextile location, duration of the simulated rainfall and its 229
intensity, statistical testing was undertaken. A Kolmogorov-Smirnov test was carried out in order to check 230
whether the data were normally distributed. The potential influence of the presence of a geotextile on 231
hydraulic performance was analysed using ANOVA for parametric variables (normally distributed) with k-232
samples (3 for geotextile location: no geotextile, lower geotextile and upper geotextile). ANOVA was also 233
used to check the statistical significance of storm duration on attenuation, and the influence of rainfall 234
intensity on attenuation performance was tested using Kruskal Wallis. Table 4 summarises the results of 235
these statistical tests, showing that geotextile location had a significant influence on attenuation, as did 236
rainfall intensity, both at the 95% confidence level. However, storm duration was found not to significantly 237
affect attenuation performance. 238
Table 5 shows the impact of rig structure and rainfall intensity on attenuation performance through the use 239
of equations of performance (trends). The values of R2 for the rigs without a geotextile and those including 240
a lower geotextile were >0.70, whilst that for the rigs with an upper geotextile was >0.5. 241
242
3.1.2. Stage 2: the effect of pollutant addition on HFD performance 243
That the addition of pollutants did influence hydraulic performance is illustrated in Figure 8 which shows 244
that the capacity of the system was reduced in terms of its ability to attenuate the storm peak. Sediments 245
also introduced higher variability as it can be seen in the number of outlayers within the experiments. This 246
particular behaviour from the sediments was highlighted by Sañudo-Fontaneda et al. (2013) when studying 247
the reduction of the infiltration capacity of PPS under different clogging scenarios. 248
It was also found that geotextile position influenced hydraulic performance (Figure 9) since the time to 249
peak for all models was increased from no geotextile structures to an upper geotextile. This finding suggests 250
that designers and practitioners looking for an increase in the time to peak should include the geotextile 251
closer to the surface of the HFD. 252
253
3.2 Geotextile effect on the hydraulic and clogging performance of HFD 254
3.2.1 Geotextile effect on the hydraulic performance of HFD 255
-10-
Initial bivariate correlation analyses shown in Table 6 highlighted significant linear relationships between 256
attenuation performance and the addition of sediments at a 95% confidence level as well as high correlation 257
between attenuation, rainfall intensity, storm duration and geotextile location. 258
In order to confirm these preliminary findings, a Kruskal Wallis test was carried out to compare the 259
influence of the inclusion of a geotextile on hydraulic performance using attenuation levels, whilst a Mann-260
Whitney test was performed to validate the influence of sediment addition on hydraulic performance. The 261
results are shown in Table 7 which confirmed that the addition of sediments and the presence of a geotextile 262
had a statistically significant effect on hydraulic performance. 263
264
3.2.2 The presence of a geotextile and its effect on the potential for clogging 265
No clogging issues were observed during storm events that simulated 2-years’ worth of pollutant addition 266
(sediments and oil) over the laboratory models although the hydraulic behaviour was found to be different. 267
Eventually, however, a crust of oil and sediment developed on the rig surface and began to create an 268
impermeable layer preventing the downprofile migration of the sediment as found in other studies such as 269
Mitchell (2015). 270
It was found that the pollutants preferentially accumulated in the top 50 mm of the HFD profile despite the 271
presence of geotextile as can be seen in Table 8. More than 70% of the total amount of pollutants added to 272
the models were found in the top of the profile for rigs either without a geotextile, or with one located lower 273
in the profile. However, 98.2% of the pollutants were found at the top of the profile for rigs with an upper 274
geotextile. Whilst complete clogging of the system was not an issue over the course of the experiments, 275
nonetheless the likelihood would be that the rigs with an upper geotextile would eventually clog, and more 276
quickly than the other structures being tested. In fact, Zhao et al. (2016) found that nonwoven geotextiles 277
are beneficial in providing a groundwater drainage layer. However, there are other possible variables 278
influencing the loss of hydraulic capacity in the field such as chemical clogging (Veylon et al. 2016). 279
Based on this study, the hydraulic deterioration of geosynthetics should be addressed in long-term field 280
studies in order to quantify the potential for clogging when used in an HFD. Furthermore, Yoo (2016) 281
pointed out the need to understand the hydraulic deterioration of geosynthetic filter drainage systems for 282
their use in other civil engineering structures such as tunnels. 283
-11-
284
4. Conclusions 285
This research has shown that using a geotextile in an HFD can contribute positively to improve the safety 286
of highways since peak flow is delayed as is time to peak due to the geotextile’s ability to become wet 287
whilst maintaining a head of water before allowing it to pass through (WRC). 288
Increasing rainfall intensity influenced the hydraulic performance of HFD rigs by decreasing time to peak 289
in all designs. However, storm duration did not influence peak attenuation in any of the HFD designs, 290
although it did affect the volume of runoff infiltrated. In addition, the presence of a geotextile influenced 291
hydraulic performance by increasing peak attenuation, hence delaying the time to peak in comparison with 292
rigs without a geotextile. Moreover, the position of the geotextile layer influenced hydraulic performance 293
(p-value = 0.05), with the higher geotextile exhibiting longer times to peak, followed by the lower 294
geotextile; rigs without a geotextile had the shortest time to peak. 295
The addition of pollutants (sediments and oil) significantly influenced hydraulic performance of all designs, 296
reducing the capacity for infiltration with the eventual formation of an impermeable crust at the surface of 297
the rigs. The majority of applied pollutants preferentially accumulated higher in the HFD profile in the top 298
50 mm, confirming the findings of previous studies such as Mitchell (2015) and Coupe et al. (2015). 299
Furthermore, the presence of an upper geotextile trapped more than 95% of the applied pollutants in the top 300
50 mm of the profile in comparison with the lower geotextile (75.9%) and no geotextile (72.4%). Finally, 301
no clogging was observed as a result of the addition of 2 years’ worth of sediment. 302
303
Acknowledgements: 304
The authors would like to thank Carnell Support Services Ltd for funding the study. Luis A. Sañudo-305
Fontaneda also wish to thank the funding for the development of the UOStormwater Engineering Research 306
Team by the University of Oviedo through the research project with reference PAPI-17-PEMERG-22. 307
308
-12-
References 309
AENOR, 2001. UNE-EN 13252:2001. Geotextiles and geotextile-related products. Characteristics required 310
for use in drainage systems. 311
Andrés-Valeri, V.C.A., Castro-Fresno, D., Sañudo-Fontaneda, L.A., and Rodriguez-Hernandez, J., 2014. 312
‘Comparative analysis of the outflow water quality of two sustainable linear drainage systems’. Water 313
Science and Technology, 70 (8), 1341-1347. 314
Bayon, J.R., Jato-Espino, D., Blanco-Fernandez, E., Castro-Fresno, D., 2015. Behaviour of geotextiles 315
designed for pervious pavements as a support for biofilm development. Geotextiles and 316
Geomembranes, 43 (2), 139-147. 317
British Standards Institution (BSI), 2006. BS EN 13242: Aggregates for unbound and hydraulically bound 318
materials for use in civil engineering work and road construction. London: BSI. 319
Broda, J., Gawlowski, A., Laszczak, R., Mitka, A., Przybylo, S., Grzybowska-Pietras, J., Rom, M., 2017. 320
Application of innovative meandrically arranged geotextiles for the protection of drainage ditches in 321
the clay ground. Geotextiles and Geomembranes, 45 (1), 45-53. 322
Bruen, M., Johnston, P., Quinn, M.K., Desta, M., Higgins, N., Bradley, C., and Burns, S., 2006. “Impact 323
Assessment of Highway Drainage on Surface Water Quality”. Report prepared for the Environmental 324
protection Agency by the Centre for Water Resources Research, University College Dublin. 325
Bustos, G. and Pérez, E., 2007. Pliego de prescripciones técnicas generales para obras de carreteras y 326
puentes. 5th Edition. Ediciones LITEAM. Madrid, Spain. 327
Carnell, 2015. SMARTscan. http://www.carnellgroup.co.uk/Services/Drainage2/SMARTscan/ 328
Castro-Fresno, D., Andrés-Valeri, V.C., Sañudo-Fontaneda, L.A., and Rodriguez-Hernandez, J., 2013. 329
‘Sustainable drainage practices in Spain, specially focused on pervious pavements.’ Water, 5 (1), 67-330
93. 331
Chinkulkijniwat, A., Horpibulsuk, S., Bui Van, D., Udomchai, A., Goodary, R., Arulrajah, A., 2017. 332
Influential factors affecting drainage design considerations for mechanical stabilised earth walls using 333
geocomposites. Geosynthetics International, 24 (3), 224-241. 334
Clapham, H.G., 1981. The TRAMMEL Drainage System. Transport Research Laboratory. American 335
Society of Civil Engineers (ASCE). 24-26 pp. 336
-13-
Coupe, S.J., Smith, H.G., Newman, A.P., Puehmeier, T., 2003. Biodegradation and microbial diversity 337
within permeable pavements. European Journal of Protistology, 39 (4), 495-498. 338
Coupe, S. J., Sañudo-Fontaneda, L. A., Charlesworth, S. M., Rowlands, E. G. Research on novel highway 339
filter drain designs for the protection of downstream environments. SUDSnet International 340
Conference, Coventry, UK, 2015. Available from: 341
http://sudsnet.abertay.ac.uk/SUDSnetConf2015.htm. 342
Coupe, S.J., Sañudo-Fontaneda, L.A., McLaughlin, A-M., Charlesworth, S.M., Rowlands, E.G. The 343
retention and in-situ treatment of contaminated sediments in laboratory highway filter drain models. 344
Water Efficiency Network Conference (WATEFCON 2016). Water Frontiers: Strategies for 2020 and 345
beyond. Coventry, UK, September 2016. Available from: 346
http://www.watefnetwork.co.uk/files/default/resources/Conference2016/Session_One/45-347
COUPE.pdf. 348
Desta, M.B., Bruen, M., Higgins, N., and Johnston, P., 2007. Highway runoff quality in Ireland. Journal of 349
Environmental Monitoring, 9, 366-371. 350
DMRB-UK, 1996. Design Manual for Roads and Bridges: Geotechnics and Drainage. Vol. 4, sec. 2, part 351
3. (HD 33/96). SURFACE AND SUB-SURFACE DRAINAGE SYSTEMS FOR HIGHWAYS. 352
Technical Report, Highways Agency, UK. 353
DMRB-UK, 1997a. Design Manual for Roads and Bridges: Geotechnics and Drainage. Vol. 4, sec. 2, part 354
4. (HA 37/97). Hydraulic design of road-edge surface water channels. Technical Report, Highways 355
Agency, UK. 356
DMRB-UK, 1997b. Design Manual for Roads and Bridges: Geotechnics and Drainage. Vol. 4, sec. 2, part 357
4. (HA 79/97). Edge of pavement details for porous asphalt surface courses. Technical Report, 358
Highways Agency, UK. 359
DMRB-UK, 1999. Design Manual for Roads and Bridges: Traffic Capacity of Urban Roads. Vol. 5, sec. 1, 360
part 3. (TA 79/99 Amendment No 1). 361
DMRB-UK, 2001. Design Manual for Roads and Bridges: Geotechnics and Drainage. Vol. 4, sec. 2, part 362
5. (HA 40/01). Determination of pipe and bedding combinations for drainage works. Technical 363
Report, Highways Agency, UK. 364
-14-
DMRB-UK, 2004. Design Manual for Roads and Bridges: Geotechnics and Drainage. Vol. 4, sec. 2, part 365
1. (HA 106/04). Drainage of runoff from natural catchments. Technical Report, Highways Agency, 366
UK. 367
Ellis, J.B., Rowlands, E.G., 2007. Highway filter drain waste arisings: A challenge for urban source control 368
management? Water Science and Technology, 56 (10), 125-131. 369
Gomez-Ullate, E., Bayon, J.R., Coupe, S., Castro-Fresno, D., 2010. Performance of pervious pavement 370
parking bays storing rainwater in the north of Spain. Water Science and Technology, 62(3), 615-621. 371
House of Commons, 2014. Maintaining strategic infrastructure: roads. Fifteenth Report on Session 2014-372
2015. Committee of Public Accounts. London: The Stationery Office Limited. 373
http://www.publications.parliament.uk/pa/cm201415/cmselect/cmpubacc/105/105.pdf. 374
Ingold, T.S., 1994. Prefabricated fin drains and their application. Geotextiles and Geomembranes: Manual. 375
Elsevier Advance Technology, UK. 376
Kearns, R.E., 1992. Long-term performance of geocomposites used as highway edge drains. Geotextiles 377
and Geomembranes, 11(4-6), 513-521. 378
Koerner, G.R., Koerner, R.M., Wilson-Fahmy, R.F., 1996. Field performance of geosynthetic highway 379
drainage systems. ASTM Special Technical Publication, 1281, 165-180. 380
MCDH, 2009. Manual of Contract Documents for Highway Works. Volume 1 - Specification for Highway 381
Works. Series 500: Drainage and Service Ducts. Highways Agency, UK. 382
Mitchell, G., 2015. Clogging of filtration SUDS. Long term performance of trunk road filter drains. 383
SUDSnet International Conference, Coventry, UK, 2015. Available from: 384
http://sudsnet.abertay.ac.uk/documents/SUDSnet2015_Mitchell_CloggingofFiltrationSuDS.pdf. 385
Newman, A.P., Pratt, C.J., Coupe, S.J., Cresswell, N., 2002. Oil bio-degradation in permeable pavements 386
by microbial communities. Water Science and Technology, 45(7), 51-56. 387
Nicodeme, C., Diamandouros, K., Diez, J., Durso, C., Brecx, C., Metushi, S., 2013. European Union Road 388
Federation. European Road Statistics 2012. Report. 389
http://www.irfnet.eu/images/Statistics/ER_Statistics_Final_2012.pdf. 390
Portelinha, F.H.M., Zornberg, J.G., 2017. Effect of infiltration on the performance of an unsaturated 391
geotextile-reinforced soil wall. Geotextiles and Geomembranes, 45(3), 211-226. 392
-15-
Pratt, C.J., Newman, A.P., Bond, P.C., 1999. Mineral oil big-degradation within a permeable pavement: 393
Long term observations. Water Science and Technology, 39(2), 103-109. 394
Raymond, O.P., Bathurst, R.J., Hajek, J., 2000. Evaluation and suggested improvements to highway edge 395
drains incorporating geotextiles. Geotextiles and Geomembranes, 18(1), 23-45. 396
Sañudo-Fontaneda, L.A., Rodriguez-Hernandez, J., Vega-Zamanillo, A., Castro-Fresno, D., 2013. 397
Laboratory analysis of the infiltration capacity of Interlocking Concrete Block Pavements in car parks. 398
Water Science and Technology 2013, 67(3), 675-681. 399
Sañudo-Fontaneda, L.A., Andrés-Valeri, V.C.A., Rodriguez-Hernandez, J., and Castro-Fresno, D., 2014a. 400
Field study of the reduction of the infiltration capacity of porous mixtures surfaces tests. Water, 6 (3), 401
661-669. 402
Sañudo-Fontaneda, L.A., Charlesworth, S., Castro-Fresno, D., Andrés-Valeri, V.C.A., and Rodriguez-403
Hernandez, J., 2014b. Water quality and quantity assessment of pervious pavements performance in 404
experimental car park areas. Water Science and Technology, 69(7), 1526-1533. 405
Sañudo Fontaneda, L.A., 2014. The analysis of rainwater infiltration into permeable pavements, with 406
concrete blocks and porous mixtures, for the source control of flooding. PhD Thesis, University of 407
Cantabria, Spain. Available from: https://repositorio.unican.es/xmlui/handle/10902/5053. 408
Sañudo-Fontaneda, L.A., Jato-Espino, D., Lashford, C., Coupe, S.J., 2016. Investigation of the design 409
considerations for Highway Filter Drains through the comparison of stormwater management tools 410
with laboratory simulation experiments. 9th International Conference NOVATECH. Planning & 411
Technologies for Sustainable Urban Water Management. Lyon, France. 412
Sañudo Fontaneda, L.A., Blanco-Fernández, E., Coupe, S.J., Carpio Garcia, J., Newman, A.P., Castro-413
Fresno, D., 2016. Use of Geosynthetics for Sustainable Drainage. Book chapter in “Sustainable 414
Surface Water Management: A Handbook for SUDS” pp. 142-155. Ed. Wiley, U.S.A., ISBN: 978-1-415
118-89770-6. 416
Sañudo-Fontaneda, L.A., Jato-Espino, D., Lashford, C., Coupe, S.J., 2017. Simulation of the hydraulic 417
performance of highway filter drains through laboratory models and stormwater management tools. 418
Environmental Science and Pollution Research, 1-10. Article in Press. 419
UK Department for Transport, 2012. Guidance on Road Classification and the Primary Route Network. 420
Available from: 421
-16-
https://www.gov.uk/government/uploads/system/uploads/attachment_data/file/315783/road-422
classification-guidance.pdf. 423
UK Department of Transports, 2015. National Road Traffic Survey. 424
https://www.gov.uk/government/statistical-data-sets/tra01-traffic-by-road-class-and-region-miles. 425
Veylon, G., Stoltz, G., Mériaux, P., Faure, Y.-H., Touze-Foltz, N., 2016. Performance of geotextile filters 426
after 18 years' service in drainage trenches. Geotextiles and Geomembranes, 44 (4), pp. 515-533. 427
Woods Ballard, B., Wilson, S., Udale-Clark, H., Illman, S., Ashley, R and Kellagher, R., 2015. The SuDS 428
manual, CIRIA 753. CIRIA. ISBN 979-0-86017-760-9. 429
Yoo, C., 2016. Hydraulic deterioration of geosynthetic filter drainage system in tunnels – its impact on 430
structural performance of tunnel linings. Geosynthetics International, 23(6), 463-480. 431
Zhao, A., Oelkers, C., Diviacchi, V., 2016. Geocomposite for landfill's groundwater drainage layer. 432
Geosynthetics, 34(1). 433