The Illinois State Toll Highway Authority
456
New Issue – Book-Entry Only Ratings: See “Ratings.” Subject to compliance by the Authority with certain covenants, in the opinion of Chapman and Cutler LLP, Chicago, Illinois, Bond Counsel, under present law, interest on the 2021A Bonds is excludable from gross income of the owners thereof for federal income tax purposes and is not included as an item of tax preference in computing the federal alternative minimum tax for individuals. Interest on the 2021A Bonds is not exempt from present State of Illinois income taxes. See “TAX MATTERS” herein for a more complete discussion. $700,000,000 THE ILLINOIS STATE TOLL HIGHWAY AUTHORITY Toll Highway Senior Revenue Bonds, 2021 Series A Maturities, Principal Amounts, Interest Rates, Yields, Prices and CUSIP Numbers are Shown on the Inside of the Front Cover This Official Statement contains information relating to The Illinois State Toll Highway Authority (“Authority”) and the Authority’s Toll Highway Senior Revenue Bonds, 2021 Series A (“2021A Bonds”). The 2021A Bonds are being issued and secured under an Amended and Restated Trust Indenture effective as of March 31, 1999, amending and restating a Trust Indenture dated as of December 1, 1985 (as amended, restated and supplemented to the date hereof, “Amended and Restated Indenture”) from the Authority to The Bank of New York Mellon Trust Company, N.A., as successor trustee (“Trustee”), and a Thirty-First Supplemental Indenture dated as of December 1, 2021 by and between the Authority and the Trustee (“Thirty-First Supplemental Indenture” and collectively with the Amended and Restated Indenture, “Indenture”). The 2021A Bonds will be issuable as fully registered bonds in the name of Cede & Co., as registered owner and nominee of The Depository Trust Company, New York, New York (“DTC”). DTC will act as securities depository for the 2021A Bonds. Purchasers of the 2021A Bonds will not receive certificates representing their interests in the 2021A Bonds purchased. Principal of and interest on the 2021A Bonds will be paid by the Trustee to DTC, which in turn will remit such principal and interest payments to its participants for subsequent disbursement to the beneficial owners of the 2021A Bonds. As long as Cede & Co. is the registered owner as nominee of DTC, payments on the 2021A Bonds will be made to such registered owner, and disbursement of such payments to beneficial owners will be the responsibility of DTC and its participants. See APPENDIX E – “Book-Entry System.” The 2021A Bonds will mature on January 1 of the years and in the amounts and will bear interest at the rates per annum set forth on the inside cover page, payable on January 1 and July 1 of each year, commencing July 1, 2022. As described herein, the 2021A Bonds are subject to optional and mandatory sinking fund redemption prior to maturity. See “DESCRIPTION OF THE 2021A BONDS – Redemption of 2021A Bonds.” All Bonds issued under the Indenture, including the 2021A Bonds, are payable solely from and secured solely by a pledge of and lien on the Net Revenues (as defined in this Official Statement) and certain other funds as provided in the Indenture. See “SECURITY AND SOURCES OF PAYMENT FOR THE 2021A BONDS.” THE 2021A BONDS AND ANY OTHER BONDS ISSUED UNDER THE INDENTURE DO NOT REPRESENT OR CONSTITUTE A DEBT OF THE AUTHORITY OR OF THE STATE OF ILLINOIS WITHIN THE MEANING OF ANY CONSTITUTIONAL OR STATUTORY LIMITATION OR A PLEDGE OF THE FAITH AND CREDIT OF THE AUTHORITY OR THE STATE OF ILLINOIS, OR GRANT TO THE OWNERS OR HOLDERS THEREOF ANY RIGHT TO HAVE THE AUTHORITY OR THE ILLINOIS GENERAL ASSEMBLY LEVY ANY TAXES OR APPROPRIATE ANY FUNDS FOR THE PAYMENT OF THE PRINCIPAL THEREOF, PREMIUM, IF ANY, OR INTEREST THEREON, OTHER THAN AS MAY BE AUTHORIZED UNDER THE TOLL HIGHWAY ACT AND PLEDGED IN ACCORDANCE WITH THE INDENTURE. The 2021A Bonds are offered for delivery when, as and if issued and received by the Underwriters, subject to withdrawal and modification of the offer without notice and approval of legality by Chapman and Cutler LLP, Chicago, Illinois, Bond Counsel. Certain legal matters in connection with the 2021A Bonds will be passed upon for the Authority by Kathleen R. Pasulka-Brown, Esq., Assistant Attorney General and the Authority’s General Counsel, and by the Authority’s special counsel, Burke Burns & Pinelli, Ltd., Chicago, Illinois, and for the Underwriters by their counsel, Kutak Rock LLP, Chicago, Illinois. Certain documents to which the Authority is a party will be approved as to form and constitutionality by the Attorney General of Illinois. It is expected that the 2021A Bonds in definitive form will be available for delivery to DTC on or about December 16, 2021. Loop Capital Markets J.P. Morgan Citigroup Ramirez & Co., Inc. Academy Securities Bernardi Securities, Inc. Blaylock Van, LLC Cabrera Capital Markets, LLC Melvin Securities Stern Brothers Dated: December 2, 2021
-
Upload
khangminh22 -
Category
Documents
-
view
0 -
download
0
Transcript of The Illinois State Toll Highway Authority

New Issue – Book-Entry Only Ratings: See “Ratings.”
Subject to compliance by the Authority with certain covenants, in the opinion of Chapman and Cutler LLP, Chicago, Illinois, Bond Counsel, under present law, interest on the 2021A Bonds is excludable from gross income of the owners thereof for federal income tax purposes and is not included as an item of tax preference in computing the federal alternative minimum tax for individuals. Interest on the 2021A Bonds is not exempt from present State of Illinois income taxes. See “TAX MATTERS” herein for a more complete discussion.
$700,000,000The IllInoIs sTaTe Toll hIghway auThorITy
Toll Highway Senior Revenue Bonds,2021 Series A
Maturities, Principal Amounts, Interest Rates, Yields, Prices and CUSIP Numbers are Shown on the Inside of the Front Cover
This Official Statement contains information relating to The Illinois State Toll Highway Authority (“Authority”) and the Authority’s Toll Highway Senior Revenue Bonds, 2021 Series A (“2021A Bonds”). The 2021A Bonds are being issued and secured under an Amended and Restated Trust Indenture effective as of March 31, 1999, amending and restating a Trust Indenture dated as of December 1, 1985 (as amended, restated and supplemented to the date hereof, “Amended and Restated Indenture”) from the Authority to The Bank of New York Mellon Trust Company, N.A., as successor trustee (“Trustee”), and a Thirty-First Supplemental Indenture dated as of December 1, 2021 by and between the Authority and the Trustee (“Thirty-First Supplemental Indenture” and collectively with the Amended and Restated Indenture, “Indenture”).
The 2021A Bonds will be issuable as fully registered bonds in the name of Cede & Co., as registered owner and nominee of The Depository Trust Company, New York, New York (“DTC”). DTC will act as securities depository for the 2021A Bonds. Purchasers of the 2021A Bonds will not receive certificates representing their interests in the 2021A Bonds purchased. Principal of and interest on the 2021A Bonds will be paid by the Trustee to DTC, which in turn will remit such principal and interest payments to its participants for subsequent disbursement to the beneficial owners of the 2021A Bonds. As long as Cede & Co. is the registered owner as nominee of DTC, payments on the 2021A Bonds will be made to such registered owner, and disbursement of such payments to beneficial owners will be the responsibility of DTC and its participants. See APPENDIX E – “Book-Entry System.”
The 2021A Bonds will mature on January 1 of the years and in the amounts and will bear interest at the rates per annum set forth on the inside cover page, payable on January 1 and July 1 of each year, commencing July 1, 2022. As described herein, the 2021A Bonds are subject to optional and mandatory sinking fund redemption prior to maturity. See “DESCRIPTION OF THE 2021A BONDS – Redemption of 2021A Bonds.”
All Bonds issued under the Indenture, including the 2021A Bonds, are payable solely from and secured solely by a pledge of and lien on the Net Revenues (as defined in this Official Statement) and certain other funds as provided in the Indenture. See “SECURITY AND SOURCES OF PAYMENT FOR THE 2021A BONDS.”
THE 2021A BONDS AND ANY OTHER BONDS ISSUED UNDER THE INDENTURE DO NOT REPRESENT OR CONSTITUTE A DEBT OF THE AUTHORITY OR OF THE STATE OF ILLINOIS WITHIN THE MEANING OF ANY CONSTITUTIONAL OR STATUTORY LIMITATION OR A PLEDGE OF THE FAITH AND CREDIT OF THE AUTHORITY OR THE STATE OF ILLINOIS, OR GRANT TO THE OWNERS OR HOLDERS THEREOF ANY RIGHT TO HAVE THE AUTHORITY OR THE ILLINOIS GENERAL ASSEMBLY LEVY ANY TAXES OR APPROPRIATE ANY FUNDS FOR THE PAYMENT OF THE PRINCIPAL THEREOF, PREMIUM, IF ANY, OR INTEREST THEREON, OTHER THAN AS MAY BE AUTHORIZED UNDER THE TOLL HIGHWAY ACT AND PLEDGED IN ACCORDANCE WITH THE INDENTURE.
The 2021A Bonds are offered for delivery when, as and if issued and received by the Underwriters, subject to withdrawal and modification of the offer without notice and approval of legality by Chapman and Cutler LLP, Chicago, Illinois, Bond Counsel. Certain legal matters in connection with the 2021A Bonds will be passed upon for the Authority by Kathleen R. Pasulka-Brown, Esq., Assistant Attorney General and the Authority’s General Counsel, and by the Authority’s special counsel, Burke Burns & Pinelli, Ltd., Chicago, Illinois, and for the Underwriters by their counsel, Kutak Rock LLP, Chicago, Illinois. Certain documents to which the Authority is a party will be approved as to form and constitutionality by the Attorney General of Illinois. It is expected that the 2021A Bonds in definitive form will be available for delivery to DTC on or about December 16, 2021.
Loop Capital Markets J.P. Morgan
Citigroup Ramirez & Co., Inc.
Academy Securities Bernardi Securities, Inc. Blaylock Van, LLC
Cabrera Capital Markets, LLC Melvin Securities Stern Brothers
Dated: December 2, 2021

MATURITIES, PRINCIPAL AMOUNTS, INTEREST RATES, YIELDS, PRICES AND CUSIP† NUMBERS
$700,000,000 The Illinois State Toll Highway Authority
Toll Highway Senior Revenue Bonds, 2021 Series A
Maturity (January 1)
Principal Amount
Interest Rate YieldC PriceC
CUSIP (452252)†
2039 $4,000,000 4.00% 1.80% 120.126 PS2
2040 20,000,000 4.00% 1.83% 119.822 PT0
2041 97,000,000 5.00% 1.72% 130.129 PU7
2042 99,000,000 4.00% 1.88% 119.316 PV5
2043 120,000,000 5.00% 1.77% 129.595 PW3
$180,000,000 4.00% Term Bonds due January 1, 2046; Yield 2.00%C; Price 118.112C; CUSIP† 452252 PY9
$180,000,000 5.00% Term Bonds due January 1, 2046; Yield 1.85%C; Price 128.745C; CUSIP† 452252 PX1
C Priced to first optional redemption date of January 1, 2032 at par. Yield is yield to the first optional redemption date.
† Copyright 2021, American Bankers Association. CUSIP numbers in this Official Statement are provided by CUSIP Global Services LLC managed on behalf of the American Bankers Association by S&P Global Market Intelligence. The CUSIP numbers listed above are being provided solely for the convenience of the holders of the 2021A Bonds at the time of issuance of the 2021A Bonds. The Authority does not make any representation with respect to such numbers or undertake any responsibility for the accuracy of such numbers. CUSIP numbers may be changed after the issuance of the 2021A Bonds as a result of various subsequent actions including, but not limited to, a refunding in whole or in part of the 2021A Bonds.

THE ILLINOIS STATE TOLL HIGHWAY AUTHORITY 2700 OGDEN AVENUE
DOWNERS GROVE, ILLINOIS 60515-1703 (630) 241-6800
DIRECTORS
JB Pritzker Governor of Illinois, ex officio director
Omer Osman Secretary of the Illinois Department of Transportation, ex officio director
Willard S. Evans, Jr. Chairman
James Connolly Stephen L. Davis Alice Gallagher
Jacqueline Gomez Fuentes
Karen McConnaughay Scott Paddock Gary Perinar
James Sweeney
Kwame Raoul Attorney General of the State of Illinois and
ex officio Attorney for the Authority
Michael W. Frerichs Treasurer of the State of Illinois and
ex officio Custodian of the Illinois State Toll Highway Authority Fund
EXECUTIVE STAFF
Willard S. Evans, Jr. Chief Executive Officer
José Alvarez Executive Director
Cassaundra Rouse Chief Operating Officer
Cathy R. Williams Chief Financial Officer
Manar Nashif Acting Chief Engineering Officer
Kathleen R. Pasulka-Brown Assistant Attorney General and
General Counsel
MUNICIPAL ADVISOR
Acacia Financial Group, Inc.
CONSULTING AND TRAFFIC ENGINEERS
WSP USA Inc. Consulting Engineers
CDM Smith Inc. Traffic Engineers

This Official Statement, which includes the cover page and inside front cover page and appendices, is being used in connection with the offer and sale of the 2021A Bonds and may not be reproduced or used, in whole or in part, for any other purpose. The information set forth in this Official Statement is believed to be reliable but is not guaranteed as to accuracy or completeness by, and is not to be construed as a representation of, the Underwriters. The Underwriters have provided the following sentence for inclusion in this Official Statement. Each Underwriter has reviewed the information in this Official Statement in accordance with and as part of its respective responsibilities to investors under the federal securities laws as applied to the facts and circumstances of this transaction, but no Underwriter guarantees the accuracy or completeness of such information. The information and expressions of opinion contained in this Official Statement are subject to change without notice and neither the delivery of this Official Statement nor any sale made hereunder shall, under any circumstances, create any implication that there has been no change in the information in this Official Statement pertaining to the Authority or the Tollway System as of any time subsequent to the date of such information. No dealer, sales representative or any other person has been authorized by the Authority or the Underwriters to give any information or to make any representation other than as contained in this Official Statement in connection with the offering it describes and, if given or made, such other information or representation must not be relied upon as having been authorized by the Authority or the Underwriters. This Official Statement does not constitute an offer of any securities other than those described on the cover page or an offer to sell or a solicitation of an offer to buy in any jurisdiction in which it is unlawful to make such offer, solicitation or sale.
This Official Statement should be considered in its entirety. No information or portion of information in this Official Statement should be considered more or less important than any other by reason of its position in this Official Statement. Where statutes, ordinances, reports or other documents are referred to in this Official Statement, reference should be made to such statutes, ordinances, reports or other documents for more complete information regarding the rights and obligations of parties to them, facts and opinions contained in them and their subject matters.
Neither this Official Statement nor any statement that may be made orally or in writing in connection therewith is to be construed as a contract with the registered or beneficial owners of the 2021A Bonds.
This Official Statement contains forecasts, projections and estimates that are based on current expectations or assumptions. If and when included in this Official Statement, the words “expects,” “forecasts,” “projects,” “intends,” “anticipates,” “estimates,” “assumes” and analogous expressions are intended to identify forward-looking statements, and any such statements inherently are subject to a variety of risks and uncertainties that could cause actual results to differ materially from those that have been projected. Such risks and uncertainties which could affect the amount of revenues received include, among others, changes in political, social and economic conditions, federal, state and local statutory and regulatory initiatives, litigation, seismic events, and various other events, conditions and circumstances, many of which are beyond the control of the Authority. These forward-looking statements include, but are not limited to, certain statements contained in the information set forth under the captions “THE TOLLWAY,” “THE CAPITAL PROGRAM,” “CERTAIN RISK FACTORS” and in APPENDICES B and C, and such statements speak only as of the date of this Official Statement. The Authority disclaims any obligation or undertaking to release publicly any updates or revisions to any forward-looking statements contained in this Official Statement to reflect any changes in the Authority’s expectations with regard to such forward-looking statements or any change in events, conditions or circumstances on which any such statements are based.
IN CONNECTION WITH THE OFFERING OF THE 2021A BONDS, THE UNDERWRITERS MAY OVER-ALLOT OR EFFECT TRANSACTIONS THAT STABILIZE OR MAINTAIN THE MARKET PRICE OF THE 2021A BONDS AT LEVELS ABOVE THE LEVELS THAT MIGHT OTHERWISE PREVAIL IN THE OPEN MARKET. SUCH STABILIZING, IF COMMENCED, MAY BE DISCONTINUED AT ANY TIME WITHOUT NOTICE.
THE 2021A BONDS HAVE NOT BEEN REGISTERED UNDER THE SECURITIES ACT OF 1933, AS AMENDED, AND HAVE NOT BEEN APPROVED OR DISAPPROVED BY ANY FEDERAL OR STATE SECURITIES COMMISSION NOR HAS ANY FEDERAL OR STATE SECURITIES COMMISSION PASSED UPON THE ACCURACY OR ADEQUACY OF THIS OFFICIAL STATEMENT. ANY REPRESENTATION TO THE CONTRARY IS A CRIMINAL OFFENSE.

TABLE OF CONTENTS
Page
i
INTRODUCTORY STATEMENT ............................................................................................................................. 1 PLAN OF FINANCE .................................................................................................................................................. 2
The Project .................................................................................................................................................... 2
ESTIMATED SOURCES AND APPLICATIONS OF FUNDS ................................................................................. 3 DESCRIPTION OF THE 2021A BONDS .................................................................................................................. 3
General .......................................................................................................................................................... 3 Interest on the 2021A Bonds; Payment; Authorized Denominations ............................................................ 3 Redemption of 2021A Bonds ........................................................................................................................ 4 Selection of Bonds for Redemption; Notice of Redemption ......................................................................... 4 Bond Registration and Transfers ................................................................................................................... 5 Mutilated, Lost, Stolen or Destroyed Bonds ................................................................................................. 5
SECURITY AND SOURCES OF PAYMENT FOR THE 2021A BONDS ............................................................... 5 Pledge of Revenues and Funds ...................................................................................................................... 5 Toll Covenant ................................................................................................................................................ 6 Certain Amendments to the Indenture ........................................................................................................... 6 Flow of Funds................................................................................................................................................ 7 Debt Reserve Account ................................................................................................................................... 8 Additional Indebtedness ................................................................................................................................ 8 Other Covenants ............................................................................................................................................ 9 The Trustee .................................................................................................................................................... 9
THE AUTHORITY ..................................................................................................................................................... 9 Board of Directors ......................................................................................................................................... 9 Principal Administrative Personnel ............................................................................................................. 10 Organizational Structure.............................................................................................................................. 11 Labor Relations ........................................................................................................................................... 13 Pension Plan ................................................................................................................................................ 13 Other Post-Employment Benefits ................................................................................................................ 17
THE TOLLWAY ....................................................................................................................................................... 18 Routes .......................................................................................................................................................... 18 Other Limited Access Highways ................................................................................................................. 19 Patron Service Areas ................................................................................................................................... 19 Toll Collections ........................................................................................................................................... 20 Toll Enforcement ......................................................................................................................................... 22 Toll Rates .................................................................................................................................................... 23 Historical Toll Transactions and Toll Revenues ......................................................................................... 26 Historical Net Operating Revenues ............................................................................................................. 28
THE CAPITAL PROGRAM ..................................................................................................................................... 30 The Move Illinois Program ......................................................................................................................... 30 Potential Additional Capital Projects .......................................................................................................... 31 Condition and Maintenance ......................................................................................................................... 32 Renewal and Replacement Program and Improvement Program ................................................................ 33
FINANCIAL INFORMATION ................................................................................................................................. 34 Financial Information Discussion ................................................................................................................ 34 Outstanding Indebtedness ............................................................................................................................ 37 Annual Debt Service Requirements ............................................................................................................ 38 Pro Forma Debt Service Coverage .............................................................................................................. 38
CERTAIN RISK FACTORS ..................................................................................................................................... 42 General Factors Affecting Authority Revenues .......................................................................................... 42

ii
COVID-19 Pandemic’s Materially Adverse Impact on Authority Revenues .............................................. 42 Forward-Looking Statements, Traffic Engineers’ Report and Consulting Engineers’ Report .................... 45 Move Illinois Program................................................................................................................................. 46 Technological and Other Risk Factors ........................................................................................................ 46 Pension Expenses ........................................................................................................................................ 47 Loss of Tax Exemption ............................................................................................................................... 47 IRS Bond Examinations .............................................................................................................................. 47 Legislative Action ....................................................................................................................................... 47
LITIGATION ............................................................................................................................................................ 47 APPROVAL OF LEGAL PROCEEDINGS .............................................................................................................. 48 RELATED PARTIES ................................................................................................................................................ 48 UNDERWRITING .................................................................................................................................................... 49 MUNICIPAL ADVISOR .......................................................................................................................................... 49 TRAFFIC AND CONSULTING ENGINEERS ........................................................................................................ 50 RATINGS .................................................................................................................................................................. 50 TAX MATTERS ....................................................................................................................................................... 50 CONTINUING DISCLOSURE ................................................................................................................................. 52
Annual Report ............................................................................................................................................. 53 Events Notification ...................................................................................................................................... 53 Consequences of Failure of the Authority to Provide Information ............................................................. 54 Amendment; Waiver ................................................................................................................................... 55 Termination of Agreement .......................................................................................................................... 55 Additional Information ................................................................................................................................ 55 Dissemination Agent ................................................................................................................................... 55
LEGALITY FOR INVESTMENT ............................................................................................................................ 55 FINANCIAL STATEMENTS ................................................................................................................................... 55 ACCOUNTING AND INVESTMENT PRACTICES .............................................................................................. 56 MISCELLANEOUS .................................................................................................................................................. 56 AUTHORIZATION .................................................................................................................................................. 57
APPENDIX A Financial Statements ................................................................................................................ A-1 APPENDIX B Consulting Engineers’ Report ................................................................................................. B-1 APPENDIX C Traffic Engineers’ Report ........................................................................................................ C-1 APPENDIX D Summary of Certain Provisions of the Indenture .................................................................... D-1 APPENDIX E Book-Entry System ................................................................................................................. E-1 APPENDIX F Form of Opinion of Bond Counsel ...........................................................................................F-1

OFFICIAL STATEMENT
$700,000,000 THE ILLINOIS STATE TOLL HIGHWAY AUTHORITY
Toll Highway Senior Revenue Bonds, 2021 Series A
INTRODUCTORY STATEMENT
This Official Statement sets forth certain information concerning The Illinois State Toll Highway Authority (“Authority”), the Tollway System (as defined in Appendix D to this Official Statement) and the Authority’s $700,000,000 Toll Highway Senior Revenue Bonds, 2021 Series A (“2021A Bonds”). The 2021A Bonds will be issued pursuant to the Toll Highway Act, 605 ILCS 10/1, et seq., as amended (“Act”), resolutions adopted by the Authority on February 25, 2021 and September 9, 2021, authorizing the issuance of the 2021A Bonds, and a Thirty-First Supplemental Indenture dated as of December 1, 2021 (“Thirty-First Supplemental Indenture”), supplementing and amending an Amended and Restated Trust Indenture effective as of March 31, 1999, amending and restating a Trust Indenture dated as of December 1, 1985 (as amended, restated and supplemented to the date hereof, “Amended and Restated Indenture”), from the Authority to The Bank of New York Mellon Trust Company, N.A., as successor to J.P. Morgan Trust Company, N.A., and its predecessors, as Trustee (“Trustee”). The Amended and Restated Indenture, as supplemented, amended and restated from time to time, including by the First through the Thirty-First Supplemental Indentures and the 1996 Amendatory Supplemental Indenture dated as of September 1, 1996, is referred to herein as the “Indenture.” Purchasers of the 2021A Bonds will be deemed to have consented to certain amendments to the Indenture including those defined herein as the “Transfer Amendment” and the “Reserve Account Credit Facility Amendment.” See “SECURITY AND SOURCES OF PAYMENT FOR THE 2021A BONDS – Certain Amendments to the Indenture” and APPENDIX D – “SUMMARY OF CERTAIN PROVISIONS OF THE INDENTURE – ADDITIONAL COVENANTS – Sale, Lease or Encumbrance of Property” and “– FLOW OF FUNDS – Debt Reserve Account.”
Certain capitalized terms used in this Official Statement, unless otherwise defined in this Official Statement, have the meanings set forth in APPENDIX D – “SUMMARY OF CERTAIN PROVISIONS OF THE INDENTURE – DEFINITIONS.”
The 2021A Bonds are being issued under the Indenture to provide funds that will be used to: (a) finance the costs of capital improvements to be made to the Tollway System as part of the Move Illinois Program described herein (“Project”); (b) make a deposit to the Debt Reserve Account created under the Indenture necessary in order that amounts held thereunder are not less than the Debt Reserve Requirement calculated in accordance with the Indenture; and (c) pay costs incurred in connection with the issuance of the 2021A Bonds. See “PLAN OF FINANCE” and “ESTIMATED SOURCES AND APPLICATIONS OF FUNDS.”
The 2021A Bonds will be secured on a parity basis with other Senior Bonds of the Authority. After the issuance of the 2021A Bonds, Senior Bonds will consist of the following: (a) $400,000,000 aggregate principal amount Toll Highway Senior Priority Revenue Bonds, Taxable 2009 Series A (Build America Bonds – Direct Payment) (“2009A Bonds”); (b) $280,000,000 aggregate principal amount Toll Highway Senior Priority Revenue Bonds, Taxable 2009 Series B (Build America Bonds – Direct Payment) (“2009B Bonds”); (c) $500,000,000 aggregate principal amount Toll Highway Senior Revenue Bonds, 2013 Series A (“2013A Bonds”); (d) $101,715,000 aggregate principal amount Toll Highway Senior Revenue Bonds, 2014 Series A (Refunding) (“2014A Bonds”); (e) $500,000,000 aggregate principal amount Toll Highway Senior Revenue Bonds, 2014 Series B (“2014B Bonds”); (f) $400,000,000 aggregate principal amount Toll Highway Senior Revenue Bonds, 2014 Series C (“2014C Bonds”); (g) $197,670,000 aggregate principal amount Toll Highway Senior Revenue Bonds, 2014 Series D (Refunding) (“2014D Bonds”); (h) $400,000,000 aggregate principal amount Toll Highway Senior Revenue Bonds, 2015 Series A (“2015A Bonds”); (i) $400,000,000 aggregate principal amount Toll Highway Senior Revenue Bonds, 2015 Series B (“2015B Bonds”); (j) $333,060,000 aggregate principal amount Toll Highway Senior Revenue Bonds, 2016 Series A (Refunding) (“2016A Bonds”); (k) $300,000,000 aggregate principal amount Toll Highway Senior Revenue Bonds, 2016 Series B (“2016B Bonds”); (l) $300,000,000 aggregate principal amount Toll Highway Senior Revenue Bonds, 2017 Series A (“2017A Bonds”); (m) $484,295,000 aggregate principal amount Toll Highway Senior Revenue Bonds, 2018 Series A (Refunding) (“2018A Bonds”); (n) $300,000,000 aggregate principal amount Toll Highway Senior

2
Revenue Bonds, 2019 Series A (“2019A Bonds”); (o) $225,245,000 aggregate principal amount Toll Highway Senior Revenue Bonds, 2019 Series B (Refunding) (“2019B Bonds”); (p) $697,870,000 aggregate principal amount Toll Highway Senior Revenue Bonds, 2019 Series C (Refunding) (“2019C Bonds”); (q) $500,000,000 aggregate principal amount Toll Highway Senior Revenue Bonds, 2020 Series A (“2020A Bonds”) and (r) $700,000,000 aggregate principal amount 2021A Bonds (collectively, “Senior Bonds”). After the issuance of the 2021A Bonds, the Senior Bonds will be outstanding in the aggregate principal amount of $7,019,855,000.
All references in this Official Statement to laws, agreements and documents are qualified in their entirety by reference to such laws, agreements and documents, and all references in this Official Statement to the 2021A Bonds and the Indenture are further qualified in their entirety by reference to their complete terms and the information with respect to them in the Indenture.
PLAN OF FINANCE
The Project
In August 2011, the Authority approved a fifteen-year, $12 billion capital improvement plan known as “Move Illinois: The Illinois Tollway Driving the Future,” which established a guide for infrastructure and other capital investments to be made to the Tollway System by the Authority beginning in 2012 and extending through 2026, approved an increase in passenger vehicle toll rates effective January 1, 2012, approved toll rates for Illinois Route 390 (formerly known as the Elgin-O’Hare Expressway) and affirmed a previously approved increase in commercial vehicle toll rates consisting of a 60% increase to be phased in between January 1, 2015 and January 1, 2017 with annual adjustments applied on January 1 of each of the years 2018 through 2021 and thereafter adjusted each January 1 based on the Consumer Price Index for All Urban Consumers as defined by the United States Department of Labor Bureau of Labor Statistics. See “THE TOLLWAY – Toll Rates.” By resolution adopted on April 27, 2017, the Board of Directors of the Authority approved certain enhancements to this capital improvement plan, increasing its total estimated cost from $12.1 billion to $14.3 billion (the original capital improvement plan, as so amended, “Move Illinois Program”). The Move Illinois Program is designed to fund necessary improvements to maintain the existing Tollway System in a state of good repair and fund new projects to enhance regional mobility. As of the date of this Official Statement, the Authority’s Move Illinois Program is projected to be completed in 2027 at a projected total cost to the Authority of $14.1 billion. For additional detail on the projects included as part of the Move Illinois Program, see “THE CAPITAL PROGRAM – The Move Illinois Program” and APPENDIX B - “Consulting Engineers’ Report.”
The Authority has issued the 2013A Bonds, 2014B Bonds, 2014C Bonds, 2015A Bonds, 2015B Bonds, 2016B Bonds, 2017A Bonds, 2019A Bonds and 2020A Bonds in the aggregate principal amount of $3.6 billion to pay the costs of the Move Illinois Program. The Authority currently expects that the remaining costs of the Move Illinois Program will be funded with (i) proceeds from an estimated $2.2 billion aggregate principal amount of Additional Senior Bonds (which includes the 2021A Bonds), and (ii) other Authority funds. A resolution adopted by the Authority on February 25, 2021 authorized the issuance of $600 million of Additional Senior Bonds to fund a portion of the Move Illinois Program. On September 9, 2021, the Authority adopted a resolution authorizing the issuance of up to $200 million aggregate principal amount of Additional Senior Bonds to fund a portion of the Move Illinois Program. The 2021A Bonds are being issued pursuant to the $600 million of authorization from the resolution adopted February 25, 2021 and the additional authorization from a resolution adopted on September 9, 2021.
In addition to the 2021A Bonds, the Authority also currently expects to issue, as Additional Senior Bonds on a parity with the 2021A Bonds and all Senior Bonds currently outstanding, approximately $1.5 billion aggregate principal amount of Additional Senior Bonds to finance a portion of the costs of the Move Illinois Program, consisting of approximately $400 million principal amount of bonds issued during the year 2022 and approximately $1.1 billion principal amount of bonds issued during the years 2023-2024. Amounts and timing are estimated and subject to change. As cashflow and the overall program schedule permits, the Authority may adjust timing of individual projects within existing project budgets, including to reduce project costs, reduce construction impacts on commuters, and/or optimize use of available resources in response to temporary delays.
In May 2020, the Authority authorized the issuance of up to $900 million aggregate principal amount of Additional Senior Bonds to refund all or portions of the 2013A Bonds and 2014B Bonds, in order to reduce debt

3
service. This authorization of refunding bonds is scheduled to expire December 31, 2022. The Authority may issue a portion of such refunding bonds as early as January 2022.
The Authority may, from time to time in the future, extend or supplement the authorizations described in the preceding paragraphs. The Authority may adopt new authorizations for additional indebtedness or hedging instruments in connection with future bonds. Issuance of additional indebtedness or hedging instruments will be subject to compliance with the requirements for additional indebtedness set forth in the Indenture. See APPENDIX D – “SUMMARY OF CERTAIN PROVISIONS OF THE INDENTURE – ADDITIONAL INDEBTEDNESS.”
ESTIMATED SOURCES AND APPLICATIONS OF FUNDS
The estimated sources and applications of the 2021A Bonds and other available funds are set forth below:
SOURCES Principal Amount of 2021A Bonds $700,000,000Original Issue Premium $172,974,010
TOTAL $872,974,010
APPLICATIONS Deposit to 2021A Construction Sub-Account $840,952,999Deposit to Debt Reserve Account $ 29,656,965Costs of Issuance(1) $ 2,364,046
TOTAL $872,974,010
(1)Includes underwriters’ discount and costs of issuance consisting of legal, financial advisory and rating agency fees. Funds for costs of issuance are deposited into and paid from the Series 2021A Construction Sub-Account, in accordance with the Indenture.
DESCRIPTION OF THE 2021A BONDS
General
The 2021A Bonds will be issued in the aggregate principal amount of $700,000,000, will be dated the date of issuance thereof and will bear interest at the rates per annum and to the maturity dates shown on the inside front cover page of this Official Statement, subject to optional redemption as set forth below.
Interest on the 2021A Bonds; Payment; Authorized Denominations
The 2021A Bonds will bear interest at the rates per annum set forth on the inside front cover page of this Official Statement (computed on the basis of a 360-day year composed of twelve 30-day months), payable on each January 1 and July 1, commencing July 1, 2022.
The principal or Redemption Price of the 2021A Bonds will be payable in lawful money of the United States of America upon surrender of such 2021A Bonds to the Trustee at the designated corporate trust office of the Trustee. Interest on the 2021A Bonds will be payable by check or bank draft mailed or delivered by the Trustee to the Registered Owners as the same appear on the registry books of the Authority maintained by the Trustee as of the applicable Record Date or, in the case of a Registered Owner of $1,000,000 or more in aggregate principal amount of 2021A Bonds who so elects, by wire transfer of funds.
The 2021A Bonds will be issued in denominations of $5,000 and integral multiples of such amount (“Authorized Denominations”).

4
Redemption of 2021A Bonds
Optional Redemption. The 2021A Bonds are subject to redemption at the election or direction of the Authority on any date on or after January 1, 2032, in whole or in part, and if in part, in Authorized Denominations, at a Redemption Price equal to 100% of the principal amount of the 2021A Bonds called for redemption plus accrued interest, if any, to the redemption date.
Sinking Fund Redemption. The 2021A Bonds maturing on January 1, 2046 and bearing interest at the rate of 4.00% per annum (“4.00% 2046 Term Bonds”) and the 2021A Bonds maturing on January 1, 2046 and bearing interest at the rate of 5.00% per annum (“5.00% 2046 Term Bonds”) are subject to mandatory redemption pursuant to Sinking Fund Installments prior to their maturity at a Redemption Price equal to the principal amount thereof by application by the Trustee in accordance with the Indenture of funds on deposit to the credit of the Redemption Sub-Account. Subject to the availability of funds for transfer from the Revenue Fund and from the Debt Reserve Account, deposits to be applied to Sinking Fund Installments are to be made into the Redemption Sub-Account pursuant to the Indenture in amounts that will make possible the retirement of 4.00% 2046 Term Bonds and 5.00% 2046 Term Bonds by purchase during the Fiscal Year, or by mandatory redemption on January 1, in the respective years and in the aggregate principal amounts as set forth in the following tables (each constituting a Sinking Fund Installment), as adjusted pursuant to the provisions of the Indenture described in the paragraph following the tables:
Available funds on deposit in the Redemption Sub-Account and Debt Reserve Account are required to be applied to the payment of Sinking Fund Installments; provided, that failure to retire the entire scheduled amount of 4.00% 2046 Term Bonds and 5.00% 2046 Term Bonds through the application of any Sinking Fund Installment on or prior to the next scheduled Sinking Fund Installment date is not an Event of Default under the Indenture. Any amount of 4.00% 2046 Term Bonds and 5.00% 2046 Term Bonds not so retired will be added to the amount to be retired on the next scheduled Sinking Fund Installment date for such Bonds. For a description of the application of funds on deposit in the Redemption Sub-Account to the payment of Sinking Fund Installments or the purchase of such Bonds, see APPENDIX D – “SUMMARY OF CERTAIN PROVISIONS OF THE INDENTURE – FLOW OF FUNDS – Debt Service Account.”
On each mandatory sinking fund redemption date the Authority shall be given credit for the principal amount of any 4.00% 2046 Term Bonds or 5.00% 2046 Term Bonds it has (i) redeemed pursuant to the optional redemption provisions for such Bonds described above, or (ii) purchased and surrendered for cancellation as described in the Indenture, provided credit has not previously been given for such redeemed or purchased Bonds.
Selection of Bonds for Redemption; Notice of Redemption
If less than all of the 2021A Bonds are to be redeemed, the particular 2021A Bonds or portions of 2021A Bonds to be redeemed shall be selected by the Authority in the principal amount designated to the Trustee by the
For the 4.00% 2046 Term Bonds
Year Principal Amount
2044 $60,000,0002045 60,000,0002046 (maturity) 60,000,000
For the 5.00% 2046 Term Bonds
Year Principal Amount
2044 $60,000,0002045 60,000,0002046 (maturity) 60,000,000

5
Authority; provided, however, that in the case of the redemption of less than all of the 2021A Bonds of a single maturity, such redemption (i) shall be by lot in such manner as the Trustee may determine among such 2021A Bonds, and (ii) shall be in a principal amount equal to an Authorized Denomination.
Notice of any redemption of 2021A Bonds will be given by the Trustee by registered or certified mail, postage prepaid, to the Registered Owner of any 2021A Bonds to be redeemed not fewer than 30 days prior to the redemption date. Neither failure to give notice by mail nor defect in any notice so mailed in respect of any 2021A Bond will affect the validity of any proceedings for redemption of any other 2021A Bonds with respect to which notice was properly given. No further interest will accrue on the principal of any 2021A Bonds properly called for redemption after the redemption date if payment of the Redemption Price thereof has been duly provided for, and the Registered Owners of such 2021A Bonds will have no rights with respect to such 2021A Bonds nor will they be entitled to the benefits of the Indenture except to receive payment of the Redemption Price thereof and unpaid interest accrued to the date fixed for redemption.
Bond Registration and Transfers
For a description of the procedure to transfer ownership of a 2021A Bond while in the book-entry only system, see APPENDIX E – “BOOK-ENTRY SYSTEM.” Subject to the limitations described below, the 2021A Bonds are transferable upon surrender thereof at the principal office of the Trustee, accompanied by a written instrument or instruments of transfer in form satisfactory to the Trustee and duly executed by the Bondholder or such Bondholder’s attorney duly authorized in writing. Any 2021A Bond, upon surrender of such 2021A Bond at the principal office of the Trustee, shall be exchanged for an equal aggregate principal amount of 2021A Bonds of any Authorized Denomination of the 2021A Bond being surrendered. The Trustee may charge a fee sufficient to cover any tax, fee or other governmental charge in connection with any exchange or transfer of any Bond.
The Trustee is not required to make any transfer or exchange of any 2021A Bond during the period between each Record Date and the next succeeding interest payment date of such 2021A Bond or after such 2021A Bond has been called for redemption.
Mutilated, Lost, Stolen or Destroyed Bonds
If any 2021A Bond is mutilated, lost, stolen or destroyed, the Authority shall execute, and the Trustee shall authenticate, a new 2021A Bond; provided, however, that the Authority and the Trustee shall require satisfactory indemnification prior to authenticating a new 2021A Bond, and the Trustee shall require satisfactory evidence of the ownership and the mutilation, loss, theft or destruction of the affected 2021A Bond. The expense of issuing a substitute 2021A Bond in place of a mutilated, lost, stolen or destroyed 2021A Bond shall be borne by the Registered Owner.
SECURITY AND SOURCES OF PAYMENT FOR THE 2021A BONDS
The following is a summary of certain provisions of the Indenture relating to the 2021A Bonds and other Bonds issued under the Indenture. A more detailed summary of such provisions is included in APPENDIX D – “SUMMARY OF CERTAIN PROVISIONS OF THE INDENTURE.”
Pledge of Revenues and Funds
All Bonds issued under the Indenture, including the 2021A Bonds, are payable solely from and secured solely by a pledge of and lien on the Net Revenues of the Tollway System and certain other funds as provided in the Indenture.
THE 2021A BONDS AND ANY OTHER BONDS ISSUED UNDER THE INDENTURE DO NOT REPRESENT OR CONSTITUTE A DEBT OF THE AUTHORITY OR OF THE STATE OF ILLINOIS WITHIN THE MEANING OF ANY CONSTITUTIONAL OR STATUTORY LIMITATION OR A PLEDGE OF THE FAITH AND CREDIT OF THE AUTHORITY OR THE STATE OF ILLINOIS, OR GRANT TO THE OWNERS OR HOLDERS THEREOF ANY RIGHT TO HAVE THE AUTHORITY OR THE ILLINOIS GENERAL ASSEMBLY LEVY ANY TAXES OR APPROPRIATE ANY FUNDS FOR THE PAYMENT OF THE PRINCIPAL OF,
6
PREMIUM, IF ANY, OR INTEREST ON THE BONDS, OTHER THAN AS MAY BE AUTHORIZED UNDER THE ACT AND PLEDGED IN ACCORDANCE WITH THE INDENTURE. THE ACT PROVIDES THAT NEITHER THE DIRECTORS OF THE AUTHORITY NOR ANY PERSON EXECUTING THE 2021A BONDS SHALL BE LIABLE PERSONALLY ON THE 2021A BONDS OR BE SUBJECT TO ANY PERSONAL LIABILITY OR ACCOUNTABILITY BY REASON OF THE ISSUANCE OF THE 2021A BONDS.
Toll Covenant
The Authority covenants in the Indenture that, in each Fiscal Year, tolls will at all times be set so that Net Revenues will at least equal the Net Revenue Requirement for such Fiscal Year, comprised of the amount necessary to cure deficiencies, if any, in the Debt Service Account, Debt Reserve Account, any Junior Bond Debt Service Account and any Junior Bond Debt Service Reserve Account plus the greater of (i) the sum of Aggregate Debt Service (defined to include all debt service on Senior Bonds), the Junior Bond Revenue Requirement and the Renewal and Replacement Deposit for such period, or (ii) 1.3 times the Aggregate Debt Service for such period. Under the Act, the Authority has the exclusive right to determine, fix, impose and collect tolls for the use of the Tollway System. Such tolls are required under the Act to be fixed and adjusted at rates calculated to provide the lowest reasonable toll rates to provide funds that will be sufficient, together with other revenues of the Authority, to pay the costs of any authorized new construction and the reconstruction, major repairs or improvements to the Tollway System and the costs of operating and maintaining the Tollway System and paying debt service on all Outstanding Bonds. There is no other State of Illinois executive, administrative or regulatory body or regional or local governmental or regulatory body with the authority to limit or restrict such rates and charges. See APPENDIX D – “SUMMARY OF CERTAIN PROVISIONS OF THE INDENTURE - TOLL RATE COVENANTS.”
Certain Amendments to the Indenture
Transfer Amendment. Each Supplemental Indenture of the Authority, beginning with the Seventh Supplemental Indenture and extending through the Thirty-First Supplemental Indenture, amends the Indenture, subject to receipt of consent of the owners of the requisite principal amount of Bonds Outstanding on the date of such consent (as described below) and certain Providers, to permit the Authority to sell, lease or otherwise dispose of or encumber all or a portion of the Tollway System (collectively, “Transfer”) upon delivery to the Trustee of, among other items, (i) an opinion of bond counsel to the effect that the Transfer complies with the provisions of the Act and the Indenture and will not cause interest on any Senior Bonds or Junior Bonds Outstanding immediately prior to the Transfer or on any Subordinated Indebtedness to become subject to Federal income taxation, (ii) evidence that the Transfer will not adversely affect the rating on any Bonds Outstanding immediately prior to the Transfer, (iii) a certificate of the Traffic Engineers estimating toll receipts for the portion of the Tollway System that has not been conveyed (“Remaining Tollway System”), (iv) a certificate of the Consulting Engineers estimating Operating Expenses and Renewal and Replacement Deposits for the Remaining Tollway System, and (v) a certificate of the Authority based upon the certificates of the Traffic Engineers and the Consulting Engineers stating, among other things, that for the then current and each of the next ten Fiscal Years, the Net Revenues allocable to the Remaining Tollway System will be not less than the greater of (A) one and one-half (1.5) times the Aggregate Debt Service and the Junior Bond Revenue Requirement (excluding, in each case, Bond interest, the payment of which shall have been provided by payments or deposits from Bond proceeds) allocable to the Remaining Tollway System for each such Fiscal Year (“Remaining Tollway System Debt Service”), and (B) the sum of the Remaining Tollway System Debt Service and the Renewal and Replacement Deposit for each such Fiscal Year. See APPENDIX D – “SUMMARY OF CERTAIN PROVISIONS OF THE INDENTURE – ADDITIONAL COVENANTS – Sale, Lease or Encumbrance of Property” for a further description of this amendment (“Transfer Amendment”).
Reserve Account Credit Facility Amendment. Each Supplemental Indenture of the Authority, beginning with the Twenty-Ninth Supplemental Indenture, amends the Indenture, subject to receipt of consent of the owners of the requisite principal amount of Bonds Outstanding on the date of such consent (as described below) and certain Providers, to allow the Provider of a Reserve Account Credit Facility which is a surety bond or insurance policy to be an insurer whose municipal bond insurance policies insuring the payment, when due, of the principal of and interest on municipal bond issues results in such issues being rated not lower than the second highest rating category by S&P Global Ratings and Moody’s Investors Service, Inc. or their successors, or any insurer who holds the highest policyholder rating accorded insurers by A.M. Best & Co. or any comparable service. See APPENDIX D –

7
“SUMMARY OF CERTAIN PROVISIONS OF THE INDENTURE – FLOW OF FUNDS – Debt Reserve Account” for a further description of this amendment (“Reserve Account Credit Facility Amendment”).
Effectiveness of Amendments. Neither the Transfer Amendment nor the Reserve Account Credit Facility Amendment shall become effective until such time as the Authority has obtained both: (i) the consents of all Providers with respect to the Senior Bonds and Refunding Bonds then Outstanding; and (ii) the consents of the Holders of at least a majority in principal amount of the Senior Bonds then Outstanding and of at least a majority in principal amount of the Junior Bonds then Outstanding. The Authority has not issued any Junior Bonds. The Authority has received the consent of the requisite bondholders to the Transfer Amendment but not the consent of the requisite Providers. Neither consent referenced in clause (i) or (ii) above has been received with respect to the Reserve Account Credit Facility Amendment. Accordingly, neither the Transfer Amendment nor the Reserve Account Credit Facility Amendment is effective. See APPENDIX D – “SUMMARY OF CERTAIN PROVISIONS OF THE INDENTURE – SUPPLEMENTAL INDENTURES.”
EACH PURCHASER OF THE 2021A BONDS WILL BE DEEMED TO HAVE CONSENTED TO THE TRANSFER AMENDMENT AND THE RESERVE ACCOUNT CREDIT FACILITY AMENDMENT BY ITS PURCHASE OF THE 2021A BONDS.
Flow of Funds
The Authority covenants to deliver all Revenues (other than investment income, unless otherwise directed by the Indenture) to the Treasurer of the State of Illinois (“Treasurer”), within five Business Days after receipt, for deposit in the Revenue Fund. On or before the 20th day of each month, the Treasurer, at the direction of the Authority, will transfer or apply the balance in the Revenue Fund not previously transferred or applied in the following order of priority:
First, to the Operating Sub-Account of the Maintenance and Operation Account;
Second, to the Operating Reserve Sub-Account of the Maintenance and Operation Account;
Third, to the Trustee for deposit to the credit of the Interest Sub-Account, Principal Sub-Account and Redemption Sub-Account of the Debt Service Account, for deposits relating to the Senior Bonds;
Fourth, to the Trustee for deposit to the credit of the Provider Payment Sub-Account of the Debt Service Account to pay Costs of Credit Enhancement, not including termination payments, or Costs of Qualified Hedge Agreements, not including termination payments, or to reimburse Providers of Credit Enhancement or Qualified Hedge Agreements for payments of principal or interest made by such Providers;
Fifth, to the Trustee for deposit to the credit of the Debt Reserve Account;
Sixth, to the Trustee for deposit to the credit of any Junior Bond Debt Service Account or any Junior Bond Debt Reserve Account;
Seventh, to the Termination Payment Account to pay termination payments then due and owing with respect to Credit Enhancement and Qualified Hedge Agreements;
Eighth, to the Renewal and Replacement Account;
Ninth, at the direction of the Authority, to the Improvement Account; and
Tenth, the balance, if any, to the System Reserve Account.
The flow of funds is further described in APPENDIX D – “SUMMARY OF CERTAIN PROVISIONS OF THE INDENTURE – FLOW OF FUNDS.”

8
Debt Reserve Account
The Indenture establishes one Debt Reserve Account for all outstanding Senior Bonds. Amounts on deposit in the Debt Reserve Account are required to be used by the Trustee to cure any deficiencies arising from time to time in the Debt Service Account with respect to payment of interest or principal (including Sinking Fund Installments) on Senior Bonds. The Debt Reserve Requirement is the maximum annual Aggregate Debt Service for any Fiscal Year for all Outstanding Senior Bonds.
Under the Indenture, the Authority may deliver a surety bond, insurance policy, letter of credit or other credit facility meeting the requirements of the Indenture (“Reserve Account Credit Facility”) to the Trustee to meet all or a part of the Debt Reserve Requirement. For a description of the requirements of a Reserve Account Credit Facility, see APPENDIX D – “SUMMARY OF CERTAIN PROVISIONS OF THE INDENTURE – FLOW OF FUNDS – Debt Reserve Account.”
In November 2008, the Authority applied funds in the Debt Reserve Account to obtain a financial guaranty insurance policy qualifying under the Indenture as a Reserve Account Credit Facility from Berkshire Hathaway Assurance Corporation (“BHAC”) in the stated amount of $100,000,000 (“BHAC Policy”) and for a term expiring January 1, 2033 to satisfy a portion of the Debt Reserve Requirement. The BHAC Policy is guaranteed by Columbia Insurance Company (“Columbia”), an affiliate of BHAC. Each of Moody’s Investors Service, Inc. and S&P Global Ratings, Inc. currently rate each of BHAC and Columbia as “Aa1” and “AA+,” respectively. A.M. Best & Co. currently rates Columbia with a Financial Strength Rating of “A++” and an Issuer Credit Rating of “aaa,” both of which are the highest A.M. Best & Co. ratings for those categories. A.M. Best & Co. does not rate BHAC.
Upon issuance of the 2021A Bonds and application of the proceeds thereof, the applicable Debt Reserve Requirement will equal $557,160,000. Concurrently with the delivery of the 2021A Bonds and the deposit of $29,656,965 of the proceeds thereof in the Debt Reserve Account, the aggregate amount of cash and permitted investments on deposit in the Debt Reserve Account, together with any financial guaranty insurance policies or other instruments constituting a Reserve Account Credit Facility, will be not less than the Debt Reserve Requirement.
In the event the balance in the Debt Reserve Account is less than the Debt Reserve Requirement, the Treasurer, at the direction of the Authority, is required to transfer monthly to such Account from the Revenue Fund, subject to certain prior transfers as described above under “SECURITY AND SOURCES OF PAYMENT FOR THE 2021A BONDS – Flow of Funds,” an amount sufficient to cause the balance in the Debt Reserve Account to equal the Debt Reserve Requirement. In the event the amount credited to the Debt Reserve Account, including the amount of any Reserve Account Credit Facility, and after making any required reimbursement to a Provider of a Reserve Account Credit Facility, exceeds the Debt Reserve Requirement, the excess shall be used as provided in the Indenture and summarized under APPENDIX D – “SUMMARY OF CERTAIN PROVISIONS OF THE INDENTURE – FLOW OF FUNDS – Debt Reserve Account.”
Additional Indebtedness
The Indenture permits the Authority to incur additional indebtedness, including Senior Bonds on parity with the 2021A Bonds and other Outstanding Senior Bonds, Junior Bonds and Subordinated Indebtedness. Additional Senior Bonds may be issued for the purposes of (a) paying Costs of Construction of any Project (which includes modifications and enhancements to the existing Tollway System, as well as System Expansion Projects and Renewal and Replacements), (b) refunding or prepaying, at or prior to maturity, Senior Bonds or any other obligations of the Authority issued or entered into for purposes for which Senior Bonds may be issued, (c) making deposits to the Debt Reserve Account or acquiring a Reserve Account Credit Facility, (d) paying interest on any Bond, (e) paying any costs of issuing Senior Bonds, and (f) paying Costs of Credit Enhancement and Qualified Hedge Agreements for Additional Senior Bonds. The requirements relating to the incurrence of additional indebtedness are described in this Official Statement in APPENDIX D – “SUMMARY OF CERTAIN PROVISIONS OF THE INDENTURE – ADDITIONAL INDEBTEDNESS.”
The Authority is also authorized by the Indenture to incur additional indebtedness by the issuance of one or more series of Junior Bonds or Subordinated Indebtedness for any purpose for which Senior Bonds may be issued without satisfying the requirements for the issuance of Additional Senior Bonds.

9
Other Covenants
The Authority covenants in the Indenture not to: (i) issue any bonds or other evidences of indebtedness (other than Senior Bonds, Junior Bonds and Subordinated Indebtedness) secured by a pledge of or lien on Net Revenues or the moneys, securities or funds set aside under the Indenture; (ii) create any lien or charge on Net Revenues or the moneys, securities or funds set aside under the Indenture except for (a) evidences of indebtedness payable from moneys in the Construction Fund as part of the Cost of Construction of any Project, and (b) Subordinated Indebtedness; or (iii) sell, lease or otherwise dispose of or encumber the Tollway System except as provided in the Indenture. See APPENDIX D – “SUMMARY OF CERTAIN PROVISIONS OF THE INDENTURE – ADDITIONAL COVENANTS – Sale, Lease or Encumbrance of Property.” The Authority also covenants, among other things, to prepare an annual budget, operate the Tollway System in a sound and economical manner, maintain the Tollway System, maintain insurance and keep proper books of records and accounts.
The Trustee
The Indenture contains provisions regarding the designation of a successor trustee by the Authority and the assumption by a successor trustee without Authority action of the trusteeship resulting from the transfer of substantially all corporate trust business of the Trustee. See APPENDIX D – “SUMMARY OF CERTAIN PROVISIONS OF THE INDENTURE – REMOVAL OR MERGER OR CONSOLIDATION OF TRUSTEE.”
The Indenture grants to the Trustee the right to act on behalf of the owners of the 2021A Bonds and other Outstanding Senior Bonds and any Outstanding Junior Bonds if an Event of Default occurs. The rights of owners of Bonds to bring direct action are limited as provided in the Indenture, but owners may bring direct action in the event of a default in the payment of Debt Service. See APPENDIX D – “SUMMARY OF CERTAIN PROVISIONS OF THE INDENTURE – EVENTS OF DEFAULT – Proceedings Brought by Trustee.”
THE AUTHORITY
The Authority was created under the Act as an instrumentality and administrative agency of the State of Illinois (“State”) to provide for the construction, operation, regulation and maintenance of a system of toll highways within the State. Under the Act, on April 1, 1968, the Authority assumed all the obligations, powers, duties, functions and assets of its predecessor agency, The Illinois State Toll Highway Commission. The Act authorizes the issuance of revenue bonds for the purposes of, among others, financing expansions of the Tollway System and reconstruction of and improvements to the Tollway System and authorizes the issuance of refunding bonds for the purpose of refunding any bonds of the Authority then outstanding at maturity or on any redemption date.
The Authority is empowered to enter into contracts; acquire, own, use, hire, lease, operate and dispose of personal and real property, including rights-of-way, franchises and easements; establish and amend resolutions, bylaws, rules and regulations; fix and revise tolls; acquire, construct, relocate, operate, regulate and maintain the Tollway System; exercise the power of eminent domain; and contract for services and supplies, including services and supplies for the various patron service areas on the Tollway System.
Board of Directors
The Authority is governed by an 11-member Board of Directors that includes the Governor of Illinois, ex officio, and the Secretary of the Illinois Department of Transportation, ex officio. Nine directors are appointed by the Governor, with the advice and consent of the Illinois Senate. Eight of the nine directors listed below were appointed pursuant to Illinois Public Act 100-1180, effective February 28, 2019. Subsequent appointments or reappointments have been for four-year terms or, in the case of an appointment to fill a vacancy, the unexpired term. No more than five directors may be from the same political party. Of the directors appointed by the Governor, one is appointed by the Governor as Chairman of the Authority.
The present directors, their terms of office and occupations are listed below.

10
Name Initial
Appointment* Expiration of Current Term Occupation
Governor JB Pritzker, ex officio
— — Governor of the State of Illinois
Secretary Omer Osman,ex officio
— — Secretary, Illinois Department of Transportation
Willard S. Evans, Jr., Chairman
February 28, 2019 March 1, 2025 President (retired), Peoples Gas and North Shore Gas
James Connolly, Vice Chair
February 28, 2019 March 1, 2023 Business Manager, Chicago & Vicinity Laborers’ District Council of the Laborers’ International Union of North America
Stephen L. Davis February 28, 2019 March 1, 2023 Chairman, The Will Group
Alice Gallagher February 28, 2019 March 1, 2025 President, Board of Trustees of the Village of Western Springs
Jacqueline Gomez Fuentes
January 26, 2021 February 28, 2023 Executive Director, Hispanic American Construction Industry Association
Karen McConnaughay February 28, 2019 March 1, 2025 Former State Senator
Scott Paddock February 28, 2019 March 1, 2025 Sr. Vice President-Marketing, Community Relations and Government Affairs of Silver Cross Hospital and Medical Center
Gary Perinar February 28, 2019 March 1, 2025 Executive Secretary-Treasurer, Chicago Regional Council of Carpenters Local 174
James Sweeney February 28, 2019 March 1, 2023 President-Business Manager, International Union of Operating Engineers Local 150
*Initial appointments and reappointments are subject to Illinois Senate confirmation. Any such appointment or reappointment, including the appointment of Director Gomez Fuentes and the reappointments of Directors Evans, Gallagher, McConnaughay, Paddock, and Perinar, that is not acted upon by the Illinois Senate within 60 session days is deemed to have received confirmation.
Principal Administrative Personnel
The Board of Directors of the Authority appoints an Executive Director and employs certain other personnel to administer the Tollway System and implement its policies. The following individuals are the principal administrative personnel of the Authority:
Willard S. Evans, Jr., Chairman of the Board and Chief Executive Officer. On February 28, 2019, Mr. Evans was appointed Chairman of the Board of the Authority. As stated in the Authority’s By-Laws, Mr. Evans also is the Chief Executive Officer of the Authority. Mr. Evans has nearly 40 years of experience in strategic planning, operations, engineering, construction, large infrastructure projects and major IT system implementations and has been in senior leadership for over 20 years. He is the former President of Peoples Gas and North Shore Gas, regulated natural gas utilities now owned by WEC Energy Group Inc.
José Alvarez, Executive Director. On April 18, 2019, the Board of Directors appointed Mr. Alvarez Executive Director of the Authority. Mr. Alvarez assumed the responsibilities of Executive Director on May 1, 2019. Prior to joining the Authority, Mr. Alvarez served as Chief Operating Officer and Chief of Staff of the Chicago Housing Authority. Mr. Alvarez has extensive experience in government administration for large, complex organizations. In addition to his work at the Chicago Housing Authority, Mr. Alvarez has served as Chief of Staff for the State Superintendent of Education for Washington D.C. Schools and various senior management roles for Chicago Public Schools.
11
Cathy R. Williams, Chief Financial Officer. Ms. Williams joined the Authority in 2012 as Deputy Chief of Finance and has served as Chief Financial Officer since March 1, 2020. In both capacities, Ms. Williams has had a lead role in managing financing of the Authority’s Move Illinois Program that commenced in 2012. Prior to joining the Authority, Ms. Williams was a Managing Director of Funds for JPMorgan Chase. Prior to that, Ms. Williams held several senior roles at JPMorgan predecessor banks (Bank One/First Chicago) including treasury management and internal audit. Ms. Williams received her undergraduate degree in Accounting from Roosevelt University and her Masters in Business Administration degree in Finance from the University of Chicago Booth School of Business and her CPA certificate from the State of Illinois.
Kathleen R. Pasulka-Brown, Assistant Attorney General and General Counsel. Ms. Pasulka-Brown assumed the responsibilities of General Counsel of the Authority on April 8, 2019. Ms. Pasulka-Brown began her legal career at the Chicago office of Chapman and Cutler. She subsequently became a partner at the Foley and Lardner law firm and most recently was a partner at Pugh, Jones & Johnson, P.C. During the more than 35 years Ms. Pasulka-Brown has practiced law, she has litigated matters involving insurance, electric and gas utilities, telecommunications, employment, construction, discrimination, foreclosures and bankruptcy. She has investigated failed banking institutions and prosecuted multi-million dollar claims against the directors and officers of such institutions. She also has handled federal and state appeals involving constitutional law, voting rights, contractual rights, tort immunity, personal injury, sexual abuse and the education of individuals with disabilities. Ms. Pasulka-Brown received her undergraduate degree from the University of California at Los Angeles cum laude and her law degree from Harvard Law School.
Manar Nashif, P.E., Acting Chief Engineering Officer. Mr. Nashif has been Acting Chief Engineering Officer of the Authority since March 2021. As Acting Chief Engineering Officer of the Authority, Mr. Nashif is responsible for the organization of the Engineering Department, including policies, procedures and performance, and ensuring the integrity and safety of Tollway infrastructure and implementation of the Move Illinois Program. He oversees a staff of engineers and consultants and manages the Engineering Department with a combined staff of approximately 500 employees. Mr. Nashif joined the Authority as Senior Project Engineer, Project Manager in 2005. After being promoted to Deputy Program Manager, he successfully managed the widening and reconstruction of 40 miles of the North Tri-State Tollway (I-294) between Dempster Road and the Wisconsin State Line, which was a part of the Congestion Relief Program. Since 2011, as Deputy Chief and Deputy Program Manager, Mr. Nashif has managed the complex Elgin-O’Hare Western Access project, which includes construction of the new I-490 Tollway to be located along the west side of O’Hare Airport. The project is a critical part of the Move Illinois Program. Mr. Nashif received his B.S. Degree in Chemical Engineering from Purdue University and his M.S. Degree in Civil Engineering from the University of Illinois at Urbana-Champaign. He is a Registered Professional Engineer in the State of Illinois.
Cassaundra Rouse, Chief Operating Officer. Since July 2021, Ms. Rouse has served as the Authority’s Chief Operating Officer, focusing on the execution and monitoring of Authority objectives, policies, guidelines and programs while, at the same time, ensuring that the goals and objectives of the Executive Director are comprehensively addressed. Ms. Rouse has assumed progressively greater responsibilities among the Authority’s leadership ranks over the past decade. Ms. Rouse previously served the Authority as: Chief Strategy and Implementation Officer, leading strategic initiatives to establish best practices in governance and implementation of compliance programs to strengthen the Authority’s internal control framework; Chief of Administration, responsible for the development and implementation of administrative policies and procedures and employee compliance; and Chief of Internal Audit, responsible for the design and execution of organizational audit strategies as well as direct communications with senior management on risk mitigation activities and internal controls. Ms. Rouse attended Howard University in Washington, D.C., and holds a Bachelor of Science degree in Management with a concentration in Accounting.
Organizational Structure
The Authority’s organizational structure consists of the following 17 departments: Administration, Business Systems, Communications, Diversity and Strategic Development, Engineering, Executive Office and Directors, Facilities and Fleet, Finance, Information Technology, Office of the Inspector General, Internal Audit, Legal, Operations, Planning, Procurement, Security and Safety and State Police District 15. As stated in the Act, the Chairman exercises general supervision over all powers, duties, obligations and functions of the Authority, and as stated in the Authority’s By-Laws, the Chairman is the Chief Executive Officer of the Authority (“Chairman/CEO”). The Executive Director manages day-to-day operations of the Authority and reports to the Chairman/CEO. The Chief

12
Financial Officer, Chief Internal Auditor and Equal Employment Opportunity Officer also report to the Chairman/CEO. The Commander of State Police District 15 reports to the Superintendent of the State Police and also reports to the Chairman/CEO. Similarly, the Assistant Attorney General and General Counsel of the Authority reports to the Attorney General of the State of Illinois and reports to the Chairman/CEO. Department chiefs report to the Chief Operating Officer, who reports to the Executive Director, except as follows: (i) the Chief of Business Systems, Chief of Information Technology, and Chief of Procurement report to the Chief Financial Officer; (ii) the EEO/AA/ADA Officer and Ethics/FOIA Officer report to the General Counsel; and (iii) with respect to the operation of the Inspector General’s Office, which is an independent office of the Authority, the Toll Highway Inspector General reports to the Authority’s Board of Directors.
The Administration Department is responsible for the development and implementation of administrative policies and procedures and employee compliance therewith.
The Business Systems Department is responsible for overseeing the electronic tolling system, collecting toll revenue, assessing and collecting invoicing fees and managing the collection of fines and penalties.
The Communications Department is responsible for external and internal communications between the Authority and its constituents, including customers, news media, elected and appointed officials, the general public and employees.
The Diversity and Strategic Development Department is responsible for promoting and implementing a comprehensive diversity program on behalf of the Authority to ensure inclusion and equal opportunity for small and veteran-owned business and disadvantaged minority- and women-owned business enterprise (D/M/WBE) firms in construction and engineering contracts and the supply of other goods and services.
The Engineering Department is responsible for the design, construction and maintenance of the Tollway System, which includes coordination and implementation of the Move Illinois capital program, inspection and maintenance of Tollway System infrastructure, and 24x7x365 monitoring of traffic operations, roadway maintenance, and incident management to ensure safe and efficient travel for Tollway customers.
The Executive Office and Directors manage Authority affairs consistent with the Act.
The Facilities and Fleet Department is responsible for maintenance and repairs at 186 Tollway System facilities and the service and repair of approximately 1,700 vehicles and operating equipment. The department also provides support services that include the warehousing and delivery of goods and materials, mail delivery, IT wiring and equipment installations at facilities, communication tower maintenance and repair, and the installation and repair of communication radio equipment in all Illinois State Police District 15 and Authority vehicles.
The Finance Department is responsible for general accounting, budgeting, treasury functions, financial reporting, accounts payable, toll revenue audit, payroll, risk management and debt management. In addition, the Finance Department manages certain investments of the Authority.
The Information Technology Department is responsible for planning, directing, managing, controlling and securing information technologies and telecommunications throughout the Authority.
The Office of the Inspector General is responsible for investigating allegations of waste, fraud, abuse, corruption, misconduct and mismanagement in the day-to-day operations of the Authority. In accordance with the Act, the Inspector General is appointed by the Governor, with the advice and consent of the Illinois State Senate, and serves a five-year term.
The Internal Audit Department recommends policies and procedures to ensure the Authority’s Board members, employees, contractors and/or vendors adhere to all State and federal laws, and internal rules and regulations.

13
The Attorney General of the State of Illinois is, by law, the legal advisor and legal representative of the Authority, and the Authority’s Legal Department is a Bureau of the Office of the Attorney General. On behalf of the Attorney General, attorneys in the Authority’s Legal Department handle all of the Authority’s legal matters and represent the Authority in all of its transactions and litigation. In addition, they examine and approve all contracts, leases, bonds or other undertakings or obligations of the Authority, as to form and constitutionality, prior to their execution and delivery.
The Operations Department is responsible for providing the necessary resources and services to maintain the Authority’s tolling operations as well as all aspects of public tolling and the associated support services through direct and indirect contact with the I-PASS Customer Service Center, oases, call center services, online inquiries and U.S. mail.
The Planning Department is responsible for strategic programming and planning, intergovernmental agreements, environmental and landscaping matters, legislation and policy, community relations, property management, geographic information system and geometrics.
The Procurement Department is responsible for agency wide procurement for all goods and services, construction, and all professional services including engineering and design. In addition, the Procurement Department ensures that all contracts are in compliance with stated goals, deliverables and obligations.
The Security and Safety Department is responsible for providing a secure and safe work environment for Authority employees and protecting both employees and Tollway facilities from threats, including natural, human-made, external and internal, while at the workplace. Additionally, the Department provides employees with comprehensive subject-matter training.
State Police District 15 is one of 21 districts of the Illinois State Police. It is responsible for providing comprehensive law enforcement services across the entire Tollway System. Officers assigned to District 15 patrol the Tollway System to enforce speed limits and traffic laws, assist disabled motorists and provide special details for specific operations, such as overweight vehicle enforcement.
Labor Relations
As of September 30, 2021, unions represent approximately 920 of the Authority’s 1,229 employees. The Authority currently has a collective bargaining agreement with Local 700 State and Municipal Teamsters and Chauffeurs Union, International Brotherhood of Teamsters, Chauffeurs, Warehousemen and Helpers of America, which represents approximately 448 employees, the majority of whom are roadway maintenance personnel. The term of the collective bargaining agreement is March 1, 2018 through February 28, 2023. The Authority has two collective bargaining agreements with the Metropolitan Alliance of Police (“MAP 135” and “MAP 336”), which together represent 21 employees. The Authority’s agreement with MAP 135, the MAP’s Telecommunicators, began May 1, 2017 and expired April 30, 2021. The Authority is in the process of negotiating a new contract with MAP 135. The Authority’s agreement with MAP 336, the MAP’s Civilian Call Takers, runs from November 1, 2018 through October 31, 2022. The Authority also has a collective bargaining agreement with the Service Employees International Union Local 73 (“SEIU”), which represents approximately 256 Authority employees. The SEIU bargaining unit includes toll collectors, money room employees, clerks, custodians and warehouse workers. The Authority’s collective bargaining agreement with SEIU runs from July 1, 2018 through June 30, 2023. Finally, approximately 195 professional and nonprofessional white collar Authority employees are represented by the American Federation of State, County and Municipal Employees, Council 31 (“AFSCME”) Local 3883. The term of the Authority’s agreement with AFSCME is January 1, 2018 through December 31, 2022.
Pension Plan
The State Employees’ Retirement System of Illinois (“SERS”) is a defined benefit, single-employer, public employee retirement system established to provide pension benefits for State of Illinois employees. SERS also administers widows and survivors benefits as well as the State’s occupational and non-occupational disability programs. SERS is governed by a 13-member Board of Trustees, consisting of the Illinois Comptroller, six trustees

14
appointed by the Governor with the advice and consent of the Illinois Senate, four trustees elected by SERS members and two trustees elected by SERS retirees. As of June 30, 2020, participation in SERS includes approximately 90,045 members, 62,621 active contributing members and 75,355 benefit recipients.
Substantially all of the Authority’s approximately 1,229 employees participate in SERS. SERS benefits earned by Authority employees while employed by the Authority are the responsibility of and administered by SERS, not the Authority.
The benefits paid by SERS are funded primarily through contributions made by employees participating in SERS, contributions made by the State (“State Contribution”), actuarially calculated pursuant to the provisions of the Illinois Pension Code, as amended (“Pension Code”), and investment returns on assets held by SERS. The Authority pays a portion of the State Contribution, which is determined through application of an employer contribution rate applied to the payroll of Authority employees participating in SERS (“Authority Contribution”). See “State Contribution and Portion of State Contribution Paid by the Authority” below.
SERS Significantly Underfunded
As of June 30, 2020, SERS’ total pension liability was $54,065,950,445, its Fiduciary Net Position (market value of assets) was $19,197,272,352 and its net pension liability was $34,868,678,093. SERS’ funded ratio, its Fiduciary Net Position as a percentage of its total pension liability (“Funded Ratio”), is 35.51% as of June 30, 2020. As of the end of fiscal years ended June 30, 2014 through June 30, 2020, SERS’ Funded Ratios have ranged from 30.58% to 35.64%. SERS’ Funded Ratios reflect that SERS has been and is significantly underfunded. SERS’ Funded Ratio is among the lowest of state pension plans in the United States.
Additional Information Regarding SERS
Additional information regarding SERS, including a review of SERS’ administration, funding, investments, pension benefit provisions, changes in benefit provisions, employee eligibility requirements (including eligibility for vesting) and the authority under which benefit provisions are established, are included in the SERS annual comprehensive financial report (“ACFR”) for the fiscal year ended June 30, 2020. The SERS ACFR is available on its website at https://srs.illinois.gov/SERS/archive_AnnualReports.htm or by request directed to State Employees’ Retirement System, 2101 S. Veterans Parkway, Springfield, Illinois 62704. Neither the content of the SERS ACFR nor the SERS website, or any information on the links appearing on the URL disclosed in the previous sentence, is incorporated into this Official Statement by reference. The Authority takes no responsibility for, nor has it attempted to verify the accuracy of, the information contained either in the SERS ACFR or on the SERS website. The Authority has not independently verified the information contained either in the SERS ACFR or on the SERS website and makes no representations and expresses no opinion as to the accuracy of such information.
State Contribution and Portion of State Contribution Paid by the Authority
The State Contribution is calculated by an actuary pursuant to the provisions of the Pension Code. The Pension Code requires the State to contribute annually the level percent of payroll necessary to allow SERS to achieve a 90% funded ratio by the end of State fiscal year 2045.
SERS establishes an employer contribution rate to be applied to fund the State Contribution. The employer contribution rate is expressed as a percentage of payroll for the upcoming fiscal year based on the required contribution for that fiscal year, the estimated payroll of eligible employees, and the recommendations of the actuary. The following table lists the employer contribution rates established by SERS for State fiscal years 2011 – 2022 and the preliminary contribution rate established by SERS for State fiscal year 2023:
Dates Applicable Employer Contribution Rate (%)
July 1, 2010 – June 30, 2011 27.988
July 1, 2011 – June 30, 2012 34.190
July 1, 2012 – June 30, 2013 37.987
July 1, 2013 – June 30, 2014 40.312

15
July 1, 2014 – June 30, 2015 42.339
July 1, 2015 – June 30, 2016 45.598
July 1, 2016 – June 30, 2017 44.568
July 1, 2017 – June 30, 2018 47.342*
July 1, 2018 – June 30, 2019 51.152**
July 1, 2019 – June 30, 2020 54.290
July 1, 2020 – June 30, 2021 54.831
July 1, 2021 – June 30, 2022 56.169
July 1, 2022 – June 30, 2023 53.258 (preliminary)***
* The employer contribution rate for State fiscal year 2018 was initially set at 54.013% and subsequently revised, effective for payrolls after January 10, 2018, to 47.342%, in accordance with Public Act 100-0023, to smooth out actuarial assumption changes over a five-year period. Refunds were provided for the excess portion of contributions made at the 54.013% rate, prior to the rate reduction to 47.342%.
** The employer contribution rate for State fiscal year 2019 was initially set at 51.614% and the Authority made contributions based on that rate. Pursuant to Public Act 100-0587, the employer contribution rate was recertified from 51.614% to 51.152%, retroactive to July 1, 2018. The Authority received a refund corresponding to this reduction in the amount of $531,379.
*** At its October 26, 2021 Board meeting, SERS set a preliminary employer contribution rate of 53.258% for the State fiscal year ending June 30, 2023. This rate is subject to review by the State actuary and expected to be finalized in January 2022.
The Authority pays the portion of the State Contribution to SERS related to the Authority’s payroll, calculated pursuant to the applicable employer contribution rate set forth above. The Authority’s contributions for Authority fiscal years (calendar years) 2010 through 2020 were as follows:
Dates Applicable
Authority Contribution
(Dollars in millions)
January 1, 2010 – Dec 31, 2010 30.3
January 1, 2011 – Dec 31, 2011 32.8
January 1, 2012 – Dec 31, 2012 37.9
January 1, 2013 – Dec 31, 2013 41.9
January 1, 2014 – Dec 31, 2014 46.7
January 1, 2015 – Dec 31, 2015 49.8
January 1, 2016 – Dec 31, 2016 50.2
January 1, 2017 – Dec 31, 2017 55.6
January 1, 2018 – Dec 31, 2018 55.2
January 1, 2019 – Dec 31, 2019 59.4
January 1, 2020 – Dec 31, 2020 61.9
The Authority’s $61.9 million contribution for its fiscal year 2020 was slightly above its budgeted amount of $59.2 million. The Authority’s contribution for Authority fiscal year 2021 included in its 2021 budget is $61.5 million, based on an assumed employer contribution rate of 54.596%. The Authority’s contribution for Authority fiscal year 2022 included in its 2022 tentative budget is $64.9 million, based on an assumed employer contribution rate of 55.382%. The Authority’s contributions to SERS are predominantly Operating Expenses of the Authority and, as such, are predominantly paid from the Maintenance and Operations Account. See “SECURITY AND SOURCES OF PAYMENT FOR THE 2021A BONDS – Flow of Funds.” For additional information, please see APPENDIX A – “FINANCIAL STATEMENTS – Note 12 – Contributions to State Employees’ Retirement System.”

16
The Authority Contribution to SERS has increased in recent years and may increase in the future as a result of potential increases in the employer contribution rate and/or increases in the amount of payroll, and such increases may have a material impact on the Authority’s finances. See “CERTAIN RISK FACTORS – Pension Expenses.”
The Authority currently contributes to SERS based on the covered payroll of Authority employees. Through legislative action, the State has the ability to modify the basis by which the Authority Contribution to SERS is determined. The Authority cannot predict the likelihood or the nature of any such future legislative action or changes in employer contribution rates as calculated by actuaries.
Financial Reporting under GASB Standards
The Governmental Accounting Standards Board (“GASB”) promulgates standards for financial reporting, including with respect to financial statements prepared by public pension systems and governments sponsoring such pension systems. Although SERS’ actuary utilizes these standards in preparing certain aspects of the annual actuarial valuation and the State uses these standards for financial reporting purposes, such standards do not impact the calculation of the State Contribution or the Authority Contribution.
For the Authority’s fiscal years up to and including the fiscal year ended December 31, 2014, the applicable GASB financial reporting standard pursuant to which the Authority’s financial statement disclosures related to pensions were prepared was GASB Statement No. 27. Beginning with the Authority’s fiscal year ending December 31, 2015, the applicable GASB financial reporting standard pursuant to which the Authority’s financial statement disclosures related to pensions have been prepared is GASB Statement No. 68, as amended by GASB Statement No. 71 (“Current GASB Standard”).
With respect to SERS and other government pension systems, the Current GASB Standard requires calculation and disclosure of a “Net Pension Liability,” which is the difference between the actuarial present value of projected benefit payments that is attributed to past periods of employee service calculated pursuant to the methods and assumptions set forth in the Current GASB Standard (referred to in such statements as “Total Pension Liability”) and the fair market value of the pension plan’s assets (referred to as the “Fiduciary Net Position”).
The Current GASB Standard requires SERS to produce an allocation of its Net Pension Liability and pension expense (“Pension Expense”) and recognize proportionate shares for the State’s primary government and component units, including the Authority. As a component unit of the State for financial reporting purposes, beginning with the fiscal year ending December 31, 2015, the Authority reports, among other items related to the Current GASB Standard, SERS’ calculation of the proportionate amount of SERS’ Net Pension Liability and Pension Expense allocable to the Authority under the Current GASB Standard. The implementation of the Current GASB Standard for financial reporting purposes has not changed the Authority’s pension-related funding obligations.
SERS has prepared allocations of its Net Pension Liability for each of its fiscal years ended June 30, 2014 through June 30, 2020. The percentage allocated to the Authority (“Allocation Percentage”) in each year was determined by comparing the Authority Contribution to the State Contribution, with certain adjustments, for such years. The Allocation Percentage and the resultant allocated Net Pension Liability for such fiscal years are as follows:

17
SERS Fiscal Year (June 30)
Allocation Percentage
Allocated Net Pension Liability
2014 2.6826% $727,079,026
2015 2.6261 735,523,053
2016 2.6382 900,824,457
2017 2.6999 888,456,774
2018 2.6698 882,540,010
2019 2.5568 853,819,076
2020 2.5578 891,871,048
In addition, the portion of Pension Expense allocated to the Authority for the SERS’ fiscal years ended June 30 of each of 2014 (the first year for which such allocation was made), 2015, 2016, 2017, 2018, 2019 and 2020 was $81,995,381, $62,052,322, $115,385,838, $118,083,891, $97,525,530, $67,395,991 and $75,079,257, respectively. The Pension Expense included in the Authority’s financial statements for Authority fiscal years ending December 31 will differ from these amounts due to certain adjustments related to the State’s fiscal year-end (June 30) being different from the Authority’s fiscal year-end (December 31).
While the portions of SERS’ Net Pension Liability and Pension Expense allocated to the Authority are material to the Authority’s financial statements, the State Contribution and Authority Contribution are determined pursuant to the Pension Code, which requires the State to amortize its unfunded liabilities of SERS to a funded ratio of 90% by 2045. Therefore, the Current GASB Standard does not impact the State Contribution and Authority Contribution.
Other Post-Employment Benefits
The State provides certain health, dental, vision and life insurance benefits (such post-employment benefits other than pensions being commonly referred to as “other post-employment benefits” or “OPEB”) to certain retirees, including former Authority employees and their dependents. Substantially all State employees, including Authority employees, may become eligible for OPEB if they eventually become annuitants of one of the State sponsored pension plans, including SERS. The Illinois Department of Central Management Services administers these benefits with the assistance of the State’s public retirement systems, including SERS. The benefits provided and contribution amounts are subject to periodic change. A summary of the OPEB provisions, including the authority under which such provisions are established, and OPEB funding and cost is included as an integral part of the State of Illinois Annual Comprehensive Financial Report (“State ACFR”) for State fiscal year ended June 30, 2020, provided, however, that the content of such State ACFR is not incorporated into this Official Statement by such reference.
As of June 30, 2020, 1,444 Authority retirees meet the eligibility requirements for OPEB. For the years ended December 31, 2018, 2019 and 2020, the Authority’s operating expenses included $9.2 million, $8.1 million and $9.4 million, respectively, toward the State’s cost of these benefits. The Authority’s contributions towards the State’s costs of OPEB benefits are Operating Expenses of the Authority and, as such, are paid from the Maintenance and Operations Account.
GASB Statement No. 75, Accounting and Financial Reporting for Postemployment Benefits Other Than Pensions, was adopted by the Authority beginning with its annual financial statements for the fiscal year ending December 31, 2018. This statement establishes standards for recognizing and measuring OPEB liabilities, deferred inflows/outflows of resources and expenses and expenditures. The Illinois Department of Central Management Services prepares a report on the allocation of the State’s OPEB liability to the funds, departments and agencies of the State. On December 31, 2020, the Authority recorded a liability of $580,018,281. Such recorded OPEB liability, as reported on December 31, 2020, was measured as of June 30, 2020, with an actuarial valuation as of June 30, 2019. The Authority’s OPEB liability, as of the measurement date of June 30, 2020, was 1.3706% of all employer contributions made to the plan during the year ended June 30, 2020.
While reporting an allocation of a portion of the State’s OPEB liability, which began with the Authority’s financial statements for the fiscal year ended December 31, 2018, may be material to the Authority’s financial

18
statements, the basis for the Authority’s contributions towards the State’s costs of these benefits is not expected to change and is expected to continue to be an annual reimbursement based on costs incurred.
THE TOLLWAY
The Tollway System presently consists of approximately 294 miles of limited access highway in twelve counties in the northern part of Illinois and is an integral part of the expressway system in northern Illinois and the U.S. Interstate Highway System. The entire Tollway System has been designated a part of the U.S. Interstate Highway System.
Since beginning operations in 1958, the Tollway System has served an important role in the development of the northern Illinois economy. During its initial operation, the Tollway System permitted rapid interstate travel between northern Illinois, Indiana and Wisconsin. As the suburban areas surrounding Chicago expanded throughout the 1960’s and 1970’s, the Tollway System evolved into primarily a commuter travel system, serving suburban Chicago and Chicago O’Hare International Airport. At the present time, the five routes of the Tollway System described below serve, among other areas, suburban Cook County and the Chicago area “collar counties,” which together represent steadily growing areas in Illinois in terms of population and employment.
Routes
The Tollway System is currently made up of five tollways: the Jane Addams Memorial, the Tri-State, the Veterans Memorial, the Ronald Reagan Memorial and Illinois Route 390 (individually, “Tollway” and collectively, “Tollways”).
The Jane Addams Memorial Tollway, formerly the Northwest Tollway, constituting a portion of U.S. Interstate Highway 90, is a 76-mile roadway. The Jane Addams Memorial Tollway begins east of the intersection of the Kennedy Expressway from downtown Chicago and the Tri-State Tollway in the vicinity of O’Hare International Airport and extends to the west, crossing the Fox River just north of Elgin, Illinois. From there, it runs northwesterly to Rockford, Illinois and then northerly to a point near the Illinois-Wisconsin border, where it feeds into the Wisconsin portion of U.S. Interstate Highway 90 leading to Madison, Wisconsin.
The Tri-State Tollway, constituting portions of U.S. Interstate Highways 80, 94 and 294 and including the 5-mile Edens Spur, is an 82-mile beltway around the Chicago metropolitan area. It extends from a point near the Indiana state line, where it intersects with the Bishop Ford and the Kingery Expressways, to a point near the Illinois-Wisconsin border, where it connects with U.S. Route 41 and U.S. Interstate Highway 94 from Milwaukee. The Tri-State also connects with the Ronald Reagan Memorial Tollway to the western suburbs, the Eisenhower Expressway to downtown Chicago, the Jane Addams Memorial Tollway to the northwest suburbs, the Kennedy Expressway to downtown Chicago, the north end of the Edens Expressway to the north shore suburbs and downtown Chicago and the Stevenson Expressway to downtown Chicago. From its southern terminus, the Tri-State Tollway has a direct connection to the Indiana Toll Road via the Kingery Expressway and U.S. Interstate Highway 80. The Tri-State Tollway is the most traveled Tollway in the Tollway System, accounting for approximately 45% of the toll revenues of the Tollway System.
The Veterans Memorial Tollway (Interstate 355), formerly the North-South Tollway, is a 30-mile highway generally paralleling Illinois Route 53 in DuPage and Will Counties between approximately the intersection of Army Trail Road and the U.S. Interstate Highway 290 spur in Addison on the north and U.S. Interstate Highway 80 (near Joliet) on the south. The Veterans Memorial Tollway, which opened in December 1989, is the newest addition to the Tollway System and consists of six through lanes along its entire length. The Veterans Memorial Tollway runs through or near the communities of Bolingbrook, Downers Grove, Naperville, Lombard, Glen Ellyn and Wheaton. A 12.5- mile south extension of the Veterans Memorial Tollway through Will County from U.S. Interstate Highway 55 to U.S. Interstate Highway 80 (“South Extension”) opened on November 12, 2007, increasing the size of the Veterans Memorial Tollway to 30 miles.
The Ronald Reagan Memorial Tollway, formerly the East-West Tollway, consisting a portion of U.S. Interstate Highway 88, covers 96 miles and begins east of the junction of the Tri-State Tollway and the Eisenhower

19
Expressway and runs southwest and west, providing service to Oak Brook, Naperville, Aurora, DeKalb and Dixon, Illinois, ending at U.S. Route 30 in the Sterling/Rock Falls area. From U.S. Route 30, U.S. Interstate Highway 88 is a toll-free facility connecting to U.S. Interstate Highway 80 and the Quad Cities.
Illinois Route 390, formerly known as the Elgin-O’Hare Expressway, is the first all-electronic roadway to open on the Tollway System. Toll collection began July 5, 2016 on the western segment of Illinois Route 390 from Lake Street (U.S. Route 20) to I-290. The eastern segment of Illinois Route 390, from I-290 East to Illinois Route 83, opened to traffic with all-electronic tolling on November 1, 2017. Illinois Route 390 is the 10-mile east-west portion of the Elgin O’Hare Western Access Project (as defined below under “THE CAPITAL PROGRAM – The Move Illinois Program”). The Elgin O’Hare Western Access Project also includes a planned north-south connection from the eastern terminus of Illinois Route 390, connecting I-90 at Elmhurst Road to the north and I-294 near North Avenue to the south, which is currently planned to be completed by 2026 and is currently expected to be designated U.S. Interstate Highway 490.
Other Limited Access Highways
There are no limited access freeways or other limited access highways under construction, and to the knowledge of the Authority, no Federal, state or other agency is now planning the construction, improvement or acquisition of any highway or other facility that may be materially competitive with the Tollway System.
Patron Service Areas
Six patron service areas (collectively, “Oasis facilities”) serve the existing Tollway System. Four of the Oasis facilities are comprised of patron service buildings that house washroom facilities, restaurants and other traveler-related convenience services (“Oasis pavilions”) and motor fuel facilities consisting of a fuel station and associated retail convenience store (“Oasis fuel facilities”). The other two Oasis facilities only have an Oasis fuel facility and associated retail convenience store; neither have an Oasis pavilion. A brief overview of the Oasis facilities since 2002 follows.
In 2002, the Authority entered into separate triple-net lease agreements with Wilton Partners Tollway LLC (“Wilton”) for developing, operating, maintaining and managing the then-seven Oasis pavilions and with ExxonMobil Oil Corporation (“Exxon”). The lease agreements expire in April 2027.
On September 30, 2010, SFI Chicago Tollway LLC (“SFI”), an iStar subsidiary, took ownership of the Wilton leasehold, following court approval of a foreclosure sale. SFI contracts with MB Real Estate Services, LLC to manage the day-to-day operation of the Oasis pavilions. The guaranteed minimum rent for the Oasis pavilions was $743,000 in lease years 4-10 (2006–2012) and increased to $850,000 in years 11-25 (2012 – 2027) (subsequently reduced as described below). Over and above the guaranteed minimum rent, if SFI sublessees’ sales exceed certain sublease-specific break points, the Authority shares in a percentage of the profits.
In 2011, Exxon assigned its leasehold interest in the Oasis fuel facilities to 7-Eleven. Guaranteed rent for the Oasis fuel facilities was $900,250 annually through 2019 and was reduced in 2020 to $689,582 annually due to closures in connection with the Central Tri-State widening and reconstruction.
In connection with widening and reconstruction work on the Jane Addams Memorial Tollway (I-90) as part of the Move Illinois Program, on September 26, 2013, the Authority’s Board of Directors approved an agreement to terminate the portions of the Oasis lease specifically applicable to the Des Plaines Oasis pavilion. The Tollway provided the required advance notice to SFI and assumed possession of this Oasis pavilion for demolition purposes on April 1, 2014 after, in accordance with the terms of the lease, negotiating compensation to SFI, consisting of $8.8 million from the Authority and $500,000 from a reserve account. As a result of this limited lease termination, effective April 1, 2014, the annual guaranteed rent paid by SFI to the Authority for the remaining Oasis pavilions was reduced from $850,000 to $728,571. This lease termination with SFI related to the Des Plaines Oasis pavilion only and did not result in the removal of the 7-Eleven fuel station and associated retail convenience store (i.e., the Des Plaines Oasis fuel facility) nor did it affect the lease payments to the Authority therefor. Subsequently, on December 14, 2018, the Des Plaines Oasis fuel facility and related ramps and parking lots were permanently closed in preparation for future

20
work on an interchange linking the Jane Addams Memorial Tollway to the planned I-490 tollway. Guaranteed rent for the Oasis fuel facilities was reduced to $689,582 annually as a result of the closure of the Des Plaines Oasis fuel facility.
In connection with widening and reconstruction work on the Central Tri-State, as part of the Move Illinois Program, on June 28, 2018, the Authority’s Board of Directors approved an agreement to terminate the portions of the Oasis facilities lease specifically applicable to the O’Hare Oasis pavilion. The Authority assumed possession of this Oasis facility for demolition purposes on September 14, 2018, after, in accordance with the terms of the lease, negotiating compensation to SFI, consisting of $8.7 million from the Authority and $500,000 from a reserve account. As a result of this limited lease termination, effective September 14, 2018, the annual guaranteed rent paid by SFI to the Authority for the remaining five Oasis pavilions was reduced from $728,571 to $607,143 (the pro-rated amount for 2018 was $688,095). This lease termination with SFI related to the O’Hare Oasis pavilion only and did not result in the removal of the 7-Eleven fuel station and associated retail convenience store (i.e., the O’Hare Oasis fuel facility) and did not affect the lease payments to the Authority therefor.
In connection with additional widening and reconstruction work on the Central Tri-State, as part of the Move Illinois Program, the Authority notified SFI of its need to terminate the portions of the Oasis facilities lease specifically applicable to the Hinsdale Oasis and, in accordance with directives from the Authority’s Board of Directors, the Authority negotiated a partial buyout of the lease. The Authority assumed possession of this Hinsdale facility for demolition purposes on September 30, 2021, after, in accordance with the terms of the lease, negotiating compensation to SFI, consisting of $7,997,990 from the Authority and $834,068 from a reserve account. As a result of this limited lease termination, effective October 1, 2021, the annual guaranteed rent paid by SFI to the Authority for the remaining four Oasis pavilions was reduced from $604,143 to $485,714. This lease termination with SFI related to the Hinsdale Oasis pavilion only and did not result in the removal of the 7-Eleven fuel station and associated retail convenience store (i.e., the Hinsdale Oasis fuel facility) and did not affect the lease payments to the Authority therefor.
Toll Collections
At present, in order to reduce the possibility of transmission of the COVID-19 virus, the Authority utilizes all-electronic tolling (“AET”) facilities for toll collection along the entirety of its 294 miles of limited access roadway. The system consists of 28 mainline and 61 ramp toll plazas. Prior to March 14, 2020, in addition to electronic tolling, 22 of the 28 mainline plazas and 2 of the 61 ramp plazas offered attendants to process cash forms of payment. Also prior to March 14, 2020, in addition to electronic tolling, 52 of the 61 ramp plazas offered payment in coins or currency or by credit card.
The Authority operates an electronic toll collection system under the “I-PASS” service mark. I-PASS enables customers to pre-pay their tolls through an I-PASS account and have an electronic debit from their I-PASS account each time they go through a collection lane. The I-PASS customer’s account is typically set up to replenish itself in a pre-determined amount from a credit card on file once it reaches a minimum balance. All toll collection lanes accommodate payment by I-PASS. The Authority currently operates 111 I-PASS open road tolling lanes and 89 AET lanes, which allow cars and trucks to travel through at the posted speed limit. The Authority operates 193 dedicated I-PASS only lanes that allow vehicles to pass through toll plazas at reduced speeds (5-30 mph). Currently, there are approximately 8.1 million I-PASS transponders outstanding and approximately 88% percent of toll transactions are transponder-based. The remaining 12% of transactions are electronically processed based on video capture of license plate information.
The I-PASS system is designed to alleviate congestion and reduce travel times. I-PASS open road tolling lanes can process more than 2,000 vehicles per hour, compared to manual lanes at 350 vehicles per hour. As part of the Authority’s previous capital program known as the Congestion-Relief Program (“CRP”), during 2005 and 2006, the Tollway System was fully converted to an open road tolling system for I-PASS users. For a customer who travels through an electronic toll collection lane in a vehicle without a working transponder but with a license plate that a camera image review shows as registered to an active I-PASS account, the Authority debits such account at the applicable electronic toll rate via a process called “video-tolling” or “v-tolling.” Effective February 1, 2018, the Authority revised its video-tolling charges for passenger cars as follows: for any license plate with v-toll transactions within a given month, the electronic toll rate is applied to the first five video tolls and the non-I-PASS toll rate is

21
applied to any subsequent video tolls. The non-I-PASS toll rate is typically double the electronic toll rate, as described in further detail in the following subsection “Toll Rates.”
The administration of revised video-tolling charges for passenger cars was reviewed and approved by the State’s Joint Committee on Administrative Rules (“JCAR”). JCAR is a bipartisan legislative oversight committee created by the Illinois General Assembly in 1977. Pursuant to the Illinois Administrative Procedure Act, JCAR is authorized to conduct systematic reviews of administrative rules promulgated by State agencies.
In September 2005, the Authority became a member of the E-ZPass Interagency Group. As a result, motorists in states that have E-ZPass transponders are able to electronically pay tolls on the Tollway System, and motorists with I-PASS transponders are able to electronically pay tolls on highways and bridges that are part of the E-ZPass system. E-ZPass is currently in use on toll facilities in the following eighteen states: Delaware, Florida (Central Florida Expressway and Florida Turnpike Enterprise), Georgia (by the second quarter of 2022), Indiana, Kentucky, Maine, Maryland, Massachusetts, Minnesota, North Carolina, New Hampshire, New Jersey, New York, Ohio, Pennsylvania, Rhode Island, Virginia and West Virginia. In addition, I-PASS transponders are accepted on the Chicago Skyway toll bridge, which is part of the E-ZPass system.
As an alternative to paying tolls via transponder, the Authority’s Pay By Plate option allows customers to pay tolls by registering their license plate and payment information. The Authority charges the non-I-PASS rate for the Pay By Plate option. For the first nine months of 2021, Pay By Plate accounted for approximately 2.5% of Tollway toll revenues
In June 2020, the Tollway implemented an invoicing process for unpaid tolls. Details of the invoicing process are provided in the following chart. The vehicle tiers listed in the chart are generally passenger cars (Tier 1), small trucks (Tier 2), medium trucks (Tier 3), and large trucks (Tier 4). Regarding the two corridors listed in the chart, “IL-390” applies to the Illinois Route 390 corridor and “Standard” applies to all other Tollway System corridors. Lower fee amounts were assigned to Illinois Route 390 because of its more frequent toll collection points.
New Invoice Process
Corridor Vehicle Tier Initial Notice Second Notice Third Notice
Standard
Passenger (1) $3.00 $-- +$5.00
2 $5.00 $-- +$5.00
3 $9.00 $-- +$5.00
4 $15.00 $-- +$5.00
IL-390
1 $1.50 $-- +$2.50
2 $2.50 $-- +$2.50
3 $4.50 $-- +$2.50
4 $7.50 $-- +$2.50
An “unpaid toll” is a toll that is neither: (i) paid at the point of transaction; nor (ii) paid via Pay By Plate within two weeks of the transaction. An unpaid toll is subject to an initial invoice requesting payment of the toll at the non-I-PASS rate plus the applicable invoicing fee listed under “Initial Notice” in the preceding chart. If the toll remains unpaid, a reminder notice is sent. If the toll continues to remain unpaid, it becomes subject to an additional invoice requesting the amount from the initial invoice plus an additional invoicing fee as listed under “Third Notice” in the preceding chart.
If a toll remains unpaid through completion of the invoicing process, which is expected to occur roughly 90 days after the toll transaction, such unpaid toll becomes subject to other enforcement actions and potentially fines. The Authority previously maintained a violation enforcement system (“VES”) in-house that resulted in revenue totaling approximately $375 million from 2016 through 2020 (see “TABLE FIVE – SUMMARY OF OPERATING REVENUES, MAINTENANCE AND OPERATING EXPENSES, NET OPERATING REVENUES AND DEBT SERVICE COVERAGE FOR THE YEARS ENDED DECEMBER 31, 2016 – DECEMBER 31, 2020” and “FINANCIAL INFORMATION – Financial Information Discussion – Toll Revenue Collection”).

22
Beginning in 2022, the Authority will implement an out-sourced VES program for recovery of outstanding invoice debt. VES relies on a camera system to record multiple digital photos of a vehicle plate associated with unpaid tolls. The plate information is then cross-checked against the Illinois Secretary of State or appropriate out-of-state department of motor vehicles databases to identify the alleged violator.
With the introduction of invoicing and the impact of changes prompted by the response to the pandemic, the Authority has not issued any fine notices since March 2020. The Authority expects issuance of fine notices to resume in the first quarter of calendar year 2022 for evasion recovery from unpaid invoices via the outsourced VES program.
The Authority’s two existing contracts with collection agencies expire in December 2021 and are not expected to be renewed. Beginning in August 2021, the Authority entered into a contract with Professional Account Management, LLC (“PAM”) for an initial period of five years from August 2021 to August 2026 for the VES program and collection enforcement efforts. PAM will be responsible for managing placements of unpaid invoices, which include collection of toll amounts plus associated invoicing fees due. PAM will perform tasks that include but are not limited to: identifying registered owner of vehicles; printing and mailing of violation notifications; managing the civil administrative adjudication process used to adjudicate alleged instances of toll violations; performing customer services; administering collections efforts; and reporting financial reconciliation. There are no direct costs to the Authority for these services. Instead, as part of a revenue share of collected debt, PAM will pay a portion of recovered revenue to the Authority to adjudicate alleged instances of toll violations.
The outside vendors responsible for most of the Authority’s functions and services relating to electronic toll collection are Electronic Transaction Consultants Corp. (“ETCC”) and Accenture, LLP (“Accenture”).
Among other things, ETCC is responsible for maintenance of roadway vehicle identification and classification technology; recording, storing and auditing toll transactions; electronic collection of toll revenue; and the roadway violation enforcement system. ETCC’s contract with the Authority began June 29, 2005, with a five-year initial term, followed by extensions of the contract through December 31, 2016, and subsequent annual contracts through December 31, 2019 for continual support of the traffic and revenue applications. In January 2019, the Authority entered into a new Toll Collection System (“TCS”) maintenance contract with ETCC for a five-year term ending December 31, 2024, with option(s) to renew for up to an additional five years. The TCS contract provides maintenance support and monitoring of roadside toll collection technologies.
Accenture is responsible for a suite of back office applications for managing I-PASS accounts, e-commerce services, issuing and processing invoices, interfacing with the E-ZPass System and integrating with the roadway violations enforcement and toll collection technology. The Accenture tolling solution provides customer service, billing capabilities, system monitoring, and financial reporting functionalities. The Accenture back office system was implemented in September 2016. Accenture’s initial contract with the Authority began in October 2013. Accenture’s current contract with the Authority expires April 22, 2023.
Toll Enforcement
The Authority has statutory authority to fix, assess and collect civil fines against toll violators and to establish by rule a system of civil administrative adjudication to adjudicate alleged instances of toll violations. With the VES program’s launch in 2022, the Authority will place all operational aspects of toll evasion recovery with PAM. PAM will be responsible for administering the evasion recovery and collections process on the behalf of the Authority. PAM will administer an adjudication process for addressing disputes relating to alleged toll violations and assessing fines. Generally, if there are three or more unpaid tolls within a one-year period and invoices issued to collect on these unpaid tolls are unresolved, a Notice of Violation is issued for all such unpaid tolls. The alleged violator can schedule an administrative hearing to challenge one or more violations. If the hearing officer, or the Circuit Court on administrative review, finds that a toll violation or violations has occurred, or a judgment by default is entered, the amount of the unpaid toll plus a $20 ($10 on Illinois Route 390) fine per violation is levied on the registered owner of the vehicle involved in the violation(s). Violators who do not pay the unpaid tolls and fines are subject to increased fines of $50 to $70 per violation ($25 to $35 total on Illinois Route 390). PAM, on the Authority’s behalf, has the ability to refer Illinois violators who fail to pay their unpaid tolls and fines to the Office of the Secretary of State, which may revoke the violator’s license plate registration; registration suspension has not been exercised in recent years but PAM has the ability to do so in the future.

23
In 2020, the Authority implemented three tolling reforms: (i) an amnesty program consisting of significantly reduced fines for outstanding violations, (ii) relief from fines during the first three and a half months of the COVID-19 pandemic, and (iii) a significant reduction to initial added costs associated with unpaid tolls (as described above with the new invoicing process). The amnesty offer is for all fines in violation notices dated before March 9, 2020. Each such fine, whether $20 or $50 (as described above), is reduced to $3 if paid by December 30, 2020, which subsequently was extended until February 10, 2022. Due to the COVID-19 pandemic, for tolls incurred between March 9, 2020 and June 25, 2020, vehicle owners received invoices for tolls only, without the added expense of a violation.
Toll Rates
The Authority’s first major toll adjustment increased toll rates in 1963. An adjustment in August 1970 decreased toll rates and an adjustment in September 1983 increased toll rates. In connection with a major increase in commercial vehicle toll rates and cash-based passenger car toll rates in January 2005, the Authority simplified its rate structure, reducing the defined classes of vehicles from ten to the four utilized today. Class 1 is a passenger car class, and the other three classes are for commercial vehicles and consist of small, medium and large truck classes, generally classified by the number of axles.
In August 2011, the Authority’s Board authorized a major increase in toll rates in conjunction with the authorization of the Move Illinois Program. Specifically, the Authority:
- increased passenger car toll rates by approximately 87% effective January 1, 2012;
- authorized per-mile toll rates for the Elgin-O’Hare Western Access Project’s Illinois Route 390 (tolling implemented in July 2016 and November 2017) and to-be constructed I-490; and
- affirmed a commercial vehicle toll rate increase initially approved in November 2008, which: (a) increased most commercial vehicle toll rates by approximately 60%, of which approximately two-thirds of such increase became effective on January 1, 2015, approximately one-sixth of such increase became effective on January 1, 2016 and approximately one-sixth of such increase became effective on January 1, 2017; and (b) made commercial vehicle toll rates subject to an annual adjustment based on the Consumer Price Index for All Urban Consumers (“CPI-U”) effective on January 1, 2018 and every January 1st thereafter. The first such annual adjustment, effective January 1, 2018, increased commercial vehicle toll rates based on a CPI-U increase of 1.839%. Subsequent annual adjustments effective on January 1, 2019, 2020 and 2021 were based on CPI-U increases of 2.254%, 2.072% and 1.564%, respectively, and the annual adjustment effective January 1, 2022 will be based on a CPI-U increase of 2.302%.
When the Authority calculates new toll rates for a given year, such toll rates are implemented after rounding to the nearest nickel. For any new toll rates calculated based on the prior year’s toll rates, such calculations are made based on the prior year’s pre-rounded toll rates.
In order to help with congestion and expedite travel times, the Authority currently charges discounted rates for commercial vehicles using the Tollway System during overnight hours (10:00 p.m. – 6:00 a.m.). The current (2021) daytime rates for the three commercial vehicle classes of large (Tier 4), medium (Tier 3) and small (Tier 2) are $6.90, $3.90 and $2.60, respectively, at typical mainline plazas. The corresponding overnight (10:00 p.m. – 6:00 a.m.) rates are discounted to $5.20, $3.00 and $1.75.
In addition to overnight discounting for commercial vehicles, the Authority discounts toll rates for passenger cars that are I-PASS users paying electronically by 50% compared to passenger car users that either utilize Pay By Plate or pay online within 14 days of the transaction. At a typical Tollway mainline plaza, passenger car I-PASS users pay $0.75, compared to $1.50 for passenger car users utilizing Pay By Plate or paying online within 14 days.

24
As described in Section 19 of the Toll Highway Act, as amended by Public Act 100-0739, the Authority currently is prohibited from collecting tolls from certain entities and specific and limited public transportation entities are relieved of the obligation to pay tolls. The latter results in de minimis foregone revenue.
Table One sets forth the toll rates paid by various classes of motor vehicles at a typical mainline toll plaza for the periods shown.
[REMAINDER OF PAGE INTENTIONALLY LEFT BLANK]

25
TABLE ONE
ILLINOIS TOLLWAY TOLL RATES BY VEHICLE CLASS, 2005 – 2022
PASSENGER VEHICLES:
2005 – Current 2005 – 2011(1)(2) 2012 – 2022(1)(2)
Class Description Transponder Cash Transponder Cash
1
Automobile/SUV, motorcycle, taxi, single unit truck or tractor, two axles, four or less tires
$0.40 $0.80 $0.75 $1.50
COMMERCIAL VEHICLES:
2005 – Current: 2005 – 2011(1)(3) 2012 – 2014(1)(3) 2015(1)(3) 2016(1)(3) 2017(1)(3) 2018 – 2021 (1)(3)(4) 2022(1)(3)(4)
Class Description 6am–10pm
10pm–6am
6am–10pm
10pm–6am
6am–10pm
10pm–6am
6am–10pm
10pm–6am
6am–10pm
10pm–6am
6am–10pm
10pm–6am
6am–10pm
10pm–6am
2 Single unit truck or tractor, bus, two axles, six tires
$1.50 $1.00 $1.50 $1.00 $2.10 $1.40 $2.25 $1.50 $2.40 $1.60 $2.45 - $2.60
$1.65 - $1.75
$2.65 $1.75
3
Three and four axle trucks, three axle buses, and Class 1 vehicles with one and two axle trailers
$2.25 $1.75 $2.25 $1.75 $3.15 $2.45 $3.40 $2.65 $3.60 $2.80 $3.65 - $3.90
$2.85 - $3.00
$4.00 $3.10
4
Five and six axle trucks and miscellaneous, special, or unusual vehicles not classified above
$4.00 $3.00 $4.00 $3.00 $5.60 $4.20 $6.00 $4.50 $6.40 $4.80 $6.50 - $6.90
$4.90 - $5.20
$7.05 $5.30
(1) The toll rates listed above are rates for 11 of the 28 mainline plazas on the Tollway System. Toll rates at the other 17 mainline plazas differ by various amounts. Toll rates on Illinois Route 390 (where tolling began in 2016 / 2017) and the South Extension of I-355 (where tolling began in 2007) are significantly higher on a per-mile basis than toll rates on the rest of the Tollway System. A complete listing of toll rates at each plaza may be found on the Authority’s website. No other information from the Authority’s website is incorporated by reference into this Official Statement.
(2) Class 1 vehicles making payment via transponders (I-PASS, E-ZPass, etc.) are tolled at a discounted rate, and a non-discounted rate applies to payments made online within 14 days of the transaction. (3) Commercial vehicles (Classes 2-4) are tolled at a discounted rate during the overnight period of 10 p.m. – 6 a.m. (“Overnight Discount Rate”). Prior to January 1, 2009, commercial vehicles paying by
I-PASS were tolled at the discounted rate for certain off-peak time periods (“I-PASS Off-Peak Discount Rate”). This I-PASS Off-Peak Discount Rate expired on 12/31/2008. The Overnight Discount Rate continues.
(4) Beginning January 1, 2018, and each January 1 thereafter, commercial vehicle toll rates adjust at approximately the rate of change of the CPI-U. The adjustments effective 1/1/2018, 1/1/2019, 1/1/2020, and 1/1/2021 were based on CPI-U increases of 1.839%, 2.254%, 2.072%, and 1.564%, respectively. The adjustment effective 1/1/2022 will be based on a CPI-U increase of 2.302%.

26
Under the Act, the Authority has the exclusive right to fix, adjust, revise and collect tolls for the use of the Tollway System. Such tolls are required to be fixed and adjusted at the lowest reasonable toll rates calculated to provide funds that will be sufficient, together with other revenues of the Authority, to pay the costs of any authorized new construction or reconstruction, operation, repair, regulation and maintenance of the Tollway System and pay debt service on Outstanding Bonds. The Authority may increase tolls by vote of a majority of its Board of Directors, after conducting a public hearing in each county in which the proposed increase is to take place. No other State executive, administrative or regulatory body or regional or local governmental or regulatory body has the authority to limit or restrict such rates and charges.
Historical Toll Transactions and Toll Revenues
Table Two sets forth annual toll transactions for passenger and commercial vehicles for selected years since 1964.
TABLE TWO
ANNUAL TOLL TRANSACTIONS – PASSENGER AND COMMERCIAL VEHICLES 1964-2020 (SELECTED YEARS)
(TRANSACTIONS IN THOUSANDS)(1)
Year Passenger Commercial Total % Passenger 1964 72,721 7,005 79,726 91.211969 146,476 14,488 160,964 91.001974 204,360 28,446 232,806 87.781979 268,051 42,606 310,657 86.291984 308,104 42,890 350,994 87.781989 428,745 57,193 485,938 88.231994 565,601 66,693 632,294 89.451999 648,269 71,835 720,104 90.022004(2) 714,120 109,025 823,145 86.762005(2) 695,378 85,068 780,446 89.102006(2) 678,535 85,590 764,125 88.802007 696,055 92,237 788,292 88.302008 688,516 89,366 777,882 88.512009 694,837 80,516 775,353 89.622010 730,797 86,286 817,083 89.442011 743,195 89,633 832,828 89.242012 711,680 92,100 803,780 88.542013 720,513 95,528 816,042 88.292014 737,238 101,041 838,279 87.952015 777,719 103,896 881,615 88.222016(3) 823,643 108,248 931,891 88.382017(3) 883,468 113,866 997,334 88.582018 889,184 119,768 1,008,952 88.132019 900,809 122,413 1,023,222 88.042020 686,065 120,584 806,650 85.05
Source: Authority’s Annual Comprehensive Financial Report for the Year Ended December 31, 2020.
(1) Total may not add up due to rounding.(2) In 2003, a new Integrated Toll Collection System was completed, classifying vehicles by axle counts in relation to the toll paid by each
vehicle. In 2004, commercial vehicle counts were inflated by the new classification system due to passenger vehicle overpayments at ramp plazas. After the commercial vehicle toll increase in January 2005, the classification system has more accurately recorded passenger and commercial vehicle counts for 2005 and beyond. The Authority estimates approximately 50% of the decline in commercial vehicle transactions between 2004 and 2005 can be attributed to the over count of commercial vehicles and corresponding under count of passenger vehicles in 2004. In 2006, the Authority permanently converted from bidirectional to one-way tolling at the Belvidere and Marengo Mainline Toll Plazas on the Jane Addams Memorial Tollway in conjunction with a doubling of fares at those plazas. Due to this reconfiguration, total transactions were reduced by 14.6 million in 2006 with no localized revenue impact.
(3) Illinois Route 390 tolling began in July 2016 (6.5 miles) and November 2017 (3.5 miles).

27
Table Three sets forth annual toll revenues generated by passenger and commercial vehicles for selected years since 1964.
TABLE THREE
ANNUAL TOLL REVENUES – PASSENGER AND COMMERCIAL VEHICLES(1)(2)
1964-2020 (SELECTED YEARS) (DOLLARS IN THOUSANDS)
Year Passenger Commercial Total %Passenger 1964 $ 26,284 $ 4,888 $ 31,172 84.321969 46,872 8,803 55,675 84.191974 55,419 14,891 70,310 78.821979 73,048 24,068 97,116 75.221984 114,233 43,094 157,327 72.611989 155,394 57,387 212,781 73.031994 215,221 66,922 282,143 76.281999 259,448 73,178 332,626 78.002004 287,218 104,368 391,586 73.352005(3) 341,352 239,090 580,442 58.812006 324,556 242,944 567,500 57.192007 321,008 251,085 572,093 56.112008 335,653 247,994 583,647 57.512009 334,520 257,544 592,063 56.502010 348,946 279,808 628,754 55.502011 354,186 298,488 652,674 54.272012(3) 615,957 306,433 922,390 66.782013 622,349 320,803 943,152 65.992014 630,556 338,416 968,972 65.072015(3) 662,720 483,910 1,146,629 57.802016(3) 686,846 529,452 1,216,298 56.472017(3) 724,905 584,285 1,309,190 55.372018(4) 719,165 621,886 1,341,051 53.632019(4) 726,063 654,688 1,380,751 52.582020(4)(5) 522,789 626,231 1,149,020 45.50
Source: Authority’s Annual Comprehensive Financial Report for the Year Ended December 31, 2020.
(1) Total may not add up due to rounding.
(2) Annual toll revenues in this chart are booked toll revenues, which do not include tolls recovered through the evasion recovery process. See the footnote to Table Two regarding impact on 2004 vehicle classification resulting from completion in 2003 of a new Integrated Toll Collection System.
(3) Due to significant changes to rate structures implemented in 2005, 2012 and 2015, the percentage of revenues from passenger vehicles decreased significantly in 2005, increased significantly in 2012 and decreased significantly in 2015. More modest changes (relative to the aforementioned changes) increasing commercial vehicle toll rates in 2016 and 2017 contributed to the decreases in percentage of revenues from passenger vehicles in 2016 and 2017.
(4) Beginning January 1, 2018 and each January 1 thereafter, commercial vehicle toll rates adjust at approximately the rate of change of the Consumer Price Index-Urban Consumers (CPI-U). The resulting annual increase in commercial vehicle toll rates contributed to the decreases in percentage of revenues from passenger vehicles from 2018 to 2020.
(5) Toll Revenues were materially adversely impacted by the COVID-19 pandemic during 2020. Passenger vehicles were adversely impacted more than commercial vehicles, resulting in a decrease in the percentage of toll revenues from passenger vehicles in 2020.

28
Historical Net Operating Revenues
Table Four sets forth operating revenues, maintenance and operating expenses and net operating revenues, for selected years since 1964.
TABLE FOUR
OPERATING REVENUES, MAINTENANCE AND OPERATING EXPENSES, AND NET OPERATING REVENUES (1) (2)
1964-2020 (SELECTED YEARS) (DOLLARS IN THOUSANDS)
Year Operating Revenues Maintenance and
Operating Expenses Net Operating Revenues 1964 $ 32,135 $ 6,832 $ 25,3031969 57,395 13,015 44,3801974 72,737 23,715 49,0221979 100,436 39,733 60,7031984 162,108 56,639 105,4691989 254,734 85,065 169,6691994 309,949 116,996 192,9531999 366,092 146,881 219,2112004 423,427 198,302 225,1252005 613,034 205,575 407,4592006 606,954 213,510 393,4442007 637,794 222,295 415,4992008 691,113 244,275 446,8382009 658,052 255,185 402,8672010 672,760 250,857 421,9032011 697,416 245,975 451,4412012 963,755 253,058 710,6972013 1,009,776 277,512 732,2632014 1,036,156 297,821 738,3352015 1,220,463 298,479 921,9842016 1,298,800 309,239 989,5612017 1,401,818 319,538 1,082,2792018 1,458,141 336,361 1,121,780(3)
2019 1,509,624 350,206 1,159,418(3)
2020 1,282,540 360,203 922,337(3)
Source: Authority’s Annual Comprehensive Financial Report for the Year Ended December 31, 2020.
(1) Determined in accordance with the Series 1955 Bond Resolution through December 26, 1985 and in accordance with the Indenture on a Trust Indenture Basis (as defined in this Official Statement) subsequent to December 26, 1985. See “FINANCIAL INFORMATION – Financial Information Discussion – GAAP Basis and Trust Indenture Basis.” See Table Five for items included in Operating Revenues and Maintenance and Operating Expenses.
(2) Totals may not add up due to rounding.
(3) For a discussion of changes from 2018 to 2019 and 2019 to 2020, see “FINANCIAL INFORMATION – Financial Information Discussion.”

29
Table Five presents, for 2016 through 2020, a more detailed review of operating revenues, maintenance and operating expenses, net operating revenues and debt service coverage. Projected net operating revenues and debt service coverage for 2021 through 2032 are set forth as part of Table Seven.
TABLE FIVE
SUMMARY OF OPERATING REVENUES, MAINTENANCE AND OPERATING EXPENSES, NET OPERATING REVENUES AND
DEBT SERVICE COVERAGE FOR THE YEARS ENDED DECEMBER 31, 2016 – DECEMBER 31, 2020(1)(2)
(DOLLARS IN THOUSANDS)
2016 2017 2018 2019 2020Revenues:
Toll Revenue $1,216,298 $1,309,190 $1,341,051 $1,380,751 $1,149,020
Toll Evasion Recovery(3) 64,491 65,640 70,469 81,554 93,165
Concession/Miscellaneous 11,481 13,041 12,232 8,864 26,630
Investment Income 6,530 13,947 34,389 38,456 13,726
Total Operating Revenue $1,298,800 $1,401,818 $1,458,141 $1,509,624 $1,282,540
Maintenance and Operating Expenses
General Administration $25,732 $32,077 $47,341 $46,074 $46,334Engineering &
Maintenance 53,650 74,055 78,404 95,540 91,503
Toll Services 109,854 140,217 141,981 136,124 130,701Police, Safety and
Communication 27,256 37,908 40,762 42,190 45,729Insurance and Employee
Benefits(4) 92,748 35,282 27,873 30,278 45,935
Total Expenses $309,239 $319,538 $336,361 $350,207 $360,203
Net Operating Revenues $989,561 $1,082,279 $1,121,780 $1,159,418 $922,337
Total Debt Service(5) $387,933 $398,411 $424,244 $419,460 $442,114
Net Revenues After Debt Service(5) $601,628 $683,868 $697,536 $739,958 $480,224
Debt Service Coverage(5) 2.55 2.72 2.64 2.76 2.09
Source: Annual Comprehensive Financial Report for the Year Ended December 31, 2020.
(1) Determined in accordance with accounting principles set forth in the Indenture and may differ from financial statements prepared in accordance with generally accepted accounting principles. Maintenance and Operating Expenses exclude depreciation and amortization. See “FINANCIAL INFORMATION – Financial Information Discussion – GAAP Basis and Trust Indenture Basis.”
(2) Totals may not add up due to rounding.(3) The Authority recognizes fines as revenues when collected. As part of tolling reforms implemented in June 2020, the Authority began
invoicing its customers for nonpayment of tolls before assessing fines. If nonpayment occurs, an initial invoice is sent which incurs an initial processing fee, followed by a second reminder invoice (for which no additional fee is incurred), followed by a third invoice which incurs a second processing fee. The Authority accrues unpaid tolls and initial invoice processing fee revenue at 60% of the stated amounts of such tolls and fees. The Authority recognizes any second invoice processing fees and any subsequent fines as revenues only as/if collected.
(4) In year 2016, the line-item “Insurance and Employee Benefits” includes expenses for the employer portions of retirement and FICA, workers compensation and medical insurance, whereas in years 2017-2020 that line-item includes expenses only for workers compensation and medical insurance. In years 2017-2020, the expenses for the employer portions of retirement and FICA were allocated among the four department-based groupings listed in the chart above under Maintenance and Operating Expenses.
(5) Debt service does not net out Subsidy Payments received by the Authority as a result of the Authority’s election to issue the 2009A Bonds and 2009B Bonds as Build America Bonds.

30
Historically, Net Revenues after Debt Service have been used primarily to fund deposits to the Renewal and Replacement Account and the Improvement Account in amounts budgeted by the Authority. The Authority anticipates that Net Revenues after Debt Service will continue to be so applied.
THE CAPITAL PROGRAM
The Authority currently has one capital program in process: the Move Illinois Program, initially scheduled for the period 2012-2026, and currently expected to be completed in 2027. The Authority’s prior capital program, known as the Congestion-Relief Program, is complete. In accordance with the Indenture, a resolution adopted by the Authority on December 21, 2017, supported by a certificate of the Consulting Engineers, determined the substantial completion of the Congestion-Relief Program.
The Move Illinois Program
The Move Illinois Program is the Authority’s capital program for 2012-2027. It is a comprehensive capital program that commits approximately $14.3 billion in transportation funding to complete the rebuilding of the Tollway System, improve mobility, relieve congestion, reduce pollution and link economies across northern Illinois. The $14.3 billion projected cost has subsequently been reduced to $14.1 billion. The Move Illinois Program is expected to be funded in part from the issuance of approximately $5.8 billion of Bonds (of which $3.6 billion was issued prior to the issuance of the 2021A Bonds), with the remainder coming from Revenues. See “PLAN OF FINANCE” for anticipated timing of issuance of the Additional Bonds. The Authority approved the Move Illinois Program on August 25, 2011 in the amount of $12.2 billion. By resolution adopted on April 27, 2017, the Board of Directors of the Authority approved certain enhancements to the Move Illinois Program, increasing its total estimated cost to $14.3 billion. In connection with the initial approval of the Move Illinois Program, the Authority approved an approximately 87% increase in passenger vehicle toll rates effective January 1, 2012. The Authority also affirmed a previously approved increase in commercial vehicle toll rates. The commercial vehicle toll rate increase consisted of an approximately 60% increase that was phased in between January 1, 2015 and January 1, 2017, and an annual adjustment applied beginning January 1, 2018 based on the Consumer Price Index for all Urban Consumers (“CPI-U”). The Authority also established per-mile toll rate authorizations for the Elgin-O’Hare Western Access Project (Illinois Route 390 and the future I-490). Tolling was implemented on Illinois Route 390 in July 2016 and November 2017. See “THE TOLLWAY – Toll Rates.”
The basis for the Move Illinois Program was a capital needs analysis performed by Authority staff and consultants that included a comprehensive assessment of the current and future physical and operational characteristics of the entire Tollway System. Previous long-range plans were reevaluated, the needs of communities and stakeholders were catalogued and new technology and transit opportunities were explored. This evaluation became the foundation of the Move Illinois Program, which will provide additional capacity, relieve congestion and maintain the region’s competitiveness with other major cities in the United States and around the world.
The Move Illinois Program includes approximately $10 billion to fund improvements to the existing Tollway System necessary to keep it in a state of good repair. Such projects include:
Reconstructing and widening the Jane Addams Memorial Tollway (I-90) from the Tri-State Tollway (I-294) near O’Hare International Airport to the I-39 interchange in Rockford (completed)
Reconstructing and widening the central Tri-State Tollway (I-294) from 95th Street to Balmoral Avenue and the Edens Spur (I-94) (ongoing)
Preserving the Ronald Reagan Memorial Tollway (I-88) (ongoing) Preserving the Veterans Memorial Tollway (I-355) (ongoing) Repairing roads, bridges and maintenance facilities (ongoing)
The Move Illinois Program commits an additional approximately $4 billion to new priority projects that focus on enhancing regional mobility including:
Constructing new interchanges for I-294 at the I-57 and 147th Street ramps

31
Rehabilitation and widening of the portion of Illinois Route 390, formerly known as the Elgin- O’Hare Expressway, and construction of an approximately four-mile eastward extension of Illinois Route 390 (substantially complete) and completion of a north-south connection along the boundary of O’Hare International Airport linking the eastern terminus of Illinois Route 390 to I-90 at Elmhurst Road to the north and I-294 near North Avenue to the south, which such north-south connections are currently expected to be designated U.S. Interstate Highway 490 (“Elgin-O’Hare Western Access Project”)
Implementing features to accommodate transit and provide increased flexibility for passenger vehicles on the Jane Addams Memorial Tollway (I-90)
Planning for other projects
The Move Illinois Program also includes environmental initiatives such as wetland and endangered species mitigation, fuel consumption reduction, “green” construction materials and practices and introduction of new intelligent transportation systems. The Authority may accelerate certain projects, including the reconstruction and widening of the central portion of the Tri-State Tollway, within existing project budgets, in order to reduce construction impact on commuters.
As described later in “THE CAPITAL PROGRAM – Potential Additional Capital Projects – Statutory Approvals for New Toll Highways,” certain approvals of the Governor and the General Assembly are required by the Act in connection with the Authority’s issuance of bonds to finance costs related to new toll highways, including a requirement that prior to the issuance of bonds for the commencement of construction of any new toll highway, that particular toll highway shall be authorized by a joint resolution of the Illinois General Assembly. The Authority held multiple public hearings relating to the Move Illinois Program. The Authority presented preliminary plans and preliminary cost estimates to the Governor, which the Governor approved on October 7, 2011. On May 23, 2013, the Illinois Senate approved a House Joint Resolution HJR0009 adopted by the Illinois House on May 1, 2013, authorizing the Authority to expand the Tollway System through the construction of the Elgin-O’Hare Western Access Project.
For additional information about the Move Illinois Program, please see APPENDIX B – “CONSULTING ENGINEERS’ REPORT.”
Potential Additional Capital Projects
Statutory Approvals for New Toll Highways. The Authority has broad powers under the Act, including the power to conduct engineering or traffic studies relative to the potential need to expand and/or improve transportation services. However, in connection with the Authority’s issuance of bonds to finance costs related to new toll highways, the Act provides for certain prior approvals by the Governor and the Illinois General Assembly. Prior to commencing any engineering or traffic studies specifically intended to determine the feasibility of constructing additional toll highways in the State, the Authority must submit the proposed route, together with an estimate of the cost of the proposed study or studies, to the Governor for his approval. If the Governor approves such studies, or fails to disapprove such studies and estimated cost within 30 days after receipt, the Authority is permitted, but is not required, to proceed with such studies. Prior to the issuance of bonds, other than refunding bonds, for new toll highways, the Authority must first hold a public hearing relating to the proposed toll highway and then deliver to the Governor preliminary plans showing the proposed location of the route of the particular toll highway for which the bonds are to be issued, together with a preliminary estimate of the costs of construction. If the Governor approves the preliminary plans and the estimated construction costs, the Authority may, but is not required to, proceed with the issuance of bonds. In addition, the Act provides that prior to the issuance of bonds for, or the commencement of construction of, any new toll highway, that particular toll highway shall be authorized by a joint resolution of the Illinois General Assembly.
Potential System Expansion. The Illinois General Assembly has passed joint resolutions authorizing, but not requiring, the Authority to construct three new toll highways described in the following table that would add approximately 69 miles to the Tollway System.

32
Year of Joint Resolution Potential Toll Highway Additional Miles
1993 Southward extension of the Veterans Memorial Tollway from U.S. Interstate Highway 80 to U.S. Interstate Highway 57 near Peotone.
20
1993 North Extension extending Illinois Route 53 from Lake-Cook Road to the Tri-State Tollway.
23
1993 Richmond Waukegan Toll Highway extending from Illinois Route 120 west to Richmond, Illinois at approximately Illinois Route 173.
26
Pursuant to a Resolution passed on December 20, 2007, the Authority identified several projects in Northeastern Illinois not currently part of the Tollway System, known as the Illiana Expressway, the Crosstown Expressway, the Prairie Parkway, completion of the Elgin-O’Hare Western Access Project and improvement of the Eisenhower Expressway, as additional potential future projects to be studied by Authority management. Except with respect to the Elgin-O’Hare Western Access Project, which is part of the Move Illinois Program, the Authority has not completed feasibility studies, held the public hearings required by the Act, or requested the Governor’s approval of preliminary plans or estimates of construction costs for any of the potential toll highways or projects described above.
Before commencing construction on any new toll highway, the Authority must comply with all applicable legal requirements under the Act. In the future, the Authority may embark on other system expansion and improvement projects, depending upon factors such as the availability of funding for highway projects in the region, changes in traffic congestion patterns and agreements with other public entities in the region.
Condition and Maintenance
Providing Tollway System patrons with a well-maintained highway is a task assigned to the Authority’s maintenance crews. Personnel assigned to the twelve maintenance buildings, spaced at approximately 25-30 mile intervals along the road, are responsible for maintaining the Tollway System by keeping roads clean and safe in all weather conditions, particularly in winter when they clear the roadway of snow and ice.
In connection with properly maintaining the condition of the Tollway System, and in accordance with the Indenture’s requirement that the Authority employ a consulting engineer of nationwide and favorable reputation (“Consulting Engineers”) while any Bonds issued under the Indenture remain outstanding, including the 2021A Bonds, the Authority has employed, beginning in 2017, WSP USA Inc., Chicago, Illinois, as the Consulting Engineers. For fifty-nine years, Consulting Engineers have performed an annual inspection of the Tollway System’s roadways and facilities and produced a report of this inspection. The most recent report, regarding the annual inspection in the year 2020, is dated March 1, 2021 (“Consulting Engineers’ 2020 Annual Report”) and includes assessments of: roadway pavement, which includes a visual inspection, structural evaluation and pavement surface evaluations; roadway appurtenances (i.e., drainage structures, embankments, ditches, guardrail and median barriers, mile markers, pavement markers and right-of-way fencing); structures (i.e., bridges, large culverts, retaining walls, noise abatement walls and sign structures); and buildings and facilities (i.e., maintenance facility sites (garages, offices, salt domes, gas pumping facilities, storage buildings and similar sites), toll plazas, telecommunication buildings and Oasis facilities)). The Consulting Engineers’ 2020 Annual Report is available on the Authority’s website, provided, however, such website is not incorporated by reference into this Official Statement.
According to the Consulting Engineers’ 2020 Annual Report, although the original system continues to be well-maintained, design life expectancies of some infrastructure elements are reaching the end of predictable usefulness due to the effects of age and increasing traffic. Prior to the current capital programs, the Authority’s annual maintenance efforts focused on protecting the integrity of the roadway through projects such as emergency patching and intermittent pavement repairs. The report of the Consulting Engineers attached to this Official Statement

33
(“Consulting Engineers’ Report”) as APPENDIX B – “CONSULTING ENGINEERS’ REPORT” includes a summary of information in the Consulting Engineers’ 2020 Annual Report.
The Authority’s Renewal and Replacement program is based upon the recommendations of the Consulting Engineers. See “– Renewal and Replacement Program and Improvement Program” below.
Renewal and Replacement Program and Improvement Program
The Authority’s Renewal and Replacement program consists of projects to maintain the integrity of the existing Tollway System. The Renewal and Replacement program includes the preservation, replacement, repair, renewal and reconstruction or modification of the Tollway System but does not include System Expansion Projects or other Improvements. The Authority and its Consulting Engineers perform periodic inspections of the Tollway System to determine work necessary to maintain the existing system.
For the period from 2005 through 2020, the Authority credited approximately $3.77 billion to the Renewal and Replacement Account for rehabilitation, repair and replacement projects; such credited amounts are presented in Table Six. Deposits to the Renewal and Replacement Account are made from Net Revenues after deposits are made pursuant to the Indenture into the Maintenance and Operation, Debt Service, Debt Reserve, Junior Bond Debt Service, Junior Bond Debt Reserve and Termination Payment Accounts. See APPENDIX D – “SUMMARY OF CERTAIN PROVISIONS OF THE INDENTURE – FLOW OF FUNDS.”
TABLE SIX
RENEWAL AND REPLACEMENT PROGRAM FOR THE YEARS ENDED DECEMBER 31, 2005 THROUGH 2020 RENEWAL AND REPLACEMENT ACCOUNT
YearTotal Funds Credited(1)
2005 $ 204,609,5802006 186,545,0352007 198,331,6872008 1,907,175 (2)
2009 161,463,2382010 206,096,4872011 174,192,9972012 300,660,9372013 200,364,6112014 200,208,0792015 240,311,5452016 300,845,3452017 423,015,6752018 425,924,4372019 428,965,9932020 121,455,373 (3)
$3,774,898,194
Source: Authority’s Annual Comprehensive Financial Report for the Year Ended December 31, 2020.
(1) Includes investment earnings credited to the Renewal and Replacement Account.
(2) The Consulting Engineers deferred their recommended $100 million deposit for 2008 to 2009, based on a projected Renewal and Replacement Account balance of $74 million at the end of 2008, which the Consulting Engineers deemed an adequate reserve for unanticipated maintenance and rehabilitation needs of the Tollway System for 2009. The Authority’s deposit of $161,463,238 in 2009 included the amount deferred from 2008 to 2009.
(3) In September 2020, the Consulting Engineers revised their recommended $240 million deposit for 2020 to $120 million, due to capital spending that was less than anticipated.

34
Pursuant to the Indenture, on or before October 31 of each Fiscal Year, the Authority is required to prepare a tentative budget for the ensuing Fiscal Year and to include in such budget the recommendations of the Consulting Engineers as to the Renewal and Replacement Deposit for the ensuing Fiscal Year. In accordance with the Indenture, Renewal and Replacement Expenses anticipated to be funded with proceeds of Bonds are not included in this Renewal and Replacement Deposit recommendation. Based upon the recommendation of the Consulting Engineers, the Authority estimates that deposits totaling $228 million will be made in 2021, of which $171 million has been deposited as of the nine months ended September 30, 2021. A portion of the Renewal and Replacement Deposits will be used to fund certain costs of the Authority’s capital programs. For a current projection of future Renewal and Replacement Deposits, see the Consulting Engineers’ Report in APPENDIX B – “CONSULTING ENGINEERS’ REPORT.”
The tentative budget the Authority prepares each Fiscal Year may include the Authority’s estimate of the amount, if any, that will be available in the ensuing Fiscal Year for credit to the Improvement Account established under the Indenture, which is used to fund the Authority’s Improvement program. The Improvement program includes any System Expansion Project or any acquisition, installation, construction, reconstruction, modification or enhancement of or to any real or personal property (other than Operating Expenses) for which a currently effective resolution of the Authority has been adopted authorizing the deposit of Revenues to the credit of the Improvement Account for such System Expansion Project or acquisition, installation, construction, reconstruction, modification or enhancement including, without limitation, the cost of related feasibility studies, plans, designs or other related expenditures. The Authority has authorized the deposit of Revenues from time to time to the credit of the Improvement Account held under the Indenture for the purpose of funding the cost of each capital improvement that constitutes an “Improvement” under the Indenture. See “THE CAPITAL PROGRAM – The Move Illinois Program” and APPENDIX D – “SUMMARY OF CERTAIN PROVISIONS OF THE INDENTURE – FLOW OF FUNDS – Improvement Account.”
FINANCIAL INFORMATION
Financial Information Discussion
General. Management of the Authority is responsible for establishing and maintaining an internal financial control structure designed to ensure that (i) the assets of the Authority are protected from loss, theft or misuse, and (ii) adequate accounting data are compiled to allow for the preparation of financial statements in conformity with generally accepted accounting principles. The Authority’s internal financial control structure is designed to provide reasonable, but not absolute, assurance that these objectives are met. The concept of reasonable assurance recognizes that: (1) the cost of a control should not exceed the benefits likely to be derived from it; and (2) the evaluation of costs and benefits requires estimates and judgments by management.
The Authority issues audited financial statements (see APPENDIX A) annually, which are prepared in accordance with generally accepted accounting principles for public agencies. The Authority’s accounting system is organized and operated on an “enterprise fund basis.” The accounting practices of the Authority are more fully described in Note 1 to the audited financial statements. The notes provided in the audited financial statements included in APPENDIX A are an integral and essential part of adequate disclosures and fair presentation of the audited financial report. The notes include a summary of significant accounting policies for the Authority and other necessary disclosures of pertinent matters relating to the financial position of the Authority. The notes provide additional informative disclosures not reflected on the face of the financial statements. The audited financial statements should be read only in conjunction with the accompanying notes.
GAAP Basis and Trust Indenture Basis. In order to demonstrate compliance with requirements stated in the Indenture, the Authority prepares separate schedules in conformity with the requirements set forth in the Indenture (“Trust Indenture Financials”). The Trust Indenture Financials are not prepared in accordance with GAAP but rather reflect the requirements of the Indenture (“Trust Indenture Basis”). The Trust Indenture Financials prepared on a Trust Indenture Basis are the source of the financial information included in Table Four, Table Five, Table Seven, the “Budgetary Controls” and “Financial Results – Annual Budget for 2022 and Projected 2021 Results – Trust Indenture Basis” subsections of this section, and Section 6 of the Consulting Engineers’ Report. A primary difference in the financial information presented on a GAAP basis versus the Trust Indenture Basis is that no depreciation/amortization is included in operating expenses in the Trust Indenture Basis because capital assets are expensed when purchased. The Trust Indenture Financials for the years 2020 and 2019 that are included in the Supplementary Information section

35
(pages 63-78) of the audited annual financial statements (see APPENDIX A) include additional information on the differences between GAAP basis accounting and the Trust Indenture Basis in Footnote 1 of such Supplementary Information section.
Financial Results – Audited, GAAP Basis – 2020 Compared to 2019. The Authority’s total preliminary, unaudited fiscal year 2020 operating revenues, totaling $1.3 billion, were lower than the previous year by approximately $224 million (15%). This decrease was mainly attributable to reduced toll revenue resulting from the COVID-19 pandemic’s adverse impact on traffic. In 2020, toll revenue totaled approximately $1.1 billion versus $1.4 billion in 2019, a decline of $231.7 million, or 16.8%. Revenue from toll evasion recovery increased to $93.2 million (from $81.6 million), due in part to an increased rate of unpaid tolls caused by the pandemic-related suspension of cash payment options, an amnesty offer which incentivized payment of unpaid tolls and related fines, and impacts of a new invoicing program implemented effective in June 2020. Concession revenue decreased in 2020 to $1.4 million (18.8%) due to reduced traffic, which resulted in less revenue at the over the road oases which generate concession revenue to the Authority.
Operating expenses, excluding depreciation, decreased in 2020, to $380.7 million (3.4%) from $394.1 million in 2019. This was largely due to a reduction in customer service costs and credit card fees due to the reduced traffic on the roadway because of the COVID-19 pandemic. Depreciation and amortization expense increased by 4.0% to $494.6 million in 2020, from $475.6 million in 2019. The resulting net operating income for the year, $385.6 million, decreased by $229.1 million, or 37.3%, from the previous year.
Nonoperating revenue decreased by $22.9 million, due in large part to decreased investment returns as a result of decreased funds on deposit and lower investment rates. Again, this year the Authority received an interest rebate from the U.S. Department of the Treasury relating to bonds which were issued as Build America Bonds. The 2020 rebates totaled $13.6 million, substantially the same as 2019.
Nonoperating expenses decreased by $1.5 million, due to decreased interest expense and amortization of financing costs offset by an increase in expense under intergovernmental agreements. The net nonoperating expenses increased in 2020 by 8.9% from $240.1 million in 2019 to $261.5 million in 2020, due to the variances noted above.
Financial Results – Audited, GAAP Basis – 2019 Compared to 2018. The Authority’s total 2019 operating revenues, totaling $1.5 billion, exceeded those of the previous year by $48.1 million (3.3%). This increase came from toll revenue, which totaled $1.4 billion in 2019 (up $39.7 million (3.0%) from 2018) due to an increase in both commercial and passenger vehicle traffic and an increase in the commercial vehicle toll rates. Revenue from toll evasion recovery was also higher (15.8%) than 2018, at $81.6 million in 2019 (versus $70.5 million in 2018). Miscellaneous revenue in 2019 was $2.2 million lower than 2018, due mainly to decreased I-PASS transponder replacement revenue. Concession revenue decreased in 2019 to $1.7 million (20.2%) due to closures of oasis sites in recent years.
Operating expenses, excluding depreciation, remained fairly constant from 2018 to 2019. Depreciation and amortization expense increased by 6.6% to $475.6 million in 2019, from $446.2 million in 2018. The resulting net operating income for the year, $614.8 million, increased by $26.6 million, or 4.5%, from the previous year.
Nonoperating revenue increased by $8.9 million, due to increased investment returns and increased intergovernmental agreement revenue. Again, this year the Authority received an interest rebate from the U.S. Department of the Treasury relating to bonds which were issued as Build America Bonds. The 2019 rebate totaled $13.6 million, down from $15.2 million in 2018.
Nonoperating expenses increased by $14.7 million, due to increased interest and amortization of financing costs and increased intergovernmental agreement expense. The net nonoperating expenses increased this year by 2.5%, from $234.4 million in 2018 to $240.1 million in 2019, due to the variances noted above.
Annual Budget for 2022 and Projected 2021 Results – Trust Indenture Basis. The Authority is required by the Indenture to prepare a tentative budget of Operating Expenses for the ensuing Fiscal Year on or before October 31 of each Fiscal Year and adopt the annual budget for such Fiscal Year on or before January 31 of such Fiscal Year. The adopted annual budget does not require the approval of the Illinois General Assembly. For Fiscal Year 2022, the

36
tentative annual budget was presented to the Board of Directors of the Authority on October 21, 2021, and the final budget is expected to be presented to the Board of the Authority on December 16, 2021. The Authority’s tentative 2022 budget anticipates $1.49 billion in revenues and presents an overall spending plan that includes $411 million of operating expenses, $490 million of debt service and $1.486 billion of capital spending, portions of which will be funded by bond proceeds and amounts available in the Renewal and Replacement Account and the Improvement Account.
The tentative budget also includes projections for Fiscal Year 2021 of $1.459 billion in revenues, supporting projected spending of $379.5 million for operating expenses, $457 million for debt service and $1.327 billion in capital spending, portions of which will be funded by bond proceeds and amounts available in the Renewal and Replacement Account and the Improvement Account.
Toll Revenue Collection. The Authority experiences a difference between expected and actual toll revenue collected for a variety of reasons, such as non-payments (including toll evasion and non-payment resulting from improper transponder use), underpayments, insufficient funds in I-PASS accounts and collection or VES equipment failures. The Authority has implemented systems and procedures to reduce the differences between expected and actual toll revenue and to facilitate recovery of “lost” toll revenue. See “THE TOLLWAY – Toll Collections.”
Expected revenue represents revenue that would be collected if every vehicle paid the exact published toll based on vehicle class, time of day and payment type. Forecasted toll revenue in the report (“Traffic Engineers’ Report”) of CDM Smith Inc., Lisle, Illinois (“Traffic Engineers”) attached hereto as APPENDIX C – “Traffic Engineers’ Report,” represents such expected revenue and, therefore, does not account for (i) overpayments, underpayments, exemptions or revenue lost due to toll avoidance, or (ii) tolls and fines collected through the violation enforcement process. Amounts of revenue reported in the Authority’s quarterly statements and annual financial reports reflect these adjustments.
The difference between estimated expected toll revenues and booked toll revenues in 2015 – 2019 ranged from 5.7% – 7.2% and averaged 6.4%. Toll evasion recovery revenues in the same period averaged 5.1% of estimated expected toll revenues, resulting in average “net leakage” in 2015 – 2019 of 1.4% of estimated expected revenues. In 2020, the difference between estimated expected toll revenues and booked toll revenues was 11.8% and toll evasion recovery revenues were 7.2% of estimated expected toll revenues, resulting in “net leakage” of 4.7% of estimated expected revenues.
[REMAINDER OF PAGE INTENTIONALLY LEFT BLANK]

37
Outstanding Indebtedness
Set forth below is a summary of the outstanding bonded indebtedness of the Authority, after giving effect to the issuance of the 2021A Bonds. All are Senior Bonds under the Indenture.
Series Final Maturity Principal Outstanding Purpose of Issue
2009A Bonds 1/1/2034 $ 400,000,000 CRP2009B Bonds 12/1/2034 280,000,000 CRP2013A Bonds 1/1/2038 500,000,000 Move Illinois2014A Bonds 12/1/2022 101,715,000 Refunding2014B Bonds 1/1/2039 500,000,000 Move Illinois2014C Bonds 1/1/2039 400,000,000 Move Illinois2014D Bonds 1/1/2025 197,670,000 Refunding2015A Bonds 1/1/2040 400,000,000 Move Illinois2015B Bonds 1/1/2040 400,000,000 Move Illinois2016A Bonds 12/1/2032 333,060,000 Refunding2016B Bonds 1/1/2041 300,000,000 Move Illinois2017A Bonds 1/1/2042 300,000,000 Move Illinois2018A Bonds 1/1/2031 484,295,000 Refunding2019A Bonds 1/1/2044 300,000,000 Move Illinois2019B Bonds 1/1/2031 225,245,000 Refunding2019C Bonds 1/1/2031 697,870,000 Refunding2020A Bonds 1/1/2045 500,000,000 Move Illinois2021A Bonds 1/1/2046 700,000,000 Move Illinois
Total Outstanding Bonds $7,019,855,000
The 2009A Bonds and 2009B Bonds were issued to finance portions of a prior capital program of the Authority known as the Congestion-Relief Program. The 2013A Bonds, 2014B Bonds, 2014C Bonds, 2015A Bonds, 2015B Bonds, 2016B Bonds, 2017A Bonds, 2019A Bonds and 2020A Bonds were issued, and the 2021A Bonds are being issued, to finance portions of the Move Illinois Program. The 2014D Bonds were issued to advance refund a portion of the Authority’s Toll Highway Senior Priority Revenue Bonds, 2006 Series A-1. The 2014A Bonds were issued to advance refund a portion of the Authority’s Toll Highway Senior Priority Revenue Bonds, 2005 Series A. The 2016A Bonds were issued to advance refund the Toll Highway Senior Priority Revenue Bonds, 2008 Series B (“2008B Bonds”). The 2018A Bonds were issued to refund portions of the 2007A and 2008A Bonds (as described later in this paragraph) and fund related swap termination payments, and refund a portion of the 2009A Bonds. The 2019B Bonds were issued to refund the Authority’s Toll Highway Senior Refunding Revenue Bonds, 2010 Series A-1 (“2010A-1 Bonds”). The 2019C Bonds were issued to fund swap termination payments and refund the following bonds: (i) Toll Highway Variable Rate Senior Priority Revenue Bonds, 2007 Series A-1a (“2007A-1a Bonds”); (ii) Toll Highway Variable Rate Senior Priority Revenue Bonds, 2007 Series A-1b (“2007A-1b Bonds” together with the 2007 A-1a Bonds, the “2007 A-1 Bonds”); (iii) Toll Highway Variable Rate Senior Priority Revenue Bonds, 2007, Series A-2d (“2007A-2 Bonds” and together with the 2007A-1 Bonds, the “2007A Bonds”); (iv) Toll Highway Variable Rate Senior Refunding Revenue Bonds, 2008 Series A-1b (“2008 A-1 Bonds”); and (v) Toll Highway Variable Rate Senior Refunding Revenue Bonds, 2008 Series A-2 (“2008A-2 Bonds” together with the 2008A-1 Bonds, the “2008A Bonds”).

38
Annual Debt Service Requirements
Set forth below is a schedule of the annual debt service requirements associated with the 2021A Bonds and the other Senior Bonds Outstanding and the combined debt service requirements thereon for the years ending January 1, 2022 through January 1, 2046. The Authority does not have any bonds outstanding other than Senior Bonds.
2021A Bonds
Year Ending January 1
Debt Service on Senior Bonds
Outstanding(1)(2) Principal Interest
Total Debt Service on all Senior
Bonds(1)(2)
2022 $467,926,022 $ $ $ 467,926,0222023 466,995,300 - 33,302,083 500,297,3832024 466,998,300 - 31,970,000 498,968,3002025 466,937,050 - 31,970,000 498,907,0502026 483,616,300 - 31,970,000 515,586,3002027 517,974,800 - 31,970,000 549,944,8002028 517,846,550 - 31,970,000 549,816,5502029 518,146,550 - 31,970,000 550,116,5502030 518,344,800 - 31,970,000 550,314,8002031 518,315,300 - 31,970,000 550,285,3002032 525,187,050 - 31,970,000 557,157,0502033 525,156,797 - 31,970,000 557,126,7972034 525,168,004 - 31,970,000 557,138,0042035 525,127,800 - 31,970,000 557,097,8002036 525,155,000 - 31,970,000 557,125,0002037 525,183,750 31,970,000 557,153,7502038 525,190,000 31,970,000 557,160,0002039 521,130,000 4,000,000 31,970,000 557,100,0002040 505,345,000 20,000,000 31,810,000 557,155,0002041 388,905,000 97,000,000 31,010,000 516,915,0002042 260,800,000 99,000,000 26,160,000 385,960,0002043 184,635,000 120,000,000 22,200,000 326,835,0002044 176,670,000 120,000,000 16,200,000 312,870,0002045 98,700,000 120,000,000 10,800,000 229,500,0002046 120,000,000 5,400,000 125,400,000
Total $10,755,454,373 $700,000,000 $688,402,083 $12,143,856,456
(1) Debt service does not net out Subsidy Payments received or anticipated to be received by the Authority as a result of the Authority’s election to issue the 2009A Bonds and 2009B Bonds as Build America Bonds.
(2) Does not take into account any projected future bond issuance. Rows and columns may not add due to rounding.
Pro Forma Debt Service Coverage
Table Seven sets forth pro forma debt service coverage for the Fiscal Years 2021 through 2032, based upon the assumptions set forth in this Official Statement. Projected Toll Revenues in Table Seven are based on information from the Traffic Engineers’ Report attached hereto as APPENDIX C – “TRAFFIC ENGINEERS’ REPORT.” Projected Operating Expenses in Table Seven are based upon the Consulting Engineers’ Report attached hereto as APPENDIX B – “CONSULTING ENGINEERS’ REPORT.” Selected portions of each report are summarized in the paragraphs that follow in this section and reference is made to APPENDICES B and C for the reports of the Consulting Engineers and Traffic Engineers, respectively.
As previously noted, the toll revenue estimates in the Traffic Engineers’ Report represent expected revenue. Expected revenue represents the revenue that would be collected if every vehicle paid the applicable published toll based on vehicle class, time of day and payment type. The expected revenue does not account for overpayments, underpayments, exemptions or toll avoidance nor does it account for tolls and fines collected through the violation
39
enforcement system. In addition, estimates of toll revenues by the Traffic Engineers are based on various assumptions, including the continuation of annual adjustments implemented each January 1, beginning with January 1, 2018, to the commercial vehicle toll rate based on changes to the CPI-U index. The annual adjustments implemented on January 1 of each of 2018, 2019, 2020 and 2021 were based on CPI-U-based increases of 1.839%, 2.254%, 2.072% and 1.564%, respectively, and the annual adjustment effective January 1, 2022 will be based on a CPI-U increase of 2.302%. The Traffic Engineers have assumed annual increases of 2.000% in each calendar year thereafter. The Traffic Engineers’ Report assumes that for passenger vehicles, the present toll schedule will remain in effect. Critical revenue assumptions are stated in the Traffic Engineers’ Report. See APPENDIX C – “TRAFFIC ENGINEERS’ REPORT.”
Future Senior Bonds for the payment of Project Costs may be issued on a parity with Outstanding Senior Bonds, provided that the Authority certifies, based upon certificates of Traffic Engineers and Consulting Engineers and in addition to certain other required certifications, that (1) Net Revenues as reflected in the books of the Authority for a period of 12 consecutive months out of the 18 months next preceding each issuance (as adjusted to reflect certain adjustments of toll rates, if applicable) exceeded the Net Revenue Requirement for such 12-month period, and (2) estimated Net Revenues for the current and each future Fiscal Year through at least the fifth full Fiscal Year after the date of issuance of such Additional Senior Bonds shall be at least equal to the estimated Net Revenue Requirement for such Fiscal Year. Other tests apply for Senior Bonds issued for the purpose of completing a Project or Senior Bonds issued for refunding purposes. The Net Revenue Requirement means, with respect to any period of time, an amount necessary to cure deficiencies, if any, in the Debt Service Account, the Debt Reserve Account, any Junior Bond Debt Service Account and any Junior Bond Debt Reserve Account plus the greater of (i) the sum of Aggregate Debt Service (defined as the sum of the amounts of Debt Service with respect to all series of Senior Bonds), the Junior Bond Revenue Requirement and the Renewal and Replacement Deposit for such period, or (ii) 1.3 times the Aggregate Debt Service for such period. As of the date of this Official Statement, the Authority has no Junior Bonds or Subordinated Indebtedness outstanding. See APPENDIX D – “SUMMARY OF CERTAIN PROVISIONS OF THE INDENTURE – ADDITIONAL INDEBTEDNESS.”
Under the Indenture, the Authority is required to adopt an annual budget of its operating expenses for each Fiscal Year, which budget shall include the recommendations of the Consulting Engineers as to the Renewal and Replacement Deposit for such Fiscal Year and the Authority’s estimate of the amounts available for credit to the Improvement Account and the System Reserve Account. Estimates of Renewal and Replacement Deposits are based upon the Consulting Engineers’ assessment of the Tollway System and its independent review of information provided by the Authority, including projected balances, budgeted expenditures and projected future expenditures. The Consulting Engineers’ Report also contains projected Renewal and Replacement Deposits and projected Operating Expenses for years 2021 through 2032.
The following table sets forth pro forma debt service coverage for Fiscal Years 2021 through 2032, based upon the assumptions set forth in the footnotes. As noted in the footnotes, debt service in this table includes the issuance of the 2021A Bonds but does not take into account any bond issuance projected after the issuance of the 2021A Bonds. The Authority’s current estimate of projected debt service coverage assuming the issuance of all additional bonds for the Move Illinois Program, such assumed issuance as described in “PLAN OF FINANCE,” is approximately or exceeds 2x for each of Fiscal Years 2021 through 2032. This table should be considered in conjunction with the entire Consulting Engineers’ Report and the entire Traffic Engineers’ Report to understand the assumptions on which Projected Revenues and Projected Operating Expenses are based. There will usually be differences between projected and actual results, because events and circumstances frequently do not occur as expected, and those differences may be material. The financial information in the following Table Seven is projected on a Trust Indenture Basis.
[REMAINDER OF PAGE INTENTIONALLY LEFT BLANK]

40
TABLE SEVEN
PRO FORMA DEBT SERVICE COVERAGE (DOLLARS IN THOUSANDS)
Projected Revenues 2021 2022 2023 2024 2025 2026
Expected Toll Revenues(1) $1,480,990 $1,538,709 $1,572,405 $1,623,497 $1,652,327 $1,731,276
Evaded Tolls(2) (201,267) (184,645) (172,965) (162,350) (165,233) (173,128)
Evasion Recovery(3) 167,056 123,097 113,999 105,527 107,401 112,533
Concessions and Miscellaneous 10,000 11,000 10,000 10,000 10,000 10,000
Investment Income 2,380 3,000 10,000 19,000 20,000 17,000
TOTAL REVENUES $1,459,159 $1,491,161 $1,533,440 $1,595,675 $1,624,496 $1,697,681
Projected Operating Expenses(4) 379,516 410,900 426,200 442,000 458,100 475,200
Projected Net Revenues $1,079,643 $1,080,261 $1,107,240 $1,153,675 $1,166,396 $1,222,481
Projected Debt Service (5) $467,926 $500,297 $498,968 $498,907 $515,586 $549,945Pro Forma Debt Service Coverage 2.3 x 2.2 x 2.2 x 2.3 x 2.3 x 2.2 x
Projected Net Cash Flow (6) $611,717 $579,963 $608,272 $654,768 $650,810 $672,536
(1) Projected Expected Toll Revenues, the toll revenues that would be collected if applicable toll payments were received from all vehicles, are based upon the Traffic Engineers’ Report. See APPENDIX C.
(2) Evaded Tolls (aka Toll Revenue Leakage) is projected at 13.6% of Expected Toll Revenues in 2021, 12% in 2022, 11% in 2023 and 10% thereafter. See “THE TOLLWAY – Toll Collections” for a discussion of Evaded Tolls.
(3) Evasion Recovery in 2021 is projected at 83% of Evaded Tolls, equating to net leakage of 2.3%, and net leakage is projected to be 4.0% in 2022, 3.75% in 2023 and 3.5% thereafter.
(4) Projected Operating Expenses are based upon the Consulting Engineers’ Report. See APPENDIX B.
(5) See “FINANCIAL INFORMATION – Annual Debt Service Requirements” for certain assumptions relating to debt service on the outstanding Senior Bonds. This table assumes the issuance of the 2021A Bonds but does not take into account any bond issuance thereafter. This table does not take into account, either as revenue or as a credit against debt service, any Subsidy Payments expected in connection with the issuance of the 2009A Bonds and 2009B Bonds as Build America Bonds. Debt Service due January 1 of each year is deemed payable in the preceding year. See the definition of “Debt Service” in APPENDIX D.
(6) In each year, the projected net cash flow exceeds the projected Renewal and Replacement Deposit for such year set forth in the Consulting Engineers’ Report.
Totals may not add due to rounding.
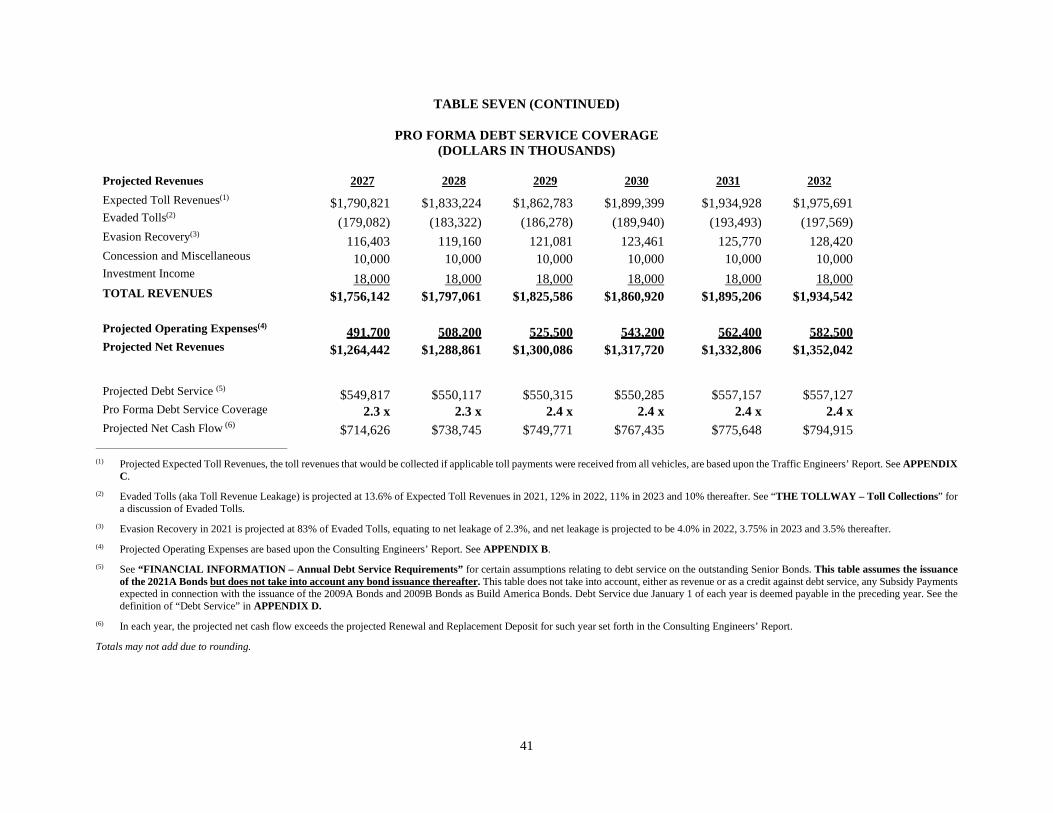
41
TABLE SEVEN (CONTINUED)
PRO FORMA DEBT SERVICE COVERAGE (DOLLARS IN THOUSANDS)
Projected Revenues 2027 2028 2029 2030 2031 2032
Expected Toll Revenues(1) $1,790,821 $1,833,224 $1,862,783 $1,899,399 $1,934,928 $1,975,691
Evaded Tolls(2)(179,082) (183,322) (186,278) (189,940) (193,493) (197,569)
Evasion Recovery(3)116,403 119,160 121,081 123,461 125,770 128,420
Concession and Miscellaneous 10,000 10,000 10,000 10,000 10,000 10,000 Investment Income 18,000 18,000 18,000 18,000 18,000 18,000 TOTAL REVENUES $1,756,142 $1,797,061 $1,825,586 $1,860,920 $1,895,206 $1,934,542
Projected Operating Expenses(4)491,700 508,200 525,500 543,200 562,400 582,500
Projected Net Revenues $1,264,442 $1,288,861 $1,300,086 $1,317,720 $1,332,806 $1,352,042
Projected Debt Service (5)$549,817 $550,117 $550,315 $550,285 $557,157 $557,127
Pro Forma Debt Service Coverage 2.3 x 2.3 x 2.4 x 2.4 x 2.4 x 2.4 xProjected Net Cash Flow (6)
$714,626 $738,745 $749,771 $767,435 $775,648 $794,915
(1) Projected Expected Toll Revenues, the toll revenues that would be collected if applicable toll payments were received from all vehicles, are based upon the Traffic Engineers’ Report. See APPENDIX C.
(2) Evaded Tolls (aka Toll Revenue Leakage) is projected at 13.6% of Expected Toll Revenues in 2021, 12% in 2022, 11% in 2023 and 10% thereafter. See “THE TOLLWAY – Toll Collections” for a discussion of Evaded Tolls.
(3) Evasion Recovery in 2021 is projected at 83% of Evaded Tolls, equating to net leakage of 2.3%, and net leakage is projected to be 4.0% in 2022, 3.75% in 2023 and 3.5% thereafter.
(4) Projected Operating Expenses are based upon the Consulting Engineers’ Report. See APPENDIX B.
(5) See “FINANCIAL INFORMATION – Annual Debt Service Requirements” for certain assumptions relating to debt service on the outstanding Senior Bonds. This table assumes the issuance of the 2021A Bonds but does not take into account any bond issuance thereafter. This table does not take into account, either as revenue or as a credit against debt service, any Subsidy Payments expected in connection with the issuance of the 2009A Bonds and 2009B Bonds as Build America Bonds. Debt Service due January 1 of each year is deemed payable in the preceding year. See the definition of “Debt Service” in APPENDIX D.
(6) In each year, the projected net cash flow exceeds the projected Renewal and Replacement Deposit for such year set forth in the Consulting Engineers’ Report.
Totals may not add due to rounding.

42
CERTAIN RISK FACTORS
The following is a discussion of certain risk factors attendant to an investment in the 2021A Bonds. The discussion is a non-exclusive summary of such risks and is not intended to be exhaustive. In order for potential investors to identify risk factors and make an informed investment decision, potential investors should be thoroughly familiar with the entire Official Statement. The order in which risks are presented is not intended to reflect either the likelihood that a particular event will occur or the relative significance of such an event. Moreover, there may be other risks or considerations associated with an investment in the 2021A Bonds in addition to those set forth in this Official Statement.
General Factors Affecting Authority Revenues
The information provided with respect to toll revenues collected by the Authority is based on historical data. The amount of future toll revenues to be collected by the Authority depends upon a number of factors, including rates established by the Authority and levels and composition of traffic on the Tollway System. The Authority is authorized under the Act to make and establish or repeal toll rates as it deems necessary, expedient and sufficient to maintain and operate the Tollway System, including the payment of administrative expenses and discharge of all Authority obligations as they become due and payable. The Authority is obligated under the Indenture to set tolls at levels that are expected to generate, with other revenues of the Authority, Net Revenues sufficient to meet its obligations under the Indenture. It is currently anticipated that the existing and future toll rate structures specified in TABLE ONE – TOLL RATES BY VEHICLE CLASS will be sufficient to meet the toll covenant of the Authority contained in the Indenture. See “SECURITY AND SOURCES OF PAYMENTS FOR THE 2021A BONDS – Toll Covenant.”However, the amount and composition of traffic on the Tollway System cannot be predicted with certainty and may underperform Authority expectations due to general economic conditions, diversion of some traffic to alternative non-toll routes to avoid toll rate increases, increased fuel costs, increased mileage standards or other factors.
COVID-19 Pandemic’s Materially Adverse Impact on Authority Revenues
Traffic and Toll Revenues have been materially adversely impacted by the COVID-19 pandemic and responses thereto. The Authority implemented all-electronic-tolling on March 14, 2020, discontinuing all options to pay tolls via cash payments to attendants or other payments by coin or currency or by credit card, in order to reduce the possibility of transmission of the COVID-19 virus. A Stay-at-Home order from the Governor of Illinois was in full effect from March 21 – April 30, 2020, which severely restricted movement and limited businesses and activities to essential functions. Under a phased approach to reopening, portions of the restrictions imposed by the Stay-at- Home order were lifted on each of May 1, May 29, and June 26, 2020.
On May 5, 2020, the Governor released Restore Illinois, a five-phased plan to reopen the State, guided by health metrics and with distinct business, education and recreational activities characterizing each. On July 15, 2020, the Governor released a resurgence mitigation plan, which established a public health framework for adopting mitigation measures in response to increases in COVID-19 case rates and hospitalizations. Under this plan, Illinois is divided into 11 regions, and a tiered approach to mitigation measures is applied regionally based on health metrics related to test positivity rates, hospital admissions and hospital capacity. Prior to November 17, 2020, different mitigation measures were in effect in different regions. In response to worsening health metrics, on November 17, 2020, the Governor announced additional “tier 3” resurgence mitigations to become effective on November 20, 2020 across the entirety of the State. By adhering to meaningful mitigations throughout late 2020 and early 2021, the State was able to bring down rates of community spread, allowing for regions to once again move forward in the State’s mitigations plan. On January 15, 2021, regions resumed moving out of “tier 3” mitigations, down to “tier 2” and “tier 1,” and ultimately back into Phase 4 of Restore Illinois on a data-driven basis. As a result, the mitigations have impacted Traffic and Toll Revenues. As of June 11, 2021, the State of Illinois entered Phase 5 of Restore Illinois with nearly all COVID-19 restrictions lifted.
Additional information regarding the State’s phased approach to reopening is available at the website https://coronavirus.illinois.gov/s/restore-illinois-introduction, and additional information regarding the State’s related mitigation plan is available at the website https://coronavirus.illinois.gov/s/restore-illinois-mitigation-plan. Neither the content of these websites nor any information on links appearing on either URL disclosed in the previous sentence is incorporated into this Official Statement by reference. The Authority has not independently verified the information contained in either website and makes no representations and expresses no opinion as to the accuracy of such information.

43
Toll Transactions – Monthly. Following are total transactions for fiscal years 2019 and 2020 and preliminary, unaudited estimates of Illinois Tollway traffic during the nine months January 1 through September 30, 2021, with percentage changes versus the nine months of fiscal years 2019 and 2020. Traffic is shown for passenger cars, commercial vehicles, and in total, by month.
TRANSACTIONS - PRELIMINARY, UNAUDITED
Passenger Vehicles Commercial Vehicles TOTAL
(000s) (000s) (000s)
Month
Fiscal Year 2019
Fiscal Year 2020
Fiscal Year 2021
Percent Change (FY2021
vs. FY2019)
Percent Change (FY2021
vs. FY2020)
Fiscal Year 2019
Fiscal Year 2020
Fiscal Year 2021
Percent Change (FY2021
vs. FY2019)
Percent Change (FY2021
vs. FY2020)
Fiscal Year 2019
Fiscal Year 2020
Fiscal Year 2021
Percent Change (FY2021
vs. FY2019)
Percent Change (FY2021
vs. FY2020)
Jan(2) 63,333 68,656 51,566 -18.6% -24.9% 9,127 9,661 9,594 5.1% -0.7% 72,459 78,317 61,160 -15.6% -21.9%
Feb(2) 63,946 67,181 49,486 -22.6% -26.3% 8,995 8,975 9,048 0.6% 0.8% 72,941 76,156 58,533 -19.8% -23.1%
Mar 74,839 53,736 63,188 -15.6% 17.6% 9,820 9,672 11,220 14.3% 16.0% 84,659 63,408 74,408 -12.1% 17.3%
Apr 74,227 32,489 65,495 -11.8% 101.6% 10,207 8,603 10,918 7.0% 26.9% 84,434 41,092 76,413 -9.5% 86.0%
May 79,561 43,936 71,209 -10.5% 62.1% 10,763 9,123 10,917 1.4% 19.7% 90,324 53,059 82,125 -9.1% 54.8%
Jun 79,156 56,501 72,642 -8.2% 28.6% 10,382 10,355 11,500 10.8% 11.1% 89,538 66,856 84,142 -6.0% 25.9%
Jul 81,390 64,371 76,932 -5.5% 19.5% 10,801 10,820 11,241 4.1% 3.9% 92,191 75,191 88,174 -4.4% 17.3%
Aug 82,275 64,634 75,670 -8.0% 17.1% 11,110 10,808 11,542 3.9% 6.8% 93,386 75,442 87,212 -6.6% 15.6%
Sep 75,401 61,959 72,046 -4.4% 16.3% 10,413 10,857 11,337 8.9% 4.4% 85,814 72,815 83,382 -2.8% 14.5%
Oct 79,543 63,470 - - - 11,424 11,475 - - - 90,967 74,945 - - -
Nov 72,582 53,279 - - - 9,883 10,105 - - - 82,465 63,383 - - -
Dec 74,555 55,854 - - - 9,489 10,132 - - - 84,045 65,986 - - -
Jan-Sep(3) 674,127 513,463 598,233 -11.3% 16.5% 91,618 88,873 97,317 6.2% 9.5% 765,745 602,336 695,550 -9.2% 15.5%
FY Total 900,808 686,065 122,413 120,584 1,023,222 806,650
(1) The COVID-19 pandemic and response thereto materially adversely impacted transactions beginning mid-March 2020. (2) According to the National Weather Service, the Chicago area experienced 21.9 inches of snow in January 2021, making it the 10th snowiest January on record in Chicago. February 2021 was the ninth snowiest February on record with 21.6 inches of snow. (3) For comparison purposes, transaction information is provided for the first nine months of each fiscal year 2019, 2020 and 2021. Total fiscal year transactions are provided for each 2019 and 2020.

44
Toll Revenues – Monthly. Following are booked toll revenues for fiscal years 2019 and 2020, and preliminary, unaudited estimates of Illinois Tollway booked toll revenues during the nine months from January 1 through September 30, 2021, with percentage changes versus the first nine months of fiscal years 2019 and 2020. Booked toll revenues is the toll revenue after accounting for toll avoidance, underpayments, and overpayments. Booked toll revenues does not include tolls, fees and fines collected through the violation enforcement system; these are reported separately in the Authority’s financial statements as toll evasion recovery.
BOOKED TOLL REVENUES - PRELIMINARY, UNAUDITED
Passenger Vehicles Commercial Vehicles TOTAL
(000s) (000s) (000s)
Month(1)
Fiscal Year 2019
Fiscal Year 2020
Fiscal Year 2021
Percent Change (FY2021
vs. FY2019)
Percent Change (FY2021
vs. FY2020)
Fiscal Year 2019
Fiscal Year 2020
Fiscal Year 2021
Percent Change (FY2021
vs. FY2019)
Percent Change (FY2021
vs. FY2020)
Fiscal Year 2019
Fiscal Year 2020
Fiscal Year 2021
Percent Change (FY2021
vs. FY2019)
Percent Change (FY2021
vs. FY2020)
Jan(2)(3) $50,094 $53,642 $38,533 -23.1% -28.2% $49,721 $53,178 $51,135 2.8% -3.8% $99,815 $106,819 $89,668 -10.2% -16.1%
Feb(3) 49,798 53,358 36,799 -26.1% -31.0% 47,908 50,122 47,792 -0.2% -4.6% 97,706 103,479 84,591 -13.4% -18.3%
Mar 60,673 41,568 46,938 -22.6% 12.9% 53,712 53,254 58,443 8.8% 9.7% 114,385 94,822 105,381 -7.9% 11.1%
Apr 59,544 24,222 47,815 -19.7% 97.4% 54,975 45,550 54,836 -0.3% 20.4% 114,519 69,772 102,651 -10.4% 47.1%
May 64,500 33,273 56,067 -13.1% 68.5% 57,431 46,563 58,126 1.2% 24.8% 121,931 79,835 114,193 -6.3% 43.0%
Jun 63,975 42,258 55,768 -12.8% 32.0% 54,372 51,171 58,605 7.8% 14.5% 118,347 93,429 114,373 -3.4% 22.4%
Jul 66,962 48,720 59,539 -11.1% 22.2% 56,933 53,736 57,086 0.3% 6.2% 123,895 102,456 116,625 -5.9% 13.8%
Aug 67,706 49,024 58,555 -13.5% 19.4% 59,132 54,258 59,367 0.4% 9.4% 126,838 103,283 117,922 -7.0% 14.2%
Sep 60,299 47,253 55,388 -8.1% 17.2% 54,832 55,815 58,606 6.9% 5.0% 115,131 103,069 113,994 -1.0% 10.6%
Oct 63,992 48,211 61,089 59,163 125,081 107,373
Nov 58,192 39,752 53,101 51,795 111,292 91,548
Dec 60,328 41,513 51,483 51,626 111,810 93,139
Jan-Sep(4) $543,551 $393,318 $455,403 -16.2% 15.8% $489,016 $463,647 $503,995 3.1% 8.7% $1,032,567 $856,965 $959,398 -7.1% 12.0%
FY Total $726,063 $522,793 $654,688 $626,231 $1,380,751 $1,149,020
(1) The COVID-19 pandemic and response thereto materially adversely impacted revenues beginning mid-March 2020. (2) Annual CPI-based CV toll rate increases went into effect 1/1/19, 1/1/20 and 1/1/21, and were based on the CPI-U-based increases of 2.254%, 2.072% and 1.564%, respectively. (3) According to the National Weather Service, the Chicago area experienced 21.9 inches of snow in January 2021, making it the 10th snowiest January on record in Chicago. February 2021 was the ninth snowiest February on record with 21.6 inches of snow.(4) For comparison purposes, booked toll revenue information is provided for the first nine months of each fiscal year 2019, 2020 and 2021. Total fiscal year booked revenue is provided for each 2019 and 2020.

45
Net Revenues – Quarterly through September. The following chart provides preliminary, unaudited quarterly financial information regarding the Authority’s Net Revenues in the first two quarters of 2021. There is no assurance that the impact of COVID-19 will not materially adversely impact the Authority’s Net Revenues in 2021 and thereafter to an extent greater than anticipated by the Authority as of the date of this Official Statement.
PRELIMINARY, UNAUDITED
2021 Quarter 1 2021 Quarter 2 2021 Quarter 3 First 9 Months
ended 3/31/21 ended 6/30/21 ended 9/30/21 ended 9/30/21
Expected Toll Revenues $322.478,113 $384,420,949 $403,160,233 $1,110,059,295
Evaded Tolls (42,837,868) (53,204,118) (54,619,404) (150,661,390)
Booked Toll Revenues $279,640,245 $331,216,831 $348,540,829 $959,397,905
Toll Evasion Recovery 37,802,369 41,906,447 45,846,420 125,555,236
Other Revenues (Inv income, concessions, misc.)
2,724,728 2,010,439 18,710,671(1) 23,445,838
Revenues $320,167,341 $375,133,717 $413,097,920 $1,108,398,978
Operating Expenses (96,143,959) (93,265,606) (93,006,685) (282,416,250)
Net Revenues $224,023,382 $281,868,111 $320,091,235 $825,982,728
To meet the $1.080 billion Net Revenues projected for Fiscal Year 2021 in Table Seven, Net Revenues in the fourth quarter of 2021 would need to be $254 million. There is no assurance that the impact of COVID-19 will not materially adversely impact the Authority’s Net Revenues in 2021 and thereafter to an extent greater than anticipated by the Authority as of the date of this Official Statement
Forward-Looking Statements, Traffic Engineers’ Report and Consulting Engineers’ Report
This Official Statement, including particularly the Traffic Engineers’ Report attached as APPENDIX C, the Consulting Engineers’ Report attached as APPENDIX B and the statements of the Authority contained in this Official Statement based on those reports, contains statements relating to future results that are “forward-looking statements” as defined in the Private Securities Litigation Reform Act of 1995. When used in this Official Statement, the words “estimate,” “anticipate,” “forecast,” “project,” “intend,” “propose,” “plan,” “expect,” “assume” and similar expressions identify forward-looking statements. Such statements are subject to risks and uncertainties that could cause actual results to differ materially from those contemplated in such forward-looking statements.
The Traffic Engineers’ Report, and the traffic forecasts contained in it, incorporates numerous assumptions and projections as to estimated revenues. No assurances can be given that such assumptions will occur. Some assumptions used to develop the forecasts may not be realized, and unanticipated events and circumstances may occur. Therefore, the actual results achieved during the forecast period may vary, and the variations may be material. See “TRAFFIC AND CONSULTING ENGINEERS” and APPENDIX C – “TRAFFIC ENGINEERS’ REPORT.”
The Consulting Engineers’ Report, and the forecasts contained in it, incorporates numerous assumptions and projections as to capital program costs, operating expenses and needs for deposits to the Renewal and Replacement Account. No assurances can be given that such assumptions will occur. Some assumptions used to develop the forecasts may not be realized, and unanticipated events and circumstances may occur. The replacement of AECOM as Consulting Engineers by WSP USA Inc., effective in 2018, may result in utilization of different assumptions, projections and methodologies to provide the services of the Consulting Engineers required by the Indenture, including assessment of the physical condition of the Tollway System. Therefore, the actual results achieved during the forecast period may vary, and the variations may be material. See APPENDIX B – “CONSULTING ENGINEERS’ REPORT.”
46
Move Illinois Program
In connection with the Move Illinois Program, as is the case with all of the Authority’s capital programs, there is a possibility of time delays and cost increases resulting from various factors. Changes in the timeliness or cost of acquiring rights-of-way (“ROW”) pursuant to eminent domain or otherwise may result in a material increase in cost and/or delay in schedule. Other factors that could contribute to time delays and cost increases include, but are not limited to (i) design and construction issues and resulting change orders and project additions or changes to project scope, (ii) environmental litigation or environmental administrative matters, (iii) unidentified factors related to the physical condition of the Tollway System, (iv) utility relocation issues, (v) hazardous materials, (vi) force majeure events, (vii) litigation, (viii) inflation, (ix) insurance coverage matters, (x) labor actions, or (xi) insolvency or bankruptcy of contractors or other inability of contractors to perform during construction of the Move Illinois Program. As a result, there can be no assurances that the costs to complete the Move Illinois Program will not exceed current estimates or that the completion of the projects will not be delayed beyond the scheduled completion date. Variations in cost estimates and delays in construction could be material.
Delays in construction completion or the inability to acquire ROW could impact the collection of toll revenues on the affected portion of the Tollway System. The Traffic Engineers’ Report forecasts revenues based on the timely completion of projects. Actual revenues may differ from such forecasts, and the difference may be material. See APPENDIX C – “TRAFFIC ENGINEERS’ REPORT.”
Technological and Other Risk Factors
The Authority is dependent on technology to conduct general business operations, including toll collection and customer account services that depend on the ability to process, record and monitor a large number of electronic transactions generated by equipment that records transponder and license plate information on vehicles, which equipment is located throughout the Tollway System. See “THE TOLLWAY – Toll Collections.” If the Authority’s financial, accounting or other data processing systems fail or have other significant shortcomings, the Authority could be materially adversely affected. The Authority is similarly dependent on its employees and contractors. It could be materially adversely affected if one or more of its employees/contractors cause a significant operational breakdown or failure, either as a result of human error, purposeful sabotage or fraudulent manipulation of one or more systems. In addition, as the Authority changes processes or introduces new services, the Authority may not fully appreciate or identify new operational risks that may arise from such changes. Any of these occurrences could diminish the Authority’s ability to operate or result in potential liability.
The Authority may experience disruptions of its operating systems due to events that are wholly or partially beyond the Authority’s control, which may include, for example, security breaches; electrical or telecommunications outages; failures of computer servers or other damage to the Authority’s property or assets; natural disasters; or events arising from local or larger scale political events, including terrorist acts. While the Authority believes that its current resiliency plans are both sufficient and adequate, there can be no assurance that such plans will fully mitigate all potential business continuity risks. Any failures or disruptions of the Authority’s systems or operations could cause reputational damage and/or give rise to losses or liability that may require the Authority to expend significant resources to correct the failure or disruption and/or expose the Authority to litigation or losses not covered by insurance.
Computer hacking, cyber-attacks or other malicious activities could disrupt Tollway System services. Further, security breaches such as leakage or loss of confidential or proprietary data and failure or disruption of information technology systems could materially and adversely affect the Authority’s reputation, which could lead to significant outlays and decreased performance that insurance may not cover.
Although the Authority devotes significant resources to maintaining and regularly upgrading its systems and processes designed to protect the security of its computer systems, software, networks and other technology assets and the confidentiality, integrity and availability of information belonging to its customers, there is no assurance that the Authority’s security measures will provide absolute security. These risks may increase in the future as the Authority continues to increase its mobile-payment and other internet-based applications both internally and externally.

47
In addition, the Authority is a member of a consortium of toll collection agencies from various states across the country that rely on technology to collect tolls, which technology is subject to similar risks. See “THE TOLLWAY – Toll Collections.”
Pension Expenses
As stated under “THE AUTHORITY – Pension Plan,” the Authority currently contributes to SERS based on the covered payroll of Authority employees. The Authority’s annual contributions to SERS have increased in recent years and may increase in the future as a result of increases to the employer contribution rate as a result of legislative action by the State modifying the basis by which the Authority Contribution to SERS is determined and/or increases to the amount of payroll. Such increases may have a material impact on the Authority’s finances. The Authority is unable to quantify the extent of any such impact at this time.
The Authority’s contributions to SERS are predominantly Operating Expenses of the Authority and, therefore, are paid from Revenues prior to the payment of debt service on Senior Bonds. See “SECURITY AND SOURCES OF PAYMENT FOR THE 2021A BONDS – Flow of Funds.” A sufficiently significant increase in the amount of the Authority’s required contributions to SERS could result in the Authority having to reduce other Operating Expenses, raise toll rates or both.
Loss of Tax Exemption
As discussed under “TAX MATTERS,” interest on the 2021A Bonds could become includable in gross income for purposes of federal income taxation, retroactive to the date the 2021A Bonds are issued, as a result of future acts or omissions of the Authority in violation of its covenants in the Tax Compliance Certificate and Agreement entered into in connection with the issuance of the 2021A Bonds or future Congressional actions.
IRS Bond Examinations
The tax-exempt bond office of the Internal Revenue Service (“Service”) conducts audits of tax-exempt bonds, both compliance checks and full audits, to determine whether, in the view of the Service, interest on such tax-exempt obligations is includable in the gross income of the owners thereof for federal income tax purposes. It cannot be predicted whether the Service will commence any such audit. If an audit is commenced, under current procedures, the Service may treat the Authority as a taxpayer, and the Owners of the 2021A Bonds may have no right to participate in such proceeding. The commencement of an audit with respect to any tax-exempt obligations of the Authority could adversely affect the market value and liquidity of the 2021A Bonds, regardless of the ultimate outcome.
Legislative Action
Legislation is introduced from time to time in the Illinois General Assembly which, if adopted, may affect the Authority or the Tollway System. The Authority cannot predict whether any such bills will be enacted into law or how any such legislation may affect the Authority and its ability to meet its payment obligations under the Indenture and with respect to the 2021A Bonds. As described in Section 19 of the Toll Highway Act, as amended by Public Act 100-0739, the Authority currently is prohibited from collecting tolls from certain entities and specific and limited public transportation entities are relieved of the obligation to pay tolls. The latter results in de minimis foregone revenue.
LITIGATION
There is no litigation pending or, to the knowledge of the Authority, threatened in any court, (i) questioning the existence or organization of the Authority, the title of any of the present officers of the Authority to their respective offices, the validity of the 2021A Bonds or any other Authority bonds, seeking to restrain or enjoin the issuance or delivery of the 2021A Bonds or any other Authority bonds or questioning the power of the Authority to pledge Net Revenues in accordance with the terms of the Indenture that would have a material adverse effect on the financial condition of the Authority or the issuance of the 2021A Bonds, or (ii) questioning the power of the Authority to collect

48
tolls, fees, charges and rents or receive other Revenues or questioning the Authority’s other powers that in either case would have a material adverse effect on the financial condition of the Authority or the issuance of the 2021A Bonds.
Lawsuits have been filed and are currently pending against the Authority, including claims for breach of contract, wrongful discharge, workers’ compensation, personal injury to employees and non-employees, property damage, adverse possession and unfair labor practices. The Authority, after taking into consideration legal counsel’s evaluation of such actions, is of the opinion that the anticipated outcome of these matters will have no material adverse effect on the financial condition of the Authority.
The Authority has commercial insurance coverage for certain risks, including liability and damages to Authority property. Each of these insurance programs is subject to self-funded retentions and/or deductibles. These self-funded retentions and deductibles are $1,000,000 per occurrence for liability and $50,000 to $1,000,000 per occurrence for damages to Authority property.
APPROVAL OF LEGAL PROCEEDINGS
Certain legal matters incident to the authorization, issuance and sale of the 2021A Bonds are subject to the approving legal opinion of Chapman and Cutler LLP, Chicago, Illinois as Bond Counsel (“Bond Counsel”), which has been retained by, and acts as, Bond Counsel to the Authority. Bond Counsel has not been retained or consulted on disclosure matters and has not undertaken to review or verify the accuracy, completeness or sufficiency of this Official Statement or other offering material relating to the 2021A Bonds and assumes no responsibility for the statements or information contained in or incorporated by reference in this Official Statement, except that in its capacity as Bond Counsel, Bond Counsel has, at the request of the Authority, reviewed only the information in this Official Statement involving the description of the 2021A Bonds and the Indenture, the security for the 2021A Bonds and the description of the federal tax exemption of interest on the 2021A Bonds, including APPENDIX D – “SUMMARY OF CERTAIN PROVISIONS OF THE INDENTURE.” This review was undertaken solely at the request and for the benefit of the Authority and did not include any obligation to establish or confirm factual matters set forth in this Official Statement. The opinion of Bond Counsel for the 2021A Bonds will be in substantially the form included in this Official Statement as APPENDIX F.
Certain legal matters in connection with the 2021A Bonds will be passed upon for the Authority by the Authority’s General Counsel, and by the Authority’s special counsel, Burke Burns & Pinelli, Ltd., Chicago, Illinois and for the Underwriters by their counsel, Kutak Rock LLP, Chicago, Illinois. The law firm representing the Underwriters was selected by the Authority, with the consent of the senior underwriters. Certain documents to which the Authority is a party will be approved as to form and constitutionality by the Attorney General of Illinois as ex officio attorney for the Authority.
For purposes of compliance with Rule 15c2-12 (“Rule 15c2-12”) adopted by the United States Securities and Exchange Commission (“SEC”) under the Securities Exchange Act of 1934 (“1934 Act”), this Official Statement constitutes an official statement of the Authority that has been deemed final by the Authority as of its date except for the omission of no more than the information permitted by Rule 15c2-12, as amended, and in effect on the date hereof.
RELATED PARTIES
In connection with the issuance of the 2021A Bonds, the Authority and the Underwriters are being represented by the law firms described under the caption “APPROVAL OF LEGAL PROCEEDINGS” above. In other transactions not related to the 2021A Bonds, each of these law firms may have acted as bond counsel or represented the Authority, the Underwriters or their affiliates, in capacities different from those currently served by such law firms in this transaction, and there will be no limitations imposed as a result of the issuance of the 2021A Bonds on the ability of any of these firms to act as bond counsel or represent any of these parties in future transactions. It should not be assumed that the Authority, the Underwriters, or their affiliates, their respective counsel or Bond Counsel has not previously engaged in, is not currently engaged in (as to matters unrelated to the 2021A Bonds) or will not, after the issuance of the 2021A Bonds, engage in other transactions with each other or with any affiliates of them, and no assurances can be given that there are or will be no past or future relationship or transactions between or among any of these parties or law firms.

49
UNDERWRITING
Loop Capital Markets LLC and J.P. Morgan Securities LLC, together acting as the representative, each on behalf of itself and on behalf of the other underwriters listed on the cover of this Official Statement (“Underwriters”), are expected to enter into a purchase contract with the Authority pursuant to which the Underwriters jointly and severally agreed, subject to certain customary conditions precedent to closing, to purchase the 2021A Bonds from the Authority at a purchase price of $871,380,463.73 (representing the par amount of the 2021A Bonds, plus original issue premium of $172,974,010.00 and less an Underwriters’ discount of $1,593,546.27).
Under the purchase contract, the Underwriters are obligated to purchase all the 2021A Bonds if any 2021A Bonds are purchased. The 2021A Bonds may be offered and sold to certain dealers (including the Underwriters and other dealers depositing such Bonds into investment trusts) at prices lower than the initial offering prices, and such public offering prices may be changed, from time to time, by the Underwriters.
The Underwriters and their respective affiliates are full service financial institutions engaged in various activities, which may include sales and trading, commercial and investment banking, advisory, investment management, investment research, principal investment, hedging, market making, brokerage and other financial and non-financial activities and services. Certain of the Underwriters and their respective affiliates have provided, and may in the future provide, a variety of these services to the Authority and to persons and entities with relationships with the Authority, for which they received or will receive customary fees and expenses. Under certain circumstances, the Underwriters and their respective affiliates may have certain creditor and/or other rights against the Authority in connection with such activities and services.
J.P. Morgan Securities LLC (“JPMS”), one of the Underwriters of the 2021A Bonds, has entered into negotiated dealer agreements (each, a “Dealer Agreement”) with each of Charles Schwab & Co., Inc. (“CS&Co.”) and LPL Financial LLC (“LPL”) for the retail distribution of certain securities offerings at the original issue prices. Pursuant to each Dealer Agreement, each of CS&Co. and LPL may purchase 2021A Bonds from JPMS at the original issue price less a negotiated portion of the selling concession applicable to any 2021A Bonds that such firm sells.
In addition, Citigroup Global Markets Inc. (“Citi”), one of the Underwriters of the 2021A Bonds, has entered into a retail distribution agreement (the “Distribution Agreement”) with Fidelity Capital Markets, a division of National Financial Services LLC (together with its affiliates, “Fidelity”). Under this Distribution Agreement, Citi may distribute municipal securities to retail investors at the original issue price through Fidelity. As part of this arrangement, Citi will compensate Fidelity for its selling efforts.
In the ordinary course of their various business activities, the Underwriters and their respective affiliates, officers, directors and employees may purchase, sell or hold a broad array of investments and actively traded securities, derivatives, loans, commodities, currencies, credit default swaps and other financial instruments for their own account or for the accounts of their customers, and such investment and trading activities may involve or relate to assets, securities and/or instruments of the Authority (directly, as collateral securing other obligations or otherwise) and/or persons and entities with relationships with the Authority. The Underwriters and their respective affiliates also may communicate independent investment recommendations, market color or trading ideas and/or publish or express independent research views in respect of such assets, securities or instruments and at any time may hold, or recommend to clients that they should acquire, long and/or short positions in such assets, securities and instruments.
MUNICIPAL ADVISOR
Acacia Financial Group, Inc. (“Municipal Advisor”) is employed as the municipal advisor to the Authority in connection with the sale and issuance of the 2021A Bonds. The Municipal Advisor in its capacity as municipal advisor does not assume any responsibility for the information, covenants and representations contained in any of the legal documents with respect to the federal income tax status of the 2021A Bonds or the possible impact of any present, pending or future actions taken by any legislative or judicial bodies.
The Municipal Advisor has provided the following sentence for inclusion in this Official Statement: The Municipal Advisor has reviewed the information in this Official Statement in accordance with, and as part of, its responsibility to the Authority and, as applicable, to investors under the federal securities laws, as applied to the facts

50
and circumstances of this transaction, but the Municipal Advisor does not guarantee the accuracy or completeness of such information.
TRAFFIC AND CONSULTING ENGINEERS
The sections of this Official Statement entitled “THE TOLLWAY – Routes,” “THE CAPITAL PROGRAM – The Move Illinois Program,” “– Potential Additional Capital Projects,” “– Condition and Maintenance” and “– Renewal and Replacement Program and Improvement Program” were prepared, in part, on the basis of information supplied by WSP USA Inc., Chicago, Illinois, the Consulting Engineers. APPENDIX B of this Official Statement was prepared by the Consulting Engineers in connection with the issuance of the Authority’s 2021A Bonds and contains information on the condition of the existing Tollway System, the history of the major improvement programs, projects in the Capital Program, and the projected needs of the Tollway System in terms of renewal and replacement deposits and future maintenance and operating costs for 2021 through 2032. Such projections are based upon certain assumptions made by the Consulting Engineers as set forth in their report. The report in APPENDIX B reflects the scope, cost and schedule of completion of the sub-projects that make up the Move Illinois Program, as developed by the Authority’s Program Management Office (“PMO”), which costs vary in detail based upon the stage of implementation of each sub-project as more fully described therein. The report provides the Consulting Engineers’ opinion on the reasonableness of the estimated cost ($14.3 billion program budget; current estimate $14.1 billion) of the Move Illinois Program as developed by the PMO. As stated in the report, market conditions and unforeseen events may affect the implementation and cost of the Capital Program and, on an annual basis, the Consulting Engineers’ recommendations for Renewal and Replacement Deposits will reflect consideration of any adjustments to the Capital Program by the Authority.
The sections of this Official Statement entitled “THE TOLLWAY – Toll Rates,” “– Historical Toll Transactions and Toll Revenues,” “– Historical Net Operating Revenues,” and “THE CAPITAL PROGRAM – The Move Illinois Program” were prepared, in part, on the basis of information supplied by the Traffic Engineers, CDM Smith Inc., Lisle, Illinois. APPENDIX C of this Official Statement was prepared by the Traffic Engineers in connection with the issuance of the Authority’s 2021A Bonds and contains historical information regarding traffic and revenues and forecasts of future traffic and revenues of the Tollway System. The forecasts in APPENDIX C are based on assumptions made by the Traffic Engineers concerning future events and circumstances it believes are significant to the forecasts.
The achievement of any activity estimates, forecasts or projections of the Consulting Engineers and the Traffic Engineers may be affected by fluctuating economic and other market conditions and other factors, including, without limitation, impact of economic conditions on travel in general, including the cost of fuel, competition and price increases for labor and materials and other matters contained in the assumptions in such reports, and depends upon the occurrence of other future events that cannot be assured. Therefore, actual results may vary from the forecasts, estimates and projections, and such variations could be material. See “CERTAIN RISK FACTORS – Forward Looking Statements; Traffic Engineers’ Report and Consulting Engineers’ Report.”
RATINGS
The 2021A Bonds have been assigned ratings of: “AA-” by Fitch Ratings, “Aa3” by Moody’s Investors Service, Inc. and “AA-” by S&P Global Ratings, Inc. Each such rating reflects only the views of such rating agency. Any explanation of the significance of such ratings may be obtained only from the respective rating agencies. Certain information and materials concerning the 2021A Bonds, the Authority and the Tollway System, some of which have not been included in this Official Statement, were furnished to the rating agencies by the Authority and others. There is no assurance that any such rating will be maintained for any given period of time or that it will not be lowered or withdrawn entirely. Any downward revision or withdrawal of any such rating may have an adverse effect on the prices at which the 2021A Bonds may be resold.
TAX MATTERS
Federal tax law contains a number of requirements and restrictions which apply to the 2021A Bonds, including investment restrictions, periodic payments of arbitrage profits to the United States, requirements regarding the proper use of bond proceeds and the facilities financed therewith, and certain other matters. The Authority has
51
covenanted to comply with all requirements that must be satisfied in order for the interest on the 2021A Bonds to be excludable from gross income for federal income tax purposes. Failure to comply with certain of such covenants could cause interest on the 2021A Bonds to become includible in gross income for federal income tax purposes retroactively to the date of issuance of the 2021A Bonds.
Subject to the Authority’s compliance with the above referenced covenants, under present law, in the opinion of Bond Counsel, interest on the 2021A Bonds is excludable from the gross income of the owners thereof for federal income tax purposes and is not included as an item of tax preference in computing the federal alternative minimum tax for individuals under the Internal Revenue Code of 1986, as amended (“Code”).
In rendering its opinion, Bond Counsel will rely upon certifications of the Authority with respect to certain material facts within the Authority’s knowledge. Bond Counsel’s opinion represents its legal judgment based upon its review of the law and the facts that it deems relevant to render such opinion and is not a guarantee of a result.
Ownership of the 2021A Bonds may result in collateral federal income tax consequences to certain taxpayers, including, without limitation, corporations subject to the branch profits tax, financial institutions, certain insurance companies, certain S corporations, individual recipients of Social Security or Railroad Retirement benefits and taxpayers who may be deemed to have incurred (or continued) indebtedness to purchase or carry tax-exempt obligations. Prospective purchasers of the 2021A Bonds should consult their tax advisors as to applicability of any such collateral consequences.
The issue price for original issue discount (as further discussed below) and market discount purposes (“OID Issue Price”) for each maturity of the 2021A Bonds is the price at which a substantial amount of such maturity of the 2021A Bonds is first sold to the public (excluding bond houses and brokers and similar persons or organizations acting in the capacity of underwriters, placement agents or wholesalers). The OID Issue Price of a maturity of the 2021A Bonds may be different from the price set forth, or the price corresponding to the yield set forth, on the inside cover page hereof.
If the OID Issue Price of a maturity of the 2021A Bonds is less than the principal amount payable at maturity, the difference between the OID Issue Price of each such maturity, if any, of the 2021A Bonds (“OID Bonds”) and the principal amount payable at maturity is original issue discount.
For an investor who purchases an OID Bond in the initial public offering at the OID Issue Price for such maturity and who holds such OID Bond to its stated maturity, subject to the condition that the Authority complies with the covenants discussed above: (a) the full amount of original issue discount with respect to such OID Bond constitutes interest which is excludable from the gross income of the owner thereof for federal income tax purposes; (b) such owner will not realize taxable capital gain or market discount upon payment of such OID Bond at its stated maturity; (c) such original issue discount is not included as an item of tax preference in computing the alternative minimum tax for individuals under the Code; and (d) the accretion of original issue discount in each year may result in certain collateral federal income tax consequences in each year even though a corresponding cash payment may not be received until a later year. Based upon the stated position of the Illinois Department of Revenue under Illinois income tax law, accreted original issue discount on such OID Bonds is subject to taxation as it accretes, even though there may not be a corresponding cash payment until a later year. Owners of OID Bonds should consult their own tax advisors with respect to the state and local tax consequences of original issue discount on such OID Bonds.
Owners of 2021A Bonds who dispose of 2021A Bonds prior to the stated maturity (whether by sale, redemption or otherwise), purchase 2021A Bonds in the initial public offering, but at a price different from the OID Issue Price or purchase 2021A Bonds subsequent to the initial public offering should consult their own tax advisors.
If a 2021A Bond is purchased at any time for a price that is less than the 2021A Bond’s stated redemption price at maturity or, in the case of an OID Bond, its OID Issue Price plus accreted original issue discount (“Revised Issue Price”), the purchaser will be treated as having purchased a 2021A Bond with market discount subject to the market discount rules of the Code (unless a statutory de minimis rule applies). Accrued market discount is treated as taxable ordinary income and is recognized when a 2021A Bond is disposed of (to the extent such accrued discount does not exceed gain realized) or, at the purchaser’s election, as it accrues. Such treatment would apply to any purchaser who purchases an OID Bond for a price that is less than its Revised Issue Price. The applicability of the

52
market discount rules may adversely affect the liquidity or secondary market price of such 2021A Bond. Purchasers should consult their own tax advisors regarding the potential implications of market discount with respect to the 2021A Bonds.
An investor may purchase a 2021A Bond at a price in excess of its stated principal amount. Such excess is characterized for federal income tax purposes as “bond premium” and must be amortized by an investor on a constant yield basis over the remaining term of the 2021A Bond in a manner that takes into account potential call dates and call prices. An investor cannot deduct amortized bond premium relating to a tax exempt bond. The amortized bond premium is treated as a reduction in the tax exempt interest received. As bond premium is amortized, it reduces the investor’s basis in the 2021A Bond. Investors who purchase a 2021A Bond at a premium should consult their own tax advisors regarding the amortization of bond premium and its effect on the 2021A Bond’s basis for purposes of computing gain or loss in connection with the sale, exchange, redemption or early retirement of the 2021A Bond.
There are or may be pending in Congress legislative proposals, including some that carry retroactive effective dates, that, if enacted, could alter or amend the federal tax matters referred to above or affect the market value of the 2021A Bonds. It cannot be predicted whether or in what form any such proposal might be enacted or whether, if enacted, it would apply to bonds issued prior to enactment. Prospective purchasers of the 2021A Bonds should consult their own tax advisors regarding any pending or proposed federal tax legislation. Bond Counsel expresses no opinion regarding any pending or proposed federal tax legislation.
The Service has an ongoing program of auditing tax exempt obligations to determine whether, in the view of the Service, interest on such tax exempt obligations is includible in the gross income of the owners thereof for federal income tax purposes. It cannot be predicted whether or not the Service will commence an audit of the 2021A Bonds. If an audit is commenced, under current procedures the Service may treat the Authority as a taxpayer and the 2021A Bondholders may have no right to participate in such procedure. The commencement of an audit could adversely affect the market value and liquidity of the 2021A Bonds until the audit is concluded, regardless of the ultimate outcome.
Payments of interest on, and proceeds of the sale, redemption or maturity of, tax exempt obligations, including the 2021A Bonds, are in certain cases required to be reported to the Service. Additionally, backup withholding may apply to any such payments to any Bond owner who fails to provide an accurate Form W 9 Request for Taxpayer Identification Number and Certification, or a substantially identical form, or to any 2021A Bond owner who is notified by the Service of a failure to report any interest or dividends required to be shown on federal income tax returns. The reporting and backup withholding requirements do not affect the excludability of such interest from gross income for federal tax purposes.
Interest on the 2021A Bonds is not exempt from present State income taxes. Ownership of the 2021A Bonds may result in other state and local tax consequences to certain taxpayers. Bond Counsel expresses no opinion regarding any such collateral consequences arising with respect to the 2021A Bonds. Prospective purchasers of the 2021A Bonds should consult their tax advisors regarding the applicability of any such state and local taxes.
CONTINUING DISCLOSURE
The Authority will enter into a Continuing Disclosure Undertaking (“Agreement”) for the benefit of the Owners of the 2021A Bonds to provide certain information and notice of certain events to the Municipal Securities Rulemaking Board (“MSRB”) through its Electronic Municipal Market Access system for municipal securities disclosure (accessible at http://emma.msrb.org/default.aspx) (“EMMA”), in electronic format as prescribed by the MSRB for purposes of paragraph (b)(5) of Rule 15c2-12, or through such other format or system as may be prescribed by the MSRB for purposes of such paragraph (b)(5) of Rule 15c2-12. The events which will be subject to notices on an occurrence basis and a summary of other terms of the Agreement, including termination, amendment and remedies, are set forth below.
The Authority believes that it has materially complied with its previous undertakings under Rule 15c2-12 during the last five years.

53
A failure by the Authority to comply with the Agreement will not constitute a default under the Indenture, and Owners of the 2021A Bonds are limited to the remedies described in the Agreement. See “CONTINUING DISCLOSURE – Consequences of Failure of the Authority to Provide Information” below. A failure by the Authority to comply with the Agreement must be reported in accordance with Rule 15c2-12 and must be considered by any broker, dealer or municipal securities dealer before recommending the purchase or sale of the 2021A Bonds in the secondary market. Consequently, such a failure may adversely affect the transferability and liquidity of the 2021A Bonds and their market price.
The following is a brief summary of certain provisions of the Agreement and does not purport to be complete. The statements made under this caption are subject to the detailed provisions of the Agreement, a copy of which is available upon request from the Underwriters.
Annual Report
The Authority will, not later than ten months after the end of each Fiscal Year, provide to the MSRB through EMMA an Annual Report. Notwithstanding the foregoing, the audited Financial Statements of the Authority prepared in accordance with generally accepted accounting principles (“GAAP Statements”) may be submitted separately from the balance of the Annual Report when such GAAP Statements are available. In the event that the GAAP Statements are not included with the Annual Report and will be submitted at a later date, the Authority will include unaudited financial information in the Annual Report and will indicate in the Annual Report the date on which the GAAP Statements are expected to be submitted. If the Annual Report (or GAAP Statements which were to be separately submitted) is not available by the date required above, the Authority will send a notice to EMMA or through any other electronic format or system prescribed by the MSRB that the Annual Report (or GAAP Statements) has not been filed.
The Authority’s Annual Report will contain or incorporate by reference the following:
(a) Operating data and other information regarding the Authority for the prior Fiscal Year of the same type as included in Tables One through Five under the caption “THE TOLLWAY” and Table Six under the caption “THE CAPITAL PROGRAM” in this Official Statement; and
(b) GAAP Statements for the prior Fiscal Year.
Any or all of the items listed above may be incorporated by reference from other documents, including official statements for debt issues with respect to which the Authority is an “obligated person” (as defined by Rule 15c2-12), which have been filed with the MSRB or the SEC. If the document incorporated by reference is a final official statement, it must be available from the MSRB. The Authority shall clearly identify each such other document so incorporated by reference.
Events Notification
The Authority covenants that it will disseminate within ten business days after the occurrence of the “Reportable Event” (as described below), to the MSRB in an electronic format as prescribed by the MSRB, accompanied by identifying information as prescribed by the MSRB, the disclosure of the occurrence of a Reportable Event. Certain Reportable Events are required to be disclosed only to the extent that such Reportable Event is material, as materiality is interpreted under the 1934 Act. The “Reportable Events,” certain of which may not be applicable to the 2021A Bonds, are:
1. principal and interest payment delinquencies;
2. non-payment related defaults, if material;
3. unscheduled draws on debt service reserves reflecting financial difficulties;
4. unscheduled draws on credit enhancements reflecting financial difficulties;

54
5. substitution of credit or liquidity providers, or their failure to perform;
6. adverse tax opinions, the issuance by the Service of proposed or final determinations of taxability, Notices of Proposed Issue (IRS Form 5701-TEB) or other material notices or determinations with respect to the tax status of the 2021A Bonds, or other material events affecting the tax status of the 2021A Bonds;
7. modifications to rights of Bondholders, if material;
8. 2021A Bond calls, if material, and tender offers;
9. defeasances;
10. release, substitution or sale of property securing repayment of the 2021A Bonds, if material;
11. rating changes;
12. bankruptcy, insolvency, receivership or similar event of the Authority (such a Reportable Event will be considered to have occurred in the following instances: (i) the appointment of a receiver, fiscal agent or similar officer for the Authority in a proceeding under the U.S. Bankruptcy Code or in any other proceeding under state or federal law in which a court or governmental authority has assumed jurisdiction over substantially all of the assets or business of the Authority; (ii) if the jurisdiction of the Authority has been assumed by leaving the Authority and the Authority’s officials or officers in possession but subject to the supervision and orders of a court or governmental authority; or (iii) the entry of an order confirming a plan of reorganization, arrangement or liquidation by a court or governmental authority having supervision or jurisdiction over substantially all of the assets or business of the Authority);
13. the consummation of a merger, consolidation or acquisition involving the Authority or the sale of all or substantially all of the assets of the Authority, other than in the ordinary course of business, the entry into a definitive agreement to undertake such an action or the termination of a definitive agreement relating to any such actions, other than pursuant to its terms, if material;
14. appointment of a successor or additional trustee or the change of name of a trustee, if material;
15. incurrence of a financial obligation* of the Authority, if material, or agreement to covenants, events of default, remedies, priority rights or other similar terms of a financial obligation of the Authority, any of which affect Bondholders, if material; and
16. default, event of acceleration, termination event, modification of terms or other similar events under the terms of a financial obligation of the Authority, any of which reflect financial difficulties.
Consequences of Failure of the Authority to Provide Information
The Authority agrees in the Agreement to give notice in a timely manner to the MSRB of any failure to provide disclosure of the Annual Report when the same is due under the Agreement.
In the event of a failure of the Authority to comply with any provision of the Agreement, the Owner of any 2021A Bond may seek mandamus or specific performance by court order to cause the Authority to comply with its obligations under the Agreement. A failure to comply under the Agreement shall not be deemed a default under the
* The term “financial obligation” means a (i) debt obligation, (ii) derivative instrument entered into in connection with, or pledged as security or a source of payment for, an existing or planned debt obligation, or (iii) a guarantee of (i) or (ii). The term financial obligation does not include municipal securities as to which a final official statement has been provided to the MSRB consistent with Rule 15c2-12.

55
Indenture, and the sole remedy under the Agreement in the event of any failure of the Authority to comply with the Agreement shall be an action to compel performance.
Amendment; Waiver
Notwithstanding any other provision of the Agreement, the Authority may amend the Agreement, and any provision of the Agreement may be waived if:
(1) The amendment or the waiver is made in connection with a change in circumstances that arises from a change in legal requirements, change in law, or change in the identity, nature or status of the Authority or type of business conducted;
(2) The Agreement, as amended, or the provision, as waived, would have complied with the requirements of Rule 15c2-12 at the time of the primary offering, after taking into account any amendments or interpretations of Rule 15c2-12, as well as any change in circumstances; and
(3) The amendment or waiver does not materially impair the interests of the Owners of the 2021A Bonds, as determined by parties unaffiliated with the Authority (such as the Trustee or Bond Counsel) at the time of the amendment.
Termination of Agreement
The Agreement shall be terminated if the Authority shall no longer have any legal liability for any obligation on or relating to repayment of the 2021A Bonds under the Indenture. For the avoidance of doubt, the Agreement shall be terminated upon the defeasance of all of the 2021A Bonds. The Authority shall give notice to EMMA or through any other electronic format or system prescribed by the MSRB in a timely manner if this paragraph is applicable.
Additional Information
Nothing in the Agreement shall be deemed to prevent the Authority from disseminating any other information, using the means of dissemination set forth in the Agreement or any other means of communication, or including any other information in any notice of occurrence of a Reportable Event, in addition to that which is required by the Agreement. If the Authority chooses to include any information in any notice of occurrence of a Reportable Event in addition to that which is specifically required by the Agreement, the Authority shall have no obligation under the Agreement to update such information or include it in any future notice of occurrence of a Reportable Event.
Dissemination Agent
The Authority may, from time to time, appoint or engage a Dissemination Agent to assist it in carrying out its obligations under the Agreement, and may discharge any such Dissemination Agent, with or without appointing a successor Dissemination Agent.
LEGALITY FOR INVESTMENT
Under the Act, the 2021A Bonds are eligible in the State of Illinois for investment of sinking funds, moneys or other funds belonging to or within the control of banks, bankers, trust companies, savings banks and institutions, building and loan associations, savings and loan associations, investment companies, insurance associations, executors, administrators, guardians, trustees and other fiduciaries, municipal corporations, political subdivisions, public bodies and public officers thereof.
FINANCIAL STATEMENTS
The financial statements of the Authority at December 31, 2020 and for the year then ended, included in APPENDIX A of this Official Statement, have been audited by CliftonLarsonAllen LLP, independent auditors as set forth in their report thereon relating to such years appearing in APPENDIX A to this Official Statement.

56
The Authority has neither requested nor obtained any consent from the auditors to include the audited financial statements as an appendix to this Official Statement. CliftonLarsonAllen LLP has not been engaged to perform and has not performed, since the date of its report included in this Official Statement, any procedures on the financial statements addressed in that report. CliftonLarsonAllen LLP also has not performed any procedures relating to this Official Statement.
ACCOUNTING AND INVESTMENT PRACTICES
Audited financial statements of the Authority conforming to generally accepted accounting principles at December 31, 2020 and for the year then ended are included in this Official Statement in APPENDIX A.
The Authority’s permitted investments are governed by the provisions of the Indenture. See APPENDIX D – “SUMMARY OF CERTAIN PROVISIONS OF THE INDENTURE – DEFINITIONS – Investment Securities.”See also Note 2 to Notes to Financial Statements included in APPENDIX A to this Official Statement for a description of the Authority’s investments at December 31, 2020.
MISCELLANEOUS
The financial data and other information contained in this Official Statement have been obtained from the Authority’s records, audited financial statements and other sources that are believed to be reliable. There is no guarantee that any of the assumptions or estimates contained in this Official Statement will be realized.
The summaries or descriptions of provisions of the Act, the Indenture, the 2021A Bonds and all references to other materials not purporting to be quoted in full, are only brief outlines of certain of their provisions, are qualified in their entirety by reference to the complete documents relating to such matters and are subject to the full texts thereof.
The authorization, agreements and covenants of the Authority are set forth in the Indenture, and neither this Official Statement nor any advertisement of the 2021A Bonds is to be construed as a contract with the owners of the 2021A Bonds.
References to web site addresses presented herein are for informational purposes only and may be in the form of a hyperlink solely for the reader’s convenience. Unless specified otherwise, such web sites and the information or links contained therein are not incorporated into, and are not part of, this Official Statement for purposes of, and as that term is defined in Rule 15c2-12.
Any statements made in this Official Statement involving matters of opinion or of estimates, whether or not expressly so identified, are intended merely as such and not as representations of fact.
[REMAINDER OF PAGE INTENTIONALLY LEFT BLANK]

57
AUTHORIZATION
The Authority has duly authorized the use and distribution of this Official Statement and the execution and delivery of this Official Statement by its Chairman and Chief Executive Officer.
THE ILLINOIS STATE TOLL HIGHWAY AUTHORITY
By: /s/ Willard S. Evans, Jr. Chairman and Chief Executive Officer

[THIS PAGE INTENTIONALLY LEFT BLANK]

APPENDIX A
FINANCIAL STATEMENTS
Audited Financial Statements for Fiscal Year Ended December 31, 2020

[THIS PAGE INTENTIONALLY LEFT BLANK]

THE ILLINOIS STATE TOLL HIGHWAY AUTHORITY A Component Unit of the State of Illinois
FINANCIAL AUDIT For the Year Ended December 31, 2020
Performed as Special Assistant Auditors for the Auditor General, State of Illinois

THE ILLINOIS STATE TOLL HIGHWAY AUTHORITYA Component Unit of the State of Illinois
FINANCIAL AUDITFor the Year Ended December 31, 2020
Table of Contents
Schedule Page(s)
Tollway Officials 1
Financial Statement Report:Summary 2-3Independent Auditors’ Report 4-6Management’s Discussion and Analysis 7-14Basic Financial Statements:
Statement of Net Position 15-16Statement of Revenues, Expenses and Changes in Net Position 17Statement of Cash Flows 18-19Notes to Financial Statements 20-59
Required Supplementary Information:Schedule of Tollway’s Proportionate Share of the Net Pension Liability
of the State Employees’ Retirement System (SERS) Pension Plan 1 60Schedule of Contributions to SERS Pension Plan 2 61Schedule of the Tollway’s Proportionate Share of the Net OPEB Liability
of the State Employees Group Insurance Program (SEGIP) 3 62
Supplementary Information – Trust Indenture Agreement Schedules(Non-GAAP):
Schedule of Changes in Fund Balance – by Fund 4 63-64Schedule of Changes in Fund Balance – Revenue Fund – by Account 5 65-66Notes to the Trust Indenture Basis Schedules 67-72Schedule of Toll Revenue by Class of Vehicles (Unaudited) 6 73Renewal and Replacement Account (Unaudited) 7 74Summary of Operating Revenues, Maintenance and Operating Expenses,
Net Operating Revenues and Debt Service Coverage (Unaudited) 8 75Annual Toll Transactions: Passenger and Commercial Vehicles
(Unaudited) 9 76Annual Toll Revenues: Passenger and Commercial Vehicles (Unaudited) 10 77Operating Revenues, Maintenance and Operating Expenses
and Net Operating Revenues (Unaudited) 11 78
Independent Auditors’ Report on Internal Control over Financial Reporting andon Compliance and Other Matters Based on an Audit of Financial StatementsPerformed in Accordance with Government Auditing Standards 79-80
Schedule of Findings and Responses 81-95
Prior Year Findings Not Repeated 96

THE ILLINOIS STATE TOLL HIGHWAY AUTHORITYA Component Unit of the State of Illinois
FINANCIAL AUDITFor the Year Ended December 31, 2020
1
Illinois Tollway Officials and Financial Staff
Executive Director Jose R. Alvarez
Chief Operating Officer Derek Messier (until 1/29/2021)
Chief Financial Officer Cathy Williams (effective 3/1/2020)Michael Colsch (until 2/28/2020)
Controller Patricia Pearn
General Counsel Kathleen Pasulka-Brown
Illinois Tollway Board Members
Chairman Will Evans, Jr.
Board Member James Connolly
Board Member Stephen Davis
Board Member Alice Gallagher
Board Member Karen McConnaughy
Board Member Scott Paddock
Board Member James Sweeney
Board Member Vacant
On 2/1/2021, Jacqueline Gomez was appointed by Governor JB Pritzker to fill the vacancy on the Board.
Tollway’s Central Administrative offices are located at:
2700 Ogden AvenueDowners Grove, Illinois 60515

THE ILLINOIS STATE TOLL HIGHWAY AUTHORITYA Component Unit of the State of Illinois
FINANCIAL AUDITFor the Year Ended December 31, 2020
2
Financial Statement Report
SummaryThe audit of the accompanying financial statements of the Illinois State Toll Highway Authority (the Tollway) was performed by CliftonLarsonAllen LLP, as special assistant auditors to the Illinois Office of the Auditor General.
Based on their audit, the auditors expressed an unmodified opinion on the Tollway’s basic financial statements.
Summary of Findings
The auditors identified four matters involving the Tollway’s internal control over financial reporting that they considered to be material weaknesses and significant deficiencies. Further, the auditors identified two noncompliance matters.
Current Prior
Number of report report
4 None
None None
Prior recommendations implemented or not repeated None 1
Findings
Repeated findings
Item No. Page Last/First Reported Description Finding Type
2020-001 81 New Significant Understatement of
OPEB Balances
Material weakness
2020-002 85 New Need to Enhance Relationship with
the Illinois State Police
Material weakness
2020-003 91 New Noncompliance with the State
Employees Group Insurance Act of
1971
Significant deficiency
and Noncompliance
2020-004 94 New Inadequate Internal Controls over
Census Data
Significant deficiency
Current Findings

THE ILLINOIS STATE TOLL HIGHWAY AUTHORITYA Component Unit of the State of Illinois
FINANCIAL AUDITFor the Year Ended December 31, 2020
3
Exit Conference
This report was discussed with the Authority at an exit conference on September 30, 2021.
Attending were:
The Illinois State Toll Highway AuthorityJose R. Alvarez Executive DirectorCassaundra Rouse Chief Operating OfficerCathy Williams Chief Financial OfficerShaun Farmer Chief Internal AuditorKathleen Pasulka-Brown General CounselWilliam O’Connell Debt ManagerPatricia Pearn Controller
Illinois State PoliceTim Cray Assistant Chief Financial Officer
Illinois Office of the Auditor GeneralThomas L. Kizziah Senior Audit ManagerDan Nugent Technical SpecialistMegan Green Senior Audit Manager
CLA LLP (CliftonLarsonAllen)Chuck Kozlik PrincipalSyril Thomas ManagerEric Gubatan Senior Associate
The responses to the recommendations were provided by Patricia Pearn, Controller, in a correspondence dated October 4, 2021.

CLA is an independent member of Nexia International, a leading, global network of independent accounting and consulting firms. See nexia.com/member-firm-disclaimer for details.
CliftonLarsonAllen LLP CLAconnect.com
4 (Continued)
INDEPENDENT AUDITORS’ REPORT
Honorable Frank J. MautinoAuditor General, State of Illinois
and
Board of DirectorsThe Illinois State Toll Highway Authority
Report on the Financial Statements
As Special Assistant Auditors for the Auditor General, we have audited the accompanying financial statements of the business-type activities of the Illinois State Toll Highway Authority (the Tollway), a component unit of the State of Illinois, as of and for the year ended December 31, 2020, and the related notes to the financial statements, which collectively comprise the Tollway’s basic financial statements as listed in the table of contents.
Management’s Responsibility for the Financial Statements
Management is responsible for the preparation and fair presentation of these financial statements in accordance with accounting principles generally accepted in the United States of America; this includes the design, implementation, and maintenance of internal control relevant to the preparation and fair presentation of financial statements that are free from material misstatement, whether due to fraud or error.
Auditors’ Responsibility
Our responsibility is to express an opinion on these financial statements based on our audit. We conducted our audit in accordance with auditing standards generally accepted in the United States of America and the standards applicable to financial audits contained in Government Auditing Standards, issued by the Comptroller General of the United States. Those standards require that we plan and perform the audit to obtain reasonable assurance about whether the financial statements are free from material misstatement.
An audit involves performing procedures to obtain audit evidence about the amounts and disclosures in the financial statements. The procedures selected depend on the auditors’ judgment, including the assessment of the risks of material misstatement of the financial statements, whether due to fraud or error. In making those risk assessments, the auditor considers internal control relevant to the entity’s preparation and fair presentation of the financial statements in order to design audit procedures that are appropriate in the circumstances, but not for the purpose of expressing an opinion on the effectiveness of the entity’s internal control. Accordingly, we express no such opinion. An audit also includes evaluating the appropriateness of accounting policies used and the reasonableness of significant accounting estimates made by management, as well as evaluating the overall presentation of the financial statements.

Honorable Frank J. MautinoAuditor General, State of IllinoisAndBoard of DirectorsThe Illinois State Toll Highway AuthorityPage 2
5 (Continued)
We believe that the audit evidence we have obtained is sufficient and appropriate to provide a basis for our audit opinion
Opinion
In our opinion, the financial statements referred to above present fairly, in all material respects, the financial position of the business-type activities of the Illinois State Toll Highway Authority as of December 31, 2020, and the respective changes in financial position and cash flows thereof for the year then ended in accordance with accounting principles generally accepted in the United States of America.
Emphasis of Matter
Further, as discussed in Note 22 to the financial statements, as of December 31, 2020, the Tollway’s beginning net position was restated to correct an error in the allocation of the OPEB liability. Our opinion isnot modified with respect to that matter.
Other Matters
Required Supplementary Information
Accounting principles generally accepted in the United States of America require that Management’s Discussion and Analysis on pages 7-14 and the required supplementary information in Schedules 1 through 3 be presented to supplement the basic financial statements. Such information, although not a part of the basic financial statements, is required by the Governmental Accounting Standards Board who considers it to be an essential part of financial reporting for placing the basic financial statements in an appropriate operational, economic, or historical context. We have applied certain limited procedures to the required supplementary information in accordance with auditing standards generally accepted in the United States of America, which consisted of inquiries of management about the methods of preparing the information and comparing the information for consistency with management’s responses to our inquiries, the basic financial statements, and other knowledge we obtained during our audit of the basic financial statements. We do not express an opinion or provide any assurance on the information because the limited procedures do not provide us with sufficient evidence to express an opinion or provide any assurance.
Supplementary and Other Information
Our audit was conducted for the purpose of forming an opinion on the financial statements that collectively comprise the Tollway's basic financial statements. The accompanying supplementary information in Schedules 4 and 5 and the notes to the trust indenture basis schedules are presented for purposes of additional analysis and are not a required part of the basic financial statements.
The accompanying supplementary information in Schedules 4 and 5 and the notes to the trust indenture basis schedules is the responsibility of management and were derived from and relate directly to the underlying accounting and other records used to prepare the basic financial statements. Such information has been subjected to the auditing procedures applied in the audit of the basic financial statements and certain additional procedures, including comparing and reconciling such information directly to the underlyingaccounting and other records used to prepare the basic financial statements or to the basic financial statements themselves, and other additional procedures in accordance with auditing standards generally accepted in the United States of America. In our opinion, the accompanying supplementary information in Schedules 4 and 5 and the notes to the trust indenture basis schedules is fairly stated, in all material respects, in relation to the basic financial statements as a whole.

Honorable Frank J. MautinoAuditor General, State of IllinoisAndBoard of DirectorsThe Illinois State Toll Highway AuthorityPage 3
6
The accompanying supplementary information in Schedules 6 through 11 has not been subjected to the auditing procedures applied in the audit of the basic financial statements, and accordingly, we do not express an opinion or provide any assurance on it.
Other Reporting Required by Government Auditing Standards
In accordance with Government Auditing Standards, we have also issued our report dated October 15, 2021, on our consideration of the Tollway’s internal control over financial reporting and on our tests of its compliance with certain provisions of laws, regulations, contracts, and grant agreements and other matters. The purpose of that report is solely to describe the scope of our testing of internal control over financial reporting and compliance and the results of that testing, and not to provide an opinion on the effectiveness of the Tollway’s internal control over financial reporting or on compliance. That report is an integral part of an audit performed in accordance with Government Auditing Standards in considering the Tollway’s internal control over financial reporting and compliance.
CliftonLarsonAllen LLP
Oak Brook, IllinoisOctober 15, 2021

THE ILLINOIS STATE TOLL HIGHWAY AUTHORITYA Component Unit of the State of Illinois
Management’s Discussion and AnalysisFor the Year Ended December 31, 2020
7
This section offers readers a discussion and analysis of the financial performance of the Illinois State Toll Highway Authority (the Tollway), provides an overview of its financial activities, and identifies changes in the Tollway’s financial position as of and for the year ended December 31, 2020. Readers should use this section of this report in conjunction with the Tollway’s basic financial statements.
Financial Highlights
In August 2011, the Tollway’s Board of Directors approved a $12.2 billion capital program, called “Move Illinois: the Illinois Tollway Driving the Future” (“Move Illinois”), which defined a program of infrastructure investments to be made by the Tollway in 2012 through 2026.
In April 2017, the Tollway’s Board of Directors approved a modification of the “Move Illinois” capital program, increasing the funding by $2.1 billion, to $14.3 billion, to provide for enhancements to the central portion of the Tri-State Tollway (Central Tri-State).
To help fund the capital outlays approved for “Move Illinois”, the Tollway Board set new toll rates for passenger vehicles using the Tollway system and these higher rates were effective January 1, 2012. The Tollway also affirmed a previously approved increase in commercial vehicle toll rates which was phased in over 2015 - 2017, with a Consumer Price Index adjustment applied beginning January 1, 2018 and annually each January 1st thereafter.
During 2020, construction and professional engineering services contracts with a combined value of $1.5 billion were awarded under this program, bringing total “Move Illinois” contract awards to date to $7.8 billion.
Including $500 million in revenue bonds issued in December 2020, a total of $3.6 billion of revenue bonds have been issued in 2013-2020 to fund the capital program.
In 2020, the Tollway implemented a series of tolling reforms under the name Tolling 2020 to provide : (i) an amnesty offer of significantly reduced fines for outstanding violations in notices dated before March 9, 2020, to the extent paid by December 31, 2020 (such deadline extended on December 17, 2020 to June 30, 2021); (ii) relief from fines incurred during March 9 – June 25, 2020, the first 3 1/2 months of the COVID-19 pandemic; and (iii) an invoicing program effective June 25, 2020, significantly reducing initial costs associated with unpaid tolls to the extent such unpaid tolls are paid within 90 days.
The Tollway’s 2020 traffic and operating revenue were adversely impacted by the COVID-19 pandemic. Toll transactions in 2020 declined 21.2% from 2019. The Tollway’s 2020 operating revenue totaled $1.3 billion, a decrease of $223.6 million from the previous year. Operating expenses increased $5.6 million (to $875.3 million) primarily due to increased depreciation expense. Net operating income for 2020 was $385.6 million, a decrease of $229.1 million from 2019.
Amounts on deposit on behalf of I-PASS account holders increased by 2.8% at year-end to $199.2million; approximately 89.1% of toll transactions are paid via I-PASS.
Basic Financial Statements
The Tollway accounts for its operations and financial transactions in a manner similar to that used by private business enterprises: the accrual basis of accounting. In these statements, revenue is recognized in the period in which it is earned, and an expense is recognized in the period in which it is incurred, regardless of the timing of its related cash flow.

THE ILLINOIS STATE TOLL HIGHWAY AUTHORITYA Component Unit of the State of Illinois
Management’s Discussion and AnalysisFor the Year Ended December 31, 2020
8
Overview of the Financial Statements
This discussion and analysis is intended to serve as an introduction to the Tollway’s basic financial statements. For each fiscal year, the Tollway’s basic financial statements are comprised of the following:
Statement of net position
Statement of revenues, expenses and changes in net position
Statement of cash flows
Notes to the financial statements
The statement of net position presents information on all of the Tollway’s assets, deferred outflows of resources, liabilities, and deferred inflows of resources, with the difference between these items reported as net position. Increases or decreases in net position, over time, may serve as a useful indicator of whether the financial position of the Tollway is improving or deteriorating.
The statement of revenues, expenses and changes in net position presents revenue and expense information and the change in the Tollway’s net position during the measurement period as a result of these transactions.
The statement of cash flows presents sources and uses of cash for the fiscal year, displayed in the following categories: cash flows from operating activities, cash flows from capital and related financing activities, and cash flows from investing activities.
The notes provide additional information that is essential to a full understanding of the data provided in the basic financial statements. They are an integral part of the basic financial statements.

THE ILLINOIS STATE TOLL HIGHWAY AUTHORITYA Component Unit of the State of Illinois
Management’s Discussion and AnalysisFor the Year Ended December 31, 2020
9
Financial Analysis
2020 Results Compared to 2019
Operating Revenue
The Tollway’s 2020 operating revenues, totaling $1.3 billion, declined $223.6 million, or 15.1%, from the previous year. This decrease was mainly attributable to reduced toll revenue resulting from the COVID-19 pandemic’s adverse impact on traffic volume. In 2020, toll revenue totaled $1.1 billion versus $1.4 billion in 2019, a decline of $231.7 million, or 16.8%. Revenue from toll evasion recovery increased to $93.2 million (from $81.6 million), due in part to an increased rate of unpaid tolls caused by (in response to risks posed by the pandemic) the suspension of cash payment options, an amnesty offer which incentivized payment of unpaid tolls and related fines, and impacts of a new invoicing program implemented effective June 25, 2020.
Concession revenue decreased in 2020 to $1.4 million (18.8%) due to reduced traffic which resulted in less revenue at the over the road oases which generate concession revenue to the Tollway.
Operating Expenses
Operating expenses, excluding depreciation, decreased in 2020, to $380.7 million (3.4%) from $394.1 million in 2019. This was largely due to a reduction in customer service costs and credit card fees due to the reduced traffic on the roadway because of the COVID-19 pandemic. Reduced group insurance costs, operational supplies, and utilities also contributed to this decrease.
Depreciation and amortization expense increased in 2020 by 4.0% to $494.6 million, from $475.6 million in 2019. The resulting net operating income for the year, $385.6 million, decreased by $229.1 million, or 37.3%, from the previous year.
Nonoperating Revenues (Expenses)
Nonoperating revenue decreased by $22.9 million (32.7%), due to decreased investment returns as the result of decreased funds on deposit and lower investment rates. This year the Tollway once againearned interest rebates from the U.S. Department of the Treasury relating to bonds which were issued as Build America Bonds. The 2020 rebates totaled $13.6 million, substantially the same as 2019.
Nonoperating expenses decreased by $1.5 million (0.5%), due to decreased interest and amortization of financing costs offset by an increase in expense under intergovernmental agreements.
The net nonoperating expenses increased this year by 8.9% from $240.1 million in 2019 to $261.5 million for 2020, due to the variances noted above.

THE ILLINOIS STATE TOLL HIGHWAY AUTHORITYA Component Unit of the State of Illinois
Management’s Discussion and AnalysisFor the Year Ended December 31, 2020
10
Changes in Net Position
Net operating income decreased in 2020 by $229.1 million (37%) to $385.6 million. After deducting this year’s net nonoperating expenses of $261.5 million, the Tollway posted an increase in net position for the year of $124.2 million compared to $374.6 million increase in net position for 2019. After this year’s result, the Tollway’s net position totaled $3.1 billion. Beginning net position was restated see note 22.
2020 2019
REVENUES:Operating revenues:
Toll revenue $ 1,149,019,894 $ 1,380,750,754
Toll evasion recovery 93,164,508 81,554,193
Concessions 1,394,810 1,717,551
Miscellaneous 17,371,262 20,483,584
Nonoperating revenues:
Investment income 13,726,188 39,833,676
Revenues under intergovernmental agreements 19,653,073 16,469,715
Bond interest subsidy (Build America Bonds) 13,611,390 13,554,800
Total revenues 1,307,941,125 1,554,364,273
EXPENSES:Operating expenses:
Engineering and maintenance of roadway and structures 107,197,951 122,363,797
Services and toll collection 149,638,080 171,529,366
Traffic control, safety patrol, and radio communications 48,631,134 44,806,282
Procurement, IT, finance and administration 75,211,820 55,443,876
Depreciation & Amortization 494,637,313 475,602,597
Nonoperating expenses:
Expenses under intergovernmental agreements 19,653,073 16,469,715
Net loss on disposal of property 32,270 261,716
Miscellaneous 360 360
Interest expense and amortization of financing costs 288,762,582 293,259,340
Total expenses 1,183,764,583 1,179,737,049
Increase in net position 124,176,542 374,627,224
Restatement of 1/1/2020 net position (505,692,050) -
Net position, beginning of year 3,451,111,822 3,076,484,598
Net position, end of year, as restated (note 22) $ 3,069,596,314 $ 3,451,111,822
Summary of Changes in Net Position

THE ILLINOIS STATE TOLL HIGHWAY AUTHORITYA Component Unit of the State of Illinois
Management’s Discussion and AnalysisFor the Year Ended December 31, 2020
11
Statement of Net Position
The Tollway’s capital assets of $10.2 billion, consisting of land, buildings, infrastructure, and equipment, constitutes 79.8% of total assets and deferred outflows of resources. The largest liabilities are revenue bonds totaling $7.3 billion, (inclusive of unamortized premiums/discounts), net pension liability of $891.9million and net other postemployment benefits (OPEB) liability of $580.0 million, which together constitute 90.8% of total liabilities and deferred inflows of resources. The restricted net position balance, totaling $474.3 million, consists of resources subject to external restrictions or legislation as to their use. The remaining portion, unrestricted net position, represents the resources available to be used at the Tollway’s discretion.
The Tollway’s assets increased by 5.6% to $12.4 billion, from $11.7 billion at December 31, 2019. This increase was mainly due to an increase in capital assets.
2020 2019
ASSETSCurrent and other assets $ 2,240,301,131 $ 2,234,036,664
Capital assets - net 10,164,520,701 9,511,797,253
Total Assets 12,404,821,832 11,745,833,917
DEFERRED OUTFLOWS OF RESOURCES
Net loss on bond refundings 235,814,949 261,180,173
Pension related 59,741,932 59,773,509
OPEB related 43,550,286 34,084,814
Total Deferred Outflows of Resources 339,107,167 355,038,496
LIABILITIES
Current debt outstanding 136,505,000 129,260,000
Long-term debt outstanding 7,174,022,374 6,712,938,755
Other liabilities 2,243,260,753 1,703,509,762
Total Liabilities 9,553,788,127 8,545,708,517
DEFERRED INFLOWS OF RESOURCESPension related 33,054,063 58,557,894
OPEB related 87,490,495 45,494,180
Total Deferred Inflows of Resources 120,544,558 104,052,074
NET POSITION
Net investment in capital assets 3,159,827,805 2,879,594,594
Restricted under trust indenture agreements 474,330,449 458,006,472
Restricted for supplemental pension benefits obligations 4,281 34,129
Unrestricted (564,566,221) 113,476,627
Total Net Position $ 3,069,596,314 $ 3,451,111,822
December 31,
Summary of Net Position
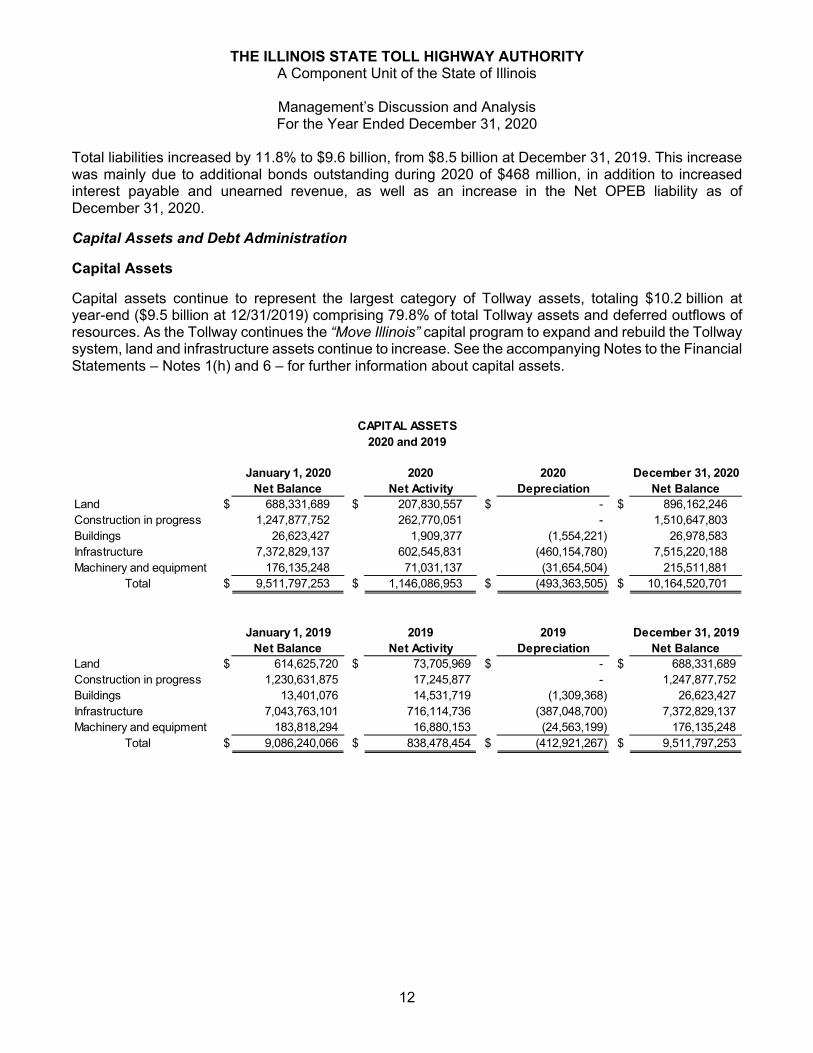
THE ILLINOIS STATE TOLL HIGHWAY AUTHORITYA Component Unit of the State of Illinois
Management’s Discussion and AnalysisFor the Year Ended December 31, 2020
12
Total liabilities increased by 11.8% to $9.6 billion, from $8.5 billion at December 31, 2019. This increase was mainly due to additional bonds outstanding during 2020 of $468 million, in addition to increased interest payable and unearned revenue, as well as an increase in the Net OPEB liability as of December 31, 2020.
Capital Assets and Debt Administration
Capital Assets
Capital assets continue to represent the largest category of Tollway assets, totaling $10.2 billion at year-end ($9.5 billion at 12/31/2019) comprising 79.8% of total Tollway assets and deferred outflows of resources. As the Tollway continues the “Move Illinois” capital program to expand and rebuild the Tollway system, land and infrastructure assets continue to increase. See the accompanying Notes to the Financial Statements – Notes 1(h) and 6 – for further information about capital assets.
January 1, 2020 2020 2020 December 31, 2020
Net Balance Net Activity Depreciation Net Balance
Land $ 688,331,689 $ 207,830,557 $ - $ 896,162,246
Construction in progress 1,247,877,752 262,770,051 - 1,510,647,803
Buildings 26,623,427 1,909,377 (1,554,221) 26,978,583
Infrastructure 7,372,829,137 602,545,831 (460,154,780) 7,515,220,188
Machinery and equipment 176,135,248 71,031,137 (31,654,504) 215,511,881
Total $ 9,511,797,253 $ 1,146,086,953 $ (493,363,505) $ 10,164,520,701
January 1, 2019 2019 2019 December 31, 2019
Net Balance Net Activity Depreciation Net Balance
Land $ 614,625,720 $ 73,705,969 $ - $ 688,331,689
Construction in progress 1,230,631,875 17,245,877 - 1,247,877,752
Buildings 13,401,076 14,531,719 (1,309,368) 26,623,427
Infrastructure 7,043,763,101 716,114,736 (387,048,700) 7,372,829,137
Machinery and equipment 183,818,294 16,880,153 (24,563,199) 176,135,248
Total $ 9,086,240,066 $ 838,478,454 $ (412,921,267) $ 9,511,797,253
CAPITAL ASSETS
2020 and 2019

THE ILLINOIS STATE TOLL HIGHWAY AUTHORITYA Component Unit of the State of Illinois
Management’s Discussion and AnalysisFor the Year Ended December 31, 2020
13
Long-Term Debt
At year-end 2020, as compared to year-end 2019, total revenue bonds payable, inclusive of original issue premium and net of current revenue bonds payable, increased by $461.0 million to $7.2 billion. This increase resulted from the addition of $644.9, inclusive of original issue premium, for the 2020 Series A bond issuance to finance a portion of the “Move Illinois” capital program, less $129.3 million of bond principal payments and less $47.4 million of original issue premium amortizations.
All Tollway bonds outstanding as of December 31, 2020 were issued under the Amended and Restated Trust Indenture effective March 31, 1999, amending and restating a Trust Indenture dated December 1, 1985 (as amended, restated, and supplemented, the Trust Indenture) from the Tollway to The Bank of New York Mellon Trust Company, N.A., as successor Trustee (the Trustee). The Trustee serves as a fiduciary for bondholders. The amount of additional senior bonds that the Tollway may issue at any time is limited by the Trust Indenture requirement that the projected Net Revenues are sufficient to meet the estimated Net Revenue Requirement for each full fiscal year through five years after the date the project being financed is estimated to be placed in service, after giving effect to the debt service attributable to such additional senior bonds. The Net Revenue Requirement is the amount necessary to cure deficiencies, if any, in the debt service and debt reserve accounts established under the Trust Indenture, plus the greater of (i) the sum of Aggregate Debt Service on Senior Bonds, the Junior Bond Revenue Requirement, and the Renewal and Replacement Deposit for such period, and (ii) 1.3 times the Aggregate Debt Service on Senior Bonds for such period (all capitalized terms as defined in the Trust Indenture). Under the terms of the Trust Indenture the revenue bond debt service coverage ratio for 2020 was 2.09.
The following table lists, as of December 31, 2020, the Tollway’s bond series and the current and noncurrent principal amounts outstanding. Amounts presented in this table do not include any unamortized original issue premiums associated with the bonds.

THE ILLINOIS STATE TOLL HIGHWAY AUTHORITYA Component Unit of the State of Illinois
Management’s Discussion and AnalysisFor the Year Ended December 31, 2020
14
Factors Impacting Future Operations
During 2020, the Tollway progressed on the $14.3 billion “Move Illinois” capital program. Land acquisition, design and construction work continued for the Elgin-O’Hare Western Access Project and for the widening of the Central Tri-State Tollway. The Tollway forecasts approximately 60% of the “Move Illinois”Program’s total costs are expected to be funded by toll revenue.
Contacting the Tollway’s Financial Management
This financial report is designed to provide our customers, bondholders, employees and other stakeholders with an overview of the Tollway’s finances and to demonstrate the Tollway’s accountability for the funds it receives and deploys. Questions concerning this report or requests for additional financial information should be directed to the Controller, The Illinois State Toll Highway Authority, 2700 Ogden Avenue, Downers Grove, Illinois 60515.

15 (Continued)
Current assets:Current unrestricted assets:
Cash and cash equivalents $ 1,022,766,480 Accounts receivable, less allowance for doubtful accounts of $198,141,949 60,617,559 Intergovernmental receivables 52,775,634 Accrued interest receivable 4,707 Risk management cash and cash equivalents 12,763,016 Investments 49,996,900 Prepaid expenses 4,559,428
Total current unrestricted assets 1,203,483,724
Current restricted assets:Cash and cash equivalents - debt service 181,401,171 Cash and cash equivalents - I-PASS accounts 199,150,846 Prepaid expenses restricted for debt service 206,897 Accrued interest receivable 226,599 Supplemental pension benefits assets 4,281
Total current restricted assets 380,989,794
Total current assets 1,584,473,518
Noncurrent unrestricted assets:Capital assets:
Land, improvements and construction in progress 2,406,810,049 Other capital assets, net of accumulated depreciation 7,757,710,652
Total capital assets 10,164,520,701 Other noncurrent unrestricted assets:
Intergovernmental receivable less current portion 101,697,014 Prepaid expenses less current portion 1,729,175
Total other noncurrent unrestricted assets 103,426,189
Noncurrent restricted assets:Cash and cash equivalents - debt reserve 330,190,001 Investments - debt reserve 95,000,000 Prepaid expenses - debt reserve 2,275,862 Cash and cash equivalents - construction 124,935,561
Total noncurrent restricted assets 552,401,424 Total assets 12,404,821,832
Net loss on bond refundings 235,814,949 Deferred outflows of resources - pension related 59,741,932 Deferred outflows of resources - OPEB related 43,550,286
Total deferred outflows of resources $ 339,107,167
See accompanying notes to the financial statements.
Deferred Outflows of Resources
THE ILLINOIS STATE TOLL HIGHWAY AUTHORITYA Component Unit of the State of Illinois
Statement of Net PositionDecember 31, 2020
Assets

16
Current liabilities:Payable from unrestricted current assets:
Accounts payable $ 15,365,144 Accrued liabilities 236,587,008 Accrued compensated absences 5,100,000 Intergovernmental agreement payable 76,075,648 Risk management claims payable 6,952,957 Deposits and retainage 54,916,032 Unearned revenue, net of accumulated amortization of $1,924,519 660,115 Net OPEB liability - current 24,417,291
Total current liabilities payable from unrestrictedcurrent assets 420,074,195
Payable from current restricted assets:Current portion of revenue bonds payable 136,505,000 Accrued interest payable 134,970,081 Deposits and unearned revenue – I-PASS accounts 199,150,846
Total current liabilities payable from current restrictedassets 470,625,927
Total current liabilities 890,700,122
Noncurrent liabilities:Revenue bonds payable, less current portion 7,174,022,374 Accrued compensated absences 6,957,250 Risk management claims payable 11,010,865 Net pension liability 891,871,048 Net OPEB liability, less current portion 555,600,990 Unearned revenue, less accumulated amortization of $35,002,521 23,625,478
Total noncurrent liabilities 8,663,088,005
Total liabilities 9,553,788,127
Deferred inflows of resources - pension related 33,054,063 Deferred inflows of resources - OPEB related 87,490,495
Total deferred inflows of resources 120,544,558
Net position:Net investment in capital assets 3,159,827,805 Restricted under the Trust Indenture 474,330,449 Restricted for supplemental pension benefits obligations 4,281 Unrestricted (564,566,221)
Total net position $ 3,069,596,314
See accompanying notes to the financial statements.
Deferred Inflows of Resources
Net Position
Liabilities
A Component Unit of the State of IllinoisTHE ILLINOIS STATE TOLL HIGHWAY AUTHORITY
Statement of Net PositionDecember 31, 2020

17
Operating revenues:
Toll revenue $ 1,149,019,894
Toll evasion recovery 93,164,508
Concessions 1,394,810
Miscellaneous 17,371,262
Total operating revenues 1,260,950,474
Operating expenses:
Engineering and maintenance of roadway and structures 107,197,951
Services and toll collection 149,638,080
Traffic control, safety patrol and radio communications 48,631,134
Procurement, IT, finance and administration 75,211,820
Depreciation and amortization 494,637,313
Total operating expenses 875,316,298
Operating income 385,634,176
Nonoperating revenues (expenses):
Revenues under intergovernmental agreements 19,653,073
Expenses under intergovernmental agreements (19,653,073)
Net loss on disposal of property (32,270)
Interest (expense) and amortization of financing costs (288,762,582)
Bond interest subsidy (Build America Bonds) 13,611,390
Miscellaneous revenue (expense) (360)
Investment income 13,726,188
Total nonoperating revenues (expenses), net (261,457,634)
Change in net position 124,176,542
Net position, beginning of year 3,451,111,822
Restatement of 1/1/20 Net Position (505,692,050)
Net position, end of year, as restated (note 22) $ 3,069,596,314
See accompanying notes to the financial statements.
THE ILLINOIS STATE TOLL HIGHWAY AUTHORITY
A Component Unit of the State of Illinois
Statement of Revenues, Expenses and Changes in Net Position
For the Year Ended December 31, 2020

18 (Continued)
Cash flows from operating activities:
Cash received from sales and services $ 1,253,145,233
Cash payments to suppliers (194,728,705)
Cash payments to employees (180,135,705)
Net cash provided by operating activities 878,280,823
Cash flows from capital and related financing activities:
Acquisition and construction of capital assets (1,172,631,414)
Cash received from other governments for capital assets 71,190,126
Proceeds from sale of property 512,337
Bond proceeds 644,942,984
Principal paid on revenue bonds (129,260,000)
Bond subsidy (Build America Bonds) 6,825,760
Interest expense and issuance costs paid on revenue bonds (290,198,128)
Net cash (used in) capital and related financing activities (868,618,335)
Cash flows from investing activities:
Proceeds from sales and maturities of investments 1,076,468,730
Interest on investments 15,067,596
Net cash provided by investing activities 1,091,536,326
Net increase in cash and cash equivalents 1,101,198,814
Cash and cash equivalents at beginning of year 770,012,542
Cash and cash equivalents at end of year $ 1,871,211,356
Reconciliation of cash and cash equivalents:
Cash and cash equivalents $ 1,022,766,480
Risk management reserved cash and cash equivalents 12,763,016
Cash and cash equivalents restricted for debt service and debt reserve 511,591,172
Cash and cash equivalents – I-PASS accounts 199,150,846
Supplemental pension benefit assets 4,281
Cash and cash equivalents - construction 124,935,561
Total cash and cash equivalents at end of year $ 1,871,211,356
See accompanying notes to the financial statements.
THE ILLINOIS STATE TOLL HIGHWAY AUTHORITYA Component Unit of the State of Illinois
Statement of Cash Flows
For the Year Ended December 31, 2020

19
Reconciliation of operating income to net cash provided by
operating activities:
Operating income $ 385,634,176
Adjustments to reconcile operating income to net cash provided
by operating activities:
Depreciation and amortization 494,637,313
Provision for bad debt 117,991,102
Prior year feasibility study project 905,052
Amortization of unearned revenue (1,924,519)
Pension adjustment 12,579,718
Other post employment benefits adjustment (11,921,084)
Effects of changes in operating assets and liabilities:
(Increase) in accounts receivable (138,740,029)
(Increase) in intergovernmental receivables (3,061,164)
(Increase) in prepaid expenses (741,762)
(Decrease) in accounts payable (4,539,396)
(Decrease) in accrued liabilities 3,503,697
Increase in accrued compensated absences 2,902,651
Increase in intergovernmental agreement payable 1,851,932
Increase in deposits - I-PASS 5,354,460
Increase in unearned revenue 12,428,741
Increase in risk management claims payable 1,419,935
Net cash provided by operating activities $ 878,280,823
Noncash capital and related financing activities:
Increase in capital asset obligation accounts payable $ 10,411,089
See accompanying notes to the financial statements.
THE ILLINOIS STATE TOLL HIGHWAY AUTHORITYA Component Unit of the State of Illinois
Statement of Cash Flows
For the Year Ended December 31, 2020

THE ILLINOIS STATE TOLL HIGHWAY AUTHORITYA Component Unit of the State of Illinois
Notes to the Financial StatementsFor the Year Ended December 31, 2020
20 (Continued)
(1) Summary of Significant Accounting Policies
The accounting policies and financial reporting practices of The Illinois State Toll Highway Authority (the Tollway) conform to accounting principles generally accepted in the United States of America (GAAP), as promulgated by the Governmental Accounting Standards Board (GASB).
(a) Financial Reporting Entity
The Tollway, a component unit of the State of Illinois, was created by an Act of the General Assembly of the State of Illinois – the Toll Highway Act, 605 ILCS 10/1 et seq., as amended (the Act) – for the purpose of constructing, operating, regulating, and maintaining a toll highway or a system of toll highways and, in connection with the financing of such projects, is authorized to issue revenue bonds which shall be retired from revenues derived from the operation of the Tollway. Under the provisions of the Act, no bond issue of the Tollway, or any interest thereon, is an obligation of the State of Illinois. In addition, the Tollway is empowered to issue refunding bonds for the purpose of refunding any revenue bonds issued under the provisions of the Act.
The enabling legislation empowers the Tollway’s Board of Directors with duties and responsibilities which include, but are not limited to, the ability to approve and modify the Tollway’s budget, the ability to approve and modify toll rates and fees charged for use of the Tollway system, the ability to employ and discharge employees as necessary in the judgment of the Tollway, and the ability to acquire, own, use, hire, lease, operate, and dispose of personal property, real property, and any interest therein.
Component units are separate legal entities for which the primary government is legally accountable. The Tollway is a component unit of the State of Illinois for financial reporting purposes because exclusion would cause the State’s financial statements to be incomplete. The governing body of the Tollway is an 11 member Board of Directors of which nine members are appointed by the Governor of Illinois with the advice and consent of the Illinois Senate. The Governor and the Secretary of the Illinois Department of Transportation are also ex-officiomembers of the Tollway’s Board of Directors. Information from these financial statements isincluded in the State’s comprehensive annual financial report. The Tollway itself does not have any component units.
(b) Basis of Accounting
The Tollway accounts for its operations and financing in a manner similar to a private business enterprise; the intent is that costs of providing goods or services to the general public on a continuing basis be financed or recovered primarily through user charges.
Accordingly, the Tollway is accounted for as a proprietary fund (enterprise fund) using the economic resources measurement focus and the accrual basis of accounting. Under this measurement focus, all assets and all liabilities associated with the Tollway’s operations are included in the statement of net position. Revenue is recognized in the period in which it is earned, and expenses are recognized in the period in which incurred.

THE ILLINOIS STATE TOLL HIGHWAY AUTHORITYA Component Unit of the State of Illinois
Notes to the Financial StatementsFor the Year Ended December 31, 2020
21 (Continued)
Nonexchange transactions, in which the Tollway receives value without directly giving equal value in return, include fines for toll evasion.
(c) Cash and Cash Equivalents
With the exception of $58.3 million in locally held funds and cash on hand at December 31, 2020, all cash and cash equivalents are held for the Tollway either by the Illinois State Treasurer (the Treasurer) as custodian, or by the Trustee under the Tollway’s Trust Indenture.
For purposes of the statement of net position and the statement of cash flows, the Tollway considers repurchase agreements, money market funds, and the Illinois Funds local government investment pool (LGIP), as cash equivalents.
(d) Investments
The Tollway reports investments at fair value or amortized cost in its statement of net position with the corresponding changes in fair value being recognized as an increase or decrease to nonoperating revenue in the statement of revenues, expenses and changes in net position. All investments are held for the Tollway either by the Treasurer as custodian or by the Trustee under the Tollway’s Trust Indenture.
The primary objective in the investment of Tollway funds is preservation of principal. Additional objectives are managing liquidity to meet the financial obligations of the Tollway and investment return.
Investments in the Illinois Funds LGIP, sponsored by the Treasurer in accordance with Illinois state law that is rated AAAm by Standard & Poor’s rating agency, are reported at amortized cost which is equal to the value of the pool shares. Other funds held for the Tollway by the Treasurer are invested in U.S. Treasury and agency issues which are valued at fair value or par. Repurchase agreements held for the Tollway by the Treasurer are recorded at face value which approximates fair value. State statute requires that all investments comply with the Illinois Public Funds Investment Act.
The Trust Indenture authorizes the Tollway to invest in U.S. Treasury and agency issues, money market funds comprised of U.S. Treasury and agency issues, repurchase agreements thereon, time deposits, and certificates of deposit. All funds held by the Tollway’s Trustee were held in compliance with these restrictions for the year ended December 31, 2020.
(e) Accounts Receivable
The Tollway’s accounts receivable consist of various toll charges and amounts due from individuals and commercial, governmental, and other entities. A provision for doubtful accounts has been recorded for the estimated amount of uncollectible accounts.
(f) Prepaid Expenses and Inventory
Certain payments made to vendors reflect costs applicable to future accounting periods and are recorded as prepaid expenses. The Tollway’s inventory items consist mostly of consumable supplies that are quickly turned over and therefore the payments for such are directly expensed.

THE ILLINOIS STATE TOLL HIGHWAY AUTHORITYA Component Unit of the State of Illinois
Notes to the Financial StatementsFor the Year Ended December 31, 2020
22 (Continued)
(g) Noncurrent Cash and Investments
Cash and investments that are externally restricted for reserve funds or for the purchase or construction of capital or other noncurrent assets are classified as noncurrent assets in the statement of net position.
(h) Capital Assets
Capital assets include the historical cost of land and improvements, easements, roadway and transportation structures (infrastructure), buildings and related improvements, machinery, equipment and software with a cost exceeding $5,000. (Projects whose individual components are less than $5,000 but in their entirety are greater than $5,000 may be capitalized at the discretion of the Tollway). Most expenses for the maintenance and repairs to the roadway and transportation structures, buildings, and related improvements are charged to operations when incurred. All expenses for land, buildings, infrastructure, and construction in progress that increase the value or productive capacities of assets are capitalized. Capital assets are depreciated using the straight-line method of depreciation over the asset’s useful life, as follows:
Buildings 20 YearsInfrastructure 5 to 40 YearsMachinery, equipment and software 3 to 20 Years
(i) Leases
The Tollway makes a distinction between: 1) capital leases that effectively transfer from the lessor to the lessee substantially all the risks and benefits incidental to ownership of the leased assets, and 2) operating leases under which the lessor effectively retains all such risks and benefits. The Tollway was not a party to any capital leases during the year.
Operating leases are accounted for as an operating revenue or expense, depending on whether the Tollway is the lessor or lessee.
(j) Long-Term Accounts Receivable
In the course of business, the Tollway may enter into contracts with various parties that call for payments to the Tollway to be made at a date more than one year in the future. These receivables are classified as long-term. See Note 7 for a description of these receivables.
(k) Debt Refunding
In accordance with GASB Statement No. 65, Items Previously Reported as Assets and Liabilities, the difference between the reacquisition price and the net carrying amount of the old debt is reported as a deferred outflow or inflow of resources and recognized as a component of interest expense systematically over the remaining life of the old debt or the life of the new debt, whichever is shorter.
(l) Unearned Revenue
The Tollway recognizes revenue when earned. Amounts received in advance of the periods in which related services are rendered are recorded as an unearned revenue liability in the statement of net position. See Note 9.
THE ILLINOIS STATE TOLL HIGHWAY AUTHORITYA Component Unit of the State of Illinois
Notes to the Financial StatementsFor the Year Ended December 31, 2020
23 (Continued)
(m)Pensions
Substantially all of the Tollway’s employees participate in the State Employees’ Retirement System (SERS), a single-employer, public employee defined benefit pension plan of the State of Illinois, as more fully described in Note 11.
In accordance with GASB Statement No. 68, Accounting and Financial Reporting for Pensions - an amendment of GASB Statement No. 27, and GASB Statement No. 71, Pension Transition for Contributions Made Subsequent to the Measurement Date – an amendment of GASB Statement No. 68, the net pension liability, deferred outflows of resources, deferred inflows of resources, and pension expense have been recognized in the Tollway’s financial statements.
The net pension liability is calculated as the difference between the actuarially calculated value of the projected benefit payments attributed to past periods of service and the plan’s fiduciary net position. The pension expense is comprised of the service cost or actuarial present value of projected benefit payments attributed to the valuation year, interest on the total pension liability, plan administrative expenses, current year benefit changes, and other changes in plan fiduciary net position less employee contributions and projected earnings on plan investments.
Additionally, the pension expense includes the annual recognition of deferred outflows and inflows of resources related to pension assets and liabilities.
For purposes of measuring the net pension liability, deferred outflows of resources, deferred inflows of resources, expense and expenditures associated with the Tollway’s contribution requirements, information about the fiduciary net position of the plan and additions to/deductions from the plan’s fiduciary net position have been determined on the same basis as they are reported within the separately issued plan financial statements. For this purpose, benefit payments (including refunds of employee contributions) are recognized when due and payable in accordance with the terms of the plan. Investments are reported at fair value.
(n) Adoption of New Accounting Pronouncements
There were no new accounting pronouncements that the Tollway was required to adopt in the year ended December 31, 2020.
(o) Net Position
The statement of net position presents the Tollway’s assets, deferred outflows of resources, liabilities, and deferred inflows of resources, with the difference reported in three categories:
Net investment in capital assets consists of capital assets, net of accumulated depreciation,and reduced by outstanding balances for revenue bonds and other debt that is attributable to the acquisition, construction, or improvement of those assets.
Restricted Net Position results when constraints placed on net position use are either externally imposed by creditors, grantors, contributors, and the like, or imposed by law through constitutional provisions or enabling legislation.
Unrestricted Net Position consists of net positions that do not meet the criteria of the two preceding categories.
At December 31, 2020, restrictions on net position consisted of:

THE ILLINOIS STATE TOLL HIGHWAY AUTHORITYA Component Unit of the State of Illinois
Notes to the Financial StatementsFor the Year Ended December 31, 2020
24 (Continued)
Restricted for Supplemental Pension Obligation reflects monies set aside for a retirement plan established in 1990 and suspended in 1994.
Restricted under the Trust Indenture reflects restrictions imposed by the Tollway’s Trust Indenture.
(p) Toll Revenue and Evasion Recovery
Toll revenue is recognized when the transaction occurs. Effective June 25, 2020, the Tollway implemented an invoicing process for unpaid tolls. This process provides for invoice(s) for missed tolls, including any administrative fees. The fee amount, reduced by an estimated allowance for doubtful accounts, is recorded as evasion recovery revenue when the invoice is issued. The fines attributed to toll evasion recovery are recorded as revenue when received in cash. Tolls that remain unpaid through the invoicing process become subject to fines. Fines are recorded as revenue upon receipt of cash by the Tollway.
(q) Classification of Operating Revenues and Expenses
The Tollway’s operating revenues and expenses consist of revenues earned and expenses incurred relating to the operation and maintenance of its Tollway system, including the Tollway’s allocated share of SERS’ pension expense pursuant to GASB Statements No. 68and 71 and the Tollway’s allocated share of the State of Illinois’ postemployment benefits liability. All other revenues and expenses are reported as nonoperating revenues and expenses or as special items.
Toll evasion recovery revenue is shown net of bad debt expense; concession revenue only includes oasis revenue.
The majority of the Tollway’s expenses are exchange transactions, which GASB defines as operating expenses for financial statement presentation purposes. Nonoperating expenses include transfers under intergovernmental agreements and capital financing costs.
Employee benefits and retirement costs have been allocated to functional expense categories within these statements on the basis of gross payroll for each category of functional expense.
(r) Risk Management
The Tollway has self-insured risk retention programs with stop-loss limits for current employee group health and self-insured reserves for workers’ compensation claims and has provided accruals for estimated losses arising from such claims. See Note 13.
(s) Use of Estimates in Preparing Financial Statements
The preparation of financial statements in conformity with accounting principles generally accepted in the United States of America requires management to make estimates and assumptions that affect the reported amounts of assets, deferred outflows of resources, liabilities, deferred inflows of resources, and disclosure of contingent assets and liabilities at the date of the financial statements and the reported amounts of revenues and expenses during the reporting period. Actual results could differ from those estimates.

THE ILLINOIS STATE TOLL HIGHWAY AUTHORITYA Component Unit of the State of Illinois
Notes to the Financial StatementsFor the Year Ended December 31, 2020
25 (Continued)
(2) Cash and Investments
(a) Custodial Credit Risk – Deposits
Custodial credit risk is the risk that an institution holding the Tollway’s deposits may fail and expose the Tollway to a loss if the Tollway’s deposits cannot be returned upon maturity or demand. State law (30 ILCS 230/2C) requires that all deposits of public funds be covered by the Federal Deposit Insurance Corporation (FDIC) insurance or eligible collateral. The Tollway has no policy that would further limit the requirements under state law. As of December 31, 2020, the Tollway’s deposits were covered by FDIC insurance or eligible collateral.
(b) Schedule of Investments
As of December 31, 2020, the carrying value of the Tollway’s investments (with associated maturities) is as follows:
For purposes of the statement of net position, money market funds, and Illinois Funds LGIP are classified as cash equivalents.
The Tollway categorizes its fair value measurements within the fair value hierarchy established by U.S. GAAP. The hierarchy is based on the valuation inputs used to measure the fair value of the asset. Level 1 inputs are quoted prices in active markets; Level 2 inputs are significant other observable inputs; and Level 3 inputs are significant unobservable inputs. The Tollway has no Level 2 or Level 3 inputs.
The Tollway has the following recurring fair value measurements as of December 31, 2020:
Money market funds, U.S. Treasury - SLGS, and Illinois Funds LGIP are measured at amortized cost.
1 - 5
Money market funds* $ 1,609,386,084 $ 1,609,386,084 $ -
U.S. Treasury - SLGS 95,000,000 95,000,000 -
Federal Home Loan Bank 49,996,900 49,996,900 -
Illinois Funds LGIP* 213,136,907 213,136,907 -
$ 1,967,519,891 $ 1,967,519,891 $ -
* Weighted average maturity is less than one year.
Investment Maturities (in years)
Fair Value Less
Investment Type or Amortized Cost Than 1
Investment Type Total Level 1
Federal Home Loan Bank $ 49,996,900 $ 49,996,900
$ 49,996,900 $ 49,996,900

THE ILLINOIS STATE TOLL HIGHWAY AUTHORITYA Component Unit of the State of Illinois
Notes to the Financial StatementsFor the Year Ended December 31, 2020
26 (Continued)
(c) Interest Rate Risk
Interest rate risk is the risk that the fair value of investments will decrease as a result of an increase in interest rates. As a means of limiting its exposure to fair value losses from rising interest rates, and as a means of managing liquidity, the Tollway’s investment policy requires that the majority of Tollway funds, excluding bond proceeds, be invested in instruments with maturities of less than one year. No investment is to exceed a 10-year maturity.
(d) Credit and Concentration Risks
Credit risk is the risk that the Tollway will not recover its investments due to the inability of the issuer to fulfill its obligation. The Tollway’s investment policy limits investment of Tollway funds to: securities guaranteed by the United States government; obligations of agencies and instrumentalities of the United States; interest-bearing savings accounts, certificates of deposit, or bank time deposits with institutions which meet specified capitalization requirements; money market mutual funds registered under the Investment Company Act of 1940; the Illinois Funds LGIP; and repurchase agreements of government securities as defined in the Government Securities Act of 1986. To minimize concentration risk, the Tollway’s investment policy further requires that the investment portfolio be diversified, as necessary to reduce the risk of loss in terms of specific maturity, specific issuer, or specific class of securities. Final maturities are limited to ten years; the majority of the Tollway’s funds, excluding bond proceeds, are to be invested in maturities of less than one year. The Tollway was in compliance with these policies during 2020.
For the year ended December 31, 2020, the Tollway’s investments in debt securities were rated by Moody’s and Standard & Poor’s as follows:
(3) Accounts Receivable
The Tollway’s accounts receivable consist of various toll charges and other amounts due from individuals, commercial, governmental, and other entities. A provision for doubtful accounts has been recorded for estimated uncollectible amounts. As of December 31, 2020, the Tollway’s accounts receivable balance consists of the following:
Fair Value
Investment Type or Amortized Cost Rating
Money market funds $ 1,609,386,084 Aaa-mf/AAAm
U.S. Treasury bills 95,000,000 Aaa/AA+u
Federal Home Loan Bank 49,996,900 Aaa/AA+
Illinois Funds LGIP 213,136,907 N/R/AAAm
2020 (Moody's/S&P)

THE ILLINOIS STATE TOLL HIGHWAY AUTHORITYA Component Unit of the State of Illinois
Notes to the Financial StatementsFor the Year Ended December 31, 2020
27 (Continued)
(4) Prepaid Expenses
In the normal course of business, the Tollway pays for goods and services that will be consumed beyond the current year. These are established as prepaid expenses. As of December 31, 2020,the Tollway had $8.8 million in prepaid expenses. These are categorized as both current and noncurrent.
(5) Leases Receivable
During 2002, the Tollway, as lessor, entered into two 25-year lease agreements for the oasis system (a retail lease and a fuel lease). Under the terms of each lease, the lessee became financially responsible for rebuilding and remains responsible for renovating the oases structures. At the end of each lease, ownership of the improvements reverts to the Tollway. In the retail lease, the lessee is responsible for the payment of all expenses associated with administration and operation of the facilities including the securing of tenants. In the fuel lease, the lessee is responsible for the operation of the service station and car wash facilities.
The fuel lease agreement set up a three-step environmental program for the oases: (1) was remediation by the Tollway of the pre-existing contamination and establishing a baseline for contamination; (2) was remediation of contamination caused by the lessee(s) during the lease period; and (3) was a post-lease testing regimen and remediation to the base line by the lessee(s). This agreement ensured that the oasis system was in compliance with environmental laws when the property was leased, and that lessee(s) would be in compliance during the term of the lease. The Tollway was solely financially responsible for the remediation program for all environmental releases prior to the lease commencement date. Additionally, the Tollway conducted post-remediation testing to establish the baseline. The Tollway completed the remediation program,and has received “No Further Remediation (NFR)” letters from the Illinois Environmental Protection Agency for all locations. Any environmental releases during the lease are solely the responsibility of the lessee(s). Furthermore, any remediation necessary after the lease to bring the site back to pre-lease conditions are the responsibility of the lessee(s). Finally, the lease
Tolls $ 13,348,786 $ (8,101,538) $ 5,247,248
Toll evasion recovery 229,334,717 (186,399,504) 42,935,213
Oases receivables 60,663 - 60,663
Damage claims 376,259 (364,663) 11,596
Over dimension vehicle permit 307,830 (101,327) 206,503
Fiber optic agreements 5,875,275 (1,025,956) 4,849,319
Other 9,455,978 (2,148,961) 7,307,017
Total non-governmental receivables 258,759,508 (198,141,949) 60,617,559
Various local government and other state agency 24,897,437 - 24,897,437
E-Z Pass Agency Group 27,878,197 - 27,878,197
Illinois Department of Transportation 101,697,014 - 101,697,014
Total intergovernmental receivables 154,472,648 - 154,472,648
$ 413,232,156 $ (198,141,949) $ 215,090,207
Net accounts
receivables doubtful accounts receivable
Total receivables
Gross accounts Allowance for
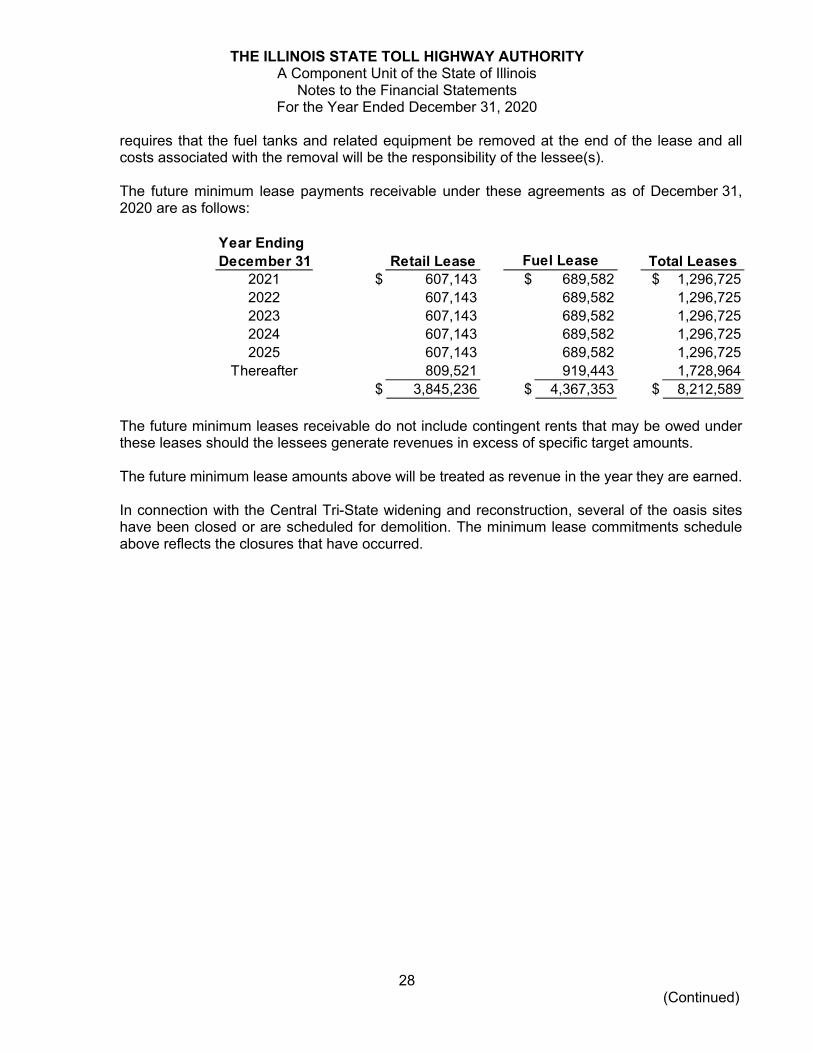
THE ILLINOIS STATE TOLL HIGHWAY AUTHORITYA Component Unit of the State of Illinois
Notes to the Financial StatementsFor the Year Ended December 31, 2020
28 (Continued)
requires that the fuel tanks and related equipment be removed at the end of the lease and all costs associated with the removal will be the responsibility of the lessee(s).
The future minimum lease payments receivable under these agreements as of December 31, 2020 are as follows:
The future minimum leases receivable do not include contingent rents that may be owed under these leases should the lessees generate revenues in excess of specific target amounts.
The future minimum lease amounts above will be treated as revenue in the year they are earned.
In connection with the Central Tri-State widening and reconstruction, several of the oasis siteshave been closed or are scheduled for demolition. The minimum lease commitments schedule above reflects the closures that have occurred.
Year Ending
December 31 Retail Lease2021 $ 607,143 $ 689,582 $ 1,296,725
2022 607,143 689,582 1,296,725
2023 607,143 689,582 1,296,725
2024 607,143 689,582 1,296,725
2025 607,143 689,582 1,296,725
Thereafter 809,521 919,443 1,728,964
$ 3,845,236 $ 4,367,353 $ 8,212,589
Fuel Lease Total Leases

THE ILLINOIS STATE TOLL HIGHWAY AUTHORITYA Component Unit of the State of Illinois
Notes to the Financial StatementsFor the Year Ended December 31, 2020
29 (Continued)
(6) Capital Assets
Changes in capital assets for the year ended December 31, 2020, are as follows:
(7) Long-Term Accounts Receivable
As of December 31, 2020, long-term accounts receivable consisted of the following:
Long-term accounts receivable represents the noncurrent amount due under intergovernmental agreements for cost-sharing construction projects.
Balance at Additions and Deletions and Balance at
Jan 1, 2020 transfers in transfers out Dec 31, 2020
Nondepreciable capital assets:
Land and improvements $ 685,361,097 $ 208,520,561 $ (480,836) $ 893,400,822
Temporary Easement 5,601,251 1,064,640 (1,360,600) 5,305,291
Construction in progress 1,247,877,752 846,138,083 (583,368,032) 1,510,647,803
1,938,840,100 1,055,723,284 (585,209,468) 2,409,353,916
Less accumulated amortization
Temporary Easement (2,630,659) (1,273,808) 1,360,600 (2,543,867)
(2,630,659) (1,273,808) 1,360,600 (2,543,867)
1,936,209,441 1,054,449,476 (583,848,868) 2,406,810,049
Depreciable capital assets
Buildings 73,259,583 1,909,377 - 75,168,960
Infrastructure 11,407,606,126 602,545,831 (137,843,848) 11,872,308,109
Machinery and equipment 440,378,307 71,094,906 (45,307,631) 466,165,582
11,921,244,016 675,550,114 (183,151,479) 12,413,642,651
Less accumulated depreciation
Buildings (46,636,156) (1,554,221) - (48,190,377)
Infrastructure (4,034,776,989) (460,154,780) 137,843,848 (4,357,087,921)
Machinery and equipment (264,243,059) (31,654,504) 45,243,862 (250,653,701)
(4,345,656,204) (493,363,505) 183,087,710 (4,655,931,999)
Total depreciable assets, net 7,575,587,812 182,186,609 (63,769) 7,757,710,652
Total capital assets, net $ 9,511,797,253 $ 1,236,636,085 $ (583,912,637) $ 10,164,520,701
Total nondepreciable capital assets
Total accumulated Amortization
Total nondepreciable capital assets net.
Total depreciable capital assets
Total accumulated depreciation
Illinois Department of Transportation $ 101,697,014

THE ILLINOIS STATE TOLL HIGHWAY AUTHORITYA Component Unit of the State of Illinois
Notes to the Financial StatementsFor the Year Ended December 31, 2020
30 (Continued)
(8) Revenue Bonds Payable
Changes in revenue bonds payable for the year ended December 31, 2020 are as follows:
*The January 1, 2020 balances are before any payments of principal due on January 1, 2020.
Balance at Balance at Due within
Jan 1, 2020* Additions Deletions Dec 31, 2020 one year
2009 Series A $ 400,000,000 $ - $ - $ 400,000,000 $ -
2009 Series B 280,000,000 - - 280,000,000 -
2013 Series A 500,000,000 - - 500,000,000 -
2014 Series A 290,850,000 - (92,265,000) 198,585,000 96,870,000
2014 Series B 500,000,000 - - 500,000,000 -
2014 Series C 400,000,000 - - 400,000,000 -
2014 Series D 243,345,000 - (19,870,000) 223,475,000 25,805,000
2015 Series A 400,000,000 - - 400,000,000 -
2015 Series B 400,000,000 - - 400,000,000 -
2016 Series A 333,060,000 - - 333,060,000 -
2016 Series B 300,000,000 - - 300,000,000 -
2017 Series A 300,000,000 - - 300,000,000 -
2018 Series A 515,250,000 - (17,125,000) 498,125,000 13,830,000
2019 Series A 300,000,000 - - 300,000,000 -
2019 Series B 225,245,000 - - 225,245,000 -
2019 Series C 697,870,000 - - 697,870,000 -
2020 Series A - 500,000,000 - 500,000,000 -
Totals $ 6,085,620,000 $ 500,000,000 $ (129,260,000) $ 6,456,360,000 $ 136,505,000
Current portion of revenue
bonds payable (129,260,000) (136,505,000) 129,260,000 (136,505,000)
Unamortized bond
premium 756,578,755 144,942,984 (47,354,365) 854,167,374
Revenue bonds payable net of
current portion, plus unamor-
tized bond premium $ 6,712,938,755 $ 508,437,984 $ (47,354,365) $ 7,174,022,374

THE ILLINOIS STATE TOLL HIGHWAY AUTHORITYA Component Unit of the State of Illinois
Notes to the Financial StatementsFor the Year Ended December 31, 2020
31 (Continued)
(a) Build America Bonds
The American Recovery and Reinvestment Act of 2009 authorized the Tollway to issue taxable bonds known as “Build America Bonds” to finance capital expenditures for which it could issue tax-exempt bonds and to elect to receive a subsidy payment from the federal government equal to 35% of the amount of each interest payment on such taxable bonds. The receipt of such subsidy payments by the Tollway is subject to certain requirements, including the filing of a form with the Internal Revenue Service prior to each interest payment date. The subsidy payments are not full faith and credit obligations of the United States of America. As a result of the impact of sequestration, the federal government reduced the amount of the subsidy payments by: 8.7% for subsidies received between March 2013 and September 2013; 7.2% for subsidies received between October 2013 and September 2014; 7.3% for subsidies received between October 2014 and September 2015; 6.8% for subsidies received between October 2015 and September 2016; 6.9% for subsidies received between October 2016 and September 2017; 6.6% for subsidies received between October 2017 and September 2018; 6.2% for subsidies received between October 2018 and September 2019; 5.9% for subsidies received between October 2019 and September 2020; and 5.7% for subsidies received between October 2020 and September 2021 (see Note 21 – Subsequent Events). The Series 2009A Bonds and Series 2009B Bonds are taxable Build America Bonds; all other Tollway bonds are tax-exempt bonds.
(b) Series 2009A Bonds
On May 21, 2009, the Tollway issued $500,000,000 of Toll Highway Senior Priority Revenue Bonds, Taxable 2009 Series A (Build America Bonds – Direct Payment). The Tollway made an irrevocable election to designate the bonds as Build America Bonds pursuant to the provisions of Section 54AA(g) of the Internal Revenue Code of 1986. The Tollway covenanted to apply Build America Bonds subsidy payments to the payment of debt service. This issuance was the fifth bond sale utilized to finance capital projects in the Congestion-Relief Program. The bonds also financed a deposit to the debt reserve account and costs of issuance. The bonds were sold as two term bonds, $100,000,000 maturing on January 1, 2024 and $400,000,000 maturing on January 1, 2034. The term bond maturing January 1, 2024, then-outstanding in an amount of $78,060,000, was refunded and redeemed, at a redemption price of 100% of the principal amount plus accrued interest, in connection with the issuance of the Tollway’s Series 2018A Bonds on January 10, 2019. The bonds maturing January 1, 2034 bear an interest rate of 6.184%, were sold at a price of 100% of the par amount of the bonds, and are subject to optional redemption at a redemption price equal to the greater of: (i) 100% of the principal amount of the bonds to be redeemed; and (ii) the sum of the present value of the remaining scheduled payments of principal and interest to the maturity date of the bonds to be redeemed, discounted to the date on which the bonds are to be redeemed on a semi-annual basis at the yield to maturity as of such redemption date of the U.S. Treasury security with a constant maturity most nearly equal to the period from the redemption date to the maturity date of the bonds to be redeemed, plus 30 basis points, plus, in each case, accrued interest. The bonds have not been insured or otherwise credit enhanced by the Tollway.
(c) Series 2009B Bonds
On December 8, 2009, the Tollway issued $280,000,000 of Toll Highway Senior Priority Revenue Bonds, Taxable 2009 Series B (Build America Bonds – Direct Payment). The Tollway made an irrevocable election to designate the bonds as Build America Bonds pursuant to the provisions of Section 54AA(g) of the Internal Revenue Code of 1986. The Tollway covenanted
THE ILLINOIS STATE TOLL HIGHWAY AUTHORITYA Component Unit of the State of Illinois
Notes to the Financial StatementsFor the Year Ended December 31, 2020
32 (Continued)
to apply Build America Bonds subsidy payments to the payment of debt service. This issuance was the sixth bond sale utilized to finance capital projects in the Congestion-Relief Program. The bonds also financed a deposit to the debt reserve account and costs of issuance. In connection with the issuance of the bonds, the Tollway deposited $12,000,000 funds on hand into the debt service account to pay the bond interest due on June 1, 2010 and a portion of the bond interest due on December 1, 2010. The bonds mature on December 1, 2034. The bonds bear an interest rate of 5.851% and were sold at a price of 100% of the par amount of the bonds. The bonds are subject to optional redemption at a redemption price equal to the greater of: (i) 100% of the principal amount of the bonds to be redeemed; and (ii) the sum of the present value of the remaining scheduled payments of principal and interest to the maturity date of the bonds to be redeemed, discounted to the date on which the bonds are to be redeemed on a semi-annual basis at the yield to maturity as of such redemption date of the U.S. Treasury security with a constant maturity most nearly equal to the period from the redemption date to the maturity date of the bonds to be redeemed, plus 25 basis points, plus, in each case, accrued interest. The bonds have not been insured or otherwise credit enhanced by the Tollway.
(d) Series 2013A Bonds
On May 16, 2013, the Tollway issued $500,000,000 of Toll Highway Senior Revenue Bonds, 2013 Series A. This issuance was the first bond sale utilized to finance capital projects in the “Move Illinois” Program. The bonds also financed a deposit to the debt reserve account and costs of issuance. The bonds were sold as serial bonds maturing on January 1 of each of the years 2027 through 2035 and a term bond maturing January 1, 2038. All bonds were sold bearing a 5.0% interest rate. The bonds were sold at yields which produced an original issue premium of $63,601,290. The bonds are subject to optional redemption on or after January 1, 2023, at a redemption price of 100% of the principal amount plus accrued interest. The term bond maturing January 1, 2038 is subject to sinking fund redemption prior to maturity. The bonds have not been insured or otherwise credit enhanced by the Tollway.
(e) Series 2014A Bonds
On February 26, 2014, the Tollway issued $378,720,000 of Toll Highway Senior Revenue Bonds, 2014 Series A (Refunding). The bonds advance refunded $436,545,000 of Toll Highway Senior Priority Revenue Bonds, 2005 Series A. The bonds also financed costs of issuance. The bonds were sold as serial bonds maturing on December 1 of each of the years 2019 through 2022. The bonds were sold bearing interest rates ranging from 4.5% - 5.0%. The bonds were sold at yields which produced an original issue premium of $66,772,076. The bonds are not subject to optional redemption. The bonds have not been insured or otherwise credit enhanced by the Tollway.
The purpose of the refunding was to reduce debt service. The aggregate difference in debt service between the refunding debt, if outstanding through final maturity, and the refunded debt, had it remained outstanding through final maturity, net of Tollway funds on hand that were applied to the refunding transaction, was $55.7 million. The present value of such savings was estimated at $44.1 million at the time of the transaction’s closing.
(f) Series 2014B Bonds
On June 4, 2014, the Tollway issued $500,000,000 of Toll Highway Senior Revenue Bonds, 2014 Series B. This issuance was the second bond sale utilized to finance capital projects in the “Move Illinois” Program. The bonds also financed a deposit to the debt reserve account and costs of issuance. The bonds were sold as serial bonds maturing on January 1 of each of the years 2026 through 2039. All bonds were sold bearing a 5.0% interest rate. The bonds were

THE ILLINOIS STATE TOLL HIGHWAY AUTHORITYA Component Unit of the State of Illinois
Notes to the Financial StatementsFor the Year Ended December 31, 2020
33 (Continued)
sold at yields which produced an original issue premium of $48,929,739. The bonds are subject to optional redemption on or after January 1, 2024, at a redemption price of 100% of the principal amount plus accrued interest. The bonds have not been insured or otherwise credit enhanced by the Tollway.
(g) Series 2014C Bonds
On December 4, 2014, the Tollway issued $400,000,000 of Toll Highway Senior Revenue Bonds, 2014 Series C. This issuance was the third bond sale utilized to finance capital projects in the “Move Illinois” Program. The bonds also financed a deposit to the debt reserve account and costs of issuance. The bonds were sold as serial bonds maturing on January 1 of each of the years 2027 through 2039. All bonds were sold bearing a 5.0% interest rate. The bonds were sold at yields which produced an original issue premium of $53,737,539. The bonds are subject to optional redemption on or after January 1, 2025, at a redemption price of 100% of the principal amount plus accrued interest. The bonds have not been insured or otherwise credit enhanced by the Tollway.
(h) Series 2014D Bonds
On December 18, 2014, the Tollway issued $264,555,000 of Toll Highway Senior Revenue Bonds, 2014 Series D (Refunding). The bonds advance refunded $291,660,000 of Toll Highway Senior Priority Revenue Bonds, 2006 Series A-1. The bonds also financed costs of issuance. The bonds were sold as serial bonds maturing on January 1 of each of the years 2018 through 2025. All bonds were sold bearing a 5.0% interest rate. The bonds were sold at yields which produced an original issue premium of $49,884,988. The bonds are not subject to optional redemption. The bonds have not been insured or otherwise credit enhanced by the Tollway.
The purpose of the refunding was to reduce debt service. The aggregate difference in debt service between the refunding debt, if outstanding through final maturity, and the refunded debt, had it remained outstanding through final maturity, net of Tollway funds on hand that were applied to the refunding transaction, was $38.4 million. The present value of such savings was estimated at $33.0 million at the time of the transaction’s closing.
(i) Series 2015A Bonds
On July 30, 2015, the Tollway issued $400,000,000 of Toll Highway Senior Revenue Bonds, 2015 Series A. This issuance was the fourth bond sale utilized to finance capital projects in the“Move Illinois” Program. The bonds also financed a deposit to the debt reserve account and costs of issuance. The bonds were sold as serial bonds maturing on January 1 of each of the years 2027 through 2037 and a term bond maturing January 1, 2040. All bonds were sold bearing a 5.0% interest rate. The bonds were sold at yields which produced an original issue premium of $39,445,649. The bonds are subject to optional redemption on or after July 1, 2025 at a redemption price of 100% of the principal amount plus accrued interest. The term bond maturing January 1, 2040 is subject to sinking fund redemption prior to maturity. The bonds have not been insured or otherwise credit enhanced by the Tollway.
(j) Series 2015B Bonds
On December 17, 2015, the Tollway issued $400,000,000 of Toll Highway Senior Revenue Bonds, 2015 Series B. This issuance was the fifth bond sale utilized to finance capital projects in the” Move Illinois” Program. The bonds also financed a deposit to the debt reserve account and costs of issuance. The bonds were sold as serial bonds maturing on January 1 of each of the years 2027 through 2037 and a term bond maturing January 1, 2040. All bonds were sold

THE ILLINOIS STATE TOLL HIGHWAY AUTHORITYA Component Unit of the State of Illinois
Notes to the Financial StatementsFor the Year Ended December 31, 2020
34 (Continued)
bearing a 5.0% interest rate. The bonds were sold at yields which produced an original issue premium of $47,418,612. The bonds are subject to optional redemption on or after January 1, 2026 at a redemption price of 100% of the principal amount plus accrued interest. The term bond maturing January 1, 2040 is subject to sinking fund redemption prior to maturity. The bonds have not been insured or otherwise credit enhanced by the Tollway.
(k) Series 2016A Bonds
On January 14, 2016, the Tollway issued $333,060,000 of Toll Highway Senior Revenue Bonds, 2016 Series A (Refunding). The bonds advance refunded $350,000,000 of Toll Highway Senior Priority Revenue Bonds, 2008 Series B. The bonds also financed costs of issuance. The bonds were sold as serial bonds maturing on December 1, 2031 bearing interest rates of 4.00% and 5.00% and December 1, 2032 bearing an interest rate of 5.00%. The bonds were sold at yields which produced an original issue premium of $49,635,106. The bonds are subject to optional redemption on or after January 1, 2026, at a redemption price of 100% of the principal amount plus accrued interest. The bonds have not been insured or otherwise credit enhanced by the Tollway.
The purpose of the refunding was to reduce debt service. The aggregate difference in debt service between the refunding debt, if outstanding through final maturity, and the refunded debt, had it remained outstanding through final maturity, net of Tollway funds on hand that were applied to the refunding transaction, was $70.0 million. The present value of such savings was estimated at $50.9 million at the time of the transaction’s closing.
(l) Series 2016B Bonds
On June 16, 2016, the Tollway issued $300,000,000 of Toll Highway Senior Revenue Bonds, 2016 Series B. This issuance was the sixth bond sale utilized to finance capital projects in the “Move Illinois” Program. The bonds also financed a deposit to the debt reserve account and costs of issuance. The bonds were sold as serial bonds maturing on January 1 of each of the years 2027 through 2038 and a term bond maturing January 1, 2041. All bonds were sold bearing a 5.0% interest rate. The bonds were sold at yields which produced an original issue premium of $59,573,902. The bonds are subject to optional redemption on or after July 1, 2026, at a redemption price of 100% of the principal amount plus accrued interest. The term bond maturing January 1, 2041 is subject to sinking fund redemption prior to maturity. The bonds have not been insured or otherwise credit enhanced by the Tollway.
(m)Series 2017A Bonds
On December 6, 2017, the Tollway issued $300,000,000 of Toll Highway Senior Revenue Bonds, 2017 Series A. This issuance was the seventh bond sale utilized to finance capital projects in the “Move Illinois” Program. The bonds also financed a deposit to the debt reserve account and costs of issuance. The bonds were sold as serial bonds maturing on January 1 of each of the years 2028 through 2039 and a term bond maturing January 1, 2042. All bonds were sold bearing a 5.0% interest rate. The bonds were sold at yields which produced an original issue premium of $50,071,706. The bonds are subject to optional redemption on or after January 1, 2028, at a redemption price of 100% of the principal amount plus accrued interest. The term bond maturing January 1, 2042 is subject to sinking fund redemption prior to maturity. The bonds have not been insured or otherwise credit enhanced by the Tollway.

THE ILLINOIS STATE TOLL HIGHWAY AUTHORITYA Component Unit of the State of Illinois
Notes to the Financial StatementsFor the Year Ended December 31, 2020
35 (Continued)
(n) Series 2018A Bonds
On January 10, 2019, the Tollway issued $515,250,000 of Toll Highway Senior Revenue Bonds, 2018 Series A (Refunding). The bonds refunded $262,500,000 of Toll Highway Variable Rate Senior Priority Revenue Bonds, 2007 Series A-2, $189,600,000 of Toll Highway Variable Rate Senior Refunding Revenue Bonds, 2008 Series A-1a, and $78,060,000 2009 Series A Bonds scheduled to mature on January 1, 2024. The bonds also financed costs of issuance and costs of terminating two variable-to-fixed interest rate exchange agreements (swaps) associated with the refunded bonds. The bonds were sold as serial bonds maturing on January 1 of each of the years 2020 through 2031 and were sold bearing an interest rate of 5.00%. The bonds were sold at yields which produced an original issue premium of $79,372,651. The bonds are subject to optional redemption on or after January 1, 2029, at a redemption price of 100% of the principal amount plus accrued interest. The bonds have not been insured or otherwise credit enhanced by the Tollway.
(o) Series 2019A Bonds
On July 11, 2019, the Tollway issued $300,000,000 of Toll Highway Senior Revenue Bonds, 2019 Series A. This issuance was the eighth bond sale utilized to finance capital projects in the “Move Illinois” Program. The bonds also financed a deposit to the debt reserve account and costs of issuance. The bonds were sold as serial bonds maturing on January 1 of each of the years 2036 through 2041 and two term bonds maturing January 1, 2044. Bonds were sold bearing interest rates ranging from 3.0% to 5.0%. The bonds were sold at yields which produced an original issue premium of $47,215,820. The bonds are subject to optional redemption on or after July 1, 2029, at a redemption price of 100% of the principal amount plus accrued interest. The term bonds maturing January 1, 2044 are each subject to sinking fund redemption prior to maturity. The bonds have not been insured or otherwise credit enhanced by the Tollway.
(p) Series 2019B Bonds
On November 14, 2019, the Tollway issued $225,245,000 of Toll Highway Senior Revenue Bonds, 2019 Series B (Refunding). The bonds refunded $276,560,000 of Toll Highway Senior Refunding Revenue Bonds, 2010 Series A-1. The bonds also financed costs of issuance. The bonds were sold as serial bonds maturing on January 1 of each of the years 2025 through 2031 and were sold bearing an interest rate of 5.00%. The bonds were sold at yields which produced an original issue premium of $51,916,736. The bonds are subject to optional redemption on or after January 1, 2030, at a redemption price of 100% of the principal amount plus accrued interest. The bonds have not been insured or otherwise credit enhanced by the Tollway.
The purpose of the refunding was to reduce debt service. The aggregate difference in debt service between the refunding debt, if outstanding through final maturity, and the refunded debt, had it remained outstanding through final maturity, net of Tollway funds on hand that were applied to the refunding transaction, was $69.2 million. The present value of such savings was estimated at $62.2 million at the time of the transaction’s closing.
(q) Series 2019C Bonds
On December 23, 2019, the Tollway issued $697,870,000 of Toll Highway Senior Revenue Bonds, 2019 Series C (Refunding). The bonds refunded $350,000,000 of Toll Highway VariableRate Senior Priority Revenue Bonds, 2007 Series A-1, $87,500,000 of Toll Highway Variable Rate Senior Priority Revenue Bonds, 2007 Series A-2d, $189,600,000 of Toll Highway Variable Rate Senior Refunding Revenue Bonds, 2008 Series A-1b, and $94,825,000 of Toll Highway Variable Rate Senior Refunding Revenue Bonds, 2008 Series A-2. The bonds also financed

THE ILLINOIS STATE TOLL HIGHWAY AUTHORITYA Component Unit of the State of Illinois
Notes to the Financial StatementsFor the Year Ended December 31, 2020
36 (Continued)
costs of issuance and costs of terminating five variable-to-fixed interest rate exchange agreements (swaps) associated with the refunded bonds. The bonds were sold as serial bonds maturing on January 1 of each of the years 2022 through 2031 and were sold bearing an interest rate of 5.00%. The bonds were sold at yields which produced an original issue premium of $166,652,297. The bonds are subject to optional redemption on or after January 1, 2030, at a redemption price of 100% of the principal amount plus accrued interest. The purpose of the refunding was to reduce risks related to variable interest rates and third-party agreements. The bonds have not been insured or otherwise credit enhanced by the Tollway.
(r) Series 2020A Bonds
On December 17, 2020, the Tollway issued $500,000,000 of Toll Highway Senior Revenue Bonds, 2020 Series A. This issuance was the ninth bond sale utilized to finance capital projects in the “Move Illinois” Program. The bonds also financed a deposit to the debt reserve account and costs of issuance. The bonds were sold as serial bonds maturing on January 1 of each of the years 2036 through 2041 and a term bond maturing January 1, 2045. Bonds were sold bearing an interest rate of 5.0%. The bonds were sold at yields which produced an original issue premium of $144,942,984. The bonds are subject to optional redemption on or after January 1, 2031, at a redemption price of 100% of the principal amount plus accrued interest. The term bond maturing January 1, 2045 is subject to sinking fund redemption prior to maturity. The bonds have not been insured or otherwise credit enhanced by the Tollway.
(s) Defeased Bonds
As of December 31, 2020, there were no defeased Tollway revenue bonds outstanding.

THE ILLINOIS STATE TOLL HIGHWAY AUTHORITYA Component Unit of the State of Illinois
Notes to the Financial StatementsFor the Year Ended December 31, 2020
37 (Continued)
(t) All Series
Details of outstanding revenue bonds as of December 31, 2020 are as follows:
Accrued interest payable as of the year ended December 31, 2020, was $134,970,081.

THE ILLINOIS STATE TOLL HIGHWAY AUTHORITYA Component Unit of the State of Illinois
Notes to the Financial StatementsFor the Year Ended December 31, 2020
38 (Continued)
The annual requirements to retire principal and pay interest on all bonds outstanding at December 31, 2020, all of which are fixed interest rate bonds, are as follows.
(u) Capitalized Interest
In 2018, the Tollway implemented GASB Statement No. 89 – Accounting for Interest Cost Incurred Before the End of a Construction Period which requires that all interest costs be recognized as an expense in the current period. Prior to implementation, a portion of interest expense attributable to construction was required to be capitalized. GASB Statement No. 89 changed this requirement prospectively. As of December 31, 2020, the Tollway continues to amortize previously capitalized interest with an unamortized balance of $119.4 million.
(v) Trust Indenture Agreement
All Tollway bonds outstanding as of December 31, 2020, were issued under the Amended and Restated Trust Indenture effective as of March 31, 1999, amending and restating a Trust Indenture dated as of December 1, 1985 (as amended, restated, and supplemented, the “Trust
Year ending Total
December 31 Principal Interest Debt Service
2021 $ 136,505,000 $ 315,846,897 $ 452,351,897
2022 145,415,000 320,447,800 465,862,800
2023 45,925,000 313,121,425 359,046,425
2024 155,025,000 308,097,675 463,122,675
2025 162,715,000 300,154,175 462,869,175
2026 187,530,000 291,398,050 478,928,050
2027 231,265,000 280,928,175 512,193,175
2028 242,700,000 269,079,050 511,779,050
2029 255,135,000 256,633,175 511,768,175
2030 268,090,000 243,552,550 511,642,550
2031 444,185,000 229,813,675 673,998,675
2032 310,030,000 211,272,048 521,302,048
2033 147,435,000 194,763,900 342,198,900
2034 614,505,000 180,745,402 795,250,402
2035 74,300,000 152,587,500 226,887,500
2036 374,425,000 141,369,375 515,794,375
2037 393,175,000 122,199,375 515,374,375
2038 412,800,000 102,110,000 514,910,000
2039 429,300,000 81,187,500 510,487,500
2040 434,800,000 59,675,000 494,475,000
2041 340,100,000 40,302,500 380,402,500
2042 229,000,000 26,217,500 255,217,500
2043 164,000,000 16,652,500 180,652,500
2044 164,000,000 8,685,000 172,685,0002045 94,000,000 2,350,000 96,350,000Total $ 6,456,360,000 $ 4,469,190,248 $ 10,925,550,248

THE ILLINOIS STATE TOLL HIGHWAY AUTHORITYA Component Unit of the State of Illinois
Notes to the Financial StatementsFor the Year Ended December 31, 2020
39 (Continued)
Indenture”) from the Tollway to The Bank Of New York Mellon Trust Company, N.A., as successor Trustee (the “Trustee”). The Trustee serves as fiduciary for bondholders. The Trust Indenture establishes the conditions under which the Tollway may issue bonds and the security to be pledged to bondholders. The Trust Indenture establishes two funds: (i) a construction fund to account for the spending of Tollway bond proceeds; and (ii) a revenue fund to account for the deposit of Tollway revenues. The construction fund is divided into different accounts for each project under the Trust Indenture. The revenue fund is divided into six different accounts (some of which are further divided into sub-accounts) which establish an order of funding priority through which Tollway revenues flow. Revenues first fund the maintenance and operation account, which is the only account in the revenue fund in which bondholders do not have a security interest. Remaining revenues fund the other accounts of the revenue fund in the following order of priority: the debt service account, the debt reserve account, the renewal and replacement account, the improvement account, and the system reserve account. (The Trust Indenture also allows for the creation of junior lien bond accounts; to date the Tollway has never issued junior lien bonds.) All accounts of the construction fund and the debt service account and debt reserve account of the revenue fund are held by the Trustee. The Trustee-held funds classified as net position restricted under the Trust Indenture is included in Note 10.
(w) Arbitrage Rebate
In the 1980s, Congress determined that arbitrage rebate rules were needed to curb issuance of investment motivated tax-exempt bonds. These rules were designed to create additional safeguards against issuers obtaining an arbitrage benefit by issuing bonds either prematurely or in excess of actual need in order to benefit from an expected spread between tax-exempt borrowing cost and return on investment of bond proceeds. As a result, under certain conditions gain from arbitrage must be rebated to the United States Government. The Tollway determined that, as of December 31, 2020, no arbitrage rebate liability had accrued.

THE ILLINOIS STATE TOLL HIGHWAY AUTHORITYA Component Unit of the State of Illinois
Notes to the Financial StatementsFor the Year Ended December 31, 2020
40 (Continued)
(9) Unearned Revenue
The Tollway’s communications network includes a fiber optic system. Excess capacity on the fiber optic lines is leased to other organizations in order to offset the cost of the system. Since 2000, when the system was initially upgraded, the Tollway has entered into fiber optic system lease agreements with terms of twenty years. The Tollway has collected a cumulative total of $55,619,310in upfront payments; the related revenue will be earned over the lease terms.
The total unearned revenue balance for the fiber optic system was $56,031,900 at December 31, 2020, and the amount earned was $31,993,832 through December 31, 2020.
The Tollway also invoices annual fiber optic maintenance fees. At December 31, 2020, some of these fees had been paid in advance. These have also been recorded as unearned revenue.
On October 1, 2013, the Tollway entered into a 3-year agreement with Travelers Marketing, LLC, for sponsorship of the Tollway’s Highway Emergency Lane Patrol (H.E.L.P.) trucks by its advertising sponsor/partner, State Farm Insurance. In exchange for a cumulative sponsorship fee of $4,958,250, Travelers has the exclusive right to place State Farm Insurance branding on Tollway H.E.L.P. trucks and H.E.L.P. truck operator uniforms. On October 1, 2016, this contract was extended for an additional 3 years and on October 1, 2019, a three-month extension was executed. An additional 3-year agreement was executed in January 2020. The unearned portion of the sponsorship fee paid by Travelers in 2020 has been recorded as unearned revenue.
This Space is Intentionally Left Blank

THE ILLINOIS STATE TOLL HIGHWAY AUTHORITYA Component Unit of the State of Illinois
Notes to the Financial StatementsFor the Year Ended December 31, 2020
41 (Continued)
A summary of changes in unearned revenue for the year ended December 31, 2020, is as follows:
(10) Restricted Net Position
As of December 31, 2020, the Tollway reported the following restricted net position:
Balance at Current Balance at Current
January 1 Year Activity December 31 Portion
Unearned revenue
Fiber optics and co-location $ 43,603,130 $ 12,428,770 $ 56,031,900 $ 2,337,109
(30,069,313) (1,924,519) (31,993,832) (1,924,519)
13,533,817 10,504,251 24,038,068 412,590
928,480 (705,997) 222,483 222,483
- - - -
928,480 (705,997) 222,483 222,483
H.E.L.P. Truck advertising revenue 4,357,250 601,000 4,958,250 25,042
Accumulated amortization (4,332,208) (601,000) (4,933,208) -
25,042 - 25,042 25,042
Unearned revenue 48,888,860 12,323,773 61,212,633 2,584,634
(34,401,521) (2,525,519) (36,927,040) (1,924,519)
Net unearned revenue $ 14,487,339 $ 9,798,254 $ 24,285,593 $ 660,115
Accumulated amortization
Accumulated amortization
Intergovernmental agreements
Accumulated amortization
Totals
Description December 31, 2020
Net position restricted under Trust Indenture Agreement $ 474,330,449
Restricted for pension benefit obligation 4,281
$ 474,334,730

THE ILLINOIS STATE TOLL HIGHWAY AUTHORITYA Component Unit of the State of Illinois
Notes to the Financial StatementsFor the Year Ended December 31, 2020
42 (Continued)
(11) State Employees’ Retirement System
Plan Description
Substantially all of the Tollway’s full-time employees, as well as the State Police assigned to the Tollway who are not eligible for any other state-sponsored retirement plan, participate in the Illinois State Employees’ Retirement System (SERS), which is a component unit of the State of Illinois reporting entity. SERS is a single-employer defined benefit public employee retirement system in which state employees participate, except those covered by the State Universities, Teachers, General Assembly and Judges’ Retirement Systems. SERS is governed by a 13 member Board of Trustees, consisting of the Illinois Comptroller, six trustees appointed by the Governor with the advice and consent of the Illinois Senate, four trustees elected by SERS members, and two trustees appointed by SERS retirees. SERS issues a separate annual comprehensive financial report (ACFR). The financial position and results of operations for SERS for fiscal year 2020 are also included in the state’s ACFR for the year ended June 30, 2020.
As of June 30, 2020, the breakdown of employees participating or benefitting from SERS, as a whole, is as follows:
Active employees 62,621Retirees and beneficiaries currently receiving benefits 75,355
Inactive employees entitled to but not yet receiving benefits 3,774
A summary of SERS’ benefit provisions, changes in benefit provisions, employee eligibility requirements including eligibility for vesting, and the authority under which benefit provisions are established are included as an integral part of the SERS’ ACFR. Also included therein is a discussion of employer and employee obligations to contribute and the authority under which those obligations are established.
To obtain a copy of SERS’ ACFR, write, call, or email:
State Employees’ Retirement System2101 S. Veterans ParkwaySpringfield, Illinois 62794-9255(217) [email protected]

THE ILLINOIS STATE TOLL HIGHWAY AUTHORITYA Component Unit of the State of Illinois
Notes to the Financial StatementsFor the Year Ended December 31, 2020
43 (Continued)
Benefit Provisions
SERS provides retirement benefits based on the member’s final average compensation and the number of years of credited service that have been established. The retirement benefit formula available to general State employees is 1.67% for each year of covered service and 2.2% for each year of noncovered service. (Covered service is defined as service time where the employee contributed to Social Security as well as SERS). Alternative formula employees have a formula of 2.5% for covered service and 3.0% for noncovered service. The maximum retirement annuity payable is 75% of final average compensation as calculated under the regular formula. The maximum retirement annuity payable is 80% of final average compensation as calculated under the alternative formula.
The minimum monthly retirement annuity payable is $15 for each year of covered employment and $25 for each year of noncovered employment.
This Space is Intentionally Left Blank
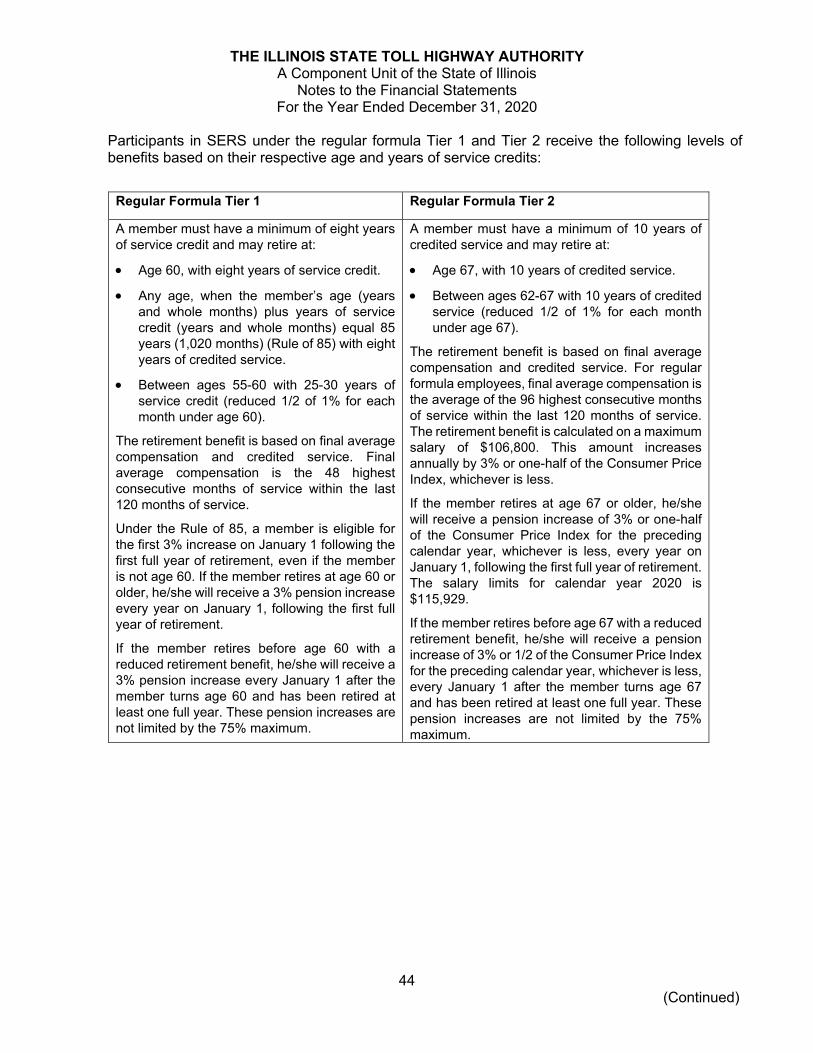
THE ILLINOIS STATE TOLL HIGHWAY AUTHORITYA Component Unit of the State of Illinois
Notes to the Financial StatementsFor the Year Ended December 31, 2020
44 (Continued)
Participants in SERS under the regular formula Tier 1 and Tier 2 receive the following levels of benefits based on their respective age and years of service credits:
Regular Formula Tier 1 Regular Formula Tier 2
A member must have a minimum of eight years of service credit and may retire at:
Age 60, with eight years of service credit.
Any age, when the member’s age (years and whole months) plus years of service credit (years and whole months) equal 85 years (1,020 months) (Rule of 85) with eight years of credited service.
Between ages 55-60 with 25-30 years of service credit (reduced 1/2 of 1% for each month under age 60).
The retirement benefit is based on final average compensation and credited service. Final average compensation is the 48 highest consecutive months of service within the last 120 months of service.
Under the Rule of 85, a member is eligible for the first 3% increase on January 1 following the first full year of retirement, even if the member is not age 60. If the member retires at age 60 or older, he/she will receive a 3% pension increase every year on January 1, following the first full year of retirement.
If the member retires before age 60 with a reduced retirement benefit, he/she will receive a 3% pension increase every January 1 after the member turns age 60 and has been retired at least one full year. These pension increases are not limited by the 75% maximum.
A member must have a minimum of 10 years of credited service and may retire at:
Age 67, with 10 years of credited service.
Between ages 62-67 with 10 years of credited service (reduced 1/2 of 1% for each month under age 67).
The retirement benefit is based on final average compensation and credited service. For regular formula employees, final average compensation is the average of the 96 highest consecutive months of service within the last 120 months of service. The retirement benefit is calculated on a maximum salary of $106,800. This amount increases annually by 3% or one-half of the Consumer Price Index, whichever is less.
If the member retires at age 67 or older, he/she will receive a pension increase of 3% or one-half of the Consumer Price Index for the preceding calendar year, whichever is less, every year on January 1, following the first full year of retirement. The salary limits for calendar year 2020 is $115,929.
If the member retires before age 67 with a reduced retirement benefit, he/she will receive a pension increase of 3% or 1/2 of the Consumer Price Index for the preceding calendar year, whichever is less, every January 1 after the member turns age 67 and has been retired at least one full year. These pension increases are not limited by the 75% maximum.

THE ILLINOIS STATE TOLL HIGHWAY AUTHORITYA Component Unit of the State of Illinois
Notes to the Financial StatementsFor the Year Ended December 31, 2020
45 (Continued)
Additionally, SERS provides an alternative retirement formula for State employees in high-risk jobs, such as State policemen, fire fighters, and security employees. Employees qualifying for benefits under the alternative formula may retire at an earlier age depending on membership in Tier 1 or Tier 2. The retirement formula is 2.5% for each year of covered service and 3.0% for each year of noncovered service.
SERS also provides occupational and nonoccupational (including temporary) disability benefits. To be eligible for nonoccupational (including temporary) disability benefits, an employee must have at least eighteen months of credited service. The nonoccupational (including temporary) disability benefit is equal to 50% of the average rate of compensation of the employee on the date of removal from the payroll. Occupational disability benefits are provided when the member becomes disabled as a direct result of injuries or diseases arising out of and in the course of State employment. The monthly benefit is equal to 75% of the average rate of compensation on the date of removal from the payroll. This benefit amount is reduced by workers’ compensation or payments under the Occupational Diseases Act.
Occupational and nonoccupational death benefits are also available through SERS. Certain nonoccupational death benefits vest after eighteen months of credited service. Occupational death benefits are provided from the date of employment.
Contributions
Contribution requirements of active employees and the State are established in accordance with Chapter 40, section 5/14-133 of the Illinois Compiled Statutes (ILCS). Member contributions are based on fixed percentages of covered payroll ranging between 4% and 12.50%. Employee contributions are fully refundable, without interest, upon withdrawal from State employment. Tier 1 members contribute based on total annual compensation. Tier 2 members contribute based on an annual compensation rate not to exceed $115,929 for 2020 with limitations for future years increased by the lessor of 3% or one-half of the annual percentage increase in the Consumer Price Index.
The State is required to make payment for the required departmental employer contributions, all allowances, annuities, any benefits granted under Chapter 40, Article 5/14 of the ILCS and all administrative expenses of SERS to the extent specified in the ILCS. State law provides that the employer contribution rate be determined based upon the results of each annual actuarial valuation.
For fiscal year 2020, the required employer contributions were computed in accordance with the State’s funding plan. This funding legislation provides for a systematic 50-year funding plan with an ultimate goal to achieve 90% funding of the plan’s liabilities. In addition, the funding plan provided for a 15-year phase-in period to allow the State to adapt to the increased financial commitment. Since the 15-year phase-in period ended June 30, 2010, the State’s contribution will remain at a level percentage of payroll, recomputed annually, for the next 35 years until the 90% funded level is achieved. For state fiscal year 2020, the employer contribution rate was 54.290%. For state fiscal year 2021, the employer contribution rate is 54.831%. The Tollway’s contribution amount for calendar year 2020 was $61,919,610.
The Tollway has made all required contributions through December 31, 2020.

THE ILLINOIS STATE TOLL HIGHWAY AUTHORITYA Component Unit of the State of Illinois
Notes to the Financial StatementsFor the Year Ended December 31, 2020
46 (Continued)
Pension Liability, Deferred Outflows of Resources, Deferred Inflows of Resources, and Expense Related to Pensions
GASB Statement No. 68, as amended by GASB Statement No. 71, requires an allocation of net pension liability and pension expense and to recognize proportionate shares for the primary government and component units, including the Tollway.
At December 31, 2020, the Tollway reported a liability of $891,871,048 for its allocated share of the State’s net pension liability for SERS on the statement of net position. The net pension liability was measured as of June 30, 2020 (current year measurement date), and the total pension liability used to calculate the net pension liability was determined by an actuarial valuation as of that date. The Tollway’s portion of the net pension liability was based on the Tollway’s proportion of employer contributions relative to all employer contributions made to the plan during the year ended June 30, 2020. As of the current year measurement date of June 30, 2020, the Tollway’s proportion was 2.5578%, which was an increase of 0.0010% from its proportion of 2.5568% measured as of the prior year measurement date of June 30, 2019.
Change in the net pension liability allocated to the Tollway for the year ended December 31, 2020, is as follows:
For the year ended December 31, 2020, the Tollway recognized pension expense of $75.1 million. This expense is higher than the statutory actual contributions made by the Tollway, due to the implementation of GASB Statement No. 68.
At December 31, 2020, the Tollway reported deferred outflows and deferred inflows of resources related to pensions from the following sources:
The $31.6 million reported as deferred outflow of resources related to pensions resulting from Tollway contributions subsequent to the measurement date will be recognized as a reduction of the net pension liability in the year ending December 31, 2021.
Balance Balance Amounts due
January 1 Additions Deletions December 31 within one year
Net Pension Liability 853,819,076$ 96,850,032$ (58,798,060)$ 891,871,048$ $ -
Deferred Deferred
Outflows Inflows
of Resources of Resources
Difference between expected and actual experience $ 2,279,573 $ 3,500,323
Changes in assumptions 18,813,910 5,260,245
Net difference between projected and actual investment
earnings on pension plan investments 4,953,869 -
Changes in proportion and differences between Tollway
contributions and proportionate share of contributions 2,081,189 24,293,495
Tollway contributions subsequent to the measurement
date 31,613,391 -
$ 59,741,932 $ 33,054,063

THE ILLINOIS STATE TOLL HIGHWAY AUTHORITYA Component Unit of the State of Illinois
Notes to the Financial StatementsFor the Year Ended December 31, 2020
47 (Continued)
Other amounts reported as deferred outflows and deferred inflows of resources related to pensions will be recognized as pension expense as follows:
Actuarial Methods and Assumptions
The total pension liability was determined by an actuarial valuation as of June 30, 2020, using the following actuarial assumptions, applied to all periods included in the measurement:
Mortality: Pub-2010 General and Public Safety Healthy Retiree mortality tables, sex distinct, with rates projected to 2018 generational mortality improvement factors were updated to projection scale MP-2018.
Inflation: 2.25%
Investment Rate of Return: 6.75%, net of pension plan investment expense, including inflation.
Salary increases: Salary increase rates based on age related productivity and merit rates plus inflation.
Post-retirement benefit increases of 3.00%, compounded, for Tier 1 and the lesser of 3.00% or one-half of the annual increase in the Consumer Price Index for Tier 2.
Retirement Age: Experience-based table of rates specific to the type of eligibility condition. Table was last updated for the June 30, 2019, valuation pursuant to an experience study of the period July 1, 2015 to June 30, 2018.
Year Ending Amount
12/31/2021 $ (10,590,221)
12/31/2022 (1,937,061)
12/31/2023 3,185,516
12/31/2024 4,416,242
Total $ (4,925,524)

THE ILLINOIS STATE TOLL HIGHWAY AUTHORITYA Component Unit of the State of Illinois
Notes to the Financial StatementsFor the Year Ended December 31, 2020
48 (Continued)
The long-term expected real rate of return on pension plan investments was determined based on the simulated average 20-year annualized geometric return for each major asset class. These returns are combined to produce the long-term expected rate of return by weighting the expected future real rates of return by the target asset allocation percentage. For each major asset class that is included in the pension plan’s target asset allocation, calculated as of the measurement date of June 30, 2020, the 20-year simulated real rates of return are summarized in the following table:
Discount Rate
A discount rate of 6.35% was used to measure the total pension liability as of June 30, 2020. This single blended discount rate was based on the expected rate of return on pension plan investments of 6.75% and a municipal bond rate of 2.45%. The projection of cash flows used to determine this single discount rate assumed that plan member contributions will be made at the current contribution rate and that contributions will be made at rates equal to the difference between the statutory contributions and the member rate. Based on these assumptions, the pension plan’s fiduciary net position and future contributions were sufficient to finance the benefit payments through the year 2075 at June 30, 2020. As a result, the long-term expected rate of return on pension plan investments was applied to projected benefit payments through the year 2075, and the municipal bond rate was applied to all benefit payments after that date.
Target 20 Year Simulated
Allocation Rate of Return
U.S. Equity 23.0% 5.5%
Developed Foreign Equity 13.0% 5.9%
Emerging Market Equity 8.0% 7.8%
Private Equity 7.0% 7.5%
Intermediate Investment Grade Bonds 14.0% 1.1%
Long-Term Government Bonds 4.0% 1.1%
TIPS 4.0% 1.0%
High Yield and Bank Loans 5.0% 3.7%
Opportunistic Debt 8.0% 4.7%
Emerging Market Debt 2.0% 2.7%
Real Estate 10.0% 3.2%
Infrastructure 2.0% 3.9%
Total 100.0%
Asset Allocation
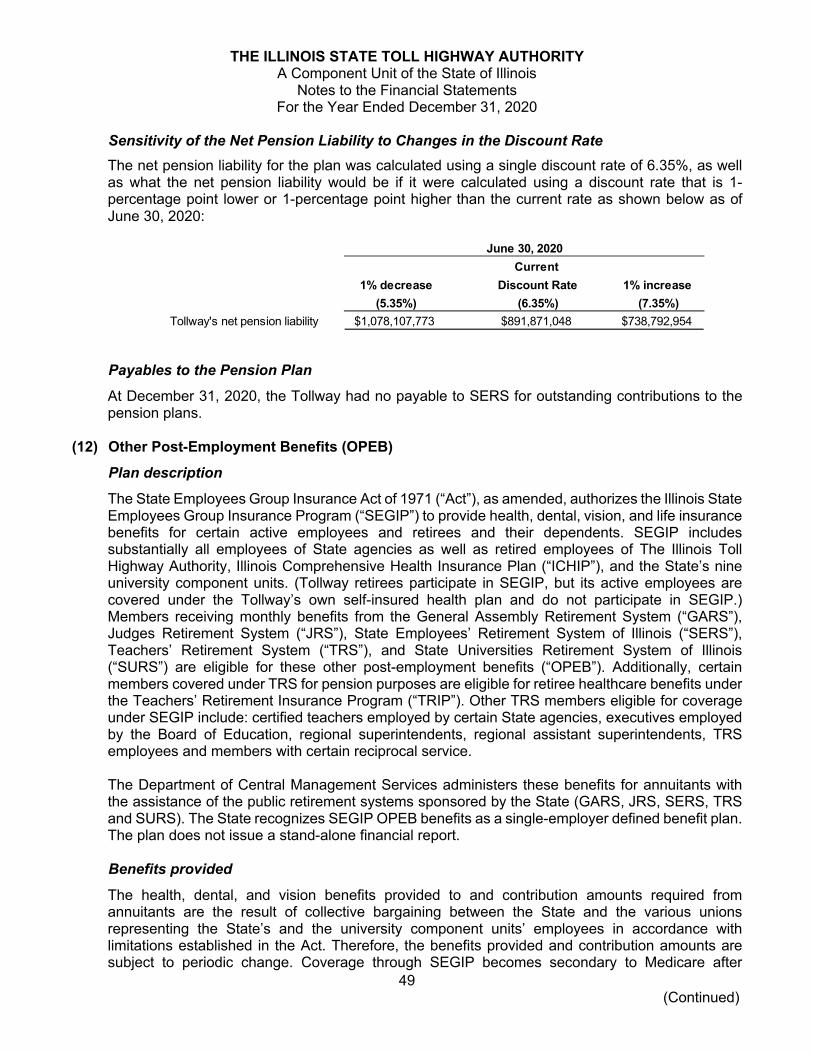
THE ILLINOIS STATE TOLL HIGHWAY AUTHORITYA Component Unit of the State of Illinois
Notes to the Financial StatementsFor the Year Ended December 31, 2020
49 (Continued)
Sensitivity of the Net Pension Liability to Changes in the Discount Rate
The net pension liability for the plan was calculated using a single discount rate of 6.35%, as well as what the net pension liability would be if it were calculated using a discount rate that is 1-percentage point lower or 1-percentage point higher than the current rate as shown below as of June 30, 2020:
Payables to the Pension Plan
At December 31, 2020, the Tollway had no payable to SERS for outstanding contributions to the pension plans.
(12) Other Post-Employment Benefits (OPEB)
Plan description
The State Employees Group Insurance Act of 1971 (“Act”), as amended, authorizes the Illinois State Employees Group Insurance Program (“SEGIP”) to provide health, dental, vision, and life insurance benefits for certain active employees and retirees and their dependents. SEGIP includes substantially all employees of State agencies as well as retired employees of The Illinois Toll Highway Authority, Illinois Comprehensive Health Insurance Plan (“ICHIP”), and the State’s nine university component units. (Tollway retirees participate in SEGIP, but its active employees are covered under the Tollway’s own self-insured health plan and do not participate in SEGIP.)Members receiving monthly benefits from the General Assembly Retirement System (“GARS”), Judges Retirement System (“JRS”), State Employees’ Retirement System of Illinois (“SERS”), Teachers’ Retirement System (“TRS”), and State Universities Retirement System of Illinois (“SURS”) are eligible for these other post-employment benefits (“OPEB”). Additionally, certain members covered under TRS for pension purposes are eligible for retiree healthcare benefits under the Teachers’ Retirement Insurance Program (“TRIP”). Other TRS members eligible for coverage under SEGIP include: certified teachers employed by certain State agencies, executives employed by the Board of Education, regional superintendents, regional assistant superintendents, TRS employees and members with certain reciprocal service.
The Department of Central Management Services administers these benefits for annuitants with the assistance of the public retirement systems sponsored by the State (GARS, JRS, SERS, TRS and SURS). The State recognizes SEGIP OPEB benefits as a single-employer defined benefit plan.The plan does not issue a stand-alone financial report.
Benefits provided
The health, dental, and vision benefits provided to and contribution amounts required from annuitants are the result of collective bargaining between the State and the various unions representing the State’s and the university component units’ employees in accordance with limitations established in the Act. Therefore, the benefits provided and contribution amounts are subject to periodic change. Coverage through SEGIP becomes secondary to Medicare after
Current
1% decrease Discount Rate 1% increase
(5.35%) (6.35%) (7.35%)
Tollway's net pension liability $1,078,107,773 $891,871,048 $738,792,954
June 30, 2020

THE ILLINOIS STATE TOLL HIGHWAY AUTHORITYA Component Unit of the State of Illinois
Notes to the Financial StatementsFor the Year Ended December 31, 2020
50 (Continued)
Medicare eligibility has been reached. Members must enroll in Medicare Parts A and B to receive the subsidized SEGIP premium available to Medicare eligible participants. The Act requires the State to provide life insurance benefits for annuitants equal to their annual salary as of the last day of employment until age 60, at which time, the benefit amount becomes $5,000.
Funding policy and annual other postemployment benefit cost
OPEB offered through SEGIP are financed through a combination of retiree premiums, State contributions and Federal government subsidies from the Medicare Part D program. Contributions are deposited in the Health Insurance Reserve Fund, which covers both active State employees and retirement members. Annuitants may be required to contribute towards health and vision benefits with the amount based on factors such as date of retirement, years of credited service with the State, whether the annuitant is covered by Medicare, and whether the annuitant has chosen a managed health care plan. Annuitants who retired prior to January 1, 1998, and who are vested in the State Employee’s Retirement System do not contribute toward health and vision benefits. For annuitants who retired on or after January 1, 1998, the annuitant’s contribution amount is reduced 5% for each year of credited service with the State allowing those annuitants with 20 or more years of credited service to not have to contribute towards health and vision benefits. All annuitants are required to pay for dental benefits regardless of retirement date. The Director of Central Management Services shall, on an annual basis, determine the amount the State shall contribute toward the basic program of group health benefits. State contributions are made primarily from the General Revenue Fund on a pay-as-you-go basis. No assets are accumulated or dedicated to funding the retiree health insurance benefit and a separate trust has not been established for the funding of OPEB.
Total OPEB liability, deferred outflows of resources, deferred inflows of resources and expense related to OPEB.
GASB Statement No. 75 requires an allocation of net OPEB liability and OPEB expense and to recognize proportionate shares for the primary government and component units, including the Tollway.
At December 31, 2020, the Tollway recorded a liability of $580,018,281 for its allocated share of the State’s net OPEB liability on the statement of net position. The total OPEB liability, as reported at December 31, 2020, was measured as of June 30, 2020, with an actuarial valuation as of June 30, 2019. The Tollway’s portion of the net OPEB liability was based on the Tollway’s proportion of employer contributions relative to all employer contributions made to the plan during the year ended June 30, 2020. As of the current year measurement date of June 30, 2020, the Tollway’s proportion was 1.3706%.
For the year ended December 31, 2020, the Tollway recognized OPEB expense of $9.3 million.

THE ILLINOIS STATE TOLL HIGHWAY AUTHORITYA Component Unit of the State of Illinois
Notes to the Financial StatementsFor the Year Ended December 31, 2020
51 (Continued)
At December 31, 2020, the Tollway reported deferred outflows and deferred inflows of resources, as of the measurement date of June 30, 2020, from the following sources:
The amounts reported as deferred outflows of resources related to OPEB resulting from Tollway contributions subsequent to the measurement date will be recognized as a reduction to the OPEB liability in the year ended December 31, 2021. Other amounts reported as deferred outflows and deferred inflows of resources related to OPEB will be recognized in OPEB expense as follows:
Actuarial methods and assumptions
The total OPEB liability was determined by an actuarial valuation using the following actuarial assumptions, applied to all periods included in the measurement unless otherwise specified. The actuarial valuation for the SEGIP was based on GARS, JRS, SERS, TRS, and SURS active, inactive, and retiree data as of June 30, 2019, for eligible SEGIP employees, and SEGIP retiree data as of June 30, 2019.
Deferred Deferred
Outflows Inflows
of Resources of Resources
Difference between expected and actual experience $ 3,282,352 $ 6,245,721
Changes in assumptions 15,850,643 58,248,141
Changes in proportion - 22,996,633
Tollway contributions subsequent to the
measurement date 24,417,291 -
$ 43,550,286 $ 87,490,495
Year Ending Amount
12/31/2021 $ 26,824,077
12/31/2022 20,186,767
12/31/2023 10,212,603
12/31/2024 9,848,508
12/31/2025 1,285,545
$ 68,357,500

THE ILLINOIS STATE TOLL HIGHWAY AUTHORITYA Component Unit of the State of Illinois
Notes to the Financial StatementsFor the Year Ended December 31, 2020
52 (Continued)
The demographic assumptions and economic assumptions used in the OPEB valuation are consistent with those used in the June 30, 2020, pension valuations for GARS, JRS, SERS, TRS, and SURS as follows:
Discount Rate
Retirees contribute a percentage of the premium rate based on service at retirement. The State contributes additional amounts to cover claims and expenses in excess of retiree contributions. Because plan benefits are financed on a pay-as-you-go basis, the single discount rate is based on a tax-exempt municipal bond rate index of 20-year general obligation bonds with an average AA credit rating as of the measurement date. A single discount rate of 3.13% at June 30, 2019, and 2.45% at June 30, 2020, was used to measure the total OPEB liability.
Valuation Date June 30, 2019
Measurement Date June 30, 2020
Actuarial Cost Method Entry Age Normal, used to measure the Total OPEB liability
Discount Rate 2.45%
Inflation Rate 2.25%
Projected Salary Increases 2.75% - 7.17%
Healthcare Cost Trend Rates
Retirees' Share of
Benefit-Related Costs
Actual trend used for fiscal year 2020. For fiscal years on and after 2021, trend
starts at 8.25% for non-Medicare cost and post-Medicare costs, and gradually
decreases to an ultimate trend of 4.25%. There is no addition al trend rate
adjustment due to the repeal of the Excise Tax.
Healthcare premium rates for members depend on the date of retirement and
the years of service earned at retirement. Members who retire before January
1, 1998, are eligible for single coverage at no cost to the member. Members
who retire after January 1, 1998, are eligible for single coverage provided they
pay a portion of the premium equal to 5% for each year of service under 20
years. Eligible dependents receive coverage provided they pay 100% of the
required dependent premium. Premiums for plan years 2019 and 2020 are
based on actual premiums. Premiums after 2020 were projected based on the
same healthcare cost trend rates applied to per capita claim costs.
General
Employees and
retirees
Proposed Mortality
Table
Male Set Back
Years
Female
Set Back
Years
Male Scaling
Factor
Female
Scaling
Factor
Pre-retirement 2 1 89% 95%
Post-retirement
Pub-2020 Gemral
Healthy Retiree sex
distinct 0 (1)
111% 111%
Pub-2010 General
Employee, sex
distinct

THE ILLINOIS STATE TOLL HIGHWAY AUTHORITYA Component Unit of the State of Illinois
Notes to the Financial StatementsFor the Year Ended December 31, 2020
53 (Continued)
Sensitivity of total OPEB liability to changes in the single discount rate
The following presents the plan’s total OPEB liability, calculated using a Single Discount Rate of 2.45%, as well as what the plan’s total OPEB liability would be if it were calculated using a Single Discount rate that is one percentage point higher (3.45%) or lower (1.45%) than the current rate:
Sensitivity of the total OPEB liability to changes in the healthcare cost trend rate
The following presents the plans total OPEB liability, calculated using the healthcare cost trend rates as well as what the plan’s total OPEB liability would be if it were calculated using a healthcare cost trend rate that is one percentage point higher or lower, than the current healthcare cost trend rates. The key trend rates are 8.25% in 2021 decreasing to an ultimate trend rate of 4.25% in 2037.
1% Decrease Rate Assumption 1% Increase
1.45% 2.45% 3.45%
$ 682,710,801 $ 580,018,281 $ 498,082,841
June 30, 2020
Current Single Discount
1% Decrease(a)
Trend Rates Assumption 1% Increase(b)
$ 485,561,273 $ 580,018,281 $ 703,876,793
(a)
(b)
June 30, 2020
One percentage point decrease in healthcare trend rates are 7.25% in 2021
decreasing to an ultimate trend rate of 3.25% in 2037.
One percentage point increase in healthcare trend rates are 9.25% in 2021,
decreasing to an ultimate trend rate of 5.25% in 2027.
Healthcare Cost

THE ILLINOIS STATE TOLL HIGHWAY AUTHORITYA Component Unit of the State of Illinois
Notes to the Financial StatementsFor the Year Ended December 31, 2020
54 (Continued)
(13) Risk Management
The Tollway has a self-insured risk program for workers’ compensation claims, and is liable to pay all approved claims. Claims liabilities are reported when it is probable that a loss has occurred and the amount of the loss can be reasonably estimated. Claims liabilities include non-incremental claims adjustment expenses. The estimated liabilities for workers’ compensation claims of $16,910,865 and incurred but not reported employee health claims of $1,052,957 as of December 31, 2020, are included in the accompanying financial statements.
Additionally, the Tollway purchases commercial insurance policies for general liability insurance and vehicle liability insurance which have a level of retention of $500,000 per occurrence for general liability and $250,000 per occurrence for vehicle insurance. Property insurance coverage for damages to capital assets other than vehicles includes retention of $1,000,000 per occurrence.
The Tollway has not had significant reductions in insurance coverage during the current or prior year nor did settlements exceed insurance coverage in any of the last three years.
Balance at Balance at Current
January 1 Additions Deletions December 31 Portion
$ 15,490,929 $ 5,855,949 $ (4,436,013) $ 16,910,865 $ 5,900,000
Changes in health insurance claims payable for the year ended December 31, 2020, are as follows:
Balance at Balance at Current
January 1 Additions Deletions December 31 Portion
$ 724,776 $ 14,139,203 $ (13,811,022) $ 1,052,957 $ 1,052,957

THE ILLINOIS STATE TOLL HIGHWAY AUTHORITYA Component Unit of the State of Illinois
Notes to the Financial StatementsFor the Year Ended December 31, 2020
55 (Continued)
(14) Compensated Absences
The accrued compensated absences liability reported in the statement of net position represents the vacation for all years, and 50% of unused sick time for the period beginning January 1, 1984, and ending December 31,1997, accrued by the employees, and is payable upon termination or death of the employee. The payment provided shall not be allowed if the purpose of the separation from employment and any subsequent re-employment is for the purpose of obtaining such payment. The Tollway’s liability for unused annual vacation leave and sick leave as defined above is recorded in the accompanying financial statements at the employee’s pay rate.
Changes in accrued compensated absences for the year ended December 31, 2020, are as follows:
This Space is Intentionally Left Blank
Balance at Balance at Due within
January 1 Accrued Used December 31 one year2020 $ 9,154,599 $ 7,928,167 $ 5,025,516 $ 12,057,250 $ 5,100,000

THE ILLINOIS STATE TOLL HIGHWAY AUTHORITYA Component Unit of the State of Illinois
Notes to the Financial StatementsFor the Year Ended December 31, 2020
56 (Continued)
(15) Pledges of Future Revenues
All revenue bonds issued under the Tollway’s Trust Indenture are secured by a pledge of and lien on Tollway revenues and certain other funds (excluding amounts reserved for the payment of maintenance and operating expenses) as provided in the Trust Indenture.
Proceeds from the bonds identified above provided financing or refinancing for the construction and/or improvement of the various corridors within the Tollway’s toll highway system. Future projected principal and interest payments on the bonds are expected to require approximately 35%of future pledged net revenue (incorporating previously approved, as of December 31, 2020, commercial vehicle annual toll rate increases based on the consumer price index, such increases projected at 2.0% annually). The total principal and interest remaining to be paid on the bonds is $10.9 billion. Principal and interest paid in calendar year 2020 was $416.9 million, and total pledged net revenue in calendar year 2020 was $933.8 million.
Pledged future Term of
Bond issue Purpose revenues commitment
2009 Series A Senior Priority Revenue (Build
America Bonds - Direct Payment)Fund Congestion-Relief Program $ 721,285,700 2034
2009 Series B Senior Priority Revenue (Build
America Bonds - Direct Payment)Fund Congestion-Relief Program 509,359,200 2034
2013 Series A Senior Revenue Fund "Move Illinois" Program 870,499,750 2038
2014 Series A (Refunding) Senior Revenue Refund 2005A Bonds 213,600,000 2022
2014 Series B Senior Revenue Fund "Move Illinois" Program 893,625,000 2039
2014 Series C Senior Revenue Fund "Move Illinois" Program 711,400,000 2039
2014 Series D (Refunding) Senior Revenue Refund 2006A Bonds 254,633,375 2025
2015 Series A Senior Revenue Fund "Move Illinois" Program 747,482,500 2040
2015 Series B Senior Revenue Fund "Move Illinois" Program 747,482,500 2040
2016 Series A (Refunding) Senior Revenue Refund 2008B Bonds 519,026,250 2032
2016 Series B Senior Revenue Fund "Move Illinois" Program 565,700,000 2041
2017 Series A Senior Revenue Fund "Move Illinois" Program 575,935,000 2042
2018 Series A (Refunding) Senior RevenueRefund portions of 2007A, 2008A, 2009A Bonds
674,382,125 2031
2019 Series A Senior Revenue Fund "Move Illinois" Program 601,840,000 2031
2019 Series B (Refunding) Senior Revenue Refund 2010A-1 Bonds 308,200,875 2044
2019 Series C (Refunding) Senior Revenue Refund 2007A, 2008A Bonds 968,120,750 2031
2020 Series A Senior Revenue Fund "Move Illinois" Program 1,042,977,222 2045
$ 10,925,550,248
December 31, 2020

THE ILLINOIS STATE TOLL HIGHWAY AUTHORITYA Component Unit of the State of Illinois
Notes to the Financial StatementsFor the Year Ended December 31, 2020
57 (Continued)
(16) Commitments
At December 31, 2020, the remaining obligations against current contracts open for capital programs for CRP and “Move Illinois” totaled $2.3 billion. The Tollway plans to fund remaining payments under these contracts through revenues, accumulated cash, and bond issue proceeds.
(17) Pending Litigation
There are pending claims and lawsuits against the Tollway, which, among other things, seek damages arising out of alleged personal injury, unpaid health insurance contributions, wrongful discharge and other employment-related matters. Generally, the Tollway’s exposure is limited to the self-insured retention of $500,000 per general liability incident. Also pending are various workers’ compensation claims and numerous Administrative Review actions in which individual parties are challenging the results of toll violation enforcement proceedings.
Management, after taking into consideration legal counsel’s evaluation of such actions, is of the opinion that the outcome of these matters will have no material effect on the financial position of the Tollway.
(18) Contingent Liabilities
A contingent liability is defined as a liability that is not sufficiently predictable to permit recording in the accounts but in which there is a reasonable possibility of an outcome which might affect financial position or results of operations. It is the opinion of management that the Tollway has no liabilitiesmeeting this definition as of December 31, 2020.
(19) New Governmental Accounting Standards
The Governmental Accounting Standards Board (GASB) has issued the following statements:
GASB Statement No. 87 – Leases – This statement changes the accounting treatment for operating leases. This statement is effective for fiscal years beginning after June 15, 2021. Management has not yet determined the impact of this pronouncement on the Tollway’s financial statements.
GASB Statement No. 90 – Majority Equity Interests – an amendment of GASB Statements No. 14 and No. 61 - This statement improves the reporting of a government’s majority interest in a legally separate organization. It is effective for years beginning after December 15, 2019. This statement did not impact the Tollway’s financial statements.
GASB Statement No. 91 – Conduit Debt Obligations – The requirements of this statement will improve financial reporting by eliminating the existing option for issuers to report conduit debt obligations as their own liabilities, thereby ending significant diversity in practice. The clarified definition will resolve stakeholders’ uncertainty as to whether a given financing is, in fact, a conduit debt obligation. Requiring issuers to recognize liabilities associated with additional commitments extended by issuers and to recognize assets and deferred inflows of resources related to certain arrangements associated with conduit debt obligations also will eliminate diversity, therebyimproving comparability in reporting by issuers. Revised disclosure requirements will provide financial statement users with better information regarding the commitments issuers extend and the likelihood that they will fulfill those commitments. That information will inform users of the potential impact of such commitments on the financial resources of issuers and help users assess issuers’ roles in conduit debt obligations. This statement is effective for reporting periods beginning after December 15, 2021. This statement did not impact the Tollway’s financial statements.

THE ILLINOIS STATE TOLL HIGHWAY AUTHORITYA Component Unit of the State of Illinois
Notes to the Financial StatementsFor the Year Ended December 31, 2020
58 (Continued)
GASB Statement No. 93 – Replacement of Interbank Offered Rates – This statement addresses accounting and financial reporting implications that result from the replacement of interbank offered rate (IBOR). This statement is effective for years beginning after June 30, 2021. This statement will not impact the Tollway’s financial statements.
GASB Statement No. 94 – Public-Private Partnerships and Availability Payment Arrangements –The objective of this statement is to improve financial reporting by addressing issues related to public-private and public-public partnership arrangements, in which a government contracts with an operator to provide public services. This statement is effective for fiscal years beginning after June 15, 2022. Management has not yet determined the impact of this pronouncement on the Tollway’s financial statements.
GASB Statement No. 95 – Postponement of the Effective Dates of Certain Authoritative Guidance– This statement postponed the effective dates of previously issued GASB pronouncements due to the COVID-19 pandemic. The revised effective dates are reflected for the pronouncements listed in this footnote.
Statement No. 96 – Subscription-Based Information Technology Arrangements (SBITAs)– This statement provides guidelines for the financial reporting for SBITA liabilities, capitalization and note disclosures. Management has not yet determined the impact of this pronouncement on the Tollway’s financial statements.
Statement No. 97 – Certain Component Unit Criteria and Financial Reporting for IRC Code 457 Deferred Compensation Plans – An Amendment of GASB Statements No. 14 and 84 -The purpose of this statement is to enhance financial reporting related to Section 457 plans. This statement is effective generally for reporting periods beginning after June 15, 2021. Management has not yet determined the impact of this pronouncement on the Tollway’s financial statements.
(20) Related Parties
The Tollway has entered into various intergovernmental agreements with the State of Illinois, through the Illinois Department of Transportation (IDOT). Intergovernmental receivables of approximately $101.7 million are recorded at December 31, 2020, representing construction projects performed by the Tollway that pertain to the infrastructure owned by IDOT. Accrued liabilities totaling approximately $37.4 million are recorded for amounts owed to IDOT for construction projects IDOT has performed for infrastructure assets owned by the Tollway.
(21) Subsequent Events
On January 1, 2021, a toll rate increase took effect for commercial vehicles, reflecting an increase in the Consumer Price Index (CPI) for All Urban Consumers. This increase was implemented pursuant to the Tollway Board of Directors’ approval in 2008 and confirmation in 2011 of annual CPI–based commercial vehicle toll rate increases beginning January 1, 2018 and each year thereafter.
On February 25, 2021, the Tollway Board authorized the issuance of up to $600,000,000 of senior-lien fixed rate revenue bonds for purposes of funding a portion of Move Illinois capital program expenditures.
On April 22, 2021, the Tollway Board of Directors approved changes to the Tollway’s economic assistance program, IPASS Assist. Under this enhanced I-PASS Assist program qualifying participants will no longer be required to place a deposit on their transponder account, and deposits

THE ILLINOIS STATE TOLL HIGHWAY AUTHORITYA Component Unit of the State of Illinois
Notes to the Financial StatementsFor the Year Ended December 31, 2020
59 (Continued)
on existing IPASS Assist accounts will be transferred to the prepaid toll balance. In addition, the minimum amount required for prepaid tolls will be reduced to $4 (from $10). Furthermore, going forward under the enhanced IPASS Assist program, under certain conditions missed tolls may not be subject to invoicing fees. Eligibility to participate will include an income-based requirement.
The traffic on the Illinois Tollway has begun to recover from the adverse effects of the COVID-19 pandemic. As of 8/31/2021, the Tollway’s traffic is at approximately 92% of its pre-pandemic level.
The Tollway has been notified by the U.S. Treasury of a 5.7% reduction in U.S. Treasury subsidies of Build America Bond interest payments for the federal fiscal year ending September 30, 2021. This reduction is expected to reduce the subsidies earned by the Tollway for: the Series 2009B interest payment due June 1, 2021; and the Series 2009A interest payment due July 1, 2021. The total amount of such reductions is expected to be $410,160.
(22) Restatement of Net Position
During Calendar Year 2020, two error corrections resulted in restatements to beginning net position, as follows:
(A) This error correction was due to an understatement in the Tollway’s OPEB liability and errors in related OPEB accounts. This error occurred due to the Tollway and the State of Illinois, Department of Central Management Services (CMS) not separately stating OPEB balances for Tollway employees who only partake in the State Employees Group Insurance Program (SEGIP) upon their retirement from the Tollway from other employees accounted for within SEGIP’s cost-sharing proportionate share allocation of OPEB balances.
(B) This error correction was due to the Tollway improperly classifying contributions to SEGIP subsequent to SEGIP’s measurement date as expenses rather than deferred outflows of resources prior to December 31, 2019.
Reporting Unit Affected
by the Restatement to
Beginning Balances
Busines-Type Activities
12/31/2019, as previously reported $ 3,451,111,822
Error Correction (A) (509,815,049)
Error Correction (B) 4,122,999
Sub-Total (505,692,050)
12/31/2019, as restated $ 2,945,419,772

REQUIRED SUPPLEMENTARY INFORMATION
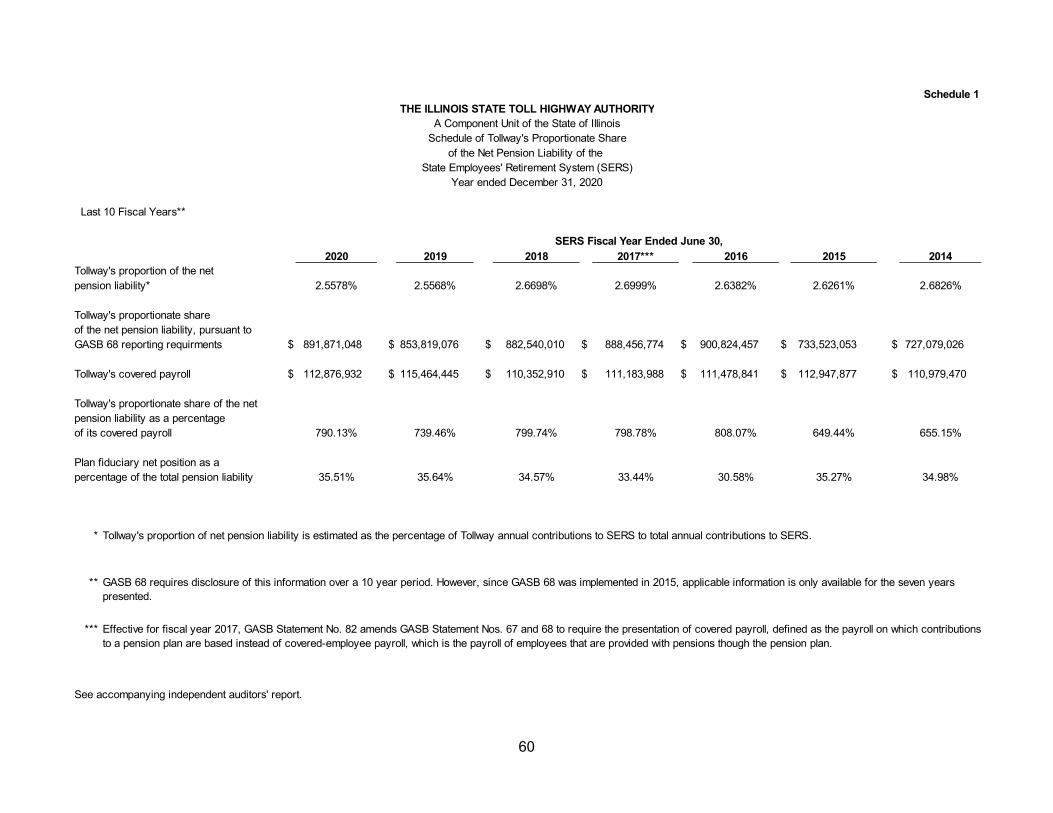
60
Last 10 Fiscal Years**
2020 2019 2018 2017*** 2016 2015 2014
Tollway's proportion of the net
pension liability* 2.5578% 2.5568% 2.6698% 2.6999% 2.6382% 2.6261% 2.6826%
Tollway's proportionate share
of the net pension liability, pursuant to
GASB 68 reporting requirments $ 891,871,048 $ 853,819,076 $ 882,540,010 $ 888,456,774 $ 900,824,457 $ 733,523,053 $ 727,079,026
Tollway's covered payroll $ 112,876,932 $ 115,464,445 $ 110,352,910 $ 111,183,988 $ 111,478,841 $ 112,947,877 $ 110,979,470
Tollway's proportionate share of the net
pension liability as a percentage
of its covered payroll 790.13% 739.46% 799.74% 798.78% 808.07% 649.44% 655.15%
Plan fiduciary net position as a
percentage of the total pension liability 35.51% 35.64% 34.57% 33.44% 30.58% 35.27% 34.98%
*
**
***
See accompanying independent auditors' report.
Schedule 1
THE ILLINOIS STATE TOLL HIGHWAY AUTHORITY
A Component Unit of the State of Illinois
Schedule of Tollway's Proportionate Share
of the Net Pension Liability of the
Tollway's proportion of net pension liability is estimated as the percentage of Tollway annual contributions to SERS to total annual contributions to SERS.
GASB 68 requires disclosure of this information over a 10 year period. However, since GASB 68 was implemented in 2015, applicable information is only available for the seven years
presented.
Effective for fiscal year 2017, GASB Statement No. 82 amends GASB Statement Nos. 67 and 68 to require the presentation of covered payroll, defined as the payroll on which contributions
to a pension plan are based instead of covered-employee payroll, which is the payroll of employees that are provided with pensions though the pension plan.
SERS Fiscal Year Ended June 30,
State Employees' Retirement System (SERS)
Year ended December 31, 2020

61
Schedule 2
Actual
Contribution
Year Actuarially Contribution as a % of
Ended Determined Actual Deficiency Covered Covered
June 30, Contribution Contribution* (Excess) Payroll* Payroll
2020 $ 74,525,328 $ 61,919,610 $ 12,605,718 $ 115,054,947 53.82%
2019 76,600,914 59,411,115 17,189,799 113,210,062 52.48%
2018 73,135,906 55,197,741 17,938,165 110,795,575 49.82%
2017 57,493,911 55,576,566 1,917,345 111,226,982 49.97%
2016 53,283,494 50,197,749 3,085,745 111,478,841 45.03%
2015 53,713,047 48,299,509 5,413,538 112,947,877 42.76%
2014 52,494,228 44,751,713 7,742,515 110,979,470 40.32%
*
See accompanying independent auditors' report.
THE ILLINOIS STATE TOLL HIGHWAY AUTHORITY
Note: GASB 68 requires disclosure of this information over a 10 year period. However, since GASB 68 was
implemented in 2015, applicable information is only available for the seven years presented.
Actual contributions and covered payroll are based on the Tollway's calendar year and were equal to the
statutorially required contribution.
Actuarially determined contributions are calculated as of June 30th, which is 6 months prior to the beginning of
the fiscal year
Year ended December 31, 2020
Schedule of Contributions to SERS Pension Plan
A Component Unit of the State of Illinois

62
Schedule 3
2020 2019 2018 2017Tollway's proportion of the net
OPEB liability* 1.3706% 0.2995% 0.3495% 0.2520%
Tollway's proportionate share
of the net OPEB liability $ 580,018,281 $ 131,448,041 $ 140,125,903 $ 104,136,124
Tollway's covered-employee payroll $ 112,876,932 $ 115,464,445 $ 110,352,910 $ 111,183,988
Proportionate share of Net OPEB liability
as a percentage of covered-employee payroll 513.85% 113.84% 126.98% 93.66%
*
**
See accompanying independent auditors' report.
GASB 75 requires disclosure of this information over a 10 year period. However, since GASB 75 was implemented in 2018,
applicable information is only available for the four years presented.
Beginning in 2020, the Tollway's proportion of net OPEB liability is estimated based on the Tollway's specific actuarial share of the
total State of Illinois liability. Prior to 2020, the Tollway's share was erroneously estimated based on actual contruibutions to SEGIP.
See Note 22 restatement.
THE ILLINOIS STATE TOLL HIGHWAY AUTHORITYA Component Unit of the State of Illinois
Schedule of Tollway's Proportionate Share
of the Net OPEB Liability of the
State Employees' Group Insurance Program (SEGIP)
For the Year Ended December 31, 2020
Last 10 Fiscal Years**
Fiscal Year Ended June 30,

SUPPLEMENTARY INFORMATION - TRUST INDENTUREAGREEMENT SCHEDULES (NON-GAAP)

63
Schedule 4
THE ILLINOIS STATE TOLL HIGHWAY AUTHORITYA Component Unit of the State of Illinois
Schedule of Changes in Fund Balance – by Fund
Trust Indenture Basis of Accounting (Non GAAP)
Year ended December 31, 2020
Revenue Construction
fund fund Total
Increases:
Toll revenue $ 1,149,019,894 $ - $ 1,149,019,894
Toll evasion recovery 93,164,508 - 93,164,508
Concessions 1,394,810 - 1,394,810
Interest 13,726,180 8 13,726,188
Miscellaneous 25,234,903 - 25,234,903
Total increases 1,282,540,295 8 1,282,540,303
Decreases:Engineering and maintenance of
roadway and structures 91,503,160 - 91,503,160
Services and toll collection 130,700,789 - 130,700,789
Traffic control, safety patrol, and
radio communications 45,729,173 - 45,729,173
Procurement, IT, finance and administration 46,334,258 - 46,334,258
Insurance and employee benefits 45,935,450 - 45,935,450
Construction expenses 1,102,792,431 - 1,102,792,431
Construction expense reimbursed by bond
proceeds (499,783,000) 499,783,000 -
Bond principal payments 129,260,000 - 129,260,000
Build America bond subsidy (13,611,390) - (13,611,390)
Bond interest and other financing costs 308,823,485 1,827,767 310,651,252
Total decreases 1,387,684,356 501,610,767 1,889,295,123
Bond Proceeds - Series 2020A 18,396,664 626,546,320 644,942,984
Prior Period Adjustment (2,995,188) - (2,995,188)
Change in fund balance (89,742,585) 124,935,561 35,192,976
Fund balance, January 1 1,403,073,655 - 1,403,073,655
Restatement of January 1, 2020 fund balance (12,669,882) - (12,669,882)
Fund balance, December 31 $ 1,300,661,188 $ 124,935,561 $ 1,425,596,749
See accompanying independent auditors’ report.

64
Schedule 4
THE ILLINOIS STATE TOLL HIGHWAY AUTHORITYA Component Unit of the State of Illinois
Schedule of Changes in Fund Balance – by Fund
Trust Indenture Basis of Accounting (Non GAAP)
For the Year Ended December 31, 2019
Revenue Construction
fund fund Total
Increases:
Toll revenue $ 1,380,750,754 $ - $ 1,380,750,754
Toll evasion recovery 81,554,193 - 81,554,193
Concessions 1,717,551 - 1,717,551
Interest 38,455,694 1,377,981 39,833,675
Miscellaneous 7,146,226 - 7,146,226
Total increases 1,509,624,418 1,377,981 1,511,002,399
Decreases:
Engineering and maintenance of
roadway and structures 95,540,233 - 95,540,233
Services and toll collection 136,123,867 - 136,123,867
Traffic control, safety patrol, and
radio communications 42,190,366 - 42,190,366
Procurement, IT, finance and administration 46,073,902 - 46,073,902
Insurance and employee benefits 30,278,247 - 30,278,247
Construction 941,563,702 - 941,563,702
Construction expense reimbursed by bond
proceeds (337,559,130) 337,559,130 -
Bond principal payments 118,780,000 - 118,780,000 Net funds applied to refunding 9,087,088 9,087,088
Bond Proceeds - Series 2019A, 2019B (9,754,500) (336,748,986) (346,503,486)
Net funds applied to refunding (3,106,469) - (3,106,469)
Build America bond subsidy (13,554,800) - (13,554,800)
Bond interest and other financing costs 304,715,976 567,837 305,283,813
Total decreases 1,360,378,482 1,377,981 1,361,756,463
Change in fund balance 149,245,936 - 149,245,936
Fund balance, January 1 1,253,827,719 - 1,253,827,719
Fund balance, December 31 $ 1,403,073,655 $ - $ 1,403,073,655
See accompanying independent auditors’ report.

65(Continued)
Schedule 5
THE ILLINOIS STATE TOLL HIGHWAY AUTHORITY
A Component Unit of the State of Illinois
Schedule of Changes in Fund Balance – Revenue Fund – by Account
Trust Indenture Basis of Accounting (Non GAAP)
Year ended December 31, 2020
Revenue fund and accounts
Maintenance and operationsOperating Operating Debt Renewal
Revenue sub reserve sub Debt service andaccount account account service reserve replacement Improvement Total
Increases:
Toll revenue $ 1,149,019,894 $ - $ - $ - $ - $ - $ - $ 1,149,019,894
Toll evasion recovery 93,164,508 - - - - - - 93,164,508
Concessions 1,394,810 - - - - - - 1,394,810
Interest 1,482,428 - - 303,397 5,772,755 1,455,373 4,712,227 13,726,180
Miscellaneous 25,234,903 - - - - - - 25,234,903
Intrafund transfers (1,284,253,897) 364,681,363 - 422,894,127 - 120,000,000 376,678,407 -
Total increases (13,957,354) 364,681,363 - 423,197,524 5,772,755 121,455,373 381,390,634 1,282,540,295
Decreases:Engineering and maintenance of roadway
and structures - 91,503,160 - - - - - 91,503,160
Services and toll collection - 130,700,789 - - - - - 130,700,789
Traffic control, safety patrol, and radio
communications - 45,729,173 - - - - - 45,729,173
Procurement, IT, finance and administration - 46,334,258 - - - - - 46,334,258
Insurance and employee benefits - 45,935,450 - - - - - 45,935,450
Construction expenses - - - - - 307,154,612 795,637,819 1,102,792,431
Construction expenses reimbursed by bond
proceeds - - - - - - (499,783,000) (499,783,000)
Bond principal payments - - - 129,260,000 - - - 129,260,000
Gain/loss on defeased bonds - - - - - - - -
Build America bond subsidy - - - (13,611,390) - - - (13,611,390)
Interest and other financing costs - - - 308,616,588 206,897 - - 308,823,485
Total decreases - 360,202,830 - 424,265,198 206,897 307,154,612 295,854,819 1,387,684,356
Net increase (decrease) (13,957,354) 4,478,533 - (1,067,674) 5,565,858 (185,699,239) 85,535,815 (105,144,061)
Bond Proceeds - Series 2020A - - - - 18,396,664 - - 18,396,664
Prior Period Adjustment - - - (2,927,453) (67,735) - - (2,995,188)
Change in fund balance (13,957,354) 4,478,533 - (3,995,127) 23,894,787 (185,699,239) 85,535,815 (89,742,585)
Fund balance, January 1 15,202,257 15,166,925 27,400,000 57,214,071 404,002,348 370,808,780 513,279,274 1,403,073,655
Restatement of January 1, 2020 fund balanc e (12,669,882) - - - - - (12,669,882)
Fund balance, December 31 $ 1,244,903 $ 6,975,576 $ 27,400,000 $ 53,218,944 $ 427,897,135 $ 185,109,541 $ 598,815,089 $ 1,300,661,188
See accompanying independent auditors ’ report.

66
Schedule 5
THE ILLINOIS STATE TOLL HIGHWAY AUTHORITY
A Component Unit of the State of Illinois
Schedule of Changes in Fund Balance – Revenue Fund – by Account
Trust Indenture Basis of Accounting (Non GAAP)
For the Year Ended December 31, 2019
Revenue fund and accounts
Maintenance and operationsOperating Operating Debt Renewal
Revenue sub reserve sub Debt service andaccount account account service reserve replacement Improvement Total
Increases:
Toll revenue $ 1,380,750,754 $ - $ - $ - $ - $ - $ - $ 1,380,750,754
Toll evasion recovery 81,554,193 - - - - - - 81,554,193
Concessions 1,717,551 - - - - - - 1,717,551
Interest 5,870,466 - - 2,738,932 8,464,992 8,965,993 12,415,311 38,455,694
Miscellaneous 7,146,226 - - - - - - 7,146,226
Intrafund transfers (1,472,251,436) 348,984,792 - 402,429,651 - 420,000,000 300,836,993 -
Total increases 4,787,754 348,984,792 - 405,168,583 8,464,992 428,965,993 313,252,304 1,509,624,418
Decreases:Engineering and maintenance of roadway
and structures - 95,540,232 - - - - - 95,540,232
Services and toll collection - 136,123,867 - - - - - 136,123,867
Traffic control, safety patrol, and radio
communications - 42,190,366 - - - - - 42,190,366
Procurement, IT, finance and administration - 46,073,902 - - - - - 46,073,902
Insurance and employee benefits - 30,278,247 - - - - - 30,278,247
Construction expenses - - - - - 471,232,860 470,330,843 941,563,702
Construction expenses reimbursed by bond (150,600,377) (186,958,753) (337,559,129)
proceeds - - - - - - - -
Bond principal payments - - - 118,780,000 - - - 118,780,000
Net Funds Applied to Refundings - - - 8,313,062 774,026 - - 9,087,088
Build America bond subsidy - - - (13,554,800) - - - (13,554,800)
Interest and other financing costs - - - 304,509,079 206,897 - - 304,715,976
Total decreases - 350,206,614 - 418,047,342 980,922 320,632,483 283,372,090 1,373,239,451
Net increase (decrease) 4,787,754 (1,221,822) - (12,878,759) 7,484,070 108,333,510 29,880,214 136,384,967
Bond Proceeds - Series 2019A - - - - 9,754,500 - - 9,754,500
Net Funds Applied to Refundings - - - 3,106,469 - - - 3,106,469
Transfer of Excess Debt Reserve Funds - - - 3,408,533 (3,408,533) - - -
Change in fund balance 4,787,754 (1,221,822) - (6,363,757) 13,830,037 108,333,510 29,880,214 149,245,936
Fund balance, January 1 10,414,503 16,388,747 27,400,000 63,577,828 390,172,311 262,475,270 483,399,060 1,253,827,719
Fund balance, December 31 $ 15,202,257 $ 15,166,925 $ 27,400,000 $ 57,214,071 $ 404,002,348 $ 370,808,780 $ 513,279,274 $ 1,403,073,655
See accompanying independent auditors’ report.

THE ILLINOIS STATE TOLL HIGHWAY AUTHORITYA Component Unit of the State of Illinois
Notes to the Trust Indenture Basis SchedulesDecember 31, 2020
67 (Continued)
(1) Summary of Significant Accounting Policies
The Trust Indenture requires the Tollway to provide separate funds for construction (Construction Fund) and for operations (Revenue Fund), which funds are not annually appropriated by the Illinois General Assembly. The Trust Indenture permits the Tollway to create additional accounts for the purpose of more precise accounting. The Illinois State Treasurer holds monies for the Tollway as ex-officio custodian and has recorded these monies in a custodial account. Part of this account is part of the Maintenance and Operation Account within the Revenue Fund.
Prior to fiscal year 2005, the Tollway issued separate annual financial statements, prepared on the basis of accounting described below, in order to demonstrate compliance with the requirements of the Trust Indenture (Trust Indenture Annual Statements). Beginning in 2005, the Tollway has included schedules, prepared on the basis of accounting described below, in the supplementary information section of this report. The Tollway believes that these schedules, along with the GAAP basis financial statements contained in this report, are sufficient to demonstrate compliance with the annual financial reporting requirements of the Trust Indenture. As a result, separate Trust Indenture Annual Statements are no longer prepared. Certain items in the presentation of the Trust Indenture information contained herein vary from the presentation previously used in the Trust Indenture Annual Statements. In addition, the schedules contained in this section of the report present only the Revenue Fund and the Construction Fund. Previously, the Trust Indenture Annual Statements included “Infrastructure and Long-term Debt Accounts,” which was optional reporting allowed under the Trust Indenture.
Basis of Accounting
Under the provisions of the Trust Indenture, the basis of accounting followed for the Construction Fund and the Revenue Fund within the schedule of changes in fund balance by Fund, differs in certain respects from accounting principles generally accepted in the United States of America.
The major differences are as follows:
1. Capital construction and asset acquisitions are charged against fund balance as incurred. In addition, there is no provision for depreciation.
2. Monies received from sale of assets are recorded as revenue when the cash is received.
3. Monies received for long-term fiber optic leases are recorded as revenue when received.
4. Principal retirements on revenue bonds are expensed when paid. The results of defeasement are accounted for as revenue or expense at the time of the transaction.
5. Bond proceeds (including premiums) are recorded as income in the year received. Amounts received from refunding issuances, if any, are recorded net of transfers to the escrow agent.
6. Unrealized gains and losses on Debt Reserve invested funds are netted against interest and other financing costs.
7. Capital lease obligations are not recorded. Payments under capital leases are expensed in the period payments are made.

THE ILLINOIS STATE TOLL HIGHWAY AUTHORITYA Component Unit of the State of Illinois
Notes to the Trust Indenture Basis SchedulesDecember 31, 2020
68 (Continued)
8. Interest related to construction in progress is not capitalized.
9. Recoveries of expenses are classified as decreases in operating expenses for Trust Indenture reporting and as miscellaneous operating revenue for GAAP.
10. In Trust Indenture reporting, transponder purchases and other miscellaneous expenses are reflected in the Renewal and Replacement fund as capital expense. For GAAP the expenses are reflected as an operating expense.
11. Construction expenses incurred under intergovernmental agreements are decreased by payments received under these intergovernmental agreements.
12. Prepaid expenses are recorded only if refundable for Trust Indenture reporting.
13. The provisions of GASB Statement No. 68 regarding net pension liability and deferred outflows and inflows of resources are not reflected in the Trust Indenture reporting. Pension expense reflects the statutory contributions required under Chapter 40, section 5/14 of the Illinois Compiled Statutes.
14. The provisions of GASB Statement No. 75 regarding net OPEB liability and deferred outflows and inflows of resources are not reflected in the Trust Indenture reporting.
Therefore, the accompanying Schedules of Changes in Fund Balance by Fund, which are prepared in accordance with the aforementioned accounting principles, are not intended to, and do not, present the financial position or the results of operations in accordance with accounting principles generally accepted in the United States of America.
A description of the individual accounts within the Revenue Fund and Construction Fund, as well as the required distribution of revenues collected, is as follows:
The Revenue Fund
All revenues received by the Tollway other than investment income shall be delivered by the Tollway to the Treasurer, for deposit in the Revenue Fund. On or before the 20th day of each month the Treasurer shall, at the direction of the Tollway, transfer or apply the balance as of such date of transfer in the Revenue Fund not previously transferred or applied in the following order of priority:
A. To the Operating Sub-Account, operating expenses set forth in the annual budget for the fiscal year in an amount equal to one-twelfth of the total approved budget, less all other amounts previously transferred by the Treasurer for deposit to the credit of the Operating Sub-Account during that fiscal year, less the balance, if any, which was on deposit to the credit of the Operating Sub-Account on December 31 of the preceding fiscal year.
B. To the Operating Reserve Sub-Account, the amount specified by the Tollway, but not to exceed 30% of the amount annually budgeted for operating expenses.

THE ILLINOIS STATE TOLL HIGHWAY AUTHORITYA Component Unit of the State of Illinois
Notes to the Trust Indenture Basis SchedulesDecember 31, 2020
69 (Continued)
C. To the Interest Sub-Account, an amount equal to interest due on unpaid bonds, plus one-sixth of the difference between the interest payable on bond and interest due within the next six months.
D. To the Principal Sub-Account, an amount equal to any principal due plus one-twelfth of any principal of such outstanding senior bonds payable on the next principal payment date.
E. To the Redemption Sub-Account, an amount for each bond equal to one-twelfth of any sinking fund installment of outstanding bonds payable within the next twelve months.
F. To the Provider Payment Sub-Account, amounts as provided in any supplemental indenture for paying costs of credit enhancement or qualified hedge agreements for bonds or for making reimbursements to providers of credit enhancement or qualified hedge agreements for bonds.
G. To the Debt Service Reserve Account, an amount sufficient to cause the balance in it to equal the debt reserve requirement and to make reimbursement to providers of reserve account credit facilities.
H. To the Junior Bond Debt Service or Junior Bond Debt Reserve Account, any amounts required by applicable supplemental indentures.
I. To the Renewal and Replacement Account, one-twelfth the portion of the renewal and replacement amount set forth in the annual budget for the fiscal year.
J. The balance of such amounts in the Revenue Funds are to be applied as follows:
1) To the credit of the Improvement Account for allocation to a project as determined by the Tollway in its sole discretion, until the balance in the Account is equal to the improvement requirement or a lesser amount as the Tollway may from time to time determine.
2) To the credit of the System Reserve Account, the entire amount remaining in the Revenue Fund after depositing or allocating all amounts required to be deposited to the credit of the above Accounts and Sub-Accounts.
Maintenance and Operation Account
The Maintenance and Operation Account consists of the Operating Sub-Account and the Operating Reserve Sub-Account. Moneys in the Operating Sub-Account are applied to operating expenses at the direction of the Tollway.

THE ILLINOIS STATE TOLL HIGHWAY AUTHORITYA Component Unit of the State of Illinois
Notes to the Trust Indenture Basis SchedulesDecember 31, 2020
70 (Continued)
Revenues are transferred to the Operating Sub-Account to cover the expenses set forth in the annual budget for the current fiscal year. One-twelfth of the operating expenses outlined in the annual budget are transferred to this account once a month. Revenue is recorded on an accrual basis and as such may not be available for allocation until the cash is collected.
The Operating Reserve Sub-Account receives or retains an amount not to exceed 30% of the amount budgeted for operating expenses in the annual budget for the current fiscal year. Monies in the Operating Reserve Sub-Account are held as a reserve for the payment of operating expenses and are to be withdrawn if moneys are not available to the credit of the Operating Sub-Account to pay operating expenses.
If the Tollway determines that the amount in the Operating Reserve Sub-Account exceeds that amount necessary, the excess will be withdrawn from such Sub-Account and applied as revenues. By resolution, the Board voted to maintain a $27.4 million fund balance in this account.
Debt Service Account
The Debt Service Account consists of the Interest Sub-Account, the Principal Sub-Account, the Redemption Sub-Account, and the Provider Payment Sub-Account, to be held by the Trustee.
Revenues are required to be deposited to cover the interest and principal amounts due and unpaid for bonds, credit enhancement or qualified hedge agreements. Revenues must also be deposited to the credit of the Debt Reserve Account in an amount sufficient to cause the balance in it to equal the debt reserve requirement.
The Debt Reserve Account receives funds to provide an amount sufficient to cause the balance in it to equal the debt reserve requirement and to make any required reimbursement to providers of reserve account credit facilities.
Renewal and Replacement Account
Revenues must be credited to the Renewal and Replacement Account in an amount set forth in the annual budget for the renewal and replacement deposit. An amount set forth in the budget shall be determined based on recommendations of the Consulting Engineer. Additional funds can be transferred to this account by the Tollway, based on the capital plan expenditures.
Improvement Account
At the direction of the Tollway, the balance of amounts in the Revenue Fund are applied to the Improvement Account, for allocations to projects, determined by the Tollway, until the balance in the Account is equal to the improvement requirement.

THE ILLINOIS STATE TOLL HIGHWAY AUTHORITYA Component Unit of the State of Illinois
Notes to the Trust Indenture Basis SchedulesDecember 31, 2020
71 (Continued)
System Reserve Account
At the direction of the Tollway, the balance in the Revenue Fund is deposited to the credit of the System Reserve Account to provide for deficiencies in any other account or sub-account. If all accounts have sufficient funds, System Reserve Account funds can be used to pay off debt, fund construction projects, make improvements, or pay for any other lawful Tollway purpose. There were no balances or activity in the System Reserve Account during 2020.
The Construction Fund
The Construction Fund is held as a separate segregated fund. The Construction Fund receives funds from the sale of bonds (other than refunding bonds) and investment of proceeds. The Treasurer establishes and maintains within the Construction Fund a separate, segregated account for each Project, the costs of which are to be paid in whole or in part out of the Construction Fund.
(2) Miscellaneous
The following items are reported as Bond Interest and Other Financing Costs:
Other Information:
(1) Construction and Other Capital Expenses for Renewal and Replacement and Improvement include accrued expenses.
(2) Bond interest expense includes accrued interest payable at December 31, 2020.
(3) In November 2008, the Tollway purchased a $100 million surety bond. This policy is being amortized over the life of the bonds (24.1 years). The amortization is shown in the debt reserve column above.
(4) Cash and investment balances held by the Trustee at December 31, 2020, are $181.4 million in the Debt Service accounts, and $425.2 million in the Debt Reserve account.
(5) Insurance and Employee Benefits includes expense for retirement, worker’s compensation, the employer portion of FICA, and medical insurance.
Components of Bond Interest and Other Financing Costs - 2020
Debt Service Debt Reserve TotalBond interest expense $ 308,556,685 $ - $ 308,556,685
Other financing costs 59,903 206,897 266,800
$ 308,616,588 $ 206,897 $ 308,823,485
THE ILLINOIS STATE TOLL HIGHWAY AUTHORITYA Component Unit of the State of Illinois
Notes to the Trust Indenture Basis SchedulesDecember 31, 2020
72
(3) Restatement of Fund Balance
The fund balance as of January 1, 2020, has been restated to correct the amount due to the Illinois State Employees Group Insurance Program for retiree health insurance. It was determined that the Tollway’s required payments had been inaccurately calculated through December 31, 2020. As the result of these errors, it was necessary for the Tollway to restate its beginning fund balance for the portion that pertained to years prior to 2020.

73
Schedule 6
Average Daily Average Daily
Transactions* Revenue** Transactions* Revenue**Class of Vehicle
1. Auto, motorcycle, taxi, station wagon,
ambulance, single-unit truck or tractor:
2 axles, 4 tires 1,879,631 $ 522,789,269 2,467,970 $ 726,062,718
2. Single-unit truck or tractor, buses:
2 axles, 6 tires 41,647 31,023,154 47,308 36,631,431
3. Trucks and buses with 3 & 4 axles 54,460 65,378,812 54,670 68,251,926
4. Trucks with 5 or more axles, other
vehicles and toll adjustments 234,261 529,828,659 233,399 549,804,679
TOTAL 2,209,999 $ 1,149,019,894 2,803,347 $ 1,380,750,754
* The "Average Daily Transactions" represents the average daily number of vehicles passing through the toll plazas.
** Toll revenue does not include tolls collected through the Evasion Recovery Program of approximately
$93.2 million and $81.5 million, respectively. These are reported as Toll Evasion Recovery revenue.
2020 2019
THE ILLINOIS STATE TOLL HIGHWAY AUTHORITYA Component Unit of the State of Illinois
Schedule of Toll Revenue by Class of
Vehicles (Unaudited)
For the Years Ended December 31, 2020 and 2019

74
Schedule 7
THE ILLINOIS STATE TOLL HIGHWAY AUTHORITY
Total funds
Year Credited (1)
2006 $ 186,545,035
2007 198,331,687
2008 1,907,175
2009 161,463,238
2010 206,096,487
2011 174,192,997
2012 300,660,937
2013 200,364,611
2014 200,208,079
2015 240,311,545
2016 300,845,345
2017 423,015,675
2018 425,924,437
2019 428,965,993
2020 121,455,373
See accompanying independent auditors' report.
A Component Unit of the State of Illinois
Renewal and Replacement Account (Unaudited)(1)
Trust Indenture Basis (Non-GAAP)
For the Years Ended December 31, 2006 through 2020
(1) Includes earnings on the Renewal and Replacement Account

75
Schedule 8
2020 2019(8) (9) (10)2018 2017 2016(6)(7) 2015(5) 2014(4) 2013(3)
2012 2011
Operating revenue:
Toll revenue $ 1,149,020 $ 1,380,751 $ 1,341,051 $ 1,309,189 $ 1,216,298 $ 1,146,629 $ 968,972 $ 943,152 $ 922,390 $ 652,674
Toll evasion recovery 93,164 81,554 70,469 65,640 64,491 64,323 53,769 54,221 32,599 33,268
Concession and other revenue 26,630 8,864 12,232 13,041 11,481 7,664 12,373 11,537 7,377 10,410
Interest income(1)
13,726 38,455 34,389 13,947 6,529 1,846 1,041 866 1,389 1,064
Total operating revenue 1,282,540 1,509,624 1,458,141 1,401,817 1,298,799 1,220,462 1,036,155 1,009,776 963,755 697,416
Maintenance and operating expenses:
Engineering and maintenance 91,503 95,540 78,404 74,054 53,650 55,477 47,614 43,225 39,144 43,667
Toll services 130,701 136,124 141,981 140,217 109,854 101,415 107,326 106,321 93,590 88,737
Police, safety and communication 45,729 42,190 40,762 37,908 27,256 24,958 27,606 22,551 22,808 23,061
Procurement, IT, finance and
administration 46,334 46,074 47,341 32,077 25,731 23,851 24,192 19,138 19,971 20,522
Insurance and employee benefits 45,935 30,278 27,873 35,282 92,748 92,778 91,082 86,278 77,544 69,988
Total expenses 360,202 350,206 336,361 319,538 309,239 298,479 297,820 277,513 253,057 245,975
Net operating revenues $ 922,338 $ 1,159,418 $ 1,121,780 $ 1,082,279 $ 989,560 $ 921,983 $ 738,335 $ 732,263 $ 710,698 $ 451,441
Total debt service(2)(3)
$ 442,114 $ 419,460 $ 424,244 $ 398,411 $ 387,933 $ 358,846 $ 308,443 $ 297,708 $ 250,253 $ 249,960
Net revenues after debt service(2)
$ 480,224 $ 739,958 $ 697,536 $ 683,868 $ 601,627 $ 563,137 $ 429,892 $ 434,555 $ 460,455 $ 201,481
Debt service coverage(2)
2.09 2.76 2.64 2.72 2.55 2.56 2.39 2.46 2.84 1.81
(1) - Excludes interest income on construction funds.
(2) – Includes, as applicable in years 2011 -2019, synthetic f ixed interest rates as determined under sw ap agreements for 1998 Series B, 2007 Series A, and 2008 Series A.
(3) – In August 2013, the Tollw ay advance refunded a portion of the 2005 A bonds.
(4) – In February 2014, the Tollw ay advance refunded a portion of the 2005 A bonds.
In December 2014, the Tollw ay advance refunded the remainder of the Tollw ay's outstanding 2006 A-1 bonds.
(5) – On July 1, 2015, the Tollw ay redeemed $ 36.81 million principal amount of 2005 A bonds, in advance of their January 1, 2016, scheduled maturity.
(6) – In January 2016, the Tollw ay advance refunded all of the 2008B bonds.
(7) – In April 2016, the Tollw ay redeemed $69.2 million principal amount of 1998B in advance of their January 1, 2017, scheduled maturity.
(8) - In January 2019, the Tollw ay refunded a portion of its 2007 Series A, 2008 Series A and 2009 Series A bonds.
(9) - In November 2019, the Tollw ay refunded all of the 2010 Series A-1 bonds.
(10) - In December 2019, the Tollw ay refunded the remainder of its 2007 Series A and 2008 Series A bonds.
See accompanying independent auditors' report.
(Amounts in thousands)
THE ILLINOIS STATE TOLL HIGHWAY AUTHORITY
A Component Unit of the State of Illinois
Summary of Operating Revenues, Maintenance and OperatingExpenses, Net Operating Revenues and Debt Service Coverage (Unaudited)
Trust Indenture Basis (Non-GAAP))
For the Years Ended December 31, 2011 through December 31, 2020
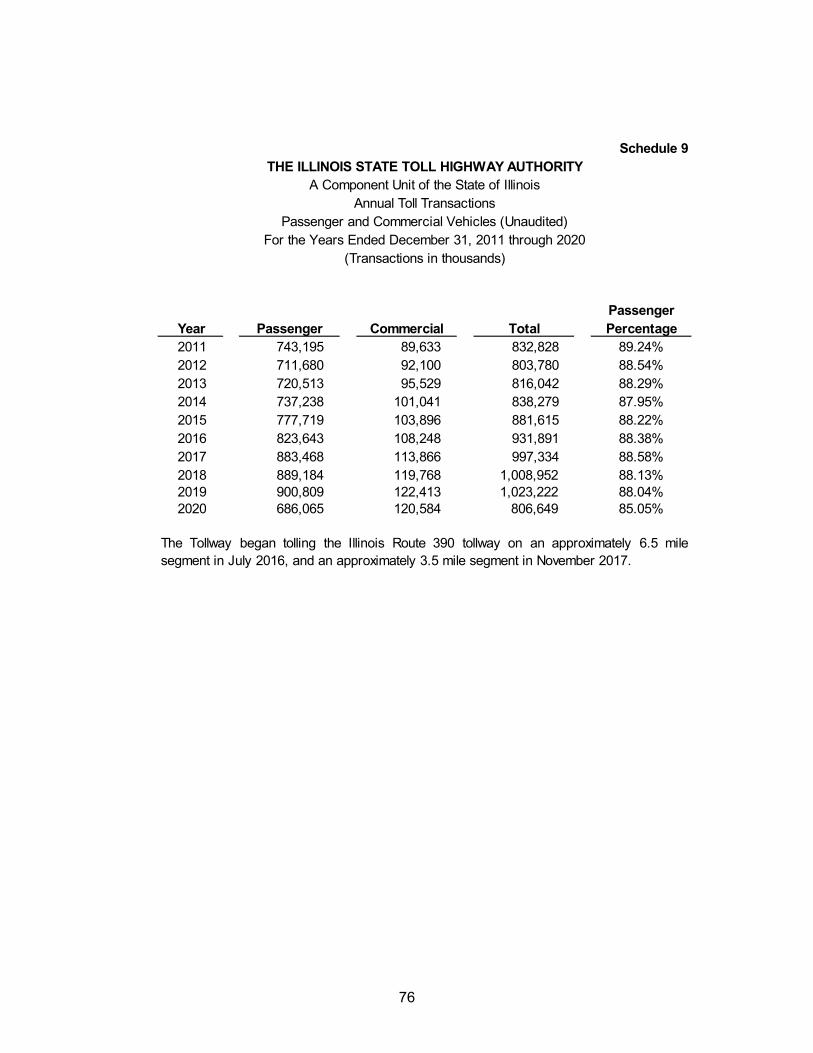
76
Schedule 9
THE ILLINOIS STATE TOLL HIGHWAY AUTHORITY
A Component Unit of the State of Illinois
Annual Toll Transactions
Passenger and Commercial Vehicles (Unaudited)
For the Years Ended December 31, 2011 through 2020
(Transactions in thousands)
Passenger
Year Passenger Commercial Total Percentage
2011 743,195 89,633 832,828 89.24%
2012 711,680 92,100 803,780 88.54%
2013 720,513 95,529 816,042 88.29%
2014 737,238 101,041 838,279 87.95%
2015 777,719 103,896 881,615 88.22%
2016 823,643 108,248 931,891 88.38%
2017 883,468 113,866 997,334 88.58%
2018 889,184 119,768 1,008,952 88.13%2019 900,809 122,413 1,023,222 88.04%2020 686,065 120,584 806,649 85.05%
The Tollway began tolling the Illinois Route 390 tollway on an approximately 6.5 mile
segment in July 2016, and an approximately 3.5 mile segment in November 2017.

77
Schedule 10
THE ILLINOIS STATE TOLL HIGHWAY AUTHORITY
A Component Unit of the State of Illinois
Annual Toll Revenues
Passenger and Commercial Vehicles (Unaudited)
For years 2011 to 2020
(Dollars in thousands)
Passenger
Year Passenger Commercial Total Percentage
2011 $ 354,186 $ 298,488 $ 652,674 54.27%
2012 615,957 306,433 922,390 66.78%
2013 622,349 320,803 943,152 65.99%
2014 630,556 338,416 968,972 65.07%
2015 662,720 483,909 1,146,629 57.80%
2016 686,846 529,452 1,216,298 56.47%2017 724,905 584,285 1,309,190 55.37%2018 719,165 621,886 1,341,051 53.63%2019 726,063 654,688 1,380,751 52.58%2020 522,789 626,231 1,149,020 45.50%
The changed rate structures implemented in 2012 and 2015-2018 contributed to the increaseand decrease, respectively, in the percentage of revenues from passenger vehicles.
See accompanying independent auditors' report.

78
Schedule 11
THE ILLINOIS STATE TOLL HIGHWAY AUTHORITY
A Component Unit of the State of Illinois
Operating Revenues, Maintenance and Operating
Expenses and Net Operating Revenues1 (Unaudited)
For selected years from 1959 to 2020
(Dollars in thousands)
Maintenance Net
Operating and operating operating
revenue expenses revenues
Year:
1959 $ 14,974 $ 4,709 $ 10,265
1969 57,395 13,015 44,380
1979 100,436 39,733 60,703
1989 254,734 85,065 169,669
1994 309,949 116,996 192,953
1999 366,092 146,881 219,211
2004 423,427 198,302 225,125
2009 658,052 255,185 402,867
2010 672,760 250,857 421,903
2011 697,416 245,975 451,441
2012 963,755 253,058 710,697
2013 1,009,776 277,512 732,264
2014 1,036,156 297,821 738,335
2015 1,220,462 298,479 921,983
2016 1,298,799 309,239 989,560
2017 1,401,817 319,538 1,082,279
2018 1,458,141 336,361 1,121,780
2019 1,509,624 350,206 1,159,418
2020 1,282,540 360,202 922,338
(1) Determined according to the Series 1955 Bond Resolution through December 26, 1985,
and in accordance with the Indenture subsequent to December 26, 1985.
See accompanying independent auditors' report.
CLA is an independent member of Nexia International, a leading, global network of independent accounting and consulting firms. See nexia.com/member-firm-disclaimer for details.
CliftonLarsonAllen LLP CLAconnect.com
79
INDEPENDENT AUDITORS’ REPORT ON INTERNAL CONTROL OVERFINANCIAL REPORTING AND ON COMPLIANCE AND OTHER MATTERS
BASED ON AN AUDIT OF FINANCIAL STATEMENTS PERFORMEDIN ACCORDANCE WITH GOVERNMENT AUDITING STANDARDS
Honorable Frank J. MautinoAuditor General, State of Illinois
and
Board of DirectorsThe Illinois State Toll Highway Authority
Report on the Financial Statements
As Special Assistant Auditors for the Auditor General, we have audited, in accordance with the auditing standards generally accepted in the United States of America and the standards applicable to financial audits contained in Government Auditing Standards issued by the Comptroller General of the United States, the financial statements of the business-type activities of the Illinois State Toll Highway Authority (the Tollway), a component unit of the State of Illinois, as of and for the year ended December 31, 2020, and the related notes to the financial statements, which collectively comprise the Tollway’s basic financial statements, and have issued our report thereon dated October 15, 2021.
Compliance and Other Matters
As part of obtaining reasonable assurance about whether the Tollway’s financial statements are free from material misstatement, we performed tests of its compliance with certain provisions of laws, regulations, contracts, and grant agreements, noncompliance with which could have a direct and material effect on the financial statements. However, providing an opinion on compliance with those provisions was not an objective of our audit and, accordingly, we do not express such an opinion. The results of our tests disclosed instances of noncompliance or other matters that are required to be reported under Government Auditing Standards and which are described in the accompanying Schedule of Findings as item 2020-003.
Internal Control Over Financial Reporting
Management of the Tollway is responsible for establishing and maintaining effective internal control over financial reporting (internal control).
In planning and performing our audit of the financial statements, we considered the Tollway’s internal control for the purpose of designing audit procedures that are appropriate in the circumstances for the purpose of expressing our opinion on the financial statements, but not for the purpose of expressing an opinion on the effectiveness of the Tollway’s internal control. Accordingly, we do not express an opinion on the effectiveness of the Tollway’s internal control.

Honorable Frank J. MautinoAuditor General, State of IllinoisAndBoard of DirectorsThe Illinois State Toll Highway AuthorityPage 2
80
Our consideration of internal control was for the limited purpose described in the preceding paragraph and was not designed to identify all deficiencies in internal control that might be material weaknesses or significant deficiencies and, therefore, material weaknesses or significant deficiencies may exist that have not been identified. However, as described in the accompanying Schedule of Findings, we did identify certain deficiencies in internal control that we consider to be material weaknesses and significant deficiencies.
A deficiency in internal control exists when the design or operation of a control does not allow management or employees, in the normal course of performing their assigned functions, to prevent, or detect and correct, misstatements on a timely basis. A material weakness is a deficiency, or a combination of deficiencies, in internal control, such that there is a reasonable possibility that a material misstatement of the entity’s financial statements will not be prevented, or detected and corrected, on a timely basis. We consider the deficiencies described in the accompanying Schedule of Findings as items 2020-001 and 2020-002 to be material weaknesses.
A significant deficiency is a deficiency, or a combination of deficiencies, in internal control that is less severe than a material weakness, yet important enough to merit attention by those charged with governance. We consider the deficiencies described in the accompanying Schedule of Findings as items 2020-003 and 2020-004 to be significant deficiencies.
Tollway’s Responses to the Findings
The Tollway’s responses to the findings identified in our audit are described in the accompanying Schedule of Findings. The Tollway’s responses were not subjected to the auditing procedures applied in the audit of the financial statements and, accordingly, we express no opinion on the responses.
Purpose of this Report
The purpose of this report is solely to describe the scope of our testing of internal control and compliance and the results of that testing, and not to provide an opinion on the effectiveness of the Tollway’s internal control or on compliance. This report is an integral part of an audit performed in accordance with Government Auditing Standards in considering the Tollway’s internal control and compliance. Accordingly, this communication is not suitable for any other purpose.
CliftonLarsonAllen LLP
Oak Brook, IllinoisOctober 15, 2021

THE ILLINOIS STATE TOLL HIGHWAY AUTHORITY A Component Unit of the State of Illinois
Schedule of Findings and Responses For the Year Ended December 31, 2020
Current Findings – GOVERNMENT AUDITING STANDARDS
81
2020-001 FINDING (Significant Understatement of OPEB Balances)
The Illinois State Toll Highway Authority (Tollway) did not identify an allocation error within its other postemployment benefits (OPEB) amounts recorded in its financial statements, resulting in a beginning balance restatement which reduced the Tollway’s unrestricted net position by $505,692,050. During testing, we noted employee-related costs incurred by the Tollway include both Tollway employees and staff of the Illinois State Police (ISP) consisting of four groups, as defined and further described below:
1) “True Tollway Employees” work for the Tollway, including its administrative, engineering, traffic, construction, and maintenance staff. These employees are paid on Tollway payroll vouchers and participate in the Tollway’s own group insurance program. Upon retirement, they transition to the State Employees Group Insurance Program (SEGIP) administered by the State of Illinois, Department of Central Management Services (CMS) for their OPEB. SEGIP does not receive a “retiree-load” charge (a charge added to contributions for current employees to obtain cash to pay benefit costs for retirees on a pay-as-you-go basis) for these employees’ current benefits provided by the Tollway’s own group insurance plan.
2) “ISP District 15 State Troopers” consist of two groups providing personal services within ISP District 15, which patrols the highways and facilities which encompass the Tollway’s operations.
a. The majority of these employees participate in the SEGIP for both their
current employee benefits and OPEB during retirement.
b. Master sergeants, however, can opt-out of SEGIP for healthcare benefits and participate in the Teamsters Local No. 727 Health and Welfare Benefits Fund (union plan) for health insurance along with SEGIP for vision, dental, and life insurance benefits as an employee and then transition to SEGIP for all of their OPEB at retirement.
All troopers are paid on ISP’s payroll vouchers which are charged against the Tollway’s agency number and accounts. These vouchers include contributions to SEGIP for all troopers’ SEGIP-provided benefits. In addition, CMS prepares supplemental billings charged to the Tollway’s accounts for SEGIP to recover the healthcare costs paid to the union plan along with the associated “retiree-load” for SEGIP.
3) “ISP District 15 Support Staff” are Tollway employees supporting the troopers assigned to ISP District 15. These employees are paid on Tollway payroll vouchers and participate in the Tollway’s own group insurance program until they transition to SEGIP for their OPEB at retirement. SEGIP does not receive a “retiree-load” charge calculated on these employees’ current benefits from the Tollway’s own group insurance plan.

THE ILLINOIS STATE TOLL HIGHWAY AUTHORITY A Component Unit of the State of Illinois
Schedule of Findings and Responses For the Year Ended December 31, 2020
Current Findings – GOVERNMENT AUDITING STANDARDS
82
Because the “True Tollway Employees” and “ISP District 15 Support Staff” participate in the Tollway’s group insurance program until retirement, CMS has not charged the “retiree-load” built into active-employee SEGIP contributions to fund pay-as-you-go costs associated with retirees participating in SEGIP. Rather, the Tollway reimburses SEGIP for the pro rata share of the cost of providing retiree benefits to those retirees who had service in “True Tollway Employees” and “ISP District 15 Support Staff” positions compared to their total service credit to the State as determined by the State Employees’ Retirement System of Illinois (SERS), as required by the State Employees Group Insurance Act of 1971 (Act) (5 ILCS 375/11). During our review of the SEGIP allocation, we noted CMS only considered current employee contributions (accounted for within detail object code 1180 group insurance contributions) to SEGIP within its allocation methodology. Both CMS and the Tollway failed to identify the pro rata share for “True Tollway Employees” and “ISP District 15 Support Staff” had not been considered in SEGIP’s State Fiscal Year 2019 allocation, which supported the Tollway’s opening balances for Calendar Year 2020. After bringing this matter to the attention of officials at both the Tollway and CMS, CMS corrected these errors and reallocated SEGIP’s total Fiscal Year 2019 OPEB liability and determined the Tollway’s OPEB balances at January 1, 2020, should have been: OPEB Liability ......................................................................................... $610,337,772 OPEB-related Deferred Inflows of Resources ........................................... $66,818,243 OPEB-related Deferred Outflows of Resources ........................................ $22,095,550 Additionally, Tollway officials recalculated the Tollway’s subsequent contributions to SEGIP for all four groups after considering each group’s unique OPEB characteristics and the impact of the error described in Finding 2020-003, estimating the Tollway’s subsequent contributions to SEGIP balance at January 1, 2020, should have been: OPEB-related Deferred Outflows of Resources ........................................ $19,180,890 Tollway officials are responsible for understanding SEGIP’s allocation methodology and communicating with CMS officials about how the Tollway’s unique group insurance program and governing provision within Section 11 of the Act impact SEGIP’s allocation and Tollway’s OPEB balances. In addition, the Fiscal Control and Internal Auditing Act (30 ILCS 10/3001) requires the Tollway to establish and maintain a system, or systems, of internal fiscal and administrative controls to provide assurance resources and funds applicable to operations are properly recorded and accounted for to permit the preparation of accounts and reliable financial reports. Additionally, the Government Accountability Office’s Standards for Internal Control in the Federal Government (Green Book) (§ 15.02 and § 15.03) endorses an entity’s management having open communication with, and obtaining quality information from, external parties using established reporting lines to help achieve management’s objectives and address related risks.
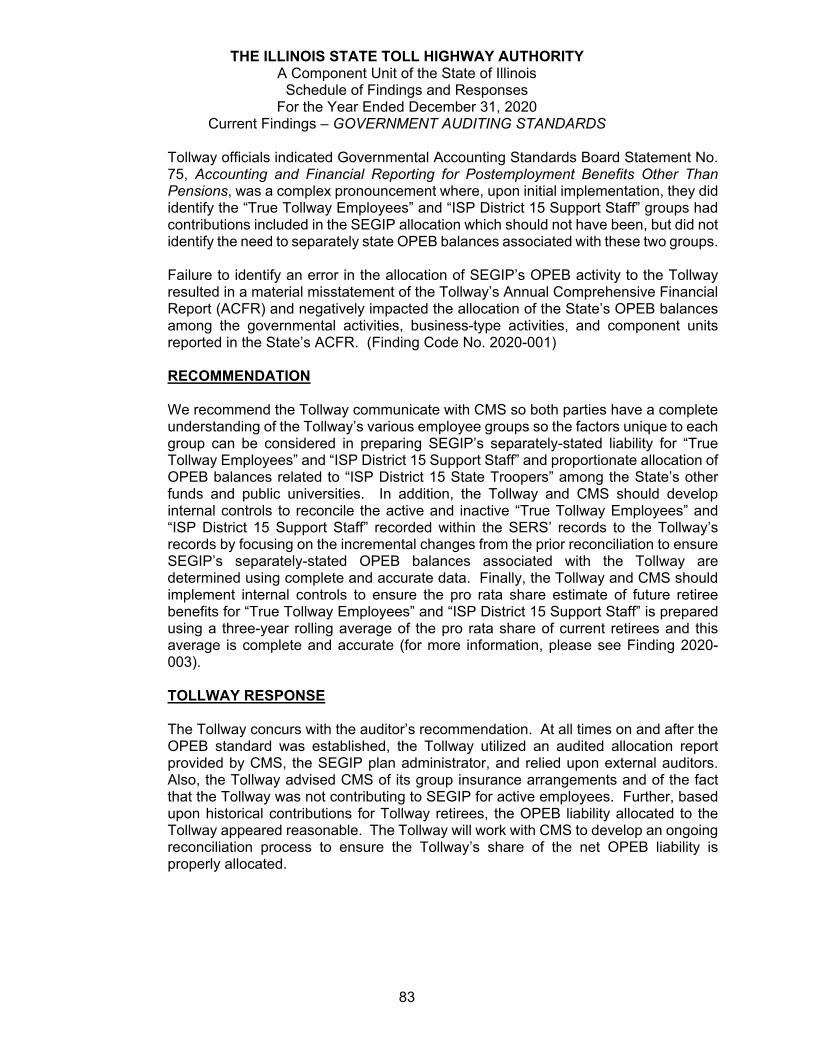
THE ILLINOIS STATE TOLL HIGHWAY AUTHORITY A Component Unit of the State of Illinois
Schedule of Findings and Responses For the Year Ended December 31, 2020
Current Findings – GOVERNMENT AUDITING STANDARDS
83
Tollway officials indicated Governmental Accounting Standards Board Statement No. 75, Accounting and Financial Reporting for Postemployment Benefits Other Than Pensions, was a complex pronouncement where, upon initial implementation, they did identify the “True Tollway Employees” and “ISP District 15 Support Staff” groups had contributions included in the SEGIP allocation which should not have been, but did not identify the need to separately state OPEB balances associated with these two groups. Failure to identify an error in the allocation of SEGIP’s OPEB activity to the Tollway resulted in a material misstatement of the Tollway’s Annual Comprehensive Financial Report (ACFR) and negatively impacted the allocation of the State’s OPEB balances among the governmental activities, business-type activities, and component units reported in the State’s ACFR. (Finding Code No. 2020-001) RECOMMENDATION We recommend the Tollway communicate with CMS so both parties have a complete understanding of the Tollway’s various employee groups so the factors unique to each group can be considered in preparing SEGIP’s separately-stated liability for “True Tollway Employees” and “ISP District 15 Support Staff” and proportionate allocation of OPEB balances related to “ISP District 15 State Troopers” among the State’s other funds and public universities. In addition, the Tollway and CMS should develop internal controls to reconcile the active and inactive “True Tollway Employees” and “ISP District 15 Support Staff” recorded within the SERS’ records to the Tollway’s records by focusing on the incremental changes from the prior reconciliation to ensure SEGIP’s separately-stated OPEB balances associated with the Tollway are determined using complete and accurate data. Finally, the Tollway and CMS should implement internal controls to ensure the pro rata share estimate of future retiree benefits for “True Tollway Employees” and “ISP District 15 Support Staff” is prepared using a three-year rolling average of the pro rata share of current retirees and this average is complete and accurate (for more information, please see Finding 2020-003). TOLLWAY RESPONSE The Tollway concurs with the auditor’s recommendation. At all times on and after the OPEB standard was established, the Tollway utilized an audited allocation report provided by CMS, the SEGIP plan administrator, and relied upon external auditors. Also, the Tollway advised CMS of its group insurance arrangements and of the fact that the Tollway was not contributing to SEGIP for active employees. Further, based upon historical contributions for Tollway retirees, the OPEB liability allocated to the Tollway appeared reasonable. The Tollway will work with CMS to develop an ongoing reconciliation process to ensure the Tollway’s share of the net OPEB liability is properly allocated.

THE ILLINOIS STATE TOLL HIGHWAY AUTHORITY A Component Unit of the State of Illinois
Schedule of Findings and Responses For the Year Ended December 31, 2020
Current Findings – GOVERNMENT AUDITING STANDARDS
84
AUDITOR’S COMMENT The Clarified Statements on Auditing Standards (AU-C § 200.05) published by the American Institute of Certified Public Accountants states:
The financial statements subject to audit are those of the entity, prepared and presented by management of the entity with oversight from those charged with governance. … The audit of the financial statements does not relieve management or those charged with governance of their responsibilities.
As noted in the finding, Tollway officials were responsible for understanding SEGIP’s allocation methodology and communicating with CMS officials about how the Tollway’s unique group insurance program and governing provision within Section 11 of the Act impacted SEGIP’s allocation and Tollway’s OPEB balances. Meanwhile, CMS officials were solely responsible for preparing a complete and accurate allocation schedule for SEGIP, and the Tollway’s governing board and management were solely responsible for preparing complete and accurate financial statements and the Tollway. The fact audits occurred, which were only designed to obtain a high, but not absolute, level of assurance SEGIP’s schedules and the Tollway’s financial statements were not materially misstated, does not relieve the Tollway’s governing board and management nor CMS’ officials of their responsibilities under the professional standards.

THE ILLINOIS STATE TOLL HIGHWAY AUTHORITY A Component Unit of the State of Illinois
Schedule of Findings and Responses For the Year Ended December 31, 2020
Current Findings – GOVERNMENT AUDITING STANDARDS
85
2020-002 FINDING (Need to Enhance Relationship with the Illinois State Police)
The Illinois State Toll Highway Authority (Tollway) needs to update the duties, roles, functions, and responsibilities within its Intergovernmental Agreement (IGA) with the Illinois State Police (ISP). The State Police Act (20 ILCS 2610/20) notes ISP and the Tollway may enter into an IGA to provide for policing of toll highways, including remuneration of police services, which comprise of (1) compensation and training of troopers and clerical employees, (2) uniforms, equipment, and supplies used by the ISP in patrolling the Tollway, and (3) reimbursements for injuries or occupational illnesses suffered by ISP personnel in the line of duty. In accordance with this IGA, ISP has assigned troopers to District 15 who police the Tollway’s highways and facilities, while also allowing for troopers to be diverted to or from District 15 in emergency situations. This IGA was last updated on July 17, 2012. During testing, we noted the following:
The IGA does not address how the Tollway and ISP will implement a census data reconciliation process for the troopers directly paid for by the Tollway to provide assurance census data submitted to the State Employees’ Retirement System of Illinois (SERS) for pension benefits and the State Employees Group Insurance Program administered by the State of Illinois, Department of Central Management Services (CMS) for the troopers’ other postemployment benefits (OPEB) is complete and accurate. Under the current process, we noted:
1) ISP maintains each trooper’s personnel records; 2) ISP is responsible for updating each trooper’s personnel records; 3) the Tollway is responsible for transmitting the census data within each
trooper’s personnel records to SERS and CMS through the Tollway’s transmission of payroll data to the Office of the Comptroller to actually pay the troopers for their work; and,
4) the Tollway is responsible for subsequently ensuring the information transmitted to SERS and CMS agrees with the records maintained by ISP which support the pension and OPEB balances recorded in the Tollway’s financial statements.
The IGA (Part III, Section A) requires the Tollway directly pay the salaries and benefits of troopers assigned to District 15 in accordance with any applicable contract between the ISP and the ISP’s unions, making the troopers effectively Tollway employees for financial reporting purposes. For employers where their employees participate in plans with multiple-employer and cost-sharing features, the American Institute of Certified Public Accountants’ Audit and Accounting Guide: State and Local Governments (AAG-SLG) (§ 13.177 for pensions and § 14.184 for OPEB) notes the determination of net pension/OPEB liability, pension/OPEB expense, and the associated deferred inflows and deferred outflows of resources depends on employer-provided census data reported to the plan being complete and accurate along with the accumulation and maintenance of this data by the plan being complete and

THE ILLINOIS STATE TOLL HIGHWAY AUTHORITY A Component Unit of the State of Illinois
Schedule of Findings and Responses For the Year Ended December 31, 2020
Current Findings – GOVERNMENT AUDITING STANDARDS
86
accurate. To help mitigate against the risk of a plan’s actuary using incomplete or inaccurate census data within similar agent multiple-employer plans, the AAG-SLG (§ 13.181 (A-27) for pensions and § 14.141 for OPEB) recommends an employer annually reconcile its active members’ census data to a report from the plan of census data submitted to the plan’s actuary, by comparing the current year’s census data file to both the prior year’s census data file and its underlying records for changes occurring during the current year. Tollway officials indicated they do not consider it their responsibility to ensure ISP officials reconcile their census data. ISP officials indicated they were not aware of the need to perform annual reconciliations.
The Tollway and ISP have not fully established proper procedures and mutual understanding of what books and records should be shared between the Tollway and ISP to enable complete and accurate financial reporting within the IGA. For example, we noted an instance where Tollway requests for ISP to produce records necessary to determine the completeness and accuracy of OPEB amounts as part of the Tollway’s efforts to correct the conditions noted in Finding 2020-001 was denied by ISP. After follow-up by the Office of the Auditor General and the Governor’s Office of Management and Budget, the ISP would only provide this requested information to us and not to the Tollway’s officials. Ultimately, we had to design alternative procedures to address not receiving this request. This type of routine interaction should be addressed by the IGA as opposed to requiring intervention by other State officials. While the IGA (Part IV, Section B) notes ISP shall supply, upon the request of the Tollway, additional books and records related to the cost or efficiency of providing police services to the Tollway, the IGA does not establish what and how financial and non-financial records needed to prepare financial information are to be supplied between Tollway and ISP officials. Tollway officials indicated they believe ISP officials should have fulfilled this request pursuant to their obligations under the IGA and they did not. ISP officials indicated the protection of the troopers’ personal information is extremely important and they did not want to have information they believed was only needed by the auditors also in the hands of Tollway officials. This position was incorrect, as management – in this case, Tollway officials – needed the data to perform the reconciliation to prepare the Tollway’s financial information, while our responsibility as the auditors was to audit management’s work.
The Tollway and ISP do not appear to have active communication protocols to address financial matters within the IGA. We identified several instances of confusion about the responsibilities of the parties and no clear assigned point

THE ILLINOIS STATE TOLL HIGHWAY AUTHORITY A Component Unit of the State of Illinois
Schedule of Findings and Responses For the Year Ended December 31, 2020
Current Findings – GOVERNMENT AUDITING STANDARDS
87
of contact at both the Tollway and ISP who would oversee their respective party’s interactions with the other party within the IGA. The Government Accountability Office’s Standards for Internal Control in the Federal Government (Green Book) (§ 15.02 and § 15.03) endorses an entity’s management having open communication with, and obtaining quality information from, external parties using established reporting lines to help achieve management’s objectives and address related risks. A good system of internal control would include these protocols within the written IGA. Tollway and ISP officials indicated each group believed, prior to this audit, that the lines of communication were adequate.
The ISP did not timely respond to our inquiries regarding census data testing. We provided the ISP with problems noted from our testing on June 7, 2021, and ISP officials provided responses to these matters over several weeks with the last response to all of the matters on August 18, 2021, 72 days later. The IGA does not address the Tollway’s need for promptness in responses by the ISP, which can negatively impact the Tollway’s ability to have its financial statements audited and posted on the Municipal Securities Rulemaking Board’s Electronic Municipal Market Access system by the deadlines established within the Tollway’s continuing disclosure agreements for its bond issues. Further, Concepts Statement No. 1 of the Governmental Accounting Standards Board, Objectives of Financial Reporting (paragraph 66), states, “If financial reports are to be useful, they must be issued soon enough after the reported events to affect decisions.” Finally, Government Finance Officers Association guidance notes governments should complete and file their Annual Comprehensive Financial Report (ACFR) no later than six months after the end of a government’s fiscal year to be eligible to receive a Certificate of Excellence in Financial Reporting award. Tollway officials indicated they believe ISP officials should have fulfilled our request timelier pursuant to their obligations under the IGA and they did not. ISP officials indicated these delays were due to (1) other competing priorities of staff during the busiest time of the fiscal year, (2) payroll staff working on the new human resources system scheduled to go-live later this fiscal year, (3) additional time needed by staff to review issues that arose from this testing that had not previously been performed by the auditors at ISP, and (4) limited staff numbers.
The ISP has not been able to maintain a minimum staffing level of 175 troopers assigned to District 15.

THE ILLINOIS STATE TOLL HIGHWAY AUTHORITY A Component Unit of the State of Illinois
Schedule of Findings and Responses For the Year Ended December 31, 2020
Current Findings – GOVERNMENT AUDITING STANDARDS
88
The IGA (Part II, Section K) requires, subject to budget availability and certain reassignments and/or diversions allowed for by the IGA, the ISP maintain, at least, 175 troopers with a goal of 196 troopers assigned to District 15. Tollway officials indicated they disagree that the IGA establishes a minimum staffing level due to the express statements that the minimum staffing level is subject to budget availability and certain reassignments and/or diversions. ISP officials indicated shortages are an ISP-wide issue due to several factors including, but not limited to, (1) retirements, (2) troopers seeking promotions and changes in job assignments as agreed to through collective bargaining agreements, and (3) the low response rate from the public of individuals seeking to become a trooper.
In addition, the Fiscal Control and Internal Auditing Act (30 ILCS 10/3001) requires the Tollway establish and maintain a system, or systems, of internal fiscal and administrative controls to provide assurance resources and funds applicable to operations are properly recorded and accounted for to permit the preparation of accounts and reliable financial reports. Further, the Green Book (§ 16.09 and § 17.06) endorses an entity’s management conducting ongoing monitoring of operations to identify internal control deficiencies to remediate those deficiencies by implementing timely and appropriate corrective action. Failure to ensure the IGA between the Tollway and ISP reflects up-to-date duties, roles, functions, and responsibilities and covers all areas of internal control hinders the ability of the Tollway to timely prepare its ACFR and could result in noncompliance with the Tollway’s continuing disclosure requirements for its bond issues. Further, failure to ensure compliance with the minimum number of troopers could hinder efforts to provide timely police services and adequate protection of the Tollway’s highways and facilities. (Finding Code No. 2020-002)
THE ILLINOIS STATE TOLL HIGHWAY AUTHORITY A Component Unit of the State of Illinois
Schedule of Findings and Responses For the Year Ended December 31, 2020
Current Findings – GOVERNMENT AUDITING STANDARDS
89
RECOMMENDATION We recommend the Tollway work with ISP to update its IGA to allow for:
1) performing an initial complete reconciliation of ISP’s census data recorded by SERS and CMS to ISP’s internal records to establish a base year of complete and accurate census data;
2) developing a process to annually obtain from SERS and CMS the incremental changes recorded by SERS and CMS in their census data records and reconcile these changes back to ISP’s internal supporting records;
3) establishing proper procedures and mutual understanding of what books and records can be shared between the Tollway and ISP to facilitate each party’s operations;
4) establishing active communication protocols to address financial matters; and, 5) establishing deadlines for responses reflective of the Tollway’s need to release
its ACFR within six months after the end of its fiscal year. Further, we recommend the Tollway and ISP work together to ensure District 15 has, at least, the minimum number of troopers assigned as required by the IGA. ISP RESPONSE The ISP is currently working with the Tollway to update the IGA and will ensure the recommendations are addressed accordingly. Additionally, there is a cadet class in process for the Tollway which will increase the number of officers above the minimum number of troopers assigned to District 15. TOLLWAY RESPONSE The Tollway agrees with recommendations 1 through 5, but disagrees that the IGA unconditionally requires a minimum staffing level.
As expressly stated in the IGA and agreed by the Tollway and ISP, “ISP District 15 State Troopers” are not Tollway employees. Accordingly, personnel data regarding “ISP District 15 State Troopers” is maintained by ISP rather than the Tollway, and ISP is ultimately responsible for reconciling its census data. The Tollway will work with ISP to ensure the IGA appropriately reflects ISP’s duty to reconcile its census data.
The IGA compels ISP to make books and records relating to the IGA available for review or audit by representatives of the Tollway, the Auditor General, the Executive Inspector General, the Tollway Inspector General, State of Illinois’ internal auditors, and other governmental entities with monitoring authority. Prior to this audit, the Tollway believed that the lines of communication between Tollway and ISP officials were adequate. Nonetheless, the Tollway will work with ISP to ensure that the IGA more specifically (i) addresses the

THE ILLINOIS STATE TOLL HIGHWAY AUTHORITY A Component Unit of the State of Illinois
Schedule of Findings and Responses For the Year Ended December 31, 2020
Current Findings – GOVERNMENT AUDITING STANDARDS
90
need for ISP to provide timely responses to requests for books and records, and (ii) identifies necessary lines of communication.
Regarding District 15 staffing, the IGA expressly states that ISP’s duty to
maintain a minimum staffing level is subject to budget availability, reassignments and/or diversions as provided for in the IGA, and agreements of the parties. Thus, for any of these reasons, the staffing level at District 15 may be below the stated minimum, and the deficiency would not violate the IGA. Accordingly, as set forth in the IGA, ISP does not have an unconditional duty to maintain the minimum staffing level identified in the IGA, and it is the Tollway’s understanding that retirements, changes in job assignments as authorized by ISP collective bargaining agreements and low recruitment levels, among other things, adversely impacted ISP’s ability to provide the minimum staffing level identified in the IGA. The Tollway disagrees with the finding that the IGA requires a minimum number of troopers, unconditionally and without exception. The Tollway currently is funding a cadet class which should enable ISP to assign additional troopers to District 15 and potentially achieve the minimum staffing level identified in the IGA.
AUDITOR’S COMMENT The Tollway has not provided any evidence to indicate Tollway officials had a separate agreement with ISP officials or that budget availability, reassignments, or diversions as allowed for by the IGA occurred during the period resulting in less than 175 troopers being assigned to ISP’s District 15. In fact, as noted in the finding, ISP officials pointed to several ISP-wide issues as being the root cause of not having 175 troopers assigned to District 15, which did not include any of the conditions noted in the response from the Tollway’s officials. We continue to recommend the Tollway work with the ISP to maintain the minimum number of troopers at District 15.

THE ILLINOIS STATE TOLL HIGHWAY AUTHORITY A Component Unit of the State of Illinois
Schedule of Findings and Responses For the Year Ended December 31, 2020
Current Findings – GOVERNMENT AUDITING STANDARDS
91
2020-003 FINDING (Noncompliance with the State Employees Group Insurance Act of 1971)
The Illinois State Toll Highway Authority (Tollway) did not ensure its repayment of the pro rata share of certain retiree costs incurred by the State Employees Group Insurance Program (SEGIP) administered by the State of Illinois, Department of Central Management Services (CMS) was complete and accurate. As further described in Finding 2020-001, employee-related costs incurred by the Tollway include both Tollway employees and staff of the Illinois State Police (ISP) and consist of four groups. The “True Tollway Employees” and “ISP District 15 Support Staff” groups are paid on Tollway payroll vouchers and participate in the Tollway’s group insurance program until they transition to SEGIP for their OPEB at retirement. As these groups participate in the Tollway’s group insurance program until retirement, CMS has not collected the “retiree-load” charge (a charge added to contributions for current employees to obtain cash to pay benefit costs for retirees on a pay-as-you-go basis) built into active-employee SEGIP contributions to fund costs associated with retirees participating in SEGIP. Rather, the State Employees Group Insurance Act of 1971 (Act) (5 ILCS 375/11) requires the Tollway reimburse SEGIP for the pro rata share of the cost of providing retiree benefits to those retirees who had service in “True Tollway Employees” and “ISP District 15 Support Staff” positions compared to their total service to the State. To enable the Tollway and CMS to accomplish this mandate during Calendar Year 2020, the State Employees’ Retirement System of Illinois (SERS) sent the Tollway a monthly extraction of Tollway-associated retirees along with each retiree’s total SERS’ service credit months and months of total service at the Tollway from SERS’ records. Further, this extraction included the State-paid OPEB costs for retirees, except for the State’s costs for “CMS Direct Bill” retirees, which SERS had previously extracted from the Department’s third-party administrator of SEGIP benefits for another purpose. The totality of this report was imported into the Tollway’s systems to generate a monthly invoice, which was sent to and approved by CMS. These monthly invoices were then aggregated together across the calendar year for one cash contribution to SEGIP by the Tollway in February 2021. Under Section 11 of the Act, the Tollway and CMS are solely responsible for ensuring compliance with this mandate. While SERS has some of the historical records necessary for the Tollway and CMS to fulfill this mandate, neither CMS nor the Tollway have communicated with nor entered into a written agreement with SERS so SERS officials could understand the information needs of the Tollway and CMS. As a result, the following occurred:
Each retiree’s service months to the Tollway were not calculated on the same
basis as SERS’ total months of service credit. After consultation with officials at CMS with input from SERS officials, it was determined SEGIP benefits are processed based on the service credit granted by SERS. As such, a month of Tollway service should only be included on the monthly extraction if SERS also granted service credit with the associated month of service.

THE ILLINOIS STATE TOLL HIGHWAY AUTHORITY A Component Unit of the State of Illinois
Schedule of Findings and Responses For the Year Ended December 31, 2020
Current Findings – GOVERNMENT AUDITING STANDARDS
92
The monthly extraction from SERS did not include all retirees from the “True Tollway Employees” and “ISP District 15 Support Staff” groups, while some retirees from the Tollway’s other groups were incorrectly included within the monthly extraction.
The monthly extraction from SERS did not include the State’s costs for “CMS
Direct Bill” retirees. These retirees, as their pension is too small to cover their retiree contribution to SEGIP for their benefits, receive a supplemental billing from the Department for balance due.
Officials at the Tollway and CMS failed to demonstrate the amounts remitted
by the Tollway for the pro rata share of its retirees from the “True Tollway Employees” and “ISP District 15 Support Staff” groups to SEGIP were complete and accurate.
After bringing these problems to the attention of officials at the Tollway, SERS, and CMS, SERS prepared a new data extraction of OPEB costs associated with retirees from the “True Tollway Employees” and “ISP District 15 Support Staff” groups for the months of June 2018, June 2019, and June 2020. The amounts due to SEGIP from these months were used to estimate the total amount due to SEGIP from the 42-month period starting on July 1, 2017, through December 31, 2020. This 42-month period was selected as OPEB records were not timely made available from SERS due to a system conversion at CMS for periods which occurred before July 1, 2017. Tollway officials estimated the Tollway had a net underpayment of contributions to SEGIP for the retirees from the “True Tollway Employees” and “ISP District 15 Support Staff” groups during this 42-month period of $18,438,839. The Tollway recorded an adjustment for this error in the Tollway’s final financial statements. In addition, the impact of this change on the estimated OPEB-related deferred outflows of resources for subsequent contributions to SEGIP was considered in calculating the adjustment further described in Finding 2020-001. Tollway and CMS officials are jointly-responsible for understanding and complying with the retiree cost repayment provisions of Section 11 of the Act. In addition, the Fiscal Control and Internal Auditing Act (30 ILCS 10/3001) requires the Tollway to establish and maintain a system, or systems, of internal fiscal and administrative controls to provide assurance resources and funds applicable to operations are properly accounted for to permit the preparation of accounts and reliable financial reports. Finally, the Government Accountability Office’s Standards for Internal Control in the Federal Government (Green Book) (§ 15.02 and § 15.03) endorses an entity’s management having open communication with, and obtaining quality information from, external parties using established reporting lines to help achieve management’s objectives and address related risks.

THE ILLINOIS STATE TOLL HIGHWAY AUTHORITY A Component Unit of the State of Illinois
Schedule of Findings and Responses For the Year Ended December 31, 2020
Current Findings – GOVERNMENT AUDITING STANDARDS
93
Tollway officials indicated they were unaware of the problems within the file, including the two different bases of monthly service, provided in the extraction by SERS, and they believed the report was accurate because (1) they noticed new retirees appeared on the listing, and (2) CMS approved and returned the monthly reports to the Tollway. Failure to properly calculate reimbursements to SEGIP for the pro rata share of the cost of providing retiree benefits to those retirees who had service in “True Tollway Employees” and “ISP District 15 Support Staff” positions compared to their total service to the State hindered the accuracy of the Tollway’s financial reporting, delayed SEGIP’s receipt of cash and prolonged SEGIP’s payment delays to vendors, and represents noncompliance with State law. (Finding Code No. 2020-003) RECOMMENDATION We recommend the Tollway communicate with CMS and SERS so all parties have a complete understanding of both the overall process and Tollway’s various employee groups so the factors unique to each group can be considered in calculating the Tollway’s monthly retiree OPEB cost repayment pursuant to Section 11 of the Act. When an understanding has been reached, the parties should enter into a formal, written interagency agreement to memorialize each party’s roles and responsibilities to fulfill this mandate. At a minimum, officials at the Tollway and the Department should agree their records for the amount due to SEGIP at June 30 and December 31 each year. In addition, the Tollway should work with CMS and SERS to calculate the total amount past due to SEGIP which can be ascertained or, if necessary, soundly estimated based on available records and contribute this amount to SEGIP as soon as practicable. If, after investigation, the Tollway and CMS determine it is not possible and/or not practicable to comply with Section 11 of the Act both for past periods and future periods, the Tollway and CMS should work with the Governor and the General Assembly to develop a legislative remedy that addresses both the financing needs of SEGIP and facilitates financial reporting in accordance with generally accepted accounting principles. TOLLWAY RESPONSE The Tollway concurs with the auditor’s recommendation. The Tollway will work with CMS and SERS to develop an acceptable method to determine the annual payment due to SEGIP for Tollway retirees.

THE ILLINOIS STATE TOLL HIGHWAY AUTHORITY A Component Unit of the State of Illinois
Schedule of Findings and Responses For the Year Ended December 31, 2020
Current Findings – GOVERNMENT AUDITING STANDARDS
94
2020-004 FINDING (Inadequate Internal Controls over Census Data)
The Illinois State Toll Highway Authority (Tollway) did not have a reconciliation process to provide assurance census data submitted to its pension and other postemployment benefits (OPEB) plans was complete and accurate. Census data is demographic data (date of birth, gender, years of service, etc.) of the active, inactive, or retired members of a pension or OPEB plan. The accumulation of inactive or retired members’ census data occurs before the current accumulation period of census data used in the plan’s actuarial valuation (which eventually flows into each employer’s financial statements), meaning the plan is solely responsible for establishing internal controls over these records and transmitting this data to the plan’s actuary. In contrast, responsibility for active members’ census data during the current accumulation period is split among the plan and each member’s current employer(s). Initially, employers must accurately transmit census data elements of their employees to the plan. Then, the plan must record and retain these records for active employees and then transmit this census data to the plan’s actuary. We noted the Tollway’s employees are members of both the State Employees’ Retirement System of Illinois (SERS) for their pensions and the State Employees Group Insurance Program administered by the State of Illinois, Department of Central Management Services (CMS) for their OPEB. In addition, we noted these plans have characteristics of different types of pension and OPEB plans, including single employer plans and cost-sharing multiple-employer plans. During testing, we noted the following:
1) The Tollway had not performed an initial complete reconciliation of its census data recorded by SERS and CMS to its internal records to establish a base year of complete and accurate census data.
2) After establishing a base year, the Tollway had not developed a process to annually obtain from SERS and CMS the incremental changes recorded by SERS and CMS in their census data records and reconcile these changes back to the Tollway’s internal supporting records.
For employers where their employees participate in plans with multiple-employer and cost-sharing features, the American Institute of Certified Public Accountants’ Audit and Accounting Guide: State and Local Governments (AAG-SLG) (§ 13.177 for pensions and § 14.184 for OPEB) notes the determination of net pension/OPEB liability, pension/OPEB expense, and the associated deferred inflows and deferred outflows of resources depends on employer-provided census data reported to the plan being complete and accurate along with the accumulation and maintenance of this data by the plan being complete and accurate. To help mitigate against the risk of a plan’s actuary using incomplete or inaccurate census data within similar agent multiple-employer plans, the AAG-SLG (§ 13.181 (A-27) for pensions and § 14.141 for OPEB) recommends an employer annually reconcile its active members’ census data to a report from the plan of census data submitted to the plan’s actuary, by comparing the

THE ILLINOIS STATE TOLL HIGHWAY AUTHORITY A Component Unit of the State of Illinois
Schedule of Findings and Responses For the Year Ended December 31, 2020
Current Findings – GOVERNMENT AUDITING STANDARDS
95
current year’s census data file to both the prior year’s census data file and its underlying records for changes occurring during the current year. Further, the Fiscal Control and Internal Auditing Act (30 ILCS 10/3001) requires the Tollway establish and maintain a system, or systems, of internal fiscal and administrative controls to provide assurance resources and funds applicable to operations are properly recorded and accounted for to permit the preparation of accounts and reliable financial reports. Tollway officials indicated they were not aware of the need to perform the annual reconciliations, so they did not request the census data from SERS and CMS to perform the reconciliation. Failure to reconcile active members’ census data reported to and held by SERS and CMS to the Tollway’s records could result in each plan’s actuary relying on incomplete or inaccurate census data in the calculation of the Tollway’s pension and OPEB balances, which may result in a misstatement of these amounts. (Finding Code No. 2020-004) RECOMMENDATION We recommend the Tollway work with SERS and CMS to develop an annual reconciliation process of its active members’ census data from its underlying records to a report from each plan of census data submitted to the plan’s actuary. After completing an initial full reconciliation, the Tollway may limit the annual reconciliations to focus on the incremental changes to the census data file from the prior actuarial valuation, provided no risks are identified that incomplete or inaccurate reporting of census data may have occurred during prior periods. TOLLWAY RESPONSE The Tollway concurs with the auditor’s recommendation. The Tollway has instituted a process to reconcile active employee census data with SERS’ census data. This has been performed in cooperation with SERS for the period ended June 30, 2021, with a plan to reconcile retiree and incremental changes annually going forward.

THE ILLINOIS STATE TOLL HIGHWAY AUTHORITY A Component Unit of the State of Illinois
Prior Year Findings Not Repeated – GOVERNMENT AUDITING STANDARDS For the Year Ended December 31, 2020
96
None


[THIS PAGE INTENTIONALLY LEFT BLANK]

APPENDIX B
CONSULTING ENGINEERS’ REPORT

[THIS PAGE INTENTIONALLY LEFT BLANK]

2021CONSULTING
ENGINEERS REPORTTOLL HIGHWAY SENIOR REVENUE BONDS
2021 SERIES ANovember 22, 2021

Consulting Engineers Report November 22, 2021
CONSULTING ENGINEERS REPORT 1 1 Illinois Tollway History and Capital Program Background ............................. 1
1.1 Prior Legislative Directives .............................................................................................. 1
1.2 Illinois Tollway Capital Projects & Programs Overview .................................................... 2
1.2.1 Congestion-Relief Program: 2004 - 2016 ................................................................................. 2
1.2.2 Move Illinois: The Illinois Tollway Driving the Future .............................................................. 3
1.2.3 Illinois Tollway and the COVID Pandemic ................................................................................ 3
2 Move Illinois: The Illinois Tollway Driving the Future ..................................... 4
2.1 Jane Addams Memorial Tollway (I-90) ............................................................................. 8
2.1.1 Kennedy Expressway to Elgin Toll Plaza – Reconstruct / Add Lane ......................................... 8
2.1.2 Elgin Toll Plaza to IL Route 47 – Reconstruct / Add Lane ......................................................... 8
2.1.3 IL Route 47 to I-39 – Reconstruct / Add Lane .......................................................................... 9
2.1.4 Kennedy Expressway to I-39 – Transit Accommodation .......................................................... 9
2.1.5 Kennedy Expressway to I-39 – ROW Acquisition ................................................................... 10
2.1.6 Kennedy Expressway to I-39 – Utility and Fiber Optic Relocation ......................................... 10
2.1.7 Kennedy Expressway to I-39 – Bridge and Ramp Repairs ...................................................... 10
2.2 Tri-State Tollway (I-94/I-294/I-80) .................................................................................. 11
2.2.1 95th Street to Balmoral Avenue – Reconstruct ...................................................................... 11
2.2.2 Edens Spur – Reconstruct ...................................................................................................... 11
2.2.3 Bishop Ford Expressway to Russell Road – Bridge and Ramp Repairs ................................... 12
2.2.4 Bishop Ford Expressway to Russell Road – ROW Acquisition ................................................ 12
2.2.5 Bishop Ford Expressway to Russell Road – Utility and Fiber Optic Relocation ...................... 12
2.3 Veterans Memorial Tollway (I-355) ................................................................................ 13
2.3.1 I-55 to Boughton Road, Collector-Distributor Roads, North Avenue to Army Trail Road –
Mill, Patch and Overlay ....................................................................................................................... 13
2.3.2 I-55 to Army Trail Road – Mill, Patch and Overlay ................................................................. 13
2.3.3 I-80 to Army Trail Road – Bridge and Ramp Repairs .............................................................. 14
2.3.4 I-80 to Army Trail Road – ROW Acquisition ........................................................................... 14
2.3.5 I-80 to Army Trail Road – Utility and Fiber Optic Relocation ................................................. 14
2.4 Reagan Memorial Tollway (I-88) .................................................................................... 15
2.4.1 York Road to I-290 - Reconstruct ........................................................................................... 15

Consulting Engineers Report November 22, 2021
i
2.4.2 East-West Connector Road Between I-294 and I-88 – Reconstruct ...................................... 15
2.4.3 IL Route 251 to IL Route 56 – Mill, Patch and Overlay ........................................................... 15
2.4.4 Aurora Toll Plaza (61) to IL Route 59 – Mill, Patch and Overlay ............................................ 16
2.4.5 U.S. Route 30 to I-290 – Bridge and Ramp Repairs ................................................................ 16
2.4.6 U.S. Route 30 to I-290 – ROW Acquisition ............................................................................. 17
2.4.7 U.S. Route 30 to I-290 – Utility and Fiber Optic Relocation ................................................... 17
2.5 I-294 / I-57 Interchange ................................................................................................. 17
2.5.1 Ramps to/from Memphis & 147th Street Ramps ................................................................... 17
2.5.2 Tri-State Tollway (I-294) / I-57 Interchange – New Ramps and Structures ........................... 18
2.5.3 Tri-State Tollway (I-294) / I-57 Interchange – ROW Acquisition ............................................ 18
2.5.4 Tri-State Tollway (I-294) / I-57 Interchange – Utility and Fiber Optic Relocation ................. 18
2.6 Elgin O’Hare Western Access Project, IL 390 and I-490 ................................................ 19
2.6.1 EOWA: IL 390 From US 20 to IL 83 – Roadway and Bridge Construction .............................. 19
2.6.2 I-490 South Leg From I-294 to Western Access Interchange – New Roadway Construction
19
2.6.3 I-490 North Leg from Western Access Interchange to I-90 – New Roadway Construction ... 20
2.6.4 Elgin O’Hare Western Access – ROW Acquisition .................................................................. 20
2.6.5 Elgin O’Hare Western Access – Utility and Fiber Optic Relocation ........................................ 21
2.6.6 EOWA Funding by others ....................................................................................................... 21
2.7 Planning for Other Projects ............................................................................................ 22
2.7.1 Planning for Other Projects .................................................................................................... 22
3 Systemwide Improvements and Initiatives..................................................... 23
3.1 Systemwide Maintenance Facilities ............................................................................... 23
3.2 Systemwide Improvements ............................................................................................ 24
3.2.1 Infrastructure Renewal – Bridge, Pavement, Drainage and Safety Appurtenance Repairs ... 24
3.2.2 Infrastructure Enhancements – Business Systems and Toll Collection Upgrades ................. 24
3.2.3 Infrastructure Enhancements – Information Technology and Intelligent Transportation
System Upgrades ................................................................................................................................ 24
3.2.4 Non-Roadway Projects ........................................................................................................... 25
3.2.5 Access Expansion – Service Interchanges .............................................................................. 25
3.2.6 Toll Collection Upgrades – Plaza Modifications for Electronic Tolling Upgrades .................. 26
3.2.7 Program Support .................................................................................................................... 26

Consulting Engineers Report November 22, 2021
ii
3.2.8 Utility and Fiber Optic Relocation .......................................................................................... 26
3.2.9 Systemwide Right-of-Way ...................................................................................................... 27
3.3 Intelligent Transportation System .................................................................................. 27
3.4 Environmental Initiatives ................................................................................................ 31
3.4.1 Expanded Use of Brine for Roadway De-icing ........................................................................ 31
3.4.2 Enhanced Environmental Inspections .................................................................................... 31
3.4.3 Invasives to Energy Research Program .................................................................................. 32
3.4.4 Landscape and Tree Planting Initiative .................................................................................. 33
3.4.5 NPDES MS4 Inspection and Annual Reporting ....................................................................... 33
3.4.6 INVEST Program ..................................................................................................................... 33
3.4.7 Stormwater Management ...................................................................................................... 34
3.5 System Growth .............................................................................................................. 35
4 Condition of the Illinois Tollway System ........................................................ 36
4.1 Transportation Asset Management System ................................................................... 37
4.2 Pavement ...................................................................................................................... 37
4.2.1 Visual Inspection .................................................................................................................... 37
4.2.2 Pavement Structural Evaluation ............................................................................................ 37
4.2.3 Surface Evaluation.................................................................................................................. 38
4.2.4 Summary of Mainline Pavement Condition ........................................................................... 42
4.3 Roadway Appurtenances .............................................................................................. 47
4.3.1 Drainage Systems ................................................................................................................... 47
4.3.2 Safety Appurtenances ............................................................................................................ 48
4.3.3 Pavement Markings and Raised Pavement Markers ............................................................. 50
4.3.4 Roadway Lighting System ...................................................................................................... 51
4.3.5 Right-of-Way Fence ................................................................................................................ 52
4.3.6 Ground-Mounted Traffic Signs ............................................................................................... 52
4.4 Structural Elements ....................................................................................................... 53
4.4.1 Bridges and Large Culverts ..................................................................................................... 53
4.4.2 Structural Walls ...................................................................................................................... 58
4.4.3 Overhead Sign Structures ...................................................................................................... 59
4.5 Facilities ........................................................................................................................ 62
4.5.1 Maintenance Facilities and Miscellaneous Facilities ............................................................. 64

Consulting Engineers Report November 22, 2021
iii
4.5.2 Toll Plazas ............................................................................................................................... 65
4.5.3 Communication Facilities ....................................................................................................... 65
4.5.4 Oases ...................................................................................................................................... 65
4.6 ITS Devices ................................................................................................................... 66
4.7 Electronic Tolling System .............................................................................................. 68
5 Estimated Renewal and Replacement Deposits ............................................ 69
6 Operating Expenses ......................................................................................... 71
6.1 Historic Expenses .......................................................................................................... 71
6.2 Illinois Tollway Operating Expenses .............................................................................. 73
6.2.1 Operations .............................................................................................................................. 73
6.2.2 Business Systems ................................................................................................................... 74
6.2.3 Engineering ............................................................................................................................ 74
6.2.4 Finance ................................................................................................................................... 76
6.3 Estimated Illinois Tollway Operating Expenses .............................................................. 77
7 Conclusion ........................................................................................................ 79

Consulting Engineers Report November 22, 2021
iv
List of Tables
Table 1: Move Illinois Program – Estimated Program Expenditures ............................ 7
Table 2: Flooding Locations and Mitigation ................................................................ 34
Table 3: Growth of the Illinois Tollway System per Corridor (By Lane Miles) ............. 35
Table 4: CRS Rating System ..................................................................................... 38
Table 5: Summary of Mainline Pavement CRS Ratings from the 2019 Evaluation (Lane Miles) ................................................................................................. 39
Table 6: Summary of Mainline Pavement RSL Values from the 2019 Evaluation (Lane Miles) ................................................................................................. 42
Table 7: Overall Condition Index Rating Descriptions ................................................ 55
Table 8: Bridge Inspection Summary ......................................................................... 55
Table 9: Structural Wall Inspection Condition Rating Summary ................................. 58
Table 10: Structural Wall Inspection Summary ............................................................ 59
Table 11: Overhead Sign Structures Inspection Condition Rating Summary ............... 60
Table 12: Overhead Sign Structure Inspection Summary ............................................ 61
Table 13: Facilities Inspection Ratings Summary ........................................................ 63
Table 14: ITS Device Summary ................................................................................... 66
Table 15: ITS Rating System ....................................................................................... 67
Table 16: Estimated Annual Renewal and Replacement Deposits .............................. 70
Table 17: 2020 Budgeted Expenditures ....................................................................... 72
Table 18: Growth in Illinois Tollway System ................................................................. 75
Table 19: State Employees’ Retirement System – Employer Contribution Rate .......... 77
Table 20: Estimated Operating Expenses .................................................................... 78
1 Important: This report is subject to limitations contained in the Official Statement and
Part 7.0 below.

Consulting Engineers Report November 22, 2021
1
1 Illinois Tollway History and Capital Program Background The Illinois Tollway is a user-financed administrative agency of the State of Illinois whose purpose is to operate, maintain and service a system of toll roads located in Northern Illinois (Illinois Tollway system). The Illinois Tollway began in 1953 as the Illinois State Toll Highway Commission, created by an act of the Illinois State Legislature. The Illinois State Toll Highway Commission was directed by the Legislature to construct the original 187 miles of the Illinois Tollway system that included the Tri-State, Northwest (now the Jane Addams Memorial) and East-West (now the Reagan Memorial) Tollways. These routes opened to traffic in 1958. On April 1, 1968, the Illinois State Toll Highway Commission became the Illinois State Toll Highway Authority (hereafter referred to as the Illinois Tollway).
The Illinois Tollway system has played a key role in the transportation network in Northern Illinois. When it opened in 1958, it was originally envisioned as a bypass to route traffic around the urban core of Chicago. Over the last six decades, the Illinois Tollway system has evolved to also serve commercial and commuter traffic throughout Northern Illinois and within the Chicago metropolitan region. Expansion of the system through the construction of extensions, new routes and capacity improvements were implemented to keep pace with overall traffic growth in the region and the demand for reliable and efficient transportation. Improvements to the Illinois Tollway system have been made in coordination with and in response to regional and state-level transportation planning objectives.
1.1 Prior Legislative Directives The Illinois Tollway system has grown over the last six decades as a result of several legislative directives:
• In 1970, the Governor approved the construction of the Reagan Memorial Extension (originally called the East-West Extension), between IL Route 56 west of Aurora and US Route 30 near Sterling – Rock Falls, which added an additional 69.5 miles to the system. This extension was included in the original authorization for the Illinois Tollway system but was not included in the original construction. This route was opened to traffic in 1974.
• In 1984, the Illinois State Legislature directed the Illinois Tollway to construct the Veterans Memorial Tollway (originally called the North-South Tollway), which added an additional 17.5 miles to the system. This route opened to traffic in 1989.
• In July 1993, the Illinois General Assembly authorized the Illinois Tollway to construct the south extension of the Veterans Memorial Tollway from I-55 to I-57. The portion from I-55 to I-80 opened to traffic in November 2007. The portion from I-57 to I-80 has not moved forward. The following projects authorized in July 1993 have also not moved forward: a north extension of Illinois Route 53 from Lake-Cook Road to Illinois Route 120 in Grayslake and east to I-94, and a Richmond Extension from Illinois Route 120 in Grayslake to the Illinois-Wisconsin border near Richmond, Illinois.
Consulting Engineers Report November 22, 2021
2
• In 1995, the Illinois Tollway was authorized to construct the Elgin O’Hare Extension and the Western O’Hare Bypass. Studies by the Illinois Department of Transportation have been completed for the Elgin O’Hare Extension and the Western O’Hare Bypass. The projects are now known as Illinois Route 390 (IL 390) and I-490 respectively and are identified within the Move Illinois Program described below. In addition, the Move Illinois Program includes studies for a northern extension of the Veterans Memorial Tollway (Illinois Route 53), referred to as the Tri-County Access Study.
1.2 Illinois Tollway Capital Projects & Programs Overview Illinois Tollway capital expenditures are generally categorized into two categories, Improvement (I) and Renewal and Replacement (RR). Expenditures classified as improvements are typically those that add capacity/lane miles and/or improve operations of the existing system. Expenditures classified as renewal and replacement projects are those intended for the purposes of maintaining the existing, baseline system at a state of good repair.
Multi-year capital programs are packages of capital projects that are periodically developed and implemented over a period of years to address the evolving transportation goals and needs of the region and to ensure the longevity of the system, as well as create jobs, stimulate local economy and alleviate congestion. Funding for these programs is provided through user fees (i.e., tolls), concession and miscellaneous revenues, investment earnings and revenue bonds.
1.2.1 Congestion-Relief Program: 2004 - 2016 In 2004, the Illinois Tollway Board approved a $5.3 billion 10-Year Congestion-Relief Plan to address the condition of existing infrastructure, congestion, the needs of growing communities and the enhancement of local economies. Known as the Congestion-Relief Program (CRP), this program evolved through the regional long-range planning process, coordination with local communities and planning agencies, a comprehensive re-evaluation of the entire Illinois Tollway system and an extensive review of the condition of the Illinois Tollway’s then 274-miles of roadways and structures.
The key components of the CRP were to reconstruct or rehabilitate nearly all of the aging infrastructure across the Illinois Tollway system and to convert the mainline toll plazas to open road tolling in order to eliminate the need for users to stop and pay tolls on the mainline. Many existing corridors were widened to provide additional capacity, and I-355 was extended 12 miles south from I-55 to I-80.
The CRP was closed out in 2018 having achieved all program goals.

Consulting Engineers Report November 22, 2021
3
1.2.2 Move Illinois: The Illinois Tollway Driving the Future In 2011, the Illinois Tollway Board approved the 15-year Move Illinois capital improvement program to address the overall age and condition of the system not reconstructed in the CRP, as well as provide additional mobility and congestion-relieving improvements. The Move Illinois Program is discussed in more detail in the subsequent section of this report.
1.2.3 Illinois Tollway and the COVID Pandemic In response to the unprecedented pandemic emergency event, the Illinois Tollway acted quickly to ensure the safety of its staff and customers and to continue to deliver on its commitment to operate and maintain its facilities to the highest standards. Through deliberate and effective actions of its Leadership, the Illinois Tollway rapidly and successfully deployed an action plan to transition its office-based staff to a sustainable telework environment, and in coordination with state health and emergency management officials, instituted appropriate steps to protect its maintenance and operations staff who are essential to providing service to its customers. These actions, supported through the strong commitment of staff at all levels, ensured the Illinois Tollway ability to maintain the highest levels of service during this global health situation.
The Illinois Tollway is positioned to continue to deliver projects for its capital program known as the Move Illinois Program, including major contracts related to the Central Tri-State (I-294) and Elgin O’Hare Western Access projects, along with renewal and replacement projects planned as part of its Systemwide Program.

Consulting Engineers Report November 22, 2021
4
2 Move Illinois: The Illinois Tollway Driving the Future As required by the Toll Highway Act, the Illinois Tollway undertook a process to develop a long-term capital plan, which resulted in a comprehensive 15-year capital program to complete the rebuilding of the 55-year-old system and commit approximately $12 billion in transportation funding to improve mobility, relieve congestion, reduce pollution and link economies across Northern Illinois. Move Illinois: The Illinois Tollway Driving the Future (Move Illinois Program) mapped out the Illinois Tollway’s next capital program for 2012 – 2026. Current projections are for the Program to be completed by 2027. The basis for Move Illinois: The Illinois Tollway Driving the Future was a capital needs analysis performed by Illinois Tollway staff and consultants that included a comprehensive assessment of the current and future physical and operational characteristics of the entire Illinois Tollway system. Previous long-range plans were reevaluated, the needs of communities and stakeholders were catalogued, and new technology and transit opportunities were explored.
On August 25, 2011, the Illinois Tollway Board of Directors approved a $12.1 billion long-range plan for the Illinois Tollway system known as “Move Illinois: The Illinois Tollway Driving the Future.” Upon Board approval, it became known as the “Move Illinois Program”. The key goals of the Move Illinois Program are to:
• Save drivers time and money • Stimulate and drive the economic engine • Build a 21st century transportation system • Take care of the existing system • Be the “cleanest and greenest” program in history
These goals ensure national and international competitiveness with other major cities in the U.S. and around the world. To achieve these goals, a program was developed using a two-pronged approach: maintain the existing Illinois Tollway system and enhance regional mobility with new priority projects. The program and the projects that make up Move Illinois are further described in later sections of this report, including an amendment of the program that increased its budget from $12.15 billion to $14.27 billion. The program cost is currently estimated at $14.092 billion. Bond proceeds and Illinois Tollway revenues are being used to fund Move Illinois. The program outlined in this report funds necessary improvements to the existing Illinois Tollway system. These needs are programmed to be performed at the time appropriate to maintain the existing 294 centerline miles in a state of good repair. These projects include:
• Reconstruct, and widen for significant portions, the Central Tri-State Tollway (I-294) from 95th Street to Balmoral Avenue and the Edens Spur (I-94)
• Reconstruct and widen the Jane Addams Memorial Tollway (I-90) from near O’Hare to the I-39 interchange in Rockford (substantially completed)
• Preserving the Reagan Memorial Tollway (I-88) • Preserving the Veterans Memorial Tollway (I-355) • Repairing roads, bridges and maintenance facilities • Other capital projects

Consulting Engineers Report November 22, 2021
5
In addition, the program funds new priority projects that focus on enhancing regional mobility, including:
• Constructing a new interchange at I-294/I-57 and 147th Street ramps • Completing Elgin O’Hare Western Access, including rehabilitation and widening of the
existing IL 390, construction of an extension of IL 390, and construction of I-490 between I-90 and I-294
• Implementing features to accommodate transit and provide increased flexibility for passenger vehicles on the Jane Addams Memorial Tollway (I-90)
• Planning for other routes as determined by the Board of Directors
The Consulting Engineers rely on the Program Management Office (PMO) to provide scopes of work and estimates of construction costs. The PMO utilizes several methods for verifying the various types of estimates, and while the Consulting Engineers have not independently verified the PMO’s methods, the review conducted shows that the cost-tracking and estimating practices presently used by the PMO for Move Illinois appear to be appropriate.
It should be noted that under the Consulting Engineers contract, cost-estimating services are provided to the Illinois Tollway and are directed by the PMO. The Consulting Engineers provided the PMO with annual costs associated with major maintenance for segments of the system required before reconstruction or rehabilitation projects are implemented. These costs are included in the Bridge and Ramp Repairs and other projects described within this section.
The project construction costs (for projects other than Systemwide Improvements) and durations were developed by the PMO and are predicated on the following basic assumptions:
1. Project construction will be in general conformance with past Illinois Tollway practices
2. Construction scope and schedule shall be as described below
3. Construction costs are escalated to the mid-point of construction
4. Escalation rate is 5% APR, compounded annually, unless noted otherwise
5. No unforeseen conditions / circumstances or unusual price escalation not currently identified will occur
As year five of the $12.1 billion Move Illinois Program began, the Illinois Tollway went through a process to validate corridor estimates across the program. The program estimates were adjusted to account for less than expected cost escalation since 2012. In addition, contracts completed in the early years of the program have closed out. As a result of the less than expected cost escalation, favorable construction industry market conditions and closing of projects, expenditures have been less than anticipated in some corridors, such as the Tri-State I-294/I-57 Interchange, Systemwide Maintenance Facilities, Reagan Memorial Tollway (I-88), Veterans Memorial Tollway (I-355) and Tri-State Edens Spur (I-94). This provided an opportunity to re-allocate funds into the Tri-State corridor where the funds could be better utilized as the corridor progresses through design development.

Consulting Engineers Report November 22, 2021
6
In April 2017, the Illinois Tollway Board of Directors authorized an amendment of the Move Illinois Program which increased the amount for the central portion (Balmoral Avenue – 95th Street) of the Tri-State Tollway (I-294) (the “Central Tri-State”) by approximately $2.1 billion, from $1.9 billion to $4.0 billion, increasing the total cost budget of the Move Illinois Program from $12.15 billion to $14.27 billion. The current cost estimate at completion is $14.092 billion. Enhancements included in the new Central Tri-State scope are allowing the Illinois Tollway to rebuild roadway and improve bridges on the 22-mile-long portion of I-294, as well as construct additional lanes to relieve congestion, improve interchanges to increase access and work to deliver solutions for stormwater, noise abatement and freight.
The table below provides the estimated annual program expenditures required to fund the current Move Illinois Program. This table is based upon information provided by: (i) the Illinois Tollway for the years 2012 through 2020; and (ii) the PMO, for the years 2021 through 2027.

Consulting Engineers Report November 22, 2021
7
Table 1: Move Illinois Program – Estimated Program Expenditures
Year
Move Illinois Program Estimated
Program Expenditures 1
(Millions)
2012 $108.2
2013 $502.2
2014 $886.7
2015 $1,239.2
2016 $985.2
2017 $747.0
2018 $919.5
2019 $941.6
2020 $1,102.8 $1,437.0 $1,445.8 $1,155.4 $1,038.2 $745.4 $575.9 $293.6
2021 $1,326.8 $1,437.0 $1,445.8 $1,155.4 $1,038.2 $745.4 $575.9 $293.6
2022 $1,486.4 $1,437.0 $1,445.8 $1,155.4 $1,038.2 $745.4 $575.9 $293.6
2023 $1,261.4 $1,437.0 $1,445.8 $1,155.4 $1,038.2 $745.4 $575.9 $293.6
2024 $1,040.5 $1,437.0 $1,445.8 $1,155.4 $1,038.2 $745.4 $575.9 $293.6
2025 $756.6 $1,40
$1,445.8 $1,155.4 $1,038.2 $745.4 $575.9 $293.6
2026 $537.8 $1,437.0 $1,445.8 $1,155.4 $1,038.2 $745.4 $575.9 $293.6
2027 $273.4 $1,437.0 $1,445.8 $1,155.4 $1,038.2 $745.4 $575.9 $293.6
Total $14,092.0
Notes: 1
From time to time, the Illinois Tollway may receive reimbursements under various intergovernmental agreements. Estimated program expenditures do not assume credit for such reimbursements with the following exceptions:
• For completed years (2012 – July 2021), the totals are net of reimbursements received under various intergovernmental agreements totaling $163.0 million.
• A credit of $300 million is assumed for the Elgin O’Hare Western Access project (EOWA). The program anticipates contributions from local, federal and other sources valued at approximately $300 million in years 2017 and 2021-2026 for interchange and access improvements, of which agreements totaling $146.8 million have been received, of which $32.9 million has been earned.
• Year 2027 includes $85.1 million in potential budgetary reserve within the Central Tri-State project, a projected net surplus of cumulative bid savings, reduced management reserve against escalated costs.
• The sum of the amounts in Table 1 total to an amount $23.2 million greater than the total shown. This discrepancy is primarily due to [timing differences in recognizing work earned between the Tollway, which provides the amounts for 2012 – 2020, the PMO provides the amounts for 2021 – 2027].
Consulting Engineers Report November 22, 2021
8
The following Sections 2, 3.1 and 3.2 provide descriptions of major projects within the Move Illinois Program, including cost and timing estimates. The total current budget is $14.255 billion, reduced from the original budget of $14.273 billion. The difference between the total current budget and the total shown in the Table 1 is the $163.0 million received under various intergovernmental agreements referenced in the second note above. The sum of the costs of all projects described in Sections 2, 3.1 and 3.2 is $14.092 billion. The difference between that total and the aforementioned $14.255 billion current budget is an $85 million budgetary reserve within the Central Tri-State project described in Section 2.2.1.
2.1 Jane Addams Memorial Tollway (I-90)
2.1.1 Kennedy Expressway to Elgin Toll Plaza – Reconstruct / Add Lane Length: 25.0 miles
Project Description: Reconstruct & widen from six to eight lanes.
Project Benefits:
• Provide congestion relief by expanding the roadway from six to eight lanes
• Provide median lane and median shoulder widening in each direction
• Improve safety and mobility throughout the corridor
• Reduce annual maintenance costs
• Improve ride quality and traffic flow by replacing 50+ year-old pavement
• Upgrade to current standards and operational requirements
Construction Period: 2013-2016
Total Cost: $1,477.0 million
No adjustments in cost or schedule from the 2020 Consulting Engineers Report.
2.1.2 Elgin Toll Plaza to IL Route 47 – Reconstruct / Add Lane Length: 7.5 miles
Project Description: Reconstruct & widen from four lanes to six lanes.
Project Benefits:
• Provide congestion relief by expanding the roadway from four to six lanes
• Provide median lane and median shoulder widening in each direction
• Improve safety and mobility throughout the corridor
• Reduce annual maintenance costs
• Improve ride quality and traffic flow by replacing 50+ year-old pavement
• Upgrade to current standards and operational requirements
Construction Period: 2013-2015

Consulting Engineers Report November 22, 2021
9
Total Cost: $202.1 million
No adjustments in cost or schedule from the 2020 Consulting Engineers Report.
2.1.3 IL Route 47 to I-39 – Reconstruct / Add Lane Length: 29.0 miles
Project Description: Reconstruct & widen from four to six lanes.
Project Benefits:
• Provide congestion relief by expanding the roadway from four to six lanes
• Provide median lane and median shoulder widening in each direction
• Improve safety and mobility throughout the corridor
• Reduce annual maintenance costs
• Improve ride quality and traffic flow by replacing 50+ year-old pavement
• Upgrade to current standards and operational requirements
Construction Period: 2013-2015
Total Cost: $482.0 million
No adjustments in cost or schedule from the 2020 Consulting Engineers Report.
2.1.4 Kennedy Expressway to I-39 – Transit Accommodation Length: 61.5 miles
Project Description: Miscellaneous improvements to allow future transit accommodation that are contracted as part of the roadway and bridge reconstruction and widening projects. The costs of median lane widening and median shoulder widening to accommodate transit are included in the section costs above. This widened cross section could be used for future operational improvements. SMART technology initiatives are also included within the main roadway sections above.
Project Benefits:
• Allow operation of a Bus Rapid Transit (BRT) system (by others)
• Allow for accommodation of rail transit in the future (by others)
• Provide basic infrastructure for lane management of transit and Illinois Tollway system users
Construction Period: 2013-2015 (Note: Transit Accommodation construction timeline includes those forecasted in main roadway sections above)
Total Cost: $0.9 million
No adjustments in cost or schedule from the 2020 Consulting Engineers Report.

Consulting Engineers Report November 22, 2021
10
2.1.5 Kennedy Expressway to I-39 – ROW Acquisition Length: 61.5 miles
Project Description: Acquire right-of-way (ROW) and easements necessary for roadway and bridge reconstruction and widening.
Project Benefits:
• Allow projects to move forward with optimal design elements
Period: 2012-2021
Total Cost: $13.7 million
The estimated project cost was increased from $13.3 million in the 2020 Consulting Engineers Report due to utility and fiber optic relocation related invoices and subsequent estimates.
2.1.6 Kennedy Expressway to I-39 – Utility and Fiber Optic Relocation Length: 61.5 miles
Project Description: Relocate Illinois Tollway-owned fiber optic and private utilities to accommodate roadway and bridge reconstruction and widening.
Project Benefits:
• Allows projects to move forward with optimal design elements
• Maintains Illinois Tollway fiber optic continuity
• Modernize utilities crossing Illinois Tollway right-of-way as necessary
Construction Period: 2012-2016
Total Cost: $159.7 million
The estimated project cost was increased from $157.8 million in the 2020 Consulting Engineers Report due to utility and fiber optic relocation related invoices and subsequent estimates.
2.1.7 Kennedy Expressway to I-39 – Bridge and Ramp Repairs Length: 61.5 miles
Project Description: Reconstruct or rehabilitate crossroad bridges and ramps.
Project Benefits:
• Upgrade to current standards and operational requirements
• Preserve and maintain the crossroad structures and ramps
• Reduce maintenance costs
Construction Period: 2013-2025
Total Cost (Escalated, 4%): $23.8 million No adjustments in cost from the 2020 Consulting Engineers Report but has minor revision in schedule from an ending year of 2026 to 2025.

Consulting Engineers Report November 22, 2021
11
2.2 Tri-State Tollway (I-94/I-294/I-80)
2.2.1 95th Street to Balmoral Avenue – Reconstruct Length: 22.3 miles
Project Description: Reconstruction of existing eight lanes and capacity enhancement from widening.
Project Benefits:
• Improve ride quality and traffic flow by replacing 50+ year‐old pavement
• Better accommodate current and future traffic demand with the addition of a Flex Lane
• Improved operations at the I-290 Interchange
• Improvements at I-55 to reduce mainline congestion
• Reduce annual maintenance costs
• Upgrade to current standards and operational requirements
Construction Period: 2018-2027
Total Cost (Escalated, 4%): $3,513.4 million
The estimated project cost was adjusted from $3,553.7 million in the 2020 Consulting Engineers Report due to updated cost estimates.
2.2.2 Edens Spur – Reconstruct Length: 5.0 miles
Project Description: Reconstruct existing four lanes of pavement.
Project Benefits:
• Improve ride quality and traffic flow by replacing 50+ year‐old pavement
• Reduce annual maintenance costs
• Upgrade to current standards and operational requirements
Construction Period: 2018-2021
Total Cost: $113.6 million
The estimated project cost was adjusted from $111.8 million in the 2020 Consulting Engineers Report due to updated cost estimates.

Consulting Engineers Report November 22, 2021
12
2.2.3 Bishop Ford Expressway to Russell Road – Bridge and Ramp Repairs Length: 78.0 miles
Project Description: Reconstruct or rehabilitate crossroad bridges and ramps.
Project Benefits:
• Upgrade to current standards and operational requirements
• Preserve and maintain the crossroad structures and ramps
• Reduce maintenance costs
Construction Period: 2012-2027
Total Cost (Escalated, 4%): $225.3 million
The estimated project cost was adjusted from $293.2 million in the 2020 Consulting Engineers Report due to projects that were deferred and the funds reallocated to cover estimated cost increases on Elgin O’Hare.
2.2.4 Bishop Ford Expressway to Russell Road – ROW Acquisition Length: 78.0 miles
Project Description: As necessary during reconstruction or repair projects, will provide right-of-way and easements for improvements.
Project Benefits:
• Allows projects to move forward with optimal design elements
Period: 2017-2027
Total Cost (Escalated, 4%): $152.3 million
The estimated project cost was adjusted from $147.6 million in the 2020 Consulting Engineers Report due to increased parcel acquisition costs and the timing of ROW acquisitions.
2.2.5 Bishop Ford Expressway to Russell Road – Utility and Fiber Optic Relocation
Length: 78.0 miles
Project Description: As necessary during reconstruction or repair projects, will provide relocation of fiber optic and private utilities for improvements.
Project Benefits: • Allows projects to move forward with optimal design elements
• Maintains Illinois Tollway fiber optic continuity
• Modernizes utilities crossing Illinois Tollway right-of-way as necessary
Construction Period: 2017-2024

Consulting Engineers Report November 22, 2021
13
Total Cost (Escalated, 4%): $161.8 million
The estimated project cost was adjusted from $161.5 million in the 2020 Consulting Engineers Report due to updated estimates for utility projects and fiber optic relocations.
2.3 Veterans Memorial Tollway (I-355)
2.3.1 I-55 to Boughton Road, Collector-Distributor Roads, North Avenue to Army Trail Road – Mill, Patch and Overlay
CONSTRUCTION COMPLETE
Length: 17.5 miles
Project Description: Rehabilitate remaining original (1992) I-355 pavement between I-55 and Army Trail Road. Add safety improvements throughout.
Project Benefits:
• Preserve and maintain the existing pavement
• Improve ride quality and traffic flow
• Reduce annual maintenance costs
• Upgrade to current standards and operational requirements
Construction Period: 2013
Total Cost: $19.8 million
No adjustments in cost or schedule from the 2020 Consulting Engineers Report.
2.3.2 I-55 to Army Trail Road – Mill, Patch and Overlay Length: 17.5 miles
Project Description: Second rehabilitation of the original I-355 pavement between I-55 and Army Trail Road.
Project Benefits: • Preserve and maintain the existing pavement
• Improve ride quality and traffic flow
• Reduce annual maintenance costs
• Upgrade to current standards and operational requirements
Construction Period: 2018-2020
Total Cost: $142.9 million
The estimated project cost was adjusted from $141.0 million in the 2020 Consulting Engineers Report due to updated contract projections.

Consulting Engineers Report November 22, 2021
14
2.3.3 I-80 to Army Trail Road – Bridge and Ramp Repairs Length: 30.0 miles
Project Description: Reconstruct or rehabilitate crossroad bridges and ramps.
Project Benefits: • Upgrade to current standards and operational requirements
• Preserve and maintain the crossroad structures and ramps
• Reduce maintenance costs
Construction Period: 2018-2026
Total Cost (Escalated, 4%): $14.8 million
The estimated project cost was adjusted from $102.7 million in the 2020 Consulting Engineers Report due to projects deferred to allow for funds to be reallocated to cover estimated cost increases on Elgin O’Hare, and there were related changes to the schedule.
2.3.4 I-80 to Army Trail Road – ROW Acquisition Length: 30.0 miles
Project Description: As necessary during reconstruction or repair projects, will provide right-of-way and easements for improvements.
Project Benefits:
• Allows projects to move forward with optimal design elements
Period: 2023-2026
Total Cost (Escalated, 4%): $0.5 million
No adjustments in cost but a revised schedule from 2020 Consulting Engineers Report.
2.3.5 I-80 to Army Trail Road – Utility and Fiber Optic Relocation Length: 30.0 miles
Project Description: As necessary during reconstruction or repair projects, will provide relocation of fiber optic and private utilities for improvements.
Project Benefits:
• Allows projects to move forward with optimal design elements
• Maintains Illinois Tollway fiber optic continuity
• Modernizes utilities crossing Illinois Tollway right-of-way as necessary
Construction Period: 2016-2023
Total Cost (Escalated): $1.3 million
No adjustments in cost but a revised schedule from 2020 Consulting Engineers Report.

Consulting Engineers Report November 22, 2021
15
2.4 Reagan Memorial Tollway (I-88)
2.4.1 York Road to I-290 - Reconstruct Length: 1.5 miles
Project Description: Reconstruct existing four and six lanes of pavement.
Project Benefits:
• Improve ride quality and traffic flow by replacing 50+ year‐old pavement
• Reduce annual maintenance costs
• Upgrade to current standards and operational requirements
Construction Period: 2018-2020
Total Cost: $62.6 million
The estimated project cost was increased from $62.2 million in the 2020 Consulting Engineers Report due to updated contract projections.
2.4.2 East-West Connector Road Between I-294 and I-88 – Reconstruct Length: 3.7 miles
Project Description: Reconstruct existing four lanes of pavement.
Project Benefits:
• Improve ride quality and traffic flow by replacing 50+ year‐old pavement
• Reduce annual maintenance costs
• Upgrade to current standards and operational requirements
Construction Period: 2019-2022
Total Cost (Escalated, 4%): $29.3 million
The estimated project cost was decreased from $29.5 million in the 2020 Consulting Engineers Report due to updated contract projections.
2.4.3 IL Route 251 to IL Route 56 – Mill, Patch and Overlay Length: 38.1 miles
Project Description: Rehabilitate existing four lanes of pavement.
Project Benefits:
• Preserve and maintain existing pavement
• Improve ride quality and traffic flow
• Reduce annual maintenance costs
• Upgrade to current standards and operational requirements
Construction Period: 2018-2020

Consulting Engineers Report November 22, 2021
16
Total Cost: $165.3 million
The estimated project cost was adjusted from $167.9 million in the 2020 Consulting Engineers Report due to updated contract projections.
2.4.4 Aurora Toll Plaza (61) to IL Route 59 – Mill, Patch and Overlay Length: 5.5 miles
Project Description: Rehabilitate existing six lanes of pavement.
Project Benefits:
• Preserve and maintain existing pavement
• Improve ride quality and traffic flow
• Reduce annual maintenance costs
• Upgrade to current standards and operational requirements
Construction Period: 2014, 2020-2022
Total Cost (Escalated, 4%): $50.3 million
The estimated project cost was adjusted from $52.6 million in the 2020 Consulting Engineers Report due to updated contract projections. The project cost includes $4.0 million in 2027 for roadside improvements.
2.4.5 U.S. Route 30 to I-290 – Bridge and Ramp Repairs Length: 96.5 miles
Project Description: Reconstruct or rehabilitate crossroad bridges and ramps.
Project Benefits:
• Upgrade to current standards and operational requirements
• Preserve and maintain the crossroad structures and ramps
• Reduce maintenance costs
Construction Period: 2013-2027
Total Cost (Escalated, 4%): $49.3 million
The estimated project cost was adjusted from $52.8 million in the 2020 Consulting Engineers Report due to reallocated funds to cover estimated cost increases on Elgin O’Hare.

Consulting Engineers Report November 22, 2021
17
2.4.6 U.S. Route 30 to I-290 – ROW Acquisition Length: 96.5 miles
Project Description: As necessary during reconstruction or repair projects, will provide right-of-way and easements for improvements.
Project Benefits:
• Allows projects to move forward with optimal design elements
Construction Period: 2016-2023
Total Cost (Escalated, 4%): $0.4 million
No adjustments in cost or schedule from the 2020 Consulting Engineers Report.
2.4.7 U.S. Route 30 to I-290 – Utility and Fiber Optic Relocation Length: 96.5 miles
Project Description: As necessary during reconstruction or repair projects, will provide relocation of fiber optic and private utilities for improvements.
Project Benefits:
• Allows projects to move forward with optimal design elements
• Maintains Illinois Tollway fiber optic continuity
• Modernizes utilities crossing Illinois Tollway right-of-way as necessary
Construction Period: 2018-2021
Total Cost: $0.6 million
No adjustments in cost or schedule from 2020 Consulting Engineers Report.
2.5 I-294 / I-57 Interchange
2.5.1 Ramps to/from Memphis & 147th Street Ramps Length: N/A
Project Description: Construct the new system interchange at I‐294 and I‐57, as well as the 147th Street ramps.
Project Benefits:
• Provide economic benefit to the region
• Add access between two major interstates
• Construction Period: 2012-2021
• Total Cost: $ 115.1 million (Illinois Tollway Commitment)
• No adjustments in cost or schedule from the 2020 Consulting Engineers Report.

Consulting Engineers Report November 22, 2021
18
2.5.2 Tri-State Tollway (I-294) / I-57 Interchange – New Ramps and Structures
Length: N/A
Project Description: Construct new ramps to complete system interchange at I‐294 and I‐57.
Project Benefits:
• Provide economic benefit to the region
• Add access between two major interstates
• Construction Period: 2019-2024
• Total Cost (Escalated, 4%): $196.1 million (Illinois Tollway Commitment)
The estimated project cost was adjusted from $194.9 million in the 2020 Consulting Engineers Report due to updated cost estimates.
2.5.3 Tri-State Tollway (I-294) / I-57 Interchange – ROW Acquisition Length: N/A
Project Description: Acquire right-of-way and easements necessary for roadway and bridge reconstruction and widening.
Project Benefits:
• Allows project to move forward with optimal design elements
Period: 2013-2027
Total Cost: $12.0 million
No adjustments in cost or schedule from the 2020 Consulting Engineers Report.
2.5.4 Tri-State Tollway (I-294) / I-57 Interchange – Utility and Fiber Optic Relocation
Length: N/A
Project Description: Relocate Illinois Tollway-owned fiber optic and private utilities to accommodate roadway and bridge reconstruction and widening.
Project Benefits:
• Allows projects to move forward with optimal design elements
• Maintains Illinois Tollway fiber optic continuity
• Modernizes utilities crossing Illinois Tollway right-of-way as necessary
Construction Period: 2013-2025
Total Cost (Escalated, 4%): $3.3 million
No adjustments in cost or schedule from the 2020 Consulting Engineers Report.

Consulting Engineers Report November 22, 2021
19
2.6 Elgin O’Hare Western Access Project, IL 390 and I-490
2.6.1 EOWA: IL 390 From US 20 to IL 83 – Roadway and Bridge Construction Length: 10 miles
Project Description: Repairs to existing IL 390 (formerly Elgin O'Hare Expressway) from US 20 to IL 53; Widening of the existing IL 390 between IL 19 and IL 53; Construction of new four-lane (with auxiliary lanes) facility from west of IL 53 to IL 83, ROW acquisitions.
Project Benefits:
• Provide economic benefit to the region
• Improve travel efficiency – reduce congestion on the local street network
• Provide access to the west side of O’Hare Airport
• Facilitate multimodal opportunities
Construction Period: 2013-2017
IL 390 Cost (Escalated): $855.3 million
The 2020 Consulting Engineers Report described the Elgin O’Hare Western Access Project as organized in the three geographic segments including the IL 390, I-490 South Leg, and I-490 North Leg, whereas ROW Acquisition and Utility Relocation costs were included within the geographic segments. Cost elements have been revised with ROW Acquisition and Utility Relocation represented as distinct components to reflect the actual segment breakdowns in the EOWA Project cashflow. The project cost did not change for this actual segment of the IL 390 excluding ROW and Utility.
2.6.2 I-490 South Leg From I-294 to Western Access Interchange – New Roadway Construction
Length: 7.7 miles
Project Description: Construction of a new four-lane facility from the extension of IL 390 to I-294 to the south, including O’Hare ramp connections, ROW acquisitions.
Project Benefits:
• Provide economic benefit to the region
• Improve travel efficiency – reduce congestion on the local street network
• Provide access to the west side of O’Hare Airport
• Facilitate multimodal opportunities
Construction Period: 2016-2026

Consulting Engineers Report November 22, 2021
20
I-490 South Leg Cost (Escalated): $1,295.9 million
Previous amount shown in the 2020 Consulting Engineers Report was $1,416.0 million, which had ROW and Utility Relocation allocated costs included within the section’s total cost. This report has ROW and Utility costs represented as separate project components. This updated Project cost breakdown representation aligns with the actual project cost segments, and cost estimate updates align with latest construction schedule and updated contract projections. The overall segment construction period remains unchanged.
2.6.3 I-490 North Leg from Western Access Interchange to I-90 – New Roadway Construction
Length: 3.1 miles
Project Description: Construction of a new four-lane facility from north of the Western Access Interchange to I-90, including collector - distributor roadways along I-90, ROW acquisitions.
Project Benefits:
• Provide economic benefit to the region
• Improve travel efficiency – reduce congestion on the local street network
• Provide access to the west side of O’Hare Airport
• Facilitate multimodal opportunities
Construction Period: 2016-2025
I-490 North Leg Cost (Escalated): $753.7 million
Previous amount shown in the 2020 Consulting Engineers Report was $903.0 million, which had ROW and Utility Relocation allocated costs included within the section’s total cost. This update has ROW and Utility costs represented as separate categories instead of respectively included within the three geographic segments. This updated Project cost breakdown representation aligns with the actual project cost segments.
2.6.4 Elgin O’Hare Western Access – ROW Acquisition Length: 20.8 miles
Project Description: Acquire right-of-way and easements necessary for roadway and bridge reconstruction and widening.
Project Benefits:
• Allows project to move forward with optimal design elements
Construction Period: 2013-2023

Consulting Engineers Report November 22, 2021
21
Total Cost: $699.0 million
The estimated cost for this actual component of ROW Acquisition was included within the three geographic segments’ total costs in the 2020 Consulting Engineers Report. No adjustments in cost or schedule from the 2020 Consulting Engineers Report for this actual component of ROW acquisition.
2.6.5 Elgin O’Hare Western Access – Utility and Fiber Optic Relocation Length: 20.8 miles
Project Description: Relocate Illinois Tollway-owned fiber optic and private utilities to accommodate roadway and bridge reconstruction and widening.
Project Benefits:
• Allows projects to move forward with optimal design elements
• Maintains Illinois Tollway fiber optic continuity
• Modernizes utilities crossing Illinois Tollway right-of-way as necessary
Construction Period: 2013-2024
Total Cost: $237.7 million
The estimated cost for this actual component of Utility and Fiber Optic Relocation was included within the three geographic segments’ total costs in the 2020 Consulting Engineers Report. This updated Project cost breakdown representation aligns with the actual project cost segments.
2.6.6 EOWA Funding by others
The assumed EOWA corridor funding sources consist of $3.542 billion of funding by the Illinois Tollway and $300 million of funding by other sources. Funding by other sources is expected to include local government contributions in the form of grants and in-kind contributions, including land and right-of-way (ROW), design, utility and materials. Commitments for approximately half of the assumed funding from other sources have been obtained.

Consulting Engineers Report November 22, 2021
22
2.7 Planning for Other Projects
2.7.1 Planning for Other Projects Length: N/A
Project Description: Planning studies for other routes as determined by the Board of Directors.
Project Benefits:
• Study and preparation of planning studies, including Environmental Impact Statements.
Period: 2013-2027
Total Cost (Escalated, 4%): $58.8 million
The estimated project cost was adjusted from $121.1 million in the 2020 Consulting Engineers Report to cover estimated cost increases on Elgin O’Hare.

Consulting Engineers Report November 22, 2021
23
3 Systemwide Improvements and Initiatives
3.1 Systemwide Maintenance Facilities Maintenance Facilities – Reconstruct / Relocate / Rehabilitate
Locations:
• M-1 (Alsip) – Reconstruct
• M-5 (Schaumburg) – Reconstruct
• M-6 (Marengo) – Reconstruct
• M-7 (Rockford) – Reconstruct
• M-8 (Naperville) – Reconstruct / Relocate
• M-11 (DeKalb) – Rehabilitate
• M-12 (Dixon) - Rehabilitate
Project Description: Reconstruct, relocate or rehabilitate aging maintenance facilities.
Project Benefits:
• Optimize maintenance operations to meet expanded system needs
• Reduce annual facilities maintenance costs
Construction Period: 2013-2027
Total Cost (Escalated, 4%): $342.0 million
The estimated project cost was adjusted from $401.9 million in the 2020 Consulting Engineers Report due to updated timing, contract projections and reallocated funds to cover estimated cost increases on Elgin O’Hare. Deferred projects include M-3 (Park Ridge), M-11 Truck Wash, M-12 Truck Wash, and various parking lot and facility repairs. Updated timing includes M-5 (Schaumburg) Reconstruction, which was moved from 2024-2026 to 2021-2023.

Consulting Engineers Report November 22, 2021
24
3.2 Systemwide Improvements
3.2.1 Infrastructure Renewal – Bridge, Pavement, Drainage and Safety Appurtenance Repairs
Length: N/A
Project Description: Annual bridge, pavement, drainage and safety appurtenance repairs and upgrades which are not included in the major corridor improvements.
Project Benefits:
• Preserve and maintain existing infrastructure
• Upgrade to current standards and operational requirements
Construction Period: 2012-2027
Total Cost (Escalated, 4%): $697.1 million
The estimated project cost was adjusted from 689.9 million in the 2020 Consulting Engineers Report due to updated contract projections.
3.2.2 Infrastructure Enhancements – Business Systems and Toll Collection Upgrades Length: N/A
Project Description: Business Systems and Information Technology upgrades, including toll collection systems and related software to keep pace with and incorporate best practices
Project Benefits:
• Optimize all toll collection operations
Construction Period: 2013-2021
Total Cost: $109.9 million
No adjustments in cost from the 2020 Consulting Engineers Report. Schedule accelerated to end in 2021.
3.2.3 Infrastructure Enhancements – Information Technology and Intelligent Transportation System Upgrades
Length: N/A
Project Description: Intelligent Transportation System (ITS) upgrades, including communications tower replacements and related software to keep pace with and incorporate best practices.
Project Benefits:
• Ensure reliability of communication network
• Improve traffic and incident management
Construction Period: 2012-2026

Consulting Engineers Report November 22, 2021
25
Total Cost (Escalated, 4%): $170.1 million
No adjustments in cost or schedule from the 2020 Consulting Engineers Report.
3.2.4 Non-Roadway Projects Length: N/A
Project Description: Annual miscellaneous capital expenditures, including transponders, vehicles, computers and other items that are critical to the Illinois Tollway’s day-to-day operations.
Project Benefits: • Maintain the state-of-good-repair
• Modernize the current systems
Construction Period: 2017-2026
Total Cost (Escalated): $895.0 million
No adjustments in cost or schedule from the 2020 Consulting Engineers Report.
3.2.5 Access Expansion – Service Interchanges Length: N/A
Project Description: Source of matching funds for construction of two service interchanges in accordance with the Illinois Tollway Interchange Policy.
Project Benefits:
• Construct interchanges on the existing system
• Provide economic benefit to the region
Construction Period: 2012-2027
Total Cost (Escalated, 4%): $131.5 million (Illinois Tollway Commitment)
The estimated project cost was adjusted from $130.8 million in the 2020 Consulting Engineers Report due to updated project timing and contract projections.

Consulting Engineers Report November 22, 2021
26
3.2.6 Toll Collection Upgrades – Plaza Modifications for Electronic Tolling Upgrades
Length: N/A
Project Description: Implement mainline and ramp plaza modifications to accommodate electronic toll collection upgrades.
Project Benefits:
• Reduce operational and maintenance costs
• Reduce environmental impacts
• Improve operational efficiency
Construction Period: 2016-2026
Total Cost (Escalated): $274.9 million
No adjustments in cost or schedule from 2020 Consulting Engineers Report.
3.2.7 Program Support Length: N/A
Project Description: Program management, project management, technical and administrative service contracts.
Project Benefits:
• Program management to execute projects efficiently and to manage budget and schedule
Construction Period: 2012-2026
Total Cost (Escalated, 4%): $514.2 million
No adjustments in cost or schedule from the 2020 Consulting Engineers Report.
3.2.8 Utility and Fiber Optic Relocation Length: 0.0 miles
Project Description: As necessary during reconstruction or repair projects, will provide relocation of fiber optic and private utilities for improvements.
Project Benefits:
• Allows projects to move forward with optimal design elements
• Maintains Illinois Tollway fiber optic continuity
• Modernizes utilities crossing Illinois Tollway right-of-way as necessary
Construction Period: 2014-2026
Consulting Engineers Report November 22, 2021
27
Total Cost (Escalated, 4%): $9.7 million
No adjustments in cost and a schedule adjustment from the 2020 Consulting Engineers Report.
3.2.9 Systemwide Right-of-Way Length: 0.0 miles
Project Description: Acquire right-of-way and easements necessary for interchange improvements, maintenance facilities.
Project Benefits:
• Allows project to move forward with optimal design elements
Construction Period: 2018-2022
Total Cost (Escalated, 4%): $36.0 million
No adjustments in cost and a schedule adjustment from the 2020 Consulting Engineers Report.
3.3 Intelligent Transportation System Deployment of Intelligent Transportation System (ITS) on the Illinois Tollway began in the late 1980s with the installation of Road Weather Information Systems (RWIS) for monitoring atmospheric and pavement conditions during inclement weather. The system was further expanded with the construction of a systemwide fiber optic communications network, deployment of roadway CCTV cameras for monitoring traffic, Microwave Vehicle Detection System (MVDS), deployment of Digital Messaging Signs (DMS) and I-PASS electronic tolling initiative in the late 1990s.
The Illinois Tollway’s first traffic operations center (TOC) opened in 2003. The TOC employs a Traffic Incident Management System (TIMS) software package, which is monitored and controlled from the TOC at the Central Administration (CA) building. The TIMS software package is a management platform that allows operators to monitor traffic conditions in real-time, manage response and clearance of incidents, monitor construction zones and communicate with a variety of stakeholders, including Illinois Tollway staff, other Traffic Management Centers, the media and directly to the motorist. The TOC was integrated (two-way) with the computer-aided dispatch (CAD) system a year later. An early review of the impact of the CAD-TIMS integration resulted in a 24% reduction in incident response times.
In 2005, the Illinois Tollway launched the Congestion Relief Program (CRP) to rebuild and widen major segments of the Illinois Tollway system, implement open road tolling and add a 12-mile extension to I-355 one of four interstate routes that comprise the Illinois Tollway system. The CRP contained funding to advance ITS as part of the capital program. ITS deployments continued, and the integration of incident management was further developed early in the CRP implementation process.
Since then, the Illinois Tollway ITS system has been expanded and enhanced to reduce the incident timeline (the time from once an incident is detected, to the time the incident is cleared, and the roadway is returned to normal conditions) to include a systemwide network of

Consulting Engineers Report November 22, 2021
28
communications, monitoring and traveler information tools. This system has enhanced the Illinois Tollway’s ability to meet the overarching traffic and incident management goals and objectives of improving the mobility, efficiency and safety of the Illinois Tollway roads.
To date, the Illinois Tollway ITS system includes the following primary systems that are integrated into TIMS:
• Systemwide fiber optics and communications equipment and infrastructure • Closed Circuit Television (CCTV) camera surveillance– for detecting, verifying and
monitoring congestion and incidents • Vehicle Detection Systems (VDS) – both microwave, Bluetooth and in-pavement
sensors for measuring volume, vehicle speed and roadway occupancy on both the mainline and ramps. The data from this detection system provides the basis for the Illinois Tollway’s posted travel times. Bluetooth solar powered detection devices allow for ease of traffic monitoring, particularly for temporary use in construction zones.
• Dynamic Message Signs (DMS) – for providing traveler information such as travel time, roadway conditions and incidents to motorists ahead of major decision points on the roadway
• Weigh-in-Motion (WIM) – to assist overweight vehicle enforcement measuring the weight of vehicles moving at highway speeds, equipped with a tire anomaly classification system detecting flat tires or missing tires and equipped with an over-height vehicle detection system (virtual gantry) that monitors over height vehicles.
• Road Weather Information Systems (RWIS) – to assist roadway operations to prepare and respond to snow and ice events by measuring atmospheric and pavement conditions, they are located at major bridge and overpass
• Wireless Queue/Count Stations – for automatic queue detection, wrong way driver detection and traffic counting
• Portable Changeable Message Signs (PCMS) – for providing traveler information to motorists on a short-term basis or within construction zones
Since 2010, the Illinois Tollway’s focus has shifted from significant expansion of the ITS system, which coincided with the broader CRP, to filling in gaps in the system with devices to better manage traffic operations while maintaining and improving the existing assets. The system has continued to expand as part of both standalone ITS projects and the “mainstreaming” of the ITS system within larger roadway rehabilitation projects.
The first corridor-wide solar-powered / wireless communications CCTV & Roadway Sensor project was undertaken in 2013. Since then, 28 elements have been implemented and fully utilized. By 2015, these 28 elements have been converted to AC power with fiber optic communications (FOC). Additionally, during 2014, temporary solar-powered / wireless units were installed to maintain Jane Addams Memorial Tollway (I-90) corridor ITS operations. These units were replaced with permanent devices during the Jane Addams Memorial Tollway (I-90) corridor reconstruction/widening. Intermediate Power Distribution & Communication (IPDC) facilities were also installed along the I-90 corridor.
Continued ITS rehabilitation and replacement occur through small systemwide and capital contracts that include Microwave Vehicle Detection Systems (MVDS) replacement (end of

Consulting Engineers Report November 22, 2021
29
lifecycle), Type 2 DMS installations near ramp queue locations, new CCTV installations not originally scoped as part of the Move Illinois Program, systemwide ramp queue detectors and a permanent truck scale at Maintenance Facility M-2 (Hillside).
New CCTV and MVDS equipment support poles have been designed and implemented that provide less vibration during windy conditions, allowing for better camera video quality of the roadway at the TOC. First issue of the ITS guide drawings, special provisions and ITS Deployment Guide were developed in 2015 and have been revised yearly based on construction lessons learned and product improvements. The ITS base drawings, guides and special provisions are used by the designers for every ITS construction contract at the Tollway.
In 2017, the Illinois Tollway opened the first “smart corridor” in the system. The Jane Addams Memorial Tollway (I-90) was funded under the current Program. This corridor included a combination of traditional Illinois Tollway ITS devices, including CCTV, MVDS, RWIS at the Fox River Bridge. A virtual weigh-in-motion system was also installed at Beverly Road. The corridor also provided enhanced full color/full matrix DMS capable of illustrating color and graphic messages. Also included were IPDC’s and new ITS devices, including a Lane Control System (LCS) over each lane. The LCS can indicate if a specific lane or lanes are open (green arrow), closed (red “X”) or merging (yellow diagonal arrow), alerting drivers to change lanes and avoid incidents. The goal is to increase roadway safety and efficiency through this implementation.
Major deployments in 2020 included the following:
• Improved maintenance and management systems with the goals of reducing system downtime, including tracking network uptime/availability of ITS devices.
• Fully utilizing the Illinois Tollway asset management system for ITS maintenance activity tracking and ITS inventory management.
• Updating of the 5 year ITS Strategic Plan • Repairs and improvements to the existing Roadway Weather Information Sensors
(RWIS) to make all sites functional for 2020/2021 winter season. • Testing and development of video incident detection (VID), with the potential to
significantly reduce incident detection time and improve incident response and clearance times.
• Continued design activities for CCTV gap analysis, queue detection, communication upgrade and continued DMS upgrades within the system. Under the ITS Design Upon Request (DUR) contracts, three ITS standalone contracts were designed and bid for construction. Under the ITS Refurbishment and Replacement program, more than 250 ITS devices have been replaced due to parts that reached end of their service life. Priorities are given to ITS components that have exceed their service life and become too costly to maintain and repair.
• Traffic Operations Center (TOC) space and equipment planning efforts to maintain equipment and plan for future expansion prior to active traffic management on the Central Tri-State.
Major initiatives planned for 2021 include the following:

Consulting Engineers Report November 22, 2021
30
• Continued design activities for CCTV gap analysis, ramp queue detection, communication upgrade, and DMS upgrades within the system.
• Replacement of out of service weigh-in-motion (WIM) systems with new virtual WIM (VWIM) systems so they can be used by the Illinois State Police for weight enforcement thus reducing the flow of overweight vehicles on Tollway roads. The VWIM will also include a tire anomaly classification system (TACS) and over-height vehicle detection system (OHVDS) to monitor and detect vehicles with tire problems or over-height trailers/cargo. This will help prevent tire blow-outs, which are a leading cause of commercial vehicle accidents, and tall vehicles damaging Illinois Tollway infrastructure.
• Purchasing third-party data – This would involve the procurement of a private sector crowdsourced data. The traffic volumes and travel times will be used to supplement existing Illinois Tollway owned traffic sensors, which also validate the crowd sourced data. An analysis of the cost effectiveness, accuracy and level of granularity determined this approach could be utilized in urban corridors but would not be effective for systemwide use.
• Wrong-Way Driver Detection and Warning System Pilot testing and expanded deployment. Additional static signage, solar powered 24/7 flashing LED signage and detections systems are being evaluated for deployment to reduce the number of wrong way driving incidents.
• Ramp queue detection – The current microwave detection does not provide sufficient level of accuracy required for certain specific new functions. As example, for ramp vehicle detection a MVDS will fail giving accurate data for traffic speed less than 20 MPH. To address this, more accurate low speed detection technology is required in selected locations. New deployment of wireless in-pavement detection sensors and flashing LED beacons in select locations will be used for ramp queue detection.
• ITS device modernization planning and ITS inventory management system – Development of guidelines and reasons to modernize ITS devices beyond just age. Utilizing asset management software to document ITS device life cycle from concept to end of life.
• ITS test lab and site – Install ITS test lab and two poles to test and validate ITS products prior to specification and widespread deployment. This will ensure products are compatible with the Tollway ITS system and verify desired performance.
• Connected and Automated Vehicle (CAV) research and development of Illinois Tollway CAV strategic plan.
• Converting the fiber optic splice request and ITS device integration forms into electronic processes in the Illinois Tollway web-based project management platform.
• The largest continuing efforts will continue to be the ongoing operation and maintenance of the TIMS and CAD systems. These two systems are critical to the management of incidents and traffic across the system. Components of each are discussed later in this document.

Consulting Engineers Report November 22, 2021
31
3.4 Environmental Initiatives The Illinois Tollway is committed to protecting the environment and implementing numerous green initiatives throughout the Illinois Tollway system and its construction projects. Environmental initiatives throughout the Illinois Tollway include both the continuation of previous commitments along with innovative programs. The following is a summary.
3.4.1 Expanded Use of Brine for Roadway De-icing The Tollway continues to make firm investments into expanding its use of brine across its system. Salt brine is produced by dissolving dry salt into a solution which can then be directly sprayed on the pavement or used to ‘wet’ dry salt before it is applied, depending on the conditions.
Use of brine has benefits for the Tollway, Tollway customers and the environment. Traditionally, dry salt crystals have been used primarily to de-ice roadway pavement. When dry salt is released from plow truck spreaders, it tends to bounce and scatter, with a substantial amount of salt, approximately 30%, being lost on the shoulders, in the median or beyond, where it is not effective. Thus, salt spread rates need to be set high enough to ensure an adequate amount salt remains on the pavement for safe roadway operations.
When dry salt is pre-wetted with brine before it is applied to the pavement, it reduces the tendency for salt to bounce and scatter and enhances its ability remain on the pavement; when pre-wetted, only 4% of salt is lost beyond the road surface. The implications are that pre-wetting the salt can allow application rates to be reduced up to approximately 25% and achieve the desired deicing effect.
From a safety and operations perspective, Pre-wetting immediately activates the salt, jump starting the deicing process, resulting in more rapid improvement of roadway driving conditions during icing events.
From an environmental perspective, reducing the amount of salt applied to the system subsequently results in less salt (chlorides) entering and affecting our rivers, streams and lakes.
Increased use of brine will decrease the Tollway’s dependency on salt, which can save costs, particularly during winter seasons when salt supplies are low and demand is high.
The Tollway has been testing brine for several years, having procured two mobile brine makers, with limited production capacity and outfitting its fleet for increased brine applications.
In 2021, the Tollway will have substantially completed construction of its first permanent, high production brine maker on its system which will be installed at the new M-8 maintenance yard that began construction in early 2020. This pilot program will inform installations of future permanent brine makers across the system in its effort to reduce its impact on the environment while maintain the high level of safety that its customers enjoy.
3.4.2 Enhanced Environmental Inspections In 2019, the Illinois Tollway enhanced its physical inspection program of detention basins, bioswales, and storm water outfalls. Ensuring that these assets are operating as intended is imperative to protecting surface water resources which are conveyed through and received

Consulting Engineers Report November 22, 2021
32
by the Illinois Tollway’s drainage system.
The enhanced inspection program incorporates additional assessment criteria as part of an improved asset management rating system that better addresses individual components and conditions that may have changed since the initial construction or since the previous inspection. The assessment criteria for storm water outfalls now includes nine physical and sensory indicators of illicit discharges as defined per U.S. Environmental Protection Agency guidance. Furthermore, assessment of basin inlet and outlet structures has been expanded to include criteria that more specifically evaluate the function and safety of the basins including nuisance issues (e.g. animal dens and burrows), vegetation components (e.g. invasive, woody, inhibited or dead), cleanliness (e.g. litter and debris accumulations), and erosion (e.g. unstable or eroding banks, damaged erosion controls). In addition to assessment of physical conditions, criteria related to bioswale function and vegetation have been incorporated to enhance the assessment of effectiveness and overall health.
This enhanced inspection program and rating system was implemented to improve tracking and identification of maintenance issues, aid in planning preventative maintenance to avoid costlier drainage repairs, and more effectively identify and eliminate potential illicit storm water discharges to maintain compliance with Illinois EPA permit requirements.
3.4.3 Invasives to Energy Research Program In 2019, the Illinois Tollway began working with University of Connecticut to evaluate the water quality benefits of, and energy production potential from invasive vegetation, such as cattails harvested from Tollway drainage ditches and ponds. In particular, the Illinois Tollway is looking to cattail harvesting as a way of removing environmentally detrimental chlorides (salt from winter de-icing activities) from the environment while also improving the function of the drainage system.
Cattails, among some other common reeds, are considered invasive plants and are adapted to thrive in environmentally degraded habitats that frequently occur along highway drainage systems. Cattails are generally considered to be a nuisance as they quickly overtake drainage features and over time cause reduced storm water storage capacity, reduced water flow, excess nutrients after decay and can clog drainage appurtenances. These large plants are difficult to manage due to fast growth and rapid reproduction that results in the crowding out of deep-rooted native species resulting in the degradation of aquatic ecosystems and reduced biodiversity.
However, these plants are effective in taking up and storing water pollutants such as chlorides and excess nutrients within their stalks. Cutting them at the right time can remove these pollutants from the environment. Typically, cattails have been managed by clear cutting and leaving the cut stalks in place and as the cattails decompose, any captured pollutants move back into the soil and are then released back into the environment.

Consulting Engineers Report November 22, 2021
33
This three-year research program will evaluate the costs and benefits of harvesting and removing cattail biomass annually (along with the chlorides it has accumulated) and identifying ways to utilize the harvested material for other useful purposes. Potential benefits include:
• Removal of chlorides and other pollutants from the system, • Water quality improvement within the Illinois Tollway’s drainage system as well as
downstream, • Reduce drainage system waste and creation of a sustainable maintenance program • Determination of whether this harvested material can be used as an energy source in
wastewater treatment processes or as compost.
3.4.4 Landscape and Tree Planting Initiative The Systemwide Landscape Master Plan was finalized in December 2017 with the goal of establishing and maintaining healthy tree communities throughout the Illinois Tollway’s 294 miles, 5 corridors and 12 counties. In partnership with The Morton Arboretum, the Master Plan leverages existing efforts in creating and nurturing current and future tree communities in the region focused on increasing the region’s tree canopy. The initial planting efforts commenced in the Spring of 2018 as part of the Illinois Tollway’s goal of planting 58,000 trees in support of the program, and to date, over 61% of this goal has been achieved with the planting of more than 35,300 trees. The Master Plan also includes functional planting of shrubs at strategic locations to help reduce snow drifting on pavement while complementing Illinois Tollway environmental programs and initiatives.
3.4.5 NPDES MS4 Inspection and Annual Reporting The Illinois Tollway maintains compliance with the Illinois Environmental Protection Agency’s (EPA) Storm Water Management Program ILR40 Permit conditions (ILR40 Permit) under the Small Municipal Separate Storm Sewer System (MS4), permit number ILR400494. An inspection of the entire system is completed annually and includes outfall inspections, illicit discharge detection and visual dry weather screening.
3.4.6 INVEST Program The Illinois Tollway continues to utilize the Infrastructure Voluntary Evaluation Sustainability Tool (INVEST) process developed by the Federal Highway Administration (FHWA) that enables transportation agencies to assess the sustainability of their projects and systems as a whole. The Illinois Tollway customized the FHWA’s INVEST program by incorporating supplements to existing FHWA criteria and creating new criteria. In 2020, the INVEST team assessed the Illinois Tollway’s system using the INVEST System Planning and Operations and Maintenance modules to determine system scores. The 2020 System Planning and Operations and Maintenance scores continue to reflect the highest level of achievement, platinum.

Consulting Engineers Report November 22, 2021
34
In 2020, the Illinois Tollway also used the INVEST Project Development module to evaluate in-progress design and construction contracts with an estimated construction cost exceeding $10 million. Projects that reached construction substantial completion in 2013 and 2014 averaged a silver rating, while projects in 2015, 2016, 2017 and 2018 averaged a gold rating. Projects that reached construction substantial completion in 2018 and 2019 had less extensive planning processes, more diverse scopes and, for those scored using version 1.2, more stringent scoring criteria. The 2018 and 2019 projects averaged a silver rating. In 2020, individual projects earned the highest scores obtained by the Illinois Tollway in economic analysis.
Planners, designers (including engineers of various disciplines), construction managers, contractors and Illinois Tollway employees have been participating in a rigorous sustainability process, including project scoring and workshops that involve brainstorming sustainability practices. The Illinois Tollway’s INVEST Program not only improves Illinois Tollway sustainability, which directly benefits its customers and the community, but it also provides exposure to sustainable principles and practices to many industry professionals. These professionals can in turn incorporate sustainable principles and practices into other projects they are involved with throughout the region and country.
3.4.7 Stormwater Management Several storm events have occurred throughout the Illinois Tollway’s history, resulting in pavement flooding. The Consulting Engineers have listed known flooding issues with the potential to impact the traveling public. Until mitigation measures are completed in each of these locations, the Consulting Engineers monitor them during, or following, severe rain events to evaluate the public impacts and provide recommendations to the Illinois Tollway. In 2019, no new flooding issues were identified, four issues were corrected as part of capital improvements and five remaining issues, all located along the Central Tri-State (I-294) corridor, will be remediated as part of future reconstruction.
Table 2: Flooding Locations and Mitigation
Location Mitigation Status I-94 near Lake Forest Oasis Monitor and Planning Mitigation
I-294 & Cermak Ave In construction (RR-20-4554)
I-294 & Archer Ave In construction (I-20-4518)
I-294 & St. Charles In construction (I-20-4533)
I-294 & 95th Street In construction (I-20-4517)
NB I-294 to Hinsdale Oasis In construction (I-20-4546)

Consulting Engineers Report November 22, 2021
35
3.5 System Growth The following table depicts how the Illinois Tollway system has grown and will grow throughout the implementation of the Move Illinois Program. All lanes (mainline, auxiliary, ramps and toll plaza manual lanes) are included. The basis of these values was determined by mapping all of the Illinois Tollway’s lanes individually and categorizing them appropriately. As improvement projects add new lanes, such as on I-490 and I-294, the total lane mile values may be revised accordingly in future versions of this and/or other reports, based on the evolution of those designs.
The system growth projections from 2020 to 2027 are based on calculations provided by the Design Corridor Managers (DCM) of the respective improvement projects, current as of the date of this report. Based upon the proposed project scopes, specifically those that increase capacity on the mainline, add interchange ramps and add mainline elements, the overall system lane-mile total is expected to grow by 18.3% from 2012 through 2027.
Table 3: Growth of the Illinois Tollway System per Corridor (By Lane Miles)
Tollway 2012 2013 2014 2015 2016 2017 2018 2019
Tri-State (I-294 & I-94) 786.5 786.5 798.6 801.2 800.4 794.9 794.9 799.7
Jane Addams (I-90) 470.3 474.0 540.9 542.5 612.8 615.6 616.1 619.2
Ronald Reagan (I-88) 528.6 528.6 529.4 531.0 531.0 530.1 530.1 534.0
Veterans (I-355) 263.5 263.5 263.5 263.5 264.3 263.1 263.1 264.5
EOWA (IL 390 and I-490) 0.0 0.0 0.0 0.0 50.2 73.3 73.3 73.3
Total Lane Miles 2,048.9 2,052.6 2,132.4 2,138.2 2,258.7 2,277.0 2,277.5 2,290.7
% Increase - Annual
0.18% 3.89% 0.27% 5.64% 0.81% 0.02% 0.58%
% Increase - Aggregate
0.2% 4.1% 4.4% 10.2% 11.1% 11.2% 11.8%
Tollway 2020 2021 2022 2023 2024 2025 2026 2027
Tri-State (I-294 & I-94) 799.6 799.6 811.9 811.9 814.9 823.9 847.1 847.1
Jane Addams (I-90) 621.1 621.1 621.1 621.1 621.1 621.1 621.1 621.1
Ronald Reagan (I-88) 534.0 534.0 534.0 534.0 534.0 534.0 534.0 534.0
Veterans (I-355) 264.5 264.5 264.5 264.5 264.5 264.5 264.5 264.5
EOWA (IL 390 and I-490) 73.3 73.3 73.3 82.1 118.6 157.6 157.6 157.6
Total Lane Miles 2,292.5 2,293.1 2304.8 2,313.6 2,353.1 2,401.1 2,424.3 2,424.3
% Increase - Annual 0.08% 0.00% 0.54% 0.38% 1.71% 2.04% 0.97% 0.00%
% Increase - Aggregate 11.9% 11.9% 12.5% 12.9% 14.8% 17.2% 18.3% 18.3%

Consulting Engineers Report November 22, 2021
36
4 Condition of the Illinois Tollway System The Illinois Tollway continues to function as an essential component of the transportation network in Northern Illinois. As part of the current Move Illinois Program to date:
• Approximately 21.5% of the system mainline pavement existing prior to the commencement of the Move Illinois Program was reconstructed and widened
• Reconstruction and widening of the Jane Addams Memorial Tollway (I-90) east of Mill Road to the Eastern Terminus has been completed
• Construction of a new interchange for the Tri-State Tollway (I-294) with Interstate 57 has commenced with the initial phase ramps opened in 2014
• Rehabilitation and widening of the Illinois Route 390 Tollway west of Rohlwing Road was completed
• Construction of the Illinois Route 390 Tollway extension to Illinois Route 83 was completed.
As part of the previous, completed CRP capital program, the following was completed:
• Approximately 43% of the system mainline pavement existing prior to the commencement of the CRP capital program was reconstructed or reconstructed/widened
• Approximately 32.3% of the system mainline pavement existing prior to the commencement of the CRP capital program was rehabilitated
• Open road tolling was implemented at all mainline toll plazas throughout the system.
• Construction of the Veterans Memorial Tollway (I-355) South Extension to I-80 was completed
The current capital program is effectively managing the infrastructure condition of the system. It is recommended that programmed capital maintenance continue to occur as programmed and that issues identified during annual inspections be addressed as part of this programmed work.
Most of the system mainline pavement which has not been reconstructed or reconstructed/widened as part of the CRP or the Move Illinois Programs to date (approximately 10.2% of the system mainline pavement existing prior to the commencement of the Move Illinois Program) is programmed for reconstruction or reconstruction and widening as part of the Move Illinois Program through 2027. Additionally, sections of pavement constructed, reconstructed, reconstructed and widened or rehabilitated as part of the CRP (approximately 21.2% of the system mainline pavement existing prior to the commencement of the Move Illinois Program) are programmed for rehabilitation required by the pavement preservation program as part of the Move Illinois Program through 2027.

Consulting Engineers Report November 22, 2021
37
Once complete, the Move Illinois Program will have:
• Reconstructed or reconstructed/widened approximately 90.0 centerline miles or 31.7% of the system mainline pavement existing prior to the commencement of the Move Illinois Program
• Rehabilitated approximately 60.1 centerline miles or 21.2% of the system mainline pavement existing prior to the commencement of the Move Illinois Program
• Constructed approximately 17.1 centerline miles of new routes and route extensions
• Increased the system-wide lane mileage by approximately 15.7% through various widening projects, construction of route extensions and new interchanges, and the inclusion of the Elgin O’Hare Western Access corridor
NOTE: The above percentages are based upon the approximately 284.1 centerline miles of mainline pavement existing prior to the commencement of the Move Illinois program and may not include new construction/expansion of interchange ramps, auxiliary or plaza pavements.
4.1 Transportation Asset Management System Inspections are performed annually throughout the entire Illinois Tollway system (Annual Inspections) pursuant to requirements of the Trust Indenture. The purpose of these inspections is to evaluate Illinois Tollway assets, which include but are not limited to pavement, bridges, overhead sign structures, structural walls, drainage structures, slopes, ditches, safety appurtenances, facilities and ITS devices. Certain Illinois Tollway assets, including bridges, structural walls, overhead sign structures and facilities, are inspected on multi-year cycles which are described in further detail later in this report.
Repair activities are logged in the Illinois Tollway’s Asset Management System. Any deficiencies that are appropriate for Illinois Tollway Maintenance to repair are instantaneously transmitted to the appropriate Maintenance Division for repair. All other deficiencies requiring repair by a contractor are transmitted to the Illinois Tollway Engineering Department for incorporation into a current or future contract, based on the severity of the deficiency.
4.2 Pavement The Illinois Tollway roadway pavement is inspected annually. The inspection includes a structural evaluation, a pavement surface evaluation and a visual inspection that detail areas for repair by means as appropriate, determined by the severity of the deficiency.
4.2.1 Visual Inspection Visual inspection of the Illinois Tollway roadway system is performed annually. This inspection consists of documenting the condition of the mainline and ramp pavements from the edge-of-shoulder and from a vehicle outfitted with cameras that capture continuously. This visual pavement inspection includes all bridge decks, approaches, shoulders and gutters.
4.2.2 Pavement Structural Evaluation The structural evaluation of the Illinois Tollway roadway system pavement is performed annually by the Illinois Tollway’s Pavement Consultant during the spring and summer months.

Consulting Engineers Report November 22, 2021
38
This evaluation consists of Falling Weight Deflectometer (FWD) testing and a pavement coring program, from which the data is used to analyze and assess the structural integrity of the mainline pavements and assist in identifying deficiencies.
FWD testing is completed by measuring the deflections caused by an impulse deflection device that applies a dynamic load by dropping a weight onto a circular load plate placed on the pavement surface. The results of the FWD testing are utilized to determine pavement layer and subgrade structural parameters, to evaluate load transfer characteristics at pavement joints and to detect the presence of subsurface voids.
The pavement coring program consists of six-inch diameter full-depth cores taken through bound pavement layers at strategically identified locations throughout the Illinois Tollway system. Pavement cores are used to verify pavement layer thickness, inspect material and bonding conditions and assess the condition of pavement layers below the surface.
4.2.3 Surface Evaluation The pavement surface evaluation of the Illinois Tollway roadway system is performed annually during the summer and fall months. This evaluation utilizes electronic and visual surveillance of the pavement surface to determine the extent of pavement distress.
The Illinois Tollway utilizes a pavement inspection and evaluation system similar to that developed by the Illinois Department of Transportation (IDOT), which categorizes pavement conditions using Condition Rating System (CRS) values. A CRS rating of 4.5 is considered to be “poor.” Although this may be tolerable on a rural route, a CRS of 5.5 or less is used as an indication of a riding surface that is uncomfortable and inconsistent with Illinois Tollway operational standards and user expectations. Therefore, pavement sections with a CRS of 5.5 or less on the Illinois Tollway system are candidates for repairs or rehabilitation. Furthermore, a pavement with a CRS value between 6.0 and 6.5 may be considered “transitional” by the Consulting Engineers, based upon the pavement’s maintenance and repair history and age, for which repairs in the subsequent two to seven years are anticipated due to repeated repair cycles diminishing pavement life span.
The CRS ratings utilized for the Illinois Tollway pavement surface evaluation are provided in the following table:
Table 4: CRS Rating System
CRS Rating General Pavement Surface Condition
>7.5 Excellent
6.5 to 7.4 Good
6.0 – 6.4 Transitional
4.5 – 5.9 Fair
< 4.4 Poor

Consulting Engineers Report November 22, 2021
39
It should be noted that while the riding surface may reflect a high CRS rating, the aging pavement substructure, drainage problems or other unknown conditions that may exist below the pavement surface are not reflected by the CRS rating. Structural evaluations as described above, projected traffic loading and analysis of the pavement’s history can also factor into the pavement’s overall condition rating and Remaining Service Life (RSL), as described below.
CRS values are determined by digitally recording surface conditions and measuring certain types of surface distress and rideability of pavements through the collection of electronic sensor data. This data is collected by a semi-automatic survey process which utilizes a survey vehicle outfitted with cameras that capture continuous images of the pavement surface and panoramic images of the roadway. The images and sensor data are processed by experienced CRS rating personnel who assign CRS values. In 2020, approximately 87.1% of the Illinois Tollway network is rated in “excellent” to “good” condition. A summary of the most recent system-wide CRS ratings is included in the following table:
Table 5: Summary of Mainline Pavement CRS Ratings from the 2020 Evaluation (Lane Miles)
* Lane Miles Surveyed does not equal total actual system lane mileage due to approximate beginning and ending points of the field survey, construction activity and the exclusion of auxiliary lanes and other lane types.
** Sections that contained construction and the long bridges were excluded from the survey and listed as “Not Rated”.
Note: This evaluation does not include auxiliary or ramp lanes that are required for entering and exiting the Illinois Tollway. Due to this, route and system totals may not match information in other sections of the report. Percentages may not total to 100% due to rounding.
Ramp lanes are evaluated on a three-year basis due to the reduced traffic and anticipated improved condition compared to the mainline, though the Illinois Tollway may begin to monitor the ramps more closely since the current programs are not expected to address many of the system’s ramps. Auxiliary lanes are generally in better condition than the adjacent mainline lanes due to reduced traffic and are generally maintained in conjunction with the mainline
Tollway Excellent
>7.5 Good 6.5-7.4
Transitional 6.0-6.4
Fair 4.5-5.9
Poor 0-4.4
**Not Rated
Tri-State (I-294/I-94/I-80) 246.5 226.1 66.9 51.3 0.0 45.1
Jane Addams (I-90) 368.0 112.8 5.1 0.0 0.0 16.2
Reagan (I-88) 355.1 69.0 4.6 5.9 0.0 30.0
Veterans (I-355) 147.1 28.4 2.1 3.5 0.0 7.7
EOWA (IL 390) 38.0 9.0 1.7 3.5 0.0 7.7
Total* 1154.7 445.4 80.4 62.7 0.0 106.7
% of Total 62.4% 24.1% 4.3% 3.4% 0.0% 5.8%

Consulting Engineers Report November 22, 2021
40
lanes.
CRS ratings are only one indicator of overall pavement condition and, if used alone, can be misleading. A newly rehabilitated roadway will likely receive an “excellent” CRS rating even though the underlying concrete pavement and base could be largely deteriorated. In such a case, the “excellent” CRS rating is expected to rapidly deteriorate to a “transitional” or “poor” CRS rating, and the pavement will likely require additional work in a relatively short period of time. It is anticipated that Illinois Tollway pavement sections not reconstructed as part of recent capital program projects which received a CRS rating of “good” to “excellent” will rapidly deteriorate to a “transitional” or lower rating due to the condition of the underlying concrete base pavement.
Considering this, the Remaining Service Life (RSL) categories were developed. The RSL categories take into account current CRS ratings, traffic volumes and pavement thickness information. This data is projected to determine how many theoretical years are remaining before a condition level is reached where major repairs are required. The RSL categories are developed using specific pavement performance models, historical condition data for a specific pavement type and assumed rehabilitation treatments. The RSL categories have been found to be a reliable indicator of pavement performance. However, if there is any deviation from the future rehabilitation treatments assumed in developing the performance model, then the model will no longer accurately predict pavement performance, and the RSL category may be incorrect.
The Illinois Tollway RSL categories included 0 years, 1-2 years, 3-4 years, 5-8 years, 9-12 years, 13-19 years and 20+ years. An RSL category of 20 or more years was created to allow for better programming of future rehabilitation projects. New pavement with an expected life of 30 or more years would typically be categorized with an RSL of 20 or more years. In contrast, pavement categorized with an RSL of 0 years will require extensive intermittent pavement repairs to maintain the pavement integrity.
The Illinois Tollway has generally been successful in maintaining consistent pavement conditions to date. This has been accomplished through activities performed by the Maintenance Division and programmed major repair work through the capital programs.
The system mainline pavement sections which have been constructed, reconstructed, or reconstructed and widened as part of the capital programs to date addressed the concern of failing base pavement on those portions of the system. However, there still exist areas of concern where the pavement has not been reconstructed. In addition to intermittent repairs system-wide, other short-term repairs in these areas include asphalt resurfacing on the Edens Spur (I-94) completed in 2010, on the Reagan Memorial Tollway (I-88) completed in 2012 and on the Tri-State Tollway (I-294) completed in 2012. These short-term repairs serve to improve pavement surface conditions and ride quality; however, they do not adequately address the deterioration of the underlying concrete base pavement. Based on pavement age and repair histories, reconstruction of these pavements is likely the most cost-effective long-term repair strategy.
Currently, a majority of the system mainline pavement not reconstructed or reconstructed and widened to date is programmed for reconstruction or reconstruction and widening as part of the capital programs through 2027. Additionally, sections of pavement constructed, reconstructed, reconstructed and widened, or rehabilitated as part of the CRP are

Consulting Engineers Report November 22, 2021
41
programmed for rehabilitation through 2027 per the Move Illinois Program pavement preservation program.
While the Illinois Tollway’s annual maintenance efforts have focused on maintaining pavement basic integrity through projects such as emergency patching and intermittent pavement repairs, the original pavement infrastructure continues to deteriorate due to load-related (vehicle loading) and non-load related (environmental) impacts. In the past, this resulted in a repair cycle that continued to accelerate until the implementation of the CRP when more substantial improvements were made. The strategy of maintaining pavement through small-scale maintenance projects became infeasible due to increasing construction costs, repair quantities, traffic disruptions and reduced pavement life. The current capital programs focus on rehabilitating or reconstructing the aging infrastructure through the reconstruction or reconstruction and widening of approximately 31.7% of the mainline system by the end of the Move Illinois Program in 2027. Approximately 21.5% of the system mainline pavement has been completed thus far.
Long-term pavement repairs began to be addressed in 2005, the first year of the CRP. As part of this, the underlying concrete base pavement deterioration issues along the Tri-State Tollway (I-294/I-94) and the Reagan Memorial Tollway (I-88) have been or are programmed to be addressed. As is shown in the following table, approximately 10.5% of system-wide pavement surveyed in 2020 was categorized with an RSL of eight years or less. The pavement within these categories will require repairs within the next eight years to maintain pavement integrity. This is a major improvement over the 85.1% of pavement system-wide that was within these categories in 2004 before the CRP began. Additionally, 35.0% of pavement surveyed in 2020 was categorized with an RSL of greater than 20 years, compared to 2.2% in 2004. In 2020, the overall Illinois Tollway network had an estimated RSL of 16.4 years with 52% of the network having an RSL of greater than 16 years.
NOTE: The above percentages are based upon the approximately 284.1 centerline miles of mainline pavement existing prior to the commencement of the Move Illinois Program and may not include new construction/expansion of interchange ramps, auxiliary or plaza pavements.

Consulting Engineers Report November 22, 2021
42
Table 6: Summary of Mainline Pavement RSL Values from the 2020 Evaluation (Lane Miles)
* Critical areas in need of attention. Reagan Memorial Tollway (I-88) – programmed for rehabilitation and reconstruction in various years, the Tri-State Tollway (I-294) from 95th Street to Balmoral Avenue – programmed for reconstruction in 2020 to 2027 and the Edens Spur (I-94) – programmed for reconstruction in 2018 to 2021.
** Lane Miles Surveyed does not equal total actual system lane mileage due to approximate beginning and ending points of the field survey and the exclusion of auxiliary lanes and other lane types.
*** Sections that contained construction and the long bridges (such as the Mile Long and Bensenville bridges on I-294) were excluded from the survey and listed as “Not Rated”.
4.2.4 Summary of Mainline Pavement Condition 4.2.4.1 Tri-State Tollway (I-294/I-94)
The 77.6-mile Tri-State Tollway (I-94/I-294/I-80) was constructed in 1958 as part of the original pavement network and consisted of either two or three lanes in each direction. The two-lane portions of this route were widened to three lanes in each direction in 1966 and at various times throughout the 1970s. As part of these widening projects, a Hot-Mix Asphalt (HMA) overlay was also typically added to the original lanes. A portion of the route from approximately 95th Street to Balmoral Avenue, commonly referred to as the Central Tri-State, was widened to four lanes in each direction and either reconstructed or partially reconstructed in 1992 and 1993. A rehabilitation of the Central Tri-State was completed in 2012, which included full-depth concrete patches, removal of the existing HMA overlay and the placement of a thicker Stone Matrix Asphalt (SMA) overlay. The Central Tri-State mainline pavement is scheduled for reconstruction in 2020 to 2027, as part of the Move Illinois Program. The majority of the mainline pavement along this route outside the limits of the Central Tri-State was reconstructed, or reconstructed and widened, from 2006 to 2009 as part of the CRP.
I-294 has some of the oldest pavement on the Tollway system, with portions along the central Tri-State nearing 60 years in age. In 2020, 74.3% of this corridor, including the Edens Spur, was rated in “excellent” to “good” condition. However, 25.2% of the corridor is estimated to
Tollway ≥ 20 Years
13-19 Years
9-12 Years
5-8 Years
3-4 Years
1–2 Years*
0 Years*
***Not
Rated
Tri-State (I-294/I-94/I-80) 150.5 280.1 23.1 27.4 24.9 33.5 51.3 45.1
Jane Addams (I-90) 385.7 8.3 60.5 26.3 5.1 0.0 0.0 16.2
Reagan (I-88) 85.6 79.5 255.1 4.0 0.0 4.6 5.9 30.0
Veterans (I-355) 0.9 174.7 0.0 0.0 0.0 0.0 5.6 7.7
EOWA (IL 390) 24.1 0.0 20.5 0.0 4.1 0.0 2.0 7.7
Total** 646.7 542.5 359.2 57.7 34.1 38.2 64.8 106.7
% of Total 35.0% 29.3% 19.4% 3.1% 1.8% 2.1% 3.5% 5.8%

Consulting Engineers Report November 22, 2021
43
have an RSL of under 12 years.
For the purposes of this report, the Tri-State Tollway is separated into the following three sections:
South Tri-State Tollway (Bishop Ford Freeway to 95th Street)
The majority of this pavement was rated in “excellent” condition (CRS) with an RSL rating of 13 to 20 years or more. The pavement from the Bishop Ford Freeway (I-94) to 163rd Street has undergone reconstruction and widening, completed in 2007. The pavement from 163rd Street to 95th Street has undergone reconstruction and widening, completed in 2009. Pavement preservation within this section was completed in 2017. In 2020, 60% of this section was rated in “excellent” condition with an average RSL rating of 18.5 years.
Central Tri-State Tollway (95th Street to Balmoral Avenue)
The pavement from 95th Street to Balmoral Avenue/O’Hare Interchange was widened and either reconstructed or partially reconstructed in 1992 and 1993. The partial reconstruction and widening included the reconstruction of the outside (third) lane in each direction on the existing six-lane facility and the addition of a new fourth lane in each direction. The remaining two inside lanes in each direction were left in place, rehabilitated and resurfaced. The reconstruction and widening areas included jointed plain concrete pavement throughout. A rehabilitation of this section was completed in 2012, which included full-depth concrete patches, removal of the existing HMA overlay and the placement of a thicker SMA overlay. Reconstruction of this section is programmed to occur in 2018 to 2025, as part of the Move Illinois Program. In 2020, approximately 11.0% of the section was rated in “excellent” condition with an average RSL estimated as 5.2 years. Approximately 18% of the section has an RSL of greater than 6 years.
North Tri-State Tollway (Balmoral Avenue to Russell Road)
The pavement from Balmoral Avenue/O’Hare Interchange to the Deerfield/Edens Spur improvement limits and from Half-Day Road to the Russell Road has undergone reconstruction and widening, completed in 2009. In 2020, 98% of this section was rated in “excellent” to “good” condition with an average RSL estimated at 18.9 years.
Edens Spur (I-94)
The 4.8-mile Edens Spur (I-94) was constructed in 1958 as part of the original pavement network and consisted of two lanes in each direction. An HMA overlay was added to this pavement in 1976 and was subsequently resurfaced in 1995. Rehabilitation of this section was completed in 2010 and included removal of the existing HMA overlay and the placement of an SMA overlay. As part of the Deerfield/Edens Spur improvement project, the west end pavement was reconstructed in 1997, and Toll Plaza 24 (Edens Spur) was constructed in 1998. The Deerfield/Edens Spur improvement was a project completed in 2000, which included the removal of the original Toll Plaza 25 (Deerfield), widening and reconstruction of the Tri-State Tollway in the vicinity of Deerfield Road, reconstruction of the west end of the Edens Spur, construction of the new mainline Toll Plaza 24 on the Edens Spur and reconfiguration of the Deerfield Road interchange ramps. Toll Plaza 24 (Edens Spur) was subsequently converted to open road tolling in 2006.
The majority of this pavement was previously rated in “good” to “fair” condition (CRS) with an

Consulting Engineers Report November 22, 2021
44
RSL rating of 0 to 2 years. The CRS and RSL ratings had rapidly deteriorated to a point where the majority of the pavement was recommended for work in the near future. Reconstruction and pavement preservation along this route began in 2018 with anticipated completion in 2021, as part of the Move Illinois Program. In 2020, the completed portions of work along this section were surveyed. The estimated overall RSL for the section is 17.8 years.
4.2.4.2 Jane Addams Memorial Tollway (I-90)
The 75.9-mile Jane Addams Memorial Tollway (I-90), originally referred to as the Northwest Tollway until 2008, was constructed in 1957 as part of the original pavement network and consisted of two lanes in each direction. The pavement from East River Road to Barrington Road was widened to three lanes in each direction in 1967. The pavement from Barrington Road to US Route 20 (Marengo-Hampshire) was widened to three lanes in each direction in 1992 and 1998. The majority of pavement from Mill Road to Rockton Road was reconstructed and widened to three lanes in each direction in 2009.
The pavement from Mill Road to Elgin Toll Plaza 9 was reconstructed and widened to three lanes in 2013 to 2014 as part of the Jane Addams Memorial Tollway (I-90) corridor reconstruction/widening projects. The pavement from Elgin Plaza 9 to the Eastern Terminus was reconstructed and widened to four lanes in each direction in 2014 to 2016.
In 2020, 95.8% of this corridor was rated in “excellent to good” condition with an a RSL of 20+ years along 76.8% of the corridor.
For the purposes of this report, the Jane Addams Memorial Tollway (I-90) is separated into the following sections:
Western Corridor (Rockton Road to Mill Road)
The majority of the pavement in this section was reconstructed and widened in 2009, and 89% is rated in “excellent” condition. This pavement is a mix of rubblized and reconstructed pavement. This will slightly reduce the RSL due to the anticipated need for future surface rehabilitations required on the rubblized sections. In 2020, an average RSL value of 8.9 years was estimated for this section.
Central Corridor (Mill Road to Elgin Plaza 9)
The majority of the pavement in this section was reconstructed and widened in 2013 to 2014 as part of the Move Illinois Program, and 80% is rated in “excellent” condition (CRS) with an average estimated RSL rating of 23.1 years.
Eastern Corridor (Elgin Plaza 9 to Des Plaines River)
The pavement within this section was reconstructed and widened in 2015 and 2016 as part of the Move Illinois Program. In 2020, 87% was rated in “excellent” condition with an average RSL rating of 25.5 years.
4.2.4.3 Reagan Memorial Tollway (I-88)
The Reagan Tollway is in excellent condition with 76.4% of the pavement having a CRS greater than 7.5. During the 2020 survey period, 91.3% of the I-88 corridor was rated in “excellent to good” condition. It is estimated that the average RSL along this corridor is 13.8 years.

Consulting Engineers Report November 22, 2021
45
I-290 to Illinois Route 56 (East)
The 26.7-mile Reagan Memorial Tollway (I-88) east of Illinois Route 56, originally referred to as the East-West Tollway until 2006, was constructed in 1957 as part of the original pavement network and consisted of two lanes in each direction. The pavement from the Eisenhower Expressway to Naperville Road was widened to three lanes and resurfaced in each direction in 1977. The pavement from Naperville Road to Prairie Path was reconstructed and widened to three lanes in each direction in 1987. The pavement from Prairie Path to Toll Plaza 61 (Aurora) and from Toll Plaza 61 (Aurora) to Orchard Road was reconstructed and widened to three lanes in each direction in 2000 and 2008 respectively.
The pavement from York Road to Naperville Road and from Naperville Road to Illinois Route 59 was reconstructed and widened to four lanes in each direction in 2008-2009 and 2004-2005 respectively. Subsequently, the pavement from the Eisenhower Expressway to York Road was resurfaced in 2008-2009. The pavement from Illinois Route 56 to Orchard Road was reconstructed and widened to three lanes in each direction in 2012 as part of the CRP.
In 2020, about 52% of this section was in “excellent” condition with approximately 5.1 miles along the section scheduled for surface overlay in 2021.
Illinois Route 56 to Illinois Route 251 (Central)
The 69.5-mile Reagan Memorial Tollway (I-88) Extension west of Illinois Route 56 was constructed in 1974 as a western extension to the original Reagan Memorial Tollway (I-88) and consisted of two lanes in each direction. The pavement received an HMA overlay in 1993. This HMA overlay was placed to a nominal 2.25-inch thickness, thinner than the typical 3-inch HMA overlay. The thinner overlay was originally intended to act as a bond breaker for a future concrete overlay. However, due to the poor performance of a similar concrete overlay installation on a section of the original Reagan Memorial Tollway (I-88), the concrete overlay was never placed. Instead, the HMA overlay remained as the riding surface. This thinner overlay did not perform well and required constant repairs by the Maintenance Division.
In January 2001, the HMA overlay between Illinois Route 56 and Illinois Route 251 failed, and the Illinois Tollway initiated immediate emergency repairs. Adverse weather conditions during the course of these emergency repairs limited their effectiveness and life expectancy, thus requiring subsequent full-width, shoulder-to-shoulder resurfacing during the summer of 2001. The pavement from Illinois Route 56 to Illinois Route 251 was rehabilitated, including the application of a thicker SMA overlay in 2012. The central portion of the Reagan Memorial received an additional 2.5-inch WMA overlay in 2018.
The rehabilitation of this pavement completed in 2012 and 2018 has served to increase the RSL of this pavement. However, these projects were intended to rehabilitate the pavement surface and did not include rehabilitation of the deteriorating original concrete pavement and base. It is expected that this original concrete pavement and base will continue to deteriorate, resulting in depreciation in the current ratings, and may require a more frequent rehabilitation cycle.
In 2020, the condition along this section was generally evaluated as “excellent”.
Illinois Route 251 to Rock Falls/US Route 30 (West)
The 2004 Annual Inspections and preliminary development of intermittent HMA repair

Consulting Engineers Report November 22, 2021
46
quantities in 2005 revealed severe deterioration of the pavement west of Illinois Route 251 (MP 76.1). It was decided to accelerate the reconstruction of this pavement originally programmed in 2006. The reconstruction included the removal of the original HMA overlay, the rubblization of the original concrete base pavement and the application of a 6-inch HMA overlay. The rubblization consisted of breaking the original concrete pavement into baseball-size and smaller pieces. The intent of this reconstruction is the eventual removal of 2 inches of HMA overlay and the application of an additional 6-inch HMA overlay for a total HMA thickness of 10 inches. Work to complete the “perpetual pavement” commenced in 2016 and was completed in 2017. The pavement at culverts and along bridge decks which was not rubblized was also included in the reconstruction along this section.
The pavement west of Illinois Route 251 to Chicago Avenue was reconstructed with work completed in 2015. This work addressed all previously noted deficiencies within this section. The pavement from Chicago Avenue to the Western Terminus was rehabilitated in 2016. This rehabilitation included the placement of an additional 6-inch thick asphalt layer, reconstruction of pavements which were not previously rubblized and reconstruction of the shoulder pavement. In 2020, 88% of the pavement west of Illinois Route 251 was rated in “excellent” condition. 4.2.4.4 Veterans Memorial Tollway (I-355)
The original 17.5-mile Veterans Memorial Tollway (I-355) north of Interstate 55, originally referred to as the North-South Tollway until 2007, was constructed in 1988 and consisted of two lanes in each direction except between Maple Avenue and Butterfield Road, which consisted of three lanes in each direction. The pavement from Plaza 89 (Boughton) to Maple Avenue and from Butterfield Road to North Avenue was widened to three lanes in each direction in 1994 and 1996, respectively. The pavement from Boughton Road to Interstate 55 was widened to three lanes in each direction in 2007 as part of the Veterans Memorial Extension project discussed later in this report. The pavement from Interstate 88 to 75th Street was widened to four lanes in each direction in 2008 and 2009. As part of these 2008 and 2009 widening projects, an HMA overlay was also added to the original three lanes. Rehabilitation of the pavement outside the limits of the aforementioned widening projects from North Avenue to Interstate 88 and from 75th Street to Boughton Road was completed in 2010 and included the placement of an SMA overlay to all lanes in each direction. The areas north of the Interstate 55 Interchange were rehabilitated in 2010 and 2013, which has served to extend the remaining service life and improve the CRS ratings. A subsequent rehabilitation of this pavement, including resurfacing and base pavement patching, commenced in 2018 with work extending through 2020. In 2020, 77.9% of the I-355 corridor was rated in “excellent” condition. In 2020, the estimated average RSL along this corridor is 15.2 years.
4.2.4.5 Illinois Route 390 Tollway
The existing 6.1-mile Illinois Route 390 Tollway, originally referred to as the Elgin O’Hare Expressway until 2013, was constructed by IDOT in 1993 and consisted of two lanes in each direction between US Route 20/Lake Street and US Route 53/Rohlwing Road. The pavement from Illinois Route 19/Irving Park Road to Meacham Road was rehabilitated and widened to three lanes in each direction in 2014-2016 as part of the Move Illinois Program. Tolling of this section commenced in July of 2016, designating this route under the jurisdiction of the Illinois

Consulting Engineers Report November 22, 2021
47
Tollway. IL 390, consisting of three lanes in each direction from Meacham Road to IL 83/Busse Road, including an interchange with I-290, was completed in 2017. The Move Illinois Program includes extension of the route east to an interchange with the future I-490, with work expected to occur between 2018 and 2025.
Annual inspections along the completed IL 390 corridor commenced in 2017. In 2020,78.5% of the pavement was rated in “excellent” to good” condition (CRS) with 40.2% of the corridor estimated as having a RSL rating over 20 years.
4.2.4.6 I-490 Tollway
The Move Illinois Program includes the anticipated construction of I-490, which will connect the Jane Addams Memorial Tollway (I-90) to the Tri-State Tollway (I-294) along the western border of O’Hare International Airport with construction to occur between 2016 and 2026.
4.3 Roadway Appurtenances The Illinois Tollway roadway appurtenances are visually inspected annually by the Illinois Tollway Engineering Department’s Division of Maintenance and Traffic as well as the Consulting Engineer. These inspections consist of the recording of visible deficiencies from the edge-of-shoulder to the right-of-way fence, including the drainage systems and all safety appurtenances. Needed repairs are prioritized based on the level of severity and then quantified. These quantities may be included in the scheduling of tasks for the Tollway Roadway Maintenance Division or, depending on the severity and scope of the deficiency, added to future contracts.
4.3.1 Drainage Systems Generally, visual inspection of the Illinois Tollway roadway drainage systems is performed annually, however some drainage assets are inspected on a four-year cycle. This inspection consists of visibly identifying any required repair activities of drainage structures, crossing culverts, slopes, ditches, detention basins, bioswales, and storm water outfalls.
The drainage systems throughout the Illinois Tollway are generally in good condition, and most of the embankment slopes are stable. Typical repair activities noted during the inspections included concrete headwall repair activities, drainage structures requiring cleaning or repair, gutter heaving or sinking, rill erosion, washouts, sinkholes and ditch restoration due to erosion.
Closed drainage systems are typical throughout the urban areas where curb and gutter is used along the roadway to control pavement drainage. These systems typically consist of storm sewers installed under the roadway pavement and shoulders that receive rainfall runoff via storm sewer catch basins. Only limited inspections can be performed on closed drainage systems due to access constraints; therefore, it is recommended that these systems be cleaned and televised to better determine their condition. Televising of closed drainage systems to identify areas of concern is programmed to occur prior to the development of designs for programmed roadway rehabilitation so that issues are addressed as part of the programmed roadway construction. As of 2020, there are nearly 24,500 existing storm sewers, system-wide.
Crossing culverts are pipes that generally cross perpendicularly under the roadway to allow

Consulting Engineers Report November 22, 2021
48
water to continue to flow from one side of the roadway to the other. Culverts are inspected for functionality, physical damage, obstructions and conveyance. The crossing culverts throughout the Illinois Tollway system are generally structurally sound. However, some have exposed reinforcement bars, misaligned wingwalls, honeycombing of the concrete surface, open joints or deterioration of the metal pipe (metal pipe culverts), or require cleaning. Crossing culverts not replaced during recent reconstruction or rehabilitation projects may in some cases be over 50 years old.
Deterioration of older Corrugated Metal Pipes (CMP) that were installed as part of the original construction of the Illinois Tollway continues to be a concern in those roadway sections not recently reconstructed. CMP deterioration typically occurs along the flow line or at the joints of the pipe. This deterioration may lead to perforation of the pipe that results in the erosion of the supporting soil and backfill material during rain events creating voids beneath the roadway. As the volume of the voids increase, the probability of roadway pavement slab settlement or failure increases. In many cases, these pipes may have been extended due to roadway widening or other construction. Although the ends of these pipes may appear in excellent condition, further examination may reveal deterioration of the original pipe and separation at the joints where the original pipe joins the new.
Due to the collapse of several CMPs, in 2007, the Illinois Tollway completed a detailed system-wide inspection of CMPs with a diameter of three feet or greater. The purpose of this inspection was to identify CMP culverts that require lining, repair or replacement. Culverts classified as bridges by the Federal Highway Administration (FHWA) were not included in the inspection and are included with the bridge inspections.
Over time, most of the older CMPs have been replaced with reinforced concrete pipe as part of reconstruction or rehabilitation contracts. Currently, there are 569 CMP storm sewers and seven CMP culverts known to exist system-wide. Two maintenance contracts completed in 2010 repaired and/or lined existing CMPs with a diameter of three feet or greater that cross beneath the pavement. Although these contracts addressed many concerns with CMPs, smaller diameter and some non-mainline-crossing CMPs still require repair or replacement in future projects. Due to the large quantity of CMPs located throughout the Illinois Tollway system and the more than 50 years of changing roadways, not all CMPs may have been identified for repair or replacement. It is recommended that replacement or lining of CMPs continue in future contracts, as they are identified.
4.3.2 Safety Appurtenances Roadway safety appurtenance inspections are performed annually, or on an annual rotation cycle as appropriate. Safety appurtenances include positive protection devices (such as concrete barriers, guardrail, impact attenuators, and cable median barrier systems), as well as pavement markings, delineators, lighting, right-of-way fencing, and ground mounted signs. Evaluations include a passive visual inspection of the Illinois Tollway roadway safety appurtenances along with logging of visible deficiencies in the concrete barriers, guardrails/terminals, cable median barriers and impact attenuators.
Concrete barriers, guardrails, cable median barrier systems and impact attenuators throughout the system are generally in good to excellent condition. Any repair activities are promptly transmitted to the Division of Maintenance and Traffic for repair. Tollway policy

Consulting Engineers Report November 22, 2021
49
requires that any guardrail/terminal safety concerns or damage resulting from vehicular accidents be addressed within 24 hours, though procurement limitations for materials prohibits achieving this policy in some cases.
The guardrail, terminals, and impact attenuators included in projects as part of the Move Illinois and recently completed Congestion Relief capital programs have been upgraded to meet Illinois Tollway standards in place at that time in adherence with the National Cooperative Highway Research Program (NCHRP) Report 350 or Manual for Assessing Safety Hardware (MASH), as appropriate. Guardrail standards used by the Illinois Tollway are regularly updated to reflect current crash test data and new technologies, in conformance with the requirements of NCHRP Report 350 and MASH.
The Manual for Assessing Safety Hardware (MASH) is an update to NCHRP Report 350, for the purposes of evaluating new safety hardware devices based primarily on changes in the vehicle fleet. Any new or revised highway safety hardware under development as of the October 15, 2009 publication of MASH may continue to be tested using NCHRP Report 350 criteria. However, FHWA stopped accepting or reviewing requests for new or revised highway safety hardware tested using NCHRP 350 criteria after January 1, 2011. In the summer of 2015, the American Association of State Highway and Transportation Officials (AASHTO) established construction sunset dates for NCHRP Report 350 devices, whereas new roadway safety products must comply with the new MASH requirements.
The Illinois Tollway has directed that all existing guardrail installations which have not been successfully tested under NCHRP Report 350 requirements, be programmed to be upgraded to MASH-tested devices over the next several years. As such, the Illinois Tollway is scheduled to meet or exceed the dates outlined by AASHTO for the installation of safety appurtenances.
The current capital programs include funds for drainage and safety improvements system-wide which should include the replacement of non-NCHRP Report 350 compliant guardrail installations. Additionally, areas of programmed reconstruction/rehabilitation are anticipated to include the replacement of non-NCHRP Report 350 compliant guardrail installations within the limits of construction.
In 2019 and 2020, a detailed audit and inspection of existing guardrail, cable median barrier and impact attenuator installations was performed to provide a more comprehensive condition assessment of this infrastructure. The audit and inspections were performed in the office by reviewing high definition geo-located 360-degree video footage of the system. This method allows for a thorough and safe inspection of each asset. Per this audit there are 2,627 of these assets system-wide, with 78 required repairs addressed in 2020. Any repair activities deemed as beyond the capability of Tollway Maintenance have been recommended for repair or replacement in future contracts.
4.3.2.1 Guardrail
AASHTO’s Strategic Highway Safety Plan lists objectives and strategies for keeping vehicles on the roadway and for minimizing the consequences when a vehicle does encroach on the roadside. Additionally, the National Cooperative Highway Research Program (NCHRP) also has published a series of guides to assist state and local agencies in their efforts to reduce injuries and fatalities along the nation’s roadways. The current Manual for Assessing Safety Hardware (MASH) contains the current recommendations for testing and evaluating the safety

Consulting Engineers Report November 22, 2021
50
performance of highway features and hardware, including longitudinal barriers, terminals, crash cushions, work zone elements, and breakaway structures. Guardrail and terminals along the Illinois Tollway system are considered to be in generally Excellent condition.
4.3.2.2 Impact Attenuator
Impact attenuators are protective systems that prevent vehicles from impacting rigid obstacles by a controlled deceleration. Impact attenuators are adaptable to many roadside locations where guardrail cannot practically be used. Impact attenuators along the Illinois Tollway system are currently rated in Excellent to Good condition.
4.3.2.3 Cable Median Barrier
Cable median barrier systems consist of tensioned cables extending between bridges and emergency turnarounds in grassy median locations to minimize the occurrence of vehicles crossing into oncoming traffic. There are few federal standards for cable median barrier systems; however, all installations are inspected to confirm that they meet the current industry practices. Cable median barrier systems are in excellent condition due most these assets being replaced or newly installed as of 2018. Currently they are installed:
• West of Deerpath Road on the Reagan Memorial Tollway (I-88) • At the southern terminus of the Veterans Memorial Tollway (I-355) • Along the Reagan Memorial Tollway (I-88) connector ramps with Tri-State Tollway (I-294) • Along the Elgin O’Hare Western Access (IL 390)
4.3.2.4 Delineators and Reflectors
Delineators and reflectors are installed throughout the Illinois Tollway system, typically affixed to guardrail or on sticks mounted in the ground. In general, these assets were found to be in fair condition. Inspections of these devices are performed by close review of high definition 360-degree camera footage typically captured at the end of each winter season. The Illinois Tollway performs regularly scheduled maintenance on these items system-wide at least twice per year including at the end of the winter season when it is common to find large quantities of missing or damaged reflectors.
4.3.3 Pavement Markings and Raised Pavement Markers Pavement markings generally refer to lane striping and other demarcations designed to be in place under active traffic conditions. These pavement markings consist of durable thermoplastic material that is affixed directly to the pavement and is utilized throughout the Illinois Tollway system.
The Illinois Tollway maintains a Pavement Marking Database which contains historical installation data and retroreflectivity values. These values are updated as new information becomes available, typically through field measurement of reflectivity by the Pavement Management Consultant. The retroreflectivity values, in conjunction with visual inspections and historical records indicating the age of the markings, is utilized to determine locations for inclusion in the annual system-wide pavement marking contract and the scheduling of future contracts.

Consulting Engineers Report November 22, 2021
51
In 2020, 1,227.5-line miles of pavement marking were field inspected, and any repair activities communicated to the Illinois Tollway. Overall, lane markings varied from fair to excellent condition. Typical defects noted were missing or damaged sections of pavement markings.
The ongoing annual system-wide pavement marking renewal program provides upgrades to pavement marking visibility throughout the system. As part of this annual program, pavement markings are maintained and upgraded as indicated by age or the observation of defects. Pavement marking replacement is typically beyond the capabilities of Tollway Maintenance. It is most often recommended that areas exhibiting observed deficiencies as identified in the visual inspection and areas which exhibit low retro reflectivity be included for improvement in the annual system-wide pavement marking contract.
Raised pavement markers (RPMs) are low-profile reflectors affixed to the pavement that are typically used in conjunction with pavement markings to help delineate lanes at night or in other reduced visibility conditions. Areas of missing reflectors typically are noted at the end of the winter season due to winter plowing. The Illinois Tollway performs regularly scheduled maintenance on these items system-wide on a three-year cycle within each individual Maintenance division. During regularly scheduled work, damaged or missing reflectors and castings are removed and replaced. RPMs throughout the Illinois Tollway system vary in condition from excellent to fair depending on when areas have been inspected and most recently repaired.
It should be noted that reconstruction projects occurring from 2007 to 2009 did not include the installation of RPMs while a study was conducted to review their use. In 2012, it was decided to include RPMs as part of all contracts system-wide. In 2014, the contract work commenced for the installation of RPMs in sections of pavement in which they were not originally included. However as of 2019, the Illinois Tollway halted the installation of RPMs as part of any construction contracts pending the conclusion of further study, initiated in 2019, regarding their safety and effectiveness.
4.3.4 Roadway Lighting System As of 2020 there were 13,100 light poles system-wide. The roadway lighting systems throughout the Illinois Tollway system are generally in excellent to fair condition. The majority of the light poles appeared to be plumb with no noticeable movement or tilt. The typical deficiencies noted during the inspections were concrete or helix foundations which have been installed too high (over four inches from finished grade) or installations with improper breakaway devices. These locations are generally replaced to ensure the effectiveness of the breakaway devices. Additionally, instances of missing light pole handholes with exposed pole wiring are reported. Corrective repairs are recommended to the Illinois Tollway Maintenance Division or, depending on the severity and extent of required repairs, forwarded for inclusion in future contracts.

Consulting Engineers Report November 22, 2021
52
The Illinois Tollway has implemented a plan to retrofit all roadway lighting luminaires from High Pressure Sodium (HPS) to less energy intensive LED luminaires. All future contracts will specify LED luminaires as part of new or replacement installations. As of 2020, LED lighting technology has been implemented along the following Tollway sections:
• Reagan Memorial (I-88) • Tri-State (I-94) from northern terminus to Duffy Lane • Jane Addams Memorial (I-90) from east of Mill Road to the eastern terminus • Tri-State (I-294) from Balmoral Avenue to Lake-Cook Road • Tri-State (I-294) Bensenville Bridge • Tri-State (I-294) from southern terminus to 95th Street • Veterans Memorial (I-355) from southern terminus to Butterfield Rd • IL 390 Elgin-O’Hare Expressway, Jane Addams Memorial (I-90) from western
terminus to I-39 • Edens Spur (I-94) from eastern terminus Duffy Lane • Tri-State (I-294) from Bensenville Bridge to Balmoral Ave • Veterans Memorial (I-355) from I-55 to Army Trail Road
4.3.5 Right-of-Way Fence Right-of-Way fence inspections are conducted in the office by reviewing high definition, 360-degree drone video footage. The right-of-way fence throughout the Illinois Tollway system is generally in excellent to good condition. Deficiencies or required repairs identified during inspections are referred to the Illinois Tollway Maintenance Division or recommended for inclusion in future contracts.
Recent reconstruction projects have included the replacement of four-foot-high field right-of-way fence with the current Illinois Tollway standard six-foot-high chain-link fence. Most right-of-way fence along the Tri-State Tollway (I-94/I-294/I-80) and the Reagan Memorial Tollway (I-88), all the Veterans Memorial Tollway (I-355) and over half of the Jane Addams Memorial Tollway (I-90) have been upgraded to the current Illinois Tollway standard chain-link fence.
4.3.6 Ground-Mounted Traffic Signs Ground-mounted traffic signs are rated based upon visual inspection of their physical condition. Retroreflectivity measurements are not taken as part of these inspections. In 2020 there were 38,774 ground-mounted traffic signs throughout the Illinois Tollway system. The ground mounted signs are generally in fair to good condition. Damage to these signs is typically caused by traffic accidents or snowplows. The Illinois Tollway Sign Shop repairs or replaces these signs when damage is reported.

Consulting Engineers Report November 22, 2021
53
4.4 Structural Elements The structural elements inspected throughout the Illinois Tollway system consist of bridges, large culverts, retaining walls, noise abatement walls, sight screen walls and overhead sign structures.
4.4.1 Bridges and Large Culverts In accordance with FHWA guidelines, bridges throughout the Illinois Tollway system must receive a routine inspection at least every two years. A routine inspection consists of, at a minimum, a complete visual inspection of all major components of the bridge. Routine Inspections determine the physical and functional condition of the bridge and identify any changes from “Initial” or previously recorded conditions. Underwater Inspections are performed every five years. During Routine Inspections, inspection of submersed portions of the substructure is limited to observations during low-flow periods. The Illinois Tollway conducted Routine bridge inspections each year, and the resultant “Structure Inspection Field Reports” were reviewed by the Consulting Engineer.
As part of the inspections, condition ratings are assigned to the deck, superstructure and substructure components for each bridge inspected. The bridge deck consists of the wearing surface, joints and parapets. The superstructure consists of beams, diaphragms and stiffeners. The substructure consists of piers, abutments, bearings, foundations, slope and crash walls and piling.
The FHWA classifies culverts as bridges if the span of the culvert is at least 20 feet when measured along the centerline of the roadway. Therefore, all Illinois Tollway culverts that meet this criterion are also inspected at a minimum of every two years as part of the bridge inspections and are assigned a condition rating similar to that of the bridges. A Health Index, as described below, is then determined from this condition rating. The Health Index for culverts is directly related to the condition ratings used for the annual bridge inspections. This rating is an all-encompassing review of the culvert elements and only recorded as a single rating value. In 2009, the Health Index calculation for culverts was changed to follow the same description as bridges.
As of the date of this report, there are 688 structures classified as bridges throughout the Illinois Tollway system. Of these, there are 612 vehicular bridges, 13 non-vehicle bridges, 62 culvert bridges and one land bridge. Bridges and large culverts, classified as bridges in this category are inspected as part of a mandated bridge inspection schedule along with supplemental maintenance, fracture critical, damage and deficiency inspections. In 2020, the Tollway performed a total of 715 bridge inspections, including 355 scheduled routine inspections on bridges under Illinois Tollway jurisdiction.
The bridge inventory is revised on an as-needed basis to account for new construction, demolition and/or ownership transfers to other agencies. It should be noted that many of the bridge decks which pass over the Illinois Tollway are not under the Illinois Tollway’s jurisdiction. However, these bridge decks are included with the inspection as an informational courtesy to the responsible agency.

Consulting Engineers Report November 22, 2021
54
There are bridges located within the jurisdiction limits of the Illinois Tollway that are entirely under the jurisdiction of another agency. As of the date of this report, these bridges have been omitted from the Illinois Tollway bridge inventory. Since these bridges cross over Illinois Tollway roadways, they are informally inspected along with the structures for which the Illinois Tollway is responsible. Formal inspections are conducted and submitted to the FHWA by the responsible agency. The following 13 bridges are entirely under the jurisdiction of and maintained by another agency:
Illinois Department of Transportation
• Bridge 197C: Tri-State (I-294/I-80) over Calumet Union Drainage Ditch
• Bridge 198: EB I-80 Ramp A over Tri-State Tollway (I-294/I-80)
• Bridge 521: I-290/IL Route 53 over Jane Addams Memorial Tollway (I-90)
• Bridge 1146: NB I-39 over Reagan Memorial Tollway (I-88)
• Bridge 1146A: SB I-39 over Reagan Memorial Tollway (I-88)
• Bridge 1621: I-290 SE Ramp G1 over IL 390
• Bridge 1625: I-290 NW Ramp G5 over IL 390
• Bridge 1628: SE I-290 Ramp G1 over WS IL 390 Ramp G7
Chicago Transit Authority (CTA)
• Bridge 366A: EB CTA O’Hare Rapid Transit over Tri-State Tollway (I-294)
• Bridge 366B: WB CTA O’Hare Rapid Transit over Tri-State Tollway (I-294)
Bridge 366C: CTA O’Hare Rapid Transit over NW I-90 Ramps M & P
Illinois Department of Conservation
• Bridge 702: Rock Cut State Park road over Jane Addams Memorial Tollway (I-90)
Village of Oakbrook
• Bridge 280: Salt Creek Greenway Trail over Reagan Memorial Tollway (I-88)
The FHWA guidelines do not include bridge deck ratings in the determination of the overall Sufficiency Rating. Therefore, the deck is not typically the driving force behind replacement. However, the deck is important in the programming of repair work based on general aesthetics and rideability. The deck is also the most visible bridge component to the traveling motorist/patron. Since the Illinois Tollway is patron-oriented and bridge deck repairs, other than minor deterioration, are typically beyond the capabilities of the Illinois Tollway Maintenance Division, the deck should be accounted for in the overall bridge condition rating.
Considering this, the Consulting Engineers created an Overall Condition Index (OCI) to more appropriately quantify the condition of the bridges throughout the Illinois Tollway system. The OCI is a weighted representation of the deck, superstructure and substructure ratings based on field inspections and is intended to give an overall indication of the condition of a bridge. A higher weight is placed on the deck rating because the deck tends to deteriorate faster than the other components of the bridge.

Consulting Engineers Report November 22, 2021
55
The Overall Condition Index is a number on a scale from 0 to 100 with 100 being the best. It does not consider the individual ratings of components such as joints, diaphragms or bearings, though these ratings are generally used to develop future repair contracts. The following table provides descriptions of the bridge Overall Condition Index ratings.
Table 7: Overall Condition Index Rating Descriptions
H.I. Description
≥90 No problems or some minor problems noted. No action required.
89 – 80 Some areas of minor deterioration. Minor repair by Maintenance or Contract would prevent additional deterioration.
79 – 70 Structural elements are sound but exhibit minor section loss or deterioration. Repair Contract likely needed within 5 years.
69 – 60 Advanced section loss. Repair Contract should be initiated within 2 years.
< 60 Advanced loss of section and deterioration. Local failures possible. Immediate attention needed.
The following table illustrates the bridge inspection Overall Condition Index summary. Since the bridges are on a two-year inspection cycle, the table illustrates the condition index rating for all bridges inspected in 2019 and 2020.
Table 8: Bridge Inspection Summary
Condition Index
Overall Condition
2019 2020 Total*
≥90 Excellent 303 281 584 (85.5%)
80-89 Good 23 41 64 (9.4%)
70-79 Fair 11 17 28 (4.1%)
60-69 Poor 1 5 6 (0.9%)
<60 Critical 0 1 1 (0.1%)
Total 338 346 683*
*Does not include the 4 new bridges built in 2021 or the land bridge because an OCI rating is not assigned for this structure.

Consulting Engineers Report November 22, 2021
56
Six of the bridges inspected during the current two-year cycle had an OCI rating of Poor; however, one of these bridges has been repaired as noted:
Bridge 223: SE I-290 Ramp H over I-290, I-294 MP 31.8
The bridge deck has an NBIS rating of Poor, the superstructure has an NBIS rating of Fair and the substructure has an NBIS rating of Fair. The bridge is currently planned for complete removal as part of ongoing design Contract I-17-4300. Interim bridge deck repairs were completed in 2019 under Contract RR-18-4439. The next scheduled inspection is in 2022.
Bridge 225: NB I-294 over Electric Avenue, I-294 Milepost 32.0
The bridge deck has a NBIS Rating of Poor, the Superstructure has a NBIS rating of Satisfactory, and the Substructure has a NBIS Rating of Fair. The bridge is currently planned for complete replacement as part of ongoing Design Contract I-17-4300. The next scheduled inspection is in 2022.
Bridge 279: I-294 Ramp M & N under York Road, I-88 MP 136.68 The bridge deck has an NBIS rating of Poor and the superstructure and substructure have NBIS ratings of Satisfactory. The bridge deck and wearing surface are under the jurisdiction of the Village of Oak Brook. The remainder of the structure is under the Illinois Tollway’s jurisdiction. Bridge repairs are being planned in coordination with the Village of Oak Brook.
Bridge 299: I-294 Ramps M & N under Windsor Road, I-88 MP 138.45 The bridge deck has a NBIS rating of Poor and the superstructure and substructure have NBIS ratings of Satisfactory. The bridge deck and wearing surface are under the jurisdiction of the Village of Oak Brook. The remainder of the structure is under the Illinois Tollway’s jurisdiction. The bridge is will be completely replaced under Contract I-18-4352 in coordination with the Village of Oak Brook.
Bridge 341: I-294 / I-94 over Lake-Cook Road, I-94 Milepost 25.28 The bridge deck has a NBIS Rating of Satisfactory, the superstructure has a rating
of Poor and the Substructure has a rating of Fair. The bridge deck is under the jurisdiction of Cook County. The remainder of the structure is under the Illinois Tollway’s jurisdiction. Bridge repairs are currently planned in 2021 under Contract RR-20-4538R.
Bridge 713: Elevator Road over I-90, I-94, Milepost 25.28 The bridge deck has a NBIS Rating of Fair, the Superstructure has a NBIS rating
of Poor, and the Substructure has a NBIS Rating of Fair. Bridge repairs were completed under Contract RR-19-4502 including one beam replacement and many deck repairs. The next scheduled inspection is in 2022.

Consulting Engineers Report November 22, 2021
57
In addition, the following bridge has an OCI Rating of Critical: Bridge 407 O: Lake Forest Oasis over I-94, I-94 Milepost 18.1 The bridge deck has a NBIS Rating of Satisfactory, the Superstructure has a NBIS
rating of Serious, and the Substructure has a NBIS Rating of Satisfactory. The bridge superstructure condition rating is due to 2020 findings on the bridge fascia beams; however, the bridge does not carry vehicular loads. The bridge is planned for repair in 2021 under Contract RR-20-4538R.
Of the 28 bridges with a Health Index of 70-79, the majority are programmed for repair within the next five years. However, a number of these bridges are located within the Central Tri-State (I-294) corridor, which is programmed for reconstruction through 2026. Depending on the nature of the deficiencies noted, some of the bridge structures may be included with these contracts. These structures will continue to be monitored, and if required, will be included for repair in advance of this programmed reconstruction.
Supplemental Inspections are performed as a proactive effort for continuous improvement. These inspections differ from the FHWA and IDOT definition Special Inspections which are intended to monitor a specific structural feature, repair activity or condition that must be monitored more frequently than required by other inspection types. Supplemental Inspections are generally performed on bridges identified during the previous year’s scheduled inspections as having a small number of outstanding repair activities that do not affect the structural load-carrying capacity of the bridge. However, with a full cycle of Element Level Inspections completed in 2018-2019 on every bridge in the Illinois Tollway system, the intended goal of the Supplemental Inspections to monitor previous repair activities has been substantially achieved without these follow-up inspections. The Illinois Tollway has evolved the process to efficiently track, using the Asset Management System, the repair activities of these monitoring Supplemental Inspections during previous cycles and verifying that work is tracked and sufficiently completed.

Consulting Engineers Report November 22, 2021
58
4.4.2 Structural Walls Structural walls include retaining walls, noise abatement walls and sight screen walls. In total, the Illinois Tollway has 986 walls under its jurisdiction.
Visual inspections of the structural walls located throughout the Illinois Tollway system are performed annually. Due to the number of structures to be inspected, the effort is scheduled as a multi-year task. The structural walls throughout the Illinois Tollway system are generally inspected on a four-year cycle. However, newly constructed structures or those last rated in excellent condition may be inspected on a slightly extended cycle due to the expectation of their remaining in excellent condition for several years. Approximately 25% of Illinois Tollway structural walls are inspected each year.
An overall condition rating is assigned for each structural wall inspected. In order to improve objectivity and uniformity between maintenance sections and inspectors, a condition rating system was developed for the structural wall inspections. The overall condition of the structural wall is assigned based on the extent and severity of all individual repair activities observed during the inspection. The condition ratings utilized for the structural wall inspections are included in the following table:
Table 9: Structural Wall Inspection Condition Rating Summary
Rating Description
Excellent There are no problems noted.
Good Good condition exists with only minor problems noted.
Fair Fair condition exists with minor section loss, cracking or spalling observed.
Poor Poor condition exists with signs of advanced deterioration, section loss, wide cracks, water seepage and out of plumb but stable condition. Wall requires close monitoring.
Critical Critical condition exists with major defects, significant deterioration and section loss, obvious vertical or horizontal movement affecting wall stability exists. Wall requires replacement or immediate attention.
Deficiencies noted at structural walls assigned a condition rating of excellent to fair are typically minor and do not require immediate attention. These deficiencies are typically addressed by the Maintenance Division or are included in a future contract. Recommendations provided for structural walls assigned a condition rating of poor to critical require monitoring or immediate attention.
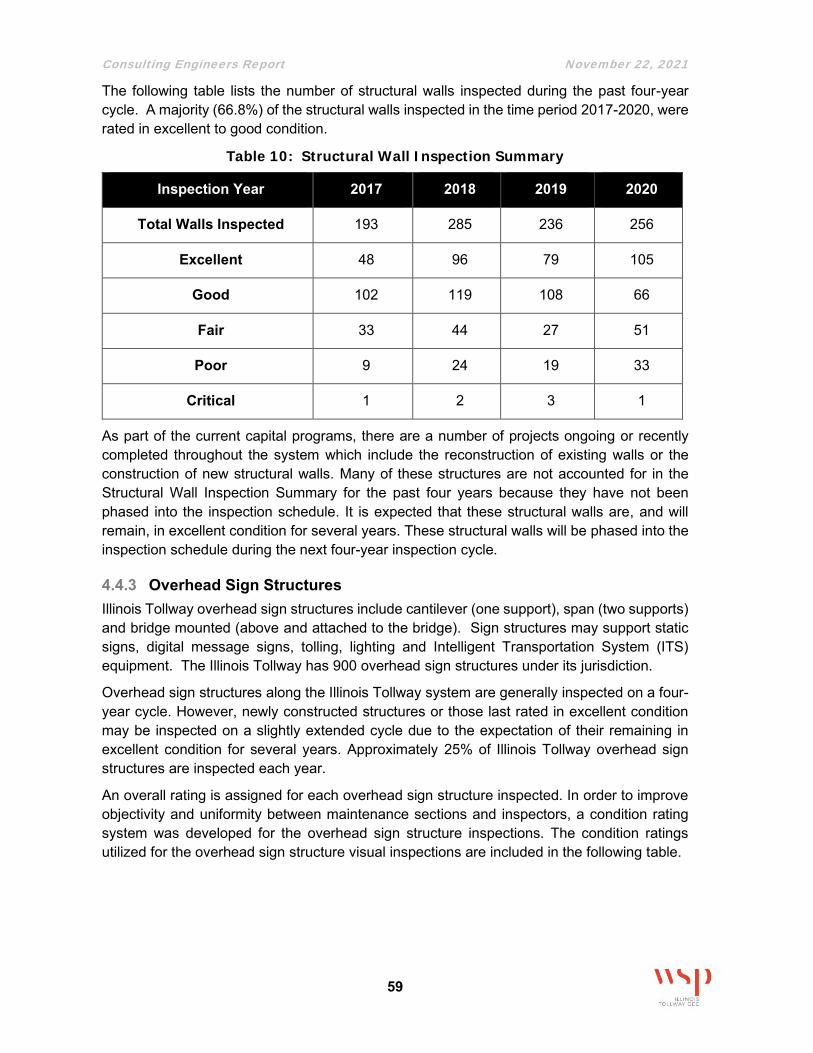
Consulting Engineers Report November 22, 2021
59
The following table lists the number of structural walls inspected during the past four-year cycle. A majority (66.8%) of the structural walls inspected in the time period 2017-2020, were rated in excellent to good condition.
Table 10: Structural Wall Inspection Summary
Inspection Year 2017 2018 2019 2020
Total Walls Inspected 193 285 236 256
Excellent 48 96 79 105
Good 102 119 108 66
Fair 33 44 27 51
Poor 9 24 19 33
Critical 1 2 3 1
As part of the current capital programs, there are a number of projects ongoing or recently completed throughout the system which include the reconstruction of existing walls or the construction of new structural walls. Many of these structures are not accounted for in the Structural Wall Inspection Summary for the past four years because they have not been phased into the inspection schedule. It is expected that these structural walls are, and will remain, in excellent condition for several years. These structural walls will be phased into the inspection schedule during the next four-year inspection cycle.
4.4.3 Overhead Sign Structures Illinois Tollway overhead sign structures include cantilever (one support), span (two supports) and bridge mounted (above and attached to the bridge). Sign structures may support static signs, digital message signs, tolling, lighting and Intelligent Transportation System (ITS) equipment. The Illinois Tollway has 900 overhead sign structures under its jurisdiction.
Overhead sign structures along the Illinois Tollway system are generally inspected on a four-year cycle. However, newly constructed structures or those last rated in excellent condition may be inspected on a slightly extended cycle due to the expectation of their remaining in excellent condition for several years. Approximately 25% of Illinois Tollway overhead sign structures are inspected each year.
An overall rating is assigned for each overhead sign structure inspected. In order to improve objectivity and uniformity between maintenance sections and inspectors, a condition rating system was developed for the overhead sign structure inspections. The condition ratings utilized for the overhead sign structure visual inspections are included in the following table.

Consulting Engineers Report November 22, 2021
60
Table 11: Overhead Sign Structures Inspection Condition Rating Summary
Rating Description
Excellent There are no problems noted.
Good Good condition exists with only minor problems noted, such as: minor rust or foundation cracking, loose bolts, missing safety chains, damaged lighting, sign legend/background problems, etc.
Fair Fair condition exists with the following: moderate corrosion or foundation cracking/spalling, several loose bolts or loose pillow blocks/saddles, etc.
Poor Poor condition exists with signs of moderate structural cracking, section loss, heavy foundation cracking/spalling or collision damage. Sign structure requires monitoring.
Critical Critical condition exists with major structural defects or loose components that could fall on roadway. Overhead sign requires immediate attention.
Deficiencies noted at overhead sign structures assigned a condition rating of excellent to fair are typically minor and do not require immediate attention. These deficiencies are typically addressed by the Maintenance Division or are included in a future contract. Therefore, recommendations are only provided for overhead sign structures assigned a condition rating of poor to critical since those deficiencies typically require either monitoring or immediate attention.
The following table lists the number of overhead sign structures inspected from 2016 to 2019. In addition, the table accounts for special inspections conducted in interim years to confirm that the severity of noted defects has not increased. Based on the 2017-2020 inspection cycle, 91% of the 900 Illinois Tollway overhead sign structures rate in excellent to good condition.

Consulting Engineers Report November 22, 2021
61
Table 12: Overhead Sign Structure Inspection Summary
Inspection Year 2017 2018 2019 2020
Total Sign Structures Inspected 188 226 225 334
Excellent 96 29 80 135
Good 82 159 115 176
Fair 7 30 21 20
Poor 3 8 9 3
Critical 0 0 0 0
As part of the current capital programs, there are a number of projects ongoing or recently completed throughout the system which include the reconstruction of existing or the construction of new overhead sign structures. Many of these structures are not accounted for in the Overhead Sign Structure Inspection Summary over the previous four years provided herein because they have not been phased into the inspection schedule. Most notably, a more than 20% increase of inventory has occurred as part of the Jane Adams Memorial Tollway (I-90) corridor reconstruction and the ongoing reconstruction and expansion of the Illinois Route 390 Tollway corridor. It is expected that these overhead sign structures are and will remain in excellent condition for several years. These sign structures will be phased into the inspection schedule over the next four-year inspection cycle.

Consulting Engineers Report November 22, 2021
62
4.5 Facilities There are several types of facilities throughout the Illinois Tollway system, including operations and administration, maintenance, toll plazas, power and communications buildings, oases and pump stations. Each may also contain multiple facility assets such as buildings, fuel stations etc. The current Illinois Tollway inventory contains 187 facilities. Through 2020, 77.0% of the facilities inspected over the most recent inspection cycle rated a condition of excellent to good, 8 facilities were assigned a condition of fair and none of the inspected facilities rated poor. No facility was given a rating of critical. New facilities were not included in the most recent inspection cycle. These facilities can be categorized as being in excellent. Inspection of these facilities will be incorporated into the next four-year inspection cycle.
Visual inspections of the facilities located throughout the Illinois Tollway system are performed annually by the Illinois Tollway’s Consulting Engineer. The inspection consists of the recording of visible deficiencies of all facility elements, including but not limited to buildings, mechanical and electrical, tunnels, canopies and sites with associated appurtenances. Facilities that are inspected include maintenance facilities, toll plazas, telecommunications buildings, oases and miscellaneous facilities. Facilities are generally inspected on a four-year cycle. However, newly constructed facilities or facilities last rated in excellent condition may be inspected on a slightly extended cycle due to the expectation of these facilities remaining in excellent condition for several years. Approximately 25% of Illinois Tollway facilities are inspected each year.
The objective of these inspections is to assess the general condition of Illinois Tollway facilities and associated site elements, identify elements requiring remedial work, make repair or replacement recommendations and evaluate the remaining useful life. The data provided by these inspections is utilized by the Illinois Tollway to program repairs and replacements of various facility components and to aid the Illinois Tollway Building Maintenance Division in planning and estimating maintenance repairs. The evaluations and recommendations are based upon visual observations, discussions with Illinois Tollway Building Maintenance Division personnel and the reviews of available reports. Emphasis is given to the identification of specific issues identified by on-site personnel experienced with the actual operating conditions of the facility. No destructive or non-destructive testing is performed, and no physical samples are collected as part of these inspections. Starting in 2018, the inspection process included the use of Unmanned Aerial Vehicles to assess the conditions of canopies and roofs, making these inspections easier and safer.

Consulting Engineers Report November 22, 2021
63
An overall condition rating is assigned for each facility inspected. A separate condition rating is also typically assigned to each associated facility element. A rating system was developed to improve objectivity and uniformity between facilities inspected and inspectors. Based upon the assigned condition rating, the future inspection schedule for each facility may either remain on a four-year cycle or be recommended for more near-term inspections. The overall condition ratings utilized for the visual inspections are provided in the following table.
Table 13: Facilities Inspection Ratings Summary
Rating Description
Excellent All four conditions must be exhibited: • New Facility or component • No repair required • Condition like new • Component performing as intended
Good All three conditions must be exhibited: • Facility is performing essentially as intended • Minor repair required (i.e., paint, clean, patching, etc.) • Less than 25% of the replacement cost of the facility or
component is required to return the component to intended condition.
Poor Any condition exhibited may be cause for rating: • Facility is approaching end of useful life • Major components need extensive repair / replacement work • 25% - 50% of the replacement cost of the system or component
is required to return the component to intended condition
Critical Any condition exhibited may be cause for rating: • System or component is non-functioning • Safety or environmental concerns are prevalent (If component
exhibits safety or environmental concerns, entire system will be graded as critical)
• More than 50% of the replacement cost of the facility or component is required to return the component to intended condition
Due to recent major capital program construction, there are 70 newly constructed or reconstructed Illinois Tollway facilities throughout the system. Facilities rated as fair to poor have seen renovation work performed to enable these facilities to continue to function although costs to maintain and repair ancillary systems including plumbing, heating and cooling, mechanical and electrical will continue to increase. Architectural and site improvements have been made to maintenance facilities on an “as needed” basis through capital improvement projects. In addition, the I-PASS implementation program has enabled many upgrades, renovations and replacement of toll plazas. To date, all mainline toll plazas have been reconstructed or rehabilitated to accommodate open road tolling.
Illinois Tollway Building Maintenance Division forces provide necessary day-to-day repairs of facilities to the greatest extent possible. More intensive repair and rehabilitation work is performed as part of the capital programs.

Consulting Engineers Report November 22, 2021
64
4.5.1 Maintenance Facilities and Miscellaneous Facilities The maintenance facilities typically consist of garages, offices, salt domes, gas pumping facilities, storage buildings, telecommunication towers and other components.
A major Facilities’ capital program to repair or replace a number of maintenance facility buildings began in late 2008. The initial emphasis of this program was the repair of existing systems and the improvement of the working environment for Illinois Tollway employees. These improvements have been and continue to be consistent with the Illinois Tollway’s desire for sustainable facilities. A scope and schedule for a 10-year program has been approved. However, due to funding restrictions, the budget is approved annually, thus requiring annual review of the program schedule and prioritization of needed repairs and facility upgrades.
As part of the ongoing Move Illinois Program, a number of maintenance facilities are programmed for relocation, reconstruction or rehabilitation. Thus, the emphasis at these facilities has shifted to keep them functional until the programmed reconstruction or rehabilitation. As a result, Professional Service Bulletin No. 12-5 was issued in October 2012 which included contract RR-12-4079 (Maintenance Facilities) that began in 2013. The purpose of this contract is to provide Phase I and II engineering services for the development of a master plan and design/architectural plans for the maintenance facilities. The scope of work includes the following:
• Development of a short-term maintenance repair plan to keep the existing facilities functional until reconstruction or rehabilitation.
• Development of master plans for reconstructed or relocated maintenance facilities.
• Development of the plats of survey for the Maintenance Facility M-4 (Gurnee) and Elgin O’Hare Western Access maintenance facilities.
• Development of contract documents for the construction of the maintenance buildings including the finalization of two prototype designs for the reconstructed and relocated maintenance facilities.
• Development of a strategy to maintain facilities and maintenance operations during construction.
• Site investigations and potential remediation.
The improvements completed to date and those anticipated as part of Contracts RR-12-4079 and RR-12-4267 have been and will continue to be consistent with the Illinois Tollway’s desire for sustainable facilities. It is anticipated that the improvements that were not completed as part of the original Facilities’ Capital Program will be addressed as part of a future design contract with budget to be determined.
The prototype master plan developed for the reconstruction of maintenance facilities has been implemented at Maintenance Facility M-1 (Alsip). Work was completed in 2015. Construction at Maintenance Facilities M-6 (Marengo) and M-7 (Rockford) was completed in 2018. The Construction of the M-7 Truck Wash was completed in 2019. The reconstruction of the M-8 Facility began in 2020 with completion projected for 2021.
In 2001, it was first recommended to program the replacement of deteriorated salt dome roofs throughout the system into a system-wide contract and to replace the vehicle storage building
Consulting Engineers Report November 22, 2021
65
at Maintenance Facility M-1 by 2006. That work has been completed, and to date, salt dome repair/replacement has been completed at Maintenance Facilities M-1, M-2, M-3, M-4, M-7, M-8, M-11 and M-12 and at the Illinois Route 251 Salt Dome.
The majority of maintenance and miscellaneous facilities throughout the Illinois Tollway system have generally been assigned a condition rating of good over the previous four-year inspection cycle and the remainder are new or were reconstructed within the last 5 years. These facilities typically only require minor repairs and continued routine maintenance. During the 2020 inspections, no maintenance or miscellaneous facilities were rated in poor condition.
4.5.2 Toll Plazas The majority of Toll Plazas throughout the Illinois Tollway system have generally been assigned a condition rating of good over the previous four-year inspection cycle. These facilities typically only require minor repairs and continued routine maintenance. Three Toll Plazas maintain a poor condition rating, and are scheduled for the necessary repairs in the next one to three years:
Due to COVID-19, the Illinois Tollway implemented cashless tolling throughout the system in March 2020. For 2021, the Illinois Tollway has decided to continue the implementation of cashless tolling at all toll locations across the system. Consequently, the Illinois Tollway is making plaza cashless retrofit improvements at numerous plaza locations. These plaza improvements will be completed in 2021. This work includes electrical and communication improvements, signing changes, and pavement marking updates.
4.5.3 Communication Facilities All communication facilities throughout the Illinois Tollway system have been assigned a condition rating of good over the previous four-year inspection cycle. These facilities typically only require minor repairs and continued routine maintenance.
4.5.4 Oases All oases throughout the Illinois Tollway system have been assigned a condition rating of good over the previous four-year inspection cycle. These facilities typically only require minor repairs and continued routine maintenance. Rehabilitation or reconstruction of the parking areas at the oasis facilities commenced in 2014 and was completed in 2015. The Des Plaines Oasis along I-90 was removed as part of the I-90 widening and to make way for the planned interchange with I-490. The O’Hare Oasis over I-294 was taken out of service and demolished in 2018.
The Hinsdale Oasis is scheduled for demolition starting in 2021. Some activities remain at these locations including gas stations and convenience stores operated by others.

Consulting Engineers Report November 22, 2021
66
4.6 ITS Devices In 2016, due to the increased deployment of Intelligent Transportation System (ITS) devices throughout the Illinois Tollway system, the Consulting Engineers performed a field inventory of the ITS devices system-wide. This inventory was done to verify the location, condition and functionality of deployed devices. This information allows the Illinois Tollway to accurately account for the number of ITS devices under its jurisdiction and to enable the Consulting Engineers to develop a more detailed ITS device inspection and preventive maintenance program.
There are several types of ITS devices deployed throughout the system. These devices are closed-circuit television (CCTV) cameras, vehicle detection systems (VDS), dynamic message signs (DMS), roadway weather information systems (RWIS), weigh-in-motion (WIM) stations, advanced warning flashing beacons, and active traffic management systems (ATMS). The ITS infrastructure consists of cabinet enclosures, pole mounting structures, and site foundations that are associated with each device.
As of 2020, the Illinois Tollway has the following ITS devices deployed in its system.
Table 14: ITS Device Summary
Type CCTV1 VDS Flash Beacon
DMS2 RWIS WIM LCS3 Total
Quantity 1340 417 4 51 21 4 376 2,213
1CCTV devices consist of ITS, toll plazas and shared use cameras. 2DMS devices consist of Type 1, and Type 2. 3LCS consist of lane control use sign and 3ftx9ft full-matrix display signs.
Inspections consist of ground-level visual inspection of the device and control components, verification that the device is communicating with TIMS and inventory and operational verification of the device and control components. These inspections occur on an annual basis. ITS assets located within an active construction zone are generally not inspected. All ITS assets that were not inspected in 2020 will be prioritized in the 2021 inspection cycle..
As a means to ensure that all ITS assets are kept in a satisfactory condition and inspectors, designers and maintainers have a consistent and objective standard for determining the status of ITS assets, the Illinois Tollway has developed the following Overall Condition Index (OCI) to measure asset condition.

Consulting Engineers Report November 22, 2021
67
Table 15: ITS Rating System
Rating Description
Excellent 100 to 90
New device, element or component Device, element or component is performing as intended No repair required Condition like new
Good 89 to 70
Device, element or component is performing as intended Only minor repair (i.e. paint, clean etc.) required to return the device, element or component to intended condition.
Fair 69 to 50
Device, element or component is performing essentially as intended Substantial repair (i.e. component/system required replacement) required to return the device, element or component to intended condition.
Poor 49 to 30
Device, element or component has reached predicted end of useful life, but is functioning. Major components requiring extensive repair/replacement work to return the device, element or component to intended condition.
Critical 29 to 0
Device, element or component is non-functioning. Safety or environmental concerns are prevalent.
The 2020 annual inspection of ITS assets reported that 94.2% of all the Illinois Tollway’s ITS devices are operating within their intended lifecycle, and their infrastructures are estimated to be in “Good Condition” with an average Overall Condition Index (OCI) of 87.9.

Consulting Engineers Report November 22, 2021
68
4.7 Electronic Tolling System The electronic tolling system encompasses technologies related to automatic vehicle detection, automatic vehicle classification and violation enforcement systems that support traffic and revenue monitoring and collections. The electronic tolling system is operated by the Illinois Tollway’s Department of Business Systems (DBS) whose primary objective is revenue collection and assurance. Due to the business-critical nature of this system, it is compartmentalized, firewalled, and operated independently from any other Illinois Tollway system, including ITS.
The Illinois Tollway’s electronic tolling system consists of technology deployed at its 89 toll plazas across 720 tolled lanes that includes cameras, vehicle detection equipment, and point of sale equipment, as well as robust back-office hardware and software systems, telecommunications and networking facilities, violations processing, and an IPASS customer service center. Back-office operations are located across multiple and redundant facilities, including the Central Administration data center, the Call Center located at the University of Illinois Chicago campus and a Disaster Recovery site located in DeKalb.
Tollway Staff and external personnel are responsible for preventive, routine and corrective maintenance of tolling system technologies. The lifecycle of electronic tolling system equipment varies by sub-system components, while the average age and predicted replacement of critical components and parts are tracked and managed by DBS. Replacement and upgrade of components has followed a planned and budgeted process. DBS utilizes an independent asset management consultant who performs routine inspections to ensure the health and reliability of these technologies. Specific repair activities identified during these inspections will be documented and tracked in the DBS Asset Management System and preventative maintenance activities are deployed as needed to mitigate identified concerns. These systems are maintained in good condition.
Due to the increased deployment of, and reliance on electronic tolling system devices, it is recommended that the Illinois Tollway’s independent inspectors continue to perform inspections, report findings to the DBS asset management consultant, and perform maintenance activities as directed to ensure the Illinois Tollway’s assets remain in a state of good repair.

Consulting Engineers Report November 22, 2021
69
5 Estimated Renewal and Replacement Deposits Section 204(1)(4) of the Trust Indenture details that the Consulting Engineers shall provide estimates of Renewal and Replacement Deposits. The Renewal and Replacement Deposit is the “amount budgeted for deposit to or projected for deposit to the Renewal and Replacement Account for Renewal and Replacement Expenses, other than such budgeted or projected amounts which the Illinois Tollway has determined will be available for Renewal and Replacement Expenses from the System Reserve Fund, the Improvement Fund, or from the proceeds of authorized borrowings or from installment purchases or leases.”
The table below provides estimates of Renewal and Replacement Deposits for each of the fiscal years 2020 through 2032. The Renewal and Replacement Deposits are based upon the following information provided to the Consulting Engineers prior to the issuance of this report:
• Estimated capital expenditures of $14.1 billion for the execution of Move Illinois Program as described in Sections 2 and 3 with approximately $7.4 billion spent from 2010 through 2020.
• The finance plan provided to the Consulting Engineers by the Illinois Tollway, which currently anticipates that the Move Illinois Program will be paid for with approximately $5.8 billion of bond proceeds and approximately $8.3 billion of Illinois Tollway revenue.
• The below deposits consist of revenues to be used for Renewal and Replacement expenditures.
• Minimal proceeds from Bond Issuances in the years of 2027-2032.
The Consulting Engineers utilize and rely upon information provided by the Illinois Tollway and PMO for the development of the Renewal and Replacement Deposit estimates. The estimates are developed based upon the independent review of information provided prior to the issuance of this report. The Consulting Engineers provide an annual letter to the Illinois Tollway indicating the recommended deposit amount for the following year, pursuant to the requirements of Section 710.1 of the Trust Indenture. The Consulting Engineers provide concurrence to the amount of the recommended deposit based upon projected balances, budgeted expenditures, projected future expenditures and other pertinent considerations or information at the time of the letter issuance.

Consulting Engineers Report November 22, 2021
70
Estimated Renewal and Replacement Deposits will fund the Move Illinois Program. The Trust Indenture requires projections for five years beyond the projected “in-service” date of the project.
Table 16: Estimated Annual Renewal and Replacement Deposits
Year Renewal and Replacement
Deposits 2021 $228,000,000 2022 $288,000,000 2023 $264,000,000 2024 $264,000,000 2025 $252,000,000 2026 $264,000,000 2027 $144,000,000 2028 $552,000,000 2029 $552,000,000 2030 $552,000,000 2031 $552,000,000 2032 $552,000,000

Consulting Engineers Report November 22, 2021
71
6 Operating Expenses
Operating Expenses are the expenses that the Illinois Tollway incurs due to the normal course of business for operation, maintenance and repairs of the Illinois Tollway system. Operating Expenses do not include debt services; the Illinois Tollway’s debt service obligations are not discussed in this report. The summary, review and future projections of the Illinois Tollway Operating Expenses provided in this section rely upon budget and actual expenditure data provided by the Illinois Tollway.
6.1 Historic Expenses With the formation of the Security and Safety Department in 2020, the Illinois Tollway’s organizational structure now consists of 17 primary functions, including: Administration, Business Systems, Communications, Directors/Executive, Diversity and Strategic Development, Engineering, Facilities and Fleet, Finance, Illinois State Police, Information Technology, Inspector General (Investigations), Internal Audit, Legal, Planning, Procurement, Security and Safety, and Operations. The following table identifies, by primary function, the actual Operating Expenses for the Illinois Tollway in 2019 and 2020, the 2021 year-end Operating Expenses Forecast, and the Tentative 2022 Budget. The Tentative 2022 Budget represents an 8.3% increase compared to the 2021 Budget and an 8.8% increase compared to the current 2021-year end forecast.
The newly created Security and Safety department is responsible for providing both the Tollway employees and facilities with a secure and safe work environment and protecting from threats, including natural, human-made, and safety-related while at the workplace. Additionally, this department provides employees with comprehensive subject-matter training.

Consulting Engineers Report November 22, 2021
72
Table 17 Operating Expenses by Department: 2019-2020 Actual; 2021 Year-End Forecast; Tentative 2022 Budget
DEPARTMENT 2019
Actual* % of Total
2020 Actual
% of Total
2021 Yr-End Forecast
% of Total
Tentative 2022
Budget % of Total
Administration $4,618,724 1.3% $3,008,824 0.8% $4,022,137 1.1% $6,001,049 1.5%
Business Systems 19,508,860 5.6% $21,549,366 6.0% $23,374,904 6.2% $24,253,860 5.9%
Communications 1,502,051 0.4% $1,462,503 0.4% $1,392,053 0.4% $1,454,531 0.4%
Diversity and
Strategic Dev. 4,640,734 1.3%
$5,001,750 1.4% $4,796,882 1.3% $6,727,963 1.6%
Engineering 66,984,734 19.1% $72,186,376 20.0% $67,778,238 18.0% $69,201,630 16.8%
Executive Office
and Directors 2,128,038 0.6%
$2,199,123 0.6% $2,686,174 0.7% $2,996,482 0.7%
Facilities and Fleet 33,760,684 9.6% $33,808,800 9.4% $38,425,151 10.2% $40,387,397 9.8%
Finance 77,732,886 22.2% $78,123,821 21.7% $84,076,682 22.3% $90,099,652 21.9%
Information
Technology 13,031,867 3.7%
$22,822,017 6.3% $27,343,049 7.2% $37,478,715 9.1%
Inspector General 833,926 0.2% $782,424 0.2% $890,564 0.2% $1,205,290 0.3%
Internal Audit 662,890 0.2% $972,567 0.3% $1,203,651 0.3% $3,631,497 0.9%
Legal 1,594,687 0.5% $1,640,113 0.5% $1,932,696 0.5% $1,990,777 0.5%
Operations 79,967,467 22.8% $71,600,454 19.9% $73,791,932 19.6% $78,031,861 19.0%
Planning 5,060,404 1.4% $2,696,169 0.7% $3,821,873 1.0% $3,950,957 1.0%
Procurement 3,281,851 0.9% $3,406,225 0.9% $2,680,522 0.7% $3,580,977 0.9%
Security and Safety
- - $729,254 0.2% $824,816 0.2% $1,467,344 0.4%
State Police 34,896,890 10.0% $38,213,044 10.6% $38,320,926 10.2% $38,413,523 9.3%
TOTALS $350,206,693 100% $360,202,830 100% $377,362,247 100% $410,873,505 100%
* Note that 2019 departmental operating expenses shown above have not been restated to reflect certain departmental organizational changes that became effective after 2019.
The existing Illinois Tollway system to be maintained and operated includes 294 centerline miles of limited access highways featuring an open road toll collection system consisting of mainline and ramp plazas. Improvements in progress as part of the Move Illinois Program will add new capacity on existing routes, create new routes within the Illinois Tollway system and will introduce additional locations of all-electronic tolling, where no cash or coins are collected.

Consulting Engineers Report November 22, 2021
73
6.2 Illinois Tollway Operating Expenses Each department has a defined operating budget that is prepared by both the specific department and the Illinois Tollway’s Finance Department. Quarterly expenditures are carefully monitored to verify compliance with the budget and to identify revisions that need to be made either in the current calendar year, or for the following year budget preparation.
Department expenses are fairly static and are generally influenced by the budgeted and actual headcounts within the department, as well as some minor annual fluctuations of material, utility or contract costs. The Illinois Tollway strives to manage their overall and department budgets. Salary and wage adjustments, required retirement contributions, and inflationary factors are the main variables on a year-over-year basis. Individual department budgets and overall budget line items may vary from one year to the next due to equipment refresh or operational changes. Seven of the 17 departments comprise 92% of the Tollway’s Tentative 2022 Budget: Finance, Operations, Engineering, Facilities and Fleet, State Police, Information Technology, and Business Systems. Several of these departments are influenced by dynamic factors that may change from year to year, including Operations, Business Systems, Engineering, and Finance.
6.2.1 Operations The Illinois Tollway’s Operations Department represents 19% of the Illinois Tollway’s Tentative 2022 Budget. Formerly called Toll Operations, this Department is responsible for providing the necessary resources and services to maintain the Tollway’s operations, as well as managing the collection and counting of tolls. Maintenance of Illinois Tollway buildings is also managed within Operations. Additionally, Operations provides support through the Customer Call Center, which acts as a single point of contact for all customer calls that relate to I-PASS, transponder accounts, Pay-by-Plate, and unpaid toll invoice payments.
The headcount for Toll Collection staff continues to decline as the Illinois Tollway made further investments in cashless toll collection and implemented tolling reforms, reduced violation fees and relief, and pay-by-plate services that streamline how customers without transponders can pay for tolls on-line. This trend continues in the Tentative 2022 budget, which reflects a 38% reduction in the number of budgeted toll collector staff compared to 2021, decreasing from 257 to 186. This substantial reduction in the past year is due in large part to the Tollway’s response to the COVID pandemic which accelerated the Tollway’s transition towards cashless toll collection.
Overall, the 2022 Operations budget is increasing by 5.7% compared the forecasted actual expenditures for 2021. These increases are related to additional customer and consumer support services and staffing related to cashless tolling services. Employee costs make up approximately 40.3% of the Operations Department Tentative 2022 budget, or $31.5 million. Although there is a 16% decrease in overall staffing, there is only a 2% decrease in overall budgeted salary and wage related costs. In 2022, there is a budgeted staffing increase for Customer and Consumer support 53 staff (91%) which are generally higher paying positions than Toll Collection positions which were reduced by 35% (111 staff).

Consulting Engineers Report November 22, 2021
74
6.2.2 Business Systems The Business Systems Department expenses represent 6% of the Illinois Tollway’s 2021 budget and is responsible for operation, maintenance and improvement of electronic tolling roadside technologies and software applications. The department focuses on tolling innovation and business intelligence with the goals of improving customer experience, increasing revenue and enhancing operating efficiencies. The department also monitors the contracts and performance of the structure surrounding the Electronic Tolling System known as open road tolling.
In March 2020 the tollway suspended all cash toll payments systemwide in response to the COVID-19 pandemic, and subsequently introduced several tolling reforms including temporary violation relief for missed tolls, reduced violation fees for outstanding and future missed tolls, and the Tollway’s new industry leading Pay-By-Plate services that rolled out in June of 2020, further streamlining the online payment process.
In June 2020, the Illinois Tollway enacted a new invoicing process for unpaid tolls where customers are still granted a 14-day period for to pay any unpaid tolls on-line at no additional cost, however after the 14-day period, and per tolling reforms, rather than receiving a $20 violation fine for each unpaid toll, owners across all vehicle classes will receive an invoice for the unpaid tolls with an initial fee nearer the toll rates for each class of vehicles. Initial notice fees begin at $3.00 for standard passenger vehicles, to be followed by an additional $5.00 fee if nonpayment continues, eventually followed by the aforementioned $20.00 fine if nonpayment continues.
Business Systems expenses are primarily variable with respect to the number of transactions and amount of revenue collected from customers. With the move to all cashless tolling, there should be the expectation that I-PASS usage will continue to increase, especially with non-transponder toll rates (on-line toll payment, pay-by-plate, invoicing) continuing to be double that of the I-PASS rate. Increased I-PASS transactions; traffic and revenue enhancement due to natural growth; increased capacity due to roadway widening; and substantial increase in vehicles due to new growth in system lane miles will all contribute to driving up costs within the Business Systems Department. Business Systems’ expenditures are anticipated to experience an average annual increase of 4.9% as projected over the duration of the Move Illinois Program.
6.2.3 Engineering The Engineering Department represents 17% of the Tollway’s Tentative 2022 Budget and is responsible for the planning, design, construction, operation and maintenance of the Illinois Tollway system. Additionally, Engineering works closely with the Planning Department in coordinating with community groups, government agencies and planning organizations on transportation and land-use policy. This department oversees annual inspections of the pavement, bridges and drainage systems, as well as the overall day-to-day maintenance of the Illinois Tollway’s roadway system.
The Engineering Department oversees three areas of operation:

Consulting Engineers Report November 22, 2021
75
• Design – Project plans and specifications are prepared for various construction and maintenance activities according to the capital improvement program schedule.
• Construction – Implements the construction phase of projects, monitoring construction quality, schedule and budget.
• Maintenance / Traffic – Maintains the roadway system by keeping roads clean, properly lit and serviceable in all weather conditions; managing incidents; and informing motorists of traffic and travel concerns.
The improvements made as part of the Move Illinois Program affect the Engineering Department in two significant ways:
• There is an increased need for additional engineers within design and construction units required to administer the design and construction phases of the projects. The majority of this work has and will be performed by Consulting Engineers under contract with the Illinois Tollway, including the PMO and other firms serving as Design Section Engineers (DSE) and Construction Managers (CM). These costs are included within the Move Illinois Program budgets.
• Maintenance and Traffic units staffing needs are anticipated to increase as the system length and number of lane miles grow. Staff needs in most of the Engineering groups are also anticipated to increase due to additional traffic and the system growth.
Table 18: Growth in Illinois Tollway System
Year Centerline Miles
Total Lane-Miles
2012 284.1 2048.9
2013 284.1 2052.6
2014 284.1 2132.4
2015 284.1 2138.2
2016 290.6 2258.7
2017 294.0 2277.0
2018 294.0 2277.5
2019 294.0 2290.7
2020 294.0 2292.5
2021 294.0 2293.1
2022 297.5 2304.8
2023 300.1 2313.6
2024 300.1 2353.1
2025 301.3 2401.1
2026 301.3 2424.3
2027 301.3 2424.3

Consulting Engineers Report November 22, 2021
76
For the 2022 Budget, the Engineering Department has budgeted for a headcount of 482 employees, with 438 (91%) of the employees within the Roadway Maintenance / Traffic unit. The Maintenance / Traffic unit is subdivided into the following groups (staffing levels projected in the 2022 Budget):
• Roadway Maintenance has budgeted for 355 staffed positions working from the 12 maintenance facilities. They are responsible for activities such as roadway sweeping; litter collection; snow and ice control; minor pavement, guardrail, fence and bridge work; drainage system upkeep; roadside landscaping; traffic channelization; and motorist aid.
• Sign Shop has budgeted for 17 staffed positions.
• Roadway Electric has budgeted for 13 staffed positions.
• Traffic Operations has budgeted for 18 staffed positions in the traffic operations center.
• Dispatch has budgeted for 35 staffed positions and is responsible for dispatching services in response to calls for motorist aid.
Maintenance / Traffic uses a database called the Maintenance Management System (MMS) to track costs associated with the Roadway Maintenance group and the Roadway Signage and Lighting activities of the Traffic Operations group. The Illinois Tollway provides the Consulting Engineers with year-end reports derived from the Maintenance Management System. On a percentage basis, the leading major activities in 2020 were snow and ice control (35%), roadside litter control (19%) and Motorist Aid (Aid Patrols & H.E.L.P. (13%).
Staffing levels at maintenance facilities have been closely tied to the snow and ice control program because of the high level of service goals established by the Illinois Tollway. Although snow and ice control are a seasonal activity, staff are hired on a permanent basis rather than as temporary or seasonal help. Snow and ice control staff members are prohibited from using vacation time during winter. Historically, the staffing level needed for snow and ice control has been relatively equal to the needs for maintenance work throughout the year. In addition, other staff, including a portion of the building maintenance employees in the Operations Department, are trained to be available for snow and ice control functions.
6.2.4 Finance The Finance Department covers a variety of internal and external roles within the Illinois Tollway and represents the largest budget at 22% of the overall budget. The majority of the cost items that are included within the department are fairly consistent. Risk Management is a small division within Finance that funds the costs for Worker’s Compensation Insurance, Employee Group Insurance, and Property Insurance for the Illinois Tollway. These three insurance items totaled $48.7 million in year 2021 and $49.8 million in the Tentative 2022 Budget, which represents 55.3% of Finance Department expenses and 12.1% of total Illinois Tollway operating expenses. Insurance costs may vary in the future due to changes in premiums and staffing levels, self-insurance requirements and other factors. The Finance Department also includes bank charges for account replenishment, which totaled $32.9 million in the 2022 Budget, representing a 36.5% share of Finance Department expenses.

Consulting Engineers Report November 22, 2021
77
6.3 Estimated Illinois Tollway Operating Expenses From current expenditure and budget information provided by the Illinois Tollway, overall, salary and wage costs are projected to escalate to account for annual wage adjustments required by collective bargaining. The staffing level for the Engineering Department is projected to remain fairly static through the duration for the Move Illinois Program. Overall, Operational services staffing levels are projected to remain flat. Business Systems costs are expected to increase at a higher rate than most other departments (4.7%) over the study period due to transponder usage, increased toll rates (including the annual CPI-based toll rate increases for commercial vehicles) and increases in traffic. The Business Systems costs include both the transaction processing and the bank charges for account replenishment, video tolling charges and violation payments. The inflation rate utilized for non-labor expenditures is 3.0%.
Finance Department cost increases, as a percentage, are also expected to outpace most other departments (4.7%) due to the high cost of Retirement and pension contributions, as a percentage of salary and wages, and anticipated future contribution rate increases. For State fiscal years 2013 – 2022, the employer contribution rates published by the State Employees’ Retirement System (SERS) are as follows. A preliminary rate for State fiscal year 2023 is also included.
Table 19: State Employees’ Retirement System – Employer Contribution Rate
State Fiscal Year
Beginning Date
Ending Date
Total Employer
Contribution Rate
2013 7/1/2012 6/30/2013 37.987%
2014 7/1/2013 6/30/2014 40.312%
2015 7/1/2014 6/30/2015 42.339%
2016 7/1/2015 6/30/2016 45.598%
2017 7/1/2016 6/30/2017 44.568%
2018 7/1/2017 6/30/2018 47.342%
2019 7/1/2018 6/30/2019 51.614%
2020 7/1/2019 6/30/2020 54.290%
2021 7/1/2020 6/30/2021 54.831%
2022 7/1/2021 6/30/2022 56.169%
2023* 7/1/2022 6/30/2023 53.258%*
* The preliminary employer contribution rate for State FY 2023 was set at the October 26, 2021 meeting of the SERS Board of Trustees.

Consulting Engineers Report November 22, 2021
78
Factoring in the 7.65% FICA contribution, an overall employer contribution rate of 63.82% has been used as the basis for projecting future retirement contribution costs beyond 2022. The 2023 preliminary rate is not expected to be finalized until January 2022.
The Trust Indenture requires projections for five years beyond the projected “in-service” date of the project. Based on the information above, the Consulting Engineers have projected Operating Expenses, as defined in the Trust Indenture, for each of the fiscal years 2020 through 2032 as provided in the table below.
Table 20: Estimated Operating Expenses
Year Operating Expenses (Millions)
Annual Increase
2020 $360.2* 2021 $379.5** 5.4% 2022 $410.9 8.3% 2023 $426.2 3.7% 2024 $442.0 3.7% 2025 $458.1 3.6% 2026 $475.2 3.7% 2027 $491.7 3.5% 2028 $508.2 3.4% 2029 $525.5 3.4% 2030 $543.2 3.4% 2031 $562.4 3.5% 2032 $582.5 3.6%
*Audited, actual expenses **2021 forecast is $377.4, estimate allows for unforeseen weather
expenses
The estimates for Operating Expenses prepared by the Consulting Engineers and included in this report have an average growth per year of approximately 4.2% between 2021 and 2032. There are many factors that will dictate what the actual Operating Expenses experienced by the Illinois Tollway will be, and the Consulting Engineers cannot predict the outcome of these factors. The Consulting Engineers have reviewed the data and forecasts provided by the Illinois Tollway with respect to proposed system expansion and operational changes and find them to be reasonable. Thus, these forecasts and assumptions have been included in the Consulting Engineers analysis. However, the Consulting Engineers cannot predict unforeseen circumstances or unusual price escalations that are not currently identified and known, so the estimates above may vary from actual future expenses.

Consulting Engineers Report November 22, 2021
79
7 Conclusion This report complies with Section 204.1.(4) of the Amended and Restated Trust Indenture Effective March 31, 1999. It provides the estimates for Operating Expenses and Renewal & Replacement Deposits for five years beyond the projected in-service date (through 2032). It also provides the estimated cost of construction and the schedule of completion for the projects (as developed by the Illinois Tollway’s PMO and reviewed for reasonableness by the Consulting Engineer) included in the Illinois Tollway’s Move Illinois Program that is being partly funded from bond proceeds. Current professional practices and procedures commensurate with the scope and schedule of the Consulting Engineers work were used in the development of this report. In that regard, in preparing this report, the Consulting Engineers are compelled to rely on information from, and the work of, others. Although that information and work product is examined for reasonableness, no extensive or exhaustive effort is undertaken by the Consulting Engineers to confirm the accuracy of such information and work product.
The Illinois Tollway has had remarkable success in delivering the Congestion Relief Program in a timely fashion and under budget. This success is continuing as the Illinois Tollway proceeds with major construction of Move Illinois Program projects in 2021, the tenth year of the Move Illinois Program. The cost estimates utilized for the compilation of costs for the program follow standard industry practices and contain appropriate contingency factors based upon level of completeness of the design. All project costs are escalated appropriately to the estimated mid-point of construction. Currently, the overall estimated cost of the Move Illinois Program at $14.092 billion appears reasonable.
This report is intended for the use of the Illinois Tollway for inclusion in the Preliminary Official Statement and Official Statement for the Illinois Tollway’s issuances of Toll Highway Senior Revenue Bonds, 2021 Series A, the sales and issuances of which are expected in the fourth quarter 2021. This report is subject to the limitations described within each Official Statement, such as those with respect to forward-looking statements, which are incorporated within this report. The Consulting Engineers are not, and have not been, a municipal advisor as defined in Federal law (such as the Dodd-Frank Wall Street Reform and Consumer Protection Act) to the Illinois Tollway and does not owe a fiduciary duty pursuant to Section 15B of the Securities Exchange Act of 1934 to the Illinois Tollway with respect to the information and material contained in this report. The Consulting Engineers are not recommending and has not recommended any action to the Illinois Tollway.
Market conditions and unforeseen events, such as the COVID-19 pandemic, are beyond the control of the Consulting Engineers, the PMO or the Illinois Tollway may affect the implementation and cost of the Move Illinois Program and the future Operating Expenses of the Illinois Tollway as detailed herein. The Consulting Engineers presume that the PMO will continually monitor the Move Illinois Program and will adjust the scopes and schedules of projects in order to control the cost of the overall program. On an annual basis, the Consulting Engineers’ recommendation for the Renewal and Replacement deposit will reflect consideration of adjustments to the Move Illinois Program by the PMO.
Finally, no one should use or rely on this report for any purpose without giving due consideration to the impact that the above-described circumstances and factors might have on the estimates and findings contained herein.

[THIS PAGE INTENTIONALLY LEFT BLANK]

APPENDIX C
TRAFFIC ENGINEERS’ REPORT

[THIS PAGE INTENTIONALLY LEFT BLANK]

Comprehensive Traffic and Toll Revenue Study
I L L I N O I S T O L L W A Y
Prepared for:ILLINOIS STATE TOLL HIGHWAY AUTHORITY
By:CDM SmithNovember 22, 2021
November 22, 2021


i
Table of Contents
Chapter 1 Background ..................................................................................................... 1-1 1.1 Introduction ................................................................................................................................................................ 1-1 1.2 Report Overview ....................................................................................................................................................... 1-1 1.3 Illinois Tollway Service Area ............................................................................................................................... 1-2 1.4 Illinois Tollway Routes ........................................................................................................................................... 1-4
1.4.1 Jane Addams Memorial Tollway (I-90).............................................................................................. 1-4 1.4.2 Tri-State Tollway (I-94/I-294/I-80) ................................................................................................... 1-7 1.4.3 Reagan Memorial Tollway (I-88) ......................................................................................................... 1-8 1.4.4 Veterans Memorial Tollway (I-355) ................................................................................................... 1-9 1.4.5 Illinois Route 390 Tollway and I-490 Tollway ............................................................................. 1-10
1.5 Illinois Tollway Capital Programs ................................................................................................................... 1-11 1.5.1 Congestion-Relief Program: Open Roads for a Faster Future (2004) ................................ 1-11 1.5.2 Move Illinois Program (2011) ............................................................................................................. 1-12
1.6 Toll Collection and Toll Rates ............................................................................................................................ 1-13 1.6.1 Toll Rate Changes ...................................................................................................................................... 1-13 1.6.2 I-PASS Usage ............................................................................................................................................... 1-17
Chapter 2 Historical Performance & Recent Trends .......................................................... 2-1 2.1 Historical Toll Traffic and Revenue Trends................................................................................................... 2-1 2.2 Recent Performance Trends ................................................................................................................................ 2-4
2.2.1 Trends by Facility ....................................................................................................................................... 2-5 2.2.2 COVID-19 Impacts .................................................................................................................................... 2-13
2.3 Traffic Profile ............................................................................................................................................................ 2-14 2.3.1 Monthly Variations ................................................................................................................................... 2-14
2.3.1.1 Urban and Rural Monthly Variations .................................................................................. 2-16 2.3.2 Daily Variations.......................................................................................................................................... 2-17 2.3.3 Hourly Variations ...................................................................................................................................... 2-18
Chapter 3 Population & Economic Growth ....................................................................... 3-1 3.1 Introduction ................................................................................................................................................................ 3-1 3.2 Regional Development Trends ............................................................................................................................ 3-1
3.2.1 Historical Population and Employment Growth Trends ............................................................ 3-2 3.2.2 Historical Real Personal Income Growth Trends .......................................................................... 3-3 3.2.3 Subregional Development Trends ....................................................................................................... 3-5
3.2.3.1 Core Counties .................................................................................................................................. 3-6 3.2.3.2 Collar Counties ............................................................................................................................... 3-7 3.2.3.3 Rockford-Area Counties ............................................................................................................. 3-8 3.2.3.4 Rural Counties ................................................................................................................................ 3-8
3.2.4 List of Major Regional Employers ........................................................................................................ 3-9 3.3 Socioeconomic Forecasts .................................................................................................................................... 3-12
3.3.1 Forecasting Method ................................................................................................................................. 3-12 3.3.2 Recommended Forecasts ....................................................................................................................... 3-13 3.3.3 Comparison of Recommended Forecasts to Other Sources .................................................... 3-16

Table of Contents
ii
Chapter 4 Transactions & Revenue Approach ................................................................... 4-1 4.1 Overview of Travel Demand Model ................................................................................................................... 4-1 4.2 Model Inputs ............................................................................................................................................................... 4-1
4.2.1 Trip Tables ..................................................................................................................................................... 4-1 4.2.2 Traffic Analysis Zones ............................................................................................................................... 4-2 4.2.3 Highway Network ....................................................................................................................................... 4-2 4.2.4 Time Periods ................................................................................................................................................. 4-3 4.2.5 Value of Time................................................................................................................................................. 4-4
4.2.5.1 Passenger Car Value of Time .................................................................................................... 4-4 4.2.6 Vehicle Operating Costs ............................................................................................................................ 4-6
4.3 Toll Diversion Algorithm ....................................................................................................................................... 4-7 4.4 Base-Year Trip Table Calibration ....................................................................................................................... 4-7
4.4.1 Screenline Volume Calibration Results .............................................................................................. 4-7 4.4.2 Mainline Plaza Calibration .................................................................................................................... 4-10
Chapter 5 Transactions & Revenue Forecast..................................................................... 5-1 5.1 Basic Assumptions .................................................................................................................................................... 5-1 5.2 Planned Transportation Improvements ......................................................................................................... 5-2
5.2.1 Illinois Tollway Projects ........................................................................................................................... 5-2 5.2.2 Other Agency Projects ............................................................................................................................... 5-4
5.3 Toll Rate Schedule .................................................................................................................................................... 5-4 5.3.1 Passenger Car Toll Rates .......................................................................................................................... 5-4 5.3.2 Commercial Vehicle Toll Rates .............................................................................................................. 5-5
5.4 Future I-PASS Participation Rates ..................................................................................................................... 5-5 5.5 Revenue Estimation Approach ............................................................................................................................ 5-6 5.6 Annual Transaction and Toll Revenue Forecasts ........................................................................................ 5-6 5.7 Disclaimer ................................................................................................................................................................. 5-15
Chapter 6 Sensitivity Tests ............................................................................................... 6-1 6.1 Higher Value of Time ............................................................................................................................................... 6-1 6.2 Vehicle Operating Costs.......................................................................................................................................... 6-3 6.3 Commercial Vehicle Toll Rates ............................................................................................................................ 6-4 6.4 Socioeconomic Growth ........................................................................................................................................... 6-5 6.5 Telecommuting .......................................................................................................................................................... 6-6

Table of Contents
iii
List of Figures Figure 1-1. Illinois Tollway Service Area ..................................................................................................................... 1-3 Figure 1-2. Tollway routes and their recent average daily traffic (ADT) volumes .................................... 1-5 Figure 1-3. Jane Addams Memorial Tollway Location Map ................................................................................. 1-6 Figure 1-4. Tri-State Tollway Location Map ............................................................................................................... 1-7 Figure 1-5. Reagan Memorial Tollway Location Map ............................................................................................. 1-9 Figure 1-6. Veterans Memorial Tollway Location Map ....................................................................................... 1-10 Figure 1-7. Illinois Route 390 Tollway and I-490 Tollway Location Map ................................................... 1-11 Figure 2-1. Illinois Tollway Systemwide Annual Transactions & Toll Revenue (in thousands).......... 2-1 Figure 2-2. Passenger Car and Commercial Vehicle Transaction Performance (2019–2021) ........... 2-13 Figure 2-3. Average Daily Transactions by Month (2019) ................................................................................. 2-15 Figure 2-4. Passenger Car and Commercial Vehicle Transactions by Month (2019) ............................. 2-16 Figure 2-5. Monthly Transactions for Urban and Rural Plazas (2019) ........................................................ 2-17 Figure 2-6. Daily Traffic Trends (2019) ..................................................................................................................... 2-18 Figure 2-7. Hourly Traffic Trends (2019) ................................................................................................................. 2-19 Figure 2-8. Passenger Car and Commercial Vehicle Hourly Trends (2019) ............................................... 2-20 Figure 3-1. Illinois Tollway Service Area ..................................................................................................................... 3-5 Figure 3-2. Fortune 500 Companies Headquartered in the Chicago Metropolitan Area (2019),
Gross Earnings ($ Millions) ................................................................................................................ 3-11 Figure 3-3. Population Annual Growth Rate, 2020–2050 .................................................................................. 3-15 Figure 3-4. Employment Annual Growth Rate, 2020–2050 .............................................................................. 3-16 Figure 3-5. Population Forecast Comparison .......................................................................................................... 3-17 Figure 3-6. Employment Forecast Comparison ...................................................................................................... 3-18 Figure 4-1. Former and Current Traffic Analysis Zone Networks in the Modeling Region ................... 4-2 Figure 4-2. Highway Network in Model ....................................................................................................................... 4-3 Figure 4-3. Chicago Metropolitan Agency for Planning Modeling Time Periods........................................ 4-4 Figure 4-4. Location of Screenlines ................................................................................................................................ 4-8 Figure 4-5. Screenline Calibration Results Actual vs. Modeled Traffic Volumes ...................................... 4-10 Figure 5-1. Chart of Systemwide Transactions and Revenue, 2021–2050 ................................................. 5-15 Figure 6-1. Results of Higher Value of Time Sensitivity Test .............................................................................. 6-2 Figure 6-2. Results of Lower Value of Time Sensitivity Test ............................................................................... 6-2 Figure 6-3. Results of Higher Vehicle Operating Costs Sensitivity Test ......................................................... 6-4 Figure 6-4. Results of Commercial Vehicle Toll Rate Increase Sensitivity Test .......................................... 6-5 Figure 6-5. Results of No Trip Growth Sensitivity Test ......................................................................................... 6-6 Figure 6-6. Results of Increased Telecommuting Sensitivity Test .................................................................... 6-7

Table of Contents
iv
List of Tables Table 1-1. Current and Historical Toll Rates on Illinois Tollway Typical Mainline Plazas .................. 1-14 Table 1-2. Toll Rates for U.S. Facilities ....................................................................................................................... 1-15 Table 1-3. I-PASS Annual Usage Rates ....................................................................................................................... 1-17 Table 1-4. 2019 Electronic Tolling Collection Usage Rates for U.S. Toll Agencies .................................. 1-18 Table 2-1. Illinois Tollway Systemwide Annual Transactions (in thousands) ............................................ 2-2 Table 2-2. Illinois Tollway Systemwide Annual Revenue (in thousands) ..................................................... 2-3 Table 2-3. Illinois Tollway Revenue by Route, 2016–2020 (in thousands) .................................................. 2-5 Table 2-4. Illinois Tollway Transactions by Route, 2016–2020 (in thousands) ......................................... 2-5 Table 2-5. Jane Addams Memorial Monthly Transactions (thousands) ......................................................... 2-6 Table 2-6. Tri-State Monthly Transactions (thousands) ....................................................................................... 2-7 Table 2-7. Reagan Memorial Monthly Transactions (thousands) ..................................................................... 2-8 Table 2-8. Veterans Memorial Monthly Transactions (thousands) .................................................................. 2-9 Table 2-9. IL 390 Monthly Transactions (thousands) ......................................................................................... 2-10 Table 2-10. Systemwide Monthly Transactions (thousands) .......................................................................... 2-11 Table 3-1. Historical Population Growth, 1980–2019 ........................................................................................... 3-2 Table 3-2. Historical Employment Growth, 1980–2019 ....................................................................................... 3-3 Table 3-3. Employment-to-Population Ratios, 2019 .............................................................................................. 3-4 Table 3-4. Real Per Capita Personal Income Growth, 1980–2019 (in 2012 Dollars) ............................... 3-4 Table 3-5. Fortune 500 Companies in the Chicago Metropolitan Area (2019) ........................................... 3-9 Table 3-6. Recommended Population Forecast ..................................................................................................... 3-13 Table 3-7. Recommended Employment Forecast ................................................................................................. 3-14 Table 4-1. Passenger Car Value of Time by Time Period (2017 Dollars/Minute) ...................................... 4-4 Table 4-2. Commercial Vehicle Value of Time Criteria (2012 Dollars/Minute) .......................................... 4-5 Table 4-3. Commercial Vehicle Median Value of Time by Vehicle Type (2017 Dollars/Minute) ........ 4-5 Table 4-4. Vehicle Operation Costs by Vehicle Type and Year (Nominal Dollars per Mile) ................... 4-6 Table 4-5. Screenline Traffic Volume Comparisons ................................................................................................ 4-9 Table 4-6. Toll Plaza Calibration, Actual vs. Modeled Volumes ....................................................................... 4-11 Table 5-1. Planned Transportation Improvements—Illinois Tollway ............................................................ 5-3 Table 5-2. Planned Transportation Improvements—Other Agencies ............................................................ 5-4 Table 5-3. Passenger Car I-PASS Rate Assumption ................................................................................................. 5-5 Table 5-4. 2021–2050 Systemwide Total Transactions and Revenue (in Thousands, Revenue
Shown in Nominal Dollars) ................................................................................................................... 5-8 Table 5-5. 2021–2050 Jane Addams Memorial Tollway (I-90) Transactions and Revenue (in
Thousands, Revenue Shown in Nominal Dollars) ....................................................................... 5-9 Table 5-6. 2021–2050 Tri-State Tollway (I-94/294/80) Transactions and Revenue (in
Thousands, Revenue Shown in Nominal Dollars) .................................................................... 5-10 Table 5-7. 2021–2050 Reagan Memorial Tollway (I-88) Transactions and Revenue (in
Thousands, Revenue Shown in Nominal Dollars) .................................................................... 5-11 Table 5-8. 2021–2050 Veterans Memorial Tollway (I-355) Transactions and Revenue (in
Thousands, Revenue Shown in Nominal Dollars) .................................................................... 5-12 Table 5-9. 2021–2050 Illinois Route 390 Tollway (IL 390) Transactions and Revenue (in
Thousands, Revenue Shown in Nominal Dollars) .................................................................... 5-13 Table 5-10. 2021–2050 I-490 Tollway (I-490) Transactions and Revenue (in Thousands,
Revenue Shown in Nominal Dollars) ............................................................................................. 5-14

Table of Contents
v
Appendices Appendix A Toll Rates by Vehicle Classification as of January 1, 2021 Appendix B Socioeconomic Trends & Forecast

Table of Contents
vi
This page intentionally left blank.

1-1
Chapter 1 Background
1.1 Introduction The Illinois Tollway operates a system of toll facilities in northern Illinois, primarily within the Chicago metropolitan area and the surrounding counties. The system currently includes 294 centerline miles of limited-access highways across five routes. Four of the five routes are part of the national Interstate Highway System, while the fifth, Illinois Route 390 (IL 390), is an Illinois state route built to interstate standards.
The Illinois Tollway was created by the Illinois General Assembly in 1953 to provide for the construction, operation, regulation, and maintenance of a system of toll highways within the state of Illinois. Opened in September 1958, the first Illinois Tollway routes were financed through the sale of revenue bonds. Bond debt payments, as well as ongoing maintenance and operating costs, are funded through the collection of tolls paid by roadway users. The system has expanded dramatically over the years to keep pace with increasing traffic demand and regional development and growth. The Illinois Tollway system is self-supporting and does not receive federal or state funding.
1.2 Report Overview The report presents the findings of the Comprehensive Traffic and Toll Revenue Study, and it is intended to support the issuance of new toll revenue bonds. This report provides potential investors and the financial community with a comprehensive overview of the Illinois Tollway system’s position within the regional transportation network. It also provides operating characteristics, past revenue trends, and the methodologies used to develop future traffic and toll revenue forecasts. The forecast contained herein includes annual transactions and toll revenues at the systemwide and facility levels through 2050.
Chapter 2 focuses on past and current operating characteristics of the Illinois Tollway, including growth in traffic volume over time, toll revenue trends, and participation in the Tollway’s electronic toll collection (ETC) system, known as I-PASS. This chapter provides additional information regarding typical travel speeds, both on and off the Tollway system. Chapter 2 offers a profile of Tollway patrons and their various trip characteristics.
Chapter 3 provides an analysis of demographic and economic conditions within the Illinois Tollway service area. This chapter explores historical development patterns and highlights current socioeconomic characteristics of the service area.
Chapter 4 documents the methodology used to develop traffic and revenue forecasts, as well as the processes used for travel demand forecasting, model development, and model calibration. The chapter also identifies and provides the rationale behind the use of key variables used in the travel demand model.

Chapter 1 Background
1-2
Chapter 5 summarizes traffic and toll revenue forecasts for 2021 through 2050 for the existing Illinois Tollway system. It outlines basic assumptions, toll rate assumptions, and key inputs to the forecasting process, including specific projects that make up the Move Illinois capital program. Chapter 5 identifies specific one-time events, such as a facility expansion or improvement, planned construction efforts, and other events that may materially impact traffic and toll revenue.
Chapter 6 documents the sensitivity tests performed by CDM Smith, which entail the alteration of key assumptions, such as regional socioeconomic growth, the assumed value of time, and the cost of motor fuel. Results of the sensitivity tests provide insight into the degree to which each of the tested variables has an impact on the system.
The COVID-19 pandemic, and the widespread social distancing measures adopted by state and local governments, along with private-sector organizations, greatly impacted travel behavior beginning in March 2020. These impacts continue, although at a reduced level, through the time of publication of this report. Section 2.2.2 of the report describes the impacts of the COVID-19 pandemic on the Illinois Tollway system in detail. As a result of the unprecedented impact of the pandemic on travel behavior, some of the data points in the description of recent performance of the Illinois Tollway system rely on 2019 data, rather than 2020 data, to better illustrate typical conditions.
The remainder of this chapter presents an overview of the geographic region in which the Tollway system is situated, as well as a general description of the individual facilities that constitute the Tollway system. It concludes with a discussion of the toll collection methods used on the Illinois Tollway, as well as the past and current toll rate structure.
1.3 Illinois Tollway Service Area Illinois Tollway facilities pass through 11 counties in northern Illinois, as illustrated in Figure 1-1. For the purpose of this report, the majority of the system’s trips are generated from the local service area that comprises Cook, Boone, DeKalb, DuPage, Kane, Lake, Lee, McHenry, Ogle, Will, and Winnebago Counties.
The geographical location of the Chicago metropolitan region, in relation to the rest of the country, significantly influenced population settlement and commercial development patterns in the area. Lake Michigan provides a barrier to ground transportation between the northeastern and western United States, requiring any ground transportation route to pass south of Lake Michigan through the Chicago metropolitan region. This location significantly contributed to Chicago’s status as a major railroad hub and the dominant urban area in the Midwestern United States. These same traits cemented Chicago’s status as a strategic hub for regional and interstate highway travel as motor vehicles became the dominant mode of commercial transport.

Chapter 1 Background
1-3
Figure 1-1. Illinois Tollway Service Area
The Illinois Tollway originally was constructed to provide efficient interstate travel between Wisconsin, Illinois, and Indiana, and to complement the expressway network built to serve the Chicago area. The Tri-State Tollway (Interstate 94 [I-94]/I-294/I-80), the Jane Addams Memorial Tollway (I-90), and the portion of the Reagan Memorial Tollway (I-88) east of Aurora opened for traffic in 1958. The western portion of I-88 opened in 1974. The original portion of the Veterans Memorial Tollway (I-355) from I-55 to Army Trail Road opened in late 1989. The I-355 south extension between I-55 to I-80 opened in late 2007. The Illinois Route 390 Tollway (IL 390 Tollway) opened in phases between 2016 and 2017, and it will connect to the future I-490 Tollway at its eastern terminus. I-490 is anticipated to open to traffic in 2026 and link I-90 to the north and I-294 to the south.
At the opening of the three original facilities in 1958, the Chicago metropolitan area had a population of more than 6.5 million. Much of the region’s employment at that time was concentrated within the city of Chicago, and the downtown area was one of the largest employment centers in the country. Following national trends, Chicago’s suburbs developed rapidly between the 1950s and 1970s. This rapid residential development of suburban northeastern Illinois resulted in much of the Illinois Tollway becoming prime commuter routes to employment centers in Chicago and surrounding Cook County. As employment increased in the suburban areas—particularly in Lake, DuPage, and northwest Cook Counties—travel patterns evolved on the Tollway system. Suburban-to-suburban commutes became more common, further contributing to traffic growth. In response to this trend, interchanges were added throughout the urbanized area, and in 1989, I-355 was constructed to serve the growing suburban-to-suburban commuter market. Today, the five Illinois Tollway facilities serve more than 8.8 million residents within the 11 counties directly touched by the system.

Chapter 1 Background
1-4
While passenger car traffic constitutes the majority of transactions, the Illinois Tollway continues to serve a vital role in interstate commerce. In 2019, a record 122.4 million commercial vehicle (CV) transactions occurred on the Illinois Tollway. CVs accounted for 12.0 percent of systemwide transactions and 47.4 percent of the Tollway’s revenues in 2019, up from 34.9 percent of revenues in 2014.
The Tri-State Tollway accounts for more than half of all CV transactions and revenues on the Illinois Tollway. Overall, the Tri-State Tollway represents nearly half of the system’s total revenue. This route is vital to regional commerce, allowing for the efficient transfer of materials between Wisconsin, Indiana, and Illinois. The route is adjacent to Chicago O’Hare International Airport, several intermodal rail facilities, and numerous manufacturing and warehousing facilities. The Tri-State Tollway also provides connections to the following interstate routes: I-55, I-57, I-80, I-90, and I-94. The southernmost five miles of I-294 are co-signed with I-80, a national truck route. The 163rd Street Toll Plaza, just north of the junction with I-80, has the highest number of 5-axle truck transactions on the entire Tollway system. Large, 5-axle trucks also account for a significant portion of total transactions at this plaza—18.0 percent—compared with 8.3 percent of transactions systemwide.
The Jane Addams Memorial Tollway is part of the overall I-90 route, which extends 3,100 miles from Boston to Seattle, serving a vital link in long-haul national commerce. The IL 390 Tollway serves industrial land uses on both its eastern and western segments, and the eastern segment provides direct access to one of the region’s largest industrial clusters located to the west of Chicago O’Hare International Airport. The remaining two routes, I-88 and I-355, provide similarly important roles to regional and interstate commerce.
1.4 Illinois Tollway Routes The Illinois Tollway system comprises five routes: Jane Addams Memorial (I-90), Tri-State (I-94/I-294/I-80), Reagan Memorial (I-88), Veterans Memorial (I-355), and IL 390 Tollways. A sixth route, the I-490 Tollway, is currently under construction (Figure 1-2).
The following section presents a general description of the physical attributes and location of each of the five Illinois Tollway routes. It also provides an overview of the demographic and socioeconomic makeup of the areas they serve.
1.4.1 Jane Addams Memorial Tollway (I-90) The Jane Addams Memorial Tollway, designated I-90 for its entire length, runs in a generally east-west alignment from just east of the Chicago O’Hare International Airport, through Rockford, Illinois, to the Wisconsin border. As illustrated in Figure 1-3, I-90 passes through portions of Cook, Kane, McHenry, Boone, and Winnebago Counties.

Chapter 1 Background
1-5
Figure 1-2. Tollway routes and their recent average daily traffic (ADT) volumes
At its northernmost extent, the Illinois Tollway jurisdiction on I-90 ends at Rockton Road, 1.2 miles south of the Illinois–Wisconsin state border. The Tollway’s jurisdiction ends just east of Chicago O’Hare International Airport, from which I-90 continues as the Kennedy Expressway, providing a direct route to the northwest side of Chicago and the Chicago central business district. The Jane Addams Memorial Tollway is part of the national I-90 corridor linking the East and West Coasts, and it provides regional access between northwest Indiana and central Wisconsin. Between 2013 and 2016, the entire I-90 corridor was reconstructed and widened, adding more than 120 lane miles to the Tollway system. The route now provides a six-lane cross section from Rockford to Elgin and an eight-lane cross section from Elgin to the Tri-State Tollway (I-294). There are a total of six mainline plazas (South Beloit, Belvidere, Marengo-Hampshire, Elgin, Devon Avenue, and River Road), and 16 ramp plazas, along the Jane Addams Memorial Tollway.
The 16 easternmost miles of I-90, between Barrington Road and the Kennedy Expressway, host the Tollway’s first active traffic management corridor, or SmartRoad. Along this corridor, overhead gantries provide lane-specific information on incidents and lane closures, as well as other critical information such as travel times.

Chapter 1 Background
1-6
Figure 1-3. Jane Addams Memorial Tollway Location Map
The easternmost segment of I-90 is located in northwest Cook County, a densely developed urban area that has experienced sustained population and employment growth since the 1950s. Elgin, located in Cook and Kane Counties, is home to approximately 113,000 residents. Nearby Arlington Heights (76,000 residents) and Schaumburg (75,000 residents) have large populations, and other suburbs along I-90, including Des Plaines, Hoffman Estates, and Mount Prospect have populations of more than 50,000 residents. Chicago O’Hare International Airport, the sixth busiest airport in the world by total passenger traffic and the busiest airport in the world by number of aircraft movements1, and the nearby communities of Elk Grove Village and Rosemont, are major employment centers. Office and other commercial development are prevalent throughout this corridor. Woodfield Mall and other nearby facilities in Schaumburg serve as major regional retail centers. Northwest Cook County is expected to continue to grow in the future, though at a slower pace because of the diminishing availability of developable land.
The western section of I-90 connects northwest Cook County to the Rockford metropolitan area, passing through low-density suburban and rural areas. While lower in density than Cook County, Kane and McHenry Counties are among the fastest growing in Illinois, as development continues to spread westward out from the Chicago area. Rockford is the largest city in Illinois outside the Chicago metropolitan area, with a population of about 145,000 residents.
___________________________________
1 Data presented are according to the 2019 list of world's busiest airports, issued by the Airports Council International in May 2020.

Chapter 1 Background
1-7
1.4.2 Tri-State Tollway (I-94/I-294/I-80) The Tri-State Tollway is illustrated in Figure 1-4. The southern 53 miles are designated I-294, and the northern 25 miles are designated I-94. The southernmost five miles are concurrent with I-80. Between 2006 and 2009, more than 105 lane miles were added to the Tri-State Tollway as large portions were reconstructed and widened. The route now provides an eight-lane cross section along its entire length. Only the Central Tri-State Tollway (I-294), which was already eight lanes wide from 95th Street to Balmoral Avenue, was not widened during this time frame. Reconstruction and additional widening work began on this central section in 2018 and is planned for substantial completion in 2026. There are a total of eight mainline toll plazas (Waukegan, Edens Spur, Touhy Avenue, Irving Park Road, Cermak Road, 82nd Street, 83rd Street, and 163rd Street), and 17 ramp plazas, along the Tri-State Tollway.
Figure 1-4. Tri-State Tollway Location Map
The primary function of the Tri-State Tollway is to allow vehicles to bypass the urban core of the Chicago region, connecting suburban communities from the Indiana border to the Wisconsin border. The Tri-State Tollway also provides access between the northern and southern suburbs to Chicago O’Hare International Airport. In the southern I-294/I-80 section, where the route runs east-west, the Tri-State Tollway is part of a major cross-country commercial route running from New York to San Francisco.
The northern section passes through Lake County, a mature suburban area. Waukegan, with a population of approximately 88,000, is situated near the northern end of I-94. Lake County has experienced significant growth for the last three decades, specifically central Lake County, west of I-94. Northern Cook and Lake Counties, through which I-94 passes, have experienced steady employment growth and are home to numerous corporate headquarters, including AbbVie,

Chapter 1 Background
1-8
Abbott Laboratories, Allstate Insurance, Baxter Laboratories, CDW, Discover Financial Services, Mondelez International, and Walgreens. Much of this dense, regional employment is located adjacent to I-94, forming a heavily traveled commuter facility.
With direct access via I-190, Chicago O’Hare International Airport and the surrounding commercial and manufacturing development provide significant trip generation for the Central Tri-State Tollway (I-294). Land surrounding the airport is densely populated with mature commercial, industrial, and residential areas. The DuPage County suburbs to the west of I-294 are also a mature mix of office, manufacturing, and residential land uses.
The south section of I-294 passes through an area with a high concentration of manufacturing activity, particularly heavy industry. Manufacturing declines over the last three decades have negatively impacted these southern suburbs and the area immediately to the east in Indiana. Therefore, many south suburban residents use I-294 to travel to jobs in the western and northern suburbs.
1.4.3 Reagan Memorial Tollway (I-88) The Reagan Memorial Tollway, designated as I-88 for its entire length, extends from the Tri-State Tollway (I-294) near the Cook–DuPage County line (15 miles west of downtown Chicago) at the east end, to the eastern edge of Whiteside County in north central Illinois (near Rock Falls) at the west end, as illustrated in Figure 1-5. Under the Congestion-Relief Program (CRP), I-88 was widened to eight lanes from Milepost 123.1 to 137.1, giving the route an eight-lane cross section for the eastern 17 miles, from the eastern terminus to IL 59. By the end of 2012, the section between IL 59 and IL 56 was widened to six lanes by adding a lane in each direction between Orchard Road and IL 56.

Chapter 1 Background
1-9
Figure 1-5. Reagan Memorial Tollway Location Map
At the western end of the Tollway’s jurisdiction at US Route 30, I-88 continues as a non-tolled route for an additional 44 miles, terminating at I-80, east of the Davenport–Moline–Rock Island metropolitan area (also known as the Quad Cities). East of the Tri-State Tollway (I-294), the route continues as I-290—the Eisenhower Expressway—providing access to the Chicago central business district. There are a total of five mainline toll plazas (Dixon, DeKalb, Aurora, Meyers Road, and York Road), and 14 ramp plazas, along the Reagan Memorial Tollway.
From its eastern terminus, I-88 passes through mature communities in DuPage County and eastern Kane County. These suburban communities have seen exceptionally high growth over the past few decades, with developable land rapidly diminishing. Aurora and Naperville have populations of approximately 200,000 and 147,000, respectively, making them two of the most populated communities in Illinois. Numerous corporate headquarters for major employers such as Dover, Navistar, TreeHouse Foods, and Univar are located along I-88, as well as regional retail centers such as Chicago Premium Outlets, Yorktown Center, and Oakbrook Mall. As available land has become scarcer, development has pushed west of the Fox River Valley, deeper into Kane County. While the rapid pace of development slowed considerably following the 2007–08 housing crisis, this area remains abundant with desirable and developable land. Kane County, which marks the transition from predominantly suburban to rural land use, is one of the fastest growing counties in Illinois. Much of the remaining western portion of the I-88 corridor passes through rural communities and agricultural land, which is less densely populated and not anticipated to change significantly over the term of this forecast.
1.4.4 Veterans Memorial Tollway (I-355) The Veterans Memorial Tollway is designated as I-355 for its entire length of 29.8 miles. As shown in Figure 1-6, it extends from its northern terminus at Army Trail Road in DuPage County to its southern terminus at I-80 in Will County. Most of the roadway is six lanes, with a short eight-lane segment between I-88 and 75th Street and another eight-lane segment between IL 38 (Roosevelt Road) and IL 56 (Butterfield Road). There are three mainline toll plazas (Army Trail Road, Boughton Road, and Spring Creek), and 11 ramp plazas, along the Veterans Memorial Tollway.
On November 11, 2007, the Tollway opened the I-355 south extension between I-55 and I-80. This 12.5-mile extension increased capacity and improved regional mobility. The I-355 corridor now directly connects three major interstate highways (I-80, I-55, and I-88). It also connects to I-290 via a short, untolled portion of I-355, providing an alternate interstate route between I-80 and I-90. As a result, I-355 has attracted more truck traffic as longer haul trucks attempt to bypass more congested parts of the region. This access has made I-355 a significant freight corridor, supporting the development of warehouse and logistics facilities, particularly to the south in Will County.
Developed suburban land characterizes the I-355 corridor, particularly within DuPage County. Undeveloped land flanking the original section of the corridor (from Army Trail Road to I-55) is diminishing, although developable land is located along the I-355 south extension in Will County, where rapid growth is expected in coming decades.

Chapter 1 Background
1-10
Figure 1-6. Veterans Memorial Tollway Location Map
1.4.5 Illinois Route 390 Tollway and I-490 Tollway As shown in Figure 1-7, the IL 390 Tollway is located in the suburban area northwest of Chicago and extends from Lake Street (U.S. Route 20) at the west end to Busse Road (IL 83) at the east end. Tolling on the western section—between Lake Street (U.S. Route 20) and Rohlwing Road—began on July 5, 2016. This limited-access expressway originally opened in 1993 as the Elgin-O’Hare Expressway. It was widened and became a part of the Illinois Tollway system in 2016. The eastern extension—between Rohlwing Road and IL 83—was completed and opened to traffic on November 1, 2017. The IL 390 Tollway serves a mix of residential, office, and industrial land uses. The latter includes a major industrial district in Elk Grove Village, one of the region’s largest manufacturing and logistics clusters. Reflecting this land use pattern, CVs represent about 15 percent of the total traffic along the eastern half of the IL 390 Tollway, which is among the highest CV share of any suburban Tollway corridor.
A sixth Tollway route, the I-490 Tollway, is under construction and planned for completion in 2026. This new north-south route will run along the western border of Chicago O’Hare International Airport, extending from the Jane Addams Tollway (I-90) at the north end to the Central Tri-State Tollway (I-294) at the south end. It will connect with the eastern terminus of the IL 390 Tollway. Similar to the eastern half of the IL 390 Tollway, the I-490 corridor is characterized by a strong industrial character.

Chapter 1 Background
1-11
Figure 1-7. Illinois Route 390 Tollway and I-490 Tollway Location Map
Together, the IL 390 and I-490 Tollways provide a combined 17 miles of new roads and 15 new or improved interchanges in the northwest suburbs. The new toll roads will enhance access to Chicago O’Hare International Airport property with new rail crossings and connections. Because of the overall magnitude of the project and the potential to enhance the national and regional economies, it is designated a “Project of National and Regional Significance” by federal transportation legislation.
1.5 Illinois Tollway Capital Programs The Illinois Tollway has undertaken two major capital programs since 2004, which are described subsequently. A detailed description of the current capital program is provided in Chapter 5.
1.5.1 Congestion-Relief Program: Open Roads for a Faster Future (2004) In September 2004, the Illinois Tollway Board of Directors (Board) approved a long-range capital plan, called the Congestion-Relief Program (CRP): Open Roads for a Faster Future. At the same time, the Board approved a new toll rate structure that was put into effect on January 1, 2005, to help finance the capital program. The Illinois Tollway’s toll rate structure had remained essentially the same from 1983 through the end of 2004. The CRP added roadway capacity to reduce existing congestion and accommodate future traffic growth. Some notable widening projects, by route, include the following:
Jane Addams Memorial Tollway (I-90) – Added one lane in each direction between Newburg Road and Rockton Road, from approximately Milepost 3.0 to 17.0. This work was completed in 2009.

Chapter 1 Background
1-12
Tri-State Tollway (I-294/I-80) – Added one lane in each direction from the southern terminus to 95th Street, from Milepost 0.0 to 17.6. Opened in phases through 2009.
Tri-State Tollway (I-94/I-294) – Added one lane in each direction from Balmoral Avenue to IL 173, from Milepost 40.0 to 75.7. Opened in phases through 2009.
Reagan Memorial Tollway (I-88) – Added one lane in each direction from IL 59 to IL 83, from Milepost 123.3 to 137.1. Opened in phases through 2009.
Veterans Memorial Tollway (I-355) – Added one lane in each direction from 75th Street to Ogden Avenue, from Milepost 15.5 to 19.5. This work was completed in 2009.
Each of the widening projects also included some existing roadway reconstruction. Additionally, the CRP reduced delays at toll plazas by converting all 22 mainline toll plazas to open road tolling (ORT) by October 2006. Finally, the CRP funded a new 12.5-mile addition to the system, the I-355 south extension, which opened on November 11, 2007.
1.5.2 Move Illinois Program (2011) Following an 18-month review and public discussion of the Illinois Tollway’s needs for its existing system and opportunities to improve regional mobility, the Illinois Tollway Board of Directors adopted a 15-year, $12 billion capital program in August 2011. The program is called Move Illinois: The Illinois Tollway Driving the Future. In April 2017, the Board approved an amendment of the Move Illinois program to add $2.1 billion in support of an expanded scope for the Central Tri-State Tollway (I-294). The revised scope includes new capacity, improved interchange configuration, and other improvements to the Central Tri-State Tollway. Construction began in July 2018.
Move Illinois is funded through a combination of current toll revenue and bonds backed by future toll revenues. In anticipation of Move Illinois, passenger car (PC) toll rates were increased effective January 1, 2012. In addition, a three-phased CV toll rate increase was implemented between 2015 and 2017. Starting January 1, 2018, CV rates began increasing annually at the rate of inflation. Move Illinois, originally scheduled to be completed by 2026, currently is scheduled to be completed in 2027.
Rebuilding and widening I-90 between Rockford and the Kennedy Expressway was completed in December 2016.
Reconstructing and widening I-294. The Central Tri-State Tollway is being reconstructed from Balmoral Avenue to 95th Street. Construction began in 2018 on the northern section between Balmoral Avenue and the O’Hare Oasis. The full reconstruction project is expected to be completed at the end of 2026.
Constructing the Elgin O’Hare Western Access (EOWA) Project, which includes widening, tolling, and extending the former Elgin-O’Hare Expressway and constructing the new I-490 Tollway. During the first phase of the EOWA Project, the IL 390 Tollway (formerly the Elgin-O’Hare Expressway) began tolling operations in July 2016. The second phase, an eastward extension of the IL 390 Tollway, opened on November 1, 2017. The timing for

Chapter 1 Background
1-13
completion of the remainder of the EOWA Project, construction of I-490, is subject to change; for purposes of this report, the additional phases are assumed to open in 2026, based on discussions with Illinois Tollway staff.
Constructing the I-294/I-57 interchange. The first phase of the I-294/I-57 interchange opened to traffic in October 2014. The next phase is currently under construction and is scheduled to be completed in 2023.
1.6 Toll Collection and Toll Rates The Illinois Tollway collects tolls at 28 mainline plazas and 61 ramp plazas. Payment options currently include electronic toll collection (ETC) via I-PASS or E-ZPass, Pay By Plate, invoice, or online payment within a 14-day grace period. As a precaution to prevent the spread of COVID-19 to Tollway customers and employees, the Illinois Tollway suspended cash collections systemwide on March 13, 2020. While initially a temporary practice, the Tollway subsequently made the suspension of cash payment permanent on February 25, 2021.
The Illinois Tollway system first implemented ETC in 1993 with a small pilot program on part of the Veterans Memorial Tollway (I-355). In 1994, electronic tolling expanded to other plazas, and in 1995, I-PASS-Only lanes were introduced. In 1998, the Illinois Tollway began installing I-PASS Express lanes that enable drivers to pay tolls while traveling at higher speeds through the plazas. ORT, which allows I-PASS payment at highway speeds, was introduced on all mainline plazas between 2005 and 2006. With ORT, vehicles paying by I-PASS never have to leave their travel lane to pay a toll, and there is no reduction in the number of lanes. Drivers with I-PASS simply pass under the toll gantry in their current lane.
1.6.1 Toll Rate Changes Historical toll rates at typical plazas are illustrated in Table 1-1. While actual rates vary by plaza, most of the rates charged at mainline plazas on the three original routes (Tri-State, Jane Addams Memorial, and Reagan Memorial) are similar. There have been four toll rate changes applied to all PC transactions: an average increase of 17 percent in 1963, a decrease of 14 percent in 1970, a 37-percent increase in 1983, and an 87.5-percent increase in 2012. Additionally, there was a PC increase in 2005 that applied to only cash-paying vehicles. The 2005 toll rate schedule simplified the former 10 toll rate classes to four rate tiers—one for PCs and three for CVs.
CVs had three rate increases prior to 2015: 50 percent in 1963; 68 percent in 1983; and an average of 216 percent for non-discounted, daytime rates in 2005. Between 2015 and 2017, a three-phase, 60-percent increase was applied to CV rates. Beginning in 2018, all CV rates are adjusted annually at the rate of inflation.
The Tollway offers a 50-percent discount on tolls to PC customers using I-PASS. While the I-PASS discount does not extend to CV customers, the Tollway offers an overnight toll rate discount for CV travel between 10:00 p.m. and 6:00 a.m.

Chapter 1 • Background
1-14
Table 1-1. Current and Historical Toll Rates on Illinois Tollway Typical Mainline Plazasa
Previous Rates Current Rates
Vehicle Classification 1959–1963 1964–1970 1971–1983 1983–2004 2005-2011d 2012-2014d 2015-2020d,e 2021d,e
1b Automobile, motorcycle, single-unit truck or tractor, two axles, four or fewer tires
$0.30 $0.35 $0.30 $0.40 $0.40 $0.75 $0.75 $0.75
2c Single-unit truck or tractor, buses, two axles, six tires
$0.40 $0.45 $0.30 $0.50 $1.00 $1.00 $1.40–$1.70 $1.75
3c Trucks with three or four axles, buses, and Class 1 vehicles with a one- or two-axle trailer
$0.50 $0.50–$0.60 $0.45–$0.60 $0.60–$1.00 $1.75 $1.75 $2.45–$3.00 $3.00
4c
Trucks with five or six axles, miscellaneous PC special, or unusual vehicles not classified in Tiers 1, 2, or 3
$0.50 $0.75–$0.90 $0.75–$1.00 $1.25–$1.75 $3.00 $3.00 $4.20–$5.10 $5.20
a The toll rates listed in the table are toll rates for 11 of the 28 mainline plazas on the Tollway System. Toll rates at the other 17 mainline plazas differ by various amounts. A complete listing of toll rates at each Tollway system plaza may be found on the Illinois Tollway’s website. No other information from the Tollway website is incorporated by reference.
b Rate for Tier 1 vehicles for the following situations: customers who pay via I-PASS and out-of-state transponders that are tolled at the discounted rate. The non-discounted rate applies to non-I-PASS forms of payment.
c CVs (Rate Tiers 2 through 4) are tolled at a discounted rate during the overnight period from 10:00 p.m. to 6:00 a.m., whether paying by I-PASS or cash (the “overnight discount rate”). Overnight discount rates are shown in the table. Prior to January 1, 2009, CVs paying by I-PASS were tolled at the discounted rate for certain off-peak time periods (the “I-PASS off-peak discount rate”). This I-PASS off-peak discount rate expired on December 31, 2008. The overnight discount rate continues.
d Beginning in 2005, the Tollway has offered a 50 percent toll rate discount to I-PASS transactions. Toll rates shown in the table are the I-PASS rate.
e A CV toll rate increase occurred in three phases between 2015 and 2017 and resulted in a total increase of 60.0 percent over 2014 rates. Annual, inflation-based increases began January 1, 2018.

Chapter 1 Background
1-15
The most recent PC rate increase occurred on January 1, 2012, and raised rates by 87.5 percent. This rate change increased the typical mainline toll from $0.40 to $0.75 for I-PASS customers and from $0.80 to $1.50 for cash customers. The CV rate changes from 2015 to 2017 increased the typical mainline toll from $4.00 in 2014 to $6.40 in 2017 for large CVs (Rate Tier 4) and from $1.50 to $2.40, in respective years, for small CVs (Rate Tier 2). As of January 1, 2018, CV rates began to increase annually based on the rate of inflation, rounded to the nearest $0.05.2 In 2018, 2019, 2020, and 2021, CV rates increased based on inflation increases of 1.84, 2.25, 2.07, and 1.56 percent, respectively. CVs have no toll rate differential between cash and I-PASS payments. CVs do receive, however, a discount for overnight travel (i.e., travel between 10:00 p.m. and 6:00 a.m.) and pay a higher toll rate for the Pay Online option on the new IL 390 Tollway. The overnight discount began in 2005 and ranges from 18.5 to 34.8 percent, depending on rate tier and plaza.
Even with the recent rate increases, the Illinois Tollway is still among the lower-priced toll roads in the country on a per-mile basis. As a comparison, Table 1-2 lists electronic toll collection rates for major toll roads in the United States.
Table 1-2. Toll Rates for U.S. Facilitiesa
$PER MILE
Agency or Facility PC 5-Axle Truck Adams Avenue Parkway, Inc (UT) $1.00 $2.50
Skyway Concession Company (IL) $0.74 $4.36
Pocahontas Parkwayb $0.53 $0.92
City of Chesapeake (VA) $0.52 $0.66
Transportation Corridor Agencies (CA) $0.51 $1.89
Northwest Parkway, LLC (CO) $0.46 $1.85
Dulles Greenwayc $0.41 $1.25
Montgomery County Toll Road Authority (TX) $0.36 $1.42
Metropolitan Washington Airports Authority (VA) $0.35 $0.97
Central Texas Regional Mobility Authority (TX) $0.31 $1.25
E-470 Public Highway Authority (CO) $0.31 $1.16
San Diego Association of Governments (CA) $0.28 $0.55
Orchard Pond Greenway, LLC (FL) $0.26 $1.04
Tampa-Hillsborough County Expressway Authority (FL) $0.24 $0.97
Fort Bend County Toll Road Authority (TX) $0.23 $0.94
Southern Connectord $0.23 $0.76
North East Texas Regional Mobility Authority (TX) $0.21 $0.83
Richmond Metropolitan Transportation Authority (VA) $0.21 $0.29
Texas Department of Transportation (TX) $0.20 $0.74
North Texas Tollway Authority (TX) $0.19 $0.77
SH 130 Concession Company, LLC (TX) $0.19 $0.77
Harris County Toll Road Authority (TX) $0.19 $0.87
___________________________________
2 Consumer Price Index for all Urban Consumers (CPI-U), or its successor index, over the 12-month period ending on June 30th of the previous year. Source: Illinois Tollway Board Resolution No. 18516, dated November 20, 2008.

Chapter 1 Background
1-16
$PER MILE
Agency or Facility PC 5-Axle Truck Delaware Department of Transportation (DE) $0.18 $0.40
North Carolina Turnpike Authority (NC) $0.18 $0.71
Cameron County Regional Mobility Authority (TX) $0.17 $0.67
Central Florida Expressway Authority (FL) $0.16 $0.39
Osceola County (FL) $0.16 $0.65
Miami-Dade Expressway Authority (FL) $0.16 $0.32
New Jersey Turnpike Authority (NJ) - New Jersey Turnpike $0.16 $0.52
Mid-Bay Bridge Authority (FL) $0.14 $0.73
South Jersey Transportation Authority (NJ) $0.14 $0.47
Pennsylvania Turnpike Commission (PA) $0.13 $0.66
South Carolina Department of Transportation (SC) $0.11 $0.55
Maryland Transportation Authority (MD) $0.10 $0.70
West Virginia Parkways, Economic Development, and Tourism Authority (WV) $0.09 $0.37
Florida Turnpike Enterprise (FL) $0.08 $0.29
Indiana Toll Road Concession Company (IN) $0.08 $0.41
Virginia Department of Transportation (VA) $0.08 $0.15
Illinois State Toll Highway Authority (IL) $0.07 $0.56
New Jersey Turnpike Authority (NJ) - Garden State Parkway $0.07 NA
Oklahoma Turnpike Authority (OK) $0.06 $0.22
Maine Turnpike Authority (ME) $0.06 $0.23
Ohio Turnpike and Infrastructure Commission (OH) $0.06 $0.18
New York State Thruway Authority (NY) $0.05 $0.27
Florida Department of Transportation (FL) $0.05 $0.20
Kansas Turnpike Authority (KS) $0.05 $0.13
Massachusetts Department of Transportation (MA) $0.04 $0.17
New Hampshire Department of Transportation (NH) $0.04 $0.19
National Average $0.11 $0.45 a Toll rates are for electronic payments at peak hour rates, if applicable. Toll rates are for full-length trips, with the exception
of the Garden State Parkway, where 5-axles trucks are not allowed on the entire facility. Toll rates are current as of June 2021.
b The Pocahontas Parkway is managed by Globalvia. c The Dulles Greenway is managed by Toll Road Investors Partnership II. d The Southern Connector is managed by Connector 2000 Association.
The Illinois Tollway implemented a change to how video tolls (V-Tolls) are assessed effective February 1, 2018. A V-Toll occurs when no transponder is read, but, upon image review, the license plate is found to correspond to an I-PASS account. This may happen for various reasons, including the improper mounting of, or absence of, an I-PASS transponder. Under the revised policy, I-PASS customers that are V-Tolled more than five times in a calendar month on any individual license plate registered to a customer’s I-PASS or electronic tolling account will be charged the cash toll rate for the sixth and every subsequent V-Toll incurred that month. In 2019 and 2020, the Tollway collected approximately $11.9 million and $10.1 million in V-Toll surcharge revenue, respectively.

Chapter 1 Background
1-17
1.6.2 I-PASS Usage The percentage of transactions paid with I-PASS has increased over time. The increase has been gradual in most years, with the most notable exception being a sharp increase in late 2004, leading up to the toll rate increase of January 1, 2005, when the PC toll rate doubled and a discount for I-PASS users was established. I-PASS usage increased from 49.8 percent of transactions in 2004 to 74.7 percent in 2005.
The Illinois Tollway joined the E-ZPass Interagency Group in 2005. Membership in this group allows for sharing of an in-vehicle transponder for toll payment on all member facilities. In this report, the term “I-PASS” when used in the context of toll payments usually means payment via the I-PASS transponder or any other transponder within the E-ZPass Interagency Group.
Between 2005 and 2015, I-PASS usage grew an average of 1.2 percentage points per year to 86.6 percent (Table 1-3).
Table 1-3. I-PASS Annual Usage Rates
Year I-PASS Annual Usage Rate 2005 74.7%
2006 78.4%
2007 79.7%
2008 81.0%
2009 81.7%
2010 82.6%
2011 83.9%
2012 86.3%
2013 86.5%
2014 86.6%
2015 86.6%
2016 87.0%
2017 87.8%
2018 90.6%
2019 90.7%
2020 89.1%
The conversion of all mainline plazas to an ORT configuration in 2006 and the introduction of cashless tolling contributed to this growth rate. (The first cashless plaza opened in 2009.) The largest year-over-year increase (2.4 percentage points) occurred in 2012, following the January 2012 PC toll rate increase. Between 2012 and 2015, I-PASS growth slowed to an average of 0.1 percentage point per year.
In recent years, I-PASS usage grew with the opening of several new cashless ramp plazas, the two-phase opening of the all cashless IL 390 Tollway in July 2016 and November 2017, and the implementation of the new V-Toll policy in February 2018. Between 2015 and 2019, I-PASS usage grew an average of 1.0 percentage point per year to 90.7 percent in 2019.

Chapter 1 Background
1-18
In 2020, I-PASS usage was impacted by the COVID-19 pandemic, as well as changes in toll collection implemented by the Tollway. The share of transactions paid via I-PASS or E-ZPass accounts was 89.1 percent for the year, representing a slight decline from 2019. Changes in toll collection include the suspension of cash collections in mid-March 2020, as well as the introduction of a new Pay By Plate option and a new invoicing process in the summer.
Table 1-4 presents ETC rates by toll agency in 2019, the latest year in which ETC usage is available for all listed facilities. As shown, the Illinois Tollway continues to rank among the top toll agencies in ETC participation. Only one agency, the Metropolitan Transportation Authority in New York, had a higher ETC usage rate for 2019.
Table 1-4. 2019 Electronic Tolling Collection Usage Rates for U.S. Toll Agencies
ETC Usage Rank ETC Usage Rates Toll Agency Name Name of ETC System 1 95.1% Metropolitan Transportation Authority (NY) E-ZPass
2 90.7% Illinois Tollway I-PASS
3 87.8% Port Authority of New York and New Jersey E-ZPass
4 86.9% New Jersey Turnpike Authority E-ZPass
5 86.0% Massachusetts Department of Transportation E-ZPass
6 85.7% Indiana Toll Road Concession Company E-ZPass
7 83.5% Florida’s Turnpike SunPass
8 83.0% North Texas Tollway Authority Toll Tag
9 82.5% Pennsylvania Turnpike Commission E-ZPass
10 82.0% Maryland Transportation Authority E-ZPass
11 78.9% Oklahoma Turnpike Authority PIKEPASS
12 78.7% New York State Thruway Authority E-ZPass
13 74.6% Harris County Toll Road Authority (Houston) E-Z Tag
14 72.0% Bay Area Toll Authority FasTrak
15 64.6% Ohio Turnpike Commission E-ZPass Source for electronic toll collection (ETC) usage: Respective toll facilities’ webpages and E-ZPass Interagency Group Settlement Reports.

2-1
Chapter 2 Historical Performance & Recent Trends
This chapter analyzes historical toll traffic and revenue trends for the Illinois Tollway. It also provides a detailed review of recent traffic trends. It concludes with an overview of typical travel patterns by month, day, and hour.
2.1 Historical Toll Traffic and Revenue Trends Figure 2-1, Table 2-1, and Table 2-2 provide the Illinois Tollway’s annual transactions and toll revenue from the first full year of operation in 1959 through 2020. In this report, historical toll revenue is presented differently than projected toll revenue, as provided in Chapter 5. The projected toll revenue is expected revenue, which is the revenue that would be collected if every vehicle paid the exact published toll based on vehicle class, time of day, and payment type. The historical toll revenue, the source of which is the Illinois Tollway Annual Comprehensive Financial Report (ACFR), is the toll revenue remaining after accounting for overpayments, underpayments, exemptions, and toll avoidance. Historical toll revenue does not include tolls and fines collected through the violation enforcement system; these are reported separately in Illinois Tollway financial statements as Toll Evasion Recovery.
Figure 2-1. Illinois Tollway Systemwide Annual Transactions & Toll Revenue (in thousands)

Chapter 2 Historical Performance & Recent Trends
2-2
Table 2-1. Illinois Tollway Systemwide Annual Transactions (in thousands)
Year PCs PC AAPCa CVs CV AAPCa Total Total AAPCa 1959 37,884 – 5,050 – 42,934 – 1964 72,721 13.9% 7,005 6.8% 79,726 13.2% 1969 146,476 15.0% 14,488 15.6% 160,964 15.1% 1970 160,916 9.9% 16,187 11.7% 177,103 10.0% 1975 216,180 6.1% 26,914 10.7% 243,094 6.5% 1980 269,106 4.5% 40,183 8.3% 309,289 4.9% 1982 278,508 1.7% 38,993 -1.5% 317,501 1.3% 1983b 290,687 4.4% 40,116 2.9% 330,803 4.2% 1985 324,673 5.7% 43,543 4.2% 368,216 5.5% 1989b 428,745 7.2% 57,193 7.1% 485,938 7.2% 1990 485,085 13.1% 57,962 1.3% 543,047 11.8% 1995 597,026 4.2% 70,179 3.9% 667,205 4.2% 2000 664,002 2.1% 72,308 0.6% 736,310 2.0% 2001 687,856 3.6% 76,429 5.7% 764,285 3.8% 2002 715,073 4.0% 77,763 1.7% 792,836 3.7% 2003 693,507 -3.0% 108,096 39.0% 801,603 1.1% 2004 714,120 3.0% 109,025 0.9% 823,145 2.7% 2005b 695,378 -2.6% 85,068 -22.0% 780,446 -5.2% 2006c 678,535 -2.4% 85,590 0.6% 764,125 -2.1% 2007d 696,055 2.6% 92,237 7.8% 788,292 3.2% 2008 688,516 -1.1% 89,366 -3.1% 777,882 -1.3% 2009 694,837 0.9% 80,516 -9.9% 775,353 -0.3% 2010 730,797 5.2% 86,286 7.2% 817,083 5.4% 2011 743,195 1.7% 89,633 3.9% 832,828 1.9% 2012e 711,680 -4.2% 92,100 2.8% 803,780 -3.5% 2013 720,513 1.2% 95,529 3.7% 816,042 1.5% 2014 737,238 2.3% 101,041 5.8% 838,279 2.7% 2015b 777,719 5.5% 103,896 2.8% 881,615 5.2% 2016b,e 823,643 5.9% 108,248 4.2% 931,891 5.7% 2017b,e 883,468 7.3% 113,866 5.2% 997,334 7.0% 2018b 889,184 0.6% 119,768 5.2% 1,008,952 1.2% 2019b 900,809 1.3% 122,413 2.2% 1,023,222 1.4% 2020b 686,065 -23.8% 120,584 -1.5% 806,650 -21.2% GROWTH RATES (AAPCa) 1959–1980 9.8% 10.4% 9.9% 1980–1990 6.1% 3.7% 5.8% 1990–2000 3.2% 2.2% 3.1% 2000–2010 1.0% 1.8% 1.0% 2010–2020 -0.6% 3.4% -0.1%
a Average annual percent change. b Toll rate adjustment. c Open road tolling (ORT) implemented at all mainline toll plazas. d Veterans Memorial Tollway (I-355) south extension opened. e Portions of Illinois Route 390 Tollway opened in July 2016 and November 2017.

Chapter 2 Historical Performance & Recent Trends
2-3
Table 2-2. Illinois Tollway Systemwide Annual Revenue (in thousands)a
Year PCs PC AAPCb CVs CV AAPCb Total Total AAPCb 1959 $11,943 – $2,593 – $14,536 – 1964 26,284 17.1% 4,888 13.5% 31,172 16.5% 1969 46,872 12.3% 8,803 12.5% 55,675 12.3% 1970 47,565 1.5% 9,343 6.1% 56,908 2.2% 1975 58,784 4.3% 13,277 7.3% 72,061 4.8% 1980 73,248 4.5% 22,204 10.8% 95,452 5.8% 1982 76,004 1.9% 23,148 2.1% 99,152 1.9% 1983c 88,074 15.9% 29,154 25.9% 117,228 18.2% 1985 120,397 16.9% 43,901 22.7% 164,298 18.4% 1989c 155,394 6.6% 57,387 6.9% 212,781 6.7% 1990 183,237 17.9% 57,842 0.8% 241,079 13.3% 1995 227,519 4.4% 70,389 4.0% 297,908 4.3% 2000 268,277 3.4% 75,668 1.5% 343,945 2.9% 2001 276,724 3.1% 78,050 3.1% 354,774 3.1% 2002 276,763 0.0% 86,472 10.8% 363,235 2.4% 2003 275,751 -0.4% 101,703 17.6% 377,454 3.9% 2004 287,218 4.2% 104,368 2.6% 391,586 3.7% 2005c 341,352 18.8% 239,090 129.1% 580,442 48.2% 2006d 324,556 -4.9% 242,943 1.6% 567,499 -2.2% 2007e 321,008 -1.1% 251,085 3.4% 572,093 0.8% 2008 335,653 4.6% 247,994 -1.2% 583,647 2.0% 2009 334,520 -0.3% 257,543 3.9% 592,063 1.4% 2010 348,946 4.3% 279,808 8.6% 628,754 6.2% 2011 354,186 1.5% 298,488 6.7% 652,674 3.8% 2012c 615,957 73.9% 306,433 2.7% 922,390 41.3% 2013 622,349 1.0% 320,803 4.7% 943,152 2.3% 2014 630,556 1.3% 338,416 5.5% 968,972 2.7% 2015c 662,720 5.1% 483,909 43.0% 1,146,629 18.3% 2016c,f 686,846 3.6% 529,452 9.4% 1,216,298 6.1% 2017c,f 724,905 5.5% 584,285 10.4% 1,309,190 7.6% 2018c 719,165 -0.8% 621,886 6.4% 1,341,051 2.4% 2019c 726,063 1.0% 654,688 5.3% 1,380,751 3.0% 2020c 522,789 -28.0% 626,231 -4.3% 1,149,020 -16.8% GROWTH RATES (AAPCb) 1959–1980 9.0% 10.8% 9.4% 1980–1990 9.6% 10.0% 9.7% 1990–2000 3.9% 2.7% 3.6% 2000–2010 2.7% 14.0% 6.2% 2010–2020 4.1% 8.4% 6.2%
a Collected revenue. b Average annual percent change. c Toll rate adjustment. d Open road tolling (ORT) implemented at all mainline toll plazas. e Veterans Memorial Tollway (I-355) south extension opened. f Portions of Illinois Route 390 Tollway opened in July 2016 and November 2017.

Chapter 2 Historical Performance & Recent Trends
2-4
Over the course of the Illinois Tollway’s history, transactions have increased steadily, with only a few year-to-year declines. The rate of transaction growth, however, has slowed as the Illinois Tollway’s service area has matured. The average annual increase in transactions in the first two decades (1959–1980) was 9.9 percent. Between 1980 and 2010, transaction growth successively decreased in each decade. Since 2010, transaction growth has increased as new capacity has been added to the Tollway, including the widening of the Jane Addams Memorial Tollway (I-90) and the addition of the new IL 390 Tollway. Two exceptions to the recent growth trend are 2012 and 2020, when transactions fell by 3.5 percent and 21.2 percent, respectively, on an annual basis. The decline in 2012 is primarily attributable to the 2012 PC toll rate increase. The decline in 2020 is due to the impacts of the COVID-19 pandemic. PC traffic was impacted most significantly by the pandemic, falling 23.8 percent, while CV transactions performed comparatively well, falling only 1.5 percent year-over-year. This performance is broadly similar to that of other major U.S. toll road facilities’ performance throughout the pandemic. Performance in the first eight months of 2021 demonstrates an increase over the same period in 2020 (16.5 percent increase for PCs and 10.2 percent increase for CVs) but remains below 2019 levels overall (12.1 percent decrease for PCs and 5.9 percent increase for CVs).
Annual toll revenues generally have displayed a growth pattern similar to transactions. However, periodic jumps in revenue have occurred as a result of toll rate increases. Between 1959 and 1980, revenue increased an average of 9.4 percent per year. In the following decade, between 1980 and 1990, average annual revenue growth increased to 9.7 percent per year. Lower growth, 3.6 percent per year, occurred between 1990 and 2000, when there were no toll increases. Since 2000, revenue has grown at a faster rate due to the following multiple toll rate increases:
PC (cash payers only) and CV toll increases in 2005
PC toll rate increase in 2012
A three-phase CV toll rate increase between 2015 and 2017
Inflation-based annual CV toll rate beginning increases in 2018
In 2019, toll revenue increased 3.0 percent to a record high of $1.38 billion. In 2020, toll revenues fell approximately 17.1 percent, to $1.1 billion, due to the impacts of the COVID-19 pandemic.
2.2 Recent Performance Trends Between 2016 and 2019, the average annual increase in transactions was 3.2 percent. This growth can be attributed to regional and national economic expansion, the opening of the IL 390 Tollway in 2016, the completion of widening the Jane Addams Memorial Tollway in December 2016, the opening of the IL 390 Tollway eastern extension in November 2017, and the opening of several new interchanges on I-90.
Over the same period, revenues increased at an average annual rate of 4.3 percent. The increase in revenues during this time exceeded that of transactions due to the 6.7-percent CV toll rate increase implemented in 2017 and the start of annual inflation-based CV toll rate increases in 2018.

Chapter 2 Historical Performance & Recent Trends
2-5
Despite the toll rate increases, CV transactions grew at an average annual rate of 4.2 percent between 2016 and 2019. This growth attests to the relatively low elasticity of demand demonstrated by Tollway patrons. In comparison, PC transactions grew at an average annual rate of 3.0 percent for that same period.
In 2019, total transactions grew by 1.4 percent over 2018. PC transactions grew by 1.3 percent, while CV transactions grew by 2.2 percent. The lower PC growth can be attributed to several major construction projects that occurred on the Tollway in 2019. CV transactions were not as impacted by construction. The lower impact on CVs is, in part, because of a higher proportion of long-distance trips that diverted to other Tollway routes.
2.2.1 Trends by Facility Annual revenues are presented by route in Table 2-3, while recent transactions on the five Illinois Tollway facilities and systemwide are presented in Table 2-4. As illustrated, trends of the different facilities have varied. Tables 2-5 through 2-10 present monthly transactions by facility.
Table 2-3. Illinois Tollway Revenue by Route, 2016–2020 (in thousands)a
Illinois Tollway Route 2016b
% Change 2017c
% Change 2018d
% Change 2019d
% Change 2020d
Jane Addams Memorial $224,423 15.2% $258,433 8.6% $280,736 3.3% $290,057 -13.9% $249,692
Tri-State 564,780 5.6% 596,569 2.3% 610,289 1.4% 618,877 -17.0% 513,815
Reagan Memorial 193,505 2.9% 199,192 -6.9% 185,530 5.4% 195,522 -17.1% 162,043
Veterans Memorial 220,902 3.6% 228,873 -0.3% 228,236 4.3% 238,006 -19.3% 191,990
Illinois Route 390 11,323 118.1% 24,699 41.2% 34,873 5.2% 36,701 -18.5% 29,904 a Collected revenue. Does not include oversized/overweight vehicle revenues. b Tolling on the western portion of IL 390 began on July 5, 2016. c Tolling on the eastern extension of IL 390 began on November 1, 2017. d CV toll rates increased by 1.84 percent in 2018, 2.25 percent in 2019, and 2.07 percent in 2020.
Table 2-4. Illinois Tollway Transactions by Route, 2016–2020 (in thousands)
Illinois Tollway Route 2016a
% Change 2017b
% Change 2018
% Change 2019
% Change 2020
Jane Addams Memorial 171,409 16.2% 199,238 6.9% 212,899 3.5% 220,352 -17.7% 181,317
Tri-State 412,384 1.1% 416,990 -1.0% 412,811 -0.5% 410,803 -22.6% 317,842
Reagan Memorial 152,910 0.8% 154,068 -6.0% 144,897 1.1% 146,491 -23.3% 112,328
Veterans Memorial 169,587 1.5% 172,168 -6.1% 161,593 2.3% 165,274 -20.4% 131,573
Illinois Route 390 25,601 114.3% 54,870 39.9% 76,752 4.6% 80,301 -20.8% 63,590 a Tolling on the western portion of IL 390 began on July 5, 2016. b Tolling on the eastern extension of IL 390 began on November 1, 2017.

Chapter 2 Historical Performance & Recent Trends
2-6
Table 2-5. Jane Addams Memorial Monthly Transactions (thousands)a
Passenger Cars 2016 % change 2017 % change 2018 % change 2019 % change 2020 % change 2021 January 11,256 10.8% 12,476 12.7% 14,055 -2.9% 13,644 9.3% 14,915 -21.2% 11,757
February 11,036 9.7% 12,107 5.4% 12,758 7.1% 13,661 7.7% 14,713 -23.7% 11,228
March 12,347 12.7% 13,917 11.1% 15,462 4.2% 16,107 -26.2% 11,879 19.6% 14,208
April 12,185 15.3% 14,043 8.5% 15,230 5.1% 16,007 -53.4% 7,461 100.2% 14,938
May 13,010 15.4% 15,017 10.2% 16,557 3.4% 17,128 -39.7% 10,333 57.7% 16,294
June 13,125 17.9% 15,480 8.3% 16,761 3.1% 17,274 -23.7% 13,177 26.7% 16,689
July 13,921 15.9% 16,137 7.0% 17,267 3.3% 17,839 -15.0% 15,169 17.4% 17,810
August 13,739 19.1% 16,366 6.2% 17,387 3.9% 18,063 -16.3% 15,124 14.8% 17,367
September 12,784 21.7% 15,560 2.3% 15,924 3.6% 16,492 -13.2% 14,309 14.0% 16,306
October 12,912 22.7% 15,844 4.2% 16,506 4.4% 17,237 -15.7% 14,525
November 12,316 21.2% 14,923 1.3% 15,122 4.4% 15,789 -22.9% 12,175
December 12,426 19.8% 14,890 4.5% 15,556 4.9% 16,321 -22.3% 12,680
Total 151,058 17.0% 176,760 6.7% 188,584 3.7% 195,560 -20.0% 156,459 16.7%b 136,598
Commercial Vehicles 2016 % change 2017 % change 2018 % change 2019 % change 2020 % change 2021 January 1,455 9.8% 1,598 12.1% 1,791 1.5% 1,817 6.5% 1,936 0.3% 1,941
February 1,487 3.6% 1,541 8.6% 1,674 6.7% 1,785 1.7% 1,816 0.9% 1,833
March 1,678 8.4% 1,819 7.1% 1,948 1.8% 1,983 -0.2% 1,980 15.4% 2,284
April 1,654 6.3% 1,758 11.8% 1,965 5.5% 2,074 -13.6% 1,791 25.7% 2,251
May 1,752 11.6% 1,956 12.9% 2,208 -0.7% 2,193 -11.9% 1,931 17.6% 2,271
June 1,838 9.7% 2,016 8.4% 2,185 -1.9% 2,143 1.1% 2,166 11.6% 2,418
July 1,739 11.2% 1,934 13.1% 2,187 0.5% 2,198 4.2% 2,291 2.2% 2,341
August 1,883 14.8% 2,162 5.8% 2,287 -1.3% 2,258 0.5% 2,270 5.9% 2,405
September 1,774 11.6% 1,979 2.3% 2,026 5.9% 2,145 5.4% 2,260 3.3% 2,334
October 1,797 14.4% 2,057 9.3% 2,247 3.1% 2,316 0.7% 2,333
November 1,694 13.0% 1,914 4.0% 1,991 0.1% 1,994 3.2% 2,058
December 1,599 9.1% 1,744 3.5% 1,806 4.5% 1,886 7.4% 2,026
Total 20,351 10.5% 22,478 8.2% 24,314 2.0% 24,793 0.3% 24,857 8.9%b 20,078
All Vehicles Total 171,409 16.2% 199,238 6.9% 212,899 3.5% 220,352 -17.7% 181,317 15.6%b 156,676 a Numbers may not add due to rounding. b Year-to-Date
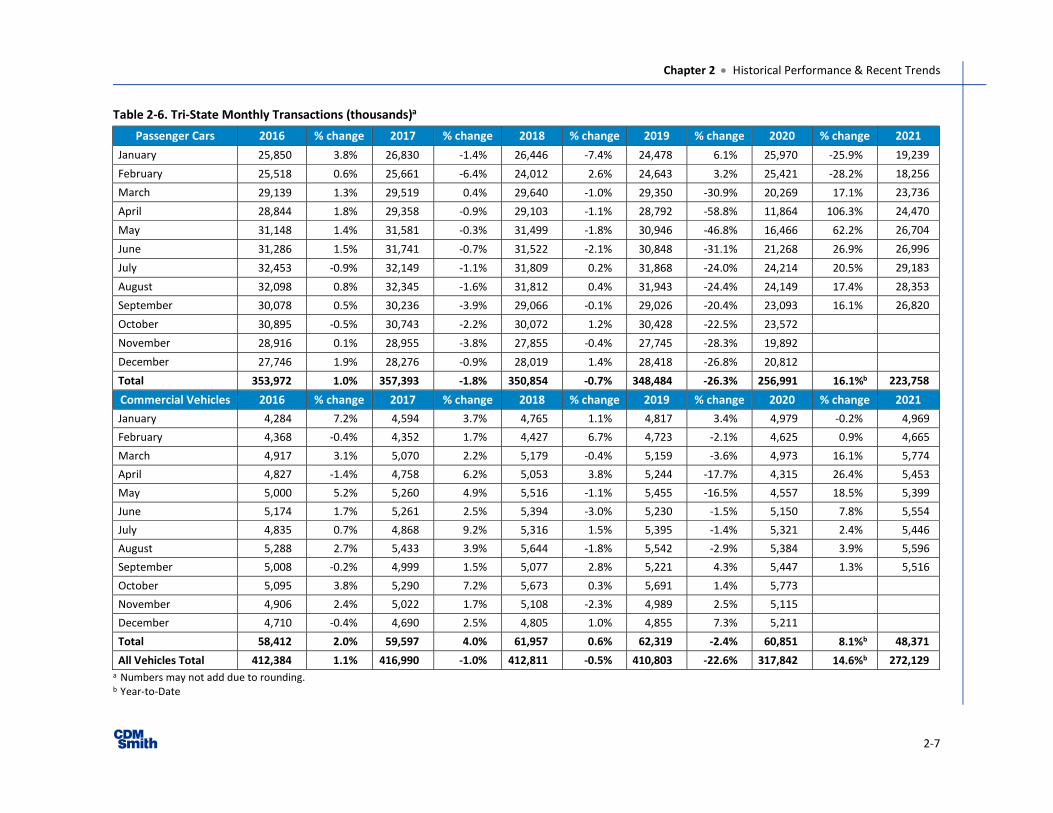
Chapter 2 Historical Performance & Recent Trends
2-7
Table 2-6. Tri-State Monthly Transactions (thousands)a
Passenger Cars 2016 % change 2017 % change 2018 % change 2019 % change 2020 % change 2021 January 25,850 3.8% 26,830 -1.4% 26,446 -7.4% 24,478 6.1% 25,970 -25.9% 19,239
February 25,518 0.6% 25,661 -6.4% 24,012 2.6% 24,643 3.2% 25,421 -28.2% 18,256
March 29,139 1.3% 29,519 0.4% 29,640 -1.0% 29,350 -30.9% 20,269 17.1% 23,736
April 28,844 1.8% 29,358 -0.9% 29,103 -1.1% 28,792 -58.8% 11,864 106.3% 24,470
May 31,148 1.4% 31,581 -0.3% 31,499 -1.8% 30,946 -46.8% 16,466 62.2% 26,704
June 31,286 1.5% 31,741 -0.7% 31,522 -2.1% 30,848 -31.1% 21,268 26.9% 26,996
July 32,453 -0.9% 32,149 -1.1% 31,809 0.2% 31,868 -24.0% 24,214 20.5% 29,183
August 32,098 0.8% 32,345 -1.6% 31,812 0.4% 31,943 -24.4% 24,149 17.4% 28,353
September 30,078 0.5% 30,236 -3.9% 29,066 -0.1% 29,026 -20.4% 23,093 16.1% 26,820
October 30,895 -0.5% 30,743 -2.2% 30,072 1.2% 30,428 -22.5% 23,572
November 28,916 0.1% 28,955 -3.8% 27,855 -0.4% 27,745 -28.3% 19,892
December 27,746 1.9% 28,276 -0.9% 28,019 1.4% 28,418 -26.8% 20,812
Total 353,972 1.0% 357,393 -1.8% 350,854 -0.7% 348,484 -26.3% 256,991 16.1%b 223,758
Commercial Vehicles 2016 % change 2017 % change 2018 % change 2019 % change 2020 % change 2021 January 4,284 7.2% 4,594 3.7% 4,765 1.1% 4,817 3.4% 4,979 -0.2% 4,969
February 4,368 -0.4% 4,352 1.7% 4,427 6.7% 4,723 -2.1% 4,625 0.9% 4,665
March 4,917 3.1% 5,070 2.2% 5,179 -0.4% 5,159 -3.6% 4,973 16.1% 5,774
April 4,827 -1.4% 4,758 6.2% 5,053 3.8% 5,244 -17.7% 4,315 26.4% 5,453
May 5,000 5.2% 5,260 4.9% 5,516 -1.1% 5,455 -16.5% 4,557 18.5% 5,399
June 5,174 1.7% 5,261 2.5% 5,394 -3.0% 5,230 -1.5% 5,150 7.8% 5,554
July 4,835 0.7% 4,868 9.2% 5,316 1.5% 5,395 -1.4% 5,321 2.4% 5,446
August 5,288 2.7% 5,433 3.9% 5,644 -1.8% 5,542 -2.9% 5,384 3.9% 5,596
September 5,008 -0.2% 4,999 1.5% 5,077 2.8% 5,221 4.3% 5,447 1.3% 5,516
October 5,095 3.8% 5,290 7.2% 5,673 0.3% 5,691 1.4% 5,773
November 4,906 2.4% 5,022 1.7% 5,108 -2.3% 4,989 2.5% 5,115
December 4,710 -0.4% 4,690 2.5% 4,805 1.0% 4,855 7.3% 5,211
Total 58,412 2.0% 59,597 4.0% 61,957 0.6% 62,319 -2.4% 60,851 8.1%b 48,371
All Vehicles Total 412,384 1.1% 416,990 -1.0% 412,811 -0.5% 410,803 -22.6% 317,842 14.6%b 272,129 a Numbers may not add due to rounding. b Year-to-Date

Chapter 2 Historical Performance & Recent Trends
2-8
Table 2-7. Reagan Memorial Monthly Transactions (thousands)a
Passenger Cars 2016 % change 2017 % change 2018 % change 2019 % change 2020 % change 2021 January 10,577 1.2% 10,700 -0.7% 10,629 -10.8% 9,476 9.1% 10,341 -27.8% 7,461
February 10,500 -1.7% 10,316 -6.4% 9,659 0.0% 9,661 5.2% 10,162 -29.1% 7,203
March 11,771 -0.7% 11,689 0.5% 11,742 -4.3% 11,235 -29.4% 7,935 17.5% 9,326
April 11,521 0.1% 11,531 -2.7% 11,218 -1.8% 11,021 -59.4% 4,477 114.6% 9,606
May 12,225 2.0% 12,467 -5.5% 11,777 0.0% 11,777 -49.0% 6,012 75.4% 10,544
June 11,973 2.2% 12,242 -6.7% 11,421 1.1% 11,550 -32.1% 7,838 36.6% 10,710
July 12,032 1.5% 12,207 -6.9% 11,367 3.6% 11,773 -23.0% 9,066 23.8% 11,228
August 12,235 2.8% 12,582 -8.7% 11,481 4.6% 12,015 -22.8% 9,276 20.7% 11,193
September 11,767 1.3% 11,924 -10.2% 10,708 4.2% 11,157 -19.6% 8,969 20.4% 10,801
October 12,152 -0.2% 12,124 -7.4% 11,227 5.1% 11,797 -21.7% 9,240
November 11,494 0.2% 11,513 -9.0% 10,479 3.7% 10,866 -28.8% 7,737
December 11,164 2.7% 11,466 -4.9% 10,900 3.7% 11,298 -27.3% 8,213
Total 139,412 1.0% 140,760 -5.8% 132,607 0.8% 133,627 -25.7% 99,264 18.9%b 88,072
Commercial Vehicles 2016 % change 2017 % change 2018 % change 2019 % change 2020 % change 2021 January 975 2.3% 998 2.5% 1,023 -10.5% 916 12.3% 1,029 -0.2% 1,027
February 1,002 -6.3% 939 1.0% 948 -2.8% 921 4.1% 959 1.1% 969
March 1,139 -2.9% 1,106 -0.5% 1,101 -9.1% 1,001 3.8% 1,039 15.5% 1,200
April 1,127 -7.4% 1,044 -3.2% 1,010 4.8% 1,058 -11.1% 941 27.4% 1,199
May 1,163 1.1% 1,176 -7.4% 1,090 2.4% 1,116 -11.1% 992 21.8% 1,208
June 1,221 -1.2% 1,207 -12.3% 1,058 2.5% 1,085 4.0% 1,128 13.6% 1,282
July 1,124 -0.3% 1,121 -7.2% 1,040 9.5% 1,139 3.8% 1,182 5.9% 1,251
August 1,208 3.8% 1,255 -13.0% 1,092 9.5% 1,196 -2.1% 1,171 10.5% 1,294
September 1,165 -1.8% 1,144 -15.5% 967 15.9% 1,120 4.6% 1,172 9.2% 1,279
October 1,187 0.3% 1,191 -8.2% 1,093 13.0% 1,235 1.7% 1,255
November 1,134 -2.1% 1,110 -12.4% 972 9.3% 1,062 3.8% 1,103
December 1,052 -3.1% 1,019 -12.1% 896 13.5% 1,016 7.5% 1,093
Total 13,498 -1.4% 13,309 -7.7% 12,290 4.7% 12,864 1.6% 13,064 11.4%b 10,709
All Vehicles Total 152,910 0.8% 154,068 -6.0% 144,897 1.1% 146,491 -23.3% 112,328 18.0%b 98,781 a Numbers may not add due to rounding. b Year-to-Date

Chapter 2 Historical Performance & Recent Trends
2-9
Table 2-8. Veterans Memorial Monthly Transactions (thousands)a
Passenger Cars 2016 % change 2017 % change 2018 % change 2019 % change 2020 % change 2021 January 11,859 1.3% 12,009 -0.5% 11,953 -12.7% 10,435 12.4% 11,724 -24.3% 8,870
February 11,717 -1.8% 11,501 -5.3% 10,887 -1.7% 10,705 6.3% 11,380 -24.2% 8,625
March 13,047 0.1% 13,054 -0.4% 13,003 -5.9% 12,238 -25.9% 9,066 19.6% 10,839
April 12,857 0.5% 12,918 -0.5% 12,853 -3.4% 12,414 -55.0% 5,580 102.5% 11,300
May 13,586 2.3% 13,896 -2.1% 13,605 -2.4% 13,283 -44.2% 7,406 64.8% 12,208
June 13,637 2.8% 14,014 -7.2% 13,005 1.3% 13,176 -27.0% 9,624 30.8% 12,587
July 13,500 1.8% 13,746 -7.9% 12,657 5.9% 13,410 -19.1% 10,849 19.5% 12,970
August 13,732 3.2% 14,173 -11.3% 12,566 8.7% 13,657 -19.4% 11,007 17.8% 12,965
September 13,047 2.4% 13,358 -13.8% 11,521 9.8% 12,649 -15.8% 10,651 17.6% 12,528
October 13,368 1.4% 13,559 -8.6% 12,395 9.3% 13,549 -18.9% 10,984
November 12,647 1.3% 12,815 -11.8% 11,305 8.6% 12,281 -25.4% 9,160
December 12,533 1.5% 12,724 -8.4% 11,659 8.0% 12,596 -23.4% 9,650
Total 155,531 1.4% 157,766 -6.6% 147,410 2.0% 150,393 -22.1% 117,083 17.9%b 102,892
Commercial Vehicles 2016 % change 2017 % change 2018 % change 2019 % change 2020 % change 2021 January 986 5.9% 1,045 6.2% 1,109 -6.6% 1,036 9.9% 1,138 -1.8% 1,118
February 1,009 -1.8% 991 3.0% 1,021 1.6% 1,037 1.2% 1,049 0.8% 1,057
March 1,129 2.4% 1,157 2.8% 1,189 -6.4% 1,113 0.4% 1,117 17.6% 1,314
April 1,152 -2.8% 1,120 7.0% 1,198 2.1% 1,223 -15.7% 1,031 31.9% 1,360
May 1,221 5.3% 1,286 3.3% 1,328 0.9% 1,340 -18.3% 1,095 26.2% 1,382
June 1,286 3.6% 1,332 -4.2% 1,276 1.2% 1,292 -1.6% 1,272 19.3% 1,518
July 1,201 1.8% 1,222 1.2% 1,236 10.7% 1,369 -2.2% 1,340 10.4% 1,479
August 1,298 5.3% 1,367 -7.6% 1,263 10.5% 1,395 -5.7% 1,315 15.2% 1,515
September 1,231 0.7% 1,240 -8.9% 1,129 12.6% 1,272 3.1% 1,311 13.4% 1,486
October 1,244 4.6% 1,302 -1.4% 1,284 10.7% 1,420 -2.2% 1,389
November 1,189 3.3% 1,228 -7.5% 1,136 7.9% 1,226 -0.1% 1,225
December 1,110 0.3% 1,113 -9.0% 1,013 14.2% 1,157 4.3% 1,206
Total 14,056 2.5% 14,402 -1.5% 14,183 4.9% 14,881 -2.6% 14,490 14.6%b 12,229
All Vehicles Total 169,587 1.5% 172,168 -6.1% 161,593 2.3% 165,274 -20.4% 131,573 17.5%b 115,121 a Numbers may not add due to rounding. b Year-to-Date

Chapter 2 Historical Performance & Recent Trends
2-10
Table 2-9. IL 390 Monthly Transactions (thousands)a
Passenger Cars 2016 % change 2017 % change 2018 % change 2019 % change 2020 % change 2021 January 3,698 44.3% 5,335 -0.7% 5,300 7.7% 5,706 -25.7% 4,239
February 3,446 43.0% 4,927 7.1% 5,277 4.3% 5,505 -24.2% 4,174
March 3,874 49.8% 5,803 1.8% 5,909 -22.4% 4,587 10.7% 5,079
April 3,817 49.0% 5,688 5.3% 5,992 -48.1% 3,107 66.7% 5,180
May 4,155 49.2% 6,200 3.7% 6,428 -42.1% 3,718 46.8% 5,459
June 4,185 45.7% 6,099 3.4% 6,308 -27.2% 4,593 23.2% 5,659
July 3,598 14.1% 4,106 47.5% 6,055 7.4% 6,500 -22.0% 5,071 13.2% 5,741
August 4,200 4.0% 4,366 44.1% 6,292 4.8% 6,597 -23.0% 5,079 14.0% 5,792
September 3,994 2.3% 4,087 40.5% 5,741 5.8% 6,076 -18.8% 4,936 13.3% 5,591
October 4,151 0.7% 4,179 49.3% 6,238 4.7% 6,532 -21.2% 5,148
November 3,896 40.0% 5,453 4.4% 5,691 3.7% 5,901 -26.9% 4,315
December 3,830 41.6% 5,424 4.3% 5,659 4.7% 5,924 -24.1% 4,499
Total 23,669 114.6% 50,790 37.3% 69,727 4.3% 72,745 -22.7% 56,267 10.9%b 46,913
Commercial Vehicles 2016 % change 2017 % change 2018 % change 2019 % change 2020 % change 2021 January 246 108.5% 513 5.5% 541 7.0% 579 -6.8% 540
February 236 104.1% 482 9.6% 528 -0.5% 526 -0.5% 523
March 285 97.6% 562 0.3% 564 -0.2% 563 15.1% 648
April 280 104.0% 571 6.6% 609 -13.8% 525 25.1% 656
May 326 93.2% 630 4.6% 659 -16.9% 548 19.9% 657
June 339 83.7% 623 1.6% 633 0.9% 639 14.2% 729
July 307 1.3% 311 98.2% 617 13.5% 700 -1.9% 687 5.3% 724
August 358 -0.1% 358 82.3% 653 10.0% 718 -7.2% 667 9.8% 732
September 337 -4.0% 323 83.4% 593 10.6% 656 1.7% 667 8.2% 721
October 346 -4.8% 329 104.0% 672 13.2% 761 -4.8% 725
November 314 73.5% 545 7.4% 585 4.7% 613 -1.5% 604
December 269 86.3% 502 4.4% 524 9.7% 575 3.7% 596
Total 1,932 111.2% 4,080 72.1% 7,024 7.6% 7,557 -3.1% 7,323 9.8%b 5,930
All Vehicles Total 25,601 114.3% 54,870 39.9% 76,752 4.6% 80,301 -20.8% 63,590 10.8%b 52,843 a Numbers may not add due to rounding. b Year-to-Date

Chapter 2 Historical Performance & Recent Trends
2-11
Table 2-10. Systemwide Monthly Transactions (thousands)a
Passenger Cars 2016 % change 2017 % change 2018 % change 2019 % change 2020 % change 2021 January 59,543 10.4% 65,713 4.1% 68,418 -7.4% 63,333 8.4% 68,656 -24.9% 51,566
February 58,772 7.2% 63,031 -1.2% 62,244 2.7% 63,946 5.1% 67,181 -26.3% 49,486
March 66,304 8.7% 72,052 5.0% 75,651 -1.1% 74,839 -28.2% 53,736 17.6% 63,188
April 65,407 9.6% 71,666 3.4% 74,092 0.2% 74,227 -56.2% 32,489 101.6% 65,495
May 69,970 10.2% 77,116 3.3% 79,637 -0.1% 79,561 -44.8% 43,936 62.1% 71,209
June 70,021 10.9% 77,662 1.5% 78,808 0.4% 79,156 -28.6% 56,501 28.6% 72,642
July 75,504 3.8% 78,345 1.0% 79,155 2.8% 81,390 -20.9% 64,371 19.5% 76,932
August 76,005 5.0% 79,831 -0.4% 79,538 3.4% 82,275 -21.4% 64,634 17.1% 75,670
September 71,670 4.9% 75,165 -2.9% 72,959 3.3% 75,401 -17.8% 61,959 16.3% 72,046
October 73,479 4.0% 76,449 0.0% 76,438 4.1% 79,543 -20.2% 63,470
November 69,269 6.3% 73,658 -4.4% 70,452 3.0% 72,582 -26.6% 53,279
December 67,699 7.5% 72,780 -1.4% 71,793 3.8% 74,555 -25.1% 55,854
Total 823,643 7.3% 883,468 0.6% 889,184 1.3% 900,808 -23.8% 686,065 16.5%b 598,233
Commercial Vehicles 2016 % change 2017 % change 2018 % change 2019 % change 2020 % change 2021 January 7,701 10.1% 8,481 8.5% 9,202 -0.8% 9,127 5.9% 9,661 -0.7% 9,594
February 7,866 2.5% 8,059 6.1% 8,552 5.2% 8,995 -0.2% 8,975 0.8% 9,048
March 8,864 6.4% 9,435 5.8% 9,980 -1.6% 9,820 -1.5% 9,672 16.0% 11,220
April 8,760 2.3% 8,959 9.4% 9,797 4.2% 10,207 -15.7% 8,603 26.9% 10,918
May 9,136 9.5% 10,004 7.7% 10,771 -0.1% 10,763 -15.2% 9,123 19.7% 10,917
June 9,519 6.7% 10,155 3.8% 10,537 -1.5% 10,382 -0.3% 10,355 11.1% 11,500
July 9,206 2.7% 9,457 9.9% 10,397 3.9% 10,801 0.2% 10,820 3.9% 11,241
August 10,035 5.4% 10,575 3.4% 10,939 1.6% 11,110 -2.7% 10,808 6.8% 11,542
September 9,515 1.8% 9,686 1.1% 9,791 6.3% 10,413 4.3% 10,857 4.4% 11,337
October 9,670 5.2% 10,168 7.9% 10,968 4.2% 11,424 0.4% 11,475
November 9,237 6.3% 9,819 -0.3% 9,792 0.9% 9,883 2.2% 10,105
December 8,739 3.8% 9,068 -0.3% 9,043 4.9% 9,489 6.8% 10,132
Total 108,248 5.2% 113,866 5.2% 119,768 2.2% 122,413 -1.5% 120,584 9.5%b 97,317
All Vehicles Total 931,891 7.0% 997,334 1.2% 1,008,952 1.4% 1,023,220 -21.2% 806,650 15.5%b 695,551 a Numbers may not add due to rounding. b Year-to-Date
Chapter 2 Historical Performance & Recent Trends
2-12
The Jane Addams Memorial Tollway (I-90) has experienced the highest recent growth of the four established Tollway routes. Prior to 2013, growth on this route had slowed because of capacity constraints and the limited ability to absorb new traffic. In 2013, major reconstruction and widening work began, which further reduced facility capacity and decreased transactions. The widening and reconstruction work was completed in December 2016 and was followed by significant revenue growth: an annual increase of 15.2 percent in 2017 and 8.6 percent in 2018.
The Tri-State Tollway (I-94/I-294/I-80) has remained the highest volume route since the Illinois Tollway opened. Although initially intended as a bypass of the Chicago metropolitan area, the Tri-State has since become a commuter route for traffic to and from the city of Chicago, as well as between suburbs. As development around the corridor has matured, traffic volumes have stabilized. In addition to serving as a commuter route, the Tri-State also carries significant CV traffic. In 2018 and 2019, transactions on this route decreased as a result of significant construction impacts, including reconstruction and widening work on the Central Tri-State (I-294) and reconstruction work on the Edens Spur (I-94).
The Reagan Memorial Tollway (I-88) had experienced high overall growth prior to 2012, because of a rapidly increasing residential population in the western suburbs, including Naperville and Aurora, and employment along the “tech corridor” that flanks I-88. In recent years, that population growth has slowed and construction on both I-88 and the parallel Jane Addams Memorial Tollway (I-90) has contributed to variations in traffic on this route. In 2014, CV traffic on I-88 increased significantly due to long-haul trucks diverting from the reconstruction and widening work on I-90. Between 2014 and 2017, that traffic returned to I-90 while various rehabilitation and resurfacing projects were implemented on I-88. In 2018 and 2019, traffic was further impacted by construction-related lane closures on a large portion of the western section and major reconstruction work between York Road and I-290.
The Veterans Memorial Tollway (I-355) is used by many suburb-to-suburb commuters and directly connects four major interstate highways: I-80, I-55, I-88, and I-290. Since the completion of the south extension in 2007, I-355 has added an additional interstate route from I-80 to I-90. This has attracted some long-haul truckers looking to bypass more congested areas of the region. The I-355 south extension also connects to areas of Will County that are still being developed. Some of the more recent transactions and revenue growth is a result of development at the south end of the route. Most recently, in 2019, traffic on this route was dampened by major widening work between Roosevelt Road (IL 38) and Butterfield Road (IL 56).
Tolling began on the IL 390 Tollway between Lake Street and Rohlwing Road on July 5, 2016, contributing to year-over-year new revenues in the second half of 2016 and the first half of 2017. The east extension of IL 390 Tollway between Rohlwing Road and Busse Road (Illinois Route 83) opened on November 1, 2017, contributing additional year-over-year revenue to the system in the last two months of 2017 and the first 10 months of 2018.

Chapter 2 Historical Performance & Recent Trends
2-13
2.2.2 COVID-19 Impacts In 2020, transactions were down 21.2 percent compared with 2019. Starting in mid-March, traffic volumes on the Illinois Tollway and throughout the United States decreased significantly as a result of social distancing measures adopted in response to the COVID-19 pandemic. In Illinois, social distancing measures include the Governor’s stay-at-home order first issued on March 20, 2020, and widespread school and workplace closures. Figure 2-2 presents 2019, 2020, and 2021 (year-to-date) transaction trends by week.
Figure 2-2. Passenger Car and Commercial Vehicle Transaction Performance (2019–2021)

Chapter 2 Historical Performance & Recent Trends
2-14
In the first two months of 2020, transactions grew by 6.2 percent compared with 2019, due in part to a decrease in construction work and mild winter weather. From March through December 2020, however, transactions were 25.7 percent below 2019 transactions for the same period. Transaction losses were most significant in April and May when COVID-19-related closures were greatest throughout the state of Illinois. Between June and September, transaction volumes gradually increased from 25.3 to 15.1 percent below 2019 levels, as the state shifted from Phase 1 to Phase 4 of the Governor’s Restore Illinois reopening plan. Recovery slowed in late fall 2020 as COVID-19 cases increased and mitigation measures under the Restore Illinois plan were implemented.
Recovery continued to be slow in early 2021, in part, because of the severe winter weather events in late January and February. Beginning in March, recovery continued, and transactions rose to 6.6 percent below 2019 levels in August.
The impact of the pandemic restrictions and closures has been most significant on PCs. From March through December 2020, PC transactions were 28.9 percent below the same period in 2019. In comparison, CV transactions were 2.2 percent below 2019 transactions for that period. CV performance rebounded quickly after peak declines in April and May. Between September and December 2020, CV performance exceeded 2019 levels. This pattern has continued into 2021, with CV transactions exceeding 2019 levels each month to date. While PC transactions in 2021 remain below 2019 levels, they have gradually increased over the year, rising to 8.0 percent below 2019 levels in August.
2.3 Traffic Profile This section presents travel patterns by month, day, and hour on the Illinois Tollway. The Tollway is largely a commuter route. On a daily basis, the Tollway has a high percentage of PC trips that are made during the rush hour periods for work-related purposes. However, the Tollway also serves as a major connection for both interstate commerce and recreational interstate passenger traffic. As a result, the summer months are the busiest months of the year because recreational traffic and peak annual commercial traffic are added to the commuter base.
2.3.1 Monthly Variations On the Tollway system, traffic volumes generally reach the highest levels during the summer months, as shown in Figure 2-3. Year-to-year variations in the number of weekdays in a given month, as well as the dates of holidays, explain slight variances in the overall pattern. For example, in 2019, September averaged fewer daily transactions than five other months, largely because of the Friday preceding Labor Day (a major travel day) falling in August, boosting its daily average transactions. Another factor in the winter months are weather events. If significant storms fall disproportionately within a single month, average daily transactions in that month may be affected. While January 2019 had three snow events, two of them fell on weekends, which diminished impacts. Similarly, the largest snowfall of the year occurred on an April Sunday. As a result, weather impacts on daily traffic in 2019 were minimal.

Chapter 2 Historical Performance & Recent Trends
2-15
Figure 2-3. Average Daily Transactions by Month (2019)
Figure 2-4 shows the share of monthly transactions by PCs and CVs. PC transactions are highest in the summer months and lowest in the winter months. The summer months are highest because both commuters and vacationers use the system during this period. During the winter months, many commuters take off work for the holidays at the end of December and beginning of January. This reduces transactions during these months. Similar to PC transactions, CV transactions increase over the summer months. CV volumes remain high in the fall as shipping increases in preparation for the holiday season. Holidays tend to have a larger impact on CV traffic, resulting in dips in March/April, July, and August/September, due to the Easter, Fourth of July, and Labor Day holidays, respectively.

Chapter 2 Historical Performance & Recent Trends
2-16
Figure 2-4. Passenger Car and Commercial Vehicle Transactions by Month (2019)
2.3.1.1 Urban and Rural Monthly Variations The monthly variations in transactions are not uniform throughout the system. While there are localized variations between individual plazas, the most significant distinction is between urban versus rural toll plazas. The heaviest travel periods on the rural portions of the Tollway occur during the summer on Friday and Sunday afternoons, when Chicago-area residents are leaving for or returning from recreational travel. Otherwise, the traffic volumes and congestion levels on the rural sections of the Tollway are typically much lower than on the urban portions. As noted previously, the rural portions of roadway do not have the traditional high-volume, peak periods in the morning and afternoon as experienced by other parts of the system.
Figure 2-5 shows the difference between monthly traffic patterns at suburban and rural plazas. York Road Toll Plaza (Plaza 51) is an urban plaza used mostly by commuters. In contrast, South Beloit Toll Plaza (Plaza 1) is located at the rural edge of the Tollway and has a higher proportion of recreational trips. While transactions at both plazas peak during the summer months, South Beloit Toll Plaza has a large spike in trips between July and August, whereas York Road Toll Plaza’s profile is relatively flat during this time.

Chapter 2 Historical Performance & Recent Trends
2-17
Figure 2-5. Monthly Transactions for Urban and Rural Plazas (2019)
2.3.2 Daily Variations The overall number of transactions is higher on weekdays, which reflects consistent use by local commuters. As shown in Figure 2-6, transactions rise slowly over the week to peak on Fridays, when transactions include both weekday commuter trips and weekend recreational trips. During the summer months, many recreational travelers leave the Chicago region on Friday afternoon for vacation destinations in Wisconsin, Indiana, and Michigan. These summer Fridays commonly represent the highest transaction days on the Tollway system. On Saturdays and Sundays, the number of transactions decrease, due to fewer work-related trips on the weekend.

Chapter 2 Historical Performance & Recent Trends
2-18
Figure 2-6. Daily Traffic Trends (2019)
2.3.3 Hourly Variations The profile of traffic by hour of day varies widely throughout the system. Most of the suburban areas have distinct peak periods during the morning and evening rush hours. In contrast, rural areas show a mild morning peak period before volumes drop slightly, then slowly build until the evening peak period. At centrally located mainline toll plazas, such as Cermak Road Toll Plaza (Plaza 35), York Road Toll Plaza (Plaza 51), and Meyers Road Toll Plaza (Plaza 52), both peak periods have high-traffic volumes in both directions without any clear directional trend.
These patterns are illustrated in Figure 2-7. In the figure, rural mainline plazas are defined as South Beloit (Plaza 1), Belvidere (Plaza 5), and Marengo-Hampshire (Plaza 7) on the Jane Addams Memorial Tollway; Waukegan (Plaza 21) on the Tri-State Tollway; and DeKalb (Plaza 66) and Dixon (Plaza 69) on the Reagan Memorial Tollway.

Chapter 2 Historical Performance & Recent Trends
2-19
Figure 2-7. Hourly Traffic Trends (2019)
Traffic by hour of day also varies among vehicle types. PCs, which make up the majority of the traffic on the Illinois Tollway, follow the peaking characteristics defined in Figure 2-7. Large truck profiles peak in late morning/early afternoon, with a gentle slope leading upward in the morning and downward in the evening. Large trucks have the highest proportion of overnight traffic, in part due to the off-peak toll discounts for CVs. Figure 2-8 shows large truck weekday hourly profiles compared with PCs for all mainline and attended plazas in 2019.

Chapter 2 Historical Performance & Recent Trends
2-20
Figure 2-8. Passenger Car and Commercial Vehicle Hourly Trends (2019)
Small and medium truck profiles share similarities with the large truck and PC profiles. Medium trucks show an hourly profile similar to rural plazas, with a mild morning peak that builds toward a larger afternoon peak. Overnight medium truck traffic is noticeably lower than that of large trucks, but higher in proportion than PC volumes. Small trucks have a clear morning and afternoon peak, similar to PCs. However, as with medium trucks, the peaks occur closer to midday with volumes remaining high in between.

3-1
Chapter 3 Population & Economic Growth
3.1 Introduction Regional socioeconomic characteristics are a principal driver of travel demand and have a significant impact on the ongoing usage of a toll facility. Population and employment are the two most important variables used in socioeconomic forecasts for transportation planning. From these socioeconomic variables and other travel-related model inputs, transportation planners forecast trip origins and destinations, trip distribution (linking origins and destinations), modal choice (auto, train, bus, walk), and trip assignment (specific route taken). The total of all trips assigned to Tollway routes provides the basis for revenue estimation. As such, it is therefore vital to review these underlying socioeconomic assumptions.
CDM Smith used a modified version of the Chicago Metropolitan Agency for Planning (CMAP) regional travel demand model as the basis for the study modeling effort. Inherent to the CMAP model are population and employment forecasts developed and adopted by CMAP. These socioeconomic forecasts are key in estimating future travel demand, and it is common practice at the investment-grade study level to independently verify and refine these assumptions. For this task, CDM Smith partnered with Dr. Kermit Wies, one of the region’s foremost travel demand modeling experts, to prepare an independent socioeconomic forecast for the Illinois Tollway service area. Dr. Wies’s full report is provided as Appendix B.
The socioeconomic forecast used throughout this study is from the independent forecast of Dr. Kermit Wies, senior research fellow and adjunct professor at Northwestern University Transportation Center. Chapter 4 details how this revised forecast was integrated into the modeling process. This chapter summarizes the demographic and economic information assembled from various sources, including Dr. Wies’s findings.
3.2 Regional Development Trends This section examines population and employment trends in the 11 Illinois counties directly served by the Illinois Tollway: Boone, Cook, DeKalb, DuPage, Kane, Lake, Lee, McHenry, Ogle, Will, and Winnebago.3 Summary tables of historical population and employment growth trends are presented first, followed by historical regional personal income growth trends. Subregional development trends are described by groups of development trends by groups of counties: “core” counties (Cook, DuPage, and Lake), “collar” counties (DeKalb, Kane, McHenry, and Will), Rockford-area counties (Boone and Winnebago), and rural counties (Lee and Ogle). The section closes with a review of major regional employers and their proximity to the Tollway system.
___________________________________
3 Occasionally, the Chicago Metropolitan Statistical Area (MSA) is used as a point of reference for various metrics. The MSA is defined by the U.S. Census Bureau and largely overlaps with the Tollway service area. It contains nine counties in Illinois (Cook, DeKalb, DuPage, Grundy, Lake, Kane, Kendall, McHenry, and Will), four counties in northwest Indiana (Jasper, Lake, Newton, and Porter), and one county in southeast Wisconsin (Kenosha).

Chapter 3 Population & Economic Growth
3-2
3.2.1 Historical Population and Employment Growth Trends Over the past four decades, the 11 counties served by the Illinois Tollway experienced population and employment growth. As shown in Table 3-1, population grew modestly in the 1980s, relatively fastest in the 1990s, modestly again in the 2000s, and declined slightly in the 2010s. Population growth has been moderately faster in the suburban counties of the Chicago metropolitan area, with DuPage, Lake, and McHenry Counties experiencing more growth in the earlier decades, while Kane and Will Counties experienced more population growth in the later decades. Urban counties like Cook and Winnebago, as well as rural counties Lee and Ogle, experienced low to negative growth over the past four decades.
Table 3-1. Historical Population Growth, 1980–2019
Growth Ratea
Subregion County 1980 1990 2000 2010 2019 1980–1990
1990–2000
2000–2010
2010–2019
Rockford Boone 28,630 30,806 41,788 54,165 53,544 0.7% 3.1% 2.6% -0.1%
Core Cook 5,253,628 5,105,044 5,376,741 5,194,675 5,150,233 -0.3% 0.5% -0.3% -0.1%
Collar DeKalb 74,628 77,932 88,941 105,160 104,897 0.4% 1.3% 1.7% 0.0%
Core DuPage 658,876 781,689 904,594 916,924 922,921 1.7% 1.5% 0.1% 0.1%
Collar Kane 278,405 317,471 404,508 515,269 532,403 1.3% 2.5% 2.5% 0.4%
Core Lake 440,387 516,418 644,682 703,462 696,535 1.6% 2.2% 0.9% -0.1%
Rural Lee 36,328 34,392 36,062 36,031 34,096 -0.6% 0.5% 0.0% -0.6%
Collar McHenry 147,897 183,241 259,524 308,760 307,774 2.2% 3.5% 1.8% 0.0%
Rural Ogle 46,338 45,957 51,001 53,497 50,643 -0.1% 1.1% 0.5% -0.6%
Collar Will 324,460 357,313 502,211 677,560 690,743 1.0% 3.5% 3.0% 0.2%
Rockford Winnebago 250,884 252,913 278,441 295,266 282,572 0.1% 1.0% 0.6% -0.5%
Total 7,540,461 7,703,176 8,588,493 8,860,769 8,826,361 0.2% 1.1% 0.3% 0.0%
Illinois 11,427,429 11,430,602 12,419,927 12,830,632 12,671,821 0.0% 0.8% 0.3% -0.1% Source: U.S. Census Bureau, Decennial Censuses (1980, 1990, 2000, 2010) and County Population Totals (2019) a Compound annual growth rate (CAGR)
As shown in Table 3-2, employment growth has been relatively higher than population growth over the past four decades, except for the 2000s. That decade was marked by the Great Recession of 2007–2009, which resulted in relatively low employment in the benchmark year of 2010. To illustrate, the Chicago Metropolitan Statistical Area’s (MSA’s) unemployment rate increased significantly during the Great Recession, from 4.9 percent in 2007 to a peak of 10.6 percent in 2010. After the peak, the unemployment rate in the Chicago MSA steadily declined and dropped to 3.9 percent in 2019. However, the Chicago-area unemployment rate continued to remain slightly higher than the Midwest and national rates of 3.6 and 3.7 percent, respectively, in 2019.

Chapter 3 Population & Economic Growth
3-3
Table 3-2. Historical Employment Growth, 1980–2019
Growth Ratea
Subregion County 1980 1990 2000 2010 2019 1980–1990
1990–2000
2000–2010
2010–2019
Rockford Boone 14,433 16,779 18,878 18,407 24,431 1.5% 1.2% -0.3% 3.2%
Core Cook 2,906,747 3,108,378 3,322,763 3,157,311 3,600,552 0.7% 0.7% -0.5% 1.5%
Collar DeKalb 35,216 40,125 47,180 50,322 52,510 1.3% 1.6% 0.7% 0.5%
Core DuPage 289,125 504,745 696,935 707,272 801,505 5.7% 3.3% 0.2% 1.4%
Collar Kane 133,232 174,179 240,063 247,778 283,377 2.7% 3.3% 0.3% 1.5%
Core Lake 210,930 296,744 415,490 441,442 475,635 3.5% 3.4% 0.6% 0.8%
Rural Lee 16,258 17,668 17,969 16,786 16,631 0.8% 0.2% -0.7% -0.1%
Collar McHenry 56,674 83,188 111,035 135,187 140,684 3.9% 2.9% 2.0% 0.4%
Rural Ogle 18,719 20,580 25,399 23,310 22,417 1.0% 2.1% -0.9% -0.4%
Collar Will 102,127 124,031 184,519 272,569 346,301 2.0% 4.2% 4.0% 2.7%
Rockford Winnebago 130,407 150,568 175,370 160,323 162,592 1.5% 1.5% -0.9% 0.2%
Total
3,913,868 4,536,985 5,255,601 5,230,707 5,926,635 1.5% 1.3% -0.1% 1.4%
Illinois
5,675,371 6,390,424 7,357,491 7,251,002 7,962,884 1.2% 1.4% -0.2% 1.1% Source: U.S. Bureau of Economic Analysis, Personal Income and Employment by Major Component a Compound annual growth rate (CAGR)
Similar to the population growth patterns, the collar counties experienced relatively large growth in employment. DuPage, Kane, and Lake Counties experienced growth earlier in the period, while Will County experienced relatively high growth throughout the period. In contrast to the population patterns, Cook County experienced employment growth in the 2010–2019 period.
The employment-to-population ratio of a geographic area provides an indication of the extent to which the population of one county may travel to another county for employment, or whether a county is a net receiver of employees (Table 3-3). For example, Cook and DuPage Counties have relatively high ratios of 0.70 and 0.87, respectively, compared with the regionwide ratio of 0.67 for the Tollway service area. Conversely, the collar counties of McHenry and Will report below average ratios of 0.46 and 0.50. Table 3-3 presents the employment-to-population ratios for the 11 counties served by the Illinois Tollway in the year 2019.
3.2.2 Historical Real Personal Income Growth Trends Demand for travel on a toll facility is dependent on several factors, specifically the time savings expected from using the tolled route. The traveler’s willingness to pay is largely determined by income. Using income, CDM Smith calculated motorists’ value-of-time (VOT) for various geographies within the study area. It is helpful to understand income levels based on geography due to the significant role VOT plays in the forecasting process. Calculation of VOT is also discussed in greater detail in Chapter 4.

Chapter 3 Population & Economic Growth
3-4
Table 3-3. Employment-to-Population Ratios, 2019
County County Employment
2019 Population
2019 Employment-to- Population Ratio
Rockford Boone 24,431 53,544 0.46 Core Cook 3,600,552 5,150,233 0.70 Collar DeKalb 52,510 104,897 0.50 Core DuPage 801,505 922,921 0.87 Collar Kane 283,377 532,403 0.53 Core Lake 475,635 696,535 0.68 Rural Lee 16,631 34,096 0.49 Collar McHenry 140,684 307,774 0.46 Rural Ogle 22,417 50,643 0.44 Collar Will 346,301 690,743 0.50 Rockford Winnebago 162,592 282,572 0.58 Total 5,926,635 8,826,361 0.67 Illinois 7,962,884 12,671,821 0.63
Sources: U.S. Census Bureau, County Population Totals (2019) and U.S. Bureau of Economic Analysis, Personal Income and Employment by Major Component
The historical real per capita income trend for the service area is displayed by county in Table 3-4. Real personal per capita incomes in core counties exceeded the statewide average, particularly in DuPage and Lake Counties. Rockford-area counties (Winnebago and Boone) and rural counties (Lee and Ogle), along with the outer collar county of DeKalb, had per capita personal incomes below the statewide average in all years.
Table 3-4. Real Per Capita Personal Income Growth, 1980–2019 (in 2012 Dollars)
Growth Ratea Subregion County 1980 1990 2000 2010 2019 1980–1990 1990–2000 2000–2010 2010–2019
Rockford Boone 23,672 29,662 36,299 36,504 44,420 2.3% 2.0% 0.1% 2.2%
Core Cook 28,303 35,188 44,959 46,131 58,766 2.2% 2.5% 0.3% 2.7%
Collar DeKalb 22,189 27,326 34,071 32,742 38,612 2.1% 2.2% -0.4% 1.9%
Core DuPage 33,248 44,139 60,818 55,321 68,664 2.9% 3.3% -0.9% 2.4%
Collar Kane 27,131 33,938 39,631 40,822 48,401 2.3% 1.6% 0.3% 1.9%
Core Lake 32,703 46,392 60,983 59,163 73,593 3.6% 2.8% -0.3% 2.5%
Rural Lee 21,166 25,864 30,422 34,476 39,302 2.0% 1.6% 1.3% 1.5%
Collar McHenry 27,609 35,206 43,299 43,503 53,152 2.5% 2.1% 0.1% 2.3%
Rural Ogle 21,006 26,958 33,857 36,964 43,320 2.5% 2.3% 0.9% 1.8%
Collar Will 25,330 30,489 38,834 41,444 50,069 1.9% 2.5% 0.7% 2.1%
Rockford Winnebago 25,023 30,015 35,185 35,202 40,986 1.8% 1.6% 0.0% 1.7%
Total 28,541 36,216 46,574 46,673 58,410 2.4% 2.6% 0.0% 2.5%
Illinois 26,536 33,185 42,396 43,981 53,565 2.3% 2.5% 0.4% 2.2% Source: Woods & Poole Economics Inc., Washington, D.C. Copyright 2020. Woods & Poole does not guarantee the accuracy of this data. The use of these data and the conclusion drawn from it are solely the responsibility of CDM Smith. a Compound annual growth rate (CAGR)

Chapter 3 Population & Economic Growth
3-5
Real personal per capita income grew between 2.0 percent and 2.5 percent for the state of Illinois for each decade, except the 2000–2010 decade, when the impacts of the Great Recession affected personal incomes in 2010. Per capita personal income growth in DuPage and Lake Counties outpaced the statewide rate in the 1980s, 1990s, and 2010s, and Cook County’s growth in the 2010s also exceeded the statewide rate. Per capita personal income growth in Winnebago and DeKalb Counties lagged the statewide rate in the 1980s, 1990s, and 2010s.
3.2.3 Subregional Development Trends The 11 Illinois counties served by the Illinois Tollway System have different levels of influence on the Tollway system. Cook, DuPage, and Lake are the three core counties of the Illinois Tollway System. All five routes travel though the core counties, and most toll revenue is generated within them.
The collar counties of DeKalb, Kane, McHenry, and Will are of increasing importance to Illinois Tollway traffic and revenue, because their population and employment growth rates exceed the regional average. The two counties of the Rockford metropolitan area (Winnebago and Boone) serve as a third subregion and have a distinct growth profile as a mature industrial subregion. Finally, the two rural counties of Lee and Ogle represent the fourth subregion. Figure 3-1 below illustrates the locations of these counties in the Illinois Tollway service area.
Figure 3-1. Illinois Tollway Service Area

Chapter 3 Population & Economic Growth
3-6
3.2.3.1 Core Counties Cook, DuPage, and Lake Counties make up the core Illinois Tollway counties, representing over three-quarters of the total population of the service area, as well as the areas from which most toll revenue and transactions are generated. The Tri-State Tollway (I-94/294) and IL 390 Tollway lie entirely within the core counties, and most of the Veterans Memorial Tollway (I-355) is also located within the core. The most heavily traveled segments of the remaining two facilities, the Jane Addams Memorial Tollway (I-90) and Reagan Memorial Tollway (I-88), are also located within the core. Employment and population growth in the core counties have the largest impact on overall transportation and revenues for the Tollway system.
Cook and DuPage Counties are both mature counties with leveled-off population growth. Lake County is somewhat later in its development relative to Cook and DuPage Counties. However, its higher growth began flattening between the 2000 and 2010 censuses. The subsequent section summarizes the population growth trend within each county.
Cook County: As the central county of the Chicago metropolitan area, Cook County is heavily urbanized with little land left for new development. As a result, Cook County’s population over the past four decades has been relatively stable, with a long-run average population of about 5.2 million. The county’s population declined modestly in the 1980s, grew in the 1990s to under 5.4 million, and declined again modestly in the 2000s. Between 2010 and 2019, the population has been relatively stable at under 5.2 million.
DuPage County: DuPage County grew rapidly between 1980 and 2000, gaining more than 120,000 residents each in the two decades, but its population has largely stabilized after 2000. Between 2000 and 2010, the population increased by about 12,000, and only an additional 6,000 residents were added between 2010 and 2019.
Lake County: Compared with the other two core counties, Lake County has more land available for new development, and its population grew at a relatively faster rate in the 1990s and 2000s, when it added more than 200,000 residents. However, like the other core counties, Lake County’s population was relatively stable during the 2010s.
The combined population of the core counties increased 7.3 percent in the period between 1980 and 2010, from 6.4 million to 6.8 million. Because of their large population bases, these three core counties accounted for approximately 35 percent of the absolute growth in population among the 11 Illinois counties in the Tollway service area during that period. The population of the core counties has been largely stable since 2010, like the larger Tollway service area.
Employment growth has occurred at a faster and sustained pace, increasing 26.4 percent, from 3.4 million to 4.3 million between 1980 and 2010. This represents over two-thirds of all job growth in the 11-county region during this period. In contrast to population trends, employment has continued to grow in the core counties since 2010, adding 572,000 jobs, or about 13.4 percent, to reach 4.9 million jobs in 2019. The three core counties represented 82.1 percent of job growth in the Tollway service area between 2010 and 2019.

Chapter 3 Population & Economic Growth
3-7
3.2.3.2 Collar Counties The collar counties—Will, Kane, McHenry, and DeKalb—lie just outside the ring of core counties surrounding Chicago. These counties contribute to trip generation for three facilities: the southern portion of the Veteran Memorial Tollway (I-355) is located in Will County, and segments of the western Jane Addams Memorial Tollway (I-90) and western Reagan Memorial Tollway (I-88) are located in Kane and DeKalb Counties. McHenry County also contributes to growth on the Jane Addams Tollway. While these counties do not represent the core of the Tollway service area, they have more developable land available for new development over the period of the 2050 forecast; as a result, the collar counties are expected to contribute to additional growth on the Tollway system.
Growth in these four collar counties was slower in the 1950–1990 period of suburbanization, when suburban Cook, DuPage, and Lake Counties were growing more rapidly. After 1990, however, growth in these four collar counties accelerated as available land for new development diminished in the core counties.
Will County: Will County is home to some of the older cities and towns in the Chicago area, including the historical satellite city of Joliet. It has experienced only recently rapid suburbanization and is one of the fastest growing counties in the United States. Growth was particularly large in the 1990s and 2000s, when the county’s population grew by more than 320,000 residents. While the core counties experienced little to no growth during the 2010s, Will County’s population grew at an annual average rate of 0.4 percent, adding over 13,000 residents. By 2019, Will County’s population had nearly matched Lake County’s population.
Kane County: Elgin and Aurora are major historical satellite cities in the Chicago region, and they are among the top 10 largest cities in Illinois. Because of its distance from the core of the Chicago region, Kane County grew more slowly than other counties during the early period of suburbanization. However, its growth was relatively high between 1990 and 2010, when almost 200,000 residents were added. Like Will County, Kane County’s population has continued to grow since 2010, and more than 17,000 residents were added between 2010 and 2019.
McHenry County: McHenry County’s population more than doubled between 1980 and 2010, growing to about 309,000 residents. About half of that growth occurred in the 1990s. Much of this growth was in and around the county’s older towns of Crystal Lake, Algonquin, and McHenry. In contrast to the larger collar counties of Will and Kane, McHenry County’s population remained relatively stable in the 2010s.
DeKalb County: The main city in DeKalb County, DeKalb, is home to Northern Illinois University. While much of the county remains rural in character, the population growth profile in the 1990s and 2000s was more like that of a suburban county in the “takeoff” period of growth. The population grew by about 27,000, or 35 percent, during those two decades. However, like McHenry County, DeKalb County’s population has been largely stable since 2010.

Chapter 3 Population & Economic Growth
3-8
Collectively, the four collar counties almost doubled in population between 1980 and 2010, from 825,000 to 1.6 million residents. This accounted for over 59 percent of all population growth in the 11-county region. Since 2010, the collar counties have grown by more than 29,000 residents, partially offsetting population losses elsewhere in the service area.
Employment grew at an even faster rate, 115.7 percent, during the same period, from about 327,000 jobs in 1980 to 706,000 jobs in 2010. Since 2010, the collar counties added almost 117,000 jobs, or 16.6 percent. The majority of that growth, almost 74,000 jobs, has occurred in Will County. The collar counties represent about 16.8 percent of new jobs added between 2010 and 2019 in the service area.
3.2.3.3 Rockford-Area Counties The Rockford MSA comprises Winnebago and Boone Counties. The only Tollway facility to pass through this area is the westernmost segment of the Jane Addams Memorial Tollway (I-90). As a result, employment and population growth in the Rockford area would largely impact one facility only.
The City of Rockford, located within Winnebago County, was the second largest city in Illinois throughout the twentieth century, but was overtaken by Aurora in the 2000 census. Like the collar counties, population growth in the Rockford area occurred in the 1990s and 2010s, but has since declined. Winnebago County’s population grew by over 42,000 residents, or 16.7 percent, between 1990 and 2010, and Boone County’s population grew by more than 23,000 residents. Together, the population of the Rockford-area counties declined by over 13,000 residents, or 3.8 percent, between 2010 and 2019, with Winnebago County representing the majority of the loss.
Winnebago County has far more employment than Boone County, representing 85–90 percent of the combined total, and its employment trends strongly influence overall trends for the Rockford-area counties. After strong employment growth in the 1980s and 1990s, when almost 50,000 jobs, or 34.1 percent, were added, employment contracted sharply in the 2000s. The Rockford area counties lost over 15,000 jobs, or 8.0 percent, during the decade, likely reflecting the impact of the Great Recession. From 2010 through 2019, the two counties had almost 8,300 jobs, partially offsetting job losses in the 2000s.
3.2.3.4 Rural Counties Lee and Ogle Counties lie at the western end of the Reagan Memorial Tollway (I-88). Both counties are largely rural in character and are expected to remain rural throughout the forecast period of 2050. As a result, growth in employment or population in these rural counties is expected to have little impact on the Tollway system’s transactions or revenue.
Lee County: Lee County’s population has been relatively stable, ranging between 34,000 and 37,000, since 1980. Similarly, its employment has also remained relatively stable, ranging between 16,000 and 18,000 during the same period.
Ogle County: In contrast, the population of Ogle County grew modestly in the 1990s and 2000s. During that period, it added almost 7,500 residents, or 16.4 percent. However, Ogle County’s population declined by over 2,800, or 5.3 percent, between 2010 and 2019.

Chapter 3 Population & Economic Growth
3-9
Employment grew in the 1990s, rising from more than 20,000 to over 25,000. However, employment has since declined to over 22,000 in 2019.
3.2.4 List of Major Regional Employers A review of the region’s major employers, both in terms of global employment and gross revenues, was conducted to identify the significance of their economic contribution to the Chicago area and Illinois. Table 3-5 lists some of the largest Fortune 500 employers located within the Chicago area, as reported in the magazine’s annual ranking in 2019. As illustrated in Figure 3-2, many of these employers are near the Illinois Tollway system. In particular, many headquarters are located along the Tri-State Tollway (I-94/I-294) in northern Cook County and southern Lake County, as well as in a second cluster along the Reagan Memorial Tollway (I-88) in DuPage County. Almost all major corporate headquarters in the Chicago region not located in the central business district are located near the Tollway.
Table 3-5. Fortune 500 Companies in the Chicago Metropolitan Area (2019)
ID Employer
Name Location
Fortune 500
Ranking Headquarters
Address Employees
(worldwide)
Gross Earnings
($ millions) Industry
Central Chicago
1 Boeing Chicago 28 100 N Riverside Plaza, Chicago, IL, 60606 153,000 $101,127 Aerospace and
Defense
2 ADM Chicago 49 77 W Wacker Dr, Chicago, IL, 60601 31,600 $64,341 Food production
3 United Airlines Chicago 78 233 S Wacker Dr,
Chicago, IL, 60606 92,000 $41,303 Airline
4 Exelon Chicago 93 10 S Dearborn St, Chase Tower, Chicago, IL, 60680
33,383 $35,985 Gas and Electric
5 McDonald's Chicago 149 1035 Randolph St, Chicago, IL, 60607 210,000 $21,025 Food Services
6 Jones Lang LaSalle Chicago 189 200 Randolph St,
Chicago, IL, 60601 90,000 $16,318 Commercial Real Estate
7 LAQ Chicago 262 500 W Madison St, Chicago, IL, 60661 51,000 $11,876 Wholesalers
8 Conagra Brands Chicago 386
222 W Merchandise Mart Plaza, Chicago, IL, 60654
12,400 $7,983 Food Consumer Products
9 R.R. Donnelley Chicago 445 111 S Wacker Dr, Chicago, IL, 60606 39,500 $6,800 Publishing, Printing
10 Northern Trust Chicago 453 50 S LaSalle St,
Chicago, IL, 60603 18,800 $6,658 Commercial Banks
11 Old Republic International Chicago 481 307 N Michigan Ave,
Chicago, IL, 60601 9,000 $6,021 Insurance
Other Chicago Metropolitan Area
12 Abbott Laboratories Lake Bluff 103 100 Abbott Park Rd,
Lake Bluff, IL, 60064 103,000 $30,578 Medical Products and Equipment
13 Ulta Beauty Bolingbrook 449 1000 Remington Blvd, Bolingbrook, IL, 60440 30,000 $6,716 Specialty Retailers
14 Walgreens Deerfield 17 200 Wilmot Rd, Deerfield, IL, 60015 299,000 $131,537 Food and Drug

Chapter 3 Population & Economic Growth
3-10
ID Employer
Name Location
Fortune 500
Ranking Headquarters
Address Employees
(worldwide)
Gross Earnings
($ millions) Industry
15 Caterpillar Deerfield 58 501 Lake Cook Rd, Deerfield, IL, 60015 104,000 $54,722 Construction and
Farm Machinery
16 Mondelez International Deerfield 116 3 Parkway N,
Deerfield, IL, 60015 80,000 $25,938 Food Consumer Products
17 Baxter International Deerfield 286 1 Baxter Way,
Deerfield, IL, 60015 50,000 $11,127 Medical Products and Equipment
18 Univar Downers Grove 353
3075 Highland Parkway, Downers Grove, IL, 60515
8,500 $8,632 Wholesalers
19 Dover Downers Grove 412
3005 Highland Parkway, Downers Grove, IL, 60515
24,000 $7,395 Industrial Machinery
20 Illinois Tool Works Glenview 214 3650 W Lake Ave,
Glenview, IL, 60026 48,000 $14,768 Industrial Machinery
21 Anixter International Glenview 364 2301 Patriot Blvd,
Glenview, IL, 60015 9,300 $8,400 Wholesalers
22 Tenneco Lake Forest 267 500 N Field Dr, Lake Forest, IL, 60045 81,000 $11,763 Motor Vehicle and
Parts
23 W.W. Grainger Lake Forest 282 14441 IL 60,
Lake Forest, IL, 60045 23,850 $11,221 Wholesalers
24 Packaging Corp. of America
Lake Forest 432 1 N Field Ct, Lake Forest, IL, 60045 15,000 $7,014 Packaging,
Containers
25 CDW Lincolnshire 191 75 Tri State International, Lincolnshire, IL, 60069
9,019 $16,240 IT Services
26 Navistar International Lisle 308 2701 Navistar Dr,
Lisle, IL, 60532 13,100 $10,250 Construction and Farm Machinery
27 AbbVie North Chicago 96 1 Waukegan Rd,
North Chicago, IL, 60064 30,000 $32,753 Pharmaceuticals
28 Allstate Northbrook 82 3075 Sanders Rd, Northbrook, IL, 60062 45,420 $39,815 Insurance
29 TreeHouse Foods Oak Brook 489 2021 Spring Rd,
Oak Brook, IL,60523 12,700 $5,812 Food Consumer Products
30 Discover Financial Riverwoods 253 2500 Lake Cook Rd,
Riverwoods, IL, 60015 16,600 $12,848 Commercial Banks
31 Arthur J Gallagher
Rolling Meadows 435 2850 Golf Rd,Rolling
Meadows, IL, 60008 30,362 $6,934 Financials
32 US Foods Holding Rosemont 125 9399 W Higgins Rd,
Rosemont, IL, 60018 24,900 $24,175 Wholesalers
33 Motorola Solutions Schaumburg 416 1295 E Algonquin Rd,
Schaumburg, IL, 60196 16,000 $7,343 IT Equipment
34 Ingredion Westchester 486 5 Westbrook Corp Ctr, Westchester, IL, 60154 11,000 $5,841 Food Production
Other Illinois
35 State Farm Insurance Bloomington 36 1 State Farm Plaza,
Bloomington, IL, 61710 56,788 $81,732 Insurance
36 Deere Moline 87 1 John Deere Plaza, Moline, IL, 61265 74,413 $37,357 Construction and
Farm Machinery Source: Fortune Magazine, Fortune 500 Rankings: 2019 Rankings.

Chapter 3 Population & Economic Growth
3-11
Figure 3-2. Fortune 500 Companies Headquartered in the Chicago Metropolitan Area (2019), Gross Earnings ($ Millions)

Chapter 3 Population & Economic Growth
3-12
3.3 Socioeconomic Forecasts CDM Smith retained the services of Dr. Wies to develop an independent review of the Chicago Metropolitan Agency for Planning (CMAP) ON TO 2050 population and employment forecasts and to recommend adjustments. Regional population and employment data are inputs into travel demand model, which is used in developing traffic and toll revenue forecasts.
Following the independent review, Dr. Wies provided CDM Smith with an alternative socioeconomic forecast to ON TO 2050. His independent forecast is a policy-neutral scenario based primarily on observed development trends and land use patterns. Population and employment data were developed and submitted by traffic analysis subzones within the 21 counties represented in the travel demand model, in decade increments through the year 2050.
This section provides an overview of Dr. Wies’s methodology, a summary of his independent socio-economic forecast, and a comparison of that forecast to other industry benchmarks.
3.3.1 Forecasting Method In contrast to CMAP’s long-term socioeconomic forecasts, which are influenced by ON TO 2050 policy recommendations that support infill development and reinvestment in existing communities, Dr. Wies’s forecast is based primarily on a “carrying capacity” analysis. This approach identifies the amount of developable land available to be built out over the planning horizon, and it derives forecasts of potential population and employment in those areas based on existing land use patterns.
Specifically, developable land was identified using CMAP’s Land Use Inventory, which provides a parcel-level categorization of land uses. This approach also accounted for undevelopable land uses, including protected natural areas, wetlands, and floodplains, to ensure they were excluded from the carrying capacity analysis. Once the amount of developable land was established, the approach calculated the number of households and employment based on the prevailing density and land-use mix of neighboring areas.
Final forecasts based on carrying capacities then were distributed over the interim milestone years using an exponential interpolation function. This function was chosen because it allows uniform growth over time for subzones surrounded by uniform density (e.g., mature, built-out areas or rural areas), but the function delays growth in subzones surrounded by non-uniform density (e.g., exurban areas).
The carrying capacity approach was used only for the seven-county CMAP region of Cook, DuPage, Kane, Kendall, Lake, McHenry, and Will Counties in northeastern Illinois, due to the availability of detailed land use data.
For the remaining counties in the larger modeling region, Dr. Wies modified ON TO 2050 forecasts for those counties based on an average of forecasts from other sources, including local metropolitan planning organizations (MPOs) of record (including Northwestern Indiana Regional Planning Commission, Southeastern Wisconsin Regional Planning Commission, Region 1 Planning Council [formerly the Rockford Metropolitan Agency for Planning], and the Kankakee Area

Chapter 3 Population & Economic Growth
3-13
Transportation Study) and proprietary socioeconomic forecasts from independent sources such as Woods & Poole (W&P) and Moody’s Analytics.
3.3.2 Recommended Forecasts Dr. Wies’s socioeconomic forecasts are depicted in Table 3-6 and Table 3-7, first tabulated by county-level population and employment for each decade through 2050, followed by series of maps visualizing the compound average growth rates (CAGRs) over time.
Table 3-6. Recommended Population Forecast
POPULATION
County 2015 2020 2030 2040 2050 CAGR
2020–2050 CMAP Cook 5,148,908 5,189,941 5,273,467 5,359,026 5,446,731 0.2% Chicago 2,683,182 2,710,572 2,766,012 2,822,350 2,879,608 0.2% Suburban Cook 2,465,726 2,479,369 2,507,455 2,536,676 2,567,123 0.1% DuPage 921,429 924,403 930,561 937,016 943,793 0.1% Kane 524,753 538,749 568,598 601,233 637,099 0.6% Kendall 123,038 137,499 168,515 202,720 240,690 1.9% Lake 686,299 694,625 711,955 730,258 749,632 0.3% McHenry 305,787 320,549 351,897 385,957 423,119 0.9% Will 678,228 706,945 767,774 833,689 905,491 0.8% CMAP Total 8,388,442 8,512,710 8,772,766 9,049,899 9,346,557 0.3% EXTERNAL CMAP Illinois Boone 53,277 57,315 65,390 73,466 81,541 1.2% DeKalb 97,986 105,229 119,714 134,199 148,685 1.2% Grundy 50,251 54,914 64,239 73,564 82,890 1.4% Kankakee 105,739 110,419 119,779 129,139 138,499 0.8% LaSalle 107,028 108,789 112,310 115,831 119,352 0.3% Leea 3,658 3,708 3,809 3,909 4,010 0.3% Oglea 18,724 19,117 19,903 20,689 21,475 0.4% Winnebago 282,381 291,276 309,066 326,856 344,646 0.6% Indiana Lake 481,504 486,433 496,290 506,147 516,004 0.2% LaPorte 104,450 104,603 104,909 105,214 105,520 0.0% Porter 164,342 171,590 186,087 200,584 215,080 0.8% Wisconsin Kenosha 164,059 173,291 191,754 210,218 228,681 0.9% Racine 190,229 194,670 203,551 212,433 221,314 0.4% Walworth 100,217 104,515 113,110 121,705 130,300 0.7% External CMAP Total 1,923,845 1,985,867 2,109,910 2,233,953 2,357,997 0.6% Regional Total 10,312,287 10,498,577 10,882,676 11,283,853 11,704,553 0.4%
Source: Independent socioeconomic forecast provided by Dr. Wies. aForecast reflects the portion of the county in the travel demand modeling area only.

Chapter 3 Population & Economic Growth
3-14
Table 3-7. Recommended Employment Forecast
EMPLOYMENT
County 2015 2020 2030 2040 2050 CAGR
2020–2050 CMAP Cook 2,591,153 2,631,606 2,722,665 2,830,037 2,957,915 0.4% Chicago 1,377,466 1,410,580 1,484,564 1,570,773 1,671,962 0.6% Suburban Cook 1,213,687 1,221,026 1,238,101 1,259,265 1,285,953 0.2% DuPagea 615,430 620,470 631,495 644,001 658,326 0.2% Kane 210,578 216,163 236,776 262,263 294,694 1.0% Kendall 27,473 31,331 39,851 49,778 61,657 2.3% Lake 338,104 344,823 360,235 379,023 402,399 0.5% McHenry 98,158 101,678 115,263 131,323 150,789 1.3% Will 204,604 216,203 243,166 276,733 319,509 1.3% CMAP Total 4,085,500 4,162,275 4,349,451 4,573,157 4,845,289 0.5% EXTERNAL CMAP Illinois Boone 17,215 18,095 19,855 21,615 23,375 0.9% DeKalb 37,259 38,045 39,618 41,191 42,763 0.4% Grundy 18,632 19,160 20,215 21,270 22,325 0.5% Kankakee 42,985 43,952 45,887 47,822 49,757 0.4% LaSalle 43,412 43,622 44,042 44,463 44,883 0.1% Leeb 254 254 254 253 253 0.0% Ogleb 6,888 6,886 6,883 6,879 6,876 0.0% Winnebago 127,391 131,993 141,198 150,402 159,607 0.6% Indiana Lake 185,816 184,515 181,912 179,310 176,707 -0.1% LaPorte 40,463 41,306 42,992 44,679 46,365 0.4% Porter 58,731 60,439 63,854 67,269 70,684 0.5% Wisconsin Kenosha 59,214 62,781 69,915 77,049 84,183 1.0% Racine 73,731 76,670 82,548 88,426 94,304 0.7% Walworth 40,062 41,979 45,814 49,649 53,484 0.8% External CMAP Total 752,053 769,698 804,988 840,278 875,567 0.4% Regional Total 4,837,553 4,931,973 5,154,438 5,413,435 5,720,856 0.5%
Source: Independent socioeconomic forecast provided by Dr. Wies. a Three Traffic Analysis Zones (TAZ) covering the southwest portion of Chicago O’Hare International Airport are part of the
city of Chicago but located in DuPage County. Employment for these subzones is listed under DuPage County and not the city of Chicago in this table.
b Forecast reflects the portion of the county in the travel demand modeling area only.
Dr. Wies’s population forecasts for the 21-county modeling region increase from a 10.3 million baseline in 2015 to 11.7 million in 2050, corresponding to an average 0.4 percent annual growth rate. The seven-county core CMAP region is projected to increase in population at a slightly slower rate than the surrounding 14-county area in Illinois, Indiana, and Wisconsin, with 0.3 percent and 0.6 percent average annual growth rates, respectively. Cook County, including the city of Chicago and neighboring suburbs, is forecast to grow relatively slowest of the 21 counties

Chapter 3 Population & Economic Growth
3-15
in the modeling area, despite the largest absolute growth, due to its largest existing population base.
Dr. Wies’s employment forecast for the 21-county region increases from a 4.8 million base in 2015 to 5.7 million in 2050, which corresponds to an average annual growth of 0.5 percent. This rate is slightly higher than the population growth over the same time period. In contrast to population growth, employment in the seven-county core CMAP region is projected to increase slightly faster than the surrounding 14-county area, with 0.5 and 0.4 percent average annual growth rates, respectively.
Figure 3-3 and Figure 3-4 illustrate the spatial pattern of growth at a finer level of geographic detail. Across decades and for both population and employment, growth rates are consistently highest in the outer portions of the seven-county CMAP region. There, vacant and agricultural land is available for development, located near existing population and jobs centers in the Chicago region. In contrast, growth rates in the already-developed core of the region are very low, reflecting little available land to support new development. Outside of the CMAP region, growth rates are generally low across the board, ranging from very low growth in northwest Indiana, to low growth in rural areas of Illinois and the Rockford region, to slightly higher growth in southeast Wisconsin.
Figure 3-3. Population Annual Growth Rate, 2020–2050

Chapter 3 Population & Economic Growth
3-16
Figure 3-4. Employment Annual Growth Rate, 2020–2050
3.3.3 Comparison of Recommended Forecasts to Other Sources This section compares Dr. Wies’s socioeconomics with benchmark forecasts from a sample of public and private sector sources. Because of the availability of historical data, socioeconomic forecasts in this section are compared for a six-county core region, corresponding to the former Northeastern Illinois Planning Commission (NIPC) definition of Cook, DuPage, Kane, Lake, McHenry, and Will Counties. This type of comparison illustrates differing patterns and magnitudes of regional population and employment across forecasts.
As shown in Figure 3-5, the six-county Chicago metropolitan area slowly increased in population during the two decades from 1970 to 1990, accelerated in the 1990s, and slowed in the 2000s, plateauing to around 8.3 million in the 2010s. CMAP forecasts those six counties to increase in population to more than 10.5 million by 2050, at a pace unseen since the relatively high-growth 1990s. In contrast, Dr. Wies and independent private-sector forecasts from W&P and Moody’s Analytics all project a population growth rate below CMAP’s forecasts. Both W&P and Moody’s Analytics downwardly revised population forecasts in each subsequent annual release of their respective forecasts over the last few years, with Moody’s Analytics 2020 forecast projecting an actual decline in population through 2050. W&P projects a plateauing of population, especially

Chapter 3 Population & Economic Growth
3-17
after 2030. Dr. Wies’ forecasts are similar to the 2020 W&P forecast for the next decade, and the forecasts continue that general growth pattern through 2050.
Figure 3-5. Population Forecast Comparison
Employment forecasts typically follow either the U.S. Bureau of Labor Statistics’ (BLS) or U.S. Bureau of Economic Analysis’ (BEA) definition of employment. The BEA definition is more encompassing, which results in higher employment forecasts.4 The use of the two different definitions is apparent in Figure 3-6.
___________________________________
4 BLS data are derived from a business establishments survey and are generally less encompassing than BEA, as the data do not include agricultural workers, military, proprietors, household workers, and miscellaneous employment. BEA data represent a more encompassing measure of full-time and part-time workers.

Chapter 3 Population & Economic Growth
3-18
Figure 3-6. Employment Forecast Comparison
Unlike population in the six-county metropolitan area, employment is forecast to increase steadily throughout the 2050 forecasting horizon, according to each published source. W&P adheres to the BEA definition and forecasts a growth pattern in parallel with the growth observed between the last recession in 2007–2009 and the COVID-19 pandemic, increasing to about 7.3 million by 2050. Other sources adhere to the narrower BLS definition and generally forecast slightly decelerated growth rates through 2050 relative to W&P. Moody’s Analytics, obtained in mid-2020, in the early COVID-19 time frame, forecasts an employment dip and rebound in the next five years, followed by steady growth to about 4.7 million in 2050. Dr. Wies’s employment forecast results in a similar 2050 level of employment, at 4.8 million, from a slightly lower base in 2020. CMAP’s employment forecast generally parallels Dr. Wies’s but is generally 100,000 to 150,000 higher in each year.
4BLS data are derived from a business establishment survey and are generally less encompassing than BEA, because the data do not include agricultural workers, military, proprietors, household workers, and miscellaneous employment. BEA data represent a more encompassing measure of full-time and part-time workers.

4-1
Chapter 4 Transactions & Revenue Approach
This chapter summarizes the traffic and revenue analysis conducted for the Illinois Tollway. It presents an overview of the travel demand modeling process and describes the primary inputs to the model, key components of the model structure, and the base-year trip table calibration process.
4.1 Overview of Travel Demand Model CDM Smith has developed and maintains a purpose-built regional travel demand model called Tollway 2050. This model is the basis for all travel demand modeling and analyses CDM Smith conducts on behalf of the Illinois Tollway. Although based on CMAP’s ON TO 2050 regional model, this customized iteration has undergone extensive network revision and calibration to speed and volumes for each time period.
Prior to the tolling analyses, the model was calibrated using 2017 traffic counts and toll transaction data, with specific attention given to Illinois Tollway corridors to ensure the model reasonably reflects current conditions. Data from 2017 were used due to the impact of substantial construction activity on the Tollway system in 2018 and 2019 and the impacts of the COVID-19 pandemic on travel in 2020. Trip tables were adjusted extensively, and networks were checked and updated to include projects critical to the Illinois Tollway system. In addition, CDM Smith made updates to reflect travel time reliability and traffic congestion.
The calibration effects were applied to future-year conditions for milestone years of 2020, 2030, 2040, and 2050. In addition, a range of future-year network scenarios were analyzed for 2025 and 2030 to assess the impact of major capacity expansion projects included in the Tollway’s Move Illinois program. Each future-year network was reviewed for consistency, inclusion, and proper coding of programmed transportation improvements. Official documentation of planned transportation network improvements and schedule were used to develop highway networks representative of year-by-year construction progress. An overview of the Move Illinois program can be found in Chapter 1, while specific program details—including dates and project attributes—can be found under the assumptions listed in Chapter 5.
4.2 Model Inputs This section describes the primary inputs and assumptions used in the travel demand model’s calculations, including trip tables, traffic analysis zones, highway networks, time periods, value of time (VOT), and vehicle operating costs (VOCs).
4.2.1 Trip Tables Trip tables summarize the origins and destinations of trips by geographic locations, called traffic analysis zones (TAZ, see Section 4.2.2 for a description of TAZs), for each model year. They rely on forecasts of future growth in population and employment, as well as assumptions about trip-making behavior, to estimate the number of trips produced from and attracted to each TAZ.

Chapter 4 Transactions & Revenue Approach
4-2
As described in Chapter 3, CDM Smith received an independent socioeconomic forecast. The growth in population and employment in that data set was translated to trip generation and trip distribution using the customized model to update the CMAP ON TO 2050 trip tables. CDM Smith borrowed CMAP’s trip generation data but converted trip distribution in the Cube platform to complete the trip table updates. CDM Smith relied on assumptions from CMAP’s ON TO 2050 model, such as special trip types, transit trips, and auto occupancy, as well as technical documentation on CMAP’s methodology, to replicate CMAP’s work to the greatest extent possible. Only items that CMAP scripted in other software unavailable to CDM Smith were redeveloped in either Cube or Python. The trip tables resulting from the trip generation and trip distribution processes were compared to CMAP’s ON TO 2050 trip tables to ensure that the impact of the independent socioeconomic forecast on final daily trips was reasonable.
4.2.2 Traffic Analysis Zones For analytical purposes, travel demand models divide a large region into small areas of relatively homogenous characteristics, called TAZs. TAZs are the primary geographic unit of analysis used in the travel demand model. CDM Smith relied on the CMAP ON TO 2050 TAZ network, which was updated in 2019 from a total of 1,961 zones to 3,649 TAZs, providing a greater level of geographic detail. The current 3,649 zones include 17 external TAZs and 3,632 internal TAZs across a 21-county modeling area spanning northern Illinois, northwestern Indiana, and southeastern Wisconsin (see Figure 4-1).
Figure 4-1. Former and Current Traffic Analysis Zone Networks in the Modeling Region
4.2.3 Highway Network The model relies on a highway network to determine the routing of trips between origins and destinations. The highway network includes numerous attribute fields, such as distance, capacity, and speed limits, which are used in the routing calculations. CMAP publishes highway networks for 2015, 2020, 2030, 2040, and 2050, which were used as the primary input for the model’s highway networks.

Chapter 4 Transactions & Revenue Approach
4-3
CDM Smith performed extensive network revisions and validation on the CMAP highway networks to include the fields necessary to perform toll diversion calculations. These revisions, which form the basis of toll transaction and revenue (T&R) forecasts, allow the model to better represent traffic movements on the Illinois Tollway system than the CMAP ON TO 2050 model.
In developing the highway networks, all the important link parameters inherited from the CMAP model, such as speed, capacity, number of lanes, and volume-delay function designations, were refined. CDM Smith also performed a review of regional transportation planning documents to ensure that the projects programmed in the long-range plan were included in the appropriate highway networks. Specific network improvements are discussed in detail in Chapter 5. Figure 4-2 portrays the overall extent of the highway network in the 2050 model year.
Figure 4-2. Highway Network in Model
4.2.4 Time Periods To better represent variations between time periods within a day, the CMAP model divides daily trips into eight time periods, shown in Figure 4-3. Trips within each time period are further divided into four vehicle classes: PCs and three CV categories (light, medium, and heavy vehicles). The CMAP overnight time period (8:00 p.m. to 6:00 a.m.) does not match the Illinois Tollway’s overnight CV toll rate discount period (10:00 p.m. to 6:00 a.m.). Long-term traffic and revenue forecasts are based on average daily traffic (ADT), so this difference in time periods is not

Chapter 4 Transactions & Revenue Approach
4-4
material; for other modeling applications, the difference in time periods is dealt with via post-processing.
Figure 4-3. Chicago Metropolitan Agency for Planning Modeling Time Periods
4.2.5 Value of Time VOT is an important variable in the analysis of toll projects, which indicates the driver’s willingness to pay in exchange for travel-time savings. Different methods were used to calculate the VOTs for PCs and CVs.
4.2.5.1 Passenger Car Value of Time For PC drivers, the VOT is a function of the purpose of the trip, the time of day (e.g., peak versus off-peak), and the income of the driver. To develop VOT for the PC travelers in the study region, CDM Smith developed individual VOT estimates for each TAZ. The methodology involved using U.S. Census Bureau data to estimate wages per minute worked. Median household income was divided by the average number of hours worked per household and converted from dollars per hour to dollars per minute. The wage per minute was further adjusted by the share of different trip purposes (i.e., work commute trips, business trips, and other trips) at different time periods (i.e., peak, off-peak, and nighttime). A “perception weighting factor,” reflecting travelers’ VOT for those activities relative to their hourly wages, also was considered in the process. That calculation resulted in tract-level VOT estimates for the peak, off-peak, and nighttime periods. These tract-level VOT data then were converted to the TAZ level.
Table 4-1 shows the region-wide average PC VOTs by time period, calculated in 2017 dollars. Although the model utilized the TAZ-level VOTs, the regional VOTs provide an overall image of the VOT in the study area. CDM Smith has assumed that PC VOT will increase with historical consumer price index (CPI) up to 2020, and then it will inflate by 2.0 percent annually throughout the forecast period. This assumption of 2.0 percent is based on historical inflation rates experienced over the past 20 to 30 years, and it is the inflation target typically adopted by the Federal Reserve System.
Table 4-1. Passenger Car Value of Time by Time Period (2017 Dollars/Minute)
Time Period VOT Morning and Evening Peak Periodsa $0.24
Off-Peak Periods $0.23
Nighttime Period $0.20 a Includes pre-peak and post-peak periods

Chapter 4 Transactions & Revenue Approach
4-5
The VOT for CVs was determined using a Monte Carlo simulation conducted for CDM Smith’s previous investment-grade study for the Illinois Tollway, completed in 2012. At that time, CDM Smith conducted an extensive review of published literature on CV VOT. From this review, four criteria stood out as important determinants of CV VOT. These four criteria, and the range of choices within each criterion, are shown in Table 4-2. The table also shows the market share of each choice within each of the four criteria. These values were obtained from the 2007 Commodity Flow Survey prepared by the United States Department of Transportation’s Research and Innovative Technology Administration and the Census Bureau. The last two columns of the table indicate the average VOT and standard deviation among sources for each of the four criteria. As the table illustrates, the standard deviations are high, generally exceeding the average value themselves. This implies high variability among the sources. For this reason, it was not sufficient to simply use the average values.
Table 4-2. Commercial Vehicle Value of Time Criteria (2012 Dollars/Minute)
Criteria Choices Market Share Average VOT Standard Deviation
1. Type of Ownership Private 21% $0.87 $0.51
For-Hire 79% $1.20 $0.67 2. Length of Haul Very Short (<50 miles) 10% $0.47 $0.66
Short (50–100 miles) 7% $0.61 $0.86
Medium (100–250 miles) 15% $0.91 $1.27
Very Long (250+ miles) 68% $1.12 $1.57 3. Type of Load Homogeneous 50% $0.57 $0.92
Heterogeneous 50% $0.51 $0.57 4. Value of Cargo Low Value 75% $0.66 $0.92
High Value 25% $0.94 $1.32
Monte Carlo simulation of the aforementioned parameters was used to determine VOT for CVs. There are 32 different permutations on CV trips using the choices available in Table 4-2, and the share of each permutation is decided by the market share. Assuming VOTs follow a lognormal distribution, the mean and standard deviations shown in Table 4-2 are used to sample VOTs for each possible combination of choices decided by market share. To ensure that each of these 32 CV trip types had at least 100 samples, a total of 4,000 samples were drawn to estimate the median VOT for CVs.
Table 4-3 shows the median VOTs for light, medium, and heavy vehicles obtained from the Monte Carlo simulations and used in the toll diversion model. These VOTs were simply grown from the values previously used in the 2012 investment-grade study using CPI. As with the PC VOTs, CDM Smith has assumed CV VOT will increase with historical CPI up to 2020 and inflate by 2.0 percent per year throughout the forecast period.
Table 4-3. Commercial Vehicle Median Value of Time by Vehicle Type (2017 Dollars/Minute)
Commercial Vehicle Type Illinois Tollway Rate Tier VOT Small 2a $0.63 Medium 3b $0.74 Large 4c $0.74
a Single-unit truck or tractor, buses, two axles, six tires. b Trucks with three or four axles, buses, and Class 1 vehicles with a one- or two-axle trailer. c Trucks with five or six axles, miscellaneous PC special, or unusual vehicles not classified in Tiers 1, 2, or 3.

Chapter 4 Transactions & Revenue Approach
4-6
4.2.6 Vehicle Operating Costs VOC is a cost parameter used in the model similar to VOT, except VOC is priced in units of distance (cents per mile) rather than time (cents per minute). The VOC includes ownership costs, such as vehicle maintenance and tires, but the primary cost component is fuel, which is dependent upon the average fuel efficiency of vehicles currently driven. This forecast relies on conservative assumptions, which consider operating costs for internal combustion engine vehicles only. The following assumptions were made in calculating VOCs for the Illinois Tollway model:
Gasoline Prices: The average gasoline price for 2018 in the Chicago area was $2.91 per gallon. To estimate future fuel prices, CDM Smith obtained a national fuel price forecast from the U.S. Department of Energy through the year 2050 and applied the growth rates in the national forecast to the 2018 fuel price for the Chicago area.
Fuel Efficiency: For PCs, CDM Smith began with an estimate of fuel efficiency for 2017–2018 using the ratio of the assumed cost of gas and average gas costs provided by the American Automobile Association’s (AAA’s) annual “Your Driving Costs” brochure. From there, fuel efficiency was assumed to improve based on national Corporate Average Fuel Economy (CAFE) standards set by the National Highway Traffic Safety Administration for the 2019–2025 period for PCs and light trucks. For 2026 and beyond, fuel efficiency values were estimated to grow at half of the increase in CAFE standards over the previous 10 years. For CVs, fuel costs come from the U.S. Energy Information Administration’s projections in the Annual Energy Outlook 2019.
Maintenance, Repair, and Tire Cost: For PCs, CDM Smith based these costs on AAA’s annual cost-of-driving estimates. These estimates are provided for sedans and sport utility vehicle (SUV)/van types. The estimates were converted to estimates for PCs in the model based on the distribution of the respective vehicle types in the light vehicle fleet. The latter uses the 2017 National Household Travel’s estimates for Illinois. For CVs, operating costs were based on the American Transportation Research Institute’s “An Analysis of the Operational Costs of Trucking” released in September 2015. Values were grown using the Chicago area CPI. For PCs and CVs, CDM Smith assumed vehicle maintenance costs will increase in line with inflation.
Table 4-4 shows the VOC by vehicle type in nominal dollars.
Table 4-4. Vehicle Operation Costs by Vehicle Type and Year (Nominal Dollars per Mile)
Year Rate Tier 1a Rate Tier 2b Rate Tier 3c Rate Tier 4d
Passenger Cars Small Trucks Medium Trucks Heavy Trucks 2017 $0.19 $0.41 $0.53 $0.63 2020 $0.22 $0.46 $0.60 $0.71 2025 $0.22 $0.51 $0.65 $0.79 2030 $0.24 $0.57 $0.71 $0.87 2040 $0.29 $0.70 $0.83 $1.04 2050 $0.35 $0.86 $1.02 $1.27
a Automobile, motorcycle, single-unit truck or tractor, two axles, four or fewer tires b Single-unit truck or tractor, buses, two axles, six tires. c Trucks with three or four axles, buses, and Class 1 vehicles with a one- or two-axle trailer. d Trucks with five or six axles, miscellaneous PC special, or unusual vehicles not classified in Tiers 1, 2, or 3.

Chapter 4 Transactions & Revenue Approach
4-7
4.3 Toll Diversion Algorithm A core component of CDM Smith’s travel demand model is its use of a toll diversion algorithm. Toll diversion algorithms compare two alternative paths for each zone-to-zone travel movement, one using the toll road and an alternate using the best non-tolled route.
To estimate the share of traffic using tolled and untolled paths, CDM Smith developed a cost per minute saved (CPMS) toll diversion curve for the Tollway model. The basic CPMS approach computes the travel time savings of the tolled route over the untolled route, and then divides the toll charge by the number of minutes saved. This toll CPMS is then compared to the distribution of values of travel time. The proportion of the population with a VOT equal to or higher than the CPMS would be expected to select the toll path.
The basic CPMS approach is modified further in the Tollway model to account for the impact of travel distance. It is assumed that drivers are not sensitive to small differences in travel distance between a tolled path and an untolled path. However, once the differences in travel distances become more than 3 miles, it is assumed drivers will start considering the cost differential in their routing choice.
In addition to the use of the modified CPMS diversion method, the following three additional improvements were applied to enhance the toll diversion algorithm:
Queue accumulation to reflect congested travel time. The free expressways connecting to the Chicago urban core, including I-290, I-90, I-94, and I-57, experience significant congestion. Customized volume-delay functions were developed to reflect congestion using the 2019 INRIX speed data.
Travel time reliability. Travel time on arterials and congested untolled highways are less reliable than Tollway corridors due to factors such as accidents, signal delay, or driving conditions at night. INRIX speed data were used to estimate the travel time variation as a representation of travel reliability. Higher variation reflects less reliable travel times.
VOC on arterial roadways. Operating cost on arterials is higher than on expressways because of lower posted speeds and the presence of signals. To account for this difference, the model uses an assumption that VOC on arterials is 30 percent higher than expressways.
4.4 Base-Year Trip Table Calibration To ensure that the model represents base-year traffic patterns, the base-year trip tables were calibrated to the observed 2017 traffic volumes for each time period by PC and CV. The following sections describe the results of this calibration at screenline locations throughout the modeling region, as well as at the Tollway’s plazas. Screenlines represent a summary of total traffic crossing an illustrative boundary line across multiple facilities.
4.4.1 Screenline Volume Calibration Results Figure 4-4 shows the locations of the 30 traffic volume screenlines used to calibrate the base-year trip tables. Screenlines are located throughout the modeling region, with the largest number located in the core of the Tollway service area. Observed traffic volumes were assembled from

Chapter 4 Transactions & Revenue Approach
4-8
various sources, including the Federal Highway Administration’s Highway Performance Monitoring System and Tollway plaza transaction data.
Figure 4-4. Location of Screenlines
While each time period was calibrated separately, Table 4-5 presents a daily summary of actual and model-assigned average weekday daily traffic (AWDT) volumes along these screenlines. Across screenlines, the total modeled AWDT was 1.1 percent higher than the actual counts. The average difference for screenlines was 1.2 percent, although they ranged from as little as a -0.1-percent difference (Screenline M) to as high as a 16.4-percent difference (Screenline AD). Screenlines with the largest variances tended to be located toward the edge of the modeling area.

Chapter 4 Transactions & Revenue Approach
4-9
Table 4-5. Screenline Traffic Volume Comparisons
Screenline Model AWDT Count AWDT Percent Difference A 1,641,822 1,638,672 0.2%
B 1,401,638 1,357,852 3.2%
C 1,235,053 1,217,929 1.4%
D 708,077 709,496 -0.2%
E 176,386 178,990 -1.5%
F 146,083 141,880 3.0%
G 121,252 129,332 -6.2%
H 388,297 390,201 -0.5%
I 322,514 306,219 5.3%
J 555,705 546,965 1.6%
K 464,275 459,666 1.0%
L 1,249,787 1,218,305 2.6%
M 647,949 648,782 -0.1%
N 1,173,189 1,162,111 1.0%
O 495,879 495,067 0.2%
P 349,847 348,736 0.3%
Q 690,246 681,227 1.3%
R 794,924 785,278 1.2%
S 306,258 310,267 -1.3%
T 93,370 90,633 3.0%
U 223,251 219,041 1.9%
V 182,522 183,938 -0.8%
W 165,717 154,379 7.3%
X 280,979 294,923 -4.7%
Y 158,743 155,935 1.8%
Z 11,925 11,416 4.5%
AA 40,412 36,200 11.6%
AB 25,109 27,101 -7.4%
AC 189,846 214,488 -11.5%
AD 182,384 156,682 16.4%
Total 14,423,439 14,271,711 1.1%
Figure 4-5 shows a scatterplot of the actual and modeled traffic volumes for the almost 800 count stations included in the 30 screenlines. Overall, the model calibration results in a close relationship between the two, with an R-squared value over 0.99.

Chapter 4 Transactions & Revenue Approach
4-10
Figure 4-5. Screenline Calibration Results Actual vs. Modeled Traffic Volumes
4.4.2 Mainline Plaza Calibration Transaction data were obtained for all toll plazas on the Illinois Tollway system. Comprehensive data are available for all hours in the year, by direction, vehicle payment tier, and payment method (cash or I-PASS). The toll plaza links were calibrated for each modeling time period and vehicle type.
Plaza-level results of the calibration are shown in Table 4-6. The calibrated model-assigned volumes were generally within 5.0 percent of actual AWDT volumes for mainline plazas across the daily, morning peak, and evening peak periods. The overall assignment across mainline plazas was within 1.0 percent across time periods. Plazas where deviation from counts was observed were adjusted for in the model post-processing stage to address the potential for over- or under-assignment of total traffic demand.

Chapter 4 Transactions & Revenue Approach
4-11
Table 4-6. Toll Plaza Calibration, Actual vs. Modeled Volumes
DAILY MORNING PEAK EVENING PEAK
Route Toll Plaza Plaza
Number Model
Assignment Actual
Transactions Percent
Difference Model
Assignment Actual
Transactions Percent
Difference Model
Assignment Actual
Transactions Percent
Difference
I-90 South Beloit 1 52,274 55,982 -6.6% 5,823 5,960 -2.3% 7,540 8,222 -8.3%
I-90 Belvidere 5 21,968 22,082 -0.5% 2,309 2,287 0.9% 3,026 3,163 -4.3%
I-90 Marengo 7 23,204 24,094 -3.7% 2,752 2,759 -0.3% 2,891 3,015 -4.1%
I-90 Elgin 9 101,080 99,202 1.9% 13,112 12,939 1.3% 15,175 14,950 1.5%
I-90 Devon Avenue 17 94,108 94,828 -0.8% 11,925 11,895 0.3% 14,250 14,369 -0.8%
I-90 River Road 19 65,971 62,218 6.0% 8,909 7,945 12.1% 7,268 6,332 14.8%
I-94 Waukegan 21 78,457 80,739 -2.8% 9,576 9,628 -0.5% 10,945 11,488 -4.7%
I-94 Edens Spur 24 58,035 60,404 -3.9% 8,834 9,231 -4.3% 8,221 8,839 -7.0%
I-294 Touhy Avenue 29 107,269 108,042 -0.7% 15,780 16,350 -3.5% 14,971 15,186 -1.4%
I-294 Irving Park Road 33 119,637 117,563 1.8% 16,002 15,705 1.9% 16,090 15,124 6.4%
I-294 Cermak Road 35 164,308 164,609 -0.2% 19,577 19,802 -1.1% 19,636 19,604 0.2%
I-294 82nd Street 36 90,935 91,717 -0.9% 9,884 10,035 -1.5% 14,577 14,502 0.5%
I-294 83rd Street 39 89,363 88,685 0.8% 11,808 11,586 1.9% 10,526 10,707 -1.7%
I-294 163rd Street 41 115,103 115,664 -0.5% 13,425 13,256 1.3% 15,429 15,335 0.6%
I-88 York Road 51 100,214 99,175 1.0% 14,896 14,510 2.7% 14,537 14,094 3.1%
I-88 Meyers Road 52 97,570 97,265 0.3% 15,802 14,676 7.7% 12,702 12,964 -2.0%
I-88 Aurora 61 91,091 93,614 -2.7% 12,546 12,752 -1.6% 14,760 15,209 -2.9%
I-88 DeKalb 66 19,659 21,165 -7.1% 2,053 2,285 -10.2% 2,691 2,992 -10.0%
I-88 Dixon 69 14,080 14,935 -5.7% 1,318 1,445 -8.8% 1,856 2,033 -8.7%
I-355 Army Trail Road 73 126,525 129,871 -2.6% 19,463 20,313 -4.2% 19,787 20,640 -4.1%
I-355 Boughton Road 89 141,051 141,800 -0.5% 19,253 18,959 1.6% 22,288 22,946 -2.9%
I-355 Spring Creek 99 59,819 66,280 -9.7% 8,820 10,120 -12.8% 9,308 10,636 -12.5%
IL 390 Lively Boulevard 320 15,370 13,736 11.9% 2,582 2,063 25.2% 2,836 2,432 16.6%
IL 390 Mittel Drive 322 29,130 25,504 14.2% 4,625 4,013 15.3% 5,092 4,403 15.7%
IL 390 Hamilton Lakes Drive 324 27,931 27,457 1.7% 4,637 4,169 11.2% 5,205 4,793 8.6%

Chapter 4 Transactions & Revenue Approach
4-12
DAILY MORNING PEAK EVENING PEAK
Route Toll Plaza Plaza
Number Model
Assignment Actual
Transactions Percent
Difference Model
Assignment Actual
Transactions Percent
Difference Model
Assignment Actual
Transactions Percent
Difference
IL 390 Plum Grove Road 326 64,626 63,489 1.8% 9,706 9,750 -0.5% 10,665 10,667 0.0%
IL 390 Mitchell Boulevard 328 59,950 60,455 -0.8% 9,057 9,318 -2.8% 10,205 10,491 -2.7%
IL 390 Lake Street 330 31,570 31,555 0.0% 4,698 4,845 -3.0% 5,570 5,579 -0.2%
Total 2,060,298 2,072,130 -0.6% 279,172 278,596 0.2% 312,358 314,688 -0.7%

5-1
Chapter 5 Transactions & Revenue Forecast
CDM Smith has updated the annual transaction and toll revenue (T&R) forecasts for the Illinois Tollway system for the years 2021 through 2050 based on the following assumptions related to construction impacts, facility expansion, and toll collection. The assumptions are presented in the following four sections:
Basic Assumptions
Planned Transportation Improvements
Toll Rate Schedule
Future I-PASS Participation Rates
Next, the approach to traffic and revenue forecast calculations is presented after the discussion of assumptions. The section closes with the T&R forecast and a disclaimer statement.
5.1 Basic Assumptions Traffic and toll revenue forecasts for the Illinois Tollway system are based on the following assumptions:
Tolls will continue to be collected under the rate structure currently in effect.
Cash is no longer collected on the Illinois Tollway. Current methods of payment via transponder, Pay By Plate, or mailed invoice will remain in place throughout the life of the forecast.
Move Illinois will be implemented as scheduled. Major elements of the improvement program are shown with the assumed construction schedule in the Planned Transportation Improvements section of this report.
Non-Illinois Tollway regional transportation network improvements will be implemented in accordance with the schedule shown in the Planned Transportation Improvements section of this report. No significant capacity will be added to the competing highway or transit systems beyond those improvements already programmed.
Motor fuel will remain in adequate supply and future increases in fuel prices will not substantially exceed the overall rate of inflation over the long term. Average fuel efficiency will not dramatically increase during this period.
No local, regional, or national emergency will arise that will restrict use of motor vehicles.
Economic growth and development will occur generally, as presented previously in this report, and as implemented in the Illinois Tollway travel demand models.
No major recession or significant economic restructuring will occur that would substantially reduce traffic in the region, other than the potential economic impacts described in this report related to the COVID-19 pandemic.

Chapter 5 Transactions & Revenue Forecast
5-2
The COVID-19 pandemic’s impact on traffic and revenue performance is assumed to be largely resolved by Spring 2022 with lingering economic impacts.
The long-term impacts of the COVID-19 pandemic on travel habits, land use, and other factors that affect the historical demand profile for the region are unknown at this time. The CDM Smith base-case forecast reflects the impacts of the current pandemic, with no adjustments made for long-term travel patterns.
Any significant departure from the aforementioned basic assumptions could materially affect the forecasts for traffic and gross toll revenue on the Illinois Tollway system presented in this report.
The widespread adoption of social distancing measures during the COVID-19 pandemic is expected to contribute to long-term changes in passenger car travel behavior, due to higher rates of telecommuting in the future and delayed overall traffic growth. These impacts are assumed to dampen passenger traffic volumes in the second half of 2022 by approximately 6.7 percent. In total, passenger car transaction volumes are expected to be slightly below 2019 volumes in 2022 (0.3 percent below). Beyond 2022, growth rates are expected to remain similar to previous expectations.
In contrast, the COVID-19 pandemic is not expected to have a lasting effect on commercial vehicle traffic. Following unusually high truck traffic in late 2020 and 2021 to date, due to a shift in personal consumption from services to goods during the pandemic, commercial vehicle levels are expected to return to previously expected levels by the second quarter of 2022. Beyond 2022, commercial vehicles are expected to grow in line with previous expectations.
5.2 Planned Transportation Improvements Over time, assumptions of future improvements to the regional highway network impact the distribution of capacity and, correspondingly, affect routing decisions for trips in the travel demand model. This section describes the assumptions for future transportation improvements used in the development of the traffic and revenue forecast. The major transportation investments listed in this sub-section are reflected in the model’s highway network and are current as of the time of publication.
5.2.1 Illinois Tollway Projects Over the next six years, under the Move Illinois program, two significant improvement projects are planned: the completion of the IL 390 and I-490 Tollways, and the Central Tri-State (I-294) reconstruction and widening.
Future construction and expansion projects, planned for the existing system of the Illinois Tollway and assumed to impact T&R, are shown in Table 5-1. Major expansion projects include the I-490 Tollway, phase 2 of the new Tri-State Tollway (I-294)/I-57 Interchange Project, the widening and reconstruction of the Central Tri-State, new I-294 northbound exit and entrance ramps at Archer Avenue/Cork Avenue, and a new I-294 southbound exit ramp at County Line Road/U.S. Route 20/Illinois Route 64. In addition to expansion projects, several planned construction projects are assumed to impact T&R. Significant construction impacts are also expected to occur between 2021 and 2026 as a result of the rehabilitation work on the Reagan Memorial Tollway (I-88) and the I-294 reconstruction and widening.

Chapter 5 Transactions & Revenue Forecast
5-3
Table 5-1. Planned Transportation Improvements—Illinois Tollway
Route Type of Improvement Project Details
Limits
2021
2022
2023
2024
2025
2026
2027
From To
I-94 Bridge Rehabilitation Stearns School Road Bridge - -
I-94 Rehabilitation Pavement and Structural Rehabilitation, 6.6 miles
Atkinson Road
Half Day Road
I-294 Reconstruction Reconstruct BNSF Bridge over Tollway - -
I-294 Bridge Rehabilitation Archer Avenue Bridge - -
I-294 Interchange construction
Completion of I-294 interchange with I-57 - -
I-294 Rehabilitation Rehab and widen 1.5 miles pavement Wolf Road O'Hare
Oasis
I-294 Reconstruction Reconstruct and widen 2.5 miles pavement
Grand Avenue Wolf Road
I-294 Reconstruction Reconstruct and widen 1.5 miles pavement
St. Charles Rd
Grand Avenue
I-294 Reconstruction Reconstruct and widen existing 3 miles pavement
Cermak Mainline
St. Charles Rd
I-294 Reconstruction Reconstruct and widen existing 2 miles pavement Ogden Ave Cermak
Mainline
I-294 Reconstruction Reconstruct and widen existing 4.3 miles pavement
I-55 Ogden Ave
I-294 Reconstruction Reconstruct and widen mainline and bridge over I-55
MP 22.9 MP 24.0
I-294 Reconstruction Reconstruct and widen existing 2 miles pavement 75th Street I-55 Bridge
(MP 22.9)
I-294 Reconstruction Reconstruct and widen Mile-Long Bridge
La Grange Rd 75th Street
I-294 Reconstruction Reconstruct and widen existing 3.5 miles pavement
95th St La Grange Rd
I-294 Interchange construction
SB exit ramp to County Line Rd/US 20/IL 64 - -
I-294 Interchange construction
NB entrance ramp from Archer Avenue
I-88 Rehabilitation Rehabilitate existing 5.5 miles pavement Aurora Plaza IL 59
I-88 Bridge Rehabilitation Deerpath Road Bridge - -
I-88 Bridge Rehabilitation
Windsor Bridge over East-West Connector Ramps - -
I-90 Interchange construction
Full interchange at I-90 and I-490 - -
IL 390 Rehabilitation Structural Rehabilitation Lake Street Lively Boulevard

Chapter 5 Transactions & Revenue Forecast
5-4
Route Type of Improvement Project Details
Limits
2021
2022
2023
2024
2025
2026
2027
From To
I-490 New Tollway Construction
I-490 between Franklin Avenue and I-294 Franklin Ave I-294
IL 390 New Tollway Construction
Western Access Ramps between IL 390 and O'Hare Airport
- -
I-490 New Tollway Construction I-490 North Extension IL 390 I-90
IL 390/ I-490
New Tollway Construction
IL 390/I-490 Extension to IL 19 IL 83 IL 19
I-490 New Tollway Construction I-490 South Extension IL 19 Franklin Ave
Construction Impacts Opening Year
5.2.2 Other Agency Projects Considering off-system projects, CDM Smith reviewed the long-range transportation plans for the Illinois Department of Transportation and Wisconsin Department of Transportation to identify which projects will have a likely impact on the Illinois Tollway T&R. These projects are listed in Table 5-2. CDM Smith also reviewed the upcoming construction schedules for the Cook County Department of Transportation and Highways and the DuPage County Division of Transportation, as well as those for municipalities surrounding the IL 390 and I-490 projects. None of the planned county or municipal projects is expected to have a measurable effect on Illinois Tollway traffic demand or revenue.
Table 5-2. Planned Transportation Improvements—Other Agencies
State Opening Year Route Project Illinois 2023 I-90/I-94/I-290 Reconstruct Jane Byrne interchange
2025 IL 56 Add lanes between IL 53 and I-355
2030 I-55 Convert the inside shoulders to managed lanes between I-355 and I-90/94
Wisconsin 2022 I-39/90 Add one lane in both directions from Madison to Illinois State line
5.3 Toll Rate Schedule Assumptions of future toll rates are a critical input in developing long-term revenue forecasts. Not only are toll rates used to calculate revenue forecasts, they are also part of the cost functions used in the model to determine routing decisions for trips. Historic and current toll rates, as well as the Tollway’s overall toll structure, are discussed in greater detail in Section 1.6. This section discusses assumptions for future toll rates through the year 2050.
5.3.1 Passenger Car Toll Rates PC toll rates increased 88 percent on January 1, 2012, for both cash and I-PASS customers. No further toll rate increases for PCs are currently planned. Therefore, the PC toll rates are identical in all model years through 2050. A full toll rate schedule is provided in Appendix A.

Chapter 5 Transactions & Revenue Forecast
5-5
5.3.2 Commercial Vehicle Toll Rates In 2018, the toll rates for CVs—Rate Tiers 2, 3, and 4—began annual increases at the rate of inflation. Actual CV rates increased by 1.84, 2.25, 2.07, and 1.56 percent in 2018, 2019, 2020, and 2021, respectively. In 2022, commercial vehicle rates are set to increase by an additional 2.30 percent. For the purposes of this study, CDM Smith assumes CV toll rates will increase 2.0 percent per year between 2022 and 2050 and will take effect annually on January 1 of each year beginning January 1, 2023. The future-year inflation assumption of 2.0 percent is based on the long-run historical average. All future CV toll rates are assumed to be rounded to the nearest multiple of $0.05.
5.4 Future I-PASS Participation Rates As discussed in Chapter 1, recent growth in I-PASS participation rates can be attributed largely to the opening of new facilities and access points in high I-PASS participation areas. I-PASS participation at existing facilities has generally been trending toward flat or low growth. For this study, CDM Smith has assumed that the PC I-PASS participation rates will continue to remain flat, consistent with 2019 performance, at a plaza level, as shown in Table 5-3.
Table 5-3. Passenger Car I-PASS Rate Assumption
Year Systemwide Tolls Paid at I-PASS Rate 2021 88.7%
2022 89.4%
2023-2025 89.5%
2026 89.6%
2027 89.7%
2028-2050 89.8% Between 2021 and 2025, the proportion of PC transactions expected to be paid at the I-PASS rate is anticipated to remain flat at the 2019 rate of 89.5 percent. In 2026 and 2027, the I-PASS rate is expected to increase to 89.7 and 89.8 percent, respectively, following the completion of the I-490 Tollway and the Central Tri-State reconstruction and widening. It then is expected to remain at that rate through 2050.
Because CVs have no toll rate differential between cash and I-PASS on the Jane Addams Memorial (I-90), Tri-State (I-94/I-294/I-80), Reagan Memorial (I-88), and Veterans Memorial (I-355) Tollways, the I-PASS participation rate has no bearing on CV revenues for these routes. Therefore, no assumptions have been made about future CV I-PASS payment rates for these routes. CVs do have a toll rate differential between the non-I-PASS (i.e., Pay By Plate and invoicing rates) and I-PASS on the IL 390 Tollway. CDM Smith has assumed that the CV I-PASS rate on IL 390 will remain at the estimated 2018–2019 rate of 93.5 percent for all future-year forecasts. For I-490, CDM Smith assumes a slightly higher pay online rate of 95.0 percent.
Additionally, the Tollway announced on February 25, 2021, that the temporary suspension of cash collections initiated at the onset of the COVID-19 pandemic in March 2020 would be made permanent. This followed the launch of the TOLLING 2020 initiative on June 25, 2020, which established a new invoicing process to increase collection of unpaid tolls before nonpayment

Chapter 5 Transactions & Revenue Forecast
5-6
reaches the violation process. The TOLLING 2020 initiative also established a new Pay By Plate toll payment option, which began in late July 2020.
CDM Smith forecasts expected revenues, not collected revenues. The suspension of cash collections, as well as new toll payment options established under the TOLLING 2020 initiative, are not anticipated to impact expected revenue forecasts, but may impact collected revenues. CDM Smith’s forecast of expected revenue does not account for evaded tolls or recovery efforts, and so the TOLLING 2020 initiative does not impact our forecast. Please refer to the main body of the Official Statement, including the sub-sections “Toll Collections,” “Pro Forma Debt Service Coverage,” and “Certain Risk Factors,” for information on toll evasion and evasion recovery.
5.5 Revenue Estimation Approach The travel demand model output expresses traffic and revenue forecasts for a typical weekday, also referred to as average weekday traffic (AWDT). This does not take into account seasonal variations, recurring holidays, and weekend volumes. As such, an “annualization procedure” was used to convert the weekday values into annual traffic and revenue values. Annualization factors were calculated for each direction of each toll plaza (both mainline and ramp plazas). The factors were calculated separately for each of the four vehicle rate tiers: PCs, small trucks, medium trucks, and large trucks. The factors were calculated using Illinois Tollway 2019 transaction data. The following numbered list shows the steps required to calculate the plaza-level factors.
1. Calculate ratio between AWDT and average annual daily traffic (AADT):
a. Extract daily transactions at each plaza by direction and rate tier.
b. Obtain AADT volume by calculating average of all days of the year.
c. Obtain AWDT volume by calculating average of Monday through Friday transactions (excluding holidays that occur on a weekday).
d. Divide AWDT volume by the AADT volume.
2. Multiply AWDT-to-AADT ratio by 365 (or 366 for leap years) to obtain “annualization factor” by plaza, direction, and rate tier.
3. Multiply model output by “annualization factor” to obtain annual transactions.
5.6 Annual Transaction and Toll Revenue Forecasts Model runs were performed for milestone years 2020, 2030, 2040, and 2050. Transaction growth then was interpolated at a plaza level for all years in between. In addition, a series of 2025 model runs were conducted to analyze the impacts of the opening of major capital expansion projects included in the Move Illinois program between now and 2027. For that effort, model runs used a set of 2025 highway networks, providing a series of impacts that were applied based on the latest capital program schedule.

Chapter 5 Transactions & Revenue Forecast
5-7
Future-year traffic assignments were developed using the modeling approach detailed in Chapter 4, and in accordance with the assumptions listed previously in this chapter. The average weekday traffic and revenue forecasts produced by the toll diversion model were converted to annual values using the annualization procedure described in the previous sub-section.
Table 5-4 through Table 5-10 show annual T&R forecasts for each Illinois Tollway facility between 2021 and 2050. Each table provides T&R by PCs and CVs separately, as well as the total T&R. T&R are shown as annual totals, in thousands. Revenues are expected revenues, which do not account for evaded tolls or recovery efforts.
On a systemwide basis, annual toll transactions are expected to increase from approximately 939 million in 2021 to more than 1.39 billion in 2050, representing an average annual rate of growth of 1.4 percent per year. Expected toll revenue is forecasted to be $1.48 billion for 2021. This is forecasted to grow to $2.76 billion by 2050, at an average annual growth rate of 2.2 percent per year.
Figure 5-1 illustrates forecasted T&R from 2021 through 2050. In 2022, revenue is expected to increase by 3.9 percent as traffic volumes continue to recover from the impact of the pandemic. Between 2022 and 2027, average annual revenue growth is forecasted at 3.1 percent. Growth will be boosted by the completion of the I-490 Tollway in late 2026, as well as by the completion of the I-294 reconstruction and widening project in phases between 2022 and 2027. Beyond 2027, expected revenue is forecasted to grow at an average annual rate of 1.9 percent.
The share of revenue collected from CVs is forecast to increase over time because of the annual inflation-based toll rate adjustments. CV revenues are expected to consistently exceed PC revenues by 2024. The previous 2005 CV rate increase, 2012 PC rate increase, and 2015 through 2017 CV rate increases demonstrate that Illinois Tollway users have a relatively low sensitivity to toll rate increases. The year-over-year declines in transactions following these toll rate increases, if any, were minor and short-lived. One potential risk to the CV revenue forecast is if annual rate adjustments fall significantly below the assumed annual rate increase of 2.0 percent beyond 2021.

Chapter 5 Transactions & Revenue Forecast
5-8
Table 5-4. 2021–2050 Systemwide Total Transactions and Revenue (in Thousands, Revenue Shown in Nominal Dollars)
Year
Transactions Revenue Passenger
Cars Commercial
Vehicles Total Passenger
Cars Commercial
Vehicles Total
2021 810,256 128,749 939,005 709,592 771,398 1,480,990
2022 898,189 127,443 1,025,632 770,177 768,531 1,538,709
2023 920,427 127,852 1,048,279 786,414 785,990 1,572,405
2024 941,597 130,915 1,072,512 803,122 820,374 1,623,497
2025 948,612 131,821 1,080,434 808,856 843,471 1,652,327
2026 1,010,778 138,886 1,149,664 841,751 889,524 1,731,276
2027 1,046,604 144,573 1,191,178 862,476 928,345 1,790,821
2028 1,062,959 147,022 1,209,982 873,984 959,240 1,833,224
2029 1,069,122 147,938 1,217,060 878,646 984,137 1,862,783
2030 1,078,364 149,256 1,227,620 885,794 1,013,605 1,899,399
2031 1,087,091 150,487 1,237,578 892,693 1,042,235 1,934,928
2032 1,098,923 152,147 1,251,070 902,117 1,073,574 1,975,691
2033 1,104,756 152,987 1,257,743 906,652 1,102,891 2,009,543
2034 1,113,709 154,256 1,267,965 913,719 1,131,769 2,045,488
2035 1,122,782 155,537 1,278,320 920,870 1,165,480 2,086,350
2036 1,135,079 157,262 1,292,341 930,633 1,202,637 2,133,270
2037 1,141,297 158,140 1,299,436 935,425 1,231,269 2,166,694
2038 1,150,741 159,461 1,310,202 942,832 1,267,063 2,209,896
2039 1,160,314 160,795 1,321,109 950,328 1,301,550 2,251,878
2040 1,173,221 162,587 1,335,808 960,522 1,343,303 2,303,825
2041 1,174,359 163,405 1,337,764 961,330 1,376,035 2,337,365
2042 1,178,727 164,680 1,343,406 964,766 1,415,484 2,380,250
2043 1,183,119 165,967 1,349,086 968,220 1,454,430 2,422,650
2044 1,190,791 167,726 1,358,516 974,340 1,500,463 2,474,803
2045 1,191,980 168,581 1,360,561 975,184 1,536,998 2,512,182
2046 1,196,449 169,907 1,366,356 978,694 1,579,267 2,557,960
2047 1,200,943 171,247 1,372,190 982,222 1,624,031 2,606,253
2048 1,208,766 173,073 1,381,839 988,456 1,675,029 2,663,486
2049 1,210,010 173,967 1,383,977 989,337 1,715,639 2,704,976
2050 1,214,583 175,348 1,389,930 992,923 1,763,915 2,756,838

Chapter 5 Transactions & Revenue Forecast
5-9
Table 5-5. 2021–2050 Jane Addams Memorial Tollway (I-90) Transactions and Revenue (in Thousands, Revenue Shown in Nominal Dollars)
Year
Transactions Revenue Passenger
Cars Commercial
Vehicles Total Passenger
Cars Commercial
Vehicles Total
2021 185,673 26,554 212,227 150,420 171,641 322,061
2022 199,453 25,720 225,173 158,863 168,187 327,050
2023 201,016 25,915 226,930 159,388 172,556 331,944
2024 204,285 26,285 230,570 161,737 178,596 340,332
2025 205,932 26,367 232,299 163,070 182,915 345,985
2026 208,962 26,543 235,505 165,412 187,944 353,355
2027 212,063 26,345 238,409 167,198 190,735 357,933
2028 214,651 26,658 241,309 169,252 196,847 366,099
2029 216,088 26,829 242,917 170,386 202,258 372,643
2030 218,135 27,076 245,211 171,980 208,377 380,357
2031 219,925 27,303 247,227 173,443 214,370 387,813
2032 222,341 27,606 249,948 175,375 221,103 396,478
2033 223,463 27,762 251,224 176,315 227,187 403,502
2034 225,223 27,995 253,218 177,751 233,327 411,077
2035 227,015 28,230 255,245 179,205 240,359 419,565
2036 229,466 28,546 258,011 181,172 247,965 429,137
2037 230,695 28,708 259,403 182,174 254,230 436,404
2038 232,585 28,950 261,535 183,689 261,681 445,370
2039 234,507 29,195 263,702 185,224 268,948 454,171
2040 237,111 29,523 266,634 187,288 277,581 464,869
2041 237,570 29,686 267,257 187,694 284,670 472,364
2042 238,685 29,933 268,618 188,614 293,101 481,715
2043 239,806 30,183 269,989 189,539 301,438 490,977
2044 241,595 30,518 272,113 190,990 310,984 501,974
2045 242,071 30,690 272,761 191,408 318,998 510,406
2046 243,214 30,948 274,162 192,351 328,043 520,394
2047 244,365 31,209 275,574 193,300 337,555 530,855
2048 246,197 31,559 277,756 194,784 348,319 543,103
2049 246,690 31,740 278,430 195,216 357,332 552,548
2050 247,864 32,009 279,874 196,186 367,557 563,744

Chapter 5 Transactions & Revenue Forecast
5-10
Table 5-6. 2021–2050 Tri-State Tollway (I-94/294/80) Transactions and Revenue (in Thousands, Revenue Shown in Nominal Dollars)
Year
Transactions Revenue Passenger
Cars Commercial
Vehicles Total Passenger
Cars Commercial
Vehicles Total
2021 303,112 63,940 367,052 274,437 379,996 654,433
2022 337,242 64,516 401,758 299,904 386,502 686,406
2023 353,644 64,649 418,293 313,766 396,292 710,058
2024 367,511 66,802 434,313 325,045 417,234 742,279
2025 370,461 67,150 437,611 327,824 428,346 756,171
2026 387,258 70,392 457,650 340,608 457,239 797,846
2027 397,358 72,324 469,683 348,586 478,480 827,066
2028 401,246 72,995 474,241 351,967 492,286 844,253
2029 402,967 73,271 476,238 353,534 504,037 857,571
2030 405,811 73,749 479,561 356,038 518,607 874,645
2031 408,227 74,215 482,442 358,330 532,370 890,699
2032 411,786 74,889 486,675 361,583 547,510 909,092
2033 413,114 75,157 488,271 362,909 561,888 924,797
2034 415,587 75,633 491,220 365,237 575,432 940,669
2035 418,078 76,113 494,192 367,584 592,099 959,683
2036 421,742 76,806 498,548 370,960 610,252 981,212
2037 423,121 77,083 500,204 372,338 623,736 996,074
2038 425,672 77,573 503,246 374,744 641,078 1,015,822
2039 428,244 78,067 506,311 377,171 657,506 1,034,677
2040 432,016 78,780 510,796 380,653 677,717 1,058,370
2041 431,880 79,023 510,903 380,609 693,076 1,073,684
2042 432,929 79,484 512,413 381,605 712,012 1,093,618
2043 433,981 79,949 513,930 382,606 730,300 1,112,906
2044 436,230 80,637 516,867 384,657 752,324 1,136,981
2045 436,099 80,887 516,986 384,621 769,190 1,153,811
2046 437,163 81,361 518,524 385,635 789,003 1,174,639
2047 438,232 81,838 520,070 386,654 810,119 1,196,773
2048 440,509 82,544 523,052 388,734 834,258 1,222,992
2049 440,382 82,802 523,184 388,704 852,757 1,241,462
2050 441,463 83,288 524,752 389,683 875,468 1,265,150

Chapter 5 Transactions & Revenue Forecast
5-11
Table 5-7. 2021–2050 Reagan Memorial Tollway (I-88) Transactions and Revenue (in Thousands, Revenue Shown in Nominal Dollars)
Year
Transactions Revenue Passenger
Cars Commercial
Vehicles Total Passenger
Cars Commercial
Vehicles Total
2021 119,759 14,213 133,972 107,136 106,360 213,496
2022 136,236 13,819 150,055 118,235 103,772 222,007
2023 136,696 13,899 150,595 118,063 106,482 224,545
2024 138,212 14,158 152,370 119,225 110,568 229,793
2025 138,577 14,401 152,978 119,584 114,507 234,091
2026 141,532 14,913 156,445 122,018 120,234 242,252
2027 142,768 15,298 158,066 123,064 125,518 248,582
2028 143,906 15,510 159,416 124,089 129,790 253,879
2029 144,264 15,639 159,903 124,431 133,564 257,995
2030 145,021 15,813 160,835 125,111 137,869 262,980
2031 145,948 15,966 161,913 125,918 141,939 267,857
2032 147,285 16,164 163,449 127,067 146,444 273,510
2033 147,825 16,275 164,101 127,540 150,522 278,063
2034 148,776 16,433 165,209 128,366 154,872 283,239
2035 149,736 16,592 166,328 129,199 159,551 288,751
2036 151,118 16,799 167,916 130,394 164,905 295,299
2037 151,682 16,915 168,597 130,888 169,065 299,953
2038 152,668 17,080 169,747 131,743 174,186 305,929
2039 153,663 17,246 170,908 132,607 179,216 311,823
2040 155,090 17,461 172,551 133,841 185,233 319,074
2041 155,115 17,570 172,684 133,879 189,935 323,814
2042 155,565 17,727 173,292 134,281 195,581 329,862
2043 156,017 17,887 173,904 134,685 201,142 335,827
2044 156,899 18,098 174,998 135,459 207,736 343,195
2045 156,927 18,212 175,139 135,499 212,982 348,481
2046 157,385 18,377 175,762 135,908 219,150 355,058
2047 157,845 18,545 176,389 136,319 225,608 361,927
2048 158,740 18,765 177,505 137,104 232,919 370,023
2049 158,771 18,885 177,655 137,146 238,820 375,966
2050 159,237 19,058 178,294 137,551 245,882 383,433

Chapter 5 Transactions & Revenue Forecast
5-12
Table 5-8. 2021–2050 Veterans Memorial Tollway (I-355) Transactions and Revenue (in Thousands, Revenue Shown in Nominal Dollars)
Year
Transactions Revenue Passenger
Cars Commercial
Vehicles Total Passenger
Cars Commercial
Vehicles Total
2021 138,748 16,188 154,936 152,034 102,141 254,175
2022 153,700 15,696 169,395 164,829 99,559 264,388
2023 156,534 15,458 171,992 166,595 99,199 265,794
2024 157,812 15,614 173,426 167,773 102,164 269,937
2025 158,660 15,766 174,426 168,832 105,419 274,250
2026 157,808 15,391 173,199 167,727 104,441 272,168
2027 158,499 15,095 173,594 168,535 104,307 272,842
2028 159,669 15,271 174,940 169,811 107,603 277,414
2029 160,285 15,364 175,649 170,579 110,423 281,001
2030 161,346 15,500 176,846 171,851 113,723 285,574
2031 162,515 15,642 178,157 173,197 117,117 290,314
2032 164,144 15,829 179,973 175,042 120,859 295,901
2033 164,889 15,930 180,820 175,959 124,326 300,285
2034 166,096 16,077 182,172 177,367 127,821 305,188
2035 167,315 16,225 183,539 178,792 131,773 310,565
2036 169,009 16,419 185,428 180,725 136,129 316,854
2037 169,793 16,525 186,318 181,690 139,609 321,299
2038 171,052 16,677 187,729 183,164 143,825 326,989
2039 172,324 16,832 189,156 184,655 148,065 332,721
2040 174,086 17,034 191,120 186,672 152,991 339,662
2041 174,141 17,151 191,292 186,774 157,196 343,970
2042 174,674 17,317 191,991 187,387 162,020 349,406
2043 175,209 17,485 192,694 188,002 167,055 355,057
2044 176,228 17,703 193,931 189,135 172,782 361,917
2045 176,286 17,827 194,113 189,241 177,524 366,765
2046 176,828 18,000 194,829 189,865 182,919 372,784
2047 177,373 18,176 195,549 190,492 188,620 379,111
2048 178,408 18,404 196,812 191,643 195,051 386,694
2049 178,471 18,533 197,004 191,754 200,357 392,111
2050 179,024 18,715 197,739 192,380 206,527 398,907

Chapter 5 Transactions & Revenue Forecast
5-13
Table 5-9. 2021–2050 Illinois Route 390 Tollway (IL 390) Transactions and Revenue (in Thousands, Revenue Shown in Nominal Dollars)
Year
Transactions Revenue Passenger
Cars Commercial
Vehicles Total Passenger
Cars Commercial
Vehicles Total
2021 62,963 7,855 70,818 25,566 11,259 36,825
2022 71,558 7,692 79,250 28,346 10,511 38,857
2023 72,537 7,932 80,469 28,602 11,462 40,064
2024 73,778 8,056 81,833 29,342 11,813 41,155
2025 74,983 8,137 83,120 29,546 12,284 41,830
2026 95,578 9,709 105,287 35,008 14,299 49,307
2027 103,030 10,625 113,655 36,927 15,754 52,681
2028 104,756 10,807 115,562 37,503 16,306 53,809
2029 105,931 10,932 116,862 37,886 16,763 54,649
2030 107,414 11,088 118,502 38,412 17,293 55,705
2031 108,867 11,234 120,100 38,877 17,982 56,859
2032 110,643 11,412 122,055 39,464 18,495 57,959
2033 111,836 11,530 123,366 39,849 19,148 58,997
2034 113,352 11,682 125,034 40,348 19,746 60,094
2035 114,890 11,835 126,725 40,852 20,398 61,250
2036 116,769 12,023 128,792 41,475 21,186 62,661
2037 118,033 12,148 130,180 41,882 21,753 63,635
2038 119,638 12,307 131,945 42,407 22,533 64,939
2039 121,266 12,469 133,735 42,938 23,208 66,146
2040 123,255 12,667 135,922 43,595 24,187 67,782
2041 123,657 12,764 136,421 43,717 24,737 68,454
2042 124,401 12,896 137,298 43,959 25,462 69,421
2043 125,150 13,031 138,181 44,202 26,206 70,408
2044 126,249 13,202 139,451 44,567 27,179 71,745
2045 126,663 13,303 139,966 44,692 27,901 72,593
2046 127,426 13,441 140,867 44,939 28,668 73,607
2047 128,194 13,581 141,776 45,187 29,536 74,723
2048 129,321 13,761 143,081 45,559 30,614 76,173
2049 129,745 13,866 143,611 45,687 31,429 77,116
2050 130,528 14,011 144,539 45,948 32,203 78,151

Chapter 5 Transactions & Revenue Forecast
5-14
Table 5-10. 2021–2050 I-490 Tollway (I-490) Transactions and Revenue (in Thousands, Revenue Shown in Nominal Dollars)
Year
Transactions Revenue Passenger
Cars Commercial
Vehicles Total Passenger
Cars Commercial
Vehicles Total
2021 0 0 0 0 0 0
2022 0 0 0 0 0 0
2023 0 0 0 0 0 0
2024 0 0 0 0 0 0
2025 0 0 0 0 0 0
2026 19,640 1,938 21,578 10,979 5,368 16,347
2027 32,886 4,885 37,771 18,166 13,552 31,717
2028 38,731 5,781 44,512 21,361 16,409 37,771
2029 39,588 5,903 45,491 21,830 17,093 38,923
2030 40,637 6,028 46,666 22,402 17,736 40,138
2031 41,610 6,128 47,738 22,928 18,457 41,385
2032 42,724 6,246 48,970 23,586 19,164 42,751
2033 43,629 6,332 49,961 24,079 19,819 43,899
2034 44,675 6,437 51,112 24,650 20,570 45,221
2035 45,748 6,543 52,291 25,236 21,300 46,536
2036 46,975 6,670 53,645 25,907 22,199 48,106
2037 47,973 6,761 54,734 26,453 22,876 49,329
2038 49,127 6,873 56,000 27,085 23,761 50,846
2039 50,310 6,987 57,297 27,732 24,607 52,339
2040 51,663 7,122 58,785 28,473 25,594 54,068
2041 51,995 7,211 59,206 28,657 26,422 55,079
2042 52,473 7,321 59,795 28,920 27,308 56,228
2043 52,956 7,433 60,389 29,185 28,289 57,474
2044 53,590 7,567 61,157 29,533 29,458 58,991
2045 53,935 7,662 61,597 29,723 30,403 60,126
2046 54,432 7,779 62,211 29,996 31,484 61,479
2047 54,933 7,898 62,831 30,271 32,593 62,864
2048 55,591 8,041 63,632 30,632 33,868 64,500
2049 55,951 8,142 64,092 30,829 34,943 65,772
2050 56,466 8,267 64,733 31,174 36,279 67,453
Figure 5-1 illustrates forecasted T&R from 2021 through 2050. In 2022, revenue is expected to increase by 4.3 percent as traffic volumes continue to recover from the impact of the pandemic. Between 2022 and 2027, average annual revenue growth is forecasted at 3.2 percent. Growth will be boosted by the completion of the I-490 Tollway in 2026, as well as by the completion of the I-294 reconstruction and widening project in phases between 2022 and 2027. Beyond 2027, expected revenue is forecasted to grow at an average annual rate of 1.9 percent.

Chapter 5 Transactions & Revenue Forecast
5-15
Figure 5-1. Chart of Systemwide Transactions and Revenue, 2021–2050
The share of revenue collected from CVs is forecast to increase over time because of the annual inflation-based toll rate adjustments. CV revenues are expected to consistently exceed PC revenues by 2023. The previous 2005 CV rate increase, 2012 PC rate increase, and 2015 through 2017 CV rate increases demonstrate that Illinois Tollway users have a relatively low sensitivity to toll rate increases. The year-over-year declines in transactions following these toll rate increases, if any, were minor and short-lived. One potential risk to the CV revenue forecast is if annual rate adjustments fall significantly below the assumed annual rate increase of 2.0 percent beyond 2021.
5.7 Disclaimer CDM Smith used currently-accepted professional practices and procedures in the development of the traffic and revenue estimates in this report. However, as with any forecast, it should be understood that differences between forecasted and actual results may occur, as caused by events and circumstances beyond the control of the forecasters. In formulating the estimates, CDM Smith reasonably relied upon the accuracy and completeness of information provided (both written and oral) by the Illinois Tollway. CDM Smith also relied upon the reasonable assurances of independent parties and is not aware of any material facts that would make such information misleading.
CDM Smith made qualitative judgments related to several key variables in the development and analysis of the traffic and revenue estimates that must be considered as a whole; therefore, selecting portions of any individual result without consideration of the intent of the whole may

Chapter 5 Transactions & Revenue Forecast
5-16
create a misleading or incomplete view of the results and the underlying methodologies used to obtain the results.
CDM Smith gives no opinion as to the value or merit of partial information extracted from this report.
All estimates and projections reported herein are based on CDM Smith’s experience and judgment and on a review of information obtained from multiple agencies, including the Illinois Tollway. These estimates and projections may not be indicative of actual or future values, and are therefore subject to substantial uncertainty. Certain variables such as future developments, economic cycles, pandemics, government actions, climate change-related events, or impacts related to advances in automotive technology etc. cannot be predicted with certainty and may affect the estimates or projections expressed in this report, such that CDM Smith does not specifically guarantee or warrant any estimate or projection contained within this report.
While CDM Smith believes that the projections and other forward-looking statements contained within the report are based on reasonable assumptions as of the date of the report, such forward-looking statements involve risks and uncertainties that may cause actual results to differ materially from the results predicted. Therefore, following the date of this report, CDM Smith will take no responsibility or assume any obligation to advise of changes that may affect its assumptions contained within the report as they pertain to socioeconomic and demographic forecasts, proposed residential or commercial land use development projects, and/or potential improvements to the regional transportation network.
The report and its contents are intended solely for use by the Illinois Tollway and designated parties approved by the Illinois Tollway and CDM Smith. Any use by third parties, other than as noted above, is expressly prohibited. In addition, any publication of the report without the express written consent of CDM Smith is prohibited.
CDM Smith is not, and has not been, a municipal advisor as defined in federal law (the Dodd Frank Bill) to the Illinois Tollway and does not owe a fiduciary duty pursuant to Section 15B of the Exchange Act to the Illinois Tollway with respect to the information and material contained in this report. CDM Smith is not recommending and has not recommended any action to the Illinois Tollway. The Illinois Tollway should discuss the information and material contained in this report with any and all internal and external advisors that it deems appropriate before acting on this information.

6-1
Chapter 6 Sensitivity Tests
A total of five sensitivity tests were conducted to measure the impact on annual T&R due to large changes in model parameters. In this test, VOCs include the same items as described in Section 4.2.6. These tests are meant to represent relatively extreme cases, which are not expected to occur in practice but illustrate the resilience of the Illinois Tollway’s traffic and revenue forecasts to potential future shocks. Each sensitivity test was conducted in the future model years of 2030, 2040, and 2050 using the same assumptions for future-year highway networks as described in Chapter 5. The sensitivity tests include the following:
VOT: Increase or decrease VOT assumption in the model by 20 percent.
VOC: Increase VOCs (e.g., cost of gasoline) by 50 percent.
CV toll rates: Reduce annual growth rate assumption for CV toll rate from 2.0 percent to 1.0 percent.
Socioeconomic growth: Eliminate growth in total travel demand between model years.
Telecommuting: Substantially increase work-from-home assumption for industry classifications with high propensity to telecommute.
The following sub-sections describe each sensitivity test in greater detail, along with the results of each test.
6.1 Higher Value of Time VOT is a critical parameter in the toll diversion model. A motorist’s decision to use a toll road is heavily influenced by the travel time savings relative to the toll charged. By increasing VOT, drivers will have a greater incentive to travel the fastest route. In turn, the T&R on the Illinois Tollway should increase. Decreasing VOT, which could be the result of declining wages in a generally weaker economy, should have the opposite effect. Figure 6-1 shows the impact of 20-percent higher VOTs for all vehicle rate tiers, and Figure 6-2 shows the impact of 20-percent lower VOTs.

Chapter 6 Sensitivity Tests
6-2
Figure 6-1. Results of Higher Value of Time Sensitivity Test
Figure 6-2. Results of Lower Value of Time Sensitivity Test

Chapter 6 Sensitivity Tests
6-3
The results show that for a 20-percent VOT increase, systemwide revenue increases approximately 6.3 percent in 2030 and 5.7 percent in 2050. When VOT is decreased 20 percent, systemwide revenue decreases 8.8 percent in 2030 and 8.1 percent in 2050. The IL 390 and I-490 facilities, which have higher per-mile toll rates, experience the largest impacts on traffic volumes in the VOT sensitivity tests.
The impact of changes in VOT differs between PC and CV T&R, with CVs more sensitive to changes in VOT than PCs. The constant PC toll rate through 2050 decreases over time to save one minute, in real terms. As a result, PC travelers become less sensitive to the change in VOT. In contrast, CV toll rates, which rise annually with inflation, make CVs consistently sensitive to the change in VOT over time.
6.2 Vehicle Operating Costs For the VOC test, CDM Smith increased the VOC for all vehicle classes by 50 percent in all years. VOCs are based on the distance traveled, not the time traveled, and so motorists’ sensitivity to trip distance increases in this test. As a result, the shortest distance path becomes more important relative to time savings, making the Tollway system relatively less attractive for more trips compared to arterial routes. At the same time, rising gas prices also reduce overall travel demand as individuals carpool, make use of transit options, walk, bike, or forgo trips entirely.
In addition to increasing the fuel component of VOC by 50 percent, CDM Smith reduced regional travel demand by 15.0 percent in all years. This assumption tests a more extreme case for the purposes of the sensitivity test; for reference, the Great Recession of 2007–2009 resulted in an estimated 4.0-percent reduction in systemwide transactions, including a 1.1-percent decrease in PC transactions and a 16.0-percent decrease in CV transactions.
Figure 6-3 illustrates the T&R impacts of increased motor fuel costs. Reduction in revenue is substantial at approximately 16.5 percent in 2030 and 15.5 percent in 2050. This effect diminished slightly over time as regional demand and congestion increases, which makes local roads less attractive. However, the majority of the impact on T&R in this test is the result of lower regional travel demand overall, rather than VOCs alone.

Chapter 6 Sensitivity Tests
6-4
Figure 6-3. Results of Higher Vehicle Operating Costs Sensitivity Test
6.3 Commercial Vehicle Toll Rates CVs represent a core component of the Illinois Tollway’s revenue base, and the importance of CV traffic has grown in recent years. This trend is expected to continue, given that current Illinois Tollway policy indexes CV toll rates to the CPI over time while no PC toll rate increases are scheduled. CDM Smith currently assumes that CV toll rates will increase 2.0 percent annually beginning 2023, which is in line with historical trends over the past 20 to 30 years, as well as the inflation target typically adopted by the Federal Reserve System. If actual inflation is lower than that level for an extended period of time, the Tollway could face a potentially substantial revenue risk.
This sensitivity test replaces the 2.0-percent annual CPI increase with a lower assumption of 1.0-percent annual increase, beginning in year 2023. Over time, this results in a substantially lower average CV toll rate. Overall, the Tollway attracted more CV trips in this test, but the higher volumes are not sufficient to offset the reduction in revenue from the lower toll rate, with the variance increasing over time. In addition, there are fewer PC trips on the Tollway in this sensitivity test because of the increased congestion caused by the higher volume of CV trips. As shown in Figure 6-4, revenues decline by 1.9 percent in 2030 and 4.7 percent in 2050. Impacts of the sensitivity test were largest on the IL 390 and I-490 facilities, which have the highest per-mile

Chapter 6 Sensitivity Tests
6-5
toll rates on the Tollway system; a lower rate of growth in CV toll rates results in higher traffic volumes on these facilities in the sensitivity test.
Figure 6-4. Results of Commercial Vehicle Toll Rate Increase Sensitivity Test
6.4 Socioeconomic Growth This sensitivity test considers the impacts of no trip growth in the modeling region. Specifically, the total number of trips in 2020 is held as a controlled total in future years 2030, 2040, and 2050, but land use changes in the underlying socioeconomic forecast are allowed to continue. As a result, origin–destination patterns change over the model years. Changes in land use, combined with changes in the other modeling parameters (e.g., capacity additions to the highway network, an increase in CV toll rates over time) result in changes to T&R in this sensitivity test.
As demonstrated in Figure 6-5, there is a substantial reduction in Tollway T&R in this test, growing from a 2.7-percent reduction in 2030 to an 11.2-percent reduction in 2050. Much of this reduction reflects the direct loss of trips due to an overall decline in travel demand. In addition, there is less congestion across the regional highway network in this sensitivity test, which, in turn, makes the Tollway system a less-attractive option compared to untolled alternative routes. The rerouting of trips in favor of untolled alternatives further reduces T&R on the Tollway system.

Chapter 6 Sensitivity Tests
6-6
Figure 6-5. Results of No Trip Growth Sensitivity Test
6.5 Telecommuting Throughout the COVID-19 pandemic, many jobs have been performed remotely due to social distancing measures. During the peak of social distancing measures in the late spring of 2020, nearly 50 percent of employees were working from home, a substantial increase from levels prior to the pandemic. Recent surveys have indicated that people working from home, either full time or part time, will continue permanently, though not as many as during the height of the pandemic.
Given that a substantial share of the Tollway’s customer base is commuter PC traffic, a long-term shift in telecommuting behavior could pose a revenue risk. To understand the risk, this telecommuting sensitivity test was conducted in three steps. The first step estimated the propensity of working from home for each employment type classified by the North American Industry Classification System. For example, CDM Smith estimates that jobs in the finance and insurance industry are estimated to have a relatively high propensity to telecommute, while jobs in the utilities or construction industries are estimated to have a relatively low propensity to telecommute. The second step estimated the share of residents in each traffic analysis zone that fall into each employment type. A weighted average percent of working from home was then calculated to represent the aggregate share of telecommuting in that zone. The third step applied the zone-level telecommuting share on home-based work trips. The result is an 11-percent reduction in home-based work trips, which leads to a 3-percent reduction in all trips.
The long-term impact of telecommuting on T&R is illustrated in Figure 6-6. An increase in telecommuting results in 2.3 percent less revenue in 2030 and 1.5 percent less revenue in 2050. Impacts across facilities are relatively consistent in this sensitivity test.

Chapter 6 Sensitivity Tests
6-7
Figure 6-6. Results of Increased Telecommuting Sensitivity Test

Chapter 6 Sensitivity Tests
6-8
This page intentionally left blank.

A-1
Appendix A Toll Rates by Vehicle Classification as of January 1, 2021
As illustrated in the full toll rate table below, mainline and ramp plaza toll rates vary substantially. The toll rates at plazas vary for the following two reasons:
Plaza toll rates are set to a target per-mile toll rate. Therefore, toll rates at an individual plaza may vary depending on the number of miles of roadway for which the plaza collects tolls.
Some sections of the Tollway, including all of the Veterans Memorial Tollway, have higher per-mile toll rates.

Appendix A Toll Rates & Vehicle Classification as of January 1, 2021
A-2
This page intentionally left blank.
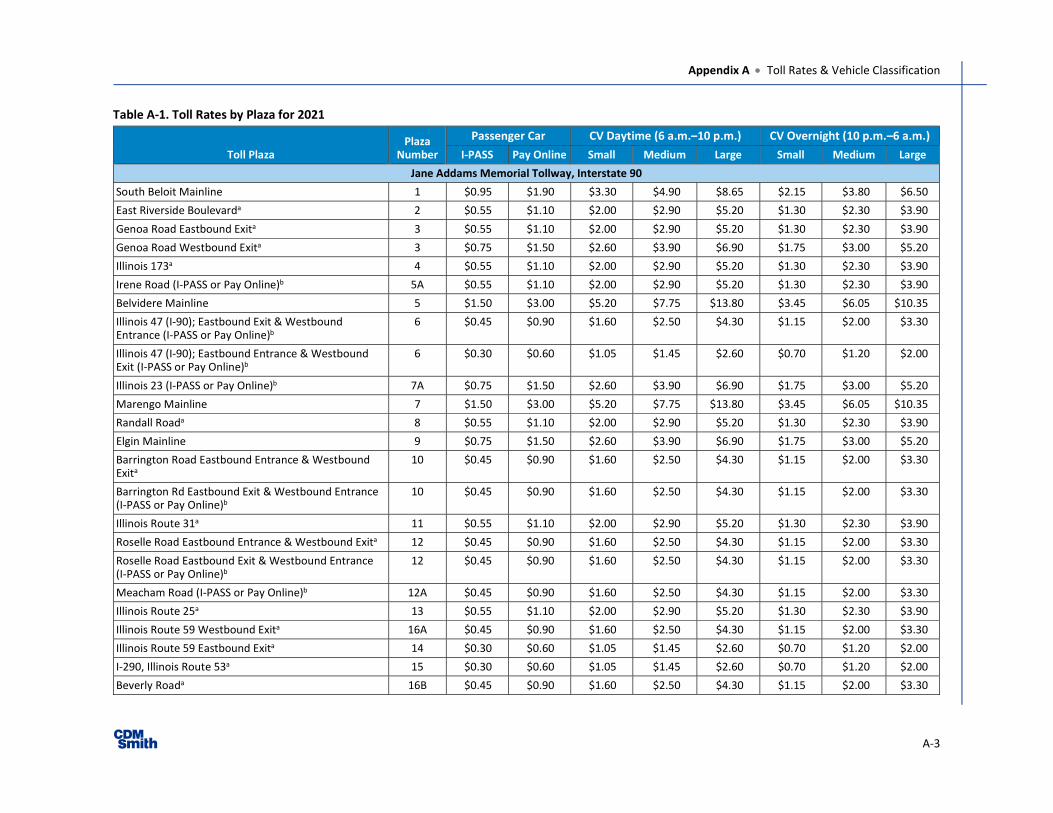
Appendix A Toll Rates & Vehicle Classification
A-3
Table A-1. Toll Rates by Plaza for 2021
Toll Plaza Plaza
Number
Passenger Car CV Daytime (6 a.m.–10 p.m.) CV Overnight (10 p.m.–6 a.m.) I-PASS Pay Online Small Medium Large Small Medium Large
Jane Addams Memorial Tollway, Interstate 90
South Beloit Mainline 1 $0.95 $1.90 $3.30 $4.90 $8.65 $2.15 $3.80 $6.50
East Riverside Boulevarda 2 $0.55 $1.10 $2.00 $2.90 $5.20 $1.30 $2.30 $3.90
Genoa Road Eastbound Exita 3 $0.55 $1.10 $2.00 $2.90 $5.20 $1.30 $2.30 $3.90
Genoa Road Westbound Exita 3 $0.75 $1.50 $2.60 $3.90 $6.90 $1.75 $3.00 $5.20
Illinois 173a 4 $0.55 $1.10 $2.00 $2.90 $5.20 $1.30 $2.30 $3.90
Irene Road (I-PASS or Pay Online)b 5A $0.55 $1.10 $2.00 $2.90 $5.20 $1.30 $2.30 $3.90
Belvidere Mainline 5 $1.50 $3.00 $5.20 $7.75 $13.80 $3.45 $6.05 $10.35
Illinois 47 (I-90); Eastbound Exit & Westbound Entrance (I-PASS or Pay Online)b
6 $0.45 $0.90 $1.60 $2.50 $4.30 $1.15 $2.00 $3.30
Illinois 47 (I-90); Eastbound Entrance & Westbound Exit (I-PASS or Pay Online)b
6 $0.30 $0.60 $1.05 $1.45 $2.60 $0.70 $1.20 $2.00
Illinois 23 (I-PASS or Pay Online)b 7A $0.75 $1.50 $2.60 $3.90 $6.90 $1.75 $3.00 $5.20
Marengo Mainline 7 $1.50 $3.00 $5.20 $7.75 $13.80 $3.45 $6.05 $10.35
Randall Roada 8 $0.55 $1.10 $2.00 $2.90 $5.20 $1.30 $2.30 $3.90
Elgin Mainline 9 $0.75 $1.50 $2.60 $3.90 $6.90 $1.75 $3.00 $5.20
Barrington Road Eastbound Entrance & Westbound Exita
10 $0.45 $0.90 $1.60 $2.50 $4.30 $1.15 $2.00 $3.30
Barrington Rd Eastbound Exit & Westbound Entrance (I-PASS or Pay Online)b
10 $0.45 $0.90 $1.60 $2.50 $4.30 $1.15 $2.00 $3.30
Illinois Route 31a 11 $0.55 $1.10 $2.00 $2.90 $5.20 $1.30 $2.30 $3.90
Roselle Road Eastbound Entrance & Westbound Exita 12 $0.45 $0.90 $1.60 $2.50 $4.30 $1.15 $2.00 $3.30
Roselle Road Eastbound Exit & Westbound Entrance (I-PASS or Pay Online)b
12 $0.45 $0.90 $1.60 $2.50 $4.30 $1.15 $2.00 $3.30
Meacham Road (I-PASS or Pay Online)b 12A $0.45 $0.90 $1.60 $2.50 $4.30 $1.15 $2.00 $3.30
Illinois Route 25a 13 $0.55 $1.10 $2.00 $2.90 $5.20 $1.30 $2.30 $3.90
Illinois Route 59 Westbound Exita 16A $0.45 $0.90 $1.60 $2.50 $4.30 $1.15 $2.00 $3.30
Illinois Route 59 Eastbound Exita 14 $0.30 $0.60 $1.05 $1.45 $2.60 $0.70 $1.20 $2.00
I-290, Illinois Route 53a 15 $0.30 $0.60 $1.05 $1.45 $2.60 $0.70 $1.20 $2.00
Beverly Roada 16B $0.45 $0.90 $1.60 $2.50 $4.30 $1.15 $2.00 $3.30

Appendix A Toll Rates & Vehicle Classification
A-4
Toll Plaza Plaza
Number
Passenger Car CV Daytime (6 a.m.–10 p.m.) CV Overnight (10 p.m.–6 a.m.) I-PASS Pay Online Small Medium Large Small Medium Large
Devon Mainline 17 $0.75 $1.50 $2.60 $3.90 $6.90 $1.75 $3.00 $5.20
Arlington Heights Roada 18 $0.45 $0.90 $1.60 $2.50 $4.30 $1.15 $2.00 $3.30
Elmhurst Road Eastbound Exit, Westbound Entrance (I-PASS or Pay Online)b 18A $0.55 $1.10 $2.00 $2.90 $5.20 $1.30 $2.30 $3.90
River Road Mainline 19 $0.75 $1.50 $2.60 $3.90 $6.90 $1.75 $3.00 $5.20
Tri-State Tollway, Interstates 294/94/80
Buckley Road (Illinois 137)a 20 $0.45 $0.90 $1.60 $2.50 $4.30 $1.15 $2.00 $3.30
Waukegan Mainline 21 $1.40 $2.80 $4.90 $7.35 $12.95 $3.30 $5.70 $9.75
Townline Road (Illinois 60)a 22 $0.45 $0.90 $1.60 $2.50 $4.30 $1.15 $2.00 $3.30
Half Day Road (Illinois 22)a 23 $0.45 $0.90 $1.60 $2.50 $4.30 $1.15 $2.00 $3.30
Edens Spur Mainline 24 $0.95 $1.90 $3.30 $4.90 $8.65 $2.15 $3.80 $6.50
Lake Cook Roada 26 $0.95 $1.90 $3.30 $4.90 $8.65 $2.15 $3.80 $6.50
Willow Roada 27 $0.95 $1.90 $3.30 $4.90 $8.65 $2.15 $3.80 $6.50
Golf Road (Illinois 58)a 28 $0.95 $1.90 $3.30 $4.90 $8.65 $2.15 $3.80 $6.50
Touhy Avenue Mainline 29 $0.95 $1.90 $3.30 $4.90 $8.65 $2.15 $3.80 $6.50
Balmoral Northbound (I-PASS or Pay Online)b 30 $0.80 $1.60 $3.30 $4.90 $8.65 $2.15 $3.80 $6.50
O'Hare Westa 31 $0.75 $1.50 $2.60 $3.90 $6.90 $1.75 $3.00 $5.20
O'Hare Easta 32 $0.75 $1.50 $2.60 $3.90 $6.90 $1.75 $3.00 $5.20
Irving Park Road (Illinois 19) Mainline 33 $0.75 $1.50 $2.60 $3.90 $6.90 $1.75 $3.00 $5.20
75th Street, Willow Springs Roada 34 $0.55 $1.10 $2.00 $2.90 $5.20 $1.30 $2.30 $3.90
Cermak Road (22nd Street) Mainline 35 $0.75 $1.50 $2.60 $3.90 $6.90 $1.75 $3.00 $5.20
82nd Street Mainline 36 $0.75 $1.50 $2.60 $3.90 $6.90 $1.75 $3.00 $5.20
I-55 (Stevenson Expressway)a 37 $0.30 $0.60 $1.05 $1.45 $2.60 $0.70 $1.20 $2.00
U.S. 12-20, 95th Streeta 38 $0.55 $1.10 $2.00 $2.90 $5.20 $1.30 $2.30 $3.90
83rd Street Mainline 39 $0.75 $1.50 $2.60 $3.90 $6.90 $1.75 $3.00 $5.20
U.S. 6, 159th Streeta 40 $0.75 $1.50 $2.60 $3.90 $6.90 $1.75 $3.00 $5.20
163rd Street Mainline 41 $0.75 $1.50 $2.60 $3.90 $6.90 $1.75 $3.00 $5.20
I-57 / 147th Street (Illinois 83) (I-PASS or Pay Online)b 42 $0.75 $1.50 $2.60 $3.90 $6.90 $1.75 $3.00 $5.20
I-80 Westbound 43 $0.55 $1.10 $2.00 $2.90 $5.20 $1.30 $2.30 $3.90

Appendix A Toll Rates & Vehicle Classification
A-5
Toll Plaza Plaza
Number
Passenger Car CV Daytime (6 a.m.–10 p.m.) CV Overnight (10 p.m.–6 a.m.) I-PASS Pay Online Small Medium Large Small Medium Large
I-80 Eastbound 45 $0.55 $1.10 $2.00 $2.90 $5.20 $1.30 $2.30 $3.90
Halsted Street (Illinois 1)a 47 $0.30 $0.60 $1.05 $1.45 $2.60 $0.70 $1.20 $2.00
Reagan Memorial Tollway, Interstate 88
York Mainline 51 $0.75 $1.50 $2.60 $3.90 $6.90 $1.75 $3.00 $5.20
Meyers Mainline 52 $0.75 $1.50 $2.60 $3.90 $6.90 $1.75 $3.00 $5.20
Spring Rd (22nd Street)a 53 $0.75 $1.50 $2.60 $3.90 $6.90 $1.75 $3.00 $5.20
Illinois 83a 54 $0.75 $1.50 $2.60 $3.90 $6.90 $1.75 $3.00 $5.20
Midwest Roada 55 $0.75 $1.50 $2.60 $3.90 $6.90 $1.75 $3.00 $5.20
Highland Avenuea 56 $0.55 $1.10 $2.00 $2.90 $5.20 $1.30 $2.30 $3.90
Naperville Roada 57 $0.30 $0.60 $1.05 $1.45 $2.60 $0.70 $1.20 $2.00
Winfield Roada 58 $0.30 $0.60 $1.05 $1.45 $2.60 $0.70 $1.20 $2.00
Farnsworth Avenuea 59 $0.55 $1.10 $2.00 $2.90 $5.20 $1.30 $2.30 $3.90
Eola Road (I-PASS or Pay Online)a 60 $0.55 $1.10 $2.00 $2.90 $5.20 $1.30 $2.30 $3.90
Aurora Mainline 61 $0.75 $1.50 $2.60 $3.90 $6.90 $1.75 $3.00 $5.20
Illinois 31a 63 $0.55 $1.10 $2.00 $2.90 $5.20 $1.30 $2.30 $3.90
Orchard Roada 64 $0.45 $0.90 $1.60 $2.50 $4.30 $1.15 $2.00 $3.30
Illinois 47 (I-88) (I-PASS or Pay Online)b 64A $0.55 $1.10 $2.00 $2.90 $5.20 $1.30 $2.30 $3.90
Peace Roada 65 $0.75 $1.50 $2.60 $3.90 $6.90 $1.75 $3.00 $5.20
DeKalb Mainline 66 $1.80 $3.60 $6.20 $9.25 $16.40 $4.15 $7.25 $12.35
Annie Glidden Roada 67 $1.05 $2.10 $3.60 $5.35 $9.50 $2.45 $4.20 $7.20
Dixon Mainline 69 $1.80 $3.60 $6.20 $9.25 $16.40 $4.15 $7.25 $12.35
Veterans Memorial Tollway, Interstate 355
Army Trail Road Mainline 73 $0.95 $1.90 $2.60 $3.90 $6.90 $1.75 $3.00 $5.20
North Avenue (Illinois 64)a 75 $0.75 $1.50 $2.05 $3.15 $5.50 $1.40 $2.45 $4.15
Roosevelt Road (Illinois 38)a 77 $0.65 $1.30 $1.85 $2.75 $4.85 $1.20 $2.15 $3.60
Butterfield Road (Illinois 56)a 79 $0.45 $0.90 $1.30 $2.00 $3.45 $0.85 $1.55 $2.60
Ogden Avenue (U.S. 34)a 81 $0.45 $0.90 $1.30 $2.00 $3.45 $0.85 $1.55 $2.60
Maple Avenuea 83 $0.55 $1.10 $1.55 $2.30 $4.15 $1.05 $1.85 $3.15
63rd Streeta 85 $0.65 $1.30 $1.85 $2.75 $4.85 $1.20 $2.15 $3.60
75th Streeta 87 $0.75 $1.50 $2.05 $3.15 $5.50 $1.40 $2.45 $4.15

Appendix A Toll Rates & Vehicle Classification
A-6
Toll Plaza Plaza
Number
Passenger Car CV Daytime (6 a.m.–10 p.m.) CV Overnight (10 p.m.–6 a.m.) I-PASS Pay Online Small Medium Large Small Medium Large
Boughton Road Mainline 89 $0.95 $1.90 $2.60 $3.90 $6.90 $1.75 $3.00 $5.20
Boughton Roada 90 $0.45 $0.90 $1.30 $2.00 $3.45 $0.85 $1.55 $2.60
127th Streeta 93 $0.95 $1.90 $2.60 $3.90 $6.90 $1.75 $3.00 $5.20
Archer Avenue/143rd Streeta 95 $1.20 $2.40 $3.35 $5.20 $8.95 $2.25 $4.00 $6.75
Illinois 7 (159th Street)a 97 $1.40 $2.80 $3.90 $5.95 $10.35 $2.60 $4.65 $7.75
Spring Creek Mainline 99 $1.90 $3.80 $5.20 $7.75 $13.80 $3.45 $6.05 $10.35
U.S. 6a 101 $0.45 $0.90 $1.30 $2.00 $3.45 $0.85 $1.55 $2.60
Illinois Route 390 Tollway–All Electronic Toll Roads (I-PASS or Pay Online)
Toll Plaza Plaza
Number
Passenger Car
CV Daytime (6 a.m.–10 p.m.) CV Overnight
Small Medium Large Small Medium Large
I-PASS Pay
Online I-PASS Pay
Online I-PASS Pay
Online I-PASS Pay
Online I-PASS Pay
Online I-PASS Pay
Online I-PASS Pay
Online
Lively Boulevard Mainlineb 320 $0.20 $0.40 $0.45 $0.65 $0.65 $0.95 $1.15 $1.75 $0.25 $0.45 $0.50 $0.75 $0.80 $1.25 Mittel Drive Mainlineb 322 $0.20 $0.40 $0.45 $0.65 $0.65 $0.95 $1.15 $1.75 $0.25 $0.45 $0.50 $0.75 $0.80 $1.25 Hamilton Lakes Drive Mainlineb 324 $0.25 $0.50 $0.55 $0.80 $0.80 $1.25 $1.45 $2.20 $0.40 $0.60 $0.65 $0.95 $1.10 $1.60 Ketter Driveb 325 $0.20 $0.40 $0.45 $0.65 $0.65 $0.95 $1.15 $1.75 $0.25 $0.45 $0.50 $0.75 $0.80 $1.25 Plum Grove Road Mainlineb 326 $0.60 $1.20 $1.25 $1.90 $1.90 $2.85 $3.35 $5.00 $0.80 $1.30 $1.45 $2.20 $2.50 $3.70 Mitchell Boulevard Mainlineb 328 $0.35 $0.70 $0.80 $1.25 $1.20 $1.80 $2.10 $3.20 $0.55 $0.80 $0.90 $1.40 $1.55 $2.40 Lake Street Mainlineb 330 $0.30 $0.60 $0.65 $0.95 $1.05 $1.55 $1.80 $2.70 $0.45 $0.65 $0.75 $1.15 $1.35 $2.05 Notes a Unattended ramp plazas. I-PASS, E-ZPass or exact amount only. b Cashless Tolling: No cash baskets or toll booths at this location. Cash is not accepted. Drivers should use an I-PASS, E-ZPass, or pay tolls online within 14 days.
Vehicle Category Description Passenger Car 2 axles – four or fewer tires; auto, SUV, motorcycle, taxi Small CV 2 axles – six tires; single-unit truck, buses Medium CV 3- and 4-axle vehicle or passenger vehicles with 1- or 2-axle side-car or trailer Large CV 5+-axle vehicle or passenger vehicles with 3+-axle trailer

B-1
Appendix B Socioeconomic Trends & Forecast

Appendix B Socioeconmic Trends & Forecast
B-2
This page intentionally left blank.

Development and Validation of a Policy-Neutral Socioeconomic Forecast
for the Illinois Tollway Service Area
Kermit W. Wies, Ph.D. Senior Research Fellow and Adjunct Professor
Northwestern University Transportation Center April 9, 2020
Table of Contents Table of Contents .......................................................................................................................................... 1
Table of Figures ............................................................................................................................................. 2
1 Executive Summary ............................................................................................................................... 3
2 Forecasting geography and data ........................................................................................................... 3
2.1 Existing land use data .................................................................................................................... 4
2.2 Existing population data ............................................................................................................... 5
2.3 Existing employment data ............................................................................................................ 6
2.4 Future year benchmarks ............................................................................................................... 7
3 Technical Forecasting Process .............................................................................................................. 9
3.1 Internal forecast calculation method .......................................................................................... 10
3.2 External forecast calculation method ......................................................................................... 10
Appendix A. Definition of geographic units and district aggregations .................................................... 12
Appendix B. Internal district forecast method ........................................................................................ 14
Appendix C. External district forecast method ....................................................................................... 19
Appendix D. Interim year interpolation method ..................................................................................... 20
Appendix E. Summary data tables by county ......................................................................................... 21
Appendix F. Subzone-level forecast dataset ........................................................................................... 49

Wies: Socioeconomic Forecasting 4/9/2020 p. 2
Table of Figures Figure 1: Comparison of Policy-Neutral with CMAP forecasts ...................................................................................... 3 Figure 2: Study area defined by CMAP modeling zones (i.e. TAZs) ............................................................................... 4 Figure 3: Population Comparison .................................................................................................................................. 5 Figure 4: 2015 Population ranked by County comparison ............................................................................................ 6 Figure 5: 2015 Employment Comparison ...................................................................................................................... 6 Figure 6: 2015 Employment ranked by County comparison ......................................................................................... 7 Figure 7: Population forecast comparison with benchmarks, modeling region ............................................................ 8 Figure 8: Employment forecast comparison with benchmarks, modeling region ......................................................... 9 Figure 9: Counties in the CMAP modeling region with subzone grid shown. .............................................................. 10 Figure 10: Study area defined by CMAP Zone17 modeling system ............................................................................. 12 Figure 11: CMAP Subzone17 system. Denser grid is the CMAP Planning Area. .......................................................... 13 Figure 12: CMAP modeling zone system. Count of Zone17 and Subzone17 by county. ............................................. 14 Figure 13: Example of selected subzone centroid and buffer polygons ...................................................................... 15 Figure 14: Comparison of Policy-Neutral forecasts in high-density job centers .......................................................... 16 Figure 15: Highlighted subzone 15736 in Plainfield Township, Will County ............................................................... 17 Figure 16: Highlighted subzone 15736 with aerial imagery and Land Use Inventory data ......................................... 17 Figure 17: Input and output values used in calculating carrying capacity for subzone 15736 .................................... 18 Figure 18: External district factors used to adjust CMAP forecast .............................................................................. 20 Figure 19: Linear versus log growth rate comparison. ................................................................................................ 21 Figure 20: Policy-Neutral population forecast summary by county ............................................................................ 22 Figure 21: CMAP ON TO 2050 population forecast summary by county..................................................................... 23 Figure 22: Policy-Neutral employment forecast summary by county ......................................................................... 24 Figure 23: CMAP ON TO 2050 employment forecast summary by county.................................................................. 25 Figure 24: Comparison of Policy-Neutral and CMAP ON TO 2050 population forecast summary .............................. 26 Figure 25: Comparison of Policy-Neutral and CMAP ON TO 2050 employment forecast summary ........................... 27 Figure 26: Cook County comparison of forecasts and benchmarks ............................................................................ 29 Figure 27: DuPage County comparison of forecasts and benchmarks ........................................................................ 30 Figure 28: Kane County comparison of forecasts and benchmarks ............................................................................ 31 Figure 29: Kendall County comparison of forecasts and benchmarks ........................................................................ 32 Figure 30: Lake County comparison of forecasts and benchmarks ............................................................................. 33 Figure 31: McHenry County comparison of forecasts and benchmarks ...................................................................... 34 Figure 32: Will County comparison of forecasts and benchmarks .............................................................................. 35 Figure 33: Winnebago County comparison of forecasts and benchmarks .................................................................. 37 Figure 34: Boone County comparison of forecasts and benchmarks .......................................................................... 38 Figure 35: Kankakee County comparison of forecasts and benchmarks ..................................................................... 39 Figure 36: Lake County, IN comparison of forecasts and benchmarks ........................................................................ 40 Figure 37: Porter County, IN comparison of forecasts and benchmarks ..................................................................... 41 Figure 38: LaPorte County, IN comparison of forecasts and benchmarks ................................................................... 42 Figure 39: Kenosha County, WI comparison of forecasts and benchmarks ................................................................ 43 Figure 40: Racine County, WI comparison of forecasts and benchmarks ................................................................... 44 Figure 41: Walworth County, WI comparison of forecasts and benchmarks .............................................................. 45 Figure 42: DeKalb County, IL comparison of forecasts and benchmarks .................................................................... 46 Figure 43: Grundy County, IL comparison of forecasts and benchmarks .................................................................... 47 Figure 44: LaSalle County, IL comparison of forecasts and benchmarks ..................................................................... 48 Figure 45: Forecast dataset variable listing ................................................................................................................. 49

Wies: Socioeconomic Forecasting 4/9/2020 p. 3
1 Executive Summary This report documents the development of a socioeconomic forecast for the Illinois Tollway service area. It includes an accompanying dataset that quantifies future population and employment values at the fine-grained geography required for analyzing travel demand and transportation network performance.
This socioeconomic forecast represents a “Policy-Neutral” counterpart to that prepared by Chicago Metropolitan Agency Planning (CMAP). The CMAP forecast represents the projected population and employment outcome of ON TO 2050, the region’s long-range comprehensive plan; a policy document that calls for significant public intervention to alter future land development trends in the region1. ON TO 2050 is the region’s official long-range transportation plan (LRTP) and CMAP’s socioeconomic data is the “forecast of record” used for evaluating federally-funded transportation improvements.
In contrast, the Policy-Neutral forecast is “built-up” from currently observed land use patterns. The difference between land-use assumptions underlying the CMAP ON TO 2050 socioeconomic forecast and the Policy-Neutral forecast results in the latter being more conservative with respect to overall growth. See Figure 1. In this report, both the CMAP and the Policy-Neutral forecast are validated against county-level econometric projections from independent analyses.
21-county modeling region2
Year 2015 Year 2050 Policy-Neutral
forecast
Year 2050 CMAP
forecast Population 10,312,287 11,704,553 13,463,945
Employment 4,837,553 5,720,856 5,870,691 Figure 1: Comparison of Policy-Neutral with CMAP forecasts
Because the Policy-Neutral forecast was prepared using empirically validated data sources and verified by visual inspection at the geographic scale used for travel demand modeling, it is this report’s conclusion that the Policy-Neutral socioeconomic forecast represents a plausible future socioeconomic forecast for the Illinois Tollway service area and provides a useful comparison to CMAP’s forecast.
2 Forecasting geography and data “Socioeconomic forecast” is a term used in conventional travel demand modeling that refers to the data that defines household and job composition for a specified future year. These data are the primary inputs to the Trip Generation step of a sequential four-step trip-based urban travel demand model. The Policy-Neutral forecast dataset includes household and employment values for years 2020, 2030, 2040 and 2050.
A specific technical objective of this study is to produce population and employment values that are directly comparable with those used by Chicago Metropolitan Agency for Planning (CMAP) in its travel demand model. In this case, the CMAP forecast takes the form of a flat-file database that enumerates
1 Chicago Metropolitan Agency for Planning, ON TO 2050 Regional Comprehensive Plan, 2018. https://www.cmap.illinois.gov/2050/implementing-the-plan Retrieved 12/21/2019. 2 Defined by CMAP as all or part of 21 counties, in three states, surrounding Chicago.

Wies: Socioeconomic Forecasting 4/9/2020 p. 4
population and employment variables by sub-units of geographically-discrete traffic analysis zones (TAZs)3.
Figure 2 shows county and TAZ boundaries included in the modeling region. The purple shaded area denotes CMAP’s official planning area. The CMAP modeling region extends beyond this to ensure that external travel demand is properly captured4. A table summarizing the count of zones found within each county appears in Appendix A.
Figure 2: Study area defined by CMAP modeling zones (i.e. TAZs)
2.1 Existing land use data The primary empirical data resource used to derive the Policy-Neutral forecast within the seven counties surrounding Chicago is CMAP’s 2015 Land Use Inventory (LUI)5. The LUI is formatted within a Geographic Information System (GIS) in which each parcel of land is digitally mapped with its current use
3 These sub-units are defined by CMAP and called “subzone17”. Subzones uniformly nest within CMAP’s current TAZ system, called “zone17”. 4 Note that the CMAP planning area includes three townships within DeKalb and Grundy Counties. All data tabulations appearing in this report include these townships within their respective counties. 5 Chicago Metropolitan Agency for Planning (CMAP), Land Use Inventory, 2013. https://www.cmap.illinois.gov/data/land-use/inventory. Retrieved 12/22/2019.

Wies: Socioeconomic Forecasting 4/9/2020 p. 5
characterized according to a standard classification. The GIS format allows land use classifications to be directly overlaid on satellite imagery for close-up visual verification.
2.2 Existing population data For this study, CMAP provided Year 2015 population that was used as the starting point for the Policy-Neutral forecast. The table below compares 20156 Census population estimates with a summation of CMAP’s “persons-living-in-households” from its 2015 socioeconomic file. The Census value is an estimate of the full population. The CMAP trip generation model, however, does not use the full population. Like most urban travel demand models, household composition (expressed as “adults-, workers-, children-per-household”) is the fundamental unit upon which trip-making is calculated. By Census definition, a household consists of all the persons who occupy a housing unit as their usual place of residence7. Average household size is obtained by dividing the total number of persons living in households by the total number of households within a particular census geography. Unlike the fully enumerated population estimate, these data are collected from the American Community Survey (ACS) and thus represent a rolling sample of averages8. For these reasons, it is safe to consider the Census’ enumeration-based population value an independent source for comparison to CMAP’s ACS-derived estimates. The CMAP values in Figure 3 represent the sum of adults- plus children-living-in-households.
2015 Census Population CMAP Adults + Children CMAP/Census CMAP 7 counties 8,532,681 8,388,442 0.98
CMAP Modeling Region 10,568,198 10,312,287 0.98 Figure 3: Population Comparison
As expected, the CMAP value is slightly less than the Census total (due primarily to the omission of persons-in-group-quarters9), with this shortfall confirmed when scrutinizing townships with major higher education campuses or military installations (e.g. Great Lakes Naval Training Center in Shields Township, Lake County). CMAP’s 2015 county totals are all within 3% of Census. See Figure 410.
6 https://www2.census.gov/programs-surveys/popest/technical-documentation/methodology/2010-2017/2017-natstcopr-meth.pdf 7 People not living in households are classified as living in group quarters (e.g. dormitories, military barracks, group-homes). Trips made by persons in group quarters are calculated separately within the CMAP trip generation model and are not included in this analysis. Incarcerated persons are not included in the CMAP group-quarters variable(s), though they do appear in the full enumeration. 8 https://www.census.gov/quickfacts/fact/note/US/HSD410217 9 Only the portions of Lee and Ogle Counties included in the CMAP modeling zone system are included in the CMAP totals for this table. All of Lee and Ogle counties are included in the Census totals. Because these counties are primarily rural in character, the differences in household and job totals are minimal at this scale. 10 The rural portions of Lee and Ogle Counties included in the CMAP modeling zone system are not included in this chart.

Wies: Socioeconomic Forecasting 4/9/2020 p. 6
Figure 4: 2015 Population ranked by County comparison
2.3 Existing employment data Figure 5 compares three independent estimates: County Business Patterns (CBP)11, Bureau of Labor Statistics (BLS)12 and Bureau of Economic Analysis (BEA)13 with CMAP’s 2015 “total employment” variable. With respect to employment estimates, there is considerable variation in how a “job” is defined across data sources, leading to a range of employment estimates depending on the source. The Policy-Neutral forecast is reconciled with the BLS estimates because these are most consistent with the number of “employed persons” (i.e. workers) found among the population.
2015 CMAP Total Employment CBP CMAP/CBP BLS CMAP/BLS BEA CMAP/BEA
CMAP 7 counties 4,085,500 3,790,917 1.08 4,016,846 1.02 5,465,761 0.75
CMAP Modeling
Region 4,837,553
4,481,160
1.08
4,791,156
1.01
6,488,390
0.75
Figure 5: 2015 Employment Comparison
11 https://www.census.gov/programs-surveys/cbp/technical-documentation/methodology.html 12 https://www.bls.gov/cew/ 13 https://www.bea.gov
0%
20%
40%
60%
80%
100%
Census 2015 CMAP 2015
CookDuPageLakeWillKaneLake, INMcHenryWinnebagoRacine, WIKenosha, WIPorter, INKendallKankakeeLasalleLaPorte, INDeKalbWalworth, WIBooneGrundy

Wies: Socioeconomic Forecasting 4/9/2020 p. 7
Figure 6: 2015 Employment ranked by County comparison
Figure 6 offers visual confirmation that the relative proportion of jobs within counties is correct. The CBP and BEA differences are consistent with an alternate definition of a “job” used by those sources. In all three cases, however, Cook County consistently holds 53% of the total number of jobs with the remaining county shares not varying by more than 1%.
2.4 Future year benchmarks Benchmarks are data points from outside sources that offer a comparison to the forecast values being calculated in this study. County-level population and employment projections from three proprietary sources are used to benchmark both the CMAP and Policy-Neutral forecasts. Woods & Poole14 and Moody’s15 are commercial products that provide population and employment data for a wide variety of business customers. The University of Illinois at Urbana Champaign Regional Economics Applications Laboratory (UIUC/REAL)16 prepares similar projections for their internal research program as well as for outside clients. The technical process used to develop the CMAP forecast is found in the document “ON TO 2050 Socioeconomic Forecast17. The technical process used to develop the Policy-Neutral forecast is found in Section 3: Technical Forecasting Process of this report. Figure 7 and Figure 8 allow a general
14 Source: Woods & Poole Economics, Inc. Washington, D.C. Copyright 2019. Woods & Poole does not guarantee the accuracy of this data. The use of this data and the conclusion drawn from it are solely the responsibility of the client. 15 Moody’s Analytics, Economic Data and Forecasts, moodysanalytics.com 16 University of Illinois at Urbana-Champaign, Regional Economics Application Laboratory, real.illinois.edu. Data source: Appendix_A4_1944TAZs transmitted to client 8/2019. 17 CMAP, ON TO 2050 Socioeconomic Forecast, 2018. https://datahub.cmap.illinois.gov/dataset/2050-forecast-of-population-households-and-employment. Retrieved, 10/2019
-
1,000,000
2,000,000
3,000,000
4,000,000
5,000,000
6,000,000
7,000,000
2015 BEA 2015 CBP 2015 BLS 2015 CMAP
CookDuPageLakeWillKaneLake, INWinnebagoMcHenryRacine, WIKenosha, WIPorter, INLaSalleKankakeeLaPorte, INWalworth, WIDeKalbKendallGrundyBoone

Wies: Socioeconomic Forecasting 4/9/2020 p. 8
comparison of population and employment totals across the modeling region18. Individual county-level comparisons between these sources appear in Appendix E.
2.4.1 Forecast population Comparing both the CMAP and Policy-Neutral population forecasts to the independently prepared benchmarks across the modeling region, CMAP’s ON TO 2050 forecast is the most optimistic. The Policy-Neutral forecast follows the same general growth trajectory as CMAP with a more conservative outcome. The independent econometric forecasts show population growth to be nearly level or in decline, consistent with recent historical trends. See Figure 7.
Population 2020 2030 2040 2050 W&P 10,649,139 10,971,096 11,171,167 11,298,155
Moody's 10,464,057 10,334,264 9,995,175 9,602,735 UIUC 10,804,481 11,319,738 11,803,419 12,193,267 CMAP 10,938,151 11,981,811 12,799,950 13,463,945
Policy Neutral 10,498,577 10,882,676 11,283,853 11,704,553
Figure 7: Population forecast comparison with benchmarks, modeling region
18 Because of minor variations in the variables and geographic extent of each source, these totals are only generally comparable at the regional scale. Specifically, just the portions of Lee, Ogle and LaSalle Counties within the CMAP modeling zone system are included in the CMAP and Policy-Neutral totals. W&P and Moody’s benchmark totals cover these counties in their entirety. UIUC does not include forecasts for Racine County, WI or LaPorte County, IN.
-
2,000,000
4,000,000
6,000,000
8,000,000
10,000,000
12,000,000
14,000,000
16,000,000
2020 2030 2040 2050
Population
W&P Moody's UIUC CMAP Policy Neutral

Wies: Socioeconomic Forecasting 4/9/2020 p. 9
2.4.2 Forecast employment Comparing the employment forecasts with their respective benchmarks, one observes close alignment between all sources. See Figure 819. The difference seen beginning in 2020 is due in part to variation in employment definition. The subsequent convergence is due to a difference in assumed growth rates.
Employment 2020 2030 2040 2050 W&P 6,860,077 7,507,075 8,026,782 8,454,959
Moody's 5,263,333 5,462,616 5,621,798 5,808,372 UIUC 5,180,695 5,503,902 5,777,768 6,121,418 CMAP 5,034,039 5,253,381 5,542,205 5,870,691
Policy Neutral 4,931,973 5,154,438 5,413,435 5,720,856
Figure 8: Employment forecast comparison with benchmarks, modeling region
3 Technical Forecasting Process The Policy-Neutral forecast is produced using two distinct methods applied to different parts of the modeling region. Within the seven Illinois counties surrounding Chicago (referred to as “Internal” in this report), current land use density is used to estimate future population and employment levels. For the remaining fourteen counties (referred to as “External”), locally-based and proprietary econometric future year benchmarks are used to adjust CMAP’s ON TO 2050 forecast20. In Figure 10, the Internal area includes the geography covered by the fine-grained subzone grid consisting of the seven full Illinois
19 Woods & Poole employment forecasts are shown in the table but not included in this chart due to a substantial variance in the total resulting from the use of a different definition of employment. Also see previous footnote. 20 The External part of the modeling region covers about 60% of the land area but contains only about 20% of the population and 15% of its employment.
-
1,000,000
2,000,000
3,000,000
4,000,000
5,000,000
6,000,000
7,000,000
2020 2030 2040 2050
Employment
Moody's UIUC CMAP Policy Neutral

Wies: Socioeconomic Forecasting 4/9/2020 p. 10
counties including and surrounding Cook21. The External area includes the remainder of the modeling region.22
Figure 9: Counties in the CMAP modeling region with subzone grid shown.
3.1 Internal forecast calculation method
For the internal part of the region surrounding Chicago, information in the Land Use Inventory (LUI) is used both to calculate the density of existing residential or commercial development and to identify parcels available for new development. These land use characteristics are then matched to current population and employment values to calculate the “carrying capacity” for future growth. The carrying capacity calculation occurs in two steps. First, an average density of households and jobs surrounding a single subzone is calculated to determine the existing intensity of neighboring development that can be expected to influence future growth. Second, this average density is applied to vacant or agricultural land within the central subzone to provide the estimated number of households or jobs expected to eventually occupy those parcels. Technical details including an example of this calculation for a single subzone are found in Appendix B. The results of the carrying capacity calculation were validated by visually comparing aerial imagery with land use and base year socioeconomic data at the township level.
3.2 External forecast calculation method Forecasts for the External area are calculated by adjusting CMAP’s forecast to match the average of selected county estimates taken from the proprietary econometric future year benchmark sources as
21 The three townships outside the seven counties covered by the fine-grained subzone grid are included in the External area. 22 Note that only portions of primarily rural Lee, Ogle and LaSalle Counties are included in the modeling region.

Wies: Socioeconomic Forecasting 4/9/2020 p. 11
well as available planning estimates of future population and employment prepared by neighboring Metropolitan Planning Organizations (MPOs). These include:
• Northwestern Indiana Regional Planning Commission (NIRPC): covering three complete counties in Indiana surrounding the city of Gary: Lake, Porter and LaPorte.
• Southeastern Wisconsin Regional Planning Commission (SEWRPC): covering several counties in Wisconsin surrounding the city of Milwaukee. Three of these are included in CMAP modeling region: Racine, Kenosha and Walworth.
• Region 1 Planning Council (formerly RMAP): covering several counties in Illinois surrounding the city of Rockford. Two of these are included in the CMAP modeling area: Winnebago and Boone.
• Kankakee Area Transportation Study (KATS): covering Kankakee County in Illinois including the city of Kankakee.
The remaining external counties in Illinois (DeKalb, Grundy, most of LaSalle and the eastern parts of Lee and Ogle counties) are primarily rural in character and served by small county governments. No locally generated population and employment forecasts were found for these jurisdictions. Proprietary benchmark estimates were used to adjust CMAP values for the portions of these counties included in the modeling region. Technical details, including the factors used to adjust the CMAP forecasts for the External counties, are found in Appendix C.

Wies: Socioeconomic Forecasting 4/9/2020 p. 12
Appendix A. Definition of geographic units and district aggregations The forecasts prepared in this study conform to the zone systems established by Chicago Metropolitan Agency for Planning in 2017 for use in regional travel demand modeling. The two coterminous zone systems are labeled respectively: “Zone17” and “Subzone17”23. See Figure 10 and Figure 11. Note that the geographic extent of this zone system is not entirely congruent with established county boundaries. In particular, only portions of primarily rural Lee, Ogle and LaSalle counties in Illinois are covered by the zone system.
Figure 10: Study area defined by CMAP Zone17 modeling system
23 The appended numerals refer to the year that CMAP established this zone and subzone system, distinguishing it from earlier versions (e.g. “Zone17” vs. “Zone09”).

Wies: Socioeconomic Forecasting 4/9/2020 p. 13
Figure 11: CMAP Subzone17 system. Denser grid is the CMAP Planning Area: 7 counties plus additional townships.
The origin-destination tables and traffic assignment steps of the regional travel demand model utilize the Zone17 Traffic Analysis Zone (TAZ) system. The socioeconomic forecasts, however, are developed at the finer-grained Subzone17 level. Because subzones are always coterminous with Zone17, the forecast results are easily aggregated for subsequent use in travel demand modeling.
All subzone boundaries conform to the United States Public Land Survey System (PLSS) developed originally for writing legal descriptions of individual parcels. In most of the Midwest, the PLSS consists of a regular grid of ¼-mile squares. The CMAP subzone system is based on this grid. There are 17,418 subzones in the 21-county CMAP modeling region. 16,714 of these subzones, at the fine-grained geography of ¼ square mile or less, cover the area within CMAP’s official planning jurisdiction. Of these, 16,426 subzones are within the seven Illinois counties surrounding Chicago24. Outside the official CMAP planning area, the remainder of subzones are aggregated to larger PLSS units. Figure 12 gives a comparison of the number of zones and subzones found in each county.
24 The seven full counties: Cook, DuPage, Kendall, Kane, Lake, McHenry and Will comprise the “Internal” area referenced throughout this report. Three urbanized townships included in CMAP’s planning area: Aux Sable (in Grundy County) and Sandwich/Somonauk (in DeKalb County) are included in the “External” area.

Wies: Socioeconomic Forecasting 4/9/2020 p. 14
Number of CMAP Zone17 polygons
Number of CMAP Subzone17 polygons
District State County County
FIPS code
1,732 3,895 Internal IL COOK 17031 DUPAGE 17043 379 1,357 KANE 17089 193 2,154 KENDALL 17093 21 1,296 LAKE 17097 258 1,896 MCHENRY 17111 119 2,444 WILL 17197 224 3,384
External IL BOONE 17007 25 25 DEKALB 17037 46 189 GRUNDY 17063 24 167 KANKAKEE 17091 52 52 LASALLE (part) 17099 72 72 LEE (part) 17103 6 6 OGLE (part) 17141 17 17 WINNEBAGO 17201 79 79
IN LAKE 18089 97 97 LAPORTE 18091 56 56 PORTER 18127 67 67
WI KENOSHA 55059 45 45 RACINE 55101 56 56 WALWORTH 55127 64 64
All 3,632 17,418 Figure 12: CMAP modeling zone system. Count of Zone17 and Subzone17 by county.
Appendix B. Internal district forecast method This appendix provides specific details of how carrying capacity is calculated within the 7-county internal portion of the CMAP modeling region and provides an example for a single subzone. Carrying capacity is based on two factors: the average household or job density in areas surrounding a specific subzone and the amount of developable land within that subzone.
The data resources used to calculate carrying capacity at the subzone level are readily available with no restrictions with respect to this scope-of-work.
• CMAP Trip Generation Zone (subzone17) Geography (the geographic unit of analysis)25 • CMAP C19Q1 Socioeconomic data for 2015 (households and jobs within subzones)26
25Chicago Metropolitan Agency for Planning, Trip Generation Zones, https://www.cmap.illinois.gov/data/transportation/modeling, retrieved 12/2019. 26 Chicago Metropolitan Agency for Planning, 2019 First Quarter Conformity Analysis, https://www.cmap.illinois.gov/data/transportation/modeling, retrieved 12/2019.

Wies: Socioeconomic Forecasting 4/9/2020 p. 15
• CMAP 2015 Land Use Inventory (parcel level land use data for density calculations and locations of developable land)27
Within the 7-county CMAP planning region covered by the Land Use Inventory (LUI), GIS software is used to generate buffer rings around each subzone at four successive radii: 0.75, 1.25, 1.75 and 2.25 miles. These half-mile increments have the effect of including an additional band of neighboring subzones with each successive ring. Within each buffer ring, the set of neighboring subzones is identified. Socioeconomic and land use attributes both within each subzone and among neighboring subzones within the buffer rings are then summed. This permits analysis of accumulated surrounding data to about 64 subzones comprising a ring 4.5 miles in diameter (about 16 square miles) centered on each centroid in the region. See Figure 13. Within each of these rings (inclusive of the interior rings), a list of summary statistics is tabulated from each centroid within the ring with the results being indexed to the current subzone record.
Figure 13: Example of selected subzone centroid and buffer polygons
Once assembled, the variables are organized and simplified for subsequent use. In particular, the multiple land use categories found in the Land Use Inventory (LUI) are distilled into three main categories: developed, developable and undevelopable. Depending on certain characteristics (e.g.
27 Chicago Metropolitan Agency for Planning, 2015 Land Use Inventory. https://www.cmap.illinois.gov/data/land-use. Retrieved 12/2019.

Wies: Socioeconomic Forecasting 4/9/2020 p. 16
schools, land platted for a specific use), additional distinctions are made to guide the carrying capacity calculation.
Average household and employment densities are then calculated for each buffer surrounding an individual subzone28. The resulting set of five values (one value for each buffer plus the central subzone itself) establishes a vector of the change in average density at increasing distances from the central subzone representing a function of the prevailing land use within and surrounding each subzone. The average density calculation does not directly weight the buffers based on their size or distance from the subzone centroid. But because each successive buffer includes the centroids from the buffer contained within, the smaller and closer-in buffers are represented more than once. This effectively establishes a distance-decay weight on the density calculation.
For each subzone, an average density (with its attendant percent standard deviation) is taken from the density calculations comprising each buffer. In this application, the average household density within 2.25 miles of the subzone centroid is used for the household carrying capacity calculation. Because employment tends to be concentrated within smaller areas of land at higher density, the average employment density within 0.75 miles of the subzone centroid is used for the employment carrying capacity calculation.
Location of subzones having >30,000 jobs per square
mile (2015)
2050 Policy -Neutral Employment Forecast
constrained by developable land
2050 Policy-Neutral Employment Forecast unconstrained by
developable land in subzones with more than 30,000 jobs/square mile
Chicago CBD 552,929 763,031 Chicago balance 159,338 210,646
Cook County balance 79,395 98,205 DuPage County 17,120 30,215
Lake County 7,882 13,152 Total 816,664 1,115,249
Figure 14: Comparison of Policy-Neutral forecasts in high-density job centers
The employment carrying capacity in subzones exceeding 30,000 jobs per square mile (e.g. Chicago CBD, Schaumburg, Oak Brook) is not constrained by the amount of developable land available in recognition of the more intensive property utilization techniques available for high-density commercial and office uses to accommodate additional employees (e.g. multi-story buildings). In these locations the average employee densities are applied to all undeveloped and developed land. The effect of relaxing this constraint is shown in Figure 14.
28 Note regarding school employment: School locations are typically located within the residential communities they serve and do not cluster with other non-residential land uses. Therefore, school employment is removed from the employment density calculation to avoid propagating new employment within predominantly residential areas. The number of school jobs, however, is retained and contributes to the total employment for the subzone.

Wies: Socioeconomic Forecasting 4/9/2020 p. 17
Example of carrying capacity calculation for a single subzone The following example is provided as a “walk-through” of the carrying capacity calculation for a single subzone located on the western edge of the village of Plainfield, Illinois in a rapidly urbanizing part of Will County. See Figure 15.
Figure 15: Highlighted subzone 15736 in Plainfield Township, Will County
The CMAP subzone17 identified as number 15736 is selected because it provides a good example of the influence that existing density plays on the calculated carrying capacity for adjacent vacant or agricultural land. Aerial imagery overlaid on Land Use Inventory data confirms the presence of undeveloped land to the west and suburban densities to the east with considerable developable land remaining within the subzone itself. See Figure 16.
Figure 16: Highlighted subzone 15736 with aerial imagery and Land Use Inventory data

Wies: Socioeconomic Forecasting 4/9/2020 p. 18
Figure 17 is a table showing the variables and values used in calculating the carrying capacity for subzone 15736.
Variable# Variable Label Variable Name Value v1 CMAP subzone17 id subzone17 15736 v2 total square miles sqmi 0.24799 v3 residential developed square miles lu13 0.086616 v4 non-residential developed square miles lu25 0 v5 developable square miles lu3 0.12525 v6 2015 Households i13 218 v7 2015 Total Employment i25 2 v8 CMAP 2050 Households j13 516 v9 CMAP 2050 Total Employment j25 99 v10 i13 within 0.75 miles i13sum075 867 v11 i13 within 1.25 miles i13sum125 2054 v12 i13 within 1.75 miles i13sum175 3838 v13 i13 within 2.25 miles i13sum225 7252 v14 i25 within 0.75 miles i25sum075 183 v15 i25 within 1.25 miles i25sum125 1340 v16 i25 within 1.75 miles i25sum175 2471 v17 i25 within 2.25 miles i25sum225 4353 v18 lu13 within 0.75 miles lu13sum075 0.82281 v19 lu13 within 1.25 miles lu13sum125 1.44978 v20 lu13 within 1.75 miles lu13sum175 3.31255 v21 lu13 within 2.25 miles lu13sum225 5.77682 v22 lu25 within 0.75 miles lu25sum075 0.32025 v23 lu25 within 1.25 miles lu25sum125 0.67864 v24 lu25 within 1.75 miles lu25sum175 1.43391 v25 lu25 within 2.25 miles lu25sum225 2.412 v26 i13/lu13 within subzone29 i13lu13 1053.71 v27 13/lu13 within 0.75 miles i13lu13_075 1053.71 v28 i13/lu13 within 1.25 miles i13lu13_125 1416.77 v29 i13/lu13 within 1.75 miles i13lu13_175 1158.62 v30 i13/lu13 within 2.25 miles i13lu13_225 1255.36 v31 i25/lu25 in subzone i25lu25 571.433 v32 i25/lu25 within 0.75 miles i25lu25_075 571.433 v33 i25/lu25 within 1.25 miles i25lu25_125 1974.52 v34 i25/lu25 within 1.75 miles i25lu25_175 1723.26 v35 i25/lu25 within 2.25 miles i25lu25_225 1804.73 v36 Household density in buffer i13df 1187.63 v37 Household carrying capacity i13cc 326.586 v38 employment density in buffer i25df 571.433 v39 employment carrying capacity i25cc 21.3261 v40 mean(i13/(i13+i25) including buffer i13i25mix 0.72998 v41 household carrying capacity growth i13g 108.586 v42 employment carrying capacity growth i25g 19.3261
Figure 17: Input and output values used in calculating carrying capacity for subzone 15736
29 Note that density values for larger buffers carry over to the smaller buffers when little or no land use is present to provide a valid density.

Wies: Socioeconomic Forecasting 4/9/2020 p. 19
Following is a generalized narrative describing the household carrying capacity calculation.
• In 2015 there were 218 households in subzone 15736 (v6) • About 0.13 square miles remain available for future development (v5) • The average household density within the 2.25 buffer is about 1188 households per square mile
(v36), based on the average of v26 through v30 • The average household/employment mix for 2015, including the central subzone is about 73%
(v40=mean((v6/(v6+v7)) + (v10/(v10+v14)) +…+ (v13/(v13/v17)))) • The household/employment mix is applied to the amount of available land; about 0.09 square
miles (v40*v5) • This results in carrying capacity for about 109 new households (v40*v5*v36=v41) • Adding the new households to the existing households results in a forecast value for the entire
subzone of 327 households (v41+v6=v37)
Following is a generalized narrative describing the employment carrying capacity calculation.
• In 2015 there were 2 jobs in subzone 15736 (v7) • About 0.13 square miles remain available for future development (v5) • The average employment density within the 0.75 buffer is about 571 jobs per square mile (v38),
based on the average of v31 through v3230 • The average household/employment mix for 2015, including the central subzone is about 73%
(v40=mean((v6/(v6+v7))+(v10/(v10+v14))+…+(v13/(v13/v17)))) • The employment/household mix is applied to the amount of available land; about 0.03 square
miles ((1-v40)*v5) • This results in carrying capacity for about 19 new jobs ((1-v40)*v5*v38=v42) • Adding the new jobs to the existing jobs results in a forecast value for the entire subzone of 21
jobs (v42+v7=v39)
Appendix C. External district forecast method The forecast for the External district is the product of adjusting corresponding ON TO 2050 forecast values to more closely match outside (i.e. non-CMAP) benchmark estimates.
The non-CMAP sources were grouped and averaged by county to factor CMAP’s estimate at the subzone level. Because these data sources are derived from different assumptions and methods, those selected for inclusion were determined on a case-by-case basis, guided by the need to keep the adjustments within an intuitive and reasonable range of each other. Non-CMAP sources with estimates that varied widely from the remaining sources (or were simply not available) were excluded from the adjustment calculation. In particular, Woods & Poole estimates were not included in the employment average due to the definition of a “job” resulting in a substantially larger value than the other sources.
Separate adjustment factors were calculated for Winnebago and Boone Counties (Region 1: RMAP) because they are directly served by an Illinois Tollway facility. Kankakee County’s MPO (KATS) provided
30 See previous note.

Wies: Socioeconomic Forecasting 4/9/2020 p. 20
limited forecast information31. The Indiana and Wisconsin MPOs (NIRPC and SEWRPC) county-level forecasts rank differently than CMAP’s estimate and thus are grouped into a single adjustment factor for each. The remaining primarily rural Illinois counties do not publish forecast data, so the proprietary sources are grouped and averaged for a single adjustment factor.
2050 Population 2050 Employment
County(ies) CMAP non-CMAP average factor CMAP non-CMAP
average factor
Winnebago 350,474 320,478 0.91 161,028 154,224 0.96 Boone 85,651 74,777 0.87 22,953 24,641 1.07
Kankakee 140,341 132,869 0.95 49,641 50,509 1.02 INDIANA 798,998 792,987 0.99 292,639 335,506 1.15
WISCONSIN 557,592 522,396 0.94 229,016 241,099 1.05 ILLINOIS 341,126 302,157 0.89 108,847 121,676 1.12
Figure 18: External district factors used to adjust CMAP forecast
Figure 18 compares the different forecast values and shows the resulting adjustment factor. These factors are applied at the subzone-level within each county grouping.
Appendix D. Interim year interpolation method The combined Internal and External methods result in subzone-level population and employment forecast values for the year 2050. Interim year estimates for 2020, 2030 and 2040 are needed for certain travel demand model applications.
To maintain the geographic continuity embedded in the subzone-level carrying capacity calculation, an exponential interpolation function is used to increment growth based on the percent standard deviation of development densities found in each subzone’s buffer set. This function has the effect of allowing uniform growth over time in subzones surrounded by uniform density (i.e. low standard deviation), but delays growth in subzones surrounded by non-uniform density (i.e. high standard deviation). See Figure 19.
31 Both RMAP and KATS forecast values were for year 2040. An average across all sources was taken for 2040 and then adjusted by CMAP’s estimate 2050/2040 growth rate.

Wies: Socioeconomic Forecasting 4/9/2020 p. 21
Figure 19: Linear versus log growth rate comparison.
Appendix E. Summary data tables by county This appendix includes data tables and charts that allow comparison of base year, benchmark and forecast values at the county and sub-regional level.
Policy-Neutral population and employment forecasts Figure 20 through Figure 23 provide county-level summaries of the Policy-Neutral and CMAP ON TO 2050 forecasts for the interim and horizon years. Figure 24 and Figure 25 provide a side-by-side comparison of the Policy-Neutral forecasts with the CMAP ON TO 2050 for the horizon year32.
32 The population forecasts are household-based. In the Policy-Neutral forecast, the average number of persons-per-households in each subzone is held constant throughout the forecast period. In the CMAP forecast, persons-per-household in each subzone varies throughout the forecast period.
0%
20%
40%
60%
80%
100%
2010 2020 2030 2040 2050
% g
row
th
Year
Variation in Growth Rate
low standard deviation high standard deviation

Wies: Socioeconomic Forecasting 4/9/2020 p. 22
2015 Population
2020 Policy Neutral Population
2030 Policy Neutral Population
2040 Policy Neutral Population
2050 Policy Neutral Population
Sum Sum Sum Sum Sum district State County
5,148,908 5,189,941 5,273,467 5,359,026 5,446,731 Internal IL COOK DUPAGE 921,429 924,403 930,561 937,016 943,793 KANE 524,753 538,749 568,598 601,233 637,099 KENDALL 123,038 137,499 168,515 202,720 240,690 LAKE 686,299 694,625 711,955 730,258 749,632 MCHENRY 305,787 320,549 351,897 385,957 423,119 WILL 678,228 706,945 767,774 833,689 905,491 SUBTOTAL 8,388,442 8,512,710 8,772,766 9,049,899 9,346,557
External IL County 53,277 57,315 65,390 73,466 81,541 BOONE
DEKALB 97,986 105,229 119,714 134,199 148,685 GRUNDY 50,251 54,914 64,239 73,564 82,890 KANKAKEE 105,739 110,419 119,779 129,139 138,499 LASALLE(part) 107,028 108,789 112,310 115,831 119,352 LEE(part) 3,658 3,708 3,809 3,909 4,010 OGLE(part) 18,724 19,117 19,903 20,689 21,475 WINNEBAGO 282,381 291,276 309,066 326,856 344,646 SUBTOTAL 719,044 750,766 814,210 877,653 941,097
IN County 481,504 486,433 496,290 506,147 516,004 LAKE
LAPORTE 104,450 104,603 104,909 105,214 105,520 PORTER 164,342 171,590 186,087 200,584 215,080 SUBTOTAL 750,296 762,626 787,285 811,945 836,604
WI County 164,059 173,291 191,754 210,218 228,681 KENOSHA
RACINE 190,229 194,670 203,551 212,433 221,314 WALWORTH 100,217 104,515 113,110 121,705 130,300 SUBTOTAL 454,505 472,475 508,415 544,355 580,295
TOTAL 10,312,287 10,498,577 10,882,676 11,283,853 11,704,553 Figure 20: Policy-Neutral population forecast summary by county

Wies: Socioeconomic Forecasting 4/9/2020 p. 23
2015 Population
2020 CMAP Population
2030 CMAP Population
2040 CMAP Population
2050 CMAP Population
Sum Sum Sum Sum Sum district State County
5,148,908 5,414,516 5,864,793 6,190,884 6,339,740 Internal IL COOK DUPAGE 921,429 971,033 1,058,000 1,106,838 1,121,687 KANE 524,753 564,959 641,088 722,756 808,861 KENDALL 123,038 148,451 183,476 214,183 279,748 LAKE 686,299 737,238 819,241 882,136 924,547 MCHENRY 305,787 338,274 390,364 438,357 504,926 WILL 678,228 739,194 839,976 943,424 1,092,794 SUBTOTAL 8,388,442 8,913,665 9,796,939 10,498,577 11,072,302
External IL County 53,277 58,660 68,243 77,138 85,651 BOONE
DEKALB 97,986 106,110 121,202 139,367 155,223 GRUNDY 50,251 55,795 66,313 76,663 87,099 KANKAKEE 105,739 114,060 125,751 133,885 140,341 LASALLE(part) 107,028 112,134 117,180 118,905 120,941 LEE(part) 3,658 3,805 3,974 4,044 4,055 OGLE(part) 18,724 19,540 20,660 21,387 21,830 WINNEBAGO 282,381 298,862 323,032 338,225 350,474 SUBTOTAL 719,044 768,966 846,354 909,614 965,615
IN County 481,504 493,740 510,423 517,291 516,266 LAKE
LAPORTE 104,450 106,823 108,863 107,961 105,528 PORTER 164,342 172,482 190,537 204,678 215,465 SUBTOTAL 750,296 773,045 809,823 829,930 837,259
WI County 164,059 175,896 196,863 214,860 233,035 KENOSHA
RACINE 190,229 199,471 212,771 219,065 223,409 WALWORTH 100,217 107,109 119,060 127,904 132,327 SUBTOTAL 454,505 482,476 528,694 561,829 588,770
TOTAL 10,312,287 10,938,151 11,981,811 12,799,950 13,463,945 Figure 21: CMAP ON TO 2050 population forecast summary by county

Wies: Socioeconomic Forecasting 4/9/2020 p. 24
2015 Employment
2020 Policy Neutral Employment
2030 Policy Neutral Employment
2040 Policy Neutral Employment
2050 Policy Neutral Employment
Sum Sum Sum Sum Sum district State County
2,591,153 2,631,606 2,722,665 2,830,037 2,957,915 Internal IL COOK DUPAGE 615,430 620,470 631,495 644,001 658,326 KANE 210,578 216,163 236,776 262,263 294,694 KENDALL 27,473 31,331 39,851 49,778 61,657 LAKE 338,104 344,823 360,235 379,023 402,399 MCHENRY 98,158 101,678 115,263 131,323 150,789 WILL 204,604 216,203 243,166 276,733 319,509 SUBTOTAL 4,085,500 4,162,275 4,349,451 4,573,157 4,845,289
External IL County 17,215 18,095 19,855 21,615 23,375 BOONE
DEKALB 37,259 38,045 39,618 41,191 42,763 GRUNDY 18,632 19,160 20,215 21,270 22,325 KANKAKEE 42,985 43,952 45,887 47,822 49,757 LASALLE(part) 43,412 43,622 44,042 44,463 44,883 LEE(part) 254 254 254 253 253 OGLE(part) 6,888 6,886 6,883 6,879 6,876 WINNEBAGO 127,391 131,993 141,198 150,402 159,607 SUBTOTAL 294,036 302,008 317,952 333,896 349,840
IN County 185,816 184,515 181,912 179,310 176,707 LAKE
LAPORTE 40,463 41,306 42,992 44,679 46,365 PORTER 58,731 60,439 63,854 67,269 70,684 SUBTOTAL 285,010 286,260 288,759 291,258 293,757
WI County 59,214 62,781 69,915 77,049 84,183 KENOSHA
RACINE 73,731 76,670 82,548 88,426 94,304 WALWORTH 40,062 41,979 45,814 49,649 53,484 SUBTOTAL 173,007 181,430 198,277 215,124 231,971
TOTAL 4,837,553 4,931,973 5,154,438 5,413,435 5,720,856 Figure 22: Policy-Neutral employment forecast summary by county

Wies: Socioeconomic Forecasting 4/9/2020 p. 25
2015 Employment
2020 CMAP Employment
2030 CMAP Employment
2040 CMAP Employment
2050 CMAP Employment
Sum Sum Sum Sum Sum district State County
2,591,153 2,690,153 2,792,464 2,910,791 3,009,412 Internal IL COOK DUPAGE 615,430 632,489 656,280 684,282 707,881 KANE 210,578 222,797 237,637 262,759 301,364 KENDALL 27,473 28,505 32,250 38,538 53,846 LAKE 338,104 350,312 368,695 391,652 416,748 MCHENRY 98,158 102,317 111,750 125,251 148,335 WILL 204,604 233,915 257,850 296,712 361,851 SUBTOTAL 4,085,500 4,260,488 4,456,926 4,709,985 4,999,437
External IL County 17,215 20,381 20,983 21,926 22,953 BOONE
DEKALB 37,259 37,453 38,558 40,292 42,183 GRUNDY 18,632 19,475 20,057 20,957 21,936 KANKAKEE 42,985 44,075 45,378 47,422 49,641 LASALLE(part) 43,412 39,712 40,895 42,720 44,728 LEE(part) 254 225 231 239 253 OGLE(part) 6,888 6,104 6,289 6,566 6,877 WINNEBAGO 127,391 142,971 147,206 153,810 161,028 SUBTOTAL 294,036 310,396 319,597 333,932 349,599
IN County 185,816 157,930 162,600 169,910 177,871 LAKE
LAPORTE 40,463 40,496 41,697 43,568 45,611 PORTER 58,731 61,400 63,212 66,057 69,157 SUBTOTAL 285,010 259,826 267,509 279,535 292,639
WI County 59,214 73,627 75,814 79,212 82,932 KENOSHA
RACINE 73,731 82,809 85,259 89,091 93,273 WALWORTH 40,062 46,893 48,276 50,450 52,811 SUBTOTAL 173,007 203,329 209,349 218,753 229,016
TOTAL 4,837,553 5,034,039 5,253,381 5,542,205 5,870,691 Figure 23: CMAP ON TO 2050 employment forecast summary by county

Wies: Socioeconomic Forecasting 4/9/2020 p. 26
2015 Population 2050 Policy Neutral Population 2050 CMAP Population Sum Sum Sum
district State County 5,148,908 5,446,731 6,339,740 Internal IL COOK
DUPAGE 921,429 943,793 1,121,687 KANE 524,753 637,099 808,861 KENDALL 123,038 240,690 279,748 LAKE 686,299 749,632 924,547 MCHENRY 305,787 423,119 504,926 WILL 678,228 905,491 1,092,794 SUBTOTAL 8,388,442 9,346,557 11,072,302
External IL County 53,277 81,541 85,651 BOONE
DEKALB 97,986 148,685 155,223 GRUNDY 50,251 82,890 87,099 KANKAKEE 105,739 138,499 140,341 LASALLE(part) 107,028 119,352 120,941 LEE(part) 3,658 4,010 4,055 OGLE(part) 18,724 21,475 21,830 WINNEBAGO 282,381 344,646 350,474 SUBTOTAL 719,044 941,097 965,615
IN County 481,504 516,004 516,266 LAKE
LAPORTE 104,450 105,520 105,528 PORTER 164,342 215,080 215,465 SUBTOTAL 750,296 836,604 837,259
WI County 164,059 228,681 233,035 KENOSHA
RACINE 190,229 221,314 223,409 WALWORTH 100,217 130,300 132,327 SUBTOTAL 454,505 580,295 588,770
TOTAL 10,312,287 11,704,553 13,463,945 Figure 24: Comparison of Policy-Neutral and CMAP ON TO 2050 population forecast summary by county
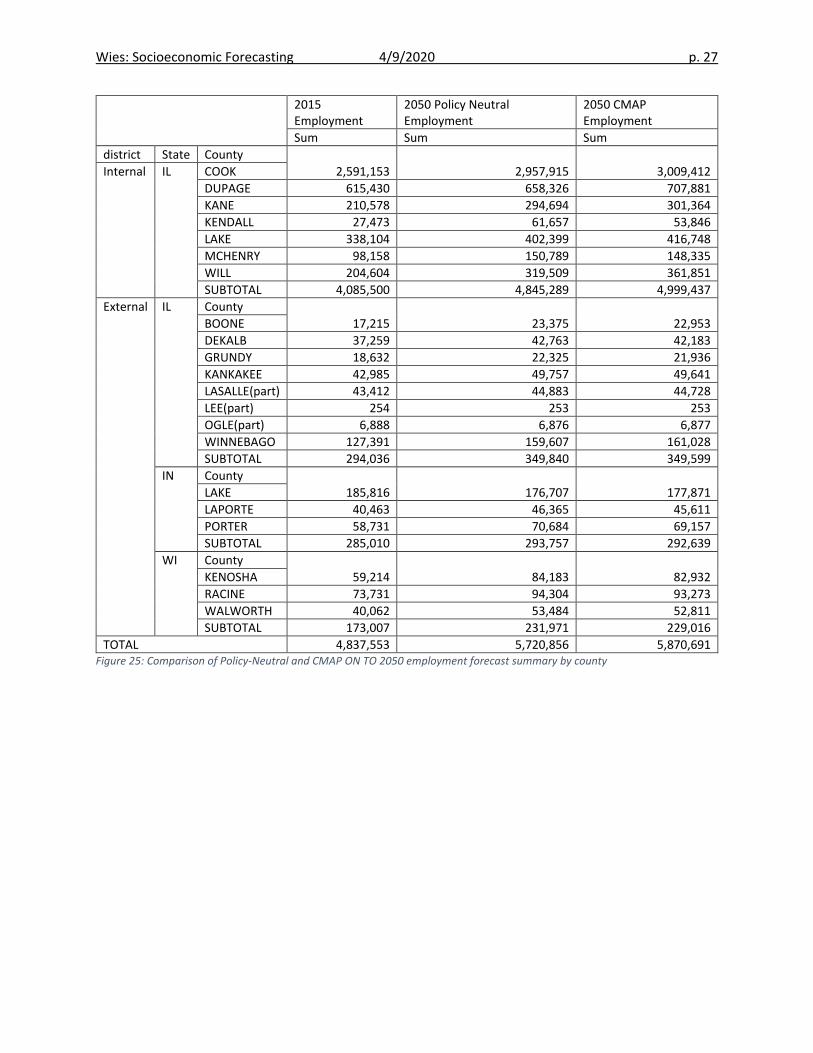
Wies: Socioeconomic Forecasting 4/9/2020 p. 27
2015 Employment
2050 Policy Neutral Employment
2050 CMAP Employment
Sum Sum Sum district State County
2,591,153 2,957,915 3,009,412 Internal IL COOK DUPAGE 615,430 658,326 707,881 KANE 210,578 294,694 301,364 KENDALL 27,473 61,657 53,846 LAKE 338,104 402,399 416,748 MCHENRY 98,158 150,789 148,335 WILL 204,604 319,509 361,851 SUBTOTAL 4,085,500 4,845,289 4,999,437
External IL County 17,215 23,375 22,953 BOONE
DEKALB 37,259 42,763 42,183 GRUNDY 18,632 22,325 21,936 KANKAKEE 42,985 49,757 49,641 LASALLE(part) 43,412 44,883 44,728 LEE(part) 254 253 253 OGLE(part) 6,888 6,876 6,877 WINNEBAGO 127,391 159,607 161,028 SUBTOTAL 294,036 349,840 349,599
IN County 185,816 176,707 177,871 LAKE
LAPORTE 40,463 46,365 45,611 PORTER 58,731 70,684 69,157 SUBTOTAL 285,010 293,757 292,639
WI County 59,214 84,183 82,932 KENOSHA
RACINE 73,731 94,304 93,273 WALWORTH 40,062 53,484 52,811 SUBTOTAL 173,007 231,971 229,016
TOTAL 4,837,553 5,720,856 5,870,691 Figure 25: Comparison of Policy-Neutral and CMAP ON TO 2050 employment forecast summary by county
Wies: Socioeconomic Forecasting 4/9/2020 p. 28
County-level comparison of Policy-Neutral forecasts to future-year benchmarks Following are county-level summary tables comparing forecasts with corresponding benchmarks. The future years shown are 2020, 2030, 2040 and 2050.. Woods & Poole (W&P)33, Moody’s34 and University of Illinois at Urbana Champaign Regional Economics Application Laboratory (UIUC)35 use proprietary econometric models. Also included are forecasts tabulated from data provided by Chicago Metropolitan Agency for Planning (CMAP) for use in the ON TO 2050 Regional Comprehensive Plan36 as well as forecast estimates from neighboring MPOs where available.
Because Woods & Poole uses a substantially different definition of a “job”, its employment forecast appears in the tables, but is omitted from the employment charts. Alternate definitions of employment among the remaining sources explain the initial differences between employment values. Limited comments are included with a few counties providing clarification of problematic or counter-intuitive observations specific to each.
Internal District The Internal district consists of the seven full Illinois counties surrounding Chicago. They are presented alphabetically: Cook, DuPage, Kane, Kendall, Lake, McHenry and Will; one county per page.
33 Source: Woods & Poole Economics, Inc. Washington, D.C. Copyright 2019. Woods & Poole does not guarantee the accuracy of this data. The use of this data and the conclusion drawn from it are solely the responsibility of the licensee. 34 Moody’s Analytics, Economic Data and Forecasts, moodysanalytics.com 35 The UIUC data used in this study is obtained from an earlier study provided by the client. 36 CMAP, https://datahub.cmap.illinois.gov/, 2019Q1 conformity data sets.
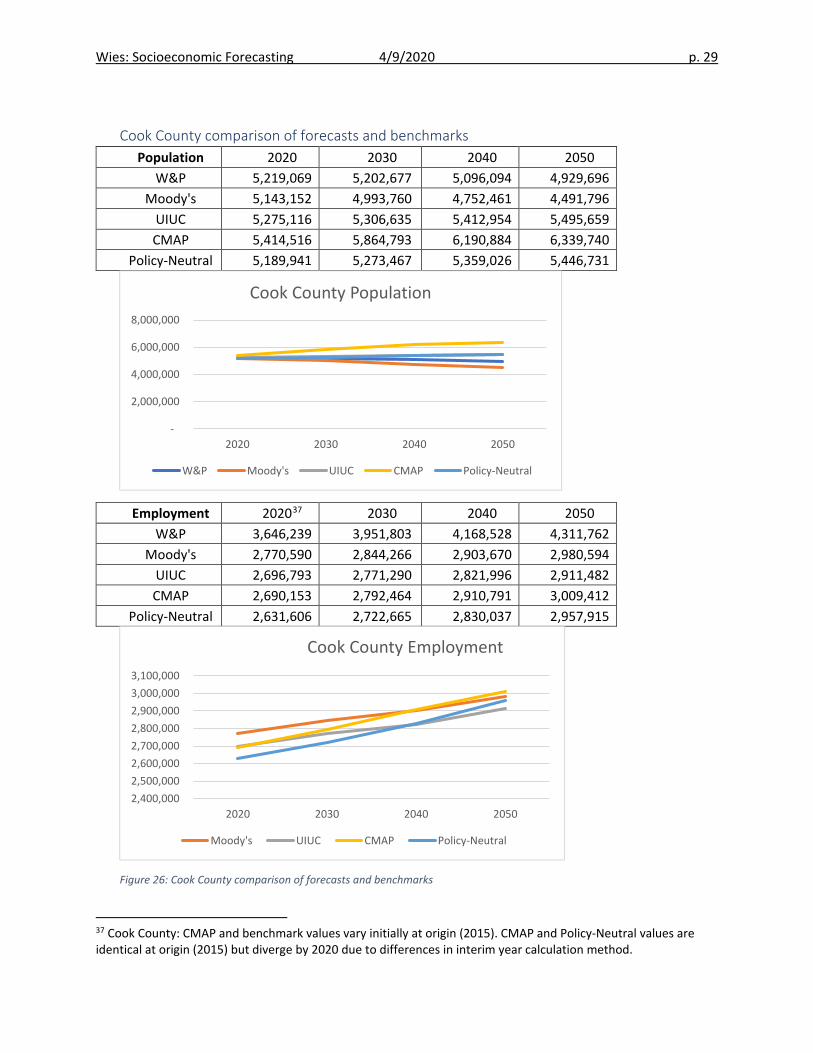
Wies: Socioeconomic Forecasting 4/9/2020 p. 29
Cook County comparison of forecasts and benchmarks Population 2020 2030 2040 2050
W&P 5,219,069 5,202,677 5,096,094 4,929,696 Moody's 5,143,152 4,993,760 4,752,461 4,491,796
UIUC 5,275,116 5,306,635 5,412,954 5,495,659 CMAP 5,414,516 5,864,793 6,190,884 6,339,740
Policy-Neutral 5,189,941 5,273,467 5,359,026 5,446,731
Employment 202037 2030 2040 2050 W&P 3,646,239 3,951,803 4,168,528 4,311,762
Moody's 2,770,590 2,844,266 2,903,670 2,980,594 UIUC 2,696,793 2,771,290 2,821,996 2,911,482 CMAP 2,690,153 2,792,464 2,910,791 3,009,412
Policy-Neutral 2,631,606 2,722,665 2,830,037 2,957,915
Figure 26: Cook County comparison of forecasts and benchmarks
37 Cook County: CMAP and benchmark values vary initially at origin (2015). CMAP and Policy-Neutral values are identical at origin (2015) but diverge by 2020 due to differences in interim year calculation method.
-
2,000,000
4,000,000
6,000,000
8,000,000
2020 2030 2040 2050
Cook County Population
W&P Moody's UIUC CMAP Policy-Neutral
2,400,000 2,500,000 2,600,000 2,700,000 2,800,000 2,900,000 3,000,000 3,100,000
2020 2030 2040 2050
Cook County Employment
Moody's UIUC CMAP Policy-Neutral

Wies: Socioeconomic Forecasting 4/9/2020 p. 30
DuPage County comparison of forecasts and benchmarks Population 2020 2030 2040 2050
W&P 941,131 970,826 984,032 985,030 Moody's 925,121 909,973 866,453 815,588
UIUC 950,836 964,828 988,099 1,006,153 CMAP 971,033 1,058,000 1,106,838 1,121,687
Policy-Neutral 924,403 930,561 937,016 943,793
Employment 2020 2030 2040 2050 W&P 827,657 902,516 960,647 1,002,664
Moody's 666,047 692,683 707,517 723,298 UIUC 646,605 680,429 706,410 741,326 CMAP 632,489 656,280 684,282 707,881
Policy-Neutral 620,470 631,495 644,001 658,326
Figure 27: DuPage County comparison of forecasts and benchmarks
-
200,000
400,000
600,000
800,000
1,000,000
1,200,000
2020 2030 2040 2050
DuPage County Population
W&P Moody's UIUC CMAP Policy-Neutral
550,000
600,000
650,000
700,000
750,000
800,000
2020 2030 2040 2050
DuPage County Employment
Moody's UIUC CMAP Policy-Neutral

Wies: Socioeconomic Forecasting 4/9/2020 p. 31
Kane County comparison of forecasts and benchmarks Population 2020 2030 2040 2050
W&P 552,539 611,547 665,079 714,313 Moody's 533,797 536,825 532,838 530,439
UIUC 616,155 678,514 737,726 786,299 CMAP 564,959 641,088 722,756 808,861
Policy-Neutral 538,749 568,598 601,233 637,099
Employment 2020 2030 2040 2050 W&P 286,614 312,542 332,821 350,017
Moody's 228,792 247,431 263,109 281,147 UIUC 257,627 296,704 336,223 378,490 CMAP 222,797 237,637 262,759 301,364
Policy-Neutral 216,163 236,776 262,263 294,694
Figure 28: Kane County comparison of forecasts and benchmarks
-
200,000
400,000
600,000
800,000
1,000,000
2020 2030 2040 2050
Kane County Population
W&P Moody's UIUC CMAP Policy-Neutral
-
50,000
100,000
150,000
200,000
250,000
300,000
350,000
400,000
2020 2030 2040 2050
Kane County Employment
Moody's UIUC CMAP Policy-Neutral

Wies: Socioeconomic Forecasting 4/9/2020 p. 32
Kendall County comparison of forecasts and benchmarks Population 2020 2030 2040 2050
W&P 136,960 179,819 236,089 309,968 Moody's 130,537 145,287 154,520 160,820
UIUC 149,269 166,305 183,323 197,319 CMAP 148,451 183,476 214,183 279,748
Policy-Neutral 137,499 168,515 202,720 240,690
Employment 2020 2030 2040 2050 W&P 47,943 63,071 82,005 106,769
Moody's 31,250 36,774 41,955 47,423 UIUC 45,544 60,298 71,481 83,103 CMAP 28,505 32,250 38,538 53,846
Policy-Neutral 31,331 39,851 49,778 61,657
Figure 29: Kendall County comparison of forecasts and benchmarks
-
50,000
100,000
150,000
200,000
250,000
300,000
350,000
2020 2030 2040 2050
Kendall County Population
W&P Moody's UIUC CMAP Policy-Neutral
- 10,000 20,000 30,000 40,000 50,000 60,000 70,000 80,000 90,000
2020 2030 2040 2050
Kendall County Employment
Moody's UIUC CMAP Policy-Neutral

Wies: Socioeconomic Forecasting 4/9/2020 p. 33
Lake County comparison of forecasts and benchmarks Population 2020 2030 2040 2050
W&P 714,674 747,046 767,296 778,307 Moody's 700,450 707,229 698,769 686,063
UIUC 741,082 767,207 796,655 820,403 CMAP 737,238 819,241 882,136 924,547
Policy-Neutral 694,625 711,955 730,258 749,632
Employment 2020 2030 2040 2050 W&P 481,021 520,781 550,919 575,492
Moody's 363,086 382,306 399,632 421,062 UIUC 360,423 377,666 392,013 411,325 CMAP 350,312 368,695 391,652 416,748
Policy-Neutral 344,823 360,235 379,023 402,399
Figure 30: Lake County comparison of forecasts and benchmarks
-
200,000
400,000
600,000
800,000
1,000,000
2020 2030 2040 2050
Lake County Population
W&P Moody's UIUC CMAP Policy-Neutral
- 50,000
100,000 150,000 200,000 250,000 300,000 350,000 400,000 450,000
2020 2030 2040 2050
Lake County Employment
Moody's UIUC CMAP Policy-Neutral
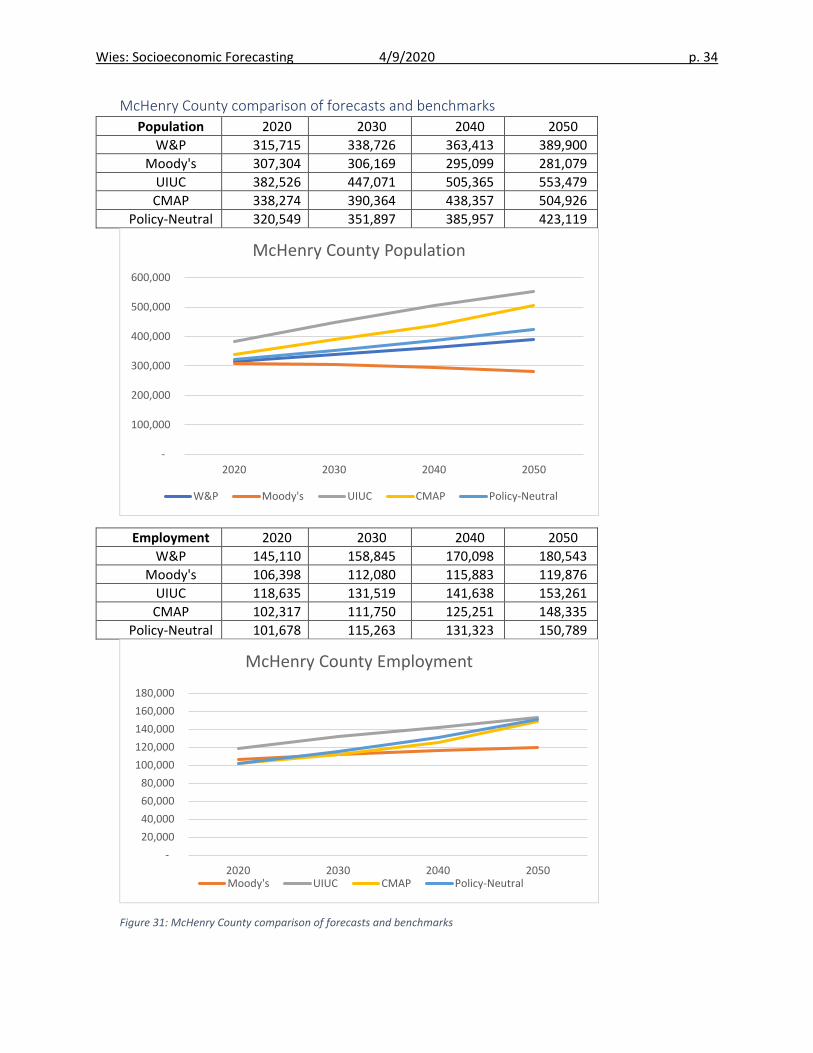
Wies: Socioeconomic Forecasting 4/9/2020 p. 34
McHenry County comparison of forecasts and benchmarks Population 2020 2030 2040 2050
W&P 315,715 338,726 363,413 389,900 Moody's 307,304 306,169 295,099 281,079
UIUC 382,526 447,071 505,365 553,479 CMAP 338,274 390,364 438,357 504,926
Policy-Neutral 320,549 351,897 385,957 423,119
Employment 2020 2030 2040 2050 W&P 145,110 158,845 170,098 180,543
Moody's 106,398 112,080 115,883 119,876 UIUC 118,635 131,519 141,638 153,261 CMAP 102,317 111,750 125,251 148,335
Policy-Neutral 101,678 115,263 131,323 150,789
Figure 31: McHenry County comparison of forecasts and benchmarks
-
100,000
200,000
300,000
400,000
500,000
600,000
2020 2030 2040 2050
McHenry County Population
W&P Moody's UIUC CMAP Policy-Neutral
- 20,000 40,000 60,000 80,000
100,000 120,000 140,000 160,000 180,000
2020 2030 2040 2050
McHenry County Employment
Moody's UIUC CMAP Policy-Neutral

Wies: Socioeconomic Forecasting 4/9/2020 p. 35
Will County comparison of forecasts and benchmarks Population 2020 2030 2040 2050
W&P 722,122 822,955 921,550 1,019,139 Moody's 692,558 702,555 689,068 667,550
UIUC 842,300 973,876 1,092,365 1,190,072 CMAP 739,194 839,976 943,424 1,092,794
Policy-Neutral 706,945 767,774 833,689 905,491
Employment 2020 2030 2040 2050 W&P 358,510 449,345 552,243 667,485
Moody's 252,349 270,661 284,769 299,619 UIUC 278,509 333,407 388,486 446,204 CMAP 233,915 257,850 296,712 361,851
Policy-Neutral 216,203 243,166 276,733 319,509
Figure 32: Will County comparison of forecasts and benchmarks
-
200,000
400,000
600,000
800,000
1,000,000
1,200,000
1,400,000
2020 2030 2040 2050
Will County Population
W&P Moody's UIUC CMAP Policy-Neutral
-
100,000
200,000
300,000
400,000
500,000
2020 2030 2040 2050
Will County Employment
Moody's UIUC CMAP Policy-Neutral

Wies: Socioeconomic Forecasting 4/9/2020 p. 36
External District The External district consists of all or part of the remaining 14 counties covered by the CMAP modeling zone system. MPO counties (non-CMAP) in Illinois, Indiana and Wisconsin are presented first, followed by the remaining non-MPO counties in Illinois. In order: ILLINOIS: Winnebago, Boone, Kankakee. INDIANA: Lake, Porter, LaPorte. WISCONSIN: Kenosha, Racine, Walworth. ILLINOIS: DeKalb, Grundy and LaSalle.
County-level summaries for the portions of primarily rural Lee and Ogle counties that are in the modeling zone system are not included in this section because the modeling zone system covers less than half the county while the benchmark estimates cover the full county. LaSalle County, however, is included because enough of the county is covered by the zone system to permit at least a general comparison to the benchmarks.

Wies: Socioeconomic Forecasting 4/9/2020 p. 37
Winnebago County comparison of forecasts and benchmarks Population 2020 2030 2040 2050
W&P 285,675 288,687 291,730 294,805 Moody's 282,676 278,669 269,628 259,355
UIUC 304,341 332,017 341,202 348,403 CMAP 298,862 323,032 338,225 350,474 RMAP
334,548
Policy-Neutral 291,276 309,066 326,856 344,646
Employment 2020 2030 2040 2050 W&P 165,686 172,196 174,365 173,165
Moody's 136,182 142,246 147,311 153,139 UIUC 151,254 164,996 176,640 190,230 CMAP 142,971 147,206 153,810 161,028 RMAP
187,790
Policy-Neutral 131,993 141,198 150,402 159,607
Figure 33: Winnebago County comparison of forecasts and benchmarks
- 50,000
100,000 150,000 200,000 250,000 300,000 350,000 400,000
2020 2030 2040 2050
Winnebago County Population
W&P Moody's UIUC CMAP Policy-Neutral
-
50,000
100,000
150,000
200,000
2020 2030 2040 2050
Winnebago County Employment
Moody's UIUC CMAP Policy-Neutral

Wies: Socioeconomic Forecasting 4/9/2020 p. 38
Boone County comparison of forecasts and benchmarks Population 2020 2030 2040 2050
W&P 54,906 59,817 65,168 70,997 Moody's 53,700 54,283 52,846 50,711
UIUC 57,962 63,845 66,609 68,827 CMAP 58,660 68,243 77,138 85,651 RMAP
84,755
Policy-Neutral 57,315 65,390 73,466 81,541
Employment 2020 2030 2040 2050 W&P 24,639 28,421 32,564 37,469
Moody's 18,546 19,864 20,698 21,465 UIUC 19,664 21,749 23,574 25,645 CMAP 20,381 20,983 21,926 22,953 RMAP
26,379
Policy-Neutral 18,095 19,855 21,615 23,375
Figure 34: Boone County comparison of forecasts and benchmarks
-
20,000
40,000
60,000
80,000
100,000
2020 2030 2040 2050
Boone County Population
W&P Moody's UIUC CMAP Policy-Neutral
-
5,000
10,000
15,000
20,000
25,000
30,000
2020 2030 2040 2050
Boone County Employment
Moody's UIUC CMAP Policy-Neutral

Wies: Socioeconomic Forecasting 4/9/2020 p. 39
Kankakee County comparison of forecasts and benchmarks Population 2020 2030 2040 2050
W&P 110,254 112,445 114,680 116,960 Moody's 109,219 105,930 100,117 93,738
UIUC 125,049 141,859 150,621 157,741 CMAP 114,060 125,751 133,885 140,341 KATS
141,610
Policy-Neutral 110,419 119,779 129,139 138,499
Employment 2020 2030 2040 2050 W&P 58,749 63,041 65,816 67,300
Moody's 46,541 47,618 48,251 49,051 UIUC 48,671 53,700 57,986 62,890 CMAP 44,075 45,378 47,422 49,641
-
Policy-Neutral 43,952 45,887 47,822 49,757
Figure 35: Kankakee County comparison of forecasts and benchmarks
-
50,000
100,000
150,000
200,000
2020 2030 2040 2050
Kankakee County Population
W&P Moody's UIUC CMAP Policy-Neutral
- 10,000 20,000 30,000 40,000 50,000 60,000 70,000
2020 2030 2040 2050
Kankakee County Employment
Moody's UIUC CMAP Policy-Neutral

Wies: Socioeconomic Forecasting 4/9/2020 p. 40
Lake, IN County comparison of forecasts and benchmarks Population 2020 2030 2040 2050
W&P 487,625 490,294 484,400 472,633 Moody's 483,395 476,632 466,474 455,114
UIUC 505,546 539,662 548,451 555,004 CMAP 493,740 510,423 517,291 516,266 NIRPC
505,066
Policy-Neutral 486,433 496,290 506,147 516,004
Employment 2020 2030 2040 2050 W&P 251,759 267,730 277,080 281,328
Moody's 200,216 202,250 204,208 205,391 UIUC 224,192 245,451 264,381 286,135
CMAP38 157,930 162,600 169,910 177,871 NIRPC
214,783
Policy-Neutral 184,515 181,912 179,310 176,707
Figure 36: Lake County, IN comparison of forecasts and benchmarks
38 Lake County, IN: The drop in CMAP employment from 2015 to 2020 appears to be an error. Lake County 2015 employment is 185,816. Note that Policy-Neutral forecast resolves with Moody’s.
-
200,000
400,000
600,000
2020 2030 2040 2050
Lake County, IN Population
W&P Moody's UIUC CMAP Policy-Neutral
-
100,000
200,000
300,000
400,000
2020 2030 2040 2050
Lake County, IN Employment
Moody's UIUC CMAP Policy-Neutral

Wies: Socioeconomic Forecasting 4/9/2020 p. 41
Porter County comparison of forecasts and benchmarks Population 2020 2030 2040 2050
W&P 171,196 180,843 191,034 201,799 Moody's 171,504 179,863 184,938 187,946
UIUC 172,018 180,102 183,515 186,102 CMAP 172,482 190,537 204,678 215,465 NIRPC
226,979
Policy-Neutral 171,590 186,087 200,584 215,080
Employment 2020 2030 2040 2050 W&P 84,648 95,051 104,631 113,748
Moody's 65,436 70,306 74,579 78,134 UIUC 67,297 74,218 80,502 87,617 CMAP 61,400 63,212 66,057 69,157 NIRPC
84,846
Policy-Neutral 60,439 63,854 67,269 70,684
Figure 37: Porter County, IN comparison of forecasts and benchmarks
-
50,000
100,000
150,000
200,000
250,000
2020 2030 2040 2050
Porter County, IN Population
W&P Moody's UIUC CMAP Policy-Neutral
-
20,000
40,000
60,000
80,000
100,000
2020 2030 2040 2050
Porter County, IN Employment
Moody's UIUC CMAP Policy-Neutral

Wies: Socioeconomic Forecasting 4/9/2020 p. 42
LaPorte County comparison of forecasts and benchmarks Population 2020 2030 2040 2050
W&P 110,108 110,373 110,638 110,903 Moody's 110,115 110,437 109,992 109,184
UIUC - - - - CMAP39 106,823 108,863 107,961 105,528 NIRPC
109,337
Policy-Neutral 104,603 104,909 105,214 105,520
Employment 2020 2030 2040 2050 W&P 53,963 55,057 54,710 53,713
Moody's 41,163 42,088 42,996 43,882 UIUC - - - - CMAP 40,496 42,992 43,568 45,611 NIRPC
43,975
Policy-Neutral 41,306 42,992 44,679 46,365
Figure 38: LaPorte County, IN comparison of forecasts and benchmarks
39 LaPorte County population: Verified with Census: 105k in households, 110k total population. County contains a large prison facility and a university campus. CMAP interim year trajectory suggests that the two population definitions were mixed.
100,000 102,000 104,000 106,000 108,000 110,000 112,000
2020 2030 2040 2050
LaPorte County, IN Population
W&P Moody's CMAP Policy-Neutral
36,000 38,000 40,000 42,000 44,000 46,000 48,000
2020 2030 2040 2050
LaPorte County, IN Employment
Moody's CMAP Policy-Neutral

Wies: Socioeconomic Forecasting 4/9/2020 p. 43
Kenosha County, WI comparison of forecasts and benchmarks Population 2020 2030 2040 2050
W&P 170,807 178,655 186,864 195,449 Moody's 171,474 182,575 191,334 198,512
UIUC 171,195 178,592 180,642 182,089 CMAP 175,896 196,863 214,860 233,035
SEWRPC 210,000 Policy-Neutral 173,291 191,754 210,218 228,681
Employment 2020 2030 2040 2050 W&P 90,423 106,502 124,047 143,858
Moody's 69,289 74,483 79,897 85,907 UIUC 73,714 80,459 86,501 93,479 CMAP 73,627 75,814 79,212 82,932
SEWRPC
90,000 Policy-Neutral 62,781 69,915 77,049 84,183
Figure 39: Kenosha County, WI comparison of forecasts and benchmarks
-
50,000
100,000
150,000
200,000
250,000
2020 2030 2040 2050
Kenosha County, WI Population
W&P Moody's UIUC CMAP Policy-Neutral
-
20,000
40,000
60,000
80,000
100,000
2020 2030 2040 2050
Kenosha County, WI Employment
Moody's UIUC CMAP Policy-Neutral

Wies: Socioeconomic Forecasting 4/9/2020 p. 44
Racine County comparison of forecasts and benchmarks Population 2020 2030 2040 2050
W&P 197,748 202,136 203,661 203,463 Moody's 197,639 201,156 202,132 201,698
UIUC - - - - CMAP 199,471 212,771 219,065 223,409
SEWRPC 210,000 Policy-Neutral 194,670 203,551 212,433 221,314
Employment 2020 2030 2040 2050 W&P 97,899 103,502 106,760 108,598
Moody's 80,068 83,735 87,681 91,708 UIUC - - - - CMAP 82,809 85,259 89,091 93,273
SEWRPC 100,000 Policy-Neutral 76,670 82,548 88,426 94,304
Figure 40: Racine County, WI comparison of forecasts and benchmarks
180,000
190,000
200,000
210,000
220,000
230,000
2020 2030 2040 2050
Racine County, WI Population
W&P Moody's CMAP Policy-Neutral
-
20,000
40,000
60,000
80,000
100,000
2020 2030 2040 2050
Racine County, WI Employment
Moody's CMAP Policy-Neutral

Wies: Socioeconomic Forecasting 4/9/2020 p. 45
Walworth County comparison of forecasts and benchmarks Population 2020 2030 2040 2050
W&P 104,723 109,677 113,220 115,888 Moody's 104,736 107,045 107,681 107,179
UIUC 104,691 108,843 109,789 110,419 CMAP 107,109 119,060 127,904 132,327
SEWRPC
125,000 Policy-Neutral 104,515 113,110 121,705 130,300
Employment 2020 2030 2040 2050 W&P 60,281 65,302 69,268 73,036
Moody's 46,057 48,215 50,375 52,583 UIUC 45,366 50,331 55,114 60,438 CMAP 46,893 48,276 50,450 52,811
SEWRPC
62,000 Policy-Neutral 41,979 45,814 49,649 53,484
Figure 41: Walworth County, WI comparison of forecasts and benchmarks
- 20,000 40,000 60,000 80,000
100,000 120,000 140,000
2020 2030 2040 2050
Walworth County, WI Population
W&P Moody's UIUC CMAP Policy-Neutral
- 10,000 20,000 30,000 40,000 50,000 60,000 70,000
2020 2030 2040 2050
Walworth County, WI Employment
Moody's UIUC CMAP Policy-Neutral

Wies: Socioeconomic Forecasting 4/9/2020 p. 46
DeKalb County comparison of forecasts and benchmarks Population 2020 2030 2040 2050
W&P 106,464 112,441 118,754 125,422 Moody's 103,142 99,651 95,194 91,327
UIUC 117,885 134,562 143,814 151,359 CMAP 106,110 121,202 139,367 155,223
Policy-Neutral 105,229 119,714 134,199 148,685
Employment 2020 2030 2040 2050 W&P 54,822 60,170 64,447 68,384
Moody's 41,631 43,253 44,265 45,584 UIUC 42,427 46,862 50,638 54,947 CMAP 37,453 38,558 40,292 42,183
Policy-Neutral 38,045 39,618 41,191 42,763
Figure 42: DeKalb County, IL comparison of forecasts and benchmarks
-
50,000
100,000
150,000
200,000
2020 2030 2040 2050
DeKalb County, IL Population
W&P Moody's UIUC CMAP Policy-Neutral
-
10,000
20,000
30,000
40,000
50,000
60,000
2020 2030 2040 2050
DeKalb County, IL Employment
Moody's UIUC CMAP Policy-Neutral

Wies: Socioeconomic Forecasting 4/9/2020 p. 47
Grundy County, IL comparison of forecasts and benchmarks Population 2020 2030 2040 2050
W&P 52,160 57,770 63,984 70,866 Moody's 51,008 52,172 51,591 50,367
UIUC 57,263 64,960 69,688 73,549 CMAP 55,795 66,313 76,663 87,099
Policy-Neutral 54,914 64,239 73,564 82,890
Employment 2020 2030 2040 2050 W&P 26,381 30,053 33,517 37,012
Moody's 20,914 22,617 23,992 25,438 UIUC 21,232 23,299 25,042 27,059 CMAP 19,475 20,057 20,957 21,936
- Policy-Neutral 19,160 20,215 21,270 22,325
Figure 43: Grundy County, IL comparison of forecasts and benchmarks
-
20,000
40,000
60,000
80,000
100,000
2020 2030 2040 2050
Grundy County, IL Population
W&P Moody's UIUC CMAP Policy-Neutral
-
5,000
10,000
15,000
20,000
25,000
30,000
2020 2030 2040 2050
Grundy County, IL Employment
Moody's UIUC CMAP Policy-Neutral

Wies: Socioeconomic Forecasting 4/9/2020 p. 48
LaSalle County comparison of forecasts and benchmarks40 Population 2020 2030 2040 2050
W&P 109,965 109,624 109,285 108,947 Moody's 108,376 104,630 99,751 94,558
UIUC 119,709 131,481 136,268 140,077 CMAP 112,134 117,180 118,905 120,941
Policy-Neutral 108,789 112,310 115,831 119,352
Employment 2020 2030 2040 2050 W&P 56,590 57,909 57,762 56,948
Moody's 47,069 48,078 49,206 50,653 UIUC 49,758 55,065 59,765 65,075 CMAP 39,712 40,895 42,720 44,728
Policy-Neutral 43,622 44,042 44,463 44,883
Figure 44: LaSalle County, IL comparison of forecasts and benchmarks
40 A small portion of rural LaSalle County is not included in the CMAP and Policy-Neutral forecast values. Other benchmarks cover the full county.
-
50,000
100,000
150,000
2020 2030 2040 2050
LaSalle County, IL Population
W&P Moody's UIUC CMAP Policy-Neutral
- 10,000 20,000 30,000 40,000 50,000 60,000 70,000
2020 2030 2040 2050
LaSalle County, IL Employment
Moody's UIUC CMAP Policy-Neutral

Wies: Socioeconomic Forecasting 4/9/2020 p. 49
Appendix F. Subzone-level forecast dataset Figure 45 is a list of variables included in the Policy-Neutral forecast dataset file, <date>_finaloutput.csv, that accompanies this report. The file contains one row for each subzone17 numbered consecutively 1 through 17418. Including the header record, there are 17419 rows in the file. Subzone17 and Zone17 boundaries are coterminous, i.e. there is a concise many-to-one relationship between their i.d. labels with no overlap or splitting.
Alphabetic List of Variables and Attributes # Variable Type Label 4 cmap Num CMAP region=1 5 county Char County name 9 emp15 Num 2015 Employment 11 emp20 Num 2020 CMAP Employment 13 emp30 Num 2030 CMAP Employment 15 emp40 Num 2040 CMAP Employment 17 emp50 Num 2050 CMAP Employment 1 fips Num County FIPS 8 hh15 Num 2015 Households 10 hh20 Num 2020 CMAP Households 12 hh30 Num 2030 CMAP Households 14 hh40 Num 2040 CMAP Households 16 hh50 Num 2050 CMAP Households 29 nemp20 Num 2020 Policy Neutral Employment 28 nemp30 Num 2030 Policy Neutral Employment 27 nemp40 Num 2040 Policy Neutral Employment 26 nemp50 Num 2050 Policy Neutral Employment 24 nhh20 Num 2020 Policy Neutral Households 22 nhh30 Num 2030 Policy Neutral Households 20 nhh40 Num 2040 Policy Neutral Households 18 nhh50 Num 2050 Policy Neutral Households 25 nphh20 Num 2020 Policy Neutral Population 23 nphh30 Num 2030 Policy Neutral Population 21 nphh40 Num 2040 Policy Neutral Population 19 nphh50 Num 2050 Policy Neutral Population 30 phh15 Num 2015 Population 31 phh20 Num 2020 CMAP Population 32 phh30 Num 2030 CMAP Population 33 phh40 Num 2040 CMAP Population 34 phh50 Num 2050 CMAP Population 7 sqmi Num total square miles 2 state Char State 6 subzone17 Num CMAP subzone17 id 3 zone17 Num CMAP zone17 id
Figure 45: Forecast dataset variable listing

cdmsmith.com
Prepared by
D-1
APPENDIX D
SUMMARY OF CERTAIN PROVISIONS OF THE INDENTURE
The following summary of certain provisions of the Indenture is qualified in its entirety by reference to the Indenture.
Definitions
“Act” means the Toll Highway Act, 605 ILCS 10/1 et seq., as amended.
“Additional Bonds” means Additional Senior Bonds and any Junior Bonds issued pursuant to the terms of the Indenture.
“Additional Senior Bonds” means any Bond or Bonds originally issued as Senior Bonds after March 31, 1999, the date certain provisions of the Amendatory Supplemental Indenture became effective, which includes the 2021A Bonds.
“Aggregate Debt Service” means, for any Fiscal Year and as of any date of calculation, the sum of the amounts of Debt Service for such Fiscal Year with respect to all Series of Senior Bonds.
“Amendatory Supplemental Indenture” means the 1996 Amendatory Supplemental Indenture dated as of September 1, 1996, between the Authority and the Trustee.
“Authorized Denominations” means $5,000 and any integral multiple thereof.
“Authorized Officer” means any director, officer or employee of the Authority authorized to perform specific acts or duties by a resolution duly adopted by the Authority.
“Bond” or “Bonds” means any bond or bonds, including Senior Bonds and Junior Bonds, authenticated and delivered under and pursuant to the Indenture, other than Subordinated Indebtedness.
“Bondholder,” or “Holder,” means any person who shall be the bearer of any coupon Bond or Bonds or the registered owner of any registered Bond or Bonds without coupons.
“Business Day” means any day which is not a Sunday or legal holiday or a day (including Saturday) on which banking institutions in the city where the principal corporate trust office of any Fiduciary is located are authorized by law or executive order to close (and such Fiduciary is in fact closed).
“Capital Appreciation Bond” means a Bond accruing interest that is compounded and added to Principal as of such date or dates specified in the related Supplemental Indenture and is payable at maturity. Any Capital Appreciation Bond may mature on any date specified in the related Supplemental Indenture.
“Code” means the Internal Revenue Code of 1986, as amended, and the regulations promulgated and proposed pursuant to it.
“Construction Fund” means the Construction Fund established pursuant to the Indenture for the purpose of paying costs of any Project.
“Consulting Engineers” means an engineer or engineering firm or corporation at the time retained by the Authority pursuant to the Indenture to perform the acts and carry out the duties provided for such Consulting Engineers in the Indenture.
“Costs of Construction” means with respect to any Project the cost of construction, acquisition, installation, reconstruction, modification, preservation, replacement, repairs, renewals or enhancement, including, without

D-2
limitation, bridges over or under existing highways and railroads, the cost of acquisition of all land, rights of way, property, rights, easements and interests, acquired by the Authority for such construction, acquisition, installation, reconstruction, modification, preservation, replacement, repairs, renewals or enhancement, the cost of demolishing or removing any buildings or structures on land so acquired, including the cost of acquiring any lands to which such buildings or structures may be moved, the cost of diverting highways, interchange of highways, access to roads to private property, including the cost of lands or easements, the cost of all machinery and equipment, financing charges, interest prior to and during work or construction and for up to two years after completion of the work or construction, the cost of traffic estimates and of engineering and legal expenses, plans, specifications, surveys, estimates of cost and revenues, other expenses necessary or incident to determining the feasibility or practicability of constructing any Project, administrative expenses and such other costs, expenses and funding as may be necessary or incident to the Project, the financing of such construction or work and the placing of such Project in operation.
“Costs of Credit Enhancement” means any fees of, or termination payments to, any Provider of Credit Enhancement; provided, that with respect to any Credit Enhancement executed and delivered or becoming effective on or after the effective date of the amendment to the Indenture establishing the Termination Payment Account (June 22, 2005), “Costs of Credit Enhancement” shall not include termination payments required to be made in connection with any such Credit Enhancement.
“Costs of Hedge Agreement” means any fees of, or termination payments to, any Provider of a Hedge Agreement; provided, that with respect to any Qualified Hedge Agreement executed and delivered or becoming effective on or after the effective date of the amendment to the Indenture establishing the Termination Payment Account (June 22, 2005), “Costs of Hedge Agreement” shall not include termination payments required to be made in connection with any such Qualified Hedge Agreement.
“Credit Enhancement” means any arrangement to provide additional security or liquidity for Bonds including, without limitation, surety bonds, bond insurance, letters of credit, lines of credit and purchase and remarketing agreements, but does not include Reserve Account Credit Facilities.
“Current Funds” means moneys that are immediately available in the hands of the payee at the place of payment.
“Debt Reserve Account” means the Debt Reserve Account established in the Indenture.
“Debt Reserve Requirement” means, as of any date of calculation, the maximum annual Aggregate Debt Service for any Fiscal Year for all Senior Bonds.
“Debt Service” means, for any period longer than one month, as of any date of calculation, an amount equal to the sum of Principal Installments and interest on Senior Bonds payable (or for the payment for which amounts are required to be deposited in the Debt Service Account) during such period, except to the extent that such interest is to be paid from Bond proceeds deposited to the credit of the Debt Service Account. Interest and Principal Installment amounts payable shall be calculated, for purposes of this definition, on the assumption that Senior Bonds Outstanding at the date of calculation will cease to be Outstanding by reason, but only by reason, of the payment of each Principal Installment on its due date. Interest and Principal Installments payable on January 1 of any Fiscal Year shall be deemed to be payable on December 31 of the preceding year. For purposes of applying this definition with respect to the calculations required by the Authority’s toll covenants and calculating the Debt Reserve Requirement, the amount of interest to be payable on Senior Bonds having variable interest rates shall be computed by assuming that the rate of interest with respect to Senior Bonds, interest on which is excludable from gross income of the Holders for federal income tax purposes, is a rate equal to the lesser of (i) the 30 Year Bond Buyer Revenue Bond Index as of the date of calculation, or (ii) the maximum interest rate on such Senior Bonds, and with respect to any Senior Bonds having a variable interest rate the interest on which is not excludable from “gross income” of the Holders for federal income tax purposes, a rate equal to the lesser of (i) 115% of the 30 Year Bond Buyer Revenue Bond Index as of the date of calculation or (ii) the maximum interest rate on such Senior Bonds, including in each case taking into account any Qualified Hedge Agreement as provided in the Indenture; for purposes of the Debt Reserve Requirement this calculation shall be made as of a date selected by the Authority within thirty (30) days preceding the date of issuance of each Series of Bonds for which such calculation is required. However, the rate for any such Series of Senior Bonds for which the variable interest rate is fixed for any portion of the applicable Fiscal Year shall be assumed to be the

D-3
actual rate borne by such Senior Bonds. For purposes of applying this definition with respect to the calculations required under the Indenture relating to the tests for the issuance of Additional Senior Bonds, the amount of interest payable on Senior Bonds having variable interest rates shall be computed at the maximum rate or amount for those Bonds, taking into account any Qualified Hedge Agreement. If a Series of Senior Bonds having variable interest rates is subject to purchase by the Authority pursuant to a mandatory or optional tender by the Holder, the “tender” date or dates shall be ignored and the stated Principal Installment dates of such Senior Bonds shall be used for purposes of calculating the Debt Service with respect to such Senior Bonds. If two Series of Senior Bonds having variable interest rates are issued simultaneously with inverse variable interest rates providing a composite fixed interest rate for such Senior Bonds taken at any time as a whole, such composite fixed rate shall be used in determining the Debt Service with respect to such Senior Bonds. Debt Service on Senior Bonds with respect to which there is a Qualified Hedge Agreement shall be calculated consistent with the provisions of the Indenture, as described in APPENDIX D – “SUMMARY OF CERTAIN PROVISIONS OF THE INDENTURE – HEDGING TRANSACTIONS.” Debt Service shall include Costs of Credit Enhancement, Costs of Hedge Agreements and reimbursements to Providers of Credit Enhancement and Qualified Hedge Agreements, in each case to be paid as provided in a Supplemental Indenture from the Debt Service Account.
“Debt Service Account” means the Debt Service Account established in the Indenture.
“Defeasance Securities” means any direct obligations of, or obligations the principal of and interest on which are unconditionally guaranteed by, the United States of America.
“Depositary” means any bank, national banking association or trust company having capital stock, surplus and retained earnings aggregating at least $8,000,000, or a savings or savings and loan institution having assets aggregating at least $65,000,000, selected by the Treasurer (and with respect to Funds, Accounts and Sub-Accounts held by the Trustee, with the consent of the Treasurer, which consent shall not be unreasonably withheld) as a depositary of moneys and securities held under the provisions of the Indenture, and may include the Trustee.
“Eighteenth Supplemental Indenture” means the Eighteenth Supplemental Indenture securing the 2014B Bonds, dated as of June 1, 2014, between the Authority and the Trustee.
“Eighth Supplemental Indenture” means the Eighth Supplemental Indenture securing the 2006 Bonds, dated as of June 1, 2006, between the Authority and the Trustee.
“Eleventh Supplemental Indenture” means the Eleventh Supplemental Indenture securing the 2008B Bonds, dated as of November 1, 2008, between the Authority and the Trustee.
“Event of Default” means any event described in APPENDIX D – “SUMMARY OF CERTAIN PROVISIONS OF THE INDENTURE – EVENTS OF DEFAULT.”
“Federal Securities” means (i) any direct obligations of, or obligations the principal of and interest on which are unconditionally guaranteed by, the United States of America, (ii) any Municipal Bonds which are fully secured as to principal and interest by an irrevocable pledge of moneys or direct obligations of, or obligations unconditionally guaranteed by, the United States of America, which moneys or obligations are segregated in trust and pledged for the benefit of the holders of the Municipal Bonds, (iii) certificates of ownership of the principal of or interest on direct obligations of, or obligations unconditionally guaranteed by, the United States of America, which obligations are held in trust by a commercial bank that is a member of the Federal Reserve System and (iv) interest obligations of the Resolution Funding Corporation, including, without limitation, interest obligations stripped by the Federal Reserve Bank of New York.
“Fiduciary” or “Fiduciaries” means the Trustee, the Registrar and the Paying Agents, or any or all of them, as may be appropriate.
“Fifteenth Supplemental Indenture” means the Fifteenth Supplemental Indenture securing the 2013A Bonds, dated as of May 1, 2013, between the Authority and the Trustee.

D-4
“Fifth Supplemental Indenture” means the Fifth Supplemental Indenture securing the 1996A Bonds, dated as of September 1, 1996, between the Authority and the Trustee.
“First Supplemental Indenture” means the First Supplemental Indenture securing Toll Highway Priority Revenue Bonds, 1986 Series, dated as of October 1, 1986, between the Authority and the Trustee.
“Fiscal Year” means the period January 1 through December 31 of the same year.
“Fitch” means Fitch Ratings, its successors and assigns, and, if Fitch shall be dissolved or liquidated or shall no longer perform the functions of a securities rating agency, “Fitch” shall be deemed to refer to any other nationally recognized securities rating agency designated by the Authority by notice to the Trustee.
“Fourteenth Supplemental Indenture” means the Fourteenth Supplemental Indenture securing the 2010A Bonds dated as of June 1, 2010, between the Authority and the Trustee.
“Fourth Supplemental Indenture” means the Fourth Supplemental Indenture securing Toll Highway Refunding Revenue Bonds, 1993 Series A and B, dated as of March 1, 1993, between the Authority and the Trustee.
“Hedge Agreement” means a payment exchange agreement, swap agreement, forward purchase agreement or any other hedge agreement entered into by the Authority providing for payments between the parties based on levels of, or changes in, interest rates, stock or other indices or contracts to exchange cash flows or a series of payments or contracts, including, without limitation, interest rate floors, or caps, options, puts or calls, which allows the Authority to manage or hedge payment, rate, spread or similar risk with respect to any Series of Senior Bonds.
“Improvement” means any System Expansion Project or any acquisition, installation, construction, reconstruction, modification or enhancement of or to any real or personal property (other than Operating Expenses) for which a currently effective resolution of the Authority has been adopted authorizing the deposit of Revenues to the credit of the Improvement Account for such System Expansion Project or acquisition, installation, construction, reconstruction, modification or enhancement including, without limitation, the cost of related feasibility studies, plans, designs or other related expenditures.
“Improvement Account” means the Improvement Account established in the Indenture.
“Improvement Requirement” means the aggregate of the amounts established by currently effective resolutions of the Authority for specified Improvements, based upon a certificate or certificates of the Consulting Engineers with respect to the estimated costs of such Improvements filed with the Authority from time to time, less the amounts previously withdrawn or transferred from the Improvement Account to pay the costs of any such Improvements.
“Indenture” means the Amended and Restated Trust Indenture effective as of March 31, 1999 amending and restating the Trust Indenture dated as of December 1, 1985, by and between the Authority and the Trustee, as from time to time amended and supplemented, including by the First Supplemental Indenture, the Second Supplemental Indenture, the Third Supplemental Indenture, the Fourth Supplemental Indenture, the Fifth Supplemental Indenture, the Sixth Supplemental Indenture, the Seventh Supplemental Indenture, the Eighth Supplemental Indenture, the Ninth Supplemental Indenture, the Tenth Supplemental Indenture, the Eleventh Supplemental Indenture, the Twelfth Supplemental Indenture, the Thirteenth Supplemental Indenture, the Fourteenth Supplemental Indenture, the Fifteenth Supplemental Indenture, the Sixteenth Supplemental Indenture, the Seventeenth Supplemental Indenture, the Eighteenth Supplemental Indenture, the Nineteenth Supplemental Indenture, the Twentieth Supplemental Indenture, the Twenty-First Supplemental Indenture, the Twenty-Second Supplemental Indenture, the Twenty-Third Supplemental Indenture, the Twenty-Fourth Supplemental Indenture, the Twenty-Fifth Supplemental Indenture, the Twenty-Sixth Supplemental Indenture, the Twenty-Seventh Supplemental Indenture, the Twenty-Eighth Supplemental Indenture, the Twenty-Ninth Supplemental Indenture, the Thirtieth Supplemental Indenture, the Thirty-First Supplemental Indenture and the Amendatory Supplemental Indenture.

D-5
“Interest Payment Date” means, with respect to the 2021A Bonds, each January 1 and July 1 commencing July 1, 2022.
“Interest Sub-Account” means the sub-account of that name in the Debt Service Account established in the Indenture.
“Investment Securities” means any of the following securities authorized by law as permitted investments of Authority funds at the time of their purchase:
(i) Federal Securities;
(ii) Bonds, debentures, notes or other evidences of indebtedness issued by any of the following agencies: Government National Mortgage Association, Federal National Mortgage Association, Federal Home Loan Mortgage Corporation, Federal Land Banks, Federal Home Loan Banks, Federal Intermediate Credit Banks, Banks for Cooperatives, Tennessee Valley Authority, United States Postal Service, Farmers Home Administration, Export-Import Bank, Federal Financing Bank and Student Loan Marketing Association;
(iii) Investments in a money market fund registered under the Investment Company Act of 1940, as amended (including any such money market fund sponsored by or affiliated with any Fiduciary), comprised of any of the investments set forth in subparagraph (i) or subparagraph (ii) above;
(iv) Negotiable or non-negotiable certificates of deposit or time deposits or other banking arrangements issued by any bank, trust company or national banking association (including any Fiduciary), which certificates of deposit or time deposits or other banking arrangements shall be continuously secured or collateralized by obligations described in subparagraphs (i), (ii) or (iii) of this definition, which obligations shall have a market value (exclusive of accrued interest) at all times at least equal to the principal amount of such certificates of deposit or time deposits or other banking arrangements and shall be lodged with the Trustee, as custodian, by the bank, trust company or national banking association issuing such certificates of deposit or time deposits or other banking arrangements, which certificates of deposit or time deposits or other banking arrangements acquired or entered into pursuant to this subparagraph (iv) shall be deemed for purposes of the Indenture to constitute investments and not deposits;
(v) With respect to moneys on deposit to the credit of the Debt Service Account, the Debt Reserve Account and the Construction Fund and its separate, segregated accounts (to the extent that the Construction Fund and such separate, segregated accounts are held by the Trustee) (except the Construction Fund revolving accounts), repurchase agreements with any bank, trust company or national banking association (including any Fiduciary) or government bond dealer reporting to the Federal Reserve Bank of New York continuously secured or collateralized by obligations described in subparagraph (i) of this definition, which obligations shall have a market value (exclusive of accrued interest) at all times at least equal to the amortized value of such repurchase agreements, provided such security or collateral is lodged with and held by the Trustee or the Authority as titleholder, as the case may be;
(vi) With respect to moneys on deposit to the credit of all Funds, Accounts and Sub-Accounts (except the Debt Service Account, the Debt Reserve Account, and the Construction Fund to the extent that the Construction Fund is held by the Trustee, the separate, segregated accounts of the Construction Fund to the extent such accounts are held by the Trustee and the revolving accounts of the Construction Fund), repurchase agreements with any bank, trust company or national banking association (including any Fiduciary) or government bond dealer reporting to the Federal Reserve Bank of New York continuously and fully secured for the benefit of the Authority and the Holders of the Bonds as provided by applicable state law with respect to the investment of public funds;
(vii) Public housing bonds issued by public housing authorities and fully secured as to the payment of both principal and interest by a pledge of annual contributions under an annual contributions contract or contracts with the United States of America; and project notes issued by public housing authorities

D-6
or by local public agencies, in each case fully secured as to the payment of both principal and interest by a requisition or payment agreement with the United States of America;
(viii) Any Municipal Bond which has a rating by each rating agency from which the Authority has obtained Ratings for its Senior Bonds, which is not lower than the Rating provided by the respective rating agency for Senior Bonds; and
(ix) Any other investment securities as to which the Authority has received written advice from each rating agency which has a Rating for any Senior Bonds that investment in such securities will not result in a reduction of the Rating by the rating agency.
Investment Securities shall be rated not lower than “BBB-” by S&P and “Baa” by Moody’s, or, in the case of Investment Securities described in subparagraph (iii), subparagraph (iv), subparagraph (v) or subparagraph (vi) of this definition, shall be secured or collateralized by Investment Securities rated not lower than “BBB” by S&P and “Baa” by Moody’s.
“Junior Bond Debt Reserve Account or Accounts” means any Junior Bond Debt Reserve Account or Accounts established in Supplemental Indentures authorizing the issuance of Junior Bonds.
“Junior Bond Debt Service Account or Accounts” means any Junior Bond Debt Service Account or Accounts established in Supplemental Indentures authorizing the issuance of Junior Bonds.
“Junior Bonds” means all Bonds authenticated and delivered as Junior Bonds pursuant to the Indenture.
“Junior Bonds Revenue Requirement” means for any Fiscal Year the amount required to be deposited from the Revenue Fund to any Junior Bond Debt Service Account and any Junior Bond Debt Reserve Account. For purposes of certain provisions of the tests established by the Indenture for the issuance of Additional Senior Bonds and the Authority’s toll covenants, the Junior Bond Revenue Requirement shall be the amount projected to be so required under the Supplemental Indentures authorizing the Junior Bonds, and taking into account, without limitation, (i) the expectations of the Authority as to the receipts, other than Revenues, which pursuant to the Supplemental Indentures authorizing Junior Bonds, will be applied to make such deposits to pay Principal Installments or interest, Costs of Credit Enhancement or Costs of Hedge Agreements and reimbursement to Providers of Credit Enhancement and Hedge Agreements on Junior Bonds to be paid from such Accounts; (ii) the expectations of the Authority as to future refinancings of Junior Bonds which were issued as provided in the Supplemental Indenture authorizing such Junior Bonds with the expectation of refinancing; and (iii) interest payable on Junior Bonds with variable interest rates as provided in the Supplemental Indenture authorizing Junior Bonds.
“Maintenance and Operation Account” means the Maintenance and Operation Account established in the Indenture.
“Moody’s” means Moody’s Investors Service, Inc., a corporation organized and existing under the laws of the State of Delaware, its successors and assigns, and, if such corporation shall be dissolved or liquidated or shall no longer perform the functions of a securities rating agency, “Moody’s” shall be deemed to refer to any other nationally recognized securities rating agency designated by the Authority by notice to the Trustee.
“Move Illinois Program” means the “Move Illinois: The Illinois Tollway Driving the Future” capital program of the Authority, as described in and approved by Resolution No. 19480 of the Authority, adopted on August 25, 2011, together with the enhancements of the portion of those capital improvements related to the Central Tri-State Tollway described in Resolution No. 21244 of the Authority adopted on April 27, 2017, and as the same may be amended, revised or modified from time to time.
“Municipal Bonds” means, any obligations of any state, public corporation, authority, political subdivision, unit of local government or municipality of any state.

D-7
“Net Revenue Requirement” means, with respect to any period of time, an amount necessary to cure deficiencies, if any, in the Debt Service Account, the Debt Reserve Account, any Junior Bond Debt Service Account and any Junior Bond Debt Reserve Account plus the greater of (i) the sum of Aggregate Debt Service, the Junior Bond Revenue Requirement and the Renewal and Replacement Deposit for such period or (ii) 1.3 times the Aggregate Debt Service for such period.
“Net Revenues” means, for any Fiscal Year or other period of time, the Revenues, excluding amounts transferred during such Fiscal Year or period (i) to the Revenue Fund from the Construction Fund and (ii) to the Trustee by the Authority from the System Reserve Account, the Improvement Account or the Renewal and Replacement Account, less the Operating Expenses for such Fiscal Year or period.
“Nineteenth Supplemental Indenture” means the Nineteenth Supplemental Indenture securing the 2014C Bonds dated as of December 1, 2014, between the Authority and the Trustee.
“Ninth Supplemental Indenture” means the Amended and Restated Ninth Supplemental Indenture securing the 2007 Bonds, dated as of March 1, 2011, between the Authority and the Trustee.
“1996 Series A Bonds” means the Toll Highway Refunding Revenue Bonds, 1996 Series A, authorized by the Fifth Supplemental Indenture.
“1993 Series B Bonds” means the Authority’s Toll Highway Refunding Revenue Bonds, 1993 Series B, issued pursuant to the Fourth Supplemental Indenture and redeemed on January 28, 2009.
“1992 Series A Bonds” means the Toll Highway Priority Revenue Bonds, 1992 Series A, authorized by the Third Supplemental Indenture.
“Operating Expenses” means the Authority’s expenses in the normal course of business for operation, maintenance and repairs of the Tollway System or any part of it and replacement and acquisition of equipment (other than expenses which under generally accepted accounting principles are capitalized and for which amounts (other than amounts held in the Maintenance and Operation Account) are set aside or otherwise available) including, without limitation, all policing, administrative and engineering expenses, legal and financial advisory expenses, fees and expenses of the fiduciaries, payments to pension, retirement, health and hospitalization funds, insurance premiums, rentals under leases of property not constituting Projects, and any other expenses or obligations required to be paid by the Authority under the provisions of the Indenture or by law, all to the extent properly and directly attributable to the operation of the Tollway System, but not including any costs or expenses of any Project, allowance for depreciation, payments on any Outstanding Bonds, Subordinated Indebtedness or money borrowed for purposes other than Operating Expenses, or any reserves for those purposes.
“Operating Reserve Sub-Account” means the subaccount of that name in the Maintenance and Operation Account established under the Indenture.
“Operating Sub-Account” means the sub-account of that name in the Maintenance and Operation Account.
“Outstanding,” when used with reference to Bonds, means, as of any date, all Bonds theretofore or thereupon being authenticated and delivered under the Indenture except:
(i) Any Bonds canceled by the Trustee at or prior to such date;
(ii) Bonds (or portions of Bonds) for the payment or redemption of which moneys, equal to the principal amount or Redemption Price thereof, as the case may be, with interest to the date of maturity or date fixed for redemption, are held in trust under the Indenture and set aside for such payment or redemption (whether at or prior to the maturity or redemption date), provided that if such Bonds (or portions of Bonds) are to be redeemed, notice of such redemption shall have been given as provided in the proceedings authorizing such Bonds or provision satisfactory to the Trustee shall have been made for the giving of such notice;

D-8
(iii) Bonds in lieu of or in substitution for which other Bonds shall have been authenticated and delivered pursuant the Indenture; and
(iv) Bonds deemed to have been paid under the provisions of the Indenture described in APPENDIX D – “SUMMARY OF CERTAIN PROVISIONS OF THE INDENTURE – DEFEASANCE.”
“Owner” or “Registered Owner” means any person who shall be the registered owner of any Bond.
“Paying Agent” means any bank, national banking association or trust company designated by the Authority as paying agent for the Bonds of any Series, and any successor or successors appointed by the Authority under the Indenture, and for the 2021A Bonds means the Trustee.
“Principal” when used in connection with a Capital Appreciation Bond shall mean the initial principal amount of such Bond as of its date of issuance plus interest accreted thereon to the date of calculation, which in the aggregate shall constitute the maturity amount of such Capital Appreciation Bond as of the date of maturity thereof.
“Principal Installment” means, as of any particular date of calculation and with respect to any particular future date and with respect to Bonds of a particular Series, (a) the principal amount of Outstanding Bonds of said Series that are stated to mature on such future date, reduced by the aggregate principal amount of such Outstanding Bonds that would before said future date cease to be Outstanding by reason, but only by reason, of the payment when due, and application in accordance with the Indenture, of Sinking Fund Installments payable before said future date toward the retirement of such Outstanding Bonds, and (b) the amount of any Sinking Fund Installment payable on said future date toward the retirement of any Outstanding Bonds of said Series.
“Principal Sub-Account” means the sub-account of that name in the Debt Service Account established in the Indenture.
“Priority Bonds” means all Bonds designated as Priority Bonds, which, as of the date of issuance of the 2021A Bonds consists of the 2009A Bonds and the 2009B Bonds.
“Project” means any Improvement or Renewal and Replacement.
“Provider” means any person or entity providing Credit Enhancement, a Reserve Account Credit Facility or a Qualified Hedge Agreement with respect to any one or more Series of Senior Bonds, pursuant to agreement with or upon the request of the Authority.
“Provider Payment Sub-Account” means the sub-account of that name in the Debt Service Account established in the Indenture.
“Qualified Hedge Agreement” means a Hedge Agreement if (i) the Provider of the Hedge Agreement is rated “A” or better by S&P and (ii) the Authority has given each rating agency then rating any of the Senior Bonds (whether or not such rating agency also rates the unsecured obligations of the Provider of the Hedge Agreement or the Provider’s guarantor) at least 15 days’ notice in writing of its intention to enter into the Hedge Agreement (unless such notice period is waived by such rating agency) and has received from such rating agency its written advice that the entering into of the Hedge Agreement by the Authority will not in and of itself cause a reduction or withdrawal by such rating agency of its Rating on any Senior Bonds. Such written advice shall constitute a waiver by that rating agency of the notice requirement set forth above.
“Rating” means a rating given Senior Bonds by a nationally-recognized rating agency upon the request or application of the Authority, and where the rating of any Senior Bonds is based upon bond insurance or similar credit enhancement, it means the rating which those Senior Bonds would have without that bond insurance or credit enhancement.

D-9
“Rating Agency” means Fitch, Moody’s and S&P or any other nationally recognized securities rating agency then assigning a Rating to the applicable Series.
“Record Date” means the fifteenth (15th) day (whether or not a Business Day) of the month next preceding each Interest Payment Date or as may be provided in the Supplemental Indenture for any Series of Bonds.
“Redemption Price” means, with respect to any Bond, the principal amount thereof plus the applicable premium, if any, payable upon the date fixed for redemption.
“Redemption Sub-Account” means the sub-account of that name in the Debt Service Account established in the Indenture.
“Refunding Bonds” means all Bonds designated as Refunding Bonds, which as of the date of issuance of the 2021A Bonds consists of the 2014A Bonds, the 2014D Bonds, the 2016A Bonds, the 2018A Bonds, the 2019B Bonds and the 2019C Bonds.
“Registrar” means the Trustee.
“Renewal and Replacement” means preservation, replacement, repairs, renewals and reconstruction or modifications of the Tollway System or any part of it constituting real or personal property, whether leased or purchased, but does not include System Expansion Projects.
“Renewal and Replacement Account” means the Renewal and Replacement Account established in the Indenture.
“Renewal and Replacement Deposit or Deposits” means, with respect to any period, any amount budgeted for deposit to or projected for deposit to the Renewal and Replacement Account for Renewal and Replacement Expenses, other than such budgeted or projected amounts which the Authority has determined will be available for Renewal and Replacement Expenses from the System Reserve Fund, the Improvement Fund or from the proceeds of authorized borrowings or from installment purchases or leases.
“Renewal and Replacement Expense or Expenses” means the cost of any Renewal and Replacement.
“Reserve Account Credit Facility” means a surety bond, an insurance policy, a letter of credit or other credit facility with respect to any Series of Senior Bonds which meets the requirements of the Indenture.
“Revenues” means (i) all tolls, fees, charges, rents, and other income and receipts derived from the operation of the Tollway System, (ii) the proceeds of any use and occupancy insurance relating to the Tollway System and of any other insurance that insures against loss of revenues, (iii) investment income from any moneys or securities held in Funds, Accounts or Sub-Accounts established under the Indenture, other than the Construction Fund, and (iv) amounts transferred from the Construction Fund to the Revenue Fund, and transfers to the Trustee by the Authority from the System Reserve Account pursuant to the Indenture. Revenues excludes Federal and State grants and appropriations, loan proceeds, gifts or donations of any kind, transfers, if any, to the Authority as permitted under any Escrow Agreement, and receipts not related to the Authority’s performance of its obligations under the Indenture or to the operations of the Tollway System.
“S&P” means S&P Global Ratings, Inc., a corporation organized and existing under the laws of the State of New York, its successors and assigns, and, if such corporation shall be dissolved or liquidated or shall no longer perform the functions of a securities rating agency, “S&P” shall be deemed to refer to any other nationally recognized securities rating agency designated by the Authority by notice to the Trustee.
“Second Supplemental Indenture” means the Second Supplemental Indenture securing Toll Highway Refunding Revenue Bonds, 1987 Series, dated as of February 15, 1987, between the Authority and the Trustee.
D-10
“Senior Bonds” means (i) the Authority’s Outstanding Priority Bonds, (ii) the Authority’s Outstanding 2013A Bonds, 2014B Bonds, 2014C Bonds, 2015A Bonds, 2015B Bonds, 2016B Bonds, 2017A Bonds, 2019A Bonds and 2020A Bonds, (iii) the Authority’s Outstanding Refunding Bonds, and (iv) all Additional Senior Bonds, without duplication, issued in accordance with the Indenture.
“Series” means all of the Bonds designated as a series and authenticated and delivered on original issuance in a simultaneous transaction, and any Bonds thereafter authenticated and delivered in lieu of or in substitution for such Bonds.
“Seventeenth Supplemental Indenture” means the Seventeenth Supplemental Indenture securing the 2014A Bonds dated as of January 1, 2014, between the Authority and the Trustee.
“Seventh Supplemental Indenture” means the Seventh Supplemental Indenture securing the 2005 Bonds, dated as of June 1, 2005, between the Authority and the Trustee.
“Sinking Fund Installment” means, each principal amount of Senior Bonds scheduled to be retired through the application of amounts on deposit in the Redemption Sub-Account established pursuant to the Indenture.
“Sixteenth Supplemental Indenture” means the Sixteenth Supplemental Indenture securing the 2013B-1 Bonds, dated as of August 1, 2013, between the Authority and the Trustee.
“Sixth Supplemental Indenture” means the Sixth Supplemental Indenture securing the 1998 Bonds, dated as of December 1, 1998, between the Authority and the Trustee.
“Subordinated Indebtedness” means any evidence of indebtedness, other than Bonds, permitted to be issued by the Indenture for any purpose for which Bonds may be issued thereunder and payable from the System Reserve Account.
“Subsidy Payments” means the cash subsidy payments that may be paid from time to time by the United States Treasury pursuant to Sections 54AA(g) and 6431 of the Code resulting from the elections by the Authority to issue the 2009A Bonds and the 2009B Bonds as “Build America Bonds (Direct Payment).”
“System Expansion Project” means any acquisition, improvement, betterment, enlargement or capital addition that extends the Tollway System.
“System Reserve Account” means the System Reserve Account established in the Indenture.
“Tenth Supplemental Indenture” means the Amended and Restated Tenth Supplemental Indenture securing the 2008 Bonds, dated as of February 1, 2011, between the Authority and the Trustee.
“Termination Payment Account” means the Termination Payment Account established in the Indenture.
“Third Supplemental Indenture” means the Third Supplemental Indenture securing the 1992 Series A Bonds, dated as of September 1, 1992, between the Authority and the Trustee.
“Thirteenth Supplemental Indenture” means the Thirteenth Supplemental Indenture securing the 2009B Bonds, dated as of December 1, 2009, between the Authority and the Trustee.
“Thirtieth Supplemental Indenture” means the Thirtieth Supplemental Indenture securing the 2020A Bonds, dated as of December 1, 2020, between the Authority and the Trustee.
“Thirty-First Supplemental Indenture” means the Thirty-First Supplemental Indenture securing the 2021A Bonds, dated as of December 1, 2021, between the Authority and the Trustee.

D-11
“Tollway System” means, collectively, (i) the toll highways operated and maintained by the Authority as of December 1, 1985, (ii) any Projects, and (iii) all properties, equipment and facilities used in connection with the operation and maintenance of the facilities listed in clause (i) or (ii) of this definition.
“Treasurer” means the Treasurer of the State of Illinois and ex officio custodian of the “Illinois State Toll Highway Authority Fund,” a special fund created under the Act, of which all Funds, Accounts, and Sub-Accounts created under the Indenture, including the Revenue Fund and the Construction Fund, are a part.
“Trustee” means The Bank of New York Mellon Trust Company, N.A., as successor to The First National Bank of Chicago, currently serving as trustee under the Indenture.
“Twelfth Supplemental Indenture” means the Twelfth Supplemental Indenture securing the 2009A Bonds, dated as of May 1, 2009, between the Authority and the Trustee.
“Twentieth Supplemental Indenture” means the Twentieth Supplemental Indenture securing the 2014D Bonds dated as of December 1, 2014, between the Authority and the Trustee.
“Twenty-Eighth Supplemental Indenture” means the Twenty-Eighth Supplemental Indenture securing the 2019B Bonds dated as of November 1, 2019, between the Authority and the Trustee.
“Twenty-Fifth Supplemental Indenture” means the Twenty-Fifth Supplemental Indenture securing the 2017A Bonds dated as of December 1, 2017, between the Authority and the Trustee.
“Twenty-First Supplemental Indenture” means the Twenty-First Supplemental Indenture securing the 2015A Bonds dated as of July 1, 2015, between the Authority and the Trustee.
“Twenty-Fourth Supplemental Indenture” means the Twenty-Fourth Supplemental Indenture securing the 2016B Bonds dated as of May 1, 2016, between the Authority and the Trustee.
“Twenty-Ninth Supplemental Indenture” means the Twenty-Ninth Supplemental Indenture securing the 2019C Bonds dated as of December 1, 2019 between the Authority and the Trustee.
“Twenty-Second Supplemental Indenture” means the Twenty-Second Supplemental Indenture securing the 2015B Bonds dated as of November 1, 2015, between the Authority and the Trustee.
“Twenty-Seventh Supplemental Indenture” means the Twenty-Seventh Supplemental Indenture securing the 2019A Bonds dated as of July 1, 2019, between the Authority and the Trustee.
“Twenty-Sixth Supplemental Indenture” means the Twenty-Sixth Supplemental Indenture securing the 2018A Bonds dated as of December 1, 2018, between the Authority and the Trustee.
“Twenty-Third Supplemental Indenture” means the Twenty-Third Supplemental Indenture securing the 2016A Bonds dated as of January 1, 2016, between the Authority and the Trustee.
“2005 Bonds” means the Toll Highway Senior Priority Revenue Bonds, 2005 Series A, authorized by the Seventh Supplemental Indenture.
“2006 Bonds” means, collectively, the Toll Highway Senior Priority Revenue Bonds, 2006 Series A-1 and 2006 Series A-2, authorized by the Eighth Supplemental Indenture.
“2007 Bonds” means, collectively, the Toll Highway Variable Rate Senior Priority Revenue Bonds, 2007 Series A-1 and 2007 Series A-2, authorized by the Ninth Supplemental Indenture.
“2008 Bonds” means, collectively, the Toll Highway Variable Rate Senior Refunding Revenue Bonds, 2008 Series A-1 and 2008 Series A-2, authorized by the Tenth Supplemental Indenture.

D-12
“2009A Bonds” means the Toll Highway Senior Priority Revenue Bonds, Taxable 2009 Series A (Build America Bonds – Direct Payment), authorized by the Twelfth Supplemental Indenture.
“2009B Bonds” means the Toll Highway Senior Priority Revenue Bonds, Taxable 2009 Series B (Build America Bonds – Direct Payment), authorized by the Thirteenth Supplemental Indenture.
“2010A Bonds” means the Toll Highway Senior Refunding Revenue Bonds, 2010 Series A-1, authorized by the Fourteenth Supplemental Indenture.
“2013A Bonds” means the Toll Highway Senior Revenue Bonds, 2013 Series A, authorized by the Fifteenth Supplemental Indenture.
“2013B-1” Bonds” means the Toll Highway Senior Revenue Bonds, 2013 Series B-1, authorized by the Sixteenth Supplemental Indenture
“2014A” Bonds means the Toll Highway Senior Revenue Bonds, 2014 Series A, authorized by the Seventeenth Supplemental Indenture
“2014B Bonds” means the Toll Highway Senior Revenue Bonds, 2014 Series B, authorized by the Eighteenth Supplemental Indenture.
“2014C Bonds” means the Toll Highway Senior Revenue Bonds, 2014 Series C, authorized by the Nineteenth Supplemental Indenture.
“2014D Bonds” means the Toll Highway Senior Revenue Bonds, 2014 Series D (Refunding), authorized by the Twentieth Supplemental Indenture.
“2015A Bonds” means the Toll Highway Senior Revenue Bonds, 2015 Series A, authorized by the Twenty-First Supplemental Indenture.
“2015B Bonds” means the Toll Highway Senior Revenue Bonds, 2015 Series B, authorized by the Twenty-Second Supplemental Indenture.
“2016A Bonds” means the Toll Highway Senior Revenue Bonds, 2016 Series A (Refunding), authorized by the Twenty-Third Supplemental Indenture.
“2016B Bonds” means the Toll Highway Senior Revenue Bonds, 2016 Series B, authorized by the Twenty-Fourth Supplemental Indenture.
“2017A Bonds” means the Toll Highway Senior Revenue Bonds, 2017 Series A, authorized by the Twenty-Fifth Supplemental Indenture.
“2018A Bonds” means the Toll Highway Senior Revenue Bonds, 2018 Series A, authorized by the Twenty-Sixth Supplemental Indenture.
“2019A Bonds” means the Toll Highway Senior Revenue Bonds, 2019 Series A, authorized by the Twenty-Seventh Supplemental Indenture.
“2019B Bonds” means the Toll Highway Senior Revenue Bonds, 2019 Series B (Refunding), authorized by the Twenty-Eighth Supplemental Indenture.
“2019C Bonds” means the Toll Highway Senior Revenue Bonds, 2019 Series C (Refunding), authorized by the Twenty-Ninth Supplemental Indenture.
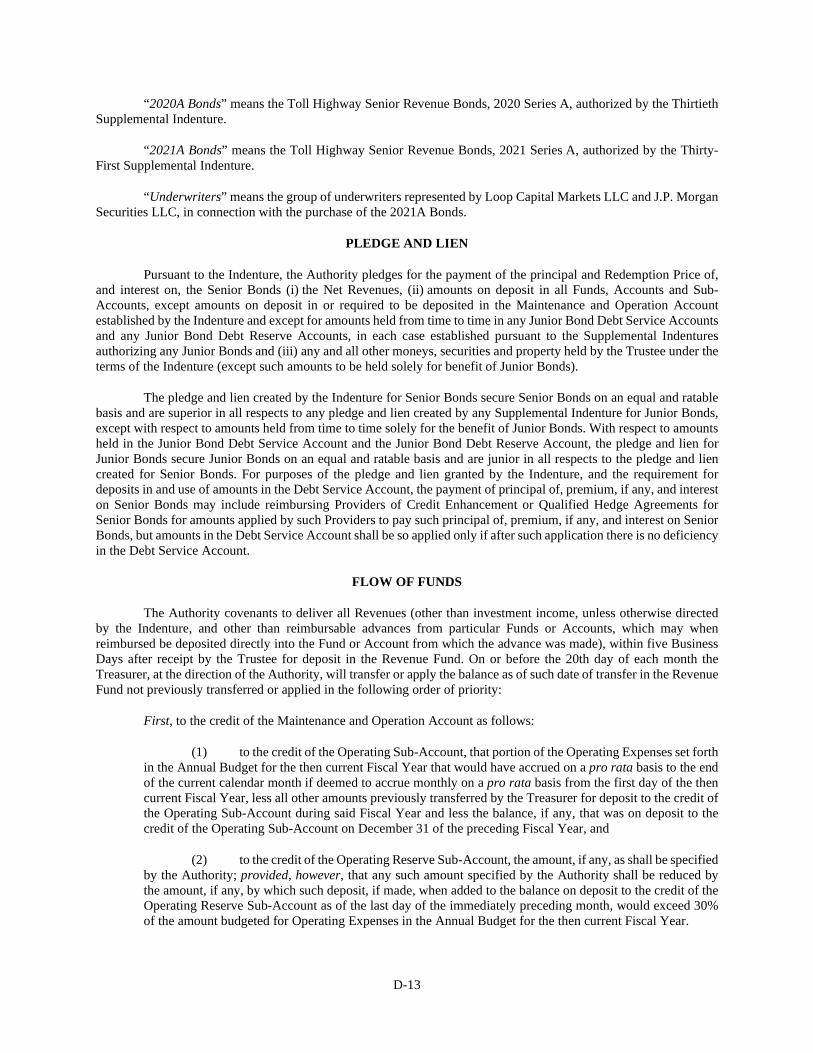
D-13
“2020A Bonds” means the Toll Highway Senior Revenue Bonds, 2020 Series A, authorized by the Thirtieth Supplemental Indenture.
“2021A Bonds” means the Toll Highway Senior Revenue Bonds, 2021 Series A, authorized by the Thirty-First Supplemental Indenture.
“Underwriters” means the group of underwriters represented by Loop Capital Markets LLC and J.P. Morgan Securities LLC, in connection with the purchase of the 2021A Bonds.
PLEDGE AND LIEN
Pursuant to the Indenture, the Authority pledges for the payment of the principal and Redemption Price of, and interest on, the Senior Bonds (i) the Net Revenues, (ii) amounts on deposit in all Funds, Accounts and Sub-Accounts, except amounts on deposit in or required to be deposited in the Maintenance and Operation Account established by the Indenture and except for amounts held from time to time in any Junior Bond Debt Service Accounts and any Junior Bond Debt Reserve Accounts, in each case established pursuant to the Supplemental Indentures authorizing any Junior Bonds and (iii) any and all other moneys, securities and property held by the Trustee under the terms of the Indenture (except such amounts to be held solely for benefit of Junior Bonds).
The pledge and lien created by the Indenture for Senior Bonds secure Senior Bonds on an equal and ratable basis and are superior in all respects to any pledge and lien created by any Supplemental Indenture for Junior Bonds, except with respect to amounts held from time to time solely for the benefit of Junior Bonds. With respect to amounts held in the Junior Bond Debt Service Account and the Junior Bond Debt Reserve Account, the pledge and lien for Junior Bonds secure Junior Bonds on an equal and ratable basis and are junior in all respects to the pledge and lien created for Senior Bonds. For purposes of the pledge and lien granted by the Indenture, and the requirement for deposits in and use of amounts in the Debt Service Account, the payment of principal of, premium, if any, and interest on Senior Bonds may include reimbursing Providers of Credit Enhancement or Qualified Hedge Agreements for Senior Bonds for amounts applied by such Providers to pay such principal of, premium, if any, and interest on Senior Bonds, but amounts in the Debt Service Account shall be so applied only if after such application there is no deficiency in the Debt Service Account.
FLOW OF FUNDS
The Authority covenants to deliver all Revenues (other than investment income, unless otherwise directed by the Indenture, and other than reimbursable advances from particular Funds or Accounts, which may when reimbursed be deposited directly into the Fund or Account from which the advance was made), within five Business Days after receipt by the Trustee for deposit in the Revenue Fund. On or before the 20th day of each month the Treasurer, at the direction of the Authority, will transfer or apply the balance as of such date of transfer in the Revenue Fund not previously transferred or applied in the following order of priority:
First, to the credit of the Maintenance and Operation Account as follows:
(1) to the credit of the Operating Sub-Account, that portion of the Operating Expenses set forth in the Annual Budget for the then current Fiscal Year that would have accrued on a pro rata basis to the end of the current calendar month if deemed to accrue monthly on a pro rata basis from the first day of the then current Fiscal Year, less all other amounts previously transferred by the Treasurer for deposit to the credit of the Operating Sub-Account during said Fiscal Year and less the balance, if any, that was on deposit to the credit of the Operating Sub-Account on December 31 of the preceding Fiscal Year, and
(2) to the credit of the Operating Reserve Sub-Account, the amount, if any, as shall be specified by the Authority; provided, however, that any such amount specified by the Authority shall be reduced by the amount, if any, by which such deposit, if made, when added to the balance on deposit to the credit of the Operating Reserve Sub-Account as of the last day of the immediately preceding month, would exceed 30% of the amount budgeted for Operating Expenses in the Annual Budget for the then current Fiscal Year.

D-14
Second, to the credit of the Debt Service Account maintained by the Trustee, as follows:
(1) to the credit of the Interest Sub-Account, an amount equal to (a) any interest due and unpaid on Senior Bonds, plus (b) for each Series of Senior Bonds, one-sixth of the difference between the interest payable on Outstanding Senior Bonds of that Series on any interest payment date within the next six months, and the proceeds of Senior Bonds on deposit to the credit of the Interest Sub-Account for paying that interest (provided, however, that for interest payable on any Series of Senior Bonds other than semi-annually or at a variable rate, and for a first interest payment date or as otherwise provided in any Supplemental Indenture for any Series of Senior Bonds, the amount so deposited shall be as provided in the Supplemental Indenture authorizing the Senior Bonds providing for such deposits). For purposes of calculating the periodic transfers required to be made to the Interest Sub-Account with respect to the 2009A Bonds and the 2009B Bonds pursuant to said clause (b), the Treasurer may apply the Subsidy Payments on deposit with the Trustee as a credit against the interest due on the date of deposit of the Subsidy Payments or if none is then due or such interest payment has been fully provided for, against the next interest due on the 2009A Bonds and the 2009B Bonds. Interest payable shall take into account any Qualified Hedge Agreement as provided under the Indenture;
(2) to the credit of the Principal Sub-Account, an amount equal to (a) any principal due and unpaid on Outstanding Senior Bonds plus (b) for each Series of Senior Bonds, one-twelfth of any principal (including the maturity amount of Capital Appreciation Bonds) of such Outstanding Senior Bonds payable on the next principal payment date within the next twelve months (provided, however, that a Supplemental Indenture authorizing any Series of Senior Bonds which has Principal Installments payable other than annually shall provide for the amounts to be so deposited, and any Supplemental Indenture authorizing any Series of Senior Bonds may provide for additional deposits in the Principal Sub-Account); and
(3) to the credit of the Redemption Sub-Account, an amount for each Series of Senior Bonds equal to one-twelfth of any Sinking Fund Installment of such Outstanding Senior Bonds of that Series payable within the next twelve months (provided, however, that a Supplemental Indenture authorizing Senior Bonds of a Series which has Sinking Fund Installments payable other than annually shall provide for the amounts to be so deposited, and any Supplemental Indenture authorizing Senior Bonds of a Series may provide for additional deposits in the Redemption Sub-Account).
Third, to the credit of the Provider Payment Sub-Account amounts as provided in any Supplemental Indenture for paying Costs of Credit Enhancement or Qualified Hedge Agreements for Senior Bonds or for making reimbursements to Providers of Credit Enhancement or Qualified Hedge Agreements for Senior Bonds; but no such deposit shall be made for making any termination payment for a Qualified Hedge Agreement when there is any deficiency in the Debt Reserve Account; provided, that, with respect to (a) any Credit Enhancements executed and delivered or becoming effective on or after the effective date of the amendment to the Indenture establishing the Termination Payment Account (June 22, 2005) all termination payments required to be made in connection with any such Credit Enhancements shall be paid from the Termination Payment Account and (b) any Qualified Hedge Agreements executed and delivered or becoming effective on or after the effective date of the amendment to the Indenture establishing the Termination Payment Account (June 22, 2005), all termination payments required to be made in connection with any such Qualified Hedge Agreements shall be paid from the Termination Payment Account.
Fourth, to the credit of the Debt Reserve Account, maintained by the Trustee, an amount sufficient to cause the balance in it to equal the Debt Reserve Requirement and to make any required reimbursement to Providers of Reserve Account Credit Facilities, which reimbursement is payable as provided by a Supplemental Indenture from the Debt Reserve Account.
Fifth, to the credit of any Junior Bond Debt Service Account or Junior Bond Debt Reserve Account, maintained by the Trustee, any amounts required by, and in the priority established by, any Supplemental Indentures authorizing Junior Bonds.
Sixth, to the credit of the Termination Payment Account, an amount sufficient to provide for the payment of termination payments then due and owing with respect to (i) Credit Enhancements and Qualified Hedge Agreements executed and delivered or becoming effective on or after the date of execution and delivery of the Seventh

D-15
Supplemental Indenture and (ii) credit enhancement and similar agreements and hedge agreements executed and delivered pursuant to any Supplemental Indenture authorizing Junior Bonds.
Seventh, to the credit of the Renewal and Replacement Account, that portion of the Renewal and Replacement Deposit set forth in the Annual Budget for the then current Fiscal Year that would have accrued on a pro rata basis to the end of the current calendar month if deemed to accrue monthly on a pro rata basis from the first day of the then current Fiscal Year, less all other amounts previously transferred by the Treasurer for deposit to the credit of the Renewal and Replacement Account during that Fiscal Year.
Eighth, at the direction of the Authority, to the credit of the Improvement Account, for allocation to a project or projects as determined by the Authority in its sole discretion, until the balance in such Account is equal to the Improvement Requirement or such lesser amount as the Authority may from time to time determine by resolution.
Ninth, at the direction of the Authority, the balance of such amounts in the Revenue Fund for deposit to the credit of the System Reserve Account.
Any deficiency in the credits required to the various Accounts and Sub-Accounts in any month shall be added to the required credit for the next month.
Funds, Accounts and Sub-Accounts. The Indenture establishes the following Funds and Accounts:
(a) Revenue Fund
(b) Maintenance and Operation Account
(c) Debt Service Account held by the Trustee
(d Debt Reserve Account held by the Trustee
(e) Any Junior Bond Debt Service Account held by the Trustee
(f) Any Junior Bond Debt Reserve Account held by the Trustee
(g) Termination Payment Account held by the Trustee
(h) Renewal and Replacement Account
(i) Improvement Account
(j) System Reserve Account
(k) Construction Fund (by Supplemental Indenture, segregated accounts therein held by the Trustee).
All moneys deposited under the provisions of the Indenture are required to be deposited with one or more Depositaries, in trust and applied only in accordance with the Indenture.
Certain of the foregoing Accounts and Sub-Accounts are established under the Indenture for the following purposes:
Maintenance and Operation Account — Operating Sub-Account. The Authority is required to pay Operating Expenses from the Operating Sub-Account in accordance with the Authority’s Annual Budget.
Maintenance and Operation Account — Operating Reserve Sub-Account. Subject to the requirements of the Authority’s Annual Budget, moneys, if any, on deposit to the credit of the Operating Reserve Sub-Account shall be

D-16
held as a reserve for the payment of Operating Expenses and shall be withdrawn from time to time by the Authority, to the extent that moneys are not available to the credit of the Operating Sub-Account, in order to pay Operating Expenses. As of the last day of each Fiscal Year, the Authority shall transfer from the Operating Reserve Sub-Account to the Operating Sub-Account the amount, if any, to the credit of the Operating Reserve Sub-Account in excess of thirty percent of the amount budgeted for Operating Expenses in the Annual Budget for the then current Fiscal Year.
Debt Service Account and Debt Reserve Account. The Indenture establishes the Debt Service Account and Debt Reserve Account for the benefit of the Outstanding Senior Bonds, and any Additional Senior Bonds. The Indenture authorizes the establishment of Junior Bond Debt Service Accounts and Junior Bond Debt Reserve Accounts.
Debt Service Account. The Trustee shall pay to the respective Paying Agents in Current Funds (i) out of the Interest Sub-Account on or before each interest payment date for any Senior Bonds, including the 2021A Bonds, the amount required for the interest payable on such date; (ii) out of the Principal Sub-Account on or before each such interest payment date, an amount equal to the principal amount of the Outstanding Senior Bonds that mature on such date; and (iii) out of the Redemption Sub-Account on or before the day preceding any date fixed for redemption of Outstanding Senior Bonds from Sinking Fund Installments, the amount required for the payment of the Redemption Price of such Senior Bonds then to be redeemed. The Trustee shall also pay out of the Interest Sub-Account the accrued interest included in the purchase price of Senior Bonds purchased for retirement. The Trustee shall, at any time there is a deficiency in credits to the Interest Sub-Account, the Principal Sub-Account and the Redemption Sub-Account, apply amounts in the Provider Payment Sub-Account to remedy those deficiencies, in that order. The Trustee shall pay from the Provider Payment Sub-Account after any payment, as provided in the preceding sentence, has been made, to Providers amounts for paying Costs of Credit Enhancement or costs of Qualified Hedge Agreements for Senior Bonds, or making reimbursement to Providers of Credit Enhancement or Qualified Hedge Agreements, for Senior Bonds, as provided in Supplemental Indentures for Senior Bonds, but only if there is no deficiency in the Interest, Principal or Redemption Sub-Accounts.
Amounts to the credit of the Redemption Sub-Account with respect to Sinking Fund Installments are required to be applied to the purchase or redemption of Senior Bonds subject to redemption pursuant to Sinking Fund Installments as follows:
(i) Amounts deposited to the credit of the Redemption Sub-Account to be used in satisfaction of any Sinking Fund Installment may, and if so directed by the Authority shall, be applied by the Trustee, on or prior to the forty-fifth day preceding the next scheduled Sinking Fund Installment date, to the purchase of Senior Bonds for which such Sinking Fund Installment was established. That portion of the purchase price attributable to accrued interest shall be paid from the Interest Sub-Account. All such purchases of Senior Bonds shall be made at prices not exceeding the applicable Sinking Fund Redemption Price of such Senior Bonds plus accrued interest, and such purchases shall be made in such manner as the Authority shall determine. The principal amount of any Senior Bonds so purchased shall be deemed to be a part of the Redemption Sub-Account until such Sinking Fund Installment date, for the purpose of calculating the amount on deposit in such Sub-Account.
(ii) At any time up to the forty-sixth day preceding the next scheduled Sinking Fund Installment date, the Authority may purchase with any available funds, which may include amounts in the Improvement Account or the System Reserve Account, Senior Bonds for which such Sinking Fund Installment was established and surrender such Senior Bonds to the Trustee at any time up to such forty-fifth day.
(iii) To the extent that amounts are available to the credit of the Redemption Sub-Account and the Debt Reserve Account, and after giving effect to the Senior Bonds purchased by the Trustee and Senior Bonds surrendered by the Authority, which shall be credited against the Sinking Fund Installment for the Senior Bonds at their applicable sinking fund Redemption Price, and as soon as practicable after the forty-fifth day preceding the next scheduled Sinking Fund Installment date, the Trustee shall proceed to call for redemption on such scheduled Sinking Fund Installment date Senior Bonds of the Series and maturity for which such Sinking Fund Installment was established (except in the case of Senior Bonds maturing on a Sinking Fund Installment date which shall be retired from payments from the Principal Sub-Account) in such

D-17
amount as shall be necessary to complete the retirement of the unsatisfied portion of such Sinking Fund Installment. The Trustee shall pay out of the Redemption Sub-Account (after transfers to it from the Debt Reserve Account, if required) to the appropriate Paying Agents, on or before the day preceding such redemption date, the Redemption Price required for the redemption of the Senior Bonds so called for redemption, and such amount shall be applied by such Paying Agents to such redemption.
(iv) If the principal amount of Senior Bonds retired through application of amounts in satisfaction of any Sinking Fund Installment shall exceed such Sinking Fund Installment, or in the event of the purchase or redemption from moneys other than from the Redemption Sub-Account of Senior Bonds of any Series and maturity for which Sinking Fund Installments have been established, such excess or the principal amount of Senior Bonds so purchased or redeemed, as the case may be, shall be credited toward future scheduled Sinking Fund Installments either (i) in the order of their due dates or (ii) in such order as the Authority establishes in a certificate signed by an Authorized Officer and delivered to the Trustee on or prior to the date which is forty-five days after such redemption date.
(v) Failure to retire the entire scheduled amount of Senior Bonds through the application of any Sinking Fund Installment on or prior to the next scheduled Sinking Fund Installment date shall not be an Event of Default under the Indenture. Any amount of Senior Bonds not so retired shall be added to the amount to be retired on the next scheduled Sinking Fund Installment date for such Senior Bonds. See APPENDIX D – “SUMMARY OF CERTAIN PROVISIONS OF THE INDENTURE – EVENTS OF DEFAULT.”
Debt Reserve Account. If on the due date of any interest on any Senior Bonds, including the 2021A Bonds, or any Principal Installment thereof, the aggregate amount to the credit of the Debt Service Account shall be less than the amount required to pay such interest or Principal Installment (and any other net amounts payable by the Authority from the Interest Sub-Account for Qualified Hedge Agreements) of any Senior Bonds, the Trustee shall apply amounts from the Debt Reserve Account to the extent necessary to make good the deficiency, in the following order of priority: first, to the credit of the Interest Sub-Account, then to the credit of the Principal Sub-Account and then to the credit of the Redemption Sub-Account.
In lieu of any required deposits into the Debt Reserve Account, the Authority may cause to be deposited into the Debt Reserve Account one or more Reserve Account Credit Facilities in total amounts equal to the difference between the Debt Reserve Requirement and the sums then on deposit to the credit of the Debt Reserve Account, if any. The Provider of the Reserve Account Credit Facility which is a surety bond or insurance policy shall be an insurer whose municipal bond insurance policies insuring the payment, when due, of the principal of and interest on municipal bond issues results in such issues being rated in the highest rating category by S&P and Moody’s, or their successors, or any insurer who holds the highest policyholder rating accorded insurers by A.M. Best & Co. or any comparable service; provided that the Authority shall give each rating agency which gives any Bonds a Rating at least 7 days prior written notice before acquiring such a Reserve Account Credit Facility which does not meet the rating requirement of this sentence from S&P and Moody’s, or their successors. The Provider of the Reserve Account Credit Facility which is a letter of credit shall be a bank or trust company or other legal entity which is rated not lower than the second highest rating category by S&P and Moody’s, or their successors, and the letter of credit or other credit facility itself shall be rated in the highest category of both such rating agencies. If a disbursement is made pursuant to any Reserve Account Credit Facility, the Authority shall be obligated either (i) to reinstate the maximum limits of such Reserve Account Credit Facility or (ii) to deposit to the credit of the Debt Reserve Account, funds in the amount of the disbursement made under such Reserve Account Credit Facility, or a combination of such alternatives, as shall provide that the amount to the credit of the Debt Reserve Account equals the Debt Reserve Requirement within a time period not longer than would have been required to restore the Debt Reserve Account by operation of the monthly transfer of funds from the Revenue Fund, as applicable.
Notwithstanding the provisions of the preceding paragraph, upon receipt of consent of the Holders of Bonds and Providers as described under “Supplemental Indentures” in this APPENDIX D and under “SECURITY AND SOURCES OF PAYMENT FOR THE 2021A BONDS – Certain Amendments to the Indenture – Reserve Account Credit Facility Amendment,” in lieu of any required deposits into the Debt Reserve Account, the Authority may cause to be deposited into the Debt Reserve Account one or more Reserve Account Credit Facilities which shall be in total amounts equal to the difference between the Debt Reserve Requirement and the sums then on deposit to the credit of the Debt Reserve Account, if any. Any Reserve Account Credit Facility shall be payable to the Trustee

D-18
for the equal and ratable benefit of all of the Holders of the Senior Bonds (upon the giving of notice as required under the Reserve Account Credit Facility) on any interest payment date on which moneys will be required to be withdrawn from the Debt Reserve Account and applied to the payment of the Principal Installments of or interest on any such Bonds which withdrawal cannot be met by any amounts on deposit to the credit of the Debt Reserve Account. The Provider of the Reserve Account Credit Facility which is a surety bond or insurance policy shall be an insurer whose municipal bond insurance policies insuring the payment, when due, of the principal of and interest on municipal bond issues results in such issues being rated not lower than the second highest rating category by any nationally-recognized rating agency, or any insurer who holds the highest policyholder rating accorded insurers by A.M. Best & Co. or any comparable service; provided that the Authority shall give each rating agency which gives any Bonds a Rating at least 7 days prior written notice before acquiring such a Reserve Account Credit Facility which does not meet the rating requirement of this sentence from any nationally-recognized rating agency. The Provider of the Reserve Account Credit Facility which is a letter of credit shall be a bank or trust company or other legal entity which is treated not lower than the second highest rating category by any nationally-recognized rating agency, and the letter of credit or other credit facility itself shall be rated in the highest rating category of both such rating agencies. If a disbursement is made pursuant to any Reserve Account Credit Facility, the Authority shall be obligated either (i) to reinstate the maximum limits of such Reserve Account Credit Facility or (ii) to deposit to the credit of the Debt Reserve Account, funds in the amount of the disbursement made under such Reserve Account Credit Facility, or a combination of such alternatives, as shall provide that the amount to the credit of the Debt Reserve Account equals the Debt Reserve Requirement within a time period not longer than would have been required to restore the Debt Reserve Account by operation of the monthly transfer of funds from the Revenue Fund, as applicable.
Whenever the amount to the credit of the Debt Reserve Account shall exceed the Debt Reserve Requirement, after making any required reimbursement to a Provider of a Reserve Account Credit Facility, the Trustee shall use such excess to remedy any deficiency in the Debt Service Account and at the written direction of the Authority promptly transfer such excess to the Authority to be applied as Revenues as further described in APPENDIX D –“SUMMARY OF CERTAIN PROVISIONS OF THE INDENTURE – FLOW OF FUNDS”; provided, however, that upon the written direction of the Authority, the Trustee shall promptly transfer all or any portion of the amount of such excess as specified in such direction (i) to a refunding or defeasance escrow established pursuant to the Indenture, or (ii) for any purpose for which Senior Bonds may be issued.
The Trustee shall pay to Providers of Reserve Account Credit Facilities any reimbursement which is payable from the Debt Reserve Account as provided by a Supplemental Indenture, and upon the written direction of an Authorized Officer shall use amounts in the Debt Reserve Account to acquire a Reserve Account Credit Facility, but only to the extent that after such payment the amount to the credit of the Debt Reserve Account, including the amount of any Reserve Account Credit Facilities, either is not less than the Debt Reserve Requirement or is not reduced by the payment or acquisition.
Junior Bond Accounts. The Trustee shall apply amounts in the Junior Bond Debt Service Accounts and the Junior Bond Debt Reserve Accounts as required by, and in the priority established by, any Supplemental Indenture authorizing Junior Bonds.
Termination Payment Account. Moneys to the credit of the Termination Payment Account are to be applied at the direction of the Authority to the payment of termination payments with respect to (i) Credit Enhancements and Qualified Swap Agreements and (ii) credit enhancement and similar agreements and hedge agreements executed and delivered pursuant to any Supplemental Indenture authorizing Junior Bonds.
If at any time the amounts to the credit of the Debt Service Account, the Debt Reserve Account, the Improvement Account and the System Reserve Account shall be insufficient to pay the interest and Principal Installments becoming due on the Senior Bonds, the Authority upon notice from the Trustee shall transfer from the Termination Payment Account for deposit to the credit of the Debt Service Account the amount necessary (or the entire available amount to the credit of the Termination Payment Account if less than the amount necessary) to make up such deficiency, in the following order of priority: first, to the credit of the Interest Sub-Account, then to the credit of the Principal Sub-Account, then to the credit of the Redemption Sub-Account and then to the credit of the Provider Payment Sub-Account.

D-19
If, at any time after the transfers referred to in the prior paragraph have been made or have been determined by the Trustee to be unnecessary, the amounts to the credit of any debt service account or debt service reserve account established pursuant to a Supplemental Indenture authorizing Junior Bonds, the Improvement Account and the System Reserve Account shall be insufficient to pay the interest and Principal Installments becoming due on any Junior Bonds or to make required payments from any such debt service account, the Authority upon notice from the Trustee shall transfer from the Termination Payment Account to the Trustee for deposit to the credit of such debt service account the amount necessary (or the entire available amount to the credit of the Termination Payment Account if less than the amount necessary) to make up such deficiency in the order or priority specified by the Supplemental Indenture authorizing the related Junior Bonds.
Renewal and Replacement Account. Moneys to the credit of the Renewal and Replacement Account are to be applied to Renewal and Replacement Expenses at the direction of the Authority.
If, at any time the amounts to the credit of the Debt Service Account, the Debt Reserve Account, the Improvement Account, and the System Reserve Account shall be insufficient to pay the interest and Principal Installments becoming due on Senior Bonds, the Authority upon notice from the Trustee shall transfer from the Renewal and Replacement Account and its revolving account to the Trustee for deposit to the credit of the Debt Service Account the amount necessary (or the entire available amount to the credit of the Renewal and Replacement Account and its revolving account if less than the amount necessary) to make up such deficiency, in the following order of priority: first, to the credit of the Interest Sub-Account, then to the credit of the Principal Sub-Account, then to the credit of the Redemption Sub-Account, and then to the credit of the Provider Payment Sub-Account.
Improvement Account. Moneys to the credit of the Improvement Account are to be applied to the payment of the costs of Improvements at the direction of the Authority.
If at any time the amounts to the credit of the Debt Service Account, the Debt Reserve Account and the System Reserve Account shall be insufficient to pay the interest and Principal Installments becoming due on the Senior Bonds and to make required payments from the Debt Service Account, the Authority upon notice from the Trustee shall transfer from the Improvement Account and its revolving account to the Trustee for deposit to the credit of the Debt Service Account the amount necessary (or the entire available amount to the credit of the Improvement Account and its revolving account if less than the amount necessary) to make up such deficiency, in the following order of priority: first, to the credit of the Interest Sub-Account, then to the credit of the Principal Sub-Account, then to the credit of the Redemption Sub-Account and then to the credit of the Provider Payment Sub-Account.
The Authority may, from time to time, cause the Consulting Engineers to prepare and file estimates of the cost of the proposed Improvements, and the Authority may adopt resolutions pursuant to such estimates to establish the Improvement Requirement. In the event the cost of any Improvement is increased in accordance with such procedures, the Improvement Requirement with respect to such Improvement shall be correspondingly increased. In the event the cost of any Improvement is decreased in accordance with such procedures, the Improvement Requirement with respect to such Improvement shall be correspondingly reduced and any resulting excess to the credit of the Improvement Account shall, at the discretion of the Authority, be promptly credited for the cost of any other Improvement or be promptly transferred to the credit of the System Reserve Account.
Nothing contained in the Indenture shall prohibit the Authority from withdrawing moneys deposited to the credit of the Improvement Account for any Improvement, and depositing such moneys to the credit of an account in the Construction Fund or to the credit of any other fund, account or sub-account maintained for the purposes of paying the cost of such Improvement.
System Reserve Account. The Authority shall transfer to the Trustee, upon requisition by the Trustee, from amounts on deposit to the credit of the System Reserve Account and its revolving account for credit (i) to the various Accounts and Sub-Accounts, and in the order of the priority specified in APPENDIX D – “SUMMARY OF CERTAIN PROVISIONS OF THE INDENTURE – FLOW OF FUNDS,” the amount necessary (or the entire amount to the credit of the System Reserve Account and its revolving account if less than the amount necessary) to make up any deficiencies in payments to said Accounts and Sub-Accounts required under the Indenture, and (ii) in the event of any transfer of moneys from the Debt Reserve Account, to the credit of the Accounts from which such transfers were made in the order of priority specified in APPENDIX D – “SUMMARY OF CERTAIN

D-20
PROVISIONS OF THE INDENTURE – FLOW OF FUNDS,” the amount of any resulting deficiency in such Accounts.
Amounts on deposit to the credit of the System Reserve Account and its revolving account after all required transfers and payments may, in the sole discretion of the Authority, be applied to any one or more of the following purposes:
(a) to make payments, when due, on Subordinated Indebtedness;
(b) to provide for the purchase or redemption of any Bonds;
(c) to make payments into any separate account or accounts established in the Construction Fund for any Project;
(d) to provide improvements, extensions, betterments, renewals and replacements of the Tollway System, including studies, surveys, estimates and investigations relating thereto, or the provision of reserves for those purposes;
(e) to apply as Revenues pursuant to the Indenture;
(f) to be transferred to any Fund or Account established under the Indenture or any Supplemental Indenture; and
(g) for any other lawful Authority purpose, including repayment of any other indebtedness incurred by the Authority.
Creation of Additional Accounts and Sub-Accounts. The Trustee or the Treasurer, as the case may be, shall, at the written request of the Authority, establish such additional Accounts within any of the Funds established under the Indenture, and Sub-Accounts within any of the Accounts established under the Indenture, as shall be specified in such written request, for the purpose of enabling the Authority to identify or account for more precisely the sources, timing and amounts of transfers or deposits into such Funds, Accounts and Sub-Accounts, the amounts on deposit in or credited to such Funds, Accounts or Sub-Accounts as of any date or dates of calculation, and the sources, timing and amounts of transfers, disbursements or withdrawals from such Funds, Accounts or Sub-Accounts; but the establishment of any such additional Accounts or Sub-Accounts shall not alter or modify in any manner or to any extent any of the requirements of the Indenture with respect to the deposit or use of moneys in any Fund, Account or Sub-Account established under the Indenture.
Investments of Certain Moneys. All moneys held in any separate, segregated accounts of the Construction Fund held by the Trustee, Debt Service Account and its Sub-Accounts, or the Debt Reserve Account, shall be invested and reinvested at the direction of the Authority to the fullest extent practicable in Investment Securities that mature no later than necessary to provide moneys when needed for payments to be made from such Funds, Accounts or Sub-Accounts, but no moneys in the Debt Reserve Account shall be invested in any Investment Security maturing more than ten (10) years from the date of such investment. Amounts in the Revenue Fund may be invested by the Treasurer, at the direction of the Authority, in Investment Securities maturing not later than necessary to provide moneys when needed for payments from such portion of the Revenue Fund so held by the Authority pursuant to the Indenture.
Moneys held in any Junior Bond Debt Service Account or Junior Bond Debt Reserve Account shall be invested and reinvested by the Trustee as provided in the applicable Supplemental Indentures.
Valuation of Investments. Valuation of Investment Securities held in the Funds, Accounts and Sub-Accounts established under the Indenture will be made as often as may be necessary to determine the amounts held under the Indenture, except the valuation of Investment Securities held in the Debt Service Account and its Sub-Accounts, the Debt Reserve Account, any Junior Bond Debt Service Account and its Sub-Accounts and any Junior Bond Debt Reserve Account shall also be made on December 20 of each year.

D-21
Deposits. All moneys on deposit to the credit of the Construction Fund, the Debt Service Account, the Debt Reserve Account, any Junior Bond Debt Service Account and any Junior Bond Debt Reserve Account shall be continuously and fully secured for the benefit of the Authority and the Holders of the Bonds, by lodging with the Trustee as collateral security, direct obligations of or obligations unconditionally guaranteed by the United States of America having a market value (exclusive of accrued interest) not less than the amount of such moneys. All other moneys held for the Authority under the Indenture shall be continuously and fully secured for the benefit of the Authority and the Holders of the Bonds as provided by applicable state law with respect to the investment of public funds.
Application of Subsidy Payments
The Authority covenants in the Twelfth Supplemental Indenture and the Thirteenth Supplemental Indenture to deposit or cause to be deposited with the Trustee promptly upon receipt all collections of Subsidy Payments for application to the payment of the next interest due on the 2009A Bonds and the 2009B Bonds. The Authority further covenants that subject to its right to elect to apply collections of the Subsidy Payments to purposes other than the payment of interest, as described below, the Authority will take all actions required by law or applicable regulations as necessary to provide for the collection to the fullest extent possible of the Subsidy Payments and will take no action or fail to take any action which in any way would materially adversely affect the ability of the Authority to collect the Subsidy Payments to the fullest extent possible.
Notwithstanding the covenant described in the preceding paragraph, the Authority may elect to apply collections of the Subsidy Payments to purposes other than the payment of interest with respect to the 2009A Bonds and the 2009B Bonds. If the Authority so elects, the Authority will provide written notice to the Trustee (i) that it will no longer deposit or cause to be deposited with the Trustee some or all of the collections of the Subsidy Payments and (ii) of the first interest payment date with respect to which the Subsidy Payments will not be deposited (the “Payment Termination Date”), which written notice shall be accompanied by the following:
(i) A certificate of an Authorized Officer demonstrating that the Net Revenues as reflected in the books of the Authority for a period of 12 consecutive calendar months out of the 18 calendar months next preceding the Payment Termination Date exceeded the Net Revenue Requirement for that 12-month period; provided that if any adjustment of toll rates shall have been placed in effect during that 12-month period, Net Revenues shall reflect the Revenues which the Traffic Engineers estimate in their certificate described in paragraph (iii) below would have resulted had such toll rate adjustment been in effect for the entire 12-month period;
(ii) A certificate of the Traffic Engineers stating whether, to the best of their knowledge, any Federal, State or other agency has begun, or is then projecting or planning, the construction, improvement or acquisition of any highway or other facility which, in the opinion of the Traffic Engineers, may be materially competitive with any part of the Tollway System, and the estimated date of completion of such construction, improvement or acquisition;
(iii) A certificate of the Traffic Engineers setting forth estimates of toll receipts for the then current and each future Fiscal Year to and including the fifth full Fiscal Year after the Payment Termination Date. The estimates will give effect to (A) the completion as estimated of any Project not yet completed, (B) the assumption that any competitive highway or other facility referred to in their certificate described in subparagraph (ii) above will be completed on the date so estimated as provided in said subparagraph (ii) and will subsequently be in operation during the period covered by such estimates, (C) any adjustment of toll rates which will have been placed in effect subsequent to the beginning of the 12-month period referred to in the certificate of an Authorized Officer described in paragraph (i), above, as if such toll rate adjustment had been in effect from the beginning of the period covered by such estimate until the effective date of any subsequent adjustment presumed necessary and (D) any adjustment of toll rates which, in the opinion of the Traffic Engineers, would be necessary to comply with the provisions of the toll covenant described under “SECURITY AND SOURCES OF PAYMENT FOR THE 2021A BONDS – Toll Covenant,” as if such adjustment were to be in effect from its effective date to the effective date of any other such adjustment;

D-22
(iv) A certificate of the Consulting Engineers setting forth for the years and on the assumptions specified in the certificate of the Traffic Engineers described in paragraph (iii) above, estimates of the Operating Expenses and Renewal and Replacement Deposits; and
(v) A certificate of an Authorized Officer setting forth the estimated Net Revenues (based on the certificates described in paragraphs (iii) and (iv) above) for the current and each future Fiscal Year through the fifth full Fiscal Year after the Payment Termination Date, and stating that such estimated Net Revenues for each such Fiscal Year equal or exceed the estimated Net Revenue Requirement for such Fiscal Year.
ADDITIONAL INDEBTEDNESS
The Indenture permits the issuance of additional indebtedness, including (a) Senior Bonds on a parity with the Outstanding Senior Bonds, including the 2021A Bonds, (b) Junior Bonds, and (c) Subordinated Indebtedness.
Senior Bonds. Additional Senior Bonds may be incurred for the purposes of (a) paying the Costs of Construction of any Project, (b) refunding or prepaying, including at or prior to maturity any (i) Senior Bonds or (ii) any other obligation of the Authority issued or entered into for purposes for which Senior Bonds may be issued, including paying related costs of issuance, costs of redemption of refunded bonds, capitalized interest, Costs of Credit Enhancement or Costs of Hedge Agreements or termination payments with respect to Credit Enhancements or Hedge Agreements becoming effective on or after the execution and delivery of the Seventh Supplemental Indenture, (c) making deposits to the Debt Reserve Account or acquiring a Reserve Account Credit Facility, (d) paying interest on any Bond, (e) paying any costs of issuing Senior Bonds or (f) paying Costs of Credit Enhancement or Costs of Qualified Hedge Agreements for the Additional Senior Bonds. A description of the requirements relating to the incurrence of additional indebtedness follows:
Senior Bonds may be issued on a parity with the Outstanding Senior Bonds, for a Project, provided, among other things that the Authority certifies that (1) Net Revenues as reflected in the books of the Authority for a period of 12 consecutive calendar months out of the 18 calendar months next preceding such issuance (as adjusted to reflect any adjustments of toll rates made during such 12-month period as if such toll rates had been in effect for the entire 12-month period) exceeded the Net Revenue Requirement for such 12-month period; (2) estimated Net Revenues (based on certificates of the Traffic Engineers and Consulting Engineers) for the current and each future Fiscal Year through the fifth full Fiscal Year after the estimated date when each Project for which Additional Senior Bonds are being issued will be placed in service, and in any case, to and including the fifth full Fiscal Year after the date of issuance of such Additional Senior Bonds, shall be at least equal to the estimated Net Revenue Requirement for such Fiscal Year; and (3) if such Additional Senior Bonds are being issued to pay Costs of Construction of a Project, the amount of the proceeds of the proposed Bonds, which may be issued in one or more Series, together with other funds then available or expected to be available, will be sufficient to pay the remainder of the Cost of Construction of such Project as scheduled. For purposes of estimating Net Revenues and determining the Net Revenue Requirement, the Authority shall rely on estimates of the Traffic Engineers with respect to toll receipts (as further described below) and on estimates of the Consulting Engineers with respect to Operating Expenses, budgeted or projected Renewal and Replacement Deposits and the costs and completion dates of Projects. In addition, the Traffic Engineers are required to certify whether, to the best of their knowledge, any Federal, state or other agency has begun or is then projecting or planning, the construction, improvement or acquisition of any highway or other facility that, in the opinion of the Traffic Engineers, may be materially competitive with any part of the Tollway System and the estimated date of completion of such construction, improvement or acquisition. The estimates of the Traffic Engineers shall give effect to (i) the completion as estimated of any Project not yet completed, (ii) the assumption that any competitive highway or other facility referred to in the certificate described in the preceding sentence will be completed on the date so estimated and subsequently be in operation during the period covered by such estimates, (iii) any adjustment of the toll rates that became effective subsequent to the beginning of the 12-month period described in clause (1) of the first sentence of this paragraph, as if such toll rate adjustment had been in effect from the beginning of the period covered by such estimate until the effective date of any subsequent adjustment presumed necessary and (iv) any adjustment of toll rates which, in the opinion of the Traffic Engineers, would be necessary to comply with the toll covenant described under “SECURITY AND SOURCES OF PAYMENT FOR THE 2021A BONDS – Toll Covenant” as if such adjustment was to be in effect from its effective date to the effective date of any other adjustment.

D-23
One or more series of Senior Bonds may be issued on a parity with the Outstanding Senior Bonds for the purpose of completing a Project for which Senior Bonds were previously issued without meeting the test described above, provided that the Trustee receives a certificate of the Consulting Engineers stating (i) the purpose for which the Additional Senior Bonds are to be issued, which shall be to complete a Project for which Senior Bonds have been issued, without material change in scope, (ii) that the amount of available proceeds of the Additional Senior Bonds issued for the purposes of completing the Project, together with other funds of the Authority then available or expected to be available for completing the Project, including proceeds of one or more other Series of Additional Bonds to be issued for such purpose, will be sufficient, in their opinion, to pay the cost of completion of the Project; and (iii) that the amount of proceeds of such Additional Senior Bonds available for completing the Project will not exceed 10% of the total estimated Costs of Construction as provided in the Certificate of the Consulting Engineers provided for the Additional Senior Bonds previously issued for that Project.
Senior Bonds may be issued on a parity with the Outstanding Senior Bonds for the purpose of refunding Outstanding Senior Bonds (including paying related Costs of Issuance, deposits to the Debt Reserve Account, capitalized interest or Costs of Credit Enhancement or Costs of Qualified Hedge Agreements for the Additional Senior Bonds) without meeting the test described in the second paragraph under the subheading “Senior Bonds” if there is received by the Trustee (i) a Counsel’s Opinion that upon issuance of the Additional Senior Bonds and application of their proceeds as provided in the authorizing Supplemental Indenture, provision for payment of the refunded Senior Bonds will have been made in accordance with the defeasance provisions of the Indenture; and (ii) the certificate of an Authorized Officer demonstrating (A) for each Fiscal Year in which any Senior Bonds (other than Additional Senior Bonds to be issued) will be Outstanding after the refunding that the Debt Service for the Additional Senior Bonds to be issued will not be greater than 105% of the Debt Service for the Senior Bonds to be refunded and (B) that the aggregate Principal Installments and interest payable in all those Fiscal Years on the Additional Senior Bonds to be issued is less than the aggregate Principal Installments and interest that would have been payable on the Senior Bonds to be refunded, assuming all Sinking Fund Installments are made as provided in the Supplemental Indentures for Senior Bonds.
Junior Bonds. One or more Series of Junior Bonds may be issued as authorized by the Authority by a Supplemental Indenture for any purpose for which Senior Bonds may be issued. Any such Supplemental Indenture shall make provision for the establishment of any Junior Bond Debt Service Account or Accounts and any Junior Bond Debt Reserve Account with respect to any or all Series of Junior Bonds and for the amounts of Net Revenues to be deposited in such Accounts. Any such Supplemental Indenture may grant a lien on and pledge for the payment of principal of and interest on Junior Bonds or reimbursing Providers of Credit Enhancement or Hedge Agreements for Junior Bonds for amounts applied by such Provider to pay such principal or interest, of the (i) Net Revenues to be deposited in any Junior Bond Debt Service Account or Junior Bond Debt Reserve Account, (ii) amounts on deposit from time to time in Junior Bond Debt Service Accounts and Junior Bond Debt Reserve Accounts, (iii) amounts on deposit from time to time in the Renewal and Replacement Account, the Improvement Account and the System Reserve Account and (iv) any other funds, accounts, property or receipts other than Revenues or Funds or Accounts established by the Indenture or a Supplemental Indenture solely for the benefit of Senior Bonds. Any such pledge or lien on Net Revenues and the amounts on deposit from time to time in the Renewal and Replacement Account, the Improvement Account and the System Reserve Account shall be subordinate to the pledge and lien made and granted by the Indenture for Senior Bonds. A Supplemental Indenture providing for the issuance of any Series of Junior Bonds may provide for “events of default” with respect to such Junior Bonds and remedies arising from such “events of default.” Such a remedy may include acceleration of the maturity of any Junior Bonds, but only upon not less than sixty days’ written notice to the Trustee. No remedy shall be contrary to the rights or remedies provided to Holders of Senior Bonds under the Indenture.
Subordinated Indebtedness. Subordinated Indebtedness may be issued for any purpose for which Bonds may be issued under the Indenture, which Subordinated Indebtedness may be payable, pursuant to the authorizing instrument, from amounts on deposit in, and secured by a pledge of and lien on amounts payable from, the System Reserve Account.
Other Indebtedness. Other indebtedness issued for any lawful Authority purpose may be payable, pursuant to the authorizing instrument, from amounts on deposit in the System Reserve Account. The Authority may also issue evidences of indebtedness payable from moneys in the Construction Fund as part of the Cost of Construction for any Project, or payable from, or secured by the pledge of, Revenues to be derived on and after such date as the pledge of

D-24
Net Revenues provided in the Indenture shall be discharged and satisfied. The Authority reserves the right to issue bonds or other evidences of indebtedness for any purpose payable from or secured by funds or sources other than Revenues or moneys on deposit with the Trustee or the Authority under the Indenture.
HEDGING TRANSACTIONS
If the Authority shall enter into any Qualified Hedge Agreement with respect to any Senior Bonds and the Authority has made a determination that the Qualified Hedge Agreement was entered into to provide substitute amounts or limits of the interest due with respect to those Senior Bonds, then during the term of the Qualified Hedge Agreement and so long as the Provider of the Qualified Hedge Agreement is not in default:
(a) for purposes of any calculation of Debt Service, the interest rate on the Senior Bonds with respect to which the Qualified Hedge Agreement applies shall be determined as if such Senior Bonds had interest payments equal to the interest payable on those Senior Bonds less any payments to the Authority from the Provider and plus any payments by the Authority to the Provider as provided by the Qualified Hedge Agreement (other than fees or termination payments of such Provider for providing the Qualified Hedge Agreement);
(b) any such payments (other than fees and termination payments) required to be made by the Authority to the Provider pursuant to such Qualified Hedge Agreement may be made from amounts on deposit to the credit of the Interest Sub-Account; and
(c) any such payments received by the Authority from the Provider pursuant to such Qualified Hedge Agreement shall be deposited to the credit of the Interest Sub-Account.
If the Authority shall enter into a Hedge Agreement that is not a Qualified Hedge Agreement, then:
(a) the interest rate adjustments or assumptions referred to above shall not be made;
(b) any payments required to be made by the Authority to the Provider pursuant to such Hedge Agreement shall be made only from amounts on deposit to the credit of the System Reserve Account; and
(c) any payments received by the Authority from the Provider pursuant to such Hedge Agreement shall be treated as Revenues and shall be deposited to the credit of the Revenue Fund.
REMOVAL OR MERGER OR CONSOLIDATION OF TRUSTEE
The Trustee may be removed at any time by an instrument in writing delivered to the Trustee and signed by the Authority and the Treasurer; provided, however, that if an Event of Default shall have occurred and be continuing, the Trustee may be so removed by the Authority and the Treasurer only with the written concurrence of the Holders of a majority in principal amount of Senior Bonds and the Holders of a majority in principal amount of Junior Bonds then Outstanding. The Trustee may be removed at any time by the Holders of a majority in principal amount of the Senior Bonds then Outstanding excluding any Bonds held by or for the account of the Authority.
Any company into which the Trustee may be merged or converted or with which it may be consolidated or any company resulting from any merger, conversion or consolidation to which it shall be a party or any company to which all or substantially all corporate trust business of the Trustee may be sold or transferred shall be the successor to the Trustee without the execution or filing of any paper or the performance of any further act, unless such successor delivers written notice of resignation pursuant to the terms of the Indenture.
TOLL RATE COVENANTS
1. The Authority shall at all times charge and collect tolls for the use of the Tollway System at rates not less than those set forth in any schedule of tolls then in effect.

D-25
2. The Authority shall at all times fix, charge and collect such tolls for the use of the Tollway System as shall be required in order that in each Fiscal Year Net Revenues shall at least equal the Net Revenue Requirement for such Fiscal Year.
3. On or before October 31 of each Fiscal Year the Authority shall cause the Traffic Engineers to make a written estimate of the revenues from tolls for the last four months of such Fiscal Year and for the ensuing Fiscal Year and shall complete a review of its financial condition for the purpose of estimating whether the Net Revenues for such Fiscal Year were, and for the next succeeding Fiscal Year will be, sufficient to comply with paragraph 2 above and shall, by resolution, make a determination with respect to that sufficiency. Such review shall take into consideration the anticipated completion date of any uncompleted Projects and the issuance of future Series of Bonds if necessary to finance the completion of such Projects. If the Authority determines that the Net Revenues may not be sufficient to meet the Net Revenue Requirement in either the current or ensuing Fiscal Year, it shall (a) forthwith cause the Traffic Engineers to provide a recommended schedule of tolls for the Tollway System which, in the opinion of the Traffic Engineers, will cause sufficient Revenues to be collected to comply with paragraph 2 in such ensuing Fiscal Year and to eliminate the amount of such estimated deficiency from such current Fiscal Year not later than twelve months after the effective date of such recommended schedule of tolls, and (b) as promptly as practicable but no later than April 30 of such following Fiscal Year, adopt and place in effect the schedule of tolls recommended by the Traffic Engineers.
4. Except as provided in paragraphs 6 and 7 below, the Authority shall not effect any reduction in any toll rate fixed for the use of the Tollway System, except after thirty days’ notice to the Trustee and then only if, accompanying the notice, there shall be filed with the Trustee:
(1) A Certificate of the Traffic Engineers stating whether, to the best of their knowledge, any Federal, State or other agency is then projecting or planning the construction, improvement, or acquisition of any highway or other facility which, in the opinion of the Traffic Engineers, may be materially competitive with any part of the Tollway System and the estimated date of completion of such highway or other facility, and setting forth estimates of Revenues, giving effect to the completion of any uncompleted Project at the time estimated by the Consulting Engineers, for the then current and each of the next ten Fiscal Years or to and including the latest maturity of the Bonds, whichever is first to occur on the assumption that any such competing highway or other facility will be completed on such estimated date and will thereafter be in operation during the period covered by such estimates;
(2) A Certificate of the Consulting Engineers setting forth, for the years and on the assumptions specified in the Certificate of the Traffic Engineers delivered pursuant to clause (1), estimates of Operating Expenses and the Renewal and Replacement Deposit, giving effect to the completion of any uncompleted Project at the time estimated by the Consulting Engineers; and
(3) A Certificate of any Authorized Officer setting forth (i) the Aggregate Debt Service (excluding bond interest, the payment of which shat have been provided by payments or deposits out of Bond proceeds) for the next preceding eighteen months and the Junior Bond Revenue Requirement, during that period, (ii) Renewal and Replacement Deposits for the then current Fiscal Year, and estimated Renewal and Replacement Deposits for each of the next ten Fiscal Years or to and including the latest maturity of the Bonds, whichever is first to occur, (iii) the Aggregate Debt Service for the then current and each of the next ten Fiscal Years or to and including the latest maturity of the Senior Bonds, whichever is first to occur and the Junior Bond Revenue Requirement, during that period, and (iv) the Net Revenues for the next preceding eighteen months; and stating (a) that Net Revenues have equaled at least 1.5 times the Aggregate Debt Service for any twelve consecutive months of the preceding eighteen months, (b) that the estimated Net Revenues (based on the certificates filed pursuant to clauses (1) and (2) of this subsection) for the then current and each of the next ten Fiscal Years or to and including the latest maturity of the Bonds, whichever is first to occur, will be not less than 1.5 times the Aggregate Debt Service for each such Fiscal Year, (c) if there shall be any uncompleted Project, that the Net Revenue Requirement for each such Fiscal Year includes the Aggregate Debt Service, as estimated by such Authorized Officer, with respect to all future Series of Senior Bonds which (based on estimates by the Consulting Engineers of Costs of Construction of such Project) will be required to complete such Project, (d) that the Authority is not in default in the performance of any of the covenants, conditions, agreements or provisions contained in the Bonds or this Indenture and (e) that the

D-26
amount in the Debt Reserve Amount is at least equal to the Debt Reserve Requirement and the amount in the Junior Bond Debt Reserve Account is at least equal to any requirement for such Account established by the related Supplemental Indenture.
5. The Authority may increase toll rates at any time and from time to time upon written recommendation of the Traffic Engineers, as evidenced by their certificate filed by the Authority with the Trustee.
6. The Authority may also make any minor adjustment or reclassification of toll rates or establish special toll rates at any time and from time to time provided that such action (i) is concurred in by the Traffic Engineers and affects traffic of a character specified by the Traffic Engineers as accounting for less than ten percent of the Revenues, as evidenced by the certificate of the Traffic Engineers filed by the Authority with the Trustee, and (ii) the Authority estimates such actions in the aggregate during any Fiscal Year will not result in a reduction of Net Revenues in excess of one and one-half percent of Net Revenues for the current or any future Fiscal Year, as supported by certificates, filed by the Authority with the Trustee, of the Traffic Engineers setting forth estimated Revenues, and of the Consulting Engineers setting forth the estimated Operating Expenses.
7. The Authority may also make any changes in toll rates when there is filed with the Trustee a Certificate of the Traffic Engineers that the change in toll rates is not projected to result in a reduction of Revenues during any Fiscal Year in the next five Fiscal Years or to and including the latest maturity of Senior Bonds, whichever is first to occur.
8. The Authority shall forthwith upon the adoption or revision of any Schedule of tolls or revision file certified copies with the Trustee.
9. The failure in any Fiscal Year to comply with the covenant in paragraph 2 above shall not constitute an Event of Default if the Authority shall comply with paragraph 3 above; provided that if the Traffic Engineers (relying upon the certificate of the Consulting Engineers mentioned below in this paragraph) shall be of the opinion, as shown by their certificate filed with the Trustee, that a schedule of tolls for the Tollway System which would provide funds to meet the requirements specified in paragraph 2 is impracticable at that time, and the Authority, therefore, cannot comply with paragraph 3, then the Authority shall fix and establish such schedule of tolls as is recommended in such certificate by the Traffic Engineers in order to comply as nearly as practicable with paragraph 2, and in such event the failure of the Authority to comply with paragraph 2 and paragraph 3 shall not constitute an Event of Default. The Traffic Engineers’ certificate shall he accompanied by a certificate of the Consulting Engineers setting forth estimates of payments for the then current and each of the next ten Fiscal Years to and including the latest maturity of the Bonds, whichever is first to occur, for Operating Expenses and Renewal and Replacement Deposits, giving effect to the estimated date of completion of construction of any uncompleted Project. The Trustee may, and upon the identical request of the Holders of not less than fifty percent in principal amount of the Senior Bonds Outstanding and upon being indemnified to its satisfaction shall, institute and prosecute in a court of competent jurisdiction or appropriate action to compel revision of the schedule of tolls and the fixing, charging and collection of tolls in accordance with the Act and any of the toll rate covenants.
ADDITIONAL COVENANTS
Sale, Lease or Encumbrance of Property. The Authority will not sell, lease or otherwise dispose of or encumber the Tollway System or any part thereof and will not create or permit to be created any charge or lien on the Revenues, except as permitted under the Indenture including certain instances generally relating to utilities and concessions if the Authority determines that such sale, lease, contract, license, easement or right does not impede or restrict the operation by the Authority of the Tollway System. The Authority may from time to time sell, exchange or otherwise dispose of any real or personal property or release, relinquish or extinguish any interest therein as the Authority shall determine is not needed in connection with the maintenance and operation of the Tollway System and, in the case of real property or any interest therein, will not in the future be needed for any foreseeable improvement to the Tollway System.

D-27
Notwithstanding the provisions of the preceding paragraph, upon receipt of consent of the Holders of Bonds and Providers as described under “Supplemental Indentures” in this APPENDIX D and under “SECURITY AND SOURCES OF PAYMENT FOR THE 2021A BONDS – Certain Amendments to the Indenture – Transfer Amendment,” to the extent permitted by law, the Authority may sell, lease, convey, mortgage, encumber or otherwise dispose, directly or indirectly, all or a portion of the Tollway System or transfer, directly or indirectly, control, management or oversight, or any material aspect of control, management or oversight of the Tollway System, whether of its properties, interests, operations, expenditures, revenues or otherwise (any of the foregoing being referred to as a “Transfer”).
Any Transfer may be part of a transaction in which the Authority enters into a leaseback or other agreement that directly or indirectly gives the Authority a right to control, manage, use and possess the Tollway System.
In connection with any Transfer, the Authority must provide to the Trustee the following:
(i) a certified copy of a resolution of the Authority authorizing and approving the Transfer;
(ii) evidence that the Transfer will not adversely affect the rating on any Bonds Outstanding immediately prior to the Transfer issued by a rating agency then maintaining a rating on such Bonds;
(iii) an opinion of nationally recognized bond counsel selected by the Authority to the effect that the Transfer (i) complies with the provisions of the Act and the Indenture and (ii) will not cause interest on any Senior Bonds or Junior Bonds Outstanding immediately prior to the Transfer or on any Subordinated Indebtedness to become subject to federal income taxation;
(iv) a Certificate of the Traffic Engineers (A) stating whether, to the best of their knowledge, any Federal, State or other agency is then projecting or planning the construction, improvement, or acquisition of any highway or other facility which, in the opinion of the Traffic Engineers, may be materially competitive with the Tollway System as constituted following the Transfer (the Tollway System as constituted following the Transfer being referred to as the “Remaining Tollway System”) and the estimated date of completion of such highway or other facility, and (B) setting forth estimates of toll receipts derived from the Remaining Tollway System for the then current and each of the next ten (10) Fiscal Years or to and including the latest maturity of the Bonds, whichever is first to occur, giving effect, with respect to the Remaining Tollway System, to the factors considered by the Traffic Engineers in delivering their certificates described above under “Additional Indebtedness – Senior Bonds”;
(v) a Certificate of the Consulting Engineers setting forth, for the years and on the assumptions specified in the Certificate of the Traffic Engineers delivered pursuant to clause (iv) above, estimates of Operating Expenses and the Renewal and Replacement Deposits for the Remaining Tollway System, giving effect, with respect to the Remaining Tollway System, to the factors considered by the Consulting Engineers in delivering their certificate described above under “Additional Indebtedness – Senior Bonds”; and
(vi) a Certificate of any Authorized Officer setting forth (i) the Aggregate Debt Service and the Junior Bond Revenue Requirement (excluding, in each case, bond interest, the payment of which shall have been provided by payments or deposits from Bond proceeds) allocable to the Remaining Tollway System (determined as described below, the Aggregate Debt Service and the Junior Bond Revenue Requirement for each Fiscal Year so allocated being referred to as the “Remaining Tollway System Debt Service”) for the next preceding eighteen months, (ii) the Remaining Tollway System Debt Service for the then current and each of the next ten Fiscal Years or to and including the latest maturity of the Bonds, whichever is first to occur and (iii) the Net Revenues allocable to the Remaining Tollway System (determined as described below, the Net Revenues so allocated being referred to as the “Remaining Tollway System Net Revenues”) for the next preceding eighteen months; and stating (a) that Remaining Tollway System Net Revenues have equaled at least one and one-half (1.5) times the Remaining Tollway System Debt Service for any twelve (12) consecutive months of the preceding eighteen (18) months, (b) that the Remaining Tollway System Net Revenues (based on the certificates filed pursuant to clauses (iv) and (v) above) for the then current and each of the next ten Fiscal Years or to and including the latest maturity of the Bonds, whichever is first to occur, will be not less than the greater of (I) one and one-half (1.5) times the Remaining Tollway System Debt

D-28
Service for each such Fiscal Year and (II) the sum of the Remaining Tollway System Debt Service and the Renewal and Replacement Deposit for each such Fiscal Year, (c) that the Authority is not in default in the performance of any of the covenants, conditions, agreements or provisions contained in the Bonds or the Indenture and (d) that the amount in the Debt Reserve Account is at least equal to the Debt Reserve Requirement and the amount in any Junior Bond Debt Reserve Account established pursuant to a Supplemental Indenture authorizing Junior Bonds is at least equal to any requirement for such Account established by the related Supplemental Indenture.
The determination of the Remaining Tollway System Debt Service and the Remaining Tollway System Net Revenues shall be made (i) to the extent determinable, by reference to the actual financial records of the Authority showing (A) Net Revenues generated by the Remaining Tollway System and (B) the Remaining Tollway Debt Service allocable to the Remaining Tollway System, or (ii) if not so determinable, by any reasonable methodology generally incorporating the assumptions of the Traffic Engineers and Consulting Engineers described above. Such determinations may be based, without limitation, by a pro rata method based on such financial results.
All proceeds received by the Authority in connection with a Transfer may be applied by the Authority to any lawful purpose designated by resolution of the Authority.
Annual Budget. The Authority is required to prepare and adopt on or before January 31 of each Fiscal Year the Annual Budget for such Fiscal Year. The Authority may at any time adopt an amended Annual Budget for the remainder of the then current Fiscal Year. Copies of the Annual Budget and of any amended Annual Budget shall be promptly filed with the Trustee, for inspection by Bondholders.
Operation and Maintenance of the Tollway System. The Authority covenants at all times to operate or cause to be operated the Tollway System properly and in a sound and economical manner and to maintain, preserve, reconstruct and keep the Tollway System or cause the Tollway System to be so maintained, preserved, reconstructed and kept so that at all times the operation of the Tollway System may be properly and advantageously conducted.
Maintenance of Insurance. The Authority is required to maintain, to the extent reasonably obtainable, the following kinds of insurance in amounts recommended by the Consulting Engineers or determined by the Authority: multi-risk insurance on the facilities of the Tollway System; use and occupancy insurance covering loss of Revenues by reason of necessary interruption, total or partial, in the use of facilities of the Tollway System; public liability insurance covering injuries to persons or property; during the construction or reconstruction of any portion of the facilities of the Tollway System, such insurance as is customarily carried by others with respect to similar structures used for similar purposes, provided that the Authority shall not be required to maintain any such insurance to the extent that such insurance is carried for the benefit of the Authority by contractors.
The Authority, with the approval of the Consulting Engineers, may adopt self-insurance programs in lieu of maintaining any of the foregoing types of insurance. Each self-insurance program shall include an actuarially sound reserve fund, if any, as recommended by the Consulting Engineers, out of which claims are to be paid. The adequacy of such fund shall be evaluated not later than ninety (90) days after the end of each insurance year. Deficiencies in any such reserve fund shall be made up in accordance with the recommendations of the Consulting Engineers. In the event a self-insurance program is discontinued, the actuarial soundness of any related reserve fund, as recommended by the Consulting Engineers, shall be maintained. With respect to any workers’ compensation self-insurance program, any such reserve fund shall be held as required by law.
EVENTS OF DEFAULT
Each of the following events constitutes an “Event of Default” with respect to Senior Bonds under the Indenture:
a. default in the due and punctual payment of the principal or Redemption Price of any Senior Bond, when and as the same shall become due and payable, whether at maturity or by call for redemption, or otherwise; provided, however, that the failure to retire the entire scheduled amount of Bonds through the application of any Sinking Fund Installment shall not constitute an Event of Default;
D-29
b. default in the due and punctual payment of interest on any Senior Bond, when and as such interest shall become due and payable;
c. default in the performance or observance by the Authority of the toll covenant (see “SECURITY AND SOURCES OF PAYMENT FOR THE 2021A BONDS – Toll Covenant”);
d. receipt of a written declaration of an Event of Default by Holders of not less than 10% of the principal amount of the Senior Bonds (or at least 50% of the principal amount of any Series of Senior Bonds) upon receipt of the Trustee of a notice of the acceleration of the maturity of any Junior Bonds as provided in the Indenture;
e. default in the performance or observance by the Authority of any other of the covenants, agreements or conditions in the Indenture or in any Bonds, and such default shall continue for a period of sixty (60) days after written notice thereof to the Authority by the Trustee or to the Authority and to the Trustee by the Holders of not less than 20% in principal amount of the Senior Bonds Outstanding;
f. if the Authority shall file a petition seeking a composition of indebtedness under the Federal bankruptcy laws, or under any other applicable law or statute of the United States of America or of the State of Illinois;
g. if any part of the Tollway System shall be damaged or destroyed to the extent of impairing its efficient operation and materially and adversely affecting the Revenues, and the Authority shall not have taken reasonable steps to promptly repair, replace, reconstruct or provide a reasonable substitute for the damaged or destroyed part of the Tollway System; or
h. if an order or decree shall be entered, with the consent or acquiescence of the Authority, appointing a receiver or receivers of the Tollway System, or any part thereof, or of the tolls or other revenues therefrom; or if such order or decree entered without the consent or acquiescence of the Authority shall not be vacated or stayed within ninety (90) days after the entry thereof.
If an Event of Default occurs and is not remedied, unless the principal of all Senior Bonds shall have already become due and payable, either the Trustee (by notice in writing to the Authority) or the Holders of not less than a majority in aggregate principal amount of the Senior Bonds Outstanding (by notice in writing to the Authority and the Trustee), may declare the principal of all the Senior Bonds then Outstanding, and the interest accrued on them, to be due and payable immediately.
Application of Revenues and Other Moneys after Default. If an Event of Default shall happen and shall not have been remedied, the Authority, upon demand of the Trustee, shall pay over or cause to be paid over to the Trustee (i) forthwith, all moneys, securities and funds then held by the Authority in any Fund, Account, Sub-Account or revolving fund pursuant to the terms of the Indenture, and (ii) all Revenues as promptly as practicable after receipt thereof.
During the continuance of an Event of Default, the Trustee shall apply such moneys, securities, funds and Revenues and the income therefrom as follows and in the following order: (1) to the payment of the reasonable and proper charges and expenses of the Trustee; (2) to the payment of the amounts required for reasonable and necessary Operating Expenses and for the reasonable renewals, repairs and replacements of the Tollway System necessary to prevent loss of Revenues; (3) to the payment of the principal of, Redemption Price and interest on the Bonds then due in the priority set forth in the Indenture. If the principal of all the Senior Bonds shall have been declared due and payable, the Trustee shall apply available sources of payment first to the ratable payment of the principal and interest then due and unpaid upon the Senior Bonds, and second to the ratable payment of the principal and interest then due and unpaid upon the Junior Bonds.
Proceedings Brought by Trustee. If an Event of Default shall happen and shall not have been remedied, then the Trustee may proceed, and upon written request of the Holders of not less than 20% in principal amount of Senior Bonds Outstanding, shall proceed to protect and enforce its rights and the rights of the Holders of the Bonds under the

D-30
Indenture as the Trustee shall deem most effectual to enforce any of its rights or to perform any of its duties under the Indenture.
The Holders of not less than a majority in principal amount of Senior Bonds at the time Outstanding may direct the time, method and place of conducting any proceedings to be taken in connection with the enforcement of the terms and conditions of the Indenture or for the enforcement of any remedy available to the Trustee, or exercising any trust or power conferred upon the Trustee, provided that the Trustee shall have the right to decline to follow any such direction if the Trustee shall be advised by counsel that the action or proceeding so directed may not lawfully be taken, or if the Trustee in good faith shall determine that the action or proceeding so directed would involve the Trustee in personal liability or be unjustly prejudicial to the Bondholders not parties to such direction.
Regardless of the happening of an Event of Default, the Trustee shall have the power, but unless requested in writing by the Holders of a majority in principal amount of the Senior Bonds then Outstanding, and furnished with reasonable security and indemnity, shall be under no obligation, to institute and maintain such suits and proceedings as may be necessary or expedient to prevent any impairment of the security under the Indenture and to preserve or protect its interests and the interests of the Bondholders.
Notwithstanding any provision of the Indenture, the Act provides that owners of any bonds issued by the Authority may bring civil actions to compel the observance by the Authority or by any of its officers, agents, or employees of any contract or covenant made by the Authority with the owner of such bonds. Further, the Act permits, notwithstanding any provision of the Indenture, owners of any bonds to bring civil actions to compel the Authority and any of its officers, agents or employees, to perform any duties required to be performed for the benefit of the owners of such bonds by the provisions of the resolution authorizing their issuance, or by the Act or to enjoin the Authority and any of its officers, agents or employees from taking any action in conflict with such contract or covenant.
SUPPLEMENTAL INDENTURES
The Authority and the Trustee may without the consent of, or notice to, any of the Bondholders, enter into Supplemental Indentures not inconsistent with the terms and provisions of the Indenture for any one or more of the following purposes: (1) to authorize Senior Bonds or Junior Bonds; (2) to close the Indenture against, or impose additional limitations or restrictions on the issuance of Bonds or other notes, bonds, obligations or other evidences of indebtedness; (3) to impose additional covenants or agreements to be observed by, or to impose other limitations or restrictions on, the Authority; (4) to surrender any right, power or privilege reserved to or conferred upon the Authority by the Indenture; (5) to confirm, as further assurance, any pledge of or lien upon the Revenues or any other moneys, securities or funds; (6) to cure any ambiguity, omission or defect in the Indenture; (7) to provide for the appointment of a successor Fiduciary; and (8) to make any other change that, in the judgment of the Trustee, is not to the prejudice of the Trustee or the Bondholders.
Except for Supplemental Indentures described in the preceding paragraph, any modification or amendment of the Indenture and of the rights and obligations of the Authority and of the Holders of the Bonds thereunder may be made with the written consent of the Holders of at least a majority in principal amount of Senior Bonds of all Outstanding Series which are affected and of the Holders of at least a majority in principal amount of the Junior Bonds of all Outstanding Series which are affected at the time such consent is given. No such modification or amendment shall permit a change in the terms of redemption or maturity of the principal of any Outstanding Bonds, or of any installment of interest thereon or a reduction in the principal amount or the Redemption Price thereof or in the rate of interest thereon without the consent of the Holder of each such Bond, or shall reduce the percentages or otherwise affect the classes of Bonds the consent of the Holders of which is required to effect any such modification or amendment, or shall change or modify any of the rights or obligations of any Fiduciary without its written assent thereto.
Notwithstanding any other provision of the Indenture, in issuing any Bonds the Authority may consent to any modification or amendment to the Indenture that may be adopted by consent of the required percentage of Holders of Bonds. That consent shall, upon the issuance of those Bonds, constitute the irrevocable consent of the Holders of those Bonds.

D-31
DEFEASANCE
If the Authority shall pay or cause to be paid or there shall otherwise be paid, to the Holders of all Bonds the principal or Redemption Price, if applicable, and interest due or to become due thereon, at the times and in the manner stipulated therein and in the Indenture, then the Indenture and all covenants, agreements and other obligations of the Authority to the Bondholders, shall thereupon be discharged and satisfied.
Bonds or interest installments for the payment or redemption of which moneys shall have been set aside and held in trust by the escrow agent at or prior to their maturity or redemption date shall be deemed to have been paid if the Authority shall have delivered to or deposited with the escrow agent (a) irrevocable instructions to pay or redeem all of said Bonds, (b) irrevocable instructions to publish or mail the required notice of redemption of any Bonds so to be redeemed, (c) either moneys in an amount that shall be sufficient or direct obligations of or obligations unconditionally guaranteed by the United States of America the principal of and the interest on which when due will provide moneys that, together with the moneys, if any, deposited with the Trustee at the same time, shall be sufficient, to pay when due the principal or Redemption Price, if applicable, and interest due and to become due on said Bonds on and prior to each specified redemption date or maturity date thereof, as the case may be, and (d) if any of said Bonds are not to be redeemed within the next succeeding sixty (60) days, irrevocable instructions to give notice, as provided in the Indenture, that such deposit has been made with the Trustee and such Bonds are deemed to have been paid under the Indenture.
THIRTY-FIRST SUPPLEMENTAL INDENTURE
The 2021A Bonds are authorized and issued pursuant to the Thirty-First Supplemental Indenture and the Indenture. The terms of the 2021A Bonds are generally described in this Official Statement under the caption “DESCRIPTION OF THE 2021A BONDS.” The proceeds of the 2021A Bonds are required by the Thirty-First Supplemental Indenture to be used for the purposes described in this Official Statement under the captions “PLAN OF FINANCE” and “ESTIMATED SOURCES AND APPLICATIONS OF FUNDS.”
[REMAINDER OF PAGE INTENTIONALLY LEFT BLANK]

[THIS PAGE INTENTIONALLY LEFT BLANK]

E-1
APPENDIX E
BOOK-ENTRY SYSTEM
The Depository Trust Company (“DTC”), New York, New York, will act as securities depository for the 2021A Bonds. The 2021A Bonds will be issued as fully-registered securities registered in the name of Cede & Co. (DTC’s partnership nominee) or such other name as may be requested by an authorized representative of DTC. One fully-registered Bond certificate will be issued for each maturity of the 2021A Bonds, each in the aggregate principal amount of each such maturity, and will be deposited with DTC.
DTC, the world’s largest depository, is a limited-purpose trust company organized under the New York Banking Law, a “banking organization” within the meaning of the New York Banking Law, a member of the Federal Reserve System, a “clearing corporation” within the meaning of the New York Uniform Commercial Code, and a “clearing agency” registered pursuant to the provisions of Section 17A of the Securities Exchange Act of 1934. DTC holds and provides asset servicing for over 3.5 million issues of U.S. and non-U.S. equity issues, corporate and municipal debt issues, and money market instruments from over 100 countries that DTC’s participants (“Direct Participants”) deposit with DTC. DTC also facilitates the post-trade settlement among Direct Participants of sales and other securities transactions in deposited securities, through electronic computerized book-entry transfers and pledges between Direct Participants’ accounts, thereby eliminating the need for physical movement of securities certificates. Direct Participants include both U.S. and non-U.S. securities brokers and dealers, banks, trust companies, clearing corporations, and certain other organizations. DTC is a wholly-owned subsidiary of The Depository Trust & Clearing Corporation (“DTCC”). DTCC is the holding company for DTC, National Securities Clearing Corporation and Fixed Income Clearing Corporation, all of which are registered clearing agencies. DTCC is owned by the users of its regulated subsidiaries. Access to the DTC system is also available to others such as both U.S. and non-U.S. securities brokers and dealers, banks, trust companies and clearing corporations that clear through or maintain a custodial relationship with a Direct Participant, either directly or indirectly (“Indirect Participants”). DTC has a Standard & Poor’s rating of AA+. The DTC Rules applicable to its Participants are on file with the Securities and Exchange Commission. More information about DTC can be found at www.dtcc.com.
Purchases of Bonds under the DTC system must be made by or through Direct Participants, which will receive a credit for the 2021A Bonds on DTC’s records. The ownership interest of each actual purchaser of each 2021A Bond (“Beneficial Owner”) is in turn to be recorded on the Direct and Indirect Participants’ records. Beneficial Owners will not receive written confirmation from DTC of their purchase. Beneficial Owners are, however, expected to receive written confirmations providing details of the transaction, as well as periodic statements of their holdings, from the Direct or Indirect Participant through which the Beneficial Owner entered into the transaction. Transfers of ownership interests in the 2021A Bonds are to be accomplished by entries made on the books of Direct and Indirect Participants acting on behalf of Beneficial Owners. Beneficial Owners will not receive certificates representing their ownership interests in Bonds, except in the event that use of the book-entry system for the 2021A Bonds is discontinued.
To facilitate subsequent transfers, all Bonds deposited by Direct Participants with DTC are registered in the name of DTC’s partnership nominee, Cede & Co., or such other name as may be requested by an authorized representative of DTC. The deposit of Bonds with DTC and their registration in the name of Cede & Co. or such other DTC nominee do not affect any change in beneficial ownership. DTC has no knowledge of the actual Beneficial Owners of the 2021A Bonds; DTC’s records reflect only the identity of the Direct Participants to whose accounts such Bonds are credited, which may or may not be the Beneficial Owners. The Direct and Indirect Participants will remain responsible for keeping account of their holdings on behalf of their customers.
Conveyance of notices and other communications by DTC to Direct Participants, by Direct Participants to Indirect Participants, and by Direct Participants and Indirect Participants to Beneficial Owners will be governed by arrangements among them, subject to any statutory or regulatory requirements as may be in effect from time to time. Beneficial Owners of the 2021A Bonds may wish to take certain steps to augment the transmission to them of notices of significant events with respect to the 2021A Bonds, such as tenders, defaults, and proposed amendments to the security documents. For example, Beneficial Owners may wish to ascertain that the nominee holding the 2021A Bonds for their benefit has agreed to obtain and transmit notices to Beneficial Owners. In the alternative, Beneficial Owners

E-2
may wish to provide their names and addresses to the registrar and request that copies of notices be provided directly to them.
Neither DTC nor Cede & Co. (nor any other DTC nominee) will consent or vote with respect to the 2021A Bonds unless authorized by a Direct Participant in accordance with DTC’s procedures. Under its usual procedures, DTC mails an Omnibus Proxy to the Authority as soon as possible after the record date. The Omnibus Proxy assigns Cede & Co.’s consenting or voting rights to those Direct Participants to whose accounts the 2021A Bonds are credited on the record date (identified in a listing attached to the Omnibus Proxy).
Principal and interest payments on the 2021A Bonds will be made to Cede & Co. or such other nominee as may be requested by an authorized representative of DTC. DTC’s practice is to credit Direct Participants’ accounts upon DTC’s receipt of funds and corresponding detail information from Authority or the Trustee, on payable date in accordance with their respective holdings shown on DTC’s records. Payments by Participants to Beneficial Owners will be governed by standing instructions and customary practices, as is the case with securities held for the accounts of customers in bearer form or registered in “street name,” and will be the responsibility of such Participant and not of DTC, the Trustee or the Authority, subject to any statutory or regulatory requirements as may be in effect from time to time. Payment of principal and interest to Cede & Co. (or such other nominee as may be requested by an authorized representative of DTC) is the responsibility of the Authority or the Trustee, disbursement of such payments to Direct Participants shall be the responsibility of DTC, and disbursement of such payments to the Beneficial Owners shall be the responsibility of Direct and Indirect Participants.
DTC may discontinue providing its services as depository with respect to the 2021A Bonds at any time by giving reasonable notice to the Authority or the Trustee. Under such circumstances, in the event a successor depository is not obtained, Bond certificates are required to be printed and delivered.
The foregoing information in this section concerning DTC and DTC’s book-entry system has been obtained from DTC and neither the Authority nor the Underwriters take any responsibility for the accuracy of such information.
Neither the Authority nor any Fiduciary will have any responsibility or obligation to DTC, any Participants in the Book-Entry System or the Beneficial Owners with respect to (i) the accuracy of any records maintained by DTC or any Participant; (ii) the payment by DTC or by any Participant of any amount due to any Beneficial Owner in respect of the principal amount or redemption or purchase price of, or interest on, any Bonds; (iii) the delivery of any notice by DTC or any Participant; (iv) the selection of the Beneficial Owners to receive payment in the event of any partial redemption of the 2021A Bonds; or (v) any other action taken by DTC or any Participant.
In reading this Official Statement it should be understood that while the 2021A Bonds are in the Book-Entry System, references in this Official Statement to registered owners should be read to include the Beneficial Owner, but (a) all rights of ownership must be exercised through DTC and the Book-Entry System and (b) notices that are to be given to registered owners by the Authority or the Trustee will be given only to DTC.
[REMAINDER OF PAGE INTENTIONALLY LEFT BLANK]

F-1
APPENDIX F
FORM OF OPINION OF BOND COUNSEL
[Letterhead of Chapman and Cutler LLP]
[Date of issuance of 2021A Bonds]
The Illinois State Toll Highway Authority Downers Grove, Illinois
The Bank of New York Mellon Trust Company, N.A., as Trustee Chicago, Illinois
Ladies and Gentlemen:
We hereby certify that we have examined certified copy of the proceedings (the “Proceedings”) of The Illinois State Toll Highway Authority (the “Authority”) passed preliminary to the issue by the Authority of its fully registered Toll Highway Senior Revenue Bonds, 2021 Series A, dated the date hereof, in the aggregate principal amount of $700,000,000 (the “Series 2021A Bonds”). The Series 2021A Bonds mature on January 1 of the years and in the amounts and bear interest at the respective rates percent per annum as follows:
YEAR AMOUNT INTEREST RATE
2039 $ 4,000,000 4.00%2040 20,000,000 4.00%2041 97,000,000 5.00%2042 99,000,000 4.00%2043 120,000,000 5.00%2046 180,000,000 4.00%2046 180,000,000 5.00%
Each of the Series 2021A Bonds bears interest (computed on the basis of a 360-day year composed of twelve 30-day months) from its date until paid, such interest being payable semiannually on January 1 and July 1 of each year, commencing on July 1, 2022.
The Series 2021A Bonds are being issued pursuant to an Amended and Restated Trust Indenture effective March 31, 1999, amending and restating a Trust Indenture dated as of December 1, 1985 (the “Amended and RestatedIndenture”), between the Authority and The Bank of New York Mellon Trust Company, N.A., as successor to J.P. Morgan Trust Company, N.A. and The First National Bank of Chicago, as trustee (the “Trustee”), and a Thirty-First Supplemental Indenture Providing For Toll Highway Senior Revenue Bonds, 2021 Series A, dated as of December 1, 2021 (the “Thirty-First Supplemental Indenture” and collectively with the Amended and Restated Indenture, as supplemented and amended to the date hereof, being referred to herein as the “Indenture.”) The Series 2021A Bonds are issued as Senior Bonds pursuant to the Toll Highway Act of the State of Illinois, as amended (the “Act”), resolutions adopted by the Board of Directors of the Authority on February 25, 2021, and September 9, 2021 (together, the “Bond Resolutions”) and the Indenture. Capitalized terms used herein without definition shall have the meanings assigned to such terms in the Thirty-First Supplemental Indenture.
The Series 2021A Bonds are subject to redemption at the election or direction of the Authority on any date on or after January 1, 2032, in whole or in part, and if in part in Authorized Denominations, and in any order of maturity or Sinking Fund Installments designated by the Authority, at a redemption price of 100 percent of the principal amount of the Series 2021A Bonds called for redemption plus accrued interest, if any, to the redemption date.

F-2
The Series 2021A Bonds maturing on January 1, 2046 and bearing interest at the rate of 4.00% per annum are also subject to mandatory redemption pursuant to Sinking Fund Installments prior to maturity at a Redemption Price equal to the principal amount thereof by application by the Trustee in accordance with the Trust Indenture of funds on deposit to the credit of the Redemption Sub-Account. Subject to the availability of funds for transfer from the Revenue Fund and the Debt Reserve Account under the Trust Indenture, deposits to be applied to Sinking Fund Installments shall be made into the Redemption Sub-Account pursuant to the Trust Indenture in amounts which will make possible the retirement of Series 2021A Bonds of such maturity by purchase during the Fiscal Year, or by mandatory redemption on January 1 of the years and in the principal amounts as follows, as adjusted pursuant to the Trust Indenture:
YEAR
PRINCIPAL
AMOUNT
2044 $60,000,0002045 60,000,000
The Series 2021A Bonds maturing on January 1, 2046 and bearing interest at the rate of 5.00% per annum are also subject to mandatory redemption pursuant to Sinking Fund Installments prior to maturity at a Redemption Price equal to the principal amount thereof by application by the Trustee in accordance with the Trust Indenture of funds on deposit to the credit of the Redemption Sub-Account. Subject to the availability of funds for transfer from the Revenue Fund and the Debt Reserve Account under the Trust Indenture, deposits to be applied to Sinking Fund Installments shall be made into the Redemption Sub-Account pursuant to the Trust Indenture in amounts which will make possible the retirement of Series 2021A Bonds of such maturity by purchase during the Fiscal Year, or by mandatory redemption on January 1 of the years and in the principal amounts as follows, as adjusted pursuant to the Trust Indenture:
YEAR
PRINCIPAL
AMOUNT
2044 $60,000,0002045 60,000,000
The Series 2021A Bonds are being issued under the Indenture to provide funds that will be used to: (a) finance the costs of capital improvements to be made to the Tollway System, (b) make a deposit to the Debt Reserve Account created under the Indenture necessary in order that amounts held thereunder are not less than the Debt Reserve Requirement calculated in accordance with the Indenture, and (c) pay costs of issuance in connection with the issuance of the Series 2021A Bonds.
In our capacity as bond counsel, we have examined, among other things, the following:
(a) certified copies of the Proceedings evidencing the adoption of the Bond Resolutions and authorizing, among other things, the execution and delivery of the Thirty-First Supplemental Indenture and the issuance of the Series 2021A Bonds;
(b) certified copies of the Bond Resolutions;
(c) an executed counterpart of the Indenture; and
(d) such other certifications, documents, showings and related matters of law as we have deemed necessary in order to render this opinion.
Based upon the foregoing we are of the opinion that:
1. The Authority has full power and authority and has taken all necessary corporate action to authorize the execution and delivery of the Thirty-First Supplemental Indenture and the issuance of the Series 2021A Bonds.

F-3
2. The Indenture, including the Thirty-First Supplemental Indenture, has been duly and lawfully executed and delivered by the Authority and, assuming the due authorization, execution and delivery by, and the binding effect on, the Trustee, the Indenture is valid and legally binding upon the Authority and enforceable in accordance with its terms.
3. The Indenture creates the valid pledge and lien which it purports to create on and in the Revenues, Funds, Accounts and moneys, securities and properties held or set aside under the Indenture, subject to the application thereof to the purposes and on the conditions permitted by the Indenture.
4. The Proceedings show lawful authority for the issuance of the Series 2021A Bonds under the laws of the State of Illinois now in force and the Series 2021A Bonds, to the amount named, are valid and legally binding obligations of the Authority, enforceable in accordance with their terms and the terms of the Indenture and are entitled to the benefits of the Indenture.
5. The form of Series 2021A Bond prescribed for said issue by the Thirty-First Supplemental Indenture is in due form of law.
6. The Series 2021A Bonds are payable ratably and equally together with all Senior Bonds, as heretofore and as may hereafter be issued, solely and only from and secured by a pledge of and lien on Net Revenues of the Tollway System and amounts on deposit in certain Funds, Accounts and Sub-Accounts established under the Indenture. The Series 2021A Bonds do not represent or constitute debt of the Authority or of the State of Illinois within the meaning of any constitutional or statutory limitation or pledge of the faith and credit of the Authority or the State of Illinois nor grant the owners thereof any right to have the Authority or the State of Illinois levy any taxes or appropriate any funds for the payment of the principal of, premium, if any, or interest on the Series 2021A Bonds.
7. Subject to compliance by the Authority with certain covenants, under present law, interest on the Series 2021A Bonds is excludable from gross income of the owners thereof for federal income tax purposes and is not included as an item of tax preference in computing the alternative minimum tax for individuals under the Internal Revenue Code of 1986, as amended. Failure to comply with certain of such Authority covenants could cause interest on the Series 2021A Bonds to be includible in gross income for federal income tax purposes retroactively to the date of issuance of the Series 2021A Bonds. Ownership of the Series 2021A Bonds may result in other federal tax consequences to certain taxpayers, and we express no opinion regarding any such collateral consequences arising with respect to the Series 2021A Bonds.
8. Interest on the Series 2021A Bonds is not exempt from income taxes imposed by the State of Illinois.
The rights of the registered owners of the Series 2021A Bonds and the enforceability of provisions of the Series 2021A Bonds and the Indenture may be subject to bankruptcy, insolvency, reorganization, moratorium and other similar laws affecting creditors' rights. Enforcement of provisions of the Series 2021A Bonds and the Indenture by an equitable or similar remedy is subject to general principles of law or equity governing such a remedy, including the exercise of judicial discretion whether to grant any particular form of relief.
We express no opinion herein as to the accuracy, adequacy or completeness of the Official Statement relating to the Series 2021A Bonds.
In rendering this opinion, we have relied upon certifications of the Authority with respect to certain material facts within the Authority’s knowledge. Our opinion represents our legal judgment based upon our review of the law and the facts that we deem relevant to render such opinion and is not a guarantee of a result. This opinion is given as of the date hereof and we assume no obligation to revise or supplement this opinion to reflect any facts or circumstances that may hereafter come to our attention or any changes that may hereafter occur.
Respectfully submitted,

[THIS PAGE INTENTIONALLY LEFT BLANK]


Th
e Il
lIn
oIs s
Ta
Te T
ol
l hIg
hw
ay a
uT
ho
rIT
y • To
ll h
Igh
wa
y se
nIo
r re
ve
nu
e Bo
nd
s, 2021 se
rIe
s a