Use of MODIS-derived surface reflectance data in the ORAC-AATSR aerosol retrieval algorithm: Impact...
12
Use of MODIS-derived surface reflectance data in the ORAC-AATSR aerosol retrieval algorithm: Impact of differences between sensor spectral response functions Andrew M. Sayer a, b, ⁎, Gareth E. Thomas a , Roy G. Grainger a , Elisa Carboni a , Caroline Poulsen b , Richard Siddans b a Department of Physics, University of Oxford, Parks Road, Oxford, OX1 3PU, UK b Science and Technology Facilities Council Rutherford Appleton Laboratory, Harwell Science and Innovation Campus, Didcot, OX11 0QX, UK abstract article info Article history: Received 27 August 2009 Received in revised form 10 February 2011 Accepted 22 February 2011 Available online xxxx Keywords: Aerosol AATSR BRDF MODIS Optimal estimation ORAC Retrieval Surface albedo The aerosol component of the Oxford-Rutherford Appleton Laboratory (RAL) Aerosol and Clouds (ORAC) retrieval scheme for the Advanced Along-Track Scanning Radiometer (AATSR) uses data derived from the Moderate Resolution Imaging Spectroradiometer (MODIS) to constrain the brightness of the surface. However, the spectral response functions of the channels used (centred near 550 nm, 660 nm, 870 nm, and 1.6 μm) do not exactly match between the two sensors. It is shown that failure to account for differences between the instruments' spectral response functions leads to errors of typically 0.001–0.01 in spectral surface albedo, and distinct biases, dependent on wavelength and surface type. A technique based on singular value decomposition (SVD) is used to reduce these random errors by an average of 35% at 670 nm and over 60% at the other wavelengths used. The technique reduces the biases so that they are negligible. In principle, the method can be extended to any combination of sensors. The SVD-based scheme is applied to AATSR data from the month of July 2008 and found to increase the number of successful aerosol retrievals, the speed of retrieval convergence, and improve the level of consistency between the measurements and the retrieved state. Additionally, retrieved aerosol optical depth at 550 nm shows an improvement in correspondence when compared to Aerosol Robotic Network (AERONET) data. © 2011 Elsevier Inc. All rights reserved. 1. Introduction Satellite radiometers play an important role in the assessment of the global burden of atmospheric aerosols. This is of particular interest because the direct and indirect radiative effects of aerosol are among the least certain contributions to radiative forcing (Forster et al., 2007; Stevens & Feingold, 2009). Over the land and sun-glint or ice-covered regions of the ocean, a large proportion of the top-of-atmosphere (TOA) reflectance measured by such instruments in the visible and near-infrared arises from the reflectance of sunlight by the surface of the Earth. An accurate aerosol retrieval requires the disentanglement of the surface and atmospheric contributions to the measured signal. Hence good knowledge of the reflectance characteristics of the surface is necessary. However, measurements from current satellite sensors do not generally have sufficient information content to unambigu- ously retrieve aerosol microphysical properties and the spectral and directional behaviour of the surface reflectance from a single overpass (Hasekamp & Landgraf, 2007; Kokhanovsky et al., 2007, 2010); as a result, assumptions about aerosol and surface properties are neces- sary in aerosol retrieval algorithms (including, for example, Diner et al., 2005; Hsu et al., 2004; Levy et al., 2007; Martonchik et al., 1998; North, 2002; Thomas et al., 2009a, 2009b; Torres et al., 1998; Veefkind et al., 1998; von Hoyningen-Huene et al., 2002, 2003). The Oxford-Rutherford Appleton Laboratory (RAL) Aerosol and Clouds (ORAC) retrieval scheme (Thomas et al., 2009a), applied to data from the Advanced Along-Track Scanning Radiometer (AATSR), performs a simultaneous retrieval of aerosol properties and surface reflectance. Surface reflectance data derived from the Moderate Resolution Imaging Spectroradiometers (MODIS, Schaaf et al., 2002) are used over land to fix the directional behaviour of the surface, and as an a priori value of the absolute brightness. However because MODIS and AATSR are different sensors it is important to account for the impact of their different spectral responses. The objective of this paper is to improve the algorithm by quantifying these differences and minimising this source of error. Section 2 provides an overview of relevant features of AATSR and ORAC, and Section 3 describes the improved treatment of land surface reflectance. Section 4 presents an updated retrieval error budget in light of the improved surface treatment. Section 5 shows the impact of the updated scheme on aerosol retrievals. Remote Sensing of Environment xxx (2011) xxx–xxx ⁎ Corresponding author at: Goddard Earth Sciences Technology and Research (GESTAR), NASA Goddard Space Flight Center, Greenbelt, MD 20771, USA. Tel.: + 1 301 614 6211; fax: +1 301 614 6307. E-mail address: [email protected] (A.M. Sayer). RSE-07995; No of Pages 12 0034-4257/$ – see front matter © 2011 Elsevier Inc. All rights reserved. doi:10.1016/j.rse.2011.02.029 Contents lists available at ScienceDirect Remote Sensing of Environment journal homepage: www.elsevier.com/locate/rse Please cite this article as: Sayer, A.M., et al., Use of MODIS-derived surface reflectance data in the ORAC-AATSR aerosol retrieval algorithm: Impact of differences between sensor spectral response functions, Remote Sensing of Environment (2011), doi:10.1016/j.rse.2011.02.029
Transcript of Use of MODIS-derived surface reflectance data in the ORAC-AATSR aerosol retrieval algorithm: Impact...

Remote Sensing of Environment xxx (2011) xxx–xxx
RSE-07995; No of Pages 12
Contents lists available at ScienceDirect
Remote Sensing of Environment
j ourna l homepage: www.e lsev ie r.com/ locate / rse
Use of MODIS-derived surface reflectance data in the ORAC-AATSR aerosol retrievalalgorithm: Impact of differences between sensor spectral response functions
Andrew M. Sayer a,b,⁎, Gareth E. Thomas a, Roy G. Grainger a, Elisa Carboni a,Caroline Poulsen b, Richard Siddans b
a Department of Physics, University of Oxford, Parks Road, Oxford, OX1 3PU, UKb Science and Technology Facilities Council Rutherford Appleton Laboratory, Harwell Science and Innovation Campus, Didcot, OX11 0QX, UK
⁎ Corresponding author at: Goddard Earth Scienc(GESTAR), NASA Goddard Space Flight Center, Greenb301 614 6211; fax: +1 301 614 6307.
E-mail address: [email protected] (A.M. Sayer
0034-4257/$ – see front matter © 2011 Elsevier Inc. Aldoi:10.1016/j.rse.2011.02.029
Please cite this article as: Sayer, A.M., et al.Impact of differences between sensor spec
a b s t r a c t
a r t i c l e i n f oArticle history:Received 27 August 2009Received in revised form 10 February 2011Accepted 22 February 2011Available online xxxx
Keywords:AerosolAATSRBRDFMODISOptimal estimationORACRetrievalSurface albedo
The aerosol component of the Oxford-Rutherford Appleton Laboratory (RAL) Aerosol and Clouds (ORAC)retrieval scheme for the Advanced Along-Track Scanning Radiometer (AATSR) uses data derived from theModerate Resolution Imaging Spectroradiometer (MODIS) to constrain the brightness of the surface.However, the spectral response functions of the channels used (centred near 550 nm, 660 nm, 870 nm, and1.6 μm) do not exactly match between the two sensors. It is shown that failure to account for differencesbetween the instruments' spectral response functions leads to errors of typically 0.001–0.01 in spectralsurface albedo, and distinct biases, dependent on wavelength and surface type. A technique based on singularvalue decomposition (SVD) is used to reduce these random errors by an average of 35% at 670 nm and over60% at the other wavelengths used. The technique reduces the biases so that they are negligible. In principle,the method can be extended to any combination of sensors. The SVD-based scheme is applied to AATSR datafrom the month of July 2008 and found to increase the number of successful aerosol retrievals, the speed ofretrieval convergence, and improve the level of consistency between the measurements and the retrievedstate. Additionally, retrieved aerosol optical depth at 550 nm shows an improvement in correspondencewhencompared to Aerosol Robotic Network (AERONET) data.
es Technology and Researchelt, MD 20771, USA. Tel.: +1
).
l rights reserved.
, Use of MODIS-derived surface reflectance datral response functions, Remote Sensing of Env
© 2011 Elsevier Inc. All rights reserved.
1. Introduction
Satellite radiometers play an important role in the assessment ofthe global burden of atmospheric aerosols. This is of particular interestbecause the direct and indirect radiative effects of aerosol are amongthe least certain contributions to radiative forcing (Forster et al., 2007;Stevens & Feingold, 2009). Over the land and sun-glint or ice-coveredregions of the ocean, a large proportion of the top-of-atmosphere(TOA) reflectance measured by such instruments in the visible andnear-infrared arises from the reflectance of sunlight by the surface ofthe Earth. An accurate aerosol retrieval requires the disentanglementof the surface and atmospheric contributions to the measured signal.Hence good knowledge of the reflectance characteristics of the surfaceis necessary. However, measurements from current satellite sensorsdo not generally have sufficient information content to unambigu-ously retrieve aerosol microphysical properties and the spectral anddirectional behaviour of the surface reflectance from a single overpass
(Hasekamp & Landgraf, 2007; Kokhanovsky et al., 2007, 2010); as aresult, assumptions about aerosol and surface properties are neces-sary in aerosol retrieval algorithms (including, for example, Diner etal., 2005; Hsu et al., 2004; Levy et al., 2007; Martonchik et al., 1998;North, 2002; Thomas et al., 2009a, 2009b; Torres et al., 1998; Veefkindet al., 1998; von Hoyningen-Huene et al., 2002, 2003).
The Oxford-Rutherford Appleton Laboratory (RAL) Aerosol andClouds (ORAC) retrieval scheme (Thomas et al., 2009a), applied todata from the Advanced Along-Track Scanning Radiometer (AATSR),performs a simultaneous retrieval of aerosol properties and surfacereflectance. Surface reflectance data derived from the ModerateResolution Imaging Spectroradiometers (MODIS, Schaaf et al., 2002)are used over land to fix the directional behaviour of the surface, andas an a priori value of the absolute brightness. However becauseMODIS and AATSR are different sensors it is important to account forthe impact of their different spectral responses. The objective of thispaper is to improve the algorithm by quantifying these differencesandminimising this source of error. Section 2 provides an overview ofrelevant features of AATSR and ORAC, and Section 3 describes theimproved treatment of land surface reflectance. Section 4 presents anupdated retrieval error budget in light of the improved surfacetreatment. Section 5 shows the impact of the updated scheme onaerosol retrievals.
ta in the ORAC-AATSR aerosol retrieval algorithm:ironment (2011), doi:10.1016/j.rse.2011.02.029
2 A.M. Sayer et al. / Remote Sensing of Environment xxx (2011) xxx–xxx
2. Overview of the ORAC-AATSR aerosol retrieval
Detailed descriptions of ORAC as applied to AATSR are provided bySayer (2009) and Thomas et al. (2009a); a brief overview of relevantinformation is provided here. AATSR is aboard Envisat (launchedMarch 2002) in a Sun-synchronous polar orbit with a mean local solarequatorial crossing time of 10 am for the descending node. Theradiometer measures at seven channels in the visible and infrared,and the first four (centred near 550 nm, 660 nm, 870 nm and 1.6 μm)are currently used in the aerosol retrieval scheme. AATSR has an on-board visible calibration system; together with vicarious calibrationagainst stable ground targets, this means that the random error on thesolar channel radiances is 2–3% (Smith et al., 2008).
The area sampled by AATSR consists of two curved swathesapproximately 550 km wide: a nadir view, looking down at zenithangles from 0°–22°, and a forward view inclined between 53° and 55°to the normal to the surface. The pixel size is 1 km×1 km at nadir andapproximately 1.5 km×1.5 km at the centre of the forward swath; thelevel 1b product used colocates and regrids forward-view measure-ments to the nadir-view grid. The two views image the same groundscene with a time difference of about 150 s. The revisit period is 3–6 days, dependent on latitude. To improve computational speed,cloud-free forward and nadir-view data are typically averaged to a10 km sinusoidal grid before the ORAC retrieval is performed (withthe requirement that at least 50% of the input pixels are cloud-free).This averaging to a coarser resolution is known as ‘superpixelling’.From here, the term ‘ground scene’ is taken to refer to the data,superpixelled or not, used for an individual retrieval.
ORAC is an Optimal Estimation (OE) retrieval (Rodgers, 2000),which aims to find the most probable state of the surface andatmosphere givenmeasurements and a priori information on the state.The robust statistical basis of OE provides the following advantages:
1. Estimates of the quality of the retrieval solution (the retrieval‘cost’) for each ground scene. This is essentially a weighted χ2 testof the retrieval solution, and provides a level of confidence as to theresults of any one retrieval.
2. Estimates of the random error on each retrieved parameter for eachground scene. These arise through knowledge of the uncertainty onthe measurements and any a priori data, propagated through theforward model.
3. The ability (but not requirement) to use any a priori data availableon the state parameters. The focus of the work presented in thenext section is an improvement of the treatment of the MODIS landsurface reflectance data used for the surface albedo a priori overland.
The shortwave quantity reported by AATSR for a given channel isan approximation of the spectral bidirectional reflection factor, theSun-normalised radiance RTOA(θs, ϕs; θv, ϕv):
RTOA θs;ϕs; θv;ϕvð Þ =∫λ2λ1πLrλϱ λð Þdλ
∫λ2λ1
cos θsEiλϱ λð Þdλ:
ð1Þ
In the above θs, ϕs denote the solar zenith and azimuth angles andθv, ϕv the corresponding angles of view (the AATSR sensor)respectively. A channel is defined between wavelengths λ1, λ2 tohave response ϱ(λ). Finally Lλ
r is the radiance measured by theinstrument and Eλ
i is the TOA downward solar irradiance. Themeasurements used (the ‘measurement vector’) are the eight Sun-normalised radiances (four wavelengths at two viewing geometries).
The retrieved state parameters (the ‘state vector’) are the aerosoloptical depth (AOD) at 550 nm (τ550), the aerosol effective radius(reff), and the surface bihemispherical reflectance (BHR, Schaepman-Strub et al., 2006; also known as white-sky albedo) at each of the fourwavelengths used (Rdd, 1, Rdd, 2, Rdd, 3 and Rdd, 4 for 550 nm, 660 nm,
Please cite this article as: Sayer, A.M., et al., Use of MODIS-derived surfaImpact of differences between sensor spectral response functions, Rem
870 nm, and 1.6 μm respectively). The wavelength of 550 nm ischosen for AOD as it is commonly used in the literature; the derivedAOD may, however, be referenced to any wavelength desired, and isobtained from all measurements simultaneously. Both AOD andeffective radius are retrieved in log10 space.
The retrieval is performed for a selection of five aerosol models,corresponding to typical continental, desert, maritime, urban, orbiomass burning aerosol. These models consist of mixtures of aerosolcomponents, and different effective radii are obtained by altering theirmixing ratios during the retrieval. The first four models are drawnfrom the Optical Properties of Aerosols and Clouds (OPAC) database(Hess et al., 1998), while the biomass burning model is taken fromDubovik et al. (2002). Mie theory is used for all models except desertdust, which is treated as a mixture of spheroids (Table 6 of Kandleret al., 2007) for which T-Matrix code (Mishchenko & Travis, 1998) isused to calculate the phase function. A cost statistic under 10 indicatesan acceptable consistency between the measurements and retrievedstate, and is used as a threshold for a successful retrieval (Sayer et al.,2010). Generally the most likely aerosol type is taken as the oneresulting in the lowest retrieval cost. However, this has been found toperform poorly over deserts, due to a lack of contrast between thesurface and atmosphere. A modified scheme is therefore applied fordeserts. Firstly, the retrieved BHR are used to calculate the (surface,not TOA) normalised difference vegetation index (NDVI) as follows:
NDVI =Rdd;3−Rdd;2
Rdd;3 + Rdd;2: ð2Þ
Retrievals over land where 0bNDVIb0.25 are classified as deserts.In these cases the desert dust model is chosen (provided the cost islower than 10). If the desert model has a cost larger than 10, the bestaerosol type reverts to the lowest-cost model.
3. An improved treatment of land surface reflectance
3.1. Surface reflectance in the ORAC forward model
The ORAC forward model makes use of a bidirectional reflectancedistribution function (BRDF, Schaepman-Strub et al., 2006) to describethe angular variation of the surface reflectance. This is a more realistictreatment than assuming a Lambertian surface. In the BRDF forwardmodel, it is necessary to define three types of surface reflectance:
1. The surface bidirectional reflectance (the BRDF evaluated for theparticular viewing geometry), Rbb. This describes the reflection ofthe direct solar beam into the viewing angle, and is a function ofboth solar and viewing angles.
2. The directional-hemispherical reflectance (DHR, also known asblack-sky albedo), Rbd. This describes the isotropic reflection of thedirect beam over the whole hemisphere (or alternatively directreflection of incoming isotropic radiance), and is a function of thesolar angle. The short time-delay between the forward and nadirviews means that the solar angle and hence DHR are effectivelyidentical for both views.
3. The BHR (white-sky albedo), Rdd. This describes the reflection ofdiffuse downwelling radiation, assumed isotropic, and so isindependent of the geometry. This is the quantity retrieved inORAC. In this work, the term ‘surface albedo’ refers to the BHR.
In this notation the subscript b indicates a direct beam and d adiffuse field; Rbd, for example, denotes an incoming direct beam beingdiffusely reflected.
Given an analytical description of the BRDF, the DHR for a givensolar zenith angle may be obtained by integration over all satelliteviewing zenith and relative (solar–satellite) azimuth angles. This maythen be integrated over all solar angles to obtain the BHR. Becausethere is insufficient information to retrieve the full BRDF from the
ce reflectance data in the ORAC-AATSR aerosol retrieval algorithm:ote Sensing of Environment (2011), doi:10.1016/j.rse.2011.02.029

3A.M. Sayer et al. / Remote Sensing of Environment xxx (2011) xxx–xxx
AATSR measurements, BRDF models are used to generate Rbb, Rbd andthe a priori Rdd. The ratios Rbb:Rdd and Rbb:Rbd are fixed in the aerosolretrieval, such that when Rdd is scaled in an iterative step in theretrieval then these ratios are used to scale Rbb and Rbd by thecorresponding factor. Over land, the MODIS BRDF model parametersdata product (MCD43B1) is used to define the shape of the BRDF andset the above ratios and the a priori DHR. The treatment over ocean,and some further information on surface reflectance in ORAC, is givenby Sayer et al. (2010).
3.2. The MODIS BRDF product and forward model
The MODIS sensors are radiometers with a 2330 km swath width,measuring at 36 channels in the visible and infrared with a spatialresolution between 250 m and 1 km (dependent on channel). Twoinstruments are in orbit, one each on the NASA satellites Terra(10:30 am descending node time) and Aqua (1:30 pm ascendingnode). The MCD43B1 product (Schaaf et al., 2002) consists of a set ofkernel weights for the Algorithm for MODIS Bidirectional ReflectanceAnisotropy of the Land Surface (AMBRALS, Wanner et al., 1997)surface BRDF model. The model calculates bidirectional reflectance asa weighted sum of three kernels (detailed by Wanner et al., 1995),representing reflectance from different types of surface.
The weighting parameters are obtained at 1 km×1 km spatialresolution grid by inversion of 16 days of cloud-free atmospherically-corrected reflectances from both MODIS instruments (Lucht et al.,2000). Collection 5 of the data, available every eight days, is used.Weights are obtained for seven MODIS solar channels (four of whichare centred near AATSR channels) and three broad bands. To reducethe storage overhead, each MODIS data granule is down-sampled toapproximately 2.5 km×2.5 km resolution and the broadband datasetsremoved before processing in ORAC. In the version of ORAC describedby Thomas et al. (2009a), the BRDF is obtained from the MCD43B1product, and integrated to provide the DHR and BHR for a MODIS-likesensor using a precalculated lookup table of kernel integrals and an
AATSR channel 1
520 540 560 580 600
Wavelength, nm
0.0
0.2
0.4
0.6
0.8
1.0
Nor
mal
ised
res
pons
e
AATSR channel 3
800 820 840 860 880 900 920
Wavelength, nm
0.0
0.2
0.4
0.6
0.8
1.0
Nor
mal
ised
res
pons
e
Fig. 1. AATSR (black) and MODIS (red) normalised visible channel response functions. MODthe references to colour in this figure legend, the reader is referred to the web version of th
Please cite this article as: Sayer, A.M., et al., Use of MODIS-derived surfaImpact of differences between sensor spectral response functions, Rem
expression provided by Lucht et al. (2000) respectively. These‘MODIS-like’ quantities are referred to as Rbb,M, Rbd,M and Rdd,M(with the subscript M indicating MODIS).
3.3. Adaptation to AATSR channels
MODIS and AATSR are different sensors and each channelmeasures not a single wavelength but a narrow band. As a result,the surface albedo reported by MODIS is an average albedo over theband, weighted by the instrument's response function. Fig. 1 showsthat the visible channel response functions for the two instruments donot match, so if the true spectral surface albedo varies across eachband, then the surface albedo each instrument would see for the sameunderlying surface would differ. This effect would be the mostpronounced for the 660 nm and 1.6 μm channels, as these have theleast similar response functions between the two instruments. In thiswork the magnitude of the error that use of MODIS data introduces isquantified, and reduced through correction of the MODIS product.
3.3.1. High-resolution spectral databasesThe Advanced Spaceborne Thermal Emission and Reflection
Radiometer (ASTER, Baldridge et al., 2009) and United StatesGeological Survey (USGS, Clark et al., 2003) spectral libraries providehigh-resolution data on the reflectance of a large variety of naturaland man-made substances from laboratory measurements. A selec-tion of 51 spectra from the ASTER library and 100 from the USGSlibrary, chosen as representatives of surfaces that are found on theEarth's surface (such as various types of vegetation; sand and soil;snow, ice and frost; or man-made substances such as concrete), areused here to quantify the impact of the visible channel shapes shownin Fig. 1 on the MODIS-reported BHR as compared to AATSR. Thisrequires the following assumptions:
1. The spectra chosen are representative of the spectra of surfacesthat make up the Earth's surface.
AATSR channel 2
600 620 640 660 680 700
Wavelength, nm
0.0
0.2
0.4
0.6
0.8
1.0
Nor
mal
ised
res
pons
e
AATSR channel 4
1500 1550 1600 1650 1700
Wavelength, nm
0.0
0.2
0.4
0.6
0.8
1.0
Nor
mal
ised
res
pons
e
IS channels closest to corresponding AATSR channels are shown. (For interpretation ofis article.)
ce reflectance data in the ORAC-AATSR aerosol retrieval algorithm:ote Sensing of Environment (2011), doi:10.1016/j.rse.2011.02.029

4 A.M. Sayer et al. / Remote Sensing of Environment xxx (2011) xxx–xxx
2. The difference found between integration of the spectra over theinstruments' visible channel response functions can be related todifferences between MODIS and AATSR surface albedos (as thespectra lack directional information), and any correction applied tothe Rdd, M to estimate Rdd can then also be applied to Rbb,M and Rbd,Mto obtain Rbb and Rbd.
These spectra are grouped according to the type of surface thatthey represent: 35 soils, 6 sands, 8 man-made substances, 4 spectra ofsnow, ice or frost and 104 assorted types of vegetation. Convolvingthese spectra with the instruments' visible channel responsefunctions leads to a set of 157 pairs of simulated ‘observed’ surfacealbedos for MODIS (Rdd,M) and AATSR (Rdd). The differences betweensurface albedo reported from MODIS and AATSR calculated for thesespectra are shown as a function of the AATSR ‘observed’ albedo inFig. 2. TheMODIS-AATSR difference Rdd,M−Rdd is hereafter referred toas the ‘expected difference’, �e. The largest departures, as suggested byFig. 1, are for 660 nm and 1.6 μm, with a clear bias particularly visibleat 1.6 μm. The mean absolute differences in Fig. 2 are 0.0034 at550 nm, 0.0057 at 660 nm, 0.0015 at 870 nm and 0.012 at 1.6 μm.
3.3.2. Singular value decomposition of spectrally-derived albedoSingular value decomposition (SVD) is a statistical tool thatmay be
applied to describe the variability in a set of data; in this case it isapplied to allow the prediction of an AATSR-observed albedo for ascene given that observed by MODIS. The technique described herecan, in principle, be applied to any combination of sensors. The SVD ofan m-by-n matrix M is defined as follows:
M = UΣV�: ð3Þ
This states thatMmay be expressed as a product of threematrices:U is an m-by-m unitary matrix, V an n-by-n unitary matrix, and the
550 nm
0.0 0.2 0.4 0.6 0.8 1.0
AATSR calculated albedo
-0.02
-0.01
0.00
0.01
MO
DIS
-AA
TSR
alb
edo
diff
eren
ce
870 nm
0.0 0.2 0.4 0.6 0.8 1.0
AATSR calculated albedo
-0.010
-0.005
0.000
0.005
0.010
MO
DIS
-AA
TSR
alb
edo
diff
eren
ce
Fig. 2. Expected differences �e between surface albedo reported by MODIS and AATSR acorresponding to AATSR visible channels, as a function of albedo calculated for AATSR. Greenand black crosses man-made substances. Note the difference in axis scales between wavelereferred to the web version of this article.)
Please cite this article as: Sayer, A.M., et al., Use of MODIS-derived surfaImpact of differences between sensor spectral response functions, Rem
matrix Σ is an m-by-n diagonal matrix with the nonzero elements indescending order. The conjugate transpose of V*, V, is the matrix ofinterest here as it describes the patterns of the variability inM. In thiscase V* does not have imaginary components and so is equivalent tothe transpose matrix VT. U contains a set of basis vectors which can beused to describe M. The columns of U and V are known as singularvectors. The elements of Σ, known as the singular values, describehow important each singular vector v in V is to the variability in M:the contribution of a singular vector in V to the total variability is itscorresponding singular value as a proportion of the total of thesingular values. Hence the first singular vector contains the mostinformation on the variability.
The matrix M in this context consists of the simulated surfacealbedos reported by MODIS and AATSR for each spectrum; hence, ithas one column for each spectrum used (157) and one row for eachinstrument channel. Results are discussed using the 4 AATSR channelsand their equivalent MODIS bands (for a total of 8 rows). In thisdiscussion nM refers to the number of MODIS bands used, and nA thenumber of AATSR bands (4 in both cases).
The calculations described were also performed using the threeadditional MODIS bands centred at 460 nm, 1.2 μm and 2.2 μm (i.e.nM=7 and a total of 11 rows in M). Including the additional threebands increases the data storage overhead of ORAC, and provides onlynegligible improvement on the nM=4 case. Therefore only the case ofnM=4 is discussed further.
3.3.3. SVD fitting and R̃dd calculationAfter computing the SVD as described above, the singular vectors v
may be obtained. These can be used to make an estimate R̃dd of theAATSR surface albedo Rdd given the MODIS surface albedo Rdd, M ateach wavelength, for any spectrum contained within M.
First, a simultaneous linear fit of the first nM elements of eachsingular vector vi (elements referred to as vi, M) to the nM MODIS
660 nm
0.0 0.2 0.4 0.6 0.8 1.0
AATSR calculated albedo
-0.04
-0.02
0.00
0.02
0.04
MO
DIS
-AA
TSR
alb
edo
diff
eren
ce
1600 nm
0.0 0.2 0.4 0.6 0.8 1.0
AATSR calculated albedo
-0.05
0.00
0.05
0.10
MO
DIS
-AA
TSR
alb
edo
diff
eren
ce
s calculated for the 157 spectra selected from the ASTER/USGS libraries, for bandsstars are vegetation, red triangles sand, orange squares soil, blue diamonds snow or icengths. (For interpretation of the references to colour in this figure legend, the reader is
ce reflectance data in the ORAC-AATSR aerosol retrieval algorithm:ote Sensing of Environment (2011), doi:10.1016/j.rse.2011.02.029

5A.M. Sayer et al. / Remote Sensing of Environment xxx (2011) xxx–xxx
surface albedos Rdd, M in question is performed. These elements of vdescribe the variability in the MODIS channels. This yields a series ofnM coefficients, ci, such that the MODIS surface albedo (at all nMwavelengths) can be calculated exactly as the following:
Rdd;M 1;2;…;nMð Þ = ∑nM
i=1civi;M: ð4Þ
Next, these coefficients are used to estimate the nA AATSR surfacealbedos using the same summation, but with the last nA elements ofthe singular vectors (referred to as vi;A) instead of the first nM. Thesedescribe the variability in the AATSR channels, and lead to thefollowing prediction of the value of the AATSR surface albedo at all nAwavelengths:
R̃dd 1;2;…;nAð Þ = ∑nM
i=1civi;A: ð5Þ
The more singular vectors used, the greater the proportion of thevariability in the spectra will be captured by them and so the moreaccurate the prediction R̃dd of Rdd. A maximum of nM singular vectorsmay be used; any more and the fit of Rdd,M described above will havenon-unique solutions. In practice, four singular vectors will be usedwith four input MODIS surface albedos to provide four coefficientsrespectively to fit the AATSR-reported spectral surface albedo. If alleight singular vectors were used then M would be reconstructedperfectly, but the values of the AATSR surface albedowould be neededin the input to fit the data and so there would be no predictive power.Hence there is a trade-off between the number of values which can bepredicted, and the accuracy of the predictions which can be made.
The first four singular vectors capture 99.3% of the variability in thespectra, suggesting that the fitting process described above shouldreconstruct the AATSR surface albedos well. The singular vectorsobtained are tabulated in Table 1, together with their singular values;the similarity between elements corresponding to equivalent chan-nels is an indication of the fact that the channels are generallyobserving similar surface albedos.
3.3.4. Quality of SVD fitThe value of the fit and estimation process can be quantified by
comparing the error in the AATSR albedo that would result from usingthe MODIS albedo as an estimate (the ‘expected difference’ �e, definedpreviously) to the error resulting from using the SVD-predictedestimate, R̃dd−Rdd. This second quantity is referred to as the ‘AATSRreconstruction error’ �r: if |�r|b |�e| then the SVDfit provides an improvedestimate of Rdd compared with using just the MODIS value directly.
Plots of |�e| against |�r| are shown in Fig. 3. For all classes of surface,the mean value of |�r| is smaller than the mean of |�e|,although for afew individual cases the unadjusted MODIS-like surface albedo is a
Table 1Values of the first four singular vectors (given here to three significant figures) obtainedin the analysis of spectra, for nM=4 and nA=4. Singular vectors are numbered in orderof their significance (with 1 being most significant). The final row gives thecorresponding singular value for each singular vector.
Element detailingvisible channel
Singular vector
1 2 3 4
MODIS 550 nm −0.227 0.411 −0.0222 0.551MODIS 660 nm −0.248 0.435 0.210 −0.371MODIS 870 nm −0.497 −0.151 −0.466 −0.108MODIS 1.6 μm −0.379 −0.344 0.466 0.119AATSR 550 nm −0.230 0.413 −0.00414 0.496AATSR 660 nm −0.250 0.437 0.240 −0.510AATSR 870 nm −0.498 −0.156 −0.466 −0.109AATSR 1.6 μm −0.364 −0.338 0.497 0.117Singular value 10.1348 2.89675 2.30584 0.372477
Please cite this article as: Sayer, A.M., et al., Use of MODIS-derived surfaImpact of differences between sensor spectral response functions, Rem
better match than the SVD-adjusted surface albedo. The mean valuesof |�r| are 0.0011 at 550 nm, 0.0021 at 660 nm, 0.00097 at 870 nm and0.0044 at 1.6 μm. These mean absolute values of �e and �r are denotedσe and σr respectively, and so represent the magnitude of the errorarising from sensor characteristics before and after making the SVD-based correction.
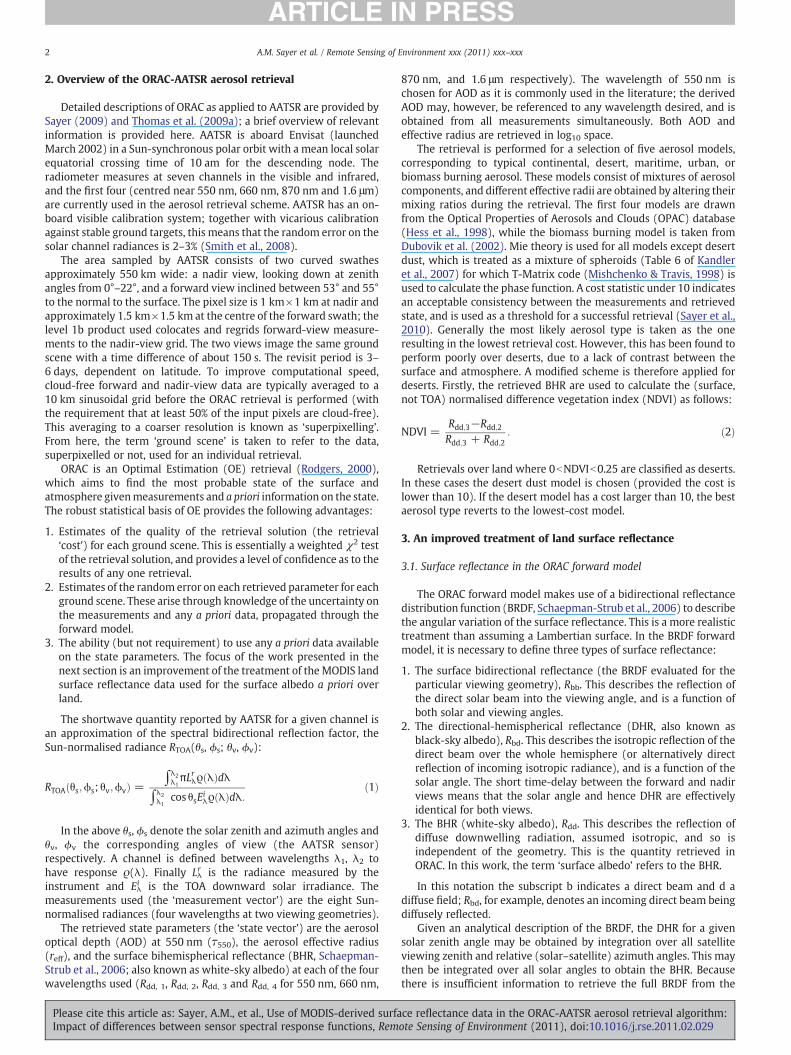
Fig. 4 shows the reconstruction errors �r as a function of the ‘true’AATSR-observed surface albedo Rdd. A comparison with Fig. 2 showsthat the use of singular vectors gives reconstruction errors withsmaller overall biases (particularly at 1.6 μm) and less clustering ofsimilar spectral types than direct use of the MODIS data. In summary,the use of SVD techniques generally allows an improved prediction ofthe AATSR BHR for a surface as compared to using the BHR derivedfrom a MODIS-like sensor as-is.
3.3.5. Composite spectraAs the Earth's surface on a satellite pixel scale is unlikely to conform
exactly to an individual spectrum present in the libraries used, it isimportant to quantify how well the singular vectors in Table 1 canpredict Rdd for surfaces consisting of a composite of these spectra.Generation of an ensemble of a million composite spectra, eachcalculated from a linear combination of between 2 and 4 randomly-weighted and randomly-picked spectra, yields an ensemble of a millionmatched sets of Rdd and Rdd, M. From there, distributions of �e and �r arecalculated after making the SVD fit; a million ensemble membersensures statistics robust to 2 significant figures.
Except at 1.6 μm, the mean absolute expected differences (σe) forthe ensemble of composite spectra are smaller than the correspondingvalues for the group of 157 single spectra. This suggests that to someextent the impact of the differences between MODIS and AATSR iscancelled out by the different materials in the composite spectra.These values of σe are 0.0031 at 550 nm, 0.0041 at 660 nm, 0.0012 at870 nm and 0.012 at 1.6 μm. The SVD technique proves effective in thecase of composite spectra; σr are 0.00086 at 550 nm, 0.0015 at660 nm, 0.00066 at 870 nm and 0.0034 at 1.6 μm.
Similar results are obtained if the number of spectra in eachcomposite spectrum is changed (such as allowing 2–6 spectra ratherthan 2–4); the higher the maximum number of spectra allowed, thesmaller the expected differences and reconstruction errors. The ratioof σr to σe remains similar. These results indicate that the techniquealso performs well for mixed spectra, such as are likely to be found forthe Earth's surface.
3.3.6. Application to the retrievalIn the preprocessing of the aerosol retrieval Rbb,M, Rbd,M and Rdd,M
are obtained from the MOD43B1 product for each (1 km×1 km)AATSR pixel. The singular vectors obtained from the 157 spectra areused to calculate R̃dd, which is used as the a priori value of Rdd in theretrieval. The ratio R̃dd : Rdd;M is calculated for each pixel and thenapplied as a scaling factor to Rbb, M and Rbd, M to obtain Rbb and Rbd.This preserves the ratio between the three reflectances obtained fromthe MCD43B1 product. If the AATSR data are being superpixelled to alower resolution (Section 2) the MODIS data within each superpixelare then averaged to give the mean Rbb, Rbd and Rdd used to initialisethe retrieval for that ground scene. If for any wavelength the ratioR̃dd : Rdd;M is larger than 1.5 or smaller than 0.5, then it is deemed apoor fit of the singular vectors and no adjustment is made. Thisconstraint helps to prevent unphysical estimates of Rbb, Rbd and Rdd.
An example of this in practice is shown in Fig. 5. Well-definedareas of differing land surface cover result in adjustments made to Rdd,M of differing signs andmagnitudes, with a strong agreement betweenthe sign of the adjustment and the reverse of the sign of the expectedMODIS-AATSR difference for spectra in different categories (such asvegetation, sand and soil) shown in Fig. 2.
Histograms of the magnitude of the adjustment for this scene arepresented in Fig. 6; thewavelength-dependence of themagnitude of the
ce reflectance data in the ORAC-AATSR aerosol retrieval algorithm:ote Sensing of Environment (2011), doi:10.1016/j.rse.2011.02.029

550 nm
0.000 0.005 0.010 0.015 0.020
Expected albedo difference
0.000
0.005
0.010
0.015
0.020
AA
TSR
rec
onst
ruct
ion
erro
r
660 nm
0.00 0.01 0.02 0.03 0.04
Expected albedo difference
0.00
0.01
0.02
0.03
0.04
AA
TSR
rec
onst
ruct
ion
erro
r
870 nm
0.000 0.002 0.004 0.006 0.008 0.010
Expected albedo difference
0.000
0.002
0.004
0.006
0.008
0.010
AA
TSR
rec
onst
ruct
ion
erro
r 1600 nm
0.00 0.02 0.04 0.06 0.08 0.10
Expected albedo difference
0.00
0.02
0.04
0.06
0.08
0.10
AA
TSR
rec
onst
ruct
ion
erro
r
Fig. 3. Expected difference in surface albedo �e against reconstruction error �r for the 157 spectra used in the analysis, at AATSR visible channel wavelengths. Presented in units of absolutealbedo, using4MODISchannels and singular vectors.Green stars are vegetation, red triangles sand, orange squares soil, bluediamonds snowor ice andblack crossesman-made substances.Note the difference in axis scales between wavelengths. (For interpretation of the references to colour in this figure legend, the reader is referred to the web version of this article.)
6 A.M. Sayer et al. / Remote Sensing of Environment xxx (2011) xxx–xxx
adjustment (smaller at 550 nm and 870 nm, larger at 660 nm and1.6 μm) is also consistentwith the single-spectrum results. Additionally,the means of the distribution of adjustments for this scene and in the
550 nm
0.0 0.2 0.4 0.6 0.8 1.0
AATSR calculated albedo
-0.02
-0.01
0.00
0.01
AA
TSR
rec
onst
ruct
ion
erro
r
870 nm
0.0 0.2 0.4 0.6 0.8 1.0
AATSR calculated albedo
-0.010
-0.005
0.000
0.005
0.010
AA
TSR
rec
onst
ruct
ion
erro
r
Fig. 4. AATSR-observed surface albedo against reconstruction error for the 157 spectra usedtriangles sand, orange squares soil, blue diamonds snow or ice and black crosses man-made sis referred to the web version of this article.)
Please cite this article as: Sayer, A.M., et al., Use of MODIS-derived surfaImpact of differences between sensor spectral response functions, Rem
ensemble of composite spectra from Section 3.3.5 are similar: theywould not be expected to match exactly, as the mean of the scenedepends upon the composition of the land surfaces in it, but the
660 nm
0.0 0.2 0.4 0.6 0.8 1.0
AATSR calculated albedo
-0.04
-0.02
0.00
0.02
0.04
AA
TSR
rec
onst
ruct
ion
erro
r
1600 nm
0.0 0.2 0.4 0.6 0.8 1.0
AATSR calculated albedo
-0.05
0.00
0.05
0.10
AA
TSR
rec
onst
ruct
ion
erro
r
in the analysis, at AATSR visible channel wavelengths. Green stars are vegetation, redubstances. (For interpretation of the references to colour in this figure legend, the reader
ce reflectance data in the ORAC-AATSR aerosol retrieval algorithm:ote Sensing of Environment (2011), doi:10.1016/j.rse.2011.02.029

16 22
16 22
3648
3648
<-0.015
-0.01
-0.005
0
0.005
0.01
>0.015
16 22
16 22
3648
3648
<-0.03
-0.015
0
0.015
>0.03
16 22
16 22
3648
3648
<-0.004
-0.002
0
0.002
>0.004
16 22
16 22
3648
3648
<-0.02
-0.01
0
0.01
>0.02
Fig. 5. Adjustment Rdd−Rdd, M made to the MODIS white-sky surface albedo at AATSR visible channel wavelengths, in units of absolute albedo. The scene covers continental Europeand parts of Northern Africa for an AATSR swath on September 5, 2004.
7A.M. Sayer et al. / Remote Sensing of Environment xxx (2011) xxx–xxx
similarity suggests that the spectra provide a reasonable representationof land surfaces. Together these figures provide confidence that themethod,whichwas shown in earlier sections to provide results valid forindividual and composite spectra, also yields physically reasonableestimates of the AATSR BHR when applied to real MCD43B1 data.
4. Revised retrieval error budget
The ability of OE to provide meaningful information on theconsistency between measurements and the retrieved state, andestimates of the uncertainty on retrieved parameters, is contingent onknowing accurately the uncertainties associated with the measure-ments, forward model, and a priori data. In ORAC, these are described
Magnitude of SVD adjustment
0.00 0.01 0.02 0.030.0
0.2
0.4
0.6
0.8
1.0
1.2
Rel
ativ
e fr
eque
ncy
Fig. 6. Frequency histograms of the magnitude of the adjustment |Rdd−Rdd, M| made tothe MODIS white-sky surface albedo at AATSR visible channel wavelengths for thescene shown in Fig. 5. Presented in units of absolute albedo. The bin size for densitycalculations is 0.0001. Black indicates data for 550 nm, red 660 nm, green 870 nm andblue 1.6 μm. The dashed-dotted lines indicates the mean of the distribution for eachwavelength as indicated by their colours, and dashed lines the mean adjustment of theensemble of a million composite spectra discussed in Section 3.3.5. (For interpretationof the references to colour in this figure legend, the reader is referred to the web versionof this article.)
Please cite this article as: Sayer, A.M., et al., Use of MODIS-derived surfaImpact of differences between sensor spectral response functions, Rem
by the covariance matrices Sa (a priori state uncertainty) and Sy (thecombination of measurement and forward model uncertainty); moredetails are provided by Rodgers (2000), Sayer (2009), Sayer et al.(2010) and Thomas et al. (2009a). In these matrices the value ofelement index i, j is the product of the uncertainties on measurementsor parameters i and j and the correlation between them. The revisedsurface treatment necessitates an update to these matrices.
4.1. The a priori uncertainty on surface albedo
The components of Sa relating to AOD and effective radius aredetailed by Sayer (2009) and Thomas et al. (2009b) and areunchanged here. The following sources of uncertainty are consideredto calculate the terms related to surface albedo:
1. Remaining differences due to sensor characteristics after the SVDfit (the reconstruction error).
2. Random errors in the MCD43B1 data product.3. Temporal variability of surface albedo arising from the use of 8-
daily rather than instantaneous MCD43B1 data.
4.1.1. The reconstruction errorSection 3.3.4 shows that although the SVD adjustment technique
can account for much of the difference between MODIS-like andAATSR-like sensors, the ‘true’ surface albedo that AATSR would see isnot perfectly reconstructed. Therefore the mean absolute reconstruc-tion errors σr of 0.0011 at 550 nm, 0.0021 at 660 nm, 0.00097 at870 nm and 0.0044 at 1.6 μm contribute to the uncertainty on the apriori BHR. These are taken to be uncorrelated between wavelengths.
4.1.2. Errors in the MCD43B1 parametersThe MCD43B1 dataset is a retrieved product and hence has some
associated error. Although several studies have examined variousaspects of the model parameters and derived (mainly broadband)albedo (Jin et al., 2003a, 2003b; Liu et al., 2009; Saloman et al., 2006;
ce reflectance data in the ORAC-AATSR aerosol retrieval algorithm:ote Sensing of Environment (2011), doi:10.1016/j.rse.2011.02.029
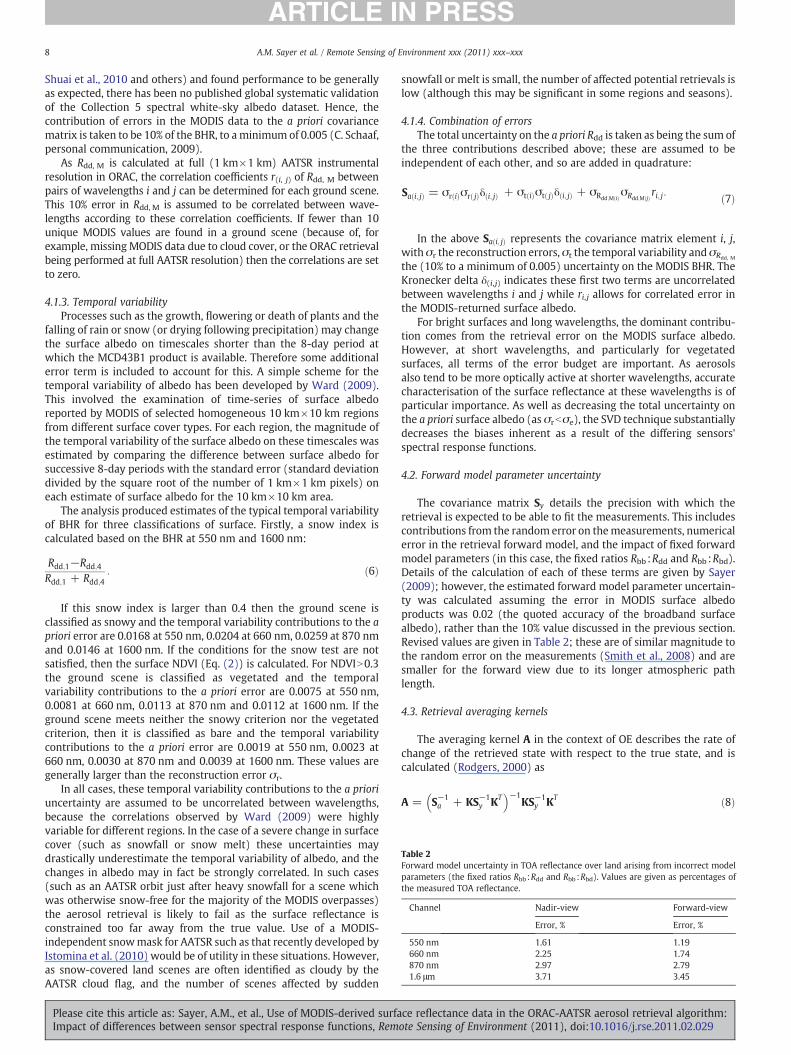
Table 2Forward model uncertainty in TOA reflectance over land arising from incorrect modelparameters (the fixed ratios Rbb :Rdd and Rbb :Rbd). Values are given as percentages ofthe measured TOA reflectance.
Channel Nadir-view Forward-view
Error, % Error, %
550 nm 1.61 1.19660 nm 2.25 1.74870 nm 2.97 2.791.6 μm 3.71 3.45
8 A.M. Sayer et al. / Remote Sensing of Environment xxx (2011) xxx–xxx
Shuai et al., 2010 and others) and found performance to be generallyas expected, there has been no published global systematic validationof the Collection 5 spectral white-sky albedo dataset. Hence, thecontribution of errors in the MODIS data to the a priori covariancematrix is taken to be 10% of the BHR, to aminimum of 0.005 (C. Schaaf,personal communication, 2009).
As Rdd, M is calculated at full (1 km×1 km) AATSR instrumentalresolution in ORAC, the correlation coefficients r(i, j) of Rdd, M betweenpairs of wavelengths i and j can be determined for each ground scene.This 10% error in Rdd, M is assumed to be correlated between wave-lengths according to these correlation coefficients. If fewer than 10unique MODIS values are found in a ground scene (because of, forexample, missing MODIS data due to cloud cover, or the ORAC retrievalbeing performed at full AATSR resolution) then the correlations are setto zero.
4.1.3. Temporal variabilityProcesses such as the growth, flowering or death of plants and the
falling of rain or snow (or drying following precipitation) may changethe surface albedo on timescales shorter than the 8-day period atwhich the MCD43B1 product is available. Therefore some additionalerror term is included to account for this. A simple scheme for thetemporal variability of albedo has been developed by Ward (2009).This involved the examination of time-series of surface albedoreported by MODIS of selected homogeneous 10 km×10 km regionsfrom different surface cover types. For each region, the magnitude ofthe temporal variability of the surface albedo on these timescales wasestimated by comparing the difference between surface albedo forsuccessive 8-day periods with the standard error (standard deviationdivided by the square root of the number of 1 km×1 km pixels) oneach estimate of surface albedo for the 10 km×10 km area.
The analysis produced estimates of the typical temporal variabilityof BHR for three classifications of surface. Firstly, a snow index iscalculated based on the BHR at 550 nm and 1600 nm:
Rdd;1−Rdd;4
Rdd;1 + Rdd;4: ð6Þ
If this snow index is larger than 0.4 then the ground scene isclassified as snowy and the temporal variability contributions to the apriori error are 0.0168 at 550 nm, 0.0204 at 660 nm, 0.0259 at 870 nmand 0.0146 at 1600 nm. If the conditions for the snow test are notsatisfied, then the surface NDVI (Eq. (2)) is calculated. For NDVIN0.3the ground scene is classified as vegetated and the temporalvariability contributions to the a priori error are 0.0075 at 550 nm,0.0081 at 660 nm, 0.0113 at 870 nm and 0.0112 at 1600 nm. If theground scene meets neither the snowy criterion nor the vegetatedcriterion, then it is classified as bare and the temporal variabilitycontributions to the a priori error are 0.0019 at 550 nm, 0.0023 at660 nm, 0.0030 at 870 nm and 0.0039 at 1600 nm. These values aregenerally larger than the reconstruction error σr.
In all cases, these temporal variability contributions to the a prioriuncertainty are assumed to be uncorrelated between wavelengths,because the correlations observed by Ward (2009) were highlyvariable for different regions. In the case of a severe change in surfacecover (such as snowfall or snow melt) these uncertainties maydrastically underestimate the temporal variability of albedo, and thechanges in albedo may in fact be strongly correlated. In such cases(such as an AATSR orbit just after heavy snowfall for a scene whichwas otherwise snow-free for the majority of the MODIS overpasses)the aerosol retrieval is likely to fail as the surface reflectance isconstrained too far away from the true value. Use of a MODIS-independent snowmask for AATSR such as that recently developed byIstomina et al. (2010) would be of utility in these situations. However,as snow-covered land scenes are often identified as cloudy by theAATSR cloud flag, and the number of scenes affected by sudden
Please cite this article as: Sayer, A.M., et al., Use of MODIS-derived surfaImpact of differences between sensor spectral response functions, Rem
snowfall or melt is small, the number of affected potential retrievals islow (although this may be significant in some regions and seasons).
4.1.4. Combination of errorsThe total uncertainty on the a priori Rdd is taken as being the sum of
the three contributions described above; these are assumed to beindependent of each other, and so are added in quadrature:
Sa i; jð Þ = σr ið Þσr jð Þδ i; jð Þ + σt ið Þσt jð Þδ i; jð Þ + σRdd;M ið ÞσRdd;M jð Þ ri; j: ð7Þ
In the above Sa i; jð Þ represents the covariance matrix element i, j,with σr the reconstruction errors, σt the temporal variability and σRdd, M
the (10% to a minimum of 0.005) uncertainty on the MODIS BHR. TheKronecker delta δ(i,j) indicates these first two terms are uncorrelatedbetween wavelengths i and j while ri,j allows for correlated error inthe MODIS-returned surface albedo.
For bright surfaces and long wavelengths, the dominant contribu-tion comes from the retrieval error on the MODIS surface albedo.However, at short wavelengths, and particularly for vegetatedsurfaces, all terms of the error budget are important. As aerosolsalso tend to be more optically active at shorter wavelengths, accuratecharacterisation of the surface reflectance at these wavelengths is ofparticular importance. As well as decreasing the total uncertainty onthe a priori surface albedo (as σrbσe), the SVD technique substantiallydecreases the biases inherent as a result of the differing sensors'spectral response functions.
4.2. Forward model parameter uncertainty
The covariance matrix Sy details the precision with which theretrieval is expected to be able to fit the measurements. This includescontributions from the random error on themeasurements, numericalerror in the retrieval forward model, and the impact of fixed forwardmodel parameters (in this case, the fixed ratios Rbb :Rdd and Rbb :Rbd).Details of the calculation of each of these terms are given by Sayer(2009); however, the estimated forward model parameter uncertain-ty was calculated assuming the error in MODIS surface albedoproducts was 0.02 (the quoted accuracy of the broadband surfacealbedo), rather than the 10% value discussed in the previous section.Revised values are given in Table 2; these are of similar magnitude tothe random error on the measurements (Smith et al., 2008) and aresmaller for the forward view due to its longer atmospheric pathlength.
4.3. Retrieval averaging kernels
The averaging kernel A in the context of OE describes the rate ofchange of the retrieved state with respect to the true state, and iscalculated (Rodgers, 2000) as
A = S−1a + KS−1
y KT� �−1
KS−1y KT ð8Þ
ce reflectance data in the ORAC-AATSR aerosol retrieval algorithm:ote Sensing of Environment (2011), doi:10.1016/j.rse.2011.02.029

Continental case
0.0
0.2
0.4
0.6
0.8
1.0
Ave
ragi
ng k
erne
l val
ue
Biomass burning case
0.0
0.2
0.4
0.6
0.8
1.0
Ave
ragi
ng k
erne
l val
ue
Desert case
0.0
0.2
0.4
0.6
0.8
1.0
Ave
ragi
ng k
erne
l val
ue
Snow case
0.0
0.2
0.4
0.6
0.8
1.0
Ave
ragi
ng k
erne
l val
ue
τ550=0.1τ550=0.3τ550=1.0
Fig. 7. Diagonal elements of averaging kernels for each of the four cases. State vector elements are indicated along the x-axis (logarithms of aerosol optical depth and effective radius,then spectral BHR). Clockwise from top left, results show continental aerosol over vegetated ground; biomass burning aerosol over dense vegetation; continental aerosol over snow;and dust aerosol over a desert. Black stars show results for an AOD at 550 nm of 0.1, red diamonds an AOD of 0.3, and green triangles an AOD of 1. (For interpretation of the referencesto colour in this figure legend, the reader is referred to the web version of this article.)
Mean AOD difference
0
45
90
9A.M. Sayer et al. / Remote Sensing of Environment xxx (2011) xxx–xxx
whereK is theweighting function (also called Jacobian)matrix, i.e. therate of change of themeasurement vectorwith respect to the retrievedstate. It can be seen that as the elements of Sa become larger (the apriori information becomes a weaker constraint), A tends towards theidentitymatrix. The diagonal elements ofA thus describe howstronglythe corresponding retrieved state vector element is influenced by the apriori data (with a value of 1 indicating that the retrieved state vectorelement is wholly determined by the measurements, and 0 indicatingthat the measurements provide no improvement on the a prioriknowledge). Off-diagonal elements indicate a sensitivity of theparticular state vector element to a change in a different state vectorelement. The trace of A provides the degrees of freedom for signal, thenumber of pieces of state information added by the measurements.
In general, A is a complicated function of the true state.Calculations are therefore presented here for a range of series ofconditions: four surface cover and aerosol types (continental aerosolover a vegetated surface; biomass burning aerosol over a densely-vegetated surface; dust aerosol over a desert surface; and continentalaerosol over a snow surface) at each of three aerosol loadings(τ550=0.1, 0.3, 1.0). The aerosol microphysical properties are thoseused in the ORAC retrieval and the effective radii the a priori values forthe relevant aerosol model. Information on these, and the calculationof Sy and Sa, is provided in Sayer (2009) and Thomas et al. (2009a), orthis work. Each surface is modelled as a Lambertian reflector withspectral BHR (Rdd, 1, Rdd, 2, Rdd, 3 and Rdd, 4 respectively) of 0.06, 0.08,0.3, 0.2 for the vegetated case; 0.05, 0.05, 0.35, 0.15 for the densely-vegetated case; 0.25, 0.45, 0.55, 0.65 for the desert case; and 0.95,0.96, 0.9, 0.15 for the snow case. These values have been chosen astypical for different surface cover types and the results are similar if
Table 3Comparison between aerosol retrievals using the new SVD-based land surfacereflectance (‘SVD’) treatment with the previous land surface reflectance treatment(‘unadjusted’). RMS indicates the root mean square difference.
Retrieved/derivedparameter
Correlationcoefficient r
RMSdifference
Mean difference(SVD-unadjusted)
AOD (550 nm) 0.920 0.120 −0.032Effective radius (μm) 0.631 0.545 0.088AOD (870 nm) 0.883 0.110 −0.015Ångström exponent 0.763 0.514 −0.207
Please cite this article as: Sayer, A.M., et al., Use of MODIS-derived surfaImpact of differences between sensor spectral response functions, Rem
surface reflectances of similar magnitudes, or reasonable BRDFmodels, are used instead. Finally, the solar zenith angle is taken as45°, satellite zenith angles 5° and 55° for nadir and forward views, andrelative azimuth angles 45° and 90° for nadir and forward views.
Diagonal elements of the averaging kernels for these cases areshown in Fig. 7. Similar patterns are observed for all cases. The elementrelating to the AOD is very close to 1 for both of the vegetated cases,indicating the algorithm should be able to retrieve the AOD well; overthe brighter desert and snow surfaces, the value is lower (around 0.8for an aerosol loading of 0.1), due to a small contribution from theaerosol to TOA reflectance, but increases as aerosol loading increases.The effective radius is comparatively poorly-constrained by themeasurements with a strong contribution from the a priori for allcases, although the situation improves for higher aerosol loadings. Thisindicates that retrievals of effective radius, and information derivedusing this, such as Ångströmexponent, are likely less reliable than τ550.Averaging kernel elements relating to BHR are very close to 1 for lowaerosol loadings (as themajority of the TOA reflectancewill arise from
-180 -90 0 90 180-90
-45
<-0.3 -0.2 -0.1 0 0.1 0.2 >0.3
Fig. 8. Mean difference in retrieved 550 nm AOD (SVD-unadjusted) for those retrievalswhere both surface treatments are successful, averaged to a 25° grid. Grid cells withoutmatched retrievals are indicated in grey.
ce reflectance data in the ORAC-AATSR aerosol retrieval algorithm:ote Sensing of Environment (2011), doi:10.1016/j.rse.2011.02.029
Cost distribution
0 5 10 15 20
Cost
0.0
0.2
0.4
0.6
0.8
1.0
Cum
ulat
ive
freq
uenc
y
Fig. 9. Cumulative frequency distribution of retrieval cost for the unadjusted (red line)and SVD (green line) cases. The black line shows the theoretical result for a χ2
distribution with 1.5 degrees of freedom. (For interpretation of the references to colourin this figure legend, the reader is referred to the web version of this article.)
10 A.M. Sayer et al. / Remote Sensing of Environment xxx (2011) xxx–xxx
direct reflection of solar radiation from the surface) and decrease asaerosol loading increases. The total degrees of freedom for signal isapproximately 5 in all cases; as the aerosol loading increases, themeasurements provide more information on τ550 and reff and less onthe surface BHR. Off-diagonal elements are generally small, exceptthose relating to effective radius at low (0.1) andmoderate (0.3) AODs.
5. Impact on aerosol retrieval
To illustrate the impact of the new surface treatment on theaerosol retrieval scheme, the improved algorithm has been applied toAATSR data from the month of July 2008 (a total of 411 processedorbits). For comparison, the month has also been processed with theprevious version of the algorithm. This control version uses the
SVD
-180 -90 0 90 180-90
-45
0
45
90Una
-180 -90-90
-45
0
45
90
-180 -90 0 90 180-90
-45
0
45
90
-180 -90-90
-45
0
45
90
-180 -90 0 90 180-90
-45
0
45
90
-180 -90-90
-45
0
45
90
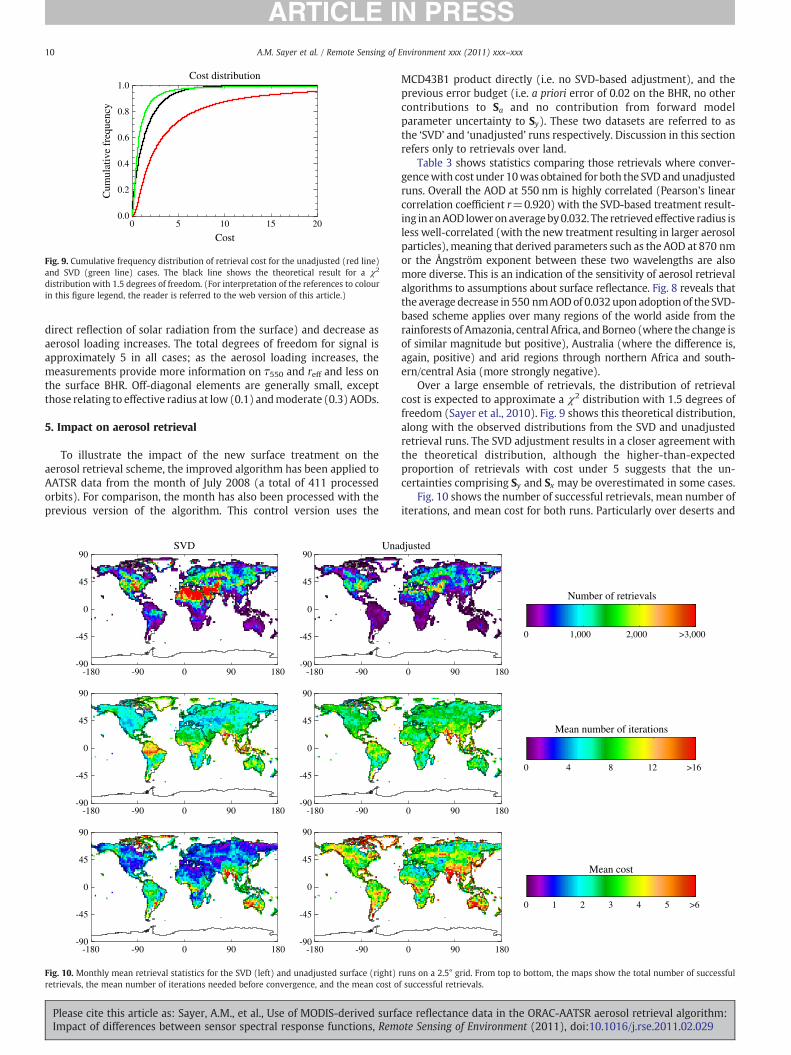
Fig. 10. Monthly mean retrieval statistics for the SVD (left) and unadjusted surface (right)retrievals, the mean number of iterations needed before convergence, and the mean cost o
Please cite this article as: Sayer, A.M., et al., Use of MODIS-derived surfaImpact of differences between sensor spectral response functions, Rem
MCD43B1 product directly (i.e. no SVD-based adjustment), and theprevious error budget (i.e. a priori error of 0.02 on the BHR, no othercontributions to Sa and no contribution from forward modelparameter uncertainty to Sy). These two datasets are referred to asthe ‘SVD’ and ‘unadjusted’ runs respectively. Discussion in this sectionrefers only to retrievals over land.
Table 3 shows statistics comparing those retrievals where conver-gencewith cost under 10was obtained for both the SVD and unadjustedruns. Overall the AOD at 550 nm is highly correlated (Pearson's linearcorrelation coefficient r=0.920) with the SVD-based treatment result-ing in anAOD lower onaverageby0.032. The retrieved effective radius isless well-correlated (with the new treatment resulting in larger aerosolparticles), meaning that derived parameters such as the AOD at 870 nmor the Ångström exponent between these two wavelengths are alsomore diverse. This is an indication of the sensitivity of aerosol retrievalalgorithms to assumptions about surface reflectance. Fig. 8 reveals thatthe average decrease in 550 nmAODof 0.032upon adoptionof the SVD-based scheme applies over many regions of the world aside from therainforests of Amazonia, central Africa, and Borneo (where the change isof similar magnitude but positive), Australia (where the difference is,again, positive) and arid regions through northern Africa and south-ern/central Asia (more strongly negative).
Over a large ensemble of retrievals, the distribution of retrievalcost is expected to approximate a χ2 distribution with 1.5 degrees offreedom (Sayer et al., 2010). Fig. 9 shows this theoretical distribution,along with the observed distributions from the SVD and unadjustedretrieval runs. The SVD adjustment results in a closer agreement withthe theoretical distribution, although the higher-than-expectedproportion of retrievals with cost under 5 suggests that the un-certainties comprising Sy and Sx may be overestimated in some cases.
Fig. 10 shows the number of successful retrievals, mean number ofiterations, and mean cost for both runs. Particularly over deserts and
djusted
0 90 180
Number of retrievals
0 1,000 2,000 >3,000
0 90 180
Mean number of iterations
0 4 8 12 >16
0 90 180
Mean cost
0 1 2 3 4 5 >6
runs on a 2.5° grid. From top to bottom, the maps show the total number of successfulf successful retrievals.
ce reflectance data in the ORAC-AATSR aerosol retrieval algorithm:ote Sensing of Environment (2011), doi:10.1016/j.rse.2011.02.029
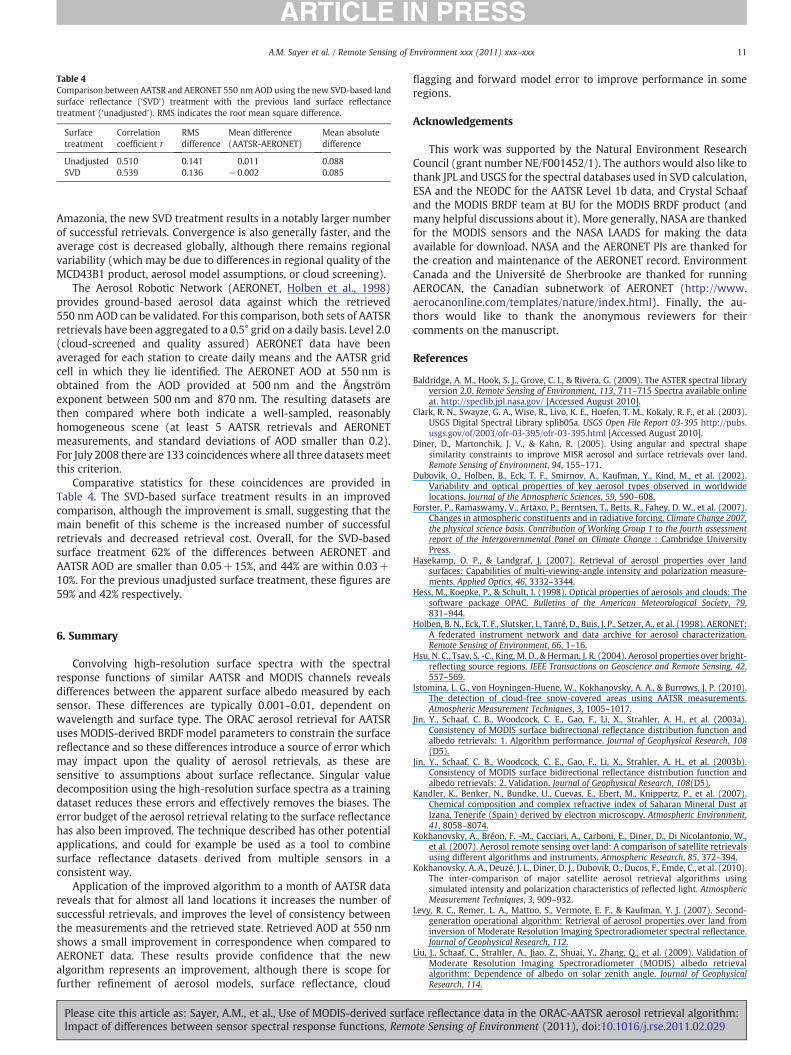
Table 4Comparison between AATSR and AERONET 550 nm AOD using the new SVD-based landsurface reflectance (‘SVD’) treatment with the previous land surface reflectancetreatment (‘unadjusted’). RMS indicates the root mean square difference.
Surfacetreatment
Correlationcoefficient r
RMSdifference
Mean difference(AATSR-AERONET)
Mean absolutedifference
Unadjusted 0.510 0.141 0.011 0.088SVD 0.539 0.136 −0.002 0.085
11A.M. Sayer et al. / Remote Sensing of Environment xxx (2011) xxx–xxx
Amazonia, the new SVD treatment results in a notably larger numberof successful retrievals. Convergence is also generally faster, and theaverage cost is decreased globally, although there remains regionalvariability (which may be due to differences in regional quality of theMCD43B1 product, aerosol model assumptions, or cloud screening).
The Aerosol Robotic Network (AERONET, Holben et al., 1998)provides ground-based aerosol data against which the retrieved550 nm AOD can be validated. For this comparison, both sets of AATSRretrievals have been aggregated to a 0.5° grid on a daily basis. Level 2.0(cloud-screened and quality assured) AERONET data have beenaveraged for each station to create daily means and the AATSR gridcell in which they lie identified. The AERONET AOD at 550 nm isobtained from the AOD provided at 500 nm and the Ångströmexponent between 500 nm and 870 nm. The resulting datasets arethen compared where both indicate a well-sampled, reasonablyhomogeneous scene (at least 5 AATSR retrievals and AERONETmeasurements, and standard deviations of AOD smaller than 0.2).For July 2008 there are 133 coincidences where all three datasetsmeetthis criterion.
Comparative statistics for these coincidences are provided inTable 4. The SVD-based surface treatment results in an improvedcomparison, although the improvement is small, suggesting that themain benefit of this scheme is the increased number of successfulretrievals and decreased retrieval cost. Overall, for the SVD-basedsurface treatment 62% of the differences between AERONET andAATSR AOD are smaller than 0.05+15%, and 44% are within 0.03+10%. For the previous unadjusted surface treatment, these figures are59% and 42% respectively.
6. Summary
Convolving high-resolution surface spectra with the spectralresponse functions of similar AATSR and MODIS channels revealsdifferences between the apparent surface albedo measured by eachsensor. These differences are typically 0.001–0.01, dependent onwavelength and surface type. The ORAC aerosol retrieval for AATSRuses MODIS-derived BRDF model parameters to constrain the surfacereflectance and so these differences introduce a source of error whichmay impact upon the quality of aerosol retrievals, as these aresensitive to assumptions about surface reflectance. Singular valuedecomposition using the high-resolution surface spectra as a trainingdataset reduces these errors and effectively removes the biases. Theerror budget of the aerosol retrieval relating to the surface reflectancehas also been improved. The technique described has other potentialapplications, and could for example be used as a tool to combinesurface reflectance datasets derived from multiple sensors in aconsistent way.
Application of the improved algorithm to a month of AATSR datareveals that for almost all land locations it increases the number ofsuccessful retrievals, and improves the level of consistency betweenthe measurements and the retrieved state. Retrieved AOD at 550 nmshows a small improvement in correspondence when compared toAERONET data. These results provide confidence that the newalgorithm represents an improvement, although there is scope forfurther refinement of aerosol models, surface reflectance, cloud
Please cite this article as: Sayer, A.M., et al., Use of MODIS-derived surfaImpact of differences between sensor spectral response functions, Rem
flagging and forward model error to improve performance in someregions.
Acknowledgements
This work was supported by the Natural Environment ResearchCouncil (grant number NE/F001452/1). The authors would also like tothank JPL and USGS for the spectral databases used in SVD calculation,ESA and the NEODC for the AATSR Level 1b data, and Crystal Schaafand the MODIS BRDF team at BU for the MODIS BRDF product (andmany helpful discussions about it). More generally, NASA are thankedfor the MODIS sensors and the NASA LAADS for making the dataavailable for download. NASA and the AERONET PIs are thanked forthe creation and maintenance of the AERONET record. EnvironmentCanada and the Université de Sherbrooke are thanked for runningAEROCAN, the Canadian subnetwork of AERONET (http://www.aerocanonline.com/templates/nature/index.html). Finally, the au-thors would like to thank the anonymous reviewers for theircomments on the manuscript.
References
Baldridge, A. M., Hook, S. J., Grove, C. I., & Rivera, G. (2009). The ASTER spectral libraryversion 2.0. Remote Sensing of Environment, 113, 711–715 Spectra available onlineat. http://speclib.jpl.nasa.gov/ [Accessed August 2010].
Clark, R. N., Swayze, G. A., Wise, R., Livo, K. E., Hoefen, T. M., Kokaly, R. F., et al. (2003).USGS Digital Spectral Library splib05a. USGS Open File Report 03-395 http://pubs.usgs.gov/of/2003/ofr-03-395/ofr-03-395.html [Accessed August 2010].
Diner, D., Martonchik, J. V., & Kahn, R. (2005). Using angular and spectral shapesimilarity constraints to improve MISR aerosol and surface retrievals over land.Remote Sensing of Environment, 94, 155–171.
Dubovik, O., Holben, B., Eck, T. F., Smirnov, A., Kaufman, Y., Kind, M., et al. (2002).Variability and optical properties of key aerosol types observed in worldwidelocations. Journal of the Atmospheric Sciences, 59, 590–608.
Forster, P., Ramaswamy, V., Artaxo, P., Berntsen, T., Betts, R., Fahey, D. W., et al. (2007).Changes in atmospheric constituents and in radiative forcing. Climate Change 2007,the physical science basis. Contribution of Working Group 1 to the fourth assessmentreport of the Intergovernmental Panel on Climate Change : Cambridge UniversityPress.
Hasekamp, O. P., & Landgraf, J. (2007). Retrieval of aerosol properties over landsurfaces: Capabilities of multi-viewing-angle intensity and polarization measure-ments. Applied Optics, 46, 3332–3344.
Hess, M., Koepke, P., & Schult, I. (1998). Optical properties of aerosols and clouds: Thesoftware package OPAC. Bulletins of the American Meteorological Society, 79,831–944.
Holben, B. N., Eck, T. F., Slutsker, I., Tanré, D., Buis, J. P., Setzer, A., et al. (1998). AERONET:A federated instrument network and data archive for aerosol characterization.Remote Sensing of Environment, 66, 1–16.
Hsu, N. C., Tsay, S. -C., King, M. D., & Herman, J. R. (2004). Aerosol properties over bright-reflecting source regions. IEEE Transactions on Geoscience and Remote Sensing, 42,557–569.
Istomina, L. G., von Hoyningen-Huene, W., Kokhanovsky, A. A., & Burrows, J. P. (2010).The detection of cloud-free snow-covered areas using AATSR measurements.Atmospheric Measurement Techniques, 3, 1005–1017.
Jin, Y., Schaaf, C. B., Woodcock, C. E., Gao, F., Li, X., Strahler, A. H., et al. (2003a).Consistency of MODIS surface bidirectional reflectance distribution function andalbedo retrievals: 1. Algorithm performance. Journal of Geophysical Research, 108(D5).
Jin, Y., Schaaf, C. B., Woodcock, C. E., Gao, F., Li, X., Strahler, A. H., et al. (2003b).Consistency of MODIS surface bidirectional reflectance distribution function andalbedo retrievals: 2. Validation. Journal of Geophysical Research, 108(D5).
Kandler, K., Benker, N., Bundke, U., Cuevas, E., Ebert, M., Knippertz, P., et al. (2007).Chemical composition and complex refractive index of Saharan Mineral Dust atIzana, Tenerife (Spain) derived by electron microscopy. Atmospheric Environment,41, 8058–8074.
Kokhanovsky, A., Bréon, F. -M., Cacciari, A., Carboni, E., Diner, D., Di Nicolantonio, W.,et al. (2007). Aerosol remote sensing over land: A comparison of satellite retrievalsusing different algorithms and instruments. Atmospheric Research, 85, 372–394.
Kokhanovsky, A. A., Deuzé, J. L., Diner, D. J., Dubovik, O., Ducos, F., Emde, C., et al. (2010).The inter-comparison of major satellite aerosol retrieval algorithms usingsimulated intensity and polarization characteristics of reflected light. AtmosphericMeasurement Techniques, 3, 909–932.
Levy, R. C., Remer, L. A., Mattoo, S., Vermote, E. F., & Kaufman, Y. J. (2007). Second-generation operational algorithm: Retrieval of aerosol properties over land frominversion of Moderate Resolution Imaging Spectroradiometer spectral reflectance.Journal of Geophysical Research, 112.
Liu, J., Schaaf, C., Strahler, A., Jiao, Z., Shuai, Y., Zhang, Q., et al. (2009). Validation ofModerate Resolution Imaging Spectroradiometer (MODIS) albedo retrievalalgorithm: Dependence of albedo on solar zenith angle. Journal of GeophysicalResearch, 114.
ce reflectance data in the ORAC-AATSR aerosol retrieval algorithm:ote Sensing of Environment (2011), doi:10.1016/j.rse.2011.02.029

12 A.M. Sayer et al. / Remote Sensing of Environment xxx (2011) xxx–xxx
Lucht, W., Schaaf, C. B., & Strahler, A. H. (2000). An algorithm for the retrieval of albedofrom space using semiempirical BRDF models. IEEE Transactions on Geoscience andRemote Sensing, 38, 977–998.
Martonchik, J. V., Diner, D. J., Kahn, R. A., Ackerman, T. P., Verstraete, M. M., Pinty, B.,et al. (1998). Techniques for the retrieval of aerosol properties over land and oceanusing multiangle imaging. IEEE Transactions on Geoscience and Remote Sensing, 36,1212–1227.
Mishchenko, M. I., & Travis, L. D. (1998). Capabilities and limitations of a currentFORTRAN implementation of the T-matrix method for randomly oriented,rotationally symmetric scatterers. Journal of Quantitative Spectroscopy and RadiativeTransfer, 60, 309–324.
North, P. R. (2002). Estimation of aerosol opacity and land surface bidirectionalreflectance from ATSR-2 dual-angle imagery: Operational method and validation.Journal of Geophysical Research, 107.
Rodgers, C. D. (2000). Inverse methods for atmospheric sounding: Theory and practice.Series on Atmospheric, Oceanic and Planetary Physics, Vol. 2: World Scientific.
Saloman, J. G., Schaaf, C. B., Strahler, A. H., Gao, F., & Jin, Y. (2006). Validation of theMODIS bidirectional reflectance distribution function and albedo retrievals usingcombined observations from the Aqua and Terra platforms. IEEE Transactions onGeoscience and Remote Sensing, 44, 1555–1565.
Sayer, A. M. (2009). Aerosol remote sensing using AATSR. Ph.D. thesis University ofOxford. Available online at http://www.atm.ox.ac.uk/group/eodg/theses/Sayer.pdf
Sayer, A. M., Thomas, G. E., & Grainger, R. G. (2010). A sea surface reflectance model for(A)ATSR, and application to aerosol retrievals.AtmosphericMeasurement Techniques,3,813–838.
Schaaf, C. B., Gao, F., Strahler, A. H., Lucht, W., Li, X., Tsang, T., et al. (2002). Firstoperational BRDF, albedo nadir reflectance products fromMODIS. Remote Sensing ofEnvironment, 83, 135–148.
Schaepman-Strub, G., Schaepman, M. E., Painter, T. H., Dangel, S., & Martonchik, J. V.(2006). Reflectance quantities in optical remote sensing—Definitions and casestudies. Remote Sensing of Environment, 103, 27–42.
Shuai, Y., Schaaf, C. B., Strahler, A. H., Liu, J., & Jiao, Z. (2010). Quality assessment ofBRDF/albedo retrievals in MODIS operational system. Geophysical Research Letters,35.
Please cite this article as: Sayer, A.M., et al., Use of MODIS-derived surfaImpact of differences between sensor spectral response functions, Rem
Smith, D., Poulsen, C., & Latter, B. (2008). Calibration status of the AATSR reflectancechannels. 2008 ESA MERIS/(A)ATSR Workshop SP-666.
Stevens, B., & Feingold, G. (2009). Untangling aerosol effects on clouds and precipitationin a buffered system. Nature, 461, 607–613.
Thomas, G. E., Poulsen, C. A., Sayer, A. M., Marsh, S. H., Dean, S. M., Carboni, E., et al.(2009a). Oxford-RAL Aerosol and Cloud (ORAC): Aerosol retrievals from satelliteradiometers. In A. A. Kokhanvosky, & G. de Leeuw (Eds.), Satellite Aerosol RemoteSensing Over Land. Berlin: Springer.
Thomas, G. E., Poulsen, C. A., Sayer, A. M., Marsh, S. H., Dean, S. M., Carboni, E., et al.(2009b). The GRAPE aerosol retrieval algorithm. Atmospheric MeasurementTechniques, 2, 679–701.
Torres, O., Bhartia, P. K., Herman, J. R., & Ahmad, Z. (1998). Derivation of aerosolproperties from satellite measurements of backscattered ultraviolet radiation:Theoretical basis. Journal of Geophysical Research, 103, 17099–17110.
Veefkind, J. P., de Leeuw, G., & Durkee, P. A. (1998). Retrieval of aerosol optical depthover land using two-angle view satellite radiometry during TARFOX. GeophysicalResearch Letters, 25, 3135–3138.
von Hoyningen-Huene, W., Freitag, M., & Burrows, J. P. (2002). Retrieval of spectralaerosol optical thickness from multi-wavelength space-borne sensors. Advances inSpace Research, 49, 1765–1770.
von Hoyningen-Huene, W., Freitag, M., & Burrows, J. P. (2003). Retrieval of aerosoloptical thickness over land surfaces from top-of-atmosphere radiance. Journal ofGeophysical Research, 108(D9).
Wanner, W., Li, X., & Strahler, A. H. (1995). On the derivation of kernels for kernel-driven models of bidirectional reflectance. Journal of Geophysical Research, 100,21077–21089.
Wanner, W., Strahler, A., Hu, B., Lewis, P., Muller, J., Li, X., et al. (1997). Global retrievalof bidirectional reflectance and albedo over land from EOS MODIS and MISR data:Theory and algorithm. Journal of Geophysical Research, 102, 17143–17161.
Ward, H. (2009). Temporal variability of surface albedo. MPhys project report,Atmospheric, Oceanic and Planetary Physics, Department of Physics, University ofOxford Available online at. http://www.atm.ox.ac.uk/group/eodg/mphys_reports/2009_Ward.pdf
ce reflectance data in the ORAC-AATSR aerosol retrieval algorithm:ote Sensing of Environment (2011), doi:10.1016/j.rse.2011.02.029