The role of Consumer Credit within Neoliberal Capitalism & its expansion to the Surplus Population
Upload
khangminh22Category
view
3download
0
U.S. National Consumer Credit Trends Report: Originations Data as of March 15, 2021
March 23, 2021

2 PROPRIETARY |
Originations through March 14, 2021 reported as of March 16, 2021
Consumer Credit Trends Report: Originations
• Auto 5
– Auto Leases 21
– Auto Loans 37
• Credit Card: Bankcard 53
• Credit Card: Private Label 69
• First Mortgage 85
• Home Equity Lines of Credit 101
• Home Equity Installment Loans 117
• Consumer Finance 133
– Consumer Finance Installment 149
– Consumer Finance Revolving 165
• Student Loans 181
• Notes 193
• Contact information Back cover

3 PROPRIETARY |
Originations through March 14, 2021 reported as of March 16, 2021
Consumer Originations Observations Weekly as of March 14, 2021
Consumer Originations
• Notable weekly originations performance insights: – Subprime share was mixed this week across all portfolios
– All product lines show declining growth except Consumer Finance
– Consumer Finance origination volumes began to pick up in mid January and appears to continue in the most recent vintages.
• The shading indicated on the graphs for the last 8 weeks is to indicate that the data could be revised to account for data furnisher lags. The Darker shading indicates less revisions are expected.

4 PROPRIETARY | CONFIDENTIAL & PROPRIETARY
Credit Trends Data & Visualization Tools!
Instant visibility into the fast changing market
● Benchmark and analyze performance
● Understand changing market drivers
● Make stronger strategy decisions ● All overlaid with Covid 19 case data ● Ability to segment by Product, Age,
Delinquency Metric, and Risk.
4
Credit Trends Data Credit Trends Economic Vitality
Application(App)
Contact Your Equifax Sales Representative for Additional Information!
Common Use Cases:
Would you like to?
● Understand Delinquency changes for
the market and Competition
● Understand how the market and competition is changing who they lend to
● Analyze your market share compared
to the competition ● Track Credit Limit & Balance Changes
for the Market or Competitors ● Enhance the profitability of
acquisitions and Risk Strategies
Complete view of the US Consumer Credit Market, trended over time
● Understand Industry trends at the
National, State, MSA, or Zip level.
● View your Organization against a defined Peer Set or against the Market
● Portfolio trends and expectations based on data from other natural disasters

5 PROPRIETARY |
Credit Trends Originations: Total Auto Loans and Leases

6 PROPRIETARY |
Originations through March 14, 2021 reported as of March 16, 2021
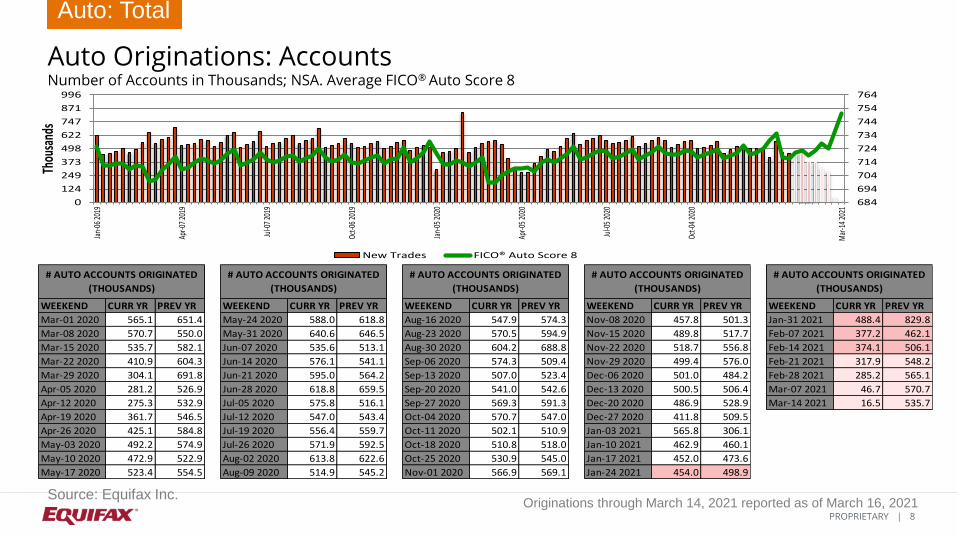
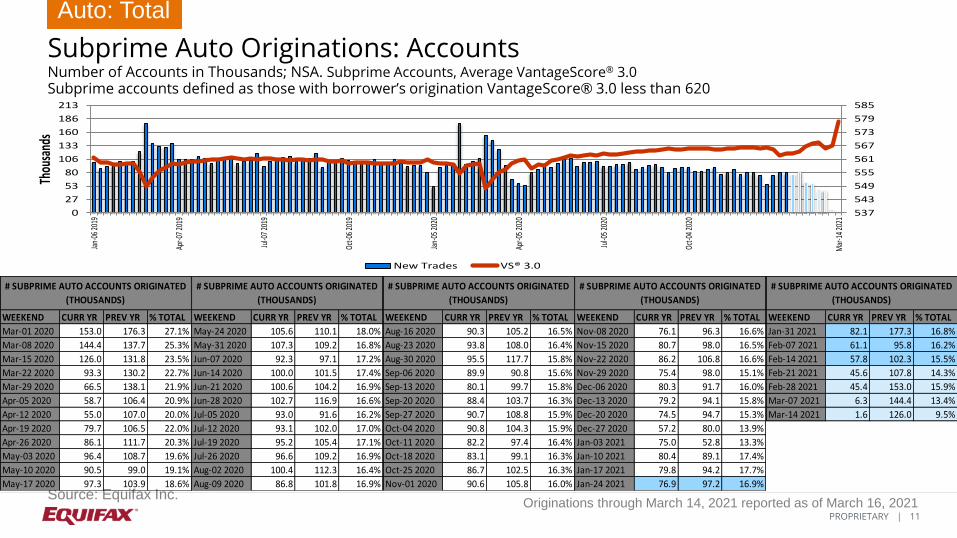
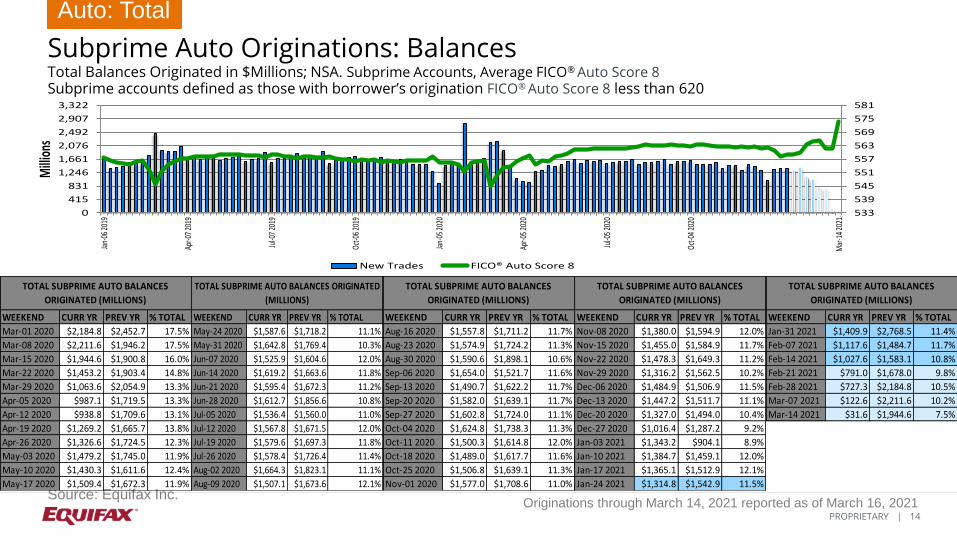
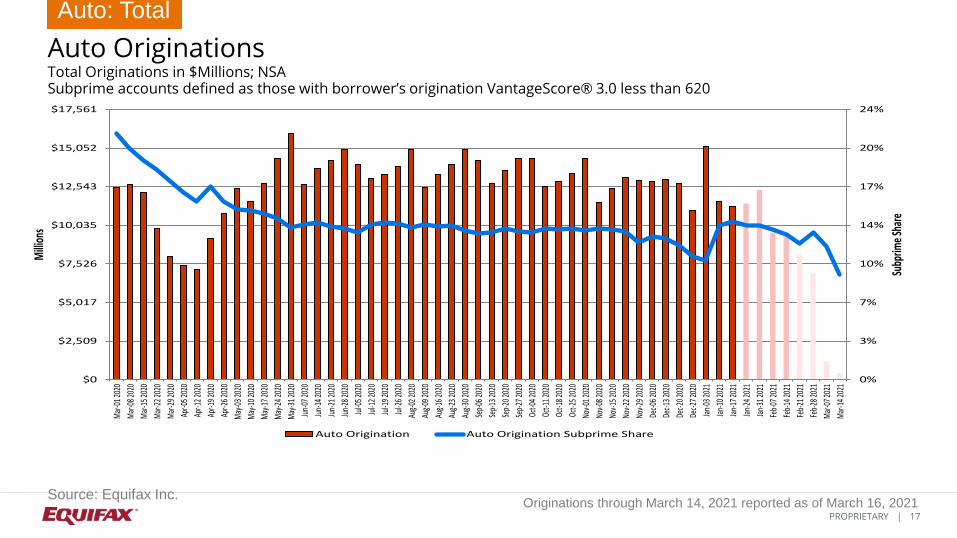
Auto Originations Observations Origination Estimates through March 14, 2021 reported as of March 16, 2021
Auto: Total
*Origination data subject to revision due to reporting lags. All data presented here are estimates.
• 16,500 auto loans and leases, totaling $420.5 million, have been originated the week ending March 14th.
• 1,600 auto loans and leases have been originated the week ending March 14th to consumers with a VantageScore® 3.0 credit score below 620. These are generally considered subprime accounts. These newly-issued loans have a corresponding total balance of $39.0 million.
• In the week ending March 14th, 9.5% of auto loans and leases were issued to consumers with a subprime VantageScore® 3.0 credit score. These subprime accounts totaled 9.3% of balances of all auto loan and leases.
• 1,300 auto loans and leases have been originated the week ending March 14th to consumers with a FICO® Auto 8 credit score below 620. These are generally considered subprime accounts. These newly-issued loans have a corresponding total balance of $31.6 million.
• In the week ending March 14th, 7.8% of auto loans and leases were issued to consumers with a FICO® Auto 8 credit score subprime credit score. These subprime accounts totaled 7.5% of balances of all auto loan and leases.
• The average origination balance for all auto loans and leases issued in the week of March 14th was $25,464. The average subprime auto loan and lease amount was $24,882.

7 PROPRIETARY |
Originations through March 14, 2021 reported as of March 16, 2021
667
677
687
697
707
717
727
737
747
0
124
249
373
498
622
747
871
996Ja
n-06
201
9
Apr-0
7 20
19
Jul-0
7 20
19
Oct-0
6 20
19
Jan-
05 2
020
Apr-0
5 20
20
Jul-0
5 20
20
Oct-0
4 20
20
Mar
-14
2021
Thou
sand
s
New Trades VS® 3.0
Auto Originations: Accounts Number of Accounts in Thousands; NSA. Average VantageScore® 3.0
Source: Equifax Inc.
Auto: Total
WEEKEND CURR YR PREV YR
Mar-01 2020 565.1 651.4
Mar-08 2020 570.7 550.0
Mar-15 2020 535.7 582.1
Mar-22 2020 410.9 604.3
Mar-29 2020 304.1 691.8
Apr-05 2020 281.2 526.9
Apr-12 2020 275.3 532.9
Apr-19 2020 361.7 546.5
Apr-26 2020 425.1 584.8
May-03 2020 492.2 574.9
May-10 2020 472.9 522.9
May-17 2020 523.4 554.5
# AUTO ACCOUNTS ORIGINATED
(THOUSANDS)
WEEKEND CURR YR PREV YR
May-24 2020 588.0 618.8
May-31 2020 640.6 646.5
Jun-07 2020 535.6 513.1
Jun-14 2020 576.1 541.1
Jun-21 2020 595.0 564.2
Jun-28 2020 618.8 659.5
Jul-05 2020 575.8 516.1
Jul-12 2020 547.0 543.4
Jul-19 2020 556.4 559.7
Jul-26 2020 571.9 592.5
Aug-02 2020 613.8 622.6
Aug-09 2020 514.9 545.2
# AUTO ACCOUNTS ORIGINATED
(THOUSANDS)
WEEKEND CURR YR PREV YR
Aug-16 2020 547.9 574.3
Aug-23 2020 570.5 594.9
Aug-30 2020 604.2 688.8
Sep-06 2020 574.3 509.4
Sep-13 2020 507.0 523.4
Sep-20 2020 541.0 542.6
Sep-27 2020 569.3 591.3
Oct-04 2020 570.7 547.0
Oct-11 2020 502.1 510.9
Oct-18 2020 510.8 518.0
Oct-25 2020 530.9 545.0
Nov-01 2020 566.9 569.1
# AUTO ACCOUNTS ORIGINATED
(THOUSANDS)
WEEKEND CURR YR PREV YR
Nov-08 2020 457.8 501.3
Nov-15 2020 489.8 517.7
Nov-22 2020 518.7 556.8
Nov-29 2020 499.4 576.0
Dec-06 2020 501.0 484.2
Dec-13 2020 500.5 506.4
Dec-20 2020 486.9 528.9
Dec-27 2020 411.8 509.5
Jan-03 2021 565.8 306.1
Jan-10 2021 462.9 460.1
Jan-17 2021 452.0 473.6
Jan-24 2021 454.0 498.9
# AUTO ACCOUNTS ORIGINATED
(THOUSANDS)
WEEKEND CURR YR PREV YR
Jan-31 2021 488.4 829.8
Feb-07 2021 377.2 462.1
Feb-14 2021 374.1 506.1
Feb-21 2021 317.9 548.2
Feb-28 2021 285.2 565.1
Mar-07 2021 46.7 570.7
Mar-14 2021 16.5 535.7
# AUTO ACCOUNTS ORIGINATED
(THOUSANDS)
8 PROPRIETARY |
Originations through March 14, 2021 reported as of March 16, 2021
684
694
704
714
724
734
744
754
764
0
124
249
373
498
622
747
871
996Ja
n-06
201
9
Apr-0
7 20
19
Jul-0
7 20
19
Oct-0
6 20
19
Jan-
05 2
020
Apr-0
5 20
20
Jul-0
5 20
20
Oct-0
4 20
20
Mar
-14
2021
Thou
sand
s
New Trades FICO® Auto Score 8
Auto Originations: Accounts Number of Accounts in Thousands; NSA. Average FICO® Auto Score 8
Source: Equifax Inc.
Auto: Total
WEEKEND CURR YR PREV YR
Mar-01 2020 565.1 651.4
Mar-08 2020 570.7 550.0
Mar-15 2020 535.7 582.1
Mar-22 2020 410.9 604.3
Mar-29 2020 304.1 691.8
Apr-05 2020 281.2 526.9
Apr-12 2020 275.3 532.9
Apr-19 2020 361.7 546.5
Apr-26 2020 425.1 584.8
May-03 2020 492.2 574.9
May-10 2020 472.9 522.9
May-17 2020 523.4 554.5
# AUTO ACCOUNTS ORIGINATED
(THOUSANDS)
WEEKEND CURR YR PREV YR
May-24 2020 588.0 618.8
May-31 2020 640.6 646.5
Jun-07 2020 535.6 513.1
Jun-14 2020 576.1 541.1
Jun-21 2020 595.0 564.2
Jun-28 2020 618.8 659.5
Jul-05 2020 575.8 516.1
Jul-12 2020 547.0 543.4
Jul-19 2020 556.4 559.7
Jul-26 2020 571.9 592.5
Aug-02 2020 613.8 622.6
Aug-09 2020 514.9 545.2
# AUTO ACCOUNTS ORIGINATED
(THOUSANDS)
WEEKEND CURR YR PREV YR
Aug-16 2020 547.9 574.3
Aug-23 2020 570.5 594.9
Aug-30 2020 604.2 688.8
Sep-06 2020 574.3 509.4
Sep-13 2020 507.0 523.4
Sep-20 2020 541.0 542.6
Sep-27 2020 569.3 591.3
Oct-04 2020 570.7 547.0
Oct-11 2020 502.1 510.9
Oct-18 2020 510.8 518.0
Oct-25 2020 530.9 545.0
Nov-01 2020 566.9 569.1
# AUTO ACCOUNTS ORIGINATED
(THOUSANDS)
WEEKEND CURR YR PREV YR
Nov-08 2020 457.8 501.3
Nov-15 2020 489.8 517.7
Nov-22 2020 518.7 556.8
Nov-29 2020 499.4 576.0
Dec-06 2020 501.0 484.2
Dec-13 2020 500.5 506.4
Dec-20 2020 486.9 528.9
Dec-27 2020 411.8 509.5
Jan-03 2021 565.8 306.1
Jan-10 2021 462.9 460.1
Jan-17 2021 452.0 473.6
Jan-24 2021 454.0 498.9
# AUTO ACCOUNTS ORIGINATED
(THOUSANDS)
WEEKEND CURR YR PREV YR
Jan-31 2021 488.4 829.8
Feb-07 2021 377.2 462.1
Feb-14 2021 374.1 506.1
Feb-21 2021 317.9 548.2
Feb-28 2021 285.2 565.1
Mar-07 2021 46.7 570.7
Mar-14 2021 16.5 535.7
# AUTO ACCOUNTS ORIGINATED
(THOUSANDS)

9 PROPRIETARY |
Originations through March 14, 2021 reported as of March 16, 2021
667
677
687
697
707
717
727
737
747
0
2,846
5,693
8,539
11,386
14,232
17,078
19,925
22,771
Jan-
06 2
019
Apr-0
7 20
19
Jul-0
7 20
19
Oct-0
6 20
19
Jan-
05 2
020
Apr-0
5 20
20
Jul-0
5 20
20
Oct-0
4 20
20
Mar
-14
2021
Mill
ions
New Trades VS® 3.0
Auto Originations: Balances Total Balances Originated in $Millions; NSA. Average VantageScore® 3.0
Source: Equifax Inc.
Auto: Total
WEEKEND CURR YR PREV YR
Mar-01 2020 $12,487.8 $13,949.5
Mar-08 2020 $12,668.0 $11,887.5
Mar-15 2020 $12,139.3 $12,827.2
Mar-22 2020 $9,803.5 $13,442.2
Mar-29 2020 $7,984.4 $15,654.5
Apr-05 2020 $7,419.9 $11,638.8
Apr-12 2020 $7,187.6 $11,894.3
Apr-19 2020 $9,202.5 $12,320.3
Apr-26 2020 $10,779.8 $13,174.9
May-03 2020 $12,394.9 $12,911.9
May-10 2020 $11,546.8 $11,768.3
May-17 2020 $12,725.7 $12,556.0
TOTAL AUTO BALANCES
ORIGINATED (MILLIONS)
WEEKEND CURR YR PREV YR
May-24 2020 $14,363.4 $14,080.1
May-31 2020 $15,964.4 $14,884.8
Jun-07 2020 $12,685.7 $11,573.0
Jun-14 2020 $13,716.8 $12,293.7
Jun-21 2020 $14,227.3 $12,926.3
Jun-28 2020 $14,978.8 $15,222.9
Jul-05 2020 $13,955.2 $11,778.4
Jul-12 2020 $13,055.8 $12,334.7
Jul-19 2020 $13,341.1 $12,745.4
Jul-26 2020 $13,832.0 $13,531.8
Aug-02 2020 $14,978.6 $14,194.6
Aug-09 2020 $12,470.7 $12,400.4
TOTAL AUTO BALANCES
ORIGINATED (MILLIONS)
WEEKEND CURR YR PREV YR
Aug-16 2020 $13,362.1 $13,127.9
Aug-23 2020 $13,982.0 $13,724.8
Aug-30 2020 $14,987.8 $16,062.2
Sep-06 2020 $14,258.0 $11,844.5
Sep-13 2020 $12,757.2 $12,126.3
Sep-20 2020 $13,574.9 $12,612.0
Sep-27 2020 $14,384.1 $13,875.6
Oct-04 2020 $14,382.0 $12,668.7
Oct-11 2020 $12,538.9 $11,804.9
Oct-18 2020 $12,882.9 $12,035.8
Oct-25 2020 $13,381.2 $12,686.1
Nov-01 2020 $14,346.2 $13,222.7
TOTAL AUTO BALANCES
ORIGINATED (MILLIONS)
WEEKEND CURR YR PREV YR
Nov-08 2020 $11,482.5 $11,615.2
Nov-15 2020 $12,434.4 $12,153.4
Nov-22 2020 $13,142.4 $12,974.9
Nov-29 2020 $12,962.3 $13,747.6
Dec-06 2020 $12,911.8 $11,326.0
Dec-13 2020 $12,981.5 $11,932.3
Dec-20 2020 $12,761.7 $12,693.9
Dec-27 2020 $11,021.4 $12,406.7
Jan-03 2021 $15,159.8 $7,102.7
Jan-10 2021 $11,553.1 $10,475.7
Jan-17 2021 $11,274.5 $10,834.9
Jan-24 2021 $11,438.7 $11,495.2
TOTAL AUTO BALANCES
ORIGINATED (MILLIONS)
WEEKEND CURR YR PREV YR
Jan-31 2021 $12,332.8 $18,975.8
Feb-07 2021 $9,550.7 $10,571.2
Feb-14 2021 $9,526.6 $11,672.0
Feb-21 2021 $8,071.8 $12,689.6
Feb-28 2021 $6,944.2 $12,487.8
Mar-07 2021 $1,199.6 $12,668.0
Mar-14 2021 $420.5 $12,139.3
TOTAL AUTO BALANCES
ORIGINATED (MILLIONS)

10 PROPRIETARY |
Originations through March 14, 2021 reported as of March 16, 2021
684
694
704
714
724
734
744
754
764
0
2,846
5,693
8,539
11,386
14,232
17,078
19,925
22,771
Jan-
06 2
019
Apr-0
7 20
19
Jul-0
7 20
19
Oct-0
6 20
19
Jan-
05 2
020
Apr-0
5 20
20
Jul-0
5 20
20
Oct-0
4 20
20
Mar
-14
2021
Mill
ions
New Trades FICO® Auto Score 8
Auto Originations: Balances Total Balances Originated in $Millions; NSA. Average FICO® Auto Score 8
Source: Equifax Inc.
Auto: Total
WEEKEND CURR YR PREV YR
Mar-01 2020 $12,487.8 $13,949.5
Mar-08 2020 $12,668.0 $11,887.5
Mar-15 2020 $12,139.3 $12,827.2
Mar-22 2020 $9,803.5 $13,442.2
Mar-29 2020 $7,984.4 $15,654.5
Apr-05 2020 $7,419.9 $11,638.8
Apr-12 2020 $7,187.6 $11,894.3
Apr-19 2020 $9,202.5 $12,320.3
Apr-26 2020 $10,779.8 $13,174.9
May-03 2020 $12,394.9 $12,911.9
May-10 2020 $11,546.8 $11,768.3
May-17 2020 $12,725.7 $12,556.0
TOTAL AUTO BALANCES
ORIGINATED (MILLIONS)
WEEKEND CURR YR PREV YR
May-24 2020 $14,363.4 $14,080.1
May-31 2020 $15,964.4 $14,884.8
Jun-07 2020 $12,685.7 $11,573.0
Jun-14 2020 $13,716.8 $12,293.7
Jun-21 2020 $14,227.3 $12,926.3
Jun-28 2020 $14,978.8 $15,222.9
Jul-05 2020 $13,955.2 $11,778.4
Jul-12 2020 $13,055.8 $12,334.7
Jul-19 2020 $13,341.1 $12,745.4
Jul-26 2020 $13,832.0 $13,531.8
Aug-02 2020 $14,978.6 $14,194.6
Aug-09 2020 $12,470.7 $12,400.4
TOTAL AUTO BALANCES
ORIGINATED (MILLIONS)
WEEKEND CURR YR PREV YR
Aug-16 2020 $13,362.1 $13,127.9
Aug-23 2020 $13,982.0 $13,724.8
Aug-30 2020 $14,987.8 $16,062.2
Sep-06 2020 $14,258.0 $11,844.5
Sep-13 2020 $12,757.2 $12,126.3
Sep-20 2020 $13,574.9 $12,612.0
Sep-27 2020 $14,384.1 $13,875.6
Oct-04 2020 $14,382.0 $12,668.7
Oct-11 2020 $12,538.9 $11,804.9
Oct-18 2020 $12,882.9 $12,035.8
Oct-25 2020 $13,381.2 $12,686.1
Nov-01 2020 $14,346.2 $13,222.7
TOTAL AUTO BALANCES
ORIGINATED (MILLIONS)
WEEKEND CURR YR PREV YR
Nov-08 2020 $11,482.5 $11,615.2
Nov-15 2020 $12,434.4 $12,153.4
Nov-22 2020 $13,142.4 $12,974.9
Nov-29 2020 $12,962.3 $13,747.6
Dec-06 2020 $12,911.8 $11,326.0
Dec-13 2020 $12,981.5 $11,932.3
Dec-20 2020 $12,761.7 $12,693.9
Dec-27 2020 $11,021.4 $12,406.7
Jan-03 2021 $15,159.8 $7,102.7
Jan-10 2021 $11,553.1 $10,475.7
Jan-17 2021 $11,274.5 $10,834.9
Jan-24 2021 $11,438.7 $11,495.2
TOTAL AUTO BALANCES
ORIGINATED (MILLIONS)
WEEKEND CURR YR PREV YR
Jan-31 2021 $12,332.8 $18,975.8
Feb-07 2021 $9,550.7 $10,571.2
Feb-14 2021 $9,526.6 $11,672.0
Feb-21 2021 $8,071.8 $12,689.6
Feb-28 2021 $6,944.2 $12,487.8
Mar-07 2021 $1,199.6 $12,668.0
Mar-14 2021 $420.5 $12,139.3
TOTAL AUTO BALANCES
ORIGINATED (MILLIONS)
11 PROPRIETARY |
Originations through March 14, 2021 reported as of March 16, 2021
537
543
549
555
561
567
573
579
585
0
27
53
80
106
133
160
186
213Ja
n-06
201
9
Apr-0
7 20
19
Jul-0
7 20
19
Oct-0
6 20
19
Jan-
05 2
020
Apr-0
5 20
20
Jul-0
5 20
20
Oct-0
4 20
20
Mar
-14
2021
Thou
sand
s
New Trades VS® 3.0
Subprime Auto Originations: Accounts Number of Accounts in Thousands; NSA. Subprime Accounts, Average VantageScore® 3.0 Subprime accounts defined as those with borrower’s origination VantageScore® 3.0 less than 620
Source: Equifax Inc.
Auto: Total
WEEKEND CURR YR PREV YR % TOTAL
Mar-01 2020 153.0 176.3 27.1%
Mar-08 2020 144.4 137.7 25.3%
Mar-15 2020 126.0 131.8 23.5%
Mar-22 2020 93.3 130.2 22.7%
Mar-29 2020 66.5 138.1 21.9%
Apr-05 2020 58.7 106.4 20.9%
Apr-12 2020 55.0 107.0 20.0%
Apr-19 2020 79.7 106.5 22.0%
Apr-26 2020 86.1 111.7 20.3%
May-03 2020 96.4 108.7 19.6%
May-10 2020 90.5 99.0 19.1%
May-17 2020 97.3 103.9 18.6%
# SUBPRIME AUTO ACCOUNTS ORIGINATED
(THOUSANDS)
WEEKEND CURR YR PREV YR % TOTAL
May-24 2020 105.6 110.1 18.0%
May-31 2020 107.3 109.2 16.8%
Jun-07 2020 92.3 97.1 17.2%
Jun-14 2020 100.0 101.5 17.4%
Jun-21 2020 100.6 104.2 16.9%
Jun-28 2020 102.7 116.9 16.6%
Jul-05 2020 93.0 91.6 16.2%
Jul-12 2020 93.1 102.0 17.0%
Jul-19 2020 95.2 105.4 17.1%
Jul-26 2020 96.6 109.2 16.9%
Aug-02 2020 100.4 112.3 16.4%
Aug-09 2020 86.8 101.8 16.9%
# SUBPRIME AUTO ACCOUNTS ORIGINATED
(THOUSANDS)
WEEKEND CURR YR PREV YR % TOTAL
Aug-16 2020 90.3 105.2 16.5%
Aug-23 2020 93.8 108.0 16.4%
Aug-30 2020 95.5 117.7 15.8%
Sep-06 2020 89.9 90.8 15.6%
Sep-13 2020 80.1 99.7 15.8%
Sep-20 2020 88.4 103.7 16.3%
Sep-27 2020 90.7 108.8 15.9%
Oct-04 2020 90.8 104.3 15.9%
Oct-11 2020 82.2 97.4 16.4%
Oct-18 2020 83.1 99.1 16.3%
Oct-25 2020 86.7 102.5 16.3%
Nov-01 2020 90.6 105.8 16.0%
# SUBPRIME AUTO ACCOUNTS ORIGINATED
(THOUSANDS)
WEEKEND CURR YR PREV YR % TOTAL
Nov-08 2020 76.1 96.3 16.6%
Nov-15 2020 80.7 98.0 16.5%
Nov-22 2020 86.2 106.8 16.6%
Nov-29 2020 75.4 98.0 15.1%
Dec-06 2020 80.3 91.7 16.0%
Dec-13 2020 79.2 94.1 15.8%
Dec-20 2020 74.5 94.7 15.3%
Dec-27 2020 57.2 80.0 13.9%
Jan-03 2021 75.0 52.8 13.3%
Jan-10 2021 80.4 89.1 17.4%
Jan-17 2021 79.8 94.2 17.7%
Jan-24 2021 76.9 97.2 16.9%
# SUBPRIME AUTO ACCOUNTS ORIGINATED
(THOUSANDS)
WEEKEND CURR YR PREV YR % TOTAL
Jan-31 2021 82.1 177.3 16.8%
Feb-07 2021 61.1 95.8 16.2%
Feb-14 2021 57.8 102.3 15.5%
Feb-21 2021 45.6 107.8 14.3%
Feb-28 2021 45.4 153.0 15.9%
Mar-07 2021 6.3 144.4 13.4%
Mar-14 2021 1.6 126.0 9.5%
# SUBPRIME AUTO ACCOUNTS ORIGINATED
(THOUSANDS)

12 PROPRIETARY |
Originations through March 14, 2021 reported as of March 16, 2021
533
539
545
551
557
563
569
575
581
0
22
44
67
89
111
133
155
178Ja
n-06
201
9
Apr-0
7 20
19
Jul-0
7 20
19
Oct-0
6 20
19
Jan-
05 2
020
Apr-0
5 20
20
Jul-0
5 20
20
Oct-0
4 20
20
Mar
-14
2021
Thou
sand
s
New Trades FICO® Auto Score 8
Subprime Auto Originations: Accounts Number of Accounts in Thousands; NSA. Subprime Accounts, Average FICO® Auto Score 8 Subprime accounts defined as those with borrower’s origination FICO® Auto Score 8 less than 620
Source: Equifax Inc.
Auto: Total
WEEKEND CURR YR PREV YR % TOTAL
Mar-01 2020 125.5 143.9 22.2%
Mar-08 2020 123.8 112.1 21.7%
Mar-15 2020 105.7 106.2 19.7%
Mar-22 2020 76.3 104.7 18.6%
Mar-29 2020 53.2 110.0 17.5%
Apr-05 2020 48.9 94.5 17.4%
Apr-12 2020 46.6 92.6 16.9%
Apr-19 2020 66.2 89.7 18.3%
Apr-26 2020 70.2 92.5 16.5%
May-03 2020 79.0 93.8 16.0%
May-10 2020 76.6 86.7 16.2%
May-17 2020 80.5 89.4 15.4%
# SUBPRIME AUTO ACCOUNTS ORIGINATED
(THOUSANDS)
WEEKEND CURR YR PREV YR % TOTAL
May-24 2020 85.2 91.8 14.5%
May-31 2020 85.7 91.8 13.4%
Jun-07 2020 81.9 86.4 15.3%
Jun-14 2020 86.4 89.0 15.0%
Jun-21 2020 85.5 88.9 14.4%
Jun-28 2020 85.3 97.8 13.8%
Jul-05 2020 80.2 81.3 13.9%
Jul-12 2020 82.4 88.7 15.1%
Jul-19 2020 82.5 90.1 14.8%
Jul-26 2020 82.2 91.7 14.4%
Aug-02 2020 85.0 96.2 13.8%
Aug-09 2020 77.1 89.1 15.0%
# SUBPRIME AUTO ACCOUNTS ORIGINATED
(THOUSANDS)
WEEKEND CURR YR PREV YR % TOTAL
Aug-16 2020 78.8 90.7 14.4%
Aug-23 2020 79.7 90.7 14.0%
Aug-30 2020 79.6 98.1 13.2%
Sep-06 2020 81.7 79.2 14.2%
Sep-13 2020 72.9 85.9 14.4%
Sep-20 2020 78.6 86.8 14.5%
Sep-27 2020 79.4 90.2 13.9%
Oct-04 2020 80.4 91.6 14.1%
Oct-11 2020 74.6 85.4 14.9%
Oct-18 2020 73.5 84.6 14.4%
Oct-25 2020 75.3 86.6 14.2%
Nov-01 2020 77.9 90.3 13.7%
# SUBPRIME AUTO ACCOUNTS ORIGINATED
(THOUSANDS)
WEEKEND CURR YR PREV YR % TOTAL
Nov-08 2020 69.3 85.0 15.1%
Nov-15 2020 72.2 83.9 14.7%
Nov-22 2020 75.9 90.6 14.6%
Nov-29 2020 65.2 81.6 13.1%
Dec-06 2020 73.4 81.2 14.7%
Dec-13 2020 71.9 81.8 14.4%
Dec-20 2020 66.6 80.4 13.7%
Dec-27 2020 49.9 66.3 12.1%
Jan-03 2021 64.8 46.7 11.4%
Jan-10 2021 71.4 78.3 15.4%
Jan-17 2021 70.2 81.0 15.5%
Jan-24 2021 66.5 81.9 14.7%
# SUBPRIME AUTO ACCOUNTS ORIGINATED
(THOUSANDS)
WEEKEND CURR YR PREV YR % TOTAL
Jan-31 2021 70.7 148.0 14.5%
Feb-07 2021 54.9 80.1 14.6%
Feb-14 2021 50.1 84.1 13.4%
Feb-21 2021 38.6 88.1 12.1%
Feb-28 2021 38.1 125.5 13.4%
Mar-07 2021 5.5 123.8 11.7%
Mar-14 2021 1.3 105.7 7.8%
# SUBPRIME AUTO ACCOUNTS ORIGINATED
(THOUSANDS)

13 PROPRIETARY |
Originations through March 14, 2021 reported as of March 16, 2021
537
543
549
555
561
567
573
579
585
0
506
1,013
1,519
2,025
2,531
3,038
3,544
4,050Ja
n-06
201
9
Apr-0
7 20
19
Jul-0
7 20
19
Oct-0
6 20
19
Jan-
05 2
020
Apr-0
5 20
20
Jul-0
5 20
20
Oct-0
4 20
20
Mar
-14
2021
Mill
ions
New Trades VS® 3.0
Subprime Auto Originations: Balances Total Balances Originated in $Millions; NSA. Subprime Accounts, Average VantageScore® 3.0 Subprime accounts defined as those with borrower’s origination VantageScore® 3.0 less than 620
Source: Equifax Inc.
Auto: Total
WEEKEND CURR YR PREV YR % TOTAL
Mar-01 2020 $2,711.5 $3,035.3 21.7%
Mar-08 2020 $2,588.7 $2,423.7 20.4%
Mar-15 2020 $2,349.1 $2,405.3 19.4%
Mar-22 2020 $1,822.0 $2,420.8 18.6%
Mar-29 2020 $1,398.6 $2,647.1 17.5%
Apr-05 2020 $1,225.1 $1,954.7 16.5%
Apr-12 2020 $1,134.9 $2,006.5 15.8%
Apr-19 2020 $1,575.5 $2,018.7 17.1%
Apr-26 2020 $1,695.1 $2,139.2 15.7%
May-03 2020 $1,868.2 $2,060.6 15.1%
May-10 2020 $1,722.6 $1,864.5 14.9%
May-17 2020 $1,873.0 $1,976.7 14.7%
TOTAL SUBPRIME AUTO BALANCES
ORIGINATED (MILLIONS)
WEEKEND CURR YR PREV YR % TOTAL
May-24 2020 $2,050.8 $2,113.9 14.3%
May-31 2020 $2,148.7 $2,153.9 13.5%
Jun-07 2020 $1,735.2 $1,824.7 13.7%
Jun-14 2020 $1,907.1 $1,929.0 13.9%
Jun-21 2020 $1,931.6 $2,007.8 13.6%
Jun-28 2020 $2,005.9 $2,286.2 13.4%
Jul-05 2020 $1,816.5 $1,776.6 13.0%
Jul-12 2020 $1,787.7 $1,946.1 13.7%
Jul-19 2020 $1,851.2 $2,023.1 13.9%
Jul-26 2020 $1,904.3 $2,111.1 13.8%
Aug-02 2020 $2,017.3 $2,172.5 13.5%
Aug-09 2020 $1,711.9 $1,934.5 13.7%
TOTAL SUBPRIME AUTO BALANCES
ORIGINATED (MILLIONS)
WEEKEND CURR YR PREV YR % TOTAL
Aug-16 2020 $1,812.1 $2,020.2 13.6%
Aug-23 2020 $1,900.3 $2,101.7 13.6%
Aug-30 2020 $1,972.1 $2,339.1 13.2%
Sep-06 2020 $1,839.5 $1,772.8 12.9%
Sep-13 2020 $1,662.0 $1,918.9 13.0%
Sep-20 2020 $1,812.6 $2,009.2 13.4%
Sep-27 2020 $1,882.5 $2,138.6 13.1%
Oct-04 2020 $1,873.5 $2,008.0 13.0%
Oct-11 2020 $1,673.4 $1,871.7 13.3%
Oct-18 2020 $1,713.9 $1,922.4 13.3%
Oct-25 2020 $1,785.2 $1,987.4 13.3%
Nov-01 2020 $1,885.6 $2,042.5 13.1%
TOTAL SUBPRIME AUTO BALANCES
ORIGINATED (MILLIONS)
WEEKEND CURR YR PREV YR % TOTAL
Nov-08 2020 $1,532.0 $1,829.3 13.3%
Nov-15 2020 $1,652.6 $1,884.9 13.3%
Nov-22 2020 $1,725.0 $2,011.1 13.1%
Nov-29 2020 $1,575.3 $1,933.2 12.2%
Dec-06 2020 $1,635.8 $1,724.8 12.7%
Dec-13 2020 $1,616.1 $1,778.6 12.4%
Dec-20 2020 $1,515.1 $1,816.1 11.9%
Dec-27 2020 $1,201.0 $1,600.7 10.9%
Jan-03 2021 $1,595.9 $1,033.2 10.5%
Jan-10 2021 $1,574.0 $1,684.4 13.6%
Jan-17 2021 $1,573.4 $1,787.4 14.0%
Jan-24 2021 $1,554.6 $1,871.6 13.6%
TOTAL SUBPRIME AUTO BALANCES
ORIGINATED (MILLIONS)
WEEKEND CURR YR PREV YR % TOTAL
Jan-31 2021 $1,684.4 $3,375.1 13.7%
Feb-07 2021 $1,266.0 $1,812.1 13.3%
Feb-14 2021 $1,219.0 $1,976.3 12.8%
Feb-21 2021 $969.1 $2,107.8 12.0%
Feb-28 2021 $905.4 $2,711.5 13.0%
Mar-07 2021 $141.3 $2,588.7 11.8%
Mar-14 2021 $39.0 $2,349.1 9.3%
TOTAL SUBPRIME AUTO BALANCES
ORIGINATED (MILLIONS)
14 PROPRIETARY |
Originations through March 14, 2021 reported as of March 16, 2021
533
539
545
551
557
563
569
575
581
0
415
831
1,246
1,661
2,076
2,492
2,907
3,322Ja
n-06
201
9
Apr-0
7 20
19
Jul-0
7 20
19
Oct-0
6 20
19
Jan-
05 2
020
Apr-0
5 20
20
Jul-0
5 20
20
Oct-0
4 20
20
Mar
-14
2021
Mill
ions
New Trades FICO® Auto Score 8
Subprime Auto Originations: Balances Total Balances Originated in $Millions; NSA. Subprime Accounts, Average FICO® Auto Score 8 Subprime accounts defined as those with borrower’s origination FICO® Auto Score 8 less than 620
Source: Equifax Inc.
Auto: Total
WEEKEND CURR YR PREV YR % TOTAL
Mar-01 2020 $2,184.8 $2,452.7 17.5%
Mar-08 2020 $2,211.6 $1,946.2 17.5%
Mar-15 2020 $1,944.6 $1,900.8 16.0%
Mar-22 2020 $1,453.2 $1,903.4 14.8%
Mar-29 2020 $1,063.6 $2,054.9 13.3%
Apr-05 2020 $987.1 $1,719.5 13.3%
Apr-12 2020 $938.8 $1,709.6 13.1%
Apr-19 2020 $1,269.2 $1,665.7 13.8%
Apr-26 2020 $1,326.6 $1,724.5 12.3%
May-03 2020 $1,479.2 $1,745.0 11.9%
May-10 2020 $1,430.3 $1,611.6 12.4%
May-17 2020 $1,509.4 $1,672.3 11.9%
TOTAL SUBPRIME AUTO BALANCES
ORIGINATED (MILLIONS)
WEEKEND CURR YR PREV YR % TOTAL
May-24 2020 $1,587.6 $1,718.2 11.1%
May-31 2020 $1,642.8 $1,769.4 10.3%
Jun-07 2020 $1,525.9 $1,604.6 12.0%
Jun-14 2020 $1,619.2 $1,663.6 11.8%
Jun-21 2020 $1,595.4 $1,672.3 11.2%
Jun-28 2020 $1,612.7 $1,856.6 10.8%
Jul-05 2020 $1,536.4 $1,560.0 11.0%
Jul-12 2020 $1,567.8 $1,671.5 12.0%
Jul-19 2020 $1,579.6 $1,697.3 11.8%
Jul-26 2020 $1,578.4 $1,726.4 11.4%
Aug-02 2020 $1,664.3 $1,823.1 11.1%
Aug-09 2020 $1,507.1 $1,673.6 12.1%
TOTAL SUBPRIME AUTO BALANCES ORIGINATED
(MILLIONS)
WEEKEND CURR YR PREV YR % TOTAL
Aug-16 2020 $1,557.8 $1,711.2 11.7%
Aug-23 2020 $1,574.9 $1,724.2 11.3%
Aug-30 2020 $1,590.6 $1,898.1 10.6%
Sep-06 2020 $1,654.0 $1,521.7 11.6%
Sep-13 2020 $1,490.7 $1,622.2 11.7%
Sep-20 2020 $1,582.0 $1,639.1 11.7%
Sep-27 2020 $1,602.8 $1,724.0 11.1%
Oct-04 2020 $1,624.8 $1,738.3 11.3%
Oct-11 2020 $1,500.3 $1,614.8 12.0%
Oct-18 2020 $1,489.0 $1,617.7 11.6%
Oct-25 2020 $1,506.8 $1,639.1 11.3%
Nov-01 2020 $1,577.0 $1,708.6 11.0%
TOTAL SUBPRIME AUTO BALANCES
ORIGINATED (MILLIONS)
WEEKEND CURR YR PREV YR % TOTAL
Nov-08 2020 $1,380.0 $1,594.9 12.0%
Nov-15 2020 $1,455.0 $1,584.9 11.7%
Nov-22 2020 $1,478.3 $1,649.3 11.2%
Nov-29 2020 $1,316.2 $1,562.5 10.2%
Dec-06 2020 $1,484.9 $1,506.9 11.5%
Dec-13 2020 $1,447.2 $1,511.7 11.1%
Dec-20 2020 $1,327.0 $1,494.0 10.4%
Dec-27 2020 $1,016.4 $1,287.2 9.2%
Jan-03 2021 $1,343.2 $904.1 8.9%
Jan-10 2021 $1,384.7 $1,459.1 12.0%
Jan-17 2021 $1,365.1 $1,512.9 12.1%
Jan-24 2021 $1,314.8 $1,542.9 11.5%
TOTAL SUBPRIME AUTO BALANCES
ORIGINATED (MILLIONS)
WEEKEND CURR YR PREV YR % TOTAL
Jan-31 2021 $1,409.9 $2,768.5 11.4%
Feb-07 2021 $1,117.6 $1,484.7 11.7%
Feb-14 2021 $1,027.6 $1,583.1 10.8%
Feb-21 2021 $791.0 $1,678.0 9.8%
Feb-28 2021 $727.3 $2,184.8 10.5%
Mar-07 2021 $122.6 $2,211.6 10.2%
Mar-14 2021 $31.6 $1,944.6 7.5%
TOTAL SUBPRIME AUTO BALANCES
ORIGINATED (MILLIONS)

15 PROPRIETARY |
Originations through March 14, 2021 reported as of March 16, 2021
$0
$5,000
$10,000
$15,000
$20,000
$25,000
$30,000
Jan-
07 20
18
Apr-0
8 20
18
Jul-0
8 201
8
Oct-0
7 201
8
Jan-
06 20
19
Apr-0
7 20
19
Jul-0
7 201
9
Oct-0
6 201
9
Jan-
05 20
20
Apr-0
5 20
20
Jul-0
5 202
0
Oct-0
4 202
0
Mar
-14 2
021
Auto Origination Loan Amount Subprime Auto Origination Loan Amount
Auto Average Origination Balance Average Origination Balance Over Time; NSA Subprime accounts defined as those with borrower’s origination VantageScore® 3.0 less than 620
Source: Equifax Inc.
Auto: Total

16 PROPRIETARY |
Originations through March 14, 2021 reported as of March 16, 2021
$0
$5,000
$10,000
$15,000
$20,000
$25,000
$30,000
Jan-
07 20
18
Apr-0
8 20
18
Jul-0
8 201
8
Oct-0
7 201
8
Jan-
06 20
19
Apr-0
7 20
19
Jul-0
7 201
9
Oct-0
6 201
9
Jan-
05 20
20
Apr-0
5 20
20
Jul-0
5 202
0
Oct-0
4 202
0
Mar
-14 2
021
Auto Origination Loan Amount Subprime Auto Origination Loan Amount
Auto Average Origination Balance Average Origination Balance Over Time; NSA Subprime accounts defined as those with borrower’s origination FICO® Auto Score 8 less than 620
Source: Equifax Inc.
Auto: Total
17 PROPRIETARY |
Originations through March 14, 2021 reported as of March 16, 2021
0%
3%
7%
10%
14%
17%
20%
24%
$0
$2,509
$5,017
$7,526
$10,035
$12,543
$15,052
$17,561M
ar-0
1 202
0
Mar
-08 2
020
Mar
-15 2
020
Mar
-22 2
020
Mar
-29 2
020
Apr-0
5 20
20
Apr-1
2 20
20
Apr-1
9 20
20
Apr-2
6 20
20
May
-03
2020
May
-10
2020
May
-17
2020
May
-24
2020
May
-31
2020
Jun-
07 2
020
Jun-
14 2
020
Jun-
21 2
020
Jun-
28 2
020
Jul-0
5 20
20
Jul-1
2 20
20
Jul-1
9 20
20
Jul-2
6 20
20
Aug-
02 2
020
Aug-
09 2
020
Aug-
16 2
020
Aug-
23 2
020
Aug-
30 2
020
Sep-
06 20
20
Sep-
13 20
20
Sep-
20 20
20
Sep-
27 20
20
Oct-0
4 20
20
Oct-1
1 20
20
Oct-1
8 20
20
Oct-2
5 20
20
Nov-
01 2
020
Nov-
08 2
020
Nov-
15 2
020
Nov-
22 2
020
Nov-
29 2
020
Dec-0
6 20
20
Dec-1
3 20
20
Dec-2
0 20
20
Dec-2
7 20
20
Jan-
03 2
021
Jan-
10 2
021
Jan-
17 2
021
Jan-
24 2
021
Jan-
31 2
021
Feb-
07 20
21
Feb-
14 20
21
Feb-
21 20
21
Feb-
28 20
21
Mar
-07 2
021
Mar
-14 2
021
Subp
rime S
hare
Milli
ons
Auto Origination Auto Origination Subprime Share
Auto Originations Total Originations in $Millions; NSA Subprime accounts defined as those with borrower’s origination VantageScore® 3.0 less than 620
Source: Equifax Inc.
Auto: Total

18 PROPRIETARY |
Originations through March 14, 2021 reported as of March 16, 2021
0%
3%
5%
8%
11%
14%
16%
19%
$0
$2,509
$5,017
$7,526
$10,035
$12,543
$15,052
$17,561M
ar-0
1 202
0
Mar
-08 2
020
Mar
-15 2
020
Mar
-22 2
020
Mar
-29 2
020
Apr-0
5 20
20
Apr-1
2 20
20
Apr-1
9 20
20
Apr-2
6 20
20
May
-03
2020
May
-10
2020
May
-17
2020
May
-24
2020
May
-31
2020
Jun-
07 2
020
Jun-
14 2
020
Jun-
21 2
020
Jun-
28 2
020
Jul-0
5 20
20
Jul-1
2 20
20
Jul-1
9 20
20
Jul-2
6 20
20
Aug-
02 2
020
Aug-
09 2
020
Aug-
16 2
020
Aug-
23 2
020
Aug-
30 2
020
Sep-
06 20
20
Sep-
13 20
20
Sep-
20 20
20
Sep-
27 20
20
Oct-0
4 20
20
Oct-1
1 20
20
Oct-1
8 20
20
Oct-2
5 20
20
Nov-
01 2
020
Nov-
08 2
020
Nov-
15 2
020
Nov-
22 2
020
Nov-
29 2
020
Dec-0
6 20
20
Dec-1
3 20
20
Dec-2
0 20
20
Dec-2
7 20
20
Jan-
03 2
021
Jan-
10 2
021
Jan-
17 2
021
Jan-
24 2
021
Jan-
31 2
021
Feb-
07 20
21
Feb-
14 20
21
Feb-
21 20
21
Feb-
28 20
21
Mar
-07 2
021
Mar
-14 2
021
Subp
rime S
hare
Milli
ons
Auto Origination Auto Origination Subprime Share
Auto Originations Total Originations in $Millions; NSA Subprime accounts defined as those with borrower’s origination FICO® Auto Score 8 less than 620
Source: Equifax Inc.
Auto: Total

19 PROPRIETARY |
Originations through March 14, 2021 reported as of March 16, 2021
667
675
683
691
699
707
715
723
731
739
747
0%
10%
20%
30%
40%
50%
60%
70%
80%
90%
100%
Mar
-01 2
020
Mar
-08 2
020
Mar
-15 2
020
Mar
-22 2
020
Mar
-29 2
020
Apr-0
5 20
20
Apr-1
2 20
20
Apr-1
9 20
20
Apr-2
6 20
20
May
-03
2020
May
-10
2020
May
-17
2020
May
-24
2020
May
-31
2020
Jun-
07 2
020
Jun-
14 2
020
Jun-
21 2
020
Jun-
28 2
020
Jul-0
5 20
20
Jul-1
2 20
20
Jul-1
9 20
20
Jul-2
6 20
20
Aug-
02 2
020
Aug-
09 2
020
Aug-
16 2
020
Aug-
23 2
020
Aug-
30 2
020
Sep-
06 20
20
Sep-
13 20
20
Sep-
20 20
20
Sep-
27 20
20
Oct-0
4 20
20
Oct-1
1 20
20
Oct-1
8 20
20
Oct-2
5 20
20
Nov-
01 2
020
Nov-
08 2
020
Nov-
15 2
020
Nov-
22 2
020
Nov-
29 2
020
Dec-0
6 20
20
Dec-1
3 20
20
Dec-2
0 20
20
Dec-2
7 20
20
Jan-
03 2
021
Jan-
10 2
021
Jan-
17 2
021
Jan-
24 2
021
Jan-
31 2
021
Feb-
07 20
21
Feb-
14 20
21
Feb-
21 20
21
Feb-
28 20
21
Mar
-07 2
021
Mar
-14 2
021
300-539 540-579 580-619 620-659 660-699 700-739 740-779 780-850 no score Avg. VS® 3.0
Auto Origination Risk VantageScore® 3.0 Distribution for Auto Originations by Week (% of Accounts)
Source: Equifax Inc.
Auto: Total
The last 8 weeks of weekly data is subject to revision due to reporting lags by data furnishers.

20 PROPRIETARY |
Originations through March 14, 2021 reported as of March 16, 2021
684
692
700
708
716
724
732
740
748
756
764
0%
10%
20%
30%
40%
50%
60%
70%
80%
90%
100%
Mar
-01 2
020
Mar
-08 2
020
Mar
-15 2
020
Mar
-22 2
020
Mar
-29 2
020
Apr-0
5 20
20
Apr-1
2 20
20
Apr-1
9 20
20
Apr-2
6 20
20
May
-03
2020
May
-10
2020
May
-17
2020
May
-24
2020
May
-31
2020
Jun-
07 2
020
Jun-
14 2
020
Jun-
21 2
020
Jun-
28 2
020
Jul-0
5 20
20
Jul-1
2 20
20
Jul-1
9 20
20
Jul-2
6 20
20
Aug-
02 2
020
Aug-
09 2
020
Aug-
16 2
020
Aug-
23 2
020
Aug-
30 2
020
Sep-
06 20
20
Sep-
13 20
20
Sep-
20 20
20
Sep-
27 20
20
Oct-0
4 20
20
Oct-1
1 20
20
Oct-1
8 20
20
Oct-2
5 20
20
Nov-
01 2
020
Nov-
08 2
020
Nov-
15 2
020
Nov-
22 2
020
Nov-
29 2
020
Dec-0
6 20
20
Dec-1
3 20
20
Dec-2
0 20
20
Dec-2
7 20
20
Jan-
03 2
021
Jan-
10 2
021
Jan-
17 2
021
Jan-
24 2
021
Jan-
31 2
021
Feb-
07 20
21
Feb-
14 20
21
Feb-
21 20
21
Feb-
28 20
21
Mar
-07 2
021
Mar
-14 2
021
250-539 540-579 580-619 620-659 660-699 700-739 740-779 780-900 no score Avg. FICO® Auto Score 8
Auto Origination Risk FICO® Auto Score 8 Distribution for Auto Originations by Week (% of Accounts)
Source: Equifax Inc.
Auto: Total
The last 8 weeks of weekly data is subject to revision due to reporting lags by data furnishers.

21 PROPRIETARY |
Credit Trends Originations: Auto Leases

22 PROPRIETARY |
Originations through March 14, 2021 reported as of March 16, 2021
Auto Lease Originations Observations Originations Estimates through March 14, 2021 reported as of March 16, 2021
Auto: Lease
• 7,300 auto leases, totaling $115.2 million, have been originated the week ending March 14th.
• Auto leases accounted for 44.1% of all auto accounts and 27.4% of all auto balances in the week ending March 14th.
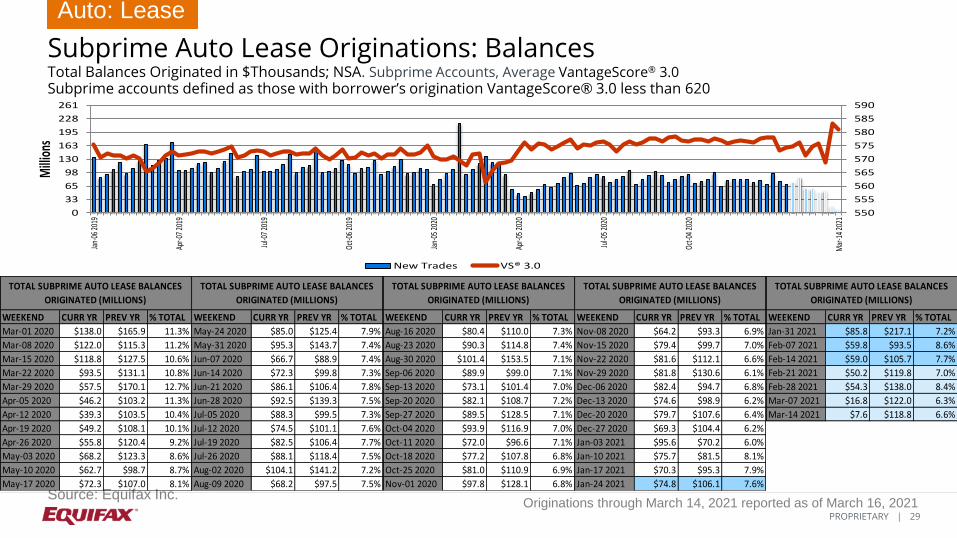
• Approximately 500 auto leases have been originated in the week ending March 14th to consumers with a VantageScore® 3.0 credit score below 620. These are generally considered subprime accounts. These newly-issued leases have a corresponding total balance of $7.6 million.
• In the week ending March 14th, 6.4% of auto lease accounts and 6.6% of total balances were issued to consumers with a VantageScore® 3.0 subprime credit score.
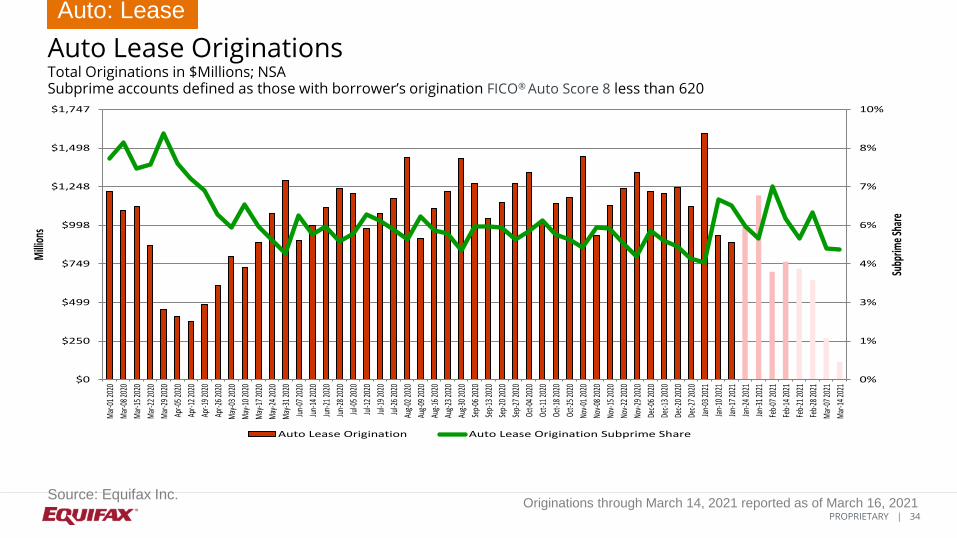
• Approximately 300 auto leases have been originated in the week ending March 14th to consumers with a FICO® Auto 8 credit score below 620. These are generally considered subprime accounts. These newly-issued leases have a corresponding total balance of $5.3 million.
• In the week ending March 14th, 4.6% of auto lease accounts and 4.6% of total balances were issued to consumers with a FICO® Auto 8 subprime credit score.
• The average origination balance for all auto leases issued in the week ending March 14th was $15,836. The average subprime lease amount was $16,160.
• Note that lease origination values reflect the contract amounts only and exclude expected vehicle residual values.

23 PROPRIETARY |
Originations through March 14, 2021 reported as of March 16, 2021
707
713
719
725
731
737
743
749
755
0
20
40
60
80
100
119
139
159Ja
n-06
201
9
Apr-0
7 20
19
Jul-0
7 20
19
Oct-0
6 20
19
Jan-
05 2
020
Apr-0
5 20
20
Jul-0
5 20
20
Oct-0
4 20
20
Mar
-14
2021
Thou
sand
s
New Trades VS® 3.0
Auto Lease Originations: Accounts Number of Accounts in Thousands; NSA. Average VantageScore® 3.0
Source: Equifax Inc.
Auto: Lease
WEEKEND CURR YR PREV YR
Mar-01 2020 70.0 91.6
Mar-08 2020 62.4 60.8
Mar-15 2020 63.6 74.4
Mar-22 2020 49.9 81.2
Mar-29 2020 24.9 111.1
Apr-05 2020 22.0 62.6
Apr-12 2020 20.6 62.7
Apr-19 2020 27.0 69.3
Apr-26 2020 34.2 81.4
May-03 2020 45.2 83.9
May-10 2020 41.3 64.8
May-17 2020 51.2 74.1
# AUTO LEASE ACCOUNTS
ORIGINATED (THOUSANDS)
WEEKEND CURR YR PREV YR
May-24 2020 62.6 92.9
May-31 2020 75.1 112.3
Jun-07 2020 51.5 56.5
Jun-14 2020 56.4 66.6
Jun-21 2020 63.3 74.4
Jun-28 2020 71.0 104.5
Jul-05 2020 69.4 71.1
Jul-12 2020 56.0 67.3
Jul-19 2020 60.8 72.5
Jul-26 2020 66.8 82.9
Aug-02 2020 82.4 97.6
Aug-09 2020 51.5 65.9
# AUTO LEASE ACCOUNTS
ORIGINATED (THOUSANDS)
WEEKEND CURR YR PREV YR
Aug-16 2020 63.5 76.9
Aug-23 2020 70.0 82.7
Aug-30 2020 83.3 117.1
Sep-06 2020 74.0 68.4
Sep-13 2020 60.7 63.1
Sep-20 2020 65.2 69.0
Sep-27 2020 72.8 86.1
Oct-04 2020 76.9 74.4
Oct-11 2020 57.1 62.9
Oct-18 2020 63.8 69.8
Oct-25 2020 66.1 75.0
Nov-01 2020 80.8 90.2
# AUTO LEASE ACCOUNTS
ORIGINATED (THOUSANDS)
WEEKEND CURR YR PREV YR
Nov-08 2020 51.5 58.8
Nov-15 2020 62.1 68.8
Nov-22 2020 68.3 76.2
Nov-29 2020 75.6 100.0
Dec-06 2020 67.7 62.7
Dec-13 2020 66.9 68.7
Dec-20 2020 68.1 77.4
Dec-27 2020 61.1 83.4
Jan-03 2021 90.5 49.5
Jan-10 2021 52.7 50.7
Jan-17 2021 48.5 56.8
Jan-24 2021 55.2 66.0
# AUTO LEASE ACCOUNTS
ORIGINATED (THOUSANDS)
WEEKEND CURR YR PREV YR
Jan-31 2021 66.7 132.6
Feb-07 2021 39.3 50.0
Feb-14 2021 42.7 63.7
Feb-21 2021 41.8 76.7
Feb-28 2021 38.3 70.0
Mar-07 2021 16.4 62.4
Mar-14 2021 7.3 63.6
# AUTO LEASE ACCOUNTS
ORIGINATED (THOUSANDS)

24 PROPRIETARY |
Originations through March 14, 2021 reported as of March 16, 2021
729
735
741
747
753
759
765
771
777
0
20
40
60
80
100
119
139
159Ja
n-06
201
9
Apr-0
7 20
19
Jul-0
7 20
19
Oct-0
6 20
19
Jan-
05 2
020
Apr-0
5 20
20
Jul-0
5 20
20
Oct-0
4 20
20
Mar
-14
2021
Thou
sand
s
New Trades FICO® Auto Score 8
Auto Lease Originations: Accounts Number of Accounts in Thousands; NSA. Average FICO® Auto Score 8
Source: Equifax Inc.
Auto: Lease
WEEKEND CURR YR PREV YR
Mar-01 2020 70.0 91.6
Mar-08 2020 62.4 60.8
Mar-15 2020 63.6 74.4
Mar-22 2020 49.9 81.2
Mar-29 2020 24.9 111.1
Apr-05 2020 22.0 62.6
Apr-12 2020 20.6 62.7
Apr-19 2020 27.0 69.3
Apr-26 2020 34.2 81.4
May-03 2020 45.2 83.9
May-10 2020 41.3 64.8
May-17 2020 51.2 74.1
# AUTO LEASE ACCOUNTS
ORIGINATED (THOUSANDS)
WEEKEND CURR YR PREV YR
May-24 2020 62.6 92.9
May-31 2020 75.1 112.3
Jun-07 2020 51.5 56.5
Jun-14 2020 56.4 66.6
Jun-21 2020 63.3 74.4
Jun-28 2020 71.0 104.5
Jul-05 2020 69.4 71.1
Jul-12 2020 56.0 67.3
Jul-19 2020 60.8 72.5
Jul-26 2020 66.8 82.9
Aug-02 2020 82.4 97.6
Aug-09 2020 51.5 65.9
# AUTO LEASE ACCOUNTS
ORIGINATED (THOUSANDS)
WEEKEND CURR YR PREV YR
Aug-16 2020 63.5 76.9
Aug-23 2020 70.0 82.7
Aug-30 2020 83.3 117.1
Sep-06 2020 74.0 68.4
Sep-13 2020 60.7 63.1
Sep-20 2020 65.2 69.0
Sep-27 2020 72.8 86.1
Oct-04 2020 76.9 74.4
Oct-11 2020 57.1 62.9
Oct-18 2020 63.8 69.8
Oct-25 2020 66.1 75.0
Nov-01 2020 80.8 90.2
# AUTO LEASE ACCOUNTS
ORIGINATED (THOUSANDS)
WEEKEND CURR YR PREV YR
Nov-08 2020 51.5 58.8
Nov-15 2020 62.1 68.8
Nov-22 2020 68.3 76.2
Nov-29 2020 75.6 100.0
Dec-06 2020 67.7 62.7
Dec-13 2020 66.9 68.7
Dec-20 2020 68.1 77.4
Dec-27 2020 61.1 83.4
Jan-03 2021 90.5 49.5
Jan-10 2021 52.7 50.7
Jan-17 2021 48.5 56.8
Jan-24 2021 55.2 66.0
# AUTO LEASE ACCOUNTS
ORIGINATED (THOUSANDS)
WEEKEND CURR YR PREV YR
Jan-31 2021 66.7 132.6
Feb-07 2021 39.3 50.0
Feb-14 2021 42.7 63.7
Feb-21 2021 41.8 76.7
Feb-28 2021 38.3 70.0
Mar-07 2021 16.4 62.4
Mar-14 2021 7.3 63.6
# AUTO LEASE ACCOUNTS
ORIGINATED (THOUSANDS)

25 PROPRIETARY |
Originations through March 14, 2021 reported as of March 16, 2021
707
713
719
725
731
737
743
749
755
0
351
702
1,053
1,404
1,755
2,106
2,457
2,808
Jan-
06 2
019
Apr-0
7 20
19
Jul-0
7 20
19
Oct-0
6 20
19
Jan-
05 2
020
Apr-0
5 20
20
Jul-0
5 20
20
Oct-0
4 20
20
Mar
-14
2021
Mill
ions
New Trades VS® 3.0
Auto Lease Originations: Balances Total Balances Originated in $Millions; NSA. Average VantageScore® 3.0
Source: Equifax Inc.
Auto: Lease
WEEKEND CURR YR PREV YR
Mar-01 2020 $1,219.5 $1,522.9
Mar-08 2020 $1,091.9 $1,025.5
Mar-15 2020 $1,116.6 $1,241.7
Mar-22 2020 $866.5 $1,346.6
Mar-29 2020 $453.4 $1,852.8
Apr-05 2020 $409.8 $1,060.9
Apr-12 2020 $378.2 $1,057.2
Apr-19 2020 $488.5 $1,165.4
Apr-26 2020 $607.9 $1,367.3
May-03 2020 $794.0 $1,391.1
May-10 2020 $722.6 $1,072.4
May-17 2020 $886.8 $1,220.2
TOTAL AUTO LEASE BALANCES
ORIGINATED (MILLIONS)
WEEKEND CURR YR PREV YR
May-24 2020 $1,072.8 $1,495.3
May-31 2020 $1,289.4 $1,792.6
Jun-07 2020 $899.2 $944.0
Jun-14 2020 $995.9 $1,104.9
Jun-21 2020 $1,109.7 $1,239.8
Jun-28 2020 $1,235.9 $1,720.8
Jul-05 2020 $1,203.3 $1,137.9
Jul-12 2020 $979.2 $1,107.0
Jul-19 2020 $1,077.0 $1,200.7
Jul-26 2020 $1,167.9 $1,383.4
Aug-02 2020 $1,436.2 $1,640.3
Aug-09 2020 $911.5 $1,119.6
TOTAL AUTO LEASE BALANCES
ORIGINATED (MILLIONS)
WEEKEND CURR YR PREV YR
Aug-16 2020 $1,103.5 $1,291.7
Aug-23 2020 $1,215.7 $1,390.4
Aug-30 2020 $1,431.2 $1,944.2
Sep-06 2020 $1,266.3 $1,150.4
Sep-13 2020 $1,042.9 $1,097.5
Sep-20 2020 $1,147.4 $1,195.9
Sep-27 2020 $1,269.4 $1,489.6
Oct-04 2020 $1,343.0 $1,300.0
Oct-11 2020 $1,009.9 $1,096.5
Oct-18 2020 $1,140.5 $1,212.7
Oct-25 2020 $1,178.5 $1,307.0
Nov-01 2020 $1,440.3 $1,561.7
TOTAL AUTO LEASE BALANCES
ORIGINATED (MILLIONS)
WEEKEND CURR YR PREV YR
Nov-08 2020 $930.4 $1,048.7
Nov-15 2020 $1,127.6 $1,226.2
Nov-22 2020 $1,233.6 $1,347.3
Nov-29 2020 $1,337.4 $1,726.1
Dec-06 2020 $1,216.9 $1,104.5
Dec-13 2020 $1,206.0 $1,212.2
Dec-20 2020 $1,241.1 $1,374.1
Dec-27 2020 $1,116.5 $1,415.7
Jan-03 2021 $1,588.3 $831.6
Jan-10 2021 $932.6 $885.8
Jan-17 2021 $884.5 $1,010.6
Jan-24 2021 $989.2 $1,165.0
TOTAL AUTO LEASE BALANCES
ORIGINATED (MILLIONS)
WEEKEND CURR YR PREV YR
Jan-31 2021 $1,191.6 $2,340.3
Feb-07 2021 $698.0 $899.6
Feb-14 2021 $762.5 $1,119.5
Feb-21 2021 $717.5 $1,331.3
Feb-28 2021 $644.5 $1,219.5
Mar-07 2021 $267.3 $1,091.9
Mar-14 2021 $115.2 $1,116.6
TOTAL AUTO LEASE BALANCES
ORIGINATED (MILLIONS)

26 PROPRIETARY |
Originations through March 14, 2021 reported as of March 16, 2021
729
735
741
747
753
759
765
771
777
0
351
702
1,053
1,404
1,755
2,106
2,457
2,808
Jan-
06 2
019
Apr-0
7 20
19
Jul-0
7 20
19
Oct-0
6 20
19
Jan-
05 2
020
Apr-0
5 20
20
Jul-0
5 20
20
Oct-0
4 20
20
Mar
-14
2021
Mill
ions
New Trades FICO® Auto Score 8
Auto Lease Originations: Balances Total Balances Originated in $Millions; NSA. Average FICO® Auto Score 8
Source: Equifax Inc.
Auto: Lease
WEEKEND CURR YR PREV YR
Mar-01 2020 $1,219.5 $1,522.9
Mar-08 2020 $1,091.9 $1,025.5
Mar-15 2020 $1,116.6 $1,241.7
Mar-22 2020 $866.5 $1,346.6
Mar-29 2020 $453.4 $1,852.8
Apr-05 2020 $409.8 $1,060.9
Apr-12 2020 $378.2 $1,057.2
Apr-19 2020 $488.5 $1,165.4
Apr-26 2020 $607.9 $1,367.3
May-03 2020 $794.0 $1,391.1
May-10 2020 $722.6 $1,072.4
May-17 2020 $886.8 $1,220.2
TOTAL AUTO LEASE BALANCES
ORIGINATED (MILLIONS)
WEEKEND CURR YR PREV YR
May-24 2020 $1,072.8 $1,495.3
May-31 2020 $1,289.4 $1,792.6
Jun-07 2020 $899.2 $944.0
Jun-14 2020 $995.9 $1,104.9
Jun-21 2020 $1,109.7 $1,239.8
Jun-28 2020 $1,235.9 $1,720.8
Jul-05 2020 $1,203.3 $1,137.9
Jul-12 2020 $979.2 $1,107.0
Jul-19 2020 $1,077.0 $1,200.7
Jul-26 2020 $1,167.9 $1,383.4
Aug-02 2020 $1,436.2 $1,640.3
Aug-09 2020 $911.5 $1,119.6
TOTAL AUTO LEASE BALANCES
ORIGINATED (MILLIONS)
WEEKEND CURR YR PREV YR
Aug-16 2020 $1,103.5 $1,291.7
Aug-23 2020 $1,215.7 $1,390.4
Aug-30 2020 $1,431.2 $1,944.2
Sep-06 2020 $1,266.3 $1,150.4
Sep-13 2020 $1,042.9 $1,097.5
Sep-20 2020 $1,147.4 $1,195.9
Sep-27 2020 $1,269.4 $1,489.6
Oct-04 2020 $1,343.0 $1,300.0
Oct-11 2020 $1,009.9 $1,096.5
Oct-18 2020 $1,140.5 $1,212.7
Oct-25 2020 $1,178.5 $1,307.0
Nov-01 2020 $1,440.3 $1,561.7
TOTAL AUTO LEASE BALANCES
ORIGINATED (MILLIONS)
WEEKEND CURR YR PREV YR
Nov-08 2020 $930.4 $1,048.7
Nov-15 2020 $1,127.6 $1,226.2
Nov-22 2020 $1,233.6 $1,347.3
Nov-29 2020 $1,337.4 $1,726.1
Dec-06 2020 $1,216.9 $1,104.5
Dec-13 2020 $1,206.0 $1,212.2
Dec-20 2020 $1,241.1 $1,374.1
Dec-27 2020 $1,116.5 $1,415.7
Jan-03 2021 $1,588.3 $831.6
Jan-10 2021 $932.6 $885.8
Jan-17 2021 $884.5 $1,010.6
Jan-24 2021 $989.2 $1,165.0
TOTAL AUTO LEASE BALANCES
ORIGINATED (MILLIONS)
WEEKEND CURR YR PREV YR
Jan-31 2021 $1,191.6 $2,340.3
Feb-07 2021 $698.0 $899.6
Feb-14 2021 $762.5 $1,119.5
Feb-21 2021 $717.5 $1,331.3
Feb-28 2021 $644.5 $1,219.5
Mar-07 2021 $267.3 $1,091.9
Mar-14 2021 $115.2 $1,116.6
TOTAL AUTO LEASE BALANCES
ORIGINATED (MILLIONS)

27 PROPRIETARY |
Originations through March 14, 2021 reported as of March 16, 2021
550
555
560
565
570
575
580
585
590
0
2
4
5
7
9
11
12
14
Jan-
06 2
019
Apr-0
7 20
19
Jul-0
7 20
19
Oct-0
6 20
19
Jan-
05 2
020
Apr-0
5 20
20
Jul-0
5 20
20
Oct-0
4 20
20
Mar
-14
2021
Thou
sand
s
New Trades VS® 3.0
Subprime Auto Lease Originations: Accounts Number of Accounts in Thousands; NSA. Subprime Accounts, Average VantageScore® 3.0 Subprime accounts defined as those with borrower’s origination VantageScore® 3.0 less than 620
Source: Equifax Inc.
Auto: Lease
WEEKEND CURR YR PREV YR % TOTAL
Mar-01 2020 7.4 9.6 10.5%
Mar-08 2020 6.6 6.5 10.5%
Mar-15 2020 6.4 7.2 10.0%
Mar-22 2020 5.0 7.6 10.0%
Mar-29 2020 3.0 9.7 12.0%
Apr-05 2020 2.4 5.8 11.0%
Apr-12 2020 2.1 5.8 10.1%
Apr-19 2020 2.7 6.0 9.8%
Apr-26 2020 3.1 6.8 9.0%
May-03 2020 3.7 6.9 8.3%
May-10 2020 3.4 5.5 8.3%
May-17 2020 4.1 6.0 7.9%
# SUBPRIME AUTO LEASE ACCOUNTS
ORIGINATED (THOUSANDS)
WEEKEND CURR YR PREV YR % TOTAL
May-24 2020 4.8 7.2 7.7%
May-31 2020 5.3 8.3 7.1%
Jun-07 2020 3.7 5.0 7.2%
Jun-14 2020 3.9 5.6 6.9%
Jun-21 2020 4.7 5.9 7.4%
Jun-28 2020 5.1 7.8 7.2%
Jul-05 2020 4.9 5.6 7.0%
Jul-12 2020 4.0 5.7 7.2%
Jul-19 2020 4.4 5.9 7.2%
Jul-26 2020 4.7 6.6 7.1%
Aug-02 2020 5.6 7.8 6.8%
Aug-09 2020 3.7 5.4 7.2%
# SUBPRIME AUTO LEASE ACCOUNTS
ORIGINATED (THOUSANDS)
WEEKEND CURR YR PREV YR % TOTAL
Aug-16 2020 4.4 6.1 7.0%
Aug-23 2020 4.9 6.3 7.0%
Aug-30 2020 5.5 8.5 6.6%
Sep-06 2020 4.9 5.5 6.7%
Sep-13 2020 4.1 5.5 6.7%
Sep-20 2020 4.4 5.9 6.7%
Sep-27 2020 4.8 7.0 6.6%
Oct-04 2020 5.1 6.4 6.6%
Oct-11 2020 3.9 5.2 6.7%
Oct-18 2020 4.1 5.9 6.5%
Oct-25 2020 4.3 6.0 6.5%
Nov-01 2020 5.1 7.1 6.3%
# SUBPRIME AUTO LEASE ACCOUNTS
ORIGINATED (THOUSANDS)
WEEKEND CURR YR PREV YR % TOTAL
Nov-08 2020 3.4 5.0 6.6%
Nov-15 2020 4.2 5.4 6.7%
Nov-22 2020 4.3 6.0 6.2%
Nov-29 2020 4.4 7.2 5.8%
Dec-06 2020 4.4 5.1 6.5%
Dec-13 2020 4.0 5.4 6.0%
Dec-20 2020 4.2 5.8 6.2%
Dec-27 2020 3.6 5.8 6.0%
Jan-03 2021 5.1 3.8 5.6%
Jan-10 2021 4.0 4.4 7.6%
Jan-17 2021 3.7 5.1 7.6%
Jan-24 2021 3.9 5.6 7.1%
# SUBPRIME AUTO LEASE ACCOUNTS
ORIGINATED (THOUSANDS)
WEEKEND CURR YR PREV YR % TOTAL
Jan-31 2021 4.5 11.6 6.8%
Feb-07 2021 3.1 5.0 7.9%
Feb-14 2021 3.1 5.7 7.2%
Feb-21 2021 2.7 6.5 6.4%
Feb-28 2021 2.9 7.4 7.5%
Mar-07 2021 1.0 6.6 6.0%
Mar-14 2021 0.5 6.4 6.4%
# SUBPRIME AUTO LEASE ACCOUNTS
ORIGINATED (THOUSANDS)

28 PROPRIETARY |
Originations through March 14, 2021 reported as of March 16, 2021
541
547
553
559
565
571
577
583
589
0
1
2
4
5
6
7
8
10
Jan-
06 2
019
Apr-0
7 20
19
Jul-0
7 20
19
Oct-0
6 20
19
Jan-
05 2
020
Apr-0
5 20
20
Jul-0
5 20
20
Oct-0
4 20
20
Mar
-14
2021
Thou
sand
s
New Trades FICO® Auto Score 8
Subprime Auto Lease Originations: Accounts Number of Accounts in Thousands; NSA. Subprime Accounts, Average FICO® Auto Score 8 Subprime accounts defined as those with borrower’s origination FICO® Auto Score 8 less than 620
Source: Equifax Inc.
Auto: Lease
WEEKEND CURR YR PREV YR % TOTAL
Mar-01 2020 5.1 6.6 7.3%
Mar-08 2020 5.0 4.4 7.9%
Mar-15 2020 4.6 4.9 7.2%
Mar-22 2020 3.5 4.9 7.1%
Mar-29 2020 2.1 6.2 8.3%
Apr-05 2020 1.6 4.5 7.5%
Apr-12 2020 1.4 4.2 7.0%
Apr-19 2020 1.8 4.3 6.6%
Apr-26 2020 2.0 4.5 5.8%
May-03 2020 2.4 4.9 5.3%
May-10 2020 2.5 4.1 6.0%
May-17 2020 2.8 4.3 5.4%
# SUBPRIME AUTO LEASE ACCOUNTS
ORIGINATED (THOUSANDS)
WEEKEND CURR YR PREV YR % TOTAL
May-24 2020 3.1 4.8 4.9%
May-31 2020 3.3 5.5 4.5%
Jun-07 2020 2.9 3.9 5.7%
Jun-14 2020 2.8 4.3 5.0%
Jun-21 2020 3.4 4.2 5.3%
Jun-28 2020 3.4 5.3 4.8%
Jul-05 2020 3.4 4.3 5.0%
Jul-12 2020 3.1 4.3 5.6%
Jul-19 2020 3.3 4.3 5.4%
Jul-26 2020 3.4 4.4 5.1%
Aug-02 2020 3.9 5.5 4.8%
Aug-09 2020 2.9 4.0 5.5%
# SUBPRIME AUTO LEASE ACCOUNTS
ORIGINATED (THOUSANDS)
WEEKEND CURR YR PREV YR % TOTAL
Aug-16 2020 3.3 4.5 5.1%
Aug-23 2020 3.4 4.4 4.9%
Aug-30 2020 3.7 5.7 4.4%
Sep-06 2020 3.8 4.1 5.1%
Sep-13 2020 3.1 4.0 5.2%
Sep-20 2020 3.3 4.0 5.1%
Sep-27 2020 3.5 4.6 4.7%
Oct-04 2020 3.9 4.8 5.0%
Oct-11 2020 3.1 3.9 5.4%
Oct-18 2020 3.2 4.3 4.9%
Oct-25 2020 3.1 4.2 4.8%
Nov-01 2020 3.6 5.0 4.5%
# SUBPRIME AUTO LEASE ACCOUNTS
ORIGINATED (THOUSANDS)
WEEKEND CURR YR PREV YR % TOTAL
Nov-08 2020 2.7 3.8 5.3%
Nov-15 2020 3.2 3.8 5.2%
Nov-22 2020 3.1 4.1 4.6%
Nov-29 2020 3.1 4.8 4.1%
Dec-06 2020 3.4 3.9 5.1%
Dec-13 2020 3.2 3.8 4.8%
Dec-20 2020 3.2 4.0 4.7%
Dec-27 2020 2.6 3.6 4.2%
Jan-03 2021 3.5 2.9 3.9%
Jan-10 2021 3.2 3.4 6.0%
Jan-17 2021 2.8 3.6 5.9%
Jan-24 2021 2.8 3.8 5.1%
# SUBPRIME AUTO LEASE ACCOUNTS
ORIGINATED (THOUSANDS)
WEEKEND CURR YR PREV YR % TOTAL
Jan-31 2021 3.1 7.9 4.7%
Feb-07 2021 2.5 3.4 6.4%
Feb-14 2021 2.3 3.7 5.4%
Feb-21 2021 1.9 4.3 4.5%
Feb-28 2021 2.0 5.1 5.2%
Mar-07 2021 0.8 5.0 4.6%
Mar-14 2021 0.3 4.6 4.6%
# SUBPRIME AUTO LEASE ACCOUNTS
ORIGINATED (THOUSANDS)
29 PROPRIETARY |
Originations through March 14, 2021 reported as of March 16, 2021
550
555
560
565
570
575
580
585
590
0
33
65
98
130
163
195
228
261Ja
n-06
201
9
Apr-0
7 20
19
Jul-0
7 20
19
Oct-0
6 20
19
Jan-
05 2
020
Apr-0
5 20
20
Jul-0
5 20
20
Oct-0
4 20
20
Mar
-14
2021
Mill
ions
New Trades VS® 3.0
Subprime Auto Lease Originations: Balances Total Balances Originated in $Thousands; NSA. Subprime Accounts, Average VantageScore® 3.0 Subprime accounts defined as those with borrower’s origination VantageScore® 3.0 less than 620
Source: Equifax Inc.
Auto: Lease
WEEKEND CURR YR PREV YR % TOTAL
Mar-01 2020 $138.0 $165.9 11.3%
Mar-08 2020 $122.0 $115.3 11.2%
Mar-15 2020 $118.8 $127.5 10.6%
Mar-22 2020 $93.5 $131.1 10.8%
Mar-29 2020 $57.5 $170.1 12.7%
Apr-05 2020 $46.2 $103.2 11.3%
Apr-12 2020 $39.3 $103.5 10.4%
Apr-19 2020 $49.2 $108.1 10.1%
Apr-26 2020 $55.8 $120.4 9.2%
May-03 2020 $68.2 $123.3 8.6%
May-10 2020 $62.7 $98.7 8.7%
May-17 2020 $72.3 $107.0 8.1%
TOTAL SUBPRIME AUTO LEASE BALANCES
ORIGINATED (MILLIONS)
WEEKEND CURR YR PREV YR % TOTAL
May-24 2020 $85.0 $125.4 7.9%
May-31 2020 $95.3 $143.7 7.4%
Jun-07 2020 $66.7 $88.9 7.4%
Jun-14 2020 $72.3 $99.8 7.3%
Jun-21 2020 $86.1 $106.4 7.8%
Jun-28 2020 $92.5 $139.3 7.5%
Jul-05 2020 $88.3 $99.5 7.3%
Jul-12 2020 $74.5 $101.1 7.6%
Jul-19 2020 $82.5 $106.4 7.7%
Jul-26 2020 $88.1 $118.4 7.5%
Aug-02 2020 $104.1 $141.2 7.2%
Aug-09 2020 $68.2 $97.5 7.5%
TOTAL SUBPRIME AUTO LEASE BALANCES
ORIGINATED (MILLIONS)
WEEKEND CURR YR PREV YR % TOTAL
Aug-16 2020 $80.4 $110.0 7.3%
Aug-23 2020 $90.3 $114.8 7.4%
Aug-30 2020 $101.4 $153.5 7.1%
Sep-06 2020 $89.9 $99.0 7.1%
Sep-13 2020 $73.1 $101.4 7.0%
Sep-20 2020 $82.1 $108.7 7.2%
Sep-27 2020 $89.5 $128.5 7.1%
Oct-04 2020 $93.9 $116.9 7.0%
Oct-11 2020 $72.0 $96.6 7.1%
Oct-18 2020 $77.2 $107.8 6.8%
Oct-25 2020 $81.0 $110.9 6.9%
Nov-01 2020 $97.8 $128.1 6.8%
TOTAL SUBPRIME AUTO LEASE BALANCES
ORIGINATED (MILLIONS)
WEEKEND CURR YR PREV YR % TOTAL
Nov-08 2020 $64.2 $93.3 6.9%
Nov-15 2020 $79.4 $99.7 7.0%
Nov-22 2020 $81.6 $112.1 6.6%
Nov-29 2020 $81.8 $130.6 6.1%
Dec-06 2020 $82.4 $94.7 6.8%
Dec-13 2020 $74.6 $98.9 6.2%
Dec-20 2020 $79.7 $107.6 6.4%
Dec-27 2020 $69.3 $104.4 6.2%
Jan-03 2021 $95.6 $70.2 6.0%
Jan-10 2021 $75.7 $81.5 8.1%
Jan-17 2021 $70.3 $95.3 7.9%
Jan-24 2021 $74.8 $106.1 7.6%
TOTAL SUBPRIME AUTO LEASE BALANCES
ORIGINATED (MILLIONS)
WEEKEND CURR YR PREV YR % TOTAL
Jan-31 2021 $85.8 $217.1 7.2%
Feb-07 2021 $59.8 $93.5 8.6%
Feb-14 2021 $59.0 $105.7 7.7%
Feb-21 2021 $50.2 $119.8 7.0%
Feb-28 2021 $54.3 $138.0 8.4%
Mar-07 2021 $16.8 $122.0 6.3%
Mar-14 2021 $7.6 $118.8 6.6%
TOTAL SUBPRIME AUTO LEASE BALANCES
ORIGINATED (MILLIONS)

30 PROPRIETARY |
Originations through March 14, 2021 reported as of March 16, 2021
541
547
553
559
565
571
577
583
589
0
22
45
67
90
112
134
157
179Ja
n-06
201
9
Apr-0
7 20
19
Jul-0
7 20
19
Oct-0
6 20
19
Jan-
05 2
020
Apr-0
5 20
20
Jul-0
5 20
20
Oct-0
4 20
20
Mar
-14
2021
Mill
ions
New Trades FICO® Auto Score 8
Subprime Auto Lease Originations: Balances Total Balances Originated in $Thousands; NSA. Subprime Accounts, Average FICO® Auto Score 8 Subprime accounts defined as those with borrower’s origination FICO® Auto Score 8 less than 620
Source: Equifax Inc.
Auto: Lease
WEEKEND CURR YR PREV YR % TOTAL
Mar-01 2020 $96.1 $115.5 7.9%
Mar-08 2020 $92.5 $79.3 8.5%
Mar-15 2020 $84.0 $86.2 7.5%
Mar-22 2020 $66.3 $85.2 7.7%
Mar-29 2020 $39.7 $108.5 8.8%
Apr-05 2020 $31.6 $79.4 7.7%
Apr-12 2020 $27.2 $75.1 7.2%
Apr-19 2020 $32.9 $76.9 6.7%
Apr-26 2020 $35.8 $81.0 5.9%
May-03 2020 $43.0 $87.0 5.4%
May-10 2020 $45.2 $73.6 6.3%
May-17 2020 $48.3 $77.4 5.5%
TOTAL SUBPRIME AUTO LEASE BALANCES
ORIGINATED (MILLIONS)
WEEKEND CURR YR PREV YR % TOTAL
May-24 2020 $53.7 $84.9 5.0%
May-31 2020 $57.9 $97.3 4.5%
Jun-07 2020 $52.6 $70.1 5.9%
Jun-14 2020 $51.5 $76.0 5.2%
Jun-21 2020 $60.6 $77.0 5.5%
Jun-28 2020 $60.9 $95.5 4.9%
Jul-05 2020 $62.5 $76.8 5.2%
Jul-12 2020 $57.6 $76.7 5.9%
Jul-19 2020 $61.0 $76.8 5.7%
Jul-26 2020 $62.6 $79.8 5.4%
Aug-02 2020 $71.6 $100.4 5.0%
Aug-09 2020 $52.9 $73.6 5.8%
TOTAL SUBPRIME AUTO LEASE BALANCES
ORIGINATED (MILLIONS)
WEEKEND CURR YR PREV YR % TOTAL
Aug-16 2020 $58.7 $80.9 5.3%
Aug-23 2020 $63.2 $80.4 5.2%
Aug-30 2020 $66.0 $103.6 4.6%
Sep-06 2020 $69.3 $73.4 5.5%
Sep-13 2020 $57.1 $73.8 5.5%
Sep-20 2020 $62.2 $73.3 5.4%
Sep-27 2020 $63.6 $84.1 5.0%
Oct-04 2020 $71.0 $87.3 5.3%
Oct-11 2020 $57.2 $71.2 5.7%
Oct-18 2020 $58.9 $77.7 5.2%
Oct-25 2020 $58.9 $77.2 5.0%
Nov-01 2020 $68.0 $90.0 4.7%
TOTAL SUBPRIME AUTO LEASE BALANCES
ORIGINATED (MILLIONS)
WEEKEND CURR YR PREV YR % TOTAL
Nov-08 2020 $50.5 $69.3 5.4%
Nov-15 2020 $60.8 $70.2 5.4%
Nov-22 2020 $59.7 $75.9 4.8%
Nov-29 2020 $58.5 $87.4 4.4%
Dec-06 2020 $64.8 $72.6 5.3%
Dec-13 2020 $59.7 $71.1 4.9%
Dec-20 2020 $58.8 $73.9 4.7%
Dec-27 2020 $48.1 $65.4 4.3%
Jan-03 2021 $66.3 $53.2 4.2%
Jan-10 2021 $60.0 $62.0 6.4%
Jan-17 2021 $54.8 $67.5 6.2%
Jan-24 2021 $54.1 $71.6 5.5%
TOTAL SUBPRIME AUTO LEASE BALANCES
ORIGINATED (MILLIONS)
WEEKEND CURR YR PREV YR % TOTAL
Jan-31 2021 $59.9 $149.2 5.0%
Feb-07 2021 $47.9 $63.8 6.9%
Feb-14 2021 $43.8 $68.5 5.7%
Feb-21 2021 $36.0 $77.7 5.0%
Feb-28 2021 $38.3 $96.1 5.9%
Mar-07 2021 $12.5 $92.5 4.7%
Mar-14 2021 $5.3 $84.0 4.6%
TOTAL SUBPRIME AUTO LEASE BALANCES
ORIGINATED (MILLIONS)

31 PROPRIETARY |
Originations through March 14, 2021 reported as of March 16, 2021
$0
$5,000
$10,000
$15,000
$20,000
$25,000
Jan-
07 20
18
Apr-0
8 20
18
Jul-0
8 201
8
Oct-0
7 201
8
Jan-
06 20
19
Apr-0
7 20
19
Jul-0
7 201
9
Oct-0
6 201
9
Jan-
05 20
20
Apr-0
5 20
20
Jul-0
5 202
0
Oct-0
4 202
0
Mar
-14 2
021
Auto Lease Origination Loan Amount Subprime Auto Lease Origination Loan Amount
Auto Lease Average Origination Balance Average Origination Lease Balance Over Time; NSA Subprime accounts defined as those with borrower’s origination VantageScore® 3.0 less than 620
Source: Equifax Inc.
Auto: Lease

32 PROPRIETARY |
Originations through March 14, 2021 reported as of March 16, 2021
$0
$5,000
$10,000
$15,000
$20,000
$25,000
Jan-
07 20
18
Apr-0
8 20
18
Jul-0
8 201
8
Oct-0
7 201
8
Jan-
06 20
19
Apr-0
7 20
19
Jul-0
7 201
9
Oct-0
6 201
9
Jan-
05 20
20
Apr-0
5 20
20
Jul-0
5 202
0
Oct-0
4 202
0
Mar
-14 2
021
Auto Lease Origination Loan Amount Subprime Auto Lease Origination Loan Amount
Auto Lease Average Origination Balance Average Origination Lease Balance Over Time; NSA Subprime accounts defined as those with borrower’s origination FICO® Auto Score 8 less than 620
Source: Equifax Inc.
Auto: Lease

33 PROPRIETARY |
Originations through March 14, 2021 reported as of March 16, 2021
0%
2%
4%
6%
8%
10%
12%
14%
$0
$250
$499
$749
$998
$1,248
$1,498
$1,747M
ar-0
1 202
0
Mar
-08 2
020
Mar
-15 2
020
Mar
-22 2
020
Mar
-29 2
020
Apr-0
5 20
20
Apr-1
2 20
20
Apr-1
9 20
20
Apr-2
6 20
20
May
-03
2020
May
-10
2020
May
-17
2020
May
-24
2020
May
-31
2020
Jun-
07 2
020
Jun-
14 2
020
Jun-
21 2
020
Jun-
28 2
020
Jul-0
5 20
20
Jul-1
2 20
20
Jul-1
9 20
20
Jul-2
6 20
20
Aug-
02 2
020
Aug-
09 2
020
Aug-
16 2
020
Aug-
23 2
020
Aug-
30 2
020
Sep-
06 20
20
Sep-
13 20
20
Sep-
20 20
20
Sep-
27 20
20
Oct-0
4 20
20
Oct-1
1 20
20
Oct-1
8 20
20
Oct-2
5 20
20
Nov-
01 2
020
Nov-
08 2
020
Nov-
15 2
020
Nov-
22 2
020
Nov-
29 2
020
Dec-0
6 20
20
Dec-1
3 20
20
Dec-2
0 20
20
Dec-2
7 20
20
Jan-
03 2
021
Jan-
10 2
021
Jan-
17 2
021
Jan-
24 2
021
Jan-
31 2
021
Feb-
07 20
21
Feb-
14 20
21
Feb-
21 20
21
Feb-
28 20
21
Mar
-07 2
021
Mar
-14 2
021
Subp
rime S
hare
Milli
ons
Auto Lease Origination Auto Lease Origination Subprime Share
Auto Lease Originations Total Originations in $Millions; NSA Subprime accounts defined as those with borrower’s origination VantageScore® 3.0 less than 620
Source: Equifax Inc.
Auto: Lease
34 PROPRIETARY |
Originations through March 14, 2021 reported as of March 16, 2021
0%
1%
3%
4%
6%
7%
8%
10%
$0
$250
$499
$749
$998
$1,248
$1,498
$1,747M
ar-0
1 202
0
Mar
-08 2
020
Mar
-15 2
020
Mar
-22 2
020
Mar
-29 2
020
Apr-0
5 20
20
Apr-1
2 20
20
Apr-1
9 20
20
Apr-2
6 20
20
May
-03
2020
May
-10
2020
May
-17
2020
May
-24
2020
May
-31
2020
Jun-
07 2
020
Jun-
14 2
020
Jun-
21 2
020
Jun-
28 2
020
Jul-0
5 20
20
Jul-1
2 20
20
Jul-1
9 20
20
Jul-2
6 20
20
Aug-
02 2
020
Aug-
09 2
020
Aug-
16 2
020
Aug-
23 2
020
Aug-
30 2
020
Sep-
06 20
20
Sep-
13 20
20
Sep-
20 20
20
Sep-
27 20
20
Oct-0
4 20
20
Oct-1
1 20
20
Oct-1
8 20
20
Oct-2
5 20
20
Nov-
01 2
020
Nov-
08 2
020
Nov-
15 2
020
Nov-
22 2
020
Nov-
29 2
020
Dec-0
6 20
20
Dec-1
3 20
20
Dec-2
0 20
20
Dec-2
7 20
20
Jan-
03 2
021
Jan-
10 2
021
Jan-
17 2
021
Jan-
24 2
021
Jan-
31 2
021
Feb-
07 20
21
Feb-
14 20
21
Feb-
21 20
21
Feb-
28 20
21
Mar
-07 2
021
Mar
-14 2
021
Subp
rime S
hare
Milli
ons
Auto Lease Origination Auto Lease Origination Subprime Share
Auto Lease Originations Total Originations in $Millions; NSA Subprime accounts defined as those with borrower’s origination FICO® Auto Score 8 less than 620
Source: Equifax Inc.
Auto: Lease

35 PROPRIETARY |
Originations through March 14, 2021 reported as of March 16, 2021
707
712
717
722
727
732
737
742
747
752
757
0%
10%
20%
30%
40%
50%
60%
70%
80%
90%
100%
Mar
-01 2
020
Mar
-08 2
020
Mar
-15 2
020
Mar
-22 2
020
Mar
-29 2
020
Apr-0
5 20
20
Apr-1
2 20
20
Apr-1
9 20
20
Apr-2
6 20
20
May
-03
2020
May
-10
2020
May
-17
2020
May
-24
2020
May
-31
2020
Jun-
07 2
020
Jun-
14 2
020
Jun-
21 2
020
Jun-
28 2
020
Jul-0
5 20
20
Jul-1
2 20
20
Jul-1
9 20
20
Jul-2
6 20
20
Aug-
02 2
020
Aug-
09 2
020
Aug-
16 2
020
Aug-
23 2
020
Aug-
30 2
020
Sep-
06 20
20
Sep-
13 20
20
Sep-
20 20
20
Sep-
27 20
20
Oct-0
4 20
20
Oct-1
1 20
20
Oct-1
8 20
20
Oct-2
5 20
20
Nov-
01 2
020
Nov-
08 2
020
Nov-
15 2
020
Nov-
22 2
020
Nov-
29 2
020
Dec-0
6 20
20
Dec-1
3 20
20
Dec-2
0 20
20
Dec-2
7 20
20
Jan-
03 2
021
Jan-
10 2
021
Jan-
17 2
021
Jan-
24 2
021
Jan-
31 2
021
Feb-
07 20
21
Feb-
14 20
21
Feb-
21 20
21
Feb-
28 20
21
Mar
-07 2
021
Mar
-14 2
021
300-539 540-579 580-619 620-659 660-699 700-739 740-779 780-850 no score Avg. VS® 3.0
Auto Lease Origination Risk VantageScore® 3.0 Distribution for Auto Lease Originations by Week (Percent of Accounts)
Source: Equifax Inc.
Auto: Lease
The last 8 weeks of weekly data is subject to revision due to reporting lags by data furnishers.

36 PROPRIETARY |
Originations through March 14, 2021 reported as of March 16, 2021
729
733
737
741
745
749
753
757
761
765
769
0%
10%
20%
30%
40%
50%
60%
70%
80%
90%
100%
Mar
-01 2
020
Mar
-08 2
020
Mar
-15 2
020
Mar
-22 2
020
Mar
-29 2
020
Apr-0
5 20
20
Apr-1
2 20
20
Apr-1
9 20
20
Apr-2
6 20
20
May
-03
2020
May
-10
2020
May
-17
2020
May
-24
2020
May
-31
2020
Jun-
07 2
020
Jun-
14 2
020
Jun-
21 2
020
Jun-
28 2
020
Jul-0
5 20
20
Jul-1
2 20
20
Jul-1
9 20
20
Jul-2
6 20
20
Aug-
02 2
020
Aug-
09 2
020
Aug-
16 2
020
Aug-
23 2
020
Aug-
30 2
020
Sep-
06 20
20
Sep-
13 20
20
Sep-
20 20
20
Sep-
27 20
20
Oct-0
4 20
20
Oct-1
1 20
20
Oct-1
8 20
20
Oct-2
5 20
20
Nov-
01 2
020
Nov-
08 2
020
Nov-
15 2
020
Nov-
22 2
020
Nov-
29 2
020
Dec-0
6 20
20
Dec-1
3 20
20
Dec-2
0 20
20
Dec-2
7 20
20
Jan-
03 2
021
Jan-
10 2
021
Jan-
17 2
021
Jan-
24 2
021
Jan-
31 2
021
Feb-
07 20
21
Feb-
14 20
21
Feb-
21 20
21
Feb-
28 20
21
Mar
-07 2
021
Mar
-14 2
021
250-539 540-579 580-619 620-659 660-699 700-739 740-779 780-900 no score Avg. FICO® Auto Score 8
Auto Lease Origination Risk FICO® Auto Score 8 Distribution for Auto Originations by Week (% of Accounts)
Source: Equifax Inc.
Auto: Lease
The last 8 weeks of weekly data is subject to revision due to reporting lags by data furnishers.

37 PROPRIETARY |
Credit Trends Originations: Auto Loans

38 PROPRIETARY |
Originations through March 14, 2021 reported as of March 16, 2021
Auto Loan Originations Observations Originations through March 14, 2021 reported as of March 16, 2021
Auto: Loan
• 9,200 auto loans, totaling $305.3 million, have been originated the week ending March 14th.
• Auto loans represent 55.9% of all auto account originations and 72.6% of all auto origination balances for the week ending March 14th.
• An estimated 1,100 auto loans were originated in the week ending March 14th to consumers with a VantageScore® 3.0 credit score below 620. These are generally considered subprime accounts. These newly-issued loans have a corresponding total balance of $31.4 million.
• In the week ending March 14th, 11.9% of auto loans were issued to consumers with a VantageScore® 3.0 subprime credit score, accounting for 10.3% of origination balances.
• An estimated 1,000 auto loans were originated in the week ending March 14th to consumers with a FICO® Auto 8 credit score below 620. These are generally considered subprime accounts. These newly-issued loans have a corresponding total balance of $26.3 million.
• In the week ending March 14th, 10.4% of auto loans were issued to consumers with a FICO® Auto 8 subprime credit score, accounting for 8.6% of origination balances.
• The average origination loan amount for all auto loans issued in the week ending March 14th was $33,045. The average subprime loan amount was $28,600.

39 PROPRIETARY |
Originations through March 14, 2021 reported as of March 16, 2021
659
669
679
689
699
709
719
729
739
0
105
209
314
418
523
627
732
837Ja
n-06
201
9
Apr-0
7 20
19
Jul-0
7 20
19
Oct-0
6 20
19
Jan-
05 2
020
Apr-0
5 20
20
Jul-0
5 20
20
Oct-0
4 20
20
Mar
-14
2021
Thou
sand
s
New Trades VS® 3.0
Auto Loan Originations: Accounts Number of Accounts in Thousands; NSA . Average VantageScore® 3.0
Source: Equifax Inc.
Auto: Loan
WEEKEND CURR YR PREV YR
Mar-01 2020 495.1 559.8
Mar-08 2020 508.3 489.2
Mar-15 2020 472.1 507.7
Mar-22 2020 361.0 523.1
Mar-29 2020 279.2 580.7
Apr-05 2020 259.2 464.3
Apr-12 2020 254.7 470.3
Apr-19 2020 334.7 477.2
Apr-26 2020 390.9 503.4
May-03 2020 447.0 491.0
May-10 2020 431.6 458.1
May-17 2020 472.2 480.4
# AUTO LOAN ACCOUNTS
ORIGINATED (THOUSANDS)
WEEKEND CURR YR PREV YR
May-24 2020 525.4 525.9
May-31 2020 565.5 534.2
Jun-07 2020 484.1 456.6
Jun-14 2020 519.7 474.5
Jun-21 2020 531.7 489.7
Jun-28 2020 547.8 555.0
Jul-05 2020 506.4 444.9
Jul-12 2020 491.0 476.1
Jul-19 2020 495.6 487.2
Jul-26 2020 505.1 509.7
Aug-02 2020 531.4 525.0
Aug-09 2020 463.4 479.3
# AUTO LOAN ACCOUNTS
ORIGINATED (THOUSANDS)
WEEKEND CURR YR PREV YR
Aug-16 2020 484.4 497.4
Aug-23 2020 500.4 512.2
Aug-30 2020 520.9 571.8
Sep-06 2020 500.3 441.0
Sep-13 2020 446.3 460.4
Sep-20 2020 475.8 473.5
Sep-27 2020 496.5 505.2
Oct-04 2020 493.8 472.5
Oct-11 2020 445.0 448.0
Oct-18 2020 447.0 448.2
Oct-25 2020 464.8 470.0
Nov-01 2020 486.1 479.0
# AUTO LOAN ACCOUNTS
ORIGINATED (THOUSANDS)
WEEKEND CURR YR PREV YR
Nov-08 2020 406.2 442.5
Nov-15 2020 427.7 448.9
Nov-22 2020 450.5 480.6
Nov-29 2020 423.8 476.0
Dec-06 2020 433.3 421.5
Dec-13 2020 433.6 437.7
Dec-20 2020 418.8 451.5
Dec-27 2020 350.7 426.1
Jan-03 2021 475.3 256.6
Jan-10 2021 410.2 409.4
Jan-17 2021 403.5 416.8
Jan-24 2021 398.7 432.9
# AUTO LOAN ACCOUNTS
ORIGINATED (THOUSANDS)
WEEKEND CURR YR PREV YR
Jan-31 2021 421.7 697.1
Feb-07 2021 337.9 412.2
Feb-14 2021 331.4 442.4
Feb-21 2021 276.2 471.5
Feb-28 2021 246.9 495.1
Mar-07 2021 30.4 508.3
Mar-14 2021 9.2 472.1
# AUTO LOAN ACCOUNTS
ORIGINATED (THOUSANDS)

40 PROPRIETARY |
Originations through March 14, 2021 reported as of March 16, 2021
676
685
694
703
712
721
730
739
748
0
105
209
314
418
523
627
732
837Ja
n-06
201
9
Apr-0
7 20
19
Jul-0
7 20
19
Oct-0
6 20
19
Jan-
05 2
020
Apr-0
5 20
20
Jul-0
5 20
20
Oct-0
4 20
20
Mar
-14
2021
Thou
sand
s
New Trades FICO® Auto Score 8
Auto Loan Originations: Accounts Number of Accounts in Thousands; NSA . Average FICO® Auto Score 8
Source: Equifax Inc.
Auto: Loan
WEEKEND CURR YR PREV YR
Mar-01 2020 495.1 559.8
Mar-08 2020 508.3 489.2
Mar-15 2020 472.1 507.7
Mar-22 2020 361.0 523.1
Mar-29 2020 279.2 580.7
Apr-05 2020 259.2 464.3
Apr-12 2020 254.7 470.3
Apr-19 2020 334.7 477.2
Apr-26 2020 390.9 503.4
May-03 2020 447.0 491.0
May-10 2020 431.6 458.1
May-17 2020 472.2 480.4
# AUTO LOAN ACCOUNTS
ORIGINATED (THOUSANDS)
WEEKEND CURR YR PREV YR
May-24 2020 525.4 525.9
May-31 2020 565.5 534.2
Jun-07 2020 484.1 456.6
Jun-14 2020 519.7 474.5
Jun-21 2020 531.7 489.7
Jun-28 2020 547.8 555.0
Jul-05 2020 506.4 444.9
Jul-12 2020 491.0 476.1
Jul-19 2020 495.6 487.2
Jul-26 2020 505.1 509.7
Aug-02 2020 531.4 525.0
Aug-09 2020 463.4 479.3
# AUTO LOAN ACCOUNTS
ORIGINATED (THOUSANDS)
WEEKEND CURR YR PREV YR
Aug-16 2020 484.4 497.4
Aug-23 2020 500.4 512.2
Aug-30 2020 520.9 571.8
Sep-06 2020 500.3 441.0
Sep-13 2020 446.3 460.4
Sep-20 2020 475.8 473.5
Sep-27 2020 496.5 505.2
Oct-04 2020 493.8 472.5
Oct-11 2020 445.0 448.0
Oct-18 2020 447.0 448.2
Oct-25 2020 464.8 470.0
Nov-01 2020 486.1 479.0
# AUTO LOAN ACCOUNTS
ORIGINATED (THOUSANDS)
WEEKEND CURR YR PREV YR
Nov-08 2020 406.2 442.5
Nov-15 2020 427.7 448.9
Nov-22 2020 450.5 480.6
Nov-29 2020 423.8 476.0
Dec-06 2020 433.3 421.5
Dec-13 2020 433.6 437.7
Dec-20 2020 418.8 451.5
Dec-27 2020 350.7 426.1
Jan-03 2021 475.3 256.6
Jan-10 2021 410.2 409.4
Jan-17 2021 403.5 416.8
Jan-24 2021 398.7 432.9
# AUTO LOAN ACCOUNTS
ORIGINATED (THOUSANDS)
WEEKEND CURR YR PREV YR
Jan-31 2021 421.7 697.1
Feb-07 2021 337.9 412.2
Feb-14 2021 331.4 442.4
Feb-21 2021 276.2 471.5
Feb-28 2021 246.9 495.1
Mar-07 2021 30.4 508.3
Mar-14 2021 9.2 472.1
# AUTO LOAN ACCOUNTS
ORIGINATED (THOUSANDS)

41 PROPRIETARY |
Originations through March 14, 2021 reported as of March 16, 2021
659
669
679
689
699
709
719
729
739
0
2,495
4,991
7,486
9,981
12,477
14,972
17,467
19,963
Jan-
06 2
019
Apr-0
7 20
19
Jul-0
7 20
19
Oct-0
6 20
19
Jan-
05 2
020
Apr-0
5 20
20
Jul-0
5 20
20
Oct-0
4 20
20
Mar
-14
2021
Mill
ions
New Trades VS® 3.0
Auto Loan Originations: Balances Total Balances Originated in $Millions; NSA . Average VantageScore® 3.0
Source: Equifax Inc.
Auto: Loan
WEEKEND CURR YR PREV YR
Mar-01 2020 $11,268.3 $12,426.7
Mar-08 2020 $11,576.1 $10,862.0
Mar-15 2020 $11,022.7 $11,585.5
Mar-22 2020 $8,937.0 $12,095.7
Mar-29 2020 $7,531.0 $13,801.7
Apr-05 2020 $7,010.0 $10,577.9
Apr-12 2020 $6,809.4 $10,837.1
Apr-19 2020 $8,714.0 $11,154.8
Apr-26 2020 $10,172.0 $11,807.7
May-03 2020 $11,600.8 $11,520.9
May-10 2020 $10,824.2 $10,695.8
May-17 2020 $11,838.9 $11,335.8
TOTAL AUTO LOAN BALANCES
ORIGINATED (MILLIONS)
WEEKEND CURR YR PREV YR
May-24 2020 $13,290.6 $12,584.7
May-31 2020 $14,674.9 $13,092.2
Jun-07 2020 $11,786.5 $10,629.0
Jun-14 2020 $12,720.9 $11,188.8
Jun-21 2020 $13,117.6 $11,686.6
Jun-28 2020 $13,743.0 $13,502.2
Jul-05 2020 $12,751.9 $10,640.4
Jul-12 2020 $12,076.6 $11,227.7
Jul-19 2020 $12,264.1 $11,544.7
Jul-26 2020 $12,664.1 $12,148.4
Aug-02 2020 $13,542.4 $12,554.3
Aug-09 2020 $11,559.1 $11,280.8
TOTAL AUTO LOAN BALANCES
ORIGINATED (MILLIONS)
WEEKEND CURR YR PREV YR
Aug-16 2020 $12,258.6 $11,836.2
Aug-23 2020 $12,766.3 $12,334.5
Aug-30 2020 $13,556.7 $14,117.9
Sep-06 2020 $12,991.6 $10,694.1
Sep-13 2020 $11,714.2 $11,028.8
Sep-20 2020 $12,427.5 $11,416.2
Sep-27 2020 $13,114.7 $12,385.9
Oct-04 2020 $13,039.1 $11,368.6
Oct-11 2020 $11,529.0 $10,708.4
Oct-18 2020 $11,742.5 $10,823.0
Oct-25 2020 $12,202.7 $11,379.1
Nov-01 2020 $12,905.9 $11,661.0
TOTAL AUTO LOAN BALANCES
ORIGINATED (MILLIONS)
WEEKEND CURR YR PREV YR
Nov-08 2020 $10,552.1 $10,566.5
Nov-15 2020 $11,306.8 $10,927.2
Nov-22 2020 $11,908.8 $11,627.6
Nov-29 2020 $11,624.9 $12,021.5
Dec-06 2020 $11,694.9 $10,221.5
Dec-13 2020 $11,775.5 $10,720.1
Dec-20 2020 $11,520.6 $11,319.8
Dec-27 2020 $9,904.9 $10,991.0
Jan-03 2021 $13,571.5 $6,271.1
Jan-10 2021 $10,620.4 $9,589.9
Jan-17 2021 $10,390.1 $9,824.3
Jan-24 2021 $10,449.5 $10,330.2
TOTAL AUTO LOAN BALANCES
ORIGINATED (MILLIONS)
WEEKEND CURR YR PREV YR
Jan-31 2021 $11,141.1 $16,635.5
Feb-07 2021 $8,852.7 $9,671.6
Feb-14 2021 $8,764.1 $10,552.5
Feb-21 2021 $7,354.3 $11,358.3
Feb-28 2021 $6,299.6 $11,268.3
Mar-07 2021 $932.4 $11,576.1
Mar-14 2021 $305.3 $11,022.7
TOTAL AUTO LOAN BALANCES
ORIGINATED (MILLIONS)

42 PROPRIETARY |
Originations through March 14, 2021 reported as of March 16, 2021
676
685
694
703
712
721
730
739
748
0
2,495
4,991
7,486
9,981
12,477
14,972
17,467
19,963
Jan-
06 2
019
Apr-0
7 20
19
Jul-0
7 20
19
Oct-0
6 20
19
Jan-
05 2
020
Apr-0
5 20
20
Jul-0
5 20
20
Oct-0
4 20
20
Mar
-14
2021
Mill
ions
New Trades FICO® Auto Score 8
Auto Loan Originations: Balances Total Balances Originated in $Millions; NSA . Average FICO® Auto Score 8
Source: Equifax Inc.
Auto: Loan
WEEKEND CURR YR PREV YR
Mar-01 2020 $11,268.3 $12,426.7
Mar-08 2020 $11,576.1 $10,862.0
Mar-15 2020 $11,022.7 $11,585.5
Mar-22 2020 $8,937.0 $12,095.7
Mar-29 2020 $7,531.0 $13,801.7
Apr-05 2020 $7,010.0 $10,577.9
Apr-12 2020 $6,809.4 $10,837.1
Apr-19 2020 $8,714.0 $11,154.8
Apr-26 2020 $10,172.0 $11,807.7
May-03 2020 $11,600.8 $11,520.9
May-10 2020 $10,824.2 $10,695.8
May-17 2020 $11,838.9 $11,335.8
TOTAL AUTO LOAN BALANCES
ORIGINATED (MILLIONS)
WEEKEND CURR YR PREV YR
May-24 2020 $13,290.6 $12,584.7
May-31 2020 $14,674.9 $13,092.2
Jun-07 2020 $11,786.5 $10,629.0
Jun-14 2020 $12,720.9 $11,188.8
Jun-21 2020 $13,117.6 $11,686.6
Jun-28 2020 $13,743.0 $13,502.2
Jul-05 2020 $12,751.9 $10,640.4
Jul-12 2020 $12,076.6 $11,227.7
Jul-19 2020 $12,264.1 $11,544.7
Jul-26 2020 $12,664.1 $12,148.4
Aug-02 2020 $13,542.4 $12,554.3
Aug-09 2020 $11,559.1 $11,280.8
TOTAL AUTO LOAN BALANCES
ORIGINATED (MILLIONS)
WEEKEND CURR YR PREV YR
Aug-16 2020 $12,258.6 $11,836.2
Aug-23 2020 $12,766.3 $12,334.5
Aug-30 2020 $13,556.7 $14,117.9
Sep-06 2020 $12,991.6 $10,694.1
Sep-13 2020 $11,714.2 $11,028.8
Sep-20 2020 $12,427.5 $11,416.2
Sep-27 2020 $13,114.7 $12,385.9
Oct-04 2020 $13,039.1 $11,368.6
Oct-11 2020 $11,529.0 $10,708.4
Oct-18 2020 $11,742.5 $10,823.0
Oct-25 2020 $12,202.7 $11,379.1
Nov-01 2020 $12,905.9 $11,661.0
TOTAL AUTO LOAN BALANCES
ORIGINATED (MILLIONS)
WEEKEND CURR YR PREV YR
Nov-08 2020 $10,552.1 $10,566.5
Nov-15 2020 $11,306.8 $10,927.2
Nov-22 2020 $11,908.8 $11,627.6
Nov-29 2020 $11,624.9 $12,021.5
Dec-06 2020 $11,694.9 $10,221.5
Dec-13 2020 $11,775.5 $10,720.1
Dec-20 2020 $11,520.6 $11,319.8
Dec-27 2020 $9,904.9 $10,991.0
Jan-03 2021 $13,571.5 $6,271.1
Jan-10 2021 $10,620.4 $9,589.9
Jan-17 2021 $10,390.1 $9,824.3
Jan-24 2021 $10,449.5 $10,330.2
TOTAL AUTO LOAN BALANCES
ORIGINATED (MILLIONS)
WEEKEND CURR YR PREV YR
Jan-31 2021 $11,141.1 $16,635.5
Feb-07 2021 $8,852.7 $9,671.6
Feb-14 2021 $8,764.1 $10,552.5
Feb-21 2021 $7,354.3 $11,358.3
Feb-28 2021 $6,299.6 $11,268.3
Mar-07 2021 $932.4 $11,576.1
Mar-14 2021 $305.3 $11,022.7
TOTAL AUTO LOAN BALANCES
ORIGINATED (MILLIONS)

43 PROPRIETARY |
Originations through March 14, 2021 reported as of March 16, 2021
536
542
548
554
560
566
572
578
584
0
25
50
75
100
125
150
175
200Ja
n-06
201
9
Apr-0
7 20
19
Jul-0
7 20
19
Oct-0
6 20
19
Jan-
05 2
020
Apr-0
5 20
20
Jul-0
5 20
20
Oct-0
4 20
20
Mar
-14
2021
Thou
sand
s
New Trades VS® 3.0
Subprime Auto Loan Originations: Accounts Number of Accounts in Thousands; NSA. Subprime Accounts, Average VantageScore® 3.0
Subprime accounts defined as those with borrower’s origination VantageScore® 3.0 less than 620
Source: Equifax Inc.
Auto: Loan
WEEKEND CURR YR PREV YR % TOTAL
Mar-01 2020 145.7 166.7 29.4%
Mar-08 2020 137.8 131.2 27.1%
Mar-15 2020 119.6 124.6 25.3%
Mar-22 2020 88.3 122.6 24.5%
Mar-29 2020 63.5 128.4 22.8%
Apr-05 2020 56.2 100.6 21.7%
Apr-12 2020 52.9 101.2 20.8%
Apr-19 2020 77.0 100.5 23.0%
Apr-26 2020 83.1 105.0 21.2%
May-03 2020 92.6 101.8 20.7%
May-10 2020 87.0 93.5 20.2%
May-17 2020 93.2 97.9 19.7%
# SUBPRIME AUTO LOAN ACCOUNTS
ORIGINATED (THOUSANDS)
WEEKEND CURR YR PREV YR % TOTAL
May-24 2020 100.8 102.9 19.2%
May-31 2020 102.0 101.0 18.0%
Jun-07 2020 88.6 92.2 18.3%
Jun-14 2020 96.1 95.9 18.5%
Jun-21 2020 95.9 98.3 18.0%
Jun-28 2020 97.6 109.1 17.8%
Jul-05 2020 88.1 86.0 17.4%
Jul-12 2020 89.0 96.2 18.1%
Jul-19 2020 90.8 99.5 18.3%
Jul-26 2020 91.9 102.6 18.2%
Aug-02 2020 94.7 104.5 17.8%
Aug-09 2020 83.1 96.4 17.9%
# SUBPRIME AUTO LOAN ACCOUNTS
ORIGINATED (THOUSANDS)
WEEKEND CURR YR PREV YR % TOTAL
Aug-16 2020 85.9 99.1 17.7%
Aug-23 2020 88.9 101.7 17.8%
Aug-30 2020 90.0 109.2 17.3%
Sep-06 2020 84.9 85.3 17.0%
Sep-13 2020 76.0 94.2 17.0%
Sep-20 2020 84.0 97.8 17.6%
Sep-27 2020 85.9 101.8 17.3%
Oct-04 2020 85.7 97.9 17.4%
Oct-11 2020 78.3 92.2 17.6%
Oct-18 2020 79.0 93.2 17.7%
Oct-25 2020 82.4 96.5 17.7%
Nov-01 2020 85.5 98.7 17.6%
# SUBPRIME AUTO LOAN ACCOUNTS
ORIGINATED (THOUSANDS)
WEEKEND CURR YR PREV YR % TOTAL
Nov-08 2020 72.7 91.3 17.9%
Nov-15 2020 76.6 92.6 17.9%
Nov-22 2020 82.0 100.8 18.2%
Nov-29 2020 71.0 90.9 16.8%
Dec-06 2020 76.0 86.6 17.5%
Dec-13 2020 75.2 88.7 17.3%
Dec-20 2020 70.3 88.9 16.8%
Dec-27 2020 53.5 74.2 15.3%
Jan-03 2021 69.9 49.0 14.7%
Jan-10 2021 76.3 84.8 18.6%
Jan-17 2021 76.1 89.1 18.9%
Jan-24 2021 73.0 91.6 18.3%
# SUBPRIME AUTO LOAN ACCOUNTS
ORIGINATED (THOUSANDS)
WEEKEND CURR YR PREV YR % TOTAL
Jan-31 2021 77.6 165.7 18.4%
Feb-07 2021 58.0 90.8 17.2%
Feb-14 2021 54.8 96.7 16.5%
Feb-21 2021 42.9 101.3 15.5%
Feb-28 2021 42.5 145.7 17.2%
Mar-07 2021 5.3 137.8 17.3%
Mar-14 2021 1.1 119.6 11.9%
# SUBPRIME AUTO LOAN ACCOUNTS
ORIGINATED (THOUSANDS)

44 PROPRIETARY |
Originations through March 14, 2021 reported as of March 16, 2021
533
539
545
551
557
563
569
575
581
0
21
42
63
84
105
126
147
168Ja
n-06
201
9
Apr-0
7 20
19
Jul-0
7 20
19
Oct-0
6 20
19
Jan-
05 2
020
Apr-0
5 20
20
Jul-0
5 20
20
Oct-0
4 20
20
Mar
-14
2021
Thou
sand
s
New Trades FICO® Auto Score 8
Subprime Auto Loan Originations: Accounts Number of Accounts in Thousands; NSA. Subprime Accounts, Average FICO® Auto Score 8 Subprime accounts defined as those with borrower’s origination FICO® Auto Score 8 less than 620
Source: Equifax Inc.
Auto: Loan
WEEKEND CURR YR PREV YR % TOTAL
Mar-01 2020 120.3 137.4 24.3%
Mar-08 2020 118.8 107.7 23.4%
Mar-15 2020 101.2 101.4 21.4%
Mar-22 2020 72.8 99.9 20.2%
Mar-29 2020 51.1 103.8 18.3%
Apr-05 2020 47.3 90.0 18.2%
Apr-12 2020 45.2 88.4 17.7%
Apr-19 2020 64.4 85.5 19.2%
Apr-26 2020 68.2 88.0 17.4%
May-03 2020 76.6 88.9 17.1%
May-10 2020 74.1 82.6 17.2%
May-17 2020 77.7 85.1 16.5%
# SUBPRIME AUTO LOAN ACCOUNTS
ORIGINATED (THOUSANDS)
WEEKEND CURR YR PREV YR % TOTAL
May-24 2020 82.1 87.0 15.6%
May-31 2020 82.4 86.3 14.6%
Jun-07 2020 78.9 82.5 16.3%
Jun-14 2020 83.6 84.7 16.1%
Jun-21 2020 82.1 84.7 15.4%
Jun-28 2020 81.8 92.5 14.9%
Jul-05 2020 76.8 77.0 15.2%
Jul-12 2020 79.3 84.5 16.2%
Jul-19 2020 79.2 85.9 16.0%
Jul-26 2020 78.8 87.3 15.6%
Aug-02 2020 81.1 90.7 15.3%
Aug-09 2020 74.2 85.1 16.0%
# SUBPRIME AUTO LOAN ACCOUNTS
ORIGINATED (THOUSANDS)
WEEKEND CURR YR PREV YR % TOTAL
Aug-16 2020 75.5 86.2 15.6%
Aug-23 2020 76.3 86.3 15.3%
Aug-30 2020 75.9 92.4 14.6%
Sep-06 2020 77.9 75.1 15.6%
Sep-13 2020 69.7 81.9 15.6%
Sep-20 2020 75.3 82.7 15.8%
Sep-27 2020 75.9 85.6 15.3%
Oct-04 2020 76.5 86.9 15.5%
Oct-11 2020 71.5 81.5 16.1%
Oct-18 2020 70.4 80.4 15.7%
Oct-25 2020 72.2 82.4 15.5%
Nov-01 2020 74.3 85.3 15.3%
# SUBPRIME AUTO LOAN ACCOUNTS
ORIGINATED (THOUSANDS)
WEEKEND CURR YR PREV YR % TOTAL
Nov-08 2020 66.6 81.2 16.4%
Nov-15 2020 69.0 80.1 16.1%
Nov-22 2020 72.8 86.5 16.2%
Nov-29 2020 62.0 76.8 14.6%
Dec-06 2020 70.0 77.3 16.2%
Dec-13 2020 68.7 77.9 15.8%
Dec-20 2020 63.4 76.4 15.1%
Dec-27 2020 47.3 62.7 13.5%
Jan-03 2021 61.3 43.8 12.9%
Jan-10 2021 68.2 74.9 16.6%
Jan-17 2021 67.4 77.3 16.7%
Jan-24 2021 63.7 78.1 16.0%
# SUBPRIME AUTO LOAN ACCOUNTS
ORIGINATED (THOUSANDS)
WEEKEND CURR YR PREV YR % TOTAL
Jan-31 2021 67.6 140.1 16.0%
Feb-07 2021 52.4 76.7 15.5%
Feb-14 2021 47.8 80.4 14.4%
Feb-21 2021 36.7 83.9 13.3%
Feb-28 2021 36.1 120.3 14.6%
Mar-07 2021 4.7 118.8 15.5%
Mar-14 2021 1.0 101.2 10.4%
# SUBPRIME AUTO LOAN ACCOUNTS
ORIGINATED (THOUSANDS)

45 PROPRIETARY |
Originations through March 14, 2021 reported as of March 16, 2021
536
542
548
554
560
566
572
578
584
0
474
947
1,421
1,895
2,369
2,842
3,316
3,790Ja
n-06
201
9
Apr-0
7 20
19
Jul-0
7 20
19
Oct-0
6 20
19
Jan-
05 2
020
Apr-0
5 20
20
Jul-0
5 20
20
Oct-0
4 20
20
Mar
-14
2021
Mill
ions
New Trades VS® 3.0
Subprime Auto Loan Originations: Balances Total Balances Originated in $Millions; NSA. Subprime Accounts, Average VantageScore® 3.0 Subprime accounts defined as those with borrower’s origination VantageScore® 3.0 less than 620
Source: Equifax Inc.
Auto: Loan
WEEKEND CURR YR PREV YR % TOTAL
Mar-01 2020 $2,573.5 $2,869.4 22.8%
Mar-08 2020 $2,466.7 $2,308.4 21.3%
Mar-15 2020 $2,230.3 $2,277.8 20.2%
Mar-22 2020 $1,728.5 $2,289.7 19.3%
Mar-29 2020 $1,341.1 $2,477.0 17.8%
Apr-05 2020 $1,178.9 $1,851.5 16.8%
Apr-12 2020 $1,095.5 $1,903.0 16.1%
Apr-19 2020 $1,526.3 $1,910.6 17.5%
Apr-26 2020 $1,639.3 $2,018.7 16.1%
May-03 2020 $1,800.0 $1,937.3 15.5%
May-10 2020 $1,660.0 $1,765.8 15.3%
May-17 2020 $1,800.7 $1,869.7 15.2%
TOTAL SUBPRIME AUTO LOAN BALANCES
ORIGINATED (MILLIONS)
WEEKEND CURR YR PREV YR % TOTAL
May-24 2020 $1,965.8 $1,988.5 14.8%
May-31 2020 $2,053.5 $2,010.1 14.0%
Jun-07 2020 $1,668.5 $1,735.8 14.2%
Jun-14 2020 $1,834.8 $1,829.2 14.4%
Jun-21 2020 $1,845.5 $1,901.4 14.1%
Jun-28 2020 $1,913.4 $2,146.9 13.9%
Jul-05 2020 $1,728.2 $1,677.1 13.6%
Jul-12 2020 $1,713.1 $1,845.0 14.2%
Jul-19 2020 $1,768.7 $1,916.7 14.4%
Jul-26 2020 $1,816.3 $1,992.7 14.3%
Aug-02 2020 $1,913.3 $2,031.2 14.1%
Aug-09 2020 $1,643.7 $1,837.0 14.2%
TOTAL SUBPRIME AUTO LOAN BALANCES
ORIGINATED (MILLIONS)
WEEKEND CURR YR PREV YR % TOTAL
Aug-16 2020 $1,731.6 $1,910.2 14.1%
Aug-23 2020 $1,810.0 $1,986.9 14.2%
Aug-30 2020 $1,870.7 $2,185.6 13.8%
Sep-06 2020 $1,749.6 $1,673.7 13.5%
Sep-13 2020 $1,588.8 $1,817.5 13.6%
Sep-20 2020 $1,730.5 $1,900.6 13.9%
Sep-27 2020 $1,793.0 $2,010.2 13.7%
Oct-04 2020 $1,779.6 $1,891.1 13.6%
Oct-11 2020 $1,601.3 $1,775.1 13.9%
Oct-18 2020 $1,636.7 $1,814.6 13.9%
Oct-25 2020 $1,704.2 $1,876.5 14.0%
Nov-01 2020 $1,787.8 $1,914.4 13.9%
TOTAL SUBPRIME AUTO LOAN BALANCES
ORIGINATED (MILLIONS)
WEEKEND CURR YR PREV YR % TOTAL
Nov-08 2020 $1,467.8 $1,736.0 13.9%
Nov-15 2020 $1,573.3 $1,785.2 13.9%
Nov-22 2020 $1,643.4 $1,899.0 13.8%
Nov-29 2020 $1,493.5 $1,802.6 12.8%
Dec-06 2020 $1,553.4 $1,630.1 13.3%
Dec-13 2020 $1,541.5 $1,679.7 13.1%
Dec-20 2020 $1,435.4 $1,708.5 12.5%
Dec-27 2020 $1,131.7 $1,496.3 11.4%
Jan-03 2021 $1,500.3 $963.0 11.1%
Jan-10 2021 $1,498.3 $1,602.9 14.1%
Jan-17 2021 $1,503.1 $1,692.2 14.5%
Jan-24 2021 $1,479.8 $1,765.5 14.2%
TOTAL SUBPRIME AUTO LOAN BALANCES
ORIGINATED (MILLIONS)
WEEKEND CURR YR PREV YR % TOTAL
Jan-31 2021 $1,598.7 $3,158.0 14.3%
Feb-07 2021 $1,206.2 $1,718.6 13.6%
Feb-14 2021 $1,160.1 $1,870.6 13.2%
Feb-21 2021 $919.0 $1,988.0 12.5%
Feb-28 2021 $851.2 $2,573.5 13.5%
Mar-07 2021 $124.5 $2,466.7 13.3%
Mar-14 2021 $31.4 $2,230.3 10.3%
TOTAL SUBPRIME AUTO LOAN BALANCES
ORIGINATED (MILLIONS)

46 PROPRIETARY |
Originations through March 14, 2021 reported as of March 16, 2021
533
539
545
551
557
563
569
575
581
0
393
786
1,179
1,572
1,965
2,357
2,750
3,143Ja
n-06
201
9
Apr-0
7 20
19
Jul-0
7 20
19
Oct-0
6 20
19
Jan-
05 2
020
Apr-0
5 20
20
Jul-0
5 20
20
Oct-0
4 20
20
Mar
-14
2021
Mill
ions
New Trades FICO® Auto Score 8
Subprime Auto Loan Originations: Balances Total Balances Originated in $Millions; NSA. Subprime Accounts, Average FICO® Auto Score 8 Subprime accounts defined as those with borrower’s origination FICO® Auto Score 8 less than 620
Source: Equifax Inc.
Auto: Loan
WEEKEND CURR YR PREV YR % TOTAL
Mar-01 2020 $2,088.8 $2,337.2 18.5%
Mar-08 2020 $2,119.1 $1,866.9 18.3%
Mar-15 2020 $1,860.6 $1,814.5 16.9%
Mar-22 2020 $1,386.9 $1,818.2 15.5%
Mar-29 2020 $1,023.9 $1,946.3 13.6%
Apr-05 2020 $955.5 $1,640.1 13.6%
Apr-12 2020 $911.7 $1,634.6 13.4%
Apr-19 2020 $1,236.3 $1,588.8 14.2%
Apr-26 2020 $1,290.9 $1,643.5 12.7%
May-03 2020 $1,436.2 $1,657.9 12.4%
May-10 2020 $1,385.1 $1,537.9 12.8%
May-17 2020 $1,461.1 $1,594.9 12.3%
TOTAL SUBPRIME AUTO LOAN BALANCES
ORIGINATED (MILLIONS)
WEEKEND CURR YR PREV YR % TOTAL
May-24 2020 $1,533.9 $1,633.3 11.5%
May-31 2020 $1,584.8 $1,672.1 10.8%
Jun-07 2020 $1,473.2 $1,534.5 12.5%
Jun-14 2020 $1,567.7 $1,587.6 12.3%
Jun-21 2020 $1,534.8 $1,595.3 11.7%
Jun-28 2020 $1,551.8 $1,761.1 11.3%
Jul-05 2020 $1,473.8 $1,483.3 11.6%
Jul-12 2020 $1,510.2 $1,594.8 12.5%
Jul-19 2020 $1,518.6 $1,620.4 12.4%
Jul-26 2020 $1,515.8 $1,646.6 12.0%
Aug-02 2020 $1,592.7 $1,722.7 11.8%
Aug-09 2020 $1,454.3 $1,600.1 12.6%
TOTAL SUBPRIME AUTO LOAN BALANCES
ORIGINATED (MILLIONS)
WEEKEND CURR YR PREV YR % TOTAL
Aug-16 2020 $1,499.0 $1,630.2 12.2%
Aug-23 2020 $1,511.8 $1,643.8 11.8%
Aug-30 2020 $1,524.6 $1,794.5 11.2%
Sep-06 2020 $1,584.7 $1,448.3 12.2%
Sep-13 2020 $1,433.6 $1,548.4 12.2%
Sep-20 2020 $1,519.8 $1,565.8 12.2%
Sep-27 2020 $1,539.2 $1,640.0 11.7%
Oct-04 2020 $1,553.8 $1,651.0 11.9%
Oct-11 2020 $1,443.1 $1,543.6 12.5%
Oct-18 2020 $1,430.2 $1,540.0 12.2%
Oct-25 2020 $1,447.9 $1,561.9 11.9%
Nov-01 2020 $1,509.0 $1,618.6 11.7%
TOTAL SUBPRIME AUTO LOAN BALANCES
ORIGINATED (MILLIONS)
WEEKEND CURR YR PREV YR % TOTAL
Nov-08 2020 $1,329.5 $1,525.6 12.6%
Nov-15 2020 $1,394.2 $1,514.7 12.3%
Nov-22 2020 $1,418.6 $1,573.4 11.9%
Nov-29 2020 $1,257.7 $1,475.1 10.8%
Dec-06 2020 $1,420.1 $1,434.3 12.1%
Dec-13 2020 $1,387.5 $1,440.5 11.8%
Dec-20 2020 $1,268.2 $1,420.1 11.0%
Dec-27 2020 $968.3 $1,221.8 9.8%
Jan-03 2021 $1,276.9 $850.8 9.4%
Jan-10 2021 $1,324.7 $1,397.2 12.5%
Jan-17 2021 $1,310.2 $1,445.4 12.6%
Jan-24 2021 $1,260.7 $1,471.2 12.1%
TOTAL SUBPRIME AUTO LOAN BALANCES
ORIGINATED (MILLIONS)
WEEKEND CURR YR PREV YR % TOTAL
Jan-31 2021 $1,350.0 $2,619.4 12.1%
Feb-07 2021 $1,069.7 $1,420.9 12.1%
Feb-14 2021 $983.8 $1,514.6 11.2%
Feb-21 2021 $755.0 $1,600.4 10.3%
Feb-28 2021 $689.0 $2,088.8 10.9%
Mar-07 2021 $110.1 $2,119.1 11.8%
Mar-14 2021 $26.3 $1,860.6 8.6%
TOTAL SUBPRIME AUTO LOAN BALANCES
ORIGINATED (MILLIONS)

47 PROPRIETARY |
Originations through March 14, 2021 reported as of March 16, 2021
$0
$5,000
$10,000
$15,000
$20,000
$25,000
$30,000
$35,000
Jan-
07 20
18
Apr-0
8 20
18
Jul-0
8 201
8
Oct-0
7 201
8
Jan-
06 20
19
Apr-0
7 20
19
Jul-0
7 201
9
Oct-0
6 201
9
Jan-
05 20
20
Apr-0
5 20
20
Jul-0
5 202
0
Oct-0
4 202
0
Mar
-14 2
021
Auto Loan Origination Loan Amount Subprime Auto Loan Origination Loan Amount
Auto Loan Average Origination Balance Average Origination Balance Over Time; NSA Subprime accounts defined as those with borrower’s origination VantageScore® 3.0 less than 620
Source: Equifax Inc.
Auto: Loan

48 PROPRIETARY |
Originations through March 14, 2021 reported as of March 16, 2021
$0
$5,000
$10,000
$15,000
$20,000
$25,000
$30,000
$35,000
Jan-
07 20
18
Apr-0
8 20
18
Jul-0
8 201
8
Oct-0
7 201
8
Jan-
06 20
19
Apr-0
7 20
19
Jul-0
7 201
9
Oct-0
6 201
9
Jan-
05 20
20
Apr-0
5 20
20
Jul-0
5 202
0
Oct-0
4 202
0
Mar
-14 2
021
Auto Loan Origination Loan Amount Subprime Auto Loan Origination Loan Amount
Auto Loan Average Origination Balance Average Origination Balance Over Time; NSA Subprime accounts defined as those with borrower’s origination FICO® Auto Score 8 less than 620
Source: Equifax Inc.
Auto: Loan

49 PROPRIETARY |
Originations through March 14, 2021 reported as of March 16, 2021
0%
4%
7%
11%
14%
18%
22%
25%
$0
$2,306
$4,612
$6,918
$9,224
$11,530
$13,836
$16,142M
ar-0
1 202
0
Mar
-08 2
020
Mar
-15 2
020
Mar
-22 2
020
Mar
-29 2
020
Apr-0
5 20
20
Apr-1
2 20
20
Apr-1
9 20
20
Apr-2
6 20
20
May
-03
2020
May
-10
2020
May
-17
2020
May
-24
2020
May
-31
2020
Jun-
07 2
020
Jun-
14 2
020
Jun-
21 2
020
Jun-
28 2
020
Jul-0
5 20
20
Jul-1
2 20
20
Jul-1
9 20
20
Jul-2
6 20
20
Aug-
02 2
020
Aug-
09 2
020
Aug-
16 2
020
Aug-
23 2
020
Aug-
30 2
020
Sep-
06 20
20
Sep-
13 20
20
Sep-
20 20
20
Sep-
27 20
20
Oct-0
4 20
20
Oct-1
1 20
20
Oct-1
8 20
20
Oct-2
5 20
20
Nov-
01 2
020
Nov-
08 2
020
Nov-
15 2
020
Nov-
22 2
020
Nov-
29 2
020
Dec-0
6 20
20
Dec-1
3 20
20
Dec-2
0 20
20
Dec-2
7 20
20
Jan-
03 2
021
Jan-
10 2
021
Jan-
17 2
021
Jan-
24 2
021
Jan-
31 2
021
Feb-
07 20
21
Feb-
14 20
21
Feb-
21 20
21
Feb-
28 20
21
Mar
-07 2
021
Mar
-14 2
021
Subp
rime S
hare
Milli
ons
Auto Loan Origination Auto Loan Origination Subprime Share
Auto Loan Originations Total Originations in $Millions; NSA Subprime accounts defined as those with borrower’s origination VantageScore® 3.0 less than 620
Source: Equifax Inc.
Auto: Loan

50 PROPRIETARY |
Originations through March 14, 2021 reported as of March 16, 2021
0%
3%
6%
9%
12%
15%
17%
20%
$0
$2,306
$4,612
$6,918
$9,224
$11,530
$13,836
$16,142M
ar-0
1 202
0
Mar
-08 2
020
Mar
-15 2
020
Mar
-22 2
020
Mar
-29 2
020
Apr-0
5 20
20
Apr-1
2 20
20
Apr-1
9 20
20
Apr-2
6 20
20
May
-03
2020
May
-10
2020
May
-17
2020
May
-24
2020
May
-31
2020
Jun-
07 2
020
Jun-
14 2
020
Jun-
21 2
020
Jun-
28 2
020
Jul-0
5 20
20
Jul-1
2 20
20
Jul-1
9 20
20
Jul-2
6 20
20
Aug-
02 2
020
Aug-
09 2
020
Aug-
16 2
020
Aug-
23 2
020
Aug-
30 2
020
Sep-
06 20
20
Sep-
13 20
20
Sep-
20 20
20
Sep-
27 20
20
Oct-0
4 20
20
Oct-1
1 20
20
Oct-1
8 20
20
Oct-2
5 20
20
Nov-
01 2
020
Nov-
08 2
020
Nov-
15 2
020
Nov-
22 2
020
Nov-
29 2
020
Dec-0
6 20
20
Dec-1
3 20
20
Dec-2
0 20
20
Dec-2
7 20
20
Jan-
03 2
021
Jan-
10 2
021
Jan-
17 2
021
Jan-
24 2
021
Jan-
31 2
021
Feb-
07 20
21
Feb-
14 20
21
Feb-
21 20
21
Feb-
28 20
21
Mar
-07 2
021
Mar
-14 2
021
Subp
rime S
hare
Milli
ons
Auto Loan Origination Auto Loan Origination Subprime Share
Auto Loan Originations Total Originations in $Millions; NSA Subprime accounts defined as those with borrower’s origination FICO® Auto Score 8 less than 620
Source: Equifax Inc.
Auto: Loan

51 PROPRIETARY |
Originations through March 14, 2021 reported as of March 16, 2021
660
668
676
684
692
700
708
716
724
732
740
0%
10%
20%
30%
40%
50%
60%
70%
80%
90%
100%
Mar
-01 2
020
Mar
-08 2
020
Mar
-15 2
020
Mar
-22 2
020
Mar
-29 2
020
Apr-0
5 20
20
Apr-1
2 20
20
Apr-1
9 20
20
Apr-2
6 20
20
May
-03
2020
May
-10
2020
May
-17
2020
May
-24
2020
May
-31
2020
Jun-
07 2
020
Jun-
14 2
020
Jun-
21 2
020
Jun-
28 2
020
Jul-0
5 20
20
Jul-1
2 20
20
Jul-1
9 20
20
Jul-2
6 20
20
Aug-
02 2
020
Aug-
09 2
020
Aug-
16 2
020
Aug-
23 2
020
Aug-
30 2
020
Sep-
06 20
20
Sep-
13 20
20
Sep-
20 20
20
Sep-
27 20
20
Oct-0
4 20
20
Oct-1
1 20
20
Oct-1
8 20
20
Oct-2
5 20
20
Nov-
01 2
020
Nov-
08 2
020
Nov-
15 2
020
Nov-
22 2
020
Nov-
29 2
020
Dec-0
6 20
20
Dec-1
3 20
20
Dec-2
0 20
20
Dec-2
7 20
20
Jan-
03 2
021
Jan-
10 2
021
Jan-
17 2
021
Jan-
24 2
021
Jan-
31 2
021
Feb-
07 20
21
Feb-
14 20
21
Feb-
21 20
21
Feb-
28 20
21
Mar
-07 2
021
Mar
-14 2
021
300-539 540-579 580-619 620-659 660-699 700-739 740-779 780-850 no score Avg. VS® 3.0
Auto Loan Origination Risk VantageScore® 3.0 Distribution for Auto Loan Originations by Week (Percent of Accounts)
Source: Equifax Inc.
Auto: Loan
The last 8 weeks of weekly data is subject to revision due to reporting lags by data furnishers.

52 PROPRIETARY |
Originations through March 14, 2021 reported as of March 16, 2021
677
684
691
698
705
712
719
726
733
740
747
0%
10%
20%
30%
40%
50%
60%
70%
80%
90%
100%
Mar
-01 2
020
Mar
-08 2
020
Mar
-15 2
020
Mar
-22 2
020
Mar
-29 2
020
Apr-0
5 20
20
Apr-1
2 20
20
Apr-1
9 20
20
Apr-2
6 20
20
May
-03
2020
May
-10
2020
May
-17
2020
May
-24
2020
May
-31
2020
Jun-
07 2
020
Jun-
14 2
020
Jun-
21 2
020
Jun-
28 2
020
Jul-0
5 20
20
Jul-1
2 20
20
Jul-1
9 20
20
Jul-2
6 20
20
Aug-
02 2
020
Aug-
09 2
020
Aug-
16 2
020
Aug-
23 2
020
Aug-
30 2
020
Sep-
06 20
20
Sep-
13 20
20
Sep-
20 20
20
Sep-
27 20
20
Oct-0
4 20
20
Oct-1
1 20
20
Oct-1
8 20
20
Oct-2
5 20
20
Nov-
01 2
020
Nov-
08 2
020
Nov-
15 2
020
Nov-
22 2
020
Nov-
29 2
020
Dec-0
6 20
20
Dec-1
3 20
20
Dec-2
0 20
20
Dec-2
7 20
20
Jan-
03 2
021
Jan-
10 2
021
Jan-
17 2
021
Jan-
24 2
021
Jan-
31 2
021
Feb-
07 20
21
Feb-
14 20
21
Feb-
21 20
21
Feb-
28 20
21
Mar
-07 2
021
Mar
-14 2
021
250-539 540-579 580-619 620-659 660-699 700-739 740-779 780-900 no score Avg. FICO® Auto Score 8
Auto Loan Origination Risk FICO® Auto Score 8 Distribution for Auto Originations by Week (% of Accounts)
Source: Equifax Inc.
Auto: Loan
The last 8 weeks of weekly data is subject to revision due to reporting lags by data furnishers.

53 PROPRIETARY |
Credit Trends Originations: Bankcard

54 PROPRIETARY |
Originations through March 14, 2021 reported as of March 16, 2021
US Bankcard Originations Observations Originations Estimates through March 14, 2021 reported as of March 16, 2021
Credit Cards: Bankcard
• Around 200,600 bankcards have been originated the week ending March 14th.
• Total bankcard credit limits originated during the week ending March 14th are $680.2 million.
• Around 27,400 bankcards have been issued during the week ending March 14th to consumers with a VantageScore® 3.0 credit score below 620. These are generally considered subprime accounts. These newly-issued cards have a corresponding total credit limit of $28.0 million.
• In the week ending March 14th, 13.6% of new bankcards were issued to consumers with a VantageScore® 3.0 subprime credit score, with their share of new total credit limits at 4.1%.
• Around 24,700 bankcards have been issued during the week ending March 14th to consumers with a FICO® Score 9 credit score below 620. These are generally considered subprime accounts. These newly-issued cards have a corresponding total credit limit of $22.6 million.
• In the week ending March 14th, 12.3% of new bankcards were issued to consumers with a FICO® Score 9 subprime credit score, with their share of new total credit limits at 3.3%.
• The average credit limit for all bankcards issued in the week ending March 14th was $3,391. The average credit limit on new subprime cards was $1,025.

55 PROPRIETARY |
Originations through March 14, 2021 reported as of March 16, 2021
662
671
680
689
698
707
716
725
734
0
260
520
780
1,040
1,300
1,560
1,820
2,079
Jan-
06 2
019
Apr-0
7 20
19
Jul-0
7 20
19
Oct-0
6 20
19
Jan-
05 2
020
Apr-0
5 20
20
Jul-0
5 20
20
Oct-0
4 20
20
Mar
-14
2021
Thou
sand
s
New Trades VS® 3.0
Bankcard Originations: Accounts Number of Accounts in Thousands; NSA. Average VantageScore® 3.0
Source: Equifax Inc.
Credit Cards: Bankcard
WEEKEND CURR YR PREV YR
Mar-01 2020 1,242.6 1,310.1
Mar-08 2020 1,363.5 1,212.1
Mar-15 2020 1,182.5 1,331.5
Mar-22 2020 896.7 1,239.7
Mar-29 2020 701.5 1,221.2
Apr-05 2020 662.5 1,304.8
Apr-12 2020 619.3 1,268.1
Apr-19 2020 647.3 1,210.1
Apr-26 2020 616.1 1,254.7
May-03 2020 623.7 1,311.7
May-10 2020 626.8 1,253.9
May-17 2020 628.5 1,283.5
# BANKCARD ACCOUNTS
ORIGINATED (THOUSANDS)
WEEKEND CURR YR PREV YR
May-24 2020 628.0 1,277.3
May-31 2020 593.4 1,212.9
Jun-07 2020 681.0 1,299.2
Jun-14 2020 722.0 1,328.2
Jun-21 2020 750.2 1,313.5
Jun-28 2020 757.1 1,290.4
Jul-05 2020 790.9 1,240.6
Jul-12 2020 803.3 1,314.0
Jul-19 2020 827.9 1,356.4
Jul-26 2020 885.3 1,261.6
Aug-02 2020 894.4 1,366.0
Aug-09 2020 959.6 1,462.4
# BANKCARD ACCOUNTS
ORIGINATED (THOUSANDS)
WEEKEND CURR YR PREV YR
Aug-16 2020 911.2 1,540.8
Aug-23 2020 942.8 1,732.9
Aug-30 2020 890.1 1,400.0
Sep-06 2020 960.9 1,357.3
Sep-13 2020 894.0 1,475.5
Sep-20 2020 964.5 1,364.7
Sep-27 2020 910.9 1,529.9
Oct-04 2020 925.6 1,364.4
Oct-11 2020 996.9 1,449.5
Oct-18 2020 1,130.7 1,322.1
Oct-25 2020 1,071.9 1,392.5
Nov-01 2020 1,118.5 1,387.6
# BANKCARD ACCOUNTS
ORIGINATED (THOUSANDS)
WEEKEND CURR YR PREV YR
Nov-08 2020 1,189.6 1,503.0
Nov-15 2020 1,202.3 1,470.3
Nov-22 2020 1,214.8 1,500.3
Nov-29 2020 1,197.8 1,645.1
Dec-06 2020 1,295.7 1,608.8
Dec-13 2020 1,191.6 1,598.9
Dec-20 2020 1,126.5 1,445.8
Dec-27 2020 790.0 1,021.5
Jan-03 2021 856.4 848.4
Jan-10 2021 945.7 1,267.6
Jan-17 2021 984.4 1,269.6
Jan-24 2021 912.9 1,212.2
# BANKCARD ACCOUNTS
ORIGINATED (THOUSANDS)
WEEKEND CURR YR PREV YR
Jan-31 2021 918.7 1,480.3
Feb-07 2021 810.0 1,260.3
Feb-14 2021 814.8 1,264.5
Feb-21 2021 642.2 1,261.7
Feb-28 2021 534.7 1,242.6
Mar-07 2021 351.2 1,363.5
Mar-14 2021 200.6 1,182.5
# BANKCARD ACCOUNTS
ORIGINATED (THOUSANDS)
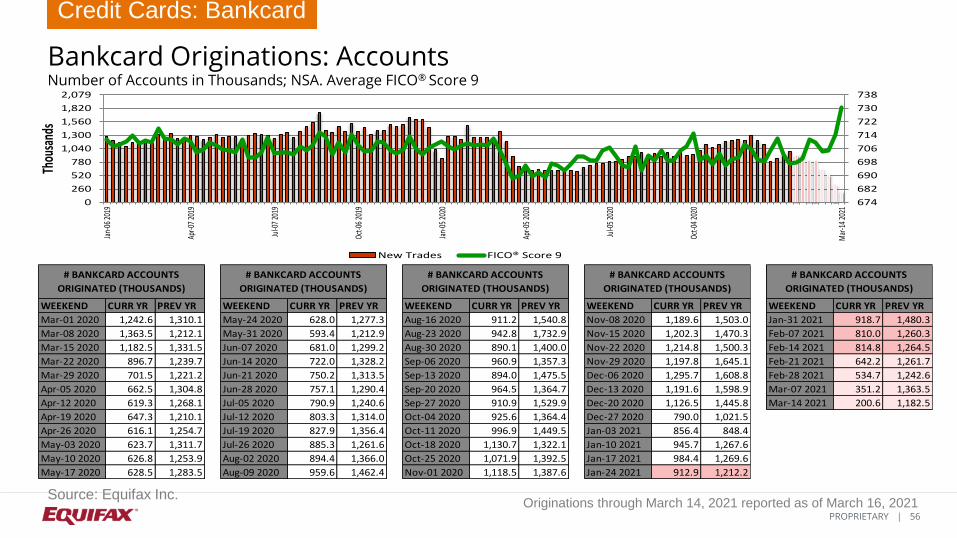
56 PROPRIETARY |
Originations through March 14, 2021 reported as of March 16, 2021
674
682
690
698
706
714
722
730
738
0
260
520
780
1,040
1,300
1,560
1,820
2,079
Jan-
06 2
019
Apr-0
7 20
19
Jul-0
7 20
19
Oct-0
6 20
19
Jan-
05 2
020
Apr-0
5 20
20
Jul-0
5 20
20
Oct-0
4 20
20
Mar
-14
2021
Thou
sand
s
New Trades FICO® Score 9
Bankcard Originations: Accounts Number of Accounts in Thousands; NSA. Average FICO® Score 9
Source: Equifax Inc.
Credit Cards: Bankcard
WEEKEND CURR YR PREV YR
Mar-01 2020 1,242.6 1,310.1
Mar-08 2020 1,363.5 1,212.1
Mar-15 2020 1,182.5 1,331.5
Mar-22 2020 896.7 1,239.7
Mar-29 2020 701.5 1,221.2
Apr-05 2020 662.5 1,304.8
Apr-12 2020 619.3 1,268.1
Apr-19 2020 647.3 1,210.1
Apr-26 2020 616.1 1,254.7
May-03 2020 623.7 1,311.7
May-10 2020 626.8 1,253.9
May-17 2020 628.5 1,283.5
# BANKCARD ACCOUNTS
ORIGINATED (THOUSANDS)
WEEKEND CURR YR PREV YR
May-24 2020 628.0 1,277.3
May-31 2020 593.4 1,212.9
Jun-07 2020 681.0 1,299.2
Jun-14 2020 722.0 1,328.2
Jun-21 2020 750.2 1,313.5
Jun-28 2020 757.1 1,290.4
Jul-05 2020 790.9 1,240.6
Jul-12 2020 803.3 1,314.0
Jul-19 2020 827.9 1,356.4
Jul-26 2020 885.3 1,261.6
Aug-02 2020 894.4 1,366.0
Aug-09 2020 959.6 1,462.4
# BANKCARD ACCOUNTS
ORIGINATED (THOUSANDS)
WEEKEND CURR YR PREV YR
Aug-16 2020 911.2 1,540.8
Aug-23 2020 942.8 1,732.9
Aug-30 2020 890.1 1,400.0
Sep-06 2020 960.9 1,357.3
Sep-13 2020 894.0 1,475.5
Sep-20 2020 964.5 1,364.7
Sep-27 2020 910.9 1,529.9
Oct-04 2020 925.6 1,364.4
Oct-11 2020 996.9 1,449.5
Oct-18 2020 1,130.7 1,322.1
Oct-25 2020 1,071.9 1,392.5
Nov-01 2020 1,118.5 1,387.6
# BANKCARD ACCOUNTS
ORIGINATED (THOUSANDS)
WEEKEND CURR YR PREV YR
Nov-08 2020 1,189.6 1,503.0
Nov-15 2020 1,202.3 1,470.3
Nov-22 2020 1,214.8 1,500.3
Nov-29 2020 1,197.8 1,645.1
Dec-06 2020 1,295.7 1,608.8
Dec-13 2020 1,191.6 1,598.9
Dec-20 2020 1,126.5 1,445.8
Dec-27 2020 790.0 1,021.5
Jan-03 2021 856.4 848.4
Jan-10 2021 945.7 1,267.6
Jan-17 2021 984.4 1,269.6
Jan-24 2021 912.9 1,212.2
# BANKCARD ACCOUNTS
ORIGINATED (THOUSANDS)
WEEKEND CURR YR PREV YR
Jan-31 2021 918.7 1,480.3
Feb-07 2021 810.0 1,260.3
Feb-14 2021 814.8 1,264.5
Feb-21 2021 642.2 1,261.7
Feb-28 2021 534.7 1,242.6
Mar-07 2021 351.2 1,363.5
Mar-14 2021 200.6 1,182.5
# BANKCARD ACCOUNTS
ORIGINATED (THOUSANDS)
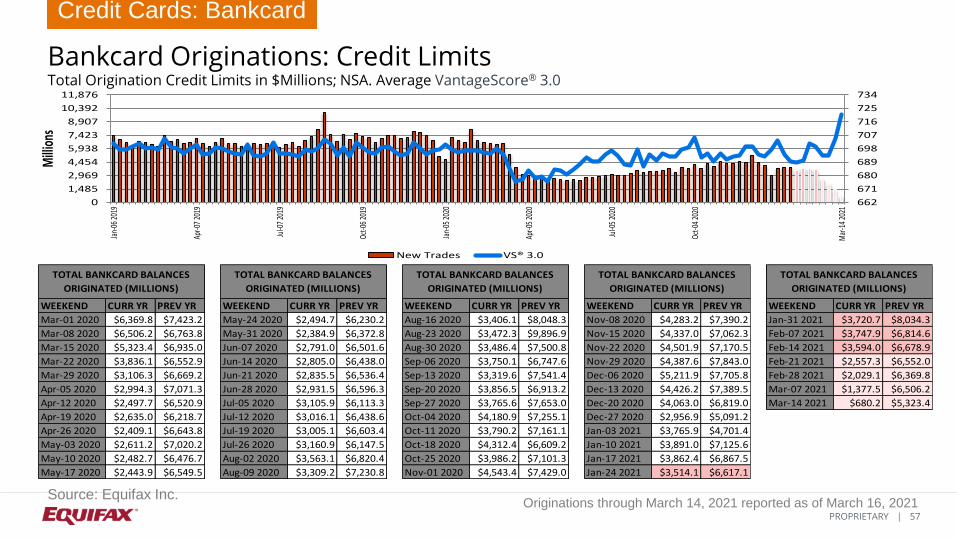
57 PROPRIETARY |
Originations through March 14, 2021 reported as of March 16, 2021
662
671
680
689
698
707
716
725
734
0
1,485
2,969
4,454
5,938
7,423
8,907
10,392
11,876
Jan-
06 2
019
Apr-0
7 20
19
Jul-0
7 20
19
Oct-0
6 20
19
Jan-
05 2
020
Apr-0
5 20
20
Jul-0
5 20
20
Oct-0
4 20
20
Mar
-14
2021
Mill
ions
New Trades VS® 3.0
Bankcard Originations: Credit Limits Total Origination Credit Limits in $Millions; NSA. Average VantageScore® 3.0
Source: Equifax Inc.
Credit Cards: Bankcard
WEEKEND CURR YR PREV YR
Mar-01 2020 $6,369.8 $7,423.2
Mar-08 2020 $6,506.2 $6,763.8
Mar-15 2020 $5,323.4 $6,935.0
Mar-22 2020 $3,836.1 $6,552.9
Mar-29 2020 $3,106.3 $6,669.2
Apr-05 2020 $2,994.3 $7,071.3
Apr-12 2020 $2,497.7 $6,520.9
Apr-19 2020 $2,635.0 $6,218.7
Apr-26 2020 $2,409.1 $6,643.8
May-03 2020 $2,611.2 $7,020.2
May-10 2020 $2,482.7 $6,476.7
May-17 2020 $2,443.9 $6,549.5
TOTAL BANKCARD BALANCES
ORIGINATED (MILLIONS)
WEEKEND CURR YR PREV YR
May-24 2020 $2,494.7 $6,230.2
May-31 2020 $2,384.9 $6,372.8
Jun-07 2020 $2,791.0 $6,501.6
Jun-14 2020 $2,805.0 $6,438.0
Jun-21 2020 $2,835.5 $6,536.4
Jun-28 2020 $2,931.5 $6,596.3
Jul-05 2020 $3,105.9 $6,113.3
Jul-12 2020 $3,016.1 $6,438.6
Jul-19 2020 $3,005.1 $6,603.4
Jul-26 2020 $3,160.9 $6,147.5
Aug-02 2020 $3,563.1 $6,820.4
Aug-09 2020 $3,309.2 $7,230.8
TOTAL BANKCARD BALANCES
ORIGINATED (MILLIONS)
WEEKEND CURR YR PREV YR
Aug-16 2020 $3,406.1 $8,048.3
Aug-23 2020 $3,472.3 $9,896.9
Aug-30 2020 $3,486.4 $7,500.8
Sep-06 2020 $3,750.1 $6,747.6
Sep-13 2020 $3,319.6 $7,541.4
Sep-20 2020 $3,856.5 $6,913.2
Sep-27 2020 $3,765.6 $7,653.0
Oct-04 2020 $4,180.9 $7,255.1
Oct-11 2020 $3,790.2 $7,161.1
Oct-18 2020 $4,312.4 $6,609.2
Oct-25 2020 $3,986.2 $7,101.3
Nov-01 2020 $4,543.4 $7,429.0
TOTAL BANKCARD BALANCES
ORIGINATED (MILLIONS)
WEEKEND CURR YR PREV YR
Nov-08 2020 $4,283.2 $7,390.2
Nov-15 2020 $4,337.0 $7,062.3
Nov-22 2020 $4,501.9 $7,170.5
Nov-29 2020 $4,387.6 $7,843.0
Dec-06 2020 $5,211.9 $7,705.8
Dec-13 2020 $4,426.2 $7,389.5
Dec-20 2020 $4,063.0 $6,819.0
Dec-27 2020 $2,956.9 $5,091.2
Jan-03 2021 $3,765.9 $4,701.4
Jan-10 2021 $3,891.0 $7,125.6
Jan-17 2021 $3,862.4 $6,867.5
Jan-24 2021 $3,514.1 $6,617.1
TOTAL BANKCARD BALANCES
ORIGINATED (MILLIONS)
WEEKEND CURR YR PREV YR
Jan-31 2021 $3,720.7 $8,034.3
Feb-07 2021 $3,747.9 $6,814.6
Feb-14 2021 $3,594.0 $6,678.9
Feb-21 2021 $2,557.3 $6,552.0
Feb-28 2021 $2,029.1 $6,369.8
Mar-07 2021 $1,377.5 $6,506.2
Mar-14 2021 $680.2 $5,323.4
TOTAL BANKCARD BALANCES
ORIGINATED (MILLIONS)
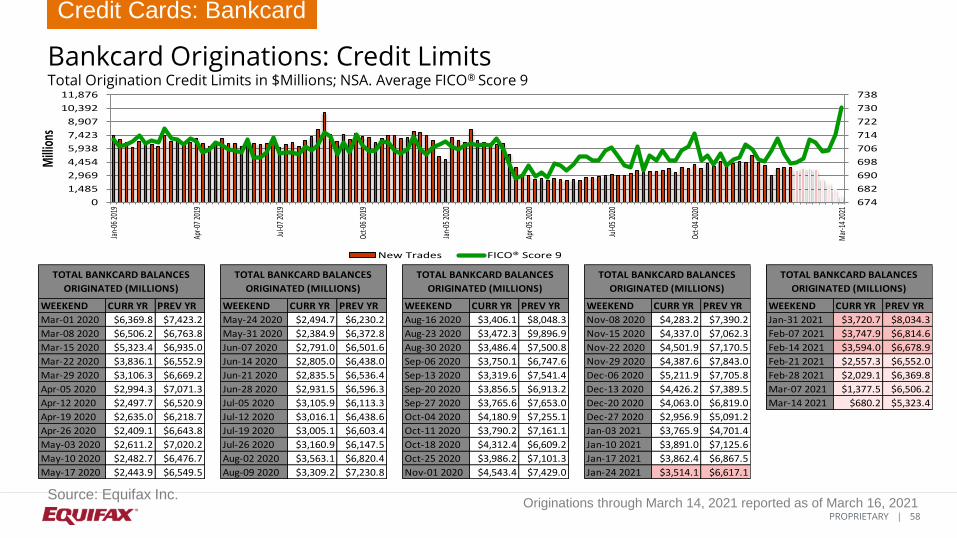
58 PROPRIETARY |
Originations through March 14, 2021 reported as of March 16, 2021
674
682
690
698
706
714
722
730
738
0
1,485
2,969
4,454
5,938
7,423
8,907
10,392
11,876
Jan-
06 2
019
Apr-0
7 20
19
Jul-0
7 20
19
Oct-0
6 20
19
Jan-
05 2
020
Apr-0
5 20
20
Jul-0
5 20
20
Oct-0
4 20
20
Mar
-14
2021
Mill
ions
New Trades FICO® Score 9
Bankcard Originations: Credit Limits Total Origination Credit Limits in $Millions; NSA. Average FICO® Score 9
Source: Equifax Inc.
Credit Cards: Bankcard
WEEKEND CURR YR PREV YR
Mar-01 2020 $6,369.8 $7,423.2
Mar-08 2020 $6,506.2 $6,763.8
Mar-15 2020 $5,323.4 $6,935.0
Mar-22 2020 $3,836.1 $6,552.9
Mar-29 2020 $3,106.3 $6,669.2
Apr-05 2020 $2,994.3 $7,071.3
Apr-12 2020 $2,497.7 $6,520.9
Apr-19 2020 $2,635.0 $6,218.7
Apr-26 2020 $2,409.1 $6,643.8
May-03 2020 $2,611.2 $7,020.2
May-10 2020 $2,482.7 $6,476.7
May-17 2020 $2,443.9 $6,549.5
TOTAL BANKCARD BALANCES
ORIGINATED (MILLIONS)
WEEKEND CURR YR PREV YR
May-24 2020 $2,494.7 $6,230.2
May-31 2020 $2,384.9 $6,372.8
Jun-07 2020 $2,791.0 $6,501.6
Jun-14 2020 $2,805.0 $6,438.0
Jun-21 2020 $2,835.5 $6,536.4
Jun-28 2020 $2,931.5 $6,596.3
Jul-05 2020 $3,105.9 $6,113.3
Jul-12 2020 $3,016.1 $6,438.6
Jul-19 2020 $3,005.1 $6,603.4
Jul-26 2020 $3,160.9 $6,147.5
Aug-02 2020 $3,563.1 $6,820.4
Aug-09 2020 $3,309.2 $7,230.8
TOTAL BANKCARD BALANCES
ORIGINATED (MILLIONS)
WEEKEND CURR YR PREV YR
Aug-16 2020 $3,406.1 $8,048.3
Aug-23 2020 $3,472.3 $9,896.9
Aug-30 2020 $3,486.4 $7,500.8
Sep-06 2020 $3,750.1 $6,747.6
Sep-13 2020 $3,319.6 $7,541.4
Sep-20 2020 $3,856.5 $6,913.2
Sep-27 2020 $3,765.6 $7,653.0
Oct-04 2020 $4,180.9 $7,255.1
Oct-11 2020 $3,790.2 $7,161.1
Oct-18 2020 $4,312.4 $6,609.2
Oct-25 2020 $3,986.2 $7,101.3
Nov-01 2020 $4,543.4 $7,429.0
TOTAL BANKCARD BALANCES
ORIGINATED (MILLIONS)
WEEKEND CURR YR PREV YR
Nov-08 2020 $4,283.2 $7,390.2
Nov-15 2020 $4,337.0 $7,062.3
Nov-22 2020 $4,501.9 $7,170.5
Nov-29 2020 $4,387.6 $7,843.0
Dec-06 2020 $5,211.9 $7,705.8
Dec-13 2020 $4,426.2 $7,389.5
Dec-20 2020 $4,063.0 $6,819.0
Dec-27 2020 $2,956.9 $5,091.2
Jan-03 2021 $3,765.9 $4,701.4
Jan-10 2021 $3,891.0 $7,125.6
Jan-17 2021 $3,862.4 $6,867.5
Jan-24 2021 $3,514.1 $6,617.1
TOTAL BANKCARD BALANCES
ORIGINATED (MILLIONS)
WEEKEND CURR YR PREV YR
Jan-31 2021 $3,720.7 $8,034.3
Feb-07 2021 $3,747.9 $6,814.6
Feb-14 2021 $3,594.0 $6,678.9
Feb-21 2021 $2,557.3 $6,552.0
Feb-28 2021 $2,029.1 $6,369.8
Mar-07 2021 $1,377.5 $6,506.2
Mar-14 2021 $680.2 $5,323.4
TOTAL BANKCARD BALANCES
ORIGINATED (MILLIONS)

59 PROPRIETARY |
Originations through March 14, 2021 reported as of March 16, 2021
546
550
554
558
562
566
570
574
578
0
52
104
156
209
261
313
365
417Ja
n-06
201
9
Apr-0
7 20
19
Jul-0
7 20
19
Oct-0
6 20
19
Jan-
05 2
020
Apr-0
5 20
20
Jul-0
5 20
20
Oct-0
4 20
20
Mar
-14
2021
Thou
sand
s
New Trades VS® 3.0
Subprime Bankcard Originations: Accounts Number of Accounts in Thousands; NSA. Subprime Accounts, Average VantageScore® 3.0
Subprime accounts defined as those with borrower’s origination VantageScore® 3.0 less than 620
Source: Equifax Inc.
Credit Cards: Bankcard
WEEKEND CURR YR PREV YR % TOTAL
Mar-01 2020 240.1 231.0 19.3%
Mar-08 2020 297.3 239.3 21.8%
Mar-15 2020 286.5 267.8 24.2%
Mar-22 2020 238.9 264.0 26.6%
Mar-29 2020 184.5 243.8 26.3%
Apr-05 2020 158.5 247.3 23.9%
Apr-12 2020 161.2 268.9 26.0%
Apr-19 2020 168.0 250.9 25.9%
Apr-26 2020 174.3 244.8 28.3%
May-03 2020 156.9 258.4 25.2%
May-10 2020 156.9 252.6 25.0%
May-17 2020 167.5 267.2 26.7%
# SUBPRIME BANKCARD ACCOUNTS
ORIGINATED (THOUSANDS)
WEEKEND CURR YR PREV YR % TOTAL
May-24 2020 160.2 273.6 25.5%
May-31 2020 145.5 223.4 24.5%
Jun-07 2020 154.4 278.8 22.7%
Jun-14 2020 171.3 287.9 23.7%
Jun-21 2020 179.3 270.9 23.9%
Jun-28 2020 167.2 237.3 22.1%
Jul-05 2020 168.1 258.6 21.3%
Jul-12 2020 178.7 269.4 22.2%
Jul-19 2020 203.8 277.2 24.6%
Jul-26 2020 223.6 266.6 25.3%
Aug-02 2020 189.7 269.1 21.2%
Aug-09 2020 243.2 290.7 25.3%
# SUBPRIME BANKCARD ACCOUNTS
ORIGINATED (THOUSANDS)
WEEKEND CURR YR PREV YR % TOTAL
Aug-16 2020 197.7 300.0 21.7%
Aug-23 2020 219.0 301.0 23.2%
Aug-30 2020 195.0 252.0 21.9%
Sep-06 2020 220.6 283.5 23.0%
Sep-13 2020 199.6 277.9 22.3%
Sep-20 2020 199.6 290.4 20.7%
Sep-27 2020 183.6 279.0 20.2%
Oct-04 2020 161.0 263.5 17.4%
Oct-11 2020 221.0 297.7 22.2%
Oct-18 2020 247.2 276.1 21.9%
Oct-25 2020 255.4 273.5 23.8%
Nov-01 2020 242.2 273.4 21.7%
# SUBPRIME BANKCARD ACCOUNTS
ORIGINATED (THOUSANDS)
WEEKEND CURR YR PREV YR % TOTAL
Nov-08 2020 270.2 309.8 22.7%
Nov-15 2020 263.5 316.2 21.9%
Nov-22 2020 263.6 317.0 21.7%
Nov-29 2020 228.8 304.7 19.1%
Dec-06 2020 257.1 319.5 19.8%
Dec-13 2020 259.7 347.7 21.8%
Dec-20 2020 246.5 294.3 21.9%
Dec-27 2020 154.5 205.4 19.6%
Jan-03 2021 148.0 154.2 17.3%
Jan-10 2021 195.5 249.2 20.7%
Jan-17 2021 224.2 261.4 22.8%
Jan-24 2021 209.3 242.4 22.9%
# SUBPRIME BANKCARD ACCOUNTS
ORIGINATED (THOUSANDS)
WEEKEND CURR YR PREV YR % TOTAL
Jan-31 2021 211.4 299.2 23.0%
Feb-07 2021 150.5 253.2 18.6%
Feb-14 2021 155.8 260.6 19.1%
Feb-21 2021 138.1 266.7 21.5%
Feb-28 2021 117.1 240.1 21.9%
Mar-07 2021 67.0 297.3 19.1%
Mar-14 2021 27.4 286.5 13.6%
# SUBPRIME BANKCARD ACCOUNTS
ORIGINATED (THOUSANDS)

60 PROPRIETARY |
Originations through March 14, 2021 reported as of March 16, 2021
542
546
550
554
558
562
566
570
574
0
47
94
141
188
235
282
329
376Ja
n-06
201
9
Apr-0
7 20
19
Jul-0
7 20
19
Oct-0
6 20
19
Jan-
05 2
020
Apr-0
5 20
20
Jul-0
5 20
20
Oct-0
4 20
20
Mar
-14
2021
Thou
sand
s
New Trades FICO® Score 9
Subprime Bankcard Originations: Accounts Number of Accounts in Thousands; NSA. Subprime Accounts, Average FICO® Score 9 Subprime accounts defined as those with borrower’s origination FICO® Score 9 less than 620
Source: Equifax Inc.
Credit Cards: Bankcard
WEEKEND CURR YR PREV YR % TOTAL
Mar-01 2020 197.5 187.9 15.9%
Mar-08 2020 256.0 195.3 18.8%
Mar-15 2020 242.1 218.5 20.5%
Mar-22 2020 199.6 215.1 22.3%
Mar-29 2020 151.2 195.0 21.6%
Apr-05 2020 134.7 219.7 20.3%
Apr-12 2020 140.3 237.5 22.7%
Apr-19 2020 144.6 218.5 22.3%
Apr-26 2020 148.2 210.1 24.0%
May-03 2020 131.9 228.2 21.1%
May-10 2020 133.2 227.3 21.3%
May-17 2020 143.5 236.7 22.8%
# SUBPRIME BANKCARD ACCOUNTS
ORIGINATED (THOUSANDS)
WEEKEND CURR YR PREV YR % TOTAL
May-24 2020 135.8 240.3 21.6%
May-31 2020 121.7 191.2 20.5%
Jun-07 2020 139.5 257.4 20.5%
Jun-14 2020 153.5 259.6 21.3%
Jun-21 2020 160.9 238.3 21.4%
Jun-28 2020 147.2 206.3 19.4%
Jul-05 2020 150.2 236.0 19.0%
Jul-12 2020 162.8 241.1 20.3%
Jul-19 2020 186.5 243.1 22.5%
Jul-26 2020 204.7 230.4 23.1%
Aug-02 2020 169.7 237.9 19.0%
Aug-09 2020 228.8 262.8 23.8%
# SUBPRIME BANKCARD ACCOUNTS
ORIGINATED (THOUSANDS)
WEEKEND CURR YR PREV YR % TOTAL
Aug-16 2020 182.6 264.4 20.0%
Aug-23 2020 200.2 250.5 21.2%
Aug-30 2020 176.7 212.4 19.9%
Sep-06 2020 215.5 253.1 22.4%
Sep-13 2020 194.7 241.0 21.8%
Sep-20 2020 190.0 251.7 19.7%
Sep-27 2020 172.2 234.6 18.9%
Oct-04 2020 150.2 236.9 16.2%
Oct-11 2020 216.2 269.9 21.7%
Oct-18 2020 240.2 243.2 21.2%
Oct-25 2020 244.8 239.1 22.8%
Nov-01 2020 230.7 238.9 20.6%
# SUBPRIME BANKCARD ACCOUNTS
ORIGINATED (THOUSANDS)
WEEKEND CURR YR PREV YR % TOTAL
Nov-08 2020 270.3 280.7 22.7%
Nov-15 2020 258.6 279.4 21.5%
Nov-22 2020 254.6 276.1 21.0%
Nov-29 2020 217.0 263.8 18.1%
Dec-06 2020 254.4 292.4 19.6%
Dec-13 2020 257.5 313.7 21.6%
Dec-20 2020 241.1 259.5 21.4%
Dec-27 2020 149.0 176.8 18.9%
Jan-03 2021 140.2 138.5 16.4%
Jan-10 2021 183.5 222.0 19.4%
Jan-17 2021 208.7 229.3 21.2%
Jan-24 2021 192.2 208.7 21.1%
# SUBPRIME BANKCARD ACCOUNTS
ORIGINATED (THOUSANDS)
WEEKEND CURR YR PREV YR % TOTAL
Jan-31 2021 191.6 252.3 20.9%
Feb-07 2021 136.5 216.2 16.9%
Feb-14 2021 140.3 218.8 17.2%
Feb-21 2021 123.0 221.3 19.2%
Feb-28 2021 103.9 197.5 19.4%
Mar-07 2021 60.4 256.0 17.2%
Mar-14 2021 24.7 242.1 12.3%
# SUBPRIME BANKCARD ACCOUNTS
ORIGINATED (THOUSANDS)

61 PROPRIETARY |
Originations through March 14, 2021 reported as of March 16, 2021
546
550
554
558
562
566
570
574
578
0
42
84
127
169
211
253
296
338Ja
n-06
201
9
Apr-0
7 20
19
Jul-0
7 20
19
Oct-0
6 20
19
Jan-
05 2
020
Apr-0
5 20
20
Jul-0
5 20
20
Oct-0
4 20
20
Mar
-14
2021
Mill
ions
New Trades VS® 3.0
Subprime Bankcard Originations: Credit Limits Total Origination Credit Limits in $Millions; NSA. Subprime Accounts, Average VantageScore® 3.0 Subprime accounts defined as those with borrower’s origination VantageScore® 3.0 less than 620
Source: Equifax Inc.
Credit Cards: Bankcard
WEEKEND CURR YR PREV YR % TOTAL
Mar-01 2020 $213.8 $209.2 3.4%
Mar-08 2020 $233.7 $201.9 3.6%
Mar-15 2020 $226.2 $223.1 4.2%
Mar-22 2020 $192.1 $226.6 5.0%
Mar-29 2020 $159.2 $228.1 5.1%
Apr-05 2020 $129.1 $209.3 4.3%
Apr-12 2020 $125.0 $219.0 5.0%
Apr-19 2020 $125.7 $210.5 4.8%
Apr-26 2020 $116.4 $215.7 4.8%
May-03 2020 $109.8 $229.3 4.2%
May-10 2020 $110.4 $211.6 4.4%
May-17 2020 $116.9 $227.1 4.8%
TOTAL SUBPRIME BANKCARD BALANCES
ORIGINATED (MILLIONS)
WEEKEND CURR YR PREV YR % TOTAL
May-24 2020 $118.2 $221.8 4.7%
May-31 2020 $110.4 $200.6 4.6%
Jun-07 2020 $110.7 $223.9 4.0%
Jun-14 2020 $124.6 $237.5 4.4%
Jun-21 2020 $124.0 $230.0 4.4%
Jun-28 2020 $121.8 $212.0 4.2%
Jul-05 2020 $113.7 $215.9 3.7%
Jul-12 2020 $121.7 $225.8 4.0%
Jul-19 2020 $134.6 $240.0 4.5%
Jul-26 2020 $139.0 $226.2 4.4%
Aug-02 2020 $126.0 $226.2 3.5%
Aug-09 2020 $143.6 $242.5 4.3%
TOTAL SUBPRIME BANKCARD BALANCES
ORIGINATED (MILLIONS)
WEEKEND CURR YR PREV YR % TOTAL
Aug-16 2020 $131.8 $254.1 3.9%
Aug-23 2020 $139.3 $281.5 4.0%
Aug-30 2020 $128.1 $231.5 3.7%
Sep-06 2020 $135.0 $237.1 3.6%
Sep-13 2020 $127.9 $259.4 3.9%
Sep-20 2020 $132.0 $248.8 3.4%
Sep-27 2020 $124.9 $248.1 3.3%
Oct-04 2020 $112.2 $223.7 2.7%
Oct-11 2020 $135.2 $246.8 3.6%
Oct-18 2020 $149.6 $233.1 3.5%
Oct-25 2020 $156.4 $232.7 3.9%
Nov-01 2020 $153.8 $237.4 3.4%
TOTAL SUBPRIME BANKCARD BALANCES
ORIGINATED (MILLIONS)
WEEKEND CURR YR PREV YR % TOTAL
Nov-08 2020 $167.4 $254.3 3.9%
Nov-15 2020 $170.9 $269.8 3.9%
Nov-22 2020 $176.5 $268.9 3.9%
Nov-29 2020 $159.1 $254.3 3.6%
Dec-06 2020 $171.9 $269.4 3.3%
Dec-13 2020 $173.3 $279.8 3.9%
Dec-20 2020 $159.8 $243.1 3.9%
Dec-27 2020 $106.2 $167.5 3.6%
Jan-03 2021 $109.9 $137.4 2.9%
Jan-10 2021 $140.2 $212.1 3.6%
Jan-17 2021 $152.3 $218.6 3.9%
Jan-24 2021 $143.8 $209.1 4.1%
TOTAL SUBPRIME BANKCARD BALANCES
ORIGINATED (MILLIONS)
WEEKEND CURR YR PREV YR % TOTAL
Jan-31 2021 $149.2 $252.7 4.0%
Feb-07 2021 $118.7 $216.6 3.2%
Feb-14 2021 $121.4 $220.6 3.4%
Feb-21 2021 $101.0 $224.0 3.9%
Feb-28 2021 $88.1 $213.8 4.3%
Mar-07 2021 $55.6 $233.7 4.0%
Mar-14 2021 $28.0 $226.2 4.1%
TOTAL SUBPRIME BANKCARD BALANCES
ORIGINATED (MILLIONS)

62 PROPRIETARY |
Originations through March 14, 2021 reported as of March 16, 2021
542
546
550
554
558
562
566
570
574
0
33
65
98
130
163
195
228
260Ja
n-06
201
9
Apr-0
7 20
19
Jul-0
7 20
19
Oct-0
6 20
19
Jan-
05 2
020
Apr-0
5 20
20
Jul-0
5 20
20
Oct-0
4 20
20
Mar
-14
2021
Mill
ions
New Trades FICO® Score 9
Subprime Bankcard Originations: Credit Limits Total Origination Credit Limits in $Millions; NSA. Subprime Accounts, Average FICO® Score 9 Subprime accounts defined as those with borrower’s origination FICO® Score 9 less than 620
Source: Equifax Inc.
Credit Cards: Bankcard
WEEKEND CURR YR PREV YR % TOTAL
Mar-01 2020 $142.1 $133.7 2.2%
Mar-08 2020 $177.6 $135.9 2.7%
Mar-15 2020 $163.0 $144.4 3.1%
Mar-22 2020 $130.6 $145.1 3.4%
Mar-29 2020 $100.9 $141.4 3.2%
Apr-05 2020 $91.5 $163.0 3.1%
Apr-12 2020 $96.8 $165.1 3.9%
Apr-19 2020 $92.4 $150.4 3.5%
Apr-26 2020 $82.6 $143.9 3.4%
May-03 2020 $76.5 $172.7 2.9%
May-10 2020 $84.4 $165.4 3.4%
May-17 2020 $88.4 $166.5 3.6%
TOTAL SUBPRIME BANKCARD BALANCES
ORIGINATED (MILLIONS)
WEEKEND CURR YR PREV YR % TOTAL
May-24 2020 $84.6 $158.6 3.4%
May-31 2020 $76.4 $137.6 3.2%
Jun-07 2020 $91.6 $183.2 3.3%
Jun-14 2020 $100.9 $182.2 3.6%
Jun-21 2020 $98.7 $166.3 3.5%
Jun-28 2020 $91.5 $146.9 3.1%
Jul-05 2020 $92.1 $175.6 3.0%
Jul-12 2020 $103.6 $172.6 3.4%
Jul-19 2020 $112.2 $172.1 3.7%
Jul-26 2020 $113.4 $154.0 3.6%
Aug-02 2020 $99.5 $164.4 2.8%
Aug-09 2020 $125.6 $189.0 3.8%
TOTAL SUBPRIME BANKCARD BALANCES
ORIGINATED (MILLIONS)
WEEKEND CURR YR PREV YR % TOTAL
Aug-16 2020 $111.8 $186.9 3.3%
Aug-23 2020 $114.1 $180.9 3.3%
Aug-30 2020 $100.7 $150.8 2.9%
Sep-06 2020 $122.6 $179.9 3.3%
Sep-13 2020 $117.5 $186.7 3.5%
Sep-20 2020 $113.5 $171.4 2.9%
Sep-27 2020 $102.1 $157.1 2.7%
Oct-04 2020 $94.4 $171.1 2.3%
Oct-11 2020 $124.9 $190.6 3.3%
Oct-18 2020 $133.5 $167.7 3.1%
Oct-25 2020 $135.0 $159.8 3.4%
Nov-01 2020 $130.0 $164.5 2.9%
TOTAL SUBPRIME BANKCARD BALANCES
ORIGINATED (MILLIONS)
WEEKEND CURR YR PREV YR % TOTAL
Nov-08 2020 $158.7 $198.9 3.7%
Nov-15 2020 $155.4 $200.7 3.6%
Nov-22 2020 $153.0 $192.3 3.4%
Nov-29 2020 $132.6 $176.4 3.0%
Dec-06 2020 $160.0 $215.9 3.1%
Dec-13 2020 $160.4 $217.1 3.6%
Dec-20 2020 $144.0 $177.9 3.5%
Dec-27 2020 $91.5 $113.9 3.1%
Jan-03 2021 $92.4 $107.3 2.5%
Jan-10 2021 $126.0 $164.5 3.2%
Jan-17 2021 $132.0 $160.3 3.4%
Jan-24 2021 $117.1 $145.7 3.3%
TOTAL SUBPRIME BANKCARD BALANCES
ORIGINATED (MILLIONS)
WEEKEND CURR YR PREV YR % TOTAL
Jan-31 2021 $115.3 $168.2 3.1%
Feb-07 2021 $93.5 $152.7 2.5%
Feb-14 2021 $95.3 $149.7 2.7%
Feb-21 2021 $74.7 $149.4 2.9%
Feb-28 2021 $64.8 $142.1 3.2%
Mar-07 2021 $45.3 $177.6 3.3%
Mar-14 2021 $22.6 $163.0 3.3%
TOTAL SUBPRIME BANKCARD BALANCES
ORIGINATED (MILLIONS)

63 PROPRIETARY |
Originations through March 14, 2021 reported as of March 16, 2021
$0
$1,000
$2,000
$3,000
$4,000
$5,000
$6,000
$7,000
Jan-
07 20
18
Apr-0
8 20
18
Jul-0
8 201
8
Oct-0
7 201
8
Jan-
06 20
19
Apr-0
7 201
9
Jul-0
7 201
9
Oct-0
6 201
9
Jan-
05 20
20
Apr-0
5 20
20
Jul-0
5 202
0
Oct-0
4 202
0
Mar
-14 2
021
Bankcard Origination Credit Limit Subprime Bankcard Origination Credit Limit
Bankcard Average Origination Credit Limit Average Origination Credit Limit Over Time; NSA Subprime accounts defined as those with borrower’s origination VantageScore® 3.0 less than 620
Source: Equifax Inc.
Credit Cards: Bankcard

64 PROPRIETARY |
Originations through March 14, 2021 reported as of March 16, 2021
$0
$1,000
$2,000
$3,000
$4,000
$5,000
$6,000
$7,000
Jan-
07 20
18
Apr-0
8 20
18
Jul-0
8 201
8
Oct-0
7 201
8
Jan-
06 20
19
Apr-0
7 201
9
Jul-0
7 201
9
Oct-0
6 201
9
Jan-
05 20
20
Apr-0
5 20
20
Jul-0
5 202
0
Oct-0
4 202
0
Mar
-14 2
021
Bankcard Origination Credit Limit Subprime Bankcard Origination Credit Limit
Bankcard Average Origination Credit Limit Average Origination Credit Limit Over Time; NSA Subprime accounts defined as those with borrower’s origination FICO® Score 9 less than 620
Source: Equifax Inc.
Credit Cards: Bankcard

65 PROPRIETARY |
Originations through March 14, 2021 reported as of March 16, 2021
0.0%
0.8%
1.6%
2.4%
3.2%
4.0%
4.8%
5.6%
$0
$1,022
$2,045
$3,067
$4,090
$5,112
$6,134
$7,157M
ar-0
1 202
0
Mar
-08 2
020
Mar
-15 2
020
Mar
-22 2
020
Mar
-29 2
020
Apr-0
5 20
20
Apr-1
2 20
20
Apr-1
9 20
20
Apr-2
6 20
20
May
-03
2020
May
-10
2020
May
-17
2020
May
-24
2020
May
-31
2020
Jun-
07 2
020
Jun-
14 2
020
Jun-
21 2
020
Jun-
28 2
020
Jul-0
5 20
20
Jul-1
2 20
20
Jul-1
9 20
20
Jul-2
6 20
20
Aug-
02 2
020
Aug-
09 2
020
Aug-
16 2
020
Aug-
23 2
020
Aug-
30 2
020
Sep-
06 20
20
Sep-
13 20
20
Sep-
20 20
20
Sep-
27 20
20
Oct-0
4 20
20
Oct-1
1 20
20
Oct-1
8 20
20
Oct-2
5 20
20
Nov-
01 2
020
Nov-
08 2
020
Nov-
15 2
020
Nov-
22 2
020
Nov-
29 2
020
Dec-0
6 20
20
Dec-1
3 20
20
Dec-2
0 20
20
Dec-2
7 20
20
Jan-
03 2
021
Jan-
10 2
021
Jan-
17 2
021
Jan-
24 2
021
Jan-
31 2
021
Feb-
07 20
21
Feb-
14 20
21
Feb-
21 20
21
Feb-
28 20
21
Mar
-07 2
021
Mar
-14 2
021
Subp
rime S
hare
Milli
ons
Bankcard Origination Credit Limits Bankcard Subprime share of Origination Credit Limits
Bankcard Origination Credit Limits Total Credit Limits in $Millions; Subprime Share of Total Origination Credit Limits (%); NSA Subprime accounts defined as those with borrower’s origination VantageScore® 3.0 less than 620
Source: Equifax Inc.
Credit Cards: Bankcard

66 PROPRIETARY |
Originations through March 14, 2021 reported as of March 16, 2021
0.0%
0.6%
1.2%
1.8%
2.4%
3.0%
3.7%
4.3%
$0
$1,022
$2,045
$3,067
$4,090
$5,112
$6,134
$7,157M
ar-0
1 202
0
Mar
-08 2
020
Mar
-15 2
020
Mar
-22 2
020
Mar
-29 2
020
Apr-0
5 20
20
Apr-1
2 20
20
Apr-1
9 20
20
Apr-2
6 20
20
May
-03
2020
May
-10
2020
May
-17
2020
May
-24
2020
May
-31
2020
Jun-
07 2
020
Jun-
14 2
020
Jun-
21 2
020
Jun-
28 2
020
Jul-0
5 20
20
Jul-1
2 20
20
Jul-1
9 20
20
Jul-2
6 20
20
Aug-
02 2
020
Aug-
09 2
020
Aug-
16 2
020
Aug-
23 2
020
Aug-
30 2
020
Sep-
06 20
20
Sep-
13 20
20
Sep-
20 20
20
Sep-
27 20
20
Oct-0
4 20
20
Oct-1
1 20
20
Oct-1
8 20
20
Oct-2
5 20
20
Nov-
01 2
020
Nov-
08 2
020
Nov-
15 2
020
Nov-
22 2
020
Nov-
29 2
020
Dec-0
6 20
20
Dec-1
3 20
20
Dec-2
0 20
20
Dec-2
7 20
20
Jan-
03 2
021
Jan-
10 2
021
Jan-
17 2
021
Jan-
24 2
021
Jan-
31 2
021
Feb-
07 20
21
Feb-
14 20
21
Feb-
21 20
21
Feb-
28 20
21
Mar
-07 2
021
Mar
-14 2
021
Subp
rime S
hare
Milli
ons
Bankcard Origination Credit Limits Bankcard Subprime share of Origination Credit Limits
Bankcard Origination Credit Limits Total Credit Limits in $Millions; Subprime Share of Total Origination Credit Limits (%); NSA Subprime accounts defined as those with borrower’s origination FICO® Score 9 less than 620
Source: Equifax Inc.
Credit Cards: Bankcard

67 PROPRIETARY |
Originations through March 14, 2021 reported as of March 16, 2021
662
669
676
683
690
697
704
711
718
725
732
0%
10%
20%
30%
40%
50%
60%
70%
80%
90%
100%
Mar
-01 2
020
Mar
-08 2
020
Mar
-15 2
020
Mar
-22 2
020
Mar
-29 2
020
Apr-0
5 20
20
Apr-1
2 20
20
Apr-1
9 20
20
Apr-2
6 20
20
May
-03
2020
May
-10
2020
May
-17
2020
May
-24
2020
May
-31
2020
Jun-
07 2
020
Jun-
14 2
020
Jun-
21 2
020
Jun-
28 2
020
Jul-0
5 20
20
Jul-1
2 20
20
Jul-1
9 20
20
Jul-2
6 20
20
Aug-
02 2
020
Aug-
09 2
020
Aug-
16 2
020
Aug-
23 2
020
Aug-
30 2
020
Sep-
06 20
20
Sep-
13 20
20
Sep-
20 20
20
Sep-
27 20
20
Oct-0
4 20
20
Oct-1
1 20
20
Oct-1
8 20
20
Oct-2
5 20
20
Nov-
01 2
020
Nov-
08 2
020
Nov-
15 2
020
Nov-
22 2
020
Nov-
29 2
020
Dec-0
6 20
20
Dec-1
3 20
20
Dec-2
0 20
20
Dec-2
7 20
20
Jan-
03 2
021
Jan-
10 2
021
Jan-
17 2
021
Jan-
24 2
021
Jan-
31 2
021
Feb-
07 20
21
Feb-
14 20
21
Feb-
21 20
21
Feb-
28 20
21
Mar
-07 2
021
Mar
-14 2
021
300-539 540-579 580-619 620-659 660-699 700-739 740-779 780-850 no score Avg. VS® 3.0
Bankcard Origination Risk VantageScore® 3.0 Distribution for Bankcard Originations by Week (Percent of Accounts)
Source: Equifax Inc.
Credit Cards: Bankcard
The last 8 weeks of weekly data is subject to revision due to reporting lags by data furnishers.

68 PROPRIETARY |
Originations through March 14, 2021 reported as of March 16, 2021
674
681
688
695
702
709
716
723
730
737
744
0%
10%
20%
30%
40%
50%
60%
70%
80%
90%
100%
Mar
-01 2
020
Mar
-08 2
020
Mar
-15 2
020
Mar
-22 2
020
Mar
-29 2
020
Apr-0
5 20
20
Apr-1
2 20
20
Apr-1
9 20
20
Apr-2
6 20
20
May
-03
2020
May
-10
2020
May
-17
2020
May
-24
2020
May
-31
2020
Jun-
07 2
020
Jun-
14 2
020
Jun-
21 2
020
Jun-
28 2
020
Jul-0
5 20
20
Jul-1
2 20
20
Jul-1
9 20
20
Jul-2
6 20
20
Aug-
02 2
020
Aug-
09 2
020
Aug-
16 2
020
Aug-
23 2
020
Aug-
30 2
020
Sep-
06 20
20
Sep-
13 20
20
Sep-
20 20
20
Sep-
27 20
20
Oct-0
4 20
20
Oct-1
1 20
20
Oct-1
8 20
20
Oct-2
5 20
20
Nov-
01 2
020
Nov-
08 2
020
Nov-
15 2
020
Nov-
22 2
020
Nov-
29 2
020
Dec-0
6 20
20
Dec-1
3 20
20
Dec-2
0 20
20
Dec-2
7 20
20
Jan-
03 2
021
Jan-
10 2
021
Jan-
17 2
021
Jan-
24 2
021
Jan-
31 2
021
Feb-
07 20
21
Feb-
14 20
21
Feb-
21 20
21
Feb-
28 20
21
Mar
-07 2
021
Mar
-14 2
021
300-539 540-579 580-619 620-659 660-699 700-739 740-779 780-850 no score Avg. FICO® Score 9
Bankcard Origination Risk FICO® Bankcard Score 9 Distribution for Bankcard Originations by Week (Percent of Accounts)
Source: Equifax Inc.
Credit Cards: Bankcard
The last 8 weeks of weekly data is subject to revision due to reporting lags by data furnishers.

69 PROPRIETARY |
Credit Trends Originations: Private Label Credit Card

70 PROPRIETARY |
Originations through March 14, 2021 reported as of March 16, 2021
Private Label Originations Observations Originations through March 14, 2021 reported as of March 16, 2021
Credit Cards: Private Label
• 202,200 private label cards were issued in the week ending March 14th.The total credit limit for private label cards originated in the week ending March 14th is $470.5 million.
• In the week ending March 14th , approximately 27,200 private label cards have been originated to consumers with a VantageScore® 3.0 credit score below 620. These are generally considered subprime accounts. These newly issued cards have a corresponding credit limit of $17.6 million.
• In the week ending March 14th, 13.4% of private label cards were issued to consumers with a VantageScore® 3.0 subprime credit score, representing 3.7% of total new limits.
• In the week ending March 14th , approximately 23,800 private label cards have been originated to consumers with a FICO® Score 9 credit score below 620. These are generally considered subprime accounts. These newly issued cards have a corresponding credit limit of $13.7 million.
• In the week ending March 14th, 11.8% of private label cards were issued to consumers with a FICO® Score 9 subprime credit score, representing 2.9% of total new limits.
• The average credit limit for all private label cards issued in the week ending March 14th was $2,327. The average credit limit on new subprime cards was $647.

71 PROPRIETARY |
Originations through March 14, 2021 reported as of March 16, 2021
655
663
671
679
687
695
703
711
719
0
196
392
588
784
980
1,176
1,372
1,568
Jan-
06 2
019
Apr-0
7 20
19
Jul-0
7 20
19
Oct-0
6 20
19
Jan-
05 2
020
Apr-0
5 20
20
Jul-0
5 20
20
Oct-0
4 20
20
Mar
-14
2021
Thou
sand
s
New Trades VS® 3.0
Private Label Originations: Accounts Number of Accounts in Thousands; NSA. Average VantageScore® 3.0
Source: Equifax Inc.
Credit Cards: Private Label
WEEKEND CURR YR PREV YR
Mar-01 2020 539.0 583.9
Mar-08 2020 584.2 603.8
Mar-15 2020 533.7 655.3
Mar-22 2020 310.3 644.5
Mar-29 2020 253.4 655.1
Apr-05 2020 266.2 646.9
Apr-12 2020 263.2 672.3
Apr-19 2020 317.5 649.3
Apr-26 2020 328.9 676.6
May-03 2020 350.5 670.1
May-10 2020 365.9 693.8
May-17 2020 388.3 639.5
# PRIVATE LABEL ACCOUNTS
ORIGINATED (THOUSANDS)
WEEKEND CURR YR PREV YR
May-24 2020 453.4 721.6
May-31 2020 427.2 697.1
Jun-07 2020 416.6 682.2
Jun-14 2020 460.1 684.2
Jun-21 2020 481.3 627.4
Jun-28 2020 471.1 661.2
Jul-05 2020 483.6 724.4
Jul-12 2020 474.4 684.6
Jul-19 2020 467.3 698.8
Jul-26 2020 473.6 669.1
Aug-02 2020 490.8 715.5
Aug-09 2020 534.4 703.2
# PRIVATE LABEL ACCOUNTS
ORIGINATED (THOUSANDS)
WEEKEND CURR YR PREV YR
Aug-16 2020 523.5 665.3
Aug-23 2020 516.5 660.2
Aug-30 2020 516.2 692.8
Sep-06 2020 565.6 678.1
Sep-13 2020 561.1 614.6
Sep-20 2020 571.0 617.0
Sep-27 2020 550.7 625.4
Oct-04 2020 549.0 622.4
Oct-11 2020 560.9 643.6
Oct-18 2020 602.0 658.6
Oct-25 2020 552.0 606.6
Nov-01 2020 545.5 624.2
# PRIVATE LABEL ACCOUNTS
ORIGINATED (THOUSANDS)
WEEKEND CURR YR PREV YR
Nov-08 2020 616.2 774.3
Nov-15 2020 708.9 812.1
Nov-22 2020 735.2 814.0
Nov-29 2020 965.9 1,306.7
Dec-06 2020 815.7 1,018.3
Dec-13 2020 776.6 991.6
Dec-20 2020 749.0 1,016.0
Dec-27 2020 572.2 658.0
Jan-03 2021 464.5 377.7
Jan-10 2021 422.3 458.0
Jan-17 2021 424.8 470.1
Jan-24 2021 426.8 494.2
# PRIVATE LABEL ACCOUNTS
ORIGINATED (THOUSANDS)
WEEKEND CURR YR PREV YR
Jan-31 2021 416.4 609.9
Feb-07 2021 421.0 525.0
Feb-14 2021 452.7 610.4
Feb-21 2021 344.2 570.6
Feb-28 2021 310.2 539.0
Mar-07 2021 265.6 584.2
Mar-14 2021 202.2 533.7
# PRIVATE LABEL ACCOUNTS
ORIGINATED (THOUSANDS)

72 PROPRIETARY |
Originations through March 14, 2021 reported as of March 16, 2021
665
672
679
686
693
700
707
714
721
0
196
392
588
784
980
1,176
1,372
1,568
Jan-
06 2
019
Apr-0
7 20
19
Jul-0
7 20
19
Oct-0
6 20
19
Jan-
05 2
020
Apr-0
5 20
20
Jul-0
5 20
20
Oct-0
4 20
20
Mar
-14
2021
Thou
sand
s
New Trades FICO® Score 9
Private Label Originations: Accounts Number of Accounts in Thousands; NSA. Average FICO® Score 9
Source: Equifax Inc.
Credit Cards: Private Label
WEEKEND CURR YR PREV YR
Mar-01 2020 539.0 583.9
Mar-08 2020 584.2 603.8
Mar-15 2020 533.7 655.3
Mar-22 2020 310.3 644.5
Mar-29 2020 253.4 655.1
Apr-05 2020 266.2 646.9
Apr-12 2020 263.2 672.3
Apr-19 2020 317.5 649.3
Apr-26 2020 328.9 676.6
May-03 2020 350.5 670.1
May-10 2020 365.9 693.8
May-17 2020 388.3 639.5
# PRIVATE LABEL ACCOUNTS
ORIGINATED (THOUSANDS)
WEEKEND CURR YR PREV YR
May-24 2020 453.4 721.6
May-31 2020 427.2 697.1
Jun-07 2020 416.6 682.2
Jun-14 2020 460.1 684.2
Jun-21 2020 481.3 627.4
Jun-28 2020 471.1 661.2
Jul-05 2020 483.6 724.4
Jul-12 2020 474.4 684.6
Jul-19 2020 467.3 698.8
Jul-26 2020 473.6 669.1
Aug-02 2020 490.8 715.5
Aug-09 2020 534.4 703.2
# PRIVATE LABEL ACCOUNTS
ORIGINATED (THOUSANDS)
WEEKEND CURR YR PREV YR
Aug-16 2020 523.5 665.3
Aug-23 2020 516.5 660.2
Aug-30 2020 516.2 692.8
Sep-06 2020 565.6 678.1
Sep-13 2020 561.1 614.6
Sep-20 2020 571.0 617.0
Sep-27 2020 550.7 625.4
Oct-04 2020 549.0 622.4
Oct-11 2020 560.9 643.6
Oct-18 2020 602.0 658.6
Oct-25 2020 552.0 606.6
Nov-01 2020 545.5 624.2
# PRIVATE LABEL ACCOUNTS
ORIGINATED (THOUSANDS)
WEEKEND CURR YR PREV YR
Nov-08 2020 616.2 774.3
Nov-15 2020 708.9 812.1
Nov-22 2020 735.2 814.0
Nov-29 2020 965.9 1,306.7
Dec-06 2020 815.7 1,018.3
Dec-13 2020 776.6 991.6
Dec-20 2020 749.0 1,016.0
Dec-27 2020 572.2 658.0
Jan-03 2021 464.5 377.7
Jan-10 2021 422.3 458.0
Jan-17 2021 424.8 470.1
Jan-24 2021 426.8 494.2
# PRIVATE LABEL ACCOUNTS
ORIGINATED (THOUSANDS)
WEEKEND CURR YR PREV YR
Jan-31 2021 416.4 609.9
Feb-07 2021 421.0 525.0
Feb-14 2021 452.7 610.4
Feb-21 2021 344.2 570.6
Feb-28 2021 310.2 539.0
Mar-07 2021 265.6 584.2
Mar-14 2021 202.2 533.7
# PRIVATE LABEL ACCOUNTS
ORIGINATED (THOUSANDS)

73 PROPRIETARY |
Originations through March 14, 2021 reported as of March 16, 2021
655
663
671
679
687
695
703
711
719
0
398
796
1,194
1,592
1,991
2,389
2,787
3,185
Jan-
06 2
019
Apr-0
7 20
19
Jul-0
7 20
19
Oct-0
6 20
19
Jan-
05 2
020
Apr-0
5 20
20
Jul-0
5 20
20
Oct-0
4 20
20
Mar
-14
2021
Mill
ions
New Trades VS® 3.0
Private Label Originations: Credit Limits Total Origination Credit Limits in $Millions; NSA. Average VantageScore® 3.0
Source: Equifax Inc.
Credit Cards: Private Label
WEEKEND CURR YR PREV YR
Mar-01 2020 $1,197.0 $1,234.2
Mar-08 2020 $1,295.3 $1,274.2
Mar-15 2020 $1,206.7 $1,431.2
Mar-22 2020 $712.5 $1,396.9
Mar-29 2020 $548.6 $1,458.8
Apr-05 2020 $560.5 $1,448.1
Apr-12 2020 $551.1 $1,504.7
Apr-19 2020 $676.2 $1,425.5
Apr-26 2020 $704.0 $1,547.7
May-03 2020 $770.5 $1,482.8
May-10 2020 $825.1 $1,496.9
May-17 2020 $867.4 $1,422.5
TOTAL PRIVATE LABEL BALANCES
ORIGINATED (MILLIONS)
WEEKEND CURR YR PREV YR
May-24 2020 $1,068.3 $1,735.2
May-31 2020 $1,057.2 $1,676.5
Jun-07 2020 $928.9 $1,471.1
Jun-14 2020 $1,020.6 $1,468.9
Jun-21 2020 $1,046.1 $1,397.8
Jun-28 2020 $1,088.3 $1,491.1
Jul-05 2020 $1,188.1 $1,737.8
Jul-12 2020 $1,100.1 $1,521.5
Jul-19 2020 $1,044.9 $1,486.3
Jul-26 2020 $1,065.1 $1,427.2
Aug-02 2020 $1,107.3 $1,464.3
Aug-09 2020 $1,169.2 $1,448.1
TOTAL PRIVATE LABEL BALANCES
ORIGINATED (MILLIONS)
WEEKEND CURR YR PREV YR
Aug-16 2020 $1,173.9 $1,437.4
Aug-23 2020 $1,127.3 $1,417.0
Aug-30 2020 $1,183.6 $1,672.5
Sep-06 2020 $1,338.1 $1,605.6
Sep-13 2020 $1,294.3 $1,330.7
Sep-20 2020 $1,179.1 $1,315.8
Sep-27 2020 $1,136.5 $1,379.7
Oct-04 2020 $1,139.8 $1,353.6
Oct-11 2020 $1,156.6 $1,406.7
Oct-18 2020 $1,260.0 $1,442.4
Oct-25 2020 $1,160.2 $1,381.1
Nov-01 2020 $1,166.0 $1,359.3
TOTAL PRIVATE LABEL BALANCES
ORIGINATED (MILLIONS)
WEEKEND CURR YR PREV YR
Nov-08 2020 $1,246.2 $1,636.8
Nov-15 2020 $1,424.1 $1,680.3
Nov-22 2020 $1,444.0 $1,718.8
Nov-29 2020 $1,903.4 $2,654.1
Dec-06 2020 $1,529.0 $1,949.3
Dec-13 2020 $1,421.7 $1,811.2
Dec-20 2020 $1,389.1 $1,879.6
Dec-27 2020 $1,116.9 $1,393.5
Jan-03 2021 $1,081.9 $905.4
Jan-10 2021 $953.8 $1,065.0
Jan-17 2021 $967.9 $1,085.5
Jan-24 2021 $1,008.7 $1,167.9
TOTAL PRIVATE LABEL BALANCES
ORIGINATED (MILLIONS)
WEEKEND CURR YR PREV YR
Jan-31 2021 $975.6 $1,439.8
Feb-07 2021 $951.5 $1,180.0
Feb-14 2021 $1,091.7 $1,398.2
Feb-21 2021 $879.4 $1,353.0
Feb-28 2021 $761.9 $1,197.0
Mar-07 2021 $614.3 $1,295.3
Mar-14 2021 $470.5 $1,206.7
TOTAL PRIVATE LABEL BALANCES
ORIGINATED (MILLIONS)

74 PROPRIETARY |
Originations through March 14, 2021 reported as of March 16, 2021
665
672
679
686
693
700
707
714
721
0
398
796
1,194
1,592
1,991
2,389
2,787
3,185
Jan-
06 2
019
Apr-0
7 20
19
Jul-0
7 20
19
Oct-0
6 20
19
Jan-
05 2
020
Apr-0
5 20
20
Jul-0
5 20
20
Oct-0
4 20
20
Mar
-14
2021
Mill
ions
New Trades FICO® Score 9
Private Label Originations: Credit Limits Total Origination Credit Limits in $Millions; NSA. Average FICO® Score 9
Source: Equifax Inc.
Credit Cards: Private Label
WEEKEND CURR YR PREV YR
Mar-01 2020 $1,197.0 $1,234.2
Mar-08 2020 $1,295.3 $1,274.2
Mar-15 2020 $1,206.7 $1,431.2
Mar-22 2020 $712.5 $1,396.9
Mar-29 2020 $548.6 $1,458.8
Apr-05 2020 $560.5 $1,448.1
Apr-12 2020 $551.1 $1,504.7
Apr-19 2020 $676.2 $1,425.5
Apr-26 2020 $704.0 $1,547.7
May-03 2020 $770.5 $1,482.8
May-10 2020 $825.1 $1,496.9
May-17 2020 $867.4 $1,422.5
TOTAL PRIVATE LABEL BALANCES
ORIGINATED (MILLIONS)
WEEKEND CURR YR PREV YR
May-24 2020 $1,068.3 $1,735.2
May-31 2020 $1,057.2 $1,676.5
Jun-07 2020 $928.9 $1,471.1
Jun-14 2020 $1,020.6 $1,468.9
Jun-21 2020 $1,046.1 $1,397.8
Jun-28 2020 $1,088.3 $1,491.1
Jul-05 2020 $1,188.1 $1,737.8
Jul-12 2020 $1,100.1 $1,521.5
Jul-19 2020 $1,044.9 $1,486.3
Jul-26 2020 $1,065.1 $1,427.2
Aug-02 2020 $1,107.3 $1,464.3
Aug-09 2020 $1,169.2 $1,448.1
TOTAL PRIVATE LABEL BALANCES
ORIGINATED (MILLIONS)
WEEKEND CURR YR PREV YR
Aug-16 2020 $1,173.9 $1,437.4
Aug-23 2020 $1,127.3 $1,417.0
Aug-30 2020 $1,183.6 $1,672.5
Sep-06 2020 $1,338.1 $1,605.6
Sep-13 2020 $1,294.3 $1,330.7
Sep-20 2020 $1,179.1 $1,315.8
Sep-27 2020 $1,136.5 $1,379.7
Oct-04 2020 $1,139.8 $1,353.6
Oct-11 2020 $1,156.6 $1,406.7
Oct-18 2020 $1,260.0 $1,442.4
Oct-25 2020 $1,160.2 $1,381.1
Nov-01 2020 $1,166.0 $1,359.3
TOTAL PRIVATE LABEL BALANCES
ORIGINATED (MILLIONS)
WEEKEND CURR YR PREV YR
Nov-08 2020 $1,246.2 $1,636.8
Nov-15 2020 $1,424.1 $1,680.3
Nov-22 2020 $1,444.0 $1,718.8
Nov-29 2020 $1,903.4 $2,654.1
Dec-06 2020 $1,529.0 $1,949.3
Dec-13 2020 $1,421.7 $1,811.2
Dec-20 2020 $1,389.1 $1,879.6
Dec-27 2020 $1,116.9 $1,393.5
Jan-03 2021 $1,081.9 $905.4
Jan-10 2021 $953.8 $1,065.0
Jan-17 2021 $967.9 $1,085.5
Jan-24 2021 $1,008.7 $1,167.9
TOTAL PRIVATE LABEL BALANCES
ORIGINATED (MILLIONS)
WEEKEND CURR YR PREV YR
Jan-31 2021 $975.6 $1,439.8
Feb-07 2021 $951.5 $1,180.0
Feb-14 2021 $1,091.7 $1,398.2
Feb-21 2021 $879.4 $1,353.0
Feb-28 2021 $761.9 $1,197.0
Mar-07 2021 $614.3 $1,295.3
Mar-14 2021 $470.5 $1,206.7
TOTAL PRIVATE LABEL BALANCES
ORIGINATED (MILLIONS)

75 PROPRIETARY |
Originations through March 14, 2021 reported as of March 16, 2021
557
562
567
572
577
582
587
592
597
0
36
72
108
144
180
216
252
288Ja
n-06
201
9
Apr-0
7 20
19
Jul-0
7 20
19
Oct-0
6 20
19
Jan-
05 2
020
Apr-0
5 20
20
Jul-0
5 20
20
Oct-0
4 20
20
Mar
-14
2021
Thou
sand
s
New Trades VS® 3.0
Subprime Private Label Originations: Accounts Number of Accounts Originated in Thousands; NSA. Subprime Accounts, Average VantageScore® 3.0 Subprime accounts defined as those with borrower’s origination VantageScore® 3.0 less than 620
Source: Equifax Inc.
Credit Cards: Private Label
WEEKEND CURR YR PREV YR % TOTAL
Mar-01 2020 113.7 127.8 21.1%
Mar-08 2020 126.4 125.1 21.6%
Mar-15 2020 118.3 128.4 22.2%
Mar-22 2020 81.4 126.1 26.2%
Mar-29 2020 72.9 128.4 28.8%
Apr-05 2020 75.3 123.9 28.3%
Apr-12 2020 72.4 125.0 27.5%
Apr-19 2020 89.5 120.6 28.2%
Apr-26 2020 98.8 125.2 30.0%
May-03 2020 103.0 125.1 29.4%
May-10 2020 100.8 126.6 27.6%
May-17 2020 103.7 115.7 26.7%
# SUBPRIME PRIVATE LABEL ACCOUNTS
ORIGINATED (THOUSANDS)
WEEKEND CURR YR PREV YR % TOTAL
May-24 2020 115.1 127.7 25.4%
May-31 2020 99.9 119.1 23.4%
Jun-07 2020 94.5 122.0 22.7%
Jun-14 2020 97.5 120.8 21.2%
Jun-21 2020 100.1 117.8 20.8%
Jun-28 2020 93.1 119.7 19.8%
Jul-05 2020 88.8 124.5 18.4%
Jul-12 2020 89.4 127.2 18.8%
Jul-19 2020 87.9 126.5 18.8%
Jul-26 2020 89.6 128.1 18.9%
Aug-02 2020 91.1 138.7 18.6%
Aug-09 2020 96.1 134.1 18.0%
# SUBPRIME PRIVATE LABEL ACCOUNTS
ORIGINATED (THOUSANDS)
WEEKEND CURR YR PREV YR % TOTAL
Aug-16 2020 91.6 124.4 17.5%
Aug-23 2020 99.8 129.2 19.3%
Aug-30 2020 97.4 122.6 18.9%
Sep-06 2020 100.8 126.7 17.8%
Sep-13 2020 96.7 118.8 17.2%
Sep-20 2020 104.8 119.7 18.3%
Sep-27 2020 100.8 115.9 18.3%
Oct-04 2020 99.3 119.5 18.1%
Oct-11 2020 104.4 120.9 18.6%
Oct-18 2020 104.6 126.5 17.4%
Oct-25 2020 102.1 116.7 18.5%
Nov-01 2020 101.9 122.3 18.7%
# SUBPRIME PRIVATE LABEL ACCOUNTS
ORIGINATED (THOUSANDS)
WEEKEND CURR YR PREV YR % TOTAL
Nov-08 2020 125.6 160.2 20.4%
Nov-15 2020 136.7 174.7 19.3%
Nov-22 2020 143.8 173.8 19.6%
Nov-29 2020 173.9 239.8 18.0%
Dec-06 2020 161.9 222.6 19.9%
Dec-13 2020 148.6 209.1 19.1%
Dec-20 2020 130.7 200.9 17.4%
Dec-27 2020 95.4 122.1 16.7%
Jan-03 2021 80.5 73.0 17.3%
Jan-10 2021 83.5 90.0 19.8%
Jan-17 2021 79.0 93.0 18.6%
Jan-24 2021 74.3 90.2 17.4%
# SUBPRIME PRIVATE LABEL ACCOUNTS
ORIGINATED (THOUSANDS)
WEEKEND CURR YR PREV YR % TOTAL
Jan-31 2021 76.3 124.4 18.3%
Feb-07 2021 75.8 108.6 18.0%
Feb-14 2021 78.1 117.1 17.3%
Feb-21 2021 61.1 108.8 17.7%
Feb-28 2021 55.6 113.7 17.9%
Mar-07 2021 39.6 126.4 14.9%
Mar-14 2021 27.2 118.3 13.4%
# SUBPRIME PRIVATE LABEL ACCOUNTS
ORIGINATED (THOUSANDS)

76 PROPRIETARY |
Originations through March 14, 2021 reported as of March 16, 2021
552
557
562
567
572
577
582
587
592
0
31
61
92
122
153
184
214
245Ja
n-06
201
9
Apr-0
7 20
19
Jul-0
7 20
19
Oct-0
6 20
19
Jan-
05 2
020
Apr-0
5 20
20
Jul-0
5 20
20
Oct-0
4 20
20
Mar
-14
2021
Thou
sand
s
New Trades FICO® Score 9
Subprime Private Label Originations: Accounts Number of Accounts Originated in Thousands; NSA. Subprime Accounts, Average FICO® Score 9 Subprime accounts defined as those with borrower’s origination FICO® Score 9 less than 620
Source: Equifax Inc.
Credit Cards: Private Label
WEEKEND CURR YR PREV YR % TOTAL
Mar-01 2020 92.8 106.0 17.2%
Mar-08 2020 108.7 102.6 18.6%
Mar-15 2020 99.2 101.2 18.6%
Mar-22 2020 66.0 98.3 21.3%
Mar-29 2020 57.7 100.8 22.8%
Apr-05 2020 64.5 113.0 24.2%
Apr-12 2020 63.0 111.5 23.9%
Apr-19 2020 75.8 104.9 23.9%
Apr-26 2020 81.6 105.5 24.8%
May-03 2020 85.9 112.2 24.5%
May-10 2020 87.3 114.3 23.9%
May-17 2020 87.3 101.3 22.5%
# SUBPRIME PRIVATE LABEL ACCOUNTS
ORIGINATED (THOUSANDS)
WEEKEND CURR YR PREV YR % TOTAL
May-24 2020 94.3 109.8 20.8%
May-31 2020 78.1 102.8 18.3%
Jun-07 2020 87.7 113.9 21.0%
Jun-14 2020 88.0 109.3 19.1%
Jun-21 2020 88.0 103.7 18.3%
Jun-28 2020 79.6 102.9 16.9%
Jul-05 2020 80.4 115.3 16.6%
Jul-12 2020 82.7 115.4 17.4%
Jul-19 2020 78.4 111.8 16.8%
Jul-26 2020 78.4 111.5 16.6%
Aug-02 2020 79.4 125.9 16.2%
Aug-09 2020 88.5 125.1 16.6%
# SUBPRIME PRIVATE LABEL ACCOUNTS
ORIGINATED (THOUSANDS)
WEEKEND CURR YR PREV YR % TOTAL
Aug-16 2020 82.6 110.8 15.8%
Aug-23 2020 87.9 112.6 17.0%
Aug-30 2020 83.3 103.6 16.1%
Sep-06 2020 96.7 114.7 17.1%
Sep-13 2020 92.3 104.6 16.4%
Sep-20 2020 96.9 102.7 17.0%
Sep-27 2020 91.0 95.4 16.5%
Oct-04 2020 92.5 109.5 16.8%
Oct-11 2020 99.1 110.1 17.7%
Oct-18 2020 95.7 112.2 15.9%
Oct-25 2020 91.6 100.7 16.6%
Nov-01 2020 89.7 107.2 16.4%
# SUBPRIME PRIVATE LABEL ACCOUNTS
ORIGINATED (THOUSANDS)
WEEKEND CURR YR PREV YR % TOTAL
Nov-08 2020 119.6 145.2 19.4%
Nov-15 2020 127.4 156.0 18.0%
Nov-22 2020 128.8 149.6 17.5%
Nov-29 2020 149.1 198.9 15.4%
Dec-06 2020 156.0 204.0 19.1%
Dec-13 2020 143.1 187.0 18.4%
Dec-20 2020 123.4 174.4 16.5%
Dec-27 2020 88.1 101.6 15.4%
Jan-03 2021 72.4 66.4 15.6%
Jan-10 2021 76.6 80.6 18.1%
Jan-17 2021 70.5 81.0 16.6%
Jan-24 2021 64.0 76.3 15.0%
# SUBPRIME PRIVATE LABEL ACCOUNTS
ORIGINATED (THOUSANDS)
WEEKEND CURR YR PREV YR % TOTAL
Jan-31 2021 63.8 103.9 15.3%
Feb-07 2021 68.1 91.1 16.2%
Feb-14 2021 68.5 94.2 15.1%
Feb-21 2021 51.3 87.0 14.9%
Feb-28 2021 45.6 92.8 14.7%
Mar-07 2021 35.4 108.7 13.3%
Mar-14 2021 23.8 99.2 11.8%
# SUBPRIME PRIVATE LABEL ACCOUNTS
ORIGINATED (THOUSANDS)

77 PROPRIETARY |
Originations through March 14, 2021 reported as of March 16, 2021
557
562
567
572
577
582
587
592
597
0
28
56
84
112
140
168
196
224Ja
n-06
201
9
Apr-0
7 20
19
Jul-0
7 20
19
Oct-0
6 20
19
Jan-
05 2
020
Apr-0
5 20
20
Jul-0
5 20
20
Oct-0
4 20
20
Mar
-14
2021
Mill
ions
New Trades VS® 3.0
Subprime Private Label Originations: Credit Limits Total Origination Credit Limits in $Milions; NSA. Subprime Accounts, Average VantageScore® 3.0 Subprime accounts defined as those with borrower’s origination VantageScore® 3.0 less than 620
Source: Equifax Inc.
Credit Cards: Private Label
WEEKEND CURR YR PREV YR % TOTAL
Mar-01 2020 $103.4 $111.9 8.6%
Mar-08 2020 $110.8 $106.6 8.6%
Mar-15 2020 $106.2 $107.9 8.8%
Mar-22 2020 $76.5 $106.9 10.7%
Mar-29 2020 $63.5 $112.0 11.6%
Apr-05 2020 $62.0 $102.7 11.1%
Apr-12 2020 $56.4 $103.4 10.2%
Apr-19 2020 $72.0 $96.9 10.6%
Apr-26 2020 $82.2 $105.0 11.7%
May-03 2020 $88.7 $104.3 11.5%
May-10 2020 $89.3 $105.0 10.8%
May-17 2020 $94.6 $95.6 10.9%
TOTAL SUBPRIME PRIVATE LABEL BALANCES
ORIGINATED (MILLIONS)
WEEKEND CURR YR PREV YR % TOTAL
May-24 2020 $107.3 $107.4 10.0%
May-31 2020 $100.1 $104.6 9.5%
Jun-07 2020 $86.7 $96.6 9.3%
Jun-14 2020 $89.5 $98.4 8.8%
Jun-21 2020 $90.9 $97.5 8.7%
Jun-28 2020 $88.2 $100.4 8.1%
Jul-05 2020 $84.7 $105.5 7.1%
Jul-12 2020 $82.0 $104.5 7.5%
Jul-19 2020 $80.9 $102.4 7.7%
Jul-26 2020 $83.4 $102.9 7.8%
Aug-02 2020 $84.3 $106.3 7.6%
Aug-09 2020 $85.3 $101.9 7.3%
TOTAL SUBPRIME PRIVATE LABEL BALANCES
ORIGINATED (MILLIONS)
WEEKEND CURR YR PREV YR % TOTAL
Aug-16 2020 $82.1 $99.7 7.0%
Aug-23 2020 $85.4 $103.5 7.6%
Aug-30 2020 $87.0 $106.7 7.3%
Sep-06 2020 $91.8 $103.7 6.9%
Sep-13 2020 $87.5 $97.3 6.8%
Sep-20 2020 $91.2 $97.6 7.7%
Sep-27 2020 $85.0 $98.0 7.5%
Oct-04 2020 $85.5 $97.9 7.5%
Oct-11 2020 $87.6 $98.6 7.6%
Oct-18 2020 $89.9 $105.0 7.1%
Oct-25 2020 $89.2 $98.0 7.7%
Nov-01 2020 $91.9 $103.2 7.9%
TOTAL SUBPRIME PRIVATE LABEL BALANCES
ORIGINATED (MILLIONS)
WEEKEND CURR YR PREV YR % TOTAL
Nov-08 2020 $102.7 $122.2 8.2%
Nov-15 2020 $111.3 $137.1 7.8%
Nov-22 2020 $118.1 $136.5 8.2%
Nov-29 2020 $144.5 $186.9 7.6%
Dec-06 2020 $126.5 $157.8 8.3%
Dec-13 2020 $117.7 $150.7 8.3%
Dec-20 2020 $116.7 $149.8 8.4%
Dec-27 2020 $91.6 $103.4 8.2%
Jan-03 2021 $80.3 $64.5 7.4%
Jan-10 2021 $78.9 $78.7 8.3%
Jan-17 2021 $74.3 $81.0 7.7%
Jan-24 2021 $69.8 $80.5 6.9%
TOTAL SUBPRIME PRIVATE LABEL BALANCES
ORIGINATED (MILLIONS)
WEEKEND CURR YR PREV YR % TOTAL
Jan-31 2021 $72.6 $119.7 7.4%
Feb-07 2021 $71.0 $95.6 7.5%
Feb-14 2021 $76.4 $105.8 7.0%
Feb-21 2021 $57.3 $99.3 6.5%
Feb-28 2021 $57.3 $103.4 7.5%
Mar-07 2021 $26.9 $110.8 4.4%
Mar-14 2021 $17.6 $106.2 3.7%
TOTAL SUBPRIME PRIVATE LABEL BALANCES
ORIGINATED (MILLIONS)

78 PROPRIETARY |
Originations through March 14, 2021 reported as of March 16, 2021
552
557
562
567
572
577
582
587
592
0
22
43
65
86
108
130
151
173Ja
n-06
201
9
Apr-0
7 20
19
Jul-0
7 20
19
Oct-0
6 20
19
Jan-
05 2
020
Apr-0
5 20
20
Jul-0
5 20
20
Oct-0
4 20
20
Mar
-14
2021
Mill
ions
New Trades FICO® Score 9
Subprime Private Label Originations: Credit Limits Total Origination Credit Limits in $Millions; NSA. Subprime Accounts, Average FICO® Score 9 Subprime accounts defined as those with borrower’s origination FICO® Score 9 less than 620
Source: Equifax Inc.
Credit Cards: Private Label
WEEKEND CURR YR PREV YR % TOTAL
Mar-01 2020 $80.8 $89.4 6.7%
Mar-08 2020 $92.1 $83.3 7.1%
Mar-15 2020 $85.0 $80.3 7.0%
Mar-22 2020 $58.2 $77.7 8.2%
Mar-29 2020 $46.0 $81.5 8.4%
Apr-05 2020 $48.8 $89.5 8.7%
Apr-12 2020 $45.0 $86.4 8.2%
Apr-19 2020 $55.8 $78.3 8.3%
Apr-26 2020 $61.8 $80.6 8.8%
May-03 2020 $68.2 $89.0 8.9%
May-10 2020 $72.2 $90.1 8.7%
May-17 2020 $74.9 $77.7 8.6%
TOTAL SUBPRIME PRIVATE LABEL BALANCES
ORIGINATED (MILLIONS)
WEEKEND CURR YR PREV YR % TOTAL
May-24 2020 $82.1 $85.5 7.7%
May-31 2020 $73.5 $83.8 7.0%
Jun-07 2020 $76.8 $87.3 8.3%
Jun-14 2020 $76.6 $84.1 7.5%
Jun-21 2020 $75.4 $79.9 7.2%
Jun-28 2020 $70.7 $80.1 6.5%
Jul-05 2020 $73.5 $93.4 6.2%
Jul-12 2020 $72.8 $89.7 6.6%
Jul-19 2020 $68.5 $83.2 6.6%
Jul-26 2020 $68.3 $82.2 6.4%
Aug-02 2020 $70.2 $90.9 6.3%
Aug-09 2020 $75.4 $90.2 6.4%
TOTAL SUBPRIME PRIVATE LABEL BALANCES
ORIGINATED (MILLIONS)
WEEKEND CURR YR PREV YR % TOTAL
Aug-16 2020 $69.8 $83.0 5.9%
Aug-23 2020 $71.1 $83.5 6.3%
Aug-30 2020 $69.8 $83.1 5.9%
Sep-06 2020 $84.7 $89.2 6.3%
Sep-13 2020 $79.0 $80.7 6.1%
Sep-20 2020 $79.0 $77.5 6.7%
Sep-27 2020 $71.3 $73.7 6.3%
Oct-04 2020 $76.0 $85.8 6.7%
Oct-11 2020 $79.2 $85.4 6.8%
Oct-18 2020 $77.6 $86.5 6.2%
Oct-25 2020 $75.9 $77.8 6.5%
Nov-01 2020 $76.1 $85.4 6.5%
TOTAL SUBPRIME PRIVATE LABEL BALANCES
ORIGINATED (MILLIONS)
WEEKEND CURR YR PREV YR % TOTAL
Nov-08 2020 $93.9 $105.6 7.5%
Nov-15 2020 $98.6 $115.0 6.9%
Nov-22 2020 $100.4 $109.6 6.9%
Nov-29 2020 $116.1 $143.9 6.1%
Dec-06 2020 $116.3 $137.6 7.6%
Dec-13 2020 $108.4 $126.9 7.6%
Dec-20 2020 $106.1 $121.6 7.6%
Dec-27 2020 $81.4 $79.3 7.3%
Jan-03 2021 $69.1 $55.7 6.4%
Jan-10 2021 $69.8 $67.4 7.3%
Jan-17 2021 $62.9 $66.4 6.5%
Jan-24 2021 $56.6 $63.6 5.6%
TOTAL SUBPRIME PRIVATE LABEL BALANCES
ORIGINATED (MILLIONS)
WEEKEND CURR YR PREV YR % TOTAL
Jan-31 2021 $56.9 $94.7 5.8%
Feb-07 2021 $60.8 $75.6 6.4%
Feb-14 2021 $63.7 $79.2 5.8%
Feb-21 2021 $45.6 $74.1 5.2%
Feb-28 2021 $45.2 $80.8 5.9%
Mar-07 2021 $21.9 $92.1 3.6%
Mar-14 2021 $13.7 $85.0 2.9%
TOTAL SUBPRIME PRIVATE LABEL BALANCES
ORIGINATED (MILLIONS)

79 PROPRIETARY |
Originations through March 14, 2021 reported as of March 16, 2021
$0
$500
$1,000
$1,500
$2,000
$2,500
$3,000
Jan-
07 20
18
Apr-0
8 20
18
Jul-0
8 201
8
Oct-0
7 201
8
Jan-
06 20
19
Apr-0
7 201
9
Jul-0
7 201
9
Oct-0
6 201
9
Jan-
05 20
20
Apr-0
5 20
20
Jul-0
5 202
0
Oct-0
4 202
0
Mar
-14 2
021
Private Label Origination Credit Limit Subprime Private Label Origination Credit Limit
Private Label Card Average Origination Credit Limit Average Origination Credit Limit over time; NSA Subprime accounts defined as those with borrower’s origination VantageScore® 3.0 less than 620
Source: Equifax Inc.
Credit Cards: Private Label

80 PROPRIETARY |
Originations through March 14, 2021 reported as of March 16, 2021
$0
$500
$1,000
$1,500
$2,000
$2,500
$3,000
Jan-
07 20
18
Apr-0
8 20
18
Jul-0
8 201
8
Oct-0
7 201
8
Jan-
06 20
19
Apr-0
7 201
9
Jul-0
7 201
9
Oct-0
6 201
9
Jan-
05 20
20
Apr-0
5 20
20
Jul-0
5 202
0
Oct-0
4 202
0
Mar
-14 2
021
Private Label Origination Credit Limit Subprime Private Label Origination Credit Limit
Private Label Card Average Origination Credit Limit Average Origination Credit Limit over time; NSA Subprime accounts defined as those with borrower’s origination FICO® Score 9 less than 620
Source: Equifax Inc.
Credit Cards: Private Label

81 PROPRIETARY |
Originations through March 14, 2021 reported as of March 16, 2021
0%
2%
4%
6%
7%
9%
11%
13%
$0
$299
$598
$897
$1,196
$1,496
$1,795
$2,094M
ar-0
1 202
0
Mar
-08 2
020
Mar
-15 2
020
Mar
-22 2
020
Mar
-29 2
020
Apr-0
5 20
20
Apr-1
2 20
20
Apr-1
9 20
20
Apr-2
6 20
20
May
-03
2020
May
-10
2020
May
-17
2020
May
-24
2020
May
-31
2020
Jun-
07 2
020
Jun-
14 2
020
Jun-
21 2
020
Jun-
28 2
020
Jul-0
5 20
20
Jul-1
2 20
20
Jul-1
9 20
20
Jul-2
6 20
20
Aug-
02 2
020
Aug-
09 2
020
Aug-
16 2
020
Aug-
23 2
020
Aug-
30 2
020
Sep-
06 20
20
Sep-
13 20
20
Sep-
20 20
20
Sep-
27 20
20
Oct-0
4 20
20
Oct-1
1 20
20
Oct-1
8 20
20
Oct-2
5 20
20
Nov-
01 2
020
Nov-
08 2
020
Nov-
15 2
020
Nov-
22 2
020
Nov-
29 2
020
Dec-0
6 20
20
Dec-1
3 20
20
Dec-2
0 20
20
Dec-2
7 20
20
Jan-
03 2
021
Jan-
10 2
021
Jan-
17 2
021
Jan-
24 2
021
Jan-
31 2
021
Feb-
07 20
21
Feb-
14 20
21
Feb-
21 20
21
Feb-
28 20
21
Mar
-07 2
021
Mar
-14 2
021
Subp
rime S
hare
Milli
ons
Private Label Origination Credit Limits Private Label Subprime share of Origination Credit Limits
Private Label Origination Credit Limits Total Credit Limits in $Millions; Subprime Share of Total Origination Credit Limits (%); NSA Subprime accounts defined as those with borrower’s origination VantageScore® 3.0 less than 620
Source: Equifax Inc.
Credit Cards: Private Label

82 PROPRIETARY |
Originations through March 14, 2021 reported as of March 16, 2021
0%
1%
3%
4%
6%
7%
8%
10%
$0
$299
$598
$897
$1,196
$1,496
$1,795
$2,094M
ar-0
1 202
0
Mar
-08 2
020
Mar
-15 2
020
Mar
-22 2
020
Mar
-29 2
020
Apr-0
5 20
20
Apr-1
2 20
20
Apr-1
9 20
20
Apr-2
6 20
20
May
-03
2020
May
-10
2020
May
-17
2020
May
-24
2020
May
-31
2020
Jun-
07 2
020
Jun-
14 2
020
Jun-
21 2
020
Jun-
28 2
020
Jul-0
5 20
20
Jul-1
2 20
20
Jul-1
9 20
20
Jul-2
6 20
20
Aug-
02 2
020
Aug-
09 2
020
Aug-
16 2
020
Aug-
23 2
020
Aug-
30 2
020
Sep-
06 20
20
Sep-
13 20
20
Sep-
20 20
20
Sep-
27 20
20
Oct-0
4 20
20
Oct-1
1 20
20
Oct-1
8 20
20
Oct-2
5 20
20
Nov-
01 2
020
Nov-
08 2
020
Nov-
15 2
020
Nov-
22 2
020
Nov-
29 2
020
Dec-0
6 20
20
Dec-1
3 20
20
Dec-2
0 20
20
Dec-2
7 20
20
Jan-
03 2
021
Jan-
10 2
021
Jan-
17 2
021
Jan-
24 2
021
Jan-
31 2
021
Feb-
07 20
21
Feb-
14 20
21
Feb-
21 20
21
Feb-
28 20
21
Mar
-07 2
021
Mar
-14 2
021
Subp
rime S
hare
Milli
ons
Private Label Origination Credit Limits Private Label Subprime share of Origination Credit Limits
Private Label Origination Credit Limits Total Credit Limits in $Millions; Subprime Share of Total Origination Credit Limits (%); NSA Subprime accounts defined as those with borrower’s origination FICO® Score 9 less than 620
Source: Equifax Inc.
Credit Cards: Private Label

83 PROPRIETARY |
Originations through March 14, 2021 reported as of March 16, 2021
655
661
667
673
679
685
691
697
703
709
715
0%
10%
20%
30%
40%
50%
60%
70%
80%
90%
100%
Mar
-01 2
020
Mar
-08 2
020
Mar
-15 2
020
Mar
-22 2
020
Mar
-29 2
020
Apr-0
5 20
20
Apr-1
2 20
20
Apr-1
9 20
20
Apr-2
6 20
20
May
-03
2020
May
-10
2020
May
-17
2020
May
-24
2020
May
-31
2020
Jun-
07 2
020
Jun-
14 2
020
Jun-
21 2
020
Jun-
28 2
020
Jul-0
5 20
20
Jul-1
2 20
20
Jul-1
9 20
20
Jul-2
6 20
20
Aug-
02 2
020
Aug-
09 2
020
Aug-
16 2
020
Aug-
23 2
020
Aug-
30 2
020
Sep-
06 20
20
Sep-
13 20
20
Sep-
20 20
20
Sep-
27 20
20
Oct-0
4 20
20
Oct-1
1 20
20
Oct-1
8 20
20
Oct-2
5 20
20
Nov-
01 2
020
Nov-
08 2
020
Nov-
15 2
020
Nov-
22 2
020
Nov-
29 2
020
Dec-0
6 20
20
Dec-1
3 20
20
Dec-2
0 20
20
Dec-2
7 20
20
Jan-
03 2
021
Jan-
10 2
021
Jan-
17 2
021
Jan-
24 2
021
Jan-
31 2
021
Feb-
07 20
21
Feb-
14 20
21
Feb-
21 20
21
Feb-
28 20
21
Mar
-07 2
021
Mar
-14 2
021
300-539 540-579 580-619 620-659 660-699 700-739 740-779 780-850 no score Avg. VS® 3.0
Private Label Credit Cards Origination Risk VantageScore® 3.0 Distribution for Private Label Card Originations by Week (Percent of Accounts)
Source: Equifax Inc.
Credit Cards: Private Label
The last 8 weeks of weekly data is subject to revision due to reporting lags by data furnishers.

84 PROPRIETARY |
Originations through March 14, 2021 reported as of March 16, 2021
665
671
677
683
689
695
701
707
713
719
725
0%
10%
20%
30%
40%
50%
60%
70%
80%
90%
100%
Mar
-01 2
020
Mar
-08 2
020
Mar
-15 2
020
Mar
-22 2
020
Mar
-29 2
020
Apr-0
5 20
20
Apr-1
2 20
20
Apr-1
9 20
20
Apr-2
6 20
20
May
-03
2020
May
-10
2020
May
-17
2020
May
-24
2020
May
-31
2020
Jun-
07 2
020
Jun-
14 2
020
Jun-
21 2
020
Jun-
28 2
020
Jul-0
5 20
20
Jul-1
2 20
20
Jul-1
9 20
20
Jul-2
6 20
20
Aug-
02 2
020
Aug-
09 2
020
Aug-
16 2
020
Aug-
23 2
020
Aug-
30 2
020
Sep-
06 20
20
Sep-
13 20
20
Sep-
20 20
20
Sep-
27 20
20
Oct-0
4 20
20
Oct-1
1 20
20
Oct-1
8 20
20
Oct-2
5 20
20
Nov-
01 2
020
Nov-
08 2
020
Nov-
15 2
020
Nov-
22 2
020
Nov-
29 2
020
Dec-0
6 20
20
Dec-1
3 20
20
Dec-2
0 20
20
Dec-2
7 20
20
Jan-
03 2
021
Jan-
10 2
021
Jan-
17 2
021
Jan-
24 2
021
Jan-
31 2
021
Feb-
07 20
21
Feb-
14 20
21
Feb-
21 20
21
Feb-
28 20
21
Mar
-07 2
021
Mar
-14 2
021
300-539 540-579 580-619 620-659 660-699 700-739 740-779 780-850 no score Avg. FICO® Score 9
Private Label Credit Cards Origination Risk FICO® Score 9 Distribution for Private Label Card Originations by Week (Percent of Accounts)
Source: Equifax Inc.
Credit Cards: Private Label
The last 8 weeks of weekly data is subject to revision due to reporting lags by data furnishers.

85 PROPRIETARY |
Credit Trends Originations: First Mortgage
86 PROPRIETARY |
Originations through March 14, 2021 reported as of March 16, 2021
First Mortgage Originations Observations Originations through March 14, 2021 reported as of March 16, 2021
• Around 700 first mortgage loans were issued in the week ending March 7th.
• The total credit limit for first mortgage loans originated in the week ending March 7th is $200 million.
• It is important to note that for the week ending March 7th, there was low weekly volume for first mortgage subprime accounts.
• The average credit limit for all first mortgage loans issued in the week ending March 7th was $361,527.
First Mortgage

87 PROPRIETARY |
Originations through March 14, 2021 reported as of March 16, 2021
711
719
727
735
743
751
759
767
775
0
56
113
169
226
282
339
395
452Ja
n-06
201
9
Apr-0
7 20
19
Jul-0
7 20
19
Oct-0
6 20
19
Jan-
05 2
020
Apr-0
5 20
20
Jul-0
5 20
20
Oct-0
4 20
20
Mar
-14
2021
Thou
sand
s
New Trades VS® 3.0
First Mortgage Originations: Accounts Number of Accounts in Thousands; NSA. Average VantageScore® 3.0
Source: Equifax Inc.
First Mortgage
WEEKEND CURR YR PREV YR
Mar-01 2020 232.7 140.8
Mar-08 2020 177.0 100.2
Mar-15 2020 191.1 116.1
Mar-22 2020 211.4 116.2
Mar-29 2020 245.9 159.4
Apr-05 2020 241.6 108.2
Apr-12 2020 215.9 119.2
Apr-19 2020 242.4 132.4
Apr-26 2020 273.6 158.2
May-03 2020 270.6 170.5
May-10 2020 229.8 134.0
May-17 2020 257.0 150.0
# FIRST MORTGAGE ACCOUNTS
ORIGINATED (THOUSANDS)
WEEKEND CURR YR PREV YR
May-24 2020 297.1 169.9
May-31 2020 243.8 167.1
Jun-07 2020 249.2 139.0
Jun-14 2020 265.4 154.5
Jun-21 2020 286.2 161.9
Jun-28 2020 311.8 219.2
Jul-05 2020 271.4 112.7
Jul-12 2020 260.5 158.8
Jul-19 2020 290.2 174.6
Jul-26 2020 301.4 198.8
Aug-02 2020 341.7 203.9
Aug-09 2020 264.4 157.0
# FIRST MORTGAGE ACCOUNTS
ORIGINATED (THOUSANDS)
WEEKEND CURR YR PREV YR
Aug-16 2020 288.7 176.3
Aug-23 2020 306.0 186.3
Aug-30 2020 341.1 244.1
Sep-06 2020 316.9 131.0
Sep-13 2020 243.3 184.6
Sep-20 2020 313.7 203.6
Sep-27 2020 351.7 237.6
Oct-04 2020 351.0 209.1
Oct-11 2020 304.4 183.4
Oct-18 2020 298.1 176.2
Oct-25 2020 342.2 218.8
Nov-01 2020 376.4 218.8
# FIRST MORTGAGE ACCOUNTS
ORIGINATED (THOUSANDS)
WEEKEND CURR YR PREV YR
Nov-08 2020 283.4 172.7
Nov-15 2020 263.6 169.5
Nov-22 2020 329.7 216.5
Nov-29 2020 230.3 155.0
Dec-06 2020 298.2 167.6
Dec-13 2020 281.8 183.0
Dec-20 2020 316.1 213.3
Dec-27 2020 237.2 136.8
Jan-03 2021 217.7 52.3
Jan-10 2021 188.4 135.7
Jan-17 2021 214.3 154.4
Jan-24 2021 182.6 136.9
# FIRST MORTGAGE ACCOUNTS
ORIGINATED (THOUSANDS)
WEEKEND CURR YR PREV YR
Jan-31 2021 217.7 197.2
Feb-07 2021 161.7 142.6
Feb-14 2021 168.6 168.1
Feb-21 2021 128.2 162.9
Feb-28 2021 130.7 232.7
Mar-07 2021 20.9 177.0
Mar-14 2021 0.7 191.1
# FIRST MORTGAGE ACCOUNTS
ORIGINATED (THOUSANDS)

88 PROPRIETARY |
Originations through March 14, 2021 reported as of March 16, 2021
709
716
723
730
737
744
751
758
765
0
56
113
169
226
282
339
395
452Ja
n-06
201
9
Apr-0
7 20
19
Jul-0
7 20
19
Oct-0
6 20
19
Jan-
05 2
020
Apr-0
5 20
20
Jul-0
5 20
20
Oct-0
4 20
20
Mar
-14
2021
Thou
sand
s
New Trades FICO® Score 5
First Mortgage Originations: Accounts Number of Accounts in Thousands; NSA. Average FICO® Score 5
Source: Equifax Inc.
First Mortgage
WEEKEND CURR YR PREV YR
Mar-01 2020 232.7 140.8
Mar-08 2020 177.0 100.2
Mar-15 2020 191.1 116.1
Mar-22 2020 211.4 116.2
Mar-29 2020 245.9 159.4
Apr-05 2020 241.6 108.2
Apr-12 2020 215.9 119.2
Apr-19 2020 242.4 132.4
Apr-26 2020 273.6 158.2
May-03 2020 270.6 170.5
May-10 2020 229.8 134.0
May-17 2020 257.0 150.0
# FIRST MORTGAGE ACCOUNTS
ORIGINATED (THOUSANDS)
WEEKEND CURR YR PREV YR
May-24 2020 297.1 169.9
May-31 2020 243.8 167.1
Jun-07 2020 249.2 139.0
Jun-14 2020 265.4 154.5
Jun-21 2020 286.2 161.9
Jun-28 2020 311.8 219.2
Jul-05 2020 271.4 112.7
Jul-12 2020 260.5 158.8
Jul-19 2020 290.2 174.6
Jul-26 2020 301.4 198.8
Aug-02 2020 341.7 203.9
Aug-09 2020 264.4 157.0
# FIRST MORTGAGE ACCOUNTS
ORIGINATED (THOUSANDS)
WEEKEND CURR YR PREV YR
Aug-16 2020 288.7 176.3
Aug-23 2020 306.0 186.3
Aug-30 2020 341.1 244.1
Sep-06 2020 316.9 131.0
Sep-13 2020 243.3 184.6
Sep-20 2020 313.7 203.6
Sep-27 2020 351.7 237.6
Oct-04 2020 351.0 209.1
Oct-11 2020 304.4 183.4
Oct-18 2020 298.1 176.2
Oct-25 2020 342.2 218.8
Nov-01 2020 376.4 218.8
# FIRST MORTGAGE ACCOUNTS
ORIGINATED (THOUSANDS)
WEEKEND CURR YR PREV YR
Nov-08 2020 283.4 172.7
Nov-15 2020 263.6 169.5
Nov-22 2020 329.7 216.5
Nov-29 2020 230.3 155.0
Dec-06 2020 298.2 167.6
Dec-13 2020 281.8 183.0
Dec-20 2020 316.1 213.3
Dec-27 2020 237.2 136.8
Jan-03 2021 217.7 52.3
Jan-10 2021 188.4 135.7
Jan-17 2021 214.3 154.4
Jan-24 2021 182.6 136.9
# FIRST MORTGAGE ACCOUNTS
ORIGINATED (THOUSANDS)
WEEKEND CURR YR PREV YR
Jan-31 2021 217.7 197.2
Feb-07 2021 161.7 142.6
Feb-14 2021 168.6 168.1
Feb-21 2021 128.2 162.9
Feb-28 2021 130.7 232.7
Mar-07 2021 20.9 177.0
Mar-14 2021 0.7 191.1
# FIRST MORTGAGE ACCOUNTS
ORIGINATED (THOUSANDS)

89 PROPRIETARY |
Originations through March 14, 2021 reported as of March 16, 2021
711
719
727
735
743
751
759
767
775
0
17
33
50
67
84
100
117
134Ja
n-06
201
9
Apr-0
7 20
19
Jul-0
7 20
19
Oct-0
6 20
19
Jan-
05 2
020
Apr-0
5 20
20
Jul-0
5 20
20
Oct-0
4 20
20
Mar
-14
2021
Billi
ons
New Trades VS® 3.0
First Mortgage Originations: Balances $ Balances in Billions; NSA. Average VantageScore® 3.0
Source: Equifax Inc.
First Mortgage
WEEKEND CURR YR PREV YR
Mar-01 2020 $67.6 $36.8
Mar-08 2020 $51.1 $26.3
Mar-15 2020 $55.5 $30.4
Mar-22 2020 $62.1 $30.8
Mar-29 2020 $72.7 $42.1
Apr-05 2020 $71.5 $29.1
Apr-12 2020 $63.3 $31.9
Apr-19 2020 $70.8 $35.7
Apr-26 2020 $80.4 $43.7
May-03 2020 $79.0 $47.0
May-10 2020 $66.2 $36.9
May-17 2020 $74.0 $41.6
TOTAL FIRST MORTGAGE
BALANCES ORIGINATED
(BILLIONS)WEEKEND CURR YR PREV YR
May-24 2020 $86.1 $47.5
May-31 2020 $70.3 $46.4
Jun-07 2020 $71.8 $38.4
Jun-14 2020 $76.1 $42.7
Jun-21 2020 $82.6 $45.5
Jun-28 2020 $90.4 $61.6
Jul-05 2020 $78.8 $32.1
Jul-12 2020 $75.2 $44.5
Jul-19 2020 $84.2 $49.3
Jul-26 2020 $87.7 $57.0
Aug-02 2020 $100.0 $57.4
Aug-09 2020 $77.2 $44.2
TOTAL FIRST MORTGAGE
BALANCES ORIGINATED
(BILLIONS)WEEKEND CURR YR PREV YR
Aug-16 2020 $84.4 $49.5
Aug-23 2020 $90.0 $53.2
Aug-30 2020 $100.8 $68.8
Sep-06 2020 $93.2 $37.4
Sep-13 2020 $71.3 $52.1
Sep-20 2020 $92.7 $58.1
Sep-27 2020 $103.8 $68.5
Oct-04 2020 $103.9 $59.6
Oct-11 2020 $89.1 $52.4
Oct-18 2020 $88.2 $50.2
Oct-25 2020 $100.6 $63.1
Nov-01 2020 $111.5 $62.5
TOTAL FIRST MORTGAGE
BALANCES ORIGINATED
(BILLIONS)WEEKEND CURR YR PREV YR
Nov-08 2020 $82.2 $48.9
Nov-15 2020 $76.3 $48.4
Nov-22 2020 $95.7 $62.2
Nov-29 2020 $66.6 $43.7
Dec-06 2020 $87.5 $47.9
Dec-13 2020 $81.5 $52.0
Dec-20 2020 $92.0 $61.3
Dec-27 2020 $69.5 $39.3
Jan-03 2021 $63.8 $15.0
Jan-10 2021 $54.5 $38.7
Jan-17 2021 $61.8 $43.7
Jan-24 2021 $52.5 $38.9
TOTAL FIRST MORTGAGE
BALANCES ORIGINATED
(BILLIONS)WEEKEND CURR YR PREV YR
Jan-31 2021 $63.6 $56.5
Feb-07 2021 $47.7 $40.6
Feb-14 2021 $49.3 $48.1
Feb-21 2021 $38.0 $47.0
Feb-28 2021 $38.6 $67.6
Mar-07 2021 $7.1 $51.1
Mar-14 2021 $0.2 $55.5
TOTAL FIRST MORTGAGE
BALANCES ORIGINATED
(BILLIONS)

90 PROPRIETARY |
Originations through March 14, 2021 reported as of March 16, 2021
709
716
723
730
737
744
751
758
765
0
17
33
50
67
84
100
117
134Ja
n-06
201
9
Apr-0
7 20
19
Jul-0
7 20
19
Oct-0
6 20
19
Jan-
05 2
020
Apr-0
5 20
20
Jul-0
5 20
20
Oct-0
4 20
20
Mar
-14
2021
Billi
ons
New Trades FICO® Score 5
First Mortgage Originations: Balances $ Balances in Billions; NSA. Average FICO® Score 5
Source: Equifax Inc.
First Mortgage
WEEKEND CURR YR PREV YR
Mar-01 2020 $67.6 $36.8
Mar-08 2020 $51.1 $26.3
Mar-15 2020 $55.5 $30.4
Mar-22 2020 $62.1 $30.8
Mar-29 2020 $72.7 $42.1
Apr-05 2020 $71.5 $29.1
Apr-12 2020 $63.3 $31.9
Apr-19 2020 $70.8 $35.7
Apr-26 2020 $80.4 $43.7
May-03 2020 $79.0 $47.0
May-10 2020 $66.2 $36.9
May-17 2020 $74.0 $41.6
TOTAL FIRST MORTGAGE
BALANCES ORIGINATED
(BILLIONS)WEEKEND CURR YR PREV YR
May-24 2020 $86.1 $47.5
May-31 2020 $70.3 $46.4
Jun-07 2020 $71.8 $38.4
Jun-14 2020 $76.1 $42.7
Jun-21 2020 $82.6 $45.5
Jun-28 2020 $90.4 $61.6
Jul-05 2020 $78.8 $32.1
Jul-12 2020 $75.2 $44.5
Jul-19 2020 $84.2 $49.3
Jul-26 2020 $87.7 $57.0
Aug-02 2020 $100.0 $57.4
Aug-09 2020 $77.2 $44.2
TOTAL FIRST MORTGAGE
BALANCES ORIGINATED
(BILLIONS)WEEKEND CURR YR PREV YR
Aug-16 2020 $84.4 $49.5
Aug-23 2020 $90.0 $53.2
Aug-30 2020 $100.8 $68.8
Sep-06 2020 $93.2 $37.4
Sep-13 2020 $71.3 $52.1
Sep-20 2020 $92.7 $58.1
Sep-27 2020 $103.8 $68.5
Oct-04 2020 $103.9 $59.6
Oct-11 2020 $89.1 $52.4
Oct-18 2020 $88.2 $50.2
Oct-25 2020 $100.6 $63.1
Nov-01 2020 $111.5 $62.5
TOTAL FIRST MORTGAGE
BALANCES ORIGINATED
(BILLIONS)WEEKEND CURR YR PREV YR
Nov-08 2020 $82.2 $48.9
Nov-15 2020 $76.3 $48.4
Nov-22 2020 $95.7 $62.2
Nov-29 2020 $66.6 $43.7
Dec-06 2020 $87.5 $47.9
Dec-13 2020 $81.5 $52.0
Dec-20 2020 $92.0 $61.3
Dec-27 2020 $69.5 $39.3
Jan-03 2021 $63.8 $15.0
Jan-10 2021 $54.5 $38.7
Jan-17 2021 $61.8 $43.7
Jan-24 2021 $52.5 $38.9
TOTAL FIRST MORTGAGE
BALANCES ORIGINATED
(BILLIONS)WEEKEND CURR YR PREV YR
Jan-31 2021 $63.6 $56.5
Feb-07 2021 $47.7 $40.6
Feb-14 2021 $49.3 $48.1
Feb-21 2021 $38.0 $47.0
Feb-28 2021 $38.6 $67.6
Mar-07 2021 $7.1 $51.1
Mar-14 2021 $0.2 $55.5
TOTAL FIRST MORTGAGE
BALANCES ORIGINATED
(BILLIONS)
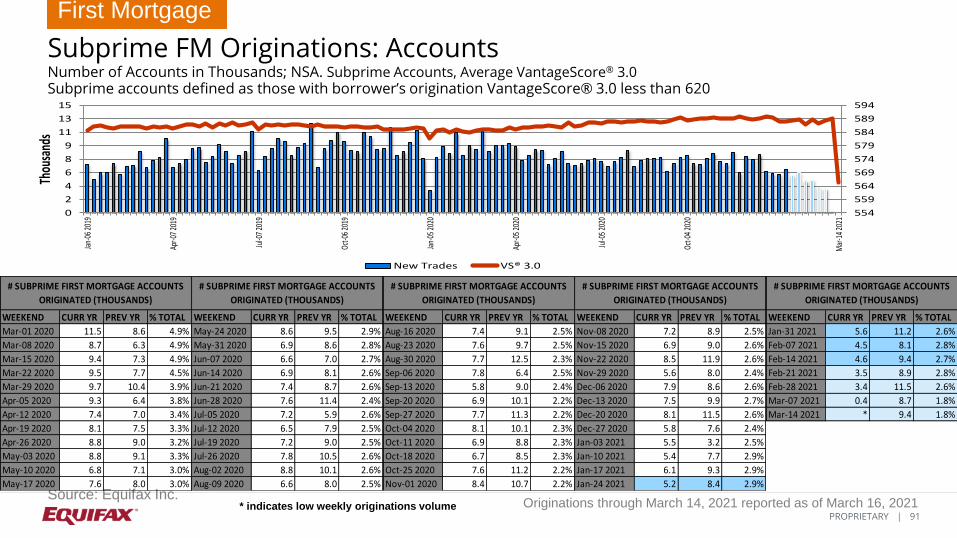
91 PROPRIETARY |
Originations through March 14, 2021 reported as of March 16, 2021
554
559
564
569
574
579
584
589
594
0
2
4
6
8
9
11
13
15
Jan-
06 2
019
Apr-0
7 20
19
Jul-0
7 20
19
Oct-0
6 20
19
Jan-
05 2
020
Apr-0
5 20
20
Jul-0
5 20
20
Oct-0
4 20
20
Mar
-14
2021
Thou
sand
s
New Trades VS® 3.0
Subprime FM Originations: Accounts Number of Accounts in Thousands; NSA. Subprime Accounts, Average VantageScore® 3.0 Subprime accounts defined as those with borrower’s origination VantageScore® 3.0 less than 620
Source: Equifax Inc.
First Mortgage
WEEKEND CURR YR PREV YR % TOTAL
Mar-01 2020 11.5 8.6 4.9%
Mar-08 2020 8.7 6.3 4.9%
Mar-15 2020 9.4 7.3 4.9%
Mar-22 2020 9.5 7.7 4.5%
Mar-29 2020 9.7 10.4 3.9%
Apr-05 2020 9.3 6.4 3.8%
Apr-12 2020 7.4 7.0 3.4%
Apr-19 2020 8.1 7.5 3.3%
Apr-26 2020 8.8 9.0 3.2%
May-03 2020 8.8 9.1 3.3%
May-10 2020 6.8 7.1 3.0%
May-17 2020 7.6 8.0 3.0%
# SUBPRIME FIRST MORTGAGE ACCOUNTS
ORIGINATED (THOUSANDS)
WEEKEND CURR YR PREV YR % TOTAL
May-24 2020 8.6 9.5 2.9%
May-31 2020 6.9 8.6 2.8%
Jun-07 2020 6.6 7.0 2.7%
Jun-14 2020 6.9 8.1 2.6%
Jun-21 2020 7.4 8.7 2.6%
Jun-28 2020 7.6 11.4 2.4%
Jul-05 2020 7.2 5.9 2.6%
Jul-12 2020 6.5 7.9 2.5%
Jul-19 2020 7.2 9.0 2.5%
Jul-26 2020 7.8 10.5 2.6%
Aug-02 2020 8.8 10.1 2.6%
Aug-09 2020 6.6 8.0 2.5%
# SUBPRIME FIRST MORTGAGE ACCOUNTS
ORIGINATED (THOUSANDS)
WEEKEND CURR YR PREV YR % TOTAL
Aug-16 2020 7.4 9.1 2.5%
Aug-23 2020 7.6 9.7 2.5%
Aug-30 2020 7.7 12.5 2.3%
Sep-06 2020 7.8 6.4 2.5%
Sep-13 2020 5.8 9.0 2.4%
Sep-20 2020 6.9 10.1 2.2%
Sep-27 2020 7.7 11.3 2.2%
Oct-04 2020 8.1 10.1 2.3%
Oct-11 2020 6.9 8.8 2.3%
Oct-18 2020 6.7 8.5 2.3%
Oct-25 2020 7.6 11.2 2.2%
Nov-01 2020 8.4 10.7 2.2%
# SUBPRIME FIRST MORTGAGE ACCOUNTS
ORIGINATED (THOUSANDS)
WEEKEND CURR YR PREV YR % TOTAL
Nov-08 2020 7.2 8.9 2.5%
Nov-15 2020 6.9 9.0 2.6%
Nov-22 2020 8.5 11.9 2.6%
Nov-29 2020 5.6 8.0 2.4%
Dec-06 2020 7.9 8.6 2.6%
Dec-13 2020 7.5 9.9 2.7%
Dec-20 2020 8.1 11.5 2.6%
Dec-27 2020 5.8 7.6 2.4%
Jan-03 2021 5.5 3.2 2.5%
Jan-10 2021 5.4 7.7 2.9%
Jan-17 2021 6.1 9.3 2.9%
Jan-24 2021 5.2 8.4 2.9%
# SUBPRIME FIRST MORTGAGE ACCOUNTS
ORIGINATED (THOUSANDS)
WEEKEND CURR YR PREV YR % TOTAL
Jan-31 2021 5.6 11.2 2.6%
Feb-07 2021 4.5 8.1 2.8%
Feb-14 2021 4.6 9.4 2.7%
Feb-21 2021 3.5 8.9 2.8%
Feb-28 2021 3.4 11.5 2.6%
Mar-07 2021 0.4 8.7 1.8%
Mar-14 2021 * 9.4 1.8%
# SUBPRIME FIRST MORTGAGE ACCOUNTS
ORIGINATED (THOUSANDS)
* indicates low weekly originations volume

92 PROPRIETARY |
Originations through March 14, 2021 reported as of March 16, 2021
560
565
570
575
580
585
590
595
600
0
2
3
5
6
8
9
11
12
Jan-
06 2
019
Apr-0
7 20
19
Jul-0
7 20
19
Oct-0
6 20
19
Jan-
05 2
020
Apr-0
5 20
20
Jul-0
5 20
20
Oct-0
4 20
20
Mar
-14
2021
Thou
sand
s
New Trades FICO® Score 5
Subprime FM Originations: Accounts Number of Accounts in Thousands; NSA. Subprime Accounts, Average FICO® Score 5 Subprime accounts defined as those with borrower’s origination FICO® Score 5 less than 620
Source: Equifax Inc.
First Mortgage
WEEKEND CURR YR PREV YR % TOTAL
Mar-01 2020 8.5 6.6 3.6%
Mar-08 2020 6.8 4.6 3.8%
Mar-15 2020 7.4 5.5 3.9%
Mar-22 2020 7.5 5.5 3.5%
Mar-29 2020 7.6 7.6 3.1%
Apr-05 2020 7.1 5.2 2.9%
Apr-12 2020 5.6 5.7 2.6%
Apr-19 2020 6.3 6.0 2.6%
Apr-26 2020 6.8 7.2 2.5%
May-03 2020 6.5 7.4 2.4%
May-10 2020 5.2 5.8 2.3%
May-17 2020 5.9 6.6 2.3%
# SUBPRIME FIRST MORTGAGE ACCOUNTS
ORIGINATED (THOUSANDS)
WEEKEND CURR YR PREV YR % TOTAL
May-24 2020 6.7 7.8 2.3%
May-31 2020 5.0 7.1 2.1%
Jun-07 2020 5.7 6.0 2.3%
Jun-14 2020 5.8 7.0 2.2%
Jun-21 2020 6.2 7.4 2.2%
Jun-28 2020 6.2 9.6 2.0%
Jul-05 2020 6.0 4.8 2.2%
Jul-12 2020 5.6 6.5 2.1%
Jul-19 2020 6.2 7.5 2.1%
Jul-26 2020 6.7 8.7 2.2%
Aug-02 2020 7.4 8.3 2.2%
Aug-09 2020 5.8 6.5 2.2%
# SUBPRIME FIRST MORTGAGE ACCOUNTS
ORIGINATED (THOUSANDS)
WEEKEND CURR YR PREV YR % TOTAL
Aug-16 2020 6.2 7.3 2.1%
Aug-23 2020 6.4 8.0 2.1%
Aug-30 2020 6.3 10.0 1.8%
Sep-06 2020 7.0 5.0 2.2%
Sep-13 2020 5.2 7.2 2.1%
Sep-20 2020 6.1 8.0 2.0%
Sep-27 2020 6.6 8.8 1.9%
Oct-04 2020 6.9 8.1 2.0%
Oct-11 2020 5.9 7.1 1.9%
Oct-18 2020 5.7 7.1 1.9%
Oct-25 2020 6.3 9.4 1.8%
Nov-01 2020 7.1 8.5 1.9%
# SUBPRIME FIRST MORTGAGE ACCOUNTS
ORIGINATED (THOUSANDS)
WEEKEND CURR YR PREV YR % TOTAL
Nov-08 2020 6.0 7.0 2.1%
Nov-15 2020 6.0 7.4 2.3%
Nov-22 2020 7.2 9.7 2.2%
Nov-29 2020 4.6 6.5 2.0%
Dec-06 2020 6.9 7.1 2.3%
Dec-13 2020 6.7 8.3 2.4%
Dec-20 2020 7.3 9.7 2.3%
Dec-27 2020 5.0 6.1 2.1%
Jan-03 2021 4.8 2.5 2.2%
Jan-10 2021 4.7 6.3 2.5%
Jan-17 2021 5.4 7.8 2.5%
Jan-24 2021 4.5 7.0 2.5%
# SUBPRIME FIRST MORTGAGE ACCOUNTS
ORIGINATED (THOUSANDS)
WEEKEND CURR YR PREV YR % TOTAL
Jan-31 2021 4.7 8.9 2.1%
Feb-07 2021 3.8 6.1 2.4%
Feb-14 2021 3.9 7.1 2.3%
Feb-21 2021 3.0 6.8 2.3%
Feb-28 2021 2.9 8.5 2.2%
Mar-07 2021 0.3 6.8 1.4%
Mar-14 2021 * 7.4 2.1%
# SUBPRIME FIRST MORTGAGE ACCOUNTS
ORIGINATED (THOUSANDS)
* indicates low weekly originations volume

93 PROPRIETARY |
Originations through March 14, 2021 reported as of March 16, 2021
554
559
564
569
574
579
584
589
594
0.0
0.4
0.8
1.3
1.7
2.1
2.5
2.9
3.4
Jan-
06 2
019
Apr-0
7 20
19
Jul-0
7 20
19
Oct-0
6 20
19
Jan-
05 2
020
Apr-0
5 20
20
Jul-0
5 20
20
Oct-0
4 20
20
Mar
-14
2021
Billi
ons
New Trades VS® 3.0
Subprime FM Originations: Balances Total Origination Balances in $Billions; NSA. Subprime Accounts, Average VantageScore® 3.0 Subprime accounts defined as those with borrower’s origination VantageScore® 3.0 less than 620
Source: Equifax Inc.
First Mortgage
WEEKEND CURR YR PREV YR % TOTAL
Mar-01 2020 $2.6 $1.7 3.8%
Mar-08 2020 $2.0 $1.2 3.8%
Mar-15 2020 $2.1 $1.5 3.8%
Mar-22 2020 $2.1 $1.5 3.4%
Mar-29 2020 $2.2 $2.1 3.0%
Apr-05 2020 $2.1 $1.3 2.9%
Apr-12 2020 $1.7 $1.4 2.6%
Apr-19 2020 $1.8 $1.6 2.6%
Apr-26 2020 $2.0 $1.9 2.5%
May-03 2020 $1.9 $1.9 2.4%
May-10 2020 $1.5 $1.5 2.3%
May-17 2020 $1.7 $1.7 2.3%
TOTAL SUBPRIME FIRST MORTGAGE
BALANCES ORIGINATED (BILLIONS)
WEEKEND CURR YR PREV YR % TOTAL
May-24 2020 $2.0 $2.0 2.3%
May-31 2020 $1.5 $1.8 2.2%
Jun-07 2020 $1.5 $1.5 2.1%
Jun-14 2020 $1.5 $1.7 2.0%
Jun-21 2020 $1.6 $1.9 2.0%
Jun-28 2020 $1.7 $2.5 1.9%
Jul-05 2020 $1.6 $1.3 2.0%
Jul-12 2020 $1.5 $1.7 1.9%
Jul-19 2020 $1.6 $1.9 1.9%
Jul-26 2020 $1.7 $2.4 2.0%
Aug-02 2020 $1.9 $2.2 1.9%
Aug-09 2020 $1.5 $1.7 1.9%
TOTAL SUBPRIME FIRST MORTGAGE
BALANCES ORIGINATED (BILLIONS)
WEEKEND CURR YR PREV YR % TOTAL
Aug-16 2020 $1.6 $2.0 1.9%
Aug-23 2020 $1.7 $2.2 1.9%
Aug-30 2020 $1.7 $2.8 1.7%
Sep-06 2020 $1.7 $1.4 1.8%
Sep-13 2020 $1.3 $2.0 1.8%
Sep-20 2020 $1.5 $2.3 1.6%
Sep-27 2020 $1.7 $2.6 1.7%
Oct-04 2020 $1.8 $2.2 1.7%
Oct-11 2020 $1.5 $1.9 1.7%
Oct-18 2020 $1.5 $1.9 1.7%
Oct-25 2020 $1.7 $2.5 1.7%
Nov-01 2020 $1.9 $2.4 1.7%
TOTAL SUBPRIME FIRST MORTGAGE
BALANCES ORIGINATED (BILLIONS)
WEEKEND CURR YR PREV YR % TOTAL
Nov-08 2020 $1.6 $1.9 2.0%
Nov-15 2020 $1.6 $2.0 2.1%
Nov-22 2020 $1.9 $2.7 2.0%
Nov-29 2020 $1.3 $1.7 1.9%
Dec-06 2020 $1.8 $1.9 2.1%
Dec-13 2020 $1.7 $2.2 2.1%
Dec-20 2020 $1.9 $2.6 2.0%
Dec-27 2020 $1.3 $1.7 1.9%
Jan-03 2021 $1.3 $0.7 2.0%
Jan-10 2021 $1.2 $1.7 2.3%
Jan-17 2021 $1.4 $2.1 2.3%
Jan-24 2021 $1.2 $1.9 2.3%
TOTAL SUBPRIME FIRST MORTGAGE
BALANCES ORIGINATED (BILLIONS)
WEEKEND CURR YR PREV YR % TOTAL
Jan-31 2021 $1.3 $2.5 2.1%
Feb-07 2021 $1.0 $1.8 2.2%
Feb-14 2021 $1.1 $2.1 2.2%
Feb-21 2021 $0.8 $2.0 2.2%
Feb-28 2021 $0.8 $2.6 2.0%
Mar-07 2021 * $2.0 1.2%
Mar-14 2021 * $2.1 1.1%
TOTAL SUBPRIME FIRST MORTGAGE
BALANCES ORIGINATED (BILLIONS)
* indicates low weekly originations volume

94 PROPRIETARY |
Originations through March 14, 2021 reported as of March 16, 2021
560
565
570
575
580
585
590
595
600
0.0
0.3
0.6
1.0
1.3
1.6
1.9
2.2
2.6
Jan-
06 2
019
Apr-0
7 20
19
Jul-0
7 20
19
Oct-0
6 20
19
Jan-
05 2
020
Apr-0
5 20
20
Jul-0
5 20
20
Oct-0
4 20
20
Mar
-14
2021
Billi
ons
New Trades FICO® Score 5
Subprime FM Originations: Balances Total Origination Balances in $Billions; NSA. Subprime Accounts, Average FICO® Score 5 Subprime accounts defined as those with borrower’s origination FICO® Score 5 less than 620
Source: Equifax Inc.
First Mortgage
WEEKEND CURR YR PREV YR % TOTAL
Mar-01 2020 $1.8 $1.3 2.7%
Mar-08 2020 $1.4 $0.9 2.8%
Mar-15 2020 $1.6 $1.0 2.9%
Mar-22 2020 $1.6 $1.0 2.6%
Mar-29 2020 $1.6 $1.5 2.2%
Apr-05 2020 $1.5 $1.0 2.1%
Apr-12 2020 $1.2 $1.1 1.9%
Apr-19 2020 $1.3 $1.2 1.9%
Apr-26 2020 $1.4 $1.5 1.8%
May-03 2020 $1.4 $1.4 1.7%
May-10 2020 $1.1 $1.1 1.7%
May-17 2020 $1.2 $1.3 1.7%
TOTAL SUBPRIME FIRST MORTGAGE
BALANCES ORIGINATED (BILLIONS)
WEEKEND CURR YR PREV YR % TOTAL
May-24 2020 $1.4 $1.6 1.7%
May-31 2020 $1.0 $1.4 1.5%
Jun-07 2020 $1.2 $1.2 1.7%
Jun-14 2020 $1.2 $1.4 1.6%
Jun-21 2020 $1.3 $1.5 1.6%
Jun-28 2020 $1.3 $2.0 1.5%
Jul-05 2020 $1.3 $1.0 1.7%
Jul-12 2020 $1.2 $1.3 1.6%
Jul-19 2020 $1.3 $1.5 1.6%
Jul-26 2020 $1.4 $1.8 1.6%
Aug-02 2020 $1.6 $1.7 1.6%
Aug-09 2020 $1.3 $1.3 1.6%
TOTAL SUBPRIME FIRST MORTGAGE BALANCES
ORIGINATED (BILLIONS)
WEEKEND CURR YR PREV YR % TOTAL
Aug-16 2020 $1.3 $1.5 1.6%
Aug-23 2020 $1.4 $1.7 1.5%
Aug-30 2020 $1.3 $2.1 1.3%
Sep-06 2020 $1.5 $1.0 1.6%
Sep-13 2020 $1.1 $1.5 1.6%
Sep-20 2020 $1.3 $1.7 1.4%
Sep-27 2020 $1.4 $1.9 1.4%
Oct-04 2020 $1.5 $1.7 1.4%
Oct-11 2020 $1.2 $1.5 1.4%
Oct-18 2020 $1.2 $1.5 1.4%
Oct-25 2020 $1.4 $2.0 1.4%
Nov-01 2020 $1.5 $1.8 1.4%
TOTAL SUBPRIME FIRST MORTGAGE
BALANCES ORIGINATED (BILLIONS)
WEEKEND CURR YR PREV YR % TOTAL
Nov-08 2020 $1.3 $1.5 1.6%
Nov-15 2020 $1.3 $1.5 1.7%
Nov-22 2020 $1.6 $2.1 1.7%
Nov-29 2020 $1.0 $1.3 1.5%
Dec-06 2020 $1.5 $1.5 1.7%
Dec-13 2020 $1.5 $1.7 1.8%
Dec-20 2020 $1.6 $2.1 1.7%
Dec-27 2020 $1.1 $1.3 1.6%
Jan-03 2021 $1.1 $0.5 1.7%
Jan-10 2021 $1.0 $1.4 1.9%
Jan-17 2021 $1.2 $1.7 1.9%
Jan-24 2021 $1.0 $1.5 1.9%
TOTAL SUBPRIME FIRST MORTGAGE
BALANCES ORIGINATED (BILLIONS)
WEEKEND CURR YR PREV YR % TOTAL
Jan-31 2021 $1.0 $1.9 1.6%
Feb-07 2021 $0.9 $1.3 1.8%
Feb-14 2021 $0.9 $1.5 1.7%
Feb-21 2021 $0.7 $1.5 1.8%
Feb-28 2021 $0.6 $1.8 1.7%
Mar-07 2021 * $1.4 0.9%
Mar-14 2021 * $1.6 1.4%
TOTAL SUBPRIME FIRST MORTGAGE
BALANCES ORIGINATED (BILLIONS)
* indicates low weekly originations volume

95 PROPRIETARY |
Originations through March 14, 2021 reported as of March 16, 2021
$0
$50,000
$100,000
$150,000
$200,000
$250,000
$300,000
$350,000
$400,000
Jan-
07 20
18
Apr-0
8 20
18
Jul-0
8 201
8
Oct-0
7 201
8
Jan-
06 20
19
Apr-0
7 20
19
Jul-0
7 201
9
Oct-0
6 201
9
Jan-
05 20
20
Apr-0
5 20
20
Jul-0
5 202
0
Oct-0
4 202
0
Mar
-14 2
021
First Mortgage Origination Loan Amount Subprime First Mortgage Origination Loan Amount
First Mortgage Average Origination Balance Average Origination Balance Over Time; NSA Subprime accounts defined as those with borrower’s origination VantageScore® 3.0 less than 620
Source: Equifax Inc.
First Mortgage

96 PROPRIETARY |
Originations through March 14, 2021 reported as of March 16, 2021
$0
$50,000
$100,000
$150,000
$200,000
$250,000
$300,000
$350,000
$400,000
Jan-
07 20
18
Apr-0
8 20
18
Jul-0
8 201
8
Oct-0
7 201
8
Jan-
06 20
19
Apr-0
7 20
19
Jul-0
7 201
9
Oct-0
6 201
9
Jan-
05 20
20
Apr-0
5 20
20
Jul-0
5 202
0
Oct-0
4 202
0
Mar
-14 2
021
First Mortgage Origination Loan Amount Subprime First Mortgage Origination Loan Amount
First Mortgage Average Origination Balance Average Origination Balance Over Time; NSA Subprime accounts defined as those with borrower’s origination FICO® Score 5 less than 620
Source: Equifax Inc.
First Mortgage

97 PROPRIETARY |
Originations through March 14, 2021 reported as of March 16, 2021
0.0%
0.6%
1.2%
1.8%
2.4%
3.0%
3.6%
4.2%
$0
$18
$35
$53
$70
$88
$105
$123M
ar-0
1 202
0
Mar
-08 2
020
Mar
-15 2
020
Mar
-22 2
020
Mar
-29 2
020
Apr-0
5 20
20
Apr-1
2 20
20
Apr-1
9 20
20
Apr-2
6 20
20
May
-03
2020
May
-10
2020
May
-17
2020
May
-24
2020
May
-31
2020
Jun-
07 2
020
Jun-
14 2
020
Jun-
21 2
020
Jun-
28 2
020
Jul-0
5 20
20
Jul-1
2 20
20
Jul-1
9 20
20
Jul-2
6 20
20
Aug-
02 2
020
Aug-
09 2
020
Aug-
16 2
020
Aug-
23 2
020
Aug-
30 2
020
Sep-
06 20
20
Sep-
13 20
20
Sep-
20 20
20
Sep-
27 20
20
Oct-0
4 20
20
Oct-1
1 20
20
Oct-1
8 20
20
Oct-2
5 20
20
Nov-
01 2
020
Nov-
08 2
020
Nov-
15 2
020
Nov-
22 2
020
Nov-
29 2
020
Dec-0
6 20
20
Dec-1
3 20
20
Dec-2
0 20
20
Dec-2
7 20
20
Jan-
03 2
021
Jan-
10 2
021
Jan-
17 2
021
Jan-
24 2
021
Jan-
31 2
021
Feb-
07 20
21
Feb-
14 20
21
Feb-
21 20
21
Feb-
28 20
21
Mar
-07 2
021
Mar
-14 2
021
Subp
rime S
hare
Billio
ns
First Mortgage Origination First Mortgage Origination Subprime Share
First Mortgage Origination Balances Total Origination Balances in $Billions; Subprime Share of Total Origination Balances (%); Subprime accounts defined as those with borrower’s origination VantageScore® 3.0 less than 620
Source: Equifax Inc.
First Mortgage
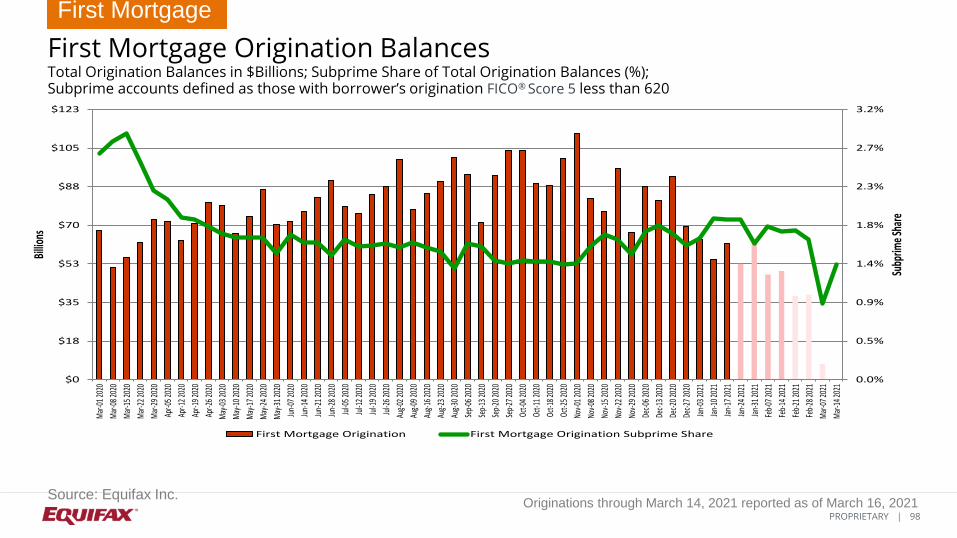
98 PROPRIETARY |
Originations through March 14, 2021 reported as of March 16, 2021
0.0%
0.5%
0.9%
1.4%
1.8%
2.3%
2.7%
3.2%
$0
$18
$35
$53
$70
$88
$105
$123M
ar-0
1 202
0
Mar
-08 2
020
Mar
-15 2
020
Mar
-22 2
020
Mar
-29 2
020
Apr-0
5 20
20
Apr-1
2 20
20
Apr-1
9 20
20
Apr-2
6 20
20
May
-03
2020
May
-10
2020
May
-17
2020
May
-24
2020
May
-31
2020
Jun-
07 2
020
Jun-
14 2
020
Jun-
21 2
020
Jun-
28 2
020
Jul-0
5 20
20
Jul-1
2 20
20
Jul-1
9 20
20
Jul-2
6 20
20
Aug-
02 2
020
Aug-
09 2
020
Aug-
16 2
020
Aug-
23 2
020
Aug-
30 2
020
Sep-
06 20
20
Sep-
13 20
20
Sep-
20 20
20
Sep-
27 20
20
Oct-0
4 20
20
Oct-1
1 20
20
Oct-1
8 20
20
Oct-2
5 20
20
Nov-
01 2
020
Nov-
08 2
020
Nov-
15 2
020
Nov-
22 2
020
Nov-
29 2
020
Dec-0
6 20
20
Dec-1
3 20
20
Dec-2
0 20
20
Dec-2
7 20
20
Jan-
03 2
021
Jan-
10 2
021
Jan-
17 2
021
Jan-
24 2
021
Jan-
31 2
021
Feb-
07 20
21
Feb-
14 20
21
Feb-
21 20
21
Feb-
28 20
21
Mar
-07 2
021
Mar
-14 2
021
Subp
rime S
hare
Billio
ns
First Mortgage Origination First Mortgage Origination Subprime Share
First Mortgage Origination Balances Total Origination Balances in $Billions; Subprime Share of Total Origination Balances (%); Subprime accounts defined as those with borrower’s origination FICO® Score 5 less than 620
Source: Equifax Inc.
First Mortgage

99 PROPRIETARY |
Originations through March 14, 2021 reported as of March 16, 2021
724
729
734
739
744
749
754
759
764
769
774
0%
10%
20%
30%
40%
50%
60%
70%
80%
90%
100%
Mar
-01 2
020
Mar
-08 2
020
Mar
-15 2
020
Mar
-22 2
020
Mar
-29 2
020
Apr-0
5 20
20
Apr-1
2 20
20
Apr-1
9 20
20
Apr-2
6 20
20
May
-03
2020
May
-10
2020
May
-17
2020
May
-24
2020
May
-31
2020
Jun-
07 2
020
Jun-
14 2
020
Jun-
21 2
020
Jun-
28 2
020
Jul-0
5 20
20
Jul-1
2 20
20
Jul-1
9 20
20
Jul-2
6 20
20
Aug-
02 2
020
Aug-
09 2
020
Aug-
16 2
020
Aug-
23 2
020
Aug-
30 2
020
Sep-
06 20
20
Sep-
13 20
20
Sep-
20 20
20
Sep-
27 20
20
Oct-0
4 20
20
Oct-1
1 20
20
Oct-1
8 20
20
Oct-2
5 20
20
Nov-
01 2
020
Nov-
08 2
020
Nov-
15 2
020
Nov-
22 2
020
Nov-
29 2
020
Dec-0
6 20
20
Dec-1
3 20
20
Dec-2
0 20
20
Dec-2
7 20
20
Jan-
03 2
021
Jan-
10 2
021
Jan-
17 2
021
Jan-
24 2
021
Jan-
31 2
021
Feb-
07 20
21
Feb-
14 20
21
Feb-
21 20
21
Feb-
28 20
21
Mar
-07 2
021
Mar
-14 2
021
300-539 540-579 580-619 620-659 660-699 700-739 740-779 780-850 no score Avg. VS® 3.0
First Mortgage Origination Risk VantageScore® 3.0 Distribution for First Mortgage Loan Originations by Week (Percent of Accounts)
Source: Equifax Inc.
First Mortgage
The last 8 weeks of weekly data is subject to revision due to reporting lags by data furnishers.

100 PROPRIETARY |
Originations through March 14, 2021 reported as of March 16, 2021
723
727
731
735
739
743
747
751
755
759
763
0%
10%
20%
30%
40%
50%
60%
70%
80%
90%
100%
Mar
-01 2
020
Mar
-08 2
020
Mar
-15 2
020
Mar
-22 2
020
Mar
-29 2
020
Apr-0
5 20
20
Apr-1
2 20
20
Apr-1
9 20
20
Apr-2
6 20
20
May
-03
2020
May
-10
2020
May
-17
2020
May
-24
2020
May
-31
2020
Jun-
07 2
020
Jun-
14 2
020
Jun-
21 2
020
Jun-
28 2
020
Jul-0
5 20
20
Jul-1
2 20
20
Jul-1
9 20
20
Jul-2
6 20
20
Aug-
02 2
020
Aug-
09 2
020
Aug-
16 2
020
Aug-
23 2
020
Aug-
30 2
020
Sep-
06 20
20
Sep-
13 20
20
Sep-
20 20
20
Sep-
27 20
20
Oct-0
4 20
20
Oct-1
1 20
20
Oct-1
8 20
20
Oct-2
5 20
20
Nov-
01 2
020
Nov-
08 2
020
Nov-
15 2
020
Nov-
22 2
020
Nov-
29 2
020
Dec-0
6 20
20
Dec-1
3 20
20
Dec-2
0 20
20
Dec-2
7 20
20
Jan-
03 2
021
Jan-
10 2
021
Jan-
17 2
021
Jan-
24 2
021
Jan-
31 2
021
Feb-
07 20
21
Feb-
14 20
21
Feb-
21 20
21
Feb-
28 20
21
Mar
-07 2
021
Mar
-14 2
021
300-539 540-579 580-619 620-659 660-699 700-739 740-779 780-850 no score Avg. FICO® Score 5
First Mortgage Origination Risk FICO® Score 5 Distribution for First Mortgage Loan Originations by Week (Percent of Accounts)
Source: Equifax Inc.
First Mortgage
The last 8 weeks of weekly data is subject to revision due to reporting lags by data furnishers.

101 PROPRIETARY |
Credit Trends Originations: Home Equity Revolving Lines of Credit
10
1

102 PROPRIETARY |
HELOC Originations Observations Originations through March 14, 2021 reported as of March 16, 2021
• Around 100 HELOCs have been originated in the week ending March 14th.
• The total credit limit on HELOCs originated in the week ending March 14th is $6.8 million.
• The average loan amount for all HELOCs originated in the week ending March 14th is $70,802. The average credit limit on subprime HELOCs was $21,875.
• It is important to note that for the week ending March 14th, there was low weekly volume for HELOC subprime accounts.
Home Equity: Lines of Credit

103 PROPRIETARY |
Originations through March 14, 2021 reported as of March 16, 2021
737
743
749
755
761
767
773
779
785
0
45
90
134
179
224
269
314
359Ja
n-06
201
9
Apr-0
7 20
19
Jul-0
7 20
19
Oct-0
6 20
19
Jan-
05 2
020
Apr-0
5 20
20
Jul-0
5 20
20
Oct-0
4 20
20
Mar
-14
2021
Hund
reds
New Trades VS® 3.0
HELOC Originations: Accounts Number of Accounts in Hundreds; NSA. Average VantageScore® 3.0
Source: Equifax Inc.
Home Equity: Lines of Credit
WEEKEND CURR YR PREV YR
Mar-01 2020 225.3 228.6
Mar-08 2020 224.6 222.3
Mar-15 2020 235.2 233.7
Mar-22 2020 227.7 242.0
Mar-29 2020 215.3 261.8
Apr-05 2020 216.1 245.8
Apr-12 2020 219.6 260.2
Apr-19 2020 230.2 271.8
Apr-26 2020 238.5 281.8
May-03 2020 240.0 282.8
May-10 2020 231.5 278.8
May-17 2020 237.5 285.8
# HELOC ACCOUNTS ORIGINATED
(HUNDREDS)
WEEKEND CURR YR PREV YR
May-24 2020 241.3 298.9
May-31 2020 198.0 242.5
Jun-07 2020 221.8 266.6
Jun-14 2020 229.6 278.2
Jun-21 2020 229.1 276.2
Jun-28 2020 228.8 289.7
Jul-05 2020 200.1 205.2
Jul-12 2020 248.5 251.0
Jul-19 2020 208.6 261.0
Jul-26 2020 208.5 271.5
Aug-02 2020 206.8 264.7
Aug-09 2020 194.4 251.9
# HELOC ACCOUNTS ORIGINATED
(HUNDREDS)
WEEKEND CURR YR PREV YR
Aug-16 2020 199.7 263.3
Aug-23 2020 199.9 269.6
Aug-30 2020 209.8 277.6
Sep-06 2020 204.5 207.4
Sep-13 2020 160.4 254.7
Sep-20 2020 198.3 266.1
Sep-27 2020 209.9 273.6
Oct-04 2020 205.7 265.9
Oct-11 2020 198.0 265.4
Oct-18 2020 170.0 228.2
Oct-25 2020 202.3 269.2
Nov-01 2020 207.5 267.4
# HELOC ACCOUNTS ORIGINATED
(HUNDREDS)
WEEKEND CURR YR PREV YR
Nov-08 2020 193.3 250.3
Nov-15 2020 164.7 212.2
Nov-22 2020 200.6 265.6
Nov-29 2020 156.0 201.2
Dec-06 2020 179.9 229.0
Dec-13 2020 187.6 241.6
Dec-20 2020 192.1 254.7
Dec-27 2020 144.5 168.4
Jan-03 2021 126.5 81.8
Jan-10 2021 155.6 205.7
Jan-17 2021 174.4 220.9
Jan-24 2021 145.1 182.9
# HELOC ACCOUNTS ORIGINATED
(HUNDREDS)
WEEKEND CURR YR PREV YR
Jan-31 2021 177.7 253.8
Feb-07 2021 161.6 213.4
Feb-14 2021 163.8 222.2
Feb-21 2021 129.6 194.6
Feb-28 2021 107.4 225.3
Mar-07 2021 15.4 224.6
Mar-14 2021 1.0 235.2
# HELOC ACCOUNTS ORIGINATED
(HUNDREDS)

104 PROPRIETARY |
Originations through March 14, 2021 reported as of March 16, 2021
736
741
746
751
756
761
766
771
776
0
45
90
134
179
224
269
314
359Ja
n-06
201
9
Apr-0
7 20
19
Jul-0
7 20
19
Oct-0
6 20
19
Jan-
05 2
020
Apr-0
5 20
20
Jul-0
5 20
20
Oct-0
4 20
20
Mar
-14
2021
Hund
reds
New Trades FICO® Score 5
HELOC Originations: Accounts Number of Accounts in Hundreds; NSA. Average FICO® Score 5
Source: Equifax Inc.
Home Equity: Lines of Credit
WEEKEND CURR YR PREV YR
Mar-01 2020 225.3 228.6
Mar-08 2020 224.6 222.3
Mar-15 2020 235.2 233.7
Mar-22 2020 227.7 242.0
Mar-29 2020 215.3 261.8
Apr-05 2020 216.1 245.8
Apr-12 2020 219.6 260.2
Apr-19 2020 230.2 271.8
Apr-26 2020 238.5 281.8
May-03 2020 240.0 282.8
May-10 2020 231.5 278.8
May-17 2020 237.5 285.8
# HELOC ACCOUNTS ORIGINATED
(HUNDREDS)
WEEKEND CURR YR PREV YR
May-24 2020 241.3 298.9
May-31 2020 198.0 242.5
Jun-07 2020 221.8 266.6
Jun-14 2020 229.6 278.2
Jun-21 2020 229.1 276.2
Jun-28 2020 228.8 289.7
Jul-05 2020 200.1 205.2
Jul-12 2020 248.5 251.0
Jul-19 2020 208.6 261.0
Jul-26 2020 208.5 271.5
Aug-02 2020 206.8 264.7
Aug-09 2020 194.4 251.9
# HELOC ACCOUNTS ORIGINATED
(HUNDREDS)
WEEKEND CURR YR PREV YR
Aug-16 2020 199.7 263.3
Aug-23 2020 199.9 269.6
Aug-30 2020 209.8 277.6
Sep-06 2020 204.5 207.4
Sep-13 2020 160.4 254.7
Sep-20 2020 198.3 266.1
Sep-27 2020 209.9 273.6
Oct-04 2020 205.7 265.9
Oct-11 2020 198.0 265.4
Oct-18 2020 170.0 228.2
Oct-25 2020 202.3 269.2
Nov-01 2020 207.5 267.4
# HELOC ACCOUNTS ORIGINATED
(HUNDREDS)
WEEKEND CURR YR PREV YR
Nov-08 2020 193.3 250.3
Nov-15 2020 164.7 212.2
Nov-22 2020 200.6 265.6
Nov-29 2020 156.0 201.2
Dec-06 2020 179.9 229.0
Dec-13 2020 187.6 241.6
Dec-20 2020 192.1 254.7
Dec-27 2020 144.5 168.4
Jan-03 2021 126.5 81.8
Jan-10 2021 155.6 205.7
Jan-17 2021 174.4 220.9
Jan-24 2021 145.1 182.9
# HELOC ACCOUNTS ORIGINATED
(HUNDREDS)
WEEKEND CURR YR PREV YR
Jan-31 2021 177.7 253.8
Feb-07 2021 161.6 213.4
Feb-14 2021 163.8 222.2
Feb-21 2021 129.6 194.6
Feb-28 2021 107.4 225.3
Mar-07 2021 15.4 224.6
Mar-14 2021 1.0 235.2
# HELOC ACCOUNTS ORIGINATED
(HUNDREDS)

105 PROPRIETARY |
Originations through March 14, 2021 reported as of March 16, 2021
737
743
749
755
761
767
773
779
785
0
482
964
1,446
1,927
2,409
2,891
3,373
3,855
Jan-
06 2
019
Apr-0
7 20
19
Jul-0
7 20
19
Oct-0
6 20
19
Jan-
05 2
020
Apr-0
5 20
20
Jul-0
5 20
20
Oct-0
4 20
20
Mar
-14
2021
Mill
ions
New Trades VS® 3.0
HELOC Originations: Total Credit Limits Total Credit Limits in $Millions; NSA. Average VantageScore® 3.0
Home Equity: Lines of Credit
Source: Equifax Inc.
WEEKEND CURR YR PREV YR
Mar-01 2020 $2,528.6 $2,603.5
Mar-08 2020 $2,563.4 $2,542.6
Mar-15 2020 $2,640.5 $2,643.9
Mar-22 2020 $2,552.7 $2,713.5
Mar-29 2020 $2,452.5 $2,937.9
Apr-05 2020 $2,498.8 $2,720.7
Apr-12 2020 $2,616.8 $2,858.2
Apr-19 2020 $2,763.3 $2,898.2
Apr-26 2020 $2,896.7 $3,026.3
May-03 2020 $2,990.3 $3,073.3
May-10 2020 $2,847.1 $3,010.3
May-17 2020 $2,934.2 $3,033.6
TOTAL HELOC BALANCES
ORIGINATED (MILLIONS)
WEEKEND CURR YR PREV YR
May-24 2020 $2,971.4 $3,212.3
May-31 2020 $2,411.9 $2,618.6
Jun-07 2020 $2,682.2 $2,834.3
Jun-14 2020 $2,730.6 $2,933.9
Jun-21 2020 $2,689.9 $2,907.1
Jun-28 2020 $2,715.8 $3,084.6
Jul-05 2020 $2,315.5 $2,095.4
Jul-12 2020 $2,689.3 $2,603.9
Jul-19 2020 $2,385.2 $2,760.7
Jul-26 2020 $2,393.0 $2,829.6
Aug-02 2020 $2,307.1 $2,795.7
Aug-09 2020 $2,173.4 $2,641.5
TOTAL HELOC BALANCES
ORIGINATED (MILLIONS)
WEEKEND CURR YR PREV YR
Aug-16 2020 $2,218.3 $2,741.2
Aug-23 2020 $2,231.3 $2,808.6
Aug-30 2020 $2,353.0 $2,958.6
Sep-06 2020 $2,305.3 $2,173.5
Sep-13 2020 $1,815.3 $2,724.3
Sep-20 2020 $2,249.1 $2,877.5
Sep-27 2020 $2,520.6 $2,961.2
Oct-04 2020 $2,395.2 $2,850.8
Oct-11 2020 $2,296.5 $2,837.6
Oct-18 2020 $1,968.7 $2,478.3
Oct-25 2020 $2,393.8 $2,977.2
Nov-01 2020 $2,479.7 $2,931.3
TOTAL HELOC BALANCES
ORIGINATED (MILLIONS)
WEEKEND CURR YR PREV YR
Nov-08 2020 $2,271.4 $2,718.6
Nov-15 2020 $1,954.3 $2,368.6
Nov-22 2020 $2,427.1 $2,964.9
Nov-29 2020 $1,853.4 $2,174.3
Dec-06 2020 $2,253.9 $2,602.0
Dec-13 2020 $2,336.7 $2,750.1
Dec-20 2020 $2,360.2 $3,019.4
Dec-27 2020 $1,806.2 $1,926.9
Jan-03 2021 $1,565.0 $935.4
Jan-10 2021 $1,937.6 $2,422.3
Jan-17 2021 $2,193.5 $2,601.8
Jan-24 2021 $1,788.8 $2,103.4
TOTAL HELOC BALANCES
ORIGINATED (MILLIONS)
WEEKEND CURR YR PREV YR
Jan-31 2021 $2,234.1 $2,915.3
Feb-07 2021 $2,011.4 $2,453.9
Feb-14 2021 $2,041.1 $2,563.2
Feb-21 2021 $1,584.5 $2,221.6
Feb-28 2021 $1,288.9 $2,528.6
Mar-07 2021 $198.9 $2,563.4
Mar-14 2021 $6.8 $2,640.5
TOTAL HELOC BALANCES
ORIGINATED (MILLIONS)

106 PROPRIETARY |
Originations through March 14, 2021 reported as of March 16, 2021
736
741
746
751
756
761
766
771
776
0
482
964
1,446
1,927
2,409
2,891
3,373
3,855
Jan-
06 2
019
Apr-0
7 20
19
Jul-0
7 20
19
Oct-0
6 20
19
Jan-
05 2
020
Apr-0
5 20
20
Jul-0
5 20
20
Oct-0
4 20
20
Mar
-14
2021
Mill
ions
New Trades FICO® Score 5
HELOC Originations: Total Credit Limits Total Credit Limits in $Millions; NSA. Average FICO® Score 5
Home Equity: Lines of Credit
Source: Equifax Inc.
WEEKEND CURR YR PREV YR
Mar-01 2020 $2,528.6 $2,603.5
Mar-08 2020 $2,563.4 $2,542.6
Mar-15 2020 $2,640.5 $2,643.9
Mar-22 2020 $2,552.7 $2,713.5
Mar-29 2020 $2,452.5 $2,937.9
Apr-05 2020 $2,498.8 $2,720.7
Apr-12 2020 $2,616.8 $2,858.2
Apr-19 2020 $2,763.3 $2,898.2
Apr-26 2020 $2,896.7 $3,026.3
May-03 2020 $2,990.3 $3,073.3
May-10 2020 $2,847.1 $3,010.3
May-17 2020 $2,934.2 $3,033.6
TOTAL HELOC BALANCES
ORIGINATED (MILLIONS)
WEEKEND CURR YR PREV YR
May-24 2020 $2,971.4 $3,212.3
May-31 2020 $2,411.9 $2,618.6
Jun-07 2020 $2,682.2 $2,834.3
Jun-14 2020 $2,730.6 $2,933.9
Jun-21 2020 $2,689.9 $2,907.1
Jun-28 2020 $2,715.8 $3,084.6
Jul-05 2020 $2,315.5 $2,095.4
Jul-12 2020 $2,689.3 $2,603.9
Jul-19 2020 $2,385.2 $2,760.7
Jul-26 2020 $2,393.0 $2,829.6
Aug-02 2020 $2,307.1 $2,795.7
Aug-09 2020 $2,173.4 $2,641.5
TOTAL HELOC BALANCES
ORIGINATED (MILLIONS)
WEEKEND CURR YR PREV YR
Aug-16 2020 $2,218.3 $2,741.2
Aug-23 2020 $2,231.3 $2,808.6
Aug-30 2020 $2,353.0 $2,958.6
Sep-06 2020 $2,305.3 $2,173.5
Sep-13 2020 $1,815.3 $2,724.3
Sep-20 2020 $2,249.1 $2,877.5
Sep-27 2020 $2,520.6 $2,961.2
Oct-04 2020 $2,395.2 $2,850.8
Oct-11 2020 $2,296.5 $2,837.6
Oct-18 2020 $1,968.7 $2,478.3
Oct-25 2020 $2,393.8 $2,977.2
Nov-01 2020 $2,479.7 $2,931.3
TOTAL HELOC BALANCES
ORIGINATED (MILLIONS)
WEEKEND CURR YR PREV YR
Nov-08 2020 $2,271.4 $2,718.6
Nov-15 2020 $1,954.3 $2,368.6
Nov-22 2020 $2,427.1 $2,964.9
Nov-29 2020 $1,853.4 $2,174.3
Dec-06 2020 $2,253.9 $2,602.0
Dec-13 2020 $2,336.7 $2,750.1
Dec-20 2020 $2,360.2 $3,019.4
Dec-27 2020 $1,806.2 $1,926.9
Jan-03 2021 $1,565.0 $935.4
Jan-10 2021 $1,937.6 $2,422.3
Jan-17 2021 $2,193.5 $2,601.8
Jan-24 2021 $1,788.8 $2,103.4
TOTAL HELOC BALANCES
ORIGINATED (MILLIONS)
WEEKEND CURR YR PREV YR
Jan-31 2021 $2,234.1 $2,915.3
Feb-07 2021 $2,011.4 $2,453.9
Feb-14 2021 $2,041.1 $2,563.2
Feb-21 2021 $1,584.5 $2,221.6
Feb-28 2021 $1,288.9 $2,528.6
Mar-07 2021 $198.9 $2,563.4
Mar-14 2021 $6.8 $2,640.5
TOTAL HELOC BALANCES
ORIGINATED (MILLIONS)

107 PROPRIETARY |
Originations through March 14, 2021 reported as of March 16, 2021
565
570
575
580
585
590
595
600
605
0
1
2
3
5
6
7
8
9
Jan-
06 2
019
Apr-0
7 20
19
Jul-0
7 20
19
Oct-0
6 20
19
Jan-
05 2
020
Apr-0
5 20
20
Jul-0
5 20
20
Oct-0
4 20
20
Mar
-14
2021
Hund
reds
New Trades VS® 3.0
Subprime HELOC Originations: Accounts Number of Accounts in Hundreds; NSA. Subprime Accounts, Average VantageScore® 3.0 Subprime accounts defined as those with borrower’s origination VantageScore® 3.0 less than 620
Home Equity: Lines of Credit
Source: Equifax Inc.
WEEKEND CURR YR PREV YR % TOTAL
Mar-01 2020 6.4 6.2 2.9%
Mar-08 2020 6.5 6.4 2.9%
Mar-15 2020 6.7 6.0 2.8%
Mar-22 2020 5.7 6.3 2.5%
Mar-29 2020 5.3 6.6 2.5%
Apr-05 2020 4.9 6.3 2.3%
Apr-12 2020 4.7 6.7 2.2%
Apr-19 2020 4.8 6.4 2.1%
Apr-26 2020 4.2 6.7 1.8%
May-03 2020 4.7 7.1 2.0%
May-10 2020 4.3 7.0 1.9%
May-17 2020 4.4 7.1 1.9%
# SUBPRIME HELOC ACCOUNTS ORIGINATED
(HUNDREDS)
WEEKEND CURR YR PREV YR % TOTAL
May-24 2020 4.5 7.6 1.8%
May-31 2020 3.6 6.0 1.8%
Jun-07 2020 3.8 6.6 1.7%
Jun-14 2020 3.9 7.6 1.7%
Jun-21 2020 3.3 7.0 1.4%
Jun-28 2020 3.9 7.7 1.7%
Jul-05 2020 3.7 6.7 1.8%
Jul-12 2020 5.1 6.9 2.1%
Jul-19 2020 3.6 6.8 1.7%
Jul-26 2020 3.6 7.0 1.7%
Aug-02 2020 3.9 7.1 1.9%
Aug-09 2020 3.9 7.1 2.0%
# SUBPRIME HELOC ACCOUNTS ORIGINATED
(HUNDREDS)
WEEKEND CURR YR PREV YR % TOTAL
Aug-16 2020 3.9 7.2 1.9%
Aug-23 2020 3.7 6.9 1.9%
Aug-30 2020 3.7 7.7 1.8%
Sep-06 2020 3.4 5.7 1.7%
Sep-13 2020 2.9 6.6 1.8%
Sep-20 2020 3.3 7.3 1.7%
Sep-27 2020 3.3 6.7 1.5%
Oct-04 2020 3.9 7.2 1.9%
Oct-11 2020 3.9 7.0 2.0%
Oct-18 2020 3.0 6.0 1.8%
Oct-25 2020 3.4 6.9 1.7%
Nov-01 2020 3.8 7.2 1.8%
# SUBPRIME HELOC ACCOUNTS ORIGINATED
(HUNDREDS)
WEEKEND CURR YR PREV YR % TOTAL
Nov-08 2020 4.1 7.0 2.1%
Nov-15 2020 3.2 5.5 1.9%
Nov-22 2020 3.5 7.1 1.8%
Nov-29 2020 3.0 5.6 1.9%
Dec-06 2020 3.2 6.2 1.8%
Dec-13 2020 3.5 6.9 1.9%
Dec-20 2020 3.7 7.3 1.9%
Dec-27 2020 2.7 4.4 1.9%
Jan-03 2021 2.2 2.2 1.7%
Jan-10 2021 2.9 5.7 1.9%
Jan-17 2021 3.3 6.5 1.9%
Jan-24 2021 2.8 5.4 1.9%
# SUBPRIME HELOC ACCOUNTS ORIGINATED
(HUNDREDS)
WEEKEND CURR YR PREV YR % TOTAL
Jan-31 2021 3.2 6.6 1.8%
Feb-07 2021 2.8 6.2 1.7%
Feb-14 2021 2.8 6.2 1.7%
Feb-21 2021 2.6 5.6 2.0%
Feb-28 2021 2.3 6.4 2.1%
Mar-07 2021 0.2 6.5 1.1%
Mar-14 2021 * 6.7 4.2%
# SUBPRIME HELOC ACCOUNTS ORIGINATED
(HUNDREDS)
* indicates low weekly originations volume

108 PROPRIETARY |
Originations through March 14, 2021 reported as of March 16, 2021
563
570
577
584
591
598
605
612
619
0.0
0.8
1.7
2.5
3.4
4.2
5.0
5.9
6.7
Jan-
06 2
019
Apr-0
7 20
19
Jul-0
7 20
19
Oct-0
6 20
19
Jan-
05 2
020
Apr-0
5 20
20
Jul-0
5 20
20
Oct-0
4 20
20
Mar
-14
2021
Hund
reds
New Trades FICO® Score 5
Subprime HELOC Originations: Accounts Number of Accounts in Hundreds; NSA. Subprime Accounts, Average FICO® Score 5 Subprime accounts defined as those with borrower’s origination FICO® Score 5 less than 620
Home Equity: Lines of Credit
Source: Equifax Inc.
WEEKEND CURR YR PREV YR % TOTAL
Mar-01 2020 4.0 3.7 1.8%
Mar-08 2020 3.8 3.4 1.7%
Mar-15 2020 4.2 3.8 1.8%
Mar-22 2020 3.7 3.6 1.6%
Mar-29 2020 3.2 4.1 1.5%
Apr-05 2020 3.0 3.3 1.4%
Apr-12 2020 2.4 3.8 1.1%
Apr-19 2020 3.1 4.0 1.3%
Apr-26 2020 3.2 4.4 1.4%
May-03 2020 3.0 4.6 1.3%
May-10 2020 2.7 4.3 1.2%
May-17 2020 3.0 4.7 1.3%
# SUBPRIME HELOC ACCOUNTS ORIGINATED
(HUNDREDS)
WEEKEND CURR YR PREV YR % TOTAL
May-24 2020 3.0 5.0 1.2%
May-31 2020 2.7 3.8 1.3%
Jun-07 2020 2.8 4.5 1.3%
Jun-14 2020 2.5 4.9 1.1%
Jun-21 2020 2.7 5.0 1.2%
Jun-28 2020 2.9 5.6 1.2%
Jul-05 2020 2.8 3.6 1.4%
Jul-12 2020 4.1 4.4 1.7%
Jul-19 2020 2.7 4.9 1.3%
Jul-26 2020 3.5 4.9 1.7%
Aug-02 2020 2.9 4.8 1.4%
Aug-09 2020 2.7 4.6 1.4%
# SUBPRIME HELOC ACCOUNTS ORIGINATED
(HUNDREDS)
WEEKEND CURR YR PREV YR % TOTAL
Aug-16 2020 3.2 4.9 1.6%
Aug-23 2020 3.1 5.4 1.6%
Aug-30 2020 3.0 5.1 1.4%
Sep-06 2020 2.6 3.6 1.3%
Sep-13 2020 1.9 4.5 1.2%
Sep-20 2020 2.5 4.7 1.3%
Sep-27 2020 2.9 4.7 1.4%
Oct-04 2020 2.9 4.2 1.4%
Oct-11 2020 2.7 4.5 1.4%
Oct-18 2020 2.4 4.0 1.4%
Oct-25 2020 2.8 4.8 1.4%
Nov-01 2020 2.8 5.0 1.3%
# SUBPRIME HELOC ACCOUNTS ORIGINATED
(HUNDREDS)
WEEKEND CURR YR PREV YR % TOTAL
Nov-08 2020 2.7 4.5 1.4%
Nov-15 2020 2.1 3.8 1.3%
Nov-22 2020 2.9 4.9 1.4%
Nov-29 2020 2.3 3.8 1.5%
Dec-06 2020 2.4 3.8 1.3%
Dec-13 2020 2.8 4.6 1.5%
Dec-20 2020 2.7 5.1 1.4%
Dec-27 2020 2.2 3.4 1.5%
Jan-03 2021 1.7 1.2 1.4%
Jan-10 2021 2.0 3.2 1.3%
Jan-17 2021 2.3 4.1 1.3%
Jan-24 2021 1.9 3.7 1.3%
# SUBPRIME HELOC ACCOUNTS ORIGINATED
(HUNDREDS)
WEEKEND CURR YR PREV YR % TOTAL
Jan-31 2021 2.3 4.9 1.3%
Feb-07 2021 2.1 3.5 1.3%
Feb-14 2021 1.9 3.9 1.2%
Feb-21 2021 1.7 3.0 1.3%
Feb-28 2021 1.6 4.0 1.5%
Mar-07 2021 * 3.8 0.3%
Mar-14 2021 * 4.2 2.1%
# SUBPRIME HELOC ACCOUNTS ORIGINATED
(HUNDREDS)
* indicates low weekly originations volume

109 PROPRIETARY |
Originations through March 14, 2021 reported as of March 16, 2021
565
570
575
580
585
590
595
600
605
0
8
17
25
34
42
50
59
67
Jan-
06 2
019
Apr-0
7 20
19
Jul-0
7 20
19
Oct-0
6 20
19
Jan-
05 2
020
Apr-0
5 20
20
Jul-0
5 20
20
Oct-0
4 20
20
Mar
-14
2021
Mill
ions
New Trades VS® 3.0
Subprime HELOC Originations: Total Limits Total Credit Limits in $Millions; NSA. Subprime Accounts, Average VantageScore® 3.0 Subprime accounts defined as those with borrower’s origination VantageScore® 3.0 less than 620
Home Equity: Lines of Credit
Source: Equifax Inc.
WEEKEND CURR YR PREV YR % TOTAL
Mar-01 2020 $38.7 $43.0 1.5%
Mar-08 2020 $41.5 $37.3 1.6%
Mar-15 2020 $39.5 $40.5 1.5%
Mar-22 2020 $34.3 $43.2 1.3%
Mar-29 2020 $35.3 $42.1 1.4%
Apr-05 2020 $28.4 $42.5 1.1%
Apr-12 2020 $34.1 $42.6 1.3%
Apr-19 2020 $31.1 $40.4 1.1%
Apr-26 2020 $31.8 $43.1 1.1%
May-03 2020 $33.8 $46.5 1.1%
May-10 2020 $28.8 $50.7 1.0%
May-17 2020 $27.3 $44.8 0.9%
TOTAL SUBPRIME HELOC BALANCES
ORIGINATED (MILLIONS)
WEEKEND CURR YR PREV YR % TOTAL
May-24 2020 $32.0 $47.2 1.1%
May-31 2020 $24.2 $36.8 1.0%
Jun-07 2020 $21.9 $42.2 0.8%
Jun-14 2020 $25.4 $46.9 0.9%
Jun-21 2020 $18.7 $40.2 0.7%
Jun-28 2020 $25.5 $49.2 0.9%
Jul-05 2020 $21.3 $40.7 0.9%
Jul-12 2020 $35.4 $42.8 1.3%
Jul-19 2020 $20.4 $44.2 0.9%
Jul-26 2020 $29.3 $42.1 1.2%
Aug-02 2020 $23.5 $44.7 1.0%
Aug-09 2020 $22.0 $47.7 1.0%
TOTAL SUBPRIME HELOC BALANCES
ORIGINATED (MILLIONS)
WEEKEND CURR YR PREV YR % TOTAL
Aug-16 2020 $30.1 $48.9 1.4%
Aug-23 2020 $20.1 $43.9 0.9%
Aug-30 2020 $20.7 $55.8 0.9%
Sep-06 2020 $21.5 $33.2 0.9%
Sep-13 2020 $18.9 $40.8 1.0%
Sep-20 2020 $18.0 $48.3 0.8%
Sep-27 2020 $20.8 $41.7 0.8%
Oct-04 2020 $25.8 $43.0 1.1%
Oct-11 2020 $22.9 $44.7 1.0%
Oct-18 2020 $19.7 $38.1 1.0%
Oct-25 2020 $23.0 $44.4 1.0%
Nov-01 2020 $21.7 $47.5 0.9%
TOTAL SUBPRIME HELOC BALANCES
ORIGINATED (MILLIONS)
WEEKEND CURR YR PREV YR % TOTAL
Nov-08 2020 $29.0 $47.4 1.3%
Nov-15 2020 $19.9 $33.0 1.0%
Nov-22 2020 $24.3 $46.2 1.0%
Nov-29 2020 $18.5 $41.5 1.0%
Dec-06 2020 $23.0 $40.6 1.0%
Dec-13 2020 $24.0 $42.6 1.0%
Dec-20 2020 $24.8 $50.7 1.1%
Dec-27 2020 $18.4 $33.0 1.0%
Jan-03 2021 $14.5 $15.6 0.9%
Jan-10 2021 $18.0 $36.6 0.9%
Jan-17 2021 $19.3 $40.7 0.9%
Jan-24 2021 $17.1 $40.6 1.0%
TOTAL SUBPRIME HELOC BALANCES
ORIGINATED (MILLIONS)
WEEKEND CURR YR PREV YR % TOTAL
Jan-31 2021 $20.4 $44.5 0.9%
Feb-07 2021 $19.1 $44.3 0.9%
Feb-14 2021 $19.2 $42.1 0.9%
Feb-21 2021 $16.8 $34.1 1.1%
Feb-28 2021 $13.2 $38.7 1.0%
Mar-07 2021 $1.2 $41.5 0.6%
Mar-14 2021 * $39.5 1.3%
TOTAL SUBPRIME HELOC BALANCES
ORIGINATED (MILLIONS)
* indicates low weekly originations volume
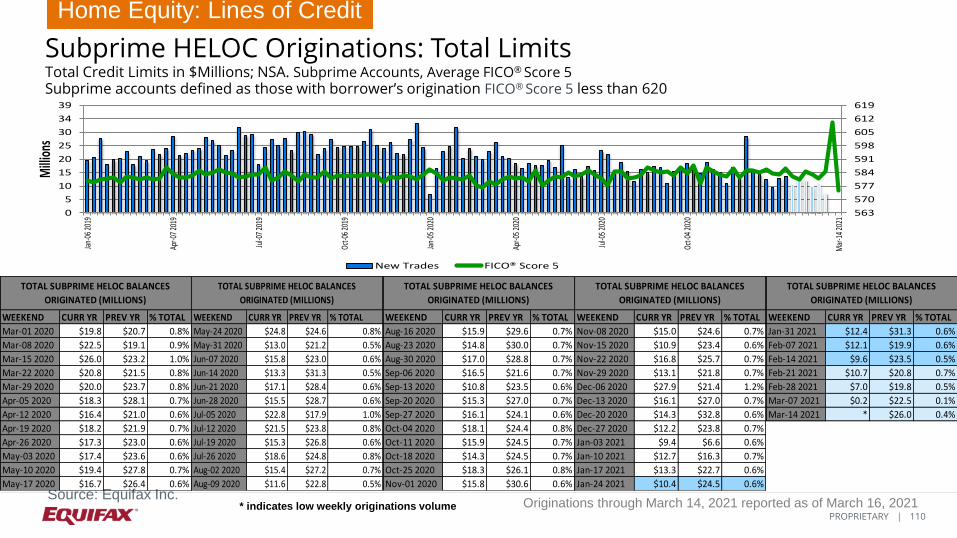
110 PROPRIETARY |
Originations through March 14, 2021 reported as of March 16, 2021
563
570
577
584
591
598
605
612
619
0
5
10
15
20
25
30
34
39
Jan-
06 2
019
Apr-0
7 20
19
Jul-0
7 20
19
Oct-0
6 20
19
Jan-
05 2
020
Apr-0
5 20
20
Jul-0
5 20
20
Oct-0
4 20
20
Mar
-14
2021
Mill
ions
New Trades FICO® Score 5
Subprime HELOC Originations: Total Limits Total Credit Limits in $Millions; NSA. Subprime Accounts, Average FICO® Score 5 Subprime accounts defined as those with borrower’s origination FICO® Score 5 less than 620
Home Equity: Lines of Credit
Source: Equifax Inc.
WEEKEND CURR YR PREV YR % TOTAL
Mar-01 2020 $19.8 $20.7 0.8%
Mar-08 2020 $22.5 $19.1 0.9%
Mar-15 2020 $26.0 $23.2 1.0%
Mar-22 2020 $20.8 $21.5 0.8%
Mar-29 2020 $20.0 $23.7 0.8%
Apr-05 2020 $18.3 $28.1 0.7%
Apr-12 2020 $16.4 $21.0 0.6%
Apr-19 2020 $18.2 $21.9 0.7%
Apr-26 2020 $17.3 $23.0 0.6%
May-03 2020 $17.4 $23.6 0.6%
May-10 2020 $19.4 $27.8 0.7%
May-17 2020 $16.7 $26.4 0.6%
TOTAL SUBPRIME HELOC BALANCES
ORIGINATED (MILLIONS)
WEEKEND CURR YR PREV YR % TOTAL
May-24 2020 $24.8 $24.6 0.8%
May-31 2020 $13.0 $21.2 0.5%
Jun-07 2020 $15.8 $23.0 0.6%
Jun-14 2020 $13.3 $31.3 0.5%
Jun-21 2020 $17.1 $28.4 0.6%
Jun-28 2020 $15.5 $28.7 0.6%
Jul-05 2020 $22.8 $17.9 1.0%
Jul-12 2020 $21.5 $23.8 0.8%
Jul-19 2020 $15.3 $26.8 0.6%
Jul-26 2020 $18.6 $24.8 0.8%
Aug-02 2020 $15.4 $27.2 0.7%
Aug-09 2020 $11.6 $22.8 0.5%
TOTAL SUBPRIME HELOC BALANCES
ORIGINATED (MILLIONS)
WEEKEND CURR YR PREV YR % TOTAL
Aug-16 2020 $15.9 $29.6 0.7%
Aug-23 2020 $14.8 $30.0 0.7%
Aug-30 2020 $17.0 $28.8 0.7%
Sep-06 2020 $16.5 $21.6 0.7%
Sep-13 2020 $10.8 $23.5 0.6%
Sep-20 2020 $15.3 $27.0 0.7%
Sep-27 2020 $16.1 $24.1 0.6%
Oct-04 2020 $18.1 $24.4 0.8%
Oct-11 2020 $15.9 $24.5 0.7%
Oct-18 2020 $14.3 $24.5 0.7%
Oct-25 2020 $18.3 $26.1 0.8%
Nov-01 2020 $15.8 $30.6 0.6%
TOTAL SUBPRIME HELOC BALANCES
ORIGINATED (MILLIONS)
WEEKEND CURR YR PREV YR % TOTAL
Nov-08 2020 $15.0 $24.6 0.7%
Nov-15 2020 $10.9 $23.4 0.6%
Nov-22 2020 $16.8 $25.7 0.7%
Nov-29 2020 $13.1 $21.8 0.7%
Dec-06 2020 $27.9 $21.4 1.2%
Dec-13 2020 $16.1 $27.0 0.7%
Dec-20 2020 $14.3 $32.8 0.6%
Dec-27 2020 $12.2 $23.8 0.7%
Jan-03 2021 $9.4 $6.6 0.6%
Jan-10 2021 $12.7 $16.3 0.7%
Jan-17 2021 $13.3 $22.7 0.6%
Jan-24 2021 $10.4 $24.5 0.6%
TOTAL SUBPRIME HELOC BALANCES
ORIGINATED (MILLIONS)
WEEKEND CURR YR PREV YR % TOTAL
Jan-31 2021 $12.4 $31.3 0.6%
Feb-07 2021 $12.1 $19.9 0.6%
Feb-14 2021 $9.6 $23.5 0.5%
Feb-21 2021 $10.7 $20.8 0.7%
Feb-28 2021 $7.0 $19.8 0.5%
Mar-07 2021 $0.2 $22.5 0.1%
Mar-14 2021 * $26.0 0.4%
TOTAL SUBPRIME HELOC BALANCES
ORIGINATED (MILLIONS)
* indicates low weekly originations volume

111 PROPRIETARY |
Originations through March 14, 2021 reported as of March 16, 2021
$0
$20,000
$40,000
$60,000
$80,000
$100,000
$120,000
$140,000
Jan-
07 20
18
Apr-0
8 20
18
Jul-0
8 201
8
Oct-0
7 201
8
Jan-
06 20
19
Apr-0
7 20
19
Jul-0
7 201
9
Oct-0
6 201
9
Jan-
05 20
20
Apr-0
5 20
20
Jul-0
5 202
0
Oct-0
4 202
0
Mar
-14 2
021
HELOC Origination Loan Amount Subprime HELOC Origination Loan Amount
HELOC Average Origination Credit Limit Average Origination Credit Limit over time; NSA Subprime accounts defined as those with borrower’s origination VantageScore® 3.0 less than 620
Home Equity: Lines of Credit
Source: Equifax Inc.

112 PROPRIETARY |
Originations through March 14, 2021 reported as of March 16, 2021
$0
$20,000
$40,000
$60,000
$80,000
$100,000
$120,000
$140,000
Jan-
07 20
18
Apr-0
8 20
18
Jul-0
8 201
8
Oct-0
7 201
8
Jan-
06 20
19
Apr-0
7 20
19
Jul-0
7 201
9
Oct-0
6 201
9
Jan-
05 20
20
Apr-0
5 20
20
Jul-0
5 202
0
Oct-0
4 202
0
Mar
-14 2
021
HELOC Origination Loan Amount Subprime HELOC Origination Loan Amount
HELOC Average Origination Credit Limit Average Origination Credit Limit over time; NSA Subprime accounts defined as those with borrower’s origination FICO® Score 5 less than 620
Home Equity: Lines of Credit
Source: Equifax Inc.

113 PROPRIETARY |
Originations through March 14, 2021 reported as of March 16, 2021
0.0%
0.3%
0.5%
0.8%
1.0%
1.3%
1.5%
1.8%
$0
$470
$940
$1,410
$1,880
$2,350
$2,819
$3,289M
ar-0
1 202
0
Mar
-08 2
020
Mar
-15 2
020
Mar
-22 2
020
Mar
-29 2
020
Apr-0
5 20
20
Apr-1
2 20
20
Apr-1
9 20
20
Apr-2
6 20
20
May
-03
2020
May
-10
2020
May
-17
2020
May
-24
2020
May
-31
2020
Jun-
07 2
020
Jun-
14 2
020
Jun-
21 2
020
Jun-
28 2
020
Jul-0
5 20
20
Jul-1
2 20
20
Jul-1
9 20
20
Jul-2
6 20
20
Aug-
02 2
020
Aug-
09 2
020
Aug-
16 2
020
Aug-
23 2
020
Aug-
30 2
020
Sep-
06 20
20
Sep-
13 20
20
Sep-
20 20
20
Sep-
27 20
20
Oct-0
4 20
20
Oct-1
1 20
20
Oct-1
8 20
20
Oct-2
5 20
20
Nov-
01 2
020
Nov-
08 2
020
Nov-
15 2
020
Nov-
22 2
020
Nov-
29 2
020
Dec-0
6 20
20
Dec-1
3 20
20
Dec-2
0 20
20
Dec-2
7 20
20
Jan-
03 2
021
Jan-
10 2
021
Jan-
17 2
021
Jan-
24 2
021
Jan-
31 2
021
Feb-
07 20
21
Feb-
14 20
21
Feb-
21 20
21
Feb-
28 20
21
Mar
-07 2
021
Mar
-14 2
021
Subp
rime S
hare
Milli
ons
HELOC Origination HELOC Origination Subprime Share
HELOC Origination Credit Limits Total Credit Limits in $Millions; Subprime Share of Total Origination Credit Limits (%); NSA Subprime accounts defined as those with borrower’s origination VantageScore® 3.0 less than 620
Home Equity: Lines of Credit
Source: Equifax Inc.

114 PROPRIETARY |
Originations through March 14, 2021 reported as of March 16, 2021
0.0%
0.2%
0.4%
0.6%
0.8%
1.0%
1.2%
1.4%
$0
$470
$940
$1,410
$1,880
$2,350
$2,819
$3,289M
ar-0
1 202
0
Mar
-08 2
020
Mar
-15 2
020
Mar
-22 2
020
Mar
-29 2
020
Apr-0
5 20
20
Apr-1
2 20
20
Apr-1
9 20
20
Apr-2
6 20
20
May
-03
2020
May
-10
2020
May
-17
2020
May
-24
2020
May
-31
2020
Jun-
07 2
020
Jun-
14 2
020
Jun-
21 2
020
Jun-
28 2
020
Jul-0
5 20
20
Jul-1
2 20
20
Jul-1
9 20
20
Jul-2
6 20
20
Aug-
02 2
020
Aug-
09 2
020
Aug-
16 2
020
Aug-
23 2
020
Aug-
30 2
020
Sep-
06 20
20
Sep-
13 20
20
Sep-
20 20
20
Sep-
27 20
20
Oct-0
4 20
20
Oct-1
1 20
20
Oct-1
8 20
20
Oct-2
5 20
20
Nov-
01 2
020
Nov-
08 2
020
Nov-
15 2
020
Nov-
22 2
020
Nov-
29 2
020
Dec-0
6 20
20
Dec-1
3 20
20
Dec-2
0 20
20
Dec-2
7 20
20
Jan-
03 2
021
Jan-
10 2
021
Jan-
17 2
021
Jan-
24 2
021
Jan-
31 2
021
Feb-
07 20
21
Feb-
14 20
21
Feb-
21 20
21
Feb-
28 20
21
Mar
-07 2
021
Mar
-14 2
021
Subp
rime S
hare
Milli
ons
HELOC Origination HELOC Origination Subprime Share
HELOC Origination Credit Limits Total Credit Limits in $Millions; Subprime Share of Total Origination Credit Limits (%); NSA Subprime accounts defined as those with borrower’s origination FICO® Score 5 less than 620
Home Equity: Lines of Credit
Source: Equifax Inc.

115 PROPRIETARY |
Originations through March 14, 2021 reported as of March 16, 2021
738
742
746
750
754
758
762
766
770
774
778
0%
10%
20%
30%
40%
50%
60%
70%
80%
90%
100%
Mar
-01 2
020
Mar
-08 2
020
Mar
-15 2
020
Mar
-22 2
020
Mar
-29 2
020
Apr-0
5 20
20
Apr-1
2 20
20
Apr-1
9 20
20
Apr-2
6 20
20
May
-03
2020
May
-10
2020
May
-17
2020
May
-24
2020
May
-31
2020
Jun-
07 2
020
Jun-
14 2
020
Jun-
21 2
020
Jun-
28 2
020
Jul-0
5 20
20
Jul-1
2 20
20
Jul-1
9 20
20
Jul-2
6 20
20
Aug-
02 2
020
Aug-
09 2
020
Aug-
16 2
020
Aug-
23 2
020
Aug-
30 2
020
Sep-
06 20
20
Sep-
13 20
20
Sep-
20 20
20
Sep-
27 20
20
Oct-0
4 20
20
Oct-1
1 20
20
Oct-1
8 20
20
Oct-2
5 20
20
Nov-
01 2
020
Nov-
08 2
020
Nov-
15 2
020
Nov-
22 2
020
Nov-
29 2
020
Dec-0
6 20
20
Dec-1
3 20
20
Dec-2
0 20
20
Dec-2
7 20
20
Jan-
03 2
021
Jan-
10 2
021
Jan-
17 2
021
Jan-
24 2
021
Jan-
31 2
021
Feb-
07 20
21
Feb-
14 20
21
Feb-
21 20
21
Feb-
28 20
21
Mar
-07 2
021
Mar
-14 2
021
300-539 540-579 580-619 620-659 660-699 700-739 740-779 780-850 no score Avg. VS® 3.0
HELOC Origination Risk VantageScore® 3.0 Distribution for HELOC Originations by Week (Percent of Accounts)
Home Equity: Lines of Credit
Source: Equifax Inc.
The last 8 weeks of weekly data is subject to revision due to reporting lags by data furnishers.

116 PROPRIETARY |
Originations through March 14, 2021 reported as of March 16, 2021
736
740
744
748
752
756
760
764
768
772
776
0%
10%
20%
30%
40%
50%
60%
70%
80%
90%
100%
Mar
-01 2
020
Mar
-08 2
020
Mar
-15 2
020
Mar
-22 2
020
Mar
-29 2
020
Apr-0
5 20
20
Apr-1
2 20
20
Apr-1
9 20
20
Apr-2
6 20
20
May
-03
2020
May
-10
2020
May
-17
2020
May
-24
2020
May
-31
2020
Jun-
07 2
020
Jun-
14 2
020
Jun-
21 2
020
Jun-
28 2
020
Jul-0
5 20
20
Jul-1
2 20
20
Jul-1
9 20
20
Jul-2
6 20
20
Aug-
02 2
020
Aug-
09 2
020
Aug-
16 2
020
Aug-
23 2
020
Aug-
30 2
020
Sep-
06 20
20
Sep-
13 20
20
Sep-
20 20
20
Sep-
27 20
20
Oct-0
4 20
20
Oct-1
1 20
20
Oct-1
8 20
20
Oct-2
5 20
20
Nov-
01 2
020
Nov-
08 2
020
Nov-
15 2
020
Nov-
22 2
020
Nov-
29 2
020
Dec-0
6 20
20
Dec-1
3 20
20
Dec-2
0 20
20
Dec-2
7 20
20
Jan-
03 2
021
Jan-
10 2
021
Jan-
17 2
021
Jan-
24 2
021
Jan-
31 2
021
Feb-
07 20
21
Feb-
14 20
21
Feb-
21 20
21
Feb-
28 20
21
Mar
-07 2
021
Mar
-14 2
021
300-539 540-579 580-619 620-659 660-699 700-739 740-779 780-850 no score Avg. FICO® Score 5
HELOC Origination Risk FICO® Score 5 Distribution for HELOC Originations by Week (Percent of Accounts)
Home Equity: Lines of Credit
Source: Equifax Inc.
The last 8 weeks of weekly data is subject to revision due to reporting lags by data furnishers.

117 PROPRIETARY |
Credit Trends Originations: Home Equity Installment Loans

118 PROPRIETARY |
Originations through March 14, 2021 reported as of March 16, 2021
Home Equity Loan Originations Observations Originations through March 14, 2021 reported as of March 16, 2021
Home Equity: Installment Loans
• Less than 50 HE Installment loans have been originated in the week ending March 14th. The total dollar amount of HE loans originated the week ending March 14th is $2.4 million.
• The average loan amount for all HE loans originated in the week ending March 14th was $95,557.
• It is important to note that for the week ending March 14th, there was low weekly volume for HE Installment subprime accounts.

119 PROPRIETARY |
Originations through March 14, 2021 reported as of March 16, 2021
653
666
679
692
705
718
731
744
757
0
34
68
102
136
171
205
239
273Ja
n-06
201
9
Apr-0
7 20
19
Jul-0
7 20
19
Oct-0
6 20
19
Jan-
05 2
020
Apr-0
5 20
20
Jul-0
5 20
20
Oct-0
4 20
20
Mar
-14
2021
Hund
reds
New Trades VS® 3.0
Home Equity Loan Originations: Accounts Number of Accounts in Hundreds; NSA. Average VantageScore® 3.0
Home Equity: Installment Loans
Source: Equifax Inc.
WEEKEND CURR YR PREV YR
Mar-01 2020 184.5 170.8
Mar-08 2020 180.5 159.7
Mar-15 2020 187.8 172.8
Mar-22 2020 178.3 182.9
Mar-29 2020 158.9 201.5
Apr-05 2020 143.7 186.5
Apr-12 2020 136.2 194.6
Apr-19 2020 146.1 197.7
Apr-26 2020 151.5 199.1
May-03 2020 161.2 204.2
May-10 2020 148.1 194.8
May-17 2020 156.3 203.1
# HOME EQUITY LOANS ACCOUNTS
ORIGINATED (HUNDREDS)
WEEKEND CURR YR PREV YR
May-24 2020 170.1 212.0
May-31 2020 147.8 190.0
Jun-07 2020 157.1 202.5
Jun-14 2020 159.2 209.2
Jun-21 2020 165.4 210.4
Jun-28 2020 173.3 227.4
Jul-05 2020 161.8 168.4
Jul-12 2020 158.7 202.1
Jul-19 2020 171.6 208.5
Jul-26 2020 174.3 213.1
Aug-02 2020 186.9 214.8
Aug-09 2020 165.1 203.1
# HOME EQUITY LOANS ACCOUNTS
ORIGINATED (HUNDREDS)
WEEKEND CURR YR PREV YR
Aug-16 2020 174.0 205.1
Aug-23 2020 179.4 209.7
Aug-30 2020 187.4 222.0
Sep-06 2020 186.7 159.4
Sep-13 2020 154.9 196.8
Sep-20 2020 185.7 204.4
Sep-27 2020 190.5 208.9
Oct-04 2020 186.9 208.7
Oct-11 2020 164.8 204.6
Oct-18 2020 157.3 188.4
Oct-25 2020 171.8 207.2
Nov-01 2020 171.7 208.3
# HOME EQUITY LOANS ACCOUNTS
ORIGINATED (HUNDREDS)
WEEKEND CURR YR PREV YR
Nov-08 2020 145.7 195.7
Nov-15 2020 143.2 181.0
Nov-22 2020 166.4 210.3
Nov-29 2020 132.2 170.6
Dec-06 2020 152.4 182.3
Dec-13 2020 150.3 193.4
Dec-20 2020 156.1 198.7
Dec-27 2020 115.3 141.8
Jan-03 2021 123.9 74.1
Jan-10 2021 113.3 167.8
Jan-17 2021 123.4 175.1
Jan-24 2021 114.6 161.2
# HOME EQUITY LOANS ACCOUNTS
ORIGINATED (HUNDREDS)
WEEKEND CURR YR PREV YR
Jan-31 2021 139.7 195.7
Feb-07 2021 123.1 160.2
Feb-14 2021 123.9 171.6
Feb-21 2021 106.4 166.5
Feb-28 2021 107.1 184.5
Mar-07 2021 20.6 180.5
Mar-14 2021 0.3 187.8
# HOME EQUITY LOANS ACCOUNTS
ORIGINATED (HUNDREDS)

120 PROPRIETARY |
Originations through March 14, 2021 reported as of March 16, 2021
673
684
695
706
717
728
739
750
761
0
34
68
102
136
171
205
239
273Ja
n-06
201
9
Apr-0
7 20
19
Jul-0
7 20
19
Oct-0
6 20
19
Jan-
05 2
020
Apr-0
5 20
20
Jul-0
5 20
20
Oct-0
4 20
20
Mar
-14
2021
Hund
reds
New Trades FICO® Score 5
Home Equity Loan Originations: Accounts Number of Accounts in Hundreds; NSA. Average FICO® Score 5
Home Equity: Installment Loans
Source: Equifax Inc.
WEEKEND CURR YR PREV YR
Mar-01 2020 184.5 170.8
Mar-08 2020 180.5 159.7
Mar-15 2020 187.8 172.8
Mar-22 2020 178.3 182.9
Mar-29 2020 158.9 201.5
Apr-05 2020 143.7 186.5
Apr-12 2020 136.2 194.6
Apr-19 2020 146.1 197.7
Apr-26 2020 151.5 199.1
May-03 2020 161.2 204.2
May-10 2020 148.1 194.8
May-17 2020 156.3 203.1
# HOME EQUITY LOANS ACCOUNTS
ORIGINATED (HUNDREDS)
WEEKEND CURR YR PREV YR
May-24 2020 170.1 212.0
May-31 2020 147.8 190.0
Jun-07 2020 157.1 202.5
Jun-14 2020 159.2 209.2
Jun-21 2020 165.4 210.4
Jun-28 2020 173.3 227.4
Jul-05 2020 161.8 168.4
Jul-12 2020 158.7 202.1
Jul-19 2020 171.6 208.5
Jul-26 2020 174.3 213.1
Aug-02 2020 186.9 214.8
Aug-09 2020 165.1 203.1
# HOME EQUITY LOANS ACCOUNTS
ORIGINATED (HUNDREDS)
WEEKEND CURR YR PREV YR
Aug-16 2020 174.0 205.1
Aug-23 2020 179.4 209.7
Aug-30 2020 187.4 222.0
Sep-06 2020 186.7 159.4
Sep-13 2020 154.9 196.8
Sep-20 2020 185.7 204.4
Sep-27 2020 190.5 208.9
Oct-04 2020 186.9 208.7
Oct-11 2020 164.8 204.6
Oct-18 2020 157.3 188.4
Oct-25 2020 171.8 207.2
Nov-01 2020 171.7 208.3
# HOME EQUITY LOANS ACCOUNTS
ORIGINATED (HUNDREDS)
WEEKEND CURR YR PREV YR
Nov-08 2020 145.7 195.7
Nov-15 2020 143.2 181.0
Nov-22 2020 166.4 210.3
Nov-29 2020 132.2 170.6
Dec-06 2020 152.4 182.3
Dec-13 2020 150.3 193.4
Dec-20 2020 156.1 198.7
Dec-27 2020 115.3 141.8
Jan-03 2021 123.9 74.1
Jan-10 2021 113.3 167.8
Jan-17 2021 123.4 175.1
Jan-24 2021 114.6 161.2
# HOME EQUITY LOANS ACCOUNTS
ORIGINATED (HUNDREDS)
WEEKEND CURR YR PREV YR
Jan-31 2021 139.7 195.7
Feb-07 2021 123.1 160.2
Feb-14 2021 123.9 171.6
Feb-21 2021 106.4 166.5
Feb-28 2021 107.1 184.5
Mar-07 2021 20.6 180.5
Mar-14 2021 0.3 187.8
# HOME EQUITY LOANS ACCOUNTS
ORIGINATED (HUNDREDS)

121 PROPRIETARY |
Originations through March 14, 2021 reported as of March 16, 2021
653
666
679
692
705
718
731
744
757
0
136
273
409
546
682
819
955
1,092
Jan-
06 2
019
Apr-0
7 20
19
Jul-0
7 20
19
Oct-0
6 20
19
Jan-
05 2
020
Apr-0
5 20
20
Jul-0
5 20
20
Oct-0
4 20
20
Mar
-14
2021
Mill
ions
New Trades VS® 3.0
Home Equity Loan Originations: Balances Total Origination Balances in $Millions; NSA. Average VantageScore® 3.0
Source: Equifax Inc.
Home Equity: Installment Loans
WEEKEND CURR YR PREV YR
Mar-01 2020 $776.6 $642.9
Mar-08 2020 $708.9 $587.4
Mar-15 2020 $749.3 $638.2
Mar-22 2020 $734.4 $686.4
Mar-29 2020 $746.4 $746.5
Apr-05 2020 $678.9 $657.0
Apr-12 2020 $680.4 $692.3
Apr-19 2020 $748.1 $708.6
Apr-26 2020 $837.7 $725.2
May-03 2020 $833.3 $734.2
May-10 2020 $772.5 $709.6
May-17 2020 $836.5 $721.1
TOTAL HOME EQUITY LOANS
BALANCES ORIGINATED (MILLIONS)
WEEKEND CURR YR PREV YR
May-24 2020 $905.3 $794.8
May-31 2020 $691.9 $669.9
Jun-07 2020 $745.3 $720.9
Jun-14 2020 $754.2 $757.3
Jun-21 2020 $764.9 $784.0
Jun-28 2020 $853.8 $847.9
Jul-05 2020 $689.7 $580.3
Jul-12 2020 $697.1 $723.8
Jul-19 2020 $755.9 $780.7
Jul-26 2020 $784.4 $798.0
Aug-02 2020 $842.8 $787.4
Aug-09 2020 $739.9 $749.6
TOTAL HOME EQUITY LOANS
BALANCES ORIGINATED (MILLIONS)
WEEKEND CURR YR PREV YR
Aug-16 2020 $775.5 $767.3
Aug-23 2020 $829.7 $806.9
Aug-30 2020 $895.1 $876.0
Sep-06 2020 $876.1 $627.2
Sep-13 2020 $711.3 $778.5
Sep-20 2020 $875.1 $817.8
Sep-27 2020 $909.8 $864.0
Oct-04 2020 $867.7 $847.3
Oct-11 2020 $790.2 $826.9
Oct-18 2020 $722.6 $724.5
Oct-25 2020 $856.9 $879.2
Nov-01 2020 $843.9 $877.6
TOTAL HOME EQUITY LOANS
BALANCES ORIGINATED (MILLIONS)
WEEKEND CURR YR PREV YR
Nov-08 2020 $716.3 $775.8
Nov-15 2020 $668.4 $712.1
Nov-22 2020 $828.0 $894.4
Nov-29 2020 $655.6 $700.9
Dec-06 2020 $741.6 $711.6
Dec-13 2020 $737.9 $782.5
Dec-20 2020 $794.3 $856.7
Dec-27 2020 $625.7 $590.8
Jan-03 2021 $599.6 $278.9
Jan-10 2021 $569.6 $645.9
Jan-17 2021 $624.8 $704.5
Jan-24 2021 $575.4 $626.8
TOTAL HOME EQUITY LOANS
BALANCES ORIGINATED (MILLIONS)
WEEKEND CURR YR PREV YR
Jan-31 2021 $690.3 $807.6
Feb-07 2021 $603.2 $630.0
Feb-14 2021 $580.8 $692.6
Feb-21 2021 $487.9 $655.1
Feb-28 2021 $456.7 $776.6
Mar-07 2021 $74.1 $708.9
Mar-14 2021 $2.4 $749.3
TOTAL HOME EQUITY LOANS
BALANCES ORIGINATED (MILLIONS)
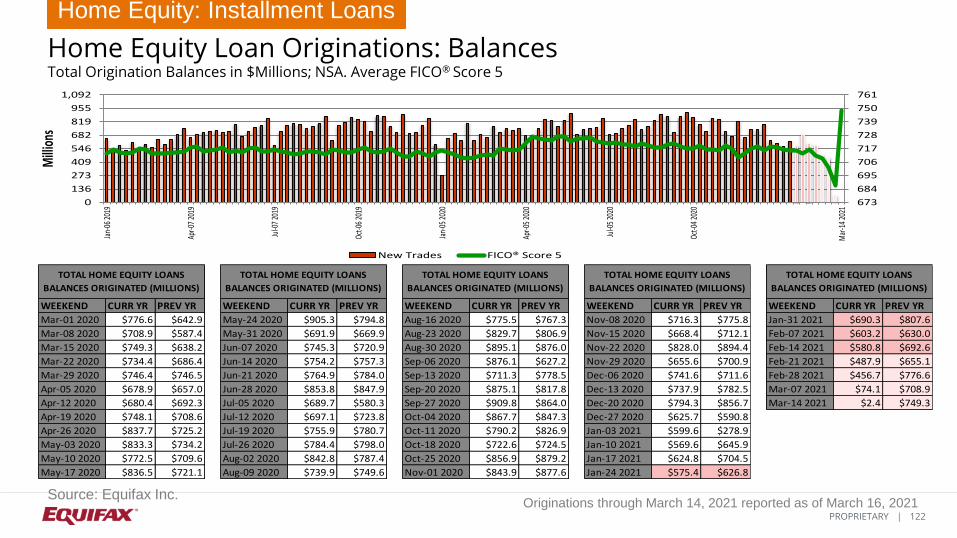
122 PROPRIETARY |
Originations through March 14, 2021 reported as of March 16, 2021
673
684
695
706
717
728
739
750
761
0
136
273
409
546
682
819
955
1,092
Jan-
06 2
019
Apr-0
7 20
19
Jul-0
7 20
19
Oct-0
6 20
19
Jan-
05 2
020
Apr-0
5 20
20
Jul-0
5 20
20
Oct-0
4 20
20
Mar
-14
2021
Mill
ions
New Trades FICO® Score 5
Home Equity Loan Originations: Balances Total Origination Balances in $Millions; NSA. Average FICO® Score 5
Source: Equifax Inc.
Home Equity: Installment Loans
WEEKEND CURR YR PREV YR
Mar-01 2020 $776.6 $642.9
Mar-08 2020 $708.9 $587.4
Mar-15 2020 $749.3 $638.2
Mar-22 2020 $734.4 $686.4
Mar-29 2020 $746.4 $746.5
Apr-05 2020 $678.9 $657.0
Apr-12 2020 $680.4 $692.3
Apr-19 2020 $748.1 $708.6
Apr-26 2020 $837.7 $725.2
May-03 2020 $833.3 $734.2
May-10 2020 $772.5 $709.6
May-17 2020 $836.5 $721.1
TOTAL HOME EQUITY LOANS
BALANCES ORIGINATED (MILLIONS)
WEEKEND CURR YR PREV YR
May-24 2020 $905.3 $794.8
May-31 2020 $691.9 $669.9
Jun-07 2020 $745.3 $720.9
Jun-14 2020 $754.2 $757.3
Jun-21 2020 $764.9 $784.0
Jun-28 2020 $853.8 $847.9
Jul-05 2020 $689.7 $580.3
Jul-12 2020 $697.1 $723.8
Jul-19 2020 $755.9 $780.7
Jul-26 2020 $784.4 $798.0
Aug-02 2020 $842.8 $787.4
Aug-09 2020 $739.9 $749.6
TOTAL HOME EQUITY LOANS
BALANCES ORIGINATED (MILLIONS)
WEEKEND CURR YR PREV YR
Aug-16 2020 $775.5 $767.3
Aug-23 2020 $829.7 $806.9
Aug-30 2020 $895.1 $876.0
Sep-06 2020 $876.1 $627.2
Sep-13 2020 $711.3 $778.5
Sep-20 2020 $875.1 $817.8
Sep-27 2020 $909.8 $864.0
Oct-04 2020 $867.7 $847.3
Oct-11 2020 $790.2 $826.9
Oct-18 2020 $722.6 $724.5
Oct-25 2020 $856.9 $879.2
Nov-01 2020 $843.9 $877.6
TOTAL HOME EQUITY LOANS
BALANCES ORIGINATED (MILLIONS)
WEEKEND CURR YR PREV YR
Nov-08 2020 $716.3 $775.8
Nov-15 2020 $668.4 $712.1
Nov-22 2020 $828.0 $894.4
Nov-29 2020 $655.6 $700.9
Dec-06 2020 $741.6 $711.6
Dec-13 2020 $737.9 $782.5
Dec-20 2020 $794.3 $856.7
Dec-27 2020 $625.7 $590.8
Jan-03 2021 $599.6 $278.9
Jan-10 2021 $569.6 $645.9
Jan-17 2021 $624.8 $704.5
Jan-24 2021 $575.4 $626.8
TOTAL HOME EQUITY LOANS
BALANCES ORIGINATED (MILLIONS)
WEEKEND CURR YR PREV YR
Jan-31 2021 $690.3 $807.6
Feb-07 2021 $603.2 $630.0
Feb-14 2021 $580.8 $692.6
Feb-21 2021 $487.9 $655.1
Feb-28 2021 $456.7 $776.6
Mar-07 2021 $74.1 $708.9
Mar-14 2021 $2.4 $749.3
TOTAL HOME EQUITY LOANS
BALANCES ORIGINATED (MILLIONS)
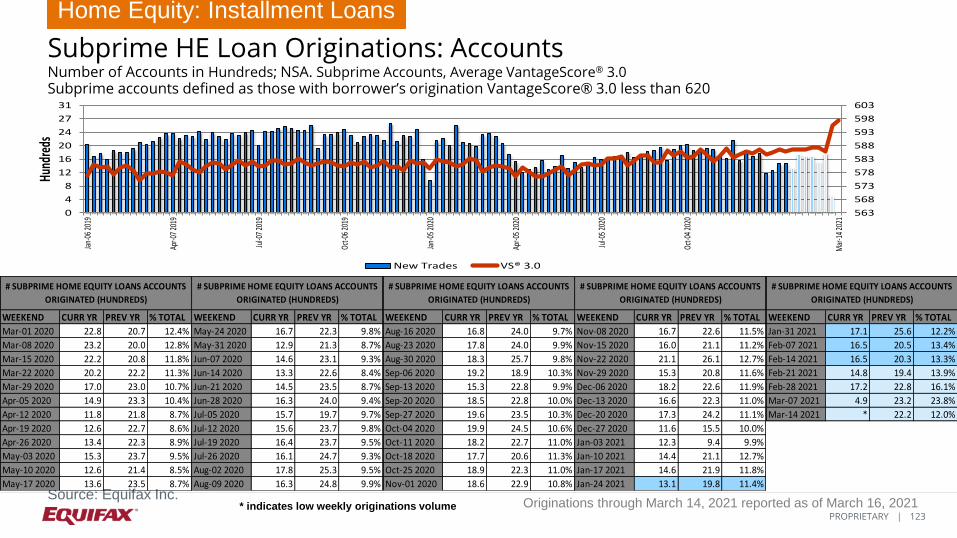
123 PROPRIETARY |
Originations through March 14, 2021 reported as of March 16, 2021
563
568
573
578
583
588
593
598
603
0
4
8
12
16
20
24
27
31
Jan-
06 2
019
Apr-0
7 20
19
Jul-0
7 20
19
Oct-0
6 20
19
Jan-
05 2
020
Apr-0
5 20
20
Jul-0
5 20
20
Oct-0
4 20
20
Mar
-14
2021
Hund
reds
New Trades VS® 3.0
Subprime HE Loan Originations: Accounts Number of Accounts in Hundreds; NSA. Subprime Accounts, Average VantageScore® 3.0 Subprime accounts defined as those with borrower’s origination VantageScore® 3.0 less than 620
Home Equity: Installment Loans
Source: Equifax Inc.
WEEKEND CURR YR PREV YR % TOTAL
Mar-01 2020 22.8 20.7 12.4%
Mar-08 2020 23.2 20.0 12.8%
Mar-15 2020 22.2 20.8 11.8%
Mar-22 2020 20.2 22.2 11.3%
Mar-29 2020 17.0 23.0 10.7%
Apr-05 2020 14.9 23.3 10.4%
Apr-12 2020 11.8 21.8 8.7%
Apr-19 2020 12.6 22.7 8.6%
Apr-26 2020 13.4 22.3 8.9%
May-03 2020 15.3 23.7 9.5%
May-10 2020 12.6 21.4 8.5%
May-17 2020 13.6 23.5 8.7%
# SUBPRIME HOME EQUITY LOANS ACCOUNTS
ORIGINATED (HUNDREDS)
WEEKEND CURR YR PREV YR % TOTAL
May-24 2020 16.7 22.3 9.8%
May-31 2020 12.9 21.3 8.7%
Jun-07 2020 14.6 23.1 9.3%
Jun-14 2020 13.3 22.6 8.4%
Jun-21 2020 14.5 23.5 8.7%
Jun-28 2020 16.3 24.0 9.4%
Jul-05 2020 15.7 19.7 9.7%
Jul-12 2020 15.6 23.7 9.8%
Jul-19 2020 16.4 23.7 9.5%
Jul-26 2020 16.1 24.7 9.3%
Aug-02 2020 17.8 25.3 9.5%
Aug-09 2020 16.3 24.8 9.9%
# SUBPRIME HOME EQUITY LOANS ACCOUNTS
ORIGINATED (HUNDREDS)
WEEKEND CURR YR PREV YR % TOTAL
Aug-16 2020 16.8 24.0 9.7%
Aug-23 2020 17.8 24.0 9.9%
Aug-30 2020 18.3 25.7 9.8%
Sep-06 2020 19.2 18.9 10.3%
Sep-13 2020 15.3 22.8 9.9%
Sep-20 2020 18.5 22.8 10.0%
Sep-27 2020 19.6 23.5 10.3%
Oct-04 2020 19.9 24.5 10.6%
Oct-11 2020 18.2 22.7 11.0%
Oct-18 2020 17.7 20.6 11.3%
Oct-25 2020 18.9 22.3 11.0%
Nov-01 2020 18.6 22.9 10.8%
# SUBPRIME HOME EQUITY LOANS ACCOUNTS
ORIGINATED (HUNDREDS)
WEEKEND CURR YR PREV YR % TOTAL
Nov-08 2020 16.7 22.6 11.5%
Nov-15 2020 16.0 21.1 11.2%
Nov-22 2020 21.1 26.1 12.7%
Nov-29 2020 15.3 20.8 11.6%
Dec-06 2020 18.2 22.6 11.9%
Dec-13 2020 16.6 22.3 11.0%
Dec-20 2020 17.3 24.2 11.1%
Dec-27 2020 11.6 15.5 10.0%
Jan-03 2021 12.3 9.4 9.9%
Jan-10 2021 14.4 21.1 12.7%
Jan-17 2021 14.6 21.9 11.8%
Jan-24 2021 13.1 19.8 11.4%
# SUBPRIME HOME EQUITY LOANS ACCOUNTS
ORIGINATED (HUNDREDS)
WEEKEND CURR YR PREV YR % TOTAL
Jan-31 2021 17.1 25.6 12.2%
Feb-07 2021 16.5 20.5 13.4%
Feb-14 2021 16.5 20.3 13.3%
Feb-21 2021 14.8 19.4 13.9%
Feb-28 2021 17.2 22.8 16.1%
Mar-07 2021 4.9 23.2 23.8%
Mar-14 2021 * 22.2 12.0%
# SUBPRIME HOME EQUITY LOANS ACCOUNTS
ORIGINATED (HUNDREDS)
* indicates low weekly originations volume

124 PROPRIETARY |
Originations through March 14, 2021 reported as of March 16, 2021
0
75
150
225
300
375
450
525
600
0
3
7
10
13
17
20
23
27
Jan-
06 2
019
Apr-0
7 20
19
Jul-0
7 20
19
Oct-0
6 20
19
Jan-
05 2
020
Apr-0
5 20
20
Jul-0
5 20
20
Oct-0
4 20
20
Mar
-14
2021
Hund
reds
New Trades FICO® Score 5
Subprime HE Loan Originations: Accounts Number of Accounts in Hundreds; NSA. Subprime Accounts, Average FICO® Score 5 Subprime accounts defined as those with borrower’s origination FICO® Score 5 less than 620
Home Equity: Installment Loans
Source: Equifax Inc.
WEEKEND CURR YR PREV YR % TOTAL
Mar-01 2020 17.0 16.4 9.2%
Mar-08 2020 16.8 15.6 9.3%
Mar-15 2020 16.0 16.3 8.5%
Mar-22 2020 15.0 17.7 8.4%
Mar-29 2020 12.8 18.4 8.1%
Apr-05 2020 12.1 18.8 8.4%
Apr-12 2020 9.4 16.7 6.9%
Apr-19 2020 10.7 18.8 7.3%
Apr-26 2020 11.4 19.0 7.5%
May-03 2020 13.7 19.4 8.5%
May-10 2020 11.2 18.3 7.6%
May-17 2020 11.8 20.3 7.5%
# SUBPRIME HOME EQUITY LOANS ACCOUNTS
ORIGINATED (HUNDREDS)
WEEKEND CURR YR PREV YR % TOTAL
May-24 2020 15.4 19.6 9.1%
May-31 2020 11.2 18.2 7.6%
Jun-07 2020 13.5 19.1 8.6%
Jun-14 2020 11.7 18.2 7.3%
Jun-21 2020 13.9 19.6 8.4%
Jun-28 2020 14.3 19.7 8.3%
Jul-05 2020 13.7 15.9 8.4%
Jul-12 2020 13.1 19.6 8.3%
Jul-19 2020 14.5 19.1 8.4%
Jul-26 2020 14.0 20.4 8.0%
Aug-02 2020 16.1 21.2 8.6%
Aug-09 2020 14.6 19.7 8.8%
# SUBPRIME HOME EQUITY LOANS ACCOUNTS
ORIGINATED (HUNDREDS)
WEEKEND CURR YR PREV YR % TOTAL
Aug-16 2020 14.6 18.9 8.4%
Aug-23 2020 15.7 19.5 8.7%
Aug-30 2020 15.6 21.3 8.3%
Sep-06 2020 15.5 14.7 8.3%
Sep-13 2020 12.4 17.8 8.0%
Sep-20 2020 16.2 18.7 8.7%
Sep-27 2020 17.6 19.6 9.2%
Oct-04 2020 16.7 18.9 8.9%
Oct-11 2020 14.7 17.2 8.9%
Oct-18 2020 15.0 16.7 9.6%
Oct-25 2020 16.4 18.6 9.6%
Nov-01 2020 16.5 18.2 9.6%
# SUBPRIME HOME EQUITY LOANS ACCOUNTS
ORIGINATED (HUNDREDS)
WEEKEND CURR YR PREV YR % TOTAL
Nov-08 2020 13.7 17.6 9.4%
Nov-15 2020 13.0 17.0 9.1%
Nov-22 2020 19.5 22.2 11.7%
Nov-29 2020 13.9 16.9 10.5%
Dec-06 2020 14.5 18.1 9.5%
Dec-13 2020 12.9 17.3 8.6%
Dec-20 2020 14.3 19.9 9.2%
Dec-27 2020 9.3 12.6 8.1%
Jan-03 2021 10.6 7.1 8.5%
Jan-10 2021 10.2 15.3 9.0%
Jan-17 2021 11.3 15.8 9.2%
Jan-24 2021 9.9 14.9 8.7%
# SUBPRIME HOME EQUITY LOANS ACCOUNTS
ORIGINATED (HUNDREDS)
WEEKEND CURR YR PREV YR % TOTAL
Jan-31 2021 13.6 19.1 9.8%
Feb-07 2021 11.5 15.8 9.4%
Feb-14 2021 12.3 14.5 9.9%
Feb-21 2021 11.0 14.1 10.4%
Feb-28 2021 12.9 17.0 12.1%
Mar-07 2021 1.9 16.8 9.4%
Mar-14 2021 * 16.0 0.1%
# SUBPRIME HOME EQUITY LOANS ACCOUNTS
ORIGINATED (HUNDREDS)
* indicates low weekly originations volume

125 PROPRIETARY |
Originations through March 14, 2021 reported as of March 16, 2021
563
568
573
578
583
588
593
598
603
0
12
23
35
47
58
70
82
93
Jan-
06 2
019
Apr-0
7 20
19
Jul-0
7 20
19
Oct-0
6 20
19
Jan-
05 2
020
Apr-0
5 20
20
Jul-0
5 20
20
Oct-0
4 20
20
Mar
-14
2021
Mill
ions
New Trades VS® 3.0
Subprime HE Loan Originations: Balances Total Balances in $Millions; NSA. Subprime Accounts, Average VantageScore® 3.0 Subprime accounts defined as those with borrower’s origination VantageScore® 3.0 less than 620
Home Equity: Installment Loans
Source: Equifax Inc.
WEEKEND CURR YR PREV YR % TOTAL
Mar-01 2020 $72.7 $54.7 9.4%
Mar-08 2020 $70.2 $54.2 9.9%
Mar-15 2020 $65.3 $58.9 8.7%
Mar-22 2020 $61.6 $60.2 8.4%
Mar-29 2020 $54.0 $62.6 7.2%
Apr-05 2020 $44.7 $61.2 6.6%
Apr-12 2020 $38.7 $63.1 5.7%
Apr-19 2020 $44.8 $62.4 6.0%
Apr-26 2020 $44.9 $62.0 5.4%
May-03 2020 $48.0 $62.4 5.8%
May-10 2020 $39.1 $58.7 5.1%
May-17 2020 $48.4 $64.4 5.8%
TOTAL SUBPRIME HOME EQUITY LOANS
BALANCES ORIGINATED (MILLIONS)
WEEKEND CURR YR PREV YR % TOTAL
May-24 2020 $53.7 $62.3 5.9%
May-31 2020 $36.8 $54.9 5.3%
Jun-07 2020 $42.0 $64.0 5.6%
Jun-14 2020 $39.7 $60.3 5.3%
Jun-21 2020 $42.5 $68.2 5.6%
Jun-28 2020 $48.5 $70.1 5.7%
Jul-05 2020 $46.8 $52.4 6.8%
Jul-12 2020 $47.0 $65.5 6.7%
Jul-19 2020 $47.1 $67.2 6.2%
Jul-26 2020 $48.2 $69.8 6.1%
Aug-02 2020 $52.4 $66.8 6.2%
Aug-09 2020 $48.9 $69.7 6.6%
TOTAL SUBPRIME HOME EQUITY LOANS
BALANCES ORIGINATED (MILLIONS)
WEEKEND CURR YR PREV YR % TOTAL
Aug-16 2020 $50.5 $68.8 6.5%
Aug-23 2020 $55.0 $69.0 6.6%
Aug-30 2020 $52.5 $71.1 5.9%
Sep-06 2020 $57.3 $56.8 6.5%
Sep-13 2020 $46.4 $69.0 6.5%
Sep-20 2020 $55.2 $67.2 6.3%
Sep-27 2020 $60.3 $72.5 6.6%
Oct-04 2020 $59.0 $71.7 6.8%
Oct-11 2020 $55.6 $66.5 7.0%
Oct-18 2020 $51.6 $58.3 7.1%
Oct-25 2020 $58.2 $74.7 6.8%
Nov-01 2020 $54.2 $67.8 6.4%
TOTAL SUBPRIME HOME EQUITY LOANS
BALANCES ORIGINATED (MILLIONS)
WEEKEND CURR YR PREV YR % TOTAL
Nov-08 2020 $49.5 $70.3 6.9%
Nov-15 2020 $47.5 $64.9 7.1%
Nov-22 2020 $60.7 $77.8 7.3%
Nov-29 2020 $45.0 $61.1 6.9%
Dec-06 2020 $52.9 $65.1 7.1%
Dec-13 2020 $50.3 $68.3 6.8%
Dec-20 2020 $55.4 $77.8 7.0%
Dec-27 2020 $37.0 $49.4 5.9%
Jan-03 2021 $39.5 $25.1 6.6%
Jan-10 2021 $45.6 $61.4 8.0%
Jan-17 2021 $45.1 $69.1 7.2%
Jan-24 2021 $42.2 $59.9 7.3%
TOTAL SUBPRIME HOME EQUITY LOANS
BALANCES ORIGINATED (MILLIONS)
WEEKEND CURR YR PREV YR % TOTAL
Jan-31 2021 $56.0 $75.2 8.1%
Feb-07 2021 $52.4 $59.5 8.7%
Feb-14 2021 $49.8 $65.3 8.6%
Feb-21 2021 $43.4 $57.0 8.9%
Feb-28 2021 $50.2 $72.7 11.0%
Mar-07 2021 $15.5 $70.2 20.9%
Mar-14 2021 $0.1 $65.3 6.2%
TOTAL SUBPRIME HOME EQUITY LOANS
BALANCES ORIGINATED (MILLIONS)

126 PROPRIETARY |
Originations through March 14, 2021 reported as of March 16, 2021
0
75
150
225
300
375
450
525
600
0
10
20
30
40
51
61
71
81
Jan-
06 2
019
Apr-0
7 20
19
Jul-0
7 20
19
Oct-0
6 20
19
Jan-
05 2
020
Apr-0
5 20
20
Jul-0
5 20
20
Oct-0
4 20
20
Mar
-14
2021
Mill
ions
New Trades FICO® Score 5
Subprime HE Loan Originations: Balances Total Balances in $Millions; NSA. Subprime Accounts, Average FICO® Score 5 Subprime accounts defined as those with borrower’s origination FICO® Score 5 less than 620
Home Equity: Installment Loans
Source: Equifax Inc.
WEEKEND CURR YR PREV YR % TOTAL
Mar-01 2020 $51.6 $42.3 6.6%
Mar-08 2020 $46.1 $39.9 6.5%
Mar-15 2020 $43.6 $43.3 5.8%
Mar-22 2020 $44.5 $45.6 6.1%
Mar-29 2020 $40.7 $47.7 5.5%
Apr-05 2020 $36.6 $43.4 5.4%
Apr-12 2020 $28.4 $42.9 4.2%
Apr-19 2020 $33.5 $49.4 4.5%
Apr-26 2020 $35.4 $50.1 4.2%
May-03 2020 $42.0 $49.6 5.0%
May-10 2020 $32.1 $45.7 4.2%
May-17 2020 $37.0 $52.5 4.4%
TOTAL SUBPRIME HOME EQUITY LOANS
BALANCES ORIGINATED (MILLIONS)
WEEKEND CURR YR PREV YR % TOTAL
May-24 2020 $46.8 $51.8 5.2%
May-31 2020 $31.7 $42.5 4.6%
Jun-07 2020 $36.7 $50.8 4.9%
Jun-14 2020 $32.8 $45.6 4.3%
Jun-21 2020 $39.7 $53.2 5.2%
Jun-28 2020 $41.6 $52.8 4.9%
Jul-05 2020 $40.9 $37.9 5.9%
Jul-12 2020 $39.3 $50.0 5.6%
Jul-19 2020 $40.3 $50.0 5.3%
Jul-26 2020 $41.7 $53.8 5.3%
Aug-02 2020 $48.7 $52.2 5.8%
Aug-09 2020 $41.5 $50.9 5.6%
TOTAL SUBPRIME HOME EQUITY LOANS BALANCES
ORIGINATED (MILLIONS)
WEEKEND CURR YR PREV YR % TOTAL
Aug-16 2020 $43.3 $50.7 5.6%
Aug-23 2020 $44.9 $53.9 5.4%
Aug-30 2020 $44.4 $58.1 5.0%
Sep-06 2020 $43.6 $39.4 5.0%
Sep-13 2020 $35.8 $49.5 5.0%
Sep-20 2020 $45.0 $52.2 5.1%
Sep-27 2020 $52.7 $56.3 5.8%
Oct-04 2020 $48.5 $50.6 5.6%
Oct-11 2020 $41.7 $46.8 5.3%
Oct-18 2020 $40.5 $44.0 5.6%
Oct-25 2020 $47.3 $60.6 5.5%
Nov-01 2020 $46.5 $49.3 5.5%
TOTAL SUBPRIME HOME EQUITY LOANS
BALANCES ORIGINATED (MILLIONS)
WEEKEND CURR YR PREV YR % TOTAL
Nov-08 2020 $38.2 $50.4 5.3%
Nov-15 2020 $35.4 $47.3 5.3%
Nov-22 2020 $53.8 $67.3 6.5%
Nov-29 2020 $38.7 $48.6 5.9%
Dec-06 2020 $41.1 $48.2 5.5%
Dec-13 2020 $37.3 $50.5 5.1%
Dec-20 2020 $41.6 $56.2 5.2%
Dec-27 2020 $28.7 $39.7 4.6%
Jan-03 2021 $32.8 $17.1 5.5%
Jan-10 2021 $30.2 $42.4 5.3%
Jan-17 2021 $35.0 $45.1 5.6%
Jan-24 2021 $28.7 $43.3 5.0%
TOTAL SUBPRIME HOME EQUITY LOANS
BALANCES ORIGINATED (MILLIONS)
WEEKEND CURR YR PREV YR % TOTAL
Jan-31 2021 $43.8 $56.2 6.4%
Feb-07 2021 $34.2 $44.7 5.7%
Feb-14 2021 $37.4 $44.8 6.4%
Feb-21 2021 $32.1 $39.6 6.6%
Feb-28 2021 $36.3 $51.6 7.9%
Mar-07 2021 $5.5 $46.1 7.4%
Mar-14 2021 * $43.6 0.1%
TOTAL SUBPRIME HOME EQUITY LOANS
BALANCES ORIGINATED (MILLIONS)
* indicates low weekly originations volume

127 PROPRIETARY |
Originations through March 14, 2021 reported as of March 16, 2021
$0
$20,000
$40,000
$60,000
$80,000
$100,000
$120,000
Jan-
07 20
18
Apr-0
8 20
18
Jul-0
8 201
8
Oct-0
7 201
8
Jan-
06 20
19
Apr-0
7 20
19
Jul-0
7 201
9
Oct-0
6 201
9
Jan-
05 20
20
Apr-0
5 20
20
Jul-0
5 202
0
Oct-0
4 202
0
Mar
-14 2
021
Home Equity Loans Origination Loan Amount Subprime Home Equity Loans Origination Loan Amount
Home Equity Loan Average Origination Balance Average Origination Balance Over Time; NSA Subprime accounts defined as those with borrower’s origination VantageScore® 3.0 less than 620
Home Equity: Installment Loans
Source: Equifax Inc.

128 PROPRIETARY |
Originations through March 14, 2021 reported as of March 16, 2021
$0
$20,000
$40,000
$60,000
$80,000
$100,000
$120,000
Jan-
07 20
18
Apr-0
8 20
18
Jul-0
8 201
8
Oct-0
7 201
8
Jan-
06 20
19
Apr-0
7 20
19
Jul-0
7 201
9
Oct-0
6 201
9
Jan-
05 20
20
Apr-0
5 20
20
Jul-0
5 202
0
Oct-0
4 202
0
Mar
-14 2
021
Home Equity Loans Origination Loan Amount Subprime Home Equity Loans Origination Loan Amount
Home Equity Loan Average Origination Balance Average Origination Balance Over Time; NSA Subprime accounts defined as those with borrower’s origination FICO® Score 5 less than 620
Home Equity: Installment Loans
Source: Equifax Inc.

129 PROPRIETARY |
Originations through March 14, 2021 reported as of March 16, 2021
0%
3%
7%
10%
13%
16%
20%
23%
$0
$143
$286
$429
$572
$715
$858
$1,001M
ar-0
1 202
0
Mar
-08 2
020
Mar
-15 2
020
Mar
-22 2
020
Mar
-29 2
020
Apr-0
5 20
20
Apr-1
2 20
20
Apr-1
9 20
20
Apr-2
6 20
20
May
-03
2020
May
-10
2020
May
-17
2020
May
-24
2020
May
-31
2020
Jun-
07 2
020
Jun-
14 2
020
Jun-
21 2
020
Jun-
28 2
020
Jul-0
5 20
20
Jul-1
2 20
20
Jul-1
9 20
20
Jul-2
6 20
20
Aug-
02 2
020
Aug-
09 2
020
Aug-
16 2
020
Aug-
23 2
020
Aug-
30 2
020
Sep-
06 20
20
Sep-
13 20
20
Sep-
20 20
20
Sep-
27 20
20
Oct-0
4 20
20
Oct-1
1 20
20
Oct-1
8 20
20
Oct-2
5 20
20
Nov-
01 2
020
Nov-
08 2
020
Nov-
15 2
020
Nov-
22 2
020
Nov-
29 2
020
Dec-0
6 20
20
Dec-1
3 20
20
Dec-2
0 20
20
Dec-2
7 20
20
Jan-
03 2
021
Jan-
10 2
021
Jan-
17 2
021
Jan-
24 2
021
Jan-
31 2
021
Feb-
07 20
21
Feb-
14 20
21
Feb-
21 20
21
Feb-
28 20
21
Mar
-07 2
021
Mar
-14 2
021
Subp
rime S
hare
Milli
ons
Home Equity Loans Origination Home Equity Loans Origination Subprime Share
Home Equity Loan Origination Balances Total Balances in $Millions; Subprime Share of Total Origination Balances (%); NSA Subprime accounts defined as those with borrower’s origination VantageScore® 3.0 less than 620
Home Equity: Installment Loans
Source: Equifax Inc.

130 PROPRIETARY |
Originations through March 14, 2021 reported as of March 16, 2021
0%
1%
2%
4%
5%
6%
7%
9%
$0
$143
$286
$429
$572
$715
$858
$1,001M
ar-0
1 202
0
Mar
-08 2
020
Mar
-15 2
020
Mar
-22 2
020
Mar
-29 2
020
Apr-0
5 20
20
Apr-1
2 20
20
Apr-1
9 20
20
Apr-2
6 20
20
May
-03
2020
May
-10
2020
May
-17
2020
May
-24
2020
May
-31
2020
Jun-
07 2
020
Jun-
14 2
020
Jun-
21 2
020
Jun-
28 2
020
Jul-0
5 20
20
Jul-1
2 20
20
Jul-1
9 20
20
Jul-2
6 20
20
Aug-
02 2
020
Aug-
09 2
020
Aug-
16 2
020
Aug-
23 2
020
Aug-
30 2
020
Sep-
06 20
20
Sep-
13 20
20
Sep-
20 20
20
Sep-
27 20
20
Oct-0
4 20
20
Oct-1
1 20
20
Oct-1
8 20
20
Oct-2
5 20
20
Nov-
01 2
020
Nov-
08 2
020
Nov-
15 2
020
Nov-
22 2
020
Nov-
29 2
020
Dec-0
6 20
20
Dec-1
3 20
20
Dec-2
0 20
20
Dec-2
7 20
20
Jan-
03 2
021
Jan-
10 2
021
Jan-
17 2
021
Jan-
24 2
021
Jan-
31 2
021
Feb-
07 20
21
Feb-
14 20
21
Feb-
21 20
21
Feb-
28 20
21
Mar
-07 2
021
Mar
-14 2
021
Subp
rime S
hare
Milli
ons
Home Equity Loans Origination Home Equity Loans Origination Subprime Share
Home Equity Loan Origination Balances Total Balances in $Millions; Subprime Share of Total Origination Balances (%); NSA Subprime accounts defined as those with borrower’s origination FICO® Score 5 less than 620
Home Equity: Installment Loans
Source: Equifax Inc.
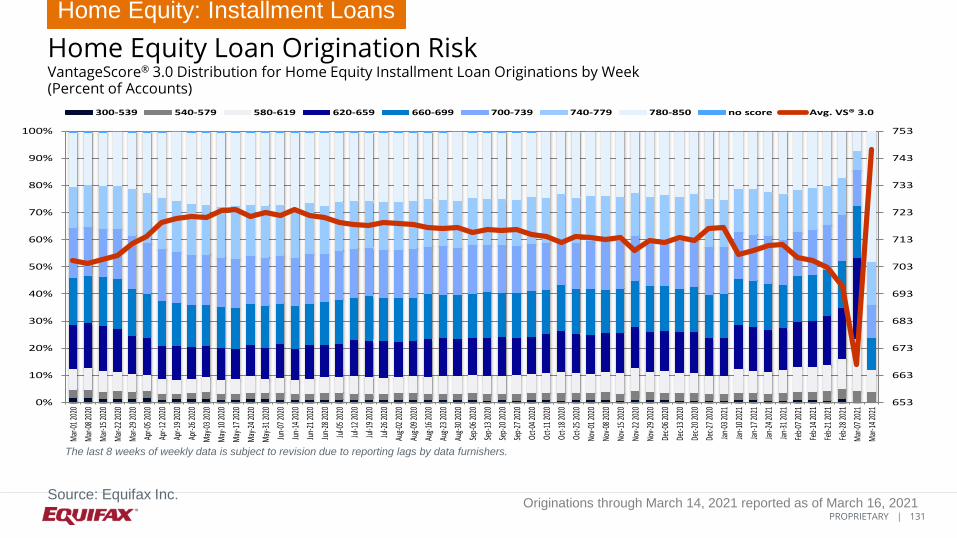
131 PROPRIETARY |
Originations through March 14, 2021 reported as of March 16, 2021
653
663
673
683
693
703
713
723
733
743
753
0%
10%
20%
30%
40%
50%
60%
70%
80%
90%
100%
Mar
-01 2
020
Mar
-08 2
020
Mar
-15 2
020
Mar
-22 2
020
Mar
-29 2
020
Apr-0
5 20
20
Apr-1
2 20
20
Apr-1
9 20
20
Apr-2
6 20
20
May
-03
2020
May
-10
2020
May
-17
2020
May
-24
2020
May
-31
2020
Jun-
07 2
020
Jun-
14 2
020
Jun-
21 2
020
Jun-
28 2
020
Jul-0
5 20
20
Jul-1
2 20
20
Jul-1
9 20
20
Jul-2
6 20
20
Aug-
02 2
020
Aug-
09 2
020
Aug-
16 2
020
Aug-
23 2
020
Aug-
30 2
020
Sep-
06 20
20
Sep-
13 20
20
Sep-
20 20
20
Sep-
27 20
20
Oct-0
4 20
20
Oct-1
1 20
20
Oct-1
8 20
20
Oct-2
5 20
20
Nov-
01 2
020
Nov-
08 2
020
Nov-
15 2
020
Nov-
22 2
020
Nov-
29 2
020
Dec-0
6 20
20
Dec-1
3 20
20
Dec-2
0 20
20
Dec-2
7 20
20
Jan-
03 2
021
Jan-
10 2
021
Jan-
17 2
021
Jan-
24 2
021
Jan-
31 2
021
Feb-
07 20
21
Feb-
14 20
21
Feb-
21 20
21
Feb-
28 20
21
Mar
-07 2
021
Mar
-14 2
021
300-539 540-579 580-619 620-659 660-699 700-739 740-779 780-850 no score Avg. VS® 3.0
Home Equity Loan Origination Risk VantageScore® 3.0 Distribution for Home Equity Installment Loan Originations by Week (Percent of Accounts)
Home Equity: Installment Loans
Source: Equifax Inc.
The last 8 weeks of weekly data is subject to revision due to reporting lags by data furnishers.

132 PROPRIETARY |
Originations through March 14, 2021 reported as of March 16, 2021
673
681
689
697
705
713
721
729
737
745
753
0%
10%
20%
30%
40%
50%
60%
70%
80%
90%
100%
Mar
-01 2
020
Mar
-08 2
020
Mar
-15 2
020
Mar
-22 2
020
Mar
-29 2
020
Apr-0
5 20
20
Apr-1
2 20
20
Apr-1
9 20
20
Apr-2
6 20
20
May
-03
2020
May
-10
2020
May
-17
2020
May
-24
2020
May
-31
2020
Jun-
07 2
020
Jun-
14 2
020
Jun-
21 2
020
Jun-
28 2
020
Jul-0
5 20
20
Jul-1
2 20
20
Jul-1
9 20
20
Jul-2
6 20
20
Aug-
02 2
020
Aug-
09 2
020
Aug-
16 2
020
Aug-
23 2
020
Aug-
30 2
020
Sep-
06 20
20
Sep-
13 20
20
Sep-
20 20
20
Sep-
27 20
20
Oct-0
4 20
20
Oct-1
1 20
20
Oct-1
8 20
20
Oct-2
5 20
20
Nov-
01 2
020
Nov-
08 2
020
Nov-
15 2
020
Nov-
22 2
020
Nov-
29 2
020
Dec-0
6 20
20
Dec-1
3 20
20
Dec-2
0 20
20
Dec-2
7 20
20
Jan-
03 2
021
Jan-
10 2
021
Jan-
17 2
021
Jan-
24 2
021
Jan-
31 2
021
Feb-
07 20
21
Feb-
14 20
21
Feb-
21 20
21
Feb-
28 20
21
Mar
-07 2
021
Mar
-14 2
021
300-539 540-579 580-619 620-659 660-699 700-739 740-779 780-850 no score Avg. FICO® Score 5
Home Equity Loan Origination Risk FICO® Score 5 Distribution for Home Equity Installment Loan Originations by Week (Percent of Accounts)
Home Equity: Installment Loans
Source: Equifax Inc.
The last 8 weeks of weekly data is subject to revision due to reporting lags by data furnishers.

133 PROPRIETARY |
Credit Trends Originations: Consumer Finance

134 PROPRIETARY |
Originations through March 14, 2021 reported as of March 16, 2021
Consumer Finance Originations Observations Originations through March 14, 2021 reported as of March 16, 2021
Consumer Finance: Total
• 132,400 consumer finance loans were originated in the week ending March 14th.
• The total dollar amount of consumer finance loans originated the week ending of March 14th is $562.7 million.
• Around 11,400 consumer finance loans have been issued the week ending March 14th to consumers with a VantageScore® 3.0 credit score below 620. These are generally considered subprime accounts. These newly issued loans have a corresponding total origination amount of $20.5 million.
• In the week ending March 14th, 8.6% of all consumer finance loans were issued to consumers with a VantageScore® 3.0 subprime credit score. Origination credit limits on subprime consumer finance loans represent 3.6% of the total.
• Around 9,300 consumer finance loans have been issued the week ending March 14th to consumers with a FICO®
Score 9 credit score below 620. These are generally considered subprime accounts. These newly issued loans have a corresponding total origination amount of $15.0 million.
• In the week ending March 14th, 7.0% of all consumer finance loans were issued to consumers with a FICO® Score 9 subprime credit score. Origination credit limits on subprime consumer finance loans represent 2.7% of the total.
• The average loan amount for all consumer finance loans originated in the week ending of March 14th was $4,251. The average loan amount on new subprime consumer finance loans was $1,797.

135 PROPRIETARY |
Originations through March 14, 2021 reported as of March 16, 2021
635
646
657
668
679
690
701
712
723
0
125
250
376
501
626
751
876
1,002
Jan-
06 2
019
Apr-0
7 20
19
Jul-0
7 20
19
Oct-0
6 20
19
Jan-
05 2
020
Apr-0
5 20
20
Jul-0
5 20
20
Oct-0
4 20
20
Mar
-14
2021
Thou
sand
s
New Trades VS® 3.0
Consumer Finance Loan Originations: Accounts Number of Accounts in Thousands; NSA. Average VantageScore® 3.0
Consumer Finance: Total
.
Source: Equifax Inc.
WEEKEND CURR YR PREV YR
Mar-01 2020 501.0 491.6
Mar-08 2020 552.9 493.6
Mar-15 2020 522.6 517.6
Mar-22 2020 425.5 717.5
Mar-29 2020 333.9 573.1
Apr-05 2020 327.6 615.3
Apr-12 2020 303.9 585.4
Apr-19 2020 301.5 578.3
Apr-26 2020 325.3 583.9
May-03 2020 361.7 619.5
May-10 2020 386.2 619.5
May-17 2020 411.0 617.0
# CONSUMER FINANCE ACCOUNTS
ORIGINATED (THOUSANDS)
WEEKEND CURR YR PREV YR
May-24 2020 496.1 681.3
May-31 2020 480.6 639.8
Jun-07 2020 499.7 635.8
Jun-14 2020 502.6 591.1
Jun-21 2020 494.0 631.6
Jun-28 2020 488.8 625.0
Jul-05 2020 531.2 627.3
Jul-12 2020 495.7 621.6
Jul-19 2020 469.1 601.1
Jul-26 2020 471.4 590.6
Aug-02 2020 489.7 605.5
Aug-09 2020 514.0 603.2
# CONSUMER FINANCE ACCOUNTS
ORIGINATED (THOUSANDS)
WEEKEND CURR YR PREV YR
Aug-16 2020 514.3 586.3
Aug-23 2020 519.1 581.5
Aug-30 2020 530.2 643.2
Sep-06 2020 598.4 593.4
Sep-13 2020 530.2 568.1
Sep-20 2020 507.4 549.2
Sep-27 2020 497.4 564.8
Oct-04 2020 522.0 597.7
Oct-11 2020 521.3 580.1
Oct-18 2020 509.4 560.1
Oct-25 2020 511.2 601.9
Nov-01 2020 507.6 582.7
# CONSUMER FINANCE ACCOUNTS
ORIGINATED (THOUSANDS)
WEEKEND CURR YR PREV YR
Nov-08 2020 547.6 635.9
Nov-15 2020 592.8 632.1
Nov-22 2020 661.6 745.5
Nov-29 2020 668.8 834.6
Dec-06 2020 684.4 757.2
Dec-13 2020 596.5 666.7
Dec-20 2020 576.8 662.5
Dec-27 2020 405.2 452.6
Jan-03 2021 414.1 318.2
Jan-10 2021 404.9 517.9
Jan-17 2021 422.0 510.0
Jan-24 2021 419.7 497.7
# CONSUMER FINANCE ACCOUNTS
ORIGINATED (THOUSANDS)
WEEKEND CURR YR PREV YR
Jan-31 2021 471.7 562.1
Feb-07 2021 444.1 508.6
Feb-14 2021 439.6 533.7
Feb-21 2021 352.8 591.2
Feb-28 2021 362.4 501.0
Mar-07 2021 167.2 552.9
Mar-14 2021 132.4 522.6
# CONSUMER FINANCE ACCOUNTS
ORIGINATED (THOUSANDS)

136 PROPRIETARY |
Originations through March 14, 2021 reported as of March 16, 2021
637
649
661
673
685
697
709
721
733
0
125
250
376
501
626
751
876
1,002
Jan-
06 2
019
Apr-0
7 20
19
Jul-0
7 20
19
Oct-0
6 20
19
Jan-
05 2
020
Apr-0
5 20
20
Jul-0
5 20
20
Oct-0
4 20
20
Mar
-14
2021
Thou
sand
s
New Trades FICO® Score 9
Consumer Finance Loan Originations: Accounts Number of Accounts in Thousands; NSA. Average FICO® Score 9
Consumer Finance: Total
.
Source: Equifax Inc.
WEEKEND CURR YR PREV YR
Mar-01 2020 501.0 491.6
Mar-08 2020 552.9 493.6
Mar-15 2020 522.6 517.6
Mar-22 2020 425.5 717.5
Mar-29 2020 333.9 573.1
Apr-05 2020 327.6 615.3
Apr-12 2020 303.9 585.4
Apr-19 2020 301.5 578.3
Apr-26 2020 325.3 583.9
May-03 2020 361.7 619.5
May-10 2020 386.2 619.5
May-17 2020 411.0 617.0
# CONSUMER FINANCE ACCOUNTS
ORIGINATED (THOUSANDS)
WEEKEND CURR YR PREV YR
May-24 2020 496.1 681.3
May-31 2020 480.6 639.8
Jun-07 2020 499.7 635.8
Jun-14 2020 502.6 591.1
Jun-21 2020 494.0 631.6
Jun-28 2020 488.8 625.0
Jul-05 2020 531.2 627.3
Jul-12 2020 495.7 621.6
Jul-19 2020 469.1 601.1
Jul-26 2020 471.4 590.6
Aug-02 2020 489.7 605.5
Aug-09 2020 514.0 603.2
# CONSUMER FINANCE ACCOUNTS
ORIGINATED (THOUSANDS)
WEEKEND CURR YR PREV YR
Aug-16 2020 514.3 586.3
Aug-23 2020 519.1 581.5
Aug-30 2020 530.2 643.2
Sep-06 2020 598.4 593.4
Sep-13 2020 530.2 568.1
Sep-20 2020 507.4 549.2
Sep-27 2020 497.4 564.8
Oct-04 2020 522.0 597.7
Oct-11 2020 521.3 580.1
Oct-18 2020 509.4 560.1
Oct-25 2020 511.2 601.9
Nov-01 2020 507.6 582.7
# CONSUMER FINANCE ACCOUNTS
ORIGINATED (THOUSANDS)
WEEKEND CURR YR PREV YR
Nov-08 2020 547.6 635.9
Nov-15 2020 592.8 632.1
Nov-22 2020 661.6 745.5
Nov-29 2020 668.8 834.6
Dec-06 2020 684.4 757.2
Dec-13 2020 596.5 666.7
Dec-20 2020 576.8 662.5
Dec-27 2020 405.2 452.6
Jan-03 2021 414.1 318.2
Jan-10 2021 404.9 517.9
Jan-17 2021 422.0 510.0
Jan-24 2021 419.7 497.7
# CONSUMER FINANCE ACCOUNTS
ORIGINATED (THOUSANDS)
WEEKEND CURR YR PREV YR
Jan-31 2021 471.7 562.1
Feb-07 2021 444.1 508.6
Feb-14 2021 439.6 533.7
Feb-21 2021 352.8 591.2
Feb-28 2021 362.4 501.0
Mar-07 2021 167.2 552.9
Mar-14 2021 132.4 522.6
# CONSUMER FINANCE ACCOUNTS
ORIGINATED (THOUSANDS)

137 PROPRIETARY |
Originations through March 14, 2021 reported as of March 16, 2021
635
646
657
668
679
690
701
712
723
0
507
1,014
1,520
2,027
2,534
3,041
3,548
4,055
Jan-
06 2
019
Apr-0
7 20
19
Jul-0
7 20
19
Oct-0
6 20
19
Jan-
05 2
020
Apr-0
5 20
20
Jul-0
5 20
20
Oct-0
4 20
20
Mar
-14
2021
Mill
ions
New Trades VS® 3.0
Consumer Finance Loan Originations: Credit Limits Total Origination Balances in $Millions; NSA. Average VantageScore® 3.0
Consumer Finance: Total
Source: Equifax Inc.
WEEKEND CURR YR PREV YR
Mar-01 2020 $2,221.2 $2,006.7
Mar-08 2020 $2,297.5 $2,020.2
Mar-15 2020 $2,226.2 $2,162.1
Mar-22 2020 $1,779.9 $3,061.6
Mar-29 2020 $1,323.0 $2,407.7
Apr-05 2020 $1,191.9 $2,465.1
Apr-12 2020 $1,111.1 $2,443.3
Apr-19 2020 $1,206.2 $2,410.7
Apr-26 2020 $1,327.8 $2,473.1
May-03 2020 $1,452.2 $2,523.2
May-10 2020 $1,573.0 $2,535.5
May-17 2020 $1,701.1 $2,634.9
TOTAL CONSUMER FINANCE
BALANCES ORIGINATED (MILLIONS)
WEEKEND CURR YR PREV YR
May-24 2020 $2,113.4 $2,980.9
May-31 2020 $2,038.1 $2,789.4
Jun-07 2020 $1,926.7 $2,585.9
Jun-14 2020 $2,002.1 $2,492.6
Jun-21 2020 $1,972.6 $2,723.0
Jun-28 2020 $1,960.3 $2,682.1
Jul-05 2020 $2,004.8 $2,656.5
Jul-12 2020 $1,920.3 $2,607.8
Jul-19 2020 $1,822.6 $2,522.3
Jul-26 2020 $1,840.6 $2,479.8
Aug-02 2020 $1,889.7 $2,492.8
Aug-09 2020 $1,912.3 $2,480.1
TOTAL CONSUMER FINANCE
BALANCES ORIGINATED (MILLIONS)
WEEKEND CURR YR PREV YR
Aug-16 2020 $1,948.0 $2,461.0
Aug-23 2020 $1,983.7 $2,524.6
Aug-30 2020 $2,070.9 $2,786.0
Sep-06 2020 $2,271.8 $2,575.9
Sep-13 2020 $2,066.1 $2,373.5
Sep-20 2020 $1,970.8 $2,340.2
Sep-27 2020 $1,928.7 $2,405.5
Oct-04 2020 $1,952.9 $2,388.9
Oct-11 2020 $1,953.8 $2,431.1
Oct-18 2020 $1,969.1 $2,402.0
Oct-25 2020 $1,956.7 $2,556.8
Nov-01 2020 $1,907.2 $2,384.5
TOTAL CONSUMER FINANCE
BALANCES ORIGINATED (MILLIONS)
WEEKEND CURR YR PREV YR
Nov-08 2020 $2,049.8 $2,596.4
Nov-15 2020 $2,249.4 $2,622.7
Nov-22 2020 $2,558.9 $3,071.9
Nov-29 2020 $2,536.7 $3,378.7
Dec-06 2020 $2,400.4 $2,792.9
Dec-13 2020 $2,095.9 $2,460.7
Dec-20 2020 $2,005.6 $2,401.0
Dec-27 2020 $1,448.2 $1,748.2
Jan-03 2021 $1,622.1 $1,275.3
Jan-10 2021 $1,655.3 $2,102.0
Jan-17 2021 $1,750.3 $2,116.5
Jan-24 2021 $1,744.0 $2,115.4
TOTAL CONSUMER FINANCE
BALANCES ORIGINATED (MILLIONS)
WEEKEND CURR YR PREV YR
Jan-31 2021 $1,832.9 $2,309.0
Feb-07 2021 $1,772.8 $2,074.7
Feb-14 2021 $1,849.9 $2,307.7
Feb-21 2021 $1,566.0 $2,587.8
Feb-28 2021 $1,579.8 $2,221.2
Mar-07 2021 $747.0 $2,297.5
Mar-14 2021 $562.7 $2,226.2
TOTAL CONSUMER FINANCE
BALANCES ORIGINATED (MILLIONS)

138 PROPRIETARY |
Originations through March 14, 2021 reported as of March 16, 2021
637
649
661
673
685
697
709
721
733
0
507
1,014
1,520
2,027
2,534
3,041
3,548
4,055
Jan-
06 2
019
Apr-0
7 20
19
Jul-0
7 20
19
Oct-0
6 20
19
Jan-
05 2
020
Apr-0
5 20
20
Jul-0
5 20
20
Oct-0
4 20
20
Mar
-14
2021
Mill
ions
New Trades FICO® Score 9
Consumer Finance Loan Originations: Credit Limits Total Origination Balances in $Millions; NSA. Average FICO® Score 9
Consumer Finance: Total
Source: Equifax Inc.
WEEKEND CURR YR PREV YR
Mar-01 2020 $2,221.2 $2,006.7
Mar-08 2020 $2,297.5 $2,020.2
Mar-15 2020 $2,226.2 $2,162.1
Mar-22 2020 $1,779.9 $3,061.6
Mar-29 2020 $1,323.0 $2,407.7
Apr-05 2020 $1,191.9 $2,465.1
Apr-12 2020 $1,111.1 $2,443.3
Apr-19 2020 $1,206.2 $2,410.7
Apr-26 2020 $1,327.8 $2,473.1
May-03 2020 $1,452.2 $2,523.2
May-10 2020 $1,573.0 $2,535.5
May-17 2020 $1,701.1 $2,634.9
TOTAL CONSUMER FINANCE
BALANCES ORIGINATED (MILLIONS)
WEEKEND CURR YR PREV YR
May-24 2020 $2,113.4 $2,980.9
May-31 2020 $2,038.1 $2,789.4
Jun-07 2020 $1,926.7 $2,585.9
Jun-14 2020 $2,002.1 $2,492.6
Jun-21 2020 $1,972.6 $2,723.0
Jun-28 2020 $1,960.3 $2,682.1
Jul-05 2020 $2,004.8 $2,656.5
Jul-12 2020 $1,920.3 $2,607.8
Jul-19 2020 $1,822.6 $2,522.3
Jul-26 2020 $1,840.6 $2,479.8
Aug-02 2020 $1,889.7 $2,492.8
Aug-09 2020 $1,912.3 $2,480.1
TOTAL CONSUMER FINANCE
BALANCES ORIGINATED (MILLIONS)
WEEKEND CURR YR PREV YR
Aug-16 2020 $1,948.0 $2,461.0
Aug-23 2020 $1,983.7 $2,524.6
Aug-30 2020 $2,070.9 $2,786.0
Sep-06 2020 $2,271.8 $2,575.9
Sep-13 2020 $2,066.1 $2,373.5
Sep-20 2020 $1,970.8 $2,340.2
Sep-27 2020 $1,928.7 $2,405.5
Oct-04 2020 $1,952.9 $2,388.9
Oct-11 2020 $1,953.8 $2,431.1
Oct-18 2020 $1,969.1 $2,402.0
Oct-25 2020 $1,956.7 $2,556.8
Nov-01 2020 $1,907.2 $2,384.5
TOTAL CONSUMER FINANCE
BALANCES ORIGINATED (MILLIONS)
WEEKEND CURR YR PREV YR
Nov-08 2020 $2,049.8 $2,596.4
Nov-15 2020 $2,249.4 $2,622.7
Nov-22 2020 $2,558.9 $3,071.9
Nov-29 2020 $2,536.7 $3,378.7
Dec-06 2020 $2,400.4 $2,792.9
Dec-13 2020 $2,095.9 $2,460.7
Dec-20 2020 $2,005.6 $2,401.0
Dec-27 2020 $1,448.2 $1,748.2
Jan-03 2021 $1,622.1 $1,275.3
Jan-10 2021 $1,655.3 $2,102.0
Jan-17 2021 $1,750.3 $2,116.5
Jan-24 2021 $1,744.0 $2,115.4
TOTAL CONSUMER FINANCE
BALANCES ORIGINATED (MILLIONS)
WEEKEND CURR YR PREV YR
Jan-31 2021 $1,832.9 $2,309.0
Feb-07 2021 $1,772.8 $2,074.7
Feb-14 2021 $1,849.9 $2,307.7
Feb-21 2021 $1,566.0 $2,587.8
Feb-28 2021 $1,579.8 $2,221.2
Mar-07 2021 $747.0 $2,297.5
Mar-14 2021 $562.7 $2,226.2
TOTAL CONSUMER FINANCE
BALANCES ORIGINATED (MILLIONS)
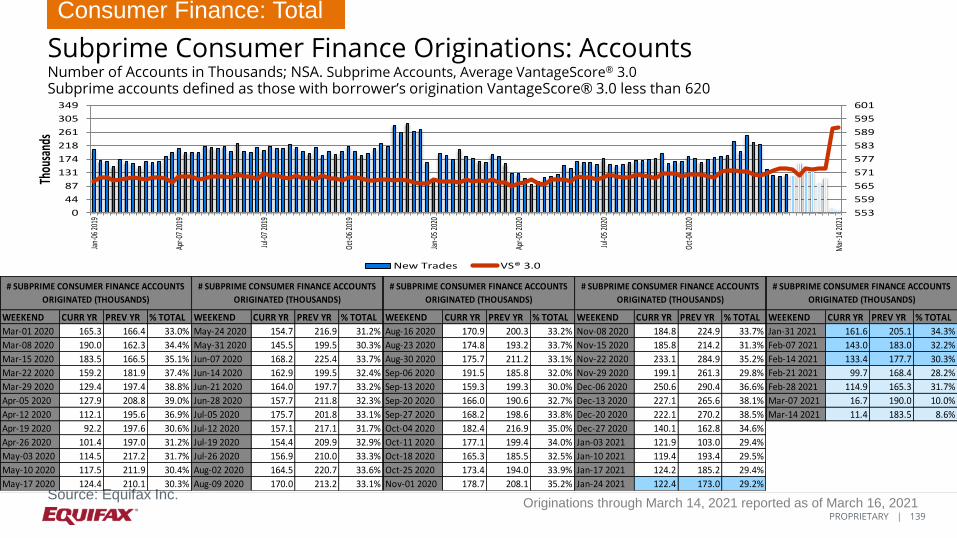
139 PROPRIETARY |
Originations through March 14, 2021 reported as of March 16, 2021
553
559
565
571
577
583
589
595
601
0
44
87
131
174
218
261
305
349Ja
n-06
201
9
Apr-0
7 20
19
Jul-0
7 20
19
Oct-0
6 20
19
Jan-
05 2
020
Apr-0
5 20
20
Jul-0
5 20
20
Oct-0
4 20
20
Mar
-14
2021
Thou
sand
s
New Trades VS® 3.0
Subprime Consumer Finance Originations: Accounts Number of Accounts in Thousands; NSA. Subprime Accounts, Average VantageScore® 3.0 Subprime accounts defined as those with borrower’s origination VantageScore® 3.0 less than 620
Consumer Finance: Total
Source: Equifax Inc.
WEEKEND CURR YR PREV YR % TOTAL
Mar-01 2020 165.3 166.4 33.0%
Mar-08 2020 190.0 162.3 34.4%
Mar-15 2020 183.5 166.5 35.1%
Mar-22 2020 159.2 181.9 37.4%
Mar-29 2020 129.4 197.4 38.8%
Apr-05 2020 127.9 208.8 39.0%
Apr-12 2020 112.1 195.6 36.9%
Apr-19 2020 92.2 197.6 30.6%
Apr-26 2020 101.4 197.0 31.2%
May-03 2020 114.5 217.2 31.7%
May-10 2020 117.5 211.9 30.4%
May-17 2020 124.4 210.1 30.3%
# SUBPRIME CONSUMER FINANCE ACCOUNTS
ORIGINATED (THOUSANDS)
WEEKEND CURR YR PREV YR % TOTAL
May-24 2020 154.7 216.9 31.2%
May-31 2020 145.5 199.5 30.3%
Jun-07 2020 168.2 225.4 33.7%
Jun-14 2020 162.9 199.5 32.4%
Jun-21 2020 164.0 197.7 33.2%
Jun-28 2020 157.7 211.8 32.3%
Jul-05 2020 175.7 201.8 33.1%
Jul-12 2020 157.1 217.1 31.7%
Jul-19 2020 154.4 209.9 32.9%
Jul-26 2020 156.9 210.0 33.3%
Aug-02 2020 164.5 220.7 33.6%
Aug-09 2020 170.0 213.2 33.1%
# SUBPRIME CONSUMER FINANCE ACCOUNTS
ORIGINATED (THOUSANDS)
WEEKEND CURR YR PREV YR % TOTAL
Aug-16 2020 170.9 200.3 33.2%
Aug-23 2020 174.8 193.2 33.7%
Aug-30 2020 175.7 211.2 33.1%
Sep-06 2020 191.5 185.8 32.0%
Sep-13 2020 159.3 199.3 30.0%
Sep-20 2020 166.0 190.6 32.7%
Sep-27 2020 168.2 198.6 33.8%
Oct-04 2020 182.4 216.9 35.0%
Oct-11 2020 177.1 199.4 34.0%
Oct-18 2020 165.3 185.5 32.5%
Oct-25 2020 173.4 194.0 33.9%
Nov-01 2020 178.7 208.1 35.2%
# SUBPRIME CONSUMER FINANCE ACCOUNTS
ORIGINATED (THOUSANDS)
WEEKEND CURR YR PREV YR % TOTAL
Nov-08 2020 184.8 224.9 33.7%
Nov-15 2020 185.8 214.2 31.3%
Nov-22 2020 233.1 284.9 35.2%
Nov-29 2020 199.1 261.3 29.8%
Dec-06 2020 250.6 290.4 36.6%
Dec-13 2020 227.1 265.6 38.1%
Dec-20 2020 222.1 270.2 38.5%
Dec-27 2020 140.1 162.8 34.6%
Jan-03 2021 121.9 103.0 29.4%
Jan-10 2021 119.4 193.4 29.5%
Jan-17 2021 124.2 185.2 29.4%
Jan-24 2021 122.4 173.0 29.2%
# SUBPRIME CONSUMER FINANCE ACCOUNTS
ORIGINATED (THOUSANDS)
WEEKEND CURR YR PREV YR % TOTAL
Jan-31 2021 161.6 205.1 34.3%
Feb-07 2021 143.0 183.0 32.2%
Feb-14 2021 133.4 177.7 30.3%
Feb-21 2021 99.7 168.4 28.2%
Feb-28 2021 114.9 165.3 31.7%
Mar-07 2021 16.7 190.0 10.0%
Mar-14 2021 11.4 183.5 8.6%
# SUBPRIME CONSUMER FINANCE ACCOUNTS
ORIGINATED (THOUSANDS)

140 PROPRIETARY |
Originations through March 14, 2021 reported as of March 16, 2021
540
547
554
561
568
575
582
589
596
0
41
82
123
164
205
246
287
328Ja
n-06
201
9
Apr-0
7 20
19
Jul-0
7 20
19
Oct-0
6 20
19
Jan-
05 2
020
Apr-0
5 20
20
Jul-0
5 20
20
Oct-0
4 20
20
Mar
-14
2021
Thou
sand
s
New Trades FICO® Score 9
Subprime Consumer Finance Originations: Accounts Number of Accounts in Thousands; NSA. Subprime Accounts, Average FICO® Score 9 Subprime accounts defined as those with borrower’s origination FICO® Score 9 less than 620
Consumer Finance: Total
Source: Equifax Inc.
WEEKEND CURR YR PREV YR % TOTAL
Mar-01 2020 147.3 149.4 29.4%
Mar-08 2020 173.1 143.8 31.3%
Mar-15 2020 165.4 146.1 31.6%
Mar-22 2020 141.7 158.7 33.3%
Mar-29 2020 115.3 174.0 34.5%
Apr-05 2020 118.2 196.0 36.1%
Apr-12 2020 103.6 180.6 34.1%
Apr-19 2020 82.0 181.6 27.2%
Apr-26 2020 89.6 179.5 27.5%
May-03 2020 103.1 203.9 28.5%
May-10 2020 106.6 197.8 27.6%
May-17 2020 111.3 194.9 27.1%
# SUBPRIME CONSUMER FINANCE ACCOUNTS
ORIGINATED (THOUSANDS)
WEEKEND CURR YR PREV YR % TOTAL
May-24 2020 137.4 199.7 27.7%
May-31 2020 128.2 185.0 26.7%
Jun-07 2020 160.6 214.9 32.1%
Jun-14 2020 154.1 188.0 30.7%
Jun-21 2020 153.3 184.1 31.0%
Jun-28 2020 146.2 197.9 29.9%
Jul-05 2020 168.4 191.4 31.7%
Jul-12 2020 150.7 203.0 30.4%
Jul-19 2020 147.5 195.0 31.4%
Jul-26 2020 148.0 194.8 31.4%
Aug-02 2020 156.3 208.2 31.9%
Aug-09 2020 163.5 200.0 31.8%
# SUBPRIME CONSUMER FINANCE ACCOUNTS
ORIGINATED (THOUSANDS)
WEEKEND CURR YR PREV YR % TOTAL
Aug-16 2020 163.0 186.8 31.7%
Aug-23 2020 164.9 178.8 31.8%
Aug-30 2020 164.7 196.8 31.1%
Sep-06 2020 185.2 174.1 30.9%
Sep-13 2020 153.5 184.4 29.0%
Sep-20 2020 159.5 175.5 31.4%
Sep-27 2020 160.9 181.9 32.3%
Oct-04 2020 175.5 205.9 33.6%
Oct-11 2020 169.6 187.0 32.5%
Oct-18 2020 156.9 172.4 30.8%
Oct-25 2020 164.4 179.2 32.2%
Nov-01 2020 169.6 195.1 33.4%
# SUBPRIME CONSUMER FINANCE ACCOUNTS
ORIGINATED (THOUSANDS)
WEEKEND CURR YR PREV YR % TOTAL
Nov-08 2020 178.3 210.1 32.6%
Nov-15 2020 177.4 198.0 29.9%
Nov-22 2020 222.3 265.1 33.6%
Nov-29 2020 186.4 241.4 27.9%
Dec-06 2020 243.1 273.3 35.5%
Dec-13 2020 220.5 248.1 37.0%
Dec-20 2020 214.6 252.2 37.2%
Dec-27 2020 134.6 150.5 33.2%
Jan-03 2021 116.8 97.7 28.2%
Jan-10 2021 112.9 181.6 27.9%
Jan-17 2021 116.1 170.9 27.5%
Jan-24 2021 113.1 159.0 26.9%
# SUBPRIME CONSUMER FINANCE ACCOUNTS
ORIGINATED (THOUSANDS)
WEEKEND CURR YR PREV YR % TOTAL
Jan-31 2021 150.8 189.3 32.0%
Feb-07 2021 134.0 166.2 30.2%
Feb-14 2021 122.8 158.6 27.9%
Feb-21 2021 89.7 148.1 25.4%
Feb-28 2021 103.8 147.3 28.6%
Mar-07 2021 14.1 173.1 8.4%
Mar-14 2021 9.3 165.4 7.0%
# SUBPRIME CONSUMER FINANCE ACCOUNTS
ORIGINATED (THOUSANDS)

141 PROPRIETARY |
Originations through March 14, 2021 reported as of March 16, 2021
553
559
565
571
577
583
589
595
601
0
114
229
343
457
572
686
800
915Ja
n-06
201
9
Apr-0
7 20
19
Jul-0
7 20
19
Oct-0
6 20
19
Jan-
05 2
020
Apr-0
5 20
20
Jul-0
5 20
20
Oct-0
4 20
20
Mar
-14
2021
Mill
ions
New Trades VS® 3.0
Subprime Consumer Fin. Originations: Credit Limits Total Balances in $Millions; NSA. Subprime Accounts, Average VantageScore® 3.0 Subprime accounts defined as those with borrower’s origination VantageScore® 3.0 less than 620
Consumer Finance: Total
Source: Equifax Inc.
WEEKEND CURR YR PREV YR % TOTAL
Mar-01 2020 $417.2 $382.7 18.8%
Mar-08 2020 $434.2 $372.1 18.9%
Mar-15 2020 $431.3 $390.5 19.4%
Mar-22 2020 $375.9 $435.8 21.1%
Mar-29 2020 $286.2 $465.0 21.6%
Apr-05 2020 $256.1 $450.4 21.5%
Apr-12 2020 $222.4 $449.1 20.0%
Apr-19 2020 $209.1 $462.1 17.3%
Apr-26 2020 $241.8 $466.5 18.2%
May-03 2020 $255.5 $481.8 17.6%
May-10 2020 $263.3 $485.1 16.7%
May-17 2020 $283.2 $526.0 16.6%
TOTAL SUBPRIME CONSUMER FINANCE
BALANCES ORIGINATED (MILLIONS)
WEEKEND CURR YR PREV YR % TOTAL
May-24 2020 $379.9 $538.1 18.0%
May-31 2020 $325.1 $468.8 15.9%
Jun-07 2020 $344.4 $510.6 17.9%
Jun-14 2020 $347.4 $472.4 17.4%
Jun-21 2020 $365.2 $485.2 18.5%
Jun-28 2020 $357.9 $509.4 18.3%
Jul-05 2020 $358.2 $447.2 17.9%
Jul-12 2020 $346.1 $514.0 18.0%
Jul-19 2020 $346.8 $504.1 19.0%
Jul-26 2020 $360.6 $501.3 19.6%
Aug-02 2020 $369.9 $505.2 19.6%
Aug-09 2020 $358.2 $496.0 18.7%
TOTAL SUBPRIME CONSUMER FINANCE
BALANCES ORIGINATED (MILLIONS)
WEEKEND CURR YR PREV YR % TOTAL
Aug-16 2020 $365.9 $468.6 18.8%
Aug-23 2020 $383.4 $465.7 19.3%
Aug-30 2020 $386.2 $490.9 18.7%
Sep-06 2020 $399.4 $404.9 17.6%
Sep-13 2020 $336.4 $455.6 16.3%
Sep-20 2020 $372.1 $450.8 18.9%
Sep-27 2020 $378.3 $468.6 19.6%
Oct-04 2020 $384.9 $466.1 19.7%
Oct-11 2020 $384.8 $449.4 19.7%
Oct-18 2020 $362.2 $433.6 18.4%
Oct-25 2020 $383.3 $455.0 19.6%
Nov-01 2020 $381.9 $461.7 20.0%
TOTAL SUBPRIME CONSUMER FINANCE
BALANCES ORIGINATED (MILLIONS)
WEEKEND CURR YR PREV YR % TOTAL
Nov-08 2020 $399.9 $507.6 19.5%
Nov-15 2020 $405.1 $494.2 18.0%
Nov-22 2020 $615.7 $762.1 24.1%
Nov-29 2020 $444.6 $579.4 17.5%
Dec-06 2020 $523.7 $606.3 21.8%
Dec-13 2020 $475.3 $565.9 22.7%
Dec-20 2020 $466.8 $577.0 23.3%
Dec-27 2020 $285.1 $339.0 19.7%
Jan-03 2021 $260.8 $197.2 16.1%
Jan-10 2021 $279.0 $428.7 16.9%
Jan-17 2021 $307.3 $430.1 17.6%
Jan-24 2021 $295.4 $398.7 16.9%
TOTAL SUBPRIME CONSUMER FINANCE
BALANCES ORIGINATED (MILLIONS)
WEEKEND CURR YR PREV YR % TOTAL
Jan-31 2021 $354.8 $466.3 19.4%
Feb-07 2021 $328.4 $409.3 18.5%
Feb-14 2021 $331.7 $411.9 17.9%
Feb-21 2021 $276.2 $405.3 17.6%
Feb-28 2021 $322.0 $417.2 20.4%
Mar-07 2021 $45.1 $434.2 6.0%
Mar-14 2021 $20.5 $431.3 3.6%
TOTAL SUBPRIME CONSUMER FINANCE
BALANCES ORIGINATED (MILLIONS)

142 PROPRIETARY |
Originations through March 14, 2021 reported as of March 16, 2021
540
547
554
561
568
575
582
589
596
0
102
204
307
409
511
613
715
817Ja
n-06
201
9
Apr-0
7 20
19
Jul-0
7 20
19
Oct-0
6 20
19
Jan-
05 2
020
Apr-0
5 20
20
Jul-0
5 20
20
Oct-0
4 20
20
Mar
-14
2021
Mill
ions
New Trades FICO® Score 9
Subprime Consumer Fin. Originations: Credit Limits Total Balances in $Millions; NSA. Subprime Accounts, Average FICO® Score 9 Subprime accounts defined as those with borrower’s origination FICO® Score 9 less than 620
Consumer Finance: Total
Source: Equifax Inc.
WEEKEND CURR YR PREV YR % TOTAL
Mar-01 2020 $339.5 $314.0 15.3%
Mar-08 2020 $350.9 $303.0 15.3%
Mar-15 2020 $352.4 $316.4 15.8%
Mar-22 2020 $302.4 $347.5 17.0%
Mar-29 2020 $239.0 $377.1 18.1%
Apr-05 2020 $223.1 $382.3 18.7%
Apr-12 2020 $195.6 $377.1 17.6%
Apr-19 2020 $178.0 $386.9 14.8%
Apr-26 2020 $208.1 $392.5 15.7%
May-03 2020 $221.0 $415.2 15.2%
May-10 2020 $229.0 $415.4 14.6%
May-17 2020 $244.8 $452.7 14.4%
TOTAL SUBPRIME CONSUMER FINANCE
BALANCES ORIGINATED (MILLIONS)
WEEKEND CURR YR PREV YR % TOTAL
May-24 2020 $328.4 $465.1 15.5%
May-31 2020 $274.4 $404.6 13.5%
Jun-07 2020 $315.7 $444.8 16.4%
Jun-14 2020 $315.1 $411.2 15.7%
Jun-21 2020 $329.4 $419.5 16.7%
Jun-28 2020 $319.5 $446.6 16.3%
Jul-05 2020 $328.6 $385.8 16.4%
Jul-12 2020 $316.0 $440.2 16.5%
Jul-19 2020 $316.9 $431.1 17.4%
Jul-26 2020 $330.2 $433.6 17.9%
Aug-02 2020 $339.3 $437.6 18.0%
Aug-09 2020 $327.2 $425.8 17.1%
TOTAL SUBPRIME CONSUMER FINANCE BALANCES
ORIGINATED (MILLIONS)
WEEKEND CURR YR PREV YR % TOTAL
Aug-16 2020 $334.3 $405.3 17.2%
Aug-23 2020 $347.5 $399.5 17.5%
Aug-30 2020 $349.8 $428.2 16.9%
Sep-06 2020 $365.3 $345.0 16.1%
Sep-13 2020 $307.6 $390.9 14.9%
Sep-20 2020 $339.6 $385.2 17.2%
Sep-27 2020 $350.2 $398.8 18.2%
Oct-04 2020 $352.4 $404.3 18.0%
Oct-11 2020 $347.2 $384.8 17.8%
Oct-18 2020 $326.8 $370.1 16.6%
Oct-25 2020 $347.9 $390.4 17.8%
Nov-01 2020 $348.8 $400.9 18.3%
TOTAL SUBPRIME CONSUMER FINANCE
BALANCES ORIGINATED (MILLIONS)
WEEKEND CURR YR PREV YR % TOTAL
Nov-08 2020 $364.7 $436.0 17.8%
Nov-15 2020 $367.0 $425.0 16.3%
Nov-22 2020 $570.5 $681.1 22.3%
Nov-29 2020 $403.1 $507.1 15.9%
Dec-06 2020 $483.8 $531.7 20.2%
Dec-13 2020 $439.8 $497.3 21.0%
Dec-20 2020 $435.1 $508.7 21.7%
Dec-27 2020 $264.0 $294.6 18.2%
Jan-03 2021 $238.3 $170.2 14.7%
Jan-10 2021 $242.3 $364.3 14.6%
Jan-17 2021 $269.1 $365.9 15.4%
Jan-24 2021 $258.3 $339.1 14.8%
TOTAL SUBPRIME CONSUMER FINANCE
BALANCES ORIGINATED (MILLIONS)
WEEKEND CURR YR PREV YR % TOTAL
Jan-31 2021 $312.6 $400.0 17.1%
Feb-07 2021 $282.2 $339.8 15.9%
Feb-14 2021 $281.8 $337.1 15.2%
Feb-21 2021 $231.9 $326.8 14.8%
Feb-28 2021 $273.4 $339.5 17.3%
Mar-07 2021 $34.7 $350.9 4.6%
Mar-14 2021 $15.0 $352.4 2.7%
TOTAL SUBPRIME CONSUMER FINANCE
BALANCES ORIGINATED (MILLIONS)

143 PROPRIETARY |
Originations through March 14, 2021 reported as of March 16, 2021
$0
$500
$1,000
$1,500
$2,000
$2,500
$3,000
$3,500
$4,000
$4,500
$5,000
Jan-
07 20
18
Apr-0
8 20
18
Jul-0
8 201
8
Oct-0
7 201
8
Jan-
06 20
19
Apr-0
7 201
9
Jul-0
7 201
9
Oct-0
6 201
9
Jan-
05 20
20
Apr-0
5 20
20
Jul-0
5 202
0
Oct-0
4 202
0
Mar
-14 2
021
Consumer Finance Origination Loan Amount Subprime Consumer Finance Origination Loan Amount
Consumer Finance Average Origination Credit Limit Average Origination Loan Credit Limit Over Time; NSA Subprime accounts defined as those with borrower’s origination VantageScore® 3.0 less than 620
Consumer Finance: Total
Source: Equifax Inc.
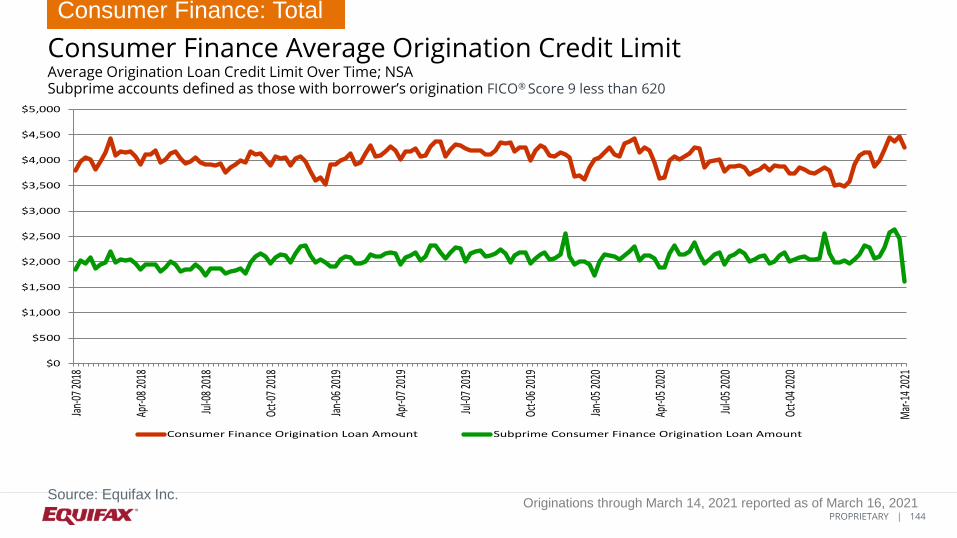
144 PROPRIETARY |
Originations through March 14, 2021 reported as of March 16, 2021
$0
$500
$1,000
$1,500
$2,000
$2,500
$3,000
$3,500
$4,000
$4,500
$5,000
Jan-
07 20
18
Apr-0
8 20
18
Jul-0
8 201
8
Oct-0
7 201
8
Jan-
06 20
19
Apr-0
7 201
9
Jul-0
7 201
9
Oct-0
6 201
9
Jan-
05 20
20
Apr-0
5 20
20
Jul-0
5 202
0
Oct-0
4 202
0
Mar
-14 2
021
Consumer Finance Origination Loan Amount Subprime Consumer Finance Origination Loan Amount
Consumer Finance Average Origination Credit Limit Average Origination Loan Credit Limit Over Time; NSA Subprime accounts defined as those with borrower’s origination FICO® Score 9 less than 620
Consumer Finance: Total
Source: Equifax Inc.

145 PROPRIETARY |
Originations through March 14, 2021 reported as of March 16, 2021
0%
4%
8%
11%
15%
19%
23%
26%
$0
$402
$804
$1,206
$1,608
$2,011
$2,413
$2,815M
ar-0
1 202
0
Mar
-08 2
020
Mar
-15 2
020
Mar
-22 2
020
Mar
-29 2
020
Apr-0
5 20
20
Apr-1
2 20
20
Apr-1
9 20
20
Apr-2
6 20
20
May
-03
2020
May
-10
2020
May
-17
2020
May
-24
2020
May
-31
2020
Jun-
07 2
020
Jun-
14 2
020
Jun-
21 2
020
Jun-
28 2
020
Jul-0
5 20
20
Jul-1
2 20
20
Jul-1
9 20
20
Jul-2
6 20
20
Aug-
02 2
020
Aug-
09 2
020
Aug-
16 2
020
Aug-
23 2
020
Aug-
30 2
020
Sep-
06 20
20
Sep-
13 20
20
Sep-
20 20
20
Sep-
27 20
20
Oct-0
4 20
20
Oct-1
1 20
20
Oct-1
8 20
20
Oct-2
5 20
20
Nov-
01 2
020
Nov-
08 2
020
Nov-
15 2
020
Nov-
22 2
020
Nov-
29 2
020
Dec-0
6 20
20
Dec-1
3 20
20
Dec-2
0 20
20
Dec-2
7 20
20
Jan-
03 2
021
Jan-
10 2
021
Jan-
17 2
021
Jan-
24 2
021
Jan-
31 2
021
Feb-
07 20
21
Feb-
14 20
21
Feb-
21 20
21
Feb-
28 20
21
Mar
-07 2
021
Mar
-14 2
021
Subp
rime S
hare
Milli
ons
Consumer Finance Origination Consumer Finance Origination Subprime Share
Consumer Finance Origination Credit Limits Total Balances in $Millions; Subprime Share of Total Origination Credit Limits (%); NSA Subprime accounts defined as those with borrower’s origination VantageScore® 3.0 less than 620
Consumer Finance: Total
Source: Equifax Inc.

146 PROPRIETARY |
Originations through March 14, 2021 reported as of March 16, 2021
0%
4%
7%
11%
14%
18%
21%
25%
$0
$402
$804
$1,206
$1,608
$2,011
$2,413
$2,815M
ar-0
1 202
0
Mar
-08 2
020
Mar
-15 2
020
Mar
-22 2
020
Mar
-29 2
020
Apr-0
5 20
20
Apr-1
2 20
20
Apr-1
9 20
20
Apr-2
6 20
20
May
-03
2020
May
-10
2020
May
-17
2020
May
-24
2020
May
-31
2020
Jun-
07 2
020
Jun-
14 2
020
Jun-
21 2
020
Jun-
28 2
020
Jul-0
5 20
20
Jul-1
2 20
20
Jul-1
9 20
20
Jul-2
6 20
20
Aug-
02 2
020
Aug-
09 2
020
Aug-
16 2
020
Aug-
23 2
020
Aug-
30 2
020
Sep-
06 20
20
Sep-
13 20
20
Sep-
20 20
20
Sep-
27 20
20
Oct-0
4 20
20
Oct-1
1 20
20
Oct-1
8 20
20
Oct-2
5 20
20
Nov-
01 2
020
Nov-
08 2
020
Nov-
15 2
020
Nov-
22 2
020
Nov-
29 2
020
Dec-0
6 20
20
Dec-1
3 20
20
Dec-2
0 20
20
Dec-2
7 20
20
Jan-
03 2
021
Jan-
10 2
021
Jan-
17 2
021
Jan-
24 2
021
Jan-
31 2
021
Feb-
07 20
21
Feb-
14 20
21
Feb-
21 20
21
Feb-
28 20
21
Mar
-07 2
021
Mar
-14 2
021
Subp
rime S
hare
Milli
ons
Consumer Finance Origination Consumer Finance Origination Subprime Share
Consumer Finance Origination Credit Limits Total Balances in $Millions; Subprime Share of Total Origination Credit Limits (%); NSA Subprime accounts defined as those with borrower’s origination FICO® Score 9 less than 620
Consumer Finance: Total
Source: Equifax Inc.

147 PROPRIETARY |
Originations through March 14, 2021 reported as of March 16, 2021
638
647
656
665
674
683
692
701
710
719
728
0%
10%
20%
30%
40%
50%
60%
70%
80%
90%
100%
Mar
-01 2
020
Mar
-08 2
020
Mar
-15 2
020
Mar
-22 2
020
Mar
-29 2
020
Apr-0
5 20
20
Apr-1
2 20
20
Apr-1
9 20
20
Apr-2
6 20
20
May
-03
2020
May
-10
2020
May
-17
2020
May
-24
2020
May
-31
2020
Jun-
07 2
020
Jun-
14 2
020
Jun-
21 2
020
Jun-
28 2
020
Jul-0
5 20
20
Jul-1
2 20
20
Jul-1
9 20
20
Jul-2
6 20
20
Aug-
02 2
020
Aug-
09 2
020
Aug-
16 2
020
Aug-
23 2
020
Aug-
30 2
020
Sep-
06 20
20
Sep-
13 20
20
Sep-
20 20
20
Sep-
27 20
20
Oct-0
4 20
20
Oct-1
1 20
20
Oct-1
8 20
20
Oct-2
5 20
20
Nov-
01 2
020
Nov-
08 2
020
Nov-
15 2
020
Nov-
22 2
020
Nov-
29 2
020
Dec-0
6 20
20
Dec-1
3 20
20
Dec-2
0 20
20
Dec-2
7 20
20
Jan-
03 2
021
Jan-
10 2
021
Jan-
17 2
021
Jan-
24 2
021
Jan-
31 2
021
Feb-
07 20
21
Feb-
14 20
21
Feb-
21 20
21
Feb-
28 20
21
Mar
-07 2
021
Mar
-14 2
021
300-539 540-579 580-619 620-659 660-699 700-739 740-779 780-850 no score Avg. VS® 3.0
Consumer Finance Loan Origination Risk VantageScore® 3.0 Distribution for Consumer Finance Loan Originations by Week (Percent of Accounts)
Consumer Finance: Total
Source: Equifax Inc.
The last 8 weeks of weekly data is subject to revision due to reporting lags by data furnishers.

148 PROPRIETARY |
Originations through March 14, 2021 reported as of March 16, 2021
640
650
660
670
680
690
700
710
720
730
740
0%
10%
20%
30%
40%
50%
60%
70%
80%
90%
100%
Mar
-01 2
020
Mar
-08 2
020
Mar
-15 2
020
Mar
-22 2
020
Mar
-29 2
020
Apr-0
5 20
20
Apr-1
2 20
20
Apr-1
9 20
20
Apr-2
6 20
20
May
-03
2020
May
-10
2020
May
-17
2020
May
-24
2020
May
-31
2020
Jun-
07 2
020
Jun-
14 2
020
Jun-
21 2
020
Jun-
28 2
020
Jul-0
5 20
20
Jul-1
2 20
20
Jul-1
9 20
20
Jul-2
6 20
20
Aug-
02 2
020
Aug-
09 2
020
Aug-
16 2
020
Aug-
23 2
020
Aug-
30 2
020
Sep-
06 20
20
Sep-
13 20
20
Sep-
20 20
20
Sep-
27 20
20
Oct-0
4 20
20
Oct-1
1 20
20
Oct-1
8 20
20
Oct-2
5 20
20
Nov-
01 2
020
Nov-
08 2
020
Nov-
15 2
020
Nov-
22 2
020
Nov-
29 2
020
Dec-0
6 20
20
Dec-1
3 20
20
Dec-2
0 20
20
Dec-2
7 20
20
Jan-
03 2
021
Jan-
10 2
021
Jan-
17 2
021
Jan-
24 2
021
Jan-
31 2
021
Feb-
07 20
21
Feb-
14 20
21
Feb-
21 20
21
Feb-
28 20
21
Mar
-07 2
021
Mar
-14 2
021
300-539 540-579 580-619 620-659 660-699 700-739 740-779 780-850 no score Avg. FICO® Score 9
Consumer Finance Loan Origination Risk FICO® Score 9 Distribution for Consumer Finance Loan Originations by Week (Percent of Accounts)
Consumer Finance: Total
Source: Equifax Inc.
The last 8 weeks of weekly data is subject to revision due to reporting lags by data furnishers.

149 PROPRIETARY |
Credit Trends Originations: Consumer Finance Installment Loans

150 PROPRIETARY |
Originations through March 14, 2021 reported as of March 16, 2021
Consumer Finance Installment Loan Originations Observations Originations through March 14, 2021 reported as of March 16, 2021
Consumer Finance: Installment
• It is important to note that for the week ending March 14th, there was low weekly volume for consumer finance installment loans. We will continue to monitor on a weekly basis.

151 PROPRIETARY |
Originations through March 14, 2021 reported as of March 16, 2021
596
602
608
614
620
626
632
638
644
0
66
131
197
263
328
394
460
525Ja
n-06
201
9
Apr-0
7 20
19
Jul-0
7 20
19
Oct-0
6 20
19
Jan-
05 2
020
Apr-0
5 20
20
Jul-0
5 20
20
Oct-0
4 20
20
Mar
-14
2021
Thou
sand
s
New Trades VS® 3.0
Consumer Finance Installment Loan Originations: Accounts Number of Accounts in Thousands; NSA. Average VantageScore® 3.0
Consumer Finance: Installment
Source: Equifax Inc.
WEEKEND CURR YR PREV YR
Mar-01 2020 246.8 257.8
Mar-08 2020 278.4 248.8
Mar-15 2020 273.7 262.2
Mar-22 2020 242.7 284.4
Mar-29 2020 188.8 305.6
Apr-05 2020 183.8 334.0
Apr-12 2020 158.7 319.1
Apr-19 2020 134.6 322.0
Apr-26 2020 149.8 318.0
May-03 2020 166.0 345.3
May-10 2020 170.2 337.0
May-17 2020 177.2 341.8
# CONSUMER FINANCE INSTALLMENT
ACCOUNTS ORIGINATED (THOUSANDS)
WEEKEND CURR YR PREV YR
May-24 2020 218.0 352.0
May-31 2020 203.1 321.2
Jun-07 2020 249.6 358.7
Jun-14 2020 245.3 326.8
Jun-21 2020 251.2 323.1
Jun-28 2020 245.7 344.9
Jul-05 2020 268.6 318.6
Jul-12 2020 244.1 347.2
Jul-19 2020 248.1 342.0
Jul-26 2020 252.9 344.4
Aug-02 2020 261.6 355.2
Aug-09 2020 270.3 340.1
# CONSUMER FINANCE INSTALLMENT
ACCOUNTS ORIGINATED (THOUSANDS)
WEEKEND CURR YR PREV YR
Aug-16 2020 264.7 319.9
Aug-23 2020 272.5 311.5
Aug-30 2020 277.8 334.3
Sep-06 2020 298.6 286.6
Sep-13 2020 247.1 309.0
Sep-20 2020 267.2 302.8
Sep-27 2020 270.2 311.9
Oct-04 2020 287.9 331.9
Oct-11 2020 275.2 306.4
Oct-18 2020 258.7 290.1
Oct-25 2020 267.1 302.0
Nov-01 2020 274.1 320.2
# CONSUMER FINANCE INSTALLMENT
ACCOUNTS ORIGINATED (THOUSANDS)
WEEKEND CURR YR PREV YR
Nov-08 2020 284.2 333.2
Nov-15 2020 282.2 324.0
Nov-22 2020 358.3 435.0
Nov-29 2020 295.2 380.0
Dec-06 2020 385.5 437.7
Dec-13 2020 350.4 396.1
Dec-20 2020 344.1 413.8
Dec-27 2020 219.7 248.4
Jan-03 2021 177.6 142.4
Jan-10 2021 175.0 284.8
Jan-17 2021 186.8 283.8
Jan-24 2021 186.2 267.0
# CONSUMER FINANCE INSTALLMENT
ACCOUNTS ORIGINATED (THOUSANDS)
WEEKEND CURR YR PREV YR
Jan-31 2021 210.2 309.9
Feb-07 2021 205.4 277.2
Feb-14 2021 193.5 267.4
Feb-21 2021 151.9 252.4
Feb-28 2021 179.2 246.8
Mar-07 2021 9.9 278.4
Mar-14 2021 * 273.7
# CONSUMER FINANCE INSTALLMENT
ACCOUNTS ORIGINATED (THOUSANDS)

152 PROPRIETARY |
Originations through March 14, 2021 reported as of March 16, 2021
582
590
598
606
614
622
630
638
646
0
66
131
197
263
328
394
460
525Ja
n-06
201
9
Apr-0
7 20
19
Jul-0
7 20
19
Oct-0
6 20
19
Jan-
05 2
020
Apr-0
5 20
20
Jul-0
5 20
20
Oct-0
4 20
20
Mar
-14
2021
Thou
sand
s
New Trades FICO® Score 9
Consumer Finance Installment Loan Originations: Accounts Number of Accounts in Thousands; NSA. Average FICO® Score 9
Consumer Finance: Installment
Source: Equifax Inc.
WEEKEND CURR YR PREV YR
Mar-01 2020 246.8 257.8
Mar-08 2020 278.4 248.8
Mar-15 2020 273.7 262.2
Mar-22 2020 242.7 284.4
Mar-29 2020 188.8 305.6
Apr-05 2020 183.8 334.0
Apr-12 2020 158.7 319.1
Apr-19 2020 134.6 322.0
Apr-26 2020 149.8 318.0
May-03 2020 166.0 345.3
May-10 2020 170.2 337.0
May-17 2020 177.2 341.8
# CONSUMER FINANCE INSTALLMENT
ACCOUNTS ORIGINATED (THOUSANDS)
WEEKEND CURR YR PREV YR
May-24 2020 218.0 352.0
May-31 2020 203.1 321.2
Jun-07 2020 249.6 358.7
Jun-14 2020 245.3 326.8
Jun-21 2020 251.2 323.1
Jun-28 2020 245.7 344.9
Jul-05 2020 268.6 318.6
Jul-12 2020 244.1 347.2
Jul-19 2020 248.1 342.0
Jul-26 2020 252.9 344.4
Aug-02 2020 261.6 355.2
Aug-09 2020 270.3 340.1
# CONSUMER FINANCE INSTALLMENT
ACCOUNTS ORIGINATED (THOUSANDS)
WEEKEND CURR YR PREV YR
Aug-16 2020 264.7 319.9
Aug-23 2020 272.5 311.5
Aug-30 2020 277.8 334.3
Sep-06 2020 298.6 286.6
Sep-13 2020 247.1 309.0
Sep-20 2020 267.2 302.8
Sep-27 2020 270.2 311.9
Oct-04 2020 287.9 331.9
Oct-11 2020 275.2 306.4
Oct-18 2020 258.7 290.1
Oct-25 2020 267.1 302.0
Nov-01 2020 274.1 320.2
# CONSUMER FINANCE INSTALLMENT
ACCOUNTS ORIGINATED (THOUSANDS)
WEEKEND CURR YR PREV YR
Nov-08 2020 284.2 333.2
Nov-15 2020 282.2 324.0
Nov-22 2020 358.3 435.0
Nov-29 2020 295.2 380.0
Dec-06 2020 385.5 437.7
Dec-13 2020 350.4 396.1
Dec-20 2020 344.1 413.8
Dec-27 2020 219.7 248.4
Jan-03 2021 177.6 142.4
Jan-10 2021 175.0 284.8
Jan-17 2021 186.8 283.8
Jan-24 2021 186.2 267.0
# CONSUMER FINANCE INSTALLMENT
ACCOUNTS ORIGINATED (THOUSANDS)
WEEKEND CURR YR PREV YR
Jan-31 2021 210.2 309.9
Feb-07 2021 205.4 277.2
Feb-14 2021 193.5 267.4
Feb-21 2021 151.9 252.4
Feb-28 2021 179.2 246.8
Mar-07 2021 9.9 278.4
Mar-14 2021 * 273.7
# CONSUMER FINANCE INSTALLMENT
ACCOUNTS ORIGINATED (THOUSANDS)
* indicates low weekly originations volume

153 PROPRIETARY |
Originations through March 14, 2021 reported as of March 16, 2021
596
602
608
614
620
626
632
638
644
0
250
500
749
999
1,249
1,499
1,749
1,999
Jan-
06 2
019
Apr-0
7 20
19
Jul-0
7 20
19
Oct-0
6 20
19
Jan-
05 2
020
Apr-0
5 20
20
Jul-0
5 20
20
Oct-0
4 20
20
Mar
-14
2021
Mill
ions
New Trades VS® 3.0
Consumer Finance Installment Loan Originations: Balances Total Origination Balances in $Millions; NSA. Average VantageScore® 3.0
Consumer Finance: Installment
Source: Equifax Inc.
WEEKEND CURR YR PREV YR
Mar-01 2020 $1,087.2 $1,012.2
Mar-08 2020 $1,124.2 $996.5
Mar-15 2020 $1,149.2 $1,059.6
Mar-22 2020 $1,002.1 $1,148.5
Mar-29 2020 $762.0 $1,216.7
Apr-05 2020 $668.3 $1,215.9
Apr-12 2020 $610.3 $1,254.4
Apr-19 2020 $598.6 $1,277.7
Apr-26 2020 $667.1 $1,264.3
May-03 2020 $694.7 $1,291.6
May-10 2020 $710.6 $1,309.9
May-17 2020 $742.9 $1,393.7
TOTAL CONSUMER FINANCE
INSTALLMENT BALANCES ORIGINATED
(MILLIONS)
WEEKEND CURR YR PREV YR
May-24 2020 $901.4 $1,424.6
May-31 2020 $796.1 $1,255.8
Jun-07 2020 $863.9 $1,370.0
Jun-14 2020 $891.5 $1,308.9
Jun-21 2020 $912.4 $1,328.6
Jun-28 2020 $907.1 $1,388.0
Jul-05 2020 $876.6 $1,172.8
Jul-12 2020 $906.2 $1,382.6
Jul-19 2020 $922.0 $1,378.5
Jul-26 2020 $941.0 $1,363.0
Aug-02 2020 $956.5 $1,355.6
Aug-09 2020 $929.6 $1,334.6
TOTAL CONSUMER FINANCE
INSTALLMENT BALANCES ORIGINATED
(MILLIONS)
WEEKEND CURR YR PREV YR
Aug-16 2020 $952.7 $1,267.4
Aug-23 2020 $987.6 $1,280.4
Aug-30 2020 $1,005.2 $1,306.0
Sep-06 2020 $1,013.0 $1,091.1
Sep-13 2020 $875.2 $1,235.2
Sep-20 2020 $1,004.7 $1,234.5
Sep-27 2020 $995.5 $1,251.0
Oct-04 2020 $997.9 $1,226.3
Oct-11 2020 $980.4 $1,211.6
Oct-18 2020 $963.2 $1,173.6
Oct-25 2020 $987.9 $1,205.9
Nov-01 2020 $969.2 $1,185.5
TOTAL CONSUMER FINANCE
INSTALLMENT BALANCES ORIGINATED
(MILLIONS)
WEEKEND CURR YR PREV YR
Nov-08 2020 $990.3 $1,259.2
Nov-15 2020 $1,017.9 $1,233.4
Nov-22 2020 $1,371.3 $1,665.5
Nov-29 2020 $1,017.8 $1,252.5
Dec-06 2020 $1,213.4 $1,390.5
Dec-13 2020 $1,154.5 $1,340.6
Dec-20 2020 $1,122.5 $1,342.2
Dec-27 2020 $731.9 $837.5
Jan-03 2021 $663.8 $465.9
Jan-10 2021 $733.2 $1,093.3
Jan-17 2021 $801.9 $1,102.5
Jan-24 2021 $785.5 $1,044.1
TOTAL CONSUMER FINANCE
INSTALLMENT BALANCES ORIGINATED
(MILLIONS)
WEEKEND CURR YR PREV YR
Jan-31 2021 $875.4 $1,175.7
Feb-07 2021 $843.6 $1,036.0
Feb-14 2021 $850.4 $1,062.2
Feb-21 2021 $699.0 $1,050.2
Feb-28 2021 $785.3 $1,087.2
Mar-07 2021 $66.2 $1,124.2
Mar-14 2021 * $1,149.2
TOTAL CONSUMER FINANCE
INSTALLMENT BALANCES ORIGINATED
(MILLIONS)
* indicates low weekly originations volume

154 PROPRIETARY |
Originations through March 14, 2021 reported as of March 16, 2021
582
590
598
606
614
622
630
638
646
0
250
500
749
999
1,249
1,499
1,749
1,999
Jan-
06 2
019
Apr-0
7 20
19
Jul-0
7 20
19
Oct-0
6 20
19
Jan-
05 2
020
Apr-0
5 20
20
Jul-0
5 20
20
Oct-0
4 20
20
Mar
-14
2021
Mill
ions
New Trades FICO® Score 9
Consumer Finance Installment Loan Originations: Balances Total Origination Balances in $Millions; NSA. Average FICO® Score 9
Consumer Finance: Installment
Source: Equifax Inc.
WEEKEND CURR YR PREV YR
Mar-01 2020 $1,087.2 $1,012.2
Mar-08 2020 $1,124.2 $996.5
Mar-15 2020 $1,149.2 $1,059.6
Mar-22 2020 $1,002.1 $1,148.5
Mar-29 2020 $762.0 $1,216.7
Apr-05 2020 $668.3 $1,215.9
Apr-12 2020 $610.3 $1,254.4
Apr-19 2020 $598.6 $1,277.7
Apr-26 2020 $667.1 $1,264.3
May-03 2020 $694.7 $1,291.6
May-10 2020 $710.6 $1,309.9
May-17 2020 $742.9 $1,393.7
TOTAL CONSUMER FINANCE
INSTALLMENT BALANCES ORIGINATED
(MILLIONS)
WEEKEND CURR YR PREV YR
May-24 2020 $901.4 $1,424.6
May-31 2020 $796.1 $1,255.8
Jun-07 2020 $863.9 $1,370.0
Jun-14 2020 $891.5 $1,308.9
Jun-21 2020 $912.4 $1,328.6
Jun-28 2020 $907.1 $1,388.0
Jul-05 2020 $876.6 $1,172.8
Jul-12 2020 $906.2 $1,382.6
Jul-19 2020 $922.0 $1,378.5
Jul-26 2020 $941.0 $1,363.0
Aug-02 2020 $956.5 $1,355.6
Aug-09 2020 $929.6 $1,334.6
TOTAL CONSUMER FINANCE
INSTALLMENT BALANCES ORIGINATED
(MILLIONS)
WEEKEND CURR YR PREV YR
Aug-16 2020 $952.7 $1,267.4
Aug-23 2020 $987.6 $1,280.4
Aug-30 2020 $1,005.2 $1,306.0
Sep-06 2020 $1,013.0 $1,091.1
Sep-13 2020 $875.2 $1,235.2
Sep-20 2020 $1,004.7 $1,234.5
Sep-27 2020 $995.5 $1,251.0
Oct-04 2020 $997.9 $1,226.3
Oct-11 2020 $980.4 $1,211.6
Oct-18 2020 $963.2 $1,173.6
Oct-25 2020 $987.9 $1,205.9
Nov-01 2020 $969.2 $1,185.5
TOTAL CONSUMER FINANCE
INSTALLMENT BALANCES ORIGINATED
(MILLIONS)
WEEKEND CURR YR PREV YR
Nov-08 2020 $990.3 $1,259.2
Nov-15 2020 $1,017.9 $1,233.4
Nov-22 2020 $1,371.3 $1,665.5
Nov-29 2020 $1,017.8 $1,252.5
Dec-06 2020 $1,213.4 $1,390.5
Dec-13 2020 $1,154.5 $1,340.6
Dec-20 2020 $1,122.5 $1,342.2
Dec-27 2020 $731.9 $837.5
Jan-03 2021 $663.8 $465.9
Jan-10 2021 $733.2 $1,093.3
Jan-17 2021 $801.9 $1,102.5
Jan-24 2021 $785.5 $1,044.1
TOTAL CONSUMER FINANCE
INSTALLMENT BALANCES ORIGINATED
(MILLIONS)
WEEKEND CURR YR PREV YR
Jan-31 2021 $875.4 $1,175.7
Feb-07 2021 $843.6 $1,036.0
Feb-14 2021 $850.4 $1,062.2
Feb-21 2021 $699.0 $1,050.2
Feb-28 2021 $785.3 $1,087.2
Mar-07 2021 $66.2 $1,124.2
Mar-14 2021 * $1,149.2
TOTAL CONSUMER FINANCE
INSTALLMENT BALANCES ORIGINATED
(MILLIONS)
* indicates low weekly originations volume
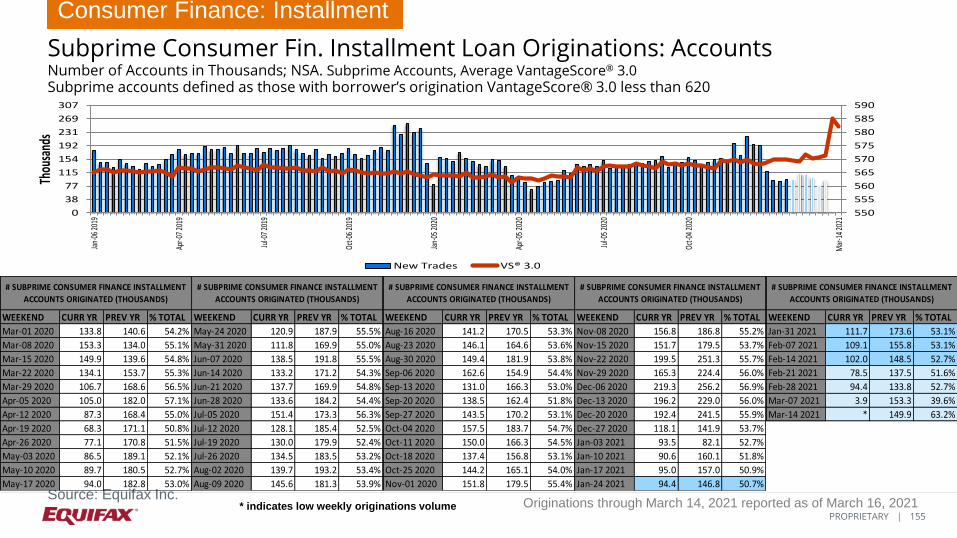
155 PROPRIETARY |
Originations through March 14, 2021 reported as of March 16, 2021
550
555
560
565
570
575
580
585
590
0
38
77
115
154
192
231
269
307Ja
n-06
201
9
Apr-0
7 20
19
Jul-0
7 20
19
Oct-0
6 20
19
Jan-
05 2
020
Apr-0
5 20
20
Jul-0
5 20
20
Oct-0
4 20
20
Mar
-14
2021
Thou
sand
s
New Trades VS® 3.0
Subprime Consumer Fin. Installment Loan Originations: Accounts Number of Accounts in Thousands; NSA. Subprime Accounts, Average VantageScore® 3.0 Subprime accounts defined as those with borrower’s origination VantageScore® 3.0 less than 620
Consumer Finance: Installment
Source: Equifax Inc.
WEEKEND CURR YR PREV YR % TOTAL
Mar-01 2020 133.8 140.6 54.2%
Mar-08 2020 153.3 134.0 55.1%
Mar-15 2020 149.9 139.6 54.8%
Mar-22 2020 134.1 153.7 55.3%
Mar-29 2020 106.7 168.6 56.5%
Apr-05 2020 105.0 182.0 57.1%
Apr-12 2020 87.3 168.4 55.0%
Apr-19 2020 68.3 171.1 50.8%
Apr-26 2020 77.1 170.8 51.5%
May-03 2020 86.5 189.1 52.1%
May-10 2020 89.7 180.5 52.7%
May-17 2020 94.0 182.8 53.0%
# SUBPRIME CONSUMER FINANCE INSTALLMENT
ACCOUNTS ORIGINATED (THOUSANDS)
WEEKEND CURR YR PREV YR % TOTAL
May-24 2020 120.9 187.9 55.5%
May-31 2020 111.8 169.9 55.0%
Jun-07 2020 138.5 191.8 55.5%
Jun-14 2020 133.2 171.2 54.3%
Jun-21 2020 137.7 169.9 54.8%
Jun-28 2020 133.6 184.2 54.4%
Jul-05 2020 151.4 173.3 56.3%
Jul-12 2020 128.1 185.4 52.5%
Jul-19 2020 130.0 179.9 52.4%
Jul-26 2020 134.5 183.5 53.2%
Aug-02 2020 139.7 193.2 53.4%
Aug-09 2020 145.6 181.3 53.9%
# SUBPRIME CONSUMER FINANCE INSTALLMENT
ACCOUNTS ORIGINATED (THOUSANDS)
WEEKEND CURR YR PREV YR % TOTAL
Aug-16 2020 141.2 170.5 53.3%
Aug-23 2020 146.1 164.6 53.6%
Aug-30 2020 149.4 181.9 53.8%
Sep-06 2020 162.6 154.9 54.4%
Sep-13 2020 131.0 166.3 53.0%
Sep-20 2020 138.5 162.4 51.8%
Sep-27 2020 143.5 170.2 53.1%
Oct-04 2020 157.5 183.7 54.7%
Oct-11 2020 150.0 166.3 54.5%
Oct-18 2020 137.4 156.8 53.1%
Oct-25 2020 144.2 165.1 54.0%
Nov-01 2020 151.8 179.5 55.4%
# SUBPRIME CONSUMER FINANCE INSTALLMENT
ACCOUNTS ORIGINATED (THOUSANDS)
WEEKEND CURR YR PREV YR % TOTAL
Nov-08 2020 156.8 186.8 55.2%
Nov-15 2020 151.7 179.5 53.7%
Nov-22 2020 199.5 251.3 55.7%
Nov-29 2020 165.3 224.4 56.0%
Dec-06 2020 219.3 256.2 56.9%
Dec-13 2020 196.2 229.0 56.0%
Dec-20 2020 192.4 241.5 55.9%
Dec-27 2020 118.1 141.9 53.7%
Jan-03 2021 93.5 82.1 52.7%
Jan-10 2021 90.6 160.1 51.8%
Jan-17 2021 95.0 157.0 50.9%
Jan-24 2021 94.4 146.8 50.7%
# SUBPRIME CONSUMER FINANCE INSTALLMENT
ACCOUNTS ORIGINATED (THOUSANDS)
WEEKEND CURR YR PREV YR % TOTAL
Jan-31 2021 111.7 173.6 53.1%
Feb-07 2021 109.1 155.8 53.1%
Feb-14 2021 102.0 148.5 52.7%
Feb-21 2021 78.5 137.5 51.6%
Feb-28 2021 94.4 133.8 52.7%
Mar-07 2021 3.9 153.3 39.6%
Mar-14 2021 * 149.9 63.2%
# SUBPRIME CONSUMER FINANCE INSTALLMENT
ACCOUNTS ORIGINATED (THOUSANDS)
* indicates low weekly originations volume

156 PROPRIETARY |
Originations through March 14, 2021 reported as of March 16, 2021
536
543
550
557
564
571
578
585
592
0
37
73
110
146
183
219
256
293Ja
n-06
201
9
Apr-0
7 20
19
Jul-0
7 20
19
Oct-0
6 20
19
Jan-
05 2
020
Apr-0
5 20
20
Jul-0
5 20
20
Oct-0
4 20
20
Mar
-14
2021
Thou
sand
s
New Trades FICO® Score 9
Subprime Consumer Fin. Installment Loan Originations: Accounts Number of Accounts in Thousands; NSA. Subprime Accounts, Average FICO® Score 9 Subprime accounts defined as those with borrower’s origination FICO® Score 9 less than 620
Consumer Finance: Installment
Source: Equifax Inc.
WEEKEND CURR YR PREV YR % TOTAL
Mar-01 2020 122.5 131.6 49.6%
Mar-08 2020 141.7 124.2 50.9%
Mar-15 2020 138.3 128.4 50.5%
Mar-22 2020 123.7 141.0 51.0%
Mar-29 2020 99.9 155.0 52.9%
Apr-05 2020 100.0 174.0 54.4%
Apr-12 2020 83.1 159.3 52.4%
Apr-19 2020 64.4 162.1 47.8%
Apr-26 2020 72.7 161.7 48.6%
May-03 2020 82.3 180.9 49.6%
May-10 2020 84.8 171.4 49.8%
May-17 2020 88.7 174.1 50.0%
# SUBPRIME CONSUMER FINANCE INSTALLMENT
ACCOUNTS ORIGINATED (THOUSANDS)
WEEKEND CURR YR PREV YR % TOTAL
May-24 2020 114.0 179.4 52.3%
May-31 2020 105.1 162.0 51.7%
Jun-07 2020 134.4 184.0 53.8%
Jun-14 2020 128.6 164.1 52.4%
Jun-21 2020 132.5 162.2 52.8%
Jun-28 2020 128.4 177.3 52.3%
Jul-05 2020 147.6 166.3 55.0%
Jul-12 2020 123.9 175.5 50.8%
Jul-19 2020 126.2 170.7 50.8%
Jul-26 2020 129.8 174.7 51.3%
Aug-02 2020 135.5 184.9 51.8%
Aug-09 2020 141.4 171.8 52.3%
# SUBPRIME CONSUMER FINANCE INSTALLMENT
ACCOUNTS ORIGINATED (THOUSANDS)
WEEKEND CURR YR PREV YR % TOTAL
Aug-16 2020 136.3 162.0 51.5%
Aug-23 2020 140.8 156.6 51.7%
Aug-30 2020 143.7 174.2 51.7%
Sep-06 2020 158.3 147.5 53.0%
Sep-13 2020 127.2 156.7 51.5%
Sep-20 2020 134.6 153.7 50.4%
Sep-27 2020 140.1 160.8 51.8%
Oct-04 2020 153.2 175.9 53.2%
Oct-11 2020 143.8 157.9 52.3%
Oct-18 2020 131.5 148.9 50.8%
Oct-25 2020 139.2 157.3 52.1%
Nov-01 2020 146.4 172.0 53.4%
# SUBPRIME CONSUMER FINANCE INSTALLMENT
ACCOUNTS ORIGINATED (THOUSANDS)
WEEKEND CURR YR PREV YR % TOTAL
Nov-08 2020 152.0 176.6 53.5%
Nov-15 2020 145.9 169.6 51.7%
Nov-22 2020 193.0 239.6 53.9%
Nov-29 2020 159.9 214.2 54.2%
Dec-06 2020 213.7 243.8 55.4%
Dec-13 2020 190.7 216.4 54.4%
Dec-20 2020 187.3 229.2 54.4%
Dec-27 2020 115.3 135.3 52.5%
Jan-03 2021 91.3 79.0 51.4%
Jan-10 2021 86.1 151.4 49.2%
Jan-17 2021 90.1 147.7 48.2%
Jan-24 2021 89.9 139.1 48.3%
# SUBPRIME CONSUMER FINANCE INSTALLMENT
ACCOUNTS ORIGINATED (THOUSANDS)
WEEKEND CURR YR PREV YR % TOTAL
Jan-31 2021 106.4 164.7 50.6%
Feb-07 2021 102.9 145.2 50.1%
Feb-14 2021 95.5 136.9 49.4%
Feb-21 2021 73.3 126.0 48.3%
Feb-28 2021 88.2 122.5 49.2%
Mar-07 2021 3.5 141.7 34.8%
Mar-14 2021 * 138.3 68.4%
# SUBPRIME CONSUMER FINANCE INSTALLMENT
ACCOUNTS ORIGINATED (THOUSANDS)
* indicates low weekly originations volume

157 PROPRIETARY |
Originations through March 14, 2021 reported as of March 16, 2021
550
555
560
565
570
575
580
585
590
0
106
212
318
424
529
635
741
847Ja
n-06
201
9
Apr-0
7 20
19
Jul-0
7 20
19
Oct-0
6 20
19
Jan-
05 2
020
Apr-0
5 20
20
Jul-0
5 20
20
Oct-0
4 20
20
Mar
-14
2021
Mill
ions
New Trades VS® 3.0
Subprime Consumer Fin. Installment Originations: Balances Total Balances in $Millions; NSA. Subprime Accounts, Average VantageScore® 3.0 Subprime accounts defined as those with borrower’s origination VantageScore® 3.0 less than 620
Consumer Finance: Installment
Source: Equifax Inc.
WEEKEND CURR YR PREV YR % TOTAL
Mar-01 2020 $364.2 $338.8 33.5%
Mar-08 2020 $378.1 $327.6 33.6%
Mar-15 2020 $378.5 $346.2 32.9%
Mar-22 2020 $332.8 $384.8 33.2%
Mar-29 2020 $251.5 $414.3 33.0%
Apr-05 2020 $223.7 $405.8 33.5%
Apr-12 2020 $190.7 $405.5 31.2%
Apr-19 2020 $173.7 $419.1 29.0%
Apr-26 2020 $201.6 $421.4 30.2%
May-03 2020 $207.2 $436.6 29.8%
May-10 2020 $217.1 $438.9 30.6%
May-17 2020 $229.1 $481.7 30.8%
TOTAL SUBPRIME CONSUMER FINANCE
INSTALLMENT BALANCES ORIGINATED (MILLIONS)
WEEKEND CURR YR PREV YR % TOTAL
May-24 2020 $316.3 $489.4 35.1%
May-31 2020 $258.9 $417.8 32.5%
Jun-07 2020 $291.3 $461.3 33.7%
Jun-14 2020 $292.7 $425.7 32.8%
Jun-21 2020 $312.0 $436.3 34.2%
Jun-28 2020 $308.7 $459.9 34.0%
Jul-05 2020 $313.3 $398.5 35.7%
Jul-12 2020 $298.5 $463.8 32.9%
Jul-19 2020 $302.4 $455.6 32.8%
Jul-26 2020 $317.3 $454.6 33.7%
Aug-02 2020 $322.5 $456.6 33.7%
Aug-09 2020 $315.6 $446.5 33.9%
TOTAL SUBPRIME CONSUMER FINANCE
INSTALLMENT BALANCES ORIGINATED (MILLIONS)
WEEKEND CURR YR PREV YR % TOTAL
Aug-16 2020 $318.4 $418.9 33.4%
Aug-23 2020 $337.7 $415.9 34.2%
Aug-30 2020 $339.7 $438.1 33.8%
Sep-06 2020 $351.2 $354.0 34.7%
Sep-13 2020 $293.6 $406.1 33.5%
Sep-20 2020 $328.4 $403.4 32.7%
Sep-27 2020 $336.1 $419.4 33.8%
Oct-04 2020 $342.7 $415.2 34.3%
Oct-11 2020 $343.8 $398.2 35.1%
Oct-18 2020 $320.2 $383.5 33.2%
Oct-25 2020 $340.1 $404.5 34.4%
Nov-01 2020 $339.7 $413.2 35.0%
TOTAL SUBPRIME CONSUMER FINANCE
INSTALLMENT BALANCES ORIGINATED (MILLIONS)
WEEKEND CURR YR PREV YR % TOTAL
Nov-08 2020 $358.0 $452.0 36.2%
Nov-15 2020 $356.4 $438.9 35.0%
Nov-22 2020 $564.7 $705.8 41.2%
Nov-29 2020 $391.4 $515.7 38.5%
Dec-06 2020 $476.9 $551.7 39.3%
Dec-13 2020 $430.8 $514.5 37.3%
Dec-20 2020 $423.9 $531.0 37.8%
Dec-27 2020 $252.1 $304.1 34.4%
Jan-03 2021 $219.0 $165.5 33.0%
Jan-10 2021 $235.9 $380.7 32.2%
Jan-17 2021 $261.1 $383.9 32.6%
Jan-24 2021 $249.8 $352.8 31.8%
TOTAL SUBPRIME CONSUMER FINANCE
INSTALLMENT BALANCES ORIGINATED (MILLIONS)
WEEKEND CURR YR PREV YR % TOTAL
Jan-31 2021 $297.2 $414.5 34.0%
Feb-07 2021 $282.5 $365.0 33.5%
Feb-14 2021 $285.2 $361.7 33.5%
Feb-21 2021 $238.1 $350.0 34.1%
Feb-28 2021 $281.6 $364.2 35.9%
Mar-07 2021 $22.3 $378.1 33.6%
Mar-14 2021 * $378.5 38.6%
TOTAL SUBPRIME CONSUMER FINANCE
INSTALLMENT BALANCES ORIGINATED (MILLIONS)
* indicates low weekly originations volume

158 PROPRIETARY |
Originations through March 14, 2021 reported as of March 16, 2021
536
543
550
557
564
571
578
585
592
0
96
193
289
386
482
578
675
771Ja
n-06
201
9
Apr-0
7 20
19
Jul-0
7 20
19
Oct-0
6 20
19
Jan-
05 2
020
Apr-0
5 20
20
Jul-0
5 20
20
Oct-0
4 20
20
Mar
-14
2021
Mill
ions
New Trades FICO® Score 9
Subprime Consumer Fin. Installment Originations: Balances Total Balances in $Millions; NSA. Subprime Accounts, Average FICO® Score 9 Subprime accounts defined as those with borrower’s origination FICO® Score 9 less than 620
Consumer Finance: Installment
Source: Equifax Inc.
WEEKEND CURR YR PREV YR % TOTAL
Mar-01 2020 $300.5 $286.5 27.6%
Mar-08 2020 $306.2 $275.3 27.2%
Mar-15 2020 $313.3 $290.1 27.3%
Mar-22 2020 $273.8 $320.1 27.3%
Mar-29 2020 $217.8 $347.3 28.6%
Apr-05 2020 $198.9 $349.2 29.8%
Apr-12 2020 $171.8 $346.9 28.2%
Apr-19 2020 $153.3 $360.0 25.6%
Apr-26 2020 $181.3 $366.6 27.2%
May-03 2020 $185.9 $381.8 26.8%
May-10 2020 $194.3 $380.9 27.3%
May-17 2020 $206.1 $424.0 27.7%
TOTAL SUBPRIME CONSUMER FINANCE
INSTALLMENT BALANCES ORIGINATED (MILLIONS)
WEEKEND CURR YR PREV YR % TOTAL
May-24 2020 $286.6 $436.7 31.8%
May-31 2020 $230.8 $369.7 29.0%
Jun-07 2020 $270.9 $402.5 31.4%
Jun-14 2020 $271.1 $375.1 30.4%
Jun-21 2020 $289.4 $384.9 31.7%
Jun-28 2020 $285.5 $413.5 31.5%
Jul-05 2020 $292.4 $345.8 33.4%
Jul-12 2020 $275.8 $400.9 30.4%
Jul-19 2020 $280.9 $395.6 30.5%
Jul-26 2020 $296.9 $401.6 31.6%
Aug-02 2020 $301.5 $399.6 31.5%
Aug-09 2020 $291.7 $385.5 31.4%
TOTAL SUBPRIME CONSUMER FINANCE INSTALLMENT
BALANCES ORIGINATED (MILLIONS)
WEEKEND CURR YR PREV YR % TOTAL
Aug-16 2020 $295.8 $368.0 31.1%
Aug-23 2020 $313.2 $364.8 31.7%
Aug-30 2020 $315.9 $391.1 31.4%
Sep-06 2020 $323.8 $304.1 32.0%
Sep-13 2020 $271.5 $353.2 31.0%
Sep-20 2020 $303.9 $352.2 30.2%
Sep-27 2020 $317.6 $365.9 31.9%
Oct-04 2020 $317.5 $360.6 31.8%
Oct-11 2020 $311.4 $343.4 31.8%
Oct-18 2020 $292.9 $333.2 30.4%
Oct-25 2020 $314.4 $356.4 31.8%
Nov-01 2020 $316.0 $364.9 32.6%
TOTAL SUBPRIME CONSUMER FINANCE
INSTALLMENT BALANCES ORIGINATED (MILLIONS)
WEEKEND CURR YR PREV YR % TOTAL
Nov-08 2020 $328.5 $391.3 33.2%
Nov-15 2020 $327.1 $384.3 32.1%
Nov-22 2020 $530.3 $642.6 38.7%
Nov-29 2020 $366.3 $464.6 36.0%
Dec-06 2020 $443.8 $488.3 36.6%
Dec-13 2020 $400.2 $457.1 34.7%
Dec-20 2020 $399.3 $475.9 35.6%
Dec-27 2020 $237.9 $271.8 32.5%
Jan-03 2021 $204.4 $143.6 30.8%
Jan-10 2021 $205.6 $324.4 28.0%
Jan-17 2021 $231.6 $331.0 28.9%
Jan-24 2021 $223.5 $307.6 28.4%
TOTAL SUBPRIME CONSUMER FINANCE
INSTALLMENT BALANCES ORIGINATED (MILLIONS)
WEEKEND CURR YR PREV YR % TOTAL
Jan-31 2021 $267.4 $363.4 30.5%
Feb-07 2021 $244.4 $308.8 29.0%
Feb-14 2021 $245.8 $302.9 28.9%
Feb-21 2021 $205.5 $291.9 29.4%
Feb-28 2021 $244.8 $300.5 31.2%
Mar-07 2021 $17.5 $306.2 26.4%
Mar-14 2021 * $313.3 54.2%
TOTAL SUBPRIME CONSUMER FINANCE
INSTALLMENT BALANCES ORIGINATED (MILLIONS)
* indicates low weekly originations volume

159 PROPRIETARY |
Originations through March 14, 2021 reported as of March 16, 2021
$0
$1,000
$2,000
$3,000
$4,000
$5,000
$6,000
$7,000
Jan-
07 20
18
Apr-0
8 20
18
Jul-0
8 201
8
Oct-0
7 201
8
Jan-
06 20
19
Apr-0
7 201
9
Jul-0
7 201
9
Oct-0
6 201
9
Jan-
05 20
20
Apr-0
5 20
20
Jul-0
5 202
0
Oct-0
4 202
0
Mar
-14 2
021
Consumer Finance Installment Origination Loan Amount Subprime Consumer Finance Installment Origination Loan Amount
CF Installment Loan Average Origination Balance Average Origination Balance Over Time; NSA Subprime accounts defined as those with borrower’s origination VantageScore® 3.0 less than 620
Consumer Finance: Installment
Source: Equifax Inc.

160 PROPRIETARY |
Originations through March 14, 2021 reported as of March 16, 2021
$0
$1,000
$2,000
$3,000
$4,000
$5,000
$6,000
$7,000
Jan-
07 20
18
Apr-0
8 20
18
Jul-0
8 201
8
Oct-0
7 201
8
Jan-
06 20
19
Apr-0
7 201
9
Jul-0
7 201
9
Oct-0
6 201
9
Jan-
05 20
20
Apr-0
5 20
20
Jul-0
5 202
0
Oct-0
4 202
0
Mar
-14 2
021
Consumer Finance Installment Origination Loan Amount Subprime Consumer Finance Installment Origination Loan Amount
CF Installment Loan Average Origination Balance Average Origination Balance Over Time; NSA Subprime accounts defined as those with borrower’s origination FICO® Score 9 less than 620
Consumer Finance: Installment
Source: Equifax Inc.

161 PROPRIETARY |
Originations through March 14, 2021 reported as of March 16, 2021
0%
6%
13%
19%
26%
32%
39%
45%
$0
$215
$431
$646
$862
$1,077
$1,293
$1,508M
ar-0
1 202
0
Mar
-08 2
020
Mar
-15 2
020
Mar
-22 2
020
Mar
-29 2
020
Apr-0
5 20
20
Apr-1
2 20
20
Apr-1
9 20
20
Apr-2
6 20
20
May
-03
2020
May
-10
2020
May
-17
2020
May
-24
2020
May
-31
2020
Jun-
07 2
020
Jun-
14 2
020
Jun-
21 2
020
Jun-
28 2
020
Jul-0
5 20
20
Jul-1
2 20
20
Jul-1
9 20
20
Jul-2
6 20
20
Aug-
02 2
020
Aug-
09 2
020
Aug-
16 2
020
Aug-
23 2
020
Aug-
30 2
020
Sep-
06 20
20
Sep-
13 20
20
Sep-
20 20
20
Sep-
27 20
20
Oct-0
4 20
20
Oct-1
1 20
20
Oct-1
8 20
20
Oct-2
5 20
20
Nov-
01 2
020
Nov-
08 2
020
Nov-
15 2
020
Nov-
22 2
020
Nov-
29 2
020
Dec-0
6 20
20
Dec-1
3 20
20
Dec-2
0 20
20
Dec-2
7 20
20
Jan-
03 2
021
Jan-
10 2
021
Jan-
17 2
021
Jan-
24 2
021
Jan-
31 2
021
Feb-
07 20
21
Feb-
14 20
21
Feb-
21 20
21
Feb-
28 20
21
Mar
-07 2
021
Mar
-14 2
021
Subp
rime S
hare
Milli
ons
Consumer Finance Installment Origination Consumer Finance Installment Origination Subprime Share
Consumer Finance Installment Origination Balances Total Balances in $Millions; Subprime Share of Total Origination Balances (%); NSA Subprime accounts defined as those with borrower’s origination VantageScore® 3.0 less than 620
Consumer Finance: Installment
Source: Equifax Inc.

162 PROPRIETARY |
Originations through March 14, 2021 reported as of March 16, 2021
0%
9%
17%
26%
34%
43%
51%
60%
$0
$215
$431
$646
$862
$1,077
$1,293
$1,508M
ar-0
1 202
0
Mar
-08 2
020
Mar
-15 2
020
Mar
-22 2
020
Mar
-29 2
020
Apr-0
5 20
20
Apr-1
2 20
20
Apr-1
9 20
20
Apr-2
6 20
20
May
-03
2020
May
-10
2020
May
-17
2020
May
-24
2020
May
-31
2020
Jun-
07 2
020
Jun-
14 2
020
Jun-
21 2
020
Jun-
28 2
020
Jul-0
5 20
20
Jul-1
2 20
20
Jul-1
9 20
20
Jul-2
6 20
20
Aug-
02 2
020
Aug-
09 2
020
Aug-
16 2
020
Aug-
23 2
020
Aug-
30 2
020
Sep-
06 20
20
Sep-
13 20
20
Sep-
20 20
20
Sep-
27 20
20
Oct-0
4 20
20
Oct-1
1 20
20
Oct-1
8 20
20
Oct-2
5 20
20
Nov-
01 2
020
Nov-
08 2
020
Nov-
15 2
020
Nov-
22 2
020
Nov-
29 2
020
Dec-0
6 20
20
Dec-1
3 20
20
Dec-2
0 20
20
Dec-2
7 20
20
Jan-
03 2
021
Jan-
10 2
021
Jan-
17 2
021
Jan-
24 2
021
Jan-
31 2
021
Feb-
07 20
21
Feb-
14 20
21
Feb-
21 20
21
Feb-
28 20
21
Mar
-07 2
021
Mar
-14 2
021
Subp
rime S
hare
Milli
ons
Consumer Finance Installment Origination Consumer Finance Installment Origination Subprime Share
Consumer Finance Installment Origination Balances Total Balances in $Millions; Subprime Share of Total Origination Balances (%); NSA Subprime accounts defined as those with borrower’s origination FICO® Score 9 less than 620
Consumer Finance: Installment
Source: Equifax Inc.

163 PROPRIETARY |
Originations through March 14, 2021 reported as of March 16, 2021
601
605
609
613
617
621
625
629
633
637
641
0%
10%
20%
30%
40%
50%
60%
70%
80%
90%
100%
Mar
-01 2
020
Mar
-08 2
020
Mar
-15 2
020
Mar
-22 2
020
Mar
-29 2
020
Apr-0
5 20
20
Apr-1
2 20
20
Apr-1
9 20
20
Apr-2
6 20
20
May
-03
2020
May
-10
2020
May
-17
2020
May
-24
2020
May
-31
2020
Jun-
07 2
020
Jun-
14 2
020
Jun-
21 2
020
Jun-
28 2
020
Jul-0
5 20
20
Jul-1
2 20
20
Jul-1
9 20
20
Jul-2
6 20
20
Aug-
02 2
020
Aug-
09 2
020
Aug-
16 2
020
Aug-
23 2
020
Aug-
30 2
020
Sep-
06 20
20
Sep-
13 20
20
Sep-
20 20
20
Sep-
27 20
20
Oct-0
4 20
20
Oct-1
1 20
20
Oct-1
8 20
20
Oct-2
5 20
20
Nov-
01 2
020
Nov-
08 2
020
Nov-
15 2
020
Nov-
22 2
020
Nov-
29 2
020
Dec-0
6 20
20
Dec-1
3 20
20
Dec-2
0 20
20
Dec-2
7 20
20
Jan-
03 2
021
Jan-
10 2
021
Jan-
17 2
021
Jan-
24 2
021
Jan-
31 2
021
Feb-
07 20
21
Feb-
14 20
21
Feb-
21 20
21
Feb-
28 20
21
Mar
-07 2
021
Mar
-14 2
021
300-539 540-579 580-619 620-659 660-699 700-739 740-779 780-850 no score Avg. VS® 3.0
Consumer Finance Installment Loan Origination Risk VantageScore® 3.0 Distribution for Consumer Finance Loan Originations by Week (Percent of Accounts)
Consumer Finance: Installment
Source: Equifax Inc.
The last 8 weeks of weekly data is subject to revision due to reporting lags by data furnishers.

164 PROPRIETARY |
Originations through March 14, 2021 reported as of March 16, 2021
582
589
596
603
610
617
624
631
638
645
652
0%
10%
20%
30%
40%
50%
60%
70%
80%
90%
100%
Mar
-01 2
020
Mar
-08 2
020
Mar
-15 2
020
Mar
-22 2
020
Mar
-29 2
020
Apr-0
5 20
20
Apr-1
2 20
20
Apr-1
9 20
20
Apr-2
6 20
20
May
-03
2020
May
-10
2020
May
-17
2020
May
-24
2020
May
-31
2020
Jun-
07 2
020
Jun-
14 2
020
Jun-
21 2
020
Jun-
28 2
020
Jul-0
5 20
20
Jul-1
2 20
20
Jul-1
9 20
20
Jul-2
6 20
20
Aug-
02 2
020
Aug-
09 2
020
Aug-
16 2
020
Aug-
23 2
020
Aug-
30 2
020
Sep-
06 20
20
Sep-
13 20
20
Sep-
20 20
20
Sep-
27 20
20
Oct-0
4 20
20
Oct-1
1 20
20
Oct-1
8 20
20
Oct-2
5 20
20
Nov-
01 2
020
Nov-
08 2
020
Nov-
15 2
020
Nov-
22 2
020
Nov-
29 2
020
Dec-0
6 20
20
Dec-1
3 20
20
Dec-2
0 20
20
Dec-2
7 20
20
Jan-
03 2
021
Jan-
10 2
021
Jan-
17 2
021
Jan-
24 2
021
Jan-
31 2
021
Feb-
07 20
21
Feb-
14 20
21
Feb-
21 20
21
Feb-
28 20
21
Mar
-07 2
021
Mar
-14 2
021
300-539 540-579 580-619 620-659 660-699 700-739 740-779 780-850 no score Avg. FICO® Score 9
Consumer Finance Installment Loan Origination Risk FICO® Score 9 Distribution for Consumer Finance Loan Originations by Week (Percent of Accounts)
Consumer Finance: Installment
Source: Equifax Inc.
The last 8 weeks of weekly data is subject to revision due to reporting lags by data furnishers.

165 PROPRIETARY |
Credit Trends Originations: Consumer Finance Revolving Loans

166 PROPRIETARY |
Originations through March 14, 2021 reported as of March 16, 2021
Consumer Finance Revolving Loan Originations Observations Originations through March 14, 2021 reported as of March 16, 2021
Consumer Finance: Revolving
• 132,300 consumer finance (CF) revolving loans were originated in the week ending March 14th.
• The total dollar amount of CF revolving loans originated in the week ending March 14th was $562.7 million.
• Around 11,400 CF revolving loans have been issued in the week ending March 14th to consumers with a VantageScore® 3.0 credit score below 620. These are generally considered subprime accounts. These newly issued loans have a corresponding total origination amount of $20.5 million.
• In the week ending March 14th, 8.6% of all CF revolving loans were issued to consumers with a VantageScore® 3.0 subprime credit score. Origination balances on subprime CF revolving loans represent 3.6% of the total.
• Around 9,300 CF revolving loans have been issued in the week ending March 14th to consumers with a FICO®
Score 9 credit score below 620. These are generally considered subprime accounts. These newly issued loans have a corresponding total origination amount of $15.0 million.
• In the week ending March 14th, 7.0% of all CF revolving loans were issued to consumers with a FICO® Score 9 subprime credit score. Origination balances on subprime CF revolving loans represent 2.7% of the total.
• The average loan amount for all CF revolving loans originated the week ending March 14th is $4,252. The average loan amount on new subprime CF revolving loans was $1,797.

167 PROPRIETARY |
Originations through March 14, 2021 reported as of March 16, 2021
680
688
696
704
712
720
728
736
744
0
68
136
205
273
341
409
477
546Ja
n-06
201
9
Apr-0
7 20
19
Jul-0
7 20
19
Oct-0
6 20
19
Jan-
05 2
020
Apr-0
5 20
20
Jul-0
5 20
20
Oct-0
4 20
20
Mar
-14
2021
Thou
sand
s
New Trades VS® 3.0
Consumer Finance Revolving Loan Originations: Accounts Number of Accounts in Thousands; NSA. Average VantageScore® 3.0
Source: Equifax Inc.
Consumer Finance: Revolving
WEEKEND CURR YR PREV YR
Mar-01 2020 254.1 233.9
Mar-08 2020 274.5 244.8
Mar-15 2020 248.9 255.4
Mar-22 2020 182.8 433.1
Mar-29 2020 145.1 267.5
Apr-05 2020 143.9 281.3
Apr-12 2020 145.2 266.3
Apr-19 2020 166.9 256.3
Apr-26 2020 175.5 265.9
May-03 2020 195.7 274.2
May-10 2020 216.0 282.5
May-17 2020 233.8 275.2
# CONSUMER FINANCE REVOLVING
ACCOUNTS ORIGINATED (THOUSANDS)
WEEKEND CURR YR PREV YR
May-24 2020 278.0 329.4
May-31 2020 277.5 318.5
Jun-07 2020 250.1 277.1
Jun-14 2020 257.3 264.3
Jun-21 2020 242.8 308.6
Jun-28 2020 243.1 280.1
Jul-05 2020 262.6 308.8
Jul-12 2020 251.6 274.5
Jul-19 2020 221.0 259.0
Jul-26 2020 218.5 246.2
Aug-02 2020 228.1 250.3
Aug-09 2020 243.7 263.1
# CONSUMER FINANCE REVOLVING
ACCOUNTS ORIGINATED (THOUSANDS)
WEEKEND CURR YR PREV YR
Aug-16 2020 249.7 266.5
Aug-23 2020 246.5 270.0
Aug-30 2020 252.3 308.9
Sep-06 2020 299.8 306.8
Sep-13 2020 283.1 259.1
Sep-20 2020 240.2 246.4
Sep-27 2020 227.1 252.9
Oct-04 2020 234.1 265.8
Oct-11 2020 246.1 273.6
Oct-18 2020 250.7 269.9
Oct-25 2020 244.1 299.9
Nov-01 2020 233.5 262.5
# CONSUMER FINANCE REVOLVING
ACCOUNTS ORIGINATED (THOUSANDS)
WEEKEND CURR YR PREV YR
Nov-08 2020 263.4 302.7
Nov-15 2020 310.6 308.1
Nov-22 2020 303.3 310.5
Nov-29 2020 373.6 454.6
Dec-06 2020 299.0 319.5
Dec-13 2020 246.1 270.6
Dec-20 2020 232.7 248.7
Dec-27 2020 185.5 204.2
Jan-03 2021 236.5 175.8
Jan-10 2021 229.9 233.1
Jan-17 2021 235.2 226.2
Jan-24 2021 233.5 230.6
# CONSUMER FINANCE REVOLVING
ACCOUNTS ORIGINATED (THOUSANDS)
WEEKEND CURR YR PREV YR
Jan-31 2021 261.5 252.2
Feb-07 2021 238.7 231.5
Feb-14 2021 246.2 266.3
Feb-21 2021 200.9 338.8
Feb-28 2021 183.2 254.1
Mar-07 2021 157.3 274.5
Mar-14 2021 132.3 248.9
# CONSUMER FINANCE REVOLVING
ACCOUNTS ORIGINATED (THOUSANDS)

168 PROPRIETARY |
Originations through March 14, 2021 reported as of March 16, 2021
690
699
708
717
726
735
744
753
762
0
68
136
205
273
341
409
477
546Ja
n-06
201
9
Apr-0
7 20
19
Jul-0
7 20
19
Oct-0
6 20
19
Jan-
05 2
020
Apr-0
5 20
20
Jul-0
5 20
20
Oct-0
4 20
20
Mar
-14
2021
Thou
sand
s
New Trades FICO® Score 9
Consumer Finance Revolving Loan Originations: Accounts Number of Accounts in Thousands; NSA. Average FICO® Score 9
Source: Equifax Inc.
Consumer Finance: Revolving
WEEKEND CURR YR PREV YR
Mar-01 2020 254.1 233.9
Mar-08 2020 274.5 244.8
Mar-15 2020 248.9 255.4
Mar-22 2020 182.8 433.1
Mar-29 2020 145.1 267.5
Apr-05 2020 143.9 281.3
Apr-12 2020 145.2 266.3
Apr-19 2020 166.9 256.3
Apr-26 2020 175.5 265.9
May-03 2020 195.7 274.2
May-10 2020 216.0 282.5
May-17 2020 233.8 275.2
# CONSUMER FINANCE REVOLVING
ACCOUNTS ORIGINATED (THOUSANDS)
WEEKEND CURR YR PREV YR
May-24 2020 278.0 329.4
May-31 2020 277.5 318.5
Jun-07 2020 250.1 277.1
Jun-14 2020 257.3 264.3
Jun-21 2020 242.8 308.6
Jun-28 2020 243.1 280.1
Jul-05 2020 262.6 308.8
Jul-12 2020 251.6 274.5
Jul-19 2020 221.0 259.0
Jul-26 2020 218.5 246.2
Aug-02 2020 228.1 250.3
Aug-09 2020 243.7 263.1
# CONSUMER FINANCE REVOLVING
ACCOUNTS ORIGINATED (THOUSANDS)
WEEKEND CURR YR PREV YR
Aug-16 2020 249.7 266.5
Aug-23 2020 246.5 270.0
Aug-30 2020 252.3 308.9
Sep-06 2020 299.8 306.8
Sep-13 2020 283.1 259.1
Sep-20 2020 240.2 246.4
Sep-27 2020 227.1 252.9
Oct-04 2020 234.1 265.8
Oct-11 2020 246.1 273.6
Oct-18 2020 250.7 269.9
Oct-25 2020 244.1 299.9
Nov-01 2020 233.5 262.5
# CONSUMER FINANCE REVOLVING
ACCOUNTS ORIGINATED (THOUSANDS)
WEEKEND CURR YR PREV YR
Nov-08 2020 263.4 302.7
Nov-15 2020 310.6 308.1
Nov-22 2020 303.3 310.5
Nov-29 2020 373.6 454.6
Dec-06 2020 299.0 319.5
Dec-13 2020 246.1 270.6
Dec-20 2020 232.7 248.7
Dec-27 2020 185.5 204.2
Jan-03 2021 236.5 175.8
Jan-10 2021 229.9 233.1
Jan-17 2021 235.2 226.2
Jan-24 2021 233.5 230.6
# CONSUMER FINANCE REVOLVING
ACCOUNTS ORIGINATED (THOUSANDS)
WEEKEND CURR YR PREV YR
Jan-31 2021 261.5 252.2
Feb-07 2021 238.7 231.5
Feb-14 2021 246.2 266.3
Feb-21 2021 200.9 338.8
Feb-28 2021 183.2 254.1
Mar-07 2021 157.3 274.5
Mar-14 2021 132.3 248.9
# CONSUMER FINANCE REVOLVING
ACCOUNTS ORIGINATED (THOUSANDS)

169 PROPRIETARY |
Originations through March 14, 2021 reported as of March 16, 2021
680
688
696
704
712
720
728
736
744
0
319
638
957
1,276
1,595
1,914
2,233
2,552
Jan-
06 2
019
Apr-0
7 20
19
Jul-0
7 20
19
Oct-0
6 20
19
Jan-
05 2
020
Apr-0
5 20
20
Jul-0
5 20
20
Oct-0
4 20
20
Mar
-14
2021
Mill
ions
New Trades VS® 3.0
Consumer Finance Revolving Loan Originations: Limits Total Origination Credit Limits in $Millions; NSA. Average VantageScore® 3.0
Source: Equifax Inc.
Consumer Finance: Revolving
WEEKEND CURR YR PREV YR
Mar-01 2020 $1,134.0 $994.4
Mar-08 2020 $1,173.3 $1,023.7
Mar-15 2020 $1,077.0 $1,102.5
Mar-22 2020 $777.8 $1,913.1
Mar-29 2020 $560.9 $1,191.0
Apr-05 2020 $523.5 $1,249.3
Apr-12 2020 $500.9 $1,188.8
Apr-19 2020 $607.5 $1,133.0
Apr-26 2020 $660.7 $1,208.8
May-03 2020 $757.5 $1,231.6
May-10 2020 $862.4 $1,225.6
May-17 2020 $958.2 $1,241.2
TOTAL CONSUMER FINANCE
REVOLVING BALANCES ORIGINATED
(MILLIONS)
WEEKEND CURR YR PREV YR
May-24 2020 $1,212.0 $1,556.3
May-31 2020 $1,242.1 $1,533.6
Jun-07 2020 $1,062.8 $1,215.9
Jun-14 2020 $1,110.6 $1,183.7
Jun-21 2020 $1,060.1 $1,394.4
Jun-28 2020 $1,053.1 $1,294.2
Jul-05 2020 $1,128.2 $1,483.6
Jul-12 2020 $1,014.1 $1,225.2
Jul-19 2020 $900.6 $1,143.9
Jul-26 2020 $899.6 $1,116.8
Aug-02 2020 $933.2 $1,137.2
Aug-09 2020 $982.7 $1,145.4
TOTAL CONSUMER FINANCE
REVOLVING BALANCES ORIGINATED
(MILLIONS)
WEEKEND CURR YR PREV YR
Aug-16 2020 $995.3 $1,193.6
Aug-23 2020 $996.1 $1,244.3
Aug-30 2020 $1,065.6 $1,480.0
Sep-06 2020 $1,258.8 $1,484.8
Sep-13 2020 $1,190.9 $1,138.3
Sep-20 2020 $966.1 $1,105.6
Sep-27 2020 $933.2 $1,154.6
Oct-04 2020 $955.0 $1,162.6
Oct-11 2020 $973.4 $1,219.6
Oct-18 2020 $1,005.9 $1,228.3
Oct-25 2020 $968.8 $1,350.8
Nov-01 2020 $938.0 $1,199.0
TOTAL CONSUMER FINANCE
REVOLVING BALANCES ORIGINATED
(MILLIONS)
WEEKEND CURR YR PREV YR
Nov-08 2020 $1,059.6 $1,337.2
Nov-15 2020 $1,231.5 $1,389.3
Nov-22 2020 $1,187.6 $1,406.4
Nov-29 2020 $1,519.0 $2,126.3
Dec-06 2020 $1,187.0 $1,402.4
Dec-13 2020 $941.4 $1,120.1
Dec-20 2020 $883.1 $1,058.8
Dec-27 2020 $716.3 $910.7
Jan-03 2021 $958.2 $809.3
Jan-10 2021 $922.1 $1,008.7
Jan-17 2021 $948.4 $1,014.0
Jan-24 2021 $958.6 $1,071.4
TOTAL CONSUMER FINANCE
REVOLVING BALANCES ORIGINATED
(MILLIONS)
WEEKEND CURR YR PREV YR
Jan-31 2021 $957.5 $1,133.3
Feb-07 2021 $929.2 $1,038.6
Feb-14 2021 $999.5 $1,245.6
Feb-21 2021 $867.0 $1,537.6
Feb-28 2021 $794.6 $1,134.0
Mar-07 2021 $680.8 $1,173.3
Mar-14 2021 $562.7 $1,077.0
TOTAL CONSUMER FINANCE
REVOLVING BALANCES ORIGINATED
(MILLIONS)
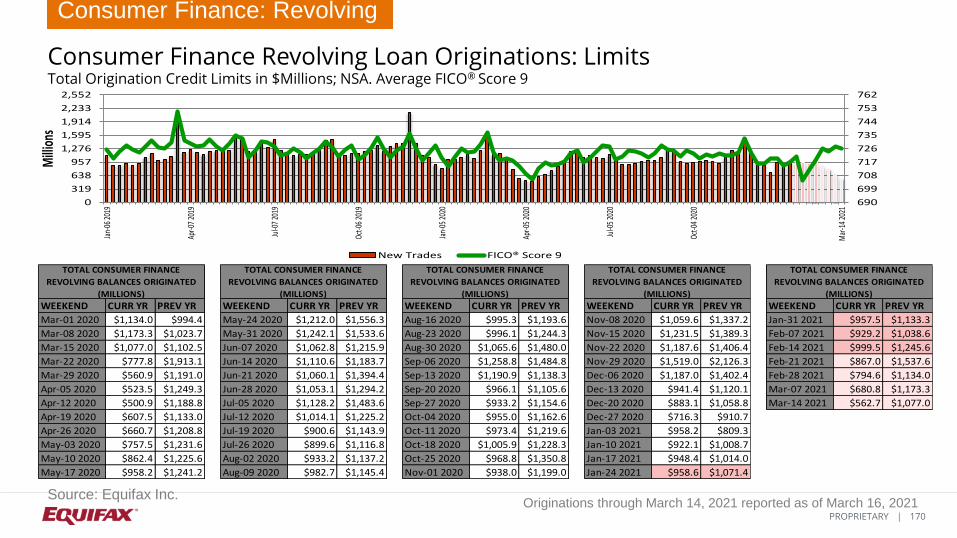
170 PROPRIETARY |
Originations through March 14, 2021 reported as of March 16, 2021
690
699
708
717
726
735
744
753
762
0
319
638
957
1,276
1,595
1,914
2,233
2,552
Jan-
06 2
019
Apr-0
7 20
19
Jul-0
7 20
19
Oct-0
6 20
19
Jan-
05 2
020
Apr-0
5 20
20
Jul-0
5 20
20
Oct-0
4 20
20
Mar
-14
2021
Mill
ions
New Trades FICO® Score 9
Consumer Finance Revolving Loan Originations: Limits Total Origination Credit Limits in $Millions; NSA. Average FICO® Score 9
Source: Equifax Inc.
Consumer Finance: Revolving
WEEKEND CURR YR PREV YR
Mar-01 2020 $1,134.0 $994.4
Mar-08 2020 $1,173.3 $1,023.7
Mar-15 2020 $1,077.0 $1,102.5
Mar-22 2020 $777.8 $1,913.1
Mar-29 2020 $560.9 $1,191.0
Apr-05 2020 $523.5 $1,249.3
Apr-12 2020 $500.9 $1,188.8
Apr-19 2020 $607.5 $1,133.0
Apr-26 2020 $660.7 $1,208.8
May-03 2020 $757.5 $1,231.6
May-10 2020 $862.4 $1,225.6
May-17 2020 $958.2 $1,241.2
TOTAL CONSUMER FINANCE
REVOLVING BALANCES ORIGINATED
(MILLIONS)
WEEKEND CURR YR PREV YR
May-24 2020 $1,212.0 $1,556.3
May-31 2020 $1,242.1 $1,533.6
Jun-07 2020 $1,062.8 $1,215.9
Jun-14 2020 $1,110.6 $1,183.7
Jun-21 2020 $1,060.1 $1,394.4
Jun-28 2020 $1,053.1 $1,294.2
Jul-05 2020 $1,128.2 $1,483.6
Jul-12 2020 $1,014.1 $1,225.2
Jul-19 2020 $900.6 $1,143.9
Jul-26 2020 $899.6 $1,116.8
Aug-02 2020 $933.2 $1,137.2
Aug-09 2020 $982.7 $1,145.4
TOTAL CONSUMER FINANCE
REVOLVING BALANCES ORIGINATED
(MILLIONS)
WEEKEND CURR YR PREV YR
Aug-16 2020 $995.3 $1,193.6
Aug-23 2020 $996.1 $1,244.3
Aug-30 2020 $1,065.6 $1,480.0
Sep-06 2020 $1,258.8 $1,484.8
Sep-13 2020 $1,190.9 $1,138.3
Sep-20 2020 $966.1 $1,105.6
Sep-27 2020 $933.2 $1,154.6
Oct-04 2020 $955.0 $1,162.6
Oct-11 2020 $973.4 $1,219.6
Oct-18 2020 $1,005.9 $1,228.3
Oct-25 2020 $968.8 $1,350.8
Nov-01 2020 $938.0 $1,199.0
TOTAL CONSUMER FINANCE
REVOLVING BALANCES ORIGINATED
(MILLIONS)
WEEKEND CURR YR PREV YR
Nov-08 2020 $1,059.6 $1,337.2
Nov-15 2020 $1,231.5 $1,389.3
Nov-22 2020 $1,187.6 $1,406.4
Nov-29 2020 $1,519.0 $2,126.3
Dec-06 2020 $1,187.0 $1,402.4
Dec-13 2020 $941.4 $1,120.1
Dec-20 2020 $883.1 $1,058.8
Dec-27 2020 $716.3 $910.7
Jan-03 2021 $958.2 $809.3
Jan-10 2021 $922.1 $1,008.7
Jan-17 2021 $948.4 $1,014.0
Jan-24 2021 $958.6 $1,071.4
TOTAL CONSUMER FINANCE
REVOLVING BALANCES ORIGINATED
(MILLIONS)
WEEKEND CURR YR PREV YR
Jan-31 2021 $957.5 $1,133.3
Feb-07 2021 $929.2 $1,038.6
Feb-14 2021 $999.5 $1,245.6
Feb-21 2021 $867.0 $1,537.6
Feb-28 2021 $794.6 $1,134.0
Mar-07 2021 $680.8 $1,173.3
Mar-14 2021 $562.7 $1,077.0
TOTAL CONSUMER FINANCE
REVOLVING BALANCES ORIGINATED
(MILLIONS)

171 PROPRIETARY |
Originations through March 14, 2021 reported as of March 16, 2021
559
564
569
574
579
584
589
594
599
0
7
15
22
30
37
45
52
60
Jan-
06 2
019
Apr-0
7 20
19
Jul-0
7 20
19
Oct-0
6 20
19
Jan-
05 2
020
Apr-0
5 20
20
Jul-0
5 20
20
Oct-0
4 20
20
Mar
-14
2021
Thou
sand
s
New Trades VS® 3.0
Subprime Consumer Finance Revolving Loan Originations: Accounts Number of Accounts in Thousands; NSA. Subprime Accounts, Average VantageScore® 3.0 Subprime accounts defined as those with borrower’s origination VantageScore® 3.0 less than 620
Source: Equifax Inc.
Consumer Finance: Revolving
WEEKEND CURR YR PREV YR % TOTAL
Mar-01 2020 31.5 25.7 12.4%
Mar-08 2020 36.7 28.3 13.4%
Mar-15 2020 33.6 26.9 13.5%
Mar-22 2020 25.1 28.1 13.7%
Mar-29 2020 22.7 28.8 15.6%
Apr-05 2020 22.9 26.7 15.9%
Apr-12 2020 24.7 27.2 17.0%
Apr-19 2020 23.8 26.6 14.3%
Apr-26 2020 24.3 26.2 13.8%
May-03 2020 28.1 28.1 14.3%
May-10 2020 27.8 31.4 12.9%
May-17 2020 30.5 27.3 13.0%
# SUBPRIME CONSUMER FINANCE REVOLVING
ACCOUNTS ORIGINATED (THOUSANDS)
WEEKEND CURR YR PREV YR % TOTAL
May-24 2020 33.8 29.1 12.2%
May-31 2020 33.7 29.6 12.2%
Jun-07 2020 29.7 33.6 11.9%
Jun-14 2020 29.7 28.3 11.5%
Jun-21 2020 26.3 27.8 10.8%
Jun-28 2020 24.1 27.7 9.9%
Jul-05 2020 24.3 28.5 9.3%
Jul-12 2020 29.0 31.7 11.5%
Jul-19 2020 24.4 30.0 11.1%
Jul-26 2020 22.5 26.5 10.3%
Aug-02 2020 24.9 27.5 10.9%
Aug-09 2020 24.4 31.9 10.0%
# SUBPRIME CONSUMER FINANCE REVOLVING
ACCOUNTS ORIGINATED (THOUSANDS)
WEEKEND CURR YR PREV YR % TOTAL
Aug-16 2020 29.7 29.8 11.9%
Aug-23 2020 28.7 28.6 11.6%
Aug-30 2020 26.3 29.3 10.4%
Sep-06 2020 28.9 30.9 9.7%
Sep-13 2020 28.3 33.0 10.0%
Sep-20 2020 27.5 28.2 11.5%
Sep-27 2020 24.7 28.3 10.9%
Oct-04 2020 25.0 33.2 10.7%
Oct-11 2020 27.1 33.1 11.0%
Oct-18 2020 27.9 28.8 11.1%
Oct-25 2020 29.2 28.9 12.0%
Nov-01 2020 26.9 28.6 11.5%
# SUBPRIME CONSUMER FINANCE REVOLVING
ACCOUNTS ORIGINATED (THOUSANDS)
WEEKEND CURR YR PREV YR % TOTAL
Nov-08 2020 27.9 38.2 10.6%
Nov-15 2020 34.2 34.6 11.0%
Nov-22 2020 33.6 33.6 11.1%
Nov-29 2020 33.8 36.9 9.0%
Dec-06 2020 31.3 34.2 10.5%
Dec-13 2020 30.9 36.6 12.6%
Dec-20 2020 29.6 28.7 12.7%
Dec-27 2020 22.0 20.9 11.9%
Jan-03 2021 28.4 20.9 12.0%
Jan-10 2021 28.7 33.3 12.5%
Jan-17 2021 29.2 28.2 12.4%
Jan-24 2021 28.0 26.1 12.0%
# SUBPRIME CONSUMER FINANCE REVOLVING
ACCOUNTS ORIGINATED (THOUSANDS)
WEEKEND CURR YR PREV YR % TOTAL
Jan-31 2021 49.8 31.5 19.1%
Feb-07 2021 34.0 27.2 14.2%
Feb-14 2021 31.4 29.1 12.8%
Feb-21 2021 21.2 30.9 10.6%
Feb-28 2021 20.6 31.5 11.2%
Mar-07 2021 12.8 36.7 8.1%
Mar-14 2021 11.4 33.6 8.6%
# SUBPRIME CONSUMER FINANCE REVOLVING
ACCOUNTS ORIGINATED (THOUSANDS)

172 PROPRIETARY |
Originations through March 14, 2021 reported as of March 16, 2021
545
552
559
566
573
580
587
594
601
0
7
13
20
27
33
40
47
53
Jan-
06 2
019
Apr-0
7 20
19
Jul-0
7 20
19
Oct-0
6 20
19
Jan-
05 2
020
Apr-0
5 20
20
Jul-0
5 20
20
Oct-0
4 20
20
Mar
-14
2021
Thou
sand
s
New Trades FICO® Score 9
Subprime Consumer Finance Revolving Loan Originations: Accounts Number of Accounts in Thousands; NSA. Subprime Accounts, Average FICO® Score 9 Subprime accounts defined as those with borrower’s origination FICO® Score 9 less than 620
Source: Equifax Inc.
Consumer Finance: Revolving
WEEKEND CURR YR PREV YR % TOTAL
Mar-01 2020 24.8 17.7 9.8%
Mar-08 2020 31.4 19.6 11.4%
Mar-15 2020 27.1 17.7 10.9%
Mar-22 2020 18.0 17.6 9.9%
Mar-29 2020 15.4 18.9 10.6%
Apr-05 2020 18.2 22.0 12.7%
Apr-12 2020 20.4 21.3 14.1%
Apr-19 2020 17.7 19.5 10.6%
Apr-26 2020 16.8 17.8 9.6%
May-03 2020 20.8 23.0 10.6%
May-10 2020 21.7 26.4 10.1%
May-17 2020 22.7 20.8 9.7%
# SUBPRIME CONSUMER FINANCE REVOLVING
ACCOUNTS ORIGINATED (THOUSANDS)
WEEKEND CURR YR PREV YR % TOTAL
May-24 2020 23.5 20.3 8.4%
May-31 2020 23.1 23.0 8.3%
Jun-07 2020 26.2 30.9 10.5%
Jun-14 2020 25.5 23.9 9.9%
Jun-21 2020 20.8 22.0 8.6%
Jun-28 2020 17.8 20.6 7.3%
Jul-05 2020 20.8 25.2 7.9%
Jul-12 2020 26.8 27.5 10.7%
Jul-19 2020 21.3 24.3 9.6%
Jul-26 2020 18.1 20.1 8.3%
Aug-02 2020 20.9 23.2 9.1%
Aug-09 2020 22.1 28.2 9.1%
# SUBPRIME CONSUMER FINANCE REVOLVING
ACCOUNTS ORIGINATED (THOUSANDS)
WEEKEND CURR YR PREV YR % TOTAL
Aug-16 2020 26.6 24.7 10.7%
Aug-23 2020 24.1 22.2 9.8%
Aug-30 2020 21.0 22.6 8.3%
Sep-06 2020 26.9 26.7 9.0%
Sep-13 2020 26.3 27.6 9.3%
Sep-20 2020 24.9 21.9 10.4%
Sep-27 2020 20.8 21.1 9.2%
Oct-04 2020 22.2 30.0 9.5%
Oct-11 2020 25.8 29.1 10.5%
Oct-18 2020 25.4 23.5 10.1%
Oct-25 2020 25.2 21.9 10.3%
Nov-01 2020 23.1 23.1 9.9%
# SUBPRIME CONSUMER FINANCE REVOLVING
ACCOUNTS ORIGINATED (THOUSANDS)
WEEKEND CURR YR PREV YR % TOTAL
Nov-08 2020 26.4 33.4 10.0%
Nov-15 2020 31.4 28.4 10.1%
Nov-22 2020 29.3 25.5 9.7%
Nov-29 2020 26.5 27.2 7.1%
Dec-06 2020 29.4 29.5 9.8%
Dec-13 2020 29.8 31.7 12.1%
Dec-20 2020 27.4 22.9 11.8%
Dec-27 2020 19.3 15.3 10.4%
Jan-03 2021 25.5 18.7 10.8%
Jan-10 2021 26.9 30.2 11.7%
Jan-17 2021 26.0 23.2 11.1%
Jan-24 2021 23.2 19.9 9.9%
# SUBPRIME CONSUMER FINANCE REVOLVING
ACCOUNTS ORIGINATED (THOUSANDS)
WEEKEND CURR YR PREV YR % TOTAL
Jan-31 2021 44.4 24.6 17.0%
Feb-07 2021 31.1 21.0 13.0%
Feb-14 2021 27.3 21.8 11.1%
Feb-21 2021 16.4 22.1 8.2%
Feb-28 2021 15.6 24.8 8.5%
Mar-07 2021 10.6 31.4 6.7%
Mar-14 2021 9.3 27.1 7.0%
# SUBPRIME CONSUMER FINANCE REVOLVING
ACCOUNTS ORIGINATED (THOUSANDS)

173 PROPRIETARY |
Originations through March 14, 2021 reported as of March 16, 2021
559
564
569
574
579
584
589
594
599
0
10
20
30
40
50
60
70
79
Jan-
06 2
019
Apr-0
7 20
19
Jul-0
7 20
19
Oct-0
6 20
19
Jan-
05 2
020
Apr-0
5 20
20
Jul-0
5 20
20
Oct-0
4 20
20
Mar
-14
2021
Mill
ions
New Trades VS® 3.0
Subprime Consumer Finance Revolving Originations: Limits Total Credit Limits in $Millions; NSA. Subprime Accounts, Average VantageScore® 3.0 Subprime accounts defined as those with borrower’s origination VantageScore® 3.0 less than 620
Source: Equifax Inc.
Consumer Finance: Revolving
WEEKEND CURR YR PREV YR % TOTAL
Mar-01 2020 $53.1 $43.9 4.7%
Mar-08 2020 $56.1 $44.5 4.8%
Mar-15 2020 $52.7 $44.3 4.9%
Mar-22 2020 $43.1 $51.0 5.5%
Mar-29 2020 $34.7 $50.7 6.2%
Apr-05 2020 $32.4 $44.6 6.2%
Apr-12 2020 $31.8 $43.6 6.3%
Apr-19 2020 $35.4 $43.0 5.8%
Apr-26 2020 $40.2 $45.1 6.1%
May-03 2020 $48.3 $45.2 6.4%
May-10 2020 $46.1 $46.1 5.4%
May-17 2020 $54.2 $44.4 5.7%
TOTAL SUBPRIME CONSUMER FINANCE
REVOLVING BALANCES ORIGINATED (MILLIONS)
WEEKEND CURR YR PREV YR % TOTAL
May-24 2020 $63.6 $48.7 5.3%
May-31 2020 $66.1 $51.0 5.3%
Jun-07 2020 $53.1 $49.4 5.0%
Jun-14 2020 $54.7 $46.6 4.9%
Jun-21 2020 $53.1 $48.9 5.0%
Jun-28 2020 $49.2 $49.5 4.7%
Jul-05 2020 $44.9 $48.6 4.0%
Jul-12 2020 $47.6 $50.2 4.7%
Jul-19 2020 $44.3 $48.5 4.9%
Jul-26 2020 $43.3 $46.7 4.8%
Aug-02 2020 $47.4 $48.6 5.1%
Aug-09 2020 $42.7 $49.5 4.3%
TOTAL SUBPRIME CONSUMER FINANCE
REVOLVING BALANCES ORIGINATED (MILLIONS)
WEEKEND CURR YR PREV YR % TOTAL
Aug-16 2020 $47.4 $49.6 4.8%
Aug-23 2020 $45.7 $49.9 4.6%
Aug-30 2020 $46.5 $52.8 4.4%
Sep-06 2020 $48.2 $50.9 3.8%
Sep-13 2020 $42.8 $49.5 3.6%
Sep-20 2020 $43.7 $47.4 4.5%
Sep-27 2020 $42.2 $49.2 4.5%
Oct-04 2020 $42.3 $50.9 4.4%
Oct-11 2020 $41.0 $51.2 4.2%
Oct-18 2020 $42.0 $50.1 4.2%
Oct-25 2020 $43.2 $50.5 4.5%
Nov-01 2020 $42.3 $48.5 4.5%
TOTAL SUBPRIME CONSUMER FINANCE
REVOLVING BALANCES ORIGINATED (MILLIONS)
WEEKEND CURR YR PREV YR % TOTAL
Nov-08 2020 $41.9 $55.6 4.0%
Nov-15 2020 $48.8 $55.2 4.0%
Nov-22 2020 $51.0 $56.3 4.3%
Nov-29 2020 $53.3 $63.7 3.5%
Dec-06 2020 $46.8 $54.6 3.9%
Dec-13 2020 $44.4 $51.4 4.7%
Dec-20 2020 $42.8 $46.1 4.8%
Dec-27 2020 $33.1 $34.9 4.6%
Jan-03 2021 $41.9 $31.6 4.4%
Jan-10 2021 $43.1 $48.0 4.7%
Jan-17 2021 $46.2 $46.2 4.9%
Jan-24 2021 $45.6 $45.9 4.8%
TOTAL SUBPRIME CONSUMER FINANCE
REVOLVING BALANCES ORIGINATED (MILLIONS)
WEEKEND CURR YR PREV YR % TOTAL
Jan-31 2021 $57.6 $51.7 6.0%
Feb-07 2021 $45.9 $44.3 4.9%
Feb-14 2021 $46.4 $50.2 4.6%
Feb-21 2021 $38.2 $55.3 4.4%
Feb-28 2021 $40.4 $53.1 5.1%
Mar-07 2021 $22.8 $56.1 3.3%
Mar-14 2021 $20.5 $52.7 3.6%
TOTAL SUBPRIME CONSUMER FINANCE
REVOLVING BALANCES ORIGINATED (MILLIONS)

174 PROPRIETARY |
Originations through March 14, 2021 reported as of March 16, 2021
545
552
559
566
573
580
587
594
601
0
7
14
20
27
34
41
48
54
Jan-
06 2
019
Apr-0
7 20
19
Jul-0
7 20
19
Oct-0
6 20
19
Jan-
05 2
020
Apr-0
5 20
20
Jul-0
5 20
20
Oct-0
4 20
20
Mar
-14
2021
Mill
ions
New Trades FICO® Score 9
Subprime Consumer Finance Revolving Originations: Limits Total Credit Limits in $Millions; NSA. Subprime Accounts, Average FICO® Score 9 Subprime accounts defined as those with borrower’s origination FICO® Score 9 less than 620
Source: Equifax Inc.
Consumer Finance: Revolving
WEEKEND CURR YR PREV YR % TOTAL
Mar-01 2020 $38.9 $27.5 3.4%
Mar-08 2020 $44.7 $27.7 3.8%
Mar-15 2020 $39.1 $26.3 3.6%
Mar-22 2020 $28.6 $27.4 3.7%
Mar-29 2020 $21.2 $29.8 3.8%
Apr-05 2020 $24.3 $33.2 4.6%
Apr-12 2020 $23.8 $30.2 4.8%
Apr-19 2020 $24.7 $26.9 4.1%
Apr-26 2020 $26.8 $25.9 4.0%
May-03 2020 $35.1 $33.4 4.6%
May-10 2020 $34.7 $34.5 4.0%
May-17 2020 $38.8 $28.7 4.0%
TOTAL SUBPRIME CONSUMER FINANCE
REVOLVING BALANCES ORIGINATED (MILLIONS)
WEEKEND CURR YR PREV YR % TOTAL
May-24 2020 $41.8 $28.4 3.4%
May-31 2020 $43.7 $34.9 3.5%
Jun-07 2020 $44.7 $42.3 4.2%
Jun-14 2020 $44.0 $36.1 4.0%
Jun-21 2020 $40.0 $34.6 3.8%
Jun-28 2020 $34.0 $33.1 3.2%
Jul-05 2020 $36.1 $40.0 3.2%
Jul-12 2020 $40.2 $39.3 4.0%
Jul-19 2020 $36.0 $35.5 4.0%
Jul-26 2020 $33.3 $31.9 3.7%
Aug-02 2020 $37.8 $38.0 4.0%
Aug-09 2020 $35.5 $40.4 3.6%
TOTAL SUBPRIME CONSUMER FINANCE REVOLVING
BALANCES ORIGINATED (MILLIONS)
WEEKEND CURR YR PREV YR % TOTAL
Aug-16 2020 $38.5 $37.3 3.9%
Aug-23 2020 $34.3 $34.7 3.4%
Aug-30 2020 $33.9 $37.2 3.2%
Sep-06 2020 $41.5 $40.9 3.3%
Sep-13 2020 $36.1 $37.7 3.0%
Sep-20 2020 $35.7 $33.0 3.7%
Sep-27 2020 $32.6 $32.8 3.5%
Oct-04 2020 $34.9 $43.7 3.7%
Oct-11 2020 $35.8 $41.4 3.7%
Oct-18 2020 $33.9 $37.0 3.4%
Oct-25 2020 $33.5 $34.0 3.5%
Nov-01 2020 $32.8 $35.9 3.5%
TOTAL SUBPRIME CONSUMER FINANCE
REVOLVING BALANCES ORIGINATED (MILLIONS)
WEEKEND CURR YR PREV YR % TOTAL
Nov-08 2020 $36.3 $44.7 3.4%
Nov-15 2020 $39.9 $40.7 3.2%
Nov-22 2020 $40.3 $38.5 3.4%
Nov-29 2020 $36.7 $42.5 2.4%
Dec-06 2020 $39.9 $43.4 3.4%
Dec-13 2020 $39.6 $40.1 4.2%
Dec-20 2020 $35.8 $32.8 4.1%
Dec-27 2020 $26.1 $22.8 3.6%
Jan-03 2021 $33.9 $26.6 3.5%
Jan-10 2021 $36.8 $39.9 4.0%
Jan-17 2021 $37.5 $34.9 4.0%
Jan-24 2021 $34.8 $31.4 3.6%
TOTAL SUBPRIME CONSUMER FINANCE
REVOLVING BALANCES ORIGINATED (MILLIONS)
WEEKEND CURR YR PREV YR % TOTAL
Jan-31 2021 $45.2 $36.6 4.7%
Feb-07 2021 $37.8 $31.0 4.1%
Feb-14 2021 $36.1 $34.2 3.6%
Feb-21 2021 $26.4 $34.9 3.0%
Feb-28 2021 $28.7 $38.9 3.6%
Mar-07 2021 $17.2 $44.7 2.5%
Mar-14 2021 $15.0 $39.1 2.7%
TOTAL SUBPRIME CONSUMER FINANCE
REVOLVING BALANCES ORIGINATED (MILLIONS)

175 PROPRIETARY |
Originations through March 14, 2021 reported as of March 16, 2021
$0
$1,000
$2,000
$3,000
$4,000
$5,000
$6,000
Jan-
07 20
18
Apr-0
8 20
18
Jul-0
8 201
8
Oct-0
7 201
8
Jan-
06 20
19
Apr-0
7 201
9
Jul-0
7 201
9
Oct-0
6 201
9
Jan-
05 20
20
Apr-0
5 20
20
Jul-0
5 202
0
Oct-0
4 202
0
Mar
-14 2
021
Consumer Finance Revolving Origination Loan Amount Subprime Consumer Finance Revolving Origination Loan Amount
CF Revolving Average Origination Credit Limit Average Origination Loan Credit Limit Over Time; NSA Subprime accounts defined as those with borrower’s origination VantageScore® 3.0 less than 620
Source: Equifax Inc.
Consumer Finance: Revolving

176 PROPRIETARY |
Originations through March 14, 2021 reported as of March 16, 2021
$0
$1,000
$2,000
$3,000
$4,000
$5,000
$6,000
Jan-
07 20
18
Apr-0
8 20
18
Jul-0
8 201
8
Oct-0
7 201
8
Jan-
06 20
19
Apr-0
7 201
9
Jul-0
7 201
9
Oct-0
6 201
9
Jan-
05 20
20
Apr-0
5 20
20
Jul-0
5 202
0
Oct-0
4 202
0
Mar
-14 2
021
Consumer Finance Revolving Origination Loan Amount Subprime Consumer Finance Revolving Origination Loan Amount
CF Revolving Average Origination Credit Limit Average Origination Loan Credit Limit Over Time; NSA Subprime accounts defined as those with borrower’s origination FICO® Score 9 less than 620
Source: Equifax Inc.
Consumer Finance: Revolving

177 PROPRIETARY |
Originations through March 14, 2021 reported as of March 16, 2021
0.0%
1.0%
2.0%
3.0%
4.0%
5.0%
6.0%
7.0%
$0
$239
$477
$716
$955
$1,193
$1,432
$1,671M
ar-0
1 202
0
Mar
-08 2
020
Mar
-15 2
020
Mar
-22 2
020
Mar
-29 2
020
Apr-0
5 20
20
Apr-1
2 20
20
Apr-1
9 20
20
Apr-2
6 20
20
May
-03
2020
May
-10
2020
May
-17
2020
May
-24
2020
May
-31
2020
Jun-
07 2
020
Jun-
14 2
020
Jun-
21 2
020
Jun-
28 2
020
Jul-0
5 20
20
Jul-1
2 20
20
Jul-1
9 20
20
Jul-2
6 20
20
Aug-
02 2
020
Aug-
09 2
020
Aug-
16 2
020
Aug-
23 2
020
Aug-
30 2
020
Sep-
06 20
20
Sep-
13 20
20
Sep-
20 20
20
Sep-
27 20
20
Oct-0
4 20
20
Oct-1
1 20
20
Oct-1
8 20
20
Oct-2
5 20
20
Nov-
01 2
020
Nov-
08 2
020
Nov-
15 2
020
Nov-
22 2
020
Nov-
29 2
020
Dec-0
6 20
20
Dec-1
3 20
20
Dec-2
0 20
20
Dec-2
7 20
20
Jan-
03 2
021
Jan-
10 2
021
Jan-
17 2
021
Jan-
24 2
021
Jan-
31 2
021
Feb-
07 20
21
Feb-
14 20
21
Feb-
21 20
21
Feb-
28 20
21
Mar
-07 2
021
Mar
-14 2
021
Subp
rime S
hare
Milli
ons
Consumer Finance Revolving Origination Consumer Finance Revolving Origination Subprime Share
Consumer Finance Revolving Origination Credit Limits Total Balances in $Millions; Subprime Share of Total Origination Credit Limits (%); NSA Subprime accounts defined as those with borrower’s origination VantageScore® 3.0 less than 620
Source: Equifax Inc.
Consumer Finance: Revolving

178 PROPRIETARY |
Originations through March 14, 2021 reported as of March 16, 2021
0.0%
0.7%
1.5%
2.2%
3.0%
3.7%
4.5%
5.2%
$0
$239
$477
$716
$955
$1,193
$1,432
$1,671M
ar-0
1 202
0
Mar
-08 2
020
Mar
-15 2
020
Mar
-22 2
020
Mar
-29 2
020
Apr-0
5 20
20
Apr-1
2 20
20
Apr-1
9 20
20
Apr-2
6 20
20
May
-03
2020
May
-10
2020
May
-17
2020
May
-24
2020
May
-31
2020
Jun-
07 2
020
Jun-
14 2
020
Jun-
21 2
020
Jun-
28 2
020
Jul-0
5 20
20
Jul-1
2 20
20
Jul-1
9 20
20
Jul-2
6 20
20
Aug-
02 2
020
Aug-
09 2
020
Aug-
16 2
020
Aug-
23 2
020
Aug-
30 2
020
Sep-
06 20
20
Sep-
13 20
20
Sep-
20 20
20
Sep-
27 20
20
Oct-0
4 20
20
Oct-1
1 20
20
Oct-1
8 20
20
Oct-2
5 20
20
Nov-
01 2
020
Nov-
08 2
020
Nov-
15 2
020
Nov-
22 2
020
Nov-
29 2
020
Dec-0
6 20
20
Dec-1
3 20
20
Dec-2
0 20
20
Dec-2
7 20
20
Jan-
03 2
021
Jan-
10 2
021
Jan-
17 2
021
Jan-
24 2
021
Jan-
31 2
021
Feb-
07 20
21
Feb-
14 20
21
Feb-
21 20
21
Feb-
28 20
21
Mar
-07 2
021
Mar
-14 2
021
Subp
rime S
hare
Milli
ons
Consumer Finance Revolving Origination Consumer Finance Revolving Origination Subprime Share
Consumer Finance Revolving Origination Credit Limits Total Balances in $Millions; Subprime Share of Total Origination Credit Limits (%); NSA Subprime accounts defined as those with borrower’s origination FICO® Score 9 less than 620
Source: Equifax Inc.
Consumer Finance: Revolving

179 PROPRIETARY |
Originations through March 14, 2021 reported as of March 16, 2021
680
685
690
695
700
705
710
715
720
725
730
0%
10%
20%
30%
40%
50%
60%
70%
80%
90%
100%
Mar
-01 2
020
Mar
-08 2
020
Mar
-15 2
020
Mar
-22 2
020
Mar
-29 2
020
Apr-0
5 20
20
Apr-1
2 20
20
Apr-1
9 20
20
Apr-2
6 20
20
May
-03
2020
May
-10
2020
May
-17
2020
May
-24
2020
May
-31
2020
Jun-
07 2
020
Jun-
14 2
020
Jun-
21 2
020
Jun-
28 2
020
Jul-0
5 20
20
Jul-1
2 20
20
Jul-1
9 20
20
Jul-2
6 20
20
Aug-
02 2
020
Aug-
09 2
020
Aug-
16 2
020
Aug-
23 2
020
Aug-
30 2
020
Sep-
06 20
20
Sep-
13 20
20
Sep-
20 20
20
Sep-
27 20
20
Oct-0
4 20
20
Oct-1
1 20
20
Oct-1
8 20
20
Oct-2
5 20
20
Nov-
01 2
020
Nov-
08 2
020
Nov-
15 2
020
Nov-
22 2
020
Nov-
29 2
020
Dec-0
6 20
20
Dec-1
3 20
20
Dec-2
0 20
20
Dec-2
7 20
20
Jan-
03 2
021
Jan-
10 2
021
Jan-
17 2
021
Jan-
24 2
021
Jan-
31 2
021
Feb-
07 20
21
Feb-
14 20
21
Feb-
21 20
21
Feb-
28 20
21
Mar
-07 2
021
Mar
-14 2
021
300-539 540-579 580-619 620-659 660-699 700-739 740-779 780-850 no score Avg. VS® 3.0
Consumer Finance Revolving Loan Origination Risk VantageScore® 3.0 Distribution for Consumer Finance Loan Originations by Week (Percent of Accounts)
Source: Equifax Inc.
Consumer Finance: Revolving
The last 8 weeks of weekly data is subject to revision due to reporting lags by data furnishers.

180 PROPRIETARY |
Originations through March 14, 2021 reported as of March 16, 2021
690
695
700
705
710
715
720
725
730
735
740
0%
10%
20%
30%
40%
50%
60%
70%
80%
90%
100%
Mar
-01 2
020
Mar
-08 2
020
Mar
-15 2
020
Mar
-22 2
020
Mar
-29 2
020
Apr-0
5 20
20
Apr-1
2 20
20
Apr-1
9 20
20
Apr-2
6 20
20
May
-03
2020
May
-10
2020
May
-17
2020
May
-24
2020
May
-31
2020
Jun-
07 2
020
Jun-
14 2
020
Jun-
21 2
020
Jun-
28 2
020
Jul-0
5 20
20
Jul-1
2 20
20
Jul-1
9 20
20
Jul-2
6 20
20
Aug-
02 2
020
Aug-
09 2
020
Aug-
16 2
020
Aug-
23 2
020
Aug-
30 2
020
Sep-
06 20
20
Sep-
13 20
20
Sep-
20 20
20
Sep-
27 20
20
Oct-0
4 20
20
Oct-1
1 20
20
Oct-1
8 20
20
Oct-2
5 20
20
Nov-
01 2
020
Nov-
08 2
020
Nov-
15 2
020
Nov-
22 2
020
Nov-
29 2
020
Dec-0
6 20
20
Dec-1
3 20
20
Dec-2
0 20
20
Dec-2
7 20
20
Jan-
03 2
021
Jan-
10 2
021
Jan-
17 2
021
Jan-
24 2
021
Jan-
31 2
021
Feb-
07 20
21
Feb-
14 20
21
Feb-
21 20
21
Feb-
28 20
21
Mar
-07 2
021
Mar
-14 2
021
300-539 540-579 580-619 620-659 660-699 700-739 740-779 780-850 no score Avg. FICO® Score 9
Consumer Finance Revolving Loan Origination Risk FICO® Score 9 Distribution for Consumer Finance Loan Originations by Week (Percent of Accounts)
Source: Equifax Inc.
Consumer Finance: Revolving
The last 8 weeks of weekly data is subject to revision due to reporting lags by data furnishers.

181 PROPRIETARY |
Credit Trends Originations: Student Loans

182 PROPRIETARY |
Originations through March 14, 2021 reported as of March 16, 2021
Student Loan Originations Observations Originations through March 14, 2021 reported as of March 16, 2021
Student Loans
• It is important to note that for the week ending March 14th, there was low weekly volume for student loan accounts. We will continue to monitor on a weekly basis.

183 PROPRIETARY |
Originations through March 14, 2021 reported as of March 16, 2021
597
613
629
645
661
677
693
709
725
0
226
452
678
904
1,130
1,356
1,582
1,808
Jan-
06 2
019
Apr-0
7 20
19
Jul-0
7 20
19
Oct-0
6 20
19
Jan-
05 2
020
Apr-0
5 20
20
Jul-0
5 20
20
Oct-0
4 20
20
Mar
-14
2021
Thou
sand
s
New Trades VS® 3.0
Student Loan Originations: Accounts Number of Accounts in Thousands; NSA. Average VantageScore® 3.0
Source: Equifax Inc.
Student Loans
WEEKEND CURR YR PREV YR
Mar-01 2020 134.7 120.9
Mar-08 2020 124.4 129.5
Mar-15 2020 113.6 110.1
Mar-22 2020 106.5 110.2
Mar-29 2020 91.3 120.6
Apr-05 2020 93.5 106.9
Apr-12 2020 90.5 123.6
Apr-19 2020 103.8 93.2
Apr-26 2020 82.3 106.8
May-03 2020 97.7 136.3
May-10 2020 122.3 163.4
May-17 2020 161.9 177.2
# STUDENT LOAN ACCOUNTS
ORIGINATED (THOUSANDS)
WEEKEND CURR YR PREV YR
May-24 2020 193.7 228.4
May-31 2020 147.5 158.6
Jun-07 2020 145.4 164.9
Jun-14 2020 143.7 151.2
Jun-21 2020 112.8 156.6
Jun-28 2020 111.7 116.5
Jul-05 2020 130.6 138.7
Jul-12 2020 142.1 163.9
Jul-19 2020 177.7 189.5
Jul-26 2020 133.7 170.1
Aug-02 2020 151.4 159.8
Aug-09 2020 354.1 390.0
# STUDENT LOAN ACCOUNTS
ORIGINATED (THOUSANDS)
WEEKEND CURR YR PREV YR
Aug-16 2020 1,061.9 1,506.9
Aug-23 2020 1,057.4 1,183.6
Aug-30 2020 937.3 1,096.8
Sep-06 2020 891.0 912.4
Sep-13 2020 617.9 835.9
Sep-20 2020 705.6 876.7
Sep-27 2020 534.8 509.3
Oct-04 2020 365.4 408.8
Oct-11 2020 281.4 319.5
Oct-18 2020 239.3 219.5
Oct-25 2020 180.0 203.5
Nov-01 2020 181.6 193.4
# STUDENT LOAN ACCOUNTS
ORIGINATED (THOUSANDS)
WEEKEND CURR YR PREV YR
Nov-08 2020 157.7 179.6
Nov-15 2020 150.1 172.4
Nov-22 2020 143.1 141.7
Nov-29 2020 80.1 82.1
Dec-06 2020 118.1 135.2
Dec-13 2020 109.6 119.5
Dec-20 2020 100.5 98.0
Dec-27 2020 53.0 74.5
Jan-03 2021 75.1 136.8
Jan-10 2021 210.8 210.4
Jan-17 2021 248.0 312.1
Jan-24 2021 233.0 232.7
# STUDENT LOAN ACCOUNTS
ORIGINATED (THOUSANDS)
WEEKEND CURR YR PREV YR
Jan-31 2021 209.7 211.0
Feb-07 2021 188.1 211.6
Feb-14 2021 174.1 183.7
Feb-21 2021 132.8 142.9
Feb-28 2021 107.9 134.7
Mar-07 2021 0.3 124.4
Mar-14 2021 * 113.6
# STUDENT LOAN ACCOUNTS
ORIGINATED (THOUSANDS)

184 PROPRIETARY |
Originations through March 14, 2021 reported as of March 16, 2021
608
624
640
656
672
688
704
720
736
0
226
452
678
904
1,130
1,356
1,582
1,808
Jan-
06 2
019
Apr-0
7 20
19
Jul-0
7 20
19
Oct-0
6 20
19
Jan-
05 2
020
Apr-0
5 20
20
Jul-0
5 20
20
Oct-0
4 20
20
Mar
-14
2021
Thou
sand
s
New Trades FICO® Score 9
Student Loan Originations: Accounts Number of Accounts in Thousands; NSA. Average FICO® Score 9
Source: Equifax Inc.
Student Loans
WEEKEND CURR YR PREV YR
Mar-01 2020 134.7 120.9
Mar-08 2020 124.4 129.5
Mar-15 2020 113.6 110.1
Mar-22 2020 106.5 110.2
Mar-29 2020 91.3 120.6
Apr-05 2020 93.5 106.9
Apr-12 2020 90.5 123.6
Apr-19 2020 103.8 93.2
Apr-26 2020 82.3 106.8
May-03 2020 97.7 136.3
May-10 2020 122.3 163.4
May-17 2020 161.9 177.2
# STUDENT LOAN ACCOUNTS
ORIGINATED (THOUSANDS)
WEEKEND CURR YR PREV YR
May-24 2020 193.7 228.4
May-31 2020 147.5 158.6
Jun-07 2020 145.4 164.9
Jun-14 2020 143.7 151.2
Jun-21 2020 112.8 156.6
Jun-28 2020 111.7 116.5
Jul-05 2020 130.6 138.7
Jul-12 2020 142.1 163.9
Jul-19 2020 177.7 189.5
Jul-26 2020 133.7 170.1
Aug-02 2020 151.4 159.8
Aug-09 2020 354.1 390.0
# STUDENT LOAN ACCOUNTS
ORIGINATED (THOUSANDS)
WEEKEND CURR YR PREV YR
Aug-16 2020 1,061.9 1,506.9
Aug-23 2020 1,057.4 1,183.6
Aug-30 2020 937.3 1,096.8
Sep-06 2020 891.0 912.4
Sep-13 2020 617.9 835.9
Sep-20 2020 705.6 876.7
Sep-27 2020 534.8 509.3
Oct-04 2020 365.4 408.8
Oct-11 2020 281.4 319.5
Oct-18 2020 239.3 219.5
Oct-25 2020 180.0 203.5
Nov-01 2020 181.6 193.4
# STUDENT LOAN ACCOUNTS
ORIGINATED (THOUSANDS)
WEEKEND CURR YR PREV YR
Nov-08 2020 157.7 179.6
Nov-15 2020 150.1 172.4
Nov-22 2020 143.1 141.7
Nov-29 2020 80.1 82.1
Dec-06 2020 118.1 135.2
Dec-13 2020 109.6 119.5
Dec-20 2020 100.5 98.0
Dec-27 2020 53.0 74.5
Jan-03 2021 75.1 136.8
Jan-10 2021 210.8 210.4
Jan-17 2021 248.0 312.1
Jan-24 2021 233.0 232.7
# STUDENT LOAN ACCOUNTS
ORIGINATED (THOUSANDS)
WEEKEND CURR YR PREV YR
Jan-31 2021 209.7 211.0
Feb-07 2021 188.1 211.6
Feb-14 2021 174.1 183.7
Feb-21 2021 132.8 142.9
Feb-28 2021 107.9 134.7
Mar-07 2021 0.3 124.4
Mar-14 2021 * 113.6
# STUDENT LOAN ACCOUNTS
ORIGINATED (THOUSANDS)
* indicates low weekly originations volume

185 PROPRIETARY |
Originations through March 14, 2021 reported as of March 16, 2021
597
613
629
645
661
677
693
709
725
0
1,152
2,304
3,457
4,609
5,761
6,913
8,065
9,218
Jan-
06 2
019
Apr-0
7 20
19
Jul-0
7 20
19
Oct-0
6 20
19
Jan-
05 2
020
Apr-0
5 20
20
Jul-0
5 20
20
Oct-0
4 20
20
Mar
-14
2021
Mill
ions
New Trades VS® 3.0
Student Loan Originations: Balances Total Origination Balances in $Millions; NSA. Average VantageScore® 3.0
Source: Equifax Inc.
Student Loans
WEEKEND CURR YR PREV YR
Mar-01 2020 $1,568.2 $1,178.4
Mar-08 2020 $1,545.1 $1,557.7
Mar-15 2020 $1,614.8 $1,555.0
Mar-22 2020 $1,673.1 $1,425.3
Mar-29 2020 $1,362.6 $1,404.0
Apr-05 2020 $1,137.4 $1,389.8
Apr-12 2020 $1,201.9 $1,420.4
Apr-19 2020 $1,103.3 $1,310.7
Apr-26 2020 $1,113.8 $1,188.0
May-03 2020 $999.1 $1,394.6
May-10 2020 $1,280.8 $1,937.3
May-17 2020 $1,369.0 $1,664.0
TOTAL STUDENT LOAN BALANCES
ORIGINATED (MILLIONS)
WEEKEND CURR YR PREV YR
May-24 2020 $1,428.7 $1,837.4
May-31 2020 $1,168.5 $1,483.9
Jun-07 2020 $1,354.4 $1,736.7
Jun-14 2020 $1,329.6 $1,648.5
Jun-21 2020 $1,233.3 $1,799.3
Jun-28 2020 $1,253.5 $1,631.5
Jul-05 2020 $1,354.7 $1,680.0
Jul-12 2020 $1,702.9 $2,141.5
Jul-19 2020 $1,633.7 $2,161.4
Jul-26 2020 $1,631.5 $2,239.8
Aug-02 2020 $1,678.6 $2,082.1
Aug-09 2020 $2,769.8 $3,241.3
TOTAL STUDENT LOAN BALANCES
ORIGINATED (MILLIONS)
WEEKEND CURR YR PREV YR
Aug-16 2020 $5,698.6 $7,681.3
Aug-23 2020 $5,621.3 $6,477.9
Aug-30 2020 $4,903.0 $5,715.9
Sep-06 2020 $4,318.1 $4,381.2
Sep-13 2020 $3,009.5 $4,113.4
Sep-20 2020 $3,221.7 $3,966.3
Sep-27 2020 $2,605.3 $2,777.7
Oct-04 2020 $1,701.1 $1,794.6
Oct-11 2020 $1,301.4 $2,739.5
Oct-18 2020 $1,757.0 $1,708.6
Oct-25 2020 $1,357.4 $1,797.0
Nov-01 2020 $1,293.5 $1,485.8
TOTAL STUDENT LOAN BALANCES
ORIGINATED (MILLIONS)
WEEKEND CURR YR PREV YR
Nov-08 2020 $1,327.3 $2,031.5
Nov-15 2020 $1,127.5 $1,594.2
Nov-22 2020 $1,265.1 $1,728.8
Nov-29 2020 $812.8 $1,096.3
Dec-06 2020 $1,138.6 $1,968.5
Dec-13 2020 $1,189.7 $1,596.6
Dec-20 2020 $1,085.6 $1,496.9
Dec-27 2020 $840.4 $1,189.9
Jan-03 2021 $1,008.7 $1,288.1
Jan-10 2021 $2,106.0 $2,224.5
Jan-17 2021 $1,928.4 $2,432.2
Jan-24 2021 $1,638.1 $1,977.8
TOTAL STUDENT LOAN BALANCES
ORIGINATED (MILLIONS)
WEEKEND CURR YR PREV YR
Jan-31 2021 $1,736.4 $1,809.8
Feb-07 2021 $1,600.0 $1,925.1
Feb-14 2021 $1,503.1 $1,829.6
Feb-21 2021 $999.4 $1,440.2
Feb-28 2021 $909.3 $1,568.2
Mar-07 2021 $2.4 $1,545.1
Mar-14 2021 * $1,614.8
TOTAL STUDENT LOAN BALANCES
ORIGINATED (MILLIONS)
* indicates low weekly originations volume

186 PROPRIETARY |
Originations through March 14, 2021 reported as of March 16, 2021
608
624
640
656
672
688
704
720
736
0
1,152
2,304
3,457
4,609
5,761
6,913
8,065
9,218
Jan-
06 2
019
Apr-0
7 20
19
Jul-0
7 20
19
Oct-0
6 20
19
Jan-
05 2
020
Apr-0
5 20
20
Jul-0
5 20
20
Oct-0
4 20
20
Mar
-14
2021
Mill
ions
New Trades FICO® Score 9
Student Loan Originations: Balances Total Origination Balances in $Millions; NSA. Average FICO® Score 9
Source: Equifax Inc.
Student Loans
WEEKEND CURR YR PREV YR
Mar-01 2020 $1,568.2 $1,178.4
Mar-08 2020 $1,545.1 $1,557.7
Mar-15 2020 $1,614.8 $1,555.0
Mar-22 2020 $1,673.1 $1,425.3
Mar-29 2020 $1,362.6 $1,404.0
Apr-05 2020 $1,137.4 $1,389.8
Apr-12 2020 $1,201.9 $1,420.4
Apr-19 2020 $1,103.3 $1,310.7
Apr-26 2020 $1,113.8 $1,188.0
May-03 2020 $999.1 $1,394.6
May-10 2020 $1,280.8 $1,937.3
May-17 2020 $1,369.0 $1,664.0
TOTAL STUDENT LOAN BALANCES
ORIGINATED (MILLIONS)
WEEKEND CURR YR PREV YR
May-24 2020 $1,428.7 $1,837.4
May-31 2020 $1,168.5 $1,483.9
Jun-07 2020 $1,354.4 $1,736.7
Jun-14 2020 $1,329.6 $1,648.5
Jun-21 2020 $1,233.3 $1,799.3
Jun-28 2020 $1,253.5 $1,631.5
Jul-05 2020 $1,354.7 $1,680.0
Jul-12 2020 $1,702.9 $2,141.5
Jul-19 2020 $1,633.7 $2,161.4
Jul-26 2020 $1,631.5 $2,239.8
Aug-02 2020 $1,678.6 $2,082.1
Aug-09 2020 $2,769.8 $3,241.3
TOTAL STUDENT LOAN BALANCES
ORIGINATED (MILLIONS)
WEEKEND CURR YR PREV YR
Aug-16 2020 $5,698.6 $7,681.3
Aug-23 2020 $5,621.3 $6,477.9
Aug-30 2020 $4,903.0 $5,715.9
Sep-06 2020 $4,318.1 $4,381.2
Sep-13 2020 $3,009.5 $4,113.4
Sep-20 2020 $3,221.7 $3,966.3
Sep-27 2020 $2,605.3 $2,777.7
Oct-04 2020 $1,701.1 $1,794.6
Oct-11 2020 $1,301.4 $2,739.5
Oct-18 2020 $1,757.0 $1,708.6
Oct-25 2020 $1,357.4 $1,797.0
Nov-01 2020 $1,293.5 $1,485.8
TOTAL STUDENT LOAN BALANCES
ORIGINATED (MILLIONS)
WEEKEND CURR YR PREV YR
Nov-08 2020 $1,327.3 $2,031.5
Nov-15 2020 $1,127.5 $1,594.2
Nov-22 2020 $1,265.1 $1,728.8
Nov-29 2020 $812.8 $1,096.3
Dec-06 2020 $1,138.6 $1,968.5
Dec-13 2020 $1,189.7 $1,596.6
Dec-20 2020 $1,085.6 $1,496.9
Dec-27 2020 $840.4 $1,189.9
Jan-03 2021 $1,008.7 $1,288.1
Jan-10 2021 $2,106.0 $2,224.5
Jan-17 2021 $1,928.4 $2,432.2
Jan-24 2021 $1,638.1 $1,977.8
TOTAL STUDENT LOAN BALANCES
ORIGINATED (MILLIONS)
WEEKEND CURR YR PREV YR
Jan-31 2021 $1,736.4 $1,809.8
Feb-07 2021 $1,600.0 $1,925.1
Feb-14 2021 $1,503.1 $1,829.6
Feb-21 2021 $999.4 $1,440.2
Feb-28 2021 $909.3 $1,568.2
Mar-07 2021 $2.4 $1,545.1
Mar-14 2021 * $1,614.8
TOTAL STUDENT LOAN BALANCES
ORIGINATED (MILLIONS)
* indicates low weekly originations volume

187 PROPRIETARY |
Originations through March 14, 2021 reported as of March 16, 2021
0
74
148
222
296
370
444
518
592
0
55
110
165
220
275
329
384
439Ja
n-06
201
9
Apr-0
7 20
19
Jul-0
7 20
19
Oct-0
6 20
19
Jan-
05 2
020
Apr-0
5 20
20
Jul-0
5 20
20
Oct-0
4 20
20
Mar
-14
2021
Thou
sand
s
New Trades VS® 3.0
Subprime Student Loan Originations: Accounts Number of Accounts in Thousands; NSA. Subprime Accounts, Average VantageScore® 3.0 Subprime accounts defined as those with borrower’s origination VantageScore® 3.0 less than 620
Source: Equifax Inc.
Student Loans
WEEKEND CURR YR PREV YR % TOTAL
Mar-01 2020 62.2 56.2 46.2%
Mar-08 2020 56.6 61.1 45.5%
Mar-15 2020 53.0 52.5 46.6%
Mar-22 2020 50.2 54.6 47.1%
Mar-29 2020 40.9 55.0 44.8%
Apr-05 2020 43.1 48.9 46.0%
Apr-12 2020 42.9 62.0 47.4%
Apr-19 2020 55.5 43.2 53.5%
Apr-26 2020 37.2 45.8 45.2%
May-03 2020 37.6 57.9 38.5%
May-10 2020 48.1 65.2 39.3%
May-17 2020 58.8 67.1 36.3%
# SUBPRIME STUDENT LOAN ACCOUNTS
ORIGINATED (THOUSANDS)
WEEKEND CURR YR PREV YR % TOTAL
May-24 2020 74.0 93.0 38.2%
May-31 2020 55.7 60.1 37.8%
Jun-07 2020 52.9 66.9 36.4%
Jun-14 2020 57.4 64.4 39.9%
Jun-21 2020 43.5 63.2 38.6%
Jun-28 2020 42.1 45.1 37.7%
Jul-05 2020 41.9 50.9 32.1%
Jul-12 2020 48.1 66.6 33.8%
Jul-19 2020 72.1 75.6 40.5%
Jul-26 2020 43.1 59.1 32.2%
Aug-02 2020 43.8 52.5 28.9%
Aug-09 2020 80.8 104.5 22.8%
# SUBPRIME STUDENT LOAN ACCOUNTS
ORIGINATED (THOUSANDS)
WEEKEND CURR YR PREV YR % TOTAL
Aug-16 2020 231.5 366.0 21.8%
Aug-23 2020 217.9 289.4 20.6%
Aug-30 2020 213.8 293.0 22.8%
Sep-06 2020 164.7 273.1 18.5%
Sep-13 2020 132.7 283.6 21.5%
Sep-20 2020 152.0 263.6 21.5%
Sep-27 2020 105.9 162.2 19.8%
Oct-04 2020 84.7 142.1 23.2%
Oct-11 2020 70.0 125.6 24.9%
Oct-18 2020 76.7 85.8 32.1%
Oct-25 2020 52.9 79.3 29.4%
Nov-01 2020 55.3 78.8 30.5%
# SUBPRIME STUDENT LOAN ACCOUNTS
ORIGINATED (THOUSANDS)
WEEKEND CURR YR PREV YR % TOTAL
Nov-08 2020 46.9 70.0 29.7%
Nov-15 2020 45.8 70.8 30.5%
Nov-22 2020 42.1 55.1 29.4%
Nov-29 2020 25.3 33.2 31.6%
Dec-06 2020 35.5 53.6 30.1%
Dec-13 2020 31.2 45.1 28.4%
Dec-20 2020 31.2 39.0 31.0%
Dec-27 2020 15.9 23.7 30.0%
Jan-03 2021 16.7 44.3 22.2%
Jan-10 2021 46.4 66.4 22.0%
Jan-17 2021 64.5 113.0 26.0%
Jan-24 2021 59.1 90.4 25.4%
# SUBPRIME STUDENT LOAN ACCOUNTS
ORIGINATED (THOUSANDS)
WEEKEND CURR YR PREV YR % TOTAL
Jan-31 2021 54.8 84.3 26.1%
Feb-07 2021 56.2 94.1 29.9%
Feb-14 2021 61.6 83.8 35.4%
Feb-21 2021 45.4 63.6 34.2%
Feb-28 2021 40.2 62.2 37.3%
Mar-07 2021 * 56.6 10.3%
Mar-14 2021 * 53.0 0.1%
# SUBPRIME STUDENT LOAN ACCOUNTS
ORIGINATED (THOUSANDS)
* indicates low weekly originations volume

188 PROPRIETARY |
Originations through March 14, 2021 reported as of March 16, 2021
0
73
146
219
292
365
438
511
584
0
33
66
99
131
164
197
230
263Ja
n-06
201
9
Apr-0
7 20
19
Jul-0
7 20
19
Oct-0
6 20
19
Jan-
05 2
020
Apr-0
5 20
20
Jul-0
5 20
20
Oct-0
4 20
20
Mar
-14
2021
Thou
sand
s
New Trades FICO® Score 9
Subprime Student Loan Originations: Accounts Number of Accounts in Thousands; NSA. Subprime Accounts, Average FICO® Score 9 Subprime accounts defined as those with borrower’s origination FICO® Score 9 less than 620
Source: Equifax Inc.
Student Loans
WEEKEND CURR YR PREV YR % TOTAL
Mar-01 2020 51.2 45.7 38.0%
Mar-08 2020 46.5 51.1 37.3%
Mar-15 2020 44.4 43.8 39.1%
Mar-22 2020 42.0 44.9 39.4%
Mar-29 2020 34.6 45.1 37.8%
Apr-05 2020 35.6 40.9 38.1%
Apr-12 2020 36.0 53.7 39.7%
Apr-19 2020 48.8 36.7 47.0%
Apr-26 2020 31.1 38.0 37.8%
May-03 2020 30.7 47.5 31.4%
May-10 2020 40.2 55.7 32.9%
May-17 2020 49.4 56.6 30.5%
# SUBPRIME STUDENT LOAN ACCOUNTS
ORIGINATED (THOUSANDS)
WEEKEND CURR YR PREV YR % TOTAL
May-24 2020 61.5 80.4 31.7%
May-31 2020 45.9 50.6 31.1%
Jun-07 2020 45.2 58.4 31.1%
Jun-14 2020 50.2 55.4 34.9%
Jun-21 2020 37.7 55.0 33.5%
Jun-28 2020 36.2 38.5 32.4%
Jul-05 2020 34.5 42.1 26.5%
Jul-12 2020 41.7 58.5 29.4%
Jul-19 2020 65.0 66.4 36.6%
Jul-26 2020 37.1 51.1 27.7%
Aug-02 2020 36.9 43.5 24.4%
Aug-09 2020 54.2 72.5 15.3%
# SUBPRIME STUDENT LOAN ACCOUNTS
ORIGINATED (THOUSANDS)
WEEKEND CURR YR PREV YR % TOTAL
Aug-16 2020 143.5 219.0 13.5%
Aug-23 2020 130.3 180.0 12.3%
Aug-30 2020 135.2 191.8 14.4%
Sep-06 2020 150.0 187.3 16.8%
Sep-13 2020 136.4 210.7 22.1%
Sep-20 2020 152.7 188.7 21.6%
Sep-27 2020 105.8 122.2 19.8%
Oct-04 2020 84.0 107.0 23.0%
Oct-11 2020 70.1 102.4 24.9%
Oct-18 2020 77.3 70.0 32.3%
Oct-25 2020 52.8 66.0 29.3%
Nov-01 2020 55.0 64.4 30.3%
# SUBPRIME STUDENT LOAN ACCOUNTS
ORIGINATED (THOUSANDS)
WEEKEND CURR YR PREV YR % TOTAL
Nov-08 2020 46.3 56.9 29.3%
Nov-15 2020 45.8 58.8 30.5%
Nov-22 2020 42.0 45.3 29.3%
Nov-29 2020 25.6 26.8 32.0%
Dec-06 2020 34.5 44.3 29.3%
Dec-13 2020 31.4 36.3 28.7%
Dec-20 2020 30.8 32.1 30.6%
Dec-27 2020 15.5 19.3 29.2%
Jan-03 2021 16.7 33.0 22.2%
Jan-10 2021 44.9 51.4 21.3%
Jan-17 2021 65.4 89.0 26.4%
Jan-24 2021 59.4 74.8 25.5%
# SUBPRIME STUDENT LOAN ACCOUNTS
ORIGINATED (THOUSANDS)
WEEKEND CURR YR PREV YR % TOTAL
Jan-31 2021 55.2 69.9 26.3%
Feb-07 2021 54.8 77.4 29.1%
Feb-14 2021 58.8 68.1 33.8%
Feb-21 2021 43.5 50.6 32.8%
Feb-28 2021 38.7 51.2 35.9%
Mar-07 2021 * 46.5 8.3%
Mar-14 2021 * 44.4 0.1%
# SUBPRIME STUDENT LOAN ACCOUNTS
ORIGINATED (THOUSANDS)
* indicates low weekly originations volume
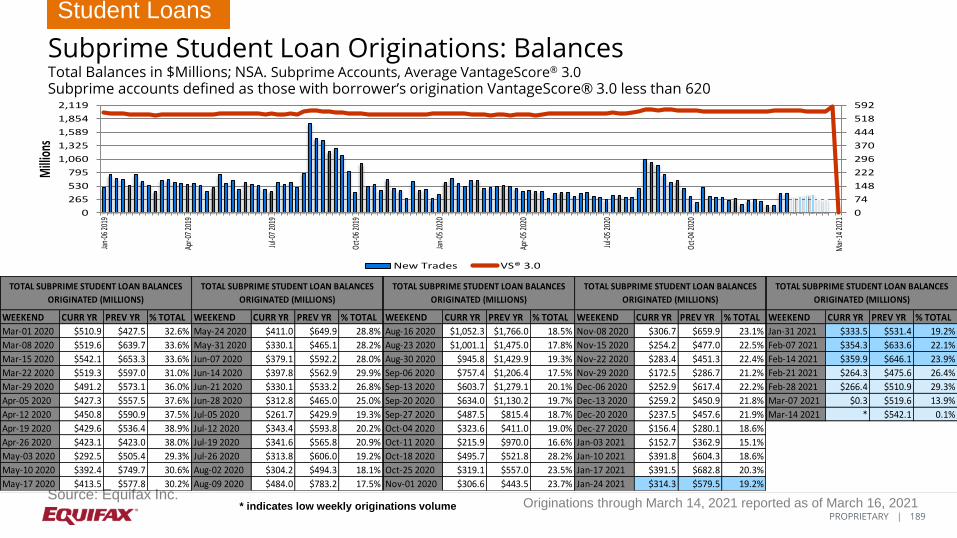
189 PROPRIETARY |
Originations through March 14, 2021 reported as of March 16, 2021
0
74
148
222
296
370
444
518
592
0
265
530
795
1,060
1,325
1,589
1,854
2,119Ja
n-06
201
9
Apr-0
7 20
19
Jul-0
7 20
19
Oct-0
6 20
19
Jan-
05 2
020
Apr-0
5 20
20
Jul-0
5 20
20
Oct-0
4 20
20
Mar
-14
2021
Mill
ions
New Trades VS® 3.0
Subprime Student Loan Originations: Balances Total Balances in $Millions; NSA. Subprime Accounts, Average VantageScore® 3.0 Subprime accounts defined as those with borrower’s origination VantageScore® 3.0 less than 620
Source: Equifax Inc.
Student Loans
WEEKEND CURR YR PREV YR % TOTAL
Mar-01 2020 $510.9 $427.5 32.6%
Mar-08 2020 $519.6 $639.7 33.6%
Mar-15 2020 $542.1 $653.3 33.6%
Mar-22 2020 $519.3 $597.0 31.0%
Mar-29 2020 $491.2 $573.1 36.0%
Apr-05 2020 $427.3 $557.5 37.6%
Apr-12 2020 $450.8 $590.9 37.5%
Apr-19 2020 $429.6 $536.4 38.9%
Apr-26 2020 $423.1 $423.0 38.0%
May-03 2020 $292.5 $505.4 29.3%
May-10 2020 $392.4 $749.7 30.6%
May-17 2020 $413.5 $577.8 30.2%
TOTAL SUBPRIME STUDENT LOAN BALANCES
ORIGINATED (MILLIONS)
WEEKEND CURR YR PREV YR % TOTAL
May-24 2020 $411.0 $649.9 28.8%
May-31 2020 $330.1 $465.1 28.2%
Jun-07 2020 $379.1 $592.2 28.0%
Jun-14 2020 $397.8 $562.9 29.9%
Jun-21 2020 $330.1 $533.2 26.8%
Jun-28 2020 $312.8 $465.0 25.0%
Jul-05 2020 $261.7 $429.9 19.3%
Jul-12 2020 $343.4 $593.8 20.2%
Jul-19 2020 $341.6 $565.8 20.9%
Jul-26 2020 $313.8 $606.0 19.2%
Aug-02 2020 $304.2 $494.3 18.1%
Aug-09 2020 $484.0 $783.2 17.5%
TOTAL SUBPRIME STUDENT LOAN BALANCES
ORIGINATED (MILLIONS)
WEEKEND CURR YR PREV YR % TOTAL
Aug-16 2020 $1,052.3 $1,766.0 18.5%
Aug-23 2020 $1,001.1 $1,475.0 17.8%
Aug-30 2020 $945.8 $1,429.9 19.3%
Sep-06 2020 $757.4 $1,206.4 17.5%
Sep-13 2020 $603.7 $1,279.1 20.1%
Sep-20 2020 $634.0 $1,130.2 19.7%
Sep-27 2020 $487.5 $815.4 18.7%
Oct-04 2020 $323.6 $411.0 19.0%
Oct-11 2020 $215.9 $970.0 16.6%
Oct-18 2020 $495.7 $521.8 28.2%
Oct-25 2020 $319.1 $557.0 23.5%
Nov-01 2020 $306.6 $443.5 23.7%
TOTAL SUBPRIME STUDENT LOAN BALANCES
ORIGINATED (MILLIONS)
WEEKEND CURR YR PREV YR % TOTAL
Nov-08 2020 $306.7 $659.9 23.1%
Nov-15 2020 $254.2 $477.0 22.5%
Nov-22 2020 $283.4 $451.3 22.4%
Nov-29 2020 $172.5 $286.7 21.2%
Dec-06 2020 $252.9 $617.4 22.2%
Dec-13 2020 $259.2 $450.9 21.8%
Dec-20 2020 $237.5 $457.6 21.9%
Dec-27 2020 $156.4 $280.1 18.6%
Jan-03 2021 $152.7 $362.9 15.1%
Jan-10 2021 $391.8 $604.3 18.6%
Jan-17 2021 $391.5 $682.8 20.3%
Jan-24 2021 $314.3 $579.5 19.2%
TOTAL SUBPRIME STUDENT LOAN BALANCES
ORIGINATED (MILLIONS)
WEEKEND CURR YR PREV YR % TOTAL
Jan-31 2021 $333.5 $531.4 19.2%
Feb-07 2021 $354.3 $633.6 22.1%
Feb-14 2021 $359.9 $646.1 23.9%
Feb-21 2021 $264.3 $475.6 26.4%
Feb-28 2021 $266.4 $510.9 29.3%
Mar-07 2021 $0.3 $519.6 13.9%
Mar-14 2021 * $542.1 0.1%
TOTAL SUBPRIME STUDENT LOAN BALANCES
ORIGINATED (MILLIONS)
* indicates low weekly originations volume

190 PROPRIETARY |
Originations through March 14, 2021 reported as of March 16, 2021
0
73
146
219
292
365
438
511
584
0
198
395
593
791
989
1,186
1,384
1,582Ja
n-06
201
9
Apr-0
7 20
19
Jul-0
7 20
19
Oct-0
6 20
19
Jan-
05 2
020
Apr-0
5 20
20
Jul-0
5 20
20
Oct-0
4 20
20
Mar
-14
2021
Mill
ions
New Trades FICO® Score 9
Subprime Student Loan Originations: Balances Total Balances in $Millions; NSA. Subprime Accounts, Average FICO® Score 9 Subprime accounts defined as those with borrower’s origination FICO® Score 9 less than 620
Source: Equifax Inc.
Student Loans
WEEKEND CURR YR PREV YR % TOTAL
Mar-01 2020 $465.2 $383.9 29.7%
Mar-08 2020 $463.5 $584.1 30.0%
Mar-15 2020 $487.9 $600.4 30.2%
Mar-22 2020 $464.0 $543.5 27.7%
Mar-29 2020 $450.3 $523.5 33.0%
Apr-05 2020 $383.2 $508.5 33.7%
Apr-12 2020 $406.1 $547.5 33.8%
Apr-19 2020 $389.6 $496.0 35.3%
Apr-26 2020 $382.0 $384.1 34.3%
May-03 2020 $252.2 $456.3 25.2%
May-10 2020 $352.9 $696.5 27.6%
May-17 2020 $360.6 $530.2 26.3%
TOTAL SUBPRIME STUDENT LOAN BALANCES
ORIGINATED (MILLIONS)
WEEKEND CURR YR PREV YR % TOTAL
May-24 2020 $359.9 $590.6 25.2%
May-31 2020 $292.7 $419.9 25.0%
Jun-07 2020 $342.8 $533.3 25.3%
Jun-14 2020 $371.4 $517.2 27.9%
Jun-21 2020 $300.8 $489.5 24.4%
Jun-28 2020 $286.2 $425.4 22.8%
Jul-05 2020 $233.3 $380.7 17.2%
Jul-12 2020 $307.6 $529.9 18.1%
Jul-19 2020 $304.5 $504.3 18.6%
Jul-26 2020 $280.4 $537.7 17.2%
Aug-02 2020 $266.5 $434.0 15.9%
Aug-09 2020 $383.2 $649.7 13.8%
TOTAL SUBPRIME STUDENT LOAN BALANCES
ORIGINATED (MILLIONS)
WEEKEND CURR YR PREV YR % TOTAL
Aug-16 2020 $788.9 $1,318.1 13.8%
Aug-23 2020 $745.6 $1,140.5 13.3%
Aug-30 2020 $732.0 $1,132.6 14.9%
Sep-06 2020 $694.2 $960.9 16.1%
Sep-13 2020 $600.4 $1,072.7 20.0%
Sep-20 2020 $626.0 $938.5 19.4%
Sep-27 2020 $480.2 $698.0 18.4%
Oct-04 2020 $316.9 $323.4 18.6%
Oct-11 2020 $212.6 $870.3 16.3%
Oct-18 2020 $492.7 $467.3 28.0%
Oct-25 2020 $318.7 $498.9 23.5%
Nov-01 2020 $310.7 $391.3 24.0%
TOTAL SUBPRIME STUDENT LOAN BALANCES
ORIGINATED (MILLIONS)
WEEKEND CURR YR PREV YR % TOTAL
Nov-08 2020 $300.1 $601.6 22.6%
Nov-15 2020 $252.4 $420.5 22.4%
Nov-22 2020 $283.1 $402.3 22.4%
Nov-29 2020 $174.4 $252.5 21.5%
Dec-06 2020 $246.2 $553.9 21.6%
Dec-13 2020 $260.2 $403.3 21.9%
Dec-20 2020 $231.3 $415.1 21.3%
Dec-27 2020 $156.9 $247.9 18.7%
Jan-03 2021 $152.8 $304.6 15.2%
Jan-10 2021 $379.2 $524.1 18.0%
Jan-17 2021 $381.7 $586.7 19.8%
Jan-24 2021 $302.2 $515.4 18.4%
TOTAL SUBPRIME STUDENT LOAN BALANCES
ORIGINATED (MILLIONS)
WEEKEND CURR YR PREV YR % TOTAL
Jan-31 2021 $328.8 $470.3 18.9%
Feb-07 2021 $337.8 $558.2 21.1%
Feb-14 2021 $343.8 $576.1 22.9%
Feb-21 2021 $254.8 $423.9 25.5%
Feb-28 2021 $252.1 $465.2 27.7%
Mar-07 2021 $0.2 $463.5 6.6%
Mar-14 2021 * $487.9 0.1%
TOTAL SUBPRIME STUDENT LOAN BALANCES
ORIGINATED (MILLIONS)
* indicates low weekly originations volume

191 PROPRIETARY |
Originations through March 14, 2021 reported as of March 16, 2021
0%
6%
12%
18%
24%
31%
37%
43%
$0
$895
$1,791
$2,686
$3,582
$4,477
$5,373
$6,268M
ar-0
1 202
0
Mar
-08 2
020
Mar
-15 2
020
Mar
-22 2
020
Mar
-29 2
020
Apr-0
5 20
20
Apr-1
2 20
20
Apr-1
9 20
20
Apr-2
6 20
20
May
-03
2020
May
-10
2020
May
-17
2020
May
-24
2020
May
-31
2020
Jun-
07 2
020
Jun-
14 2
020
Jun-
21 2
020
Jun-
28 2
020
Jul-0
5 20
20
Jul-1
2 20
20
Jul-1
9 20
20
Jul-2
6 20
20
Aug-
02 2
020
Aug-
09 2
020
Aug-
16 2
020
Aug-
23 2
020
Aug-
30 2
020
Sep-
06 20
20
Sep-
13 20
20
Sep-
20 20
20
Sep-
27 20
20
Oct-0
4 20
20
Oct-1
1 20
20
Oct-1
8 20
20
Oct-2
5 20
20
Nov-
01 2
020
Nov-
08 2
020
Nov-
15 2
020
Nov-
22 2
020
Nov-
29 2
020
Dec-0
6 20
20
Dec-1
3 20
20
Dec-2
0 20
20
Dec-2
7 20
20
Jan-
03 2
021
Jan-
10 2
021
Jan-
17 2
021
Jan-
24 2
021
Jan-
31 2
021
Feb-
07 20
21
Feb-
14 20
21
Feb-
21 20
21
Feb-
28 20
21
Mar
-07 2
021
Mar
-14 2
021
Subp
rime S
hare
Milli
ons
Student Loan Origination Student Loan Origination Subprime Share
Student Loan Average Origination Balance Average Origination Balance Over Time; NSA Subprime accounts defined as those with borrower’s origination VantageScore® 3.0 less than 620
Source: Equifax Inc.
Student Loans

192 PROPRIETARY |
Originations through March 14, 2021 reported as of March 16, 2021
0%
6%
11%
17%
22%
28%
33%
39%
$0
$895
$1,791
$2,686
$3,582
$4,477
$5,373
$6,268M
ar-0
1 202
0
Mar
-08 2
020
Mar
-15 2
020
Mar
-22 2
020
Mar
-29 2
020
Apr-0
5 20
20
Apr-1
2 20
20
Apr-1
9 20
20
Apr-2
6 20
20
May
-03
2020
May
-10
2020
May
-17
2020
May
-24
2020
May
-31
2020
Jun-
07 2
020
Jun-
14 2
020
Jun-
21 2
020
Jun-
28 2
020
Jul-0
5 20
20
Jul-1
2 20
20
Jul-1
9 20
20
Jul-2
6 20
20
Aug-
02 2
020
Aug-
09 2
020
Aug-
16 2
020
Aug-
23 2
020
Aug-
30 2
020
Sep-
06 20
20
Sep-
13 20
20
Sep-
20 20
20
Sep-
27 20
20
Oct-0
4 20
20
Oct-1
1 20
20
Oct-1
8 20
20
Oct-2
5 20
20
Nov-
01 2
020
Nov-
08 2
020
Nov-
15 2
020
Nov-
22 2
020
Nov-
29 2
020
Dec-0
6 20
20
Dec-1
3 20
20
Dec-2
0 20
20
Dec-2
7 20
20
Jan-
03 2
021
Jan-
10 2
021
Jan-
17 2
021
Jan-
24 2
021
Jan-
31 2
021
Feb-
07 20
21
Feb-
14 20
21
Feb-
21 20
21
Feb-
28 20
21
Mar
-07 2
021
Mar
-14 2
021
Subp
rime S
hare
Milli
ons
Student Loan Origination Student Loan Origination Subprime Share
Student Loan Average Origination Balance Average Origination Balance Over Time; NSA Subprime accounts defined as those with borrower’s origination FICO® Score 9 less than 620
Source: Equifax Inc.
Student Loans

193 PROPRIETARY |
Credit Trends Originations: Notes

194 PROPRIETARY |
Originations through March 14, 2021 reported as of March 16, 2021
U.S. Consumer Credit Trends – Originations
Notes
• Data are not seasonally adjusted.
• Due to changes in data reported to Equifax, previously reported data December change.
• Data are sourced from Equifax’s U.S. Consumer Credit database of over 220 million consumers.
– Equifax Credit Trends is the primary source for the data in this report; for more information on this database please visit www.equifax.com/business/credit-trends
– These data are population level – not a sample.
– Jointly held accounts are represented by a randomly selected borrower on the account. Tradelines are only counted once.
– Exclusions for data quality are applied, such as timely reporting of the establishment of the trade (≤12 months); completeness of the tradeline record including type, credit limit, balance outstanding and status; and other similar filters (e.g., exclude if borrower’s death reported).
• Definitions: Account Type
– Auto – Total: all accounts from banks and finance companies for loans or leases on light vehicles.
– Auto – Lease: a long-term contract lease of the light vehicle that terminates with the return of the car or a balloon payment of the rest of the balance due. Lease amounts reported to Equifax reflect the contract amount only, excluding the expected residual value of the vehicle at lease end.
– Auto – Loan: traditional amortizing installment loans on a light vehicle.
– Credit Cards – Bankcard: general purpose credit cards.

195 PROPRIETARY |
Originations through March 14, 2021 reported as of March 16, 2021
U.S. Consumer Credit Trends – Originations
Notes
• Definitions: Account Type, continued – Credit Cards – Private Label: credit cards issued for use at particular retailers. Sometimes called retail cards
or store cards.
– First Mortgage: loans with first lien position on a residential property.
– Home Equity Installment Loan: loans in second lien position on a residential property. These loans are amortizing for the full term of the loan and do not have a draw feature.
– Home Equity Revolving Lines of Credit: loans usually in second lien position on a residential property. These loans commonly require only interest payments during the draw period and then are recast into amortizing payments at the end of the draw. During the draw period the borrower June take advances from the line of credit.
– Total Consumer Finance: installment or revolving loans opened with a sales financing company or a personal finance company. These are typically unsecured finance trades.
– Consumer Finance Installment: consumer finance loans that are amortizing for the full term of the loan and do not have a draw feature.
– Consumer Finance Revolving: consumer finance loans with a line of credit from which the borrower can draw funds.
– Student Loan: loan funded for the purpose of financing post-secondary educational study

196 PROPRIETARY |
Originations through March 14, 2021 reported as of March 16, 2021
U.S. Consumer Credit Trends – Originations
Notes
• Definitions: Other – Credit limit: the maximum amount the borrower can access on the account. On installment accounts this is
the original loan amount. On revolving accounts this is also known as the credit line or high credit.
– Subprime: a loan characterized by a combination of factors that make it not-prime-credit quality, meaning that these loans will typically have higher default rates and higher loss rates on average than prime-quality loans from the same vintage. Within this report these are defined as loans extended to borrowers who at the time the loan was originated had a VantageScore® 3.0 Or FICO® Score 9, FICO® Score 8 or FICO® Score 5 credit score below 620.
• Data on new tradeline originations are subject to revision for up to 12 months due to lags in lenders and servicers reporting to Equifax.
– Data for the most recent 12 months are grossed up for expected but as yet unreported new loans.
– First Mortgage tradelines June be most affected by delays as servicing rights as well as the loans themselves are frequently sold after origination.
– With the exception of first mortgage and home equity installment loans, at least 90% of expected new tradelines will have been recorded for the most recent month included in this report (e.g., October 2017 origination data in the October 2018 report).
– Note that in January 2017 we permanently moved accounts that were previously identified incorrectly as home equity installment loans to consumer finance installment loans, affecting values after April 2014.

197 PROPRIETARY |
Originations through March 14, 2021 reported as of March 16, 2021
U.S. Consumer Credit Trends – Originations
Notes
• VantageScore – VantageScore is a trademark of VantageScore Solutions, LLC
– More information can be found at www.vantagescore.com
• FICO – FICO is a trademark of Fair Isaac Corporation
– More information can be found at www.FICO.com
• Equifax and the Equifax logo are registered trademarks of Equifax Inc., Atlanta, GA
The information presented herein is for general informational use only. Neither Equifax nor any of its affiliates make any express or implied representation or warranty as to the accuracy or completeness of the information contained herein. Equifax and its affiliates expressly disclaim any and all liability which June be based in whole or in part on such information, errors therein or omissions therefrom. This information is qualified in its entirety by the footnotes, assumptions and other qualifying statements contained herein. This information should not be relied upon in making any financial decision or otherwise. Such information is presented as of the date hereof only and is subject to change without notice. Equifax undertakes no responsibility to update or supplement the information contained herein.

198 PROPRIETARY | Or Visit www.equifax.com/business/credit-trends
Peter Gao VP – USIS Insights & Analytics Leader
470.373.2310
Chris Walker Product Manager
770.740.4772
Contact our Credit Trends Experts for More Information:
Copyright © 2022 FDOKUMEN