
Oracle Financial Services Currency Transaction Reporting ...
Upload
khangminh22Category
view
1download
0
1
Translating Digital Credit Transaction
Data into Consumer Protection
Supervision
A Toolkit
Innovations for Poverty Action
Innovations for Poverty Action
Daniel Putman

2
Table of Acronyms
APIs Application programming interface
BLS (United States) Bureau of Labor Statistics
CAK Competition Authority of Kenya
DTI Debt-to-income
DFS Digital Financial Services
FSPs Financial service providers
HTTPS Hypertext transfer protocol secure
IPA Innovations for Poverty Action
IRB International Review Board
LASSO Least Absolute Shrinkage and Selection Operator
MSISDN Mobile station integrated services digital network
PII Personally Identifiable Information
SFTP Secure file transfer protocol
U.S. United States

3
Table of Contents
Using this Toolkit………………………………………………………………………………………. 4
Introduction………………………………………………………………………………………………. 5
Section I: Analysis of Digital Credit Data for Consumer Protection Market
Monitoring…………………………………………………………………………………………………. 15
Section II: Data Security…………………………………………………………………..….….… 47
Section III: Making the Request……………………………………………………..……..….. 58
Section IV: Conclusion…………………………………………………………………….………... 67
Summary………………………………………………………………………………………….…….… 70
Appendix…………………………………………………………………………………….……………. 76

4
Using this Toolkit
This toolkit is aimed at addressing the opportunities and challenges of using digital credit
transaction data for consumer protection market monitoring. The introduction explains the
reasons for consumer protection supervision, the advantages and limitations of
administrative data for supervision, as well as organizational prerequisites for its use. The
toolkit is organized into three major sections that detail a distinct set of tools important to
using transaction data for market monitoring:
• Section I: Outlines how digital credit transaction data can be analyzed to monitor
consumer protection issues. Additional analyses, including the use of predictive and
causal methods, are also covered in this section in less detail.
• Section II: Presents data security issues associated with an information request and
recommends tools for keeping data safe within this process. This information can
facilitate productive communication with information technology support staff
about what support is needed to complete the analysis.
• Section III: Builds on the analysis and data security tools in the previous sections by
providing a guide for obtaining data and is supplemented with example documents
in the supplemental Appendices.
• Section IV: Includes an extensive checklist that will help guide users in executing the
data research process based on the suggested steps in this toolkit.
Typically, when conducting market monitoring, the researcher will collect, then transfer,
and finally analyze the data. The sections in this toolkit are ordered in reverse
chronological order intentionally; As the researcher plans the data request, the data
security procedures and the request will depend on the type of analysis conducted at
the end of the process. Thus, it is recommended to undertake assessing the analysis
process by engaging with information technology professionals and other staff who will
be depended on operationally, and then iterating before planning the data request.
This approach will maximize internal capacity to deliver the data that is necessary, and
the quality of the data collected and delivered.

5
Introduction
Digital Credit and Consumer Protection
Digital Financial Services (DFS) have seen widespread adoption in lower- and middle-
income countries; 21 percent of adults in Sub-Saharan Africa now hold a mobile money
account (Demirguc-Kunt et al. 2018). Likewise, in 2020 South Asia had 305 million mobile
money accounts, or about 16 accounts for every hundred people (Andersson and Naghavi
2021).1 There has been an increase in digital credit, which emerged in recent years as
extension to mobile money, mobile banking, and payments systems, loans which are
delivered via a mobile phone, web browser, or app, where the enrollment, origination and
repayment are managed through digital channels. . For example, Kenya, a leading market
in mobile money adoption, has seen rapid growth over the last decade (Gubbins and
Totolo, 2019). In 2016, over one third of Kenyans with a mobile phone had taken a loan
digitally at some point (Totolo 2018).
Digital credit products have differentiated themselves from traditional lending in three
primary ways; they are “instant, automated, and remote” (Chen and Mazer 2016).
First, while traditional lending applications might take many days to be approved or denied,
digital credit transfers occur nearly instantly. Likewise, disbursement of loans happens
more quickly with the help of digital payments services. Second, while traditional credit
products rely on human decision-making, digital credit products allow for automation
when making credit decisions based on preset parameters or algorithms. Third, instead of
making a trip to a bank branch and filling out applications, disbursements and repayments
can be managed remotely.
These three attributes also drive the benefits of digital credit relative to traditional lending.
A few additional benefits to digital credit include:
• Transaction costs of lending and borrowing: For borrowers, transaction costs fall
because credit is instant, automated, and remote. Credit transactions are faster
when they are demanded, with less paperwork, and without a journey to a bank.
Likewise, for the providers, the cost of credit screening falls with automation, which
suggests the potential for reduced prices on consumer credit (Björkegren and
Grissen 2018).2
1 Total population figure from World Bank Data: https://data.worldbank.org/indicator/SP.POP.TOTL?locations=8S
2 Conditional on the borrowers’ credit risk. If new borrowers are riskier than older borrowers, overall prices might be higher.

6
• Consumer access to formal credit: Reductions in transaction costs for lenders
opens up new markets, easing access to services as compared to traditional credit
products. This relative ease of borrowing suggests digital credit as a likely driver of
financial inclusion (Björkegren and Grissen 2018). Credit obtained from formal
financial service providers (FSPs) might serve as a substitute for potentially costly or
otherwise undesirable informal credit arrangements that borrowers might
otherwise use (Blumenstock et al. 2021).
• Financial health and resilience: Access to flexible credit products could lead to
increased financial health. For example, data from a digital credit provider in Kenya
finds that access to digital credit loans serves as a buffer to risk, allowing borrowers
to handle small, short-term emergencies (Suri et al. 2021). Additionally, borrowers in
Malawi report positive impacts on financial health as a result of their gaining access
to digital loans (Brailovskaya et al. 2020)
• Stress and well-being: Empirical evidence suggests that there may be small
positive effects on stress and subjective well-being due to the emergence of digital
credit. While this topic has not been fully explored, in theory, this could be related to
mechanisms like resilience to risk or improved future prospects. In particular, in
Nigeria, a study finds that digital borrowing led to an increase in self-reported
happiness as well as a reduction in an index of depression among users use
(Blumenstock et al. 2021).
However, risks also exist in relation to digital credit. Some of the key risks which digital
credit raises include:
• Uninformed consumers: Customers who are being introduced to the formal
lending sector via digital credit will have limited experience with formal lending
products (Francis et al. 2017).3 One example documented by Brailovskaya et al.
(2020) illustrates that consumers in Malawi are uninformed about the terms and
conditions of digital credit products. If consumers are not aware of the terms of
service, this could result in serious consequences for borrowers, including taking on
credit that is not affordable. For example, consumers may be prone to
overborrowing as their credit limits increase (Shema 2021).
• Present biased consumers: When combined with present bias, or the tendency to
focus on present benefits and ignore future costs may have similar damaging
consequences.4 For example, a study in Mexico finds that longer wait times reduce
defaults. This work suggests that credit could be granted too quickly in some cases,
before consumers have had sufficient time to think through repayment options
(Burlando et al. 2021).
3 Furthermore, it is often the case that information about the credit products is presented on mobile phones, making it more
difficult to adequately represent the conditions in fine print. 4 See Kuchler and Pagel (2021) for an example of present bias in consumer credit.

7
• Fee Complexity: When fees are not disclosed or are complex, they might lead to a
higher cost of credit for digital credit consumers, even despite the reduction in
transaction costs to providers. fees might raise prices for unsophisticated
consumers while cross-subsidizing sophisticated consumers who can avoid them
(Gabaix and Laibson 2006). This motivates understanding fee types as well as the
complexity of their application. In the case of digital credit, information disclosure
before and during transactions can help improve borrower's choices as it has in the
American payday loans business (Bertrand and Morse 2011; Wang and Burke 2021).
• Multiple borrowing and credit information systems: The speed and availability
of digital credit may also stress traditional credit information systems, allowing
consumers to borrow from multiple sources simultaneously, otherwise known as
multiple borrowing. Non-bank digital lenders are often not subject to the same
regulations as banks. In particular, while banks are often required to use credit
information systems, digital credit providers are not. This may lead to providers
opting out of these systems, allowing for the possibility of multiple borrowing across
providers which goes undetected by lenders.5 Whilst each loan might be assessed as
affordable individually, the combination of multiple loans could be unaffordable
(Chichaibelu and Waibel 2017).
• Credit scoring: Beyond multiple borrowing, a number of issues related to credit
scoring might pose risks to borrowers. First, risk-based pricing may or may not be
used to price loans. In the absence of risk-based pricing, some risky borrowers
benefit from flat fees while lower risk borrowers pay higher fees than they would if
risk-based pricing were used, resulting in cross subsidization of risky borrowers by
safer borrowers (Staten 2015).6 Borrowers who are too risky for the flat fee applied
to all borrowers may also be screened out of access to credit based on this
scenario.7 Automation of lending may also pose risks; In particular, credit scoring
algorithms may harbor bias due to the training data used, the modeling decisions,
or complex combinations of these elements (Kelly and Mirpourian 2021; Rizzi et al.
2021).
5 Even when lenders do not opt-out of credit reporting, digital lenders may only report negative credit information since
positive information may allow other lenders to poach their best borrowers (Pagano and Jappelli 1993). Even in cases where
credit information systems are fully regulated, the speed of digital credit can still put stress on these systems. For example,
when systems update on a monthly basis, borrowers might be able to take an additional loan before negative credit
information is submitted about them. Even where credit information systems are updated on a daily basis, a borrower might
be able to take out multiple loans simultaneously due to the near-instant nature of digital credit loan decision-making and
disbursement. In very extreme cases, such activity is combined with inauthentic application profiles as a form of fraud. For
example, see: https://www.transunion.com/blog/fraud-in-the-digital-age-loan-stacking-and-synthetic-fraud
6 This might be a combination of two issues; Beyond leading to higher rates for safer borrowers, this may also lead to borrowers
taking riskier actions when taking credit if good behavior is not compensated.
7 Risk-based pricing also has the advantage of encouraging good repayment behavior by rewarding those who repay on time.

8
• Market concentration: As digital credit begins to succeed in broadening access to
lending products, many of those who adopt may be first time borrowers in the
formal sector and may not have access to traditional products. This may pose a
market concentration risk in the short term even there is rich competition among
traditional providers. Moreover, where mobile money markets are highly
concentrated, this concentration could spill over into the digital credit market
through interlinkages between the markets. These interlinkages might include
spaces on mobile money product menus provided by mobile network or mobile
money operators with high market share. Similarly, the data from these operators is
valuable in predicting credit default (Björkegren and Grissen 2019). Therefore,
concentration within digital finance could lead to higher profits for those providers
who have access to this data or a place on these menus. This motivates market
monitoring of the degree of concentration, the price of credit offered to consumers,
and the potential for consumers to move between providers.
These risks contribute to the need for supervision of digital credit. This report walks
through one approach to supervision using administrative data from digital credit
providers for market monitoring. Transaction level administrative data from providers can
help with in-depth monitoring of the consumer outcomes listed above. However, while the
data itself is often lower cost when compared to consumer surveys or audit methods, it
does require substantial upfront investments to reap these rewards. Therefore, before
diving into the types of analysis, methodology, and practical details of running an
information request to acquire this data, the toolkit addresses the costs and benefits of
using this approach for consumer protection market monitoring.
Administrative and Digital Credit Market Monitoring
There are many advantages for tracking outcomes with administrative data broken down in
the following four categories:
1. Detailed short-run measurement: Administrative data is useful in providing
detailed information in the very short term, or short-run, particularly when using
transaction data. It allows for clear and detailed timelines of consumer behavior:
transaction data is accompanied with information about the date a disbursement or
repayment took place and potentially the time of day a transaction took place. In
the case of digital credit, if data feeds can be established, the high frequency of
measurement might be used to monitor negative consumer outcomes nearly
instantly.
2. Understanding market evolution: While many other data sources give a snapshot
or a series of frames, administrative data is collected continuously, allowing for

9
tracking of outcomes without gaps. This allows for measuring the evolution of the
market at different time intervals to understand market trends in the medium and
long-term.
3. Improved outcome measurement: When compared to survey data, administrative
data also provides value by improving the measurement of outcomes. Since
research participants are not asked to recall their experiences, this may allow for
greater accuracy and precision when considering hard to recall variables like the
number, average size, or fees associated with credit contracts (Feeney et al. 2018).
Likewise, administrative data does not suffer from the reporting biases that
complicate survey data; for example, if a survey respondent knows they are over-
indebted, they might misreport their outstanding loans to save face. In contrast,
administrative data reflects the behavior of research participants.
4. Reduced cost of data collection: Collecting administrative data has cost and
logistical benefits for both the data collector and the participants. For example, one
does not need to construct a survey instrument, track respondents, or pay
enumerators (Feeney et al. 2018).
Many financial service regulators successfully run information requests which ask FSPs to
deliver data. For example, the United Kingdom’s Financial Conduct Authority used
regulatory reporting data in combination with consumer surveys as part of a study of high-
cost, short term credit in the UK.8 Similarly, the Consumer Financial Protection Bureau in
the United States (U.S.) uses administrative data in its research and regulation activities and
maintains a lending database from the Home Mortgage Disclosure Act.9 The Competition
Authority of Kenya (CAK) made use of transaction-level administrative data in their Digital
Credit Market Inquiry, which this toolkit will further explore when explicating data for
market monitoring (D. Putman et al. 2021). Many additional examples exist: CGAP and the
Bank of Tanzania (Izaguirre et al. 2018), UNCDF and the Bank of Sierra Leone (Blackmon,
Cuccaro, et al. 2021). In each case, these inquiries and studies have informed regulators
about the state of the market in great detail and have often led to policy recommendations.
Despite the advantages of administrative data for consumer protection supervision, it is
not always the right tool to use in every study. There are two questions which policymakers
should ask themselves before embarking on a project to use administrative data for
market monitoring:
1. Does administrative data have the desired information? While there are many
advantages in using administrative data, FSPs do not record everything that might
be of interest to a consumer protection regulator or researcher. In some cases,
8 Financial Conduct Authority. January 24, 2019. “Consumer credit – high-cost short-term credit lending data.” Last updated
May 15, 2019. https://www.fca.org.uk/data/consumer-credit-high-cost-short-term-credit-lending-data-jan-2019
9 Consumer Financial Protection Bureau, U.S. Government. HDMA. Updated regularly.
https://www.consumerfinance.gov/data-research/hmda/

10
alternative data collection methods may be better suited to address certain
consumer protection issues.
2. Does the team have the technical capacity to execute a data request? While
transaction data is low in price compared to other data collection methods,
specialized skills and technical capacity are required to collect and analyze the data
properly.
The next two subsections explore these questions through the lens of policymaking.
USE OF ADMINISTRATIVE DATA
Administrative records can be exceptionally useful in understanding a number of
consumer protection issues in digital credit. Examples of places where administrative
data might add value include understanding digital credit pricing, over indebtedness (such
as multiple borrowing), and discrimination. At the same time, there are consumer
protection issues that are outside the scope of administrative transactions data and will
require other types of data to diagnose and understand the issue.
Some types of misconduct that adversely impact consumers may not appear in
administrative data. For example, fraudulent digital credit applications will also fall outside
of this analysis because they would not answer a data request; Fu and Mishra (2021) use
data scraped from the Google Play Store to document fraudulent digital credit apps.10 Loan
officers or others assigned to handle debt collection by digital credit providers might also
use tactics such as frequently messaging overdue borrowers or texting their friends to
shame them.11 Similarly, such behavior would not be visible within transaction level
administrative data. However, complaints data, either to the company or to a government
agency might hold evidence of its occurrence.12
Likewise, it will be difficult to understand consumers' knowledge or perceptions of digital
credit products by solely utilizing administrative data. For example, if consumers are
repaying loans late, researchers or policymakers would have difficulty documenting what
has led to this outcome; consumers could lack knowledge of terms and conditions
(Brailovskaya et al. 2020). However, it might just as well be that consumers enter into
10 Some might bring up methods in forensic accounting, though these are outside the purview of consumer protection as they
have been developed to understand fraud against corporations by their employees.
11 Kiruga, Morris. May 26, 2020. “This Lending App Publicly Shames You When You’re Late on a Payment.” Rest of World.
https://restofworld.org/2020/okash-microlending-public-shaming/
12 Related to this issue is that of overcharging in mobile money, which is similarly difficult to determine from administrative
data. Overcharging tends to happen in cash, “off the books.” Despite the fact that this would not be present up in
administrative data, it is picked up by mystery shopping or consumer surveys. For example, consumer surveys show 31
percent of consumers were overcharged when using mobile money in Uganda in comparison to 3 percent in Kenya
(Blackmon, Mazer, et al. 2021; Mazer and Bird, 2021). If a similar situation occurred with digital credit, it would be difficult to
track.

11
financial distress which makes the loans difficult to repay. Survey data will have the
advantage of observing these different mechanisms whereas administrative data will not.
Preferences that govern consumer behavior are difficult to observe directly from
observational data. A consumer could fail to repay their loans due to a phenomenon
known as hyperbolic discounting, when consumers heavily discount their future
consumption when compared to current consumption as compared to loan default based
on financial distress or a lack of understanding of the product. Such preferences could be
examined with laboratory or field experiments but in most cases cannot be recovered from
administrative data.13
Here are some questions to ask before beginning research with administrative data. At
least one of these questions should be answered in the affirmative:
• Will the study measure data that is difficult to precisely recall? i.e., precise
amounts, total credit extended, number of loans taken over some period, if loans
were paid back, etc.
• Are consumers likely to misrepresent their experiences? i.e., sensitive topics are
being discussed in the survey such as indebtedness.
• Does timing matter?
a. Will the study need to see outcomes evolve over time? Is a snapshot of the
market sufficient to answer my question(s)?
b. Will the study need to see the details of when transactions took place?
Here are some questions to ask and answer in the negative before beginning research with
administrative data. For answers in the affirmative, alternative data sources are suggested.
More precisely if all the questions of interest fall into one of these categories,
administrative data will not be the ideal data source:
• Is the explicit misconduct by (employees of) FSPs of interest? This information
may be better captured through mystery shopping or through administrative
complaints data. However, with the right methods and data it may still be possible
to detect some forms of discrimination using administrative data.
• Are the perceptions, beliefs, or motivations of consumers of interest?
Administrative data will allow you to see detailed behavior of consumers, but
perceptions, beliefs, and motivations would need to be inferred from this data.
Consumer surveys may allow one to ask directly about these topics.
• Are the preferences that drive financial behavior of interest? As discussed in
the previous section, while consumer behavior can be observed from administrative
data, preferences would need to be inferred. However, behavioral experiments
13 For example, Andreoni et al. (2015) compares methods by which time preferences can be elicited experimentally. To elicit
time preferences without an experiment, one needs an economist who specializes in structural econometrics and a setting
which allows them to cleverly back out these preferences. While this is sometimes possible (and worthwhile), the economist
and the setting are not always easy to come by.
12
designed to elicit consumer preferences. As a second-best option, consumer
surveys can ask about preferences directly.
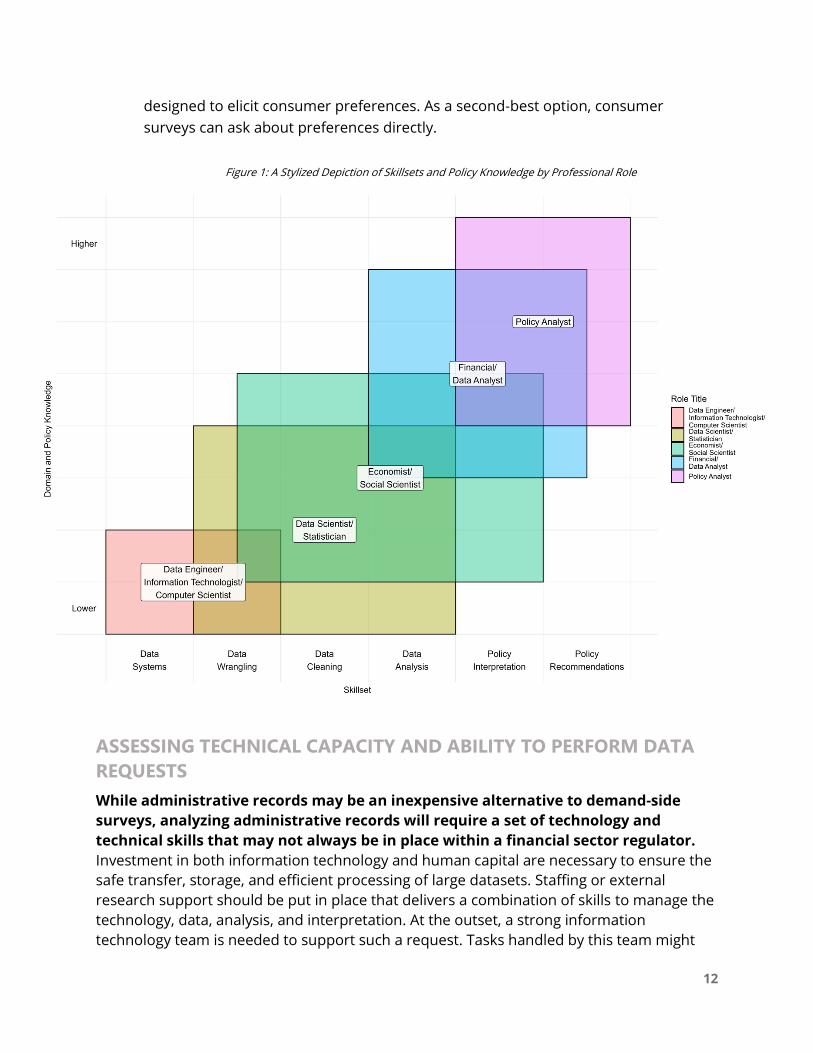
Figure 1: A Stylized Depiction of Skillsets and Policy Knowledge by Professional Role
ASSESSING TECHNICAL CAPACITY AND ABILITY TO PERFORM DATA
REQUESTS
While administrative records may be an inexpensive alternative to demand-side
surveys, analyzing administrative records will require a set of technology and
technical skills that may not always be in place within a financial sector regulator.
Investment in both information technology and human capital are necessary to ensure the
safe transfer, storage, and efficient processing of large datasets. Staffing or external
research support should be put in place that delivers a combination of skills to manage the
technology, data, analysis, and interpretation. At the outset, a strong information
technology team is needed to support such a request. Tasks handled by this team might
13
include data systems tasks like installing hardware and software, determining system
needs, troubleshooting user issues, and implementing security protocols. Staffing might
include information technology professionals, programmers, or others who have been
trained in computer science. It is likely that this team already exists to support other
operations of the regulator.
It is useful here to explore the continuum between data engineers, data scientists, and data
analysts to understand the necessary roles.14 On one end of the spectrum, data engineers
are focused on building and maintaining data architectures: where data is stored and how
it is delivered. At the other end of the spectrum, data analysts in policy outfits are focused
on analyzing data, interpreting results within a policy framework, and recommending policy
actions based on the results of statistical analyses on the data. Such work might also be
conducted by financial or policy analysts, or even occasionally policy minded economists. In
between the raw data and this analysis, however, are data scientists, who are responsible
for cleaning and organizing the data for the purpose of analysis. In a perfect world, data
would arrive ready to use, but in reality, there are steps of processing and management
that prepare data to be used by analysts. Tasks include data wrangling and cleaning;
wrangling involves transforming data from raw records into data usable by an analyst
whereas cleaning involves amending errors or bugs that may exist within the data. Other
staffing relevant for these intermediate steps might include data engineers, statisticians,
economists, or other quantitative social scientists. This continuum of skills and knowledge
is depicted above in Figure 1.
Based on the training received in such tasks, staffers may take on one or multiple of these
roles. For example, economists or statisticians with relevant knowledge of the policy realm
may be able to clean, organize, and analyze the data (or if the staff member is senior, they
can direct a team to do so correctly). Likewise, a data scientist supported by a policy expert
on the staff will also often have the skills to take on analysis. The staff who will take on
roles cleaning, wrangling, and analyzing data should have the ability to use statistical
programming languages like R, Python, Stata, or another language equipped to handle the
analysis of large datasets. Depending on internal staff capacity, it may not make sense to
hire all of the staff necessary to take on the data request, but some of these needs can be
outsourced or handled by collaborating with research organizations or academic
institutions.
Below are a few questions to help answer if your team has the technical capacity to
undertake digital credit data analysis:
• Could the team include staff that fill all of the roles mentioned above? Finding
individuals to fill each of these roles in directing the research process is essential to
success in this type of work.
• For roles that may take greater staffing as data increases in size and number
of providers, will the team be adequately staffed in order to properly conduct
14 Willems, Karlijn. Datacamp. February 22, 2017. https://www.datacamp.com/community/blog/data-scientist-vs-data-engineer

14
cleaning, wrangling, and compliance? If not, these steps will lead to bottlenecks in
the process and might threaten the success of the endeavor. This can of course be
filled by lower-level staffers as long as they have sufficient skills to carry out their
tasks with direction.
• If all of these roles cannot be filled internally, can the organization partner
with other institutions who can fill the gaps? It is not always reasonable to
expect to fill all roles internally. In many cases collaborations between universities,
research institutions, and regulatory bodies can lead to fruitful outcomes.

15
Section I: Analysis of Digital Credit Data
for Consumer Protection Market
Monitoring
This section discusses the kinds of analysis that administrative data can contribute to in the
context of credit markets. Describing the state and the evolution of a credit market is often
a main objective of a regulators’ administrative data information request. This section will
explore what outcomes can be generated to describe the state and evolution of the market
and will also cover outcome segmentation and heterogeneity using both traditional
methods like disaggregating by observable characteristics, as well as newer methods like
clustering. The subsections describe data requests, their limits, and possibilities, and which
of these outcomes can be captured by an information request. The final subsection
introduces additional analyses outside of descriptive statistics that can be conducted to
deepen the value of administrative data for consumer protection market monitoring
including using administrative data to measure the effect of policy changes and to predict
consumer protection outcomes measured by survey data.
THE STATE OF THE MARKET
Consumer Protection Outcomes
Administrative data gives access to numerous outcomes relevant to consumer protection
market monitoring. This section details and defines an expansive set of outcomes, their
common uses, interpretations, and utility in understanding consumer protection issues.
For each of the outcomes discussed precise mathematical definitions are given in the
Appendix. Each outcome is marked by a two-digit code, one letter for the outcome group
and a number for the outcome. These outcomes are related to market size, the nature of
loan contracts, pricing, repayment behavior, multiple borrowing, switching, over-
indebtedness, and loan applications.
Market Size
Market size, or the amount of activity in a market over a given period of time, is one of the
most fundamental pieces of information about a market. It helps understand the
importance of that market in the economy and the ubiquity of that market in people’s lives.
From the perspective of the policymaker, consumer protection issues will be scaled in
accordance to the role the market plays in the economy and in people’s lives. The market
can be sized in many ways using administrative data including the following options:
1. Total accounts (M1): the total number of unique borrowers across lenders.

16
2. Total disbursements (M2): The total number of loans granted within a period to all
borrowers.15
3. Total value (M3): The sum of the value disbursed in the period to all borrowers.
In order to represent the true size of the market in any of these cases, data should be
collected from most digital credit providers. Access to representative user surveys from
digital financial services which ask providers respondents for their digital lending use by
name can support the research in two ways; (1) By matching the proportion of respondents
who use a given provider to those where administrative data is collected to check that
there is a reasonably sufficient coverage of the market; (2) By estimating the total number
of consumers when administrative data is incomplete. In particular, the number of unique
consumers in the administrative data sample divided by the proportion of users that have
accounts with the FSPs from survey data will yield an estimate of the total number of
accounts in the market.16
As part of the Digital Credit Market Inquiry in Kenya, consumer surveys data tracked what
digital credit providers respondents had used (Blackmon, Mazer, et al. 2021). To the degree
this survey was representative of digital credit consumers in the Kenyan market, we could
check the percentage of those consumers the collected administrative included. In
particular, about 96 percent of those who used digital credit in the survey used at least one
of the providers that submitted administrative data and about 43 percent of survey
respondents used one of the providers submitting transaction data (D. S. Putman 2021).
While the survey was not meant to be fully representative of digital credit borrowers, other
surveys are constructed to be so.
Loan Contracts
Sizing the market helps better understand the kind of service borrowers receive within the
market including the target customers and purpose of digital loans. For example, smaller
loans may not be sufficient to raise capital for investing in small businesses. Three main
features of these contracts are of interest: the loan size (C1), tenure (C2), and contracted
APR (P1), as well as the various fees and charges that are specified in the contract. Loan
size is the amount disbursed to the borrower that they are free to use. In some cases,
providers record the disbursement as the total amount the borrower will need to repay by
the end of the loan but give a smaller amount of cash to that borrower, essentially having
the borrower pay the fee at disbursement. Tenure is recorded during disbursement as the
length of time from when the loan is disbursed until when it is due.17
15 When overdraft products are also part of the market, this may include overdrafts in addition to disbursements.
16 This conclusion supposes data is not already regularly collected on FSP aggregates, which would reach an estimate of market
size more directly. However, it is not always the case that such aggregate data is collected from unregulated digital lenders.
17 For both loan size and tenure, one must decide between finding the average loan or the average consumer experience.
Each method has its own advantages and disadvantages, illustrated using average loan size. For a first measure, compute the
simple average, divide the total disbursements by the number of loans given. Alternatively, a second approach is to compute

17
Contracted APR, or the rate paid by the borrower in annual terms if they repay the loan as
stipulated in the contract, is used to measure the price of a loan at contract. This
normalizes cost in terms of both loan amount and tenure, to make sure loan pricing is
comparable across providers and consumers. Contracted APR is calculated as seen below:
CAPR = (Normal fees
Value of disbursement) × (
365 days
Tenure) × 100%
When only account or provider level data is available, performing a partial version of this
exercise is possible, however, if tenure is the same across all loans (this is often the case at
digital credit providers) it is possible to ascertain the average.
Pricing
Two additional measures of the price of credit to account for consumer repayment behavior
and application of penalties by providers after contracting can be used. First, APR (C2) can
introduce additional fees levied due to lateness, rollover, or default. APR is calculated as seen
below:
APR = (All fees
Value of disbursement) × (
365 days
Tenure) × 100%
Effective APR (P3) can be used to study the true price of credit once consumer behavior is
fully accounted for. Here, in addition to including all the fees and charges that are used in
the actual APR calculation, tenure can be replaced with effective tenure (R1), or the length
of time from when the loan is disbursed to when it is actually repaid in full. Effective tenure
is used here since it is common for digital credit borrowers to repay their loans well before
the due date, which can create a difference between APR at loan origination and the actual
APR when the loan is repaid. Effective tenure is calculated in the following manner:
EAPR = (All fees
Value of disbursement) × (
365 days
Effective tenure) × 100%
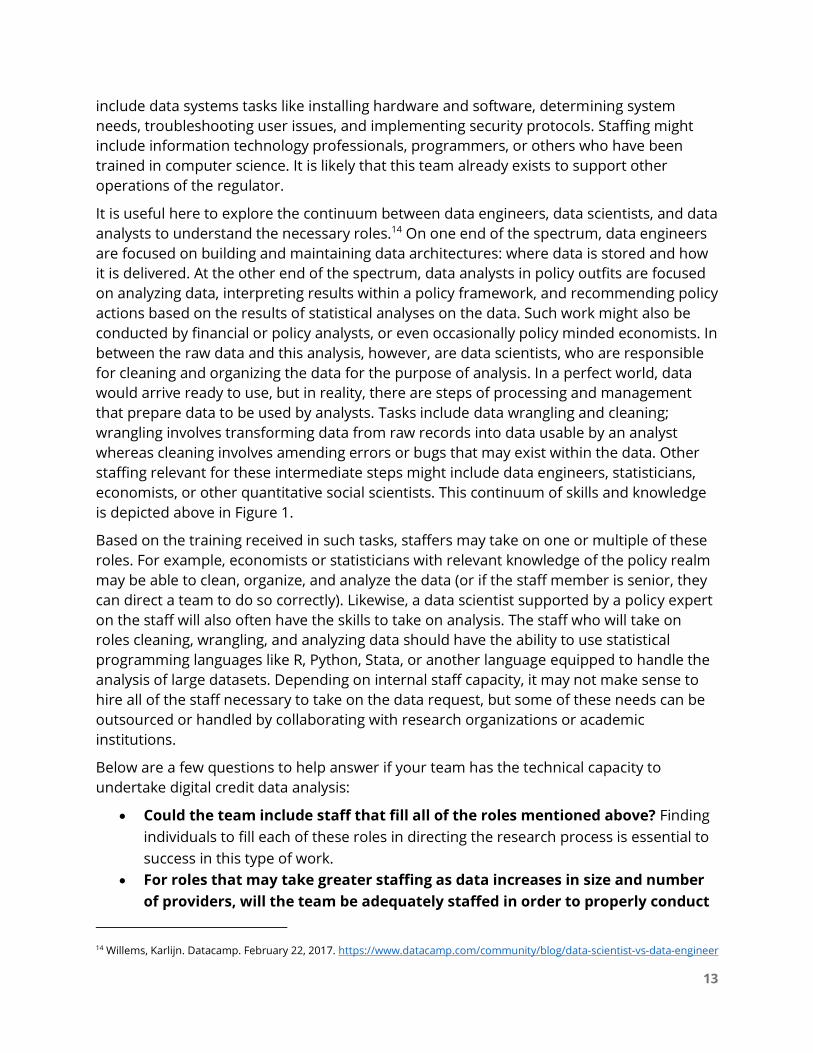
To better understand how these formulas are used in monitoring of the prices consumers
pay for credit, consider this example: There are four borrowers (Angie, Benny, Chloe, and
Danny) who have each taken out a 30-day loan at a 10 percent interest rate. Angie repays
early in order to make sure she does not forget to pay on time. Benny repays in full on time
at 30 days. Chloe is not able to pay on time but can get the cash together two weeks after
the loan is due and pays at 45 days and is charged a late fee of 10percent of the loan size.
Danny cannot obtain the cash but goes to an agent of the provider and asks to roll the loan
over for another 30 days, when he pays back the loan and a late fee of 10 percent. These
decisions and their resulting consequences in terms of CAPR, APR, and EAPR are outlined in
table 1.
the average loan for an average borrower, or the population weighted average. To do this, divide the total disbursed in each
account by the number of loans in each account. Then divide the total of the account level by the number of accounts to get
the population weighted average. While the first mean will faithfully describe the market average, from the perspective of
average consumer experience, it will assign higher weight to those who take more loans and lower value to those who take
fewer loans. With the heterogeneity in borrowing patterns among digital credit borrowers, they will likely differ, though
perhaps not hugely. Notably, in cases where only account level data is available, one may only be able to compute the
population level mean. Finally, it is often useful to compute the median of both statistics since the mean can be skewed from
by outliers. One can similarly apply this logic to the average tenure of loans, (assuming contracts are not fixed in length).
18
Borrower Effective
tenure
Provider fee
adjustment
Contracted
APR
APR Effective APR
Angie 15 (early) None 122% 122% 243%
Benny 30 (on time) None 122% 122% 122%
Chloe 45 (late) Late fee (10%) 122% 243% 162%
Danny 60 (late) Rollover (10%) 122% 243% 122%
Table 1: Comparison of Contracted, Actual, and Effective APR on a 30-day 10 percent Loan
How do these consumers fare? While all four received the same loan terms initially, Chloe
and Danny paid much more for the contracted term of the loan than Angie and Benny,
illustrated in the APR column of Table 1 (243 percent versus 122 percent). This figure
reflects extra late payment charges, however the figure does not reflect how Benny and
Danny gave themselves more time to pay off their loans, effectively reducing their APR by
increasing their effective tenure. By assessing the Effective APR, Angie received the worst
deal (243 percent), followed by Chloe (162 percent). Danny got an equal deal to Benny, who
repaid on time. The example illustrates why actual and Effective APR are useful measures
to understand the price of credit once consumer behavior is considered.
Consumers may not internalize the measures presented in Table 1. Many consumers
neglect the length of loans and focus on the total cost of lending or recognize the flexibility
of loan length but repay early as a commitment mechanism (i.e., if a consumer does not
repay when they first receive the money, they may use the funds elsewhere). For this
reason, it may be useful to report more basic measures of the price of borrowing:
potentially in the form of total paid to borrow or the total paid normalized by the value
disbursed.
Loan Repayment Behavior
Figure 2 plots the average time to repayment by account illustrating heterogeneity based
on when borrowers repay, ranging from an average of less than one day (4 percent of
borrowers) to the entire length of the loan repayment period.
Key to any consumer protection monitoring strategy is understanding loan repayment
behavior, including early and late repayment of loans, as well as outright defaults. Late
repayment (R2) and outright default (R3) may lead to late fees, accounts falling into
collections, or increasing indebtedness. In addition to the late fees noted above, when
consumers default, providers lose money and borrowers lose access to credit (from that
provider and often other players) or face less favorable terms for future loans.

19
While more often overlooked, early repayment (R4) is important to monitor, especially in
digital credit where it is common. Early repayment may have some benefits for consumers
such as making it possible to take larger subsequent loans or timely repayment of the loan;
however, when consumers pay early, they pay more in Effective APR for these loans, pay
more than they would if the loans were of shorter tenure, and are charged fees based on
this shorter tenure.
In order to more thoroughly assess early and late loan repayment, researchers could
compare the effective tenure of loans to the contracted tenure. Early repayment would be
defined as those consumers who repaid their loan before the due date and late repayment
defined as those who repaid later than the due date or not at all. Likewise, those who have
not paid in full by a certain number of days after the due date (often 90 days) are usually
considered in default.18
In order to assess concordance, it is worthwhile to check measures of due dates against
fees levied for overdue loans. For example, the CAK Digital Credit Market Inquiry assessed
default and late repayment at one provider to operationalize measures of these outcomes
by comparing repayment behavior against penalty fees paid by borrowers on these loans.
This analysis found that loans that had no penalties sometimes were not repaid in the first
month as one would expect them to be if they had a tenure of one month, but were always
repaid by the end of the second month (D. S. Putman 2021). This evidence suggests that
18 These are often also called non-performing loans.
Figure 2: Effective Tenure Visualization from CAK Digital Market Inquiry

20
penalties may actually be a better measure of late repayment. Figure 3 illustrates the
dynamics of repayment broken down by penalization.
Be careful when interpreting the results of such measures; The optimal rate of default is
not zero because there are trade-offs between financial inclusion and consumer
protection. While the risks stated above are obvious, from the perspective of financial
inclusion, and in this case increasing access to credit, extending credit to higher risk
populations will sometimes result in credit default. New applicants come with a thin file, or
little to no credit record. Despite the use of new data sources in digital credit, there is still
relatively little data to assess borrower creditworthiness. As the market matures and
algorithms improve, however, credit screening may improve, leading to a reduction in the
default rate without a reduction in the number of contracts offered given that this
screening process will become more informative. On the other hand, default rates may be
determined by the degree of risk tolerance of the provider. To diagnose these situations,
understanding default in the context of access is also important. For example, in the three
year period from 2016 to 2018, MicroSave Consulting found that the percentage of loans
that went into default fell from 24 percent to 9 percent over a period in which the number
of loans increased dramatically (MicroSave Consulting 2019).
Two other potential outcomes might happen that are related to late repayment; (1) Late
payment of a loan may not be subject to penalties but the borrower may still pay more in
other ways. For example, a loan could instead be automatically rolled over into a new loan
Figure 3: Repayment Dynamics from a Single Provider, CAK Digital Credit Market Inquiry

21
with an accompanying charge. As in the U.S. payday loan markets, automatic rollovers may
represent a consumer protection risk, in particular when unpaid interest is rolled into a
new loan with interest or fees of its own (Burke et al. 2014). Tracking outcomes like these in
addition to late repayment is useful; and 2) Consumers could renegotiate their loans after
realizing that they may not be able to pay on time. Re-negotiation may be less common
than rollovers but may also be an outcome worth tracking.
Concentration, Competition, and Market Power
Understanding the degree of concentration and competition within a market is a common
goal for supervision, often in the domain of competition regulators. However, this
competition mandate is closely related to consumer protection concerns. Assessing these
outcomes will help researchers better understand if FSPs hold market power and crucially
if they are able to capture a great share of market surplus (e.g., through raising prices or
reduced quality in their products).19
The Herfindahl-Hirschman Index (HHI, M4) is one such measure of concentration, which
takes the sum of squared market shares and accords with how competition economists
think about market power and concentration. A market with many equally sized firms (i.e.,
perfect competition) will achieve the lowest concentration metric and one with one large
firm (i.e., monopoly) will achieve the highest concentration metric (Shaffer and Spierdijk
2017). HHI can be computed in many different settings; To compute it in the digital loans
sector, use data on total accounts, loans, or value of lending at the firm level or on the
market shares directly. The Digital Credit Market Inquiry computed HHI using survey data
on the share of consumers who held loans from each given provider, finding an HHI of
1,946 for digital credit providers, which is a moderately concentrated market. A similar
calculation should be conducted with aggregate data from all providers in the market.
Use the HHI with caution; (1) For administrative data to be valid it is vitally important that
data be representative of the market, or drawn from all providers or that the market share
of omitted lenders can be estimated in some other way. If not, estimating this metric will
lead to an overestimation of the concentration in the market; (2) The interpretation of such
measures of concentration are not always easy to come by when it is difficult to define
what firms should or should not be included in the market (Kaplow 2015). For example, in
the context of digital credit, researchers could compute concentration without regard for
other markets in which credit might be obtained such as the microfinance market.
To learn more about the nature of the market, use the market shares metric (M5)
calculated in route to the HHI to compute other measures of concentration. For example,
the k-firm concentration ratio (M6) is the sum of the top 𝑘 market shares (often 𝑘 equals
three or four).
19 Market surplus is the willingness to pay for a product less the marginal cost of producing the unit consumed, or the sum of
producer surplus and consumer surplus. As producers can increase the marginal cost they can capture more of this surplus
as producer surplus.

22
There are many other options to study market power each, with its own advantages,
however, these measures often necessitate more than transaction data alone for proper
assessment (Shaffer and Spierdijk 2017).20
Borrower Switching Behavior
Before diving into consumer switching between providers and multiple borrowing, it is
important to define multiple account holding (MA1): Consumers who have taken loans
from multiple providers over the course of the sample period are considered multiple
account holders. However, multiple account holding is difficult to interpret definitively. In
particular, as explored below, multiple account holding could suggest that a borrower is
shopping around for the best deal, implying strong competition in the digital credit market.
However, it could also be evidence of a stressed credit information system and
overindebted consumers. In this circumstance, it is important to further assess consumer
switching behavior and any potential multiple borrowing.
While many of the methods noted above consider the number, size and distribution of
firms as the source of market power, other outcomes might contribute to market power
beyond the structure of the supply side of the market. For example, if it is costly for
consumers to move between firms, this could be a source of market power for firms even
when there are numerous competitors in the market. This is of particular interest when
credit information systems are not strong and therefore consumers who have borrowed
from one provider may face steeper prices when moving providers or may find it difficult to
get a loan with a limited credit history. In a situation where consumers are myopic (i.e., only
considering the price of their next loan), a lender might charge their existing borrowers an
interest rate just below the rate for new consumers (i.e., thin file) at competing firms, even
when such a consumer could bargain for a lower rate if other providers had information
about their past positive repayment and their creditworthiness.21
A powerful counterargument to this source of market power would be to document the
ability of consumers to switch between providers at minimal increased cost, or even
receive better rates when switching. One preliminary descriptive analysis that could be
undertaken is to identify the subset of borrowers who moved from one provider to
another, not due to default or late repayment, and document if these borrowers received
more favorable or less favorable terms in those loans at the new provider. For example, did
20 For example, direct computation of the Lerner Index requires information about the marginal cost of lending. While with
transaction date it is possible to compute the marginal cost of default and the risk-free rate, access to the marginal cost of
disbursing and approving loans is rare, though reasonable assumptions might be made. Similarly, van Leuvensteijn et al.
(2007) require knowledge of costs to compute profits. Many others involve econometric estimation of demand elasticities
which requires exogenous variation in input prices to be done credibly (Bresnahan 1982; Lau 1982; Shaffer and Spierdijk
2015). The content of an information request is mismatched in these cases: too detailed of data in some cases and not
enough data in other cases.
21 This view of this credit market is reminiscent of explanations of informal credit markets where asymmetric information
allows for kind of monopolistic competition. In particular, since there is no credit information system in these markets,
lenders must buy information on borrowers’ creditworthiness by obtaining information on potential borrowers (Hoff and
Stiglitz 1993).

23
loan size and the cost of credit rise or fall for those consumers?22 While the presence of
widespread switching with limited cost might provide evidence indicating that there is an
ability for consumers to switch providers, the absence of switching is more difficult to
interpret; In particular, competition does not always depend on actual switching but rather
the credible threat of moving to another provider by consumers who feel they are paying
too much. However, an absence of switching would be consistent with a case pointing to
this potential source of market power. Such data requests, when they feature data around
multiple account holding and borrowing from multiple providers, are uniquely positioned
to document such loan terms and switching behavior.
There are several outcomes which could be useful to measure as a means to document
switching in digital credit; (1) To document the ability for consumers to move between
providers, we can document loans taken from multiple providers that do not overlap (i.e.,
the due date of the first loan does not occur after the second loan is taken). Borrows who
engage in this behavior and not multiple borrowing are switching borrowing (MA3); (2) To
document the cost of moving from provider to provider, comparing the terms of the loans
will also be important. Contract outcomes from the first loan after switching to the last loan
before switching can be compared by checking if the amount disbursed increased or
decreased, the tenure changed, and if the contracted APR rose or fell. If these are fairly
static, and switching is relatively common, this should help to rule out monopolistic
competition in the credit market.
Multiple Borrowing
Measurement of switching behavior is complicated by the issue of multiple borrowing.
While switching providers may provide an antidote to market power, borrowing from two
providers simultaneously may signify a different problem for consumers in these markets.
As in the case of measuring switching behavior, detailed data can yield distinguishing
features which allow us to differentiate multiple account holding that arises due to
provider switching from multiple account holding due to multiple borrowing.
Multiple borrowing (MA2) is when a consumer takes simultaneous loans (i.e., beginning at
the same time) or overlapping loans (i.e., one begins before the other ends) from more
than one provider.23 An expanded definition of multiple borrowing might also include loans
taken at a different provider directly after a loan has been repaid. This behavior could be
defined as multiple borrowing if the first loan was taken to repay the second, even though
22 This analysis is preliminary because there are at least two unresolved causal inference challenges posed here; (1) Those
who move may have unobservable differences from those who do not move (these differences may even cause them to
move), making it difficult to find a viable control group to compare them to; and (2) There is the issue of external validity. That
is, it may be the case that some more creditworthy consumers can move at low cost, but those who do not move may decide
not to switch because it is a higher cost for them to do so.
23 In cases where there is a discount for repaying early, it might make sense for borrowers to take re-financing loans from a
second bank if they can obtain a lower interest rate. This might appear to be a concerning form of multiple borrowing, but it
does not increase risk to the lending sector and actively improves the financial situation of the borrower. However, this
situation is not as relevant in digital credit markets since early repayment is often not rewarded, ruling out such (rational)
refinancing behavior.

24
no overlap took place. This type of subsequent borrowing may also be a metric to track
independently of overlapping borrowing.
Borrower Second loan Multiple
Borrowing
Switching Explanation 𝐀𝐏𝐑𝑨 𝐀𝐏𝐑𝑩
Esther From B, just
after first
loan
Yes No Combines her loans to
relax credit constraint
10% 15%
Frederick From B, just
before
repaying first
loan
Yes No Uses the second loan
to pay first
10% 10%
Grace From A, after
repaying A
No No Does not switch - no
benefit
10% 10%
Hassan From A, after
repaying A
No No
Does not switch -
worse rate
10% 15%
Innocent From B, after
repaying A
No Yes Switches to B for
better rate
10% 5%
Table 2: Comparison of Multiple and Switching Borrowers
Table 2 depicts a number of possible situations that borrowers might face exemplified
through an example of five borrowers; Esther and Frederick each multiple borrow for
different reasons. Esther takes two loans at the same time immediately, to gather the
amount of capital she seeks, while Frederick takes a second loan to repay the first. In the
case of Esther, the second loan is more expensive than the first, meaning she pays more
than if she could have borrowed entirely from Provider A. Grace, Hassan, and Innocent are
all looking to potentially switch lenders in order to receive a lower price. However, after
inquiring about their price of credit at Provider B, Grace and Hassan find no benefit from
switching. Hassan’s loan from provider B would be worse. Innocent borrows from Provider
B because he can receive a lower rate there. Innocent’s loan is an example of why it is
important to be careful when interpreting multiple accounts as harmful.
Several precautions need be taken when seeking to measure the rate of multiple
borrowing. Three main concerns exist in measuring the rate of multiple borrowing in the
digital credit space: coverage of providers, sampling of consumers, and the fidelity of
identifiers as explored below:
• Coverage of Providers: In order to estimate the rate of multiple borrowing, the
data should have good coverage of providers – many providers are included in the

25
study. If all providers are not accounted for, the reported rate of multiple borrowing
will be a lower bound for the rate of multiple borrowing among consumers. If the
study has data from all but one provider, adding this last provider may result in new
multiple borrowers being identified but will never reduce the number of multiple
borrowers. Therefore, the estimate can only increase as providers are added. As of
yet, it is unclear how informative this lower bound is when most providers are not
observed, though it serves as a proxy given that a large portion of the market is
covered. In situations where a provider makes up a large market share and when
there are fewer providers overall, it may be easier to reach substantial coverage of
the market with a study. In particular, this lower bound argument is true when
borrowers tend to multiple borrow at similar rates at different institutions.
However, it may be that smaller providers have outsized influence on multiple
borrowing.24
• Sampling of Customers: Sample of customers is important when accurately
measuring multiple borrowing. In particular, when samples from different providers
are not constructed to contain the same individuals, this may result in significant
underreporting of multiple account holding (and therefore borrowing, and
switching), even when there are only two providers. That is, if we take a sample of
consumers from Provider A’s accounts and from Provider B’s accounts, we will face
underreporting. In fact, this lower bound may not be informative about how much
multiple borrowing actually exists and may be an artifact of the sampling rate.25
However, if able to construct a common sample of consumers to take from all
providers (i.e., collect data on those sampled consumers if they have an account at
that provider), this will yield valid estimates of the rate of multiple account holding.
One such approach would be to randomly sample phone numbers that consumers
use to sign up for accounts, much like a Random Digit Dial survey method26.
• Fidelity of Identifying Variable: The measurement of multiple borrowing may
suffer depending on the fidelity of the identifying27 variable used to link borrowers.
National identification or financial numbers after they have been hashed (See
Section II on Data Security for more information) may serve as much better markers
of identity than phone numbers. For example, where multiple telecommunications
24 For example, for one smaller lender in the CAK Digital Credit Market Inquiry, we found over 60% of borrowers had accounts
at one of three other providers in our sample, a higher rate than among the larger providers
25 More precisely, if one sample of consumers is taken from accounts at Provider A and a different sample is taken from
accounts at Provider B, if the rate of account holding (the probability a consumer has an account at provider A or at B,
assumed equal) exceeds the sampling rate, then the observed rate of multiple borrowing will equal the rate which would
have occurred if the rate of account holding equals the sampling rate. Therefore, the multiple borrowing rate would be an
artifact of the sampling rate (author’s own simulation work, unpublished). 26 The Random digital dialing survey method is a method for selecting people for involvement in telephone statistical surveys
by generating telephone numbers at random.
27 Literally meaning “the degree to which the detail and quality of an original, such as a picture, sound, or story, is copied
exactly:.” https://dictionary.cambridge.org/us/dictionary/english/fidelity

26
providers exist, it may not be difficult to keep a phone number with each and take
loans from different digital credit providers using these different numbers. Some
digital lenders require SIM cards of a particular telecommunications provider to
access their loan product, so consumers may use multiple SIMs in such situations.
Much worse are names listed, which may be misspelled or translated incorrectly.
However, researchers may only have access to a lower fidelity identifier, such as
phone number, if the other data is not available or is deemed too sensitive to
collect.
Once multiple borrowers have been identified, understanding their behavior can be quite
interesting, especially measures of how multiple borrowing relates to indebtedness. One
approach would be to directly measure total indebtedness by these borrowers. To do this,
one can compute daily totals owed by tracking loans taken, fees, and repayments made by
date, and aggregating these into a timeline of total indebtedness. In turn, this can be used
to compute average indebtedness for that consumer throughout the course of the sample.
Alternatively, one could study the correlation between multiple borrowing behavior and
eventual default, either at the loan level or the account level.
Figure 4: Late Repayment and Default by Multiple Borrowing Behavior, CAK Digital Credit Market Inquiry
The Digital Credit Market Inquiry finds that those who could be observed taking
overlapping loans from multiple sources eventually repaid late and defaulted at a higher

27
rate than other borrowers (see Figure 4). Interestingly, those who multiple borrowed but
also took overlapping loans or repaid early to the same provider were less likely to default
or be late on their loan repayments (D. S. Putman 2021).
Over Indebtedness
Over indebtedness remains a difficult outcome to measure and monitor because it is
challenging to measure the optimal level of credit for borrowers. While more credit might
allow for the possibility of increases in capital for those with greater entrepreneurial skill
(Banerjee et al. 2019), for others it may lead to being overleveraged. A few of the outcomes
already covered may help diagnose symptoms or signs of over indebtedness. In particular,
default and late repayment are often thought of as having over indebtedness as their
proximate cause, though default may also happen when borrowers are not overindebted
(Garz et al. 2020).28 Multiple borrowing behavior is related to over indebtedness, and may
be another indicator to calculate indebtedness (Chichaibelu and Waibel 2017). Even if there
are individual exceptions where borrowers exhibit these traits but are not truly
overindebted or in debt stress, when assessing data across a market or a specific lender’s
portfolio, these indicators can give signals as to the general financial health of borrowers in
loan portfolios.
Administrative data might also be used to characterize total indebtedness. For example,
researchers can track how consumers’ debt varies in any given year for those who multiple
borrow from two providers. With this information, maximum indebtedness, average
indebtedness, and other statistics can be characterized at the borrower level. Moreover,
given credit limits at individual providers, how much more borrowers have taken out in
comparison to these credit limits can also be characterized.
Other approaches might consider indebtedness using firm level data. Work from Dvara
research includes several practical suggestions considering aggregate indebtedness to
Gross Domestic Product by location yielding an aggregate debt to income ratio
(Bhattacharya et al. 2021).
Credit Applications
In some cases, it may be possible to collect information about credit applications in
addition to transaction data. Using these records, one could learn about credit screening by
providers. A number of aggregate statistics might be computed from this data; (1) It is
possible to compute the approval rate (A1).29 This is a useful data point, though it is
important to remember that, on its own, a given approval rate might be due to a number
of different factors. A high approval rate might be indicative of strong creditworthiness of
applicants or a credit environment that allows easy access to credit in spite of
creditworthiness; (2) Other outcomes that might come from applications include the
number of applications (A2) a given borrower attempted before being approved for a loan,
28 Consider, for example, classic strategic default. 29 Or compute the rejection rate in order to frame the analysis differently.
28
and if a borrower was approved for multiple loans, but took only one; and (3) The final
outcome indicates shopping around, which might be a sign of a competitive credit market.
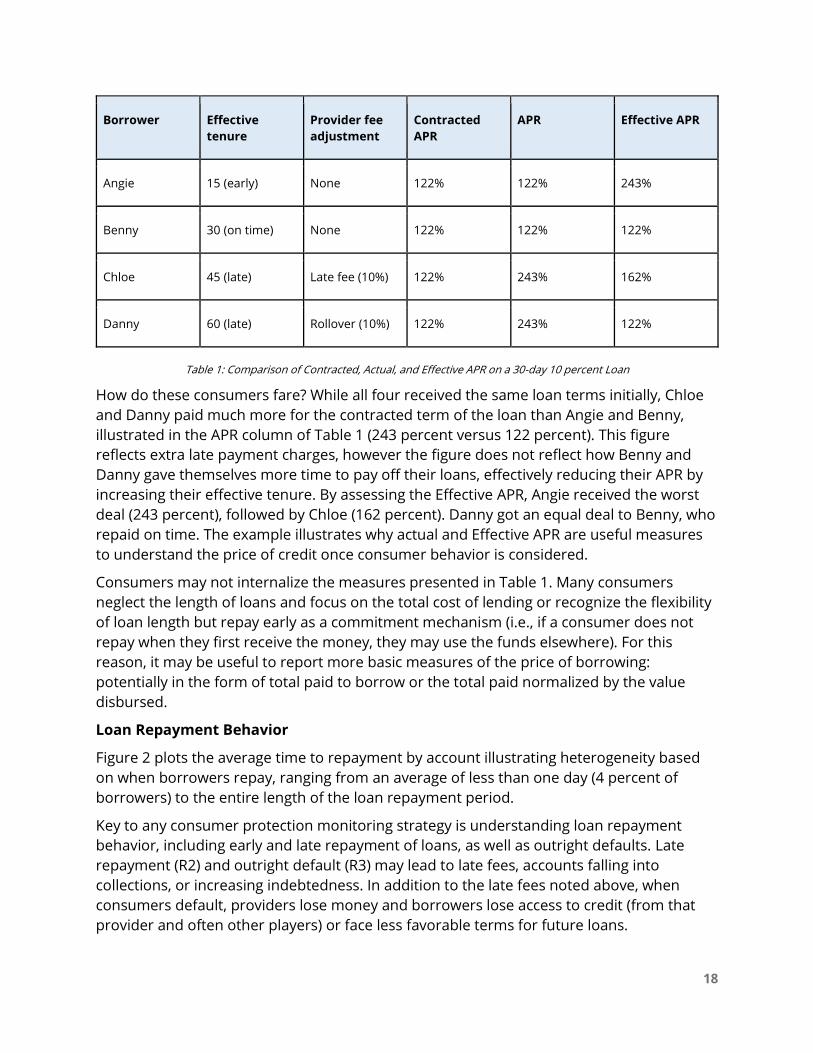
Providers may or may not collect this data but it may be possible to link transaction data to
credit bureau data in order to study applications. This will be informative to the analysis if
providers are querying credit bureaus when borrowers apply for loans. This data could also
enrich the analysis even when provider applications data is available. For example, if credit
bureau data might include variables like credit scoring, which could contribute to analyses
like those of risk-based pricing.
CONSUMER SEGMENTATION
Consumer segmentation helps better understand which consumer groups have a
higher concertation of risks. Consumers can be segmented according to observable
characteristics including age, gender, occupation, and income. This type of segmentation
remains important to monitor for differential outcomes that might suggest unfair
treatment or poor suitability of products for consumers in different groups. Demographic
segmentation addresses how risks are concentrated on particular consumer group such as
assessing the average APR for receiving credit. While the reasons for any observed
differences may be nuanced, they may point to differences in consumer profiles by gender
as well as differences in treatment (i.e., in the screening process). Of course, the latter of
these two possibilities represents a serious claim, in particular if it is suspected that explicit
discrimination is at play. However, a simple difference in means will often not suffice as
evidence of disclination or unfair treatment. Evidence of discrimination often comes as
evidence from audit studies like those undertaken by Montoya et al. (2020) and Hernández-
Trillo and Martínez-Gutiérrez (2021).30 Other outcomes can be compared by gender beyond
price, such as loan size.
Likewise, understanding the distribution of outcomes by age cohorts may also help us
understand if credit products are suitable, though this also comes with disclaimers. For
example, multiple analyses of Kenyan data have found that younger borrowers defaulted
at higher rates (MicroSave Consulting 2019; D. Putman et al. 2021). These defaults could
impact the credit terms available to them for years after. However, the disclaimer here is
that there are natural life cycle effects in credit; Younger consumers often have less credit
history, making it more difficult for lenders to assess who will repay their loans.
Data visualization was utilized to explore segmentation in the Digital Credit Market Inquiry,
as can be seen in Figures 5 and 6. Figure 5 plots the distributions of men and women’s
average loan sizes as well as the market average for men and women. While it is not fully
apparent in the plotted distribution of average loan size, one can see from the means that
we found that women tended to receive smaller loans on average. The administrative data
30 Even then, applied microeconomics sets a high (though not unreasonable) bar for the measurement of discrimination, see
Heckman (1998) for some of the methodological reasons.

29
can be used to check possible explanations for this gender difference. For example, one
hypothesis to explain this would be that if more male borrowers are middle aged, they
might receive larger loans on average. However, when the smoothed conditional means by
gender and age are plotted in Figure 6, this outcome can be ruled out (although the life
cycle effect is evidenced).31 Men tended to receive larger loans at all ages (D. Putman et al.
2021). Importantly, demographic data may not always accurate (i.e., there is a high
proportion of data where no gender is reported in Figure 5). Those without gender data
tend to also receive smaller loans on average. Therefore, the average loan size for both
men and women will likely be overstated in data in which gender information is not
present. Furthermore, if there is a difference in the propensity for gender data to be
omitted between genders, this would also skew the gender differences in average loan size.
31 These smoothed conditional means are plotted using geom_smooth() from ggplot2 in R. In particular, this method uses
penalized regression splines as it is default behavior for plotting large datasets: Tidyverse; ggplot2. Updated regularly.
https://ggplot2.tidyverse.org/reference/geom_smooth.html
Figure 5: Distribution of Average Loan Size Disaggregated by Gender, CAK Digital Credit Market Inquiry

30
For from vendors who are less likely to enter their gender compared to men, this will lead
to understating the differences in average loan size. Alternatively, gender may be better
captured on new accounts as more emphasis has been placed on know your customer
initiatives.32 In this case if women have newer accounts, the differences are overstated
between men and women’s loan sizes. Whatever the case may be, researchers should be
aware of how missing data might change conclusions within certain contexts.
In addition to demographic information, it may be useful to segment consumers via
geography. In particular, when considering product suitability, it may be the case that rural
consumers differ from their urban counterparts in terms of what they demand from credit.
For example, agricultural credit often may not be best served by the short timeline offered
by digital credit products if credit is used for input loans.33 While such input loans represent
high productivity uses of credit, they best serve farmers when they are able to repay after
harvest, several months after the loan has been disbursed. For example, Izaguirre et al.
(2018) segments digital credit lending in Tanzania by region, finding that the relatively rural
regions in the west and north have less account penetration and feature worse repayment
rates.
32 Know your client (or KYC) guidelines in financial services require that FSPs verify the identity, suitability, and risks involved
with a client. In this case, verifying the identity involves collecting vital information such as gender of the client. 33 Input loans are offered through local retailers allowing the client to purchase and finance their inputs at the same time.
Figure 6: Mean Average Loan Size Disaggregated by Gender and Age, CAK Digital Credit Market Inquiry

31
When data on income, wealth, and occupation is available, this can similarly be used to
segment consumers. Small loans may also be taken by wealthy individuals for the sake of
convenience as opposed to need. For example, in the case of airtime loans34, it may be the
case that while a borrower's airtime is low, this is because they have not had the
opportunity to travel to an agent to top up, or add credit, their account (Barriga-Cabanillas
and Lybbert, 2020).
Goal Relevant characteristics Method(s)
Explore differences in
consumer outcomes
by consumer
characteristics
● Gender
● Age
● Occupation
● Income and wealth
● Estimate averages of outcomes by
characteristics (e.g., men's average loan vs
women's average loan size)
● Test statistical differences in outcomes by
characteristics (e.g., difference in men and
women's average loan size)
● Plot means over continuous variables (e.g.,
average loan size over age)
Explore differences in
consumer outcomes
by provider and
product
characteristics
● Provider regulatory status
● Delivery channel (e.g.,
USSD/SIM Toolkit v. App)
● Product features
● Lender size
● Estimate averages of outcomes by provider
characteristics (e.g., average APR for app-
based lending v. USSD)
● Test statistical differences in consumer
outcomes by provider characteristics (e.g.,
difference in APR between app-based lenders
and USSD)
● Plot means over continuous variables (e.g.,
average APR over lender size)
Explore seasonality
and market evolution
● Date and time
● Years, Quarters or
Months
● Estimate growth rate in lending by providers
● Visualize trends over time (e.g., number of
disbursements by month by provider)
● Estimate seasonal trends using fixed effects
regression
To segment
borrowers into
different behavioral
groups with different
policy needs
Consumer protection
outcomes, e.g.,
● Loan size
● APR
● Time to repayment
● Default
● Multiple borrowing
● Use cluster analysis (e.g., PCA) on borrower
outcomes to identify similar groups of
consumers
● These groups may be higher and lower risk or
face different risks from digital credit
● Determine demographic characteristics of
different consumer groups
Table 3: Methods for Data Segmentation
34 Airtime loans are a form of digital credit provided by telecoms that provide prepaid customers small airtime advances for a
fee.

32
Demographic segmentation may also provide important clues to how risks will evolve as
digital credit expands the reach of credit products to traditionally excluded consumers. If
products are not suitable for these consumers, such issues may increase with a changing
composition of consumers.
ADDITIONAL EXAMPLES OF SEGMENTATION
When measuring consumer protection risks in a market, it is useful to consider the
evolution of the market over time to identify new risks or measure reductions in risk
as markets mature or new consumer protection policies are introduced. For example,
the Digital Credit Market Inquiry captures a period of considerable change in the digital
credit market, in particular, a new overdraft product was launched and became the
dominant product over the course of the period. Since these disbursements (or rather
overdrafts) tended to be smaller in size than the average loan, the overdraft product down
the average loan disbursement size in the sample analyzed in the Inquiry (D. Putman et al.
2021). This evolution is illustrated in Figures 7 and 8.
While tracking outcomes over time is beneficial, it is also important to consider seasonality.
When agriculture is the main source of lending, tracking seasonality is essential because
lending outcomes may be correlated with growing seasons. However, school fees, holidays,
or other seasonal events might also drive variation in lending throughout the year in other
contexts. When measuring seasonality is important to have at least two years of
Figure 7: Evolution of Total Value of Loans Disbursed Disaggregated by Provider and Product, CAK Digital Credit Market Inquiry
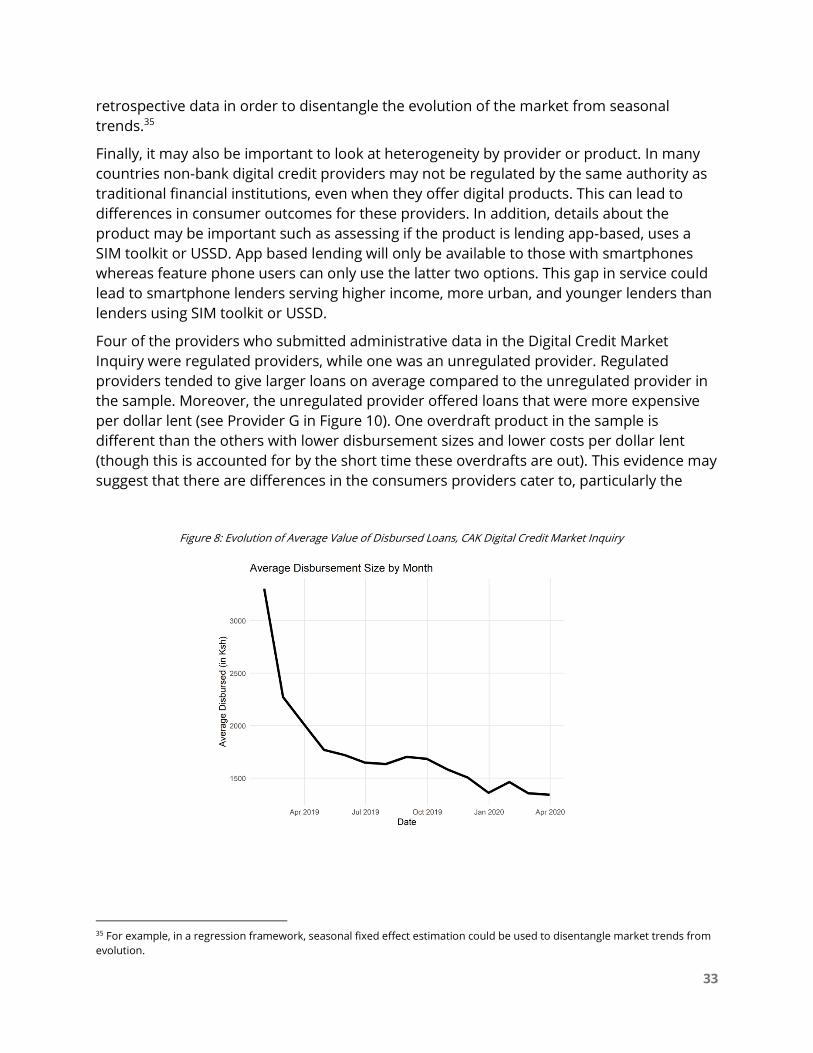
33
retrospective data in order to disentangle the evolution of the market from seasonal
trends.35
Finally, it may also be important to look at heterogeneity by provider or product. In many
countries non-bank digital credit providers may not be regulated by the same authority as
traditional financial institutions, even when they offer digital products. This can lead to
differences in consumer outcomes for these providers. In addition, details about the
product may be important such as assessing if the product is lending app-based, uses a
SIM toolkit or USSD. App based lending will only be available to those with smartphones
whereas feature phone users can only use the latter two options. This gap in service could
lead to smartphone lenders serving higher income, more urban, and younger lenders than
lenders using SIM toolkit or USSD.
Four of the providers who submitted administrative data in the Digital Credit Market
Inquiry were regulated providers, while one was an unregulated provider. Regulated
providers tended to give larger loans on average compared to the unregulated provider in
the sample. Moreover, the unregulated provider offered loans that were more expensive
per dollar lent (see Provider G in Figure 10). One overdraft product in the sample is
different than the others with lower disbursement sizes and lower costs per dollar lent
(though this is accounted for by the short time these overdrafts are out). This evidence may
suggest that there are differences in the consumers providers cater to, particularly the
35 For example, in a regression framework, seasonal fixed effect estimation could be used to disentangle market trends from
evolution.
Figure 8: Evolution of Average Value of Disbursed Loans, CAK Digital Credit Market Inquiry

34
unregulated providers such as digital lenders which provide fewer and and/or high risk
options.
Figure 9: Evolution of Average Loan Size by Product, CAK Digital Credit Market Inquiry
Market Inquiry
Figure 10: Evolution of Fees to Value Disbursed Disaggregated by Product, CAK Digital Credit Market Inquiry
Market Inquiry

35
CLUSTER ANALYSIS SEGMENTATION
In addition to comparisons of outcomes by observable characteristics, one can use
clustering algorithms and consumer protection outcomes to construct subsets of
consumers who face similar issues to similar degrees. Clustering algorithms can
simplify complex data by finding a few individuals representative of the population. This
data driven exploration of heterogeneity in outcomes offers an alternative market
monitoring tool for those that employ it. What the data driven tool uncovers may serve as
the first step in a policy process to find solutions targeted at groups of consumers who
behave similarly.
The Digital Credit Market Inquiry segments users who held multiple accounts by their early
borrowing and multiple borrowing behavior, using a wide number of variables. Using a
clustering algorithm called 𝑘-means clustering, the study finds five similar groups
illustrated in Figure 11. Highest usage borrowers are not necessarily the riskiest; The study
was able to identify cross-provider borrowers36 as being more likely to default on a loan
throughout the course of the sample as compared to early and revolving borrowers and
highest usage borrowers. This led to two different policy recommendations targeted at
heterogeneous borrowers. For those who repay and borrow again early, the main risk is
not default, but instead the cost of servicing interest. For those who are defaulting and are
able to take out multiple loans from different providers, it’s recommended that all
36 Borrowers who borrowed from multiple providers.
Figure 9: Clustering of Multiple Account Holders Revealed Different Borrowers Faced Different Risks, CAK Digital Credit Market
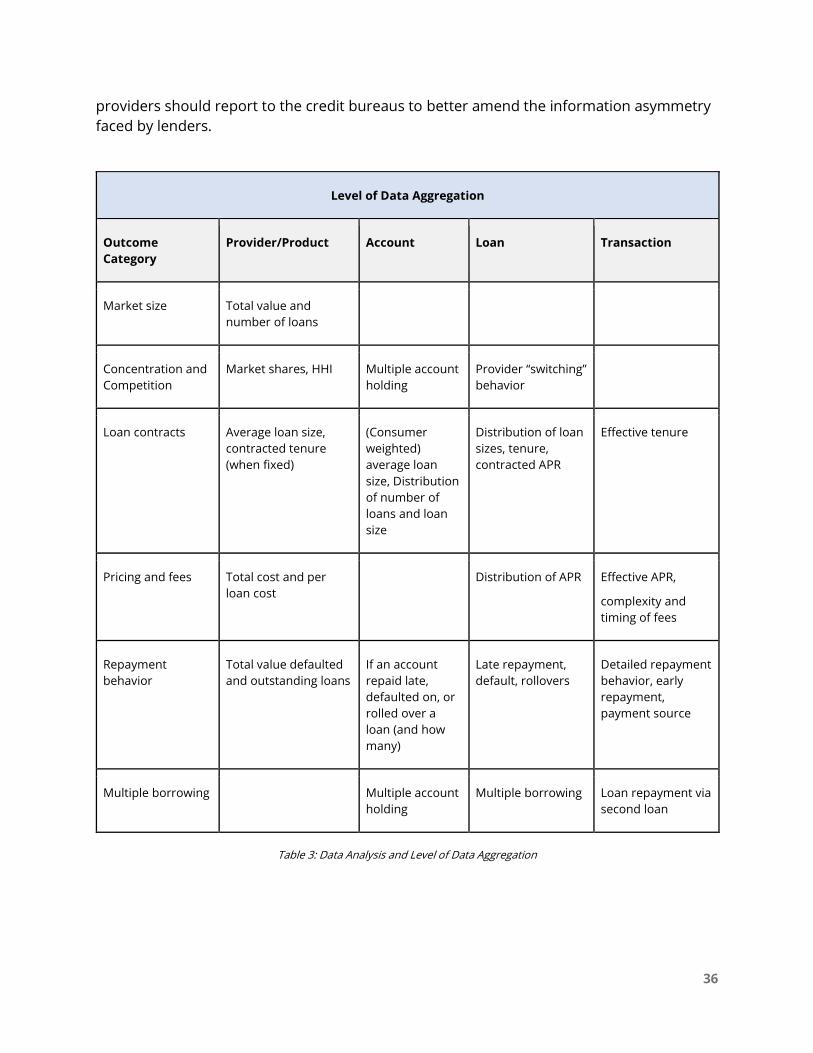
36
providers should report to the credit bureaus to better amend the information asymmetry
faced by lenders.
Level of Data Aggregation
Outcome
Category
Provider/Product Account Loan Transaction
Market size Total value and
number of loans
Concentration and
Competition
Market shares, HHI Multiple account
holding
Provider “switching”
behavior
Loan contracts Average loan size,
contracted tenure
(when fixed)
(Consumer
weighted)
average loan
size, Distribution
of number of
loans and loan
size
Distribution of loan
sizes, tenure,
contracted APR
Effective tenure
Pricing and fees Total cost and per
loan cost
Distribution of APR Effective APR,
complexity and
timing of fees
Repayment
behavior
Total value defaulted
and outstanding loans
If an account
repaid late,
defaulted on, or
rolled over a
loan (and how
many)
Late repayment,
default, rollovers
Detailed repayment
behavior, early
repayment,
payment source
Multiple borrowing Multiple account
holding
Multiple borrowing Loan repayment via
second loan
Table 3: Data Analysis and Level of Data Aggregation

37
Level of Aggregation
One of the most important decisions to be made in any data request is in the level of
aggregation because it will determine the degree of detail an information request will be
able to provide about consumer behavior and consumer protection outcomes. This section
introduces levels of aggregation and what they mean for the analysis described earlier in
the toolkit. The Making a Request section outlines templates for different aggregations of
data.
When considering different types of data, one major difference is the level of aggregation
of the data with respect to the providers’ administrative records. There are four levels of
interest with credit data requests; (1) provider/product level; (2) account level; (3) loan level;
and (4) transaction level.37 Among the latter three levels of disaggregation—product,
account, and loan level—there is a further difference in the ability to link this data to survey
or other data (see box “Linking De-Identified Data”).
There are trade-offs when considering the level at which to request data. While more
aggregated data is easier to transfer, store, and analyze, it is less detailed and will limit the
types of monitoring activities that are possible. Table 4 documents how the possible
analysis of digital credit data increases as the data becomes more disaggregated.
Importantly, it is possible to aggregate on the loan level given that all the relevant
information is included in transaction level data. Likewise, loan data can be aggregated to
the account level, and so on: More disaggregated datasets give access to their aggregates.
PROVIDER AND PRODUCT LEVEL DATA
The most common form of data used by regulatory agencies includes data that has
been aggregated to the provider level. This data gives us access to information on the
total size of the market and average characteristics of individual accounts or loans which
can be useful in understanding the broad trends of digital credit usage. With the total
amount disbursed and the number of loans, the mean loan size, total cost, and fees per
loan can be computed. Market concentration measures and can use some measures of
loan defaults (in this case using counts of total defaults) can also be computed (Table 4).38
37 Many other disaggregations might exist at the provider level, for example, provider level data could be disaggregated by
sex, age, or location.
38 Such data is commonly used for other types of monitoring like systemic risk. However, existing formats often emphasize a
provider centric purpose (i.e., a regulator interested in systemic risk might want to know the capitalization of a given bank to
understand if that bank is undercapitalized at a given point in time). It may be difficult to track consumer default rates over
time if it provides data like total value disbursed and total defaulted, at least without making further assumptions about loan
length.

38
ACCOUNT LEVEL DATA
Account level data opens up a number of new topics that could be studied pertaining
consumer behavior and experiences in the market overall. In particular, account level
identifiers can illustrate if individuals hold an account at multiple providers (multiple
account holding). Likewise, by capturing the total loan in each account and the number of
loans held by each account, it is possible to determine the average loan size at the account
level. Likewise, at the provider level it’s possible to discern the average loan size at the
market level, and additionally determine the standard deviation and the distribution.
Outcomes can be assessed not only for the average consumer, but also for those with the
worse outcomes (e.g., it is possible to assess the maximum cost paid for loans as a fraction
of total disbursement and analyze outliers who pay significantly more for credit). Finally, at
the account level, we can assess if loans were ever late or ever defaulted upon.
However, the move from provider level aggregates to account level data represents a large
increase in the volume of data, with one record for each consumer. While provider level
data may be in the hundreds, consumers are in the hundreds of thousands or millions.
LOAN LEVEL DATA
Loan level data expands the possible analysis and does not add as much complexity
like assessing provider to account level data. With this data, it is possible to analyze the
distributions of outcomes such as loan sizes and costs, including statistics like the standard
deviation. Additionally, researchers are granted access to tenure for each individual loan
and thus, very useful measures of price including APR. It is possible to determine when
loans were disbursed and repaid and can help in gauging switching behavior between
competitors. Finally, with loan level data, researchers can evaluate late repayment, default,
rollovers, and multiple borrowing.
The move to loan level data increases the size of the data appreciably: the increase is
roughly proportional to the number of loans taken by the average consumer in a year. If
loans are uncommon, this difference might not be considerable.
TRANSACTIONAL LEVEL DATA
Finally, transaction level data disaggregates this data into individual transactions, which
could allow for a much more detailed assessment of consumer behavior depending on
what transactions are recorded by the digital credit provider (e.g., detailed repayment
behavior such as how long it took for borrowers to repay loans and if this repayment and
when the repayment occurred). The digital credit market inquiry finds that many
consumers who repaid significantly ahead of time, which influenced the policy
recommendations (D. Putman et al. 2021). Researchers can assess effective tenure and

39
additional measures of APR, like effective APR with transaction level data. The frequency
with which fees are charged, how late fees are applied in practice, and when they are
applied can be analyzed. Finally, the data allows for multiple borrowing assessments (i.e.,
checking if loans might have been taken out to repay previous loans).
Beyond increasing the size of the data appreciably (at least double the size of loan level
data), the freedom and detail afforded by transaction level data also means that the data
must be cleaned at the individual transaction level.
Beyond Descriptive Analysis: Predictive Analytics and
Policy Analysis
The analysis so far can be categorized as descriptive, which means that the goal of the
work is to generate basic knowledge on consumer protection outcomes, understand the
average of these statistics, their distribution, how they correlate with each other. In this
section two further types of analysis are introduced; (1) predictive analytics; and (2) causal
inference. Where descriptive work focuses on understanding the outcomes, predictive
analytics focuses on predicting those outcomes using correlated data. These analyses are
convenient when data is not (or cannot be) available at the time of decision-making (e.g.,
credit default). On the other hand, causal inference is focused not on the value of the
outcomes, but to establish in credible ways how they are impacted by policies or other
factors. The tools of causal inference become useful in order to establish how a policy
intervention will influence consumer protection issues. Additionally, causal inference
methods can add depth to the understanding of what elements of financial products pose
risks to consumers.
PREDICTIVE ANALYTICS
Predictive analytics is the use of statistical and machine learning techniques with
past data to predict future outcomes. Use of predictive analytics may be valuable to
consumer protection regulators in at least two ways when tracking digital credit outcomes;
1. Transaction level data and machine learning might be used to predict important
outcomes that are difficult or expensive to track. For example, when considering
outcomes that tend to be measured by surveys (e.g., such as over indebtedness
measures) regulators cannot track activity in between surveys due to high cost. By
measuring these outcomes once via a survey and using administrative data to
predict future outcomes, regulators have a general sense of how these outcomes
evolve even in between surveys.

40
2. Where reporting lags its real-time value, a prediction of this value may allow
regulators to be more informed about present issues. This might give a regulator
data several months in advance of when it would be reported, allowing crucial
preparation time when actions might need to be taken.
Each of these methods is described in detail below. Importantly, such work may require
employing a data scientist, economist, or statistician who has access to the relevant tools
for predictive analysis, particularly machine learning. With proper staffing, the benefits
might include faster inputs to policy actions and a reduced cost to supervision.
Using Transaction Data to Predict Consumer Protection Outcomes
Administrative data serves as a useful tool to predict consumer protection outcomes. It is
often detailed, rich, and covers a large number of individuals. At the same time, it is
passively collected and therefore cheap given its size and richness. In the case of
transaction level data, many different measures can be constructed from the individual
Merging Administrative Data with Other Data Sources
Administrative data is useful on its own but can be used in combination with other data sources for
even greater effect. Some of the most compelling results are from identifiers with high fidelity, which may
include identifiers like national identification numbers or phone numbers. Of these two options, national
identification numbers are more useful because an individual will have only one identification number. Phone
numbers, in contrast, may not always succeed in linking individuals because they may have multiple sim
cards linked to separate accounts for different financial products or use a different phone number for bank
transfers versus phone calls. Names can serve as a reasonable identifier if there is consistency in the naming
conventions, however, due to the commonality between some first and last names there may be false links
between distinct individuals with the same names. Therefore, names could be matched with the help of
additional indirect identifiers to reduce the false positives. Additionally, names may be misspelled when it is
not essential to business to record them correctly or when they are transliterated into the Roman alphabet
with multiple valid spellings, which could complicate matching names over multiple datasets.
An alternative approach is to use geographic data when datasets have geographic identifiers (i.e., a
number of observations in each location). Then administrative data can be aggregated to these geographic
units and matched with other data collected at those units. For example, Raval (2020) uses administrative
data from anti-fraud actions, complaints data, and the American Community Survey in order to understand
consumer complaints when they are victims of fraud.
Researchers can also use the fuzzy matching method, which matching queries that have similar
values across a number of variables. This method may be difficult if only de-identified data is available;
records that were once similar may return very different values after hashing, example “Jon” and “John” might
return considerably different strings once passed through a hashing algorithm, (Harron et al. 2017). For these
cases, there are innovative methods from computer science, though these will take significant additional
investment in human capital (Pita et al., 2015).
There are some limitations when merging survey data even when a feasible solution is found (e.g.,
issues with statistical power in impact evaluations). Likewise, when merging administrative data with
survey data, informed consent needs be obtained from survey respondents. This can lead to non-consent
biases, however, these biases are may be mild compared to others (Sakshaug and Kreuter 2012).
41
transactions that might be useful for predicting consumer protection outcomes that are
difficult to measure.
Work conducted in poverty mapping using call detail records data serves as a proof of
concept for transaction data to predict consumer protection outcomes.
Blumenstock et al. (2015) links survey data from a household to mobile phone records and
uses machine learning to predict a wealth index constructed from the survey. In turn, these
predictions are used to construct detailed poverty maps of Rwanda. More recently, this
method has been extended to 135 low and middle-income countries (Chi et al. 2021).
While the data sources and outcomes differ, the main approach would not in the contexts
outlined in this toolkit. One could construct a similar survey linked to administrative data
and a unique ID (e.g., phone number) used to provide actionable insights based on future
collection of administrative data by applying the following steps:
1. Conduct a consumer survey with informed consent to link data;
2. Merge consumer survey data on the ID variable with digital credit transaction data;
and
3. Use transaction data to predict outcomes from consumer survey data.
Given a strong prediction of the outcome, such a model could be used to provide
actionable insights.
As an example, one might try to use administrative data to predict over indebtedness as
measured by survey data. Depending on the representativeness of the survey sample,
these predictions could be extended to different localities over time to understand where
and when over indebtedness is a challenge, and to monitor trends in over indebtedness.39
A number of approaches exist in order to use survey data, including collecting information
about debt, income, and assets to compute debt to income to understand how leveraged
consumers are. Likewise, these approaches could be combined with questions from a
sacrifice based approach, which asks consumers what necessities they have given up to
service their debts (Schicks 2011). Finally, as recommended in Garz et al. (2020), over
indebtedness measures might be combined with broader measures of financial well-being
(Consumer Financial Protection Bureau 2015).
Using survey-based outcomes, one can construct variables that are relevant to over
indebtedness at the borrower level. As mentioned in previously, these might include
various statistics related to the total amount of debt taken on, if the borrower has
defaulted, how often, if they’ve multiple borrowed, and how much of their credit limit they
tend to borrow. After collecting data, one can train models to predict various outcomes and
indices. If the staff of the regulator or research organization have limited experience with
machine learning, they can use simple correlations or multiple linear regression. However,
39 This would be useful for two reasons in addition to production of the predictive model; (1) More work is needed to
understand over indebtedness measurement by survey or by other means; and (2) Understanding how closely the measures
from administrative data align with other measures of over indebtedness.

42
statistical learning models are designed to deliver better out-of-sample predictive power
and are obviously preferred.40 For example, by using machine learning and cross validation
one could create a very large set of predictor variables and let the machine learning model
sort through these for the best sample predictors.41
Trial-and-error might be necessary using the survey-based outcomes approach. One issue
that could come up in this context has to do with the relative ease of predicting various
quantities. For example, the more statically stable a variable is over time, the easier it is to
predict using this methodology; Stocks are easier to predict than flows (e.g., wealth vs.
income).42 One may find that income is easier to predict than debt if debt is occasional (i.e.,
more unstable). Predicting measures like debt-to-income (DTI) might lead to more
conclusive results regarding income as opposed to debt given the calculation process. This
underscores the importance of collecting related information like sacrifice-based measures
and the need for analysts with some experience with predictive modeling. It is through a
combination of real-world experience and modeling experience that the best results can be
obtained.
Risk-Based Pricing
One interesting consumer protection issue that involves predictive modeling is the use of
statistical credit scoring models to set loan interest rates, better known as risk-based
pricing. Risk-based pricing refers to providers’ attempts to tailor the price of credit to their
credit default risk. Risk-based pricing has the potential to improve credit markets for both
borrowers who have established credit history and those who are looking to build history.
Borrowers who have established a good credit history will see lower prices. Newer, more
risky borrowers will be able to receive higher priced credit where they may have previously
been denied access to credit, allowing them to enter the market and access credit (Staten
2015).
The most common approach to measuring the degree of risk-based pricing in a market is
to measure the responsiveness of loan price with respect to the risk of default as seen in
Edelberg (2006) and Magri and Pico (2011). Assessing this depends on estimates of the
probability of loan default before the loan is issued. The entire process spans several
steps:
• Estimate a model that predicts whether loans end in default or are repaid. In the
context of risk-based pricing, this might include information about past loan sizes,
40 Out of sample prediction is how well a statistical or machine learning model performs in predicting an outcome using
observations that were not used in originally estimating that model. The estimating sample is called the training sample and
the predictive power within this sample in the in-sample predictive power. A non-estimating sample is called the test sample
and the predictive power within this sample is called out-of-sample predictive power. Out of sample predictive power is used
to determine key parameters in these models, the process of doing this is referred to as cross validation.
41 A common approach is to use penalized regression such as Least Absolute Shrinkage and Selection Operator (LASSO)
regression for variable selection (Tibshirani 1996). This method naturally omits those variables with small coefficients as it
shrinks coefficients and therefore selects variables from this larger set.
42 See Lybbert et al. (2021) for an example of when this methodology does not work as planned.

43
repayment behavior, credit scores (e.g., from a credit bureau) or any other
information a bank or fintech might have access to in order to make credit
decisions.43 Such a model might be as straightforward as logistic regression or could
include more complicated machine learning classification models. By using this
model it is possible to arrive at a predicted probability of default for each consumer
who applies for a loan. Alternatively, if an estimate can be obtained externally, this
can be used in the analysis.
• Regress the interest rate on the predicted probability of default as the second stage
in a two-step selection model.44 The stronger the correlation is between the price
and the expected probability of default, the higher the degree of risk-based pricing
is in this market.45
Before undertaking a risk-based pricing analysis however, it is very useful to consider
the terms and conditions of credit contracts. It may be the case that digital credit
providers may charge a fixed proportion of the disbursement size to consumers in fees,
therefore excluding the possibility of any sort of risk-based pricing within the provider.
In this situation, what we mean formally by risk-based pricing, or adjusting price based
on statistical modeling of credit default, cannot take place. However, regressions that
pool all consumers across firms may still estimate a positive relationship between price
and probability of default due to sorting of risky borrowers between firms. In markets
where credit information systems work well and it is easy to switch between providers,
this may work just as well as risk-based pricing.
43 Notably, some information may be excluded on account of regulatory protections for classes of people. In some cases,
regulations about what information is used to make credit decisions might exclude demographic data, and in other cases
there may be a specified list of approved uses of data.
44 The econometrics of two-step models are understandably complicated, economic theory of asymmetric information
justifies their use: In a simple model of adverse selection for consumer credit (i.e., project choice does not induce moral
hazard), offering loans at high interest rates will drive out consumers who are likely to repay and invite those who have no
intention of repaying and therefore do not react to price changes. Thus, credit providers will not offer loans above certain
interest rates in this model. Where the lender and our estimate of the probability of default differ, lower priced observations
will still be included at this predicted probability of default. This can result in a subtle attenuation in the degree of correlation
between predicted probability of default and price of credit. This bias is addressed using two step models. See Edelberg
(2006), Margi and Pico (2011) for the approach and/or Chapter 19 of Wooldridge (2002) for details on two-step estimation.
45 It may be worthwhile also to use the (natural) logarithm of interest rate as the outcome variable, as this is likely easier to
compare within the literature on disparate markets and also has a more straightforward interpretation as the percentage
change in price associated with a one percentage point increase in the probability of default.

44
POLICY ANALYSIS
Administrative data can also be valuable in policy analysis and in measuring the
causal effects of regulatory policies and digital credit products. Causal inference is
focused on establishing credibly how outcomes are impacted by policies or other factors,
which can support a better understanding of the risks of digital credit and guide policy
interventions. In cases where one hopes to estimate causal effects, experimental
interventions must be conducted, or natural experiments, need to be found. When
collaborating with the FSP, administrative data can serve in measuring the outcomes of
experiments conducted on provider’s platform. In the context of natural experiments, or
situations in which an event or decision process mimics a scientific experiment,
administrative data may serve simply to measure outcomes or as a setting in which a
natural experiment has taken place (as is the case in Burlando et al. 2021 highlighted
below). In either case, the guidance of economists and other practitioners of causal
inference will be an essential component when using administrative data in this context.
Learning About Consumer Risks in Digital Credit
Estimating the causal effect of digital credit products can serve to help regulators and
researchers better understand the risks that consumers face when using these products. In
one example, Burlando et al. (2021) uses administrative data from a digital credit provider
in Mexico and a regression discontinuity design. This empirical approach relies on those
who are on one side of a cutoff determining eligibility for a policy being very similar to
those who just miss eligibility. In this case, digital loan applications are screened in batches
every eight hours, the paper compares those loan applications that were made just before
screening took place to those that were made just after--and therefore had to wait an
additional eight hours to be approved. The authors find that customers who just missed
Further Resources on Predictive Analysis
Predictive analytics and the use of machine learning is a field far too wide to address here. For those who are
interested in learning more about machine learning and its potential role in development economics and
finance, the following resources will provide good entry points for those who come from a technical (e.g.,
statistics or econometrics) background:
• Two academic papers that describe a blueprint for the use of predictive analytics in development
economics and credit default: Blumenstock et al. (2015) and In the context of credit default, Björkegren
and Grissen (2019) serves as a blueprint for prediction with machine learning.1
• James et al. (2015) Introduction to Statistical Learning introduces machine learning methods, including
prediction with machine learning. The textbook emphasizes the understanding and application of
machine learning methods to real-world problems.2
_____________________________
1 Furthermore, they find that mobile phone metadata helps predicts credit repayment, outperforming models using credit bureau information, offering important
insights into the advantages mobile network and mobile money operators hold over their competitors.
2 Another classic resource is Elements of Statistical Learning (Hastie et al. 2009), though this is aimed at a more academic audience. For those coming from an
econometrics background, see Professor of Economics Colin Cameron’s (UC Davis) website: http://cameron.econ.ucdavis.edu/e240f/machinelearning.html

45
the cutoff had significantly higher repayment rates than those who received credit
instantaneously: doubling the delivery time of a loan from ten to twenty hours decreased
credit default by 21 percent. This evidence suggests that in some cases the instantaneous
delivery of credit afforded by digital credit products may represent a consumer protection
risk for borrowers.46
Testing Policy Solutions for Consumer Protection Issues
In some cases, regulators and their academic partners may want to go beyond the
identification and monitoring of consumer protection risks to test the effectiveness of
policy solutions. It is difficult to measure the impact of policies because we cannot observe
what would have happened if a policy were not implemented. Even when policies are
applied to only some actors in the economy, such as certain providers, or consumers, one
still does not observe a consumer who is both treated and untreated by a policy.
Randomized evaluations are an experimental approach to policy evaluation that randomly
assign economic actors or geographies to treatment with a given policy or control. Because
units are randomly treated, those who are not in the treatment group, closely resemble
those who are in the treatment group. Estimates of the impact of policies are only as good
as their estimate of what would have happened without the policy. Randomized
evaluations are the gold standard for estimating impact because they create good
comparison groups for those individuals who were subject to a policy. With access to
administrative data, this gold standard of impact evaluation meets the power of
administrative data to yield detailed descriptions of consumer protection outcomes.
46 Other work related to credit and digital credit that utilizes regression discontinuity includes Suri et al. (2021), Brailovskaya
et al. (2020). For an up-to-date primer on regression discontinuity see Cattaneo et al. (2019a, 2019b).

46
Further Resources on Causal Inference
While the particulars of randomized evaluations are beyond the scope of this toolkit, there are many
resources that deal both specifically with running randomized evaluations and for combining this
methodology with administrative data. In some cases, quasi-experimental methods can also be used to learn
more about the responses to policy interventions. For those who seek to evaluate policies with randomized or
quasi-experimental evaluations, these resources have been produced to help understand both the theoretical and
practical application of causal inference:
• Glennerster and Takavarasha (2013) Running Randomized Evaluations serves as a technical and practical
resource for impact evaluations. While Brown et al. (2015) emphasizes impact evaluation of financial
products and services in the U.S., it may be useful due to its emphasis on financial services.
• Feeney et al. (2018) is a key resource for the use of administrative data in impact evaluations. In addition,
Cole et al. (2020) presents a number of case studies on using administrative data in research, including a
number of chapters where administrative data was used for randomized evaluations.
Much more exists on causal inference methods in a non-experimental context: While many different
resources are of interest, Mostly Harmless Econometrics: An Empiricist’s Companion (Angrist and Pischke, 2009),
Causal Inference: The Mixtape (Cunningham 2021),1 and The Effect: An Introduction to Research Design and
Causality (Huntington-Klein 2022)2 are all designed for those who are new to these methods.
_____________________________
1 As of the publication of this toolkit, the textbook is available online for free at the following address: https://mixtape.scunning.com/
2 As of the publication of this toolkit, the textbook is available online for free at the following address: https://theeffectbook.net/index.html

47
Section II: Data Security
Data security and protection is an essential aspect of handling administrative data.
Researchers have an ethical and, often, legal obligation to preserve the security of
consumers. This section aims to introduce the frameworks, concepts, and some of the
tools that may help in preserving security. While this section is not intended to be all
inclusive, it should serve as an introduction to the issues one must consider to safely
deliver data from digital credit providers for analysis. These considerations should form the
basis of a data security strategy devised with the help of your organization's information
technology team. They will be familiar with your organization’s technical capacity to
execute a given strategy and ensure the safety of participants’ data.
The Five Safes Framework
The Five Safes framework provides a foundation for responsible research with
administrative data. This framework was developed as a way to describe a safe center for
confidential research at the UK’s Office for National Statistics and is based on the titular five
safes; (1) safe projects (i.e., is this use of the data appropriate?); (2) safe people (i.e., can the
researchers be trusted to use it in an appropriate manner?); (3) safe data (i.e., is there a
disclosure risk in the data itself?); (4) safe settings (i.e., does the access facility limit
unauthorized use?); and (5) safe outputs (i.e., are the statistical results non-disclosive?),
which serve to simplify the complex discussion around data access (Desai et al. 2016):
The five dimensions help gauge the safety of the research, however, while considering
these measures of safety can help regulators and researchers manage risks and implement
best practices, those involved must still calibrate what is safe enough. This is true in any
given dimension and holistically must be agreed upon by the regulator, external
researchers, and other stakeholders, where appropriate.
While the remainder of this section will focus on tools, set-ups, and outputs that keep data
safe, safe projects and safe people are a prerequisite for arriving at this stage and each
deserves its own short discussion, starting with safe projects. To understand if a project is
safe, researchers should first understand if the purpose of the project is appropriate. At the
extreme, this might include legal, moral, or ethical considerations about the project47 (e.g.,
relevant data protection laws may forbid the processing of data for certain purposes). A
more common binding constraint impacting a project's safety is that the data be used for a
valid statistical purpose that contributes to the public good. In the case of this toolkit,
knowledge about the state of consumer protection in a given market is the public good
yielded by the analysis.
47 Not least among these are those considerations required by the Institutional Revenue Board (IRB) processes.
48
Choosing the research team is important as it determines who has access to the data and
unfiltered results of any analysis. Just as the purpose for using the data in the first place
must be valid, the people who are working on the project must be trustworthy,
knowledgeable about the use of data, and have the necessary skills to ensure its
safekeeping. Importantly, depending on the necessary transfer of data (e.g., from a
regulator to a research organization), this team may span organizations. Each organization
is responsible for appointing a safe team to handle the data, not just the researchers
themselves.
Creating a safe team is not just about choosing the right individuals, but also the incentives
the team members face. As a prerequisite, researchers should exist in an environment that
provides the incentives to meet the minimum standards agreed to on the project. This
includes agreements with data users or between organizations protecting data
confidentiality and potentially, transparency about who has been granted access to the
data. Finally, the role of incentives faced by the research team is important to consider
when setting other standards and safeguards. While it is tempting to seek the highest
assurances of safety when planning to use data, more restrictive safeguards cost
researchers time and energy to uphold. If safeguards are so restrictive as to make the
researchers’ job arduous, it is likely that the researcher will disregard the minimum
standards set, leading to worse overall data security than would be the case otherwise.
DATA TRANSFER, STORAGE, ACCESS, AND COMPUTING
Safe settings can be one of the most difficult hurdles in collecting data from
providers when transferring, storing, accessing, and computing statistics from data.
While in many contexts where administrative data is accessed for analysis, data can be
housed at the owning institution, in a request that features multiple owning institutions,
this can become difficult. In particular, if datasets from different providers are to be
analyzed together, that is, if data tables or other statistical aggregates generated from data
are combined in the final analysis, data will need to be transferred to a location where it
can be accessed by the organization that will be responsible for the processing and analysis
of the data.48 Safe settings are discussed in the context where data needs to be transferred
across
NAVIGATING SECURE DATA TRANSFERS AND STORAGE
When analysis uses data from multiple sources, there should be a central
clearinghouse and repository to host the data. There are several ways to arrange the
transfer and storage of administrative data between a regulator, providers, and, where
48 Moreover, this might prove to be a greater burden on providers, in particular if a system is not set up for the long-term access
of data by the regulator.

49
relevant, research partners. In one set-up example, data owned by providers is transferred
to the regulator, who serves as both the clearinghouse and the repository. From there, the
data can be accessed by analysts within the regulator (Figure 14 in the Appendix depicts
such a data transfer process). Alternatively, if another organization is undertaking the
analysis for the regulator, it may make sense for the regulator to transfer the data to that
organization (Figure 12 depicts such a data transfer process). In this case the regulator will
still serve as the clearinghouse receiving data from providers, while the analyzing
organization serves as a repository. In other cases, it may make sense for some other
organization to serve in the role of clearinghouse. For example, one can contract with a
data management company to pull the data from providers, de-identify the data, and then
pass the data to the eventual analysts (Figure 13 in the Appendix depicts such a data
transfer process).
Many tools exist to make these transfers in a secure manner. The first option to transfer
data is the use of physical media such as USB drives. While this approach prevents
adversarial cyber-attacks during data transmission, it can be a difficult and expensive
option.49 When using physical media, these devices should be encrypted in case they would
be lost or stolen in transit. Alternatively, a secure network protocol can be used to transfer
data, including SSH secure file transfer protocol (SFTP), or hypertext transfer protocol
secure (HTTPS), used by most modern websites. Notably, encrypted cloud services can
serve as minimally secure and attractive in their ease of use. For this, application
programming interface (APIs) may also serve as attractive transfer options when they are
built using HTTPS standards (Shen and Vilhuber 2020).
For real-time data collection, an essential piece of real-time monitoring, the data solution
relies on being able to submit and pull data automatically as a stream of data, or on
demand, when information is needed to create a dashboard. Such data streams can be set-
up via SFTP or API. Additionally, since this process will be continuously updating, be sure
that there are staffers who are responsible for the system continuing to function in case of
issues as software updates and changes.
Data should also be encrypted as a minimum standard when holding sensitive data. This
can be conducted through a number of tools which information technology professionals
should be well versed in. These include FileVault on MacOS, BitLocker on Microsoft
Windows, BoxCryptor for encryption within cloud services. Additionally, beyond the end-to-
end encryption50 provided by approved transfer methods which keeps data encrypted in
transit, data should also be encrypted at the ends of each transfer (i.e., data should be
encrypted when it is in storage at rest51). This ensures that the intermediate storage
locations do not compromise the security of the transfer (Shen and Vilhuber 2020).
49 Additionally, some providers in data intensive industries prevent the use of USB access to data as a security measure to
prevent leaks by employees. 50 A method of secure communication that prevents third parties from accessing data. 51 At rest encryption is designed to prevent an attacker from accessing the unencrypted data by ensuring that it is encrypted
when on disk.

50
ANALYSIS AND SECURITY
Data should be restricted to those who need to access it. To ensure this is the case,
numerous solutions can be used to control access to data within the research organization.
These include virtual private networks, IP address restrictions, remote desktop access,
physical access cards, secure rooms, and biometric authentication. As security measures
for access controls become more severe, working with data can become more difficult
(Shen and Vilhuber 2020).
For work with large, rich, or complex datasets the computing power of an employee’s
standard computer may complicate the analysis in a number of ways; while the storage
space in standard computers has risen dramatically in recent years, it is worthwhile to
check that the data needed for analysis can be stored where it can be used to make
computations. Likewise, computations may go slowly if there is insufficient processing
power or halt entirely if the memory is flooded when loading in data. Therefore, a solution
that ensures the technical capacity for analysis can take place at a reasonable pace is
essential.
One common approach is to send jobs to an external high performance computing cluster
(e.g., Amazon Web Services). Notably, with sensitive data and when facing new data
protection laws, offloading the data to a third party should be handled with care. In
particular, many of these laws require that data protection standards upheld by the
research firm must also be met by any other entity handling the data, including when data
is sent to a high-performance computing cluster. Researchers should understand where
data is processed before seeking to use external computational power. Ideally, such
analysis could be undertaken within organizations that have the computing infrastructure
to take on these high-performance computing jobs internally. In many cases this is true of
Figure 10: Diagram of Hypothetical of Data Transfer and Analysis Process
Market Inquiry

51
research focused academics departments including statistics, economics, and computer
science. Within such an organization, in fact, data could both be stored securely on a server
and used to run analysis. Such secure servers can use a number of the access controls
listed above. For example, in addition to password protection and encryption of data, one
could use two-factor authentication when accessing the server or could limit the computers
which are able to connect to the server.
Data De-Identification and Personally Identifiable
Information
A Personally Identifiable Information (PII), defined by the U.S. Bureau of Labor Statistics
(BLS), is “any representation of information that permits the identity of an individual to
whom the information applies to be reasonably inferred by either direct or indirect
means.”52 Exact definitions for PII or its analogs vary considerably by agency53 and by
jurisdiction.54 This toolkit focuses on the BLS definition as it is useful in discussing direct
and indirect identifiers included in data. Regardless of the exact definition, collection of PII
naturally comes with privacy issues that may interact with data protection laws and/or
research governance guidelines (e.g., those set by Internal Review Boards at universities
and research organizations).
DIRECT IDENTIFIERS
The most obvious disclosure risk presented by administrative data is direct
identifiers such as phone number, or mobile station integrated services digital
network (MSISDN), account numbers, or names. Such data is explicitly tied to an
individual’s identity. While steps will always be taken such that data doesn’t fall into the
wrong hands, it is still a possibility that should be protected against. However, when data
needs to be linked between datasets either within a database or with other data that has
been collected, such direct identifiers may also be very useful. Therefore, finding ways to
52 U.S. Department of Labor. “Guidance on the Protection of Personal Identifiable Information. “Updated regularly.
https://www.dol.gov/general/ppii
53 For example, PII as defined in the U.S. is narrower than the definition of personal data which is used in the E.U. Schwartz,
Paul M. 2014. “Reconciling Personal Information in the U.S. and the European Union.” . University of California, Berkeley Law.
https://lawcat.berkeley.edu/record/1126268
54 Other similar definitions are used within the U.S. For example, from the department of commerce: “any information about
an individual maintained by an agency, including; (1) any information that can be used to distinguish or trace an individual's
identity, such as name, social security number, date and place of birth, mother's maiden name, or biometric records; and (2)
any other information that is linked or linkable to an individual, such as medical, educational, financial, and employment
information.” McCallister, Erika, Grance, Tim, and Karen Scarfone. April, 2010. “Guide to Protecting the Confidentiality of
Personally Identifiable Information.” National Institute of Technology; US Department of Commerce.
https://nvlpubs.nist.gov/nistpubs/Legacy/SP/nistspecialpublication800-122.pdf

52
encode, or hash these identifiers, as described in later sections, is very important when
they are useful.
INDIRECT INDENTIFIERS AND K-ANONYMITY
While direct identifiers clearly pose a risk of identifiability, indirect identifiers can
also pose risks. These indirect identifiers are data which might partially identify an
individual by reducing the set of individuals that could be a match with the given individual.
For example, knowing what neighborhood, gender, date of birth, and the locality of a given
individual might together uniquely identify an individual. This could leave the dataset
vulnerable to re-identification through matching to some other, publicly accessible, dataset
which features direct identifiers. For example, researchers were able to re-identify the
Governor of Massachusetts in purportedly de-identified medical data using voting data that
featured gender, date of birth, and place of residence (Sweeney 2002).
One way to think about the risk posed by indirect identifiers is the concept of k-anonymity.
When considering possible indirect identifiers, data is k-anonymous when for each
individual in the dataset, their specific combination of these variables appears at least k
times within the data. As the number of possible identifiers increases or the values of these
identifiers becomes finer grained, it may become more difficult to achieve k-anonymity
within a given dataset, and the likelihood of uniquely matching an individual with another
dataset increases substantially (Sweeney 2002).
LOCATION OF DEIDENTIFICATION
While it is clear that data should be de-identified before it is used in analysis, it is not
always clear where this process should take place. In many cases where PII is involved,
research organizations may only be able to analyze the data of those respondents for
whom informed consent has been obtained. However, when data has been de-identified
by the regulator, the transfer of data to the research organization can function similar to a
public release of data, even though the data will be tightly controlled within the research
organization. In some select cases it may make sense for de-identification to take place
with an external research organization (e.g., when the research organization commits to
collect some other form of data that will be tied to administrative data). In this case, it is
important to have identifying information from the survey participants (e.g., a phone
survey would need disclosure of MSISDN to the research organization). For those sampled
who do not consent to the use of their administrative data, the administrative data will be
tossed out. For those that consent, both the survey and administrative data will be de-
identified before analysis takes place.

53
METHODS FOR DE-IDENTIFYING DATA
Hashing and Salting
Linking data can often add to the depth and quality of analysis done. This can be
conducted either vertically, between different types of data, horizontally between similar
data from different sources, or within a database. For example, Blumenstock et al. (2015)
vertically links call detail records to survey data using MSISDN, in order to predict a wealth
index built from the survey data using the call detail record. Likewise, Putman et al. (2021)
use MSISDN to horizontally link digital credit transactions data from different providers to
pick out multiple borrowers among digital credit customers in Kenya. Similarly, the toolkit
will further explore horizontal linkage between providers to examine the behavior of
multiple borrowers, switching between providers, and other entities.
While one way to deal with this within a database is to encode sensitive identifying data
with unique numbers which no longer contain sensitive information (e.g., replacing phone
numbers or bank account numbers), this will not allow the type of matching described
above. However, using hashing algorithms can provide a reasonable solution for this issue.
Individual numbers are anonymized by use of a hash algorithm. Hashing algorithms take
an input and transform it deterministically into a string of letters and numbers that
appears random but in fact is deterministic. This uniquely identifies just as well as the
identifier it was created from but masks the sensitive information itself.
However, just as indirect identifiers are subject to attacks using outside information, one
could attack hashed identifiers using a rainbow table attack, or an attack where the
perpetrator tries to guess the hashing algorithm and then applies this algorithm to all
possible values of the identifier. For example, when attacking MSISDN, the attacker would
create a table of all MSISDN in the relevant context, hash this and match it to the de-
identified data. To ensure that this kind of rainbow attack is not feasible, researchers
should utilize salt55 when hashing MSISDN.
In one example, Innovations for Poverty Action works with the regulator to employ a
combination of hashing and salting to identify multiple borrowers (Putman et al. 2021).
When the regulator receives the first dataset, unique MSISDN numbers are extracted from
the dataset and a random string of numbers and letters (salt) is stored with these MSISDN
numbers. MSISDN and the salt are concatenated, and the resulting string is hashed. The
researcher dataset then features only the hashed value of MSISDN with salt. When new
data is received by the regulator, this data is checked against the numbers already existing
in the list of unique MSISDN. For those which already exist, the salt that has already been
generated is used. For those MSISDN that have not yet been observed, new salt is
generated and appended to the end of the dataset with the number. Then, the numbers
are hashed as before. This process therefore deterministically produces unique,
55 Salt is the addition of a unique, random string of characters known only to the site to each password before it is hashed.

54
irreversible identifiers that can be used to create a horizontal match and identify multiple
borrowers.
Adding Noise
One approach to de-identifying data is to add noise to precise variables. For example,
many surveys now collect the geographic coordinates of a household residence and in
order to prevent the re-identification of these households for public data disclosure, noise
can be added to the household’s location by generating random numbers and adding them
to latitude and longitude. Therefore, households can still be assigned to administrative
units (with some error) but are not directly identified by the location of their household.
Notably this approach may not work for outlying data, and in this case, very rural areas
may need considerable noise to be truly de-identified in this manner.
Coarsening Data
Another approach to de-identifying data is to coarsen the data. For example, given the
span of human life and the exclusion of those younger than 18, individuals could have
30,000 dates of birth. Depending on the size of the data this might already stress the
concept of k-anonymity before other demographic information is introduced. A simple
approach is to only record the year of birth or the age of individuals in the dataset, to
reduce the differentiation lent by that variable considerably. Similarly, one could coarsen
Hashing Application
In data transfers between regulatory agencies and research organizations, it is sometimes useful for
the data be de-identified before the transfer takes place in order to adhere to privacy and data
protection laws. In these cases, it is best practice to operate as if the data transfer from the regulatory body
to the research organization is a quasi-public release, even if the administrative data will not be released
publicly beyond the research organization. De-identifying the data before the transfer will ensure adherence
to data security standards and any internal standards set by the Internal Review Board (IRB).
For this process, it has been useful to have tools that are able to reduce the burden of de-
identification on partners. In the Digital Credit Market Inquiry, IPA’s research team wrote scripts to de-
identify data and address in/direct identifiers. The scripts hashed direct identifiers including MSISDN, while
deleting others, and coarsened indirect identifiers including location and date of birth.
While the scripts made de-identification possible, the process can still to be arduous for regulatory
partners. In order to make the process more seamless, IPA is working on a hashing application that embeds
a similar backend process into an easy-to-use application that features a graphical user interface. This
application loads in datasets that need be de-identified and prompts the user to identify which columns in
the data are sensitive and how each should be handled including the ability to remove PII, hash PII, and
coarsen birth dates. The application is password protected and can be changed for each use case, which
ensures that any hashing will be irreversible and non-replicable and prevents external attacks. This provides
redundancies for other data security policies already used within the organization. Users who need to de-
identify the data but are not fluent in programming languages necessary to do such de-identification will be
able to use this tool.

55
geographical data by choosing higher level administrative units or assigning geolocated
data to its administrative unit.
Deleting Data
When data is not useful to the research at hand but is still provided, it is best to simply
delete the data. For example, if customer names were provided with data along with other
unique identifiers, this data should be erased. If it is direct PII that is not useful, deleting
this data is an essential step. Such information could also contribute to indirect
identification of records, and therefore should be removed.
The Practical Trade-Offs Between Privacy and Accuracy
The methods discussed above for dealing with indirect identifiers, coarsening data or
adding noise, necessarily reduce the accuracy of the data at hand. More fine-grained data
on identifiers like location or occupation can allow for more precise monitoring of trends in
consumer protection outcomes. Likewise, having access to demographic information like
gender and age can help understand who is vulnerable to certain risks. This presents a
trade-off for analysis of such data; Researchers must decide on acceptable levels of
disclosure risk when de-identifying data depending on each context, whether other publicly
available data exists, and to whom the data is released. In the case of consumer protection
work, small research teams are usually released the data, which may mean less stringent
standards than if data might be made available to a large group of people who are not as
closely vetted.
DATA ANALYSIS PREPARATION ACTIVITIES
Before data is analyzed, there are a few steps that will help ensure reliable results and
a straightforward analysis;
1. Validation: Checking that the data has the expected characteristics.
2. Cleaning: Removing, adjusting, or fixing incorrect, incomplete, or incorrectly
formatted data.
3. Harmonization: Standardizing data formatting where providers data submissions
differ.
4. Wrangling: Transforming the data into datasets usable for analysis at a given level.
Data Validation
Data validation is the process of checking that data has the expected characteristics
(Rosenbaum 2021). While one cannot validate that data is the truth (e.g., that a mistake was
not made in collecting the data), researchers can check the properties of the data to verify
what it is measuring. In order to conduct this validation process we can assess certain
characteristics such as the expected values of the cells, the relationship between variables,
and the consistency of the data.

56
In the Digital Credit Market Inquiry, a short internal report for each provider who submitted
data which included tabulations of possible values variables could take on and descriptions
of what each variable represents. The following additional checks may be useful:
● Check to make sure that certain columns should have a precise mathematical
relationship (e.g., the balance due after a payment is made on a loan should equal
the balance due before the payment is made on that loan less the size of the
payment) if using financial transactions data;
● Check for substantial amounts of missing data. In some cases, this may be
unavoidable, but if there is a great deal of missing data it could be worthwhile to try
to understand the root problem; and
● Check for extreme values in the data (e.g., there are often maximum disbursement
sizes for digital credit loans). If values that fall outside of this range, we may suspect
issues with the data.
In general, it is best to automate as much of this process as possible, though it is not
always possible to fully automate it. Useful resources exist that highlight the kind of checks
that should be run and tools that will allow for automation. For example, Constantinescu
(2020) outlines and demonstrates the capabilities of seven packages in R for data
validation.
Data Cleaning, Harmonization, and Wrangling
Before analyzing the data it should be cleaned, harmonized, and wrangled into acceptable
formats. Cleaning data involves removing, adjusting, or fixing incorrect, incomplete, or
incorrectly formatted data. Often, the issues that are cleaned are issues found during the
validation process. Each dataset has its own issues and will need to be dealt with
individually.
Innovations for Poverty Action has found that less of the cleaning issues related to survey
data (e.g., misspellings in data entry keystroke or response issues) and more occurred
during the process of preparing the data during harmonization. Because harmonization
requires the combination of data from different data sources, it is essential to ensure
events are represented the same way in different datasets. The process of harmonization
involves determining a format for each variable and instituting it across datasets.
Harmonization is important because:
● Different providers may submit different data (e.g., while some providers keep a
record of the datetime of transactions, others simply record the date of the
transaction);
● Even when the data is the same, data can arrive in slightly different formats (e.g.,
the tenure may be in months or days or date formats may be YYYY-MM-DD or they
might be MM-DD-YYYY);
● Transactions may be recorded differently by different providers (e.g., some
providers will update a single record with total repaid, total fees, etc. whereas
57
others will introduce a new record for each transaction made, i.e., disbursement,
interest fee, repayment, etc.); and
● Labels may mean different things for each dataset, and different labels may mean
the same thing (e.g., gender may be coded as “m” or “M” to indicate male).
Wrangling data involves transforming the data into the kind of datasets that will be
used for the analysis. This might include aggregating transaction level data up into loan
level, account level, or provider level data. It might also include merging datasets to
check for multiple account holding behavior.
Further Resources on Data Security and Processing
What the toolkit has detailed so far will aid researchers in conducting data requests, however, some steps
may take more detailed understanding of the methods used to manage and process data securely. The
following resources dive deeper into these various topics:
• Desai et al. (2016) “Five Safes: Designing Data Access for Research” details the five safes approach to
data security.
• The Handbook on Using Administrative Data for Research and Evidence-based Policy (S. A. Cole et al.
2020) has several chapters on data security including practical considerations on securing data,
disclosure risk, and the trade-offs between usability and privacy.
• Constantinescu (2020) “Data Validation in R: From Principles to Tools and Packages” details both the
principles of data validation (and their sources) in addition to testing many data validation packages
in the statistical programming language R.
For cleaning and processing data, two guides that might be helpful are from IPA (2021) and J-PAL (Kopper
2021). While these tend to focus more on cleaning survey data, the tools are largely transferrable.

58
Section III: Making the Request
In order to make a clear and concise data request, researchers must gather the right
information and pre-planning documents, understand and adhere to data security
protocol, and gather the necessary data documents and templates.
BEFORE THE REQUEST: INFORMATION GATHERING
Understanding as much as possible about what data providers collect and store
before making the request will raise both the odds and the degree of success, as well
as lower the cost to carry out the data request and analysis for provider and
researchers alike. In contrast to survey data collection, researchers cannot observe the
process of collecting data and thus cannot vet the data in its entirety. If data definitions
within the industry differ from the data request, this could jeopardize the interpretation of
results and could be meaningful in terms of the eventual policy implications of the analysis.
Likewise, if data is arduous for the provider to compile, they might not fully comply with the
data request and turn in data that does not align with what was requested or omits
important points of information requested.
In an ideal scenario, before making the request, the regulator would have access to
information from the providers expected to submit data to understand the types of data
they already have and how it is currently categorized. Moreover, staff at the providers who
are in the position of coordinating with the regulator or the researcher organization may
not have in-depth knowledge of the record keeping and data systems their company uses.
For this reason, it can be highly valuable to meet with staff whose primary role is in
information systems or information technology. Organizational members in these roles will
have the knowledge to deliver relevant information. Indeed, they may be eventually
charged with compiling the data for the information request. Therefore, these connections
can yield major benefits when structuring the request (i.e., what to ask for in the
information request) or when following up on the request. If the research team is able to
meet with someone with knowledge of the specific data systems, ask as many questions as
possible, and do not presume that all providers’ systems are alike.
Three primary areas of information could be collected including codebooks, database
information, and any other metadata.56 Questions researchers should ask while collecting
data from each area are detailed below:
1. The Codebook
a. What are the names of variables in the dataset?
56 Metadata is “information that is given to describe or help you use other information.”
https://dictionary.cambridge.org/us/dictionary/english/metadata

59
b. How are variables defined?
c. How and when is data recorded and updated? For example, when a
repayment is made, is that recorded as a new transaction or is the loan entry
updated?
2. The Database
a. Is it possible to access diagrams depicting how the data is structured and
stored?
b. What variables are used to link data from different datasets in the database?
In addition to account ID, are there variables for Loan ID, or transaction ID?
c. Is it possible to access other related information like data schema (i.e., the
formal “blueprint” of the database)?
3. Other metadata
a. How many accounts are in the database?
b. How many transaction records?
c. What programming language is used to process and query the data (i.e., R,
SQL, Python)?
It will not always be possible to gain knowledge of the codebook and database before the
information request is undertaken. Providers may view this information as sensitive and
other entities may be resistant to information requests overall and may not be forthcoming
with these details. Conversely, it may be the case that some of this data has already been
collected by the regulator and part of their supervisory activities. For example, some data
may exist on the number loans or number accounts at each provider on a monthly or
quarterly basis. This information should also contribute to the information gathering
period.
When it is difficult to engage with providers before the data request, another strategy is to
schedule meetings and provide a time for comment on the draft request as part of the data
request schedule. In this approach, one writes the request letter and data request template
using their best sense of the provider’s data and sends this to them, formally commencing
the request process. If the provider foresees issues, they are able to make comments
within a set time bound period, which will be taken into consideration in the content of
what is requested. If these concerns are serious enough, the structure of the data
requested could be amended overall or on a case-by-case basis.

60
Level Account
Variable MSISDN Account number Gender Date of Birth
Format 254-xxx-xxxxxx [numeric] “M” “F” or “N” YYYY-MM-DD
Example 254-123-45678 123456 M 1970
Purpose Merging datasets
to study multiple
borrowing
Account
aggregation
Segmentation Segmentation
De-identification
process
Hashed Hashed - Coarsened to year
of birth or age,
those over 90 top-
coded
Level Loans Transaction
Variable Loan ID Tenure Type Datetime Value
Format [numeric] [numeric, in
days]
“Disbursement”
“Repayment”
“Fee” “Penalty”
“Write-off” etc.
YYYY-MM-DD
hh:mm:ss
[numeric, in
local currency
unit, e.g., KSh]
Examples 23456 30 Disbursement 2022-01-01
01:23:45
1000
23456 30 Fee 2022-01-01
01:24:00
75
23456 30 Repayment 2022-01-31
12:13:14
-1075
Purpose Loan
aggregation
Outcome
construction
Outcome
construction
Outcome
construction
Outcome
construction
De-identification
process
Potentially
hashed
- - Could be
coarsened to
date
-
Table 4: Example Data Template with additional rows explaining the purpose and de-identification process for specific data

61
Documents
PLANNING DOCUMENTS
Pre-Analysis Plan
While pre-analysis plans have become more popular in economics recently for their ability
to improve research transparency and limit the misreporting of statistical results (or p-
hacking) they are just as useful in planning out the analysis of non-academic work where
these incentives are less pronounced. In data requests, pre-analysis plans serve several
purposes including; (1) The functional purpose of planning out the analysis and once data
is collected and ready to use, doing the analysis requires simply executing the analysis
plan; (2) Pre-analysis plans serve as a sanity check for the analysis that is planned. In
particular, to write a pre-analysis plan, one must articulate the data needs in order to do
the analysis. If the data needed to carry out the analysis is unwieldly, or particularly difficult
to obtain, this may often become clear as the plan is written up; and (3) In situations where
there is a risk of pressure to report certain results, they also provide the ability to
differentiate between results that are pre-specified and those which are exploratory, with
greater weight for those pre-specified results.
Ideally, a pre-analysis plan should include the following steps:
1. Outcomes that will be used during the study;
2. Outline of how the outcomes will be analyzed. The following questions can serve as
a guide;
a. What will be calculated? (e.g., means, medians, correlations, statistical tests);
b. Will any data visualization be used?;
c. Will any segmentation that will take place?;
d. If predictive or causal inference analysis is undertaken, an empirical strategy
detailing how this will work;
3. Level of aggregation at which the analysis will take place;
4. Datasets will need to be merge or aggregated and variables identified (e.g.,
MSISDN, Loan ID, Account Number, etc.); and
5. Corrections needed for sampled datasets further explored below.
In general, if they analysis uses known tools, short descriptions of what will be done should
be sufficient. Finally, despite the value of pre-specification, it may be the case that some of
the analysis that is undertaken will come from exploring the data. While the value of pre-
specifying hypotheses is valuable, being overly deferential to such a plan might constrain
the kind of diligent analysis that might arise from these data requests. Specific consumer
protection issues that may arise within the data are unclear in the planning stage.
Furthermore, some of the pre-specified may lead to further analysis to better understand
those issues. For further information, see the following resources:

62
• A number of papers discuss pre-analysis plans in the context of randomized
evaluations: Olken (2015) discussed some potential benefits as well as limitations of
pre-analysis plans. Likewise Duflo et al. (2020) advocates for moderation in the
implementation of these plans.
• Christensen (2018) “Manual of Best Practices in Transparent Social Science
Research” serves as a reference for transparency and reproducibility in social
sciences.
Data Security Protocol
Like the pre-analysis plan, one should also consider preparing a data security protocol that
outlines the steps taken to keep data secure. As outlined in the above section, this should
cover:
1. A plan for how data will be transferred, stored, and de-identified
2. Encryption tools that will be used
3. De-identification that will be used
4. The research team who will access the (de-identified) data
5. Controls for accessing the data
6. If and when data will be destroyed
7. If there is any public release of the data, this should be detailed here
This protocol will be valuable not only as a tool for internal planning, but to provider
assurance of data security in discussions with partners and other stakeholders.
REQUEST DOCUMENTS
Request Letter
The central document in these administrative data requests is a request letter. This letter
represents a formal request from the research organization, the partner organization, or
both to access the data for analysis. Such a request letter should be brief, yet thorough.
Providers should be informed of the following information in the request letter:
• Who the research and/or partner organization is (if relevant);
• What analysis the data will be used for (broadly, avoiding specifics which may
confuse or raise concerns with the providers);
• Why this use is important for the mandate and policy goals of the organization
requesting the data;
• What data is sought: sample, time period, product type(s), level(s) of aggregation,
variables of interest;
• How, when, where, and to what organization the data will be transferred, including
an overview of security measures that will be taken to protect the data and
anonymize sensitive data;
• Who the provider can contact to ask questions and give feedback; and

63
• If relevant, the time and location of information sessions, or an invitation to
schedule a meeting may also be valuable to include.
In cases where providers are compelled to release information due to regulatory statutes
should be cited within the request letter. Data requests should be delivered by the
regulatory authority through the standard conveyance for communicating with providers.
An example request letter is provided in the Appendix.
Data Templates and Other Annexes
With a few exceptions, data templates serve as the ultimate guidelines to the data being
requested and prove to be highly useful in clarifying the substance of the request. These
should be delivered with the data request letter and featured as annexes or appendices to
the request letter. Such templates should feature unambiguous descriptions of variables
including appropriate classes (numeric, string, date, etc.) and value restrictions (e.g.,
earliest, and latest date in the time period). For each level of aggregation and product type
(or combination therein), an additional template should be included with the request. A
stylized example of a data template is depicted above in Table 5. Additionally, a more
robust template is available in the supplemental appendix.
While most of a data request can be well communicated between the request letter and a
template, a few exceptions exist. Most notably, if data is being sampled by providers in
potentially complex ways, this will not translate well via a template. Instead, another annex
or appendix should be included explaining the sampling procedure.
Provider Compliance
An important aspect of any data request is managing provider compliance. To yield
samples with the greatest potential for useful analysis, wide compliance with the request is
needed. Non-compliance by providers will not only reduce the scope of the analysis, but it
may also lead to results that fail to be sufficiently representative of the market. While non-
representative analyses can still be valuable case studies, their value is lower than a
representative look at the market.
To prevent situations where incomplete compliance is a challenge, it is important that
those charged with enforcing compliance and those charged with research are on the same
page. To ensure compliance, follow up may be necessary. Additionally, providers may use
tactics to try to exempt themselves from the data inquiry including stalling or invoking data
protection laws. If the regulator is not fully bought-in and ready to provide resources to
handle such tactics, requests could languish due to such attempted non-compliance of
providers.
Furthermore, capacity constraints in such data requests should be considered before the
request is made. For example, in markets where there are many digital lenders, it may not

64
be feasible to provide the follow up for every digital credit provider in the economy from
which information is requested. In these cases, it is better to focus on collecting the data of
few similar providers and those with larger market share, as opposed to doing a poor job
collecting the data from many. While issues of fairness in regulation may arise here, a
number of justifications might exist for not requesting data from each and every provider.
For example, providers might be chosen by their overall size or randomly chosen to build a
representative sample of providers in the economy. This limited sample could help in
building a reasonably representative look at the economy without the same burden of
enforcing compliance.
Sampling
Provider compliance can be difficult on the capacity of a regulator as well as the size and
scope of the data collected by the provider. Collecting the universe of transactions will
include considerable time spent transferring, de-identifying, cleaning, analyzing data. One
way to reduce the amount of effort is to utilize random samples of the administrative data.
These random samples will ensure results that are representative of the economy while
reducing the strain of data collection. This section covers the characteristics of samples
that need to be determined, as well as two approaches useful for getting the most out of
samples.
While economists and statisticians are used to sampling (e.g., in survey design), the process
of generating a truly random sample could pose challenges for providers with limited
technical capacity. This challenge should be considered against the additional effort it
would take to process the full data for each provider.
CHARACTERISTICS OF SAMPLES
When determining the correct sample for an administrative data request, there are
several dimensions that could be sampled that should be considered when assessing
the degree of data aggregation in the request. As is discussed earlier, the degree of
aggregation will determine what analysis can be undertaken with the data. This might be at
the provider, account, loan, or transaction level. The following dimensions should be
considered:
1. Define the sample period as it will vary depending on the aim of the exercise. For
example, in real-time monitoring, many very short samples will be collected.
Alternatively, if researchers are interested in studying the evolution of the industry,
they will need to sample multiple years of data in order to disentangle seasonal
variation from long term trends in the industry (e.g., borrowing might peak near the
end of each year in order to pay for holiday festivities). Without long-term data it’s

65
not possible to understand how much of the most recent year is due to growth in
lending versus this seasonal trend.
2. Determine if the request will be for all accounts at an institution or a subset of these
accounts. Because of the volume of data that is generated, it may be useful to
analyze subsets to reduce the strain on IT and researchers of handling and
wrangling data. In this case, detailed instructions on how sampling should be done
need to be included outside of a template.
RANDOM SAMPLE PLUS AGGREGATES APPROACH
One particular data request design that might prove useful to reduced effort by both
providers, information technology staff, and researchers is to request transaction
level data for a random sample of accounts along with aggregate data pertaining to
the entire sample. For a number of statistics, such a request allows for statistically
adequate samples to analyze issues in detail and allow analysts to make accurate and
precise inferences about the population without having to analyze the universe of
transactions in the market.
In this approach the provider submits both provider level aggregates (i.e., number of loans,
number of accounts, total size of loans) plus transactions for only a limited number of
consumers. This can reduce the needed volume of data significantly. Based on the total
number of accounts or the total number of loans, researchers will be able to scale results
from the transaction level analysis to be able to present results at the loan level or account
level in the economy.
Given the concerns about Provider’s ability to deliver random samples, it may also make
sense to prepare tools to help the providers with random sampling in addition to detailed
instructions around sampling procedure. It may also make sense to include additional
checks for non-randomness in the data validation process (e.g., data only being from
certain months). It may make sense to visualize the data (i.e., using histograms or density
plots) and check the data ranges.
RANDOM SAMPLING, MULTIPLE ACCOUNT HOLDING, AND MULTIPLE
BORROWING
One potential issue with receiving sampled data is that this may restrict the ability
to measure and analyze multiple account holding and borrowing across different
providers. While one may be able to identify some individuals who hold multiple accounts,
many others will not be identified because they were excluded from the random sample of
accounts. In particular, if different samples are generated at each provider, then there is no
guarantee that we will observe a given consumer at Provider A and Provider B, even if they
hold accounts at both.

66
One possible solution for this problem is to assemble a list of randomly selected individuals
to query all providers about. This type of sampling might be facilitated using a credit
registry as a frame, or by randomly selecting account numbers from systems such as
mobile phone numbers or national ID numbers. Each of these approaches to sampling
have their own complications. While those who are listed by the credit registry may indeed
be active users of digital credit, different providers may submit customer information to
credit bureaus or registries differently. An extreme example of this is in Kenya, where
digital lenders were banned from submitting to the credit bureaus.57
Randomly selecting phone numbers is an approach that is commonly used in a random
digit dial survey, a type of phone survey that finds respondents by randomly generating
phone numbers as a sampling technique. Applying this method to administrative data
requests, since each account at a digital lender will have information on MSISDN or other
identification numbers (e.g., BVN or NIN in Nigeria) a selection of phone numbers or ID
numbers could be randomly generated, and the same sample request could then be made
across multiple providers. However, many of the requested individuals may not be
financially active and therefore will not have accounts at the queried institutions.
Therefore, it is important to establish expectations on the number of queries in order to
provide a large enough sample for statistical analysis.
57 Mutua, John. 2021. “624 Digital Loan Firms Barred from Sharing Client Data with CRBs.” Business Daily, May 28, 2021.
https://www.businessdailyafrica.com/bd/markets/market-news/624-digital-loan-from-sharing-client-data-with-crbs-3416546

67
Section IV: Conclusion
Task Checklist
The process of collecting administrative data for consumer protection supervision touches
on many different topics and methods. The following checklist organizes the tasks in
sequential order, from preliminary steps to be taken on before you decide to collect data in
this manner, preparing to make the request, the request itself, and the analysis after the
data is collected.
1. PRELIMINARY STEPS
Determine your questions/area of interest
□ Is the issue of the data appropriate?
□ Is administrative data the correct tool?
Verify technical capacity
Ensure there is capacity for:
□ Secure data storage.
□ Statistical programming (e.g., experience in R, State, or Python).
□ Data processing and analysis.
□ Staffing for information request compliance.
Determine partners and draft partner agreements
□ Determine needs (e.g., missing technical capacity).
□ Find partners or consultants who fit these needs.
□ Draft memorandums of understanding and/or data use agreements.
2. BEFORE THE REQUEST
Prepare your pre-analysis plan
Determine:
□ Outcomes of interest.
□ Segmentation variables.
□ Level(s) of data aggregation.
□ Sampling strategy (if relevant).
□ Empirical strategy for predictive or causal work (if relevant).

68
Build your data template
□ Determine if you need a single dataset or multiple.
□ What identification variables do you need.
□ Variable list for each dataset.
□ Variable descriptions and computation details.
□ Variable formats.
□ Sample data in the template.
Prepare your Data Security Protocol
□ What security measures will be taken to protect data?
□ Who will be able to access the data?
□ What access controls will be used?
□ Where and how will de-identification take place.
□ How data will be transferred and stored.
□ How will data be protected during transfer and storage.
Draft Request Letter
□ Provide the basic facts of the request.
□ What data is sought including descriptions.
□ An overview of the security measures that will be used.
□ Any relevant regulatory statutes.
□ Schedule meetings or period for comment.
Gather Information
□ Collect codebooks database diagrams, schema, and metadata.
□ Amend request letter and template (if relevant).
3. MAKING THE REQUEST
Send request letters and receive provider comments
□ Deliver the letters.
□ Hold meetings with providers.
□ Receive comments via email.
□ Ensure provider questions are answered.
□ Have any issues been identified? If so, amend request.
Securely transfer and storage of data
□ Partner encrypts data before transfer.
□ Transferred over a secure channel.

69
□ Validate data – is it what we expected given the template?
□ De-identify the data.
□ Store data in secure location.
□ If relevant, transfer de-identified, encrypted data over secure channel.
Follow-up for compliance
□ Follow-up with providers who did not submit.
□ Follow-up with providers where data does not match template.
4. AFTER THE REQUEST
Process Data
□ Clean data – modify data to remove (apparent) errors.
□ Harmonize data – ensure consistency across providers.
□ Wrangle – merge, reshape, or aggregate data to prepare for analysis.
Analyze data
Execute the pre-analysis plan:
□ Descriptive statistics.
□ Summarize outcomes.
□ Visualize data.
□ Predictive or causal analysis (if relevant).
□ Document your process to make sure research is reproducible.
□ Document the results and interpret them in a policy context.
□ Find all relevant policy recommendations and areas for further study.
□ Destroy the data after project has concluded (if relevant).
Disseminate the results
□ Verify outputs do not pose disclosure risk.
□ Validate findings with providers.
□ Present findings to policymakers.
□ If relevant, present to consumers.

70
Summary
While information requests and the analysis of digital credit data can be intimidating, the
tools and advice contained within this toolkit should orient your team toward towards
executing a successful data request. Although each empirical project is unique, these
resources anticipate the challenges associated with data security, de-identification,
processing, as well as the opportunities for rich data analysis that administrative data
enables. When making a data request, do not hesitate to ask a lot of questions from
specialists on the team, invite feedback from many stakeholders, and iterate continuously.
Do not expect providers to double check the work or go above and beyond the request. As
much as possible, the researcher’s role is to create a seamless process for providers or
other research partners so that the data requested is detailed and useful for innovative
analysis.

71
References
1. Andersson, Simon, and Nika Naghavi. 2021. “State of the Industry Report on Mobile
Money.” GSMA, 1–75.
2. Andreoni, James, Michael A. Kuhn, and Charles Sprenger. 2015. “Measuring Time
Preferences: A Comparison of Experimental Methods.” Journal of Economic
Behavior and Organization 116: 451–64. https://doi.org/10.1016/j.jebo.2015.05.018.
3. Angrist, Joshua D., and Jörn-Steffen Pischke. 2009. Mostly Harmless Econometrics:
An Empiricist’s Companion.
4. Banerjee, Abhijit, Emily Breza, Esther Duflo, and Cynthia Kinnan. 2AD. “Can
Microfinance Unlock a Poverty Trap for Some Entrepreneuers?”
5. Barriga-Cabanillas, Oscar, and Travis J Lybbert. 2020. “Liquidity or Convenience?
Heterogeneous Impacts of Mobile Airtime Loans on Communication Expenditure.”
6. Bertrand, Marianne, and Adair Morse. 2011. “Information Disclosure, Cognitive
Biases, and Payday Borrowing.” Journal of Finance 66 (6): 1865–93.
https://doi.org/10.1111/j.1540-6261.2011.01698.x.
7. Bhattacharya, Dwijaraj, Amulya Neelam, and Deepti George. 2021. “A Framework for
Detecting Over-Indebtedness and Monitoring Indian Credit Markets.”
8. Björkegren, Daniel, and Darrell Grissen. 2018. “The Potential of Digital Credit to Bank
the Poor.” AEA Papers and Proceedings 108: 68–71.
https://doi.org/10.1257/pandp.20181032.
9. ———. 2019. “Behavior Revealed in Mobile Phone Usage Predicts Credit
Repayment.” World Bank Economic Review. https://doi.org/10.1093/wber/lhz006.
10. Blackmon, William, Filippo Cuccaro, Andreas Holzinger, Rafe Mazer, Wycliffe
Ngwabe, and Daniel Putman. 2021. “From the Field to Policy Formulation—How
Research Is Informing Consumer Protection in Sierra Leone.” Innovations for
Poverty Action. 2021. https://www.poverty-action.org/blog/field-policy-formulation—
how-research-informing-consumer-protection-sierra-leone.
11. Blackmon, William, Rafe Mazer, and Shana Warren. 2021. “Kenya Consumer
Protection in Digital Finance Survey,” no. March.
12. Blumenstock, Joshua E., Gabriel Cadamuro, and Robert On. 2015. “Predicting
Poverty and Wealth from Mobile Phone Metadata.” Science 350 (6264): 1073–76.
13. Blumenstock, Joshua E., Omowunmi Folajimi-Senjobi, Jackie Mauro, and Suraj Nair.
2021. “Welfare Impacts of Digital Credit: Results from a Randomized Evaluation in
Nigeria.” In DCO Webinar Series. https://cega.berkeley.edu/event/welfare-impacts-
of-digital-credit-results-from-a-randomized-evaluation-in-nigeria/.
14. Brailovskaya, Valentina, Pascaline Dupas, and Jonathan Robinson. 2020. “Digital
Credit: Filling a Hole, or Digging a Hole? Evidence from Malawi.” In DCO Webinar
Series. https://cega.berkeley.edu/resource/video-digital-credit-filling-a-hole-or-
digging-a-hole-evidence-from-malawi/.
15. Bresnahan, Timothy F. 1982. “The Oligopoly Solution Concept Is Identified.”
Economics Letters 10 (1–2): 87–92. https://doi.org/10.1016/0165-1765(82)90121-5.

72
16. Brown, Julia, Lucia Goin, Nora Gregory, Katherine Hoffmann, and Kim Smith. 2015.
“Evaluating Financial Products and Services in the US: A Toolkit for Running
Randomized Controlled Trials.”
17. Burke, Kathleen, Jonathan Lanning, Jesse Leary, and Jialan Wang. 2014. “CFPB Data
Point: Payday Lending,” no. March.
18. Burlando, Alfredo, Michael A. Kuhn, and Silvia Prina. 2021. “Too Fast, Too Furious?
Digital Credit Delivery Speed and Repayment Rates.” CEGA Working Paper.
https://doi.org/10.11436/mssj.15.250.
19. Cattaneo, Matias D., Nicolás Idrobo, and Rocío Titiunik. 2019a. A Practical
Introduction to Regression Discontinuity Designs: Extensions.
https://doi.org/10.1017/9781108684606.
20. ———. 2019b. A Practical Introduction to Regression Discontinuity Designs:
Foundations. https://doi.org/10.1017/9781108684606.
21. Chen, Greg, and Rafe Mazer. 2016. “Instant, Automated, Remote: The Key Attributes
of Digital Credit.” CGAP Blog. 2016. https://www.cgap.org/blog/instant-automated-
remote-key-attributes-digital-credit.
22. Chi, Guanghua, Han Fang, Sourav Chatterjee, and Joshua E. Blumenstock. 2021.
Micro-Estimates of Wealth for All Low- and Middle-Income Countries.
http://arxiv.org/abs/2104.07761.
23. Chichaibelu, Bezawit Beyene, and Hermann Waibel. 2017. “Borrowing from ‘Pui’ to
Pay ‘Pom’: Multiple Borrowing and Over-Indebtedness in Rural Thailand.” World
Development 98: 338–50. https://doi.org/10.1016/j.worlddev.2017.04.032.
24. Christensen, Garret. 2018. “Manual of Best Practices in Transparent Social Science
Research,” 74.
https://github.com/garretchristensen/BestPracticesManual/blob/master/Manual.pdf
25. Cole, Shawn A, Iqbal Dhaliwal, Anja Sautmann, and Lars Vilhuber. 2020. Handbook
on Using Administrative Data for Research and Evidence-Based Policy.
26. Consumer Financial Protection Bureau. 2015. “Measuring Financial Well-Being: A
Guide to Using the CFPB Financial Well-Being Scale.”
27. Cunningham, Scott. 2021. Causal Inference: The Mixtape.
28. Demirguc-Kunt, Asli, Leora Klapper, Dorothe Singer, Saniya Ansar, and Jake Hess.
2018. “The Global Findex Database 2017: Measuring Financial Inclusion and the
Fintech Revolution.” https://doi.org/10.1596/978-1-4648-1259-0.
29. Desai, Tanvi, Felix Ritchie, and Richard Welpton. 2016. “Five Safes: Designing Data
Access for Research.” Economics Working Paper Series 1601 (February): 28.
30. Duflo, Esther, Abhijit V. Banerjee, Amy Finkelstein, Lawrence F Katz, Benjamin A
Olken, and Anja Sautmann. 2020. “In Praise of Moderation: Suggestions for the
Scope and Use of Pre-Analysis Plans for RCTs in Economics.”
31. Edelberg, Wendy. 2006. “Risk-Based Pricing of Interest Rates for Consumer Loans.”
Journal of Monetary Economics 53 (8): 2283–98.
https://doi.org/10.1016/j.jmoneco.2005.09.001.
32. Feeney, Laura, Jason Bauman, Julia Chabrier, Geeti Mehra, Michelle Woodford, and J-
pal North America. 2018. “Using Adminstrative Data for Randomized Evaluations.”

73
33. Francis, Eilin, Joshua Blumenstock, and Jonathan Robinson. 2017. “Digital Credit in
Emerging Markets. A Snapshot of the Current Landscape and Open Research
Questions.” Digital Credit Observatory.
http://www.digitalcreditobservatory.org/uploads/8/2/2/7/82274768/dco_landscape_
analysis.pdf.
34. Gabaix, Xavier, and David Laibson. 2006. “Shrouded Attributes, Consumer Myopia
and Information Suppression in Competitive Markets.” The Quarterly Journal of
Economics, no. May. https://doi.org/10.1162/qjec.2006.121.2.505.
35. Garz, Seth, Xavier Giné, Dean Karlan, Rafe Mazer, Caitlin Sanford, and Jonathan
Zinman. 2020. “Consumer Protection for Financial Inclusion in Low and Middle
Income Countries: Bridging Regulator and Academic Perspectives.” Vol. 2507.
https://doi.org/10.1146/annurev-financial-071020-012008.
36. Glennerster, Rachel, and Kudzai Takavarasha. 2013. Running Randomized
Evaluations: A Practical Guide. Princeton University Press.
37. Gubbins, Paul, and Edoardo Totolo. 2019. “Digital Credit in Kenya: Evidence from
Demand- Side Surveys.”
38. Harron, Katie, Chris Dibben, James Boyd, Anders Hjern, Mahmoud Azimaee,
Mauricio L. Barreto, and Harvey Goldstein. 2017. “Challenges in Administrative Data
Linkage for Research.” Big Data and Society 4 (2): 1–12.
https://doi.org/10.1177/2053951717745678.
39. Hastie, Trevor, Robert Tibshirani, and Jerome Friedman. 2009. The Elements of
Statistical Learning. Vol. 1. https://doi.org/10.1007/b94608.
40. Heckman, James J. 1998. “Detecting Discrimination.” Journal of Economic
Perspectives 12 (2): 101–16. https://doi.org/10.1257/jep.12.2.101.
41. Hernández-Trillo, Fausto, and Ana Laura Martínez-Gutiérrez. 2021. “The Dark Road
to Credit Applications: The Small‑Business Case of Mexico.” Journal of Financial
Services Research. https://doi.org/10.1007/s10693-021-00356-x.
42. Hoff, Karla, and Joseph E. Stiglitz. 1993. “Imperfect Information and Rural Credit
Markets: Puzzles and Policy Perspectives.” In The Economics of Rural Organization.
43. Huntington-Klein, Nick. 2022. The Effect: An Introduction to Research Design and
Causality.
44. Innovations for Poverty Action. 2021. “Data Cleaning.” 2021.
https://povertyaction.github.io/guides/cleaning/readme/.
45. Izaguirre, Juan Carlos, Rafe Mazer, and Louis Graham. 2018. “Digital Credit Market
Monitoring in Tanzania,” no. September.
46. James, Gareth, Daniela Witten, Trevor Hastie, and Robert Tibshirani. 2015. An
Introduction to Statistical Learning. https://doi.org/10.1016/j.peva.2007.06.006.
47. Kaplow, Louis. 2015. “Market Definition, Market Power.”
48. Kelly, Sonja, and Mehrdad Mirpourian. 2021. “Algorithmic Bias, Financial Inclusion,
and Gender: A Primer on Opening up New Credit to Women in Emerging
Economies.” https://www.womensworldbanking.org/wp-
content/uploads/2021/02/2021_Algorithmic_Bias_Report.pdf.
49. Kopper, Sarah. 2021. “Data Cleaning and Management.” 2021.

74
https://www.povertyactionlab.org/resource/data-cleaning-and-management.
50. Kuchler, Theresa, and Michaela Pagel. 2021. “Sticking to Your Plan: The Role of
Present Bias for Credit Card Paydown.” Journal of Financial Economics 139 (2): 359–
88. https://doi.org/10.1016/j.jfineco.2020.08.002.
51. Lau, Lawrence J. 1982. “On Identifying the Degree of Competitiveness from Industry
Price and Output Data.” Economics Letters 10 (1–2): 93–99.
https://doi.org/10.1016/0165-1765(82)90122-7.
52. Leuvensteijn, Michiel van, Jacob A Bikker, Adrian A.R.J.M. van Rixtel, and Christoffer
Kok Sørensen. 2007. “A New Approach to Measuring Competition in the Loan
Markets of the Euro Area.” Europea Central Bank Working Paper Series.
53. Lybbert, Travis J, Barriga Cabanillas, Daniel Putman, and Joshua Blumenstock. 2021.
“Digital Breadcrumbs & Dietary Diversity: Testing the Limits of Cell Phone Metadata
in Development Economics.”
54. Magri, Silvia, and Raffaella Pico. 2011. “The Rise of Risk-Based Pricing of Mortgage
Interest Rates in Italy.” Journal of Banking and Finance 35 (5): 1277–90.
https://doi.org/10.1016/j.jbankfin.2010.10.008.
55. Mazer, Rafe, and Matthew Bird. 2021. “Consumer Protection Survey of Digital
Finance Users: Uganda.” Harvard Dataverse.
56. MicroSave Consulting. 2019. “Making Digital Credit Truly Responsible.”
57. Montoya, Ana María, Eric Parrado, Alex Solís, and Raimundo Undurraga. 2020. “Bad
Taste: Gender Discrimination in the Consumer Credit Market.”
58. Olken, Benjamin A. 2015. “Promises and Perils of Pre-Analysis Plans.” Journal of
Economic Perspectives 29 (3): 61–80. https://doi.org/10.1257/jep.29.3.61.
59. Pagano, Marco, and Tullio Jappelli. 1993. “Information Sharing in Credit Markets.”
Journal of Finance, 1693–1718.
60. Pita, Robespierre, Clicia Pinto, Pedro Melo, Malu Silva, Marcos Barreto, and Davide
Rasella. 2015. “A Spark-Based Workflow for Probabilistic Record Linkage of
Healthcare Data.” CEUR Workshop Proceedings 1330: 17–26.
61. Putman, Daniel, Rafe Mazer, and William Blackmon. 2021. “Report on the
Competition Authority of Kenya Digital Credit Market Inquiry.”
62. Putman, Daniel S. 2021. “Digital Credit Market Monitoring with Administrative Data:
Evidence from a Collaboration with the Competition Authority of Kenya.”
63. Raval, Devesh. 2020. “Whose Voice Do We Hear in the Marketplace? Evidence from
Consumer Complaining Behavior.” Marketing Science 39 (1): 168–87.
https://doi.org/10.1287/mksc.2018.1140.
64. Rizzi, Alexandra, Alexandra Kessler, and Jacobo Menajovsky. 2021. “The Stories
Algorithms Tell: Bias and Financial Inclusion at the Data Margins.”
65. Sakshaug, Joseph W., and Frauke Kreuter. 2012. “Assessing the Magnitude of Non-
Consent Biases in Linked Survey and Administrative Data.” Survey Research
Methods 6 (2): 113–22. https://doi.org/10.18148/srm/2012.v6i2.5094.
66. Schicks, J. 2011. “The Over-Indebtedness of Microborrowers in Ghana-An Empirical
Study from a Customer Protection Perspective.”
http://www.cermi.eu/documents/WP/CERMi_WP_-_Schicks_J._-

75
_August_2011.pdf%5Cnhttp://www.cermi.eu/documents/CERMi_WP_-_Schicks_J._-
_August_2011.pdf.
67. Shaffer, Sherrill, and Laura Spierdijk. 2015. “The Panzar-Rosse Revenue Test and
Market Power in Banking.” Journal of Banking and Finance 61: 340–47.
https://doi.org/10.1016/j.jbankfin.2015.09.019.
68. ———. 2017. “Market Power: Competition among Measures.” In Handbook of
Competition in Banking and Finance, 11–26.
https://doi.org/10.4337/9781785363306.00007.
69. Shema, Alain. 2021. “Effects of Increasing Credit Limit in Digital Microlending: A
Study of Airtime Lending in East Africa.” Electronic Journal of Information Systems in
Developing Countries, no. July 2020: 1–14. https://doi.org/10.1002/isd2.12199.
70. Shen, Jim, and Lars Vilhuber. 2020. “Physically Protecting Sensitive Data.” In
Handbook on Using Administrative Data for Research and Evidence-Based Policy,
edited by Shawn Cole, Iqbal Dhaliwal, Anja Sautmann, and Lars Vilhuber, 37–84.
71. Staten, Michael. 2015. “Risk-Based Pricing in Consumer Lending.” Journal of Law,
Economics & Policy 33.
72. Suri, Tavneet, Prashant Bharadwaj, and William Jack. 2021. “Fintech and Household
Resilience to Shocks: Evidence from Digital Loans in Kenya.” Journal of Development
Economics 153 (April 2020): 102697. https://doi.org/10.1016/j.jdeveco.2021.102697.
73. Sweeney, Latanya. 2002. “K-ANONYMITY: A Model for Protecting Privacy.”
International Journal on Uncertainty, Fuzziness and Knowledge-Based Systems 10
(5).
74. Tibshirani, Robert. 1996. “Regression Shrinkage and Selection via the Lasso.” Journal
of the Royal Statistical Society. https://doi.org/10.1093/nq/s3-V.128.490-a.
75. Totolo, Edoardo. 2018. “The Digital Credit Revolution in Kenya: An Assessment of
Market Demand, 5 Years On,” no. March: 28.
https://www.microfinancegateway.org/library/digital-credit-revolution-kenya-
assessment-market-demand-5-years.
76. Wang, Jialan, and Kathleen Burke. 2021. “The Effects of Disclosure and Enforcement
on Payday Lending in Texas.” NBER Working Papers.
77. Wooldridge, Jeffrey M. 2002. Econometric Analysis of Cross Section and Panel Data.
2nd ed.

76
Appendix

Innovations for Poverty Action |poverty-action.org
Acknowledgements: This work benefited from insightful comments and reviews from
Rafe Mazer, William Blackmon, and Tanvi Jaluka, and discussions with others in Financial
Inclusion Program at IPA. All errors herein are my own. Thanks also to Lauren Perlik for
designing and editing support. This work was supported by the Bill & Melinda Gates
Foundation BMG-19-10001. The views expressed herein are those of the authors and
should not be attributed to the Bill & Melinda Gates Foundation.
Innovations for Poverty Action (IPA) is a research and policy nonprofit that discovers and promotes effective solutions to global poverty
problems. IPA designs, rigorously evaluates, and refines these solutions and their applications together with researchers and local decision-
makers, ensuring that evidence is used to improve the lives of the world’s poor. Our well-established partnerships in the countries where
we work, and a strong understanding of local contexts, enable us to conduct high-quality research. This research has informed hundreds of
successful programs that now impact millions of individuals worldwide.
Copyright © 2022 FDOKUMEN