Urika®-GX System Administration Guide (1.1.UP00) S-3016
199
Urika®-GX System Administration Guide (1.1.UP00) S-3016
-
Upload
khangminh22 -
Category
Documents
-
view
3 -
download
0
Transcript of Urika®-GX System Administration Guide (1.1.UP00) S-3016

Urika®-GX System Administration Guide(1.1.UP00) S-3016

Contents1 About the Urika-GX System Administration Guide.................................................................................................6
2 The Urika-GX System.............................................................................................................................................8
2.1 Administrative Components of Urika-GX...................................................................................................8
2.2 Urika-GX Network Components................................................................................................................9
2.3 Urika-GX File Systems............................................................................................................................10
2.4 Urika-GX System Nodes.........................................................................................................................11
2.5 Restrictions on Use.................................................................................................................................11
2.6 Service to Node Mapping........................................................................................................................12
3 System Management............................................................................................................................................16
3.1 Urika-GX Component Naming Conventions............................................................................................16
3.2 System Management Workstation (SMW)...............................................................................................17
3.2.1 Power On the System Management Workstation (SMW)..........................................................17
3.2.2 About the Integrated Dell Remote Access Controller (iDRAC)..................................................17
3.2.3 Change the Default iDRAC8 Password......................................................................................18
3.2.4 Change the Default System Management Workstation (SMW) Passwords...............................20
3.2.5 Control System Management Workstation (SMW) Power with the iDRAC8 Web Console........20
3.2.6 Synchronize the System Management Workstation (SMW) to the Site NTP Server..................22
3.2.7 Synchronize Time of Day on System Nodes..............................................................................23
3.2.8 Reboot a Stopped System Management Workstation (SMW)...................................................24
3.3 Hardware Supervisory System (HSS).....................................................................................................24
3.3.1 Hardware Supervisory System (HSS) Architecture Overview....................................................26
3.3.2 The xtdiscover Command..........................................................................................................27
3.3.3 Hardware Supervisory System (HSS) Component Location Discovery.....................................27
3.3.4 Hardware Supervisory System (HSS) Daemons........................................................................27
3.3.5 Hardware Supervisory System (HSS) Administration and Diagnostic CommandsSupported on Urika-GX.............................................................................................................29
3.3.6 Hardware Supervisory System (HSS) Environments.................................................................32
3.3.7 High Speed Network (HSN) Management.................................................................................34
3.3.8 Create Direct Connection between the System Management Workstation (SMW) and aCompute Node Console............................................................................................................34
3.3.9 Display and Change Hardware System Status..........................................................................35
3.3.10 Disable Hardware Components...............................................................................................35
3.3.11 Enable Hardware Components................................................................................................35
3.3.12 Set Hardware Components to EMPTY......................................................................................36
3.3.13 Stop Components Using the Hardware Supervisory System (HSS)........................................36
Contents
S3016 2

3.3.14 Unlock Hardware Components................................................................................................37
3.3.15 Capture and Analyze System-level and Node-level Dumps.....................................................37
3.3.16 Collect Debug Information From Hung Nodes Using the xtnmi Command..............................38
3.3.17 Find Node Information..............................................................................................................38
3.3.18 Request and Display System Routing......................................................................................39
3.3.19 Initiate a Network Discovery Process.......................................................................................40
3.3.20 Power Up a Rack or Dual Aries Network Card (dANC)............................................................40
3.3.21 Check the Status of System Components................................................................................41
3.3.22 Check Compute Node High Speed Network (HSN) Connection..............................................41
3.3.23 Monitor the Health of PCIe Channels.......................................................................................41
3.3.24 Poll a Response from an HSS Daemon, Manager, or the Event Router..................................41
3.3.25 View Component Alert, Warning, and Location History............................................................42
3.3.26 Display Alerts and Warnings....................................................................................................42
3.3.27 Display Error Codes.................................................................................................................42
3.3.28 Display Component State Information......................................................................................43
3.3.29 Clear Component Flags...........................................................................................................43
3.3.30 Flash Management on Urika-GX..............................................................................................44
3.3.31 Create and Modify the authorized_keys File Using the xtcc-ssh-keys Command.......44
3.3.32 Change the Passwords of RC, dANCCs and iSCB using the xtccpasswd Command..........45
3.3.33 Gather Troubleshooting Information Using the xtdumpsys Command.....................................45
3.4 Dual Aries Network Card (dANC) Management......................................................................................45
3.5 Analyze Node Memory Dump Using the kdump and crash Utilities on a Node.....................................46
3.6 Cray Lightweight Log Management (LLM) System.................................................................................47
3.7 About CSMS............................................................................................................................................47
3.7.1 Use OpenStack CLI Clients........................................................................................................47
3.7.2 OpenStack Nova Instance States..............................................................................................48
3.7.3 Using Cray System Management Software (CSMS) on Urika-GX.............................................49
3.7.4 Urika-GX Node Power Management..........................................................................................49
3.8 Overview of Urika-GX System Management UI......................................................................................52
3.9 Log on to the System Management UI....................................................................................................58
3.10 Synchronize the System Management Workstation (SMW) to the Site NTP Server.............................59
3.11 Synchronize Time of Day on System Nodes.........................................................................................60
3.12 Power Up the Urika-GX System............................................................................................................61
3.13 Power Down the Urika-GX System.......................................................................................................63
3.14 Urika-GX CLI Commands for Managing Services.................................................................................66
4 System Monitoring................................................................................................................................................70
4.1 System Monitoring Tools.........................................................................................................................70
4.2 Getting Started with Using Grafana.........................................................................................................70
Contents
S3016 3
4.3 Default Grafana Dashboards...................................................................................................................72
4.4 Update InfluxDB Security Settings..........................................................................................................82
4.5 Update the InfluxDB Data Retention Policy.............................................................................................83
4.6 Grafana's Configuration Settings.............................................................................................................84
4.7 Change the Default Timezone Displayed on Grafana.............................................................................85
4.8 Create a New Grafana Dashboard..........................................................................................................86
4.9 Add a New Graph to the Grafana Dashboard.........................................................................................88
4.10 Start InfluxDB Before Hadoop Services................................................................................................91
4.11 Monitor Subrack Attributes....................................................................................................................91
4.12 Analyze Node Memory Dump Using the kdump and crash Utilities on a Node...................................92
4.13 Use the urika-check-platform Command...............................................................................................93
5 Logging.................................................................................................................................................................95
5.1 Urika-GX System Management Log File Locations.................................................................................95
5.2 Analytic Applications Log File Locations.................................................................................................98
5.3 OpenStack Log File Locations.................................................................................................................99
5.4 Default Log Settings..............................................................................................................................100
6 Resource Management......................................................................................................................................102
6.1 Manage Resources on Urika-GX...........................................................................................................102
6.2 Use Apache Mesos on Urika-GX ..........................................................................................................104
6.3 Use mrun to Retrieve Information About Marathon and Mesos Frameworks........................................108
6.4 Manage Long Running Services Using Marathon.................................................................................111
6.5 Manage the Spark Thrift Server as a Non-Admin User.........................................................................114
7 Control the Spark Thrift Server...........................................................................................................................116
8 Use Tableau® with Urika-GX...............................................................................................................................117
8.1 Connect Tableau to HiveServer2...........................................................................................................117
8.2 Connect Tableau to HiveServer2 Securely............................................................................................120
8.3 Connect Tableau to the Spark Thrift Server .........................................................................................123
8.4 Connect Tableau to the Spark Thrift Server Securely...........................................................................127
9 Cray DVS............................................................................................................................................................131
9.1 Introduction to DVS...............................................................................................................................131
9.1.1 Use Cray DVS on Urika-GX.....................................................................................................132
9.1.2 DVS ioctl Interfaces..................................................................................................................132
9.1.3 DVS Client Mount Point Options..............................................................................................133
9.1.4 DVS Environment Variables.....................................................................................................140
9.1.5 Modes.......................................................................................................................................140
9.1.6 Resiliency and Diagnostics......................................................................................................145
9.1.7 Caveats....................................................................................................................................148
9.1.8 Administrative Tasks.................................................................................................................149
Contents
S3016 4
10 Troubleshooting................................................................................................................................................166
10.1 Clean Up Log Data..............................................................................................................................166
10.2 Diagnose and Troubleshoot Orphaned Mesos Tasks..........................................................................167
10.3 Troubleshoot Common Analytic Issues ..............................................................................................168
10.4 Troubleshoot mrun Issues...................................................................................................................175
10.5 Troubleshoot: Application Hangs as a Result of NFS File Locking.....................................................177
10.6 Troubleshoot: DVS does not Start after Data Store Move...................................................................177
10.7 Troubleshoot: DVS Ignores User Environment Variables....................................................................177
10.8 Clear Leftover hugetlbf Files................................................................................................................178
10.9 Remove Temporary Spark Files from SSDs........................................................................................178
10.10 CSMS Troubleshooting Information...................................................................................................179
10.10.1 kdump utility.........................................................................................................................179
10.10.2 The cray_dumpsys Command.............................................................................................179
11 Security.............................................................................................................................................................181
11.1 Authentication Mechanisms.................................................................................................................181
11.2 Default Urika-GX System Accounts.....................................................................................................182
11.3 Tableau Authorization and Authentication Mechanisms......................................................................183
11.4 Enable SSL on Urika-GX.....................................................................................................................183
11.5 Install a Trusted SSL Certificate on Urika-GX.....................................................................................188
11.6 Enable LDAP Authentication on Urika-GX .........................................................................................189
11.6.1 Enable LDAP for Connecting Tableau to HiveServer2...........................................................191
11.7 Enable SQL Standard based Authorization for HiveServer2...............................................................192
11.8 Change LDAP Password on Urika-GX................................................................................................193
11.9 File System Permissions.....................................................................................................................194
11.10 Urika-GX Security Quick Reference Information...............................................................................194
11.11 Modify the Secret of a Mesos Framework.........................................................................................195
11.12 Reset a Forgotten Password for the Cray Application Management UI............................................196
11.13 Port Assignments..............................................................................................................................197
Contents
S3016 5
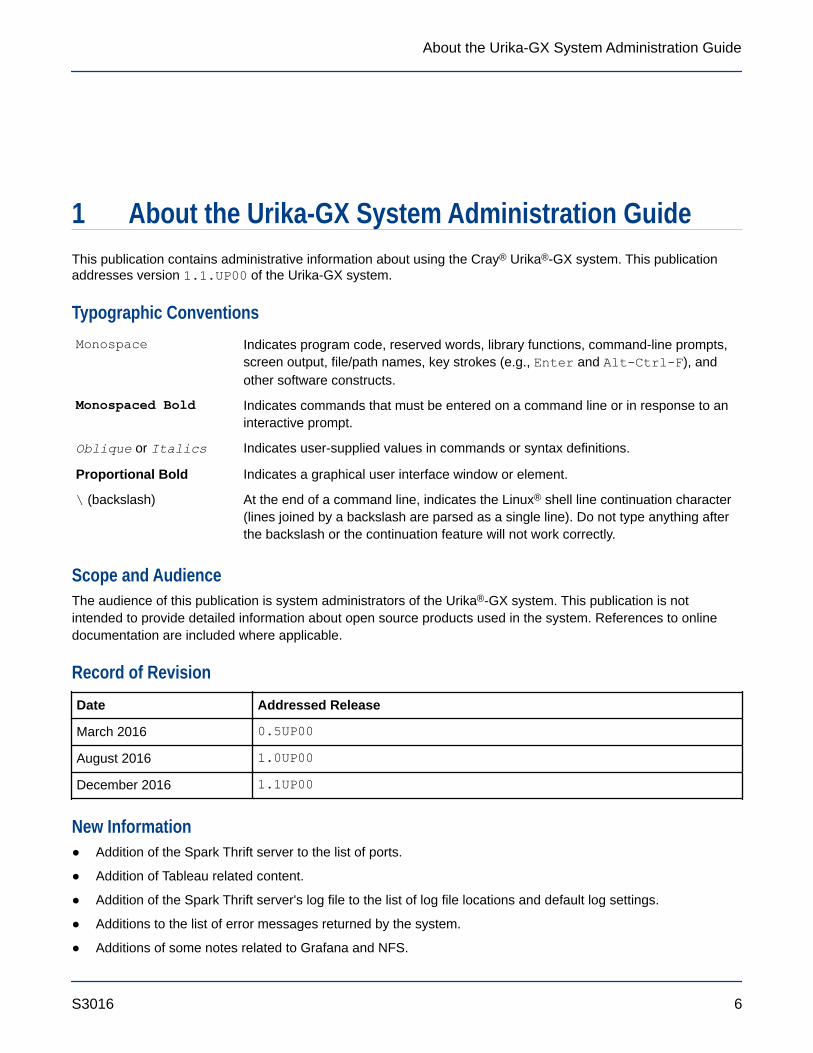
1 About the Urika-GX System Administration GuideThis publication contains administrative information about using the Cray® Urika®-GX system. This publicationaddresses version 1.1.UP00 of the Urika-GX system.
Typographic ConventionsMonospace Indicates program code, reserved words, library functions, command-line prompts,
screen output, file/path names, key strokes (e.g., Enter and Alt-Ctrl-F), andother software constructs.
Monospaced Bold Indicates commands that must be entered on a command line or in response to aninteractive prompt.
Oblique or Italics Indicates user-supplied values in commands or syntax definitions.
Proportional Bold Indicates a graphical user interface window or element.
\ (backslash) At the end of a command line, indicates the Linux® shell line continuation character(lines joined by a backslash are parsed as a single line). Do not type anything afterthe backslash or the continuation feature will not work correctly.
Scope and AudienceThe audience of this publication is system administrators of the Urika®-GX system. This publication is notintended to provide detailed information about open source products used in the system. References to onlinedocumentation are included where applicable.
Record of RevisionDate Addressed Release
March 2016 0.5UP00
August 2016 1.0UP00
December 2016 1.1UP00
New Information● Addition of the Spark Thrift server to the list of ports.
● Addition of Tableau related content.
● Addition of the Spark Thrift server's log file to the list of log file locations and default log settings.
● Additions to the list of error messages returned by the system.
● Additions of some notes related to Grafana and NFS.
About the Urika-GX System Administration Guide
S3016 6

● Additions of procedures for updating the InfluxDB security settings and data retention policies.
● Addition of procedure to update the secret of a Mesos framework.
● Addition of tips and cautions related to NFS and Grafana.
● Addition of procedure to start and/or stop the Spark Thrift Server.
● Addition of Cray Data Virtualization Service (DVS) related content.
Updated InformationFollowing is a summary of changes included with this publication version:
● Updates to the System Management UI section to reflect changes made to this UI in this release.
● Updates to the security section, which now provides instructions for enabling SSL for Tableau'sauthentication.
● Updates to the Urika CLI section to reflect addition of the Spark Thrift server. This section now also includesthe sequence in which the urika-start and urika-stop commands need to be executed.
● Updates to the service to node mapping section to incorporate addition of the Spark Thrift server.
● Updates to the power up and power down procedures.
● Updates to the list of system accounts.
● Updates to the list of authentication mechanisms to include authentication mechanisms for HiverServer2 andSpark Thrift Server.
● Minor updates to the Grafana sections to reflect timezone related information and other editorial changes.
● Minor updates to the default system configurations.
Other changes include reorganization of some sections for better readability.
FeedbackVisit the Cray Publications Portal at http://pubs.cray.com and make comments online using the Contact Us buttonin the upper-right corner or Email [email protected]. Your comments are important to us and we will respond within24 hours.
TrademarksThe following are trademarks of Cray Inc. and are registered in the United States and other countries: CRAY anddesign, SONEXION, Urika-GX, Urika-XA, Urika-GD, and YARCDATA. The following are trademarks of Cray Inc.: APPRENTICE2, CHAPEL, CLUSTER CONNECT, CRAYDOC, CRAYPAT, CRAYPORT, DATAWARP, ECOPHLEX,LIBSCI, NODEKARE. The following system family marks, and associated model number marks, are trademarksof Cray Inc.: CS, CX, XC, XE, XK, XMT, and XT. The registered trademark LINUX is used pursuant to asublicense from LMI, the exclusive licensee of Linus Torvalds, owner of the mark on a worldwide basis. Othertrademarks used in this document are the property of their respective owners.
About the Urika-GX System Administration Guide
S3016 7

2 The Urika-GX SystemThe Urika-GX system is a big data analytics platform optimized for analytic workflows. It combines a highlyadvanced hardware platform with a comprehensive analytic software stack to help derive optimal business valuefrom data. The Urika-GX platform provides the tools required for capturing and organizing a wide variety of datatypes from different sources and enables analyzing big data and discovering hidden relationships.
The Urika-GX system also features a number of workload management tools as well as an optimized systemadministration tool for performing monitoring and management tasks.
For a list of features of the Urika-GX system, see S-3017, "Urika®-GX System Overview".
2.1 Administrative Components of Urika-GXUrika-GX platforms have been developed by tightly integrating commodity hardware components, open-sourcesoftware, and Cray proprietary hardware, to provide users a high performance, scalable and open computeplatform.
Major administrative components of Urika-GX include:
● System Management Workstation (SMW) - The SMW is a server that acts as a single-point interface to asystem administrator's environment. It provides an interface for performing administrative and monitoringcapabilities.
○ Hardware Supervisory System (HSS) - HSS is an integrated system of hardware and softwarecomponents that are used for managing and monitoring the system.
○ Cray System Management Software (CSMS) - CSMS is a system management tool that is based uponOpenStack. It interfaces with HSS to provide image and node and management capabilities on the Urika-GX system.
● Rack Controller (RC) - The RC monitors the environmental sensors within the rack and managescommunication between the SMW and other physical system components, including the rack, sub-rack anddANC (Dual Aries Network Card).
● Intelligent Subrack Control Board (iSCB) - The iSCB status command can be used to monitor the physicalattributes of the sub-rack, such as the power supply, amperage, fan status, and temperature.
● Aries Network Card Controller (ANCC) - Each sub-rack chassis of the Urika-GX system contains twodANCs (dual Aries Network Cards). Each dANC contains 2 Aries chips, an Advanced RISC Machines (ARM)processor, and a number of environmental sensors to help monitor the system.
● Integrated Dell Remote Access Controller (iDRAC) - The iDRAC is a hardware that provides advancedagentless system management functionality for the SMW. It operates independently of the SMW's CPU andoperating system. The version of iDRAC used on the Urika-GX system is iDRAC8.
● System Monitoring and Performance Analysis Tools - Urika-GX ships with Grafana, which enablesmonitoring system resources and viewing performance statistics of various system components. For moreinformation, see S-3015, Urika®-GX Analytic Applications Guide.
The Urika-GX System
S3016 8
● Data Analytic Components - Urika-GX features a number of data analytic tools that help perform analytictasks, including managing and monitoring clusters, executing Hadoop and SPARK jobs, etc. For moreinformation, see S-3015, Urika®-GX Analytic Applications Guide.
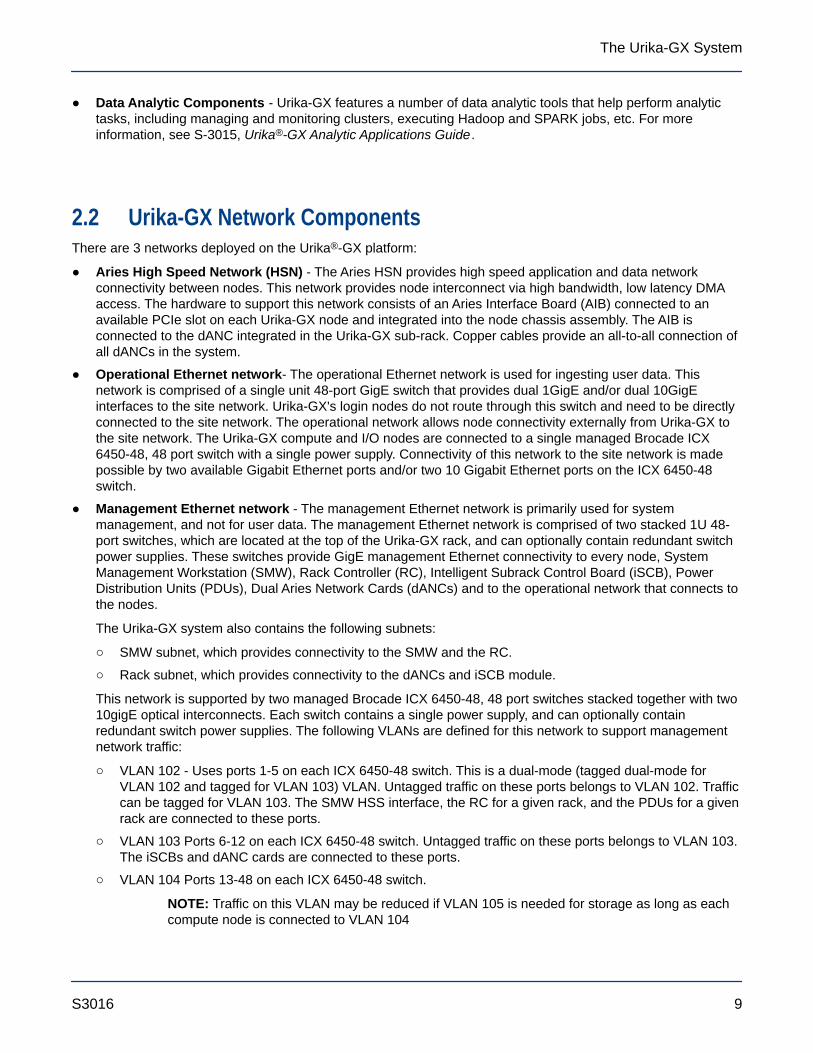
2.2 Urika-GX Network ComponentsThere are 3 networks deployed on the Urika®-GX platform:
● Aries High Speed Network (HSN) - The Aries HSN provides high speed application and data networkconnectivity between nodes. This network provides node interconnect via high bandwidth, low latency DMAaccess. The hardware to support this network consists of an Aries Interface Board (AIB) connected to anavailable PCIe slot on each Urika-GX node and integrated into the node chassis assembly. The AIB isconnected to the dANC integrated in the Urika-GX sub-rack. Copper cables provide an all-to-all connection ofall dANCs in the system.
● Operational Ethernet network- The operational Ethernet network is used for ingesting user data. Thisnetwork is comprised of a single unit 48-port GigE switch that provides dual 1GigE and/or dual 10GigEinterfaces to the site network. Urika-GX's login nodes do not route through this switch and need to be directlyconnected to the site network. The operational network allows node connectivity externally from Urika-GX tothe site network. The Urika-GX compute and I/O nodes are connected to a single managed Brocade ICX6450-48, 48 port switch with a single power supply. Connectivity of this network to the site network is madepossible by two available Gigabit Ethernet ports and/or two 10 Gigabit Ethernet ports on the ICX 6450-48switch.
● Management Ethernet network - The management Ethernet network is primarily used for systemmanagement, and not for user data. The management Ethernet network is comprised of two stacked 1U 48-port switches, which are located at the top of the Urika-GX rack, and can optionally contain redundant switchpower supplies. These switches provide GigE management Ethernet connectivity to every node, SystemManagement Workstation (SMW), Rack Controller (RC), Intelligent Subrack Control Board (iSCB), PowerDistribution Units (PDUs), Dual Aries Network Cards (dANCs) and to the operational network that connects tothe nodes.
The Urika-GX system also contains the following subnets:
○ SMW subnet, which provides connectivity to the SMW and the RC.
○ Rack subnet, which provides connectivity to the dANCs and iSCB module.
This network is supported by two managed Brocade ICX 6450-48, 48 port switches stacked together with two10gigE optical interconnects. Each switch contains a single power supply, and can optionally containredundant switch power supplies. The following VLANs are defined for this network to support managementnetwork traffic:
○ VLAN 102 - Uses ports 1-5 on each ICX 6450-48 switch. This is a dual-mode (tagged dual-mode forVLAN 102 and tagged for VLAN 103) VLAN. Untagged traffic on these ports belongs to VLAN 102. Trafficcan be tagged for VLAN 103. The SMW HSS interface, the RC for a given rack, and the PDUs for a givenrack are connected to these ports.
○ VLAN 103 Ports 6-12 on each ICX 6450-48 switch. Untagged traffic on these ports belongs to VLAN 103.The iSCBs and dANC cards are connected to these ports.
○ VLAN 104 Ports 13-48 on each ICX 6450-48 switch.
NOTE: Traffic on this VLAN may be reduced if VLAN 105 is needed for storage as long as eachcompute node is connected to VLAN 104
The Urika-GX System
S3016 9

Untagged traffic on these ports belongs to VLAN 104. The compute nodes and the SMW node-sidenetwork are connected to these ports.
○ VLAN 105 Some number of Ports 13-48 on each ICX 6450-48 switch, as needed for storagemanagement. Untagged traffic on these ports belongs to VLAN 105. The Storage Management Ports areconnected to these ports.
○ VLAN 1 (default) is unused.
Traffic from the SMW to the subcomponents in the rack subnet, and vice versa, is routed through thecorresponding RC.
For additional information, see the Urika®-GX Hardware Guide.
2.3 Urika-GX File SystemsSupported file system types on Urika-GX include:
● Internal file systems
○ Hadoop Distributed File System (HDFS) - Hadoop uses HDFS for storing data. HDFS is highly fault-tolerant, provides high throughput access to application data, and is suitable for applications that havelarge data sets. Urika-GX also features tiered HDFS storage. HDFS data is transferred over the Ariesnetwork.
○ Network File System (NFS) - The Urika-GX SMW hosts NFS, which is made available to every node viathe management network.
● External file system
Urika-GX currently supports Lustre as an external file system. On the Urika-GX system, Cray Lustre clientsand a Lustre server is included to support:
○ Direct Attach Lustre (DAL) - In a DAL configuration, the Urika-GX I/O nodes are directly attached to anexternal block storage device and configured as Lustre servers, whereas all the other node areconfigured as Lustre clients.
○ Cray Sonexion storage system - When a Urika-GX system uses the Cray Sonexion as its external storagesystem, the Sonexion system is attached to Urika-GX I/O nodes as Lustre clients. In this type ofconfiguration, the I/O nodes act as LNET routers to serve Lustre to all other nodes in the system.
○ Cray Data Virtualization Service (DVS) - Cray has successfully experimented with connecting Urika-GX toGPFS and NFS filesystems via Cray DVS. For more information and guidance, please contact CraySupport.
The Lustre file system is served over the Aries network when the DAL or Sonexion configuration type is used.
File Locations● Home directories are mounted on (internal) NFS, with limited space
● Distributed filesystem (Lustre), if provisioned, is mounted at /mnt/lustre and is suitable for larger files.
CAUTION: Avoid using NFS for high data transfer and/or large writes as this will cause the network tooperate much slower or timeout. NFS, as configured for Urika-GX home directories, is not capable ofhandling large parallel writes from multiple nodes without data loss. Though It is possible to configureNFS to handle parallel writes, it would require a hard mount, which would have undesired consequences.
The Urika-GX System
S3016 10

2.4 Urika-GX System NodesEach Urika-GX node is a logical grouping of a processor, memory, and a data routing resource. Nodes can becategorized as compute, I/O, and login nodes.
Table 1. Node Types and Descriptions
Node Type Description
Compute nodes Compute nodes run application programs.
I/O nodes I/O nodes facilitate connecting to the supported external storage system.
Login nodes Users log in to the Urika-GX system via login nodes. Login nodes store users'local files and facilitate launching jobs from the command line. They also offerthe environment for users to build, compile, and monitor analytics applications.
All Urika-GX nodes run the CentOS operating system (version 7.2) as well as portions of the Cray LinuxEnvironment (CLE).
2.5 Restrictions on Use
Hardware ConsiderationsThe following items should be kept under consideration when using Urika-GX hardware:
● High speed network/management network switches must not be modified as this network is internal to Urika-GX.
● Moving the system from the rack Cray supplies to customer provided racks is not supported.
● Hardware configurations of the sub-racks and System Management Workstation (SMW) must not bechanged.
● PCIe devices should not be modified.
● Hardware and drivers installed on the SMW and nodes should not be modified.
● PDUs installed on the system should not be replaced.
NOTE: Contact Cray Support if it is required to swap nodes between slots.
The following options are supported:
● Connecting to the internal PDU power switches.
● Changing the hosts names of login nodes and the SMW.
● The single top of rack switch used for the operational network may be modified to meet site-specific needs.This switch is expected to be used to enable a direct connection from the site network to the compute and I/Onodes to support data ingestion and streaming analytics. This network may be modified to reflect site-specificIP addresses and node names that would be directly exposed to the site network.
The Urika-GX System
S3016 11
● The available space in the rack can be used for additional hardware, however proper power and cooling forthat gear needs to be ensured.
Contact Cray Support for information related to:
● Optionally switching to higher bandwidth NICs on the login nodes or SMW connections to the site network.
● Changing the internal range of Cray's IP addresses in case there is a conflict.
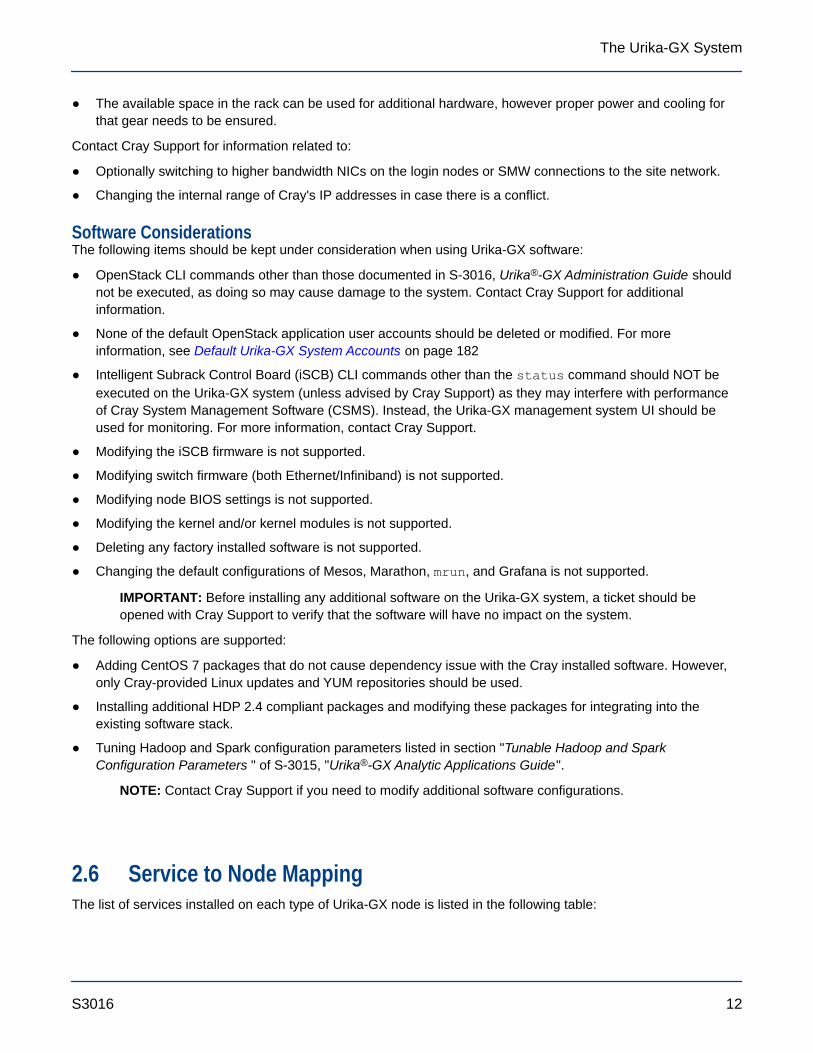
Software ConsiderationsThe following items should be kept under consideration when using Urika-GX software:
● OpenStack CLI commands other than those documented in S-3016, Urika®-GX Administration Guide shouldnot be executed, as doing so may cause damage to the system. Contact Cray Support for additionalinformation.
● None of the default OpenStack application user accounts should be deleted or modified. For moreinformation, see Default Urika-GX System Accounts on page 182
● Intelligent Subrack Control Board (iSCB) CLI commands other than the status command should NOT beexecuted on the Urika-GX system (unless advised by Cray Support) as they may interfere with performanceof Cray System Management Software (CSMS). Instead, the Urika-GX management system UI should beused for monitoring. For more information, contact Cray Support.
● Modifying the iSCB firmware is not supported.
● Modifying switch firmware (both Ethernet/Infiniband) is not supported.
● Modifying node BIOS settings is not supported.
● Modifying the kernel and/or kernel modules is not supported.
● Deleting any factory installed software is not supported.
● Changing the default configurations of Mesos, Marathon, mrun, and Grafana is not supported.
IMPORTANT: Before installing any additional software on the Urika-GX system, a ticket should beopened with Cray Support to verify that the software will have no impact on the system.
The following options are supported:
● Adding CentOS 7 packages that do not cause dependency issue with the Cray installed software. However,only Cray-provided Linux updates and YUM repositories should be used.
● Installing additional HDP 2.4 compliant packages and modifying these packages for integrating into theexisting software stack.
● Tuning Hadoop and Spark configuration parameters listed in section "Tunable Hadoop and SparkConfiguration Parameters " of S-3015, "Urika®-GX Analytic Applications Guide".
NOTE: Contact Cray Support if you need to modify additional software configurations.
2.6 Service to Node MappingThe list of services installed on each type of Urika-GX node is listed in the following table:
The Urika-GX System
S3016 12
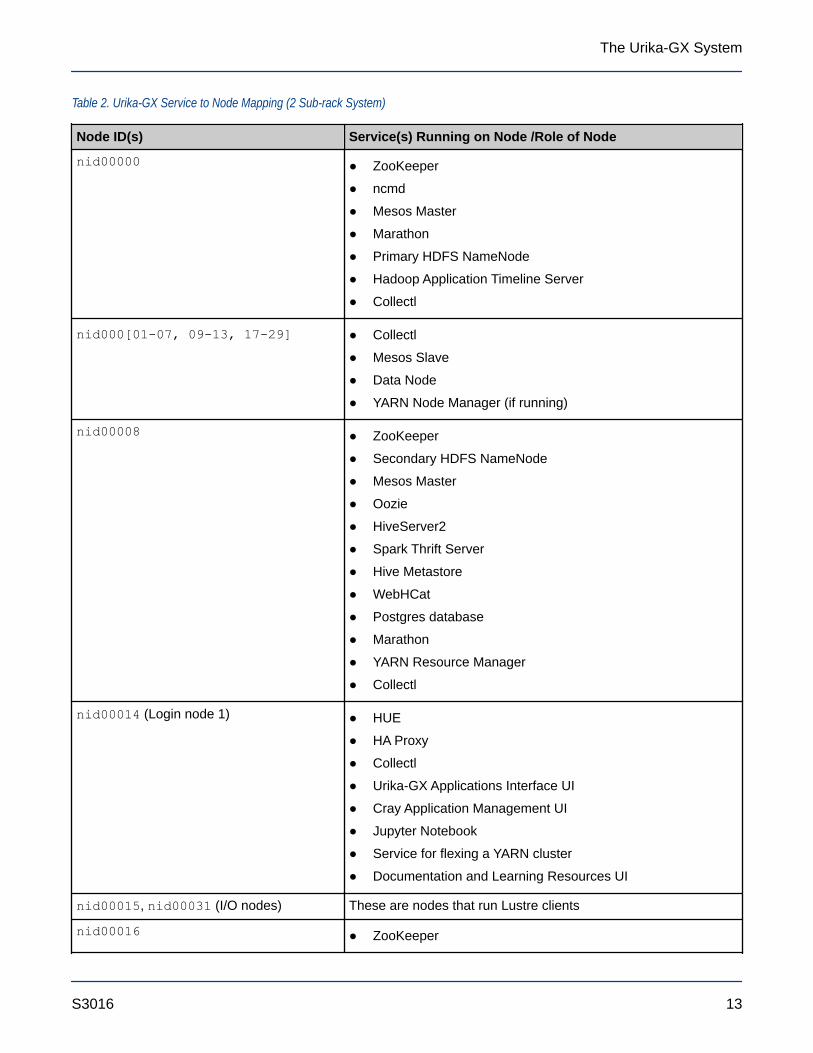
Table 2. Urika-GX Service to Node Mapping (2 Sub-rack System)
Node ID(s) Service(s) Running on Node /Role of Node
nid00000 ● ZooKeeper
● ncmd
● Mesos Master
● Marathon
● Primary HDFS NameNode
● Hadoop Application Timeline Server
● Collectl
nid000[01-07, 09-13, 17-29] ● Collectl
● Mesos Slave
● Data Node
● YARN Node Manager (if running)
nid00008 ● ZooKeeper
● Secondary HDFS NameNode
● Mesos Master
● Oozie
● HiveServer2
● Spark Thrift Server
● Hive Metastore
● WebHCat
● Postgres database
● Marathon
● YARN Resource Manager
● Collectl
nid00014 (Login node 1) ● HUE
● HA Proxy
● Collectl
● Urika-GX Applications Interface UI
● Cray Application Management UI
● Jupyter Notebook
● Service for flexing a YARN cluster
● Documentation and Learning Resources UI
nid00015, nid00031 (I/O nodes) These are nodes that run Lustre clients
nid00016 ● ZooKeeper
The Urika-GX System
S3016 13

Node ID(s) Service(s) Running on Node /Role of Node
● Mesos Master
● Marathon
● Hadoop Job History Server
● Spark History Server
● Collectl
nid00030 (Login node 2) ● HUE
● HA Proxy
● Collectl
● Service for flexing a YARN cluster
● Grafana
● InfluxDB
Table 3. Urika-GX Service to Node Mapping (3 Sub-rack System)
Node ID(s) Service(s) Running on Node /Role of Node
nid00000 ● ZooKeeper
● ncmd
● Mesos Master
● Marathon
● Primary HDFS NameNode
● Hadoop Application Timeline Server
● Collectl
nid00001-nid00015, nid00017-nid00029, nid00033-nid00045
● Collectl
● Mesos Slave
● Data Node
● YARN Node Manager (if running)
nid00016 ● ZooKeeper
● Mesos Master
● Marathon
● Hadoop Job History Server
● Spark History Server
● Collectl
nid00030 (Login node 1) ● HUE
● HA Proxy
The Urika-GX System
S3016 14
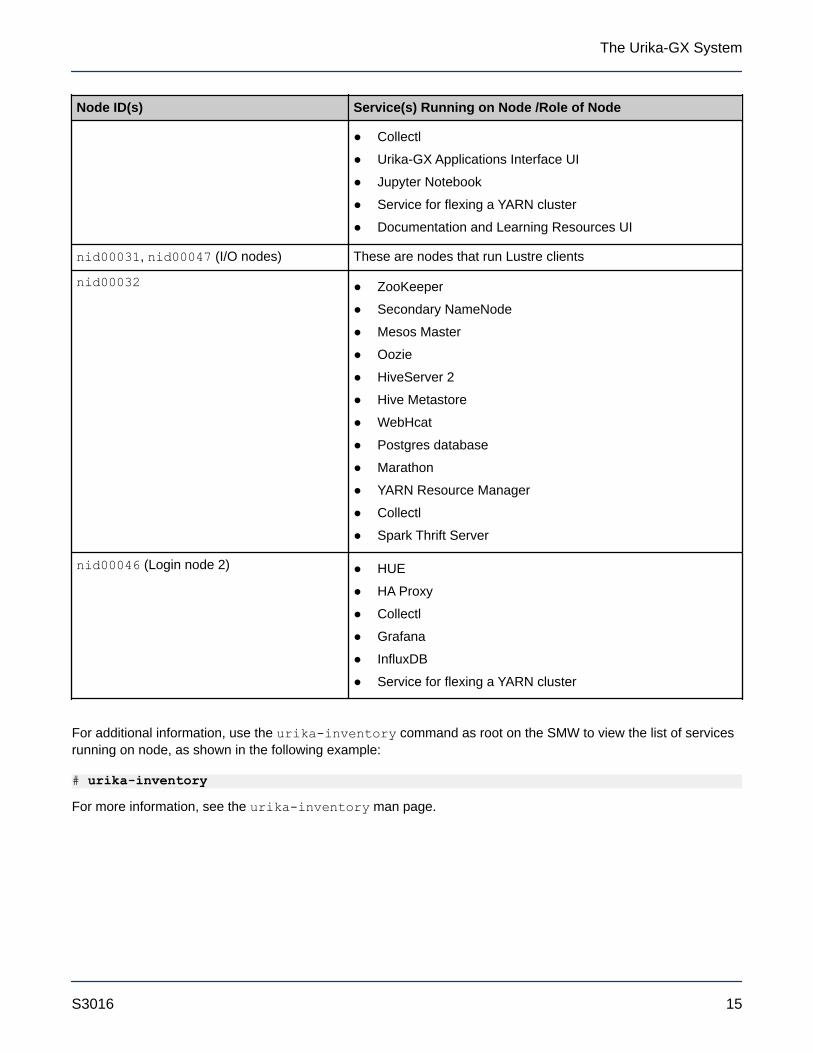
Node ID(s) Service(s) Running on Node /Role of Node
● Collectl
● Urika-GX Applications Interface UI
● Jupyter Notebook
● Service for flexing a YARN cluster
● Documentation and Learning Resources UI
nid00031, nid00047 (I/O nodes) These are nodes that run Lustre clients
nid00032 ● ZooKeeper
● Secondary NameNode
● Mesos Master
● Oozie
● HiveServer 2
● Hive Metastore
● WebHcat
● Postgres database
● Marathon
● YARN Resource Manager
● Collectl
● Spark Thrift Server
nid00046 (Login node 2) ● HUE
● HA Proxy
● Collectl
● Grafana
● InfluxDB
● Service for flexing a YARN cluster
For additional information, use the urika-inventory command as root on the SMW to view the list of servicesrunning on node, as shown in the following example:
# urika-inventory
For more information, see the urika-inventory man page.
The Urika-GX System
S3016 15
3 System Management
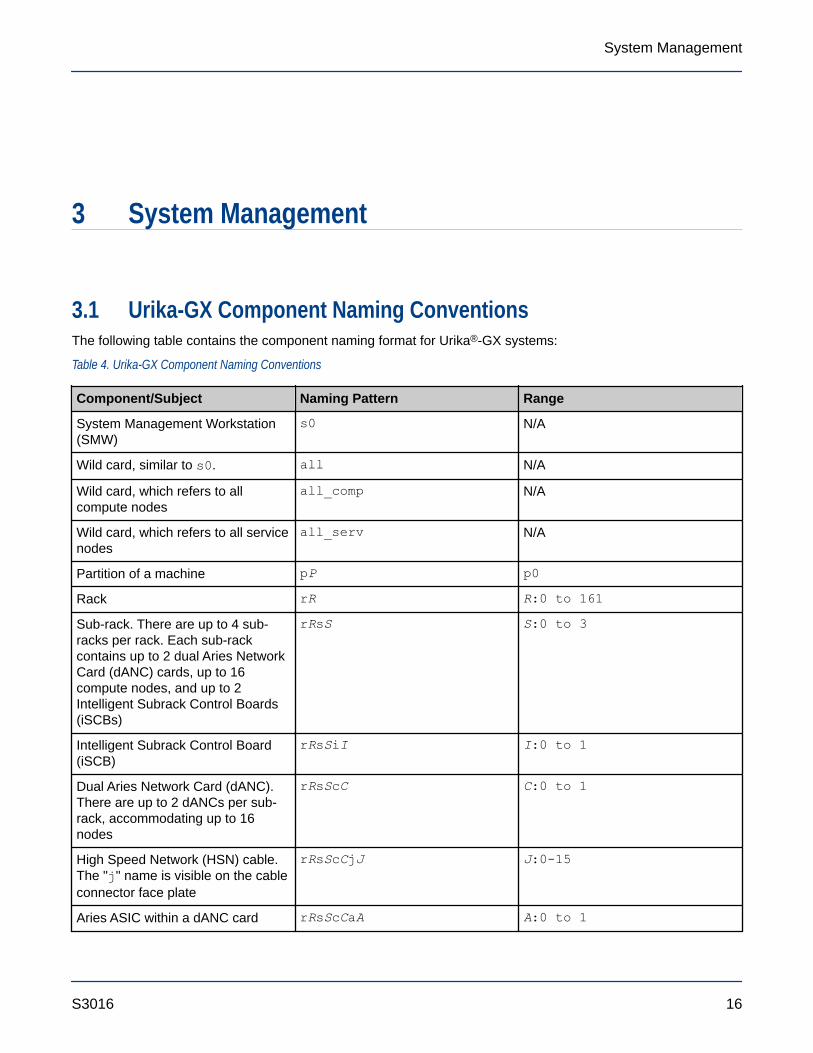
3.1 Urika-GX Component Naming ConventionsThe following table contains the component naming format for Urika®-GX systems:
Table 4. Urika-GX Component Naming Conventions
Component/Subject Naming Pattern Range
System Management Workstation(SMW)
s0 N/A
Wild card, similar to s0. all N/A
Wild card, which refers to allcompute nodes
all_comp N/A
Wild card, which refers to all servicenodes
all_serv N/A
Partition of a machine pP p0
Rack rR R:0 to 161
Sub-rack. There are up to 4 sub-racks per rack. Each sub-rackcontains up to 2 dual Aries NetworkCard (dANC) cards, up to 16compute nodes, and up to 2Intelligent Subrack Control Boards(iSCBs)
rRsS S:0 to 3
Intelligent Subrack Control Board(iSCB)
rRsSiI I:0 to 1
Dual Aries Network Card (dANC).There are up to 2 dANCs per sub-rack, accommodating up to 16nodes
rRsScC C:0 to 1
High Speed Network (HSN) cable.The "j" name is visible on the cableconnector face plate
rRsScCjJ J:0-15
Aries ASIC within a dANC card rRsScCaA A:0 to 1
System Management
S3016 16

Component/Subject Naming Pattern Range
Aries link control block within anAries ASIC.
rRsScCaAlRC R:0 to 5
C:0 to 7
Network Interface Controller (NIC)within an Aries ASIC
rRsScCaAnN N:0 to 3
Node within a dANC card rRsScCnN N:0 to 7
Accelerator within a node rRsScCnNaA A:0 to 7
Board Management Control (BMC)within a node
rRsScCnNbB B:0
3.2 System Management Workstation (SMW)The System Management Workstation (SMW) is the system administrator's console for managing a Cray system.The SMW is a server that runs the CentOS (version 7.2) operating system, Cray developed software, and third-party software. The SMW is also a point of control for the Hardware Supervisory System (HSS). The HSS data isstored on an internal hard drive of the SMW.
The SMW provides shell, and web access via CSMS, to authorized users to perform administrative andmonitoring tasks.
Most system logs are collected and stored on the SMW. The SMW plays no role in computation after the systemis booted. From the SMW an administrator can initiate the boot process, access the database that keeps track ofsystem hardware, analyze log messages, and perform standard administrative tasks.
CAUTION:
The SMW is a critical system component, which facilitates the operation of other hardware and softwarecomponents. Therefore, it is important that all instructions in this publication be followed before makingany changes/reconfigurations to the SWM, as well as before restarting the SMW.
3.2.1 Power On the System Management Workstation (SMW)The SMW can be turned on by:
● Physically turning the SMW on via the power button.
● Using the iDRAC.
CAUTION:
The SMW is a critical system component, which facilitates the operation of other hardware and softwarecomponents. Therefore, it is important that all instructions in this publication be followed before makingany changes/reconfigurations to the SWM, as well as before restarting the SMW.
System Management
S3016 17

3.2.2 About the Integrated Dell Remote Access Controller (iDRAC)The iDRAC is a systems management hardware and software solution that provides remote managementcapabilities, crashed system recovery, and power control functions for the System Management Workstation(SMW). The iDRAC alerts administrators to server issues, helps them perform remote server management, andreduces the need for physical access to the server. The iDRAC also facilitates inventory management andmonitoring, deployment and troubleshooting. To help diagnose the probable cause of a system crash, the iDRACcan log event data and capture an image of the screen when it detects that the system has crashed.
For more information about the iDRAC, refer to online documentation at http://www.dell.com.
3.2.3 Change the Default iDRAC8 Password
About this taskAfter accessing the iDRAC8's web interface, it is recommended to change the default password using thefollowing instructions:
Procedure
1. Bring up a web browser.
2. Go to: https://cray-drac, where cray-drac is used as an example for the iDRAC's name, such as https://system-smw-ras
The iDRAC's login screen appears.
3. Enter root and initial0 as the default user name and password on the iDRAC's log in screen.
4. Select the Submit button
5. Select iDRAC settings from the left navigation menu bar.
6. Select User Authentication
7. Select the User ID for the user that needs to have the password changed.
System Management
S3016 18

Figure 1. Change the Default Password Interface
8. Select the Next button on the next interface
9. Select the Change Password check-box on the User Configuration interface.
10. Enter the new password in the New Password and Confirm New Password fields.
System Management
S3016 19

11. Select Apply to complete the password change.
3.2.4 Change the Default System Management Workstation (SMW) Passwords
PrerequisitesEnsure that the SMW is accessible. This procedure requires root access.
About this taskAfter logging on to the SMW for the first time, Cray recommends changing the default passwords, as described inthe following instructions.
Procedure
1. Log in to SMW as root.
2. Change default passwords on the SMW by executing the following commands.
smw# passwd root
smw# passwd crayadm
smw# passwd mysql
3. Update the password in the same manner on all the nodes.
For rack-mount SMWs, such as that used in the Urika-GX system, it is also necessary to change the defaultiDRAC password.
3.2.5 Control System Management Workstation (SMW) Power with the iDRAC8 WebConsole
PrerequisitesEnsure that the SMW is up and running.
About this taskUse the iDRAC's web console to start up and shut down the System Management Workstation (SMW).
Procedure
1. Point your browser to your site-specific iDRAC IP address, such as https://system-smw-ras
The iDRAC console's login screen appears.
2. Enter root and initial0 in the Username and Password fields respectively. These are the defaultcredentials that should only be used if the default credentials have not been changed.
System Management
S3016 20
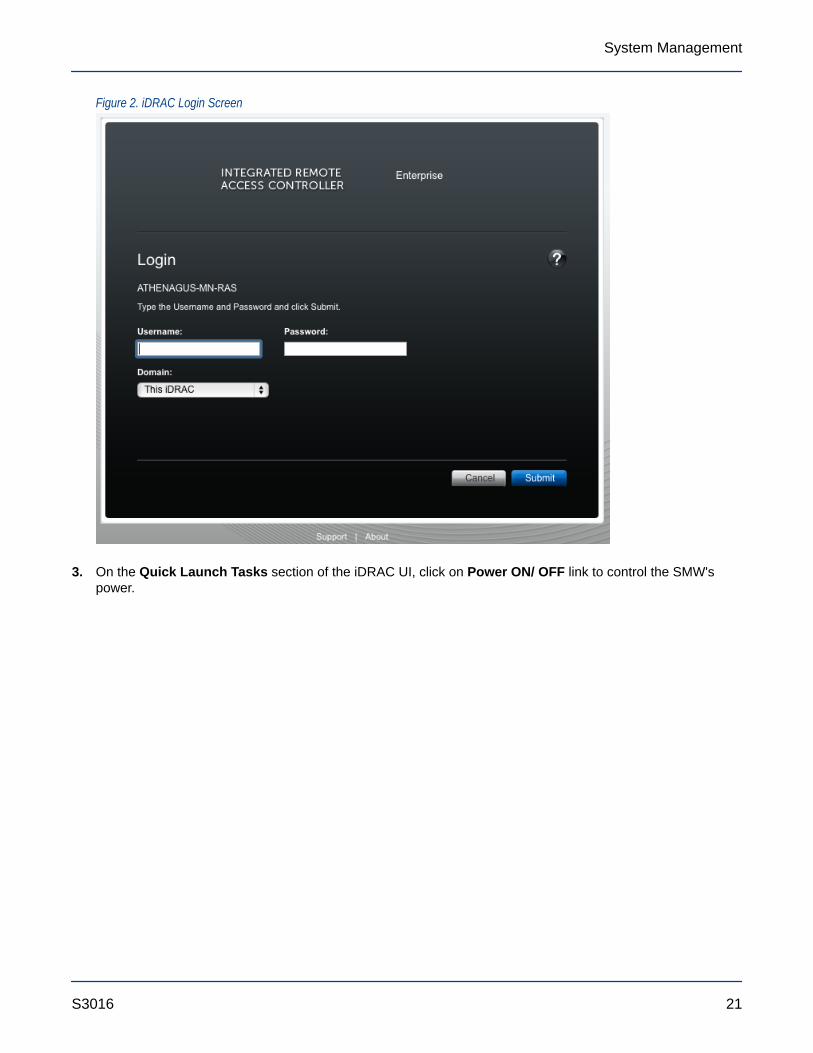
Figure 2. iDRAC Login Screen
3. On the Quick Launch Tasks section of the iDRAC UI, click on Power ON/ OFF link to control the SMW'spower.
System Management
S3016 21
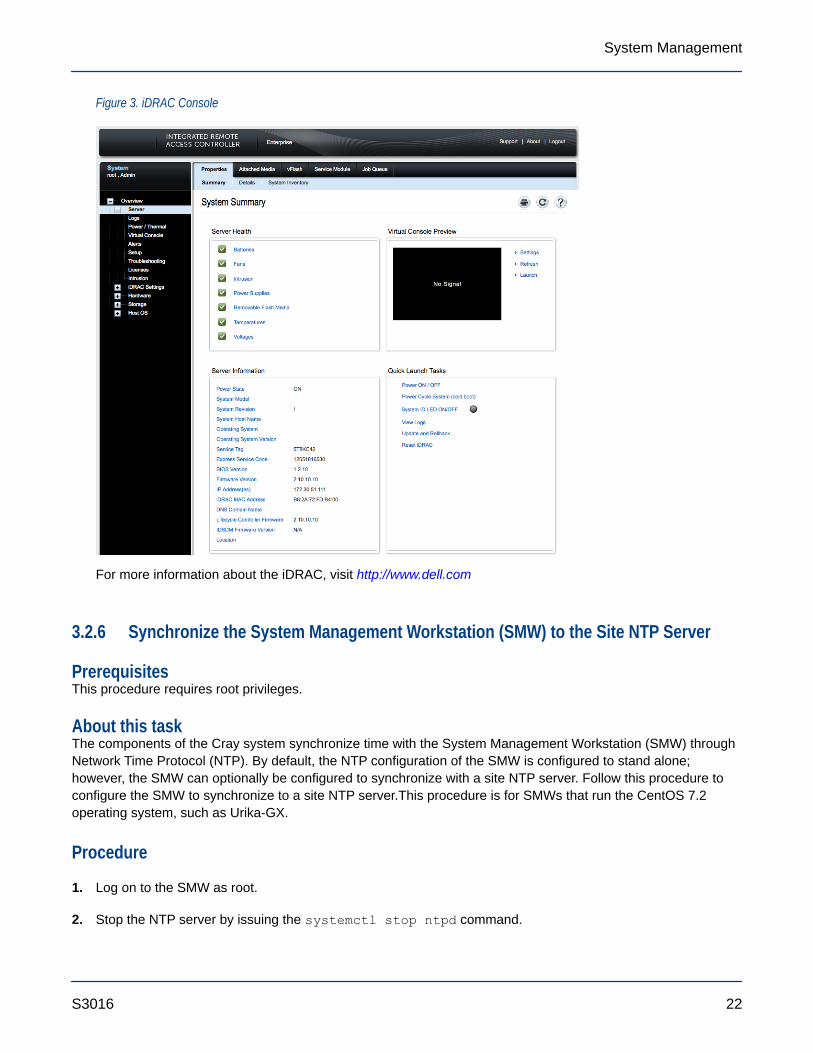
Figure 3. iDRAC Console
For more information about the iDRAC, visit http://www.dell.com
3.2.6 Synchronize the System Management Workstation (SMW) to the Site NTP Server
PrerequisitesThis procedure requires root privileges.
About this taskThe components of the Cray system synchronize time with the System Management Workstation (SMW) throughNetwork Time Protocol (NTP). By default, the NTP configuration of the SMW is configured to stand alone;however, the SMW can optionally be configured to synchronize with a site NTP server. Follow this procedure toconfigure the SMW to synchronize to a site NTP server.This procedure is for SMWs that run the CentOS 7.2operating system, such as Urika-GX.
Procedure
1. Log on to the SMW as root.
2. Stop the NTP server by issuing the systemctl stop ntpd command.
System Management
S3016 22

smw:~ # systemctl stop ntpd
3. Edit the /etc/ntp.conf file on the SMW to point to the new server.
4. Update the clocks
smw:~ # ntpdate timeserver
5. Restart the NTP server by issuing the systemctl start ntpd command:
smw:~ # systemctl start ntpd
The SMW can continue to update the rest of the system by proxy. By default, the SMW qualifies as a stratum3 (local) NTP server. For more information about NTP, refer to the Linux documentation.
6. Sync the hardware clock
smw:~ # hwclock --systohc
7. Verify that the SMW has jitter from the NTP server
smw:~ # ntpq -p
3.2.7 Synchronize Time of Day on System Nodes
PrerequisitesThis procedure needs to be carried out as root.
About this taskFollow this procedure to configure Urika-GX compute nodes to synchronize to a site NTP server. This procedureis speicific to a 48 node system.
Procedure
1. Stop the NTP server by issuing the systemctl stop ntpd command.
# pdsh -w nid000[00-47] " systemctl stop ntpd"
2. Edit the /etc/ntp.conf file on the SMW to point to the new server.
3. Update the clocks
# pdsh -w nid000[00-47] " ntpdate -s smw"
4. Sync the hardware clock
# pdsh -w nid000[00-47] "hwclock --systohc "
5. Restart the NTP server by issuing the systemctl start ntpd command:
# pdsh -w nid000[00-47] " systemctl start ntpd"
System Management
S3016 23

3.2.8 Reboot a Stopped System Management Workstation (SMW)
About this taskThe SMW is an integral player in monitoring and maintaining optimal High Speed Network (HSN) traffic. If theSMW is down or being rebooted (i.e., not fully working), the Aries Network Card Controllers (ANCCs) willautomatically throttle the high-speed network because the ANCCs are no longer hearing SMW heartbeats. This isdone in order to prevent possible network congestion, which normally requires the SMW to be up in order torespond to such congestion. Once the SMW is up again, the ANCCs will unthrottle the network. (No attempt ismade to prevent loss of data or to carry out operations that occur when the SMW is offline). The consequences ofthrottling are that the network will perform much more slowly than normal.
When the SMW comes up, it restarts, establishes communications with all external interfaces, restores the properstate in the state manager, and continues normal operation without user intervention.
For a scheduled or unscheduled shutdown and reboot of the SMW, it is necessary to have a backup ofconfiguration files so that if one or more of the files in use becomes corrupted, a clean set of files is available withwhich to reboot.
Procedure
1. Ensure that there are no resiliency actions taking place (by executing tail -f /var/opt/cray/log/p0-default/nlrd-YYYYMMDD) at the time of a graceful SMW shutdown, otherwise wait until the action isfinished.
# tail -f /var/opt/cray/log/p0-default/nlrd-YYYYMMDD
2. Boot the SMW.
3.3 Hardware Supervisory System (HSS)HSS is an integrated system of hardware and software that monitors the hardware components of the system andproactively manages the health of the system. HSS communicates with nodes and management processors overan internal (private) Ethernet network that operates independently of the Cray Aries High Speed Network (HSN).
HSS includes the following components:
● HSS network
● HSS Command Line Interface (CLI)
● Aries Network Card Controllers (ANCCs)
● Rack controllers
● HSS daemons
● HSS database
● Various logs
HSS performs a number of administrative tasks, such as:
● Monitoring certain hardware system components
System Management
S3016 24
● Managing hardware and software failures
● Starting up and shutting down nodes
● Managing the High Speed Network (HSN)
● Maintaining system component states
● Managing the hardware inventory
HSS Command Line InterfaceHSS has a command-line interface to manage and view the system from the SMW. For complete usageinformation, see the xtcli(8) man page.
Dual Aries Network Card (dANC) Controllers and Rack ControllersA dANC control processor is hierarchically the lowest component of the monitoring system. The dANC Craynetwork card contains two Aries ASICs and an ANCC. There are 2 dANC cards per sub-rack, and hence 4 AriesASICs, which support 16 nodes. The dANC monitors the general health of components, including items such asvoltages, temperature, and various failure indicators. A version of Linux optimized for embedded controllers runson each dANC controller.
Each rack has a rack control processor (rack controller) that monitors and controls the rack power andcommunicates with all dANC controllers in the rack. It sends a periodic heartbeat to the SMW to indicate rackhealth.
The rack controller connects to the dANC controllers via the Ethernet switch on each blade by an Ethernet cableand routes HSS data to and from the SMW. RC runs the same version of embedded Linux as the dANCs. TheSMW, rack controllers, iSCBs, and ANCCs are all interconnected via Ethernet
The monitoring system uses periodic heartbeats. Processes send heartbeats within a time interval. If the intervalis exceeded, the system monitor generates a fault event that is sent to the state manager. The fault is recorded inthe event log, and the state manager sets an alert flag for the component (dANC controller or rack controller) thatspawned it.
The rack and dANC controllers use NTP to keep accurate time with the SMW.
HSS DaemonsHSS daemons on the SMW and the controllers act to monitor and control the state of the system, and to respondto incidents such as hardware failures. The data path between the HSS CLI and the various daemons is via HSSevents.
Cray System Network Routing UtilityThe rtr command performs a variety of routing-related tasks for the High Speed Network (HSN). Tasks include:
● Generating and applying HSN routes
● Verifying that routes can be generated for the current configuration
● Verifying that generated routes are free of cyclic dependencies
● Dumping out a variety of routing-related and link-related information
System Management
S3016 25

HSS DatabaseThe HSS database is a MariaDB relational database that contains the state of all the physical systemcomponents, including the System Management Workstation (SMW), Rack Controller (RC), Intelligent SubrackControl Board (iSCB), nodes, and the Aries Network Card Controller (ANCC). The state manager reads andwrites the system state to the HSS database. The state manager keeps the database up-to-date with the currentstate of components and retrieves component information from the database when needed.
Log FilesEvent Logs The event router records events to the event log in the /var/opt/cray/log/event-yyyymmdd
file.
Log rotation takes place at specific time intervals. By default, one file is generated per day.
Dump Logs The xtdumpsys writes logs into the/var/opt/cray/dump directory by default.
SMW Logs SMW logs are stored in /var/opt/cray/log/p0-default on the SMW, and include logs forxtconsole, xtconsumer, xtnlrd, etc.
3.3.1 Hardware Supervisory System (HSS) Architecture OverviewHSS hardware on the Urika-GX system consists of a System Management Workstation (SMW), which is a rack-mounted Intel-based server running CentOS 7.2, along with an Ethernet network that connects the SMW to a rackcontroller (RC) via a switch. The RC connects to one Aries Network Card Controller (ANCC) on each dual AriesNetwork Card (dANC) and consists of a mini PC running Linux. The ANCC has a 32-bit processor. Each hardwarecomponent in the HSS system runs a version of Linux with the relevant HSS software installed. RC is used toroute data downstream from the SMW to the ANCCs and Intelligent Subrack Control Boards (iSCBs), andupstream from the ANCCs and iSCBs to the SMW.
HSS control and monitoring is performed by the SMW over the HSS Ethernet via a stacked managed switch,which uses VLANs to connect the SMW to the ANCCs, RC, and iSCBs.
The Urika-GX system can consist of 1, 2 or 3 sub-racks per rack, and 2 dANCs per sub-rack, resulting in amaximum of 6 dANCs per rack. Each dANC has 2 Aries ASICs, each of which has 4 NICs to support a singlenode per NIC connected by PCIe Gen 3.
HSS infrastructure software stack executes on the RC, SMW, and the ANCC to control and monitor the AriesASIC.
Resiliency Communication Agent (RCA)RCA is a messaging service that connects compute nodes to the HSS event and messaging system, and allowscompute nodes to subscribe to and inject HSS events and messages.
Inventory ManagementHSS keeps track of hardware inventory to identify which hardware components are up and running. It uses thexthwinv command to retrieve hardware component information.
Hardware DiscoveryHSS plays an integral role in system hardware discovery. HSS components that play a role in this process includethe HSS database and the xtdiscover command. For more information, see the xtdiscover(8) man page.
System Management
S3016 26
Hardware Supervisory System (HSS) Ethernet/Management NetworkThe HSS network provides interconnectivity between the System Management Workstation (SMW), RackControllers (RCs), and dual Aries Network Cards (dANCs) in a hierarchical fashion.
3.3.2 The xtdiscover CommandThe xtdiscover command automatically discovers the hardware components on a Cray system and createsentries in the system database to reflect the current hardware configuration. The xtdiscover commandidentifies missing or non-responsive cabinets and empty or non-functioning Dual Aries Network Cards (dANCs).The xtdiscover command and the state manager ensure that the system status represents the real state of thehardware. When xtdiscover has finished, a system administrator can use the xtcli command to display thecurrent configuration. No previous configuration of the system is required; the hardware is discovered and madeavailable. Modifications can be made to components after xtdiscover has finished creating entries in thesystem database.
The xtdiscover interface steps a system administrator through the discovery process.
Prior to performing component discovery, the xtdiscover command will need to make sure that the HardwareSupervisory System (HSS) networking is set up properly, using a user-provided block of IP address space. Thisinformation is used to create the /etc/hosts file and DHCP entries for the HSS network. This setup typicallyonly needs to be done once unless the address block is moved, or a new rack is added.
TIP: Simply adding an additional rack within an existing address block will not affect the addressassignments for the existing racks. If it is intended to add additional racks in the future, it is better toconfigure networking for all of them all at once. The xtdiscover command will automatically detectwhether each rack is presently in the system and will set the system state accordingly. HSS IPconfiguration is separate from that used by Cray System Management Software (CSMS) for setting upnetworking to the compute and service nodes. The two IP ranges provided must not overlap each other.
If there are changes to the system hardware, such as populating a previously empty dANC, or adding anadditional rack, then xtdiscover must be executed again, and it will perform an incremental discovery of thehardware changes. A full-system xtdiscover is not intended to be run while the High Speed Network (HSN) isactively routing traffic. When new blades are added during system operation with xtwarmswap, however, a mini-xtdiscover is automatically run to make the required updates to the database.
For more information, see the xtdiscover(8) man page.
3.3.3 Hardware Supervisory System (HSS) Component Location DiscoveryEach Urika®-GX system rack is numbered starting at 0. Each sub-rack within a rack has a dip switch that can setthe rack and sub rack number. The iSCB conveys the rack and sub-rack numbers to the Aries Network Cards(ANCs) via an I2C bus. The Dual Aries Network Card (dANC) blade has a slot-sense bit which tells it which dualdANC number it is within the sub-rack (0 or 1). The dANC uses the rack, sub-rack, and dANC number toconstruct its hostname. The Rack Controller (RC) determines its rack number from the location of the IntelligentSubrack Control Board (iSCB), encoded in a DHCP request sent by the iSCB and seen by RC.
3.3.4 Hardware Supervisory System (HSS) DaemonsHSS daemons and applications exchange information with the event router. They are locatedat: /opt/cray/hss/default/bin and are started when the System Management Workstation (SMW) boots.
System Management
S3016 27
They can be managed via systemd and can be stopped and started via systemctl stop hss andsystemctl start hss respectively. HSS daemons are configured dynamically by executing thextdaemonconfig command.
Key HSS daemons include:
● State manager daemon (state_manager) - Performs HSS system hardware state management.
● Event router daemon (erd) and (erdh) - Performs HSS message routing.
● Node ID manager daemon (nid_mgr) - Manages node IDs and NIC addresses for every node in the system.
State ManagerHSS maintains the state of all components that it manages. The state manager, state_manager, runs on theSMW and uses a relational database (also referred to as the HSS database) to maintain/store the system state.The state manager keeps the database up-to-date with the current state of components and retrieves componentinformation from the database when needed. Thus, the dynamic system state persists between SMW boots. Thestate manager uses the Lightweight Log Manager (LLM). The log data from state manager is writtento: /var/opt/cray/log/sm-yyyymmdd. The default setting for state manager is to enable LLM logging. Thestate manager performs the following functions:
● Updates and maintains component state information
● Monitors events to update component states
● Detects and handles state notification upon failure
● Provides state and configuration information to HSS applications.
The state manager performs the aforementioned tasks on behalf of:
● System nodes
● Aries chips
● Aries HSN Links
● dual Aries Network Card (dANC)
● Rack controller (RC)
● Intelligent Subrack Control Board (iSCB)
In summary, the state manager subscribes to and listens for HSS events, records changes of states, and sharesthose states with other daemons.
The Event Router (erd)HSS functions are event-driven. The event router daemon, erd runs on the SMW, rack controllers, and dANCcontrollers. HSS commands and daemons subscribe to events and inject events into the HSS system by usingthe services of the erd. The event router starts as each of the devices (SMW, rack controller, dANC controller)are started.
When the event router on the SMW receives an event from either a connected agent or from another event routerin the hierarchy, the event is logged and then processed. HSS CLI commands use events to query and controlHSS daemons.
System Management
S3016 28
Node ID (NID) ManagerThe nid_mgr generates a list of mapping between node logical IDs and physical Network Interface Controller(NIC) IDs and distributes this information to the blade controllers. Along with the ability to assign NIDsautomatically, the nid_mgr supports a mechanism that allows an administrator to control the NID assignment;this is useful for handling unique configurations. Administrator-controlled NID assignment is accomplished throughthe NID assignment file, nids.ini.
CAUTION: The nids.ini file can have a major impact on the functionality of a Cray system and shouldonly be used or modified at the recommendation of Cray support personnel. Setting up this file incorrectlycan make the Cray system unroutable.
Typically after a NID mapping is defined for a system, this mapping is used until some major event occurs, suchas a hardware configuration change. This may require the NID mapping to change, depending on the nature ofthe configuration change. Adding additional racks does not typically result in a new mapping.
Since the operating system always uses NIDs, HSS converts these to NIC IDs when sending them on to the HSSnetwork and converts them to NIDs when forwarding events from HSS network to a node.
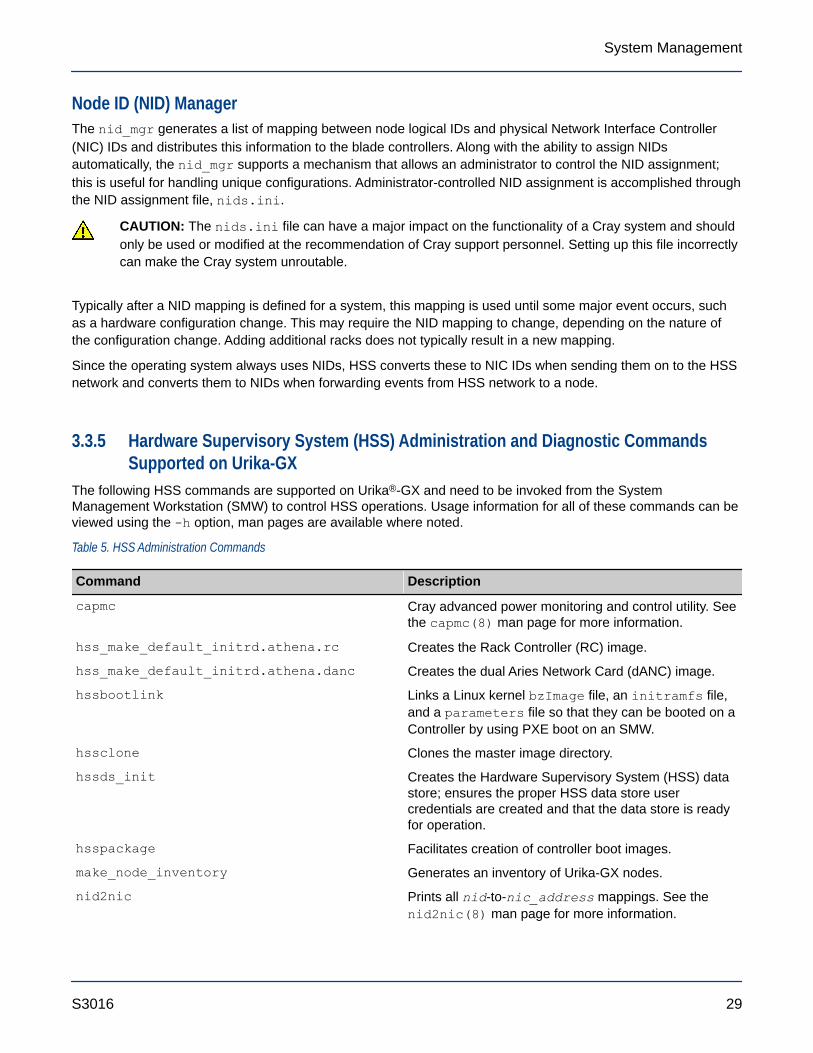
3.3.5 Hardware Supervisory System (HSS) Administration and Diagnostic CommandsSupported on Urika-GX
The following HSS commands are supported on Urika®-GX and need to be invoked from the SystemManagement Workstation (SMW) to control HSS operations. Usage information for all of these commands can beviewed using the -h option, man pages are available where noted.
Table 5. HSS Administration Commands
Command Description
capmc Cray advanced power monitoring and control utility. Seethe capmc(8) man page for more information.
hss_make_default_initrd.athena.rc Creates the Rack Controller (RC) image.
hss_make_default_initrd.athena.danc Creates the dual Aries Network Card (dANC) image.
hssbootlink Links a Linux kernel bzImage file, an initramfs file,and a parameters file so that they can be booted on aController by using PXE boot on an SMW.
hssclone Clones the master image directory.
hssds_init Creates the Hardware Supervisory System (HSS) datastore; ensures the proper HSS data store usercredentials are created and that the data store is readyfor operation.
hsspackage Facilitates creation of controller boot images.
make_node_inventory Generates an inventory of Urika-GX nodes.
nid2nic Prints all nid-to-nic_address mappings. See thenid2nic(8) man page for more information.
System Management
S3016 29
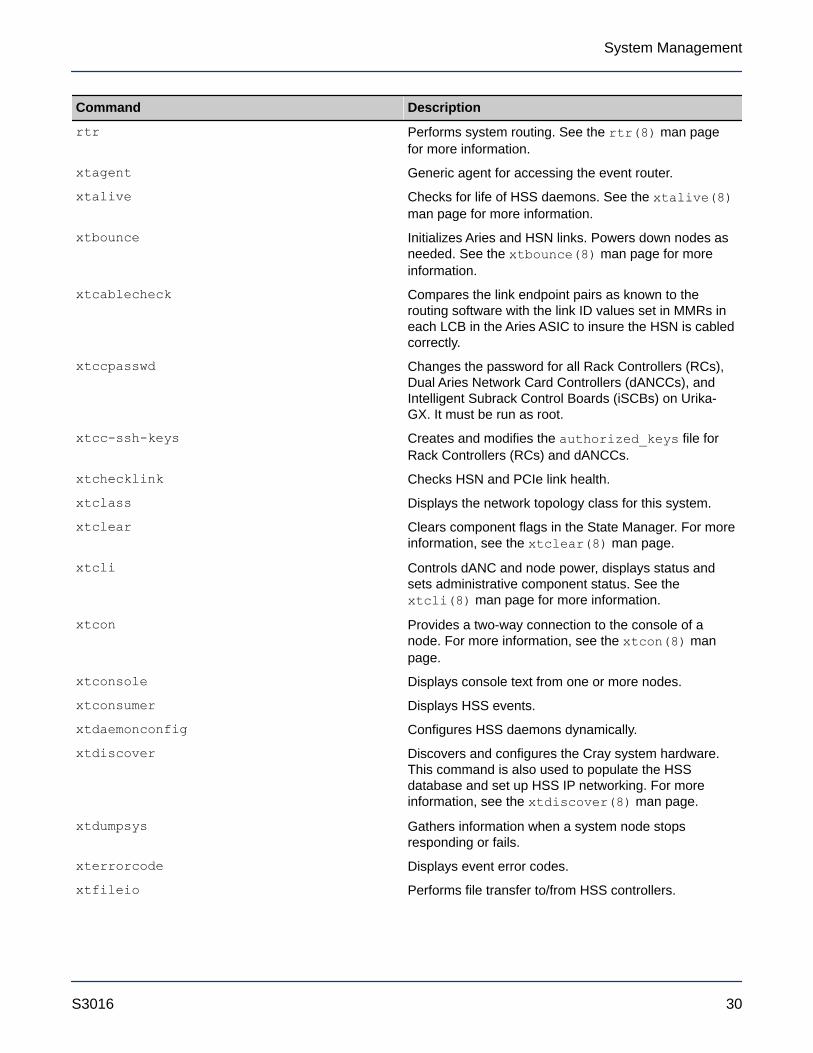
Command Description
rtr Performs system routing. See the rtr(8) man pagefor more information.
xtagent Generic agent for accessing the event router.
xtalive Checks for life of HSS daemons. See the xtalive(8)man page for more information.
xtbounce Initializes Aries and HSN links. Powers down nodes asneeded. See the xtbounce(8) man page for moreinformation.
xtcablecheck Compares the link endpoint pairs as known to therouting software with the link ID values set in MMRs ineach LCB in the Aries ASIC to insure the HSN is cabledcorrectly.
xtccpasswd Changes the password for all Rack Controllers (RCs),Dual Aries Network Card Controllers (dANCCs), andIntelligent Subrack Control Boards (iSCBs) on Urika-GX. It must be run as root.
xtcc-ssh-keys Creates and modifies the authorized_keys file forRack Controllers (RCs) and dANCCs.
xtchecklink Checks HSN and PCIe link health.
xtclass Displays the network topology class for this system.
xtclear Clears component flags in the State Manager. For moreinformation, see the xtclear(8) man page.
xtcli Controls dANC and node power, displays status andsets administrative component status. See thextcli(8) man page for more information.
xtcon Provides a two-way connection to the console of anode. For more information, see the xtcon(8) manpage.
xtconsole Displays console text from one or more nodes.
xtconsumer Displays HSS events.
xtdaemonconfig Configures HSS daemons dynamically.
xtdiscover Discovers and configures the Cray system hardware.This command is also used to populate the HSSdatabase and set up HSS IP networking. For moreinformation, see the xtdiscover(8) man page.
xtdumpsys Gathers information when a system node stopsresponding or fails.
xterrorcode Displays event error codes.
xtfileio Performs file transfer to/from HSS controllers.
System Management
S3016 30

Command Description
xtfile2mem/xtmem2file Reads CPU or Aries memory and saves it in a file.Performs binary file-to-MMR/node memory and viceversa.
xtgenid Generates HSS physical IDs.
xtgenevent Injects arbitrary HSS events into the event stream.
xthwerrlog Displays hardware errors retrieved from xthwerrlogdin user-friendly format.
xthwerrlogd Monitors HW error log messages sent by the ANCC andby nodes.
xtlogfilter Filters information from event router log files.
xtmemio Performs reads or writes to Aries MMRs or nodememory.
xtnetwatch Watches the Cray system interconnection network forlink control block (LCB) and router errors.
xtnid2str Converts node identification numbers to physicalnames. See the xtnid2str(8) man page for moreinformation.
xtnlrd Responds to fatal Aries and HSN errors by rerouting thesystem.
xtnmi Sends a non-maskable interrupt to target nodes. Seethe xtnmi(8) man page for more information.
xtpcimon Monitors health of PCIe channels for Urika-GX systems.
rackfw Flashes all devices in the Urika-GX system via out-of-band (OOB). See the rackfw(8) man page for moreinformation.
xtshow Shows components with selected characteristics. Seethe xtshow(8) man page for more information.
xtsignal Sends a signal number or software interrupt to a remoteprocess.
xtwarmswap Allows Cray dANC cards or high-speed network cablesto be warm swapped. See the xtwarmswap(8) manpage for more information.
xthwinv Retrieves hardware component information for selectedmodules.
xtls Generates a summary of HSN link errors.
xtpe Generates a summary of PCIe link errors.
There are a number of HSS diagnostics commands supported on Urika-GX. These commands need to be runfrom a compute node.
WARNING: All HSS diagnostics commands are intended for use by Cray Service Personnel only.Improper use of these restricted commands can cause serious damage to the system.
System Management
S3016 31
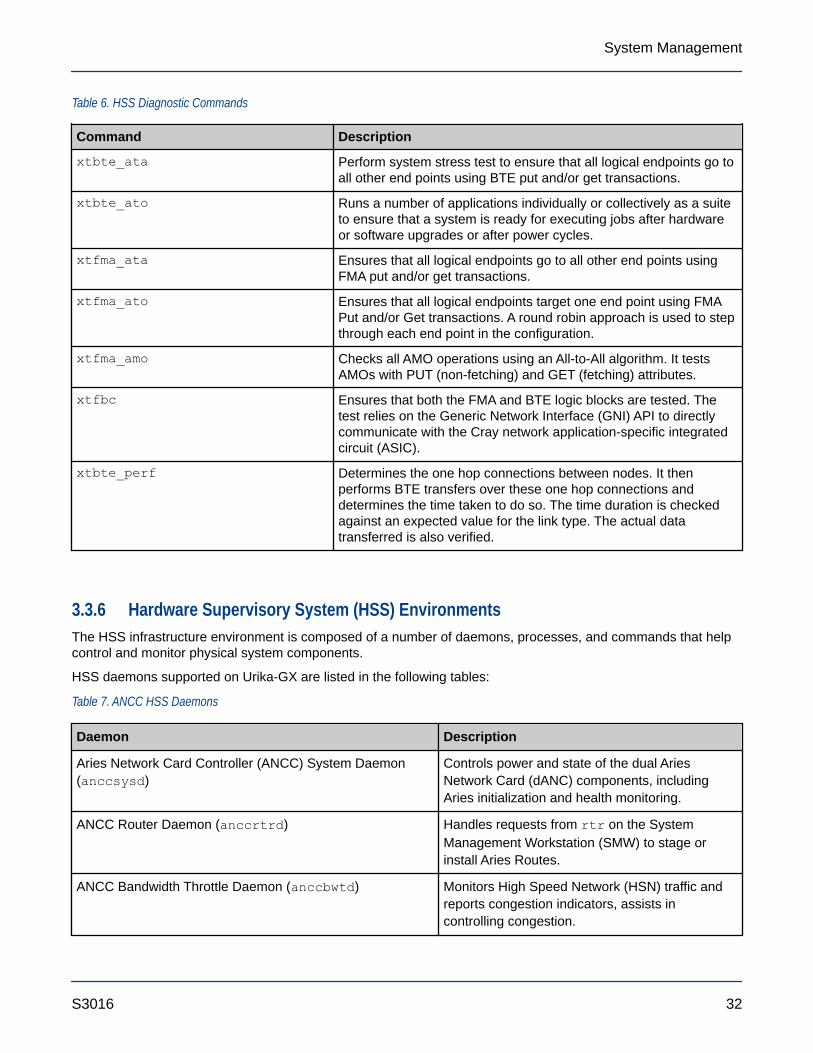
Table 6. HSS Diagnostic Commands
Command Description
xtbte_ata Perform system stress test to ensure that all logical endpoints go toall other end points using BTE put and/or get transactions.
xtbte_ato Runs a number of applications individually or collectively as a suiteto ensure that a system is ready for executing jobs after hardwareor software upgrades or after power cycles.
xtfma_ata Ensures that all logical endpoints go to all other end points usingFMA put and/or get transactions.
xtfma_ato Ensures that all logical endpoints target one end point using FMAPut and/or Get transactions. A round robin approach is used to stepthrough each end point in the configuration.
xtfma_amo Checks all AMO operations using an All-to-All algorithm. It testsAMOs with PUT (non-fetching) and GET (fetching) attributes.
xtfbc Ensures that both the FMA and BTE logic blocks are tested. Thetest relies on the Generic Network Interface (GNI) API to directlycommunicate with the Cray network application-specific integratedcircuit (ASIC).
xtbte_perf Determines the one hop connections between nodes. It thenperforms BTE transfers over these one hop connections anddetermines the time taken to do so. The time duration is checkedagainst an expected value for the link type. The actual datatransferred is also verified.
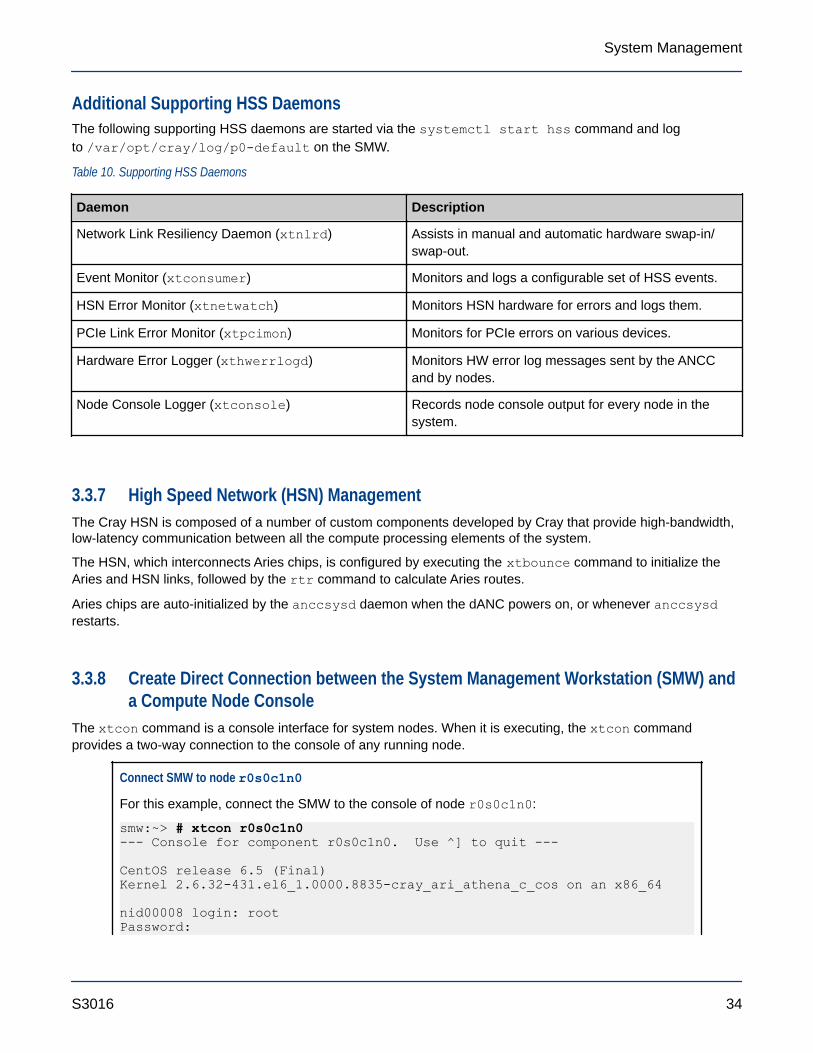
3.3.6 Hardware Supervisory System (HSS) EnvironmentsThe HSS infrastructure environment is composed of a number of daemons, processes, and commands that helpcontrol and monitor physical system components.
HSS daemons supported on Urika-GX are listed in the following tables:
Table 7. ANCC HSS Daemons
Daemon Description
Aries Network Card Controller (ANCC) System Daemon(anccsysd)
Controls power and state of the dual AriesNetwork Card (dANC) components, includingAries initialization and health monitoring.
ANCC Router Daemon (anccrtrd) Handles requests from rtr on the SystemManagement Workstation (SMW) to stage orinstall Aries Routes.
ANCC Bandwidth Throttle Daemon (anccbwtd) Monitors High Speed Network (HSN) traffic andreports congestion indicators, assists incontrolling congestion.
System Management
S3016 32

Daemon Description
ANCC Network Daemon (anccnwd) Monitors the Aries HSN link status, and reportssoft and fatal errors.
ANCC PCIe Monitor Daemon (anccpcimond) Monitors the Aries PCIe errors and status.
ANCC User-space Driver Daemon Acts as the ANCC JTAG/MMR/Node Memoryaccess driver.
ANCC Environment Monitor Daemon (anccmond) Monitors various environmental sensors.
ERD File System Client (erfsc) Acts as the ERFS dANC-level client.
Event Router Daemon (erd) Performs HSS message routing
Controller Vitality Check Daemon (cvcd) Monitors memory consumption, CPU utilization,file system usage, etc.
Table 8. Rack Controller HSS Daemon
Daemon Description
Rack Controller System Daemon (rcsysd) Monitors ANCC heartbeats, emits heartbeat forthe State Manager, controls dANC poweroperations, and monitors the iSCB's health.
Controller Vitality Check Daemon (cvcd) Monitors memory consumption, CPU utilization,file system usage, etc.
ERD File System Client (erfsc) Acts as the ERFS RC-level client.
ERD File System Daemon (erfsd) Facilitates the ERD file system
Event Router Daemon (erd) Performs HSS message routing
Table 9. SMW HSS Daemons
Daemon Description
State Manager (state_manager) Performs HSS system hardware statemanagement.
ERD File System daemon (erfsd) Facilitates the ERD file system.
Event Router Daemon (erd) Performs HSS message routing
NID Manager (nid_mgr) Manages node IDs and NIC addresses for everynode in the system.
NOTE: SMW HSS daemons are started and stopped via the systemctl start hss and systemctlstop hss commands respectively.
System Management
S3016 33
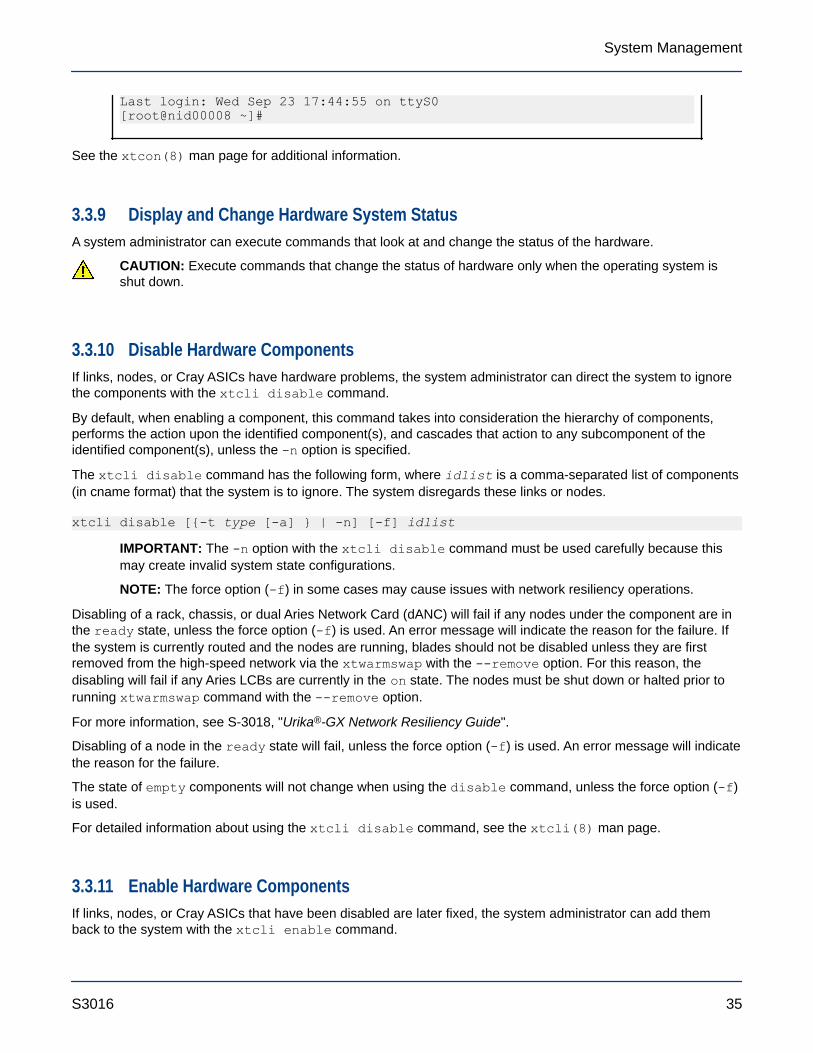
Additional Supporting HSS DaemonsThe following supporting HSS daemons are started via the systemctl start hss command and logto /var/opt/cray/log/p0-default on the SMW.
Table 10. Supporting HSS Daemons
Daemon Description
Network Link Resiliency Daemon (xtnlrd) Assists in manual and automatic hardware swap-in/swap-out.
Event Monitor (xtconsumer) Monitors and logs a configurable set of HSS events.
HSN Error Monitor (xtnetwatch) Monitors HSN hardware for errors and logs them.
PCIe Link Error Monitor (xtpcimon) Monitors for PCIe errors on various devices.
Hardware Error Logger (xthwerrlogd) Monitors HW error log messages sent by the ANCCand by nodes.
Node Console Logger (xtconsole) Records node console output for every node in thesystem.
3.3.7 High Speed Network (HSN) ManagementThe Cray HSN is composed of a number of custom components developed by Cray that provide high-bandwidth,low-latency communication between all the compute processing elements of the system.
The HSN, which interconnects Aries chips, is configured by executing the xtbounce command to initialize theAries and HSN links, followed by the rtr command to calculate Aries routes.
Aries chips are auto-initialized by the anccsysd daemon when the dANC powers on, or whenever anccsysdrestarts.
3.3.8 Create Direct Connection between the System Management Workstation (SMW) anda Compute Node Console
The xtcon command is a console interface for system nodes. When it is executing, the xtcon commandprovides a two-way connection to the console of any running node.
Connect SMW to node r0s0c1n0
For this example, connect the SMW to the console of node r0s0c1n0:
smw:~> # xtcon r0s0c1n0--- Console for component r0s0c1n0. Use ^] to quit ---
CentOS release 6.5 (Final)Kernel 2.6.32-431.el6_1.0000.8835-cray_ari_athena_c_cos on an x86_64
nid00008 login: rootPassword:
System Management
S3016 34
Last login: Wed Sep 23 17:44:55 on ttyS0[root@nid00008 ~]#
See the xtcon(8) man page for additional information.
3.3.9 Display and Change Hardware System StatusA system administrator can execute commands that look at and change the status of the hardware.
CAUTION: Execute commands that change the status of hardware only when the operating system isshut down.
3.3.10 Disable Hardware ComponentsIf links, nodes, or Cray ASICs have hardware problems, the system administrator can direct the system to ignorethe components with the xtcli disable command.
By default, when enabling a component, this command takes into consideration the hierarchy of components,performs the action upon the identified component(s), and cascades that action to any subcomponent of theidentified component(s), unless the -n option is specified.
The xtcli disable command has the following form, where idlist is a comma-separated list of components(in cname format) that the system is to ignore. The system disregards these links or nodes.
xtcli disable [{-t type [-a] } | -n] [-f] idlist
IMPORTANT: The -n option with the xtcli disable command must be used carefully because thismay create invalid system state configurations.
NOTE: The force option (-f) in some cases may cause issues with network resiliency operations.
Disabling of a rack, chassis, or dual Aries Network Card (dANC) will fail if any nodes under the component are inthe ready state, unless the force option (-f) is used. An error message will indicate the reason for the failure. Ifthe system is currently routed and the nodes are running, blades should not be disabled unless they are firstremoved from the high-speed network via the xtwarmswap with the --remove option. For this reason, thedisabling will fail if any Aries LCBs are currently in the on state. The nodes must be shut down or halted prior torunning xtwarmswap command with the --remove option.
For more information, see S-3018, "Urika®-GX Network Resiliency Guide".
Disabling of a node in the ready state will fail, unless the force option (-f) is used. An error message will indicatethe reason for the failure.
The state of empty components will not change when using the disable command, unless the force option (-f)is used.
For detailed information about using the xtcli disable command, see the xtcli(8) man page.
3.3.11 Enable Hardware ComponentsIf links, nodes, or Cray ASICs that have been disabled are later fixed, the system administrator can add themback to the system with the xtcli enable command.
System Management
S3016 35
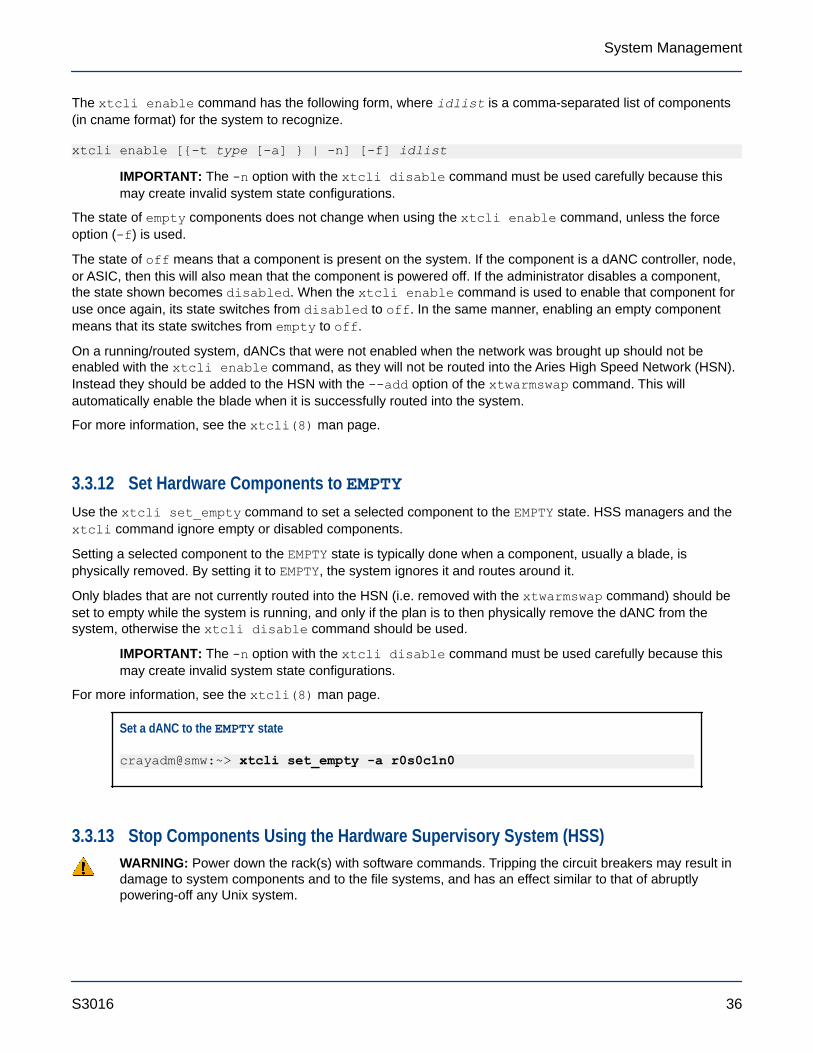
The xtcli enable command has the following form, where idlist is a comma-separated list of components(in cname format) for the system to recognize.
xtcli enable [{-t type [-a] } | -n] [-f] idlist
IMPORTANT: The -n option with the xtcli disable command must be used carefully because thismay create invalid system state configurations.
The state of empty components does not change when using the xtcli enable command, unless the forceoption (-f) is used.
The state of off means that a component is present on the system. If the component is a dANC controller, node,or ASIC, then this will also mean that the component is powered off. If the administrator disables a component,the state shown becomes disabled. When the xtcli enable command is used to enable that component foruse once again, its state switches from disabled to off. In the same manner, enabling an empty componentmeans that its state switches from empty to off.
On a running/routed system, dANCs that were not enabled when the network was brought up should not beenabled with the xtcli enable command, as they will not be routed into the Aries High Speed Network (HSN).Instead they should be added to the HSN with the --add option of the xtwarmswap command. This willautomatically enable the blade when it is successfully routed into the system.
For more information, see the xtcli(8) man page.
3.3.12 Set Hardware Components to EMPTYUse the xtcli set_empty command to set a selected component to the EMPTY state. HSS managers and thextcli command ignore empty or disabled components.
Setting a selected component to the EMPTY state is typically done when a component, usually a blade, isphysically removed. By setting it to EMPTY, the system ignores it and routes around it.
Only blades that are not currently routed into the HSN (i.e. removed with the xtwarmswap command) should beset to empty while the system is running, and only if the plan is to then physically remove the dANC from thesystem, otherwise the xtcli disable command should be used.
IMPORTANT: The -n option with the xtcli disable command must be used carefully because thismay create invalid system state configurations.
For more information, see the xtcli(8) man page.
Set a dANC to the EMPTY state
crayadm@smw:~> xtcli set_empty -a r0s0c1n0
3.3.13 Stop Components Using the Hardware Supervisory System (HSS)WARNING: Power down the rack(s) with software commands. Tripping the circuit breakers may result indamage to system components and to the file systems, and has an effect similar to that of abruptlypowering-off any Unix system.
System Management
S3016 36

WARNING: Before powering down a Dual Aries Network Card (dANC) or a rack, ensure the operatingsystem is not running on any nodes associated with dANCs.
The xtcli power down command powers down the specified rack and/or dANCs within the specified partition,chassis, or list of dANCs. Racks must be in the READY state to receive power commands. The xtcli powerdown command uses the following form, where physIDlist is a comma-separated list of racks or dANCspresent on the system:
crayadm@smw:~> xtcli power down physIDlist
WARNING: Although a dANC is powered off, the Hardware Supervisory System (HSS) in the rack is aliveand has power.
For information about powering down a component, see the xtcli_power(8) man page.
Power down a specified dANC
For this example, power down a dANC with the ID r0s0c0:
crayadm@smw:~> xtcli power down r0s0c0
3.3.14 Unlock Hardware ComponentsIt may be required to unlock components when a daemon unexpectedly dies while holding a lock.
Use the HSS xtcli lock command to unlock components. This command is useful when a daemonunexpectedly dies while holding a lock.
The system administrator can manually check for locks with the xtcli lock show command and then unlockthem. Unlocking a component does not print out the state manager session ID. The -u option must be used tounlock a component as follows:
crayadm@smw:~> xtcli lock -u lock_number
Where lock_number is the value given when initiating the lock; it is also indicated in the xtcli lock showquery. Unlocking does nothing to the state of the component other than to release locks associated with it.
Unlock rack r0
crayadm@smw:~> xtcli -u r0
3.3.15 Capture and Analyze System-level and Node-level DumpsThe xtdumpsys command collects and analyzes information from a Cray system that is failing or has failed, hascrashed, or is hung. Analysis is performed on, for example, event log data, active heartbeat probing, voltages,temperatures, health faults, in-memory console buffers, and high-speed interconnection network errors. Whenfailed components are found, detailed information is gathered from them.
System Management
S3016 37
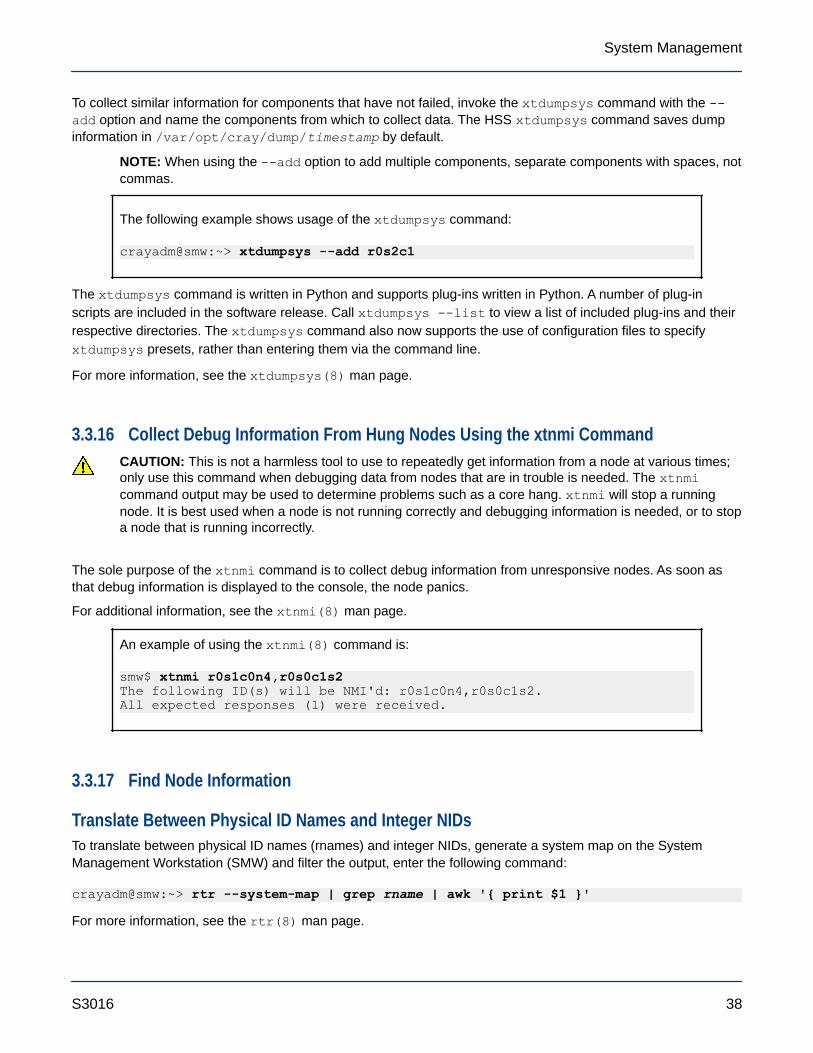
To collect similar information for components that have not failed, invoke the xtdumpsys command with the --add option and name the components from which to collect data. The HSS xtdumpsys command saves dumpinformation in /var/opt/cray/dump/timestamp by default.
NOTE: When using the --add option to add multiple components, separate components with spaces, notcommas.
The following example shows usage of the xtdumpsys command:
crayadm@smw:~> xtdumpsys --add r0s2c1
The xtdumpsys command is written in Python and supports plug-ins written in Python. A number of plug-inscripts are included in the software release. Call xtdumpsys --list to view a list of included plug-ins and theirrespective directories. The xtdumpsys command also now supports the use of configuration files to specifyxtdumpsys presets, rather than entering them via the command line.
For more information, see the xtdumpsys(8) man page.
3.3.16 Collect Debug Information From Hung Nodes Using the xtnmi CommandCAUTION: This is not a harmless tool to use to repeatedly get information from a node at various times;only use this command when debugging data from nodes that are in trouble is needed. The xtnmicommand output may be used to determine problems such as a core hang. xtnmi will stop a runningnode. It is best used when a node is not running correctly and debugging information is needed, or to stopa node that is running incorrectly.
The sole purpose of the xtnmi command is to collect debug information from unresponsive nodes. As soon asthat debug information is displayed to the console, the node panics.
For additional information, see the xtnmi(8) man page.
An example of using the xtnmi(8) command is:
smw$ xtnmi r0s1c0n4,r0s0c1s2The following ID(s) will be NMI'd: r0s1c0n4,r0s0c1s2.All expected responses (1) were received.
3.3.17 Find Node Information
Translate Between Physical ID Names and Integer NIDsTo translate between physical ID names (rnames) and integer NIDs, generate a system map on the SystemManagement Workstation (SMW) and filter the output, enter the following command:
crayadm@smw:~> rtr --system-map | grep rname | awk '{ print $1 }'
For more information, see the rtr(8) man page.
System Management
S3016 38
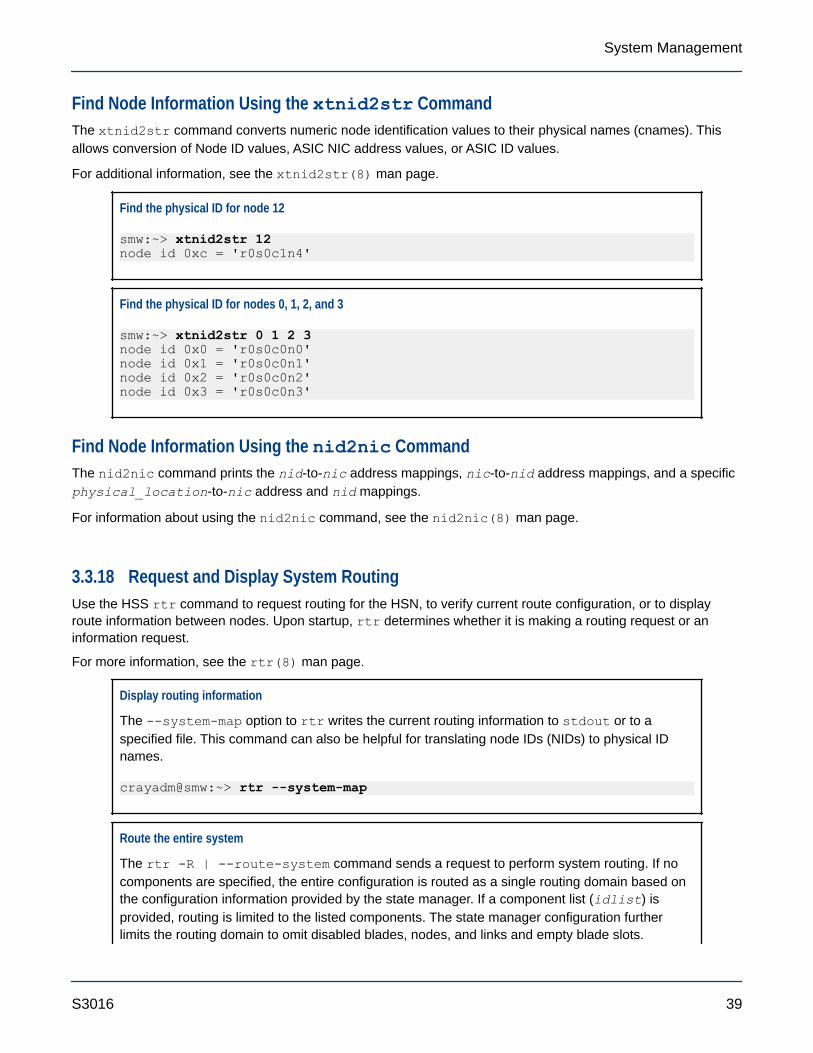
Find Node Information Using the xtnid2str CommandThe xtnid2str command converts numeric node identification values to their physical names (cnames). Thisallows conversion of Node ID values, ASIC NIC address values, or ASIC ID values.
For additional information, see the xtnid2str(8) man page.
Find the physical ID for node 12
smw:~> xtnid2str 12node id 0xc = 'r0s0c1n4'
Find the physical ID for nodes 0, 1, 2, and 3
smw:~> xtnid2str 0 1 2 3node id 0x0 = 'r0s0c0n0'node id 0x1 = 'r0s0c0n1'node id 0x2 = 'r0s0c0n2'node id 0x3 = 'r0s0c0n3'
Find Node Information Using the nid2nic CommandThe nid2nic command prints the nid-to-nic address mappings, nic-to-nid address mappings, and a specificphysical_location-to-nic address and nid mappings.
For information about using the nid2nic command, see the nid2nic(8) man page.
3.3.18 Request and Display System RoutingUse the HSS rtr command to request routing for the HSN, to verify current route configuration, or to displayroute information between nodes. Upon startup, rtr determines whether it is making a routing request or aninformation request.
For more information, see the rtr(8) man page.
Display routing information
The --system-map option to rtr writes the current routing information to stdout or to aspecified file. This command can also be helpful for translating node IDs (NIDs) to physical IDnames.
crayadm@smw:~> rtr --system-map
Route the entire system
The rtr -R | --route-system command sends a request to perform system routing. If nocomponents are specified, the entire configuration is routed as a single routing domain based onthe configuration information provided by the state manager. If a component list (idlist) isprovided, routing is limited to the listed components. The state manager configuration furtherlimits the routing domain to omit disabled blades, nodes, and links and empty blade slots.
System Management
S3016 39

crayadm@smw:~> rtr --route-system
CAUTION: The rtr -R command should not be executed if the system nodes have already been bootedand are using the Aries network.
CAUTION: Be sure the Aries ASCIs have been initialized using the xtbounce command and that theHSN links have been initialized.
3.3.19 Initiate a Network Discovery ProcessUse the HSS rtr --discover command to initiate a network discovery process.
crayadm@smw:~> rtr --discover
The discovery process must be done on the system as a whole—it cannot be applied to individual partitions.Therefore, discovery will immediately fail if the system does not have partition p0 enabled.
The rtr --discover process should be used under the following circumstances:
● During an initial install, after successful execution of xtdiscover● During the installation of additional cabinets in an existing installation, after the successful execution of
xtdiscover● During an upgrade of optical cabling in a system, after all recabling is complete
The rtr --discover process is NOT required under the following circumstances:
● On any single group system at any time, even those listed above
● During a warmswap operation
See the rtr(8) man page for additional information.
3.3.20 Power Up a Rack or Dual Aries Network Card (dANC)IMPORTANT: Change the state of the hardware only when the operating system is not running or is shutdown.
The xtcli power up command powers up the specified rack and/or dual Aries Network Card (dANC) within thespecified partition, chassis, or list of dANCs. Racks must be in the READY state to receive power commands.
The xtcli power up command has the following form, where physIDlist is a comma-separated list of racksor dANCs present on the system.
xtcli power up physIDlist
For more information, see the xtcli_power(8) man page.
Power up dANC in r1s2c0
crayadm@smw:~> xtcli power up r1s2c0
System Management
S3016 40
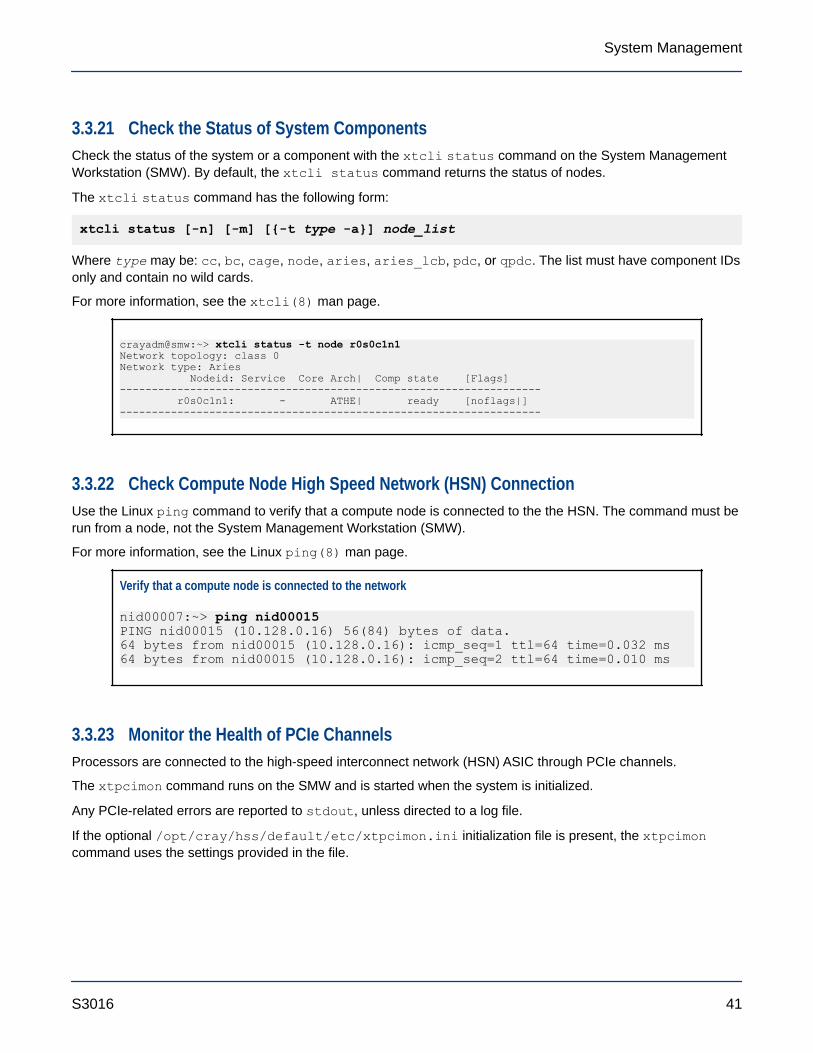
3.3.21 Check the Status of System ComponentsCheck the status of the system or a component with the xtcli status command on the System ManagementWorkstation (SMW). By default, the xtcli status command returns the status of nodes.
The xtcli status command has the following form:
xtcli status [-n] [-m] [{-t type -a}] node_list
Where type may be: cc, bc, cage, node, aries, aries_lcb, pdc, or qpdc. The list must have component IDsonly and contain no wild cards.
For more information, see the xtcli(8) man page.
crayadm@smw:~> xtcli status -t node r0s0c1n1Network topology: class 0Network type: Aries Nodeid: Service Core Arch| Comp state [Flags]------------------------------------------------------------------ r0s0c1n1: - ATHE| ready [noflags|]------------------------------------------------------------------
3.3.22 Check Compute Node High Speed Network (HSN) ConnectionUse the Linux ping command to verify that a compute node is connected to the the HSN. The command must berun from a node, not the System Management Workstation (SMW).
For more information, see the Linux ping(8) man page.
Verify that a compute node is connected to the network
nid00007:~> ping nid00015PING nid00015 (10.128.0.16) 56(84) bytes of data.64 bytes from nid00015 (10.128.0.16): icmp_seq=1 ttl=64 time=0.032 ms64 bytes from nid00015 (10.128.0.16): icmp_seq=2 ttl=64 time=0.010 ms
3.3.23 Monitor the Health of PCIe ChannelsProcessors are connected to the high-speed interconnect network (HSN) ASIC through PCIe channels.
The xtpcimon command runs on the SMW and is started when the system is initialized.
Any PCIe-related errors are reported to stdout, unless directed to a log file.
If the optional /opt/cray/hss/default/etc/xtpcimon.ini initialization file is present, the xtpcimoncommand uses the settings provided in the file.
System Management
S3016 41

3.3.24 Poll a Response from an HSS Daemon, Manager, or the Event RouterThe xtalive command can be used to ensure that the HSS has connectivity to the ANCCs and that, by default,anccsysd is running and responding to events on the ANCCs.
For more information, see the xtalive(8) man page.
Check the state manager
crayadm@smw:~> xtalive -l smw -a sm s0
3.3.25 View Component Alert, Warning, and Location HistoryUse the xtcli comp_hist command to display component alert, warning, and location history. Either an errorhistory, which displays alerts or warnings found on designated components, or a location history may bedisplayed.
Display the location history for component r1s0c1n2
crayadm@smw:~> xtcli comp_hist -o loc r1s0c1n2
For more information, see the xtcli(8) man page.
3.3.26 Display Alerts and WarningsUse the xtshow command to display alerts and warnings.
Alerts are not propagated through the system hierarchy, only information for the component being examined isdisplayed. For example, invoking the xtshow --alert command for a cabinet does not display an alert for anode. Similarly, checking the status of a node does not detect an alert on a cabinet.
Show all alerts on the system
crayadm@smw:~> xtshow --alert
Alerts and warnings typically occur while the HSS xtcli command operates; these alerts and warnings are listedin the command output with an error message. After they are generated, alerts and warnings become part of thestate for the component and remain set until manually cleared.
For additional information, see the xtshow(8) man page.
3.3.27 Display Error CodesWhen an HSS event error occurs, the related message is displayed on the SMW. The xterrorcode commandon the SMW displays a single error code or the entire list of error codes.
System Management
S3016 42

Display HSS error codes
crayadm@smw:~> xterrorcode errorcode
A system error code entered in a log file is a bit mask; invoking the xterrorcode bitmask_code_numbercommand on the SMW displays the associated error code.
Display an HSS error code using its bit mask number
crayadm@smw:~> xterrorcode 131279Maximum error code (RS_NUM_ERR_CODE) is 447code = 207, string = 'Node Voltage Fault'
3.3.28 Display Component State InformationUse the HSS xtshow command to identify the state of components. Commands are typed as xtshow --option_name.
Identify all nodes in the disabled state
crayadm@smw:~> xtshow --disabledL1s that are disabled...Cages that are disabled... r0s3: - ATHE| disabled [noflags|]L0s that are disabled...Nodes that are disabled...Aries that are disabled...AthenaISCBs that are disabled... r0s3i0: - ATHE| disabled [noflags|]AriesLcbs that are disabled...
The --disabled option in the preceding example shows all the disabled hardware components. Formore information, see the xtshow(8) man page.
3.3.29 Clear Component FlagsUse the xtclear command to clear system information for selected components. Type commands as xtclear--option_name, where option_name is alert, reserve, or warn.
Clear all warnings in specified cabinet
For this example, clear all warnings in cabinet c13-2:
smw:~> xtclear --warn r1
Alerts, reserves, and warnings must be cleared before a component can operate. Clearing an alert on acomponent frees its state.
For more information, see the xtclear(8) man page.
System Management
S3016 43
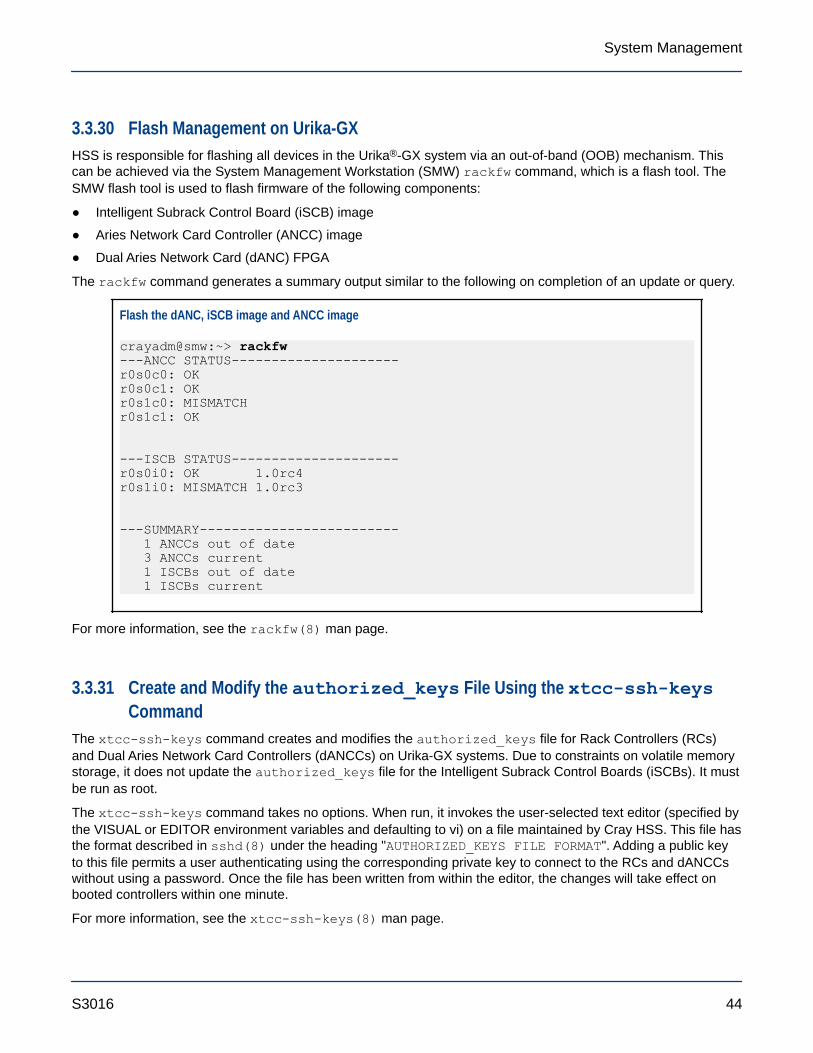
3.3.30 Flash Management on Urika-GXHSS is responsible for flashing all devices in the Urika®-GX system via an out-of-band (OOB) mechanism. Thiscan be achieved via the System Management Workstation (SMW) rackfw command, which is a flash tool. TheSMW flash tool is used to flash firmware of the following components:
● Intelligent Subrack Control Board (iSCB) image
● Aries Network Card Controller (ANCC) image
● Dual Aries Network Card (dANC) FPGA
The rackfw command generates a summary output similar to the following on completion of an update or query.
Flash the dANC, iSCB image and ANCC image
crayadm@smw:~> rackfw---ANCC STATUS---------------------r0s0c0: OKr0s0c1: OKr0s1c0: MISMATCHr0s1c1: OK
---ISCB STATUS---------------------r0s0i0: OK 1.0rc4r0s1i0: MISMATCH 1.0rc3
---SUMMARY------------------------- 1 ANCCs out of date 3 ANCCs current 1 ISCBs out of date 1 ISCBs current
For more information, see the rackfw(8) man page.
3.3.31 Create and Modify the authorized_keys File Using the xtcc-ssh-keysCommand
The xtcc-ssh-keys command creates and modifies the authorized_keys file for Rack Controllers (RCs)and Dual Aries Network Card Controllers (dANCCs) on Urika-GX systems. Due to constraints on volatile memorystorage, it does not update the authorized_keys file for the Intelligent Subrack Control Boards (iSCBs). It mustbe run as root.
The xtcc-ssh-keys command takes no options. When run, it invokes the user-selected text editor (specified bythe VISUAL or EDITOR environment variables and defaulting to vi) on a file maintained by Cray HSS. This file hasthe format described in sshd(8) under the heading "AUTHORIZED_KEYS FILE FORMAT". Adding a public keyto this file permits a user authenticating using the corresponding private key to connect to the RCs and dANCCswithout using a password. Once the file has been written from within the editor, the changes will take effect onbooted controllers within one minute.
For more information, see the xtcc-ssh-keys(8) man page.
System Management
S3016 44
3.3.32 Change the Passwords of RC, dANCCs and iSCB using the xtccpasswdCommand
The xtccpasswd command changes the password for all Rack Controllers (RCs), Dual Aries Network CardControllers (dANCCs), and Intelligent Subrack Control Boards (iSCBs) on Urika-GX systems. It must be run asroot. This command allows an administrator to grant access to the SMW without granting access to the controllernetwork nodes.
If xtccpasswd is run without options, it prompts for a new password (which will not be echoed to the screen) andthen confirms it. If the two entered passwords match exactly, a salted hash of the password is written to a filemaintained by Cray HSS. Within one minute, all booted controllers in the Urika-GX system will be using the newpassword.
For more information, see the xtccpasswd (8) man page.
3.3.33 Gather Troubleshooting Information Using the xtdumpsys CommandThe xtdumpsys command collects and analyzes information from a Cray system that is failing or has failed, hascrashed, or is hung. Analysis is performed on, for example, event log data, active heartbeat probing, voltages,temperatures, health faults, in-memory console buffers, and high-speed interconnection network errors. Whenfailed components are found, detailed information is gathered from them. To collect similar information forcomponents that have not failed, invoke the xtdumpsys command with the --add option and name thecomponents from which to collect data.
NOTE: Only the crayadm account can execute the xtdumpsys command.
For more information, see the xtdumpsys(8) man page.
3.4 Dual Aries Network Card (dANC) ManagementThere are a number of components that are used to perform dANC management on Urika-GX.
dANC PowerBy default, the dANCs power up when the rack is powered up. They can however be turned off and on via thextcli power command.
CAUTION: Powering off a dANC on a booted and routed system will route out that card out of the AriesHigh Speed Network (HSN) and make all 8 nodes (served by that dANC card) unusable.
dANC uBootThe Linux U-boot utility supports booting a Linux image on the ARM processor (located on the dANC controller)via net boot or flash boot.
There are 3 valid boot modes for the ANCC and iSCB, as listed below:
1. Boot from flash. This is the default mode.
2. Netboot and write image to flash . This mode is used for software upgrades
System Management
S3016 45
3. Netboot and do not write to flash. This is a development option.
The Urika®-GX rackfw tool enables recovery mode for dANC booting. It will also allow for initializing/setting theboot mode in NVRAM as follows:
● Set 1 of 3 ANCC boot modes listed above. If the nvRAM is uninitialized or corrupted, it is required to initializethe nvRAM.
● Set the default ANCC image location/path, or the iSCB image
● Reboot specified device (ANCC0, ANCC1, iSCB0 or iSCB1)
dANC Scrub DevicesThe Urika-GX system supports scrubbing of non-volatile devices on the dANC. This includes the DANFPGA anddANC flash devices. The DANFPGA FPGA image and flash tool is included in the dANC ARM image and is flashedafter the ARM has booted Linux.
dANC MonitoringThe dANC monitoring daemon, anccmond executes on the Dual Aries Network Card Controller (dANCC) andperforms the following functions:
● Monitors Aries, AOC and board temperatures.
● Monitors the AOC and board power.
● Sends events to HSS ERD.
● Provides threshold warnings to iSCB via an I2C bus.
● Sets up the temperature and voltages as a poll mechanism, so that the iSCB can poll for the data.
The HSS thresholds can be modified on the SMW using the HSS xtdaemonconfig command.
3.5 Analyze Node Memory Dump Using the kdump and crashUtilities on a Node
The kdump and crash utilities may be used to analyze the memory on any Urika®-GX compute node. The kdumpcommand is used to dump node memory to a file. kdump is the Linux kernel's built-in crash dump mechanism. Inthe event of a kernel crash, kdump creates a memory image (also known as vmcore) that can be analyzed forthe purposes of debugging and determining the cause of a crash. Dumped image of the main memory, exportedas an Executable and Linkable Format (ELF) object, can be accessed either directly during the handling of akernel crash (through /proc/vmcore), or it can be automatically saved to a locally accessible file system, to araw device, or to a remote system accessible over the network. kdump is configured to automatically generatevmcore crash dumps on node crashes. These dumps can be found on the node in the crash partition, mounted tonid000XX:/mnt/crash/var/crash/datestamp/*, where XX ranges from 00-15 for a rack containing asingle sub-rack, 00-31 for a rack containing 2 sub-racks, and 00-47 for a rack containing 3 sub-racks. Afterkdump completes, the crash utility can be used on the dump file generated by kdump. The xtdumpsys SMWutility can be used to extract vmcores from the cluster and store them on the SMW for crash analysis as well.
NOTE: Cray recommends executing the kdump utility only if a node has panicked or is hung, or if a dumpis requested by Cray.
System Management
S3016 46

On the Urika-GX compute nodes, kdump's system facing configuration files are set to have a kdump filestored on a local hard drive partition that is mounted as /mnt/crash so the kernel crash dumps arestore in /mnt/crash/var/crash. Urika-GX has two local HDDs. kdump stores the vmcore collectionson one of these drives. It is advised not to modify the /etc/kdump.conf or /etc/sysconfig/kdumpconfiguration files.
Using kdump● Starting kdump - Log on to the desired node and use the following command to start the kdump utility:
$ service kdump start● Stopping kdump - Log on to the desired node and use the following command to stop the kdump utility:
$ service kdump stop● Checking the status of kdump - Log on to the desired node and use the following command to check the
status of the kdump utility:
$ service kdump status
For more information, see the kdump(8) and crash(8) man pages.
3.6 Cray Lightweight Log Management (LLM) SystemThe Cray Lightweight Log Management (LLM) system is the log infrastructure for Cray systems and must beenabled for systems to successfully log events. At a high level, a library is used to deliver messages to rsyslogutilizing the RFC 5424 protocol; rsyslog transports those messages to the SMW and places the messages intolog files.
By default, LLM has a log trimming mechanism enabled called xttrim.
3.7 About CSMSCSMS is a common systems management infrastructure that is based on OpenStack and is designed to supportthe diverse Cray product ecosystem and a wide variety of Cray hardware platforms. OpenStack is leveragedwithin CSMS to manage various components of the Cray system and to provide a common interface for systemmanagement.
3.7.1 Use OpenStack CLI ClientsOpenStack CLI clients require certain environment variables to be set in order to communicate with OpenStackservices. Before using the OpenStack CLI commands, the /root/admin.openrc file must be sourced. Ifdesired, this file can be copied/modified to another user’s home directory in order to use the CLI as a non-rootuser.
Use the following command to source the admin.openrc file and enter the OpenStack admin password whenprompted for the OpenStack password:
System Management
S3016 47
smw1# source ~/admin.openrcEnter OpenStack Password:
Following is an example of using the list command of the OpenStack Nova service:
smw1# nova list
Execute the following command to display a list of all CLI commands for a given OpenStack service, replacingservice with the actual name of the OpenStack service:
smw1# service help
Execute the following command to retrieve usage information and options of a specific command, replacingservice with the actual name of the OpenStack service:
smw1# service help command
3.7.2 OpenStack Nova Instance States● Nova Power State - The power state of the physical node. The power state can have one of the following
values at a given time:
○ NO STATE○ RUNNING○ BLOCKED○ PAUSED○ SHUTDOWN○ SHUTOFF○ CRASHED○ SUSPENDED○ FAILED○ BUILDING
The state of an instance may be displayed as NO STATE if it is currently transitioning to another state.
● Nova Status - The current status of the instance. This status is affected by the action/task performed on theinstance via CLI commands or by the drop down in the Actions column of the UI. Nova status can have oneof the following values at a given time:
○ Deleted○ Active○ Shutoff○ Paused○ Error○ SUSPENDED○ resize○ verify_resize○ revert_resize
System Management
S3016 48
○ reboot○ hard_reboot○ password○ rebuild○ migrating○ build○ rescue○ soft_deleted○ shelved○ shelved_offloaded
NOTE: If the instance is in the Error state, check the logs under /var/log/nova to see theunderlying cause of the issue.
● Capmc Status - The status of the instance as returned by the HSS capmc command and can have one ofthe follow values at a given time:
○ on○ off○ ready○ error○ halt○ standby○ disabled○ enabled○ na○ empty○ diag
NOTE: If the capmc status is not in the 'ready' state, it is recommended to check the logs located atvar/opt/cray/log/ to identify the issue.
3.7.3 Using Cray System Management Software (CSMS) on Urika-GXUrika®-GX uses CSMS for:
● Bare metal provisioning - Urika-GX uses the OpenStack Ironic and Heat services for provisioning baremetal nodes.
● Image management - Urika-GX uses the OpenStack Glance service for image management.
● Power management- The Urika-GX system is powered up and powered down using the OpenStack Novaservice.
System Management
S3016 49
3.7.4 Urika-GX Node Power ManagementHardware inventory information of all nodes known to the Hardware Supervisory System (HSS) is imported intoOpenStack. This includes physical characteristics of the nodes, CPU count, memory, HDD size, and the EthernetMAC address. When the OpenStacks Nova service wishes to power on/off a node, it communicates with theOpenStack Ironic service, which in turn talks to the HSS Ironic power driver. This driver then sends the powerrequest to the dANC associated with the node via the HSS capmc interface and the node is powered on or offdepending on the request.
Before executing the ux-nid-power-on or ux-nid-power-off commands, or any OpenStack commands, theadmin.openrc file needs to be sourced. Use the following command to source the admin.openrc file andenter initial0 when prompted for the OpenStack password:
# cd /root# source admin.openrcEnter OpenStack Password:
Start Up a Single NodeUse the ux-nid-power-on command to start up a node. For example, use the following command to start upnode 47:
$ ux-nid-power-on 47
Start Up All NodesUse the ux-nid-power-on script (located inthe /etc/opt/cray/openstack/ansible/heat_templates/node_specific directory on the SystemManagement Workstation (SMW)) to start up all the nodes at once. For more information, see the ux-nid-power-on man page
$ ux-nid-power-on
Stop a Single NodeEnsure that the analytics services are stopped on the node and Lustre is unmounted. Use the ux-nid-power-off command to stop a running node. For example, use the following command to stop node 47:
$ ux-nid-power-off 47
Stop All NodesEnsure that the analytics services are stopped on the node and Lustre is unmounted. Use the ux-nid-power-off script (located in the /etc/opt/cray/openstack/ansible/heat_templates/node_specificdirectory on the System Management Workstation (SMW) to stop all the nodes at once.
$ ux-nid-power-off
For more information, see the ux-nid-power-off man page.
Check the Status of NodesNOTE: The following sample output is displayed only as examples. Actual output may vary.
● Use the ironic node-list command to display the power and provisioning state of all the nodes.
System Management
S3016 50
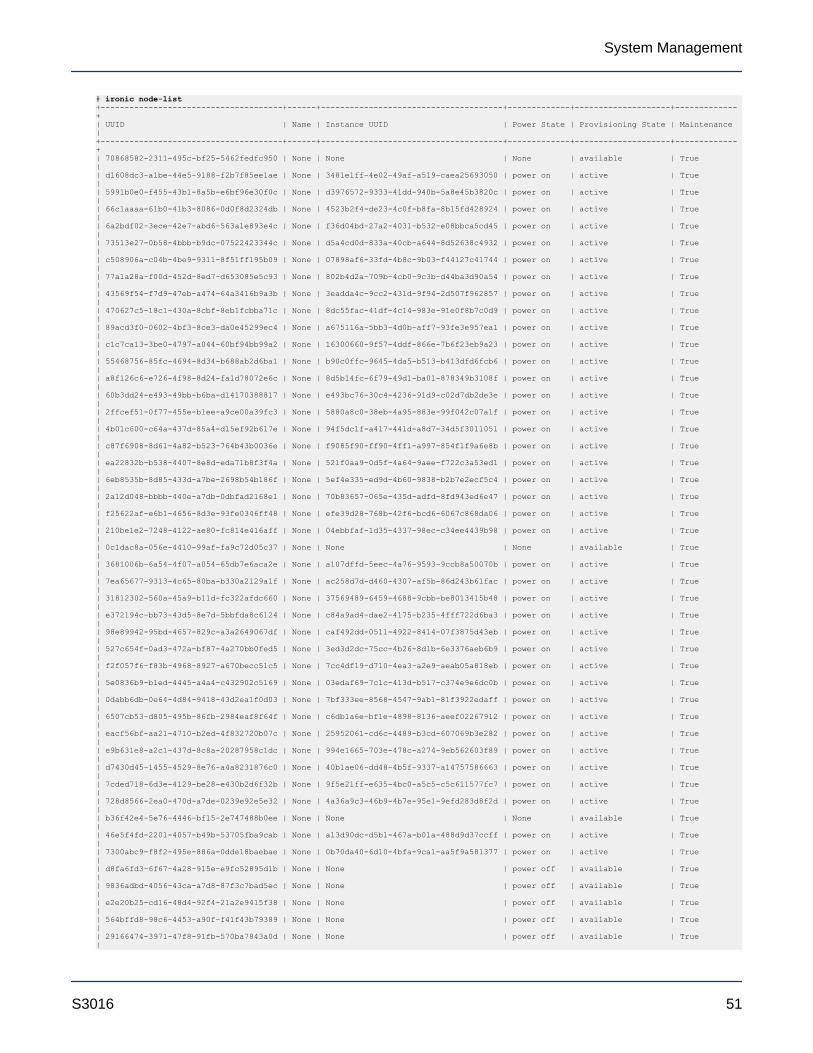
# ironic node-list+--------------------------------------+------+--------------------------------------+-------------+--------------------+-------------+| UUID | Name | Instance UUID | Power State | Provisioning State | Maintenance |+--------------------------------------+------+--------------------------------------+-------------+--------------------+-------------+| 70868582-2311-495c-bf25-5462fedfc950 | None | None | None | available | True || d1608dc3-a1be-44e5-9188-f2b7f85ee1ae | None | 3481e1ff-4e02-49af-a519-caea25693050 | power on | active | True || 5991b0e0-f455-43b1-8a5b-e6bf96e30f0c | None | d3976572-9333-41dd-940b-5a8e45b3820c | power on | active | True || 66c1aaaa-61b0-41b3-8086-0d0f8d2324db | None | 4523b2f4-de23-4c0f-b8fa-8b15fd428924 | power on | active | True || 6a2bdf02-3ece-42e7-abd6-563a1e893e4c | None | f36d04bd-27a2-4031-b532-e08bbca5cd45 | power on | active | True || 73513e27-0b58-4bbb-b9dc-07522423344c | None | d5a4cd0d-833a-40cb-a644-8d52638c4932 | power on | active | True || c508906a-c04b-4be9-9311-8f51ff195b09 | None | 07898af6-33fd-4b8c-9b03-f44127c41744 | power on | active | True || 77a1a28a-f00d-452d-8ed7-d653085e5c93 | None | 802b4d2a-709b-4cb0-9c3b-d44ba3d90a54 | power on | active | True || 43569f54-f7d9-47eb-a474-64a3416b9a3b | None | 3eadda4c-9cc2-431d-9f94-2d507f962857 | power on | active | True || 470627c5-18c1-430a-8cbf-8eb1fcbba71c | None | 8dc55fac-41df-4c14-983e-91e0f8b7c0d9 | power on | active | True || 89acd3f0-0602-4bf3-8ce3-da0e45299ec4 | None | a675116a-5bb3-4d0b-aff7-93fe3e957ea1 | power on | active | True || c1c7ca13-3be0-4797-a044-60bf94bb99a2 | None | 16300660-9f57-4ddf-866e-7b6f23eb9a23 | power on | active | True || 55468756-85fc-4694-8d34-b688ab2d6ba1 | None | b90c0ffc-9645-4da5-b513-b413dfd6fcb6 | power on | active | True || a8f126c6-e726-4f98-8d24-fa1d78072e6c | None | 8d5b14fc-6f79-49d1-ba01-878349b3108f | power on | active | True || 60b3dd24-e493-49bb-b6ba-d14170388817 | None | e493bc76-30c4-4236-91d9-c02d7db2de3e | power on | active | True || 2ffcef51-0f77-455e-b1ee-a9ce00a39fc3 | None | 5880a8c0-38eb-4a95-883e-99f042c07a1f | power on | active | True || 4b01c600-c64a-437d-85a4-d15ef92b617e | None | 94f5dc1f-a417-441d-a8d7-34d5f3011051 | power on | active | True || c87f6908-8d61-4a82-b523-764b43b0036e | None | f9085f90-ff90-4ff1-a997-854f1f9a6e8b | power on | active | True || ea22832b-b538-4407-8e8d-eda71b8f3f4a | None | 521f0aa9-0d5f-4a64-9aee-f722c3a53ed1 | power on | active | True || 6eb8535b-8d85-433d-a7be-2698b54b186f | None | 5ef4e335-ed9d-4b60-9838-b2b7e2ecf5c4 | power on | active | True || 2a12d048-bbbb-440e-a7db-0dbfad2168e1 | None | 70b83657-065e-435d-adfd-8fd943ed6e47 | power on | active | True || f25622af-e6b1-4656-8d3e-93fe0346ff48 | None | efe39d28-768b-42f6-bcd6-6067c868da06 | power on | active | True || 210be1e2-7248-4122-ae80-fc814e416aff | None | 04ebbfaf-1d35-4337-98ec-c34ee4439b98 | power on | active | True || 0c1dac8a-056e-4410-99af-fa9c72d05c37 | None | None | None | available | True || 3681006b-6a54-4f07-a054-65db7e6aca2e | None | a107dffd-5eec-4a76-9593-9ccb8a50070b | power on | active | True || 7ea65677-9313-4c65-80ba-b330a2129a1f | None | ac258d7d-d460-4307-af5b-86d243b61fac | power on | active | True || 31812302-560a-45a9-b11d-fc322afdc660 | None | 37569489-6459-4688-9cbb-be8013415b48 | power on | active | True || e372194c-bb73-43d5-8e7d-5bbfda8c6124 | None | c84a9ad4-dae2-4175-b235-4fff722d6ba3 | power on | active | True || 98e89942-95bd-4657-829c-a3a2649067df | None | caf492dd-0511-4922-8414-07f3875d43eb | power on | active | True || 527c654f-0ad3-472a-bf87-4a270bb0fed5 | None | 3ed3d2dc-75cc-4b26-8d1b-6e3376aeb6b9 | power on | active | True || f2f057f6-f83b-4968-8927-a670becc51c5 | None | 7cc4df19-d710-4ea3-a2e9-aeab05a818eb | power on | active | True || 5e0836b9-b1ed-4445-a4a4-c432902c5169 | None | 03edaf69-7c1c-413d-b517-c374e9e6dc0b | power on | active | True || 0dabb6db-0e64-4d84-9418-43d2ea1f0d03 | None | 7bf333ee-8568-4547-9ab1-81f3922edaff | power on | active | True || 6507cb53-d805-495b-86fb-2984eaf8f64f | None | c6db1a6e-bf1e-4898-8136-aeef02267912 | power on | active | True || eacf56bf-aa21-4710-b2ed-4f832720b07c | None | 25952061-cd6c-4489-b3cd-607069b3e282 | power on | active | True || e9b631e8-a2c1-437d-8c8a-20287958c1dc | None | 994e1665-703e-478c-a274-9eb562603f89 | power on | active | True || d7430d45-1455-4529-8e76-a4a8231876c0 | None | 40b1ae06-dd48-4b5f-9337-a14757586663 | power on | active | True || 7cded718-6d3e-4129-be28-e430b2d6f32b | None | 9f5e21ff-e635-4bc0-a5c5-c5c611577fc7 | power on | active | True || 728d8566-2ea0-470d-a7de-0239e92e5e32 | None | 4a36a9c3-46b9-4b7e-95e1-9efd283d8f2d | power on | active | True || b36f42e4-5e76-4446-bf15-2e747488b0ee | None | None | None | available | True || 46e5f4fd-2201-4057-b49b-53705fba9cab | None | a13d90dc-d5b1-467a-b01a-488d9d37ccff | power on | active | True || 7300abc9-f8f2-495e-886a-0dde18baebae | None | 0b70da40-6d10-4bfa-9ca1-aa5f9a581377 | power on | active | True || d8fa6fd3-6f67-4a28-915e-e9fc52895d1b | None | None | power off | available | True || 9836adbd-4056-43ca-a7d8-87f3c7bad5ec | None | None | power off | available | True || e2e20b25-cd16-48d4-92f4-21a2e9415f38 | None | None | power off | available | True || 564bffd8-98c6-4453-a90f-f41f43b79389 | None | None | power off | available | True || 29166474-3971-47f8-91fb-570ba7843a0d | None | None | power off | available | True |
System Management
S3016 51
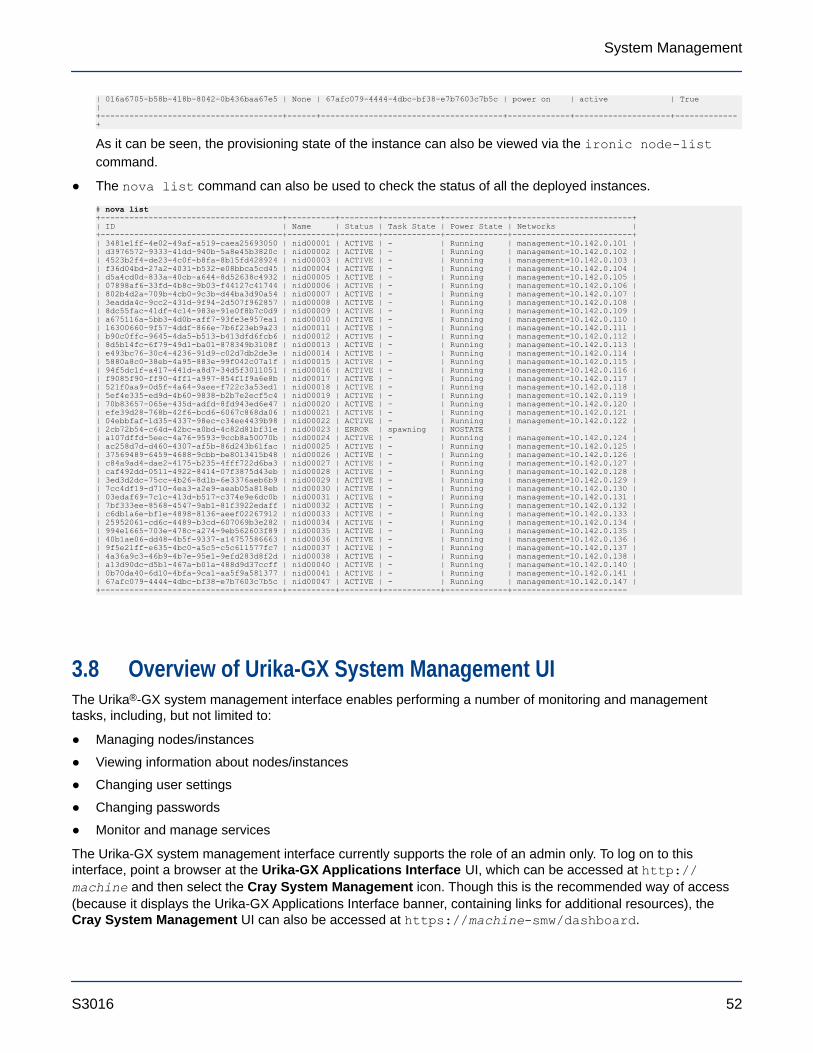
| 016a6705-b58b-418b-8042-0b436baa67e5 | None | 67afc079-4444-4dbc-bf38-e7b7603c7b5c | power on | active | True |+--------------------------------------+------+--------------------------------------+-------------+--------------------+-------------+
As it can be seen, the provisioning state of the instance can also be viewed via the ironic node-listcommand.
● The nova list command can also be used to check the status of all the deployed instances.
# nova list+--------------------------------------+----------+--------+------------+-------------+-------------------------+| ID | Name | Status | Task State | Power State | Networks |+--------------------------------------+----------+--------+------------+-------------+-------------------------+| 3481e1ff-4e02-49af-a519-caea25693050 | nid00001 | ACTIVE | - | Running | management=10.142.0.101 || d3976572-9333-41dd-940b-5a8e45b3820c | nid00002 | ACTIVE | - | Running | management=10.142.0.102 || 4523b2f4-de23-4c0f-b8fa-8b15fd428924 | nid00003 | ACTIVE | - | Running | management=10.142.0.103 || f36d04bd-27a2-4031-b532-e08bbca5cd45 | nid00004 | ACTIVE | - | Running | management=10.142.0.104 || d5a4cd0d-833a-40cb-a644-8d52638c4932 | nid00005 | ACTIVE | - | Running | management=10.142.0.105 || 07898af6-33fd-4b8c-9b03-f44127c41744 | nid00006 | ACTIVE | - | Running | management=10.142.0.106 || 802b4d2a-709b-4cb0-9c3b-d44ba3d90a54 | nid00007 | ACTIVE | - | Running | management=10.142.0.107 || 3eadda4c-9cc2-431d-9f94-2d507f962857 | nid00008 | ACTIVE | - | Running | management=10.142.0.108 || 8dc55fac-41df-4c14-983e-91e0f8b7c0d9 | nid00009 | ACTIVE | - | Running | management=10.142.0.109 || a675116a-5bb3-4d0b-aff7-93fe3e957ea1 | nid00010 | ACTIVE | - | Running | management=10.142.0.110 || 16300660-9f57-4ddf-866e-7b6f23eb9a23 | nid00011 | ACTIVE | - | Running | management=10.142.0.111 || b90c0ffc-9645-4da5-b513-b413dfd6fcb6 | nid00012 | ACTIVE | - | Running | management=10.142.0.112 || 8d5b14fc-6f79-49d1-ba01-878349b3108f | nid00013 | ACTIVE | - | Running | management=10.142.0.113 || e493bc76-30c4-4236-91d9-c02d7db2de3e | nid00014 | ACTIVE | - | Running | management=10.142.0.114 || 5880a8c0-38eb-4a95-883e-99f042c07a1f | nid00015 | ACTIVE | - | Running | management=10.142.0.115 || 94f5dc1f-a417-441d-a8d7-34d5f3011051 | nid00016 | ACTIVE | - | Running | management=10.142.0.116 || f9085f90-ff90-4ff1-a997-854f1f9a6e8b | nid00017 | ACTIVE | - | Running | management=10.142.0.117 || 521f0aa9-0d5f-4a64-9aee-f722c3a53ed1 | nid00018 | ACTIVE | - | Running | management=10.142.0.118 || 5ef4e335-ed9d-4b60-9838-b2b7e2ecf5c4 | nid00019 | ACTIVE | - | Running | management=10.142.0.119 || 70b83657-065e-435d-adfd-8fd943ed6e47 | nid00020 | ACTIVE | - | Running | management=10.142.0.120 || efe39d28-768b-42f6-bcd6-6067c868da06 | nid00021 | ACTIVE | - | Running | management=10.142.0.121 || 04ebbfaf-1d35-4337-98ec-c34ee4439b98 | nid00022 | ACTIVE | - | Running | management=10.142.0.122 || 2cb72b54-c64d-42bc-a0bd-4c82d81bf31e | nid00023 | ERROR | spawning | NOSTATE | || a107dffd-5eec-4a76-9593-9ccb8a50070b | nid00024 | ACTIVE | - | Running | management=10.142.0.124 || ac258d7d-d460-4307-af5b-86d243b61fac | nid00025 | ACTIVE | - | Running | management=10.142.0.125 || 37569489-6459-4688-9cbb-be8013415b48 | nid00026 | ACTIVE | - | Running | management=10.142.0.126 || c84a9ad4-dae2-4175-b235-4fff722d6ba3 | nid00027 | ACTIVE | - | Running | management=10.142.0.127 || caf492dd-0511-4922-8414-07f3875d43eb | nid00028 | ACTIVE | - | Running | management=10.142.0.128 || 3ed3d2dc-75cc-4b26-8d1b-6e3376aeb6b9 | nid00029 | ACTIVE | - | Running | management=10.142.0.129 || 7cc4df19-d710-4ea3-a2e9-aeab05a818eb | nid00030 | ACTIVE | - | Running | management=10.142.0.130 || 03edaf69-7c1c-413d-b517-c374e9e6dc0b | nid00031 | ACTIVE | - | Running | management=10.142.0.131 || 7bf333ee-8568-4547-9ab1-81f3922edaff | nid00032 | ACTIVE | - | Running | management=10.142.0.132 || c6db1a6e-bf1e-4898-8136-aeef02267912 | nid00033 | ACTIVE | - | Running | management=10.142.0.133 || 25952061-cd6c-4489-b3cd-607069b3e282 | nid00034 | ACTIVE | - | Running | management=10.142.0.134 || 994e1665-703e-478c-a274-9eb562603f89 | nid00035 | ACTIVE | - | Running | management=10.142.0.135 || 40b1ae06-dd48-4b5f-9337-a14757586663 | nid00036 | ACTIVE | - | Running | management=10.142.0.136 || 9f5e21ff-e635-4bc0-a5c5-c5c611577fc7 | nid00037 | ACTIVE | - | Running | management=10.142.0.137 || 4a36a9c3-46b9-4b7e-95e1-9efd283d8f2d | nid00038 | ACTIVE | - | Running | management=10.142.0.138 || a13d90dc-d5b1-467a-b01a-488d9d37ccff | nid00040 | ACTIVE | - | Running | management=10.142.0.140 || 0b70da40-6d10-4bfa-9ca1-aa5f9a581377 | nid00041 | ACTIVE | - | Running | management=10.142.0.141 || 67afc079-4444-4dbc-bf38-e7b7603c7b5c | nid00047 | ACTIVE | - | Running | management=10.142.0.147 |+--------------------------------------+----------+--------+------------+-------------+------------------------
3.8 Overview of Urika-GX System Management UIThe Urika®-GX system management interface enables performing a number of monitoring and managementtasks, including, but not limited to:
● Managing nodes/instances
● Viewing information about nodes/instances
● Changing user settings
● Changing passwords
● Monitor and manage services
The Urika-GX system management interface currently supports the role of an admin only. To log on to thisinterface, point a browser at the Urika-GX Applications Interface UI, which can be accessed at http://machine and then select the Cray System Management icon. Though this is the recommended way of access(because it displays the Urika-GX Applications Interface banner, containing links for additional resources), theCray System Management UI can also be accessed at https://machine-smw/dashboard.
System Management
S3016 52

CAUTION: When accessing the Cray System Management UI for the first time, users should direct theirbrowser at https://machine-smw/dashboard instead of accessing via the Urika-GX ApplicationsInterface UI, otherwise the system will return an error because the CSMS SSL is configured with a self-signed certificate. In addition, when the user directs their browser at the Cray System Management UIfor the first time, they will need to add an exception to the certificate/accept the browser exception inorder to access the Cray System Management UI. This needs to be done only once. After adding anexception to the certificate, users can access Cray System Management UI from the Urika-GXApplications Interface UI also.
Accessing via the Urika-GX Applications Interface UI displays The default username for logging in is adminand the default password is initial0. After logging in, the admin menu located at the top right of the interfacecan be used to change passwords and UI settings.
The Urika-GX system management interface contains the following navigational links, which are located on theleft side of the screen:
● Settings - The Settings tab enables managing users and credentials. This menu contains the following menuitems:
○ User Settings - Enables users to change the management system UI settings/preferences, as shown inthe following figure:
Figure 4. Urika-GX System Management User Settings Interface
Changing the number of items displayed per page and changing the language on the UI via the Languagedrop down is not supported.
○ Change Password - Enables users to change their password, as shown in the following figure:
System Management
S3016 53

Figure 5. Urika-GX System Management Change Password Interface
● System - This is the landing page of the UI and contains Instances as a menu item.
Selecting System > Instances presents the Instances interface.
The Instances interface also displays a table containing information about the nodes/instances in the system,as shown in the following figure:
Figure 6. Urika-GX System Management Instances Interface
This table contains the following fields:
○ Instance Name - Displays the node/instance name in the format: nid000N, where N ranges from[00-15] for a rack containing one sub-rack, [16-31] for a rack containing 2 sub-racks, and [32-47]for a rack containing 3 sub-racks.
○ Geo Name - Refers to the physical component name of the node/instance.
○ Aries IP - Refers to the instance's IP address within the Aries High Speed Network (HSN), whichprovides high speed application and data network connectivity between nodes.
○ Management IP - Refers to the instance's IP address within the management network, which is used forsystem management.
○ Operational IP - Refers to the instance's IP address within the operational network, which is used forexecuting applications.
○ Nova Status - Displays the instance/node's status, as retrieved by the OpenStack Nova instanceprovisioning service.
System Management
S3016 54
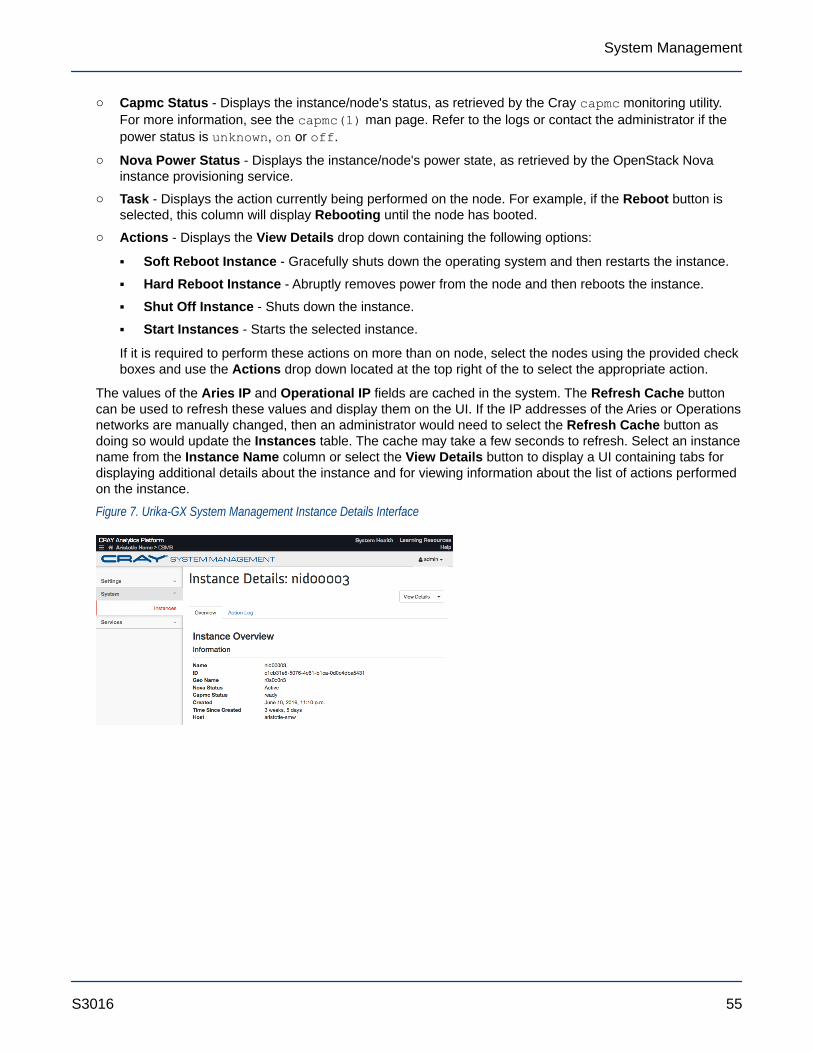
○ Capmc Status - Displays the instance/node's status, as retrieved by the Cray capmc monitoring utility.For more information, see the capmc(1) man page. Refer to the logs or contact the administrator if thepower status is unknown, on or off.
○ Nova Power Status - Displays the instance/node's power state, as retrieved by the OpenStack Novainstance provisioning service.
○ Task - Displays the action currently being performed on the node. For example, if the Reboot button isselected, this column will display Rebooting until the node has booted.
○ Actions - Displays the View Details drop down containing the following options:
▪ Soft Reboot Instance - Gracefully shuts down the operating system and then restarts the instance.
▪ Hard Reboot Instance - Abruptly removes power from the node and then reboots the instance.
▪ Shut Off Instance - Shuts down the instance.
▪ Start Instances - Starts the selected instance.
If it is required to perform these actions on more than on node, select the nodes using the provided checkboxes and use the Actions drop down located at the top right of the to select the appropriate action.
The values of the Aries IP and Operational IP fields are cached in the system. The Refresh Cache buttoncan be used to refresh these values and display them on the UI. If the IP addresses of the Aries or Operationsnetworks are manually changed, then an administrator would need to select the Refresh Cache button asdoing so would update the Instances table. The cache may take a few seconds to refresh. Select an instancename from the Instance Name column or select the View Details button to display a UI containing tabs fordisplaying additional details about the instance and for viewing information about the list of actions performedon the instance.
Figure 7. Urika-GX System Management Instance Details Interface
System Management
S3016 55

Figure 8. Urika-GX System Management Action Log Interface
Click on a column heading to sort instances. Use the Filter field located at the top right of the Instancesinterface to filter instance as needed.
● Services - The Services menu enables managing Urika-GX services and contains the following sub-menuitems:
○ State - Enables starting, stopping and monitoring the state of services. An online state indicates thatthe service is up and running, whereas an offline state indicates the service is down.
CAUTION: Before starting the Spark History server from the Urika State interface of the CraySystem Management UI or via the urika-start command, it is required to start the followingservices in the order listed:
1. HDFS NameNode
2. HDFS DataNode
System Management
S3016 56

Figure 9. Urika-GX System Management Urika State Interface
Hover over the service name to view a short description of the service. Refer to the urika-state manpage for more information.
○ Inventory - Displays the list and status of services running on each node. Hover over the column headingto view a short description of the analytic service under consideration.
A green check mark in the services columns indicates that a service is installed on the node underconsideration, whereas a red cross indicates that the service is down.
System Management
S3016 57
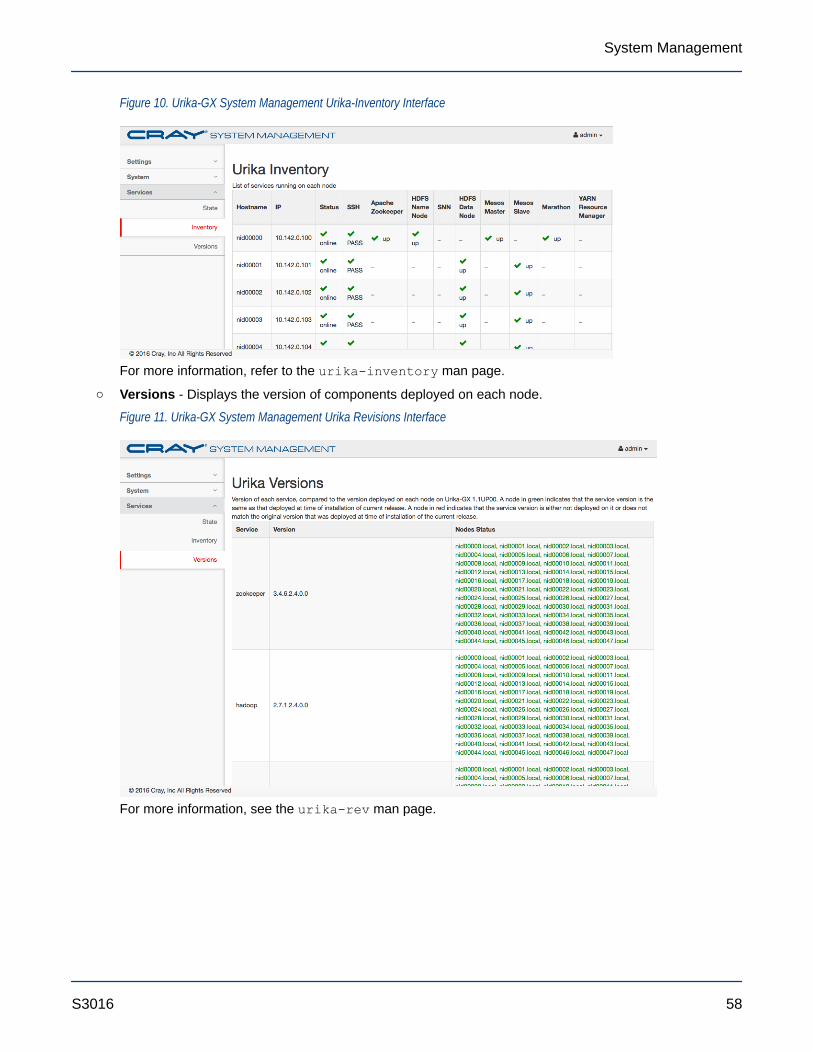
Figure 10. Urika-GX System Management Urika-Inventory Interface
For more information, refer to the urika-inventory man page.
○ Versions - Displays the version of components deployed on each node.
Figure 11. Urika-GX System Management Urika Revisions Interface
For more information, see the urika-rev man page.
System Management
S3016 58

3.9 Log on to the System Management UI
PrerequisitesThe management system UI is accessible and that the supported OpenStack services are running.
Procedure
1. Use a web browser to open the URL of the management system UI.
2. Enter the Cray default username (admin) and password (initial0) if logging on for the first time or if thedefault credentials have not been changed.
Figure 12. Management System Log in Screen
3. Select the Sign In button.
3.10 Synchronize the System Management Workstation (SMW) to theSite NTP Server
PrerequisitesThis procedure requires root privileges.
System Management
S3016 59
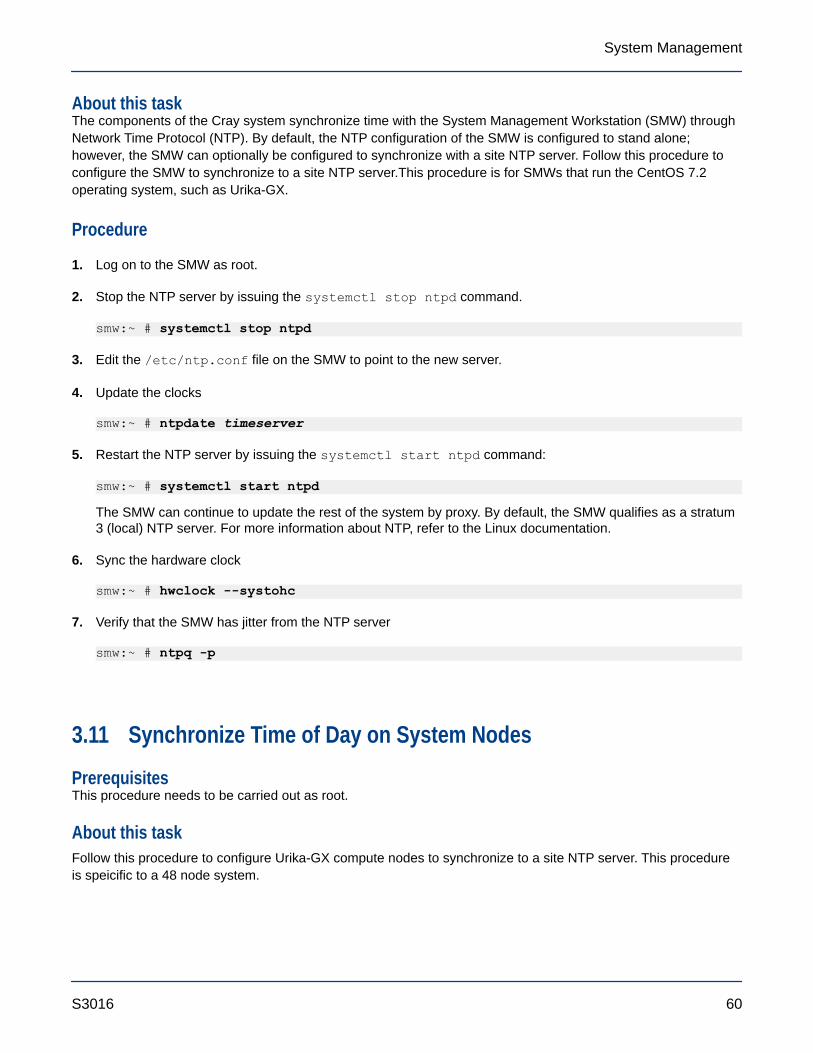
About this taskThe components of the Cray system synchronize time with the System Management Workstation (SMW) throughNetwork Time Protocol (NTP). By default, the NTP configuration of the SMW is configured to stand alone;however, the SMW can optionally be configured to synchronize with a site NTP server. Follow this procedure toconfigure the SMW to synchronize to a site NTP server.This procedure is for SMWs that run the CentOS 7.2operating system, such as Urika-GX.
Procedure
1. Log on to the SMW as root.
2. Stop the NTP server by issuing the systemctl stop ntpd command.
smw:~ # systemctl stop ntpd
3. Edit the /etc/ntp.conf file on the SMW to point to the new server.
4. Update the clocks
smw:~ # ntpdate timeserver
5. Restart the NTP server by issuing the systemctl start ntpd command:
smw:~ # systemctl start ntpd
The SMW can continue to update the rest of the system by proxy. By default, the SMW qualifies as a stratum3 (local) NTP server. For more information about NTP, refer to the Linux documentation.
6. Sync the hardware clock
smw:~ # hwclock --systohc
7. Verify that the SMW has jitter from the NTP server
smw:~ # ntpq -p
3.11 Synchronize Time of Day on System Nodes
PrerequisitesThis procedure needs to be carried out as root.
About this taskFollow this procedure to configure Urika-GX compute nodes to synchronize to a site NTP server. This procedureis speicific to a 48 node system.
System Management
S3016 60
Procedure
1. Stop the NTP server by issuing the systemctl stop ntpd command.
# pdsh -w nid000[00-47] " systemctl stop ntpd"
2. Edit the /etc/ntp.conf file on the SMW to point to the new server.
3. Update the clocks
# pdsh -w nid000[00-47] " ntpdate -s smw"
4. Sync the hardware clock
# pdsh -w nid000[00-47] "hwclock --systohc "
5. Restart the NTP server by issuing the systemctl start ntpd command:
# pdsh -w nid000[00-47] " systemctl start ntpd"
3.12 Power Up the Urika-GX System
PrerequisitesThis procedure requires root access. The examples of this procedure assumes that the instructions are beingcarried out on a 3 sub-rack (48 node) system.
About this taskThe instructions documented in the procedure can be used for powering up the Urika®-GX system. For detailedinformation, or for troubleshooting issues, please contact Cray Support.
Procedure
1. Physically power on the Power Distribution Units (PDUs).
2. Turn on the System Management Workstation (SMW).
However, it is recommended to wait a few minutes to allow the RC to boot and to verify that the RC has beenturned on. This can be achieved by executing the following command:
root@smw:~ xtalive -l l1The expected response was received.
The statement: "The expected response was received" indicates that the RC has been turned on.
3. Ensure that alert or reserved is not displayed in the Flags column of results when the followingcommand is executed:
root@smw:~ xtcli status -t l0 s0
System Management
S3016 61
if alert or reserved is displayed in the Flags column of results when the preceding command isexecuted, use the xtclear_alert or xtclear_reserve command to clear those statuses.
4. Power up the Aries Network Card Controllers (ANCCs) by executing the following command:
root@smw:~ xtcli power up s0
5. Verify that the dANCs are in the 'ready' state when the controller is responding to the xtalive commandand is up and running. Also ensure that alert or reserved is not displayed in the Flags column of resultswhen the following command is executed:
root@smw:~ xtcli status -t l0 s0
if alert or reserved is displayed in the Flags column of results when the preceding command isexecuted, use the xtclear_alert or xtclear_reserve command to clear those statuses.
6. Ensure that the ANCCs are powered on by executing the command:
root@smw:~ xtalive All 6 expected responses were received.
The above response may vary, depending on the number of sub-racks in the system. The previous exampledisplays a response the system would return if there are 3 sub-racks in the rack.
7. Become the crayadm user.
root@smw:~ su - crayadm
8. Initialize the High Speed Network (HSN) by executing the command:
crayadm@smw:~ xtbounce --linktune s0
This may step a few minutes to finish executing.
9. Exit to become the root user again.
crayadm@smw:~ exit
10. Use the HSS rtr command to request routing for the HSN
root@smw:~ rtr -R s0
11. Execute the following command to check for any alerts/issues.
root@smw:~ capmc node_status
12. Power on all the compute nodes of the system by executing the ux-nid-power-on script.
For more information, see the ux-nid-power-on man page.
root@smw:~ source /root/admin.openrcroot@smw:~ ux-nid-power-on all
Once all the node IDs have reported that they are up, wait for 5 or so minutes. The login nodes take longerthan the rest of the nodes.
System Management
S3016 62

13. Verify that the compute nodes have been turned on.
root@smw:~ xtcli status s0
All the nodes should send a response. If a response is not received from all the nodes, do not proceed.
14. Execute the following command:
root@smw:~ pall uptime |sort
Once all the node IDs have reported that they are up, wait for 5 or so minutes. The login nodes take longerthan the rest of the nodes.
15. Mount Lustre
root@smw:~ pall mount /mnt/lustre
Here pall is an alias for pdsh -w and should be configured in .bash_profile
16. Confirm that the required nodes have a mount point by executing the following command:
root@smw:~ pall df -k |grep lustre |sort
17. Start up the analytic applications using the urika-start script.
For more information, see the urika-start man page.
root@smw:~ urika-start
This starts up all the analytic applications installed on the system.
18. Pause for 5 minutes or so.
It is important to allow Hadoop to perform the required set up before proceeding. Hadoop will initially be insafe mode when it starts.
19. Verify that the analytic services have started.
root@smw:~ urika-inventory
20. Confirm services are up on all the expected nodes and that all processes are listed as online when theurika-state command is executed.
root@smw:~ urika-state
21. Optional: Check the general health of the system.
root@smw:~ urika-check-platform
System Management
S3016 63
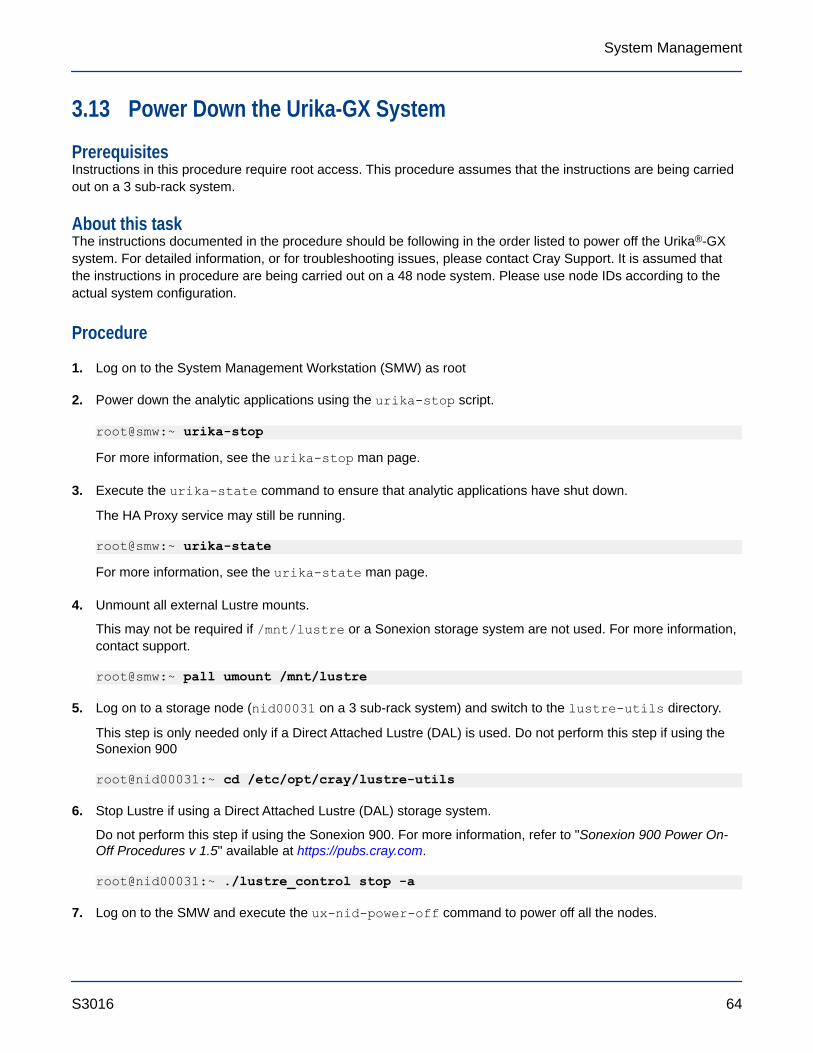
3.13 Power Down the Urika-GX System
PrerequisitesInstructions in this procedure require root access. This procedure assumes that the instructions are being carriedout on a 3 sub-rack system.
About this taskThe instructions documented in the procedure should be following in the order listed to power off the Urika®-GXsystem. For detailed information, or for troubleshooting issues, please contact Cray Support. It is assumed thatthe instructions in procedure are being carried out on a 48 node system. Please use node IDs according to theactual system configuration.
Procedure
1. Log on to the System Management Workstation (SMW) as root
2. Power down the analytic applications using the urika-stop script.
root@smw:~ urika-stop
For more information, see the urika-stop man page.
3. Execute the urika-state command to ensure that analytic applications have shut down.
The HA Proxy service may still be running.
root@smw:~ urika-state
For more information, see the urika-state man page.
4. Unmount all external Lustre mounts.
This may not be required if /mnt/lustre or a Sonexion storage system are not used. For more information,contact support.
root@smw:~ pall umount /mnt/lustre
5. Log on to a storage node (nid00031 on a 3 sub-rack system) and switch to the lustre-utils directory.
This step is only needed only if a Direct Attached Lustre (DAL) is used. Do not perform this step if using theSonexion 900
root@nid00031:~ cd /etc/opt/cray/lustre-utils
6. Stop Lustre if using a Direct Attached Lustre (DAL) storage system.
Do not perform this step if using the Sonexion 900. For more information, refer to "Sonexion 900 Power On-Off Procedures v 1.5" available at https://pubs.cray.com.
root@nid00031:~ ./lustre_control stop -a
7. Log on to the SMW and execute the ux-nid-power-off command to power off all the nodes.
System Management
S3016 64
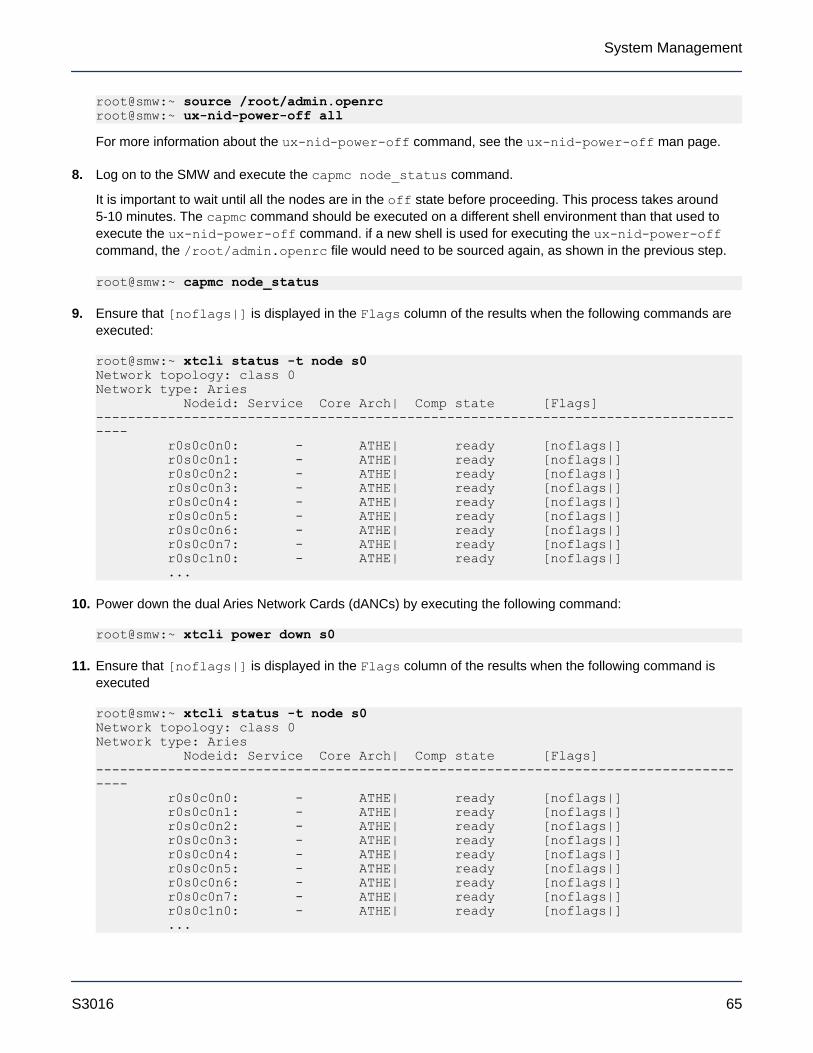
root@smw:~ source /root/admin.openrcroot@smw:~ ux-nid-power-off all
For more information about the ux-nid-power-off command, see the ux-nid-power-off man page.
8. Log on to the SMW and execute the capmc node_status command.
It is important to wait until all the nodes are in the off state before proceeding. This process takes around5-10 minutes. The capmc command should be executed on a different shell environment than that used toexecute the ux-nid-power-off command. if a new shell is used for executing the ux-nid-power-offcommand, the /root/admin.openrc file would need to be sourced again, as shown in the previous step.
root@smw:~ capmc node_status
9. Ensure that [noflags|] is displayed in the Flags column of the results when the following commands areexecuted:
root@smw:~ xtcli status -t node s0 Network topology: class 0Network type: Aries Nodeid: Service Core Arch| Comp state [Flags]------------------------------------------------------------------------------------ r0s0c0n0: - ATHE| ready [noflags|] r0s0c0n1: - ATHE| ready [noflags|] r0s0c0n2: - ATHE| ready [noflags|] r0s0c0n3: - ATHE| ready [noflags|] r0s0c0n4: - ATHE| ready [noflags|] r0s0c0n5: - ATHE| ready [noflags|] r0s0c0n6: - ATHE| ready [noflags|] r0s0c0n7: - ATHE| ready [noflags|] r0s0c1n0: - ATHE| ready [noflags|] ...
10. Power down the dual Aries Network Cards (dANCs) by executing the following command:
root@smw:~ xtcli power down s0
11. Ensure that [noflags|] is displayed in the Flags column of the results when the following command isexecuted
root@smw:~ xtcli status -t node s0Network topology: class 0Network type: Aries Nodeid: Service Core Arch| Comp state [Flags]------------------------------------------------------------------------------------ r0s0c0n0: - ATHE| ready [noflags|] r0s0c0n1: - ATHE| ready [noflags|] r0s0c0n2: - ATHE| ready [noflags|] r0s0c0n3: - ATHE| ready [noflags|] r0s0c0n4: - ATHE| ready [noflags|] r0s0c0n5: - ATHE| ready [noflags|] r0s0c0n6: - ATHE| ready [noflags|] r0s0c0n7: - ATHE| ready [noflags|] r0s0c1n0: - ATHE| ready [noflags|] ...
System Management
S3016 65

12. Turn off the SMW.
root@smw:~ shutdown -h
13. Ensure that Lustre is unmounted before shutting down breakers on rack, if Lustre is installed on the samerack.
14. Physically power down the rack by turning off the Power Distribution Units (PDUs).
3.14 Urika-GX CLI Commands for Managing ServicesUrika-GX features a number of scripts for controlling and monitoring installed analytic applications. Thecommands need to be run as root from the System Management Workstation (SMW).
CAUTION: These scripts should only be executed by administrators.
urika-start
The urika-start command is used to start analytic services on the Urika-GX system. This command starts allthe running services if used without any options. To start a specific service, use the -s or --service option tospecify the name of that service.
CAUTION: The urika-start command should only be used to start pre-defined services. It should notbe used to modify any existing services.
CAUTION: Before starting the Spark History server from the Urika State interface of the Cray SystemManagement UI or via the urika-start command, it is required to start the following services in theorder listed:
1. HDFS NameNode
2. HDFS DataNode
If this command is used without any options, it will start the YARN Node Manager service as well as theaforementioned services. It also calls the urika-yam-flexup script.
If run without any options, the urika-start command does not start the Spark Thrift Server. Use the -s optionof this command to start the Spark Thrift Server.
For more information, see the urika-start(8) man page.
Start all running services
# urika-start
Start a single service (Hue in this example):
System Management
S3016 66
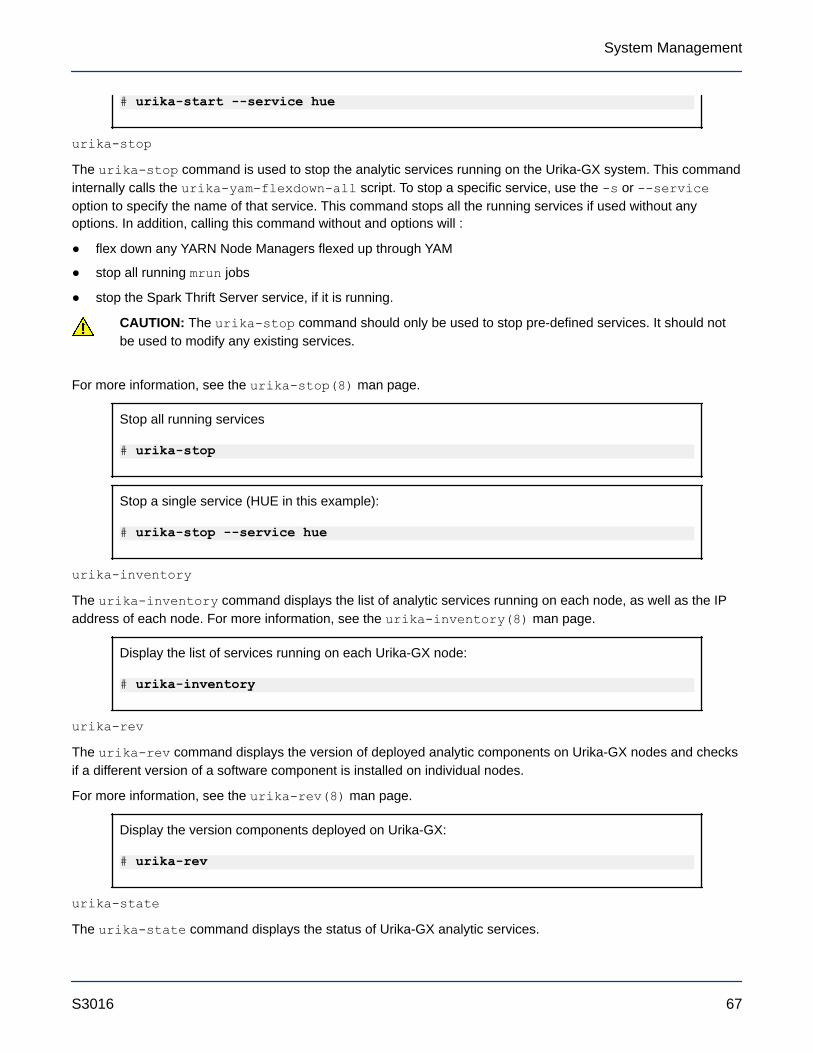
# urika-start --service hue
urika-stop
The urika-stop command is used to stop the analytic services running on the Urika-GX system. This commandinternally calls the urika-yam-flexdown-all script. To stop a specific service, use the -s or --serviceoption to specify the name of that service. This command stops all the running services if used without anyoptions. In addition, calling this command without and options will :
● flex down any YARN Node Managers flexed up through YAM
● stop all running mrun jobs
● stop the Spark Thrift Server service, if it is running.
CAUTION: The urika-stop command should only be used to stop pre-defined services. It should notbe used to modify any existing services.
For more information, see the urika-stop(8) man page.
Stop all running services
# urika-stop
Stop a single service (HUE in this example):
# urika-stop --service hue
urika-inventory
The urika-inventory command displays the list of analytic services running on each node, as well as the IPaddress of each node. For more information, see the urika-inventory(8) man page.
Display the list of services running on each Urika-GX node:
# urika-inventory
urika-rev
The urika-rev command displays the version of deployed analytic components on Urika-GX nodes and checksif a different version of a software component is installed on individual nodes.
For more information, see the urika-rev(8) man page.
Display the version components deployed on Urika-GX:
# urika-rev
urika-state
The urika-state command displays the status of Urika-GX analytic services.
System Management
S3016 67

For more information, see the urika-state(8) man page.
Display status of services:
# urika-state
Sequence of Execution of ScriptsThe urika-state command can be used to view the state services running on Urika-GX. Use this command toensure that the following dependencies are met:
● Before executing the start -s mesos_master command, ensure that the ZooKeeper service is up andrunning.
● Before executing the stop -s mesos_master command, ensure that the Marathon and Mesos slaveservices have already been stopped
● Before executing the start -s mesos_slave command, ensure that the ZooKeeper and Mesos Masterservices are up and running.
● Before executing the start -s marathon command, ensure that the ZooKeeper and Mesos Masterservices are up and running.
In addition, it is recommended to stop the Mesos slave service before stopping Marathon via the urika-stop -s marathon command. The urika-stop -s mesos_slave command does not have any dependencies,though any running tasks would be lost. Therefore, it is recommended to ensure that all the existing jobs finishrunning before executing the stop -s mesos_slave command.
Additional Scripts (USE ONLY IF REQUESTED BY CRAY SUPPORT)CAUTION: The following scripts should ONLY be used by administrations and ONLY if requestedby Cray Support for diagnostic/troubleshooting purposes:
● urika-datanode.service - Service for HDFS Data Node, which stores and retrieves data on one node
● urika-namednode_primary.service - Service for HDFS Name Node, which keeps directory tree of allfiles in HDFS
● urika-namednode_secondary.service - Service for HDFS Secondary Name Node, which periodicallystores metadata from NameNode
● urika-zookeeper.service - Service for Apache ZooKeeper, which is used to coordinate distributedapplications
● urika-oozie.service - Service for Apache Oozie, which is a work-flow scheduler for Hadoop
● urika-hive.service - Service for Hive metastore, which stores the metadata for Hive tables andpartitions
● urika-hive2.service - Service for HiveServer2 (HS2), which is a server interface that enables remoteclients to execute queries against Hive urika-webhcat.service - Service for Hive WebHCat, whichprovides an API for Hive web interface.
● urika-hue.service - Service for Hadoop User Experience (HUE), which is a web interface that enablesinteracting with a Hadoop cluster and browsing HDFS
System Management
S3016 68
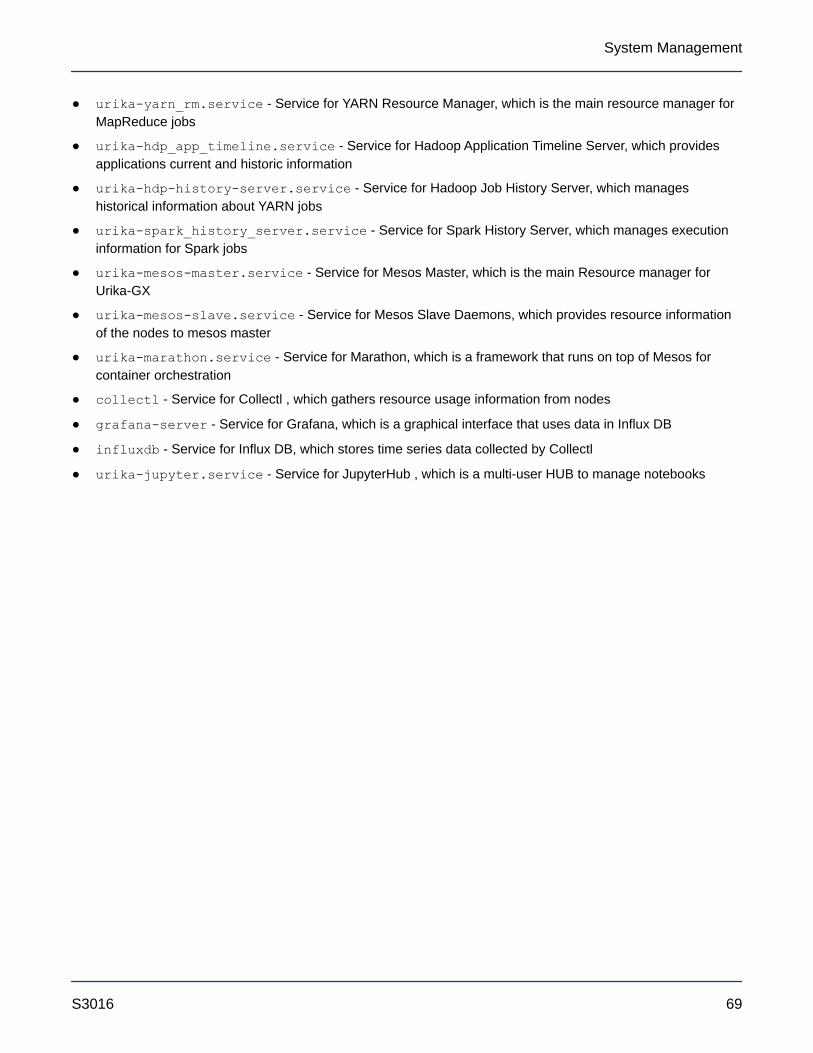
● urika-yarn_rm.service - Service for YARN Resource Manager, which is the main resource manager forMapReduce jobs
● urika-hdp_app_timeline.service - Service for Hadoop Application Timeline Server, which providesapplications current and historic information
● urika-hdp-history-server.service - Service for Hadoop Job History Server, which manageshistorical information about YARN jobs
● urika-spark_history_server.service - Service for Spark History Server, which manages executioninformation for Spark jobs
● urika-mesos-master.service - Service for Mesos Master, which is the main Resource manager forUrika-GX
● urika-mesos-slave.service - Service for Mesos Slave Daemons, which provides resource informationof the nodes to mesos master
● urika-marathon.service - Service for Marathon, which is a framework that runs on top of Mesos forcontainer orchestration
● collectl - Service for Collectl , which gathers resource usage information from nodes
● grafana-server - Service for Grafana, which is a graphical interface that uses data in Influx DB
● influxdb - Service for Influx DB, which stores time series data collected by Collectl
● urika-jupyter.service - Service for JupyterHub , which is a multi-user HUB to manage notebooks
System Management
S3016 69
4 System Monitoring
4.1 System Monitoring ToolsVarious tools are used to monitor individual components of Urika-GX.
● System Management Workstation - Monitored via the iDRAC.
● Physical system resources - Monitored via Grafana.
● Physical system components - Health of physical system components, such as PCIe Channels, Dual AriesNetwork Card (dANC) etc., is monitored via the Hardware Supervisory system (HSS).
○ Sub-racks - Sub-rack level attributes, such as power supply, amperage, fan status, and temperature infoare monitored via the iSCB.
CAUTION: iSCB CLI commands other than the status command should NOT be executed onthe Urika-GX system (unless advised by Cray Support) as they may interfere with OpenStack'sperformance. For more information, contact Cray support.
○ Nodes/instances- Monitored via:
▪ The capmc command.
▪ The system management UI.
▪ The OpenStack Nova service.
● OpenStack services - Monitored via OpenStack CLI commands.
In addition to the aforementioned tools, Hadoop and Spark applications can be monitored using the Urika-GXperformance analysis tools. For more information, see S-3015, "Urika®-GX Analytic Applications Guide".
4.2 Getting Started with Using GrafanaGrafana is a feature-rich metrics, dashboard, and graph editor. It provides information about utilization of systemresources, such as CPU, memory, I/O, etc.
Major Grafana components and UI elements include:
● Dashboard - The Dashboard consolidates all the visualizations into a single interface. Urika-GX ships withpre-defined dashboards for resource utilization information. For information about these dashboards, see Default Grafana Dashboards on page 72.
● Panels - The Panel is the basic visualization building block of the GUI. Panels support a wide variety offormatting options and can be dragged, dropped, resized, and rearranged on the Dashboard.
System Monitoring
S3016 70

● Query Editor - Each Panel provides a Query Editor for the data source, which is InfluxDB on the Urika-GXsystem. Information retrieved from the Query Editor is displayed on the Panel.
● Data Source - Grafana supports many different storage back-ends for retrieving time series data. Each DataSource has a specific Query Editor that is customized for the features and capabilities that the particularData Source exposes. Urika-GX currently supports InfluxDB as its data source.
● Organization - Grafana supports multiple organizations in order to support a wide variety of deploymentmodels. Each Organization can have one or more Data Sources. All Dashboards are owned by a particularOrganization.
● User - A User is a named account in Grafana. A user can belong to one or more Organizations, and can beassigned different levels of privileges via roles.
● Row - A Row is a logical divider within a Dashboard, and is used to group Panels together.
RolesUsers and Organizations can be assigned roles to specify permissions/privileges. These roles and theirprivileges are listed in the following table:
Table 11. Grafana Roles and Permissions
Role Edit roles View graphs Edit/createcopy of
existing graphs
Add newgraphs toexistingdashboards
Create new/
import existing
dashboards
Admin Yes Yes Yes Yes Yes (Thesedashboardspersist betweensessions)
Viewer (defaultrole)
No Yes No No No
Editor No Yes Yes Yes Yes (Thesedashboards getdeleted when theeditor logs out)
Read only editor No Yes Yes Yes No
Each role type can also export performance data via the dashboard. When a new user signs up for the first time,the default role assigned to the user is that of a Viewer. The admin can then change the new user's role if needed.All users have a default role of a Viewer when they first log on to Grafana. Administrators can change rolesassigned to users as needed using the Admin menu.
System Monitoring
S3016 71

Figure 13. Change User Roles Using the Admin Menu
Since the time displayed on the Grafana UI uses the browser's timezone and that displayed on the Spark Historyserver's UI uses the Urika-GX system's timezone, the timezones displayed on the two UIs may not be the same.
By default, Grafana's refresh rate is turned off on the Urika-GX system. Sometimes the Hadoop and SparkGrafana dashboards take longer to load than expected. The usual cause of this issue is the time it takes InfluxDBto return all of the requested data. To reduce the time for the Hadoop and Spark dashboards to display data, referto Update the InfluxDB Data Retention Policy on page 83. Reducing the amount of data retained makesGrafana dashboards dsiplay faster.
4.3 Default Grafana DashboardsThe default set of Grafana dashboards shipped with Urika-GX include:
● Aggregate Compute Node Performance Statistics - Displays graphs representing statistical data related tonetwork, CPU, and I/O utilization for all Urika-GX nodes.
This dashboard contains the following graphs:
○ CPU AND MEMORY
▪ CPU utilization - Displays the overall CPU utilization for all nodes.
▪ Memory utilization - Displays the overall memory used by all nodes.
○ FILE SYSTEM DATA RATES
▪ SSD Reads/Writes Bytes/Second - Displays SSD utilization for all nodes.
▪ Second Hard Drive (/dev/sdb) Reads/Writes Bytes/Sec - Displays utilization of secondary harddisk space for all nodes.
▪ Root FS HDD (/dev/sda) Reads/Writes Bytes/Sec - Displays utilization of root files system on thehard drive for all nodes.
System Monitoring
S3016 72

▪ Lustre Reads/Writes Bytes/Second - Displays the aggregate Lustre I/O for all the nodes.
○ NETWORK READS AND WRITES
▪ Aries HSN Bytes/Sec In/Out - Displays the overall Aries network TCP traffic information for nodes.Note that non-TCP Aries traffic, including most traffic generated by CGE, is not shown here.
▪ Operational network Bytes/sec In/Out - Displays the overall operational network traffic informationfor all nodes.
▪ Management network Bytes/sec In/Out - Displays the overall management network trafficinformation for all nodes.
Figure 14. Aggregate Compute Node Performance Statistics
● Basic Metrics - Displays graphs representing statistical data related to network, CPU, and I/O utilization forthe Urika-GX system, as a whole.
TIP: It is recommended that administrators use the Basic Metrics dashboard before using otherdashboards to retrieve a summary of the system's health.
This dashboard contains the following graphs:
○ CPU AND MEMORY
▪ Used and File Cached Memory - Displays the used and file cached memory for each node.
▪ CPU Utilization User + System - Displays the CPU utilization by the user and system for each node
○ FILE SYSTEM DATA RATES
▪ Root File System Hard Drive (/dev/sda) Reads/Writes Bytes/Sec (200MB/sec max) - Displaysinformation about the usage of memory on the root file system for each node.
System Monitoring
S3016 73
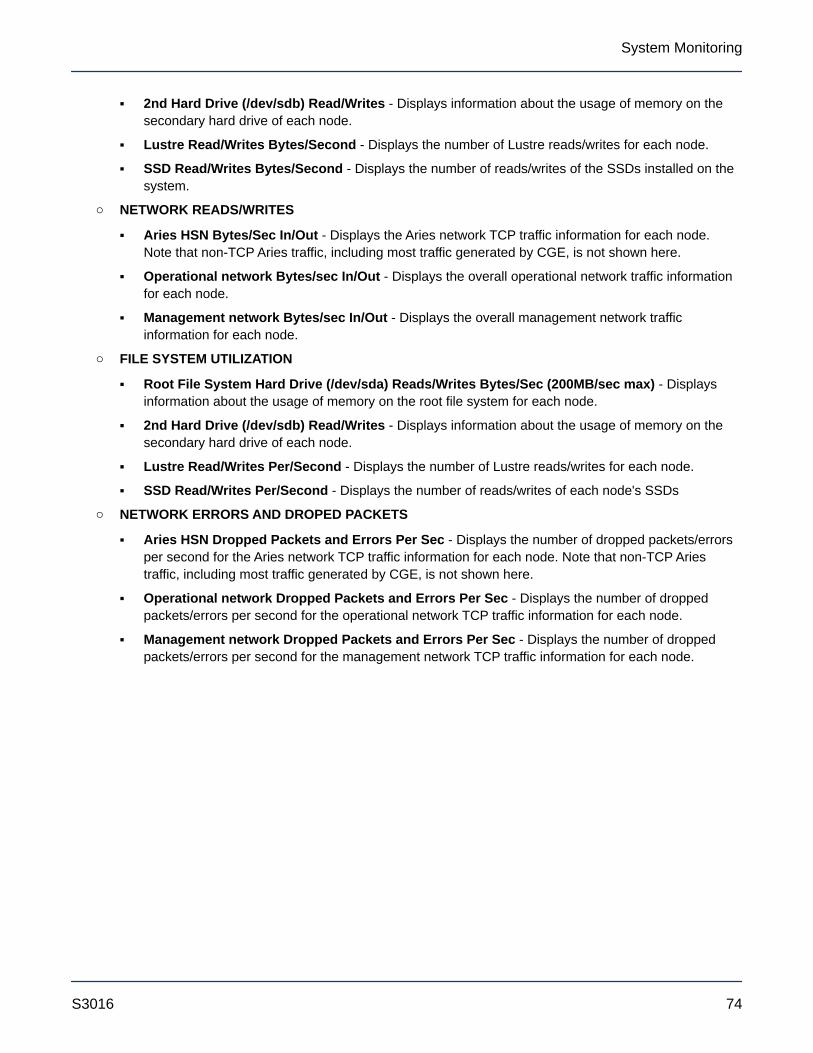
▪ 2nd Hard Drive (/dev/sdb) Read/Writes - Displays information about the usage of memory on thesecondary hard drive of each node.
▪ Lustre Read/Writes Bytes/Second - Displays the number of Lustre reads/writes for each node.
▪ SSD Read/Writes Bytes/Second - Displays the number of reads/writes of the SSDs installed on thesystem.
○ NETWORK READS/WRITES
▪ Aries HSN Bytes/Sec In/Out - Displays the Aries network TCP traffic information for each node.Note that non-TCP Aries traffic, including most traffic generated by CGE, is not shown here.
▪ Operational network Bytes/sec In/Out - Displays the overall operational network traffic informationfor each node.
▪ Management network Bytes/sec In/Out - Displays the overall management network trafficinformation for each node.
○ FILE SYSTEM UTILIZATION
▪ Root File System Hard Drive (/dev/sda) Reads/Writes Bytes/Sec (200MB/sec max) - Displaysinformation about the usage of memory on the root file system for each node.
▪ 2nd Hard Drive (/dev/sdb) Read/Writes - Displays information about the usage of memory on thesecondary hard drive of each node.
▪ Lustre Read/Writes Per/Second - Displays the number of Lustre reads/writes for each node.
▪ SSD Read/Writes Per/Second - Displays the number of reads/writes of each node's SSDs
○ NETWORK ERRORS AND DROPED PACKETS
▪ Aries HSN Dropped Packets and Errors Per Sec - Displays the number of dropped packets/errorsper second for the Aries network TCP traffic information for each node. Note that non-TCP Ariestraffic, including most traffic generated by CGE, is not shown here.
▪ Operational network Dropped Packets and Errors Per Sec - Displays the number of droppedpackets/errors per second for the operational network TCP traffic information for each node.
▪ Management network Dropped Packets and Errors Per Sec - Displays the number of droppedpackets/errors per second for the management network TCP traffic information for each node.
System Monitoring
S3016 74
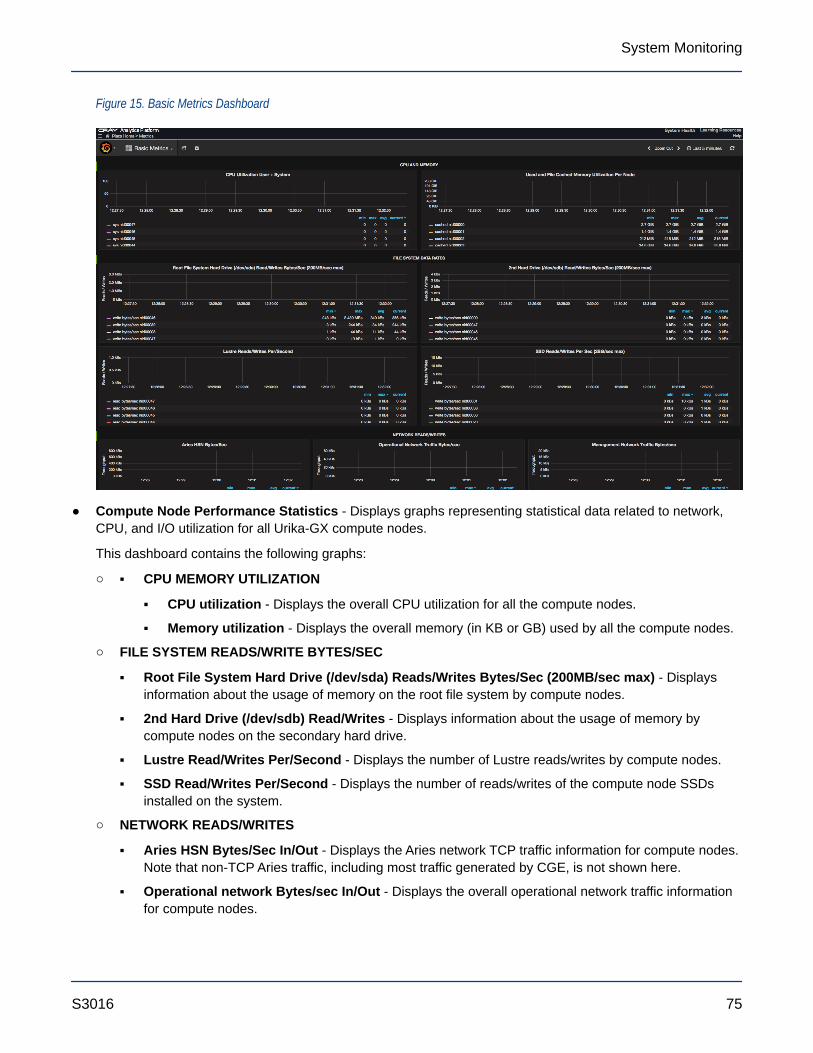
Figure 15. Basic Metrics Dashboard
● Compute Node Performance Statistics - Displays graphs representing statistical data related to network,CPU, and I/O utilization for all Urika-GX compute nodes.
This dashboard contains the following graphs:
○ ▪ CPU MEMORY UTILIZATION
▪ CPU utilization - Displays the overall CPU utilization for all the compute nodes.
▪ Memory utilization - Displays the overall memory (in KB or GB) used by all the compute nodes.
○ FILE SYSTEM READS/WRITE BYTES/SEC
▪ Root File System Hard Drive (/dev/sda) Reads/Writes Bytes/Sec (200MB/sec max) - Displaysinformation about the usage of memory on the root file system by compute nodes.
▪ 2nd Hard Drive (/dev/sdb) Read/Writes - Displays information about the usage of memory bycompute nodes on the secondary hard drive.
▪ Lustre Read/Writes Per/Second - Displays the number of Lustre reads/writes by compute nodes.
▪ SSD Read/Writes Per/Second - Displays the number of reads/writes of the compute node SSDsinstalled on the system.
○ NETWORK READS/WRITES
▪ Aries HSN Bytes/Sec In/Out - Displays the Aries network TCP traffic information for compute nodes.Note that non-TCP Aries traffic, including most traffic generated by CGE, is not shown here.
▪ Operational network Bytes/sec In/Out - Displays the overall operational network traffic informationfor compute nodes.
System Monitoring
S3016 75
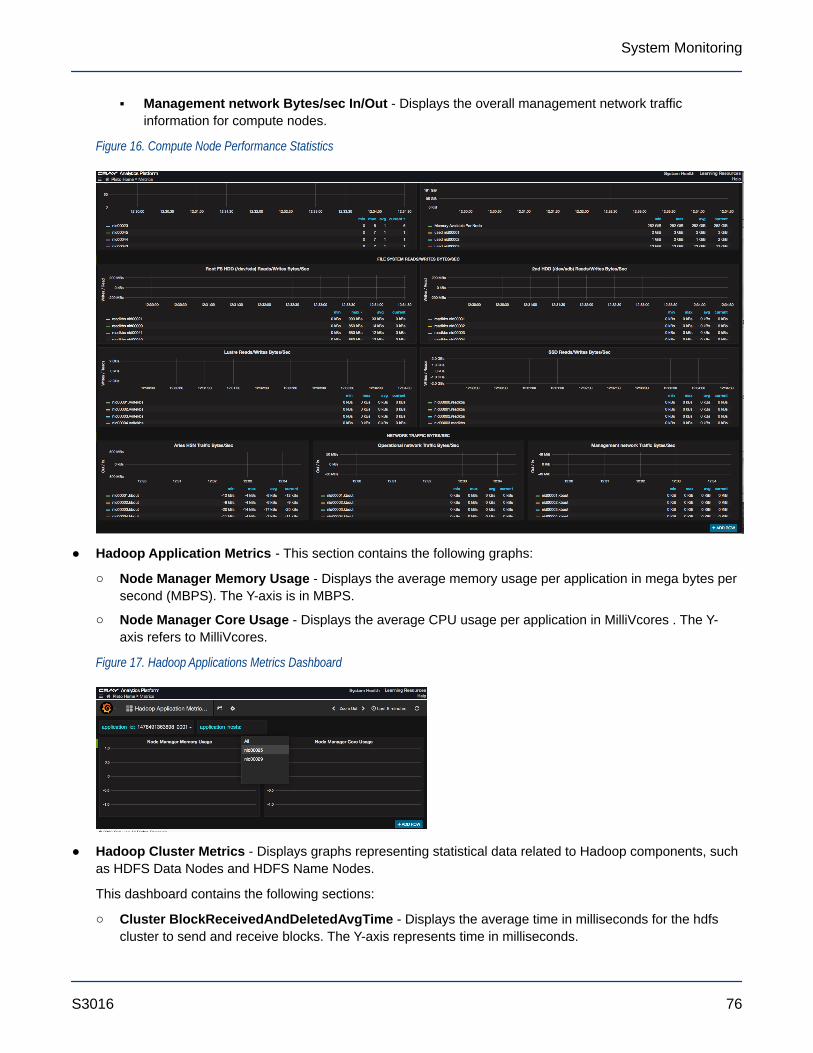
▪ Management network Bytes/sec In/Out - Displays the overall management network trafficinformation for compute nodes.
Figure 16. Compute Node Performance Statistics
● Hadoop Application Metrics - This section contains the following graphs:
○ Node Manager Memory Usage - Displays the average memory usage per application in mega bytes persecond (MBPS). The Y-axis is in MBPS.
○ Node Manager Core Usage - Displays the average CPU usage per application in MilliVcores . The Y-axis refers to MilliVcores.
Figure 17. Hadoop Applications Metrics Dashboard
● Hadoop Cluster Metrics - Displays graphs representing statistical data related to Hadoop components, suchas HDFS Data Nodes and HDFS Name Nodes.
This dashboard contains the following sections:
○ Cluster BlockReceivedAndDeletedAvgTime - Displays the average time in milliseconds for the hdfscluster to send and receive blocks. The Y-axis represents time in milliseconds.
System Monitoring
S3016 76

○ NumActive Node Manager - Displays the number of Node Managers up and running in the Hadoopcluster at a given time. The Y-axis represents a linear number.
○ AllocatedContainers - Displays the number of allocated YARN containers by all the jobs in the hadoopcluster. The Y-axis represents a linear number.
○ DataNode Bytes Read/Write - Displays the number of bytes read or write per node from local client inthe hadoop cluster. The Y-axis refers to a linear number. Read is shown on the positive scale. Write isshown on the negative scale.
○ Data Node Remote bytes Read/Written - Displays the number of bytes read or written per node fromremote clients in the Hadoop cluster. The Y-axis represents a linear number. The number of reads areshown on the positive scale. The number of writes are shown on the negative scale.
○ Figure 18. Hadoop Cluster Metrics Dashboard
● Non-compute Node Performance Statistics - Displays graphs representing statistical data related tonetwork, CPU, and I/O utilization for all the non-compute (I/O and login) nodes of Urika-GX.
This dashboard contains the following graphs:
○ CPU MEMORY UTILIZATION
▪ CPU utilization - Displays the overall CPU utilization for I/O and login (non-compute) nodes.
▪ Memory utilization - Displays the overall memory (in KB or GB) used by all the I/O and login nodes.
○ FILE SYSTEM READS/WRITE BYTES/SEC
▪ Root File System Hard Drive (/dev/sda) Reads/Writes Bytes/Sec (200MB/sec max) - Displaysinformation about the usage of memory on the root file system by I/O and login nodes.
▪ 2nd Hard Drive (/dev/sdb) Read/Writes - For I/O and login nodes, displays information about theusage of memory by compute nodes on the secondary hard drive.
System Monitoring
S3016 77
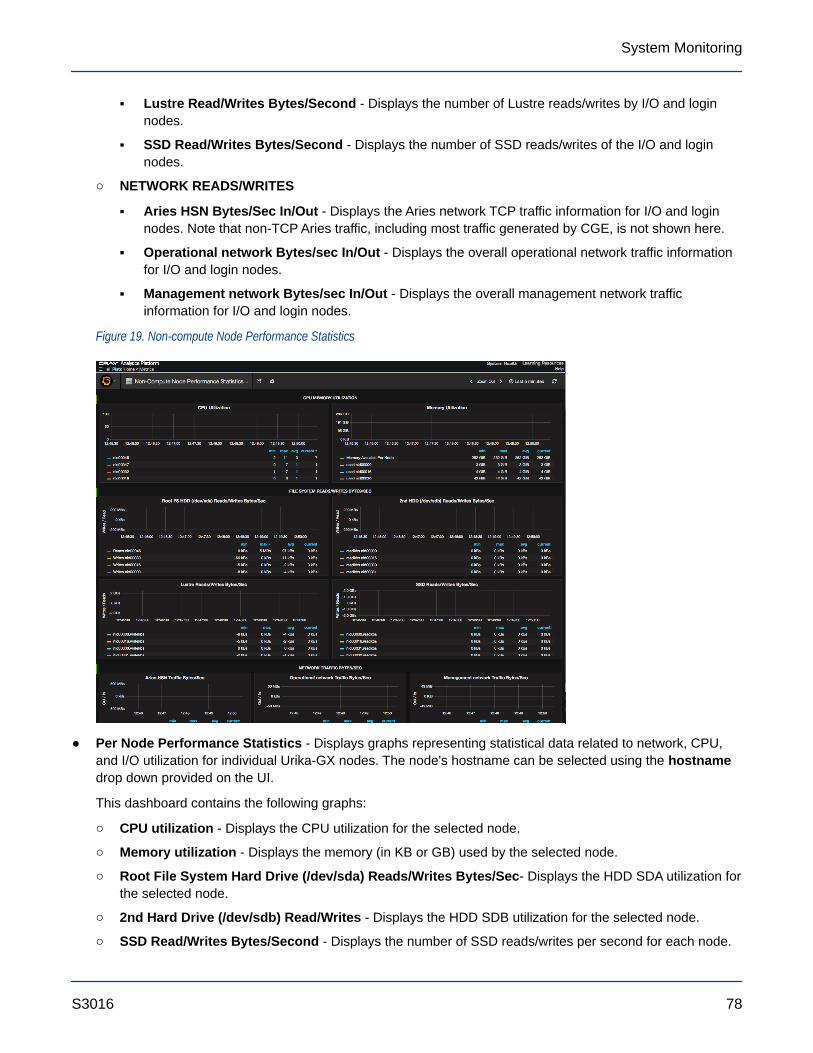
▪ Lustre Read/Writes Bytes/Second - Displays the number of Lustre reads/writes by I/O and loginnodes.
▪ SSD Read/Writes Bytes/Second - Displays the number of SSD reads/writes of the I/O and loginnodes.
○ NETWORK READS/WRITES
▪ Aries HSN Bytes/Sec In/Out - Displays the Aries network TCP traffic information for I/O and loginnodes. Note that non-TCP Aries traffic, including most traffic generated by CGE, is not shown here.
▪ Operational network Bytes/sec In/Out - Displays the overall operational network traffic informationfor I/O and login nodes.
▪ Management network Bytes/sec In/Out - Displays the overall management network trafficinformation for I/O and login nodes.
Figure 19. Non-compute Node Performance Statistics
● Per Node Performance Statistics - Displays graphs representing statistical data related to network, CPU,and I/O utilization for individual Urika-GX nodes. The node's hostname can be selected using the hostnamedrop down provided on the UI.
This dashboard contains the following graphs:
○ CPU utilization - Displays the CPU utilization for the selected node.
○ Memory utilization - Displays the memory (in KB or GB) used by the selected node.
○ Root File System Hard Drive (/dev/sda) Reads/Writes Bytes/Sec- Displays the HDD SDA utilization forthe selected node.
○ 2nd Hard Drive (/dev/sdb) Read/Writes - Displays the HDD SDB utilization for the selected node.
○ SSD Read/Writes Bytes/Second - Displays the number of SSD reads/writes per second for each node.
System Monitoring
S3016 78
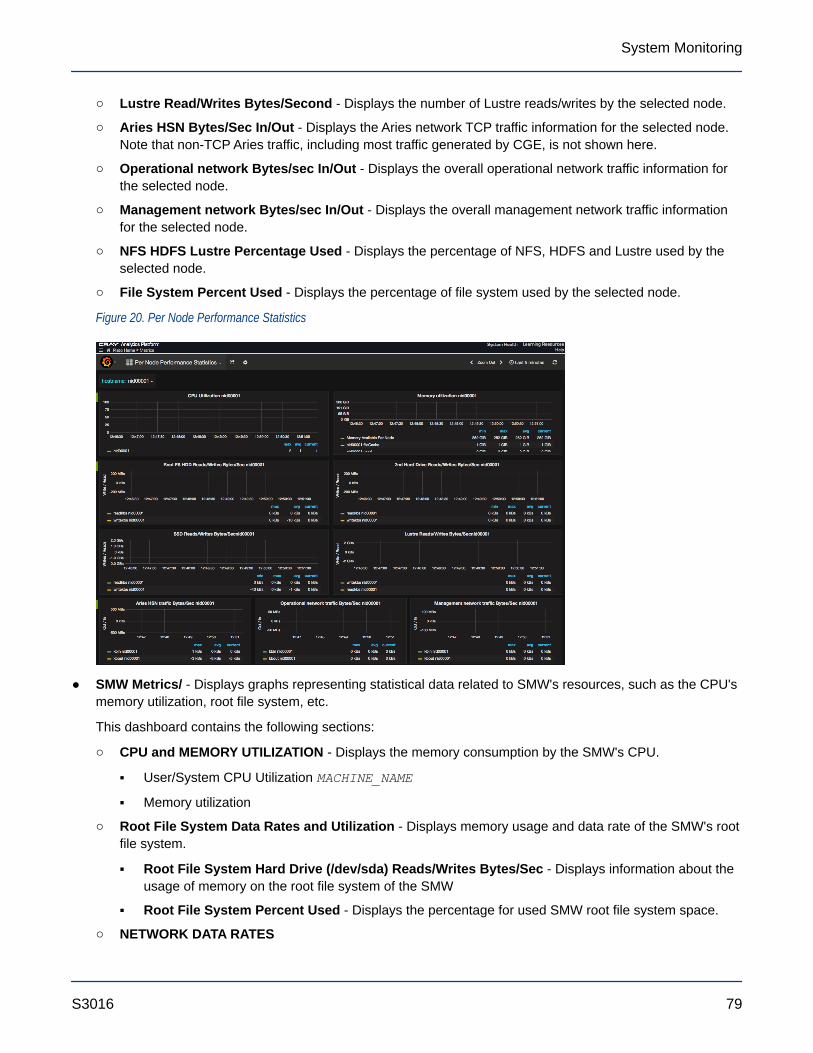
○ Lustre Read/Writes Bytes/Second - Displays the number of Lustre reads/writes by the selected node.
○ Aries HSN Bytes/Sec In/Out - Displays the Aries network TCP traffic information for the selected node.Note that non-TCP Aries traffic, including most traffic generated by CGE, is not shown here.
○ Operational network Bytes/sec In/Out - Displays the overall operational network traffic information forthe selected node.
○ Management network Bytes/sec In/Out - Displays the overall management network traffic informationfor the selected node.
○ NFS HDFS Lustre Percentage Used - Displays the percentage of NFS, HDFS and Lustre used by theselected node.
○ File System Percent Used - Displays the percentage of file system used by the selected node.
Figure 20. Per Node Performance Statistics
● SMW Metrics/ - Displays graphs representing statistical data related to SMW's resources, such as the CPU'smemory utilization, root file system, etc.
This dashboard contains the following sections:
○ CPU and MEMORY UTILIZATION - Displays the memory consumption by the SMW's CPU.
▪ User/System CPU Utilization MACHINE_NAME
▪ Memory utilization
○ Root File System Data Rates and Utilization - Displays memory usage and data rate of the SMW's rootfile system.
▪ Root File System Hard Drive (/dev/sda) Reads/Writes Bytes/Sec - Displays information about theusage of memory on the root file system of the SMW
▪ Root File System Percent Used - Displays the percentage for used SMW root file system space.
○ NETWORK DATA RATES
System Monitoring
S3016 79

▪ Operational Network Traffic Bytes/sec - Displays the operational network's data rate.
▪ Management Network Traffic Bytes/sec - Displays the management network's data rate.
○ NETWORK PACKET DROPS/SEC AND ERRORS/SEC
▪ Operational Network Dropped and Errors Per Sec - Displays the number of dropped packets anderrors per second for the operational network.
▪ Management Network Dropped and Errors Per Sec - Displays the number of dropped packets anderrors per second for the operational network.
Figure 21. SMW Metrics Dashboard
● Spark Metrics - Displays graphs representing statistical data related to Spark jobs. This dashboard alsocontains links for viewing the Spark Web UI and Spark History Server.
System Monitoring
S3016 80
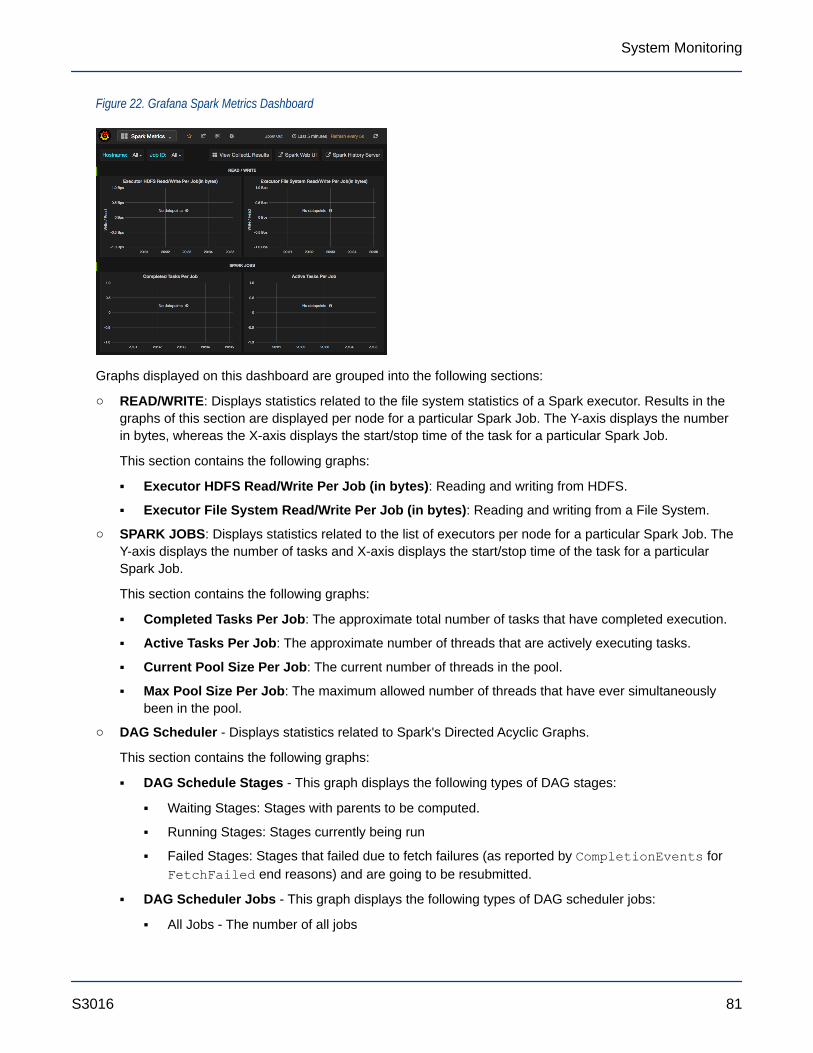
Figure 22. Grafana Spark Metrics Dashboard
Graphs displayed on this dashboard are grouped into the following sections:
○ READ/WRITE: Displays statistics related to the file system statistics of a Spark executor. Results in thegraphs of this section are displayed per node for a particular Spark Job. The Y-axis displays the numberin bytes, whereas the X-axis displays the start/stop time of the task for a particular Spark Job.
This section contains the following graphs:
▪ Executor HDFS Read/Write Per Job (in bytes): Reading and writing from HDFS.
▪ Executor File System Read/Write Per Job (in bytes): Reading and writing from a File System.
○ SPARK JOBS: Displays statistics related to the list of executors per node for a particular Spark Job. TheY-axis displays the number of tasks and X-axis displays the start/stop time of the task for a particularSpark Job.
This section contains the following graphs:
▪ Completed Tasks Per Job: The approximate total number of tasks that have completed execution.
▪ Active Tasks Per Job: The approximate number of threads that are actively executing tasks.
▪ Current Pool Size Per Job: The current number of threads in the pool.
▪ Max Pool Size Per Job: The maximum allowed number of threads that have ever simultaneouslybeen in the pool.
○ DAG Scheduler - Displays statistics related to Spark's Directed Acyclic Graphs.
This section contains the following graphs:
▪ DAG Schedule Stages - This graph displays the following types of DAG stages:
▪ Waiting Stages: Stages with parents to be computed.
▪ Running Stages: Stages currently being run
▪ Failed Stages: Stages that failed due to fetch failures (as reported by CompletionEvents forFetchFailed end reasons) and are going to be resubmitted.
▪ DAG Scheduler Jobs - This graph displays the following types of DAG scheduler jobs:
▪ All Jobs - The number of all jobs
System Monitoring
S3016 81
▪ Active Jobs - The number of active jobs
▪ DAG Scheduler Message Processing Time - This graph displays the processing time of the DAGScheduler.
○ JVM Memory Usage - The memory usage dashboards represent a snapshot of used memory.
▪ JVM Memory Usage - init: Represents the initial amount of memory (in bytes) that the Java virtualmachine requests from the operating system for memory management during start up. The Javavirtual machine may request additional memory from the operating system and may also releasememory to the system over time. The value of init may be undefined.
▪ JVM Memory Usage - Used: Represents the amount of memory currently used (in bytes).
▪ JVM Memory Usage - Committed: Represents the amount of memory (in bytes) that is guaranteedto be available for use by the Java virtual machine. The amount of committed memory may changeover time (increase or decrease). The Java virtual machine may release memory to the system andcommitted could be less than init. committed will always be greater than or equal to used.
▪ JVM Memory Usage - Max: Represents the maximum amount of memory (in bytes) that can be usedfor memory management. Its value may be undefined. The maximum amount of memory may changeover time if defined. The amount of used and committed memory will always be less than or equal tomax if max is defined. A memory allocation may fail if it attempts to increase the used memory suchthat used > committed even if used <= max is still true, for example, when the system is low onvirtual memory.
▪ JVM Heap Usage: Represents the maximum amount of memory used by the JVM heap space
▪ JVM Non-Heap Usage: Represents the maximum amount of memory used by the JVM non-heapspace
4.4 Update InfluxDB Security Settings
PrerequisitesThis procedure requires root privileges.
About this taskThe default configuration for InfluxDB as shipped with Urika-GX is:
1. InfluxDB UI on socket login2:8083 is disabled
2. No authorization is enabled.
This means that any user on login node 2 can call the /bin/influx command and modify databases. To restrictthis to only a privileged user, the admin needs to create an authorized user and enable basic authentication forInfluxDB.
CAUTION: After creating the privilege user the Grafana data sources must to be updated to provide thename and password for Grafana queries to InfluxDB to succeed.
To enable add an authorized user and enable basic authentication:
System Monitoring
S3016 82

Procedure
1. Log on to login2 (login node 2) and become root.
2. Connect to InfluxDB and add a user named admin user and set its password.
# /bin/influxVisit https://enterprise.influxdata.com to register for updates, InfluxDB server management, and monitoring.Connected to http://localhost:8086 version 0.12.2InfluxDB shell 0.12.2> create user admin with password 'admin' with all privileges> show usersuser adminadmin true
3. Edit the /etc/influxdb/influxdb.conf file as root.
# vi /etc/influxdb/influxdb.conf< change auth to be true, save file, exit ># systemctl restart influxdb
At this point Grafana dashboards will still work because Grafana is shipped with credentials for InfluxDB to beuser admin with admin as the password. If the privileged user differs from these defaults Grafana queries willfail and graphs in dashboards will not work. To resolve this issue, log on to Grafana as the admin user andopen each data source, edit the InfluxDB details, updating the user and password to match that of theprivileged InfluxDB user.
For more information, visit https://docs.influxdata.com/.
4.5 Update the InfluxDB Data Retention Policy
PrerequisitesEnsure that the InfluxDB service is running using the urika-state command. For more information, see theurika-state man page.
About this taskThe data retention policy for InfluxDB defaults to infinite, i.e. data is never deleted. As a result, Spark and HadoopGrafana dashboards may take longer to load and InfluxDB may take up more space than necessary. To reducethe amount of space being used by InfluxDB, the data retention policy for each database needs to be reduced, asdescribed in this procedure. Reducing the data retention policy for Spark and Hadoop databases can reduce theload time of the Spark and Hadoop Grafana dashboards.
Procedure
1. Log on to login2 and become root.
2. Switch to the /var/lib/influxdb/data directory.
System Monitoring
S3016 83
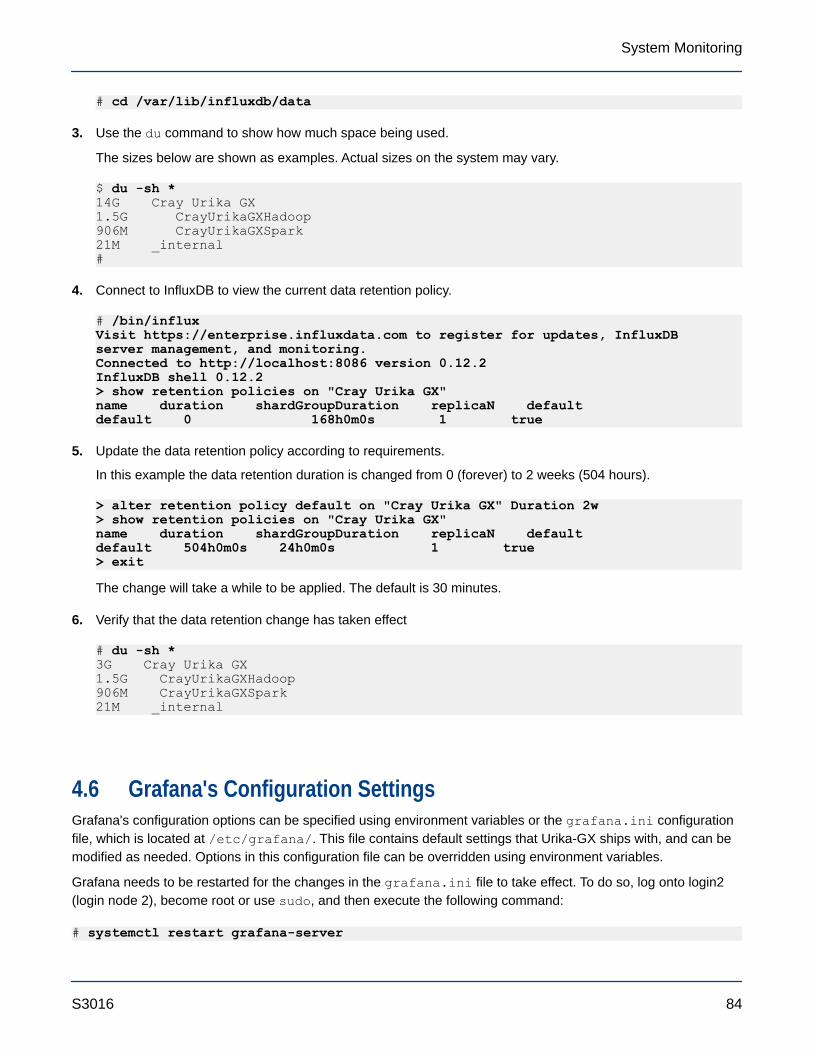
# cd /var/lib/influxdb/data
3. Use the du command to show how much space being used.
The sizes below are shown as examples. Actual sizes on the system may vary.
$ du -sh *14G Cray Urika GX1.5G CrayUrikaGXHadoop906M CrayUrikaGXSpark21M _internal#
4. Connect to InfluxDB to view the current data retention policy.
# /bin/influxVisit https://enterprise.influxdata.com to register for updates, InfluxDB server management, and monitoring.Connected to http://localhost:8086 version 0.12.2InfluxDB shell 0.12.2> show retention policies on "Cray Urika GX"name duration shardGroupDuration replicaN defaultdefault 0 168h0m0s 1 true
5. Update the data retention policy according to requirements.
In this example the data retention duration is changed from 0 (forever) to 2 weeks (504 hours).
> alter retention policy default on "Cray Urika GX" Duration 2w> show retention policies on "Cray Urika GX"name duration shardGroupDuration replicaN defaultdefault 504h0m0s 24h0m0s 1 true> exit
The change will take a while to be applied. The default is 30 minutes.
6. Verify that the data retention change has taken effect
# du -sh *3G Cray Urika GX1.5G CrayUrikaGXHadoop906M CrayUrikaGXSpark21M _internal
4.6 Grafana's Configuration SettingsGrafana's configuration options can be specified using environment variables or the grafana.ini configurationfile, which is located at /etc/grafana/. This file contains default settings that Urika-GX ships with, and can bemodified as needed. Options in this configuration file can be overridden using environment variables.
Grafana needs to be restarted for the changes in the grafana.ini file to take effect. To do so, log onto login2(login node 2), become root or use sudo, and then execute the following command:
# systemctl restart grafana-server
System Monitoring
S3016 84

In addition, the metrics that Grafana displays on the UI are retrieved from the collectl.conf file, whichspecifies the list of metrics that need to be collected from each node and stored in InfluxDB. By default, a subsetof the list of collected metrics is displayed on the Grafana dashboard. Users with admin or editor privileges cancreate/modify dashboards to update the default list of displayed metrics if needed. The collectl.confconfiguration file contains instructions for making such updates.
4.7 Change the Default Timezone Displayed on Grafana
PrerequisitesThis procedure requires administrative privileges.
About this taskUrika-GX ships with UTC as the default timezone displayed on the Grafana UI. This procedure can be used tochange the timezone for newly created dashboards or copies of the predefined dashboards shipped with thesystem.
NOTE: The timezone for the default set of Dashboards shipped with the system cannot be changed.Since the time displayed on the Grafana UI uses the browser's timezone and that displayed on the SparkHistory server's UI uses the Urika-GX system's timezone, the timezones displayed on the two UIs maynot be the same.
Procedure
1. Access the Grafana UI using the Urika-GX Applications Interface by pointing a browser at http://hostname-login1 (which is the recommended way of access) or at http://hostname-login2:3000.
2. Log on to Grafana as an admin.
Figure 23. Grafana Login Screen
System Monitoring
S3016 85
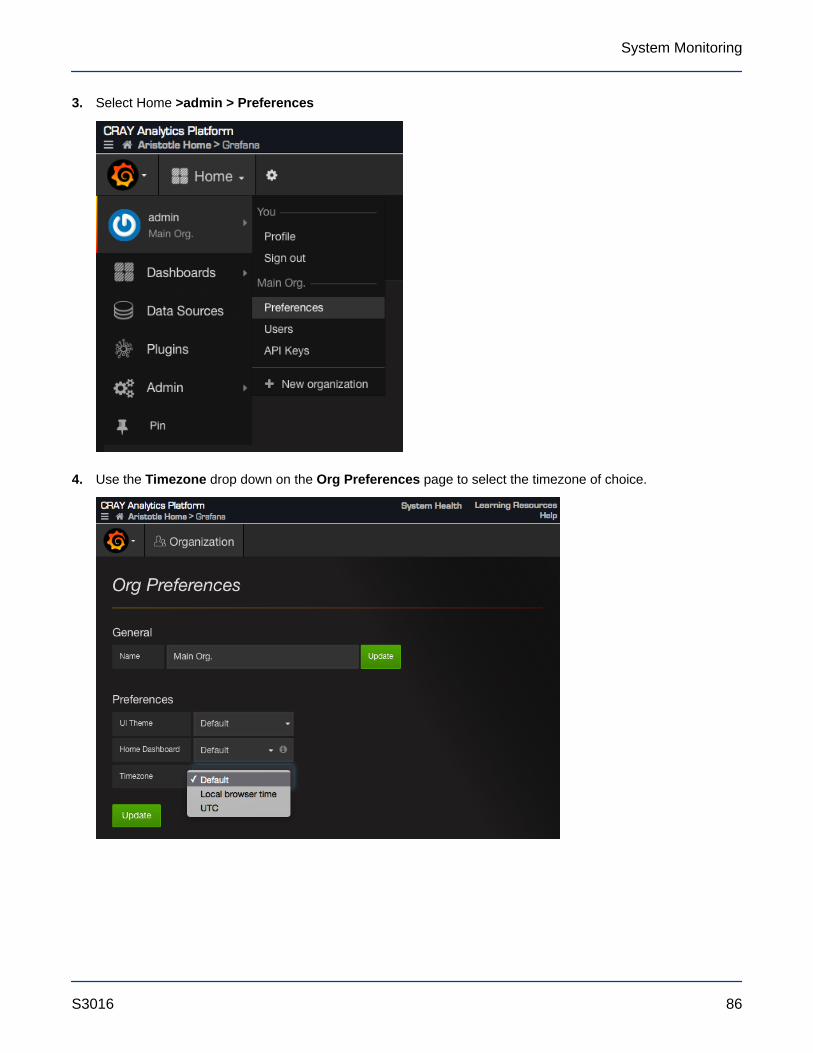
3. Select Home >admin > Preferences
4. Use the Timezone drop down on the Org Preferences page to select the timezone of choice.
System Monitoring
S3016 86
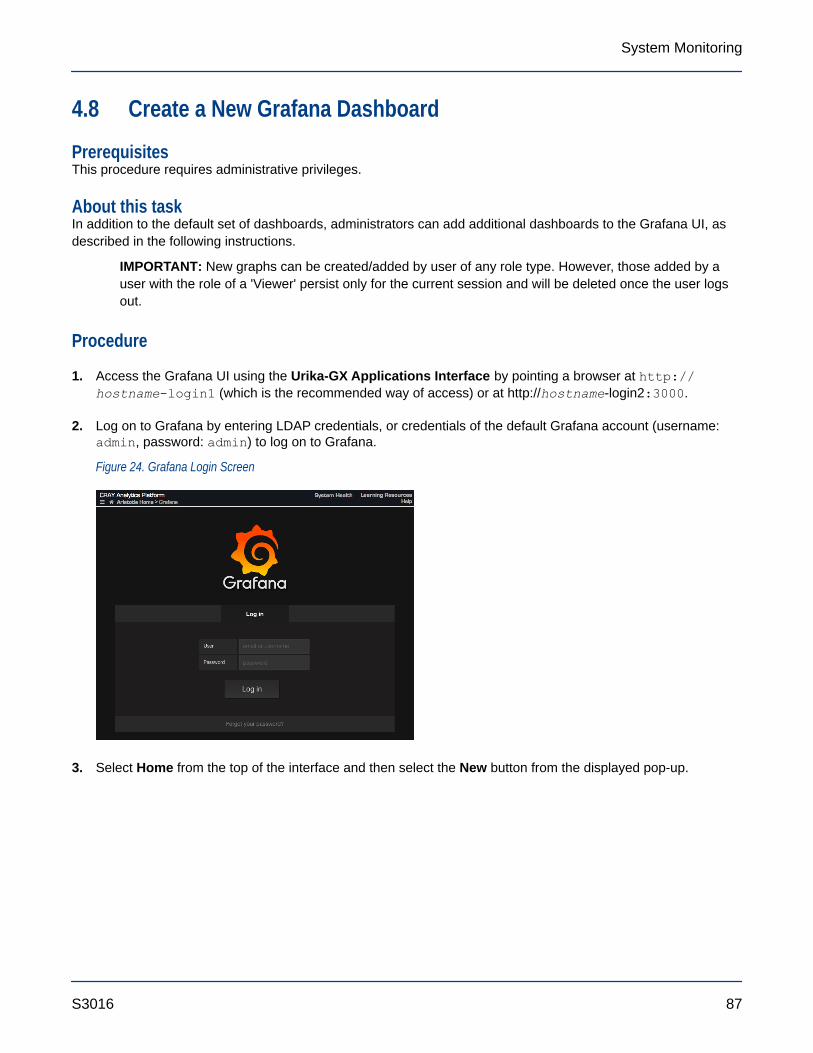
4.8 Create a New Grafana Dashboard
PrerequisitesThis procedure requires administrative privileges.
About this taskIn addition to the default set of dashboards, administrators can add additional dashboards to the Grafana UI, asdescribed in the following instructions.
IMPORTANT: New graphs can be created/added by user of any role type. However, those added by auser with the role of a 'Viewer' persist only for the current session and will be deleted once the user logsout.
Procedure
1. Access the Grafana UI using the Urika-GX Applications Interface by pointing a browser at http://hostname-login1 (which is the recommended way of access) or at http://hostname-login2:3000.
2. Log on to Grafana by entering LDAP credentials, or credentials of the default Grafana account (username:admin, password: admin) to log on to Grafana.
Figure 24. Grafana Login Screen
3. Select Home from the top of the interface and then select the New button from the displayed pop-up.
System Monitoring
S3016 87
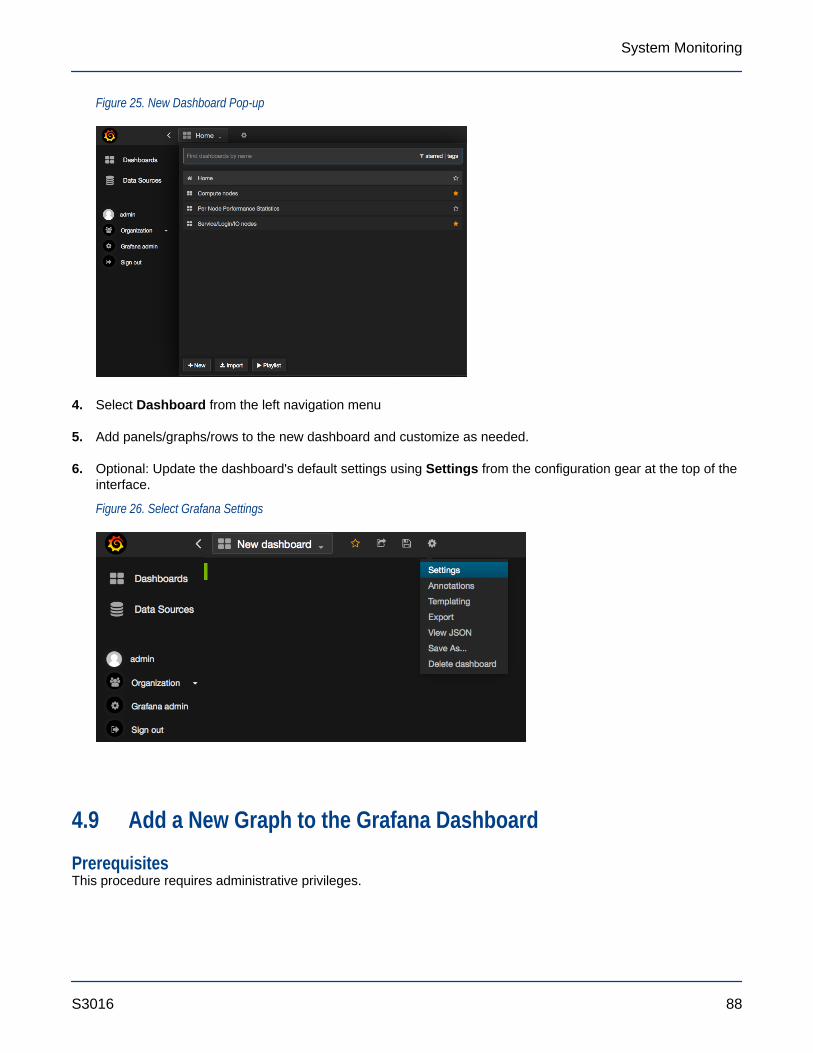
Figure 25. New Dashboard Pop-up
4. Select Dashboard from the left navigation menu
5. Add panels/graphs/rows to the new dashboard and customize as needed.
6. Optional: Update the dashboard's default settings using Settings from the configuration gear at the top of theinterface.
Figure 26. Select Grafana Settings
4.9 Add a New Graph to the Grafana Dashboard
PrerequisitesThis procedure requires administrative privileges.
System Monitoring
S3016 88

About this taskIn addition to the default set of panels, administrators can add additional panels to the Dashboard of the GrafanaUI, as described in the following instructions.
Procedure
1. Access the Grafana UI using the Urika-GX Applications Interface by pointing a browser at http://hostname(which is the recommended method) or at http://hostname:3000.
2. Log on to Grafana by entering LDAP credentials, or credentials of the default Grafana account (username:admin, password: admin) to log on to Grafana.
Figure 27. Grafana Login Screen
3. Select the dashboard that the new graph needs to be added to.
Figure 28. Default Grafana UI on Urika-GX
4. Select Add Panel > graph from the green menu on the left side of the Dashboard.
System Monitoring
S3016 89

Figure 29. Add a New Graph to Grafana Dashboard
5. Click on the title of the new panel and select edit as shown in the following figure:
Figure 30. Edit a Grafana Panel
6. Enter a title for the graph in the Title field of the General tab and optionally specify a span and/or height forthe graph.
7. Specify/select metrics using UI elements.
8. Optional: Click on the Axes & Grid and/or Display Styles tabs for specifying formatting options for the graph.
System Monitoring
S3016 90
4.10 Start InfluxDB Before Hadoop Services
PrerequisitesThis procedure requires root privileges.
About this taskIf the Hadoop Cluster Metrics Grafana dashboard takes too long to populate, it may because the InfluxDBservice was started after Hadoop services. Follow the instructions documented in this procedure to troubleshootthis issue.
Procedure
1. Log on to the SMW as root.
2. Stop YARN.
# urika-stop --service yarn
3. Stop the HDFS services.
# urika-stop --service hdfs
4. Verify that the InfluxDB service is running or start it if it is not already started.
# urika-start --service influxdb
5. Start the HDFS services.
# urika-start --service hdfs
6. Start YARN.
# urika-start --service yarn
7. Refresh the browser to load the Hadoop Clusters Grafana dashboard again.
4.11 Monitor Subrack Attributes
PrerequisitesThis procedure requires root access.
System Monitoring
S3016 91
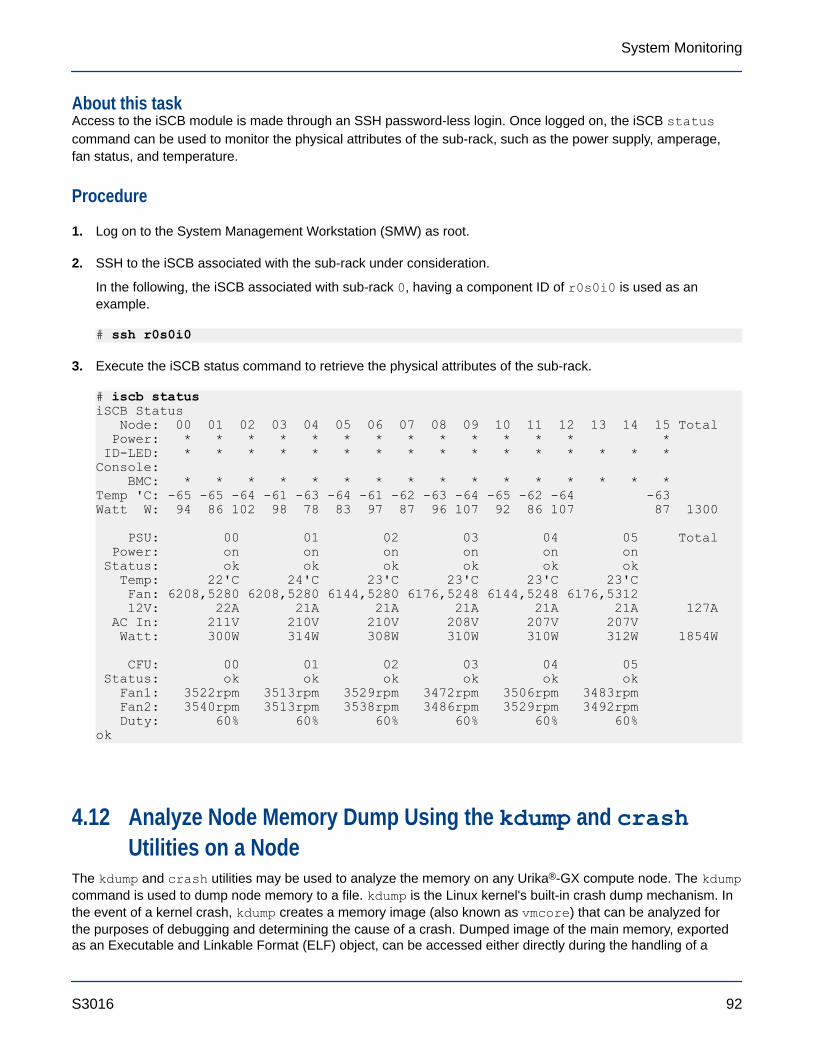
About this taskAccess to the iSCB module is made through an SSH password-less login. Once logged on, the iSCB statuscommand can be used to monitor the physical attributes of the sub-rack, such as the power supply, amperage,fan status, and temperature.
Procedure
1. Log on to the System Management Workstation (SMW) as root.
2. SSH to the iSCB associated with the sub-rack under consideration.
In the following, the iSCB associated with sub-rack 0, having a component ID of r0s0i0 is used as anexample.
# ssh r0s0i0
3. Execute the iSCB status command to retrieve the physical attributes of the sub-rack.
# iscb statusiSCB Status Node: 00 01 02 03 04 05 06 07 08 09 10 11 12 13 14 15 Total Power: * * * * * * * * * * * * * * ID-LED: * * * * * * * * * * * * * * * *Console: BMC: * * * * * * * * * * * * * * * *Temp 'C: -65 -65 -64 -61 -63 -64 -61 -62 -63 -64 -65 -62 -64 -63Watt W: 94 86 102 98 78 83 97 87 96 107 92 86 107 87 1300
PSU: 00 01 02 03 04 05 Total Power: on on on on on on Status: ok ok ok ok ok ok Temp: 22'C 24'C 23'C 23'C 23'C 23'C Fan: 6208,5280 6208,5280 6144,5280 6176,5248 6144,5248 6176,5312 12V: 22A 21A 21A 21A 21A 21A 127A AC In: 211V 210V 210V 208V 207V 207V Watt: 300W 314W 308W 310W 310W 312W 1854W
CFU: 00 01 02 03 04 05 Status: ok ok ok ok ok ok Fan1: 3522rpm 3513rpm 3529rpm 3472rpm 3506rpm 3483rpm Fan2: 3540rpm 3513rpm 3538rpm 3486rpm 3529rpm 3492rpm Duty: 60% 60% 60% 60% 60% 60%ok
4.12 Analyze Node Memory Dump Using the kdump and crashUtilities on a Node
The kdump and crash utilities may be used to analyze the memory on any Urika®-GX compute node. The kdumpcommand is used to dump node memory to a file. kdump is the Linux kernel's built-in crash dump mechanism. Inthe event of a kernel crash, kdump creates a memory image (also known as vmcore) that can be analyzed forthe purposes of debugging and determining the cause of a crash. Dumped image of the main memory, exportedas an Executable and Linkable Format (ELF) object, can be accessed either directly during the handling of a
System Monitoring
S3016 92
kernel crash (through /proc/vmcore), or it can be automatically saved to a locally accessible file system, to araw device, or to a remote system accessible over the network. kdump is configured to automatically generatevmcore crash dumps on node crashes. These dumps can be found on the node in the crash partition, mounted tonid000XX:/mnt/crash/var/crash/datestamp/*, where XX ranges from 00-15 for a rack containing asingle sub-rack, 00-31 for a rack containing 2 sub-racks, and 00-47 for a rack containing 3 sub-racks. Afterkdump completes, the crash utility can be used on the dump file generated by kdump. The xtdumpsys SMWutility can be used to extract vmcores from the cluster and store them on the SMW for crash analysis as well.
NOTE: Cray recommends executing the kdump utility only if a node has panicked or is hung, or if a dumpis requested by Cray.
On the Urika-GX compute nodes, kdump's system facing configuration files are set to have a kdump filestored on a local hard drive partition that is mounted as /mnt/crash so the kernel crash dumps arestore in /mnt/crash/var/crash. Urika-GX has two local HDDs. kdump stores the vmcore collectionson one of these drives. It is advised not to modify the /etc/kdump.conf or /etc/sysconfig/kdumpconfiguration files.
Using kdump● Starting kdump - Log on to the desired node and use the following command to start the kdump utility:
$ service kdump start● Stopping kdump - Log on to the desired node and use the following command to stop the kdump utility:
$ service kdump stop● Checking the status of kdump - Log on to the desired node and use the following command to check the
status of the kdump utility:
$ service kdump status
For more information, see the kdump(8) and crash(8) man pages.
4.13 Use the urika-check-platform Command
PrerequisitesThis procedure requires root access to the System Management Workstation (SMW).
About this taskThe urika-check-platform command can be used to retrieve various pieces of information.
Procedure
1. Log on to the SMW as root.
2. Execute the urika-check-platform command, as shown in the following examples.
● Various HSS checks, Rack controller, dANCs, xtcli status, and xtcablecheck using the --hssoption:
System Monitoring
S3016 93
# urika-check-platform --hss● Get revision info of Rack Controller, iSCBs, dANCs, and Compute Nodes using the --rev option:
# urika-check-platform --rev
If nodes are not listed then revision information is unavailable. Makesure /global/cray/mfg/self_update_fw/intel_fw_chk.sh is installed properly on each node.
● Check if Aries is routed:
# urika-check-platform --aries● Get OpenStack data about each individual node using the --open-stack option:
# urika-check-platform --open-stack● Test node connectivity using the --testnodes option. First perform the ping test. If the nodes can be
pinged, then ssh is attempted. If ssh succeeds then the Aries IP is resolved and displayed next to thehostname with the subnet mask:
# urika-check-platform --testnodes● Display all of the aforementioned sections together by executing the command without any options:
# urika-check-platformFor more information, see the urika-check-platform man page.
System Monitoring
S3016 94
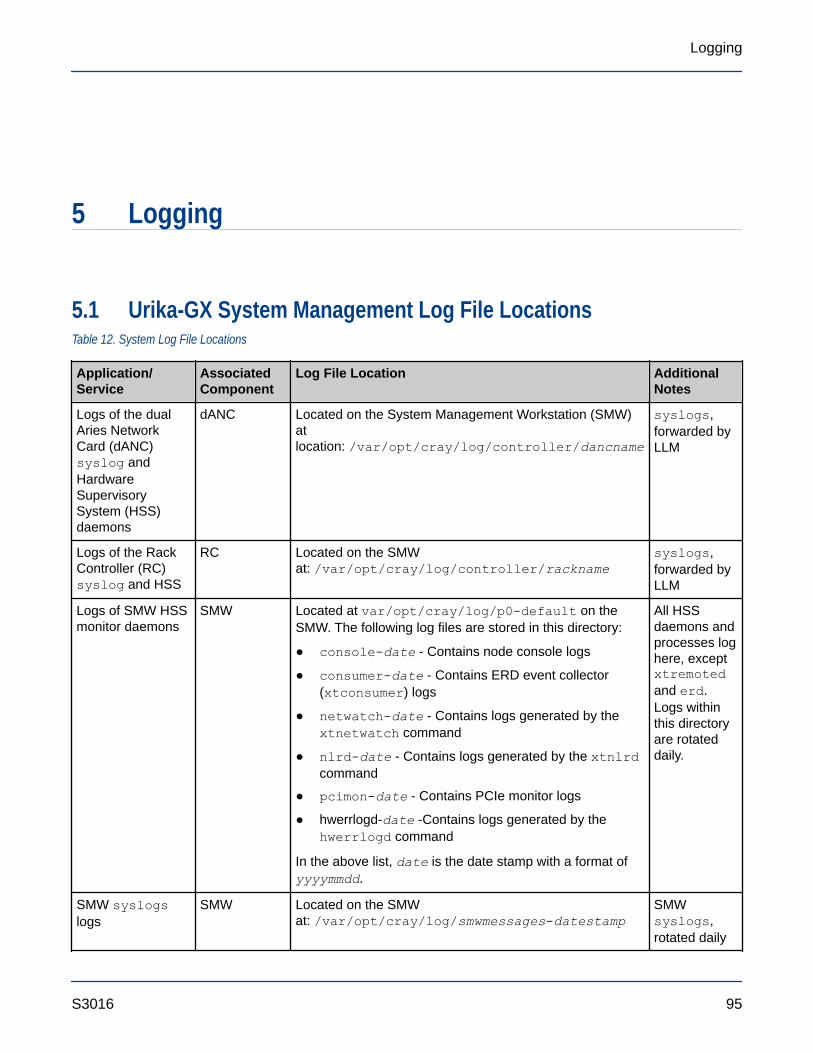
5 Logging
5.1 Urika-GX System Management Log File LocationsTable 12. System Log File Locations
Application/Service
AssociatedComponent
Log File Location AdditionalNotes
Logs of the dualAries NetworkCard (dANC)syslog andHardwareSupervisorySystem (HSS)daemons
dANC Located on the System Management Workstation (SMW)atlocation: /var/opt/cray/log/controller/dancname
syslogs,forwarded byLLM
Logs of the RackController (RC)syslog and HSS
RC Located on the SMWat: /var/opt/cray/log/controller/rackname
syslogs,forwarded byLLM
Logs of SMW HSSmonitor daemons
SMW Located at var/opt/cray/log/p0-default on theSMW. The following log files are stored in this directory:
● console-date - Contains node console logs
● consumer-date - Contains ERD event collector(xtconsumer) logs
● netwatch-date - Contains logs generated by thextnetwatch command
● nlrd-date - Contains logs generated by the xtnlrdcommand
● pcimon-date - Contains PCIe monitor logs
● hwerrlogd-date -Contains logs generated by thehwerrlogd command
In the above list, date is the date stamp with a format ofyyyymmdd.
All HSSdaemons andprocesses loghere, exceptxtremotedand erd. Logs withinthis directoryare rotateddaily.
SMW syslogslogs
SMW Located on the SMWat: /var/opt/cray/log/smwmessages-datestamp
SMWsyslogs,rotated daily
Logging
S3016 95
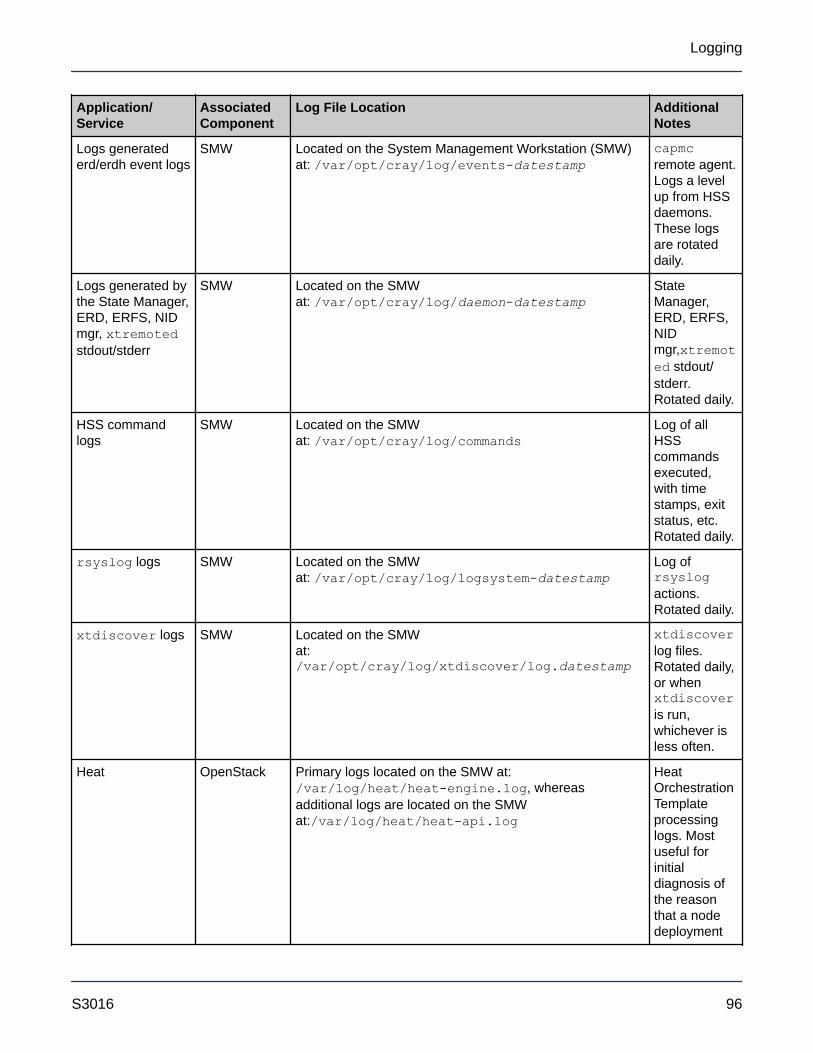
Application/Service
AssociatedComponent
Log File Location AdditionalNotes
Logs generatederd/erdh event logs
SMW Located on the System Management Workstation (SMW)at: /var/opt/cray/log/events-datestamp
capmcremote agent.Logs a levelup from HSSdaemons.These logsare rotateddaily.
Logs generated bythe State Manager,ERD, ERFS, NIDmgr, xtremotedstdout/stderr
SMW Located on the SMWat: /var/opt/cray/log/daemon-datestamp
StateManager,ERD, ERFS,NIDmgr,xtremoted stdout/stderr. Rotated daily.
HSS commandlogs
SMW Located on the SMWat: /var/opt/cray/log/commands
Log of allHSScommandsexecuted,with timestamps, exitstatus, etc. Rotated daily.
rsyslog logs SMW Located on the SMWat: /var/opt/cray/log/logsystem-datestamp
Log ofrsyslogactions. Rotated daily.
xtdiscover logs SMW Located on the SMWat:/var/opt/cray/log/xtdiscover/log.datestamp
xtdiscoverlog files. Rotated daily,or whenxtdiscoveris run,whichever isless often.
Heat OpenStack Primary logs located on the SMW at:/var/log/heat/heat-engine.log, whereasadditional logs are located on the SMWat:/var/log/heat/heat-api.log
HeatOrchestrationTemplateprocessinglogs. Mostuseful forinitialdiagnosis ofthe reasonthat a nodedeployment
Logging
S3016 96
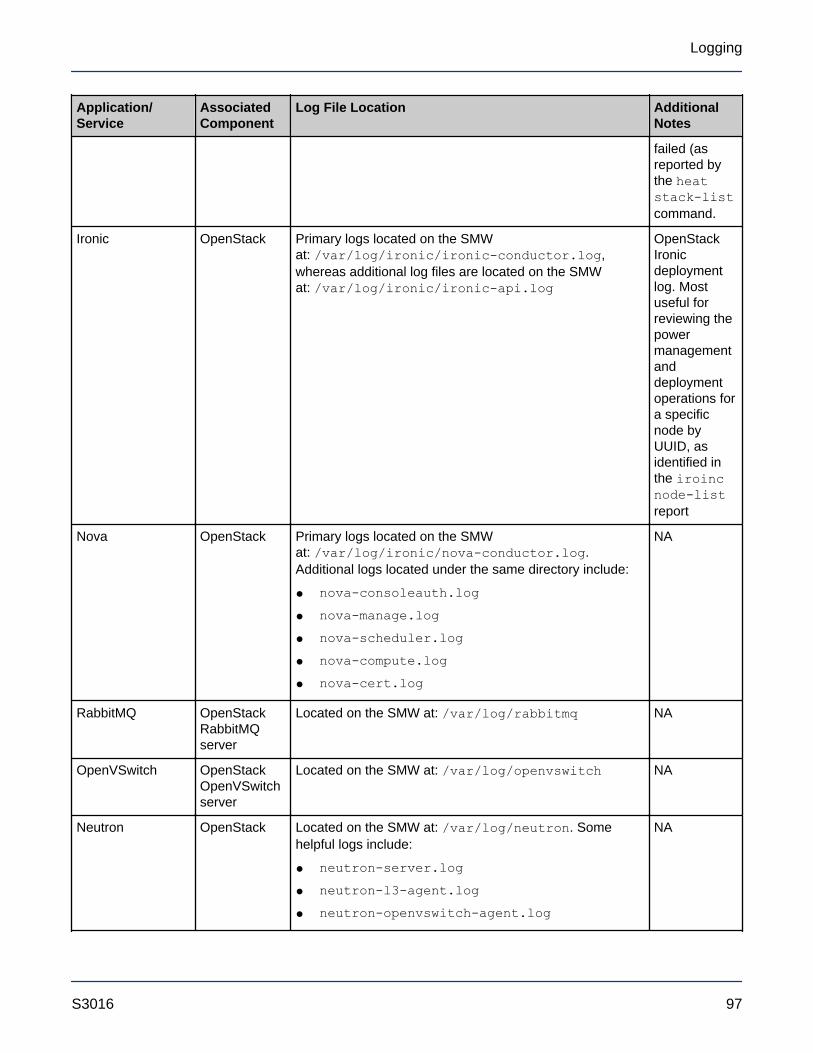
Application/Service
AssociatedComponent
Log File Location AdditionalNotes
failed (asreported bythe heatstack-listcommand.
Ironic OpenStack Primary logs located on the SMWat: /var/log/ironic/ironic-conductor.log,whereas additional log files are located on the SMWat: /var/log/ironic/ironic-api.log
OpenStackIronicdeploymentlog. Mostuseful forreviewing thepowermanagementanddeploymentoperations fora specificnode byUUID, asidentified inthe iroincnode-listreport
Nova OpenStack Primary logs located on the SMWat: /var/log/ironic/nova-conductor.log.Additional logs located under the same directory include:
● nova-consoleauth.log● nova-manage.log● nova-scheduler.log● nova-compute.log● nova-cert.log
NA
RabbitMQ OpenStackRabbitMQserver
Located on the SMW at: /var/log/rabbitmq NA
OpenVSwitch OpenStackOpenVSwitchserver
Located on the SMW at: /var/log/openvswitch NA
Neutron OpenStack Located on the SMW at: /var/log/neutron. Somehelpful logs include:
● neutron-server.log● neutron-l3-agent.log● neutron-openvswitch-agent.log
NA
Logging
S3016 97
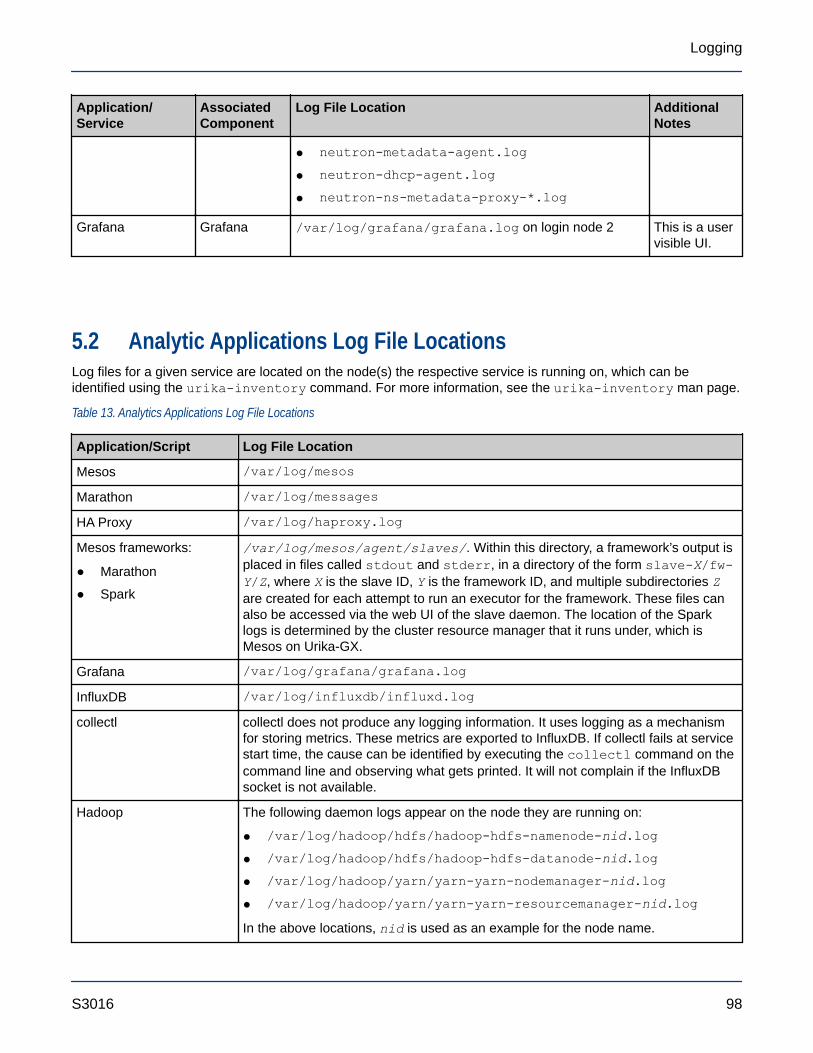
Application/Service
AssociatedComponent
Log File Location AdditionalNotes
● neutron-metadata-agent.log● neutron-dhcp-agent.log● neutron-ns-metadata-proxy-*.log
Grafana Grafana /var/log/grafana/grafana.log on login node 2 This is a uservisible UI.
5.2 Analytic Applications Log File LocationsLog files for a given service are located on the node(s) the respective service is running on, which can beidentified using the urika-inventory command. For more information, see the urika-inventory man page.
Table 13. Analytics Applications Log File Locations
Application/Script Log File Location
Mesos /var/log/mesos
Marathon /var/log/messages
HA Proxy /var/log/haproxy.log
Mesos frameworks:
● Marathon
● Spark
/var/log/mesos/agent/slaves/. Within this directory, a framework’s output isplaced in files called stdout and stderr, in a directory of the form slave-X/fw-Y/Z, where X is the slave ID, Y is the framework ID, and multiple subdirectories Zare created for each attempt to run an executor for the framework. These files canalso be accessed via the web UI of the slave daemon. The location of the Sparklogs is determined by the cluster resource manager that it runs under, which isMesos on Urika-GX.
Grafana /var/log/grafana/grafana.log
InfluxDB /var/log/influxdb/influxd.log
collectl collectl does not produce any logging information. It uses logging as a mechanismfor storing metrics. These metrics are exported to InfluxDB. If collectl fails at servicestart time, the cause can be identified by executing the collectl command on thecommand line and observing what gets printed. It will not complain if the InfluxDBsocket is not available.
Hadoop The following daemon logs appear on the node they are running on:
● /var/log/hadoop/hdfs/hadoop-hdfs-namenode-nid.log● /var/log/hadoop/hdfs/hadoop-hdfs-datanode-nid.log● /var/log/hadoop/yarn/yarn-yarn-nodemanager-nid.log● /var/log/hadoop/yarn/yarn-yarn-resourcemanager-nid.log
In the above locations, nid is used as an example for the node name.
Logging
S3016 98
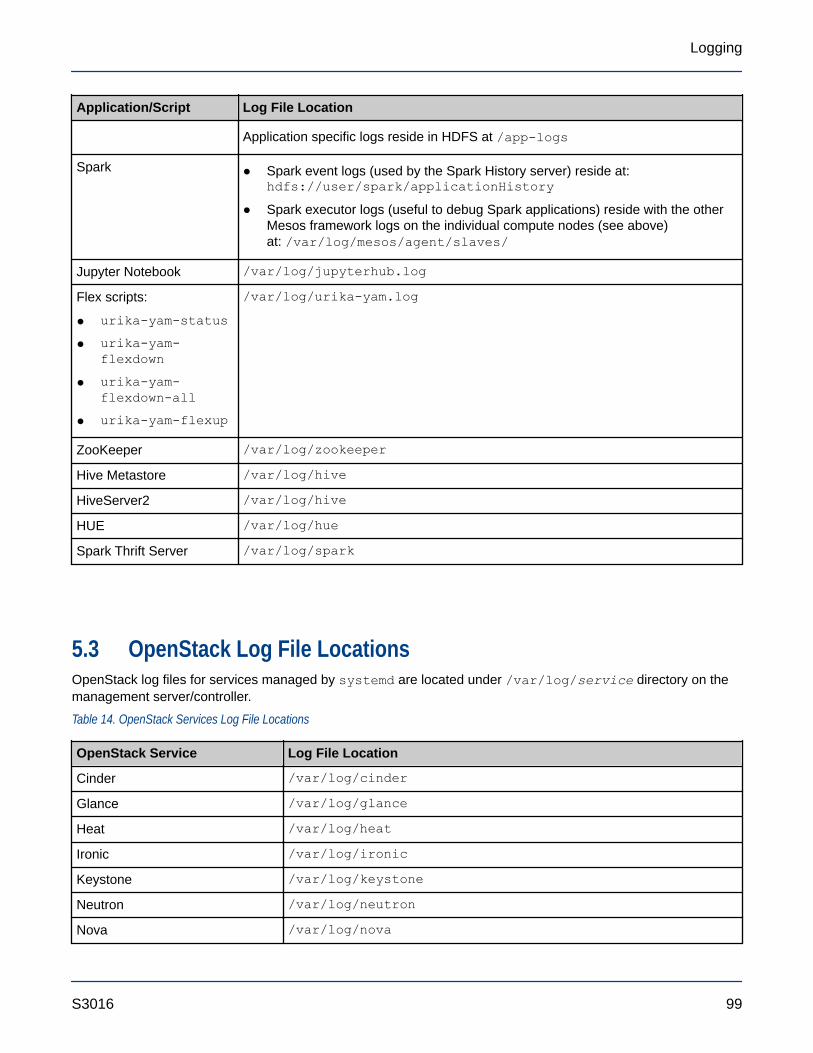
Application/Script Log File Location
Application specific logs reside in HDFS at /app-logs
Spark ● Spark event logs (used by the Spark History server) reside at:hdfs://user/spark/applicationHistory
● Spark executor logs (useful to debug Spark applications) reside with the otherMesos framework logs on the individual compute nodes (see above)at: /var/log/mesos/agent/slaves/
Jupyter Notebook /var/log/jupyterhub.log
Flex scripts:
● urika-yam-status● urika-yam-
flexdown● urika-yam-
flexdown-all● urika-yam-flexup
/var/log/urika-yam.log
ZooKeeper /var/log/zookeeper
Hive Metastore /var/log/hive
HiveServer2 /var/log/hive
HUE /var/log/hue
Spark Thrift Server /var/log/spark
5.3 OpenStack Log File LocationsOpenStack log files for services managed by systemd are located under /var/log/service directory on themanagement server/controller.
Table 14. OpenStack Services Log File Locations
OpenStack Service Log File Location
Cinder /var/log/cinder
Glance /var/log/glance
Heat /var/log/heat
Ironic /var/log/ironic
Keystone /var/log/keystone
Neutron /var/log/neutron
Nova /var/log/nova
Logging
S3016 99
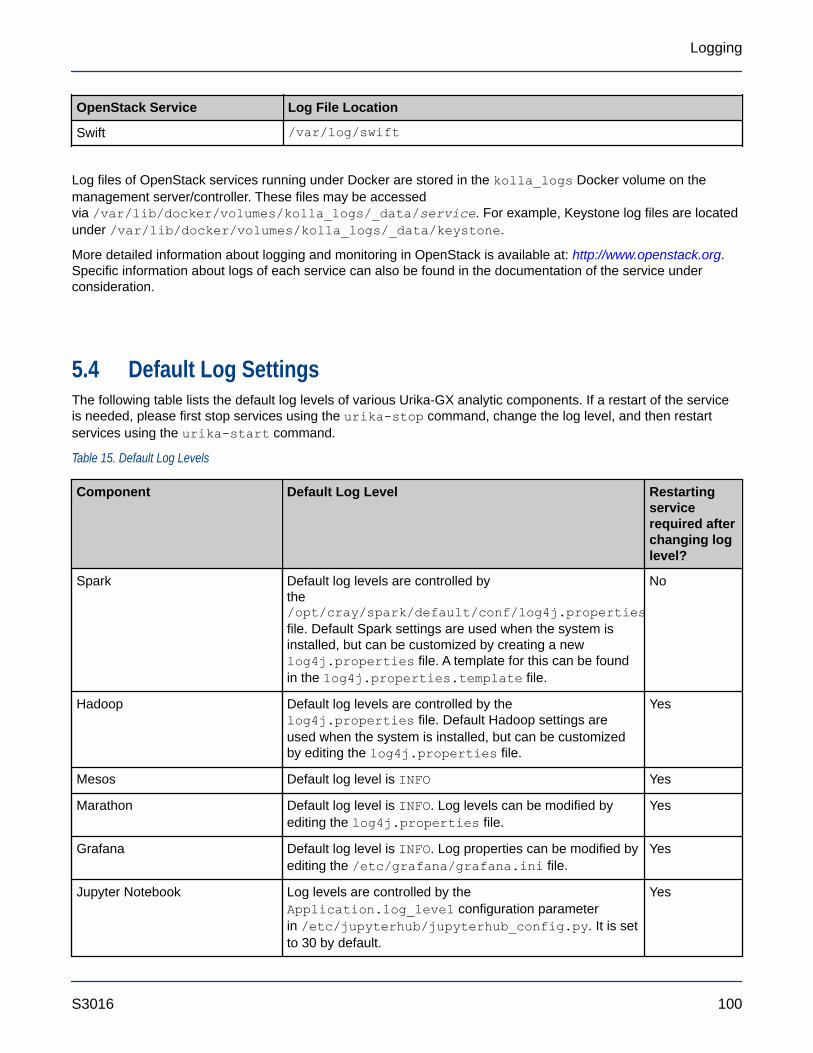
OpenStack Service Log File Location
Swift /var/log/swift
Log files of OpenStack services running under Docker are stored in the kolla_logs Docker volume on themanagement server/controller. These files may be accessedvia /var/lib/docker/volumes/kolla_logs/_data/service. For example, Keystone log files are locatedunder /var/lib/docker/volumes/kolla_logs/_data/keystone.
More detailed information about logging and monitoring in OpenStack is available at: http://www.openstack.org.Specific information about logs of each service can also be found in the documentation of the service underconsideration.
5.4 Default Log SettingsThe following table lists the default log levels of various Urika-GX analytic components. If a restart of the serviceis needed, please first stop services using the urika-stop command, change the log level, and then restartservices using the urika-start command.
Table 15. Default Log Levels
Component Default Log Level Restartingservicerequired afterchanging loglevel?
Spark Default log levels are controlled bythe/opt/cray/spark/default/conf/log4j.propertiesfile. Default Spark settings are used when the system isinstalled, but can be customized by creating a newlog4j.properties file. A template for this can be foundin the log4j.properties.template file.
No
Hadoop Default log levels are controlled by thelog4j.properties file. Default Hadoop settings areused when the system is installed, but can be customizedby editing the log4j.properties file.
Yes
Mesos Default log level is INFO Yes
Marathon Default log level is INFO. Log levels can be modified byediting the log4j.properties file.
Yes
Grafana Default log level is INFO. Log properties can be modified byediting the /etc/grafana/grafana.ini file.
Yes
Jupyter Notebook Log levels are controlled by theApplication.log_level configuration parameterin /etc/jupyterhub/jupyterhub_config.py. It is setto 30 by default.
Yes
Logging
S3016 100
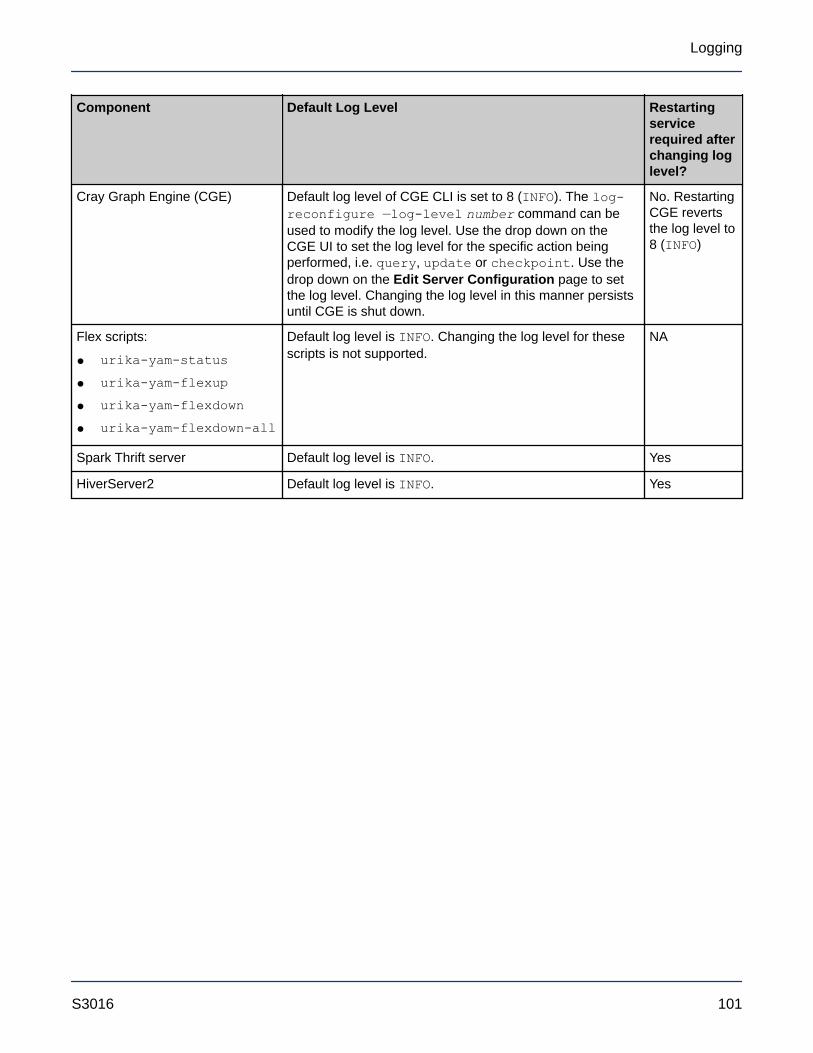
Component Default Log Level Restartingservicerequired afterchanging loglevel?
Cray Graph Engine (CGE) Default log level of CGE CLI is set to 8 (INFO). The log-reconfigure —log-level number command can beused to modify the log level. Use the drop down on theCGE UI to set the log level for the specific action beingperformed, i.e. query, update or checkpoint. Use thedrop down on the Edit Server Configuration page to setthe log level. Changing the log level in this manner persistsuntil CGE is shut down.
No. RestartingCGE revertsthe log level to8 (INFO)
Flex scripts:
● urika-yam-status● urika-yam-flexup● urika-yam-flexdown● urika-yam-flexdown-all
Default log level is INFO. Changing the log level for thesescripts is not supported.
NA
Spark Thrift server Default log level is INFO. Yes
HiverServer2 Default log level is INFO. Yes
Logging
S3016 101
6 Resource Management
6.1 Manage Resources on Urika-GXThe resource management model of Mesos is different from traditional HPC schedulers. With traditional HPCschedulers, jobs request resources and the scheduler decides when to schedule and execute the job. Mesos onthe other hand offers resources to frameworks that are registered with it. It is up to the framework scheduler todecide whether to accept or reject its resources. If framework rejects the offer, Mesos will continue to make newoffers based on resource availability. Framework refers to implementation of different computing paradigms suchas Spark, Hadoop, CGE etc.
For example, a user submits a spark job that requests 1000 cores to run. Spark registers as a framework withMesos. Mesos offers its available resources to Spark. If Mesos offers 800 cores, Spark will either choose toaccept the resources or reject it. If Spark accepts the resource offer, the job will be scheduled on the cluster. If itrejects the offer, Mesos will continue to make new offers.
Mesos Frameworks on Urika-GXWhen users submit jobs to a Mesos cluster, frameworks register with Mesos. Mesos offers resources to registeredframeworks. Frameworks can either choose to accept or reject the resource offer from Mesos. If the resourceoffer satisfies the resource requirements for a job, they accept the resources and schedule the jobs on the slaves.If the resource offer does not satisfy the resource requirements, frameworks can reject them. Frameworks will stillbe registered with Mesos. Mesos will update the resources it has at regular intervals (when an existing frameworkfinishes running its job and releases the resources or when some other frameworks reject the resources) andcontinues to offer the resources to registered frameworks.
Each spark job is registered as a separate framework with Mesos. For each spark job that has been submitted,Mesos makes separate resource offers.
Marathon is registered as a single framework with Mesos. Marathon provides a mechanism to launch non-framework applications to run under Mesos. Marathon enables long-running services under Mesos such asdatabases, streaming engines etc. Cray has developed:
● the mrun command, which sets up resources for CGE
● scripts for setting up resources for YARN
These are submitted as applications to Marathon. Marathon negotiates for resources from Mesos and they getresources from Marathon.
Mesos tracks the frameworks that have registered with it. If jobs are submitted and there are no resourcesavailable, frameworks will not be dropped. Instead, frameworks will remain registered (unless manually killed bythe user) and will continue to receive updated resource offers from Mesos at regular intervals. As an example,consider a scenario where there are four Spark jobs running and using all of the resources on the cluster. A user
Resource Management
S3016 102
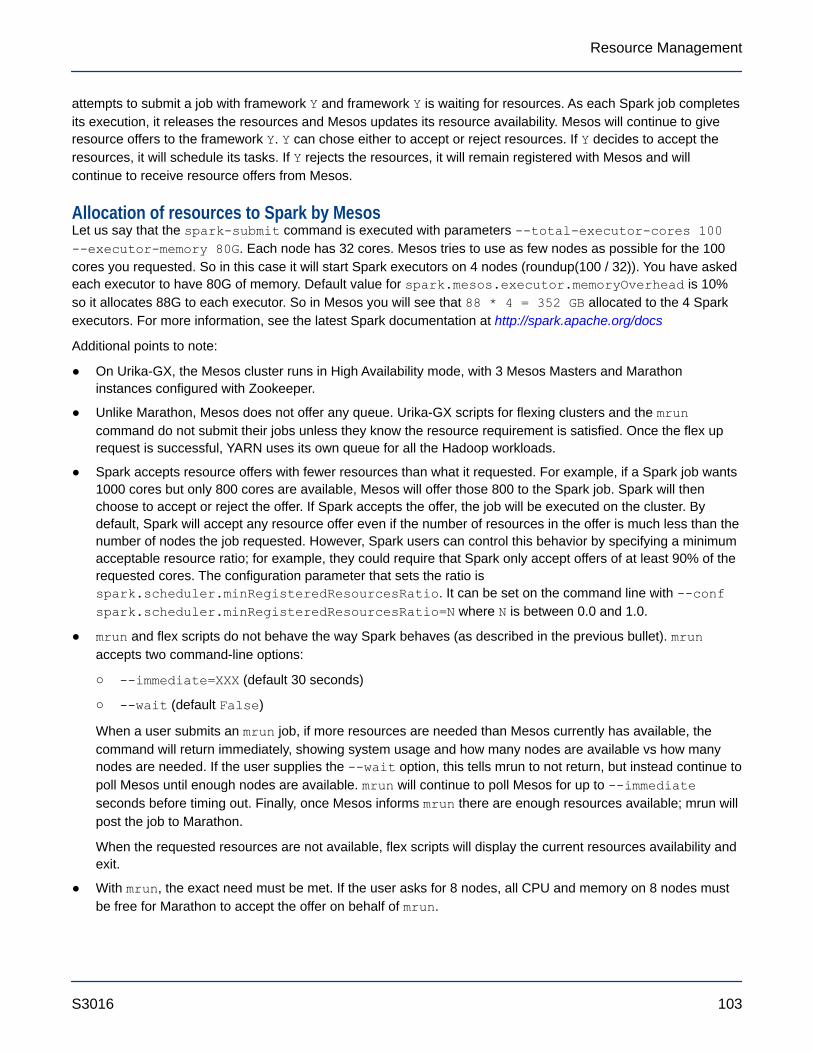
attempts to submit a job with framework Y and framework Y is waiting for resources. As each Spark job completesits execution, it releases the resources and Mesos updates its resource availability. Mesos will continue to giveresource offers to the framework Y. Y can chose either to accept or reject resources. If Y decides to accept theresources, it will schedule its tasks. If Y rejects the resources, it will remain registered with Mesos and willcontinue to receive resource offers from Mesos.
Allocation of resources to Spark by MesosLet us say that the spark-submit command is executed with parameters --total-executor-cores 100--executor-memory 80G. Each node has 32 cores. Mesos tries to use as few nodes as possible for the 100cores you requested. So in this case it will start Spark executors on 4 nodes (roundup(100 / 32)). You have askedeach executor to have 80G of memory. Default value for spark.mesos.executor.memoryOverhead is 10%so it allocates 88G to each executor. So in Mesos you will see that 88 * 4 = 352 GB allocated to the 4 Sparkexecutors. For more information, see the latest Spark documentation at http://spark.apache.org/docs
Additional points to note:
● On Urika-GX, the Mesos cluster runs in High Availability mode, with 3 Mesos Masters and Marathoninstances configured with Zookeeper.
● Unlike Marathon, Mesos does not offer any queue. Urika-GX scripts for flexing clusters and the mruncommand do not submit their jobs unless they know the resource requirement is satisfied. Once the flex uprequest is successful, YARN uses its own queue for all the Hadoop workloads.
● Spark accepts resource offers with fewer resources than what it requested. For example, if a Spark job wants1000 cores but only 800 cores are available, Mesos will offer those 800 to the Spark job. Spark will thenchoose to accept or reject the offer. If Spark accepts the offer, the job will be executed on the cluster. Bydefault, Spark will accept any resource offer even if the number of resources in the offer is much less than thenumber of nodes the job requested. However, Spark users can control this behavior by specifying a minimumacceptable resource ratio; for example, they could require that Spark only accept offers of at least 90% of therequested cores. The configuration parameter that sets the ratio isspark.scheduler.minRegisteredResourcesRatio. It can be set on the command line with --confspark.scheduler.minRegisteredResourcesRatio=N where N is between 0.0 and 1.0.
● mrun and flex scripts do not behave the way Spark behaves (as described in the previous bullet). mrunaccepts two command-line options:
○ --immediate=XXX (default 30 seconds)
○ --wait (default False)
When a user submits an mrun job, if more resources are needed than Mesos currently has available, thecommand will return immediately, showing system usage and how many nodes are available vs how manynodes are needed. If the user supplies the --wait option, this tells mrun to not return, but instead continue topoll Mesos until enough nodes are available. mrun will continue to poll Mesos for up to --immediateseconds before timing out. Finally, once Mesos informs mrun there are enough resources available; mrun willpost the job to Marathon.
When the requested resources are not available, flex scripts will display the current resources availability andexit.
● With mrun, the exact need must be met. If the user asks for 8 nodes, all CPU and memory on 8 nodes mustbe free for Marathon to accept the offer on behalf of mrun.
Resource Management
S3016 103
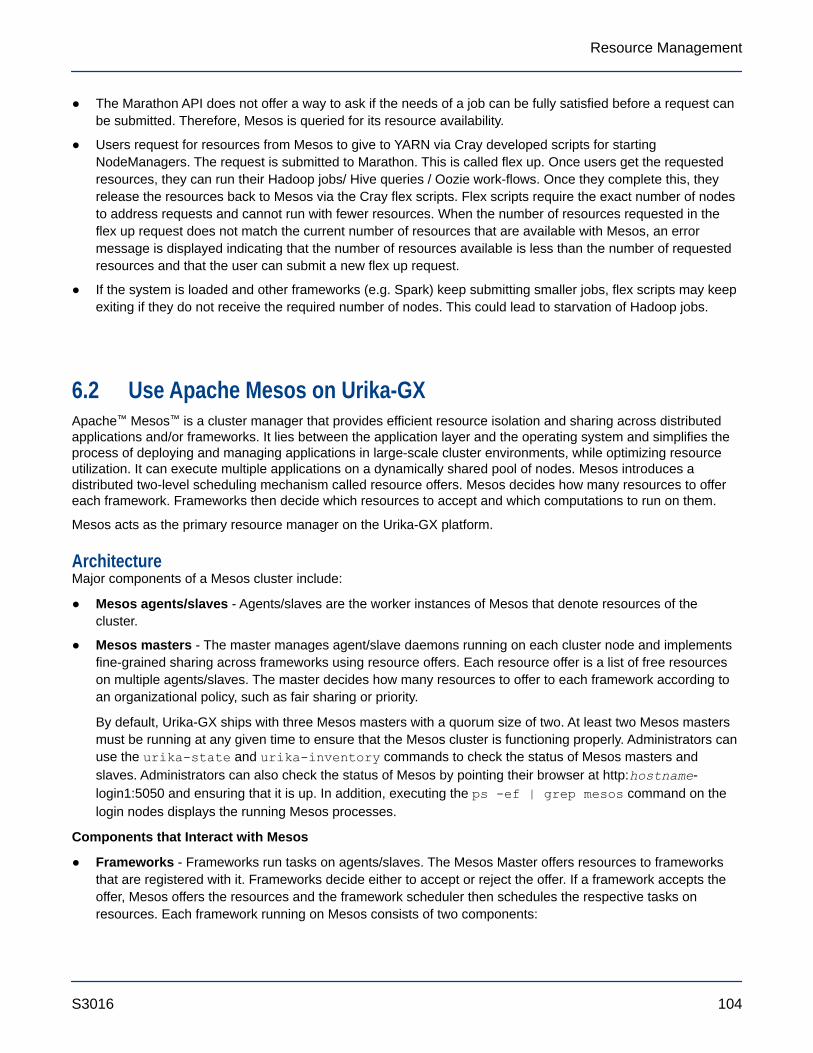
● The Marathon API does not offer a way to ask if the needs of a job can be fully satisfied before a request canbe submitted. Therefore, Mesos is queried for its resource availability.
● Users request for resources from Mesos to give to YARN via Cray developed scripts for startingNodeManagers. The request is submitted to Marathon. This is called flex up. Once users get the requestedresources, they can run their Hadoop jobs/ Hive queries / Oozie work-flows. Once they complete this, theyrelease the resources back to Mesos via the Cray flex scripts. Flex scripts require the exact number of nodesto address requests and cannot run with fewer resources. When the number of resources requested in theflex up request does not match the current number of resources that are available with Mesos, an errormessage is displayed indicating that the number of resources available is less than the number of requestedresources and that the user can submit a new flex up request.
● If the system is loaded and other frameworks (e.g. Spark) keep submitting smaller jobs, flex scripts may keepexiting if they do not receive the required number of nodes. This could lead to starvation of Hadoop jobs.
6.2 Use Apache Mesos on Urika-GXApache™ Mesos™ is a cluster manager that provides efficient resource isolation and sharing across distributedapplications and/or frameworks. It lies between the application layer and the operating system and simplifies theprocess of deploying and managing applications in large-scale cluster environments, while optimizing resourceutilization. It can execute multiple applications on a dynamically shared pool of nodes. Mesos introduces adistributed two-level scheduling mechanism called resource offers. Mesos decides how many resources to offereach framework. Frameworks then decide which resources to accept and which computations to run on them.
Mesos acts as the primary resource manager on the Urika-GX platform.
ArchitectureMajor components of a Mesos cluster include:
● Mesos agents/slaves - Agents/slaves are the worker instances of Mesos that denote resources of thecluster.
● Mesos masters - The master manages agent/slave daemons running on each cluster node and implementsfine-grained sharing across frameworks using resource offers. Each resource offer is a list of free resourceson multiple agents/slaves. The master decides how many resources to offer to each framework according toan organizational policy, such as fair sharing or priority.
By default, Urika-GX ships with three Mesos masters with a quorum size of two. At least two Mesos mastersmust be running at any given time to ensure that the Mesos cluster is functioning properly. Administrators canuse the urika-state and urika-inventory commands to check the status of Mesos masters andslaves. Administrators can also check the status of Mesos by pointing their browser at http:hostname-login1:5050 and ensuring that it is up. In addition, executing the ps -ef | grep mesos command on thelogin nodes displays the running Mesos processes.
Components that Interact with Mesos
● Frameworks - Frameworks run tasks on agents/slaves. The Mesos Master offers resources to frameworksthat are registered with it. Frameworks decide either to accept or reject the offer. If a framework accepts theoffer, Mesos offers the resources and the framework scheduler then schedules the respective tasks onresources. Each framework running on Mesos consists of two components:
Resource Management
S3016 104
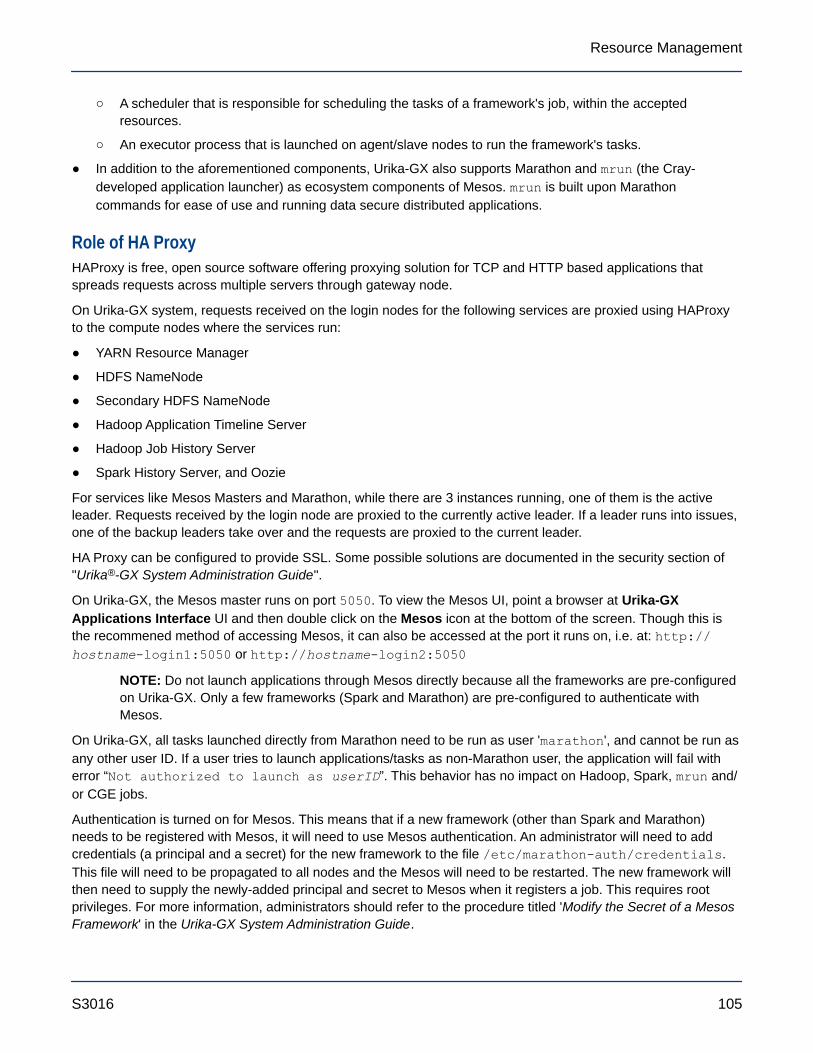
○ A scheduler that is responsible for scheduling the tasks of a framework's job, within the acceptedresources.
○ An executor process that is launched on agent/slave nodes to run the framework's tasks.
● In addition to the aforementioned components, Urika-GX also supports Marathon and mrun (the Cray-developed application launcher) as ecosystem components of Mesos. mrun is built upon Marathoncommands for ease of use and running data secure distributed applications.
Role of HA ProxyHAProxy is free, open source software offering proxying solution for TCP and HTTP based applications thatspreads requests across multiple servers through gateway node.
On Urika-GX system, requests received on the login nodes for the following services are proxied using HAProxyto the compute nodes where the services run:
● YARN Resource Manager
● HDFS NameNode
● Secondary HDFS NameNode
● Hadoop Application Timeline Server
● Hadoop Job History Server
● Spark History Server, and Oozie
For services like Mesos Masters and Marathon, while there are 3 instances running, one of them is the activeleader. Requests received by the login node are proxied to the currently active leader. If a leader runs into issues,one of the backup leaders take over and the requests are proxied to the current leader.
HA Proxy can be configured to provide SSL. Some possible solutions are documented in the security section of"Urika®-GX System Administration Guide".
On Urika-GX, the Mesos master runs on port 5050. To view the Mesos UI, point a browser at Urika-GXApplications Interface UI and then double click on the Mesos icon at the bottom of the screen. Though this isthe recommened method of accessing Mesos, it can also be accessed at the port it runs on, i.e. at: http://hostname-login1:5050 or http://hostname-login2:5050
NOTE: Do not launch applications through Mesos directly because all the frameworks are pre-configuredon Urika-GX. Only a few frameworks (Spark and Marathon) are pre-configured to authenticate withMesos.
On Urika-GX, all tasks launched directly from Marathon need to be run as user 'marathon', and cannot be run asany other user ID. If a user tries to launch applications/tasks as non-Marathon user, the application will fail witherror “Not authorized to launch as userID”. This behavior has no impact on Hadoop, Spark, mrun and/or CGE jobs.
Authentication is turned on for Mesos. This means that if a new framework (other than Spark and Marathon)needs to be registered with Mesos, it will need to use Mesos authentication. An administrator will need to addcredentials (a principal and a secret) for the new framework to the file /etc/marathon-auth/credentials.This file will need to be propagated to all nodes and the Mesos will need to be restarted. The new framework willthen need to supply the newly-added principal and secret to Mesos when it registers a job. This requires rootprivileges. For more information, administrators should refer to the procedure titled 'Modify the Secret of a MesosFramework' in the Urika-GX System Administration Guide.
Resource Management
S3016 105

Figure 31. Select Hadoop Resource Manager from the Urika-GX Applications Interface UI
The Mesos UI is displayed in the following figure:
Figure 32. Apache Mesos UI
Resource Management
S3016 106
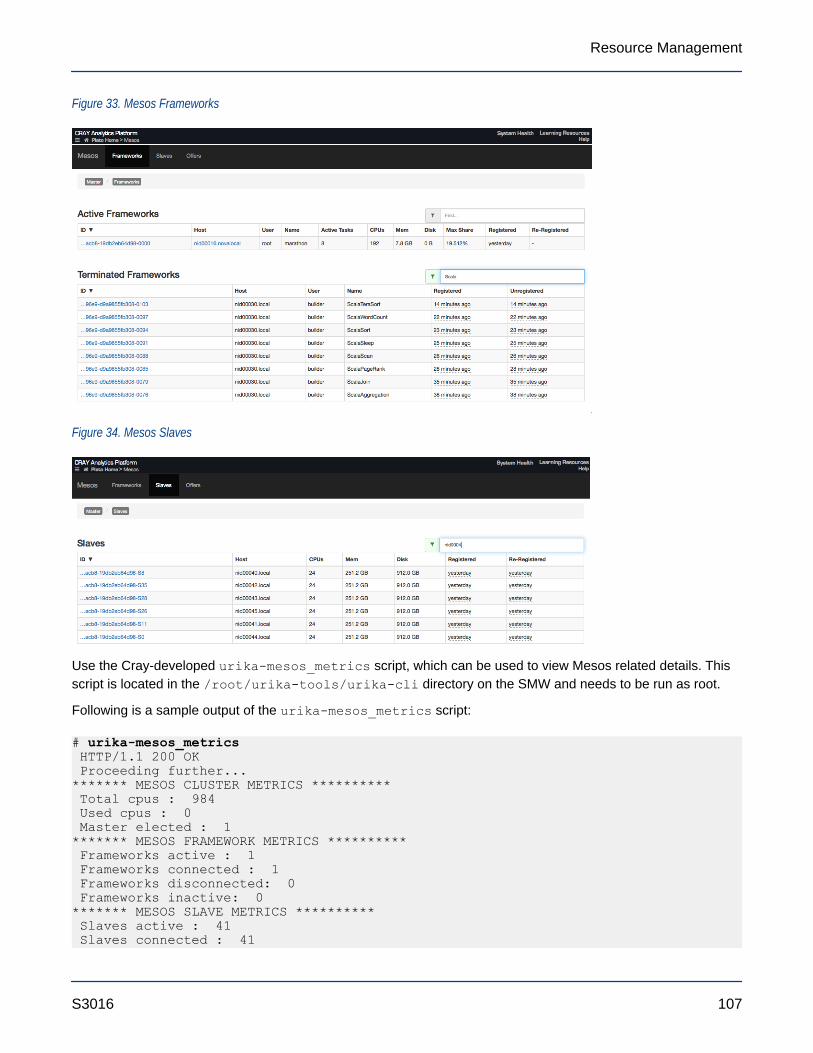
Figure 33. Mesos Frameworks
Figure 34. Mesos Slaves
Use the Cray-developed urika-mesos_metrics script, which can be used to view Mesos related details. Thisscript is located in the /root/urika-tools/urika-cli directory on the SMW and needs to be run as root.
Following is a sample output of the urika-mesos_metrics script:
# urika-mesos_metrics HTTP/1.1 200 OK Proceeding further...******* MESOS CLUSTER METRICS ********** Total cpus : 984 Used cpus : 0 Master elected : 1******* MESOS FRAMEWORK METRICS ********** Frameworks active : 1 Frameworks connected : 1 Frameworks disconnected: 0 Frameworks inactive: 0******* MESOS SLAVE METRICS ********** Slaves active : 41 Slaves connected : 41
Resource Management
S3016 107
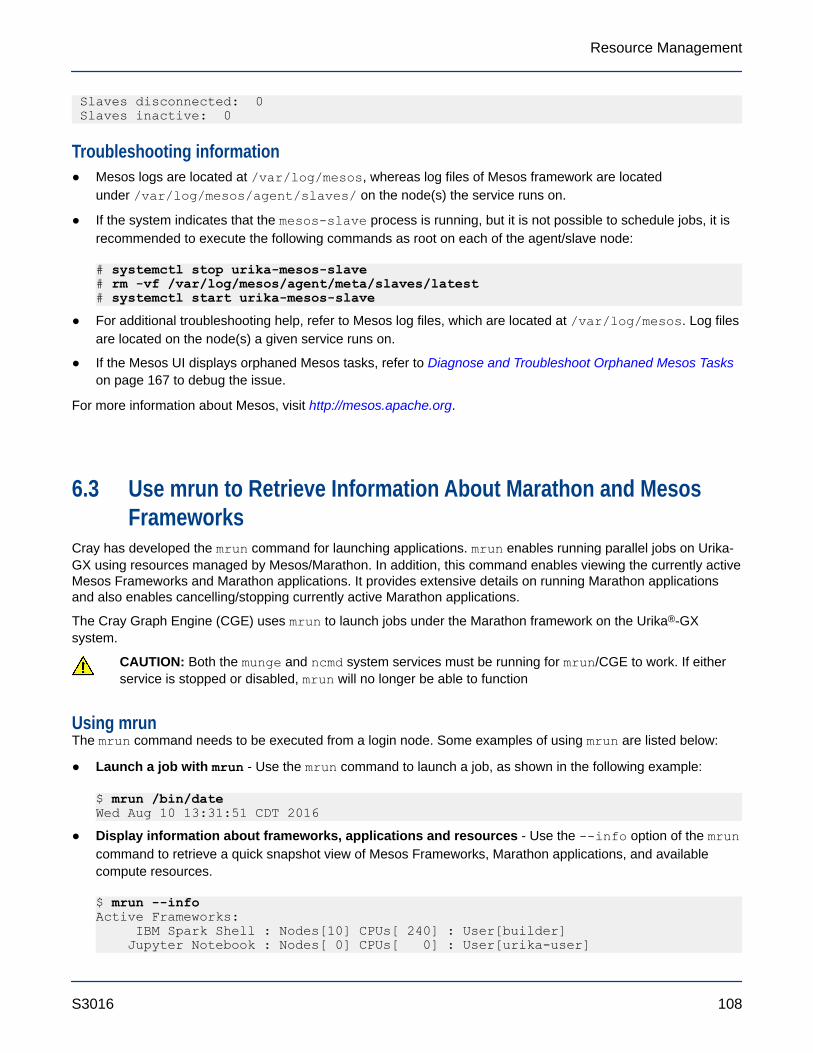
Slaves disconnected: 0 Slaves inactive: 0
Troubleshooting information● Mesos logs are located at /var/log/mesos, whereas log files of Mesos framework are located
under /var/log/mesos/agent/slaves/ on the node(s) the service runs on.
● If the system indicates that the mesos-slave process is running, but it is not possible to schedule jobs, it isrecommended to execute the following commands as root on each of the agent/slave node:
# systemctl stop urika-mesos-slave# rm -vf /var/log/mesos/agent/meta/slaves/latest# systemctl start urika-mesos-slave
● For additional troubleshooting help, refer to Mesos log files, which are located at /var/log/mesos. Log filesare located on the node(s) a given service runs on.
● If the Mesos UI displays orphaned Mesos tasks, refer to Diagnose and Troubleshoot Orphaned Mesos Taskson page 167 to debug the issue.
For more information about Mesos, visit http://mesos.apache.org.
6.3 Use mrun to Retrieve Information About Marathon and MesosFrameworks
Cray has developed the mrun command for launching applications. mrun enables running parallel jobs on Urika-GX using resources managed by Mesos/Marathon. In addition, this command enables viewing the currently activeMesos Frameworks and Marathon applications. It provides extensive details on running Marathon applicationsand also enables cancelling/stopping currently active Marathon applications.
The Cray Graph Engine (CGE) uses mrun to launch jobs under the Marathon framework on the Urika®-GXsystem.
CAUTION: Both the munge and ncmd system services must be running for mrun/CGE to work. If eitherservice is stopped or disabled, mrun will no longer be able to function
Using mrunThe mrun command needs to be executed from a login node. Some examples of using mrun are listed below:
● Launch a job with mrun - Use the mrun command to launch a job, as shown in the following example:
$ mrun /bin/dateWed Aug 10 13:31:51 CDT 2016
● Display information about frameworks, applications and resources - Use the --info option of the mruncommand to retrieve a quick snapshot view of Mesos Frameworks, Marathon applications, and availablecompute resources.
$ mrun --infoActive Frameworks: IBM Spark Shell : Nodes[10] CPUs[ 240] : User[builder] Jupyter Notebook : Nodes[ 0] CPUs[ 0] : User[urika-user]
Resource Management
S3016 108
marathon : Nodes[20] CPUs[ 480] : User[root]Active Marathon Jobs: /mrun/cge/user.dbport-2016-133-03-50-28.235572 : Nodes[20] CPUs[320/480] : user:user cmd:cge-serverAvailable Resources: : Nodes[14] CPUs[336] idle nid000[00-13] : Nodes[30] CPUs[480] busy nid000[14-29,32-45] : Nodes[ 2] CPUs[???] down nid000[30-31]
In the example output above, notice the CPUs[320/480] indicates that while the user only specified mrun--ntasks-per-node=16 -N 20 (meaning the application is running on 320 CPUs), mrun intends ALLapplications to have exclusive access to each node it is running on, and thus will ask Mesos for ALL theCPUs on the node, not just the number of CPUs per node the user requested to run on.
● Retrieve a summary of running Marathon applications - Use the --brief option of the mrun commandto obtain a more concise report on just the running Marathon applications and node availability.
$ mrun --briefN:20 CPU:320/480 <user> /mrun/cge/user.dbport-2016-133-03-50-28.235572 cge-server -d /mn...Status: Idle:14 Busy:30 Unavail:2
● Retrieve information on a specific Marathon application - Use the --detail option of the mruncommand to obtain additional information on a specific Marathon application. The application ID needs to bespecified with this option.
$ mrun --detail /mrun/cge/user.dbport-2016-133-03-50-28.235572Active Frameworks: IBM Spark Shell : Nodes[10] CPUs[ 240] : User[builder] Jupyter Notebook : Nodes[ 0] CPUs[ 0] : User[urika-user] marathon : Nodes[20] CPUs[ 480] : User[root]Active Marathon Jobs: /mrun/cge/user.dbport-2016-133-03-50-28.235572 : Nodes[20] CPUs[320/480] : user:<user> cmd:cge-server : [nid00032.urika.com]: startedAt:2016-05-12T17:05:53.573Z : [nid00028.urika.com]: startedAt:2016-05-12T17:05:53.360Z : [nid00010.urika.com]: startedAt:2016-05-12T17:05:53.359Z : [nid00007.urika.com]: startedAt:2016-05-12T17:05:53.397Z : [nid00001.urika.com]: startedAt:2016-05-12T17:05:53.384Z : [nid00019.urika.com]: startedAt:2016-05-12T17:05:53.383Z......
The additional information provided by the --detail option includes a list of all the node names theapplication is running on, and at what time the application was launched on those nodes.
● Stop, cancel or abort a running Marathon application - Use the --cancel option of the mrun commandto stop, cancel or abort a running Marathon application. The application ID needs to be specified with thisoption.
$ mrun --cancel /mrun/cge/user.3750-2016-133-20-01-07.394582Thu May 12 2016 15:01:21.284876 CDT[][mrun]:INFO:App /mrun/cge/user.3750-2016-133-20-01-07.394582 has been cancelled
If the application has already been cancelled, or completes, or does not exist, the following message isdisplayed:
Resource Management
S3016 109

$ mrun --cancel /mrun/cge/user.3750-2016-133-20-01-07.394582App '/mrun/cge/user.3750-2016-133-20-01-07.394582' does not exist
● Retrieve a list of nodes, CPU counts and available memory - Use the --resources option of the mruncommand to obtain a complete list of nodes, CPU counts, and available memory.
$ mrun --resources NID HEX NODENAME CPUs MEM STAT 0 0x00 nid00000 32 515758 idle 1 0x01 nid00001 32 515758 busy 2 0x02 nid00002 32 515758 idle 3 0x03 nid00003 32 515758 busy 4 0x04 nid00004 32 515758 busy 5 0x05 nid00005 32 515758 idle 6 0x06 nid00006 32 515758 idle 7 0x07 nid00007 32 515758 busy 8 0x08 nid00008 32 515758 busy 9 0x09 nid00009 32 515758 busy 10 0x0a nid00010 32 515758 busy 11 0x0b nid00011 32 515758 busy 12 0x0c nid00012 32 515758 idle 13 0x0d nid00013 32 515758 idle 14 0x0e nid00014 32 515758 busy 15 0x0f nid00015 32 515758 busy 16 0x10 nid00016 36 515756 idle 17 0x11 nid00017 36 515756 idle 18 0x12 nid00018 36 515756 busy 19 0x13 nid00019 36 515756 busy 20 0x14 nid00020 36 515756 idle 21 0x15 nid00021 36 515756 idle 22 0x16 nid00022 36 515756 busy 23 0x17 nid00023 36 515756 idle 24 0x18 nid00024 36 515756 idle 25 0x19 nid00025 36 515756 busy 26 0x1a nid00026 36 515756 idle 27 0x1b nid00027 36 515756 busy 28 0x1c nid00028 36 515756 busy 29 0x1d nid00029 36 515756 idle 30 0x1e nid00030 0 0 unavail 31 0x1f nid00031 0 0 unavail 32 0x20 nid00032 24 515758 busy 33 0x21 nid00033 24 515758 idle 34 0x22 nid00034 24 515758 idle 35 0x23 nid00035 24 515758 idle 36 0x24 nid00036 24 515758 idle 37 0x25 nid00037 24 515758 idle 38 0x26 nid00038 24 515758 busy 39 0x27 nid00039 24 515758 idle 40 0x28 nid00040 24 515758 idle 41 0x29 nid00041 24 515758 idle 42 0x2a nid00042 24 515758 busy 43 0x2b nid00043 24 515758 busy 44 0x2c nid00044 24 515758 idle 45 0x2d nid00045 24 515758 idle
Node names that are marked as unavail are hidden from Mesos as available compute resources, such asthe login node (nid00030). In the example above, some nodes have 24 CPUs/node, some have 32 CPUs/node and some have 36 CPUs/node. While not a typical situation, mrun does support this configuration, and
Resource Management
S3016 110
a command such as cge-launch -I36 -N 4 d.... would in fact be allowed to proceed, and would belimited to 4 instances on nid000[16-29].
Configuration FilesWhen mrun is invoked, it sets up some internal default values for required settings. mrun will then check if anysystem defaults have been configured in the /etc/mrun/mrun.conf file. An example mrun.conf file is shownbelow:
## (c) Copyright 2016 Cray Inc. All Rights Reserved.## Anything after an initial hashtag '#' is ignored# Blank lines are ignored.##NCMDServer=nid00000#MesosServer=localhost # same as --host#MesosPort=5050#MarathonServer=localhost#MarathonPort=8080#DebugFLAG=False # same as --debug#VerboseFLAG=False # same as --verbose#JobTimeout=0-0:10:0 # ten minutes, same as --time#StartupTimeout=30 # 30 seconds, same as --immediate#HealthCheckEnabled=True # Run with Marathon Health Checks enabled#HCGracePeriodSeconds=5 # Seconds at startup to delay Health Checks#HCIntervalSeconds=10 # Seconds between Health Check pings#HCTimeoutSeconds=10 # Seconds to answer Health Check successfully#HCMaxConsecutiveFailures=3 # How many missed health checks before app killed
If any of the lines above are not commented out, those values will become the new defaults for every mruninvocation.
Additionally, after the system /etc/mrun/mrun.conf file is loaded (if it exists), the user's private$HOME/.mrun.conf file will be loaded (if it exists). The following items should be noted:
● Any settings in the user's $HOME/.mrun.conf file will take precedence over any conflicting settings in thesystem /etc/mrun/mrun.conf file.
● Any command-line arguments that conflict with any pre-loaded configuration file settings will take precedencefor the current invocation of mrun.
CAUTION: Since Marathon does not require authentication, the mrun --cancel command does notprevent users from killing other users’ applications, as they can easily do this from the Marathon UIinstead.
For more information, see the mrun(1) man page.
6.4 Manage Long Running Services Using MarathonMarathon is a Platform as a Service (PaaS) service system that scales to thousands of physical servers. It runsas a framework on Mesos. Marathon is fully REST based and allows canary style deployment topologies.
Resource Management
S3016 111

Marathon provides an API for starting, stopping, and scaling long running services. It is highly available, elastic,and distributed.
On the Urika-GX system, there are always three Mesos Masters and three Marathon instances running, while oneof them is the active leader. Requests received by the login node are proxied to the currently active leader. If aleader runs into issues, one of the backup leaders take over and the requests are proxied to the current leader.
The Marathon web UI can be accessed using the Urika-GX Applications Interface UI, which can be accessedat: http://hostname-login1 and then selecting Marathon from the list of icons located at the bottom of theUI. Though this is the recommended method of accessing Marathon, it can also be accessed at the port it runson, i.e. at http://hostname-login1:8080 or http://hostname-login2:8080
Figure 35. Urika-GX Applications Interface
On Urika-GX, the Marathon service presents both a web UI and a REST API on port 8080. From most nodes, theREST API can be reached via http://hostname-login1:8080.
On Urika-GX, Marathon is used by the Cray-developed command named mrun to allocate node resources fromMesos and launch application instances as needed. To learn more about mrun, see the mrun man page.
TIP: If Marathon does not start after a system crash, because the queue has reached full capacity, useurika-stop and then urika-start to start Marathon again.
In addition, Cray-developed scripts for starting a cluster of YARN Node Managers are also launched throughMarathon.
CAUTION: Unless it is required to shut down YARN nodes, analytic applications that use the Cray-developed scripts for flexing a cluster should not be deleted through the Marathon UI, as doing will lead toloss of YARN nodes.
Resource Management
S3016 112
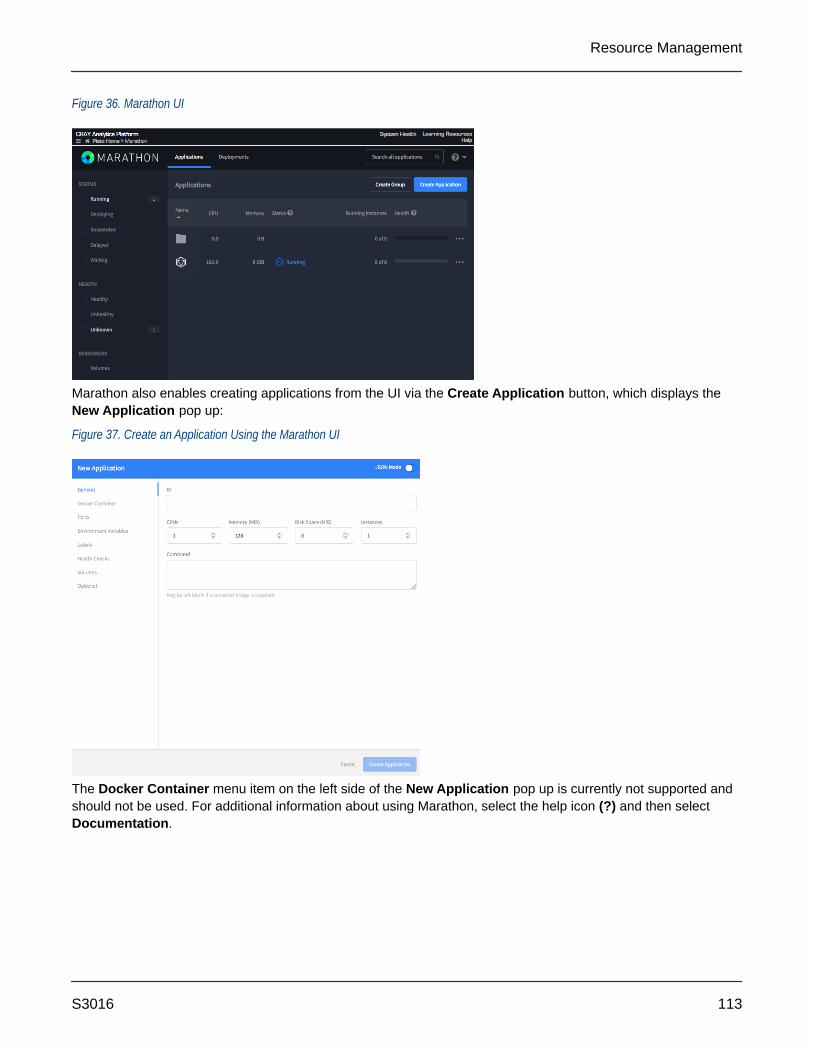
Figure 36. Marathon UI
Marathon also enables creating applications from the UI via the Create Application button, which displays theNew Application pop up:
Figure 37. Create an Application Using the Marathon UI
The Docker Container menu item on the left side of the New Application pop up is currently not supported andshould not be used. For additional information about using Marathon, select the help icon (?) and then selectDocumentation.
Resource Management
S3016 113
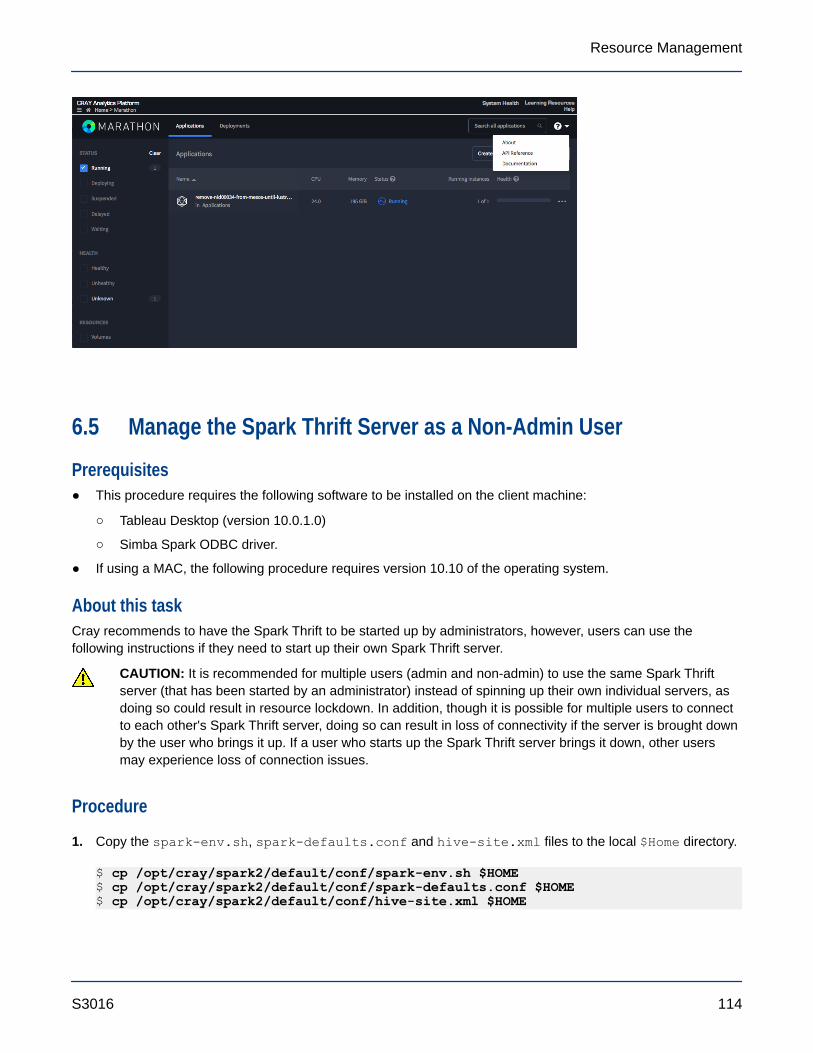
6.5 Manage the Spark Thrift Server as a Non-Admin User
Prerequisites● This procedure requires the following software to be installed on the client machine:
○ Tableau Desktop (version 10.0.1.0)
○ Simba Spark ODBC driver.
● If using a MAC, the following procedure requires version 10.10 of the operating system.
About this taskCray recommends to have the Spark Thrift to be started up by administrators, however, users can use thefollowing instructions if they need to start up their own Spark Thrift server.
CAUTION: It is recommended for multiple users (admin and non-admin) to use the same Spark Thriftserver (that has been started by an administrator) instead of spinning up their own individual servers, asdoing so could result in resource lockdown. In addition, though it is possible for multiple users to connectto each other's Spark Thrift server, doing so can result in loss of connectivity if the server is brought downby the user who brings it up. If a user who starts up the Spark Thrift server brings it down, other usersmay experience loss of connection issues.
Procedure
1. Copy the spark-env.sh, spark-defaults.conf and hive-site.xml files to the local $Home directory.
$ cp /opt/cray/spark2/default/conf/spark-env.sh $HOME$ cp /opt/cray/spark2/default/conf/spark-defaults.conf $HOME$ cp /opt/cray/spark2/default/conf/hive-site.xml $HOME
Resource Management
S3016 114

2. Modify the hive-site.xml configuration file to set hive.server2.thrift.port to a non-conflictingport.
3. Increase the number of compute nodes if needed by editing the spark-defaults.conf configuration fileand changing the default value of spark.cores.max from 128 to the desired value.
4. Execute the start-thriftserver.sh script.
$ /opt/cray/spark2/default/sbin/start-thriftserver.sh
5. Stop the Spark Thrift server when finished using it.
$ /opt/cray/spark2/default/sbin/stop-thriftserver.sh
Resource Management
S3016 115
7 Control the Spark Thrift ServerThe Spark Thrift server is one of the analytic components of the Urika-GX software stack. The urika-start andurika-stop commands can be used to control this service.
Start the Spark Thrift ServerTo start the Spark Thrift Server, execute the urika-start command as root from the SMW, specifyingspark_thrift as the name of the service to start:
# urika-start -s spark_thrift
For more information, see the urika-start man page.
Stop the Spark Thrift ServerTo stop the Spark Thrift Server, execute the urika-stop command as root from the SMW, specifyingspark_thrift as the name of the service to stop:
# urika-stop -s spark_thrift
Calling the urika-stop command without any options also stops the Spark Thrift Server. For more information,see the urika-stop man page.
Check the Status of the Spark Thrift ServerTo check the status of the Spark Thrift Server, execute the urika-state command as root from the SMW:
# urika-state
For more information, see the urika-state man page.
Control the Spark Thrift Server
S3016 116
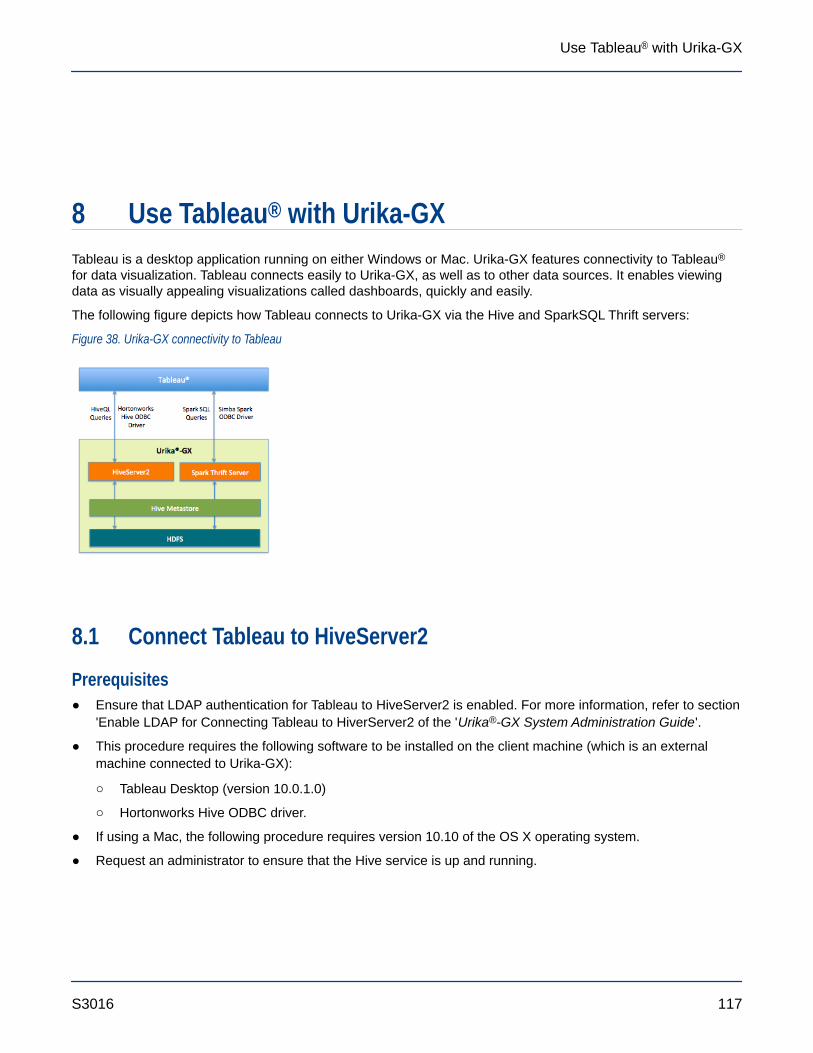
8 Use Tableau® with Urika-GXTableau is a desktop application running on either Windows or Mac. Urika-GX features connectivity to Tableau®
for data visualization. Tableau connects easily to Urika-GX, as well as to other data sources. It enables viewingdata as visually appealing visualizations called dashboards, quickly and easily.
The following figure depicts how Tableau connects to Urika-GX via the Hive and SparkSQL Thrift servers:
Figure 38. Urika-GX connectivity to Tableau
8.1 Connect Tableau to HiveServer2
Prerequisites● Ensure that LDAP authentication for Tableau to HiveServer2 is enabled. For more information, refer to section
'Enable LDAP for Connecting Tableau to HiverServer2 of the 'Urika®-GX System Administration Guide'.
● This procedure requires the following software to be installed on the client machine (which is an externalmachine connected to Urika-GX):
○ Tableau Desktop (version 10.0.1.0)
○ Hortonworks Hive ODBC driver.
● If using a Mac, the following procedure requires version 10.10 of the OS X operating system.
● Request an administrator to ensure that the Hive service is up and running.
Use Tableau® with Urika-GX
S3016 117
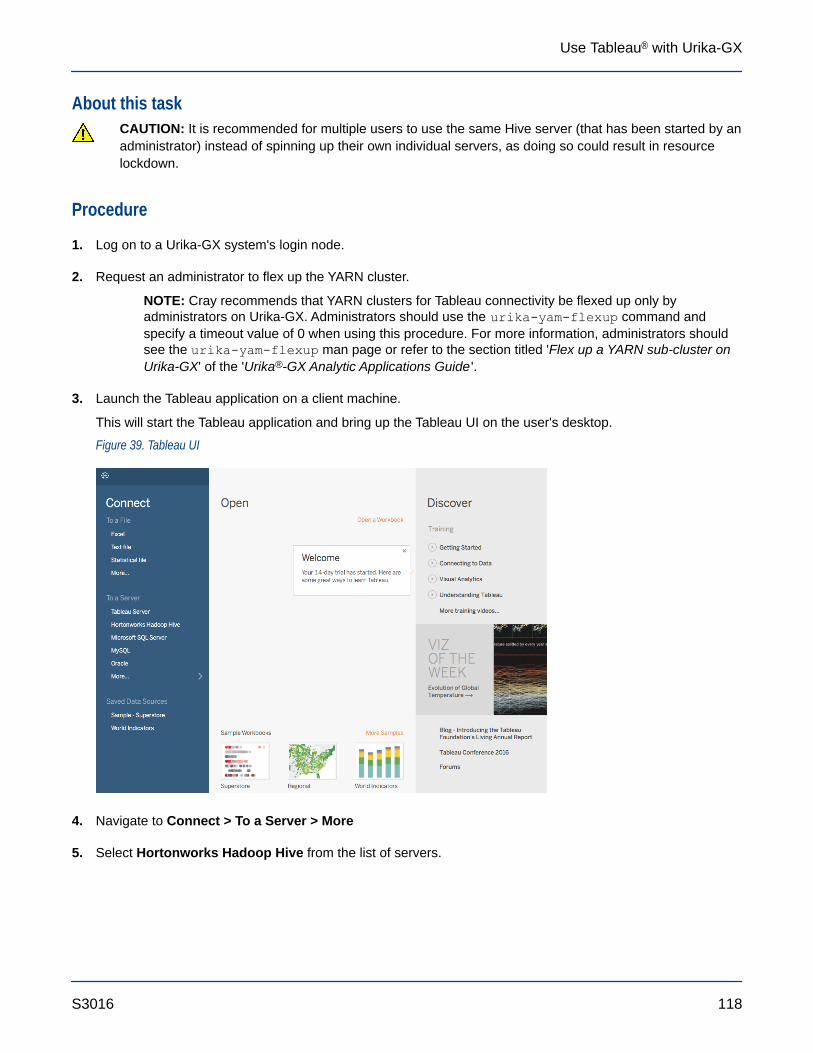
About this taskCAUTION: It is recommended for multiple users to use the same Hive server (that has been started by anadministrator) instead of spinning up their own individual servers, as doing so could result in resourcelockdown.
Procedure
1. Log on to a Urika-GX system's login node.
2. Request an administrator to flex up the YARN cluster.
NOTE: Cray recommends that YARN clusters for Tableau connectivity be flexed up only byadministrators on Urika-GX. Administrators should use the urika-yam-flexup command andspecify a timeout value of 0 when using this procedure. For more information, administrators shouldsee the urika-yam-flexup man page or refer to the section titled 'Flex up a YARN sub-cluster onUrika-GX' of the 'Urika®-GX Analytic Applications Guide '.
3. Launch the Tableau application on a client machine.
This will start the Tableau application and bring up the Tableau UI on the user's desktop.
Figure 39. Tableau UI
4. Navigate to Connect > To a Server > More
5. Select Hortonworks Hadoop Hive from the list of servers.
Use Tableau® with Urika-GX
S3016 118

Figure 40. Selecting Hortonworks Hadoop Hive Server
6. Populate the server connection pop up.
a. Enter hostname-login1 in the Server field, where hostname is used as an example for the name ofthe machine and should be replaced with the actual machine name when following this step.
b. Enter 10000 in the Port field.
c. Select HiveServer2 from the Type drop down.
d. Select User Name and Password from the Authentication drop down.
e. Enter values in the Username and Password fields.
f. Select the Sign In button.
Use Tableau® with Urika-GX
S3016 119

Figure 41. Connect HiveServer2 to Tableau
7. Perform data visualization/exploration tasks as needed using Tableau.
8. Request an administrator to flex down the YARN cluster.
NOTE: Cray recommends that YARN clusters for Tableau connectivity be flexed down only byadministrators on Urika-GX. For more information, administrators should see the urika-yam-flexdown man page or refer to the section titled 'Flex up a YARN sub-cluster on Urika-GX' of the'Urika®-GX Analytic Applications Guide '.
8.2 Connect Tableau to HiveServer2 Securely
Prerequisites● This procedure requires the following software to be installed on the client machine:
○ Tableau Desktop (version 10.0.1.0)
○ Hortonworks Hive ODBC driver.
● If using a Mac, the following procedure requires version 10.10 of the OS X operating system.
● Request and administrator to ensure that the Hive service is up and running.
About this taskCAUTION: It is recommended for multiple users to use the same Hive server (that has been started by anadministrator) instead of spinning up their own individual servers, as doing so could result in resourcelockdown.
Use Tableau® with Urika-GX
S3016 120
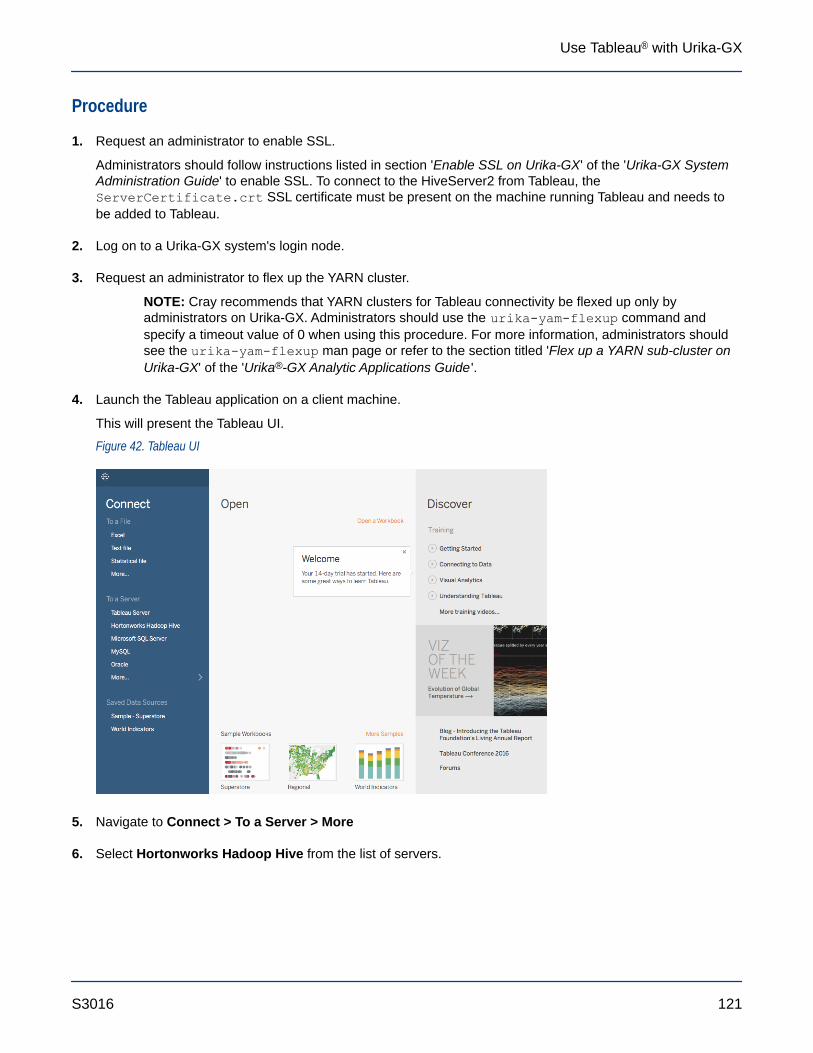
Procedure
1. Request an administrator to enable SSL.
Administrators should follow instructions listed in section 'Enable SSL on Urika-GX' of the 'Urika-GX SystemAdministration Guide' to enable SSL. To connect to the HiveServer2 from Tableau, theServerCertificate.crt SSL certificate must be present on the machine running Tableau and needs tobe added to Tableau.
2. Log on to a Urika-GX system's login node.
3. Request an administrator to flex up the YARN cluster.
NOTE: Cray recommends that YARN clusters for Tableau connectivity be flexed up only byadministrators on Urika-GX. Administrators should use the urika-yam-flexup command andspecify a timeout value of 0 when using this procedure. For more information, administrators shouldsee the urika-yam-flexup man page or refer to the section titled 'Flex up a YARN sub-cluster onUrika-GX' of the 'Urika®-GX Analytic Applications Guide '.
4. Launch the Tableau application on a client machine.
This will present the Tableau UI.
Figure 42. Tableau UI
5. Navigate to Connect > To a Server > More
6. Select Hortonworks Hadoop Hive from the list of servers.
Use Tableau® with Urika-GX
S3016 121
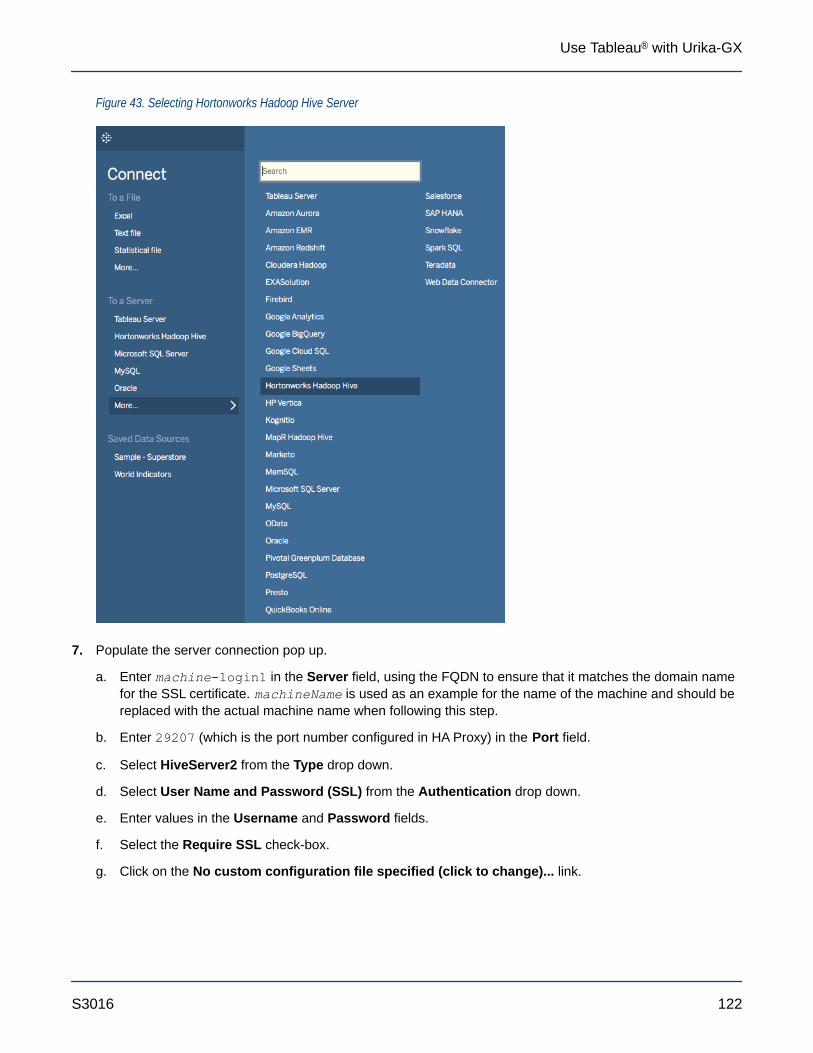
Figure 43. Selecting Hortonworks Hadoop Hive Server
7. Populate the server connection pop up.
a. Enter machine-login1 in the Server field, using the FQDN to ensure that it matches the domain namefor the SSL certificate. machineName is used as an example for the name of the machine and should bereplaced with the actual machine name when following this step.
b. Enter 29207 (which is the port number configured in HA Proxy) in the Port field.
c. Select HiveServer2 from the Type drop down.
d. Select User Name and Password (SSL) from the Authentication drop down.
e. Enter values in the Username and Password fields.
f. Select the Require SSL check-box.
g. Click on the No custom configuration file specified (click to change)... link.
Use Tableau® with Urika-GX
S3016 122
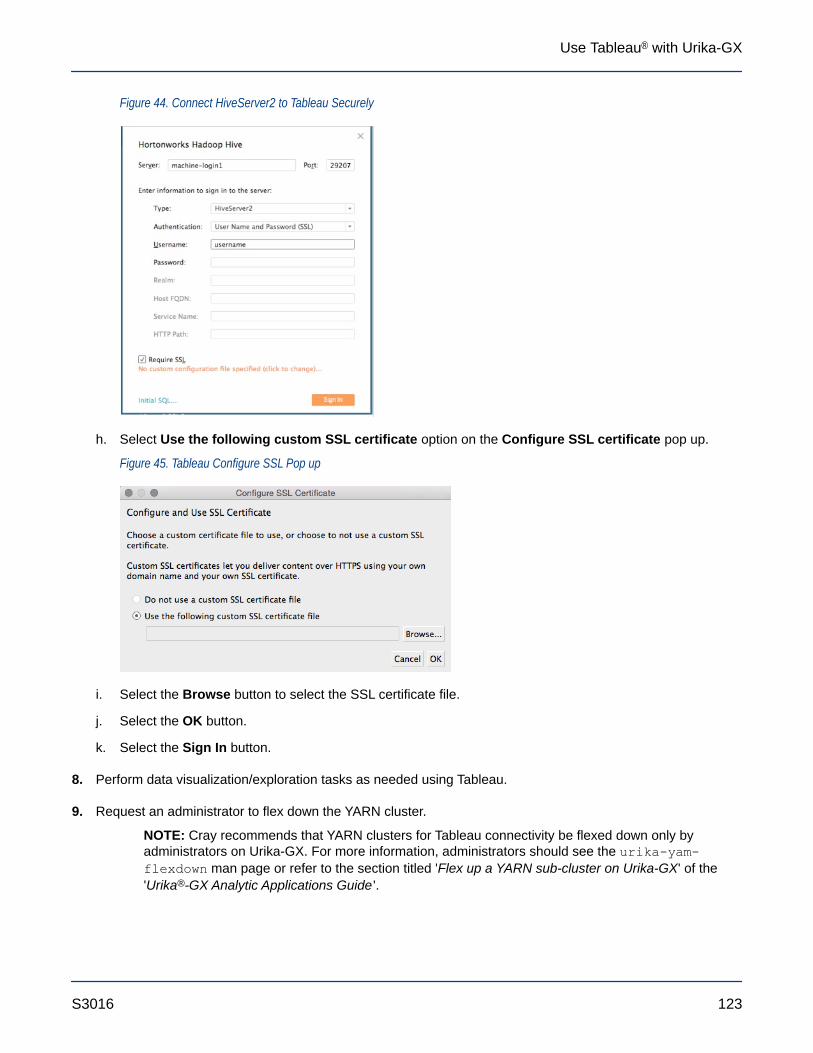
Figure 44. Connect HiveServer2 to Tableau Securely
h. Select Use the following custom SSL certificate option on the Configure SSL certificate pop up.
Figure 45. Tableau Configure SSL Pop up
i. Select the Browse button to select the SSL certificate file.
j. Select the OK button.
k. Select the Sign In button.
8. Perform data visualization/exploration tasks as needed using Tableau.
9. Request an administrator to flex down the YARN cluster.
NOTE: Cray recommends that YARN clusters for Tableau connectivity be flexed down only byadministrators on Urika-GX. For more information, administrators should see the urika-yam-flexdown man page or refer to the section titled 'Flex up a YARN sub-cluster on Urika-GX' of the'Urika®-GX Analytic Applications Guide '.
Use Tableau® with Urika-GX
S3016 123
8.3 Connect Tableau to the Spark Thrift Server
Prerequisites● This procedure requires the following software to be installed on the client machine, which is an external
machine connected to Urika-GX:
○ Tableau Desktop (version 10.0.1.0)
○ Simba Spark ODBC driver.
● If using a Mac, the following procedure requires version 10.10 of the OS X operating system.
About this taskThe Spark Thrift server ships pre-configured with LDAP authentication.
CAUTION: The recommended approach for using Tableau with the Spark Thrift server on Urika-GX is tohave multiple users (admin and non-admin) to use the same Spark Thrift server (that has been started byan administrator) instead of spinning up their own individual servers, as doing so could result in resourcelockdown. In addition, though it is possible for multiple users to connect to each other's Spark Thriftserver, doing so can result in loss of connectivity if the server is brought down by the user who brings itup.
Procedure
1. Request the administrator to verify that the Spark Thrift server is running and to start it if it is not already up.
Administrators should refer to the section titled, 'Control the Spark Thrift Server' in the 'Urika®-GX SystemAdministration Guide' to start the Spark Thrift server. Cray recommends to have the Spark Thrift serverstopped by administrators. In order to start the Spark Thrift server non-admins have started withoutadministrative privileges, non-admins should refer to Manage the Spark Thrift Server as a Non-Admin User onpage 114.
2. Launch the Tableau application on a client machine.
This will present the Tableau UI.
Use Tableau® with Urika-GX
S3016 124

Figure 46. Tableau UI
3. Navigate to Connect > To a Server > More
4. Select Spark SQL server from the list of servers.
Use Tableau® with Urika-GX
S3016 125

Figure 47. Selecting Spark SQL Server
5. Populate the server connection pop up.
a. Enter hostname-login1 in the Server field, where hostname is used as an example for the name ofthe machine and should be replaced with the actual machine name when following this step.
b. Enter 10015 in the Port field.
c. Select SparkThriftServer (Spark 1.1 and later) from the Type drop down.
d. Select User Name and Password from the Authentication drop down.
e. Enter values in the Username and Password fields.
f. Select the Sign In button.
Use Tableau® with Urika-GX
S3016 126

Figure 48. Tableau's Spark Connection Pop up
6. Perform data visualization/exploration tasks as needed.
7. Request an administrator to stop the Spark Thrift server service.
Administrators should refer to the section titled, 'Control the Spark Thrift Server' in the 'Urika®-GX SystemAdministration Guide' to stop the Spark Thrift server. Cray recommends to have the Spark Thrift serverstopped by administrators. In order to stop the Spark Thrift server non-admins have started withoutadministrative privileges, non-admins should refer to 'Manage the Spark Thrift Server as a Non-Admin User'of the 'Urika-GX Analytic Applications Guide '.
8.4 Connect Tableau to the Spark Thrift Server Securely
Prerequisites● This procedure requires the following software to be installed on the client machine:
○ Tableau Desktop (version 10.0.1.0)
○ Simba Spark ODBC driver.
● If using a Mac, the following procedure requires version 10.10 of the OS X operating system.
About this taskCAUTION: The recommended approach for using Tableau with the Spark Thrift server on Urika-GX is tohave multiple users (admin and non-admin) to use the same Spark Thrift server (that has been started byan administrator) instead of spinning up their own individual servers, as doing so could result in resourcelockdown. In addition, though it is possible for multiple users to connect to each other's Spark Thrift
Use Tableau® with Urika-GX
S3016 127

server, doing so can result in loss of connectivity if the server is brought down by the user who brings itup.
Procedure
1. Request an administrator to verify that SSL is enabled.
Administrators should follow instructions listed in section 'Enable SSL on Urika-GX' of the 'Urika-GX SystemAdministration Guide' to enable SSL.
2. Request the administrator to verify that the Spark Thrift server is running and to start it if it is not already up.
Administrators should refer to the section titled, 'Control the Spark Thrift Server' in the 'Urika-GX SystemAdministration Guide' to start the Spark Thrift server. Cray recommends to have the Spark Thrift serverstopped by administrators. In order to start the Spark Thrift server non-admins have started withoutadministrative privileges, non-admins should refer to 'Manage the Spark Thrift Server as a Non-Admin User'of the 'Urika-GX Analytic Applications Guide '.
3. Launch the Tableau application.
This will present the Tableau UI.
Figure 49. Tableau UI
4. Navigate to Connect > To a Server > More
5. Select Spark SQL server from the list of servers.
Use Tableau® with Urika-GX
S3016 128
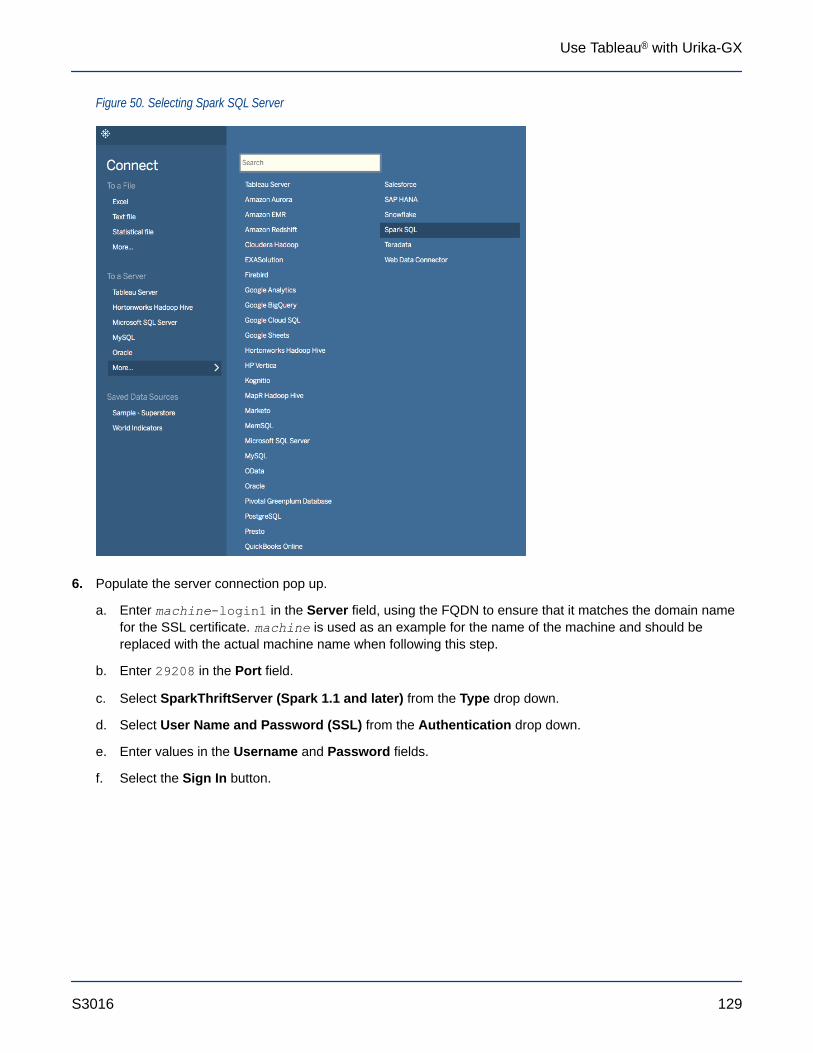
Figure 50. Selecting Spark SQL Server
6. Populate the server connection pop up.
a. Enter machine-login1 in the Server field, using the FQDN to ensure that it matches the domain namefor the SSL certificate. machine is used as an example for the name of the machine and should bereplaced with the actual machine name when following this step.
b. Enter 29208 in the Port field.
c. Select SparkThriftServer (Spark 1.1 and later) from the Type drop down.
d. Select User Name and Password (SSL) from the Authentication drop down.
e. Enter values in the Username and Password fields.
f. Select the Sign In button.
Use Tableau® with Urika-GX
S3016 129

Figure 51. Connect Tableau to the Spark Thrift Server Using SSL
7. Perform data visualization/exploration tasks as needed.
8. Request an administrator to stop the Spark Thrift server.
Administrators should refer to the section titled, 'Control the Spark Thrift Server' in the 'Urika-GX SystemAdministration Guide' to stop the Spark Thrift server. Cray recommends to have the Spark Thrift serverstopped by administrators. In order to stop the Spark Thrift server non-admins have started withoutadministrative privileges, non-admins should refer to 'Manage the Spark Thrift Server as a Non-Admin User'of the 'Urika-GX Analytic Applications Guide '.
Use Tableau® with Urika-GX
S3016 130

9 Cray DVS
9.1 Introduction to DVSThe Cray Data Virtualization Service (Cray DVS) is a distributed network service that provides transparent accessto file systems residing on the service I/O nodes and remote servers in the data center. Cray DVS provides aservice analogous to NFS™. It projects local file systems resident on I/O nodes or remote file servers to computeand service nodes within the Cray system. Projecting is simply the process of making a file system available onnodes where it does not physically reside. DVS-specific options to the mount command enable clients (computenodes) to access a file system projected by DVS servers. Thus, Cray DVS, while not a file system, represents asoftware layer that provides scalable transport for file system services. See the mount(8) and dvs(5) manpages for more information.
Cray DVS uses the Linux-supplied VFS interface to process file system access operations. This allows DVS toproject any POSIX-compliant file system.
Figure 52. Cray DVS Use Case
/home (NFS)
Input FilesSmall Data FilesApplications
Lustre/scratch
UserApplication
DVS Network Service
Shared Data File
Input FilesLarge Data FilesApplications
Compute Nodes /home, /gpfs, /scratch
/gpfs
Cray DVS provides I/O performance and scalability to a large number of nodes, far beyond the typical number ofclients supported by a single NFS server. Operating system noise and impact on compute node memoryresources are both minimized in the Cray DVS configuration.
IMPORTANT: DVS servers use unlimited amounts of CPU and memory resources based directly on the I/O requests sent from DVS clients. For this reason, DVS servers should be dedicated and not sharenodes with other services (Lustre nodes, login nodes, etc.).
Administration of Cray DVS is very similar to configuring and mounting any Linux file system. For moreinformation, see the dvs(5) man page. Here is a system administrator's view of Cray DVS.
Cray DVS
S3016 131
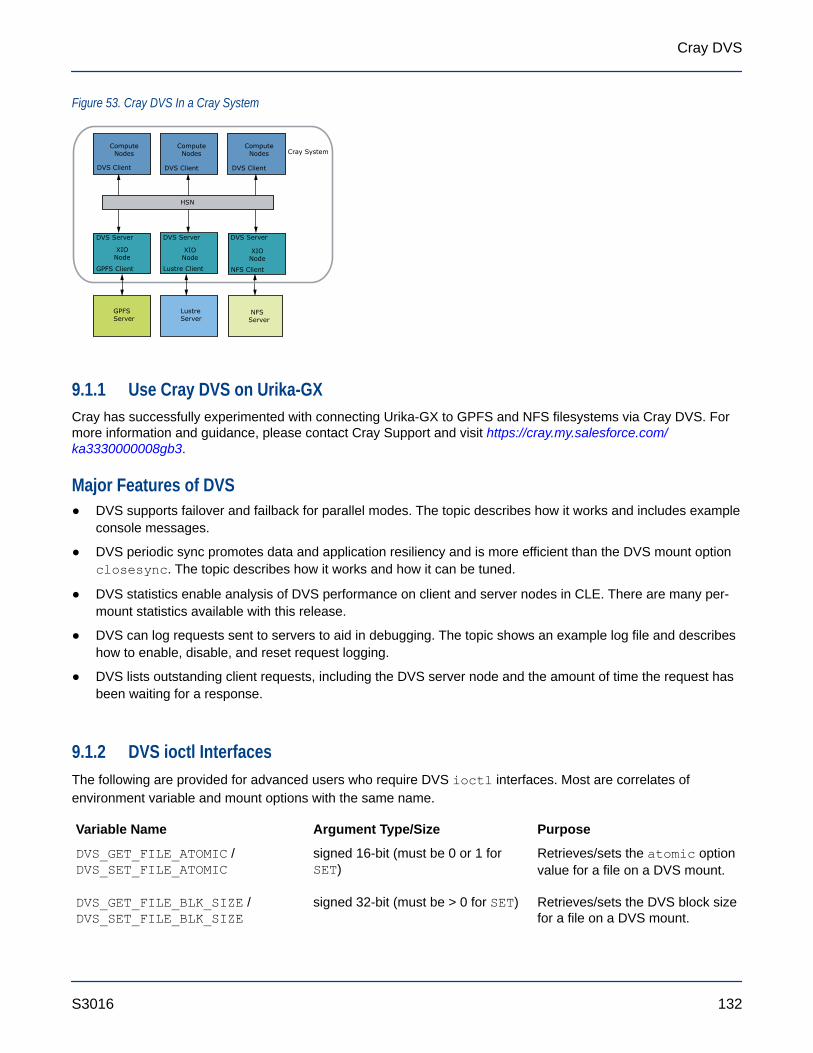
Figure 53. Cray DVS In a Cray System
Cray System
GPFSServer
LustreServer
DVS Server
GPFS Client
XIONode
NFSServer
DVS Client
Compute Nodes
DVS Client
Compute Nodes
DVS Client
Compute Nodes
DVS Server
Lustre Client
XIONode
DVS Server
NFS Client
XIONode
HSN
9.1.1 Use Cray DVS on Urika-GXCray has successfully experimented with connecting Urika-GX to GPFS and NFS filesystems via Cray DVS. Formore information and guidance, please contact Cray Support and visit https://cray.my.salesforce.com/ka3330000008gb3.
Major Features of DVS● DVS supports failover and failback for parallel modes. The topic describes how it works and includes example
console messages.
● DVS periodic sync promotes data and application resiliency and is more efficient than the DVS mount optionclosesync. The topic describes how it works and how it can be tuned.
● DVS statistics enable analysis of DVS performance on client and server nodes in CLE. There are many per-mount statistics available with this release.
● DVS can log requests sent to servers to aid in debugging. The topic shows an example log file and describeshow to enable, disable, and reset request logging.
● DVS lists outstanding client requests, including the DVS server node and the amount of time the request hasbeen waiting for a response.
9.1.2 DVS ioctl InterfacesThe following are provided for advanced users who require DVS ioctl interfaces. Most are correlates ofenvironment variable and mount options with the same name.
Variable Name Argument Type/Size Purpose
DVS_GET_FILE_ATOMIC /DVS_SET_FILE_ATOMIC
signed 16-bit (must be 0 or 1 forSET)
Retrieves/sets the atomic optionvalue for a file on a DVS mount.
DVS_GET_FILE_BLK_SIZE /DVS_SET_FILE_BLK_SIZE
signed 32-bit (must be > 0 for SET) Retrieves/sets the DVS block sizefor a file on a DVS mount.
Cray DVS
S3016 132

Variable Name Argument Type/Size Purpose
DVS_GET_FILE_CACHE /DVS_SET_FILE_CACHE
signed 16-bit (must be 0 or 1 forSET)
Retrieves/sets the cache optionfor a file on a DVS mount. To setthe file cache, read-only optionmust be set.
DVS_GET_FILE_CACHE_READ_SZ /DVS_SET_FILE_CACHE_READ_SZ
signed 32-bit (must be > 0 for SET) Retrieves/sets thecache_read_sz value for a fileon a DVS mount.
DVS_GET_FILE_CLOSESYNC /DVS_SET_FILE_CLOSESYNC
signed 16-bit (must be 0 or 1 forSET)
Retrieves/sets the closesyncoption for a file on a DVS mount.
DVS_GET_FILE_DATASYNC /DVS_SET_FILE_DATASYNC
signed 16-bit (must be 0 or 1 forSET)
Retrieves/sets the currentdatasync value for a file on aDVS mount.
DVS_GET_FILE_DEFEROPENS /DVS_SET_FILE_DEFEROPENS
signed 16-bit (must be 0 or 1 forSET)
Retrieves/sets the deferopensvalue for a file on a DVS mount.
DVS_GET_FILE_KILLPROCESS /DVS_SET_FILE_KILLPROCESS
signed 16-bit (must be 0 or 1 forSET)
Retrieves/sets the killprocessoption for a file on a DVS mount.
DVS_GET_FILE_STRIPE_WIDTH /DVS_SET_FILE_STRIPE_WIDTH
signed 32-bit (must be > 0 for SET) Retrieves/sets the stripe widthsize for a file on a DVS mount. Toset the stripe width, loadbalanceoption must be set.
DVS_GET_NNODES signed 32-bit Retrieves the number of nodescurrently available for a mountpoint.
DVS_GET_REMOTE_FS_MAGIC unsigned 64-bit Gets the remote file system typefor a file on a DVS mount.
DVS_BCAST_IOCTL struct dvs_ioctl_tunnel Used for DataWarp to allowspecialized ioctl calls to bepassed through DVS to a remoteserver.
DVS_AUGMENTED_BCAST_IOCTL struct dvs_augmented_ioctl_tunnel Used for DataWarp to allowspecialized ioctl calls to bepassed through DVS to a remoteserver.
DVS_TUNNEL_IOCTL struct dvs_ioctl_tunnel Used for DataWarp to allowspecialized ioctl calls to bepassed through DVS to a remoteserver.
DVS_AUGMENTED_TUNNEL_IOCTL struct dvs_augmented_ioctl_tunnel Used for DataWarp to allowspecialized ioctl calls to bepassed through DVS to a remoteserver.
Cray DVS
S3016 133
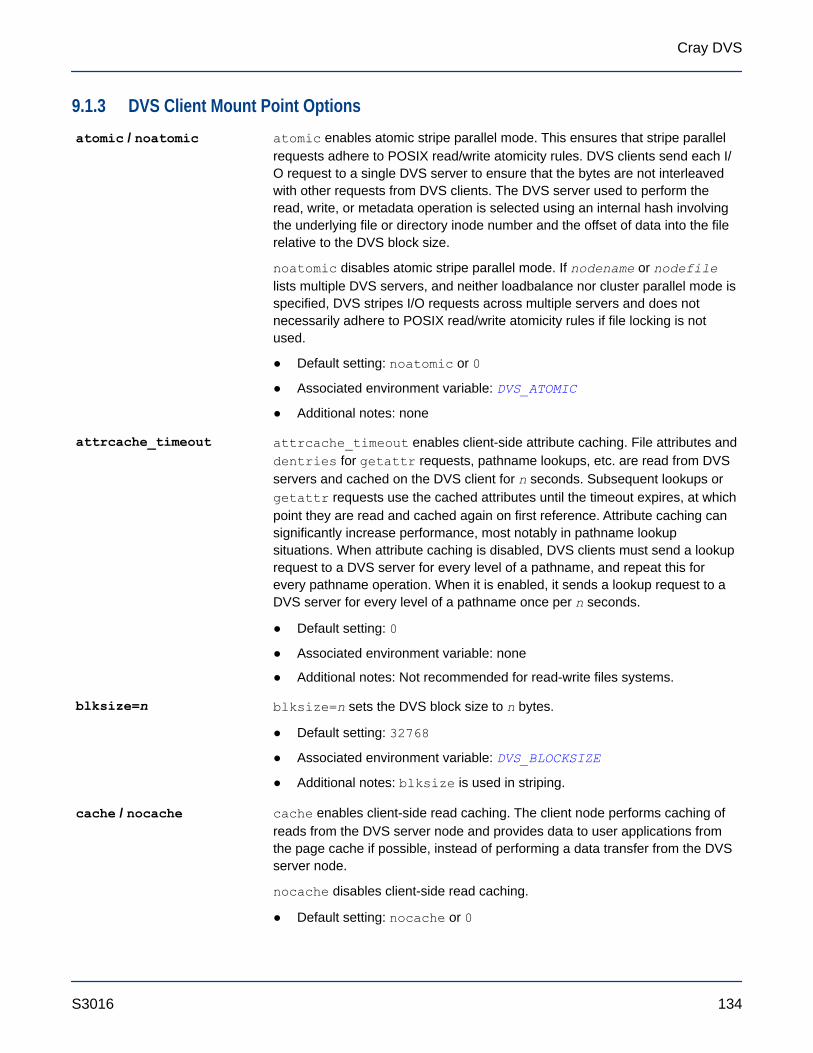
9.1.3 DVS Client Mount Point Optionsatomic / noatomic atomic enables atomic stripe parallel mode. This ensures that stripe parallel
requests adhere to POSIX read/write atomicity rules. DVS clients send each I/O request to a single DVS server to ensure that the bytes are not interleavedwith other requests from DVS clients. The DVS server used to perform theread, write, or metadata operation is selected using an internal hash involvingthe underlying file or directory inode number and the offset of data into the filerelative to the DVS block size.
noatomic disables atomic stripe parallel mode. If nodename or nodefilelists multiple DVS servers, and neither loadbalance nor cluster parallel mode isspecified, DVS stripes I/O requests across multiple servers and does notnecessarily adhere to POSIX read/write atomicity rules if file locking is notused.
● Default setting: noatomic or 0
● Associated environment variable: DVS_ATOMIC
● Additional notes: none
attrcache_timeout attrcache_timeout enables client-side attribute caching. File attributes anddentries for getattr requests, pathname lookups, etc. are read from DVSservers and cached on the DVS client for n seconds. Subsequent lookups orgetattr requests use the cached attributes until the timeout expires, at whichpoint they are read and cached again on first reference. Attribute caching cansignificantly increase performance, most notably in pathname lookupsituations. When attribute caching is disabled, DVS clients must send a lookuprequest to a DVS server for every level of a pathname, and repeat this forevery pathname operation. When it is enabled, it sends a lookup request to aDVS server for every level of a pathname once per n seconds.
● Default setting: 0
● Associated environment variable: none
● Additional notes: Not recommended for read-write files systems.
blksize=n blksize=n sets the DVS block size to n bytes.
● Default setting: 32768
● Associated environment variable: DVS_BLOCKSIZE
● Additional notes: blksize is used in striping.
cache / nocache cache enables client-side read caching. The client node performs caching ofreads from the DVS server node and provides data to user applications fromthe page cache if possible, instead of performing a data transfer from the DVSserver node.
nocache disables client-side read caching.
● Default setting: nocache or 0
Cray DVS
S3016 134

● Associated environment variable: DVS_CACHE
● Additional notes: Cray DVS is not a clustered file system; no coherency ismaintained among multiple DVS client nodes reading and writing to thesame file. If cache is enabled and data consistency is required,applications must take care to synchronize their accesses to the sharedfile.
cache_read_sz cache_read_sz is a limit that can be specified to prevent reads over this sizefrom being cached in the Linux page cache.
● Default setting: 0
● Associated environment variable: DVS_CACHE_READ_SZ
● Additional notes: none
closesync / noclosesync closesync enables data synchronization on last close of a file. When aprocess performs the final close of a file descriptor, in addition to forwardingthe close to the DVS server, the DVS server node waits until data has beenwritten to the underlying media before indicating that the close has completed.Because DVS does not cache data on client nodes and has no replaycapabilities, this ensures that data is not lost if a server node crashes after anapplication has exited.
noclosesync is the default behavior of DVS. In the default case, DVS returnsa close() request immediately.
● Default setting: noclosesync or 0
● Associated environment variable: DVS_CLOSESYNC
● Additional notes: When DVS periodic sync is enabled, it is redundant touse closesync. Moreover, periodic sync is more efficient because ittracks which files are "dirty."
datasync / nodatasync datasync enables data synchronization. The DVS server node waits untildata has been written to the underlying media before indicating that the writehas completed.
nodatasync disables data synchronization. The DVS server node returnsfrom a write request as soon as the user's data has been written into the pagecache on the server node.
● Default setting: nodatasync or 0
● Associated environment variable: DVS_DATASYNC
● Additional notes: datasync can significantly impact performance.
deferopens deferopens defers DVS client open requests to DVS servers for a given setof conditions. When a file is open in stripe parallel mode or atomic stripeparallel mode, DVS clients send the open request to a single DVS server only.Additional open requests are sent as necessary when the DVS client performsa read or write to a different server for the first time. The deferopens optiondeviates from POSIX specifications. For example, if a file was removed after
Cray DVS
S3016 135
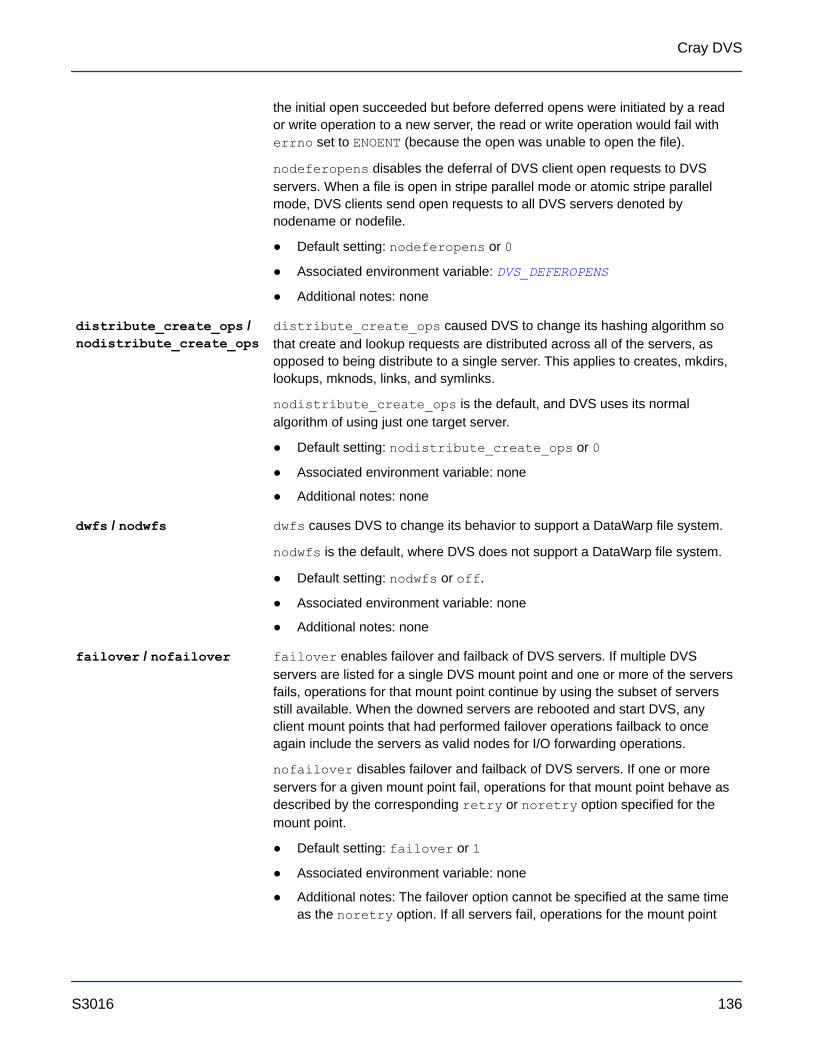
the initial open succeeded but before deferred opens were initiated by a reador write operation to a new server, the read or write operation would fail witherrno set to ENOENT (because the open was unable to open the file).
nodeferopens disables the deferral of DVS client open requests to DVSservers. When a file is open in stripe parallel mode or atomic stripe parallelmode, DVS clients send open requests to all DVS servers denoted bynodename or nodefile.
● Default setting: nodeferopens or 0
● Associated environment variable: DVS_DEFEROPENS
● Additional notes: none
distribute_create_ops /nodistribute_create_ops
distribute_create_ops caused DVS to change its hashing algorithm sothat create and lookup requests are distributed across all of the servers, asopposed to being distribute to a single server. This applies to creates, mkdirs,lookups, mknods, links, and symlinks.
nodistribute_create_ops is the default, and DVS uses its normalalgorithm of using just one target server.
● Default setting: nodistribute_create_ops or 0
● Associated environment variable: none
● Additional notes: none
dwfs / nodwfs dwfs causes DVS to change its behavior to support a DataWarp file system.
nodwfs is the default, where DVS does not support a DataWarp file system.
● Default setting: nodwfs or off.
● Associated environment variable: none
● Additional notes: none
failover / nofailover failover enables failover and failback of DVS servers. If multiple DVSservers are listed for a single DVS mount point and one or more of the serversfails, operations for that mount point continue by using the subset of serversstill available. When the downed servers are rebooted and start DVS, anyclient mount points that had performed failover operations failback to onceagain include the servers as valid nodes for I/O forwarding operations.
nofailover disables failover and failback of DVS servers. If one or moreservers for a given mount point fail, operations for that mount point behave asdescribed by the corresponding retry or noretry option specified for themount point.
● Default setting: failover or 1
● Associated environment variable: none
● Additional notes: The failover option cannot be specified at the same timeas the noretry option. If all servers fail, operations for the mount point
Cray DVS
S3016 136
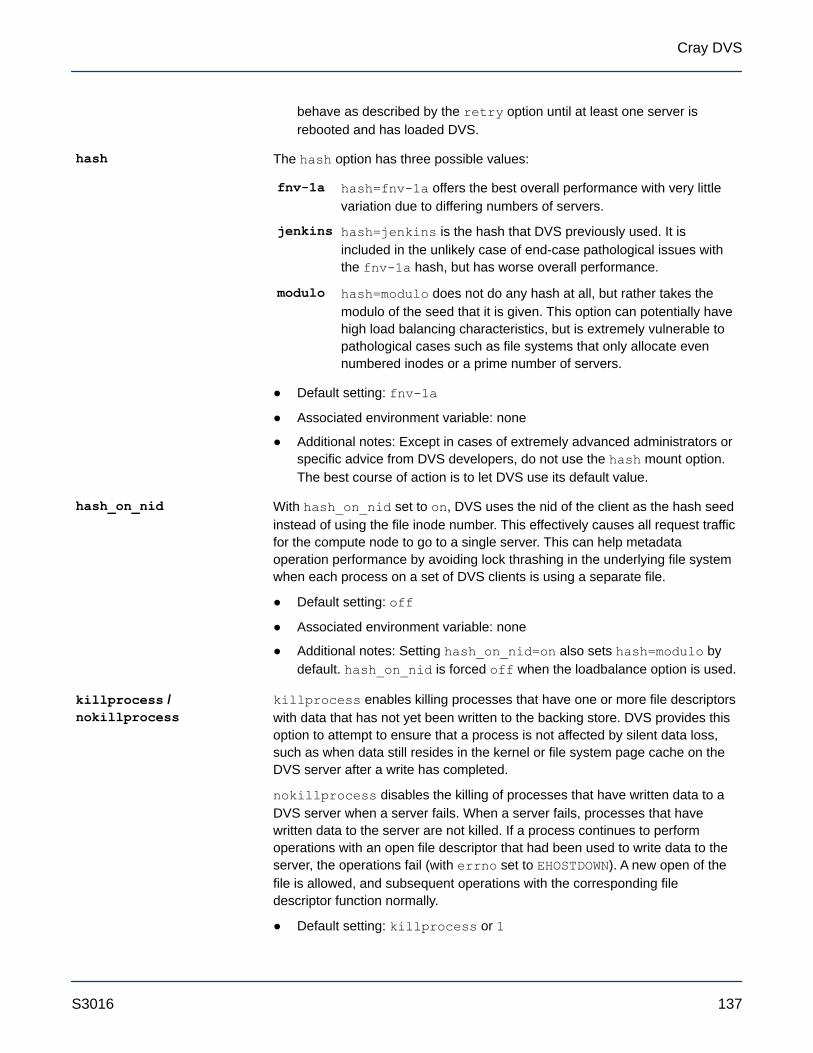
behave as described by the retry option until at least one server isrebooted and has loaded DVS.
hash The hash option has three possible values:
fnv-1a hash=fnv-1a offers the best overall performance with very littlevariation due to differing numbers of servers.
jenkins hash=jenkins is the hash that DVS previously used. It isincluded in the unlikely case of end-case pathological issues withthe fnv-1a hash, but has worse overall performance.
modulo hash=modulo does not do any hash at all, but rather takes themodulo of the seed that it is given. This option can potentially havehigh load balancing characteristics, but is extremely vulnerable topathological cases such as file systems that only allocate evennumbered inodes or a prime number of servers.
● Default setting: fnv-1a
● Associated environment variable: none
● Additional notes: Except in cases of extremely advanced administrators orspecific advice from DVS developers, do not use the hash mount option.The best course of action is to let DVS use its default value.
hash_on_nid With hash_on_nid set to on, DVS uses the nid of the client as the hash seedinstead of using the file inode number. This effectively causes all request trafficfor the compute node to go to a single server. This can help metadataoperation performance by avoiding lock thrashing in the underlying file systemwhen each process on a set of DVS clients is using a separate file.
● Default setting: off
● Associated environment variable: none
● Additional notes: Setting hash_on_nid=on also sets hash=modulo bydefault. hash_on_nid is forced off when the loadbalance option is used.
killprocess /nokillprocess
killprocess enables killing processes that have one or more file descriptorswith data that has not yet been written to the backing store. DVS provides thisoption to attempt to ensure that a process is not affected by silent data loss,such as when data still resides in the kernel or file system page cache on theDVS server after a write has completed.
nokillprocess disables the killing of processes that have written data to aDVS server when a server fails. When a server fails, processes that havewritten data to the server are not killed. If a process continues to performoperations with an open file descriptor that had been used to write data to theserver, the operations fail (with errno set to EHOSTDOWN). A new open of thefile is allowed, and subsequent operations with the corresponding filedescriptor function normally.
● Default setting: killprocess or 1
Cray DVS
S3016 137
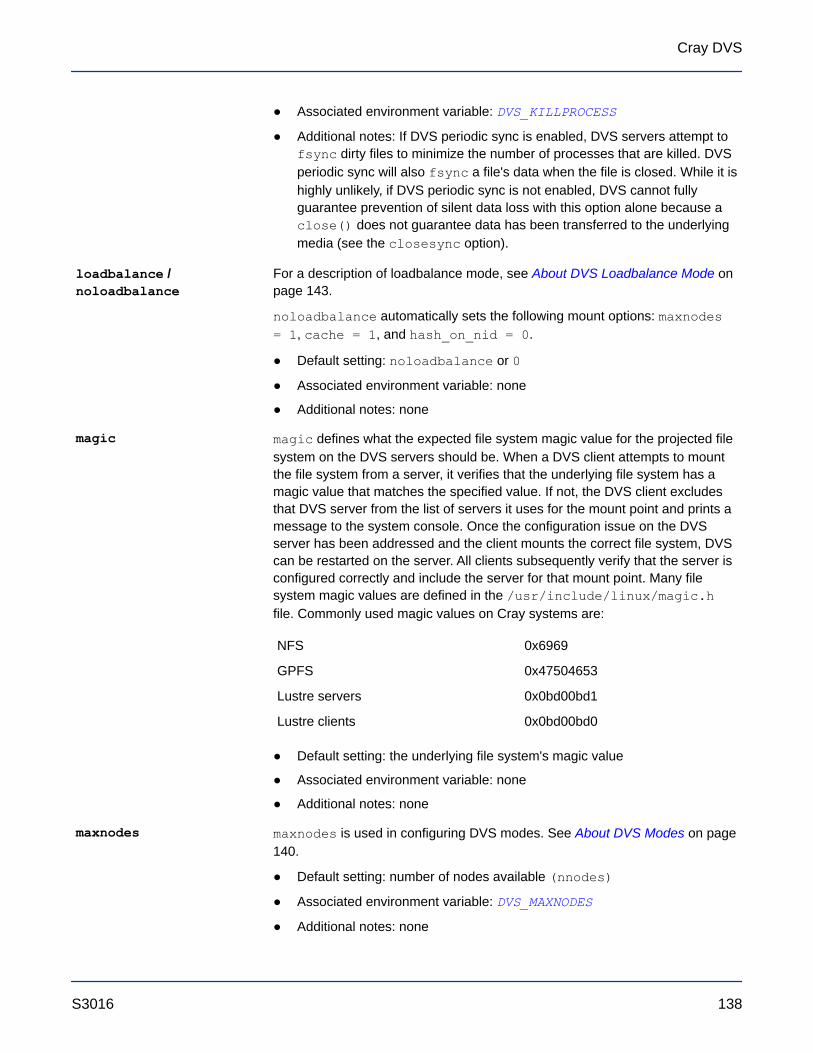
● Associated environment variable: DVS_KILLPROCESS
● Additional notes: If DVS periodic sync is enabled, DVS servers attempt tofsync dirty files to minimize the number of processes that are killed. DVSperiodic sync will also fsync a file's data when the file is closed. While it ishighly unlikely, if DVS periodic sync is not enabled, DVS cannot fullyguarantee prevention of silent data loss with this option alone because aclose() does not guarantee data has been transferred to the underlyingmedia (see the closesync option).
loadbalance /noloadbalance
For a description of loadbalance mode, see About DVS Loadbalance Mode onpage 143.
noloadbalance automatically sets the following mount options: maxnodes= 1, cache = 1, and hash_on_nid = 0.
● Default setting: noloadbalance or 0
● Associated environment variable: none
● Additional notes: none
magic magic defines what the expected file system magic value for the projected filesystem on the DVS servers should be. When a DVS client attempts to mountthe file system from a server, it verifies that the underlying file system has amagic value that matches the specified value. If not, the DVS client excludesthat DVS server from the list of servers it uses for the mount point and prints amessage to the system console. Once the configuration issue on the DVSserver has been addressed and the client mounts the correct file system, DVScan be restarted on the server. All clients subsequently verify that the server isconfigured correctly and include the server for that mount point. Many filesystem magic values are defined in the /usr/include/linux/magic.hfile. Commonly used magic values on Cray systems are:
NFS 0x6969
GPFS 0x47504653
Lustre servers 0x0bd00bd1
Lustre clients 0x0bd00bd0
● Default setting: the underlying file system's magic value
● Associated environment variable: none
● Additional notes: none
maxnodes maxnodes is used in configuring DVS modes. See About DVS Modes on page140.
● Default setting: number of nodes available (nnodes)
● Associated environment variable: DVS_MAXNODES
● Additional notes: none
Cray DVS
S3016 138
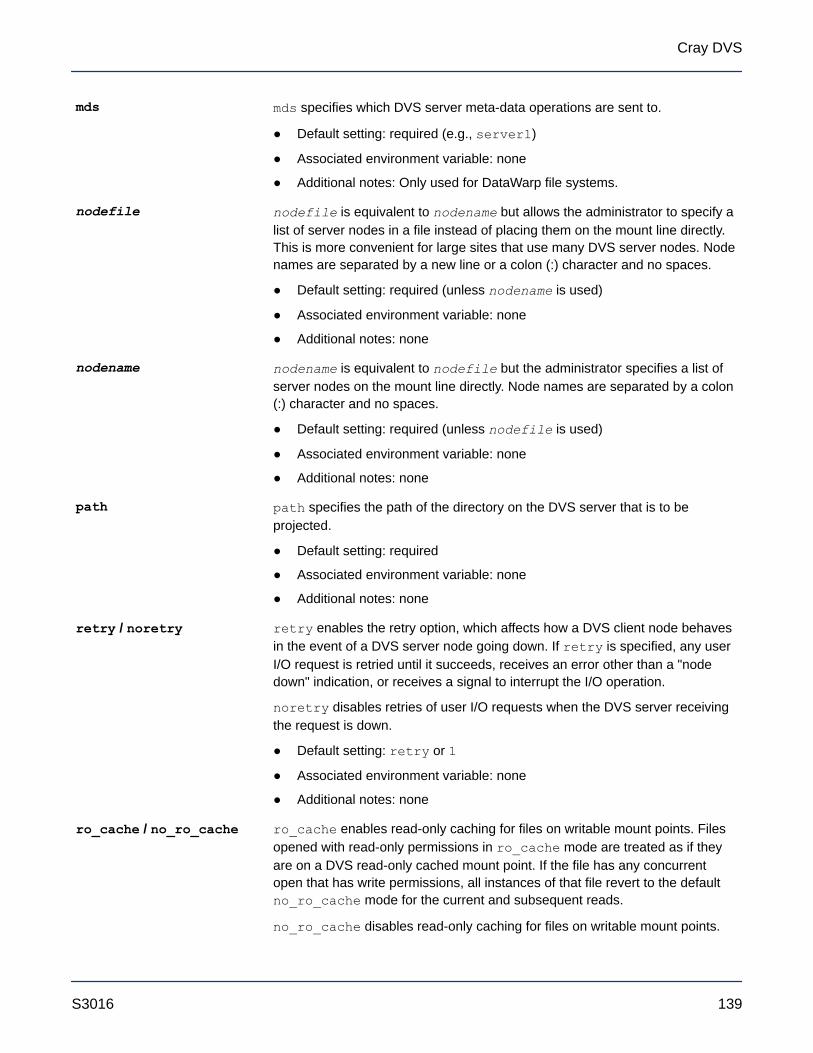
mds mds specifies which DVS server meta-data operations are sent to.
● Default setting: required (e.g., server1)
● Associated environment variable: none
● Additional notes: Only used for DataWarp file systems.
nodefile nodefile is equivalent to nodename but allows the administrator to specify alist of server nodes in a file instead of placing them on the mount line directly.This is more convenient for large sites that use many DVS server nodes. Nodenames are separated by a new line or a colon (:) character and no spaces.
● Default setting: required (unless nodename is used)
● Associated environment variable: none
● Additional notes: none
nodename nodename is equivalent to nodefile but the administrator specifies a list ofserver nodes on the mount line directly. Node names are separated by a colon(:) character and no spaces.
● Default setting: required (unless nodefile is used)
● Associated environment variable: none
● Additional notes: none
path path specifies the path of the directory on the DVS server that is to beprojected.
● Default setting: required
● Associated environment variable: none
● Additional notes: none
retry / noretry retry enables the retry option, which affects how a DVS client node behavesin the event of a DVS server node going down. If retry is specified, any userI/O request is retried until it succeeds, receives an error other than a "nodedown" indication, or receives a signal to interrupt the I/O operation.
noretry disables retries of user I/O requests when the DVS server receivingthe request is down.
● Default setting: retry or 1
● Associated environment variable: none
● Additional notes: none
ro_cache / no_ro_cache ro_cache enables read-only caching for files on writable mount points. Filesopened with read-only permissions in ro_cache mode are treated as if theyare on a DVS read-only cached mount point. If the file has any concurrentopen that has write permissions, all instances of that file revert to the defaultno_ro_cache mode for the current and subsequent reads.
no_ro_cache disables read-only caching for files on writable mount points.
Cray DVS
S3016 139

● Default setting: no_ro_cache or 0
● Associated environment variable: none
● Additional notes: none
userenv / nouserenv userenv argument specifies that DVS must honor end user environmentvariable overrides for DVS mount options.
nouserenv argument allows the administrator to block end user environmentvariable overrides for DVS mount options.
● Default setting: userenv or 1
● Associated environment variable: none
● Additional notes: none
9.1.4 DVS Environment VariablesBy default, user environment variables allow client override of options specified in the /etc/fstab entry and areevaluated a file is opened by DVS. However, if the nouserenv option is specified in the DVS entry, then userenvironment variables are disabled.
The following environment variables are for use in the default case:
Variable Name Options Purpose
DVS_ATOMIC on|off Overrides the atomic or noatomic mount options.
DVS_BLOCKSIZE n A nonzero number, n overrides the blksize mount option.
DVS_CACHE on|off Overrides the cache or nocache mount options. This option is available onlyfor read-only mount points and is ignored for writeable mount points.
DVS_CACHE_READ_SZ n A positive integer, n overrides the cache_read_sz mount option.
DVS_CLOSESYNC on|off Overrides the closesync or noclosesync mount options.
DVS_DATASYNC on|off Overrides the datasync or nodatasync mount options.
NOTE: Setting DVS_DATASYNC to on can slow down an applicationconsiderably. Consider using periodic sync.
DVS_DEFEROPENS on|off Overrides the deferopens or nodeferopens mount options.
DVS_KILLPROCESS on|off Overrides the killprocess or nokillprocess mount options.
DVS_MAXNODES n A nonzero number, n overrides the maxnodes mount option. The specifiedvalue of maxnodes must be greater than zero and less than or equal to thenumber of server nodes specified on the mount, otherwise the variable has noeffect.
9.1.5 Modes
Cray DVS
S3016 140
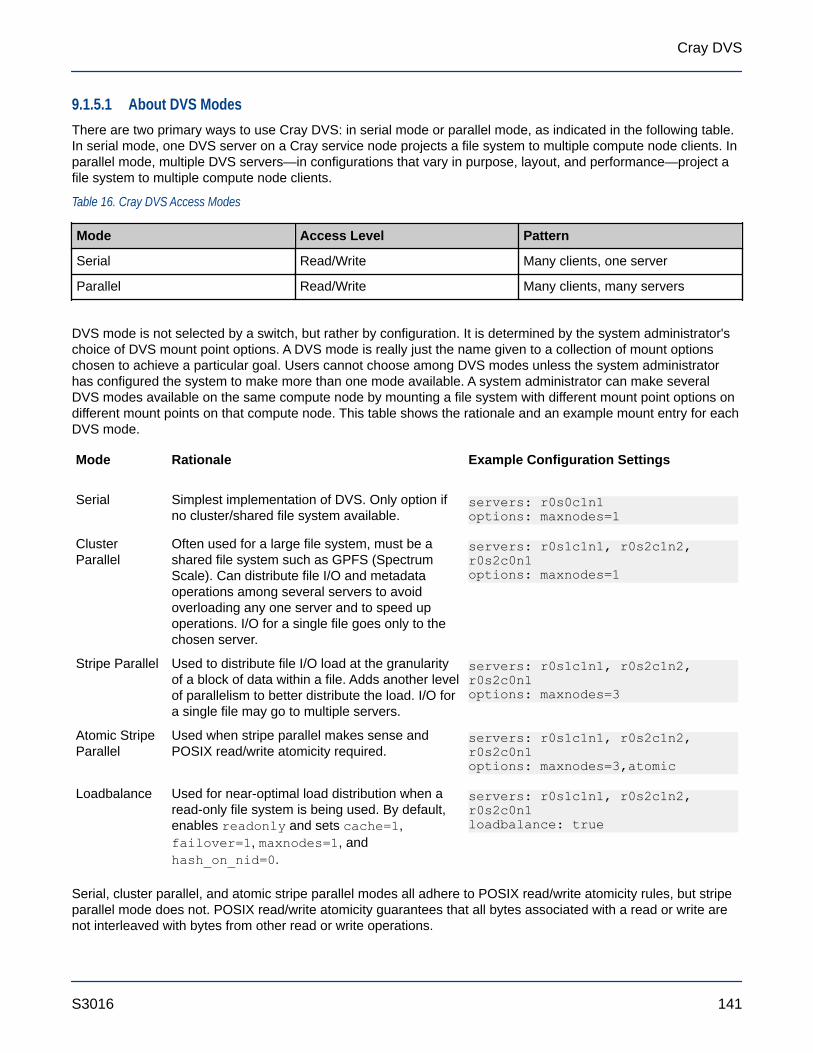
9.1.5.1 About DVS ModesThere are two primary ways to use Cray DVS: in serial mode or parallel mode, as indicated in the following table.In serial mode, one DVS server on a Cray service node projects a file system to multiple compute node clients. Inparallel mode, multiple DVS servers—in configurations that vary in purpose, layout, and performance—project afile system to multiple compute node clients.
Table 16. Cray DVS Access Modes
Mode Access Level Pattern
Serial Read/Write Many clients, one server
Parallel Read/Write Many clients, many servers
DVS mode is not selected by a switch, but rather by configuration. It is determined by the system administrator'schoice of DVS mount point options. A DVS mode is really just the name given to a collection of mount optionschosen to achieve a particular goal. Users cannot choose among DVS modes unless the system administratorhas configured the system to make more than one mode available. A system administrator can make severalDVS modes available on the same compute node by mounting a file system with different mount point options ondifferent mount points on that compute node. This table shows the rationale and an example mount entry for eachDVS mode.
Mode Rationale Example Configuration Settings Serial Simplest implementation of DVS. Only option if
no cluster/shared file system available.servers: r0s0c1n1options: maxnodes=1
ClusterParallel
Often used for a large file system, must be ashared file system such as GPFS (SpectrumScale). Can distribute file I/O and metadataoperations among several servers to avoidoverloading any one server and to speed upoperations. I/O for a single file goes only to thechosen server.
servers: r0s1c1n1, r0s2c1n2, r0s2c0n1options: maxnodes=1
Stripe Parallel Used to distribute file I/O load at the granularityof a block of data within a file. Adds another levelof parallelism to better distribute the load. I/O fora single file may go to multiple servers.
servers: r0s1c1n1, r0s2c1n2, r0s2c0n1options: maxnodes=3
Atomic StripeParallel
Used when stripe parallel makes sense andPOSIX read/write atomicity required.
servers: r0s1c1n1, r0s2c1n2, r0s2c0n1options: maxnodes=3,atomic
Loadbalance Used for near-optimal load distribution when aread-only file system is being used. By default,enables readonly and sets cache=1,failover=1, maxnodes=1, andhash_on_nid=0.
servers: r0s1c1n1, r0s2c1n2, r0s2c0n1loadbalance: true
Serial, cluster parallel, and atomic stripe parallel modes all adhere to POSIX read/write atomicity rules, but stripeparallel mode does not. POSIX read/write atomicity guarantees that all bytes associated with a read or write arenot interleaved with bytes from other read or write operations.
Cray DVS
S3016 141

9.1.5.2 About DVS Serial ModeSerial mode is the simplest implementation of DVS, where each file system is projected from a single DVS serverto multiple clients (see figure). DVS can project multiple file systems in serial mode by assigning a new or existingDVS server to each additional file system in serial access mode and entering the appropriate mount point on theclients. The following example mount entry contains the mount options essential for serial mode: a singlenodename and maxnodes=1.
mount -o nodename=server1, maxnodes=1
DVS serial mode adheres to POSIX read/write atomicity rules.
Figure 54. Cray DVS Serial Access Mode
Cray System
DVS Client DVS Client
Application
DVS Client
FS Client
FS Server
Disk FS
DVS Server
Application
DVS Client
Application Application
9.1.5.3 About DVS Cluster Parallel ModeIn cluster parallel access mode, each client interacts with multiple servers. For example, in the figure below, DVSis mounted to /foo on the DVS client, and three different files—bar1, bar2, and bar3—are handled by threedifferent DVS servers, thus distributing the load. The server used to perform the read, write, or metadataoperation is selected using an internal hash involving the underlying file or directory inode number. Once a serverhas been selected for a file, it looks similar to serial mode: all I/O from all clients involving that file routes to thatserver to prevent file system coherency thrash.
The following example mount entry contains the mount options essential for cluster parallel mode: more than onenodename and maxnodes=1.
mount -o nodename=server1:server2:server3, maxnodes=1
DVS cluster parallel mode adheres to POSIX read/write atomicity rules.
Cray DVS
S3016 142
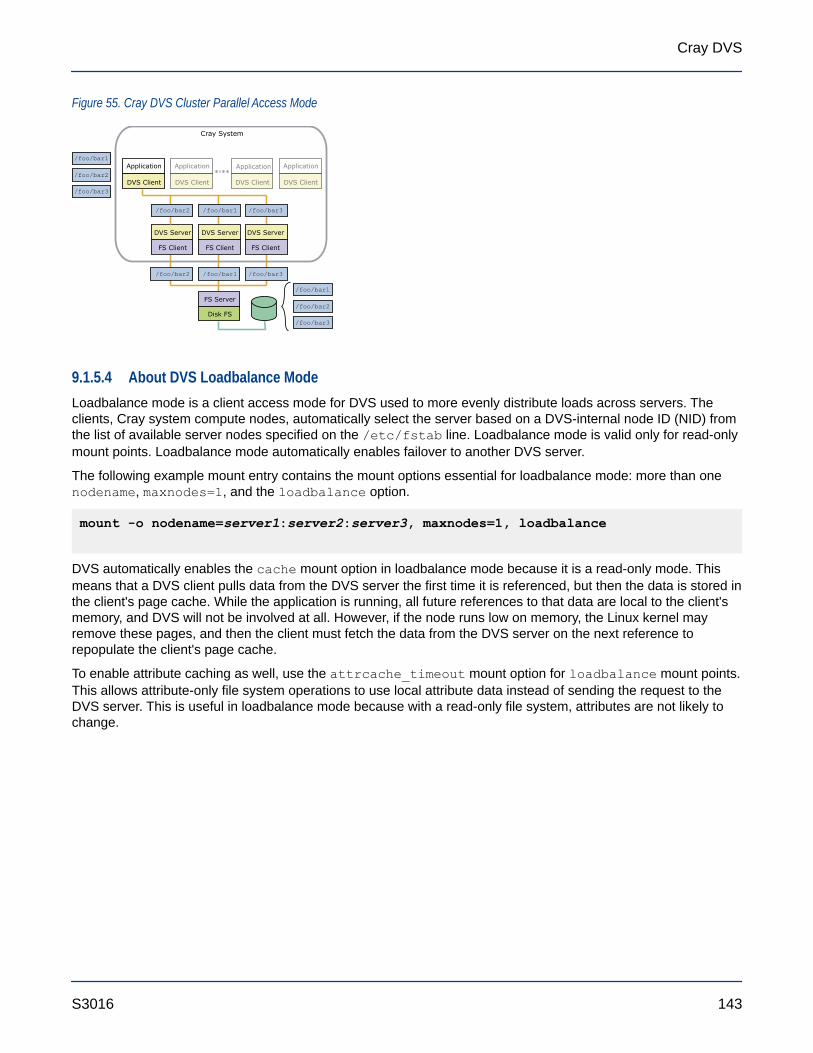
Figure 55. Cray DVS Cluster Parallel Access Mode
Cray System
DVS ServerDVS Server DVS Server
Application
DVS Client
FS Server
Disk FS
FS Client
DVS Server
FS Client
DVS Server
FS Client
DVS Server
Application
DVS Client
Application
DVS Client
Application
DVS Client
/foo/bar1
/foo/bar2
/foo/bar3
/foo/bar3/foo/bar1/foo/bar2
/foo/bar3/foo/bar1/foo/bar2
/foo/bar1
/foo/bar2
/foo/bar3
9.1.5.4 About DVS Loadbalance ModeLoadbalance mode is a client access mode for DVS used to more evenly distribute loads across servers. Theclients, Cray system compute nodes, automatically select the server based on a DVS-internal node ID (NID) fromthe list of available server nodes specified on the /etc/fstab line. Loadbalance mode is valid only for read-onlymount points. Loadbalance mode automatically enables failover to another DVS server.
The following example mount entry contains the mount options essential for loadbalance mode: more than onenodename, maxnodes=1, and the loadbalance option.
mount -o nodename=server1:server2:server3, maxnodes=1, loadbalance
DVS automatically enables the cache mount option in loadbalance mode because it is a read-only mode. Thismeans that a DVS client pulls data from the DVS server the first time it is referenced, but then the data is stored inthe client's page cache. While the application is running, all future references to that data are local to the client'smemory, and DVS will not be involved at all. However, if the node runs low on memory, the Linux kernel mayremove these pages, and then the client must fetch the data from the DVS server on the next reference torepopulate the client's page cache.
To enable attribute caching as well, use the attrcache_timeout mount option for loadbalance mount points.This allows attribute-only file system operations to use local attribute data instead of sending the request to theDVS server. This is useful in loadbalance mode because with a read-only file system, attributes are not likely tochange.
Cray DVS
S3016 143
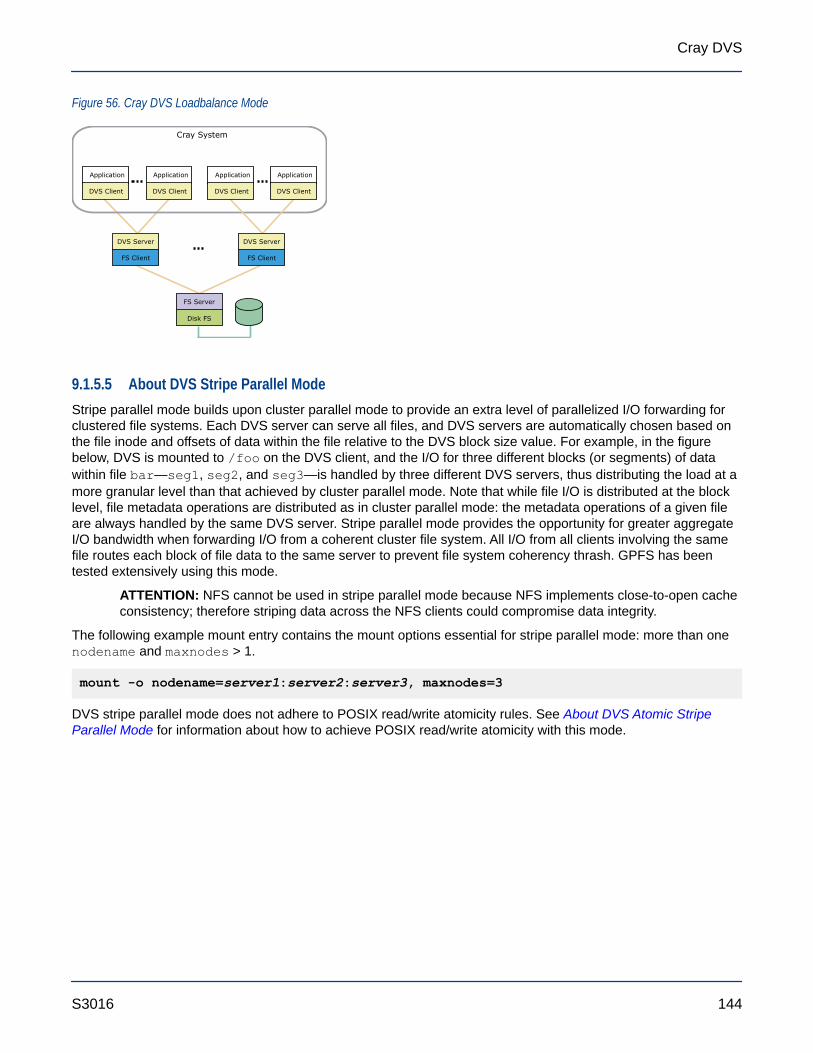
Figure 56. Cray DVS Loadbalance Mode
Cray System
FS Server
Disk FS
Application
DVS Client
DVS Server
FS Client
Application
DVS Client
Application
DVS Client
Application
DVS Client
FS Client
DVS Server
9.1.5.5 About DVS Stripe Parallel ModeStripe parallel mode builds upon cluster parallel mode to provide an extra level of parallelized I/O forwarding forclustered file systems. Each DVS server can serve all files, and DVS servers are automatically chosen based onthe file inode and offsets of data within the file relative to the DVS block size value. For example, in the figurebelow, DVS is mounted to /foo on the DVS client, and the I/O for three different blocks (or segments) of datawithin file bar—seg1, seg2, and seg3—is handled by three different DVS servers, thus distributing the load at amore granular level than that achieved by cluster parallel mode. Note that while file I/O is distributed at the blocklevel, file metadata operations are distributed as in cluster parallel mode: the metadata operations of a given fileare always handled by the same DVS server. Stripe parallel mode provides the opportunity for greater aggregateI/O bandwidth when forwarding I/O from a coherent cluster file system. All I/O from all clients involving the samefile routes each block of file data to the same server to prevent file system coherency thrash. GPFS has beentested extensively using this mode.
ATTENTION: NFS cannot be used in stripe parallel mode because NFS implements close-to-open cacheconsistency; therefore striping data across the NFS clients could compromise data integrity.
The following example mount entry contains the mount options essential for stripe parallel mode: more than onenodename and maxnodes > 1.
mount -o nodename=server1:server2:server3, maxnodes=3
DVS stripe parallel mode does not adhere to POSIX read/write atomicity rules. See About DVS Atomic StripeParallel Mode for information about how to achieve POSIX read/write atomicity with this mode.
Cray DVS
S3016 144

Figure 57. Cray DVS Stripe Parallel Mode
DVS Server
Application
DVS Client
FS Server
Disk FS
seg3
seg3
DVS Server
FS Client
DVS Server
seg2seg1
seg2
seg1
seg3seg2seg1
seg3
seg2
seg1
Application
DVS Client
Application
DVS Client
Application
DVS Client
Cray System
FS Client FS Client
DVS Server
/foo/bar
/foo/bar
9.1.5.5.1 About DVS Atomic Stripe Parallel Mode
Stripe parallel mode provides parallelism within a file at the granularity of the DVS block size. However, whenapplications do not use their own file locking, stripe parallel mode cannot guarantee POSIX read/write atomicity. Incontrast, atomic stripe parallel mode adheres to POSIX read/write atomicity rules while still allowing for possibleparallelism within a file. It is similar to stripe parallel mode in that the server used to perform the read, write, ormetadata operation is selected using an internal hash involving the underlying file or directory inode number, andthe offset of data into the file is relative to the DVS block size. However, once that server is selected, the entireread or write request is handled by that server only. This ensures that all I/O requests are atomic while allowingDVS clients to access different servers for subsequent I/O requests if they have different starting offsets within thefile.
The following example mount entry contains the mount options essential for atomic stripe parallel mode: morethan one nodename, maxnodes > 1, and the atomic option.
mount -o nodename=server1:server2:server3, maxnodes=3, atomic
Users can request atomic stripe parallel mode by setting the DVS_ATOMIC user environment variable to on.
9.1.6 Resiliency and Diagnostics
9.1.6.1 About DVS FailoverDVS clients use resiliency communication agent (RCA) events to determine when server nodes have failed orwhen DVS has been unloaded from a server node and when server nodes have been booted and DVS isreloaded. This ensures that all clients are informed of server failures and reboots in the same manner at the sametime, which reduces the underlying file system coherency traffic associated with rerouting I/O operations awayfrom downed servers and back to rebooted servers.
Cray DVS supports failover and failback for parallel modes:
● For cluster, stripe, and atomic stripe parallel modes, add the failover option to the mount lineor /etc/fstab entry to specify failover and failback.
● For loadbalance mode, failover and failback are specified by default.
DVS failover and failback are done in an active-active manner. Multiple servers must be specified inthe /etc/fstab entry for failover and failback to function. When a server fails, it is taken out of the list of servers
Cray DVS
S3016 145

to use for the mount point until it is rebooted. All open and new files use the remaining servers as described bythe cluster, stripe, and atomic stripe parallel sections. Files not using the failed server are not affected.
When failover occurs:
● If all servers fail, I/O is retried as described by the retry option (see DVS Client Mount Point Options onpage 133).
● Any mount point using loadbalance mode automatically recalibrates the existing client-to-server routes toensure that the clients are evenly distributed across the remaining servers. When failback occurs, thisprocess is repeated.
● Any mount point using cluster parallel mode automatically redirects I/O to one of the remaining DVS serversfor any file that previously routed to the now-down server. When failback occurs, files are rerouted to theiroriginal server.
● Any mount point using stripe parallel mode or atomic stripe parallel mode automatically restripes I/O acrossthe remaining DVS servers in an even manner. When failback occurs, files are restriped to their originalpattern.
Client System Console Message: "DVS: file_node_down: removing from list of available serversfor 2 mount points"
The following message indicates that a DVS server has failed.
DVS: file_node_down: removing r0s1c1n3 from list of availableservers for 2 mount points
In this example, r0s1c1n3 is the DVS server that has failed and has been removed from the listof available mount points provided in the /etc/fstab entry for the DVS projection.
After the issue is resolved, the following message is printed to the console log of each client ofthe projection:
DVS: file_node_up: adding r0s1c1n3 back to list of available servers for 2 mount points
9.1.6.2 About DVS Periodic SyncDVS periodic sync improves data resiliency and facilitates a degree of application resiliency so that applicationsmay continue executing in the event of a stalled file system or DVS server failure. Without periodic sync, such anevent would result in DVS clients killing any processes with open files that were written through the failed server.Any data written through that server that was only in the server's page cache and not written to disk would be lost,and processes using the file would see data corruption.
Periodic sync works by periodically performing fsync on individual files with dirty pages on the DVS servers, toensure those files are written to disk. For each file, the DVS client tracks when a DVS server performs a file syncand when processes on DVS clients write to it, and then notifies the DVS server when fsync is needed.
DVS periodic sync makes the DVS closesync mount option redundant. Periodic sync is more efficient thanclosesync because it is aware of which files may have dirty pages.
Use the following three /proc files to tune DVS periodic sync behavior (echo desired value into each file):
Cray DVS
S3016 146
/proc/fs/dvs/sync_num_threads Specifies the number of threads on the DVS server thatperform sync operations. There must be at least 1 thread andthe maximum number is 32. The default value is 8.
/proc/fs/dvs/sync_dirty_timeout_secs On DVS servers, specifies the number of seconds that musthave passed since the file was written before DVS syncs it.The default value is 300. The objective is to reduceunnecessary sync operations for files actively being updated.Decreasing this number increases the likelihood that the file isin use when it is synced. Increasing this number increases thelikelihood that processes are killed during a server failure.
On DVS clients, specifies the number of seconds that musthave passed since the file was written before DVS asks theserver for an updated sync time. The default value is 300.Decreasing this number increases the number of DVSrequests being sent. Increasing this number increases thelikelihood that processes are killed during a server failure.
/proc/fs/dvs/sync_period_secs On DVS servers, specifies the number of seconds before thesync_num_threads syncs files on the DVS server (ifnecessary). The default value is 300.
On DVS clients, specifies the number of seconds betweenchecks for dirty files that need to request the last sync timefrom the server. The default value is 600.
A fourth /proc file, /procsfs/dvs/sync_stats, collects statistics of the syncing behavior. This setting is nottunable (read only).
9.1.6.3 About DVS StatisticsThe /proc/fs/dvs/stats file contains statistics for system operations that cannot be correlated to a specificDVS mount point, and is thus most interesting on DVS servers.
The same type of information is also available on DVS clients at the mount point(/proc/fs/dvs/mounts/0/stats, /proc/fs/dvs/mounts/1/stats, etc.) Each of these files contains thestatistics for that specific mount point only. More information about each of these mount points can be obtained byviewing the mount file that resides in the same directory (e.g., /proc/fs/dvs/mounts/0/mount).
● The first section of the file contains remote procedure call (RPC) message-passing statistics. Each linedisplays a file system operation, followed by counts of successful and failed send operations of that type,counts of successful and failed receive operations of that type, the time it took to process the most recentoperation of that type, and the maximum time to process that operation in the history of the system.
● The second section of the file contains statistics on virtual file system (VFS) operations. Each line displays acallback name, followed by counts of successful and failed callbacks of that name, the time it took to processthe most recent callback of that name, and the maximum time to process that callback in the history of thesystem.
● The third section contains fields for the smallest and largest request sizes (in bytes) for read and writeoperations, and the number of successful and failed interprocess communication (IPC) requests, IPCasynchronous requests, and IPC replies.
In addition, the /proc/fs/dvs/ipc/stats file displays DVS IPC statistics such as bytes transferred andreceived, NAK counts, and so forth. It also displays message counts by type and size.
Cray DVS
S3016 147
DVS statistics are enabled and collected by default.
● To disable a DVS statistics file, write a zero into the file:
echo 0 > /proc/fs/dvs/stats● To re-enable a DVS statistics file, write a 1 into the file:
echo 1 > /proc/fs/dvs/stats● To reset the statistics values to zero, write a 2 into the file:
echo 2 > /proc/fs/dvs/stats
9.1.6.4 About DVS Client RequestsDVS provides a list of outstanding requests on client nodes in /proc/fs/dvs/ipc/requests, which lists theDVS server node, the request, the DVS file system path, uid, time that the request has been waiting for aresponse, and the associated apid. If the request is from a process that was not spawned through aprun, therequest apid is 0. An example output of the file looks like:
% cat /proc/fs/dvs/ipc/requestsserver: r0s1c1n3 request: RQ_LOOKUP path: /dsl/ufs/home user: 12795 time: 0.000 secapid: 3871
The file appears on DVS servers but returns an error when a user tries to access it.
9.1.7 Caveats
9.1.7.1 Caveat: Client ConsistencyDVS supports close-to-open consistency, which means that files on client and server are consistent at open()and close(). However, while a file is open, DVS does not guarantee that the file on the client and the file on theserver are consistent.
9.1.7.2 Caveat: DVS blksize Must Match or be a Multiple of GPFS Block SizeWhen projecting a general parallel file system (GPFS), the client mount option blksize must match or be amultiple of the GPFS blocksize. When projecting multiple GPFS file systems that have different block sizes, DVSmust have a different /etc/fstab entry for each file system.
In the case of two GPFS file systems, one with a 64 kilobyte (KB) block size, and another with a1024KB block size, the /etc/fstab entries for DVS would look like the following:
/gpfs1 /dvs1 dvs path=/dvs1,nodefile=/etc/nidlist1,blksize=65536/gpfs2 /dvs2 dvs path=/dvs2,nodefile=/etc/nidlist2,blksize=1048576
Cray DVS
S3016 148
9.1.7.3 Caveat: Expanded File System SupportSetting up and mounting target file systems on Cray service nodes is the sole responsibility of the customer or anagent of the customer. Cray Custom Engineering is available to provide a tailored file system solution. Pleasecontact a Cray service representative for more information.
9.1.7.4 Caveat: flock() Not SupportedDVS does not support flock() system calls and will return an error. DVS will set errno to ENOTSUPP when aflock() call is attempted for a DVS-projected file system.
DVS supports file locking with fcntl().
For more information, see the fcntl(2) man page.
9.1.7.5 Caveat: mmap() SupportDVS currently supports only read-only access when the MAP_SHARED flag is specified to the memory mapfunction mmap(). This is because writable shared mmaps are cached in the Linux kernel page cache, and DVSdoes not maintain consistency between DVS clients and DVS servers. Therefore the file data cached on the DVSclient may not be kept coherent with other accesses to the file data from other nodes. This may cause DVS to seterrno to ENOSYS. Write access is expected to be available in the next release.
Write access is available when the MAP_PRIVATE flag is specified to mmap() because the file data is private tothe process that performed the mmap() and therefore coherency with other processes is not a problem.
9.1.8 Administrative Tasks
9.1.8.1 Disable DVS Fairness of Service
About this taskDVS creates user- or job-specific request queues for clients. Originally, DVS used one queue to handle requestsin a FIFO (first-in, first out) fashion. This meant that since all clients shared one queue, a demanding job could taxthe server disproportionately and the other clients would have to wait until the demanding client's request(s)completed. Fairness of Service creates a list of queues—one queue for each client and/or job. The list of queuesis processed in a circular fashion. When a message thread is available, it fetches the first queue on the list,moves that queue to the end of the list, and processes the first message in that queue. This helps to distribute theworkload and potentially helps contending applications perform better.
Fairness of Service is enabled by default. This procedure describes how to disable Fairness of Service.
Procedure
1. Stop DVS on all servers.
NOTE: This would typically be done only during a maintenance interval, because this is a drasticaction.
2. Edit /etc/modprobe.d/dvs.conf file on all the DVS server NIDs configured in the cluster to enter thefollowing line :
Cray DVS
S3016 149

options dvsipc_single_msg_queue=1
3. Restart DVS on all servers.
9.1.8.2 Force a Cache Revalidation on a DVS Mount Point
About this taskMounting DVS with the attrcache_timeout=[time_in_seconds] option can improve performance because cachedfile attributes on a DVS client preclude the need to make some requests of the DVS server. Unfortunately, if thefile attributes of the DVS mounted file system changed, the only way to revalidate the cache was to wait the entiretimeout, which is often as long as four hours. Users can force a cache revalidation at any time, not just when thetimeout has expired, by using the following procedure.
Procedure
1. Force a cache revalidation on a DVS client using one of the following methods:
● To revalidate all cached attributes on a single DVS mount point, echo 1 into that mount point'sdrop_caches proc file. The following example uses the second mount point on the client and uses thecat command first to confirm that is the desired mount point. To specify a different mount point, replacethe 2 with 0-n.
cat /proc/fs/dvs/mounts/2/mountecho 1 > /proc/fs/dvs/mounts/2/drop_caches
● To revalidate all attributes across all DVS mounts, echo 1 into the universal DVS drop_caches procfile. For example:
echo 1 > /proc/fs/dvs/drop_caches
2. (Optional) Clear out other caches on the DVS client to ensure that all data is revalidated.
echo 3 > /proc/sys/vm/drop_caches
3. (Optional) Clear out other caches on the DVS server to ensure that all data is revalidated.
If an NFS file system is the underlying file system, it is also likely that the same procedure will be required onthe DVS servers to allow all of the changes on the NFS file system to properly propagate out to the DVSclients. This has to do with NFS caching behavior.
echo 3 > /proc/sys/vm/drop_caches
9.1.8.3 Project XFS over DVS
About this taskThe following procedure is used to project an XFS file system over DVS to compute and service node clients inCray systems.
Cray DVS
S3016 150

Procedure
1. Edit the /etc/exports file on the DVS server node and add the appropriate export:
/xfs/scratch *(rw,no_root_squash,no_subtree_check)
2. Find the attached XFS devices.
nid00006# ls -l /dev/disk/by-id/dm-uuid-mpath-360080e50002ff41a000004*lrwxrwxrwx 1 root root 10 May 3 10:29 /dev/disk/by-id/dm-uuid-mpath-360080e50002ff41a0000040b517a2609 \-> ../../dm-3lrwxrwxrwx 1 root root 10 May 3 10:29 /dev/disk/by-id/dm-uuid-mpath-360080e50002ff41a0000040e517a261e \-> ../../dm-4lrwxrwxrwx 1 root root 10 May 3 10:30 /dev/disk/by-id/dm-uuid-mpath-360080e50002ff41a000004a851837c9b \-> ../../dm-5nid00006# fdisk -l /dev/disk/by-id/dm-uuid-mpath-360080e50002ff41a000004*Disk /dev/disk/by-id/dm-uuid-mpath-360080e50002ff41a0000040b517a2609: 7999.4 GB, 7999443697664 bytes255 heads, 63 sectors/track, 972543 cylinders, total 15623913472 sectorsUnits = sectors of 1 * 512 = 512 bytesSector size (logical/physical): 512 bytes / 512 bytesI/O size (minimum/optimal): 512 bytes / 512 bytesDisk identifier: 0x00000000Disk /dev/disk/by-id/dm-uuid-mpath-360080e50002ff41a0000040b517a2609 doesn't contain a valid \partition tableDisk /dev/disk/by-id/dm-uuid-mpath-360080e50002ff41a0000040e517a261e: 7999.4 GB, 7999443697664 bytes255 heads, 63 sectors/track, 972543 cylinders, total 15623913472 sectorsUnits = sectors of 1 * 512 = 512 bytesSector size (logical/physical): 512 bytes / 512 bytesI/O size (minimum/optimal): 512 bytes / 512 bytesDisk identifier: 0x00000000Disk /dev/disk/by-id/dm-uuid-mpath-360080e50002ff41a0000040e517a261e doesn't contain a valid \partition tableDisk /dev/disk/by-id/dm-uuid-mpath-360080e50002ff41a000004a851837c9b: 1798.8 GB, 1798765019136 bytes255 heads, 63 sectors/track, 218687 cylinders, total 3513212928 sectorsUnits = sectors of 1 * 512 = 512 bytesSector size (logical/physical): 512 bytes / 512 bytesI/O size (minimum/optimal): 512 bytes / 512 bytesDisk identifier: 0x00000000Disk /dev/disk/by-id/dm-uuid-mpath-360080e50002ff41a000004a851837c9b doesn'tcontain a valid partition table
3. Make a writable /etc/lvm.
nid00006# mkdir /tmp/lvmnid00006# cp -rp /etc/lvm/* /tmp/lvm/nid00006# cp /tmp/lvm/lvm.conf /tmp/lvm/lvm.tmpnid00006# mv /tmp/lvm/lvm.tmp /tmp/lvm/lvm.confnid00006# mount -o bind /tmp/lvm /etc/lvm
4. Edit the /etc/lvm/lvm.conf file on the DVS server node.
Cray DVS
S3016 151
a. Edit the /etc/lvm/lvm.conf file.
node/6# vi -n 6 /etc/lvm/lvm.conf
b. Add the following custom filter to the configuration file:
filter = [ "a|/dev/disk/by-id/dm-uuid-.*mpath-.*|", "r/.*/" ]
c. Remove any previous filters from the configuration file.
5. Edit the /etc/sysconfig/lvm file to append the following string.
LVM_ACTIVATED_ON_DISCOVERED="enable" #LVM_VGS_ACTIVATED_ON_BOOT="`grep '/dev/' /etc/fstab | sed 's/\t.*//g' | sed 's,/*[^/]\+/*$,,' | sed '$!N; /^\(.*\)\n\1$/!P; D'`" LVM_VGS_ACTIVATED_ON_BOOT="fs1"
6. Initialize LVM physical disks and verify intitialization.
For this configuration, all the disks in /dev/disk/by-id/ are for the LVM volumes.
a. Initialize LVM physical disks (while logged on to nid00006).
nid00006# pvcreate /dev/disk/by-id/dm-uuid-mpath-360080e50002ff41a0000040b517a2609Physical volume "/dev/disk/by-id/dm-uuid-mpath-360080e50002ff41a0000040b517a2609" successfully creatednid00006# pvcreate /dev/disk/by-id/dm-uuid-mpath-360080e50002ff41a0000040e517a261ePhysical volume "/dev/disk/by-id/dm-uuid-mpath-360080e50002ff41a0000040e517a261e" successfullycreated
b. Display the volumes to verify that the disks have been initialized.
nid00006# pvdisplay"/dev/disk/by-id/dm-uuid-mpath-360080e50002ff41a0000040b517a2609" is a new physical \volume of "7.28 TiB"--- NEW Physical volume ---PV Name /dev/disk/by-id/dm-uuid-mpath-360080e50002ff41a0000040b517a2609VG NamePV Size 7.28 TiBAllocatable NOPE Size 0Total PE 0Free PE 0Allocated PE 0PV UUID Llb2m3-3AZC-LuWT-ttfH-2iB2-GH3J-oas5W1"/dev/disk/by-id/dm-uuid-mpath-360080e50002ff41a0000040e517a261e" is a new physical \volume of "7.28 TiB"--- NEW Physical volume ---PV Name /dev/disk/by-id/dm-uuid-mpath-360080e50002ff41a0000040e517a261eVG NamePV Size 7.28 TiBAllocatable NOPE Size 0Total PE 0Free PE 0
Cray DVS
S3016 152

Allocated PE 0PV UUID PRCPkx-3Tan-IHgr-0ZLh-iTGt-XWzY-pBkUpM
7. Create the volume group. Keep the physical volumes in the same volume group.
nid00006# vgcreate fs1 /dev/disk/by-id/dm-uuid-mpath-360080e50002ff41a0000040b517a2609/dev/disk/by-id/dm-uuid-mpath-360080e50002ff41a0000040e517a261eVolume group "fs1" successfully created
8. Create logical volumes.
nid00006# lvcreate --stripes 2 --stripesize 512k --extents 100%FREE --name fs1 fs1Logical volume "fs1" created
9. Create the XFS file system using mkfs.
nid0006# mkfs -t xfs /dev/fs1/fs1
10. Mount the XFS file system and verify its availability.
a. Mount the XFS file system to the service node.
nid0006# mount -t xfs /dev/fs1/fs1 /mnt
b. Display the mount to verify that the file system is available.
nid00006# df -h --type xfsFilesystem Size Used Avail Use% Mounted on/dev/mapper/fs1-fs1 15T 34M 15T 1% /mnt
11. Edit the /etc/fstab file on the DVS server node to add the following:
/dev/mapper/fs1-fs1 /scratch xfs defaults 1 0
If there is a secondary XFS/DVS node used as a high-availability manual backup and failover device for theprimary XFS/DVS node, do not add the mount definition entry to that node configuration. XFS is neither aclustered nor a shared file system and can be natively mounted on only one node at any given time. If the filesystem is mounted on more than one node, there is a great risk of data corruption.
9.1.8.4 Configure DVS Using modeprobe.d
About this taskMost DVS parameters are typically changed by adding lines to a modprobe.d configuration file or echoing valuesto a /proc file. Changes to a modprobe.d file are made prior to booting the affected nodes, and the changestake effect at boot.
The dvs.conf file is one of many files that are generated automatically and controlled by the Cray ConfigurationManagement Framework (CMF). Such files can be identified by the warning statement in the file header.
In the following example, DVS request logging is enabled on a node with a node ID of nid00023.
Cray DVS
S3016 153
Procedure
1. Create and change to the directory structure that is to be replicated on the target node.
smw# mkdir -p etc/modprobe.dsmw# cd etc/modprobe.d
2. Create and change to the directory structure that is to be replicated on the target node.
smw# ssh nid00023smw# mkdir -p etc/modprobe.d/smw# cd etc/modprobe.d/
3. Create or edit the DVS configuration file and add the options line(s) for the parameter to be set/changed.
For this example, the lines are from the dvs_request_log_enabled entry of the DVS kernel moduleparameters list below. Then comment/uncomment the appropriate lines, depending on which action is to betaken.
# Disable DVS request logoptions dvsproc dvs_request_log_enabled=0
# Enable DVS request log#options dvsproc dvs_request_log_enabled=1
9.1.8.5 Change Kernel Module Parameters Dynamically Using Proc FilesSome of the kernel module parameters in the following list can be changed dynamically by echoing valuesto /proc files on the appropriate nodes. Those that can be changed using that method are indicated in the list,including the name of the /proc file and the values to use. Note that such changes do not persist.
List of DVS Kernel Module Parametersdvs_request_log_enabled Logs each DVS request sent to servers.
● Default value: 0 (disabled)
● To view read-only:cat /sys/module/dvsproc/parameters/dvs_request_log_enabled
● To change prior to boot, add these lines to<nid_of_choice>/etc/modprobe.d/dvs-local.conf:
# Disable DVS request logoptions dvsproc dvs_request_log_enabled=0
# Enable DVS request log#options dvsproc dvs_request_log_enabled=1
● To change dynamically:
Cray DVS
S3016 154
hostname# echo 0 > /proc/fs/dvs/request_loghostname# echo 1 > /proc/fs/dvs/request_loghostname# echo 2 > /proc/fs/dvs/request_log
The value "2" resets the log.
dvs_request_log_size_kb Size (KB) of the request log buffer.
● Default value: 16384 KB (16384 * 1024 bytes)
● To view read-only:cat /sys/module/dvsproc/parameters/dvs_request_log_size_kb
● To change prior to boot, add these lines to<nid_of_choice>/etc/modprobe.d/dvs-local.conf:
# Set size (in kb) of the request log bufferoptions dvsproc dvs_request_log_size_kb=17000
● To change dynamically:
hostname# echo 17000 > /proc/fs/dvs/request_log_size_kb
dvs_instance_info Contains the following fields, which are parameters for the DVS thread pool in theDVS IPC layer. Most of these fields can be changed through other moduleparameters (e.g., dvsipc_msg_thread_limit and dvsipc_single_msg_queue);however, this module parameter has priority over the individual ones and if set, willoverride them.
Field Definition
thread_min Number of threads created at startup.
thread_max Maximum number of persistent threads.
thread_limit Maximum number of valid threads that DVS IPCallows to exist at one time. DVS IPC willdynamically scale up the number of threads to thisnumber as the load increases.
thread_concurrent_creates Maximum number of IPC threads that can be in theprocess of forking a new thread.
thread_nice Nice value for the threads.
single_msg_queue Disables/enables fairness of service. Setting to 1disables fairness of service by processing incomingrequests with a FIFO method. Setting to 0 (default)groups requests into different queues (qhdrs)based on apid, and round-robbins the queues tomaintain quality of service (QOS) among jobs.
init_free_qhdrs Low water mark for the pool of unused qhdrs.When the pool falls below this number, more areallocated. Used only if single_msg_queue = 0.
Cray DVS
S3016 155
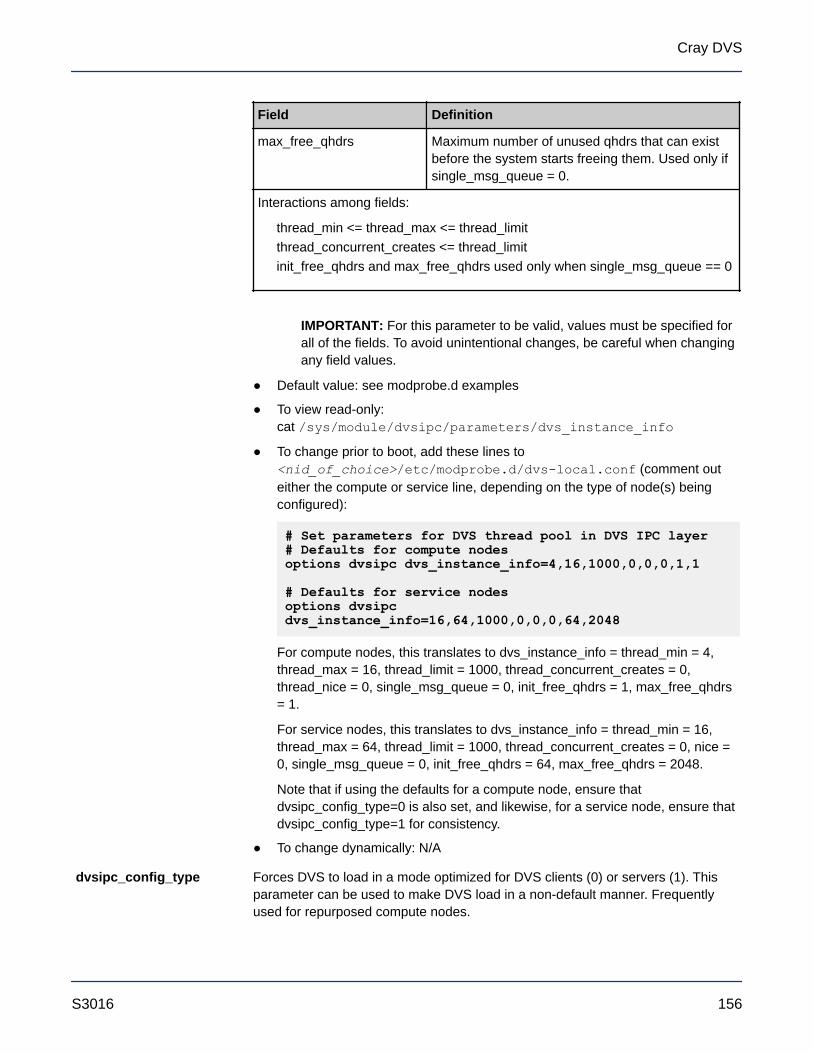
Field Definition
max_free_qhdrs Maximum number of unused qhdrs that can existbefore the system starts freeing them. Used only ifsingle_msg_queue = 0.
Interactions among fields:
thread_min <= thread_max <= thread_limitthread_concurrent_creates <= thread_limitinit_free_qhdrs and max_free_qhdrs used only when single_msg_queue == 0
IMPORTANT: For this parameter to be valid, values must be specified forall of the fields. To avoid unintentional changes, be careful when changingany field values.
● Default value: see modprobe.d examples
● To view read-only:cat /sys/module/dvsipc/parameters/dvs_instance_info
● To change prior to boot, add these lines to<nid_of_choice>/etc/modprobe.d/dvs-local.conf (comment outeither the compute or service line, depending on the type of node(s) beingconfigured):
# Set parameters for DVS thread pool in DVS IPC layer# Defaults for compute nodesoptions dvsipc dvs_instance_info=4,16,1000,0,0,0,1,1
# Defaults for service nodesoptions dvsipc dvs_instance_info=16,64,1000,0,0,0,64,2048
For compute nodes, this translates to dvs_instance_info = thread_min = 4,thread_max = 16, thread_limit = 1000, thread_concurrent_creates = 0,thread_nice = 0, single_msg_queue = 0, init_free_qhdrs = 1, max_free_qhdrs= 1.
For service nodes, this translates to dvs_instance_info = thread_min = 16,thread_max = 64, thread_limit = 1000, thread_concurrent_creates = 0, nice =0, single_msg_queue = 0, init_free_qhdrs = 64, max_free_qhdrs = 2048.
Note that if using the defaults for a compute node, ensure thatdvsipc_config_type=0 is also set, and likewise, for a service node, ensure thatdvsipc_config_type=1 for consistency.
● To change dynamically: N/A
dvsipc_config_type Forces DVS to load in a mode optimized for DVS clients (0) or servers (1). Thisparameter can be used to make DVS load in a non-default manner. Frequentlyused for repurposed compute nodes.
Cray DVS
S3016 156
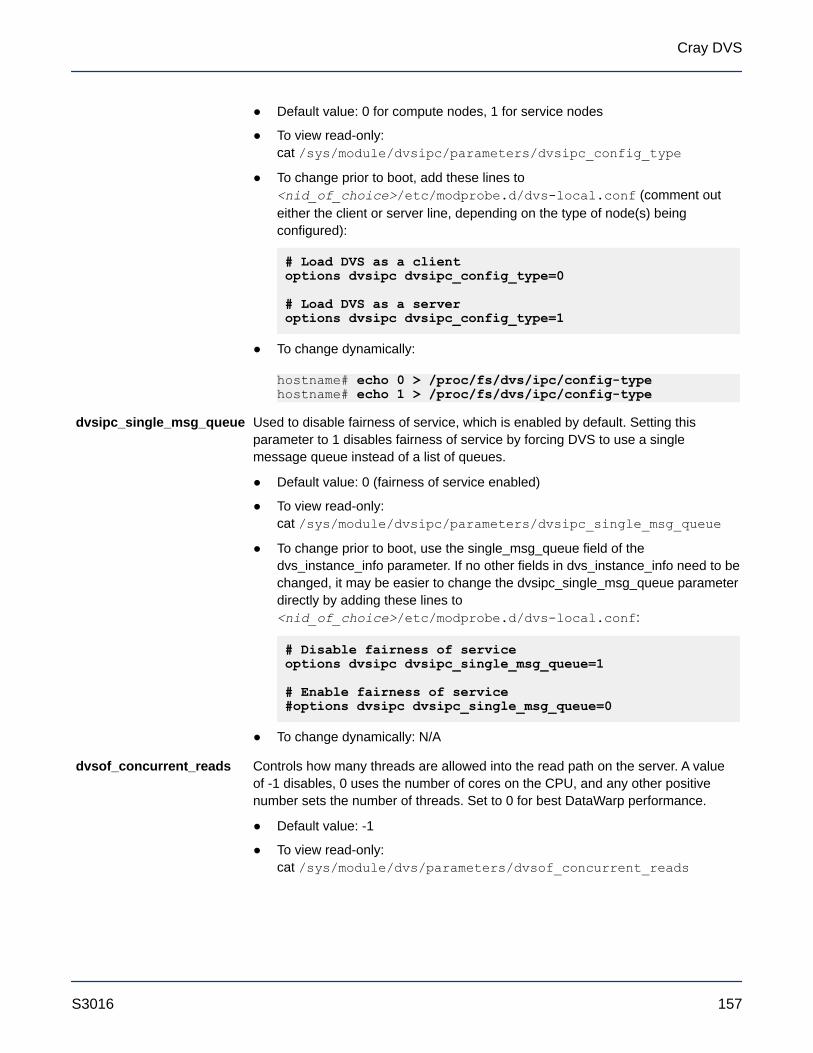
● Default value: 0 for compute nodes, 1 for service nodes
● To view read-only:cat /sys/module/dvsipc/parameters/dvsipc_config_type
● To change prior to boot, add these lines to<nid_of_choice>/etc/modprobe.d/dvs-local.conf (comment outeither the client or server line, depending on the type of node(s) beingconfigured):
# Load DVS as a clientoptions dvsipc dvsipc_config_type=0
# Load DVS as a serveroptions dvsipc dvsipc_config_type=1
● To change dynamically:
hostname# echo 0 > /proc/fs/dvs/ipc/config-typehostname# echo 1 > /proc/fs/dvs/ipc/config-type
dvsipc_single_msg_queue Used to disable fairness of service, which is enabled by default. Setting thisparameter to 1 disables fairness of service by forcing DVS to use a singlemessage queue instead of a list of queues.
● Default value: 0 (fairness of service enabled)
● To view read-only:cat /sys/module/dvsipc/parameters/dvsipc_single_msg_queue
● To change prior to boot, use the single_msg_queue field of thedvs_instance_info parameter. If no other fields in dvs_instance_info need to bechanged, it may be easier to change the dvsipc_single_msg_queue parameterdirectly by adding these lines to<nid_of_choice>/etc/modprobe.d/dvs-local.conf:
# Disable fairness of serviceoptions dvsipc dvsipc_single_msg_queue=1
# Enable fairness of service#options dvsipc dvsipc_single_msg_queue=0
● To change dynamically: N/A
dvsof_concurrent_reads Controls how many threads are allowed into the read path on the server. A valueof -1 disables, 0 uses the number of cores on the CPU, and any other positivenumber sets the number of threads. Set to 0 for best DataWarp performance.
● Default value: -1
● To view read-only:cat /sys/module/dvs/parameters/dvsof_concurrent_reads
Cray DVS
S3016 157
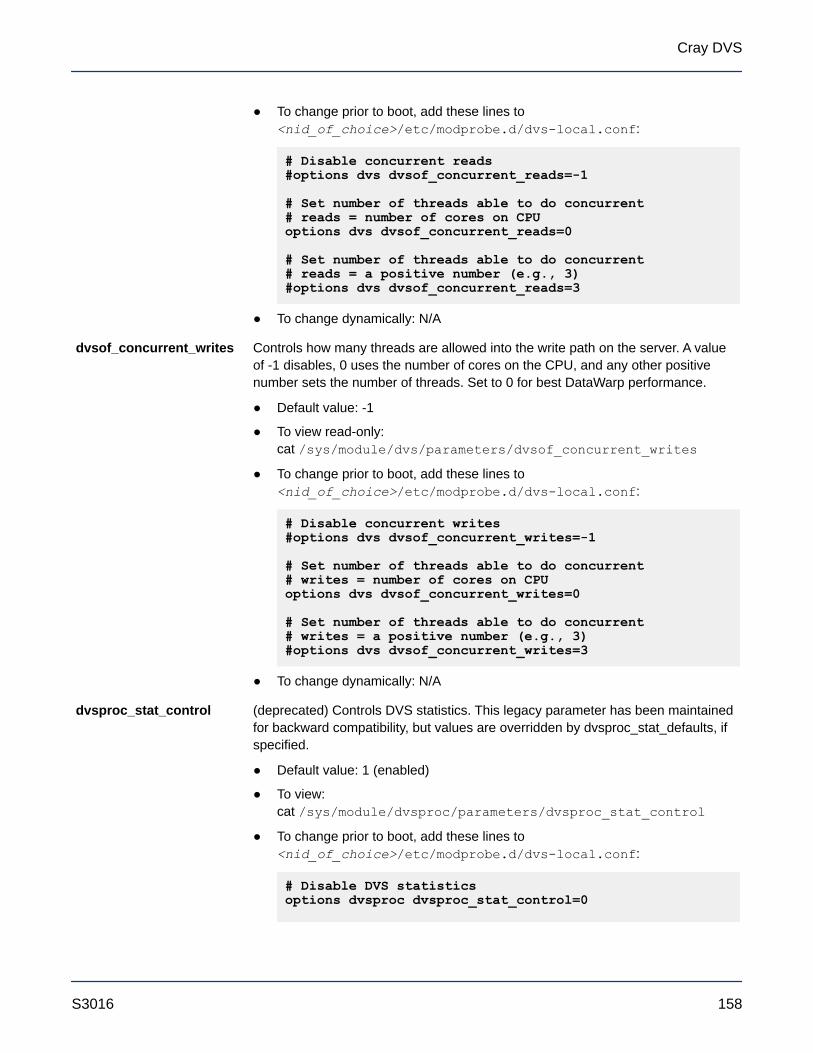
● To change prior to boot, add these lines to<nid_of_choice>/etc/modprobe.d/dvs-local.conf:
# Disable concurrent reads#options dvs dvsof_concurrent_reads=-1
# Set number of threads able to do concurrent # reads = number of cores on CPUoptions dvs dvsof_concurrent_reads=0
# Set number of threads able to do concurrent # reads = a positive number (e.g., 3)#options dvs dvsof_concurrent_reads=3
● To change dynamically: N/A
dvsof_concurrent_writes Controls how many threads are allowed into the write path on the server. A valueof -1 disables, 0 uses the number of cores on the CPU, and any other positivenumber sets the number of threads. Set to 0 for best DataWarp performance.
● Default value: -1
● To view read-only:cat /sys/module/dvs/parameters/dvsof_concurrent_writes
● To change prior to boot, add these lines to<nid_of_choice>/etc/modprobe.d/dvs-local.conf:
# Disable concurrent writes#options dvs dvsof_concurrent_writes=-1
# Set number of threads able to do concurrent # writes = number of cores on CPUoptions dvs dvsof_concurrent_writes=0
# Set number of threads able to do concurrent # writes = a positive number (e.g., 3)#options dvs dvsof_concurrent_writes=3
● To change dynamically: N/A
dvsproc_stat_control (deprecated) Controls DVS statistics. This legacy parameter has been maintainedfor backward compatibility, but values are overridden by dvsproc_stat_defaults, ifspecified.
● Default value: 1 (enabled)
● To view:cat /sys/module/dvsproc/parameters/dvsproc_stat_control
● To change prior to boot, add these lines to<nid_of_choice>/etc/modprobe.d/dvs-local.conf:
# Disable DVS statisticsoptions dvsproc dvsproc_stat_control=0
Cray DVS
S3016 158

# Enable DVS statistics#options dvsproc dvsproc_stat_control=1
● To change dynamically:
This is root writableat /sys/module/dvsproc/parameters/dvsproc_stat_control, butchanges should be made only through the /proc/fs/dvs/stats interface,as shown in this example.
hostname# echo 0 > /proc/fs/dvs/statshostname# echo 1 > /proc/fs/dvs/statshostname# echo 2 > /proc/fs/dvs/stats
dvsproc_stat_defaults Controls DVS statistics. Use this parameter to disable/enable and format DVSstatistics.
● Default values: enable, legacy, brief, plain, notest
● To view:cat /sys/module/dvsproc/parameters/dvsproc_stat_defaults
● To change prior to boot, add these lines to<nid_of_choice>/etc/modprobe.d/dvs-local.conf:
# Disable/enable and format DVS statisticsoptions dvsproc dvsproc_stat_defaults="enable,legacy,brief,plain,notest"
● To change dynamically:
This is root writableat /sys/module/dvsproc/parameters/dvsproc_stat_defaults, butchanges should be made only through the /proc/fs/dvs/stats interface,as shown in this example.
hostname# echo disable > /proc/fs/dvs/statshostname# echo enable > /proc/fs/dvs/statshostname# echo reset > /proc/fs/dvs/statshostname# echo json,pretty > /proc/fs/dvs/stats
estale_max_retry Controls the number of times to retry an operation on the original server after itreturns ESTALE.
● Default value: 36 iterations at a fixed 5 seconds per iteration (3 minutes)
● To view read-only:cat /sys/module/dvsproc/parameters/estale_max_retry
● To change prior to boot, add these lines to<nid_of_choice>/etc/modprobe.d/dvs-local.conf:
# Set the number of times to retry an operation # on the original server after it returns ESTALEoptions dvsproc estale_max_retry=
Cray DVS
S3016 159

● To change dynamically (example changes estale_max_retry to 40 forillustration only):
hostname# echo 40 > /proc/fs/dvs/estale_timeout_secs
estale_timeout_secs Controls the time to wait between retries of an operation after it returns ESTALE.
● Default value: 300 seconds
● To view read-only:cat /sys/module/dvsproc/parameters/estale_timeout_secs
● To change prior to boot, add these lines to<nid_of_choice>/etc/modprobe.d/dvs-local.conf:
# Set the time to wait between retries of an # operation that returns ESTALEoptions dvsproc estale_timeout_secs=
● To change dynamically (example changes estale_timeout_secs to 400 forillustration only):
hostname# echo 400 > /proc/fs/dvs/estale_timeout_secs
kdwfs_instance_info Contains the following fields, which are parameters for the DataWarp thread poolin the DVS IPC layer.
Field Definition
thread_min Number of threads created at startup.
thread_max Maximum number of persistent threads.
thread_limit Maximum number of valid threads that DVS IPCallows to exist at one time. DVS IPC willdynamically scale up the number of threads to thisnumber as the load increases.
thread_concurrent_creates Maximum number of IPC threads that can be in theprocess of forking a new thread.
thread_nice Nice value for the threads.
single_msg_queue Disables/enables fairness of service. Setting to 1disables fairness of service by processing incomingrequests with a FIFO method. Setting to 0 (default)groups requests into different queues (qhdrs)based on apid, and round-robbins the queues tomaintain quality of service (QOS) among jobs.
init_free_qhdrs Low water mark for the pool of unused qhdrs.When the pool falls below this number, more areallocated. Used only if single_msg_queue = 0.
Cray DVS
S3016 160
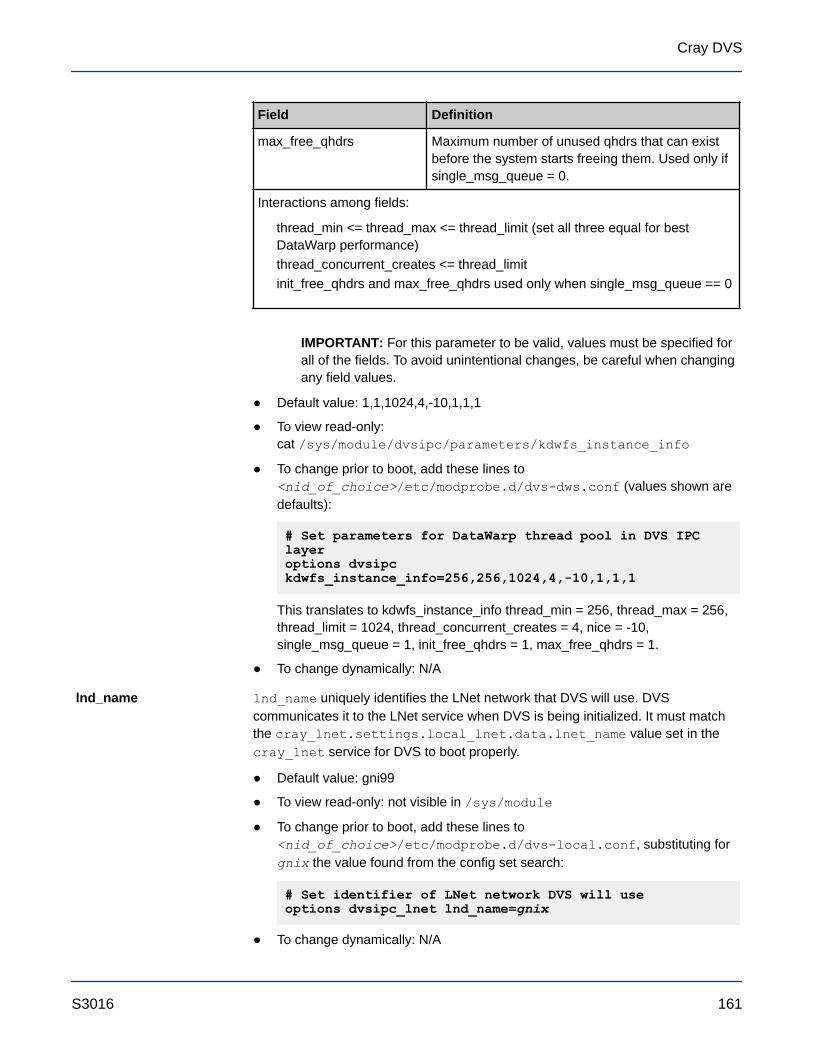
Field Definition
max_free_qhdrs Maximum number of unused qhdrs that can existbefore the system starts freeing them. Used only ifsingle_msg_queue = 0.
Interactions among fields:
thread_min <= thread_max <= thread_limit (set all three equal for bestDataWarp performance)thread_concurrent_creates <= thread_limitinit_free_qhdrs and max_free_qhdrs used only when single_msg_queue == 0
IMPORTANT: For this parameter to be valid, values must be specified forall of the fields. To avoid unintentional changes, be careful when changingany field values.
● Default value: 1,1,1024,4,-10,1,1,1
● To view read-only:cat /sys/module/dvsipc/parameters/kdwfs_instance_info
● To change prior to boot, add these lines to<nid_of_choice>/etc/modprobe.d/dvs-dws.conf (values shown aredefaults):
# Set parameters for DataWarp thread pool in DVS IPC layeroptions dvsipc kdwfs_instance_info=256,256,1024,4,-10,1,1,1
This translates to kdwfs_instance_info thread_min = 256, thread_max = 256,thread_limit = 1024, thread_concurrent_creates = 4, nice = -10,single_msg_queue = 1, init_free_qhdrs = 1, max_free_qhdrs = 1.
● To change dynamically: N/A
lnd_name lnd_name uniquely identifies the LNet network that DVS will use. DVScommunicates it to the LNet service when DVS is being initialized. It must matchthe cray_lnet.settings.local_lnet.data.lnet_name value set in thecray_lnet service for DVS to boot properly.
● Default value: gni99
● To view read-only: not visible in /sys/module
● To change prior to boot, add these lines to<nid_of_choice>/etc/modprobe.d/dvs-local.conf, substituting forgnix the value found from the config set search:
# Set identifier of LNet network DVS will useoptions dvsipc_lnet lnd_name=gnix
● To change dynamically: N/A
Cray DVS
S3016 161
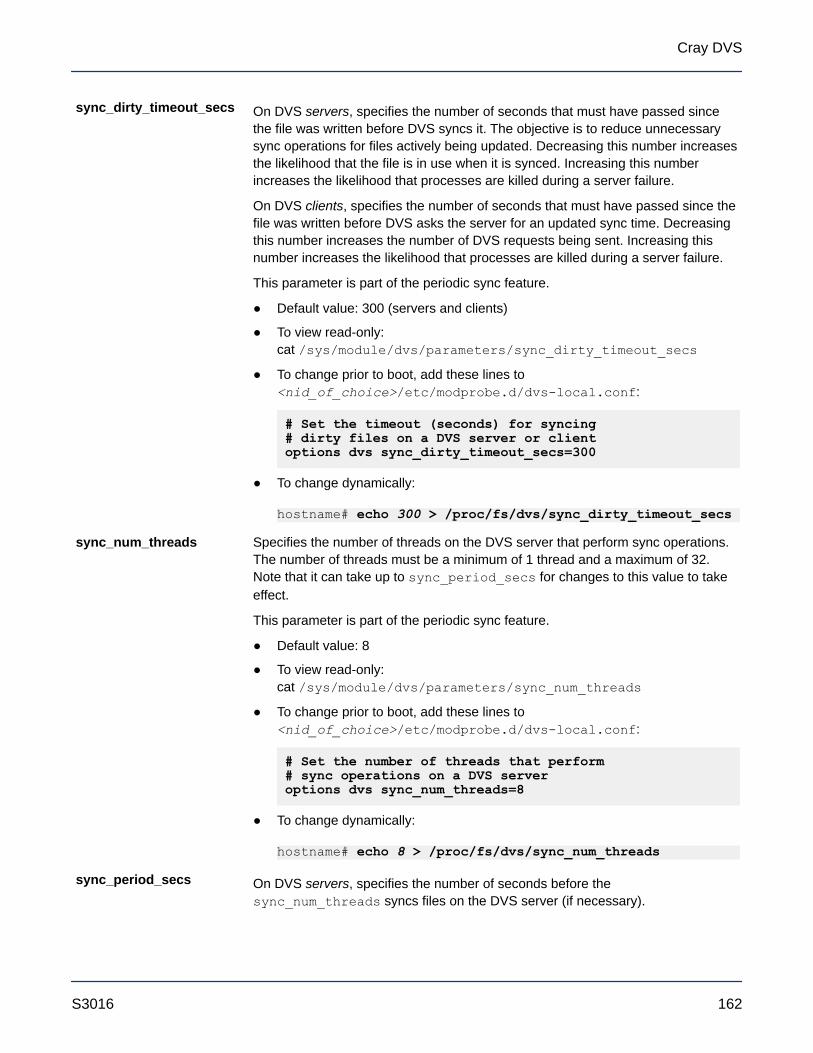
sync_dirty_timeout_secs On DVS servers, specifies the number of seconds that must have passed sincethe file was written before DVS syncs it. The objective is to reduce unnecessarysync operations for files actively being updated. Decreasing this number increasesthe likelihood that the file is in use when it is synced. Increasing this numberincreases the likelihood that processes are killed during a server failure.
On DVS clients, specifies the number of seconds that must have passed since thefile was written before DVS asks the server for an updated sync time. Decreasingthis number increases the number of DVS requests being sent. Increasing thisnumber increases the likelihood that processes are killed during a server failure.
This parameter is part of the periodic sync feature.
● Default value: 300 (servers and clients)
● To view read-only:cat /sys/module/dvs/parameters/sync_dirty_timeout_secs
● To change prior to boot, add these lines to<nid_of_choice>/etc/modprobe.d/dvs-local.conf:
# Set the timeout (seconds) for syncing # dirty files on a DVS server or clientoptions dvs sync_dirty_timeout_secs=300
● To change dynamically:
hostname# echo 300 > /proc/fs/dvs/sync_dirty_timeout_secs
sync_num_threads Specifies the number of threads on the DVS server that perform sync operations.The number of threads must be a minimum of 1 thread and a maximum of 32.Note that it can take up to sync_period_secs for changes to this value to takeeffect.
This parameter is part of the periodic sync feature.
● Default value: 8
● To view read-only:cat /sys/module/dvs/parameters/sync_num_threads
● To change prior to boot, add these lines to<nid_of_choice>/etc/modprobe.d/dvs-local.conf:
# Set the number of threads that perform # sync operations on a DVS serveroptions dvs sync_num_threads=8
● To change dynamically:
hostname# echo 8 > /proc/fs/dvs/sync_num_threads
sync_period_secs On DVS servers, specifies the number of seconds before thesync_num_threads syncs files on the DVS server (if necessary).
Cray DVS
S3016 162
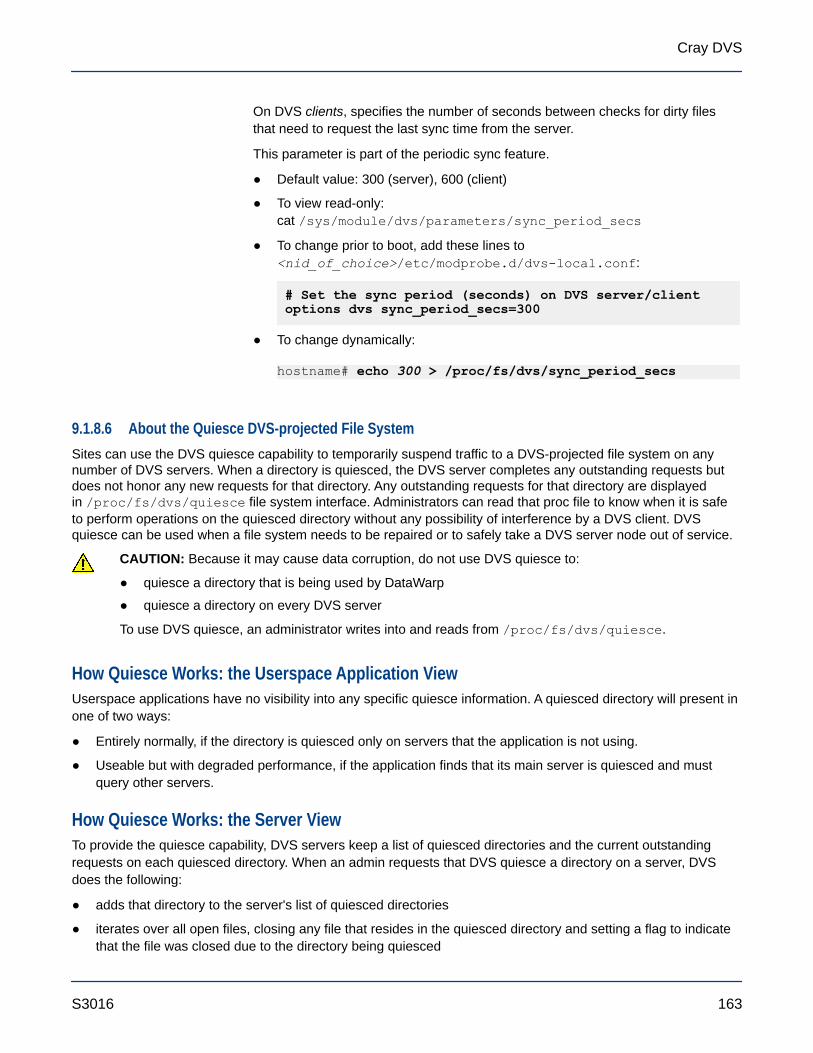
On DVS clients, specifies the number of seconds between checks for dirty filesthat need to request the last sync time from the server.
This parameter is part of the periodic sync feature.
● Default value: 300 (server), 600 (client)
● To view read-only:cat /sys/module/dvs/parameters/sync_period_secs
● To change prior to boot, add these lines to<nid_of_choice>/etc/modprobe.d/dvs-local.conf:
# Set the sync period (seconds) on DVS server/clientoptions dvs sync_period_secs=300
● To change dynamically:
hostname# echo 300 > /proc/fs/dvs/sync_period_secs
9.1.8.6 About the Quiesce DVS-projected File SystemSites can use the DVS quiesce capability to temporarily suspend traffic to a DVS-projected file system on anynumber of DVS servers. When a directory is quiesced, the DVS server completes any outstanding requests butdoes not honor any new requests for that directory. Any outstanding requests for that directory are displayedin /proc/fs/dvs/quiesce file system interface. Administrators can read that proc file to know when it is safeto perform operations on the quiesced directory without any possibility of interference by a DVS client. DVSquiesce can be used when a file system needs to be repaired or to safely take a DVS server node out of service.
CAUTION: Because it may cause data corruption, do not use DVS quiesce to:
● quiesce a directory that is being used by DataWarp
● quiesce a directory on every DVS server
To use DVS quiesce, an administrator writes into and reads from /proc/fs/dvs/quiesce.
How Quiesce Works: the Userspace Application ViewUserspace applications have no visibility into any specific quiesce information. A quiesced directory will present inone of two ways:
● Entirely normally, if the directory is quiesced only on servers that the application is not using.
● Useable but with degraded performance, if the application finds that its main server is quiesced and mustquery other servers.
How Quiesce Works: the Server ViewTo provide the quiesce capability, DVS servers keep a list of quiesced directories and the current outstandingrequests on each quiesced directory. When an admin requests that DVS quiesce a directory on a server, DVSdoes the following:
● adds that directory to the server's list of quiesced directories
● iterates over all open files, closing any file that resides in the quiesced directory and setting a flag to indicatethat the file was closed due to the directory being quiesced
Cray DVS
S3016 163

When a DVS server receives a request from a client, DVS checks the request path against the list of quiesceddirectories. The comparison between the path name in the request and the quiesced directory is a simple stringcompare to avoid any access of the underlying file system that has been quiesced. If DVS finds that the request isfor a quiesced file system, it sends a reply indicating that the request could not be completed due to a quiesceand noting which directory is quiesced. If the client request is for a file that has been closed due to quiesce, theserver returns a reply to the client indicating that the request could not be completed due to a quiesce.
When an admin unquiesces a directory on a DVS server, DVS simply removes that directory from the server's listof quiesced directories and clears all quiesce-related flags for that directory.
How Quiesce Works: the Client ViewWhen making a request of a server, a client may get back reply indicating that the request was for a file in aquiesced directory. The client then retries the operation on the next server in its server list. If it makes the requestof every server in its server list and gets the same reply from each of them, then one of two things happens,depending on the type of request:
path namerequest
If the request is a path name request (lookup, stat, file open, etc.), then DVS reattempts theoperation on a different server in a round-robin fashion until it finds a server that allows theoperation to complete successfully.
open file If the request is for an open file (read, write, lseek, etc.), then DVS attempts the operation on adifferent server. If the file is not open on any other servers, DVS attempts to open on the file on aserver in a round robin fashion until it gets a successful open. DVS will then attempt to performthe operation.
If a client receives a reply indicating a quiesced directory, the client adds that directory to a list of quiesceddirectories held on the DVS superblock. This is intended to reduce network traffic by avoiding requests that targetquiesced directories. The client's list of quiesced directories expires about every 60 seconds, thereby allowingclients to try those directories again in case one or more have been unquiesced during that time. This mechanismenables DVS to strike a balance between the timely unquiescing of a file system and a large reduction in networktraffic and requests coming into the server. It also has the effect of naturally staggering clients when they start touse a server.
9.1.8.6.1 Use Case: Quiesce a Single Directory on a Single DVS Server
PrerequisitesThis procedure requires administrative privileges.
About this taskThe example provided in this procedure is for a scenario in which an admin wants to quiesce adirectory /gpfs/test/foo on a DVS server. This is an unlikely use case, but an illustrative example.
Procedure
1. Quiesce the directory on the DVS server.
dvs1# echo quiesce /gpfs/test/foo > /proc/fs/dvs/quiesce
Cray DVS
S3016 164
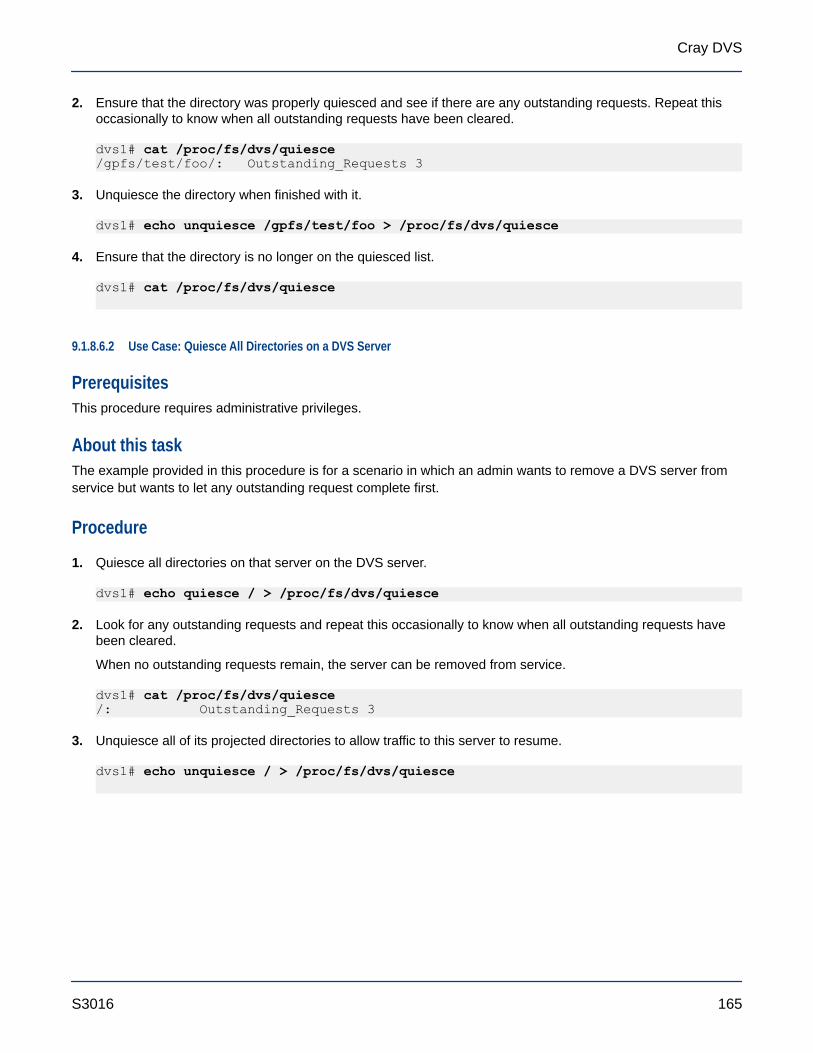
2. Ensure that the directory was properly quiesced and see if there are any outstanding requests. Repeat thisoccasionally to know when all outstanding requests have been cleared.
dvs1# cat /proc/fs/dvs/quiesce/gpfs/test/foo/: Outstanding_Requests 3
3. Unquiesce the directory when finished with it.
dvs1# echo unquiesce /gpfs/test/foo > /proc/fs/dvs/quiesce
4. Ensure that the directory is no longer on the quiesced list.
dvs1# cat /proc/fs/dvs/quiesce
9.1.8.6.2 Use Case: Quiesce All Directories on a DVS Server
PrerequisitesThis procedure requires administrative privileges.
About this taskThe example provided in this procedure is for a scenario in which an admin wants to remove a DVS server fromservice but wants to let any outstanding request complete first.
Procedure
1. Quiesce all directories on that server on the DVS server.
dvs1# echo quiesce / > /proc/fs/dvs/quiesce
2. Look for any outstanding requests and repeat this occasionally to know when all outstanding requests havebeen cleared.
When no outstanding requests remain, the server can be removed from service.
dvs1# cat /proc/fs/dvs/quiesce/: Outstanding_Requests 3
3. Unquiesce all of its projected directories to allow traffic to this server to resume.
dvs1# echo unquiesce / > /proc/fs/dvs/quiesce
Cray DVS
S3016 165

10 Troubleshooting
10.1 Clean Up Log DataAs jobs are executed on the system, a number of logs are generated, which need to be cleaned up, otherwisethey may consume unnecessary space. Log data is useful for debugging issues, but if it is certain that this data isno longer needed, it can be deleted.
● Mesos logs - Mesos logs are stored under var/log/mesos, whereas the Mesos framework logs are storedunder /var/log/mesos/agent/slaves. These logs need to be deleted manually.
● Marathon logs - Marathon logs are stored under var/log/message and need to be deleted manually.
● HA Proxy logs - HA Proxy logs are stored under var/log/message and need to be deleted manually.
● Jupyter logs - Juypter log file are located at var/log/jupyterhub/jupyterhub.log and need to bedeleted manually.
● Grafana and InfluxDB logs - Grafana logs are stored under var/log/grafana, whereas InfluxDB logs arestored under var/log/influxdb. Influxdb log files are compressed. Both Grafana and InfluxDB use thelogrotate utility to keep log files from using too much space. Log files are rolled daily by default, but ifspace is critical, logs can be deleted manually.
● Spark logs - Shuffle data files on the SSDs is automatically deleted on Urika-GX. Spark logs need to bedeleted manually and are located at the following locations:
○ Spark event logs - Located at hdfs://user/spark/applicationHistory
○ Spark executor logs - Located on individual compute nodes at /var/log/mesos/agent/slaves/
● Hadoop logs - Hadoop log files are located in the following locations and need to be deleted manually:
○ Core Hadoop - Log files are generated under the following locations:
▪ var/log/hadoop/hdfs
▪ var/log/hadoop/yarn
▪ var/log/hadoop/mapreduce
○ ZooKeeper - ZooKeeper logs are generated under var/log/zookeeper
○ Hive (metastore and hive server2) - These logs are generated under var/log/hive
○ Hive Webhcat - These logs are generated under var/log/webhcat
○ Oozie - Oozie logs are stored under /var/log/oozie
○ HUE - HUE logs are generated under /var/log/hue
Troubleshooting
S3016 166
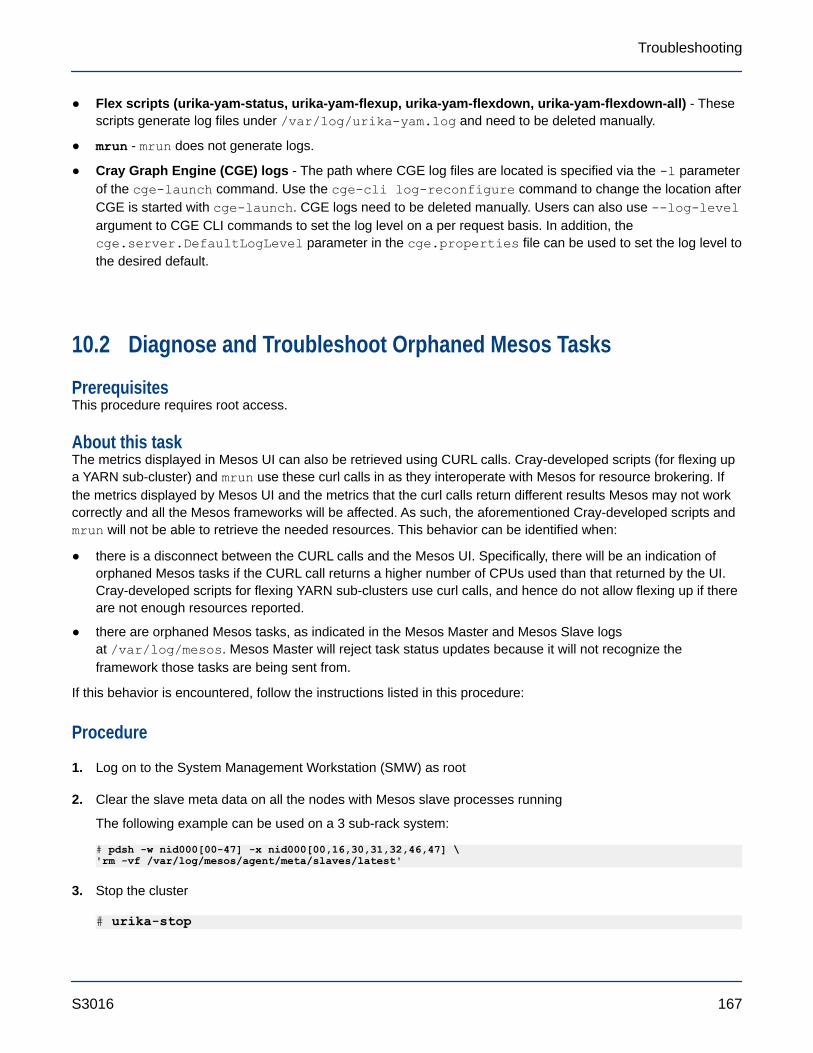
● Flex scripts (urika-yam-status, urika-yam-flexup, urika-yam-flexdown, urika-yam-flexdown-all) - Thesescripts generate log files under /var/log/urika-yam.log and need to be deleted manually.
● mrun - mrun does not generate logs.
● Cray Graph Engine (CGE) logs - The path where CGE log files are located is specified via the -l parameterof the cge-launch command. Use the cge-cli log-reconfigure command to change the location afterCGE is started with cge-launch. CGE logs need to be deleted manually. Users can also use --log-levelargument to CGE CLI commands to set the log level on a per request basis. In addition, thecge.server.DefaultLogLevel parameter in the cge.properties file can be used to set the log level tothe desired default.
10.2 Diagnose and Troubleshoot Orphaned Mesos Tasks
PrerequisitesThis procedure requires root access.
About this taskThe metrics displayed in Mesos UI can also be retrieved using CURL calls. Cray-developed scripts (for flexing upa YARN sub-cluster) and mrun use these curl calls in as they interoperate with Mesos for resource brokering. Ifthe metrics displayed by Mesos UI and the metrics that the curl calls return different results Mesos may not workcorrectly and all the Mesos frameworks will be affected. As such, the aforementioned Cray-developed scripts andmrun will not be able to retrieve the needed resources. This behavior can be identified when:
● there is a disconnect between the CURL calls and the Mesos UI. Specifically, there will be an indication oforphaned Mesos tasks if the CURL call returns a higher number of CPUs used than that returned by the UI.Cray-developed scripts for flexing YARN sub-clusters use curl calls, and hence do not allow flexing up if thereare not enough resources reported.
● there are orphaned Mesos tasks, as indicated in the Mesos Master and Mesos Slave logsat /var/log/mesos. Mesos Master will reject task status updates because it will not recognize theframework those tasks are being sent from.
If this behavior is encountered, follow the instructions listed in this procedure:
Procedure
1. Log on to the System Management Workstation (SMW) as root
2. Clear the slave meta data on all the nodes with Mesos slave processes running
The following example can be used on a 3 sub-rack system:
# pdsh -w nid000[00-47] -x nid000[00,16,30,31,32,46,47] \'rm -vf /var/log/mesos/agent/meta/slaves/latest'
3. Stop the cluster
# urika-stop
Troubleshooting
S3016 167
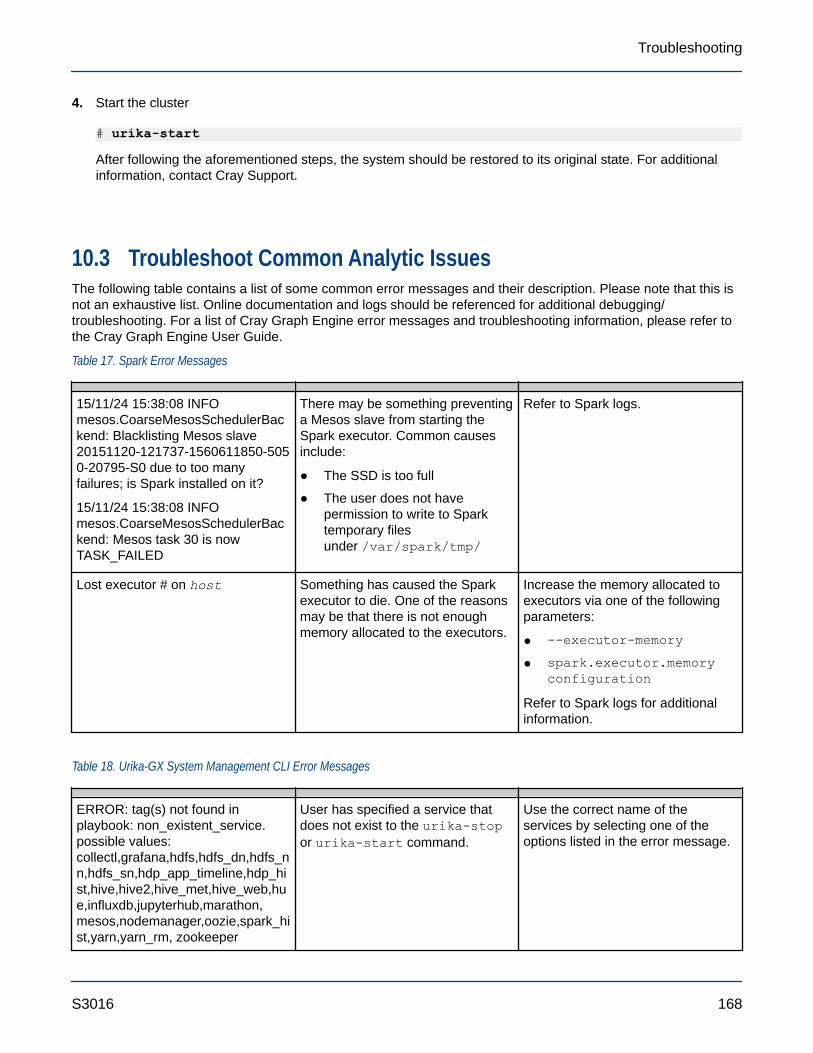
4. Start the cluster
# urika-start
After following the aforementioned steps, the system should be restored to its original state. For additionalinformation, contact Cray Support.
10.3 Troubleshoot Common Analytic IssuesThe following table contains a list of some common error messages and their description. Please note that this isnot an exhaustive list. Online documentation and logs should be referenced for additional debugging/troubleshooting. For a list of Cray Graph Engine error messages and troubleshooting information, please refer tothe Cray Graph Engine User Guide.
Table 17. Spark Error Messages
15/11/24 15:38:08 INFOmesos.CoarseMesosSchedulerBackend: Blacklisting Mesos slave20151120-121737-1560611850-5050-20795-S0 due to too manyfailures; is Spark installed on it?
15/11/24 15:38:08 INFOmesos.CoarseMesosSchedulerBackend: Mesos task 30 is nowTASK_FAILED
There may be something preventinga Mesos slave from starting theSpark executor. Common causesinclude:
● The SSD is too full
● The user does not havepermission to write to Sparktemporary filesunder /var/spark/tmp/
Refer to Spark logs.
Lost executor # on host Something has caused the Sparkexecutor to die. One of the reasonsmay be that there is not enoughmemory allocated to the executors.
Increase the memory allocated toexecutors via one of the followingparameters:
● --executor-memory● spark.executor.memory
configuration
Refer to Spark logs for additionalinformation.
Table 18. Urika-GX System Management CLI Error Messages
ERROR: tag(s) not found inplaybook: non_existent_service.possible values:collectl,grafana,hdfs,hdfs_dn,hdfs_nn,hdfs_sn,hdp_app_timeline,hdp_hist,hive,hive2,hive_met,hive_web,hue,influxdb,jupyterhub,marathon,mesos,nodemanager,oozie,spark_hist,yarn,yarn_rm, zookeeper
User has specified a service thatdoes not exist to the urika-stopor urika-start command.
Use the correct name of theservices by selecting one of theoptions listed in the error message.
Troubleshooting
S3016 168
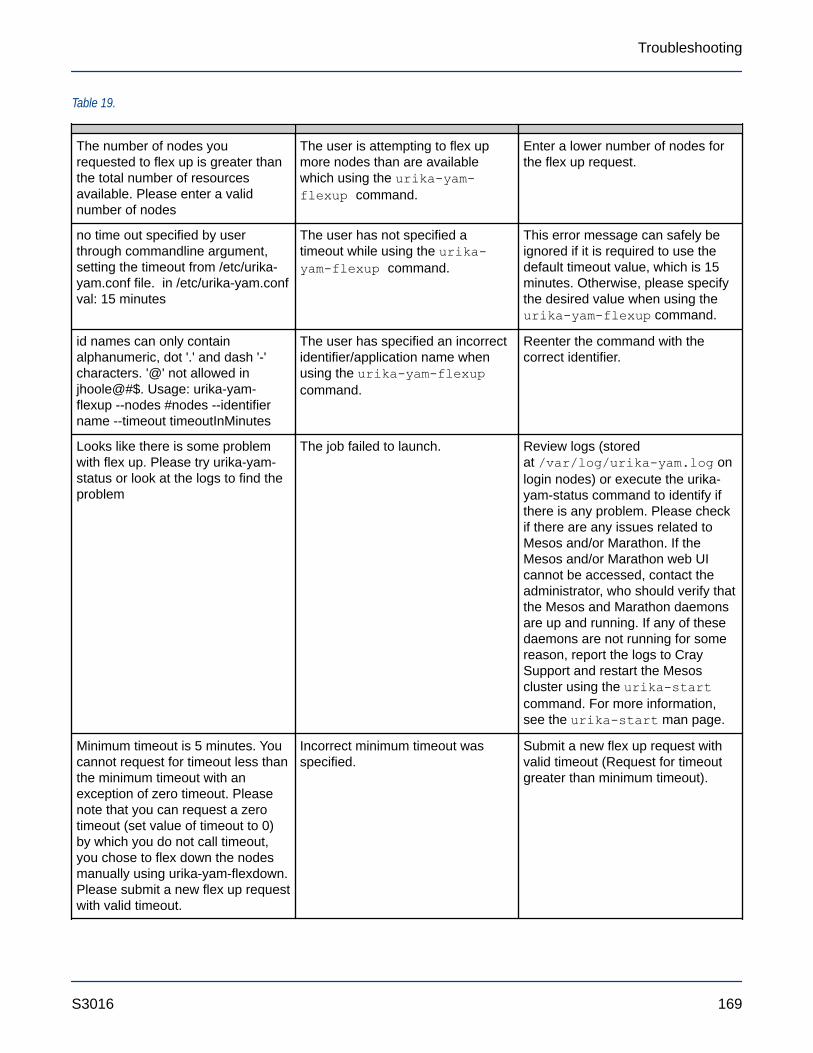
Table 19.
The number of nodes yourequested to flex up is greater thanthe total number of resourcesavailable. Please enter a validnumber of nodes
The user is attempting to flex upmore nodes than are availablewhich using the urika-yam-flexup command.
Enter a lower number of nodes forthe flex up request.
no time out specified by userthrough commandline argument,setting the timeout from /etc/urika-yam.conf file. in /etc/urika-yam.confval: 15 minutes
The user has not specified atimeout while using the urika-yam-flexup command.
This error message can safely beignored if it is required to use thedefault timeout value, which is 15minutes. Otherwise, please specifythe desired value when using theurika-yam-flexup command.
id names can only containalphanumeric, dot '.' and dash '-'characters. '@' not allowed injhoole@#$. Usage: urika-yam-flexup --nodes #nodes --identifiername --timeout timeoutInMinutes
The user has specified an incorrectidentifier/application name whenusing the urika-yam-flexupcommand.
Reenter the command with thecorrect identifier.
Looks like there is some problemwith flex up. Please try urika-yam-status or look at the logs to find theproblem
The job failed to launch. Review logs (storedat /var/log/urika-yam.log onlogin nodes) or execute the urika-yam-status command to identify ifthere is any problem. Please checkif there are any issues related toMesos and/or Marathon. If theMesos and/or Marathon web UIcannot be accessed, contact theadministrator, who should verify thatthe Mesos and Marathon daemonsare up and running. If any of thesedaemons are not running for somereason, report the logs to CraySupport and restart the Mesoscluster using the urika-startcommand. For more information,see the urika-start man page.
Minimum timeout is 5 minutes. Youcannot request for timeout less thanthe minimum timeout with anexception of zero timeout. Pleasenote that you can request a zerotimeout (set value of timeout to 0)by which you do not call timeout,you chose to flex down the nodesmanually using urika-yam-flexdown.Please submit a new flex up requestwith valid timeout.
Incorrect minimum timeout wasspecified.
Submit a new flex up request withvalid timeout (Request for timeoutgreater than minimum timeout).
Troubleshooting
S3016 169

Currently only "x" nodes areavailable in the cluster. Please waittill the number of nodes you requireare available Or submit a new flexup request with nodes less than "x"
This error is seen when the numberof nodes requested to flex up is notavailable.
Either wait till the number of nodesyou require are available Or submita new flex up request with nodesless than "x".
Invalid app name. Your app namecan consist of a series of namesseparated by slashes. Each namemust be at least 1 character. Thename may only contain digits (0-9),dashes (-), dots (.), and lowercaseletters (a-z). The name may notbegin or end with a dash.
This error is seen when theidentifier provided by user for theflex up request is invalid.
Follow the rules mentioned thereand re-submit a new flex uprequest.
Total number of resources not set inthe /etc/urika-yam.conf file, pleasere-check the configuration file
In /etc/urika-yam.conf file, thenumber of resources is set bydefault. The total number ofresources may not have been set.
Re-check the status of mesoscluster.
Hostname is not set in the /etc/urika-yam.conf file, please re-checkthe configuration file.
In /etc/urika-yam.conf file, theparameter hostname is set bydefault. The value set may not becorrect or may not have been set.
Ensure that this parameter is set,and the value is the same as defaultvalue.
Mesos port is not set in the /etc/urika-yam.conf file, please re-checkthe configuration file
In /etc/urika-yam.conf file, theparameter marathon_port is setby default. This parameter may nothave been set or value set may notbe set to the same as the defaultvalue.
Ensure that this parameter is set,and the value is the same as defaultvalue.
Marathon port is not set in the /etc/urika-yam.conf file, please re-checkthe configuration file.
In /etc/urika-yam.conf file, theparameter marathon_port is set bydefault. This parameter may nothave been set or value set may notbe set to the same as the defaultvalue..
It should be ensured that thisparameter is set, and the value isthe same as default value.
The number of nodes yourequested to flex up is greater thanthe total number of resourcesavailable. Please enter a validnumber of nodes
This error is seen when the numberof nodes requested to flex up ismore than the total number ofnodes available in the cluster
Submit a new flex up request withnodes less than or equal to thenumber of nodes available in thecluster.
App '/$marathon_app_name' doesnot exist. Please re-check theidentifier corresponding nodes youflex up, that you would like to flexdown
The identifier provided for flex downdoes not exist.
Re-check the usage: if you are aroot user, please provide thecomplete name as seen in urika-yam-status or as a non-root user,make sure you provide the sameidentifier used at the time of flex up.In addition, checkif /var/log/urika-yam.logreflects any log messages where
Troubleshooting
S3016 170
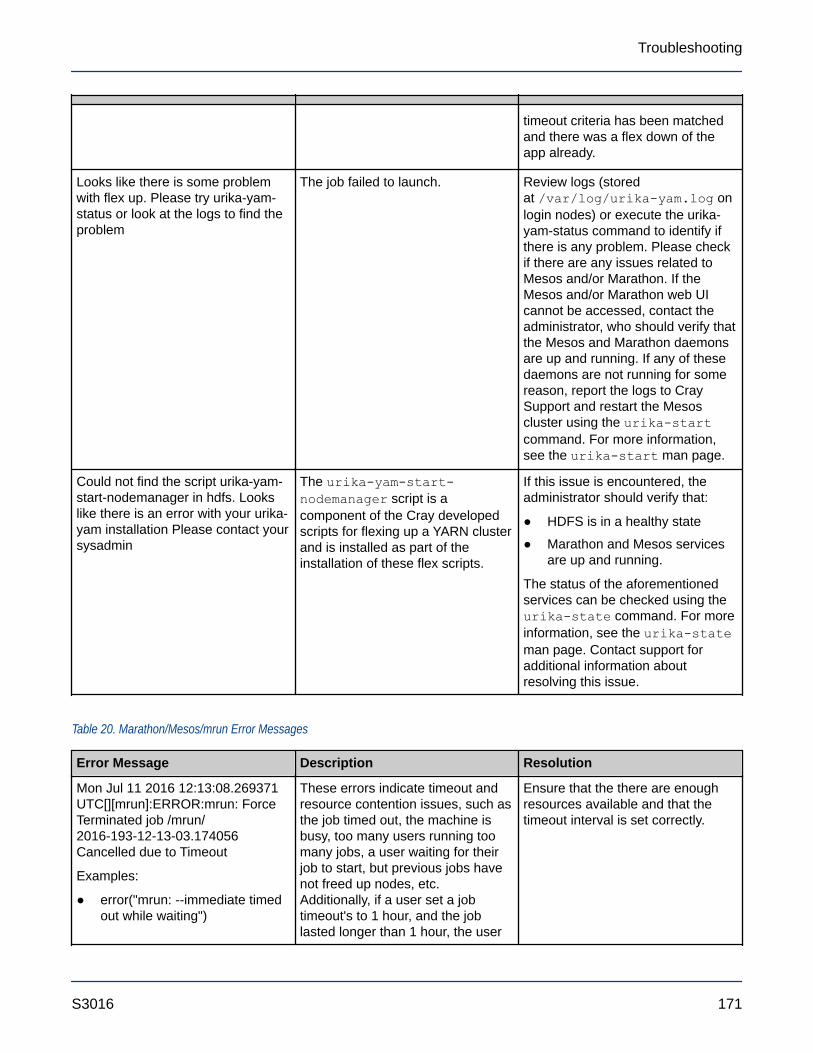
timeout criteria has been matchedand there was a flex down of theapp already.
Looks like there is some problemwith flex up. Please try urika-yam-status or look at the logs to find theproblem
The job failed to launch. Review logs (storedat /var/log/urika-yam.log onlogin nodes) or execute the urika-yam-status command to identify ifthere is any problem. Please checkif there are any issues related toMesos and/or Marathon. If theMesos and/or Marathon web UIcannot be accessed, contact theadministrator, who should verify thatthe Mesos and Marathon daemonsare up and running. If any of thesedaemons are not running for somereason, report the logs to CraySupport and restart the Mesoscluster using the urika-startcommand. For more information,see the urika-start man page.
Could not find the script urika-yam-start-nodemanager in hdfs. Lookslike there is an error with your urika-yam installation Please contact yoursysadmin
The urika-yam-start-nodemanager script is acomponent of the Cray developedscripts for flexing up a YARN clusterand is installed as part of theinstallation of these flex scripts.
If this issue is encountered, theadministrator should verify that:
● HDFS is in a healthy state
● Marathon and Mesos servicesare up and running.
The status of the aforementionedservices can be checked using theurika-state command. For moreinformation, see the urika-stateman page. Contact support foradditional information aboutresolving this issue.
Table 20. Marathon/Mesos/mrun Error Messages
Error Message Description Resolution
Mon Jul 11 2016 12:13:08.269371UTC[][mrun]:ERROR:mrun: ForceTerminated job /mrun/2016-193-12-13-03.174056Cancelled due to Timeout
Examples:
● error("mrun: --immediate timedout while waiting")
These errors indicate timeout andresource contention issues, such asthe job timed out, the machine isbusy, too many users running toomany jobs, a user waiting for theirjob to start, but previous jobs havenot freed up nodes, etc.Additionally, if a user set a jobtimeout's to 1 hour, and the joblasted longer than 1 hour, the user
Ensure that the there are enoughresources available and that thetimeout interval is set correctly.
Troubleshooting
S3016 171
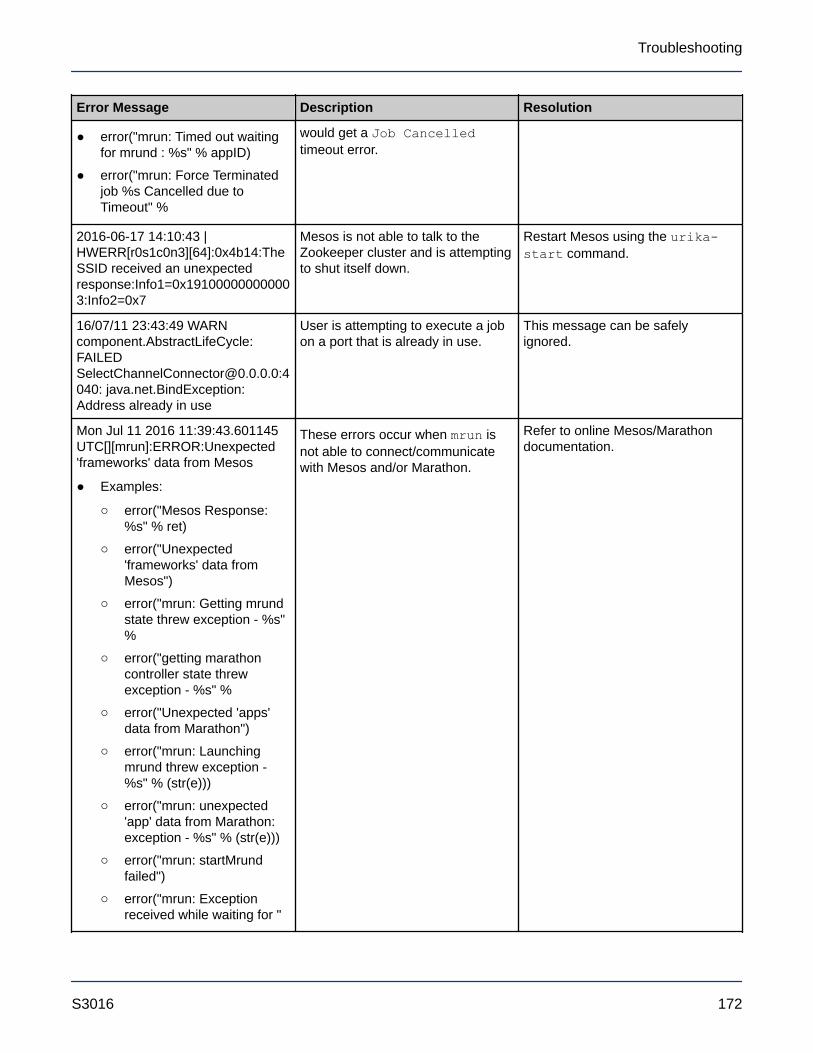
Error Message Description Resolution
● error("mrun: Timed out waitingfor mrund : %s" % appID)
● error("mrun: Force Terminatedjob %s Cancelled due toTimeout" %
would get a Job Cancelledtimeout error.
2016-06-17 14:10:43 |HWERR[r0s1c0n3][64]:0x4b14:TheSSID received an unexpectedresponse:Info1=0x191000000000003:Info2=0x7
Mesos is not able to talk to theZookeeper cluster and is attemptingto shut itself down.
Restart Mesos using the urika-start command.
16/07/11 23:43:49 WARNcomponent.AbstractLifeCycle:[email protected]:4040: java.net.BindException:Address already in use
User is attempting to execute a jobon a port that is already in use.
This message can be safelyignored.
Mon Jul 11 2016 11:39:43.601145UTC[][mrun]:ERROR:Unexpected'frameworks' data from Mesos
● Examples:
○ error("Mesos Response:%s" % ret)
○ error("Unexpected'frameworks' data fromMesos")
○ error("mrun: Getting mrundstate threw exception - %s"%
○ error("getting marathoncontroller state threwexception - %s" %
○ error("Unexpected 'apps'data from Marathon")
○ error("mrun: Launchingmrund threw exception -%s" % (str(e)))
○ error("mrun: unexpected'app' data from Marathon:exception - %s" % (str(e)))
○ error("mrun: startMrundfailed")
○ error("mrun: Exceptionreceived while waiting for "
These errors occur when mrun isnot able to connect/communicatewith Mesos and/or Marathon.
Refer to online Mesos/Marathondocumentation.
Troubleshooting
S3016 172
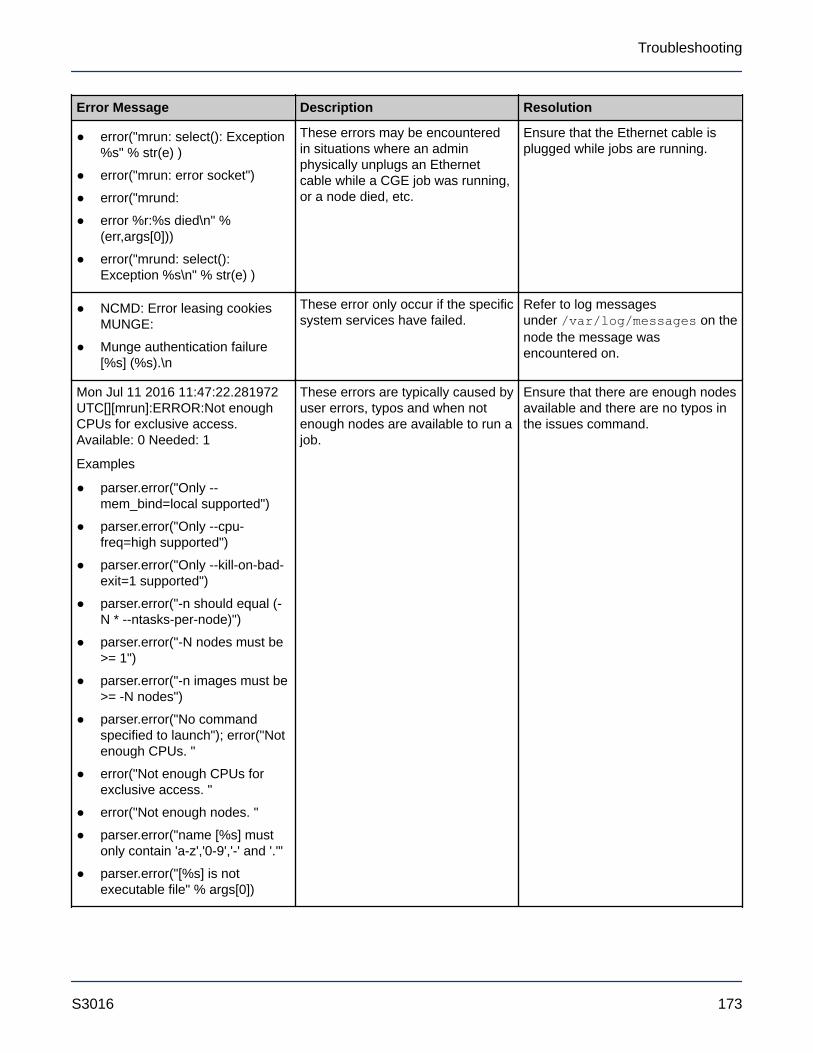
Error Message Description Resolution
● error("mrun: select(): Exception%s" % str(e) )
● error("mrun: error socket")
● error("mrund:
● error %r:%s died\n" %(err,args[0]))
● error("mrund: select():Exception %s\n" % str(e) )
These errors may be encounteredin situations where an adminphysically unplugs an Ethernetcable while a CGE job was running,or a node died, etc.
Ensure that the Ethernet cable isplugged while jobs are running.
● NCMD: Error leasing cookiesMUNGE:
● Munge authentication failure[%s] (%s).\n
These error only occur if the specificsystem services have failed.
Refer to log messagesunder /var/log/messages on thenode the message wasencountered on.
Mon Jul 11 2016 11:47:22.281972UTC[][mrun]:ERROR:Not enoughCPUs for exclusive access.Available: 0 Needed: 1
Examples
● parser.error("Only --mem_bind=local supported")
● parser.error("Only --cpu-freq=high supported")
● parser.error("Only --kill-on-bad-exit=1 supported")
● parser.error("-n should equal (-N * --ntasks-per-node)")
● parser.error("-N nodes must be>= 1")
● parser.error("-n images must be>= -N nodes")
● parser.error("No commandspecified to launch"); error("Notenough CPUs. "
● error("Not enough CPUs forexclusive access. "
● error("Not enough nodes. "
● parser.error("name [%s] mustonly contain 'a-z','0-9','-' and '.'"
● parser.error("[%s] is notexecutable file" % args[0])
These errors are typically caused byuser errors, typos and when notenough nodes are available to run ajob.
Ensure that there are enough nodesavailable and there are no typos inthe issues command.
Troubleshooting
S3016 173
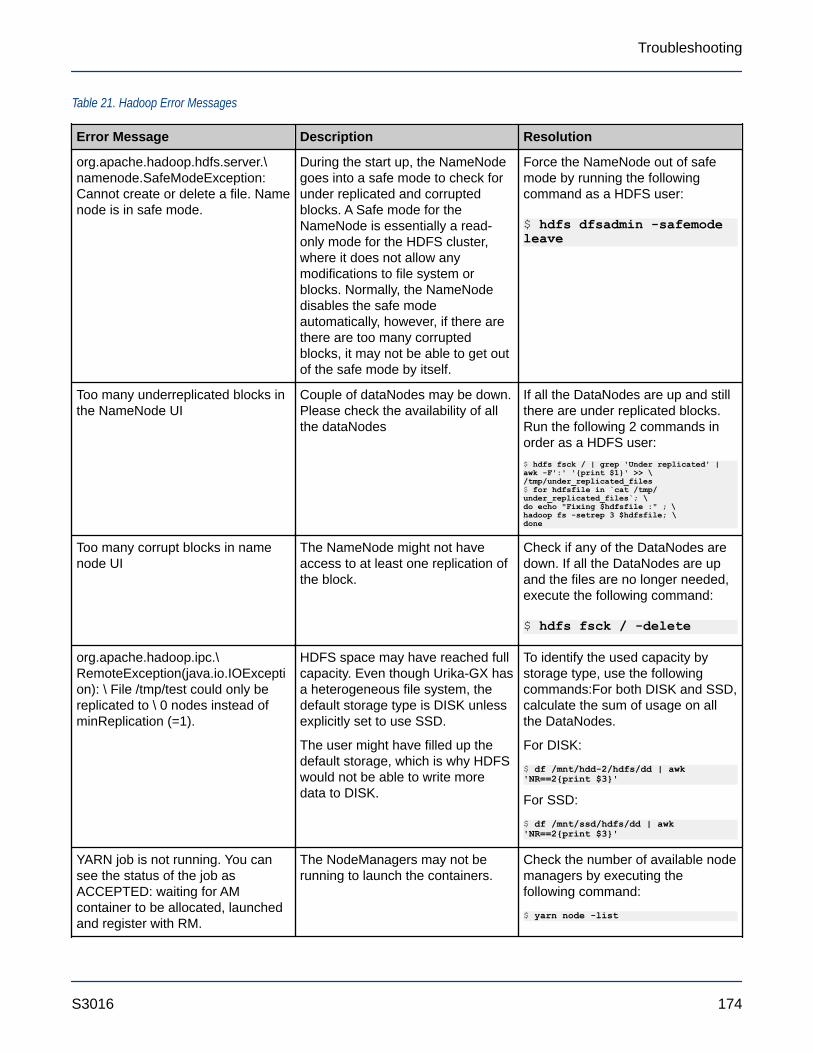
Table 21. Hadoop Error Messages
Error Message Description Resolution
org.apache.hadoop.hdfs.server.\namenode.SafeModeException:Cannot create or delete a file. Namenode is in safe mode.
During the start up, the NameNodegoes into a safe mode to check forunder replicated and corruptedblocks. A Safe mode for theNameNode is essentially a read-only mode for the HDFS cluster,where it does not allow anymodifications to file system orblocks. Normally, the NameNodedisables the safe modeautomatically, however, if there arethere are too many corruptedblocks, it may not be able to get outof the safe mode by itself.
Force the NameNode out of safemode by running the followingcommand as a HDFS user:
$ hdfs dfsadmin -safemode leave
Too many underreplicated blocks inthe NameNode UI
Couple of dataNodes may be down.Please check the availability of allthe dataNodes
If all the DataNodes are up and stillthere are under replicated blocks.Run the following 2 commands inorder as a HDFS user:$ hdfs fsck / | grep 'Under replicated' | awk -F':' '{print $1}' >> \/tmp/under_replicated_files$ for hdfsfile in `cat /tmp/under_replicated_files`; \do echo "Fixing $hdfsfile :" ; \hadoop fs -setrep 3 $hdfsfile; \done
Too many corrupt blocks in namenode UI
The NameNode might not haveaccess to at least one replication ofthe block.
Check if any of the DataNodes aredown. If all the DataNodes are upand the files are no longer needed,execute the following command:
$ hdfs fsck / -delete
org.apache.hadoop.ipc.\RemoteException(java.io.IOException): \ File /tmp/test could only bereplicated to \ 0 nodes instead ofminReplication (=1).
HDFS space may have reached fullcapacity. Even though Urika-GX hasa heterogeneous file system, thedefault storage type is DISK unlessexplicitly set to use SSD.
The user might have filled up thedefault storage, which is why HDFSwould not be able to write moredata to DISK.
To identify the used capacity bystorage type, use the followingcommands:For both DISK and SSD,calculate the sum of usage on allthe DataNodes.
For DISK:
$ df /mnt/hdd-2/hdfs/dd | awk 'NR==2{print $3}'
For SSD:
$ df /mnt/ssd/hdfs/dd | awk 'NR==2{print $3}'
YARN job is not running. You cansee the status of the job asACCEPTED: waiting for AMcontainer to be allocated, launchedand register with RM.
The NodeManagers may not berunning to launch the containers.
Check the number of available nodemanagers by executing thefollowing command:
$ yarn node -list
Troubleshooting
S3016 174
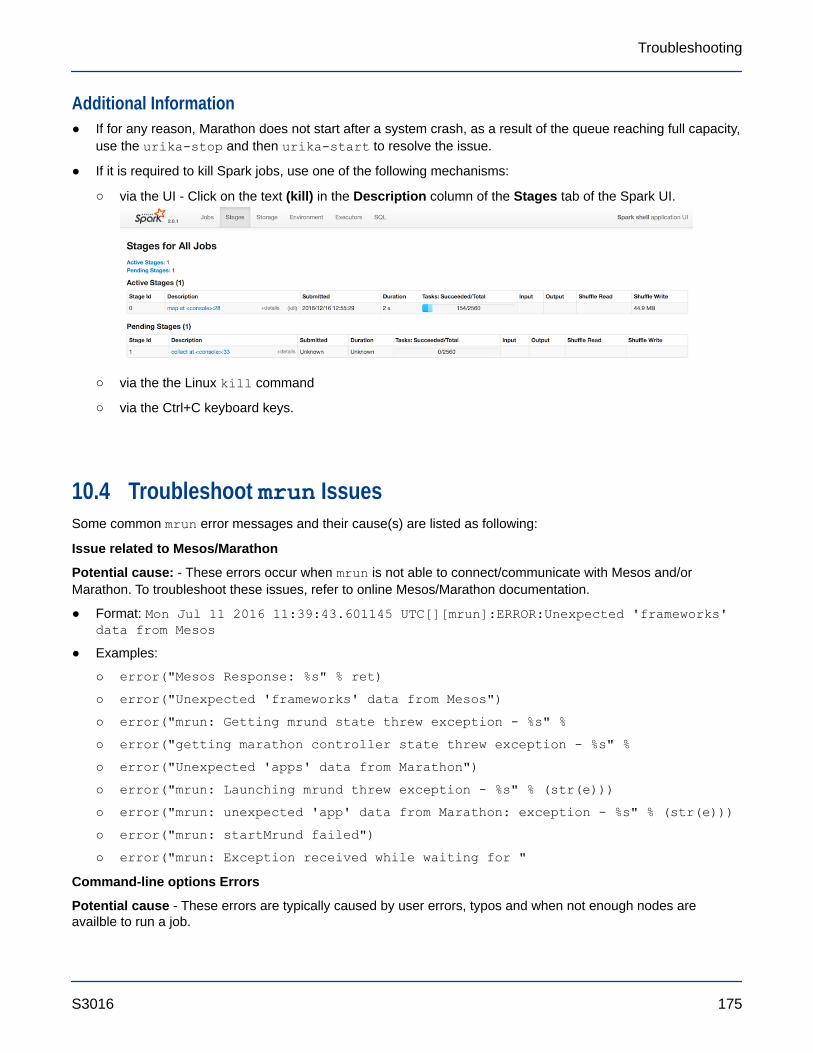
Additional Information● If for any reason, Marathon does not start after a system crash, as a result of the queue reaching full capacity,
use the urika-stop and then urika-start to resolve the issue.
● If it is required to kill Spark jobs, use one of the following mechanisms:
○ via the UI - Click on the text (kill) in the Description column of the Stages tab of the Spark UI.
○ via the the Linux kill command
○ via the Ctrl+C keyboard keys.
10.4 Troubleshoot mrun IssuesSome common mrun error messages and their cause(s) are listed as following:
Issue related to Mesos/Marathon
Potential cause: - These errors occur when mrun is not able to connect/communicate with Mesos and/orMarathon. To troubleshoot these issues, refer to online Mesos/Marathon documentation.
● Format: Mon Jul 11 2016 11:39:43.601145 UTC[][mrun]:ERROR:Unexpected 'frameworks'data from Mesos
● Examples:
○ error("Mesos Response: %s" % ret)○ error("Unexpected 'frameworks' data from Mesos")○ error("mrun: Getting mrund state threw exception - %s" %○ error("getting marathon controller state threw exception - %s" %○ error("Unexpected 'apps' data from Marathon")○ error("mrun: Launching mrund threw exception - %s" % (str(e)))○ error("mrun: unexpected 'app' data from Marathon: exception - %s" % (str(e)))○ error("mrun: startMrund failed")○ error("mrun: Exception received while waiting for "
Command-line options Errors
Potential cause - These errors are typically caused by user errors, typos and when not enough nodes areavailble to run a job.
Troubleshooting
S3016 175
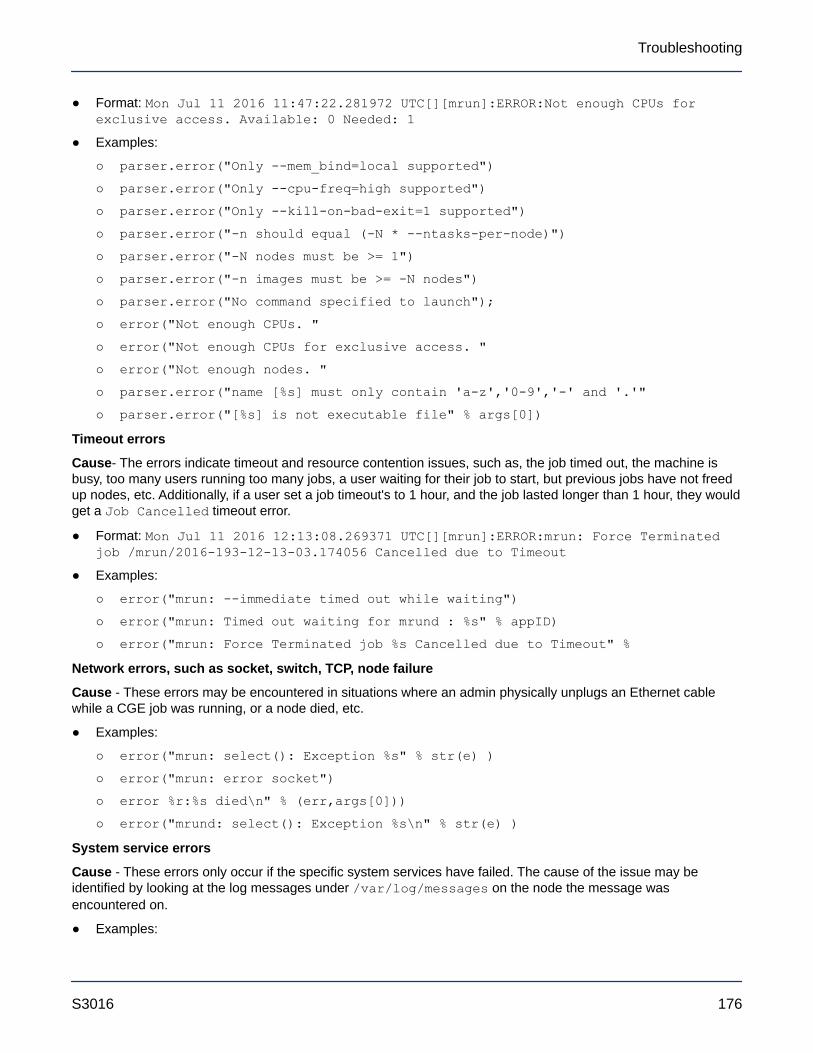
● Format: Mon Jul 11 2016 11:47:22.281972 UTC[][mrun]:ERROR:Not enough CPUs forexclusive access. Available: 0 Needed: 1
● Examples:
○ parser.error("Only --mem_bind=local supported")○ parser.error("Only --cpu-freq=high supported")○ parser.error("Only --kill-on-bad-exit=1 supported")○ parser.error("-n should equal (-N * --ntasks-per-node)")○ parser.error("-N nodes must be >= 1")○ parser.error("-n images must be >= -N nodes")○ parser.error("No command specified to launch");○ error("Not enough CPUs. "○ error("Not enough CPUs for exclusive access. "○ error("Not enough nodes. "○ parser.error("name [%s] must only contain 'a-z','0-9','-' and '.'"○ parser.error("[%s] is not executable file" % args[0])
Timeout errors
Cause- The errors indicate timeout and resource contention issues, such as, the job timed out, the machine isbusy, too many users running too many jobs, a user waiting for their job to start, but previous jobs have not freedup nodes, etc. Additionally, if a user set a job timeout's to 1 hour, and the job lasted longer than 1 hour, they wouldget a Job Cancelled timeout error.
● Format: Mon Jul 11 2016 12:13:08.269371 UTC[][mrun]:ERROR:mrun: Force Terminatedjob /mrun/2016-193-12-13-03.174056 Cancelled due to Timeout
● Examples:
○ error("mrun: --immediate timed out while waiting")○ error("mrun: Timed out waiting for mrund : %s" % appID)○ error("mrun: Force Terminated job %s Cancelled due to Timeout" %
Network errors, such as socket, switch, TCP, node failure
Cause - These errors may be encountered in situations where an admin physically unplugs an Ethernet cablewhile a CGE job was running, or a node died, etc.
● Examples:
○ error("mrun: select(): Exception %s" % str(e) )○ error("mrun: error socket")○ error %r:%s died\n" % (err,args[0]))○ error("mrund: select(): Exception %s\n" % str(e) )
System service errors
Cause - These errors only occur if the specific system services have failed. The cause of the issue may beidentified by looking at the log messages under /var/log/messages on the node the message wasencountered on.
● Examples:
Troubleshooting
S3016 176
○ NCMD: Error leasing cookies MUNGE:○ Munge authentication failure [%s] (%s).\n
For more information, see the mrun(1) man page.
10.5 Troubleshoot: Application Hangs as a Result of NFS File Locking
About this taskApplications may hang when NFS file systems are projected through DVS and file locking is used. To avoid thisissue:
Procedure
Specify the nolock option in the NFS mount point on DVS servers.
See the nfs(5) man page for more information on the nolock option.
10.6 Troubleshoot: DVS does not Start after Data Store Move
About this taskIf DVS fails after the Cray system's data store is moved to a shared external Lustre file system, verify that DVShas the correct lnd_name that uniquely identifies the Cray system to the LNet router. The default value forlnd_name on a single-user Lustre file system is gni. Each system sharing an external Lustre file system musthave a unique gni* identifier, such as gni0, gni1.
Procedure
Modify the /etc/modprobe.d/dvs.conf file to add the following line:
10.7 Troubleshoot: DVS Ignores User Environment VariablesIf the nouserenv option has not been specified in the DVS entry, and a DVS user environment variable that wasset does not override the associated DVS mount option, it appears as if DVS is ignoring user environmentvariables. This can be caused by the addition of a large number of user environment variables. Due to the natureof Linux, if a user adds a large number of user environment variables (large enough that the kernel needs to storethat information somewhere other than the usual location), DVS may not be able to find and apply those userenvironment variables, producing unexpected results.
To define a large number of user environment variables, Cray recommends that users include those definitions inthe user's shell so that they are available at startup and stored where DVS can always locate them.
Troubleshooting
S3016 177
10.8 Clear Leftover hugetlbf Files
PrerequisitesThis procedure requires root privileges
About this taskFollow the instructions in this procedure if the system displays the error message, "LIBDMAPP ERROR duringcreate in _dmappi_get_sheap_addr_hugepages: Permission denied". The node IDs shown inthese examples are for a system containing 3 sub-racks. If a system with 2 sub-racks is being used, replace thesewith the node IDs for a 2 sub-rack system.
Procedure
1. Log on to the System Management Workstation (SMW) as root
2. Execute the following command to clear out any leftover hugetlbf files
# pdsh -w 'nid000[00-47]' '/bin/rm -f /var/lib/hugetlbfs/global/*/*DMAPP*'
3. Verify that the leftover hugetlbf files have been cleared
# pdsh -w 'nid000[00-47]' '/bin/ls -l /var/lib/hugetlbfs/global/*/*DMAPP*' 2>/dev/null|wc0 0 0
10.9 Remove Temporary Spark Files from SSDs
PrerequisitesThis procedure requires root privileges.
About this taskSpark writes temporary files to the SSDs of the compute nodes that the Spark executors run on. Ordinarily, thesetemporary files are cleaned up by Spark when its execution completes. However, sometimes Spark may fail tofully clean up its temporary files, such as, when the Spark executors is not shut down correctly. If this happens toomany times, or with very large temporary files, the SSD may begin to fill up. This can cause Spark jobs to fail orslow down.
Urika-GX checks for any idle nodes once per hour, and cleans up any left over temporary files. This is handled bya cron job on one of the login nodes that executes the /usr/sbin/cleanupssds.sh script once per hour.Follow the instructions in this procedure if this automated cleaning ever proves to be insufficient.
Procedure
1. Log on to one of the login nodes as root.
Troubleshooting
S3016 178
2. Kill all the processes of running Spark jobs.
3. Execute the /usr/sbin/cleanupssds.sh script.
# /usr/sbin/cleanupssds.sh
10.10 CSMS Troubleshooting InformationThere are a number of mechanisms that can be used to debug CSMS issues.
General debugging tips● Many OpenStack CLI commands provide the --debug and/or --verbose option(s), which may be useful if
unexpected behavior is encountered.
● When determining the root cause of unexpected behavior, check if the command being executed has anyshow options, such as heat stack-show, nova show, ironic node-show, etc. If so, there may beuseful information in the resulting output, often in a fault or reason field. For additional information,examine the OpenStack logs in the per-service /var/log/ directories around the time of the failure for anymessages that may indicate the source of the problem.
10.10.1 kdump utilityThe kdump utility is installed and enabled by default to ensure that data is saved in the event of a server kernelpanic. Refer to the RedHat Kernel Crash Dump Guide for details on customizing kdump.
The crash command is also installed and can be used to examine crash dump data. Kernel crash dumps arestored in /var/crash/ by default. In order to use crash on the server, the kernel-debuginfo package mustalso be installed.
Users creating tenant images for deployment via OpenStack are responsible for configuring the tenant imageswith kdump support if desired. Administrators are also responsible for copying and/or removing kdump data fromtenant nodes.
10.10.2 The cray_dumpsys CommandThe cray_dumpsys script gathers data needed to debug the CSMS. It dumps the state of the OpenStackservices, configuration and log files, and background information about the system. The files are compressed andthe results are stored in the /var/tmp/ directory. By default, only recent logs are dumped.
cray_dumpsys includes the --all-logs option to dump all rotated logs. Additionally, the --days optiondumps logs up to a certain number of days. For example:
root@smw2# cray_dumpsys --days 4/root/admin.openrc sourced!
sosreport (version 3.2)
This command will collect diagnostic and configuration information from[...]
Troubleshooting
S3016 179
Setting up archive ...Setting up plugins ...Running plugins. Please wait ...Running 1/12: memory...Running 2/12: mysql...Running 3/12: networking...[...]Running 12/12: newtplugin...
Creating compressed archive...
Your sosreport has been generated and saved in:/var/tmp/sosreport-newt-20150923124808.tar.xz
The checksum is: bb87d9323f88813e07659e53aebb16b6
Please send this file to your support representative.
Troubleshooting
S3016 180

11 Security
11.1 Authentication MechanismsTable 22. Authentication Mechanisms
Application Authentication Mechanism
Cray Application Management UI LDAP. Users can also log in with the default accountshipped with the system. This account has the followingcredentials:
username: admin
password: admin
Cray System Management UI This application is only accessible to systemadministrators. The default credentials for logging on tothis interface are:
username: admin
password: initial0
Urika-GX Applications Interface Not available.
Documentation and Learning Resources UI Not available.
Grafana UI LDAP. The system also ships with a default account thatcan be used to log on to Grafana. The credentials of thisaccount are:
username: admin
password: admin
Jupyter Notebook UI LDAP. The system also ships with a default account thatcan be used to log on to Jupyter. The credentials of thisaccount are:
username: crayadm
password: initial0
HUE UI LDAP
Security
S3016 181
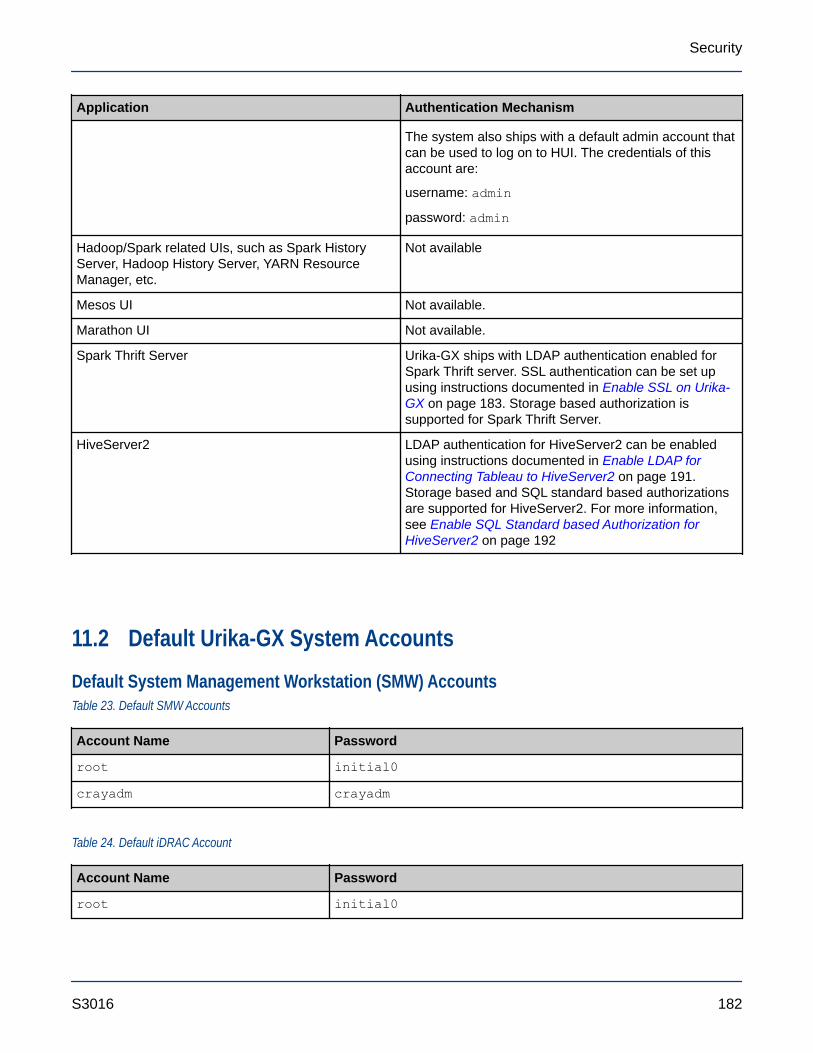
Application Authentication Mechanism
The system also ships with a default admin account thatcan be used to log on to HUI. The credentials of thisaccount are:
username: admin
password: admin
Hadoop/Spark related UIs, such as Spark HistoryServer, Hadoop History Server, YARN ResourceManager, etc.
Not available
Mesos UI Not available.
Marathon UI Not available.
Spark Thrift Server Urika-GX ships with LDAP authentication enabled forSpark Thrift server. SSL authentication can be set upusing instructions documented in Enable SSL on Urika-GX on page 183. Storage based authorization issupported for Spark Thrift Server.
HiveServer2 LDAP authentication for HiveServer2 can be enabledusing instructions documented in Enable LDAP forConnecting Tableau to HiveServer2 on page 191.Storage based and SQL standard based authorizationsare supported for HiveServer2. For more information,see Enable SQL Standard based Authorization forHiveServer2 on page 192
11.2 Default Urika-GX System Accounts
Default System Management Workstation (SMW) AccountsTable 23. Default SMW Accounts
Account Name Password
root initial0
crayadm crayadm
Table 24. Default iDRAC Account
Account Name Password
root initial0
Security
S3016 182
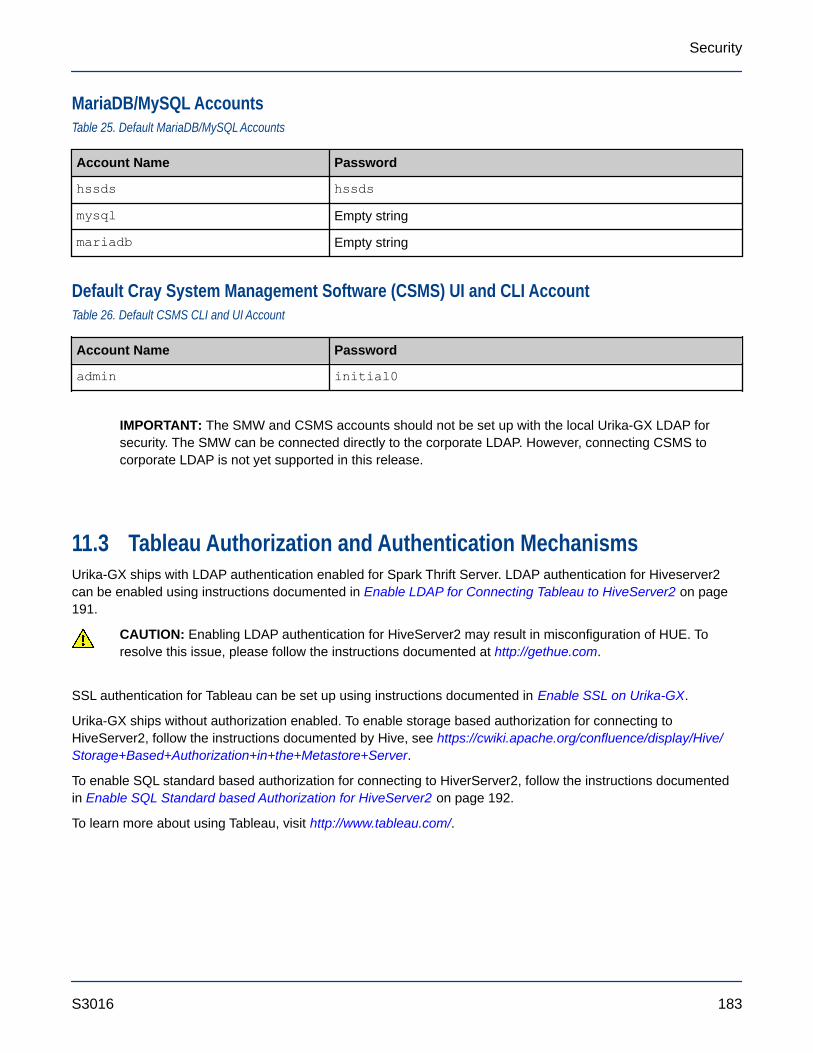
MariaDB/MySQL AccountsTable 25. Default MariaDB/MySQL Accounts
Account Name Password
hssds hssds
mysql Empty string
mariadb Empty string
Default Cray System Management Software (CSMS) UI and CLI AccountTable 26. Default CSMS CLI and UI Account
Account Name Password
admin initial0
IMPORTANT: The SMW and CSMS accounts should not be set up with the local Urika-GX LDAP forsecurity. The SMW can be connected directly to the corporate LDAP. However, connecting CSMS tocorporate LDAP is not yet supported in this release.
11.3 Tableau Authorization and Authentication MechanismsUrika-GX ships with LDAP authentication enabled for Spark Thrift Server. LDAP authentication for Hiveserver2can be enabled using instructions documented in Enable LDAP for Connecting Tableau to HiveServer2 on page191.
CAUTION: Enabling LDAP authentication for HiveServer2 may result in misconfiguration of HUE. Toresolve this issue, please follow the instructions documented at http://gethue.com.
SSL authentication for Tableau can be set up using instructions documented in Enable SSL on Urika-GX.
Urika-GX ships without authorization enabled. To enable storage based authorization for connecting toHiveServer2, follow the instructions documented by Hive, see https://cwiki.apache.org/confluence/display/Hive/Storage+Based+Authorization+in+the+Metastore+Server.
To enable SQL standard based authorization for connecting to HiverServer2, follow the instructions documentedin Enable SQL Standard based Authorization for HiveServer2 on page 192.
To learn more about using Tableau, visit http://www.tableau.com/.
Security
S3016 183
https://cwiki.apache.org/confluence/display/Hive/Storage+Based+Authorization+in+the+Metastore+Server
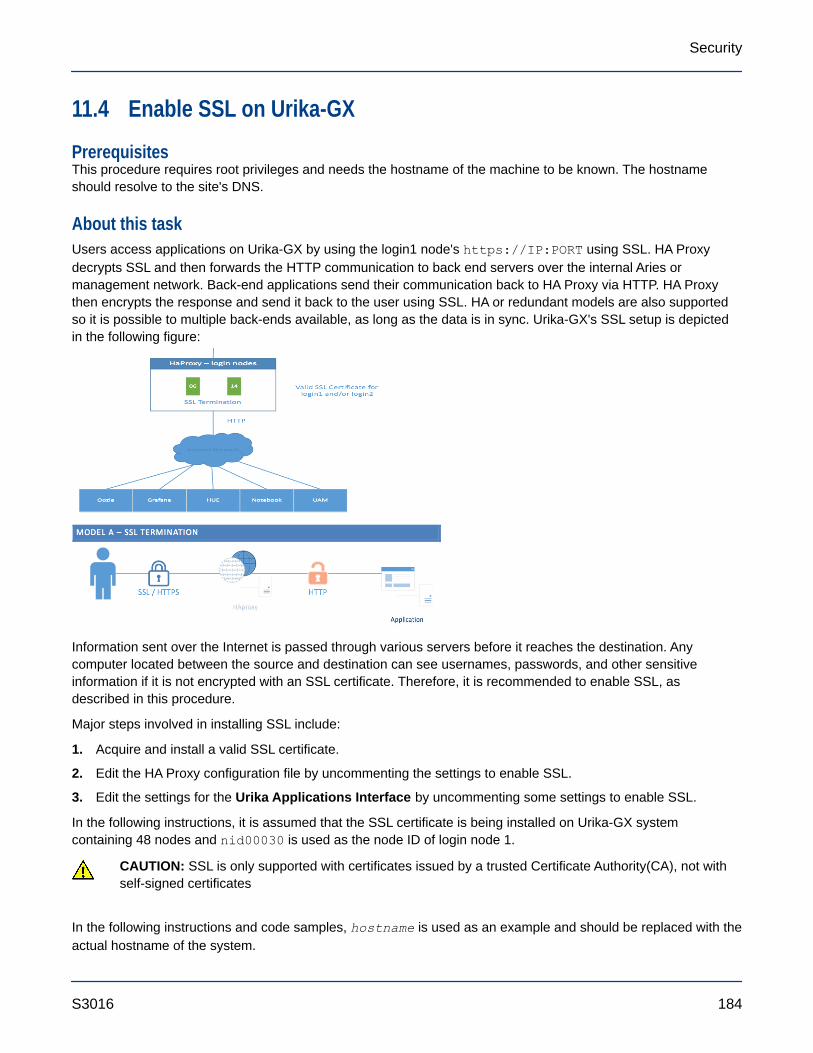
11.4 Enable SSL on Urika-GX
PrerequisitesThis procedure requires root privileges and needs the hostname of the machine to be known. The hostnameshould resolve to the site's DNS.
About this taskUsers access applications on Urika-GX by using the login1 node's https://IP:PORT using SSL. HA Proxydecrypts SSL and then forwards the HTTP communication to back end servers over the internal Aries ormanagement network. Back-end applications send their communication back to HA Proxy via HTTP. HA Proxythen encrypts the response and send it back to the user using SSL. HA or redundant models are also supportedso it is possible to multiple back-ends available, as long as the data is in sync. Urika-GX's SSL setup is depictedin the following figure:
Information sent over the Internet is passed through various servers before it reaches the destination. Anycomputer located between the source and destination can see usernames, passwords, and other sensitiveinformation if it is not encrypted with an SSL certificate. Therefore, it is recommended to enable SSL, asdescribed in this procedure.
Major steps involved in installing SSL include:
1. Acquire and install a valid SSL certificate.
2. Edit the HA Proxy configuration file by uncommenting the settings to enable SSL.
3. Edit the settings for the Urika Applications Interface by uncommenting some settings to enable SSL.
In the following instructions, it is assumed that the SSL certificate is being installed on Urika-GX systemcontaining 48 nodes and nid00030 is used as the node ID of login node 1.
CAUTION: SSL is only supported with certificates issued by a trusted Certificate Authority(CA), not withself-signed certificates
In the following instructions and code samples, hostname is used as an example and should be replaced with theactual hostname of the system.
Security
S3016 184
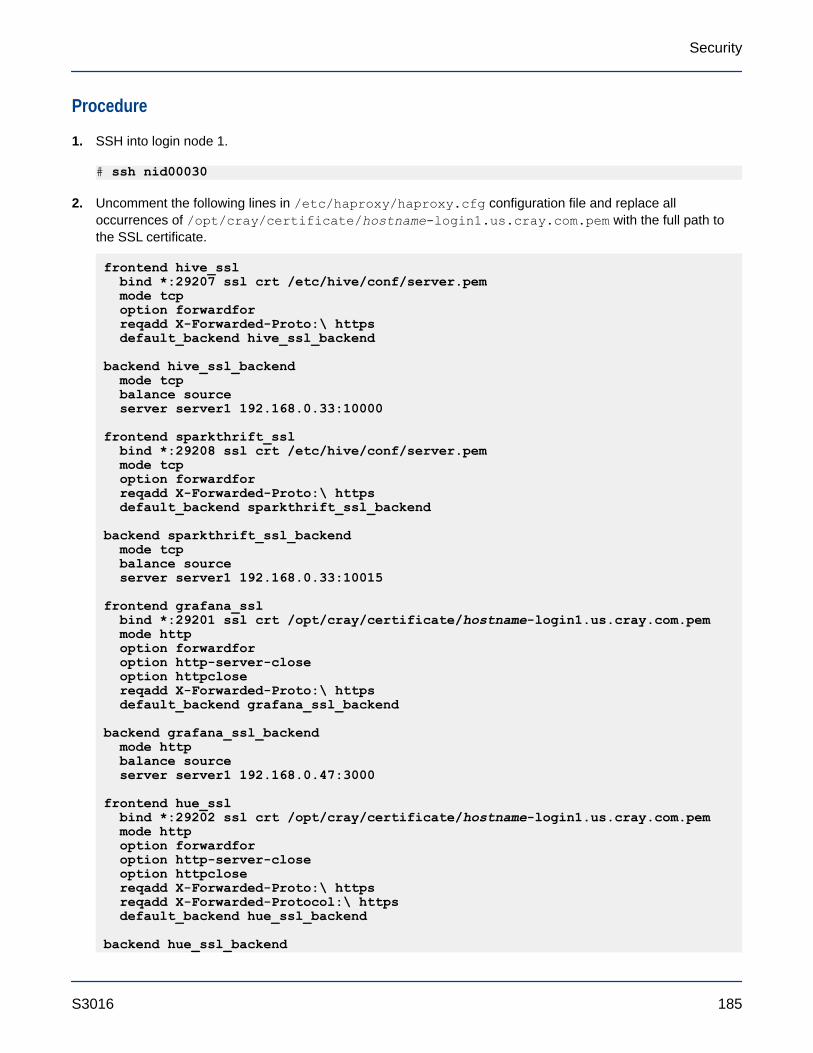
Procedure
1. SSH into login node 1.
# ssh nid00030
2. Uncomment the following lines in /etc/haproxy/haproxy.cfg configuration file and replace alloccurrences of /opt/cray/certificate/hostname-login1.us.cray.com.pem with the full path tothe SSL certificate.
frontend hive_ssl bind *:29207 ssl crt /etc/hive/conf/server.pem mode tcp option forwardfor reqadd X-Forwarded-Proto:\ https default_backend hive_ssl_backend backend hive_ssl_backend mode tcp balance source server server1 192.168.0.33:10000
frontend sparkthrift_ssl bind *:29208 ssl crt /etc/hive/conf/server.pem mode tcp option forwardfor reqadd X-Forwarded-Proto:\ https default_backend sparkthrift_ssl_backend backend sparkthrift_ssl_backend mode tcp balance source server server1 192.168.0.33:10015
frontend grafana_ssl bind *:29201 ssl crt /opt/cray/certificate/hostname-login1.us.cray.com.pem mode http option forwardfor option http-server-close option httpclose reqadd X-Forwarded-Proto:\ https default_backend grafana_ssl_backend backend grafana_ssl_backend mode http balance source server server1 192.168.0.47:3000 frontend hue_ssl bind *:29202 ssl crt /opt/cray/certificate/hostname-login1.us.cray.com.pem mode http option forwardfor option http-server-close option httpclose reqadd X-Forwarded-Proto:\ https reqadd X-Forwarded-Protocol:\ https default_backend hue_ssl_backend backend hue_ssl_backend
Security
S3016 185

mode http balance source server server3 192.168.0.31:8888 frontend jupyter_ssl bind *:29204 ssl crt /opt/cray/certificate/hostname-login1.us.cray.com.pem mode http option forwardfor option http-server-close option httpclose reqadd X-Forwarded-Proto:\ https default_backend jupyter_ssl_backend backend jupyter_ssl_backend mode http balance source server server4 192.168.0.31:7800 frontend csms_ssl bind *:29200 ssl crt /opt/cray/certificate/hostname-login1.us.cray.com.pem mode http option forwardfor option http-server-close option httpclose reqadd X-Forwarded-Proto:\ https default_backend csms_ssl_backend backend csms_ssl_backend mode http balance source server server2 10.142.0.1:443 ssl verify none frontend urika-app-magmt_ssl bind *:29203 ssl crt /opt/cray/certificate/hostname-login1.us.cray.com.pem mode http option forwardfor option http-server-close option httpclose reqadd X-Forwarded-Proto:\ https reqadd X-Forwarded-Protocol:\ https default_backend urika-app-magmt_ssl_backend backend urika-app-magmt_ssl_backend mode http balance source server server1 192.168.0.31:8000
In the above file, 192.168.0.31 is the IP address of the node where HUE is running. 8888 is the port whereHUE is running. If SSL is enabled, the HUE UI would be available at https://hostname-login1:29202.HUE would still be available at http://hostname-login1:8888, but this URL not secure. It isrecommended to use https://hostname-login1:29202.
3. Save the /etc/haproxy/haproxy.cfg configuration file.
4. Restart HAProxy
# service haproxy restart
Security
S3016 186
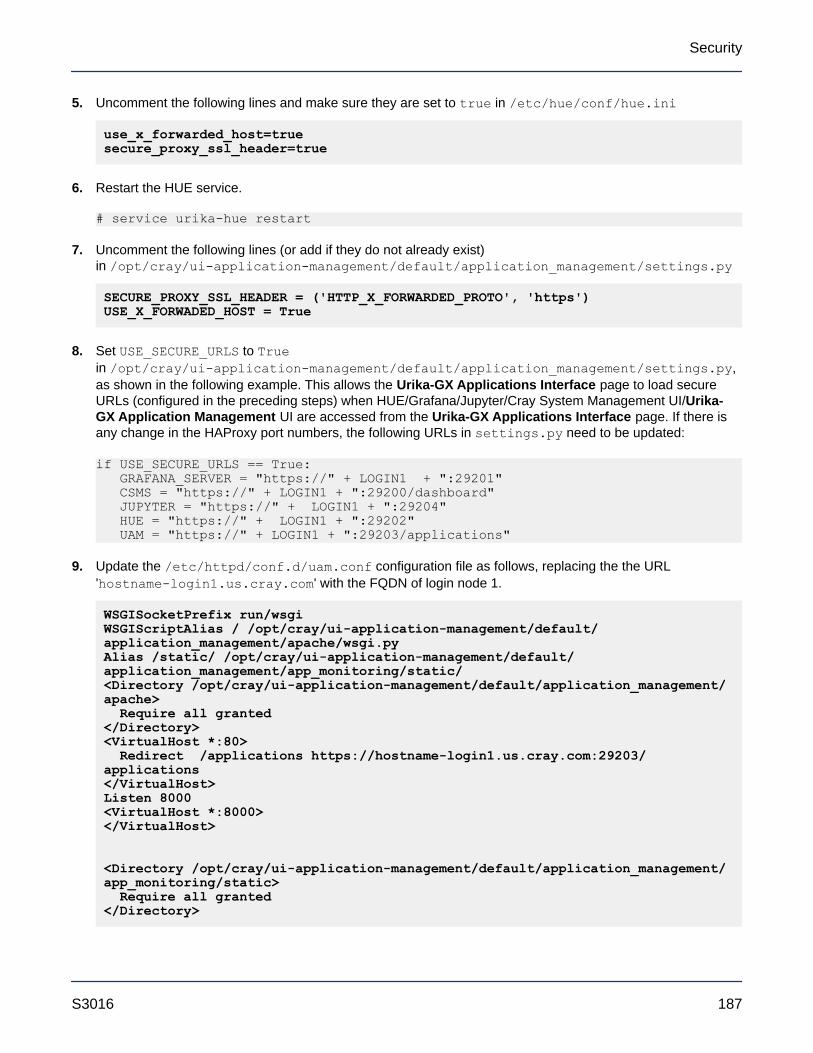
5. Uncomment the following lines and make sure they are set to true in /etc/hue/conf/hue.ini
use_x_forwarded_host=truesecure_proxy_ssl_header=true
6. Restart the HUE service.
# service urika-hue restart
7. Uncomment the following lines (or add if they do not already exist)in /opt/cray/ui-application-management/default/application_management/settings.py
SECURE_PROXY_SSL_HEADER = ('HTTP_X_FORWARDED_PROTO', 'https')USE_X_FORWADED_HOST = True
8. Set USE_SECURE_URLS to Truein /opt/cray/ui-application-management/default/application_management/settings.py,as shown in the following example. This allows the Urika-GX Applications Interface page to load secureURLs (configured in the preceding steps) when HUE/Grafana/Jupyter/Cray System Management UI/Urika-GX Application Management UI are accessed from the Urika-GX Applications Interface page. If there isany change in the HAProxy port numbers, the following URLs in settings.py need to be updated:
if USE_SECURE_URLS == True: GRAFANA_SERVER = "https://" + LOGIN1 + ":29201" CSMS = "https://" + LOGIN1 + ":29200/dashboard" JUPYTER = "https://" + LOGIN1 + ":29204" HUE = "https://" + LOGIN1 + ":29202" UAM = "https://" + LOGIN1 + ":29203/applications"
9. Update the /etc/httpd/conf.d/uam.conf configuration file as follows, replacing the the URL'hostname-login1.us.cray.com' with the FQDN of login node 1.
WSGISocketPrefix run/wsgiWSGIScriptAlias / /opt/cray/ui-application-management/default/application_management/apache/wsgi.pyAlias /static/ /opt/cray/ui-application-management/default/application_management/app_monitoring/static/<Directory /opt/cray/ui-application-management/default/application_management/apache> Require all granted</Directory><VirtualHost *:80> Redirect /applications https://hostname-login1.us.cray.com:29203/applications</VirtualHost>Listen 8000<VirtualHost *:8000></VirtualHost> <Directory /opt/cray/ui-application-management/default/application_management/app_monitoring/static> Require all granted</Directory>
Security
S3016 187
10. Restart Apache on login node 1.
# service httpd restart
11. SSH on to the SMW.
hostname is used in the following example as the machine name.
# ssh hostname-smw
12. Uncomment the following lines (or add if they do not already exist)in /usr/share/openstack-dashboard/openstack_dashboard/settings.py:
SECURE_PROXY_SSL_HEADER = ('HTTP_X_FORWARDED_PROTO', 'https')USE_X_FORWADED_HOST = True
13. Restart Apache on the SMW
# service httpd restart
14. Verify that all the URLs of services are accessible.
11.5 Install a Trusted SSL Certificate on Urika-GX
PrerequisitesThis procedure needs to be performed as root. The hostname needs to be known and needs to resolve to thesite's DNS.
About this taskThis procedure provides instructions for installing a SSL certificate that has been issued by a trusted CertificateAuthority (CA). In the following instructions, nid00030 is used as an exmaple for login node 1's ID. Pleasereplace 'hostname-login1.us.cray.com' in the following examples with the FQDN of login node 1.
Procedure
1. Log on to login node 1 as root.
2. Generate a key. Following is an example for generating a key using openssl
[root@nid00030~]# openssl genrsa -out hostname-login1.us.cray.com.key 2048
3. Generate a Certificate Signing Request (CSR). The system will prompt to enter information that will beincorporated into the certificate request.
[root@nid00030~]# openssl req -new-key hostname-login1.us.cray.com.key -out hostname-login1.us.cray.com.csr
4. Store the CSR in a secure location on the system, such as /opt/cray/certificate
Security
S3016 188

5. Send the CSR to the IT department to obtain a certifcate
6. Create a PEM file, which is the crt + key combined into 1 file.
WARNING: The PEM file needs a linefeed bewteen crt and key. Use a vi editor or the cat commandto combine the crt and key
[root@nid00030~]# cat server.crt server.key > server.pem
7. Save the PEM file as hostname-login1.us.cray.com.pem under /opt/cray/certificate.
11.6 Enable LDAP Authentication on Urika-GX
Prerequisites● This procedure requires root access.
● Ensure that the storage LDAP client points at login node 1, which is the LDAP server on Urika-GX. Thisensures that the Urika-GX system and storage are authenticating to the same source.
NOTE: This examples used in this procedure are intended for a 3 sub-rack system. Replace node IDs asneeded when executing the following commands if using a system containing less than 3 sub-racks.
About this taskUrika-GX uses an internal LDAP server that comes with two basic user types:
● crayusr – This is the standard user type
● crayadm – Users of this type have root/admin privileges.
The Urika-GX LDAP setup is depicted in the following figure:
Security
S3016 189

Figure 58. Urika-GX LDAP Setup
The following procedure can be used to enable the LDAP server for every Urika®-GX node. In the followinginstructions, login-1 is used as an example for the name of login node 1, which is where the LDAP service runs.
CAUTION: Cray Support should be involved for all LDAP related procedures and changes.
Procedure
1. Log on to login node 1 as root.
# ssh root@login-1
2. Edit the /usr/local/openldap/etc/openldap/slapd.conf file to uncomment the following lines, andreplace [myldap] with the actual LDAP server’s URL:
[root@login-1 ~]# vi /usr/local/openldap/etc/openldap/slapd.conf #uri"ldap://[myldap]/ou=external,dc=local"#lastmod off#suffixmassage"ou=external,dc=local" "[dc=datacenter,dc=cray,dc=com]"
NOTE: The square brackets, i.e. [ ] need to be omitted when replacing [myldap] with the actualLDAP server’s URL.
For example, if the LDAP server’s URL is hostname.com, the line:
# uri"ldap://[myldap]/ou=external,dc=local"
should be uncommented and customized to look like the following:
uri"ldap://hostname.com/ou=external,dc=local"
Security
S3016 190
3. Save the /usr/local/openldap/etc/openldap/slapd.conf file.
4. Restart the slapd daemon, which listens for LDAP connections.
[root@login-1 ~]# service slapd restart
5. Restart the oddjobd daemon, which provides a means for invoking and taking limited control of applications.
[root@login-1 ~]# service oddjobd restart
6. Ensure that LDAP has been set up properly
a. Log on to the System Management Workstation (SMW) as root.
b. Verify that the users registered with LDAP are listed on all the nodes.
In the following example, system-smw is used as an example for the SMW's hostname and username isused as an example of an LDAP user's username.
# root@system-smw pdsh -w nid000[00-47] 'id username'
c. Log on to login node 1.
# ssh root@login-1
d. Verify that all LDAP users are listed when the ldapsearch command is executed for all entries:
[root@nid00030 ~]# ldapsearch -h 127.0.0.1 -D "cn=crayadm,dc=local" -w initial0 -b "dc=local"
For information about internal LDAP or the LDAP server, contact Cray Support. For advanced configurationsettings, see the OpenLDAP Software Administrator’s guide at http://www.openldap.org.
11.6.1 Enable LDAP for Connecting Tableau to HiveServer2
PrerequisitesThis procedure requires root privileges.
About this taskThis procedure provides instructions for enabling LDAP for connecting HiveServer2 to Tableau or other externalclients.
Procedure
1. Log on to the SMW.
2. Stop the HiveServer2 service.
# urika-stop -s hive
3. Connect to a node where the HiveServer2 service is running.
Security
S3016 191
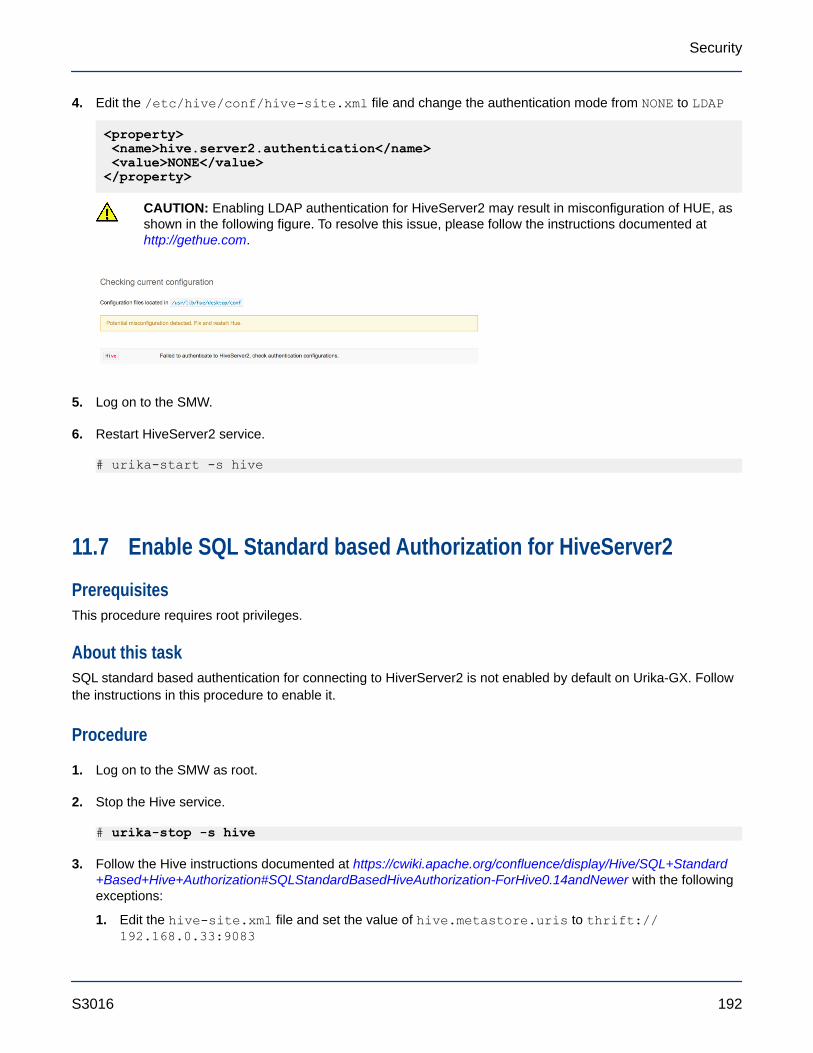
4. Edit the /etc/hive/conf/hive-site.xml file and change the authentication mode from NONE to LDAP
<property> <name>hive.server2.authentication</name> <value>NONE</value></property>
CAUTION: Enabling LDAP authentication for HiveServer2 may result in misconfiguration of HUE, asshown in the following figure. To resolve this issue, please follow the instructions documented at http://gethue.com.
5. Log on to the SMW.
6. Restart HiveServer2 service.
# urika-start -s hive
11.7 Enable SQL Standard based Authorization for HiveServer2
PrerequisitesThis procedure requires root privileges.
About this taskSQL standard based authentication for connecting to HiverServer2 is not enabled by default on Urika-GX. Followthe instructions in this procedure to enable it.
Procedure
1. Log on to the SMW as root.
2. Stop the Hive service.
# urika-stop -s hive
3. Follow the Hive instructions documented at https://cwiki.apache.org/confluence/display/Hive/SQL+Standard+Based+Hive+Authorization#SQLStandardBasedHiveAuthorization-ForHive0.14andNewer with the followingexceptions:
1. Edit the hive-site.xml file and set the value of hive.metastore.uris to thrift://192.168.0.33:9083
Security
S3016 192
2. Use either or both of the values defined in the Hive documentation for thehive.security.authorization.manager configuration parameter.
3. Edit hive-site.xml to set values of properties, as opposed to the Hive documentation, which instructsusers to set these properties in hiveserver2-site.xml
NOTE: Even though the documentation at https://cwiki.apache.org/confluence/display/Hive/SQL+Standard+Based+Hive+Authorization#SQLStandardBasedHiveAuthorization-ForHive0.14andNewerinstructs users to put some settings into hiveserver2-site.xml, all of the properties listed in thelinked documentation should go in hive-site.xml.
There is no need to modify other parameters of the hive-site.xml file that are documented in the Hivedocumentation, as they are already configured on the Urika-GX system.
4. Start the Hive service.
# urika-start -s hive
5. Reconnect to HiveServer2.
11.8 Change LDAP Password on Urika-GX
PrerequisitesThis procedure requires root privileges.
About this taskFollow the instructions in this procedure to change the LDAP password on Urika-GX
Procedure
1. Log on to nid00030, which is a login node.
2. Edit the slapd.conf file and add in ACLs to allow users to modify the LDAP password.
[root@nid0003~]# vim /usr/local/openldap/etc/openldap/slapd# Define global ACLs to disable default read access. access to * by self write by * read by anonymous auth
3. Restart slapd
[root@nid00030]# ldappasswd -H ldap://127.0.0.1 -x -D \"uid=crayusr,ou=users,dc=urika,dc=com" -w initial0 -a initial0 -S
4. Login as crayusr to test changing password by entering it when prompted.
[crayusr@nid0003~]# ldappasswd -H ldap://127.0.0.1 -x -D "uid=crayusr,ou=users,dc=urika,dc=com" \-w initial0 -a initial0 -S
Security
S3016 193

New password: Re-enter newpassword:
11.9 File System PermissionsThis section provides details on user restrictions and access controls implemented on Urika-GX for the threeUrika-GX file systems.
● Internal file systems
○ Hadoop Distributed File System (HDFS) - Apache Hadoop HDFS implements authentication andauthorization model similar to POSIX model, where each file is associated with an owner and a group.Urika-GX implements a simple mode of user authentication. In this mode, the identify of a client processis determined by the OS's user name, which can be retrieved via the whoami command. The userauthentication is managed by Open LDAP server running on login node 1. Groups and user credential areinherited from the Open LDAP.
○ Network File System (NFS) - The SMW provides the NFS mount, which has the same groups and userpermissions as those of the host operating system.
● External file system (Lustre) - If Lustre is used on Urika-GX, it inherits Linux group permissions from thelogin node.
11.10 Urika-GX Security Quick Reference Information
Configuration of LDAP Settings on Urika-GXThe Open LDAP server on Urika-GX runs on login node 1. For example, if the system's hostname is hostnatme,then the Open LDAP service would run on hostname-login1. The particular ID of the login node (such asnid00030 on a 48 node system) would change, based on the number of nodes in the system i.e. 16N, 32N or48N. The Open LDAP server and can be connected with the site corporate LDAP server from which, groups,permissions and user credentials will be inherited. Please refer to the site specific LDAP server documentation fordetails on setup and configuration.
LDAP and User management InformationFor details of how to add, enable and manage users on LDAP please refer to http://www.openldap.org.
● Configure LDAP settings - The Open LDAP server on Urika-GX can be connected with the site/corporateLDAP server, from which groups, permissions, and user credentials will be inherited.
● Open LDAP service node - The Open LDAP service runs on login node 1 of Urika-GX system. For example,if the hostname of your Urika-GX is hostname then Open LDAP service is running on hostname-login1. Theparticular node (such as: nid00030) would change, based on the number of nodes in the system i.e. 16N, 32Nor 48N
● Authenticate users - Urika-GX uses LDAP based authentication. System administrators can use LDAPservers to setup user authentication.
● Add a user to a group - Use the usermod command to add a user to an existing group.
Security
S3016 194

● Add a user to LDAP - Use the ldapadd command to add a user to LDAP.
● Create a group on each node - In order to enable group permissions in HDFS, the changes on the Linuxsystem need to take place on the server that is running the NameNode service. If it is unclear which node isrunning the NameNode service, run the urika-inventory command from the SMW. For consistency, it isrecommended to set up group(s) from the SMW on all nodes via pdsh. Use the groupadd command tocreate a group on each node and the hdfs groups command to confirm that HDFS recognizes the newgroup.
● Change user passwords - Use the ldappasswd command to change user passwords.
● Create HDFS home directory - Use the hdfs dfs -mkdir command to create a HDFS home directory.
● Change user permissions - Use the hadoop dfs -chown command to change permissions on directoryto make new user the owner of home directory
11.11 Modify the Secret of a Mesos Framework
PrerequisitesThis procedure requires root privileges.
About this taskThe urika-mesos-change-secret command is used to change the secret of the Spark and/or Marathonframeworks, which are registered with Mesos on Urika-GX. This script needs to be run as root from the SMW. Thesecret entered needs to be in plain text. The Mesos cluster needs to be stopped (via urika-stop -smesos_cluster) before running this script and then restarted (via urika-start -s mesos_cluster) after the scriptfinishes executing. If the Mesos cluster is not restarted after running this script, the framework will notauthenticate. The following list of items, which is subject to change, needs to be kept under consideration whencreating a new secret for a framework:
● All lowercase and uppercase letters and numbers are allowed in secrets. -, _, and . are allowed at anyposition in the secret
● ! can be used, but should not be the first character
● Other punctuation characters can cause authentication issues and are not recommended
● White space in the secret is not allowed. White space at the end of the string will get trimmed
● An empty space secret will not authenticate.
This command accepts the following options:
● -spark secret - Use this option to update the secret of the Spark framework. secret refers to the text usedto specify the new secret for the framework under consideration.
● -marathon secret - Use this option to update the secret of the Marathon framework. secret refers to thetext used to specify the new secret for the framework under consideration.
Use the -h or --h options for more information.
On Urika-GX, the following frameworks need authenticate with Mesos:
Security
S3016 195
● Spark
● Marathon
A principal can be thought of as an identifier for a framework, whereas a secret refers to secret information thatauthenticates the framework's principal. In order to update the secret information, the credential information ofMesos as well as that of the framework needs to get updated.
Procedure
1. Log on to the SMW as root.
2. Stop the Mesos cluster.
# urika-stop -s mesos_cluster
3. Execute the urika-change-mesos-secret script, specifying the framework and new secret.
Modify Spark's secret:
# urika-change-mesos-secret -spark secret
Modify Marathon's secret:
# urika-change-mesos-secret -marathon secret
The system will return an error if no secret is specified or if the secret is not entered in plain text.
4. Start the Mesos cluster.
CAUTION: The Mesos cluster needs to be restarted after running the urika-mesos-change-secret command, otherwise the framework will not authenticate.
# urika-start -s mesos_cluster
11.12 Reset a Forgotten Password for the Cray ApplicationManagement UI
PrerequisitesThis proedure requries root privileges and assumes that it is being carried out on a 48-node system. The nodeIDs should be replaced with acutal ones to reflect actual system configuration.
About this taskFollow the instructions in this procedure if the password has been forgotten and needs to be reset.
Procedure
1. Log on to login node 1.
Security
S3016 196

# ssh nid00030
2. Switch to the /opt/cray/ui-application-management/default directory.
# cd /opt/cray/ui-application-management/default
3. Run the ./manage.py script to reset the password and enter the new password when prompted.
# ./manage.py changepassword adminChanging password for user 'admin'Password:
11.13 Port AssignmentsTable 27. Services Running on the System Management Workstation (SMW)
Service Name Default Port
SSH 22
Table 28. Services Running on the I/O Nodes
Service Name Default Port
SSH 22
Table 29. Services Running on the Compute Nodes
Service Name Default Port
ssh 22
YARN Node Managers, if theyare running under Mesos
8040, 8042, 45454, and 13562
Mesos slaves on all computenodes
5051
DataNode Web UI to access thestatus, logs and otherinformation
50075
DataNode use for data transfers 50010
DataNode used for metadataoperations.
8010
Security
S3016 197

Table 30. Services Accessible via the Login Nodes via the Hostname
Service Default Port
Mesos Master UI 5050. This UI is user-visible.
Spark History Server's web UI 18080. This UI is user-visible.
HDFS NameNode UI forviewing health information
50070. This UI is user-visible.
Secondary NameNode web UI 50090. This UI is user-visible.
Web UI for Hadoop ApplicationTimeline Server
8188. This UI is user-visible.
YARN Resource Manager webUI
8088. This UI is user-visible.
Marathon web UI 8080. This UI is user-visible.
HiveServer2 SSL - 29207
Non-SSL - 10000
Hive Metastore 9083.
Hive WebHCat 50111.
Oozie server 11000. The Oozie dashboard UI runs on this port and is user-visible.
Hadoop Job History Server 19888 on nid00016. This is a user-visible web UI.
HUE server 8888 on login1 and login2. The web UI for the HUE dashboard runs on thisport and is user-visible.
CGE cge-launch command 3750. See S-3010, "Cray® Graph Engine Users Guide" for more informationabout the cge-launch command or see the cge-launch man page.
CGE Web UI and SPARQLendpoints
3756
Spark Web UI 4040. This port is valid only when a Spark job is running. If the port is alreadyin use, the port number's value is incremented until an open port is found.Spark Web UI runs on whichever login node (1 or 2) that the user executesspark-submit/spark-shell/spark-sql/pyspark on. This UI is user-visible.
InfluxDB 8086 on login2. InfluxDB runs on nid00046 on three sub-rack, and onnid00030 on a two sub-rack system.
InfluxDB port for listening forcollectl daemons oncompute nodes
2003. InfluxDB runs on login node 2 on the Urika-GX system.
InfluxDB cluster communication 8084
Grafana 3000 on login2 (login node 2). The Grafana UI is a user-visible.
Web UI for Jupyter Notebook 7800. Jupyter Notebook internally uses HTTP proxy, which listens to ports7881 and 7882
Security
S3016 198

Service Default Port
Urika-GX Applications Interface 80 on login1 (login node 1).
Urika-GX ApplicationManagement
80 on login1 (login node 1).
Spark SQL Thrift Server SSL - 29208
Non-SSL - 10015
Additional Ports and Services
Table 31. Additional Services and Ports They Run on
Service Port
ZooKeeper 2181
Kafka (not configured by default) 9092
Flume (not configured bydefault)
41414
Port for SSH 22
Security
S3016 199