Urban Groundwater Development and Management for ...
129
Urban Groundwater Development and Management for Metropolitan Areas in South Africa - Case study: Gautrain Tunnel. Kgotso Caswell Mahlahlane Student number: 2007014356 Submitted in fulfilment of the requirements for the degree Magister Scientiae in Geohydrology in the Faculty of Natural and Agricultural Sciences (Institute for Groundwater Studies) at the University of the Free State Supervisor: Prof Kai Witthüser October 2019
-
Upload
khangminh22 -
Category
Documents
-
view
0 -
download
0
Transcript of Urban Groundwater Development and Management for ...

Urban Groundwater Development and
Management for Metropolitan Areas in South
Africa - Case study: Gautrain Tunnel.
Kgotso Caswell Mahlahlane
Student number: 2007014356
Submitted in fulfilment of the requirements for the degree
Magister Scientiae in Geohydrology
in the
Faculty of Natural and Agricultural Sciences
(Institute for Groundwater Studies)
at the
University of the Free State
Supervisor: Prof Kai Witthüser
October 2019

- i -
DECLARATION
I, Kgotso Mahlahlane, hereby declare that the thesis hereby submitted by me to the Institute for
Groundwater Studies in the Faculty of Natural and Agricultural Sciences at the University of the Free
State, in fulfilment of the degree of Magister Scientiae, is my own independent work. It has not
previously been submitted by me to any other institution of higher education. In addition, I declare that
all sources cited have been acknowledged by means of a list of references. I furthermore cede
copyright of the thesis and its contents in favour of the University of the Free State.
This thesis emanates from a Water Research Commission (WRC) funded K5-2751 project titled
“Urban Groundwater Development and Management”. Sincere thanks are given to WRC for
financing this project.
……………………….
Kgotso Caswell Mahlahlane
Bloemfontein Campus
Date: 28 October 2019

- ii -
ACKNOWLEDGEMENTS
I would hereby like to express my sincere gratitude to all who have motivated and assisted me in the
completion of this thesis:
All the Honour and Glory belongs to God, for providing me with the faith and perseverance to
complete this thesis - James 1: 2-3.
Professor Kai Witthüser, Supervisor of this thesis, many thanks for the opportunity granted to
undertake this study. Your support, patience, and guidance are immeasurably appreciated. You
have indeed been a great Supervisor and mentor. I will carry the knowledge, skills and work
ethic I have learned from you into my future endeavours.
Helen Seyler, for her massive guidance and contribution throughout my research, always
ensuring that the study objectives are met. Thank you for your inspiration and meaningful ideas.
A special thanks to the following institutions and individuals for their support:
o Bombela Concession Company for granting permission to use the Gautrain Tunnel as a case
study,
o Mr. Khulekani Nxumalo and Mr. Anthony Els of Rand Water for the permission to use their
information on the bulk pipeline networks,
o Mr. Victor Chewe of Johannesburg Water for permission to use their information on the
pipeline networks,
o Mr. Cliff Midgley of St. John‟s College, for the information pertaining to water use on the
school‟s premises,
o Mr. Johann Enslin, Pr. Eng. of the Department of Water and Sanitation, for expert advice on
Engineering Aspects, related to water supply, that were beyond my knowledge,
o Ms. Chetty Thiruveni, of the Department of Water and Sanitation, for assistance with
creating maps using Arc GIS,
o Mr. Royce Baatjies of Xylem Water Solutions, South Africa, for guidance on the costing of
infrastructure.
Institute of Groundwater Studies (IGS) personnel, for academic advice and the impartation of
valuable knowledge.
My family for their unwavering support and steadfast prayers. Thanks for moulding me into the
courageous man I am today.

- iii -
DEDICATION
This thesis is dedicated to my mother, Ponstho Alinah Mahlahlane and my late father, John Jack Isaac
Mahlahlane. Robala Ka Kgotso Thakadu.

- iv -
ABSTRACT
Urbanization is a predominant challenge for urban groundwater management in most Metropolitan
Municipalities (MMs) in South Africa. Most urban areas comprise of high-yielding aquifers, with
sufficient potential to expand water supply incrementally and reduce the dependence on the existing
municipal water supply system (Foster, 2013).
The study assessed the status quo of urban groundwater management in four (4) MMs, namely; The
City of Johannesburg (CoJ), City of Tshwane (CTMM), Ekurhuleni (EMM), and eThekwini (eTMM)
to improve urban groundwater management practices and implement strategies to ensure the resource
is protected and sustainable. MMs are using groundwater resources to varying degrees. However,
groundwater makes up a small percentage of the total supply, reaching 6% in Tshwane. Additionally,
treated acid mine drainage (i.e. rebounding groundwater) is added to the Vaal River System (VRS),
making up to 3% of the current supply to the MMs in Gauteng.
The overarching findings from the assessment are that groundwater use and management are poorly
integrated into the key planning processes at the MMs. In no cases is there a coherent plan for
groundwater development and management evident from the MMs and no such plan is integrated
across each of the necessary and available planning documents. In light of the findings, we propose
that groundwater development be planned and budgeted for in the Integrated Development Plans and
protection of groundwater be strengthened within the Spatial Development Framework and Water
Sensitive Design in the respective MMs. The findings further underpinned gaps that led to the
identification of an urban groundwater challenge (excess ingress of groundwater into the Gautrain
Tunnel) that could be solved by the development of innovative technical solutions.
Currently, a total of 3.1 million m3/annum ingress groundwater is dewatered and discharged from 3 of
the 5 localities. The discharge is mainly at Shaft E21, Shaft E7, and Sandspruit Discharge Point while
discharge at Shafts E3 and Shaft E4 is unknown due to continuously low discharge rates (and are thus
considered negligible). The inference from the average discharge volumes between 2013 and 2017
confirmed that 68% of the total groundwater is discharged from E2, 17% from E7 and 15% from
Sandspruit Point. Of these points, only the Sandspruit Point discharges directly into the Sandspruit
River and the remainder discharge into stormwater systems. Notwithstanding the combined discharge
volume making up to 0.3% of the CoJ annual water demand, it remains a significant amount as CoJ
faces a projected water deficit by 2030 (DWAF, 2009b). We, therefore, argued that a by-law
prohibiting the discharge of groundwater from the tunnel with no beneficial use must be established.
1 Shafts E2, E3, E4, and E7 denote to Groundwater Discharge Points located along the Gautrain Tunnel. This is the term
used by Bombela Concession Company (Pty) Ltd for these points.

- v -
In instances where ingress groundwater will not be utilized for any bulk supply, active management is
still a requirement to protect and conserve the resource.
Based on the significant volume and generally good to excellent water quality (with few cases of
elevated salt concentrations requiring minimal treatment) suitable for all uses, including human
consumption, the following were beneficial uses identified for the available groundwater emanating
from Shaft E2, Shaft E7 and the Sandspruit Discharge Point: (i) Decentralized Supply, (ii) Aquatic and
Groundwater-dependent Ecosystem Augmentation, (iii) In-House use2, (iv) Augmenting Existing Bulk
Water Systems, and (v) Bottling of the Water to Generate Revenue. The Pre-Feasibility Analysis was
undertaken in terms of benefits, financial costs and legislative requirements with each scenario
proving to be economically feasible with return on investments. In conclusion, the benefits and
opportunities from the current study, particularly the Pre-Feasibility Analysis, were fully recognized
and contributed to a shift from inadequate management of groundwater resources in urban areas with
no beneficial use, to active management leading to the potential for bulk water supply.
Keywords: Urban Groundwater Management, Groundwater Ingress, Innovative Technical Solutions,
Gautrain Tunnel.
2 In-House use refers to the use of groundwater discharged from Shaft E7 for toilet flushing at Sandton Gautrain Station.
- vi -
OPSOMMING
Verstedeliking is „n geweldige uitdaging vir die bestuur van stedelike grondwater in meeste
Metropolitaanse Munisipaliteite (MM‟e) in Suid Afrika. Die meeste stedelike gebiede bestaan uit hoë-
opbrengs waterhoudende grondlae, met genoegsame potensiaal om watervoorraad inkrementeel uit te
brei en die afhanklikheid op die bestaande munisipale watervoorraadstelsel te verminder (Foster,
2013).
Die studie het die status quo van vier (4) MM‟e se stedelike grondwaterbestuur ondersoek naamlik;
Die Stad van Johannesburg Metropolitaanse Munisipaliteit, Die van Stad Tshwane Metropolitaanse
Munisipaliteit, Ekurhuleni Metropolitaanse Munisipaliteit en die eThekwini Metropolitaanse
Munisipaliteit, om stedelike grondwaterbestuur-praktyke te verbeter en om strategieë te implementeer
om te verseker dat die bron beskermd en volhoubaar is. MM‟e gebruik grondwaterbronne in meerdere
of mindere mate. Grondwater maak egter „n klein persentasie van die algehele voorraad uit, soos
byvoorbeeld slegs 6% in Die Stad van Tshwane. Daarbenewens word suur mynwater dreinering (i.e.
grondwater wat afstuit) by die Vaalrivier Stelsel se watervoorraadstelsel gevoeg wat tot 3% van die
huidige voorraad van die MM‟e in Gauteng uitmaak.
Die opsomende bevindings van hierdie ondersoek is dat grondwater gebruik en bestuur swak
geïntegreer is in die sleutelbeplanningsprosesse by die MM‟e. Daar is nie in een van die gevalle „n
samehangende plan vir die ontwikkeling en bestuur van grondwater duidelik vanaf die MM‟e nie en
ook nie in enige van die nodige en beskikbare beplanningsdokumente nie. Op grond van hierdie
bevindings, beveel ons aan dat daar beplan en begroot word vir die ontwikkeling van grondwater in
die Geïntegreerde Ontwikkelingsplanne en die beskerming van grondwater versterk word binne die
Ruimte Ontwikkelingsraamwerk en Watersensitiewe Ontwerp in die onderskeie MM‟e.
Die bevindings het verdere tekortkominge aan die lig gebring wat tot die identifikasie van „n stedelike
grondwater uitdaging (oormatige invloei van grondwater in die Gautrein-tonnel) wat opgelos kan word
deur die ontwikkeling van innoverende tegniese oplossings.
Daar word huidiglik „n totaal van 3.1 miljoen m³/per jaar invloeiwater ontwater en afgestuit, vanuit 3
van die 5 gebiede. Die afskeiding is hoofsaaklik by Skag E23, Skag E7, en die Sandspruit-Uitlaatpunt,
terwyl afloop by Skagte E3 and E4 onbekend is as gevolg van die voortdurende lae afloop volumes en
word dus as onbeduidend geag. Na afleiding van die algemene afloopvolumes tussen 2013-2017 is dit
bevestig dat 68% van die totale water afgeloop het vanuit Skag E2, 17% van Skag E7 en 15% vanuit
die Sandspruit Uitlaatpunt. Die Sandspruit Uitlaatpunt is die enigste punt waar water direk in die
3 Skagte E2, E3, E4, en E7 verwys na Grondwater-uitvloeipunte wat langs die Gautrein-tonnel geleë is. Dit is die term wat
deur Bombela Begunstiging Maatskappy (Edms.) Bpk. gebruik word vir hierdie punte.

- vii -
Sandspruitrivier vloei, by die ander vloei dit in stormwaterstelsels af. Nieteenstaande die
gekombineerde afloopvolume wat tot 0.3% van die Stad van Johannesburg se jaarlikse waterbehoefte
uitmaak, bly dit „n merkwaardige volume aangesien die Stad van Johannesburg „n voorgenome
waterterkort teen 2030 sal beleef (DWAF, 2009b). Daarom is ons van die mening dat „n verordening
ingestel moet word wat die afloop van grondwater vanuit die tonnel met geen nuttige gebruik nie
verbied moet word. In gevalle waar uitvloeiwater nie vir grootmaatvoorsiening gebruik gaan word nie,
is aktiewe bestuur steeds nodig om die bron te benut en bewaar.
Die volgende voordelige gebruike van die beskikbare water afkomstig vanaf Skag E2, Skag E7 en die
Sandspruit Uitlaatpunt is gebaseer op die merkwaardige volume en algehele goeie tot uitstekende
waterkwaliteit (met min gevalle van hoër sout konsentrasie wat minimale behandeling benodig) wat
vir alle gebruike, insluitend menslike verbruik, geskik is: (i) Gedesentraliseerde water voorraad, (ii)
Akwatiese en grondwater afhanklike ekosisteem aanvulling, (iii) Binnenshuise-gebruik4, (iv)
Aanvulling van bestaande grootmaat waterstelsels, en (v) Die water kan gebottel word om inkomste te
genereer. Die analise om uitvoerbaarheid te toets is uitgevoer in terme van voordele, finansiële kostes,
en wetlike vereistes met elke scenario wat as ekonomies uitvoerbaar bewys is met
beleggingsopbrengste. Ten slotte is die voordele en geleenthede van die huidige studie, veral die
analise om die uitvoerbaarheid te toets, duidelik uitgewys, en het bygedra tot „n verskuiwing vanaf
onvoldoende bestuur van grondwaterbronne in stedelike gebiede met geen voordelige gebruik, tot
aktiewe bestuur wat lei tot die potensiaal vir grootmaat watervoorraad.
Sleutelwoorde: Verstedeliking Groundwater Bestuurder, Grondwater invloei, Innoverende Tegniese
Oplossings, Bestuur, Gautrein-tonnel.
4 Binnenshuise-gebruik verwys na die gebruik van grondwater wat vanuit Skag E7 afloop vir die spoel van toilette by
Sandton Stasie.

- viii -
TABLE OF CONTENTS
DECLARATION I
ACKNOWLEDGEMENTS II
DEDICATION III
ABSTRACT IV
OPSOMMING VI
LIST OF FIGURES XII
LIST OF TABLES XIV
LIST OF ACRONYMS AND ABBREVIATIONS XVI
LIST OF SYMBOLS AND UNITS XVIII
CHAPTER 1 : INTRODUCTION 1
1.1 OVERVIEW OF THE STUDY 1
1.2 CONTEXT AND SIGNIFICANCE OF THE STUDY 2
1.3 STUDY AIMS AND OBJECTIVES 3
1.4 STRUCTURE OF THESIS 3
CHAPTER 2 : LITERATURE REVIEW 5
2.1 REVIEW OF STATUS QUO OF URBAN GROUNDWATER 5
2.1.1 Regional Geology and Geohydrology of Gauteng 5
2.2 CITY OF JOHANNESBURG 9
2.2.1 Current Municipal Water Supply Source 9
2.2.2 Current and Future Water Supply Demand 9
2.2.3 Aquifer Characteristics 10
2.2.4 Groundwater Flow Direction 11
2.2.5 Groundwater Quality and Aquifers in the wider area of the CoJ 12
2.2.6 Status of Urban Groundwater Planning and Management 12
2.3 CITY OF TSHWANE 15
2.3.1 Current Municipal Water Supply Source 15
2.3.2 Current and Future Water Supply Demand 15
2.3.3 Aquifer Characteristics 16

- ix -
2.3.4 Groundwater Levels and Flow Direction 16
2.3.5 Groundwater Quality and Aquifers in the wider area of the CTMM 17
2.3.6 Status of Urban Groundwater Planning and Management 19
2.4 EKURHULENI METROPOLITAN MUNICIPALITY 19
2.4.1 Current Municipal Water Supply Source 19
2.4.2 Current and Future Water Demand 19
2.4.3 Aquifer Characteristics and Groundwater Flow Direction 20
2.4.4 Groundwater Quality and Aquifers in the wider area of the EMM 21
2.4.5 Status of Urban Groundwater Planning and Management 23
2.5 ETHEKWINI METROPOLITAN MUNICIPALITY 23
2.5.1 Current Municipal Water Supply Source 23
2.5.2 Current Municipal Water Supply Source 23
2.5.3 Current and Future Water Supply Demand 24
2.5.4 Aquifers Characteristics 25
2.5.5 Groundwater Quality 26
2.5.6 Status of Urban Groundwater Planning and Management 26
2.6 REVIEW OF INTERNATIONAL GROUNDWATER BEST PRACTICES 29
2.6.1 Dire Dawa, Ethiopia 29
2.6.2 Namibia 30
2.6.3 Australia, Great Artesian Basin 31
2.6.4 Europe, Netherlands 32
2.6.5 California 34
2.7 SUMMARY OF GROUNDWATER MANAGEMENT IN SOUTH AFRICAN
METROPOLITAN MUNICIPALITIES 35
CHAPTER 3 : STUDY AREA 41
3.1 GENERAL SETTING 41
3.2 GEOLOGICAL SETTING 41
3.3 GEOHYDROLOGY 44
3.3.1 Groundwater Use and Groundwater Potential 44
3.4 TUNNEL CONSTRUCTION AND DRAINAGE SYSTEM 48
3.4.1 Authorization Granted 48
3.4.2 Tunnel Construction 49
3.4.3 Tunnel Drainage System 52
3.4.4 Groundwater Levels 53
Pre-Construction Groundwater Regime 54

- x -
Construction Groundwater Regime 55
Post-Construction Groundwater Regime 56
3.4.5 Cone of Dewatering 57
3.5 DISCHARGE VOLUMES AND GROUNDWATER QUALITY 59
3.5.1 Tunnel Discharge Volumes 59
3.5.2 Monitoring Network 61
3.5.3 Observed Groundwater Quality 62
CHAPTER 4 : METHODOLOGY OF DATA COLLATION 66
4.1 DATA COLLECTION SITE 66
4.2 DATA COLLECTION PROCEDURE 67
4.3 CALCULATIONS AND COST-BENEFIT ANALYSIS APPROACH 70
CHAPTER 5 : PRE-FEASIBILITY ANALYSIS 71
5.1 RATIONAL OF ANALYSIS 71
5.2 LIMITATIONS AND ASSUMPTIONS OF THE ANALYSIS 71
5.3 DETAILED SCENARIO CALCULATIONS 72
5.3.1 Scenario 1: Decentralized Supply 72
Flow Rate: 74
Pipeline Diameter: 75
Friction Losses: 75
Energy cost for Pumping: 76
5.3.2 Scenario 2: Aquatic and Ecological Augmentation and Sustainability 77
5.3.3 Scenario 3: In-House Use 79
5.3.4 Scenario 4: Augmenting Existing Bulk Water Systems 80
5.3.5 Scenario 5: Bottling of Water to Generate Revenue 83
Scenario Context: 83
Investment Assumptions: 84
Proposed Status of Business and Process Flow: 85
5.4 COST-BENEFIT ANALYSIS OF THE SCENARIOS 86
5.5 OVERARCHING LEGAL REQUIREMENTS 90
5.6 COMPARATIVE ASSESSMENT OF SCENARIOS 92
CHAPTER 6 : DISCUSSIONS AND CONCLUSIONS 94
6.1 DISCUSSIONS AND CONCLUSIONS 94
6.1.1 Limitations of the study 98
6.2 RECOMMENDATIONS 98

- xi -
6.2.1 Future recommended research 99
REFERENCE LIST 101
LIST OF APPENDICES 110

- xii -
LIST OF FIGURES
Figure 2-1 Main rock types underlying the Metropolitan Municipalities (WRC, 2018). .......................... 7
Figure 2-2 Aquifer types underlying Metropolitan Municipalities (WRC, 2018). ..................................... 8
Figure 2-3 Water Requirements for City of Johannesburg (High Population Scenario: DWAF,
2009b). ......................................................................................................................................... 9
Figure 2-4 Conceptual Hydrogeological Model along the South-North section in Johannesburg
(Abiye et al., 2011). ................................................................................................................... 11
Figure 2-5 A Map depicting the Tarlton Dolomitic Aquifers (Holland, 2007).......................................... 14
Figure 2-6 Water requirements for the City of Tshwane (High Population Scenario:
(DWAF, 2009b). ....................................................................................................................... 15
Figure 2-7 Hydrogeological Map depicting various groundwater compartments in the City of
Tshwane (Meyer, 2014). .......................................................................................................... 18
Figure 2-8 Water requirements for Ekurhuleni (High Population Scenario: DWAF, 2009b). ............... 20
Figure 2-9 Geological Map depicting the Delmas-Bapsfontein dolomitic aquifers (Pietersen,
2011). ......................................................................................................................................... 22
Figure 2-10 Mgeni System: Reconciliation of water supply and demand (DWA, 2010). ......................... 25
Figure 2-11 Geological and Hydrogeological Map of KwaZulu-Natal depicting the Natal Group
sandstone aquifers (Ndlovu and Demlie, 2018). .................................................................... 28
Figure 3-1 Locality, Geological and Geohydrological setting of the study area. ...................................... 46
Figure 3-2 Structural Geology of the study area. ........................................................................................ 47
Figure 3-3 Schematic illustration of a cross-sectional view of the tunnel (adapted after, BCC,
2012). ......................................................................................................................................... 50
Figure 3-4 Cross Section depicting different construction methods employed along the tunnel
(modified after Iliso Consulting, 2010). ................................................................................. 51
Figure 3-5 Schematic illustration of localized tunnel drainage (Iliso Consulting, 2010). ........................ 52
Figure 3-6 Schematic illustration of diffuse tunnel drainage (Iliso Consulting, 2010). ............................ 53
Figure 3-7 Groundwater levels (BCC, 2017). ............................................................................................... 54
Figure 3-8 Contour Map showing the groundwater regime during the construction phase of the
tunnel alignment (Arup, 2009). ............................................................................................... 55
Figure 3-9 Cross-Sectional schematic depicting the relationship between groundwater levels and
vertical tunnel alignment (Arup, 2009). ................................................................................. 58

- xiii -
Figure 3-10 Contour Map illustrating the groundwater drawdown post-construction of tunnel
alignment (Arup, 2009). .......................................................................................................... 59
Figure 3-11 Tunnel discharge volumes along the Gautrain Tunnel alignment (BCC, 2016). ................. 60
Figure 3-12 Piper Diagram of groundwater samples along the Gautrain Tunnel alignment. ................ 64
Figure 3-13 Sodium Absorption Rate (SAR) Diagram of the groundwater samples along the
Gautrain Tunnel alignment. ................................................................................................... 65
Figure 4-1 Gautrain Tunnel alignment route and tunnel ingress and water Discharge Points. ............. 66
Figure 4-2 Sandspruit Discharge Point (BCC, 2017). ................................................................................. 67
Figure 4-3 One hundred metres (100m) upstream and 100m downstream of the Sandspruit
Discharge Point (BCC, 2017). ................................................................................................. 67
Figure 5-1 Schematic diagram of St. John’s College in relation to the Shaft E2. ..................................... 73
Figure 5-2 Images illustrating the pumping of groundwater from the Gautrain Tunnel for the
water features. .......................................................................................................................... 78
Figure 5-3 Growth rate in the bottled water market (Waterwheel, 2006). ............................................... 83
Figure 5-4 Simplified process flow diagram for a Water Purification Plant. ........................................... 86
Figure 5-5 Schematic illustrating Water Use Licence Application Process. ............................................. 92

- xiv -
LIST OF TABLES
Table 2-1 Karst aquifer hydraulic parameters (after Naidoo, 2014). ........................................................ 16
Table 2-2 Borehole yields summary for Natal Group Sandstone based on 48 data points obtained
from NGA (after Demlie et al., 2012). .................................................................................... 26
Table 2-3 Current and planned future bulk supply to Metropolitan Municipalities, with a focus
on groundwater information................................................................................................... 37
Table 2-4 Integration of groundwater to municipal planning, protection, and management
mechanisms. ............................................................................................................................. 39
Table 3-1 Summary of the Regional Geology, in the form of a Stratigraphic Succession (after
Iliso Consulting, 2011). ............................................................................................................ 42
Table 3-2 Groundwater potential along the Gautrain Tunnel alignment (after Iliso Consulting,
2011). ......................................................................................................................................... 45
Table 3-3 Tunnel Discharge Points and monitoring boreholes along the Gautrain Tunnel
alignment. ................................................................................................................................. 61
Table 3-4 Surface Monitoring Points along the Gautrain Tunnel alignment. .......................................... 62
Table 4-1 Water Tariffs (2018/19) for the City of Johannesburg. ............................................................. 69
Table 4-2 Electricity Tariffs (2018/19) for the City of Johannesburg. ...................................................... 69
Table 5-1 Cost of the current municipal water supply per annum for St. John’s College. ..................... 74
Table 5-2 Cost of the current municipal water supply per annum for the Wilds Nature Reserve. ........ 78
Table 5-3 Calculation summary results for Scenario 2 for the Wild Nature Reserve.............................. 79
Table 5-4 Cost of the current municipal water supply per annum for Sandton Station. ........................ 80
Table 5-5 Calculation summary results for Scenario 3 for Sandton Station. ........................................... 80
Table 5-6 Calculation summary results for Scenario 4 for Augmenting Supply to Johannesburg
Water. ....................................................................................................................................... 83
Table 5-7 Summary of Assumed Business Investment Costs and Revenue. ............................................. 85
Table 5-8 Total Estimated Costs for Scenario 1. ......................................................................................... 88
Table 5-9 Total Estimated Costs for Scenario 2. ......................................................................................... 88
Table 5-10 Total Estimated Costs for Scenario 3. ....................................................................................... 89
Table 5-11 Total Estimated Costs for Scenario 4. ....................................................................................... 89
Table 5-12 Total Estimated Costs for Scenario 5. ....................................................................................... 90

- xv -
Table 5-13 Discharge Points authorized to Bombela Concession Company (Pty) Ltd. ........................... 91

- xvi -
LIST OF ACRONYMS AND ABBREVIATIONS
AMD Acid Mine Drainage
ASR Aquifer Storage and Recovery
BCC Bombela Concession Company (Pty) Ltd
BCJV Bombela Concession Joint Venture
CBA Cost-Benefit Analysis
CBD Central Business District
CoJ City of Johannesburg
CTC Cost to Company
CTMM City of Tshwane Metropolitan Municipality
CoT City of Tshwane
DWA Department of Water Affairs
DWS Department of Water and Sanitation
DWAF Department of Water Affairs and Forestry
EC Electrical Conductivity
EIA Environmental Impact Assessment
EMF Environmental Management Framework
EMM Ekurhuleni Metropolitan Municipality
eTMM eThekwini Metropolitan Municipality
GDRT Gauteng Department of Roads and Transport
GDS Groundwater Development Services
GMU Groundwater Management Units
GRIP Groundwater Resource Information Project
IDP Integrated Development Plan
IWUL Integrated Water Use License
IWULA Integrated Water Use License Application
JW Johannesburg Water
K Hydraulic conductivity
KZN KwaZulu-Natal
LHWP Lesotho Highlands Water Project
MAR Managed Aquifer Recharge
MFP Mushroom Farm Park
MM Metropolitan Municipality
NGA National Groundwater Archive
NWA National Water Act
ORTIA OR Tambo International Airport
SANBWA South African National Bottled Water Association
SANS South African National Standards
SDF Spatial Development Framework
SUDS Sustainable Urban Drainage System
T Transmissivity
TBM Tunnel Boring Machine
TDS Total Dissolved Solids
uMWP-1 uMkhomazi Water Project Phase 1
VSD Variable Speed Drive
VRS Vaal River System
WARMS Water Authorization Registration Management System
WISH Windows Interpretation System for Hydrogeologist
WMA Water Management Area
WMS Water Management System
WTWs Water Treatment Works
WC/WDM Water Conservation Water Demand Management Measure
WRC Water Research Commission
WSA Water Service Authority

- xvii -
WUL Water Use License
WSD Water Sensitive Design
WSS Water Supply System
WSUD Water Sensitive Urban Design
WSDP Water Service Development Plan
WSP Water Service Provider

- xviii -
LIST OF SYMBOLS AND UNITS
L Litre
l/s Litre per second
l/c/d Litre per capita per day
% Percent
kl Kilolitre
kl/month Kilolitre/month
m Metre
km Kilometre
km2 Squared kilometre
m3/day Cubic metre per day
m3/a Cubic metre per annum
mm/year Millimetre per year
mg/l Milligram per litre
mS/m Millisiemen per metre
m/s Metre per second
Ml Megalitre
Ml/day Megalitre per day
Mm3 /a Million cubic meter per annum
Max. Maximum
Min. Minimum
mamsl Meter above mean sea level
KW Kilowatt
kWh Kilowatt per hour
c/kWh Cent per kilowatt hour
R/kWh Rand per kilowatt hour
$ Dollar
< Less than
> More than
HF Friction losses
HT Total pumping head
π Pi
ρ Density of water
g Acceleration due to gravity
𝞰 Pumping Efficiency

- 1 -
CHAPTER 1: INTRODUCTION
1.1 OVERVIEW OF THE STUDY
Urbanization is a common phenomenon for many parts of the globe and this is the case in most urban
areas in drought-prone Sub-Saharan Africa. This urbanization, in combination with population growth,
leads to pressure on the urban water supply provision. Groundwater is an important underlying
resource in urban areas but is currently being misused (Foster et al., 2012; Foster and Vairavamoorthy,
2013). This study aims to address urban groundwater challenges faced by Metropolitan areas in South
Africa and find innovative technical solutions to ensure they meet their future water demand.
Urbanization is a predominant challenge for urban groundwater management in most Metropolitan
areas in South Africa. Foster (2013) predicted that the world‟s urban population will increase to 6.4
billion by 2050 with approximately 90% of the population growth in low-income countries.
Approximately 80% of the population in urban areas have access to improved water sources but this
might have declined due to rapid population growth (Foster et al., 2012). They also advocated the
view elsewhere that population growth in urban areas led to an unequal increase of both domestic and
industrial water demand, as well as the generation of more wastewater. Unless adequately managed,
these trends are likely to impact negatively on groundwater resources (Foster et al., 2010). According
to Jacobsen et al. (2013), in order to assess these challenges faced by urban areas, groundwater
resources must be viewed within an integrated framework that is inclusive of other components of
urban water systems such as surface water, wastewater, and stormwater, their relationships, and
positive and negative interactions.
Foster et al. (1998) pointed out that groundwater has been a critical source of water supply since the
first urban settlements. There has been a significant increase in urban groundwater use in recent times,
with most of the municipalities relying on groundwater resources, and private abstractors drilling and
constructing their own boreholes to meet their daily water needs. Most urban areas comprise of high-
yielding aquifers, with sufficient potential to expand water supply incrementally with demand at lower
average water production costs (Foster and Vairavamoorthy, 2013).
There is an urgent need for groundwater, which generally offers drought resilience, to be used
effectively as it can serve an important role in adaptation strategies to climate change (Foster, 1998).
For this reason, the large groundwater storage of many aquifers must be managed strategically, and in
some cases used conjunctively with surface water to improve water supply security (Foster and
Vairavamoorthy, 2013). This study, therefore, seeks to contribute to a shift from inadequate

- 2 -
management of groundwater resources in urban areas with no beneficial use, to active management
leading to the potential for bulk water supply. The study further aims to provide innovative technical
solutions that will lead to improved existing practices for enhanced groundwater use.
1.2 CONTEXT AND SIGNIFICANCE OF THE STUDY
South Africa is a water-stressed country receiving less than 500 mm average rainfall per annum.
Scarce water resources are a limiting factor for development in many countries in Sub-Saharan Africa
and cause implications for most sectors of the economy (Jacobsen et al., 2013). Increased stresses on
water resources affect its quality, quantity, and availability. The need to protect and not pollute
valuable water resources cannot be overemphasized. Rising demand for increasingly scarce water
resources is leading to growing concerns about future access to water, particularly in urban areas.
Foster and Vairavamoorthy (2013), in a paper; Policies and Institutions for Integrated Groundwater
Management, deduced that urban groundwater is impacted amongst others by the following:
a. Infiltration of urban runoff consisting of heavy metals and micro-pollutants emanating from
industrial sites,
b. Intensive urban horticulture, high in nutrient and pesticide leaching, and
c. Inadequate handling of chemicals and improper urban and industrial liquid-effluent and solid
waste disposal.
The aforementioned impacts are attributed to growing cities, which are hubs for the world‟s economic
development. It is also worth mentioning that one of the most important resources to sustain urban
growth is water resources and particularly, groundwater.
Anabella et al. (2014) argued that groundwater has historically provided a locally available low-cost
source of water for public supply and domestic use. Currently, five (5) out of eight (8) Metropolitan
Municipalities (MMs) use groundwater, and groundwater makes up only an insignificant percentage of
the supply (2%) in the remaining three (3) MMs (WRC, 2016). Groundwater is indeed a better option
that can be used to augment surface water for the purpose of water supply in urban areas because of its
wide distribution, dependability, inexpensiveness, and its requirement of little or no treatment before
use.
The current study will assess the groundwater status quo of four (4) MMs, namely; City of
Johannesburg (CoJ), City of Tshwane (CTMM), Ekurhuleni (EMM), and eThekwini (eTMM) and in
so doing, improve urban groundwater management practices in South Africa and develop innovative

- 3 -
technical solutions and strategies to implement in order to ensure that the resource is protected and
sustainable.
1.3 STUDY AIMS AND OBJECTIVES
This thesis forms part of the broader study under the Water Research Commission (WRC) funded K5-
2751 project aimed at assessing and addressing challenges relating to planning, development, and
management of urban groundwater resources. The primary aim of the study is to assess the status quo
of urban groundwater management in the CoJ, CTMM, EMM, and eTMM. Information on current
municipal groundwater use and plans for future groundwater development in the MMs are contained
within the water master plans or water services development plans, and the reconciliation strategies
respectively. The groundwater management strategies of the MMs will be compared to international
best practice and to adopt best practices that have the potential for development in South Africa. The
assessment will assist in identifying gaps that will underpin an innovative technical solution to assist
in the sustainable management of groundwater resources related to tunnel inflows. A Pre-Feasibility
Analysis (in the form of Pre-Feasibility Scenarios) will be developed to describe the identified
innovative technical solution. This, coupled with developed strategies will lead to improved existing
practices for enhanced groundwater use.
1.4 STRUCTURE OF THESIS
The study commences with a literature review of the status quo of urban groundwater management
plans in four (4) MMs, which has five (5) elements:
a. Appraisal of current municipal groundwater and water use requirements (consumer demand)
based on available data,
b. Compilation of aquifer characteristics including water levels and water quality. Specific
attention is focused on the urban influences on groundwater (availability and quality). In the
case, that information on urban groundwater is not well documented within municipal
reconciliation plans (i.e. perhaps better documented in research reports or Department of
Water and Sanitation (DWS) monitoring reports, then those reports will be consulted,
c. Review of current and future groundwater development plans and groundwater management
plans, if any.
d. Compendium of papers outlining best practice for urban groundwater management.
These papers are expected to highlight South African and international best practice examples
and contain a range of themes relevant to urban groundwater management i.e. large-scale
groundwater development, groundwater quality protection, innovative integrated solutions for
urban water challenges, and policy and governance approaches.

- 4 -
e. Review of the degree to which groundwater management is mainstreamed into relevant
planning processes and structures, and the level of integration across various disciplines or
departments of the MMs against best practice.
Following the literature review, a case study on groundwater management challenges related to
excessive groundwater inflows into the Gautrain tunnel will be presented. The study area will be
described in terms of locality, geological setting, structural geology, geohydrology, groundwater
potential, and use. The authorizations that had to be complied with during the construction phase of
the Gautrain Tunnel alignment, the employed construction methods, the operation of the tunnel
drainage system, groundwater level trends, and impacts associated with the construction will be
presented. Monitoring points, discharge points and volumes, as well as qualities, will be presented and
discussed in relation to the existing Integrated Water Use License for Bombela Concession Company
(Pty) Ltd. Following an outline of the applied methodology, different scenarios for the beneficial uses
of the excess groundwater discharged from the Gautrain Tunnel will be proposed. The costs,
plausibility, and potential of implementing each scenario will be explored to determine the costs and
benefits involved. The final chapter will provide a summary of the pertinent findings and a discussion
of the results obtained as well as the limitations of the thesis. Lastly, recommendations (including
future research and investigations) are proposed based on the gaps which were identified in this thesis.

- 5 -
CHAPTER 2: LITERATURE REVIEW
2.1 REVIEW OF STATUS QUO OF URBAN GROUNDWATER
The review of the status quo of urban groundwater plans in Metropolitan Municipalities (MMs) is with
specific reference to municipal groundwater use and municipal water use requirements (consumer
demand), aquifer hydraulic characteristics, including water levels and quality, and the degree to which
groundwater management is mainstreamed into relevant planning processes and structures, and the
level of integration across various disciplines or departments.
The City of Johannesburg (CoJ), City of Tshwane (CTMM), and Ekurhuleni Metropolitan
Municipality (EMM) are all MMs that fall under the jurisdiction of the Gauteng Province with the
exception of the eThekwini Metropolitan Municipality (eTMM). This implies that similar trends will
be observed in terms of groundwater management, planning processes and structures and also
integration across various disciplines and departments. The same regional geology/geohydrology and
aquifer type information is shared between the three (3) municipalities. Therefore, regional
geology/geohydrology information of these three MMs will be discussed upfront in sections 2.2.1 and
2.2.2, and the remaining information such as current/future supply, local geology/geohydrology will
be discussed per MM.
2.1.1 Regional Geology and Geohydrology of Gauteng
The first geological event that occurred in Gauteng was the formation of the Witwatersrand
Supergroup. It is reported that approximately 3000 million years ago, an inland shallow „sea‟ or lake
was formed as a result of depression of the granite crust of the earth (EMF, 2014). Post the formation
of the Witwatersrand Supergroup, there was a period of volcanic activity that followed and covered
most of the Ventersdorp Sequence sediments that were previously deposited. The next period was the
deposition of the Transvaal Sequence whereby sedimentation and inter-dispersed volcanic activity
covered most of the northern part of the old Kaapvaal Craton (Barton and Kroner, 1999). The
Kaapvaal Craton, in turn, sank lower than sea level, after thermal pressure became less intense.
Barnard (2000) explained that the Witswaterand Supergroup was further subdivided into the lower
West Rand and the upper Central Rand Group. The former conformably overlies volcanic rocks of the
Dominion Group and non-conformably overlaps the Archean basement rocks of the Kaapvaal Craton
(Anhaeusser, 2006). The south-central portion consists mainly of a variety of homogeneous, medium-
grained granodioritic rocks. The Witwatersrand Supergroup overlies basement granitoids and
greenstones, as well as the sedimentary and volcanic rocks of the Dominion Group (Barnard, 2000).
The part of Witwatersrand basin that lies close to the dome is grouped under West Rand, Central

- 6 -
Rand, and East Rand Groups. The West Rand Group consists of quartzites and shales. The Central
Rand Group consists of different proportions of quartzites and shales where the sequence consists
mainly of quartzites and conglomerates.
The CoJ is comprised of elongated ridges, rolling topography, and wide plain areas, which are
remnants of the old geological activity (intrusion, sedimentation, metamorphism, ductile, and brittle
tectonics), and subsequent erosion processes (Abiye et al., 2011). These geological events played a
role and had a major impact on the hydrogeological conditions of the rocks, primarily by influencing
recharge into the groundwater (Abiye et al., 2011). According to Barton and Kroner (1999), the
Johannesburg dome forms sloping relief terrain, whereas the enclosing younger rocks (Transvaal
Sequence) form the relatively high ground. Fractures of all orientation and weathering zones exist in
all rocks (Abiye et al., 2011). The rocks that outcrop in the CoJ are reported to fall under the hard rock
category and have low groundwater productivity except for dolomites that contain dissolution cavities,
and consequently host huge quantities of groundwater (Abiye et al., 2011).
According to the Johannesburg 1:500 000 scale Hydrogeological Map compiled by Barnard (2000);
the following are the four (4) main aquifer systems in Gauteng:
a. The intergranular aquifer in the alluvial covered zones,
b. The fractured aquifer in the Witwatersrand Supergroup associated with fractures, fissures, and
joints,
c. The karstic aquifer in the Malmani Subgroup Dolomites, and
d. The intergranular and fractured aquifer with typically low yields in the crystalline rocks.
Figure 2-1 and Figure 2-2 depicts the various underlying lithologies and the aquifer types of each
South African MM that will be discussed in detail in this chapter. Reference will be made to these two
figures when the aquifers of each MM are later discussed.

- 7 -
Figure 2-1 Main rock types underlying the Metropolitan Municipalities (WRC, 2018).

- 8 -
Figure 2-2 Aquifer types underlying Metropolitan Municipalities (WRC, 2018).

- 9 -
2.2 CITY OF JOHANNESBURG
2.2.1 Current Municipal Water Supply Source
The City of Johannesburg (CoJ) imports water from areas located approximately 600 kilometres away.
The CoJ is currently importing almost all of its water from the different storage and inter-basin
transfer schemes (DWAF, 2009). The bulk water supply is abstracted from the Vaal River System and
Rand Water is the main Water Services Provider (WSP) for water supply and wastewater (DWAF
2009).
2.2.2 Current and Future Water Supply Demand
The current water demand of 600 million m3/a and future water demand (2030) of 700 million m
3/a
from the Vaal River System (VRS) are depicted in the accompanying Figure 2-3 (DWAF, 2009b). The
graph shows the current system yield and the expected growth in „high water requirement‟ until 2030.
This water requirement is shown both with the successful implementation of the Water Conservation
and Water Demand Management measures (WC/WDM) that were approved in the 2007
Reconciliation Strategy. Currently, the CoJ is meeting its water supply requirements.
Figure 2-3 Water Requirements for City of Johannesburg (High Population Scenario: DWAF, 2009b).
It is projected that the CoJ will experience a deficit of water supply in 2030 (DWAF, 2009b). There is
however a program in place that will augment the deficit from the Vaal River System. A plan was
proposed for the CTMM to boost the CoJ with an additional supply of water. The proposal was
developed in light of the Vaal River System being severely stressed and unable to keep up with the

- 10 -
demand placed upon it. The proposal was approved by the relevant authorities after many years of
deliberations. This water augmentation program will depend highly on the re-use of treated effluent
from the Wastewater Treatment Works (WTWs). The only challenge with this program to be
successfully implemented is financial constraints. Future planned sources for the CoJ are as follows
(DWAF, 2009b):
a. Water Conservation and Water Demand Management to reduce losses and urban demand by at
least 20% by 2030,
b. Re-use of water (priority being water from gold mines),
c. Vaal River Integrated Water Quality Management Strategy, and
d. Lesotho Highlands Water Project (LHWP).
2.2.3 Aquifer Characteristics
The aquifers in the CoJ are all based on the Johannesburg Hydrogeological Map published by Barnard
(2000) and are summarised as follows:
Karstic Aquifers
The CoJ is dominated by the Malmani Subgroup Dolomites of the Chuniespoort Group (Transvaal).
Karstic groundwater yield is classed as excellent due to 50% of the boreholes on record producing
more than 5 l/s with a maximum of 126 l/s (Abiye et al., 2011). The groundwater level in the
dolomitic aquifers does not mimic the topography as is often the case in other formations. Typically,
due to the high permeability of the formation, groundwater flows under very low gradients. These
characteristics are partly indicative of extremely deep groundwater rest levels in areas of raised
topography. Depths of more than 100 m sub-surface are uncommon for the CoJ.
Intergranular (alluvial) Aquifers
Intergranular aquifers with a thickness of 30 m occur along the Crocodile River, downstream of the
Roodekopjes and Vaalkop Dam with blow yields less than 5 l/s (Barnard, 2000). A distinguishing
feature of this aquifer is its hydraulic connection with the Crocodile River (DWAF, 2004). The quality
of the alluvial groundwater is good and is suitable for all purposes since none of the parameters exceed
maximum allowable limits for Drinking Water Standards. The water from this aquifer has a
Magnesium-Carbonate signature (DWAF, 2004).
Fractured Aquifers
Fractured aquifers of the meta-sedimentary shales and quartzites of the Witwatersrand and
Ventersdorp Supergroups as well as the Waterberg group are notable with minimum yields of less than
2 l/s and a maximum of more than 5 l/s.

- 11 -
Intergranular and Fractured Aquifers
Intergranular and fractured aquifers are associated with the crystalline rocks of the Basement,
Ventersdorp and Transvaal Supergroups with yield classes varying from 0.1 - 0.5 to 2.0 - 5.0 l/s ranges
(Barnard, 2000). The majority of cold springs, especially those that support strong yields, are
associated with the dolomite of the Chuniespoort Group. Three thermal springs and a number of
thermal artesian boreholes occur south-west of Groblersdal. A few deep artesian boreholes occur north
of Zeerust and Delmas and are associated with the dolomite of the Chuniespoort Group.
2.2.4 Groundwater Flow Direction
Abiye et al. (2011) prepared a Hydrogeological Conceptual Model illustrating that the CoJ is situated
on a groundwater divide. The groundwater typically flows in the northern and southern directions,
away from the water divide (Figure 2-4). There is also a strong hydraulic link between the various
stratigraphic units. Groundwater flows across the groundwater divide via the dissolution cavities and
tectonic lineaments in the Transvaal Dolomites located in the western and eastern parts of the
Johannesburg Area. The alluvial aquifers occurring along the Crocodile River Valley downstream of
Hartbeespoort Dam are high-yielding aquifers with blow yields of 16 l/s and are reported to be highly
productive (Abiye et al., 2011). The dolomites in the area are characterized by impervious and semi-
pervious syenite and diabase dykes, which divide these areas into separate groundwater compartments
(Coetzee et al., 2009).
Figure 2-4 Conceptual Hydrogeological Model along the South-North section in Johannesburg (Abiye et
al., 2011).

- 12 -
2.2.5 Groundwater Quality and Aquifers in the wider area of the CoJ
There are problems regarding Acid Mine Drainage (AMD) in the CoJ and heavily contaminated water
from old mining areas in the Johannesburg Area and surroundings, and its potential impact on the
quality of groundwater in the area. The monitoring of groundwater in Johannesburg is relatively poor
and the majority of the established groundwater monitoring networks are out of service (CoJ, 2009).
The Tarlton dolomitic aquifers shown in Figure 2-5 are the relevant aquifers to the CoJ that can
potentially be used for groundwater supply in the future. They are the only readily available water
resource for many farms in the region and are also a vital component of the water resources needed for
the expanding demand of the urban complexes of the Mogale City Local Municipality. Tarlton
dolomitic aquifers are located approximately 40 km north-west of Johannesburg and include the
municipal areas of Mogale City and Randfontein. The aquifers are formed by the Malmani dolomite
formations of the Chuniespoort Group (Johnson et al., 2006). It is within this Group that karst
formation has occurred. Dykes form boundaries to groundwater flow across the Dolomites, creating
isolated hydrogeological compartments (Johnson et al., 2006). The Zwartkrans compartment covers an
area of approximately 178 km2 and contains the Sterkfontein and Wonder Caves, and the major
springs in Danielrus, Kromdraai, and Zwartkrans.
2.2.6 Status of Urban Groundwater Planning and Management
The CoJ has successfully incorporated groundwater into its Water Service Development Plan (WSDP)
and acknowledges groundwater as a valuable resource that could potentially be used for bulk water
supply and requires protection if it is to be available for future use. However, the following pollution
and groundwater monitoring problems have been identified:
a. Acid Mine Drainage (AMD) due to the continuous flow of heavily contaminated water from
old mining areas in the CoJ. AMD poses detrimental impacts on the quality of groundwater in
the area, and
b. The monitoring of groundwater in the Johannesburg Area is relatively poor due to the majority
of the established groundwater monitoring networks being dysfunctional (CoJ, 2009).
A solution to these challenges was to conduct a study that investigated the restoration of the
monitoring boreholes and the expansion of the monitoring network over the entire city. In 2009 it was
reported that the study proved to be unfeasible due to financial constraints (CoJ, 2009). Groundwater
use is listed in the Integrated Development Plan (IDP), as a water demand management measure to
meet the five (5) year plan towards environmental sustainability. No other details regarding planned
groundwater use are provided (CoJ, 2017a). There are also additional current uses of groundwater

- 13 -
(from un-impacted aquifers) other than bulk supply, for hockey fields and golf courses. There are no
measures within the Spatial Development Framework (SDF) that specifically target protection of the
recharge area for the current and proposed future groundwater resources.
The City of Johannesburg‟s response to Water Sensitive Urban Design (WSUD) is evident in many
initiatives that are currently being implemented. The following are the WSUD initiatives noted in the
CoJ (2012a) and the CoJ (2012b) and are summarised from the IDP and status of WSUD reports
respectively:
a. Urban Water Management Program that aims to place focus on repairing existing
infrastructure in order to reduce the amount of water lost,
b. Implementation of water demand reduction measures,
c. Investigation of alternative water sources,
d. Implementation of Sustainable Urban Drainage Systems (SUDS) as well as urban water
harvesting, and
e. Reducing the water demand, treatment of wastewater and the re-use of AMD water as well as
the development of Sustainable Urban Drainage Designs (CoJ, 2011).
Additionally, the CoJ takes into cognizance environmental policy that aims to encompass WSUD-
relevant goals such as:
a. Responding to the effects of climate change,
b. Sustainable management of waste streams, and
c. Protection of its river ecosystems, water conservation, biodiversity conservation, and
environmental heritage management as well as building awareness and capacity for
environmental management (CoJ, 2011).
The CoJ‟s water services by-laws do not provide for groundwater protection nor the registration of
boreholes (CoJ, 2008). The CoJ has Dolomite risk by-laws in place, which are a prerequisite for the
establishment of a Dolomite Risk Management Section within the City and are responsible for the
mitigation of land subsidence issues. The by-law controls the CoJ‟s emergency response to sinkhole
formation and the necessity for dolomite risk assessments at site developments on dolomite land.
Extensive measures requiring the CoJ to monitor dolomite groundwater levels, and enabling control of
dolomite abstraction are provided with the aim of maintaining safety (CoJ, 2015).

- 14 -
Figure 2-5 A Map depicting the Tarlton Dolomitic Aquifers (Holland, 2007).
- 15 -
2.3 CITY OF TSHWANE
2.3.1 Current Municipal Water Supply Source
The CTMM is the Water Service Authority (WSA) for the entire municipality. Water supply to the
CTMM is primarily through Rand Water, which is the major water supplier in Gauteng (WSDP,
2010). Tshwane receives 81.3% of its water from Rand Water and Magalies Water. The City of
Tshwane supplies the remaining 18.7% from its own dams and boreholes.
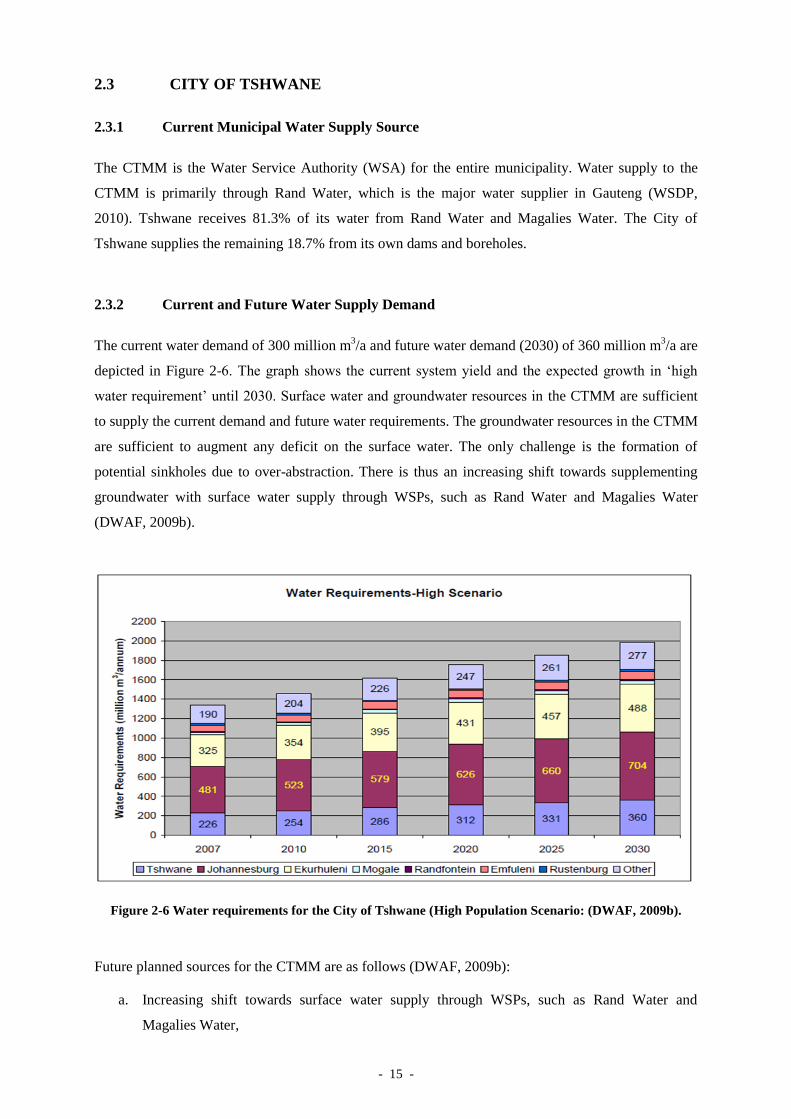
2.3.2 Current and Future Water Supply Demand
The current water demand of 300 million m3/a and future water demand (2030) of 360 million m
3/a are
depicted in Figure 2-6. The graph shows the current system yield and the expected growth in „high
water requirement‟ until 2030. Surface water and groundwater resources in the CTMM are sufficient
to supply the current demand and future water requirements. The groundwater resources in the CTMM
are sufficient to augment any deficit on the surface water. The only challenge is the formation of
potential sinkholes due to over-abstraction. There is thus an increasing shift towards supplementing
groundwater with surface water supply through WSPs, such as Rand Water and Magalies Water
(DWAF, 2009b).
Figure 2-6 Water requirements for the City of Tshwane (High Population Scenario: (DWAF, 2009b).
Future planned sources for the CTMM are as follows (DWAF, 2009b):
a. Increasing shift towards surface water supply through WSPs, such as Rand Water and
Magalies Water,

- 16 -
b. Increase in water mix especially groundwater utilization, which could include rainwater
harvesting,
c. Re-use of water, and Water Conservation and Demand Management.
2.3.3 Aquifer Characteristics
The Dolomites in the CTMM belong to the Chuniespoort Group and are classified as a karst-aquifer
(Barnard, 2000), which means that open cavities and even caves have developed below ground level
due to the dissolution or chemical weathering of the dolomite. This gives the aquifer enhanced
properties of groundwater storage and permeability, resulting in high- yielding boreholes and making
the Chuniespoort Group important (Barnard, 2000). Karst- aquifers are formed through the action of
rainwater infiltrating into the aquifer and reacting with carbon dioxide in the air and in the soil to
produce a weak acid, namely carbonic acid. The groundwater resources in the Chuniespoort Group
dolomites are reported not to be a single, interconnected resource, but as dolomites, which are sub-
divided into various units and compartments (Meyer, 2014). This implies that the compartments are
formed by the intrusive dykes5 and other geological structures, which form barriers for groundwater
flow. Extensive research has been done by various authors and Table 2-1 below is a summary after
Naidoo (2014) of the different aquifer hydraulic parameters reported on.
Table 2-1 Karst aquifer hydraulic parameters (after Naidoo, 2014).
Author Effective
Porosity Transmissivity Storage
Buttrick & Van Rooy (1993) 2-14% 10-30 000 m2/day -
Foster (1989) 1-3.4% 10-30 000 m2/day -
Mulder (year unknown) 20% 10-30 000 m2/day 12 000 million m3
DWAF (2006) - - 5000 million m3
DWAF & WRC (1995) - - -
2.3.4 Groundwater Levels and Flow Direction
The groundwater in the Tshwane dolomites has been extensively exploited for many years, and natural
recharge and discharge mechanisms modified by people (such as altering river flows and capturing
springs). It is therefore difficult to determine a “natural” groundwater state (Hobbs, 2004). Natural
groundwater level fluctuations in the Tshwane dolomites are thought to be small, most likely around 5
m (Hobbs, 2004). This is because groundwater storage in karstic dolomites is relatively large and this
suggests large volumes of water must be added or removed to obtain a fairly moderate change in
groundwater levels.
5 Dykes are generally composed of the post-Karoo age dolerite and syenite.

- 17 -
2.3.5 Groundwater Quality and Aquifers in the wider area of the CTMM
An assessment of groundwater quality in the dolomites was conducted by Hobbs (2004). The data was
obtained from the Water Management System (WMS) database and was examined, the results for a
total of 158 borehole water samples were obtained from the database. In general, only data for the
concentrations of the major ions (Calcium, Magnesium, Bicarbonate, Sodium, Chloride, Nitrate,
Potassium, and Sulphate) plus Fluoride, Phosphate, Ammonium, pH and Electrical Conductivity were
available. Hobbs (2004) published the following findings:
a. Chemical quality of the groundwater was generally good, with all but four (4) of the sample
sites having groundwater quality falling into the Class 0 (ideal) or Class 1 (acceptable)
category, according to the SANS 241 standard applicable at the time, and
b. Groundwater was classified as predominantly of the Calcium-Magnesium-Bicarbonate type,
as expected for dolomitic groundwater in which dissolution of the rock matrix is the major
contributor to chemical quality.
Compartments, as depicted in Figure 2-7, were proposed by different authors for karst-aquifers
(Barnard, 2000). This is because the linear structures, which form compartments, are not always
continuous, and the extent to which they prevent or allow groundwater flow is not always obvious. In
some cases, groundwater levels do not differ significantly from one compartment to the next, even
where the compartments are separate. The compartments proposed by Hobbs (2004) for the CTMM
are East Fountains, West Fountains, East Doornkloof, West Doornkloof, and Erasmia. These
compartments were consolidated into three “Groundwater Management Units” (GMUs) by Hobbs
(2004), based on the inferred connections between compartments (i.e. along the Sesmylspruit), and on
similar water level changes (hydrostatic responses). The Fountains East and West groundwater
compartments are shown in Figure 2-7 and comprise of the Upper and Lower Fountain springs. The
two (2) springs have been supplying Pretoria with water since its founding in 1855. The two (2)
dolomite springs are founded on the rocks of the Malmani Subgroup (Chuniespoort Group) and are
separated by the Pretoria (syenite) dyke. The springs belong to separate dolomite compartments,
namely; the Fountains East compartment (Upper Fountain) and Fountains West compartment
(Lower Fountain). Both the Upper and Lower Fountain springs are located on rocks of the Malmani
Subgroup, which forms part of the Chuniespoort Group (Transvaal Supergroup). According to
Eriksson et al. (2006), the Malmani Subgroup is divided into five (5) subgroups, namely; Oaktree,
Monte Christo, Lyttelton, Eccles, and Frisco.

- 18 -
Figure 2-7 Hydrogeological Map depicting various groundwater compartments in the City of Tshwane (Meyer, 2014).

- 19 -
2.3.6 Status of Urban Groundwater Planning and Management
The CTMM has incorporated groundwater into its WSDP and acknowledges groundwater as a
valuable resource that is currently used for bulk water supply and which requires protection for future
use. However, groundwater use does not yet translate to planned projects in the IDP or other bulk
supply augmentation schemes. There are also no measures in the SDF that specifically target
groundwater protection.
Tshwane‟s response to WSUD is observed in many initiatives that are currently being implemented.
The following are the WSUD initiatives noted in the literature:
a. A program to boost its ability to supply water, developed in light of the fact that the Vaal
River System is severely stressed and unable to keep up with the demand placed upon it has
been approved,
b. The CTMM aims to reduce the water supply-demand placed on the Vaal River System by
developing its own water resources. This water augmentation program will depend highly on
the re-use of treated effluent from the WTWs. The only challenge with these augmentation
programs is the costs attached to it. As a result, Water Conservation and Demand Management
remain a high priority in the CTMM.
Various groundwater management measures are included in the by-laws and are as follows:
a. The CTMM can request notification for all existing and planned boreholes by public notice,
b. The CTMM can require owners who intend to drill a borehole to conduct an Environmental
Impact Assessment (EIA),
c. The CTMM can require owners with boreholes to obtain approval from the MM for use of the
borehole for potable supply and can impose conditions for potable use of borehole water.
2.4 EKURHULENI METROPOLITAN MUNICIPALITY
2.4.1 Current Municipal Water Supply Source
The bulk water supply is abstracted from the Vaal River System. Rand Water and East Rand Water
Care are the two (2) major bulk WSPs for water supply and wastewater.
2.4.2 Current and Future Water Demand
The current water demand of 410 million m3/a and future water demand (2030) of 480 million m
3/a are
depicted in Figure 2-8. Similar to the CoJ, it is projected that the EMM will go into deficit in 2030. As

- 20 -
already mentioned, there is a program in place to augment the deficit from the Vaal River System
(VRS). A plan was proposed for the CTMM to boost the CoJ with an additional supply of water. This
will also boost the EMM due to the fact that it receives its bulk water supply from the VRS. The
proposal was developed in light of the VRS being severely stressed and unable to keep up with the
demand placed upon it and this proposal has been approved. This water augmentation program will
depend highly on the re-use of treated effluent from the Wastewater Treatment Works (WTWs). The
only challenge with this program to be implemented successfully is the high cost of treatment
facilities.
Figure 2-8 Water requirements for Ekurhuleni (High Population Scenario: DWAF, 2009b).
Future planned sources for the EMM are as follows (DWAF, 2009):
a. Conservation and Water Demand Management to reduce losses and reduce the urban demand
by at least 20% by 2030,
b. Re-use of water (priority being water from gold mines),
c. Vaal River Integrated Water Quality Management Strategy, and
d. The Lesotho Highlands Water Project.
2.4.3 Aquifer Characteristics and Groundwater Flow Direction
Barnard (2000) published a general Hydrogeological Map 2526 that indicates three (3) main dominant
aquifer types in the EMM, namely; karst, intergranular as well as intergranular and fractured aquifers.
Karst aquifers are the most important aquifers in the EMM and will be aptly described. Karst aquifers

- 21 -
occur mainly in the dolomites of the Chuniespoort Group. This is the most important aquifer type in
South Africa. Infiltrating rainwater contains weak carbonic acid, which dissolves dolomites and results
in the formation of caves and cavities that may facilitate the formation of sinkholes, especially if the
water from these cavities is extracted through boreholes. Boreholes with the highest yield occur from
Wadeville to the south of Vosloorus with yields of more than 10 l/s reported.
Groundwater flow is predominantly towards the north-west in the Bapsfontein, Elandsfontein and
Witkoppies compartments and towards the east in the Delmas Area.
2.4.4 Groundwater Quality and Aquifers in the wider area of the EMM
Water quality levels in the EMM are impacted by changes in rainfall and poor urban drainage
management. Other impacts include:
a. Discharge of industrial effluents, irrigation returns flows and urban runoff,
b. Organic chemicals and heavy metals – concern for the increasing contamination of the shallow
Karoo aquifers underlying the Holfontein Landfill Site, and
c. Due to the mining activities in the area, groundwater quality is under threat of AMD. Mining
in the areas (the urban influence from East and West Rand - dewatering) has a significant
impact on the quality (especially acidification) of groundwater as well as on fluctuations of the
groundwater levels in the area.
The Delmas-Bapsfontein dolomitic aquifers south-east of Pretoria (Figure 2-9), represent important
groundwater resources that are relied on by many, especially in the EMM. Water users include urban
and rural residents, irrigation and livestock farmers, industry and mining. The aquifers also sustain the
ecology where wetland areas around dolomitic springs and surface water flowing from the dolomite
groundwater, create an ideal habitat for plant and animal species.

- 22 -
Figure 2-9 Geological Map depicting the Delmas-Bapsfontein dolomitic aquifers (Pietersen, 2011).

- 23 -
2.4.5 Status of Urban Groundwater Planning and Management
The EMM has not incorporated groundwater into its WSDP nor IDP and does not acknowledge
groundwater as a valuable resource that could potentially be used for bulk water supply and which
requires protection if it is to be available for future use. There are no additional uses of groundwater
planned other than bulk supply. There are no measures within the SDF that specifically target
protection of the recharge area for the current and proposed future groundwater resources. However,
the City explicitly embraces WSDP within its IDP. Linked to the plan are a range of issues i.e. water
supply, quality and water services infrastructure. Additionally, groundwater‟s role in WSD is not
included but strategies currently available are Planning and Coordinated Use of River-Basin, and
Water Conservation and Demand Management.
Various groundwater management measures are included in the by-laws and include the following:
a. The owner of an existing borehole prior to the promulgation of the by-laws has 90 days to
notify the EMM of its existence, and provide required details,
b. Prior approval is required to drill, deepen or replace a borehole,
c. Allowance is made for the EMM to enter the property to monitor private boreholes and
determine the maximum abstraction allowable from a borehole, and
d. There is the prevention of pollution policy but it only caters for streams and reservoirs.
2.5 ETHEKWINI METROPOLITAN MUNICIPALITY
2.5.1 Current Municipal Water Supply Source
The KwaZulu-Natal (KZN) Coastal Metropolitan Area stretches from Pietermaritzburg in the west to
Durban in the east and from Kwadukuza in the north to Amanzimtoti in the south. It includes the
eThekwini Metropolitan and Msunduzi and iLembe Municipalities. The main stakeholders are the
Municipalities, Umgeni Water, and the Department of Water and Sanitation.
2.5.2 Current Municipal Water Supply Source
The area is supplied by two independent systems, namely; Msunduzi and most of the eTMM is
supplied by the Mgeni System, with the northern fringe of eThekwini and the KZN north coast
supplied by the Mdloti System. The bulk water system of the KZN Coastal Metropolitan Area consists
of an extensive network of water conveyance and treatment infrastructure (pipelines and aqueducts)
transferring water from the main storage reservoirs, Midmar, Albert Falls, Nagle and Inanda Dams in
the Mgeni River System and Hazelmere Dam on the Mdloti River to the users (DWA, 2010).
Furthermore, the Mooi-Mgeni Transfer Scheme augments the supply of the upper Mgeni River

- 24 -
(Midmar Dam) and in the far north of the area, KwaDukuza in the iLembe District Municipality,
currently receives water from the Mvoti River (DWAF, 2009a).
2.5.3 Current and Future Water Supply Demand
The current water demand of 450 million m3/a and future water demand (2030) of 550 million m
3/a are
depicted in Figure 2-10. A Water Reconciliation Strategy for the KZN Coastal Metropolitan Areas
was completed in March 2010 and from the study, it was indicated that both the large Mgeni System
and the much smaller Mdloti System were in deficit, with requirements in excess of assured supply.
Good rains between 2010 and 2019 have masked this deficit. The expected future increase in water
requirements is a consequence of planned improvements in water services, along with the needs of
proposed housing developments.
Future planned sources to meet water requirements in the Mgeni System as per Reconciliation
Strategy 2010 are as follows:
a. The effective implementation of Water Conservation and Water Demand Management
(WC/WDM) measures is critical to reconciling the water balance. The reconciliation strategy
recommended an intensive WC/WDM program to reduce water requirements,
b. The strategy recommended that the Spring Grove Dam on the Mooi River be built to
supplement the Mgeni System. Construction was due to begin and this dam was anticipated to
deliver water in 2013,
c. The re-use of water through the treatment of effluent from several Wastewater Treatment
Plants that will contribute to approximately 60 million m3/a available to supply urban use.
This will be sufficient to supply the system until 2023. eThekwini is currently undertaking a
study to confirm the feasibility of this option (DWA, 2010),
d. The deficit in the Mdloti System was projected to be met in 2012 by increasing the storage of
Hazelmere Dam through the addition of crest gates. It was further projected that this would
increase the yield of the dam from 18 to 28 million m3/a,
e. Further augmentation from the Thukela River was in a Pre-Design Stage in 2010 and the first
water delivery anticipated in 2015,
f. Re-use of KwaMashu treated effluent was planned after 2016, and
g. In the long term (after 2020) the water resource of the Mvoti River will have to be developed.

- 25 -
Figure 2-10 Mgeni System: Reconciliation of water supply and demand (DWA, 2010).
A decision on which option to be implemented was planned to be made by 2016. Options included:
a. The proposed uMkhomazi Water Project Phase 1 (uMWP-1) to transfer water from the
uMkhomazi River Catchment to the Mgeni System. The proposed uMWP-1 would entail the
proposed Smithfield Dam on the Mkomazi River, a raw water tunnel and pipeline, as well as a
Water Treatment Works (WTWs) with a capacity of 625 Ml/day and a potable water pipeline
where it will tie in with the Mgeni System‟s Infrastructure at Umlaas Road,
b. The Desalination of seawater, and re-use of treated effluent.
2.5.4 Aquifers Characteristics
The Natal Group sandstone (Figure 2-11) outcrops in the eastern KZN province of South Africa and is
an example of a secondary aquifer. The Natal Group sandstone is called many names in the literature,
namely; Palaeozoic Sandstone Formation, the Table Mountain Sandstone and the Table Mountain
Series that is Ordovician to Silurian in age and consists of conglomerates, sandstones, siltstones and
mudrocks (Marshall, 2006). The Paleozoic age Natal Group sandstone represents a secondary aquifer
where its porosity and permeability are results of mainly the abundant joints, faults, and bedding-plane
partings. Groundwater in a large number of boreholes drilled within the Group comes from intensively
jointed and faulted rock mass (Demlie et al., 2012). According to Bell and Maud (2000), the Natal
Group sandstone is very interesting from a hydrogeological perspective, as it is one of the most
productive aquifers in the region. Natal Group sandstone is very limited, however, localized studies
conducted indicate that the sandstone of the Natal Group is relatively the most productive aquifer

- 26 -
(high borehole yields and very low percentage of dry boreholes) compared to other rock units. The
following are the aquifer hydraulic parameters reported by Bell and Maud (2000):
a. Sandstone Aquifer of the Natal Group in the Greater Durban Area has a storativity of 0.001,
which is typical for confined aquifers,
b. An average Transmissivity (T) of about 1.5 m2/day and Hydraulic conductivity (K) of
2.8 m/day is reported for the same area by Groundwater Development Services (GDS, 1995).
However, more than 60 m2/day transmissivity values are commonly reported in areas that are
characterized by faults, fractures and joint systems with borehole yields greater than 5 l/s, and
c. Analysis of data of 48 boreholes drilled within the Natal Group sandstone gave yields that
ranged from 0.2 to 20 l/s with an overall median yield of 3 l/s. The borehole yields for Natal
Group Sandstone are summarised in Table 2-2 below.
Table 2-2 Borehole yields summary for Natal Group Sandstone based on 48 data points obtained from
NGA (after Demlie et al., 2012).
Borehole Yield
(l/s)
No. of
Boreholes
Perc.
(%)
Min.
Yield
Max.
Yield
Mean
Yield
Median
Yield
Standard
Deviation
>3 l/s 24 51
0.2 20 4.4 3 3.7 >0.5 l/s ≤ 3l/s
19
40
>0.1 l/s ≤ 0.5 l/s 5 9
2.5.5 Groundwater Quality
Based on a hydrochemical study conducted with data from the KZN Groundwater Resource
Information Project (GRIP) and information from different specialist reports, the general quality of
groundwater within the Natal Group sandstone is good except in areas east of Melmoth where
groundwater has an Electrical conductivity (EC) as high as 449 mS/m and a Total Dissolved Solids
(TDS) of 2791 mg/l. The EC decreases generally from the coast inland and from north to south.
2.5.6 Status of Urban Groundwater Planning and Management
The WSDP for the eTMM (which includes Durban) shows no evidence of plans for the inclusion of
groundwater management. The KZN Groundwater Plan published by the Department of Water Affairs
and Forestry (DWAF, 2008) suggests however that groundwater in the eTMM is mostly used for
industrial purposes and that the groundwater is heavily polluted. The plan further confirms that
groundwater monitoring is poor, with an overall lack of data management. Groundwater is not
included in the IDP. There are also no other uses of groundwater planned, other than bulk supply.

- 27 -
There are no measures within the SDF that specifically target protection of the recharge area for the
current and proposed future groundwater resources.
To some extent, the eTMM is engaged in various initiatives that correspond with individual WSUD
principles and these include:
a. Green Rivers Programme that aims to improve poor river water quality through activities,
which minimize overflow from the sewer reticulation system into rivers,
b. Activities, among others, include infiltration and accumulation of silt, illegal stormwater
ingress, and illegal discharges of toxic pollutants (eThekwini Municipality, 2011),
c. Sewers being cleaned with the primary objective of removing large deposits of silt and foreign
objects. The sewer reticulation system in the Umgeni River Catchment is the first key area of
focus,
d. Levels of silt accumulation are also being measured in order to establish plans for future
cleaning of sewers,
e. New systems for the monitoring of pump station overflows and failures are being installed and
the identification of pumps and equipment for replacement is being carried out, and
f. Monitoring was also being undertaken through the extension of an aquatic Biomonitoring
Program and the possibility of remote as well as an automatic sampling of industrial effluent
is being explored (eThekwini Municipality, 2011).
Additionally, the Environmental Planning Departments in eThekwini take into cognizance the
importance of being indirectly involved in the monitoring process of effluent, after expressing their
reservations with the technical criteria associated with the Green Drop accreditation. Other direct roles
that eThekwini fully take charge of are:
a. „Eco-system servicing‟, which aims to assess the value of „free‟ services provided by the
environment, i.e. wetlands and floodplains,
b. The eTMM undertook a feasibility study in 2011 into re-using treated effluent for potable use.
The proposal that was being taken forward by the City will see treated effluent from two (2)
WTWs being reclaimed and treated to potable levels. An EIA was also planned in order to
assess this proposal, subject to the completion of a rapid reserve determination by the
Department of Water Affairs (eThekwini Municipality, 2011).
By-laws state that the eTMM can, by public notice, request notification for all existing and planned
boreholes (eTMM, 2017b).

- 28 -
Figure 2-11 Geological and Hydrogeological Map of KwaZulu-Natal depicting the Natal Group sandstone aquifers (Ndlovu and Demlie, 2018).

- 29 -
2.6 REVIEW OF INTERNATIONAL GROUNDWATER BEST PRACTICES
2.6.1 Dire Dawa, Ethiopia
Dire Dawa is the second oldest and largest urbanized City in Ethiopia, comprising of a population of
more than 270 000 (Yitayew, 2005). The only source for water supply and industrial activities in Dire
Dawa is groundwater as there are no surface water resources available in the region (Abate, 2010).
The anthropogenic activities have effects on the natural system posing risks to the quantity and quality
of groundwater. The main causes of degradation to the quality of groundwater are, namely; discharge
of untreated chemical and industrial waste into streams, lack of proper sewerage systems, aquifer
contamination, and over-abstraction and unplanned urban development (Abate, 2010).
The current best practices in Dire Dawa are encouraging amongst others, stormwater infiltration or
artificial recharge over detention and release as surface water (Mengesha Wolde, 2014). Artificial
recharge was done in order to maximize groundwater potential and proper groundwater management
(Yitayew, 2005). The establishment of environmental standards associated with chemical management
and the development of the concept of Integrated Management Strategy (i.e. source reduction,
recycling, sorting, and sanitary landfills) and construction of sewerage systems was proposed by
Yitayew (2005). The following is a summary of proposed and mitigation measures based on previous
studies conducted by Mengesha Wolde (2014):
a. Proper management of liquid and solid waste systems within the City,
b. Establishing of protection (buffer) zones around the well-fields,
c. Locating industries producing harmful products and by-products far from well-field protection
zones,
d. Prohibition of chemical fertilizers within the protection zones,
e. Implementation of proper watershed management,
f. Drilling new boreholes and decommissioning contaminated ones,
g. Blending of water from two (2) boreholes to reduce the Nitrates to an acceptable level,
h. Use of Nitrate water for other household purposes except for drinking and cooking,
i. Groundwater monitoring for seasonal abstractions, water level, streamflow, and water table
mapping. This would also strengthen the Water Resource Management Plan, and
j. Issuance of permits and certificates for the development of boreholes. Additional service fees
for permits pertaining to waterworks construction, water use, and discharging waste.

- 30 -
2.6.2 Namibia
Namibia is one of the most arid countries in Sub-Saharan Africa, and for this reason, it is mainly
dependent on groundwater. Namibia is known for its perennial rivers found on the northern and
southern borders. These rivers are located at a reasonable distance from the Central Areas such as the
Capital City, Windhoek. The main source of water supply for the country‟s more urbanized central
regions is the dams on the ephemeral rivers. The inflow into the dams is irregular and unreliable and
evaporation rates in Namibia‟s arid climate are high. Due to this, the safe yield of the dams is low.
Namibia‟s demand for water resources is increasing and the current water resources are reported to be
insufficient to meet the future needs of the country.
The best option to overcome the water challenge in the Central Areas is augmentation by means of a
water bank through managed aquifer recharge of the Windhoek Fractured aquifer (Zekster and Everett,
2004). This is achieved in conjunction with deep boreholes in order to increase the accessibility to
larger volumes of the stored reserves. The Managed Aquifer Recharge (MAR) includes abstraction of
water from the Three-Dam System, which the City is reliant upon when there is a surplus of water,
purification and finally injection into the Windhoek aquifer done through the boreholes (Zekster and
Everett, 2004). MAR in Namibia ensures the reduction of evaporation from the dams. The stored
underground water can be used when surface water resources become insufficient over the years.
The three dams are operated on an individual basis and yield a 95% safe yield of 20 Mm3 per year.
This is due to evaporation losses from the Omatako and Swakoppoort Dams (van der Gun, 2012). The
integrated use of the three dams, ensure that the water is transferred and stored in the Von Bosch Dam.
The Von Bosch Dam has the lowest evaporation rate due to its basin characteristics. The procedure for
operating the Three-Dam System improves the 95% safe yield to 20 Mm3 per year and it is projected
that annual water demand will increase from the current level of 20 Mm3 to approximately 40 Mm
3 in
2021 (van der Gun, 2012). Below are the three (3) main development options to ensure additional
water supply to the Central Areas of Namibia:
a. Managed recharge of the Windhoek aquifer (using surplus water from the Central Area dams
to increase underground reserves),
b. Karst aquifers used only for emergency supply, and
c. A pipeline link from the Okavango River to supply the Central Areas when required.
MAR is the preferred option in Namibia. Due to the over-abstraction of the Windhoek aquifer since
1950, the underground storage facility has been created and is estimated at 21 Mm3 filled through
natural and artificial recharge. The total estimated storage that can be abstracted from existing

- 31 -
boreholes is approximately 15 Mm3, giving total usable storage (water bank) of 36 Mm
3 (van der Gun,
2012).
2.6.3 Australia, Great Artesian Basin
Groundwater forms approximately 17% of Australia‟s available water resources and makes up to 30%
of the total water in particular regions. The most highly productive aquifers in Australia are the
surficial sedimentary aquifers in the wet regions of the continent where there is sufficient annual
groundwater recharge. Groundwater resources of Australia include amongst others the following
(Harrington and Cook, 2014):
a. The Great Artesian Basin covering one-fifth of the continent,
b. The major alluvial aquifers of the Murray Darling Basin,
c. Perth Basin supplying most of Perth‟s water demands,
d. The Canning Basin in north-western Australia,
e. The Daly Basin in northern Australia, and
f. The Otway Basin aquifers of the southeast of Australia.
In Australia, groundwater is the main source of water supply for many communities particularly for
agriculture, domestic and urban use, industry and mining. There are numerous threats for sustainable
development and management of groundwater resources mainly attributed to a lack of understanding.
Summary of the key groundwater challenges faced by Australia:
a. Increased water demand,
b. Over-allocation and use of groundwater,
c. Groundwater quality, and
d. Inter-Aquifer contamination.
The following is the summary from Harrington and Cook (2014) of groundwater management plans
aimed to strike a balance between the available water resources, the water uses and water needs of the
Great Artesian Basin and Australia in general:
a. Great Artesian Basin Sustainability Initiative - Government invested approximately $140
million over 15 years (1999-2014) for the repair of artesian boreholes and replacement of open
borehole drains with pipe water reticulation systems,

- 32 -
b. Conjunctive use of surface water, groundwater, and artificial recharge are used to manage the
aquifers. The artificial recharge scheme is supplied with water from rivers, artificial channels,
recharge pits, and tidal barrages,
c. Community consultations used as a means to reduce groundwater over-abstraction in the
limestone aquifers,
d. Desalination is an option for many cities due to saline groundwater,
e. Seawater intrusion is addressed with a strategy of concurrently using surface water for
irrigation and artificial recharge of coastal aquifers,
f. In Loxton, in the South of Australia, groundwater is pumped into evaporation ponds to control
salinity,
g. Aquifer Storage and Recovery (ASR) is a common practice of managing aquifers by re-
injecting water into aquifers for industrial, agricultural and municipal use for future recovery
and use, and
h. Water re-use in the Alice Project recycles and stores approximately 600 Ml annually of treated
wastewater in an aquifer. The water is further re-used for the „Arid Zone Research Institute
Horticulture‟ projects.
2.6.4 Europe, Netherlands
About 75% of the European Union (EU) residents are reliant on groundwater as a source of water
supply (Europe Commission, 2008). Groundwater is also recognized as an important resource for
industries (cooling waters) and agriculture (irrigation). The European Union residents acknowledge
that groundwater should not be seen as only a reservoir for water supply but also be protected. In
Europe, more than 50% of the annual flows in rivers are derived from groundwater (European
Commission, 2008).
The Netherlands is a very densely populated country covering an area of about 38 000 km2 and good
groundwater is found in the thick diluvial sediments, emanating from precipitation and rivers such as
the Rhine, Meuse, and Scheldt (Pellenbarg, 1998). In the western parts of the Netherlands, the
groundwater level ranges from 0.5 to 1.0 m below the surface and in the higher areas from 1.0 to 20.0
m (Pellenbarg, 1998). Pellenbarg (1998) maintained that groundwater used to be of good quality but
there are problems of groundwater in the sandy regions.
Pellenbarg (1998) reported that in the most recent years, the drainage levels were lowered to obtain the
following:

- 33 -
a. Higher agricultural production,
b. Large areas were drained to build houses, and
c. Groundwater extractions for drinking water and industry increased significantly and caused
shortages of groundwater locally. Furthermore, groundwater quality is deteriorating and
threatened by industrial pollution, Nitrates, and Phosphates (fertilizers), pesticides, and acid
rain.
The best practices for the Netherlands are summarised below after Zhao (2010):
a. Water management in the Netherlands is closely linked to spatial planning, suggesting the
land use functions of areas and sub-areas (urban areas, different types of agricultural areas,
aquatic and terrestrial nature) are a start of defining the desired regime of groundwater and
surface water levels,
b. Approximately 10% of horticulture farmers are using brackish groundwater to irrigate crops
due to surface water and rainwater not being a sufficient source of water for this purpose.
Horticulture crops bring more profits than other agricultural crops,
c. Since 2006, the European Water Framework Directive prohibits the use of salty water hence
the need to find alternative solutions. Other relevant directives are for Nitrates, urban
wastewater treatment, plant protection products, biocides, integrated pollution prevention
control, and landfills,
d. The Groundwater Act of Netherland stipulates that no one has the ownership to groundwater
and a license or permit is a prerequisite for any groundwater extraction,
e. Every license holder should pay a levy by virtue of the Groundwater Act,
f. There is a groundwater management policy that caters for groundwater managers i.e.
provinces, that require groundwater management plans in advance for any groundwater-
related activity to ensure good groundwater management,
g. The Soil Protection Act in the Netherlands prohibits the use of chemicals in the soil,
h. Acts protecting groundwater pollution are The Environmental Management Act, The Pollution
of Surface Waters Act, The Fertilisers Act, and the memorandum on the use of animal
fertilizers, and
i. The Water Plan was first drafted in 2009 and needs to be reviewed every four years. The plan
prioritizes water security, water quality in the Rhine and Meuse Rivers, division of water use
(drinking water, cooling water for industries, water for agriculture) and conservation and
protection of groundwater for domestic use and ecosystems.

- 34 -
Moreover, due to the variation in the properties of groundwater, groundwater monitoring networks and
information systems in the Netherlands are in good standing to ensure excellent and detailed
groundwater data in a densely populated country.
2.6.5 California
Groundwater is a critical source of water supply in California, making up approximately 40% of the
water used and about 60% that is used during periods of droughts (California Water Foundation,
2014). About 75% of the people in California (30 million people) rely solely on groundwater as a
source of drinking supply (SWRCB, 2012). Groundwater plays a key role in the agricultural sector and
other sectors of the economy. Groundwater basins of various sizes are found throughout the state and
have the capacity to store billions of gallons of water.
Groundwater is mainly found in the two (2) main types of hydrogeological settings in California. Most
groundwater resources are stored in the alluvial basins made up of sediments such as gravel, sand, silt
or clay and cover approximately 40% of California‟s geographical area (Blacet and Parker, 2011).
Blacet and Parker (2011) stated that California‟s groundwater resources are also stored and extracted
from the fractured aquifers (bedrock or sandstone) in which the majority of the municipal supply
boreholes are located i.e. the Sierra Nevada and Coastal Ranges.
During the 1960s and 1970s, over-abstraction caused great challenges in parts of the Central Valley
and led to a drop of about 25 feet (California Groundwater Foundation, 2014). Lund and Harter (2013)
reported that over-abstraction continues to be a challenge in Tulare Lake and the San Joaquin Basins
due to limited surface water supplies and intensive agricultural activities. Land subsidence resulting
from over-abstraction leads to deformation of the land surface, causing a sinking or settling of the land
and subsidence. Some of the costly consequences of subsidence reported by California Groundwater
Foundation (2014) include:
a. Increased coastal and inland flooding,
b. Reduction in conveyance capacity of canals, aqueducts, and flood bypass channels,
c. Damage to buildings, roads, bridges, pipelines, boreholes, and other infrastructure, and
d. Development and formation of earth fissures, which can damage the surface and subsurface
structures and pollute shallow aquifers.
The south-western United States, including California, are prone to periodic droughts. The three (3)
consecutive dry years from 2006 to 2009 resulted in the driest conditions in decades and reduced water
storage in important reservoirs (Blacet and Parker, 2011). It is evident that prolonged periods of

- 35 -
drought have multiple effects on groundwater resources and management. Insufficient surface water
resources can place additional demands on groundwater basins and less water available for
groundwater recharge. The sudden drop in groundwater levels due to increased demand or reduced
recharge implies additional pumping for groundwater resources and a greater potential for over-
abstraction. Other groundwater challenges reported for California are Nitrate contamination, salinity
accumulation and decrease in streamflows.
Blacet and Parker (2011) recognized the following sources for conjunctive use as best practices for
California:
a. Imported water - transferred water across hydrologic region boundaries from one agency to
another. Most states receive imported water from the State Water Project and Central Valley
Project,
b. Local surface water - delivery of water directly from stream flows, as well as water supplies
from local storage facilities,
c. Recycled water - municipal, industrial, or agricultural wastewater that is treated to produce
water that can be re-used,
d. Reclaimed water - treated water where the inflow water supply is polluted, contaminated, or
otherwise tainted,
e. Desalinated water - water that has been treated to remove salt for beneficial use. Source water
can be brackish or seawater, and
f. Stormwater (runoff) - water that collects during a rainfall event and may carry pollutants to
watercourses, causing degradation.
2.7 SUMMARY OF GROUNDWATER MANAGEMENT IN SOUTH
AFRICAN METROPOLITAN MUNICIPALITIES
The literature was reviewed to obtain the status quo of urban groundwater in South Africa, with
specific reference to the CoJ, CTMM, EMM, eTMM. Emphasis was placed on providing analyses
based on literature for the following: current water supply, water supply/demand, future reconciliation
strategies, and plans. The geology, aquifer characteristics, groundwater quality and aquifers in the
wider area of each municipality were also discussed. Furthermore, the review of the status of urban
groundwater planning was done to assess the groundwater‟s integration to municipal planning,
protection, and management. An indication was provided on whether each municipality is considering
groundwater as a future supply source. In cases where urban groundwater is not utilized for bulk water
supply for certain reasons (i.e. perhaps more productive aquifers are located beyond the urban area),
active management and protection for other uses (ecological services, garden irrigation, and sports

- 36 -
fields) were strongly recommended. Lastly, a compendium of papers on international best practices
was reviewed to assess the groundwater management and compared with the status quo in order to
understand the gaps that would lead to innovative technical solutions.
At some MMs, some of the ways in which groundwater should be represented in the MMs key
planning processes were met. However, it is noted that there is no single MM that achieves an ideal
representation of groundwater in all the relevant planning documentation. The overall findings from
the analyses are that groundwater use and management are poorly integrated into the key planning
processes at the MMs. There is no case where there is a coherent plan for groundwater development
and management from the MMs. The assessment of the status quo assisted to identify groundwater
ingressing into the Gautrain Tunnel as a challenge that can potentially be solved.
The review of the international best practices revealed that a number of increasing cities around the
world are beginning to implement alternative water management approaches such as wastewater re-
use, conjunctive use of surface water and groundwater, linking water management to spatial planning,
and protection of groundwater through Environmental Acts.
Having reviewed the literature pertaining to the status quo of urban groundwater resources in MMs
and best practices for urban groundwater management, a summary in Table 2-3 and Table 2-4 presents
the most pertinent findings acquired from the literature review.

- 37 -
Table 2-3 Current and planned future bulk supply to Metropolitan Municipalities, with a focus on groundwater information.
MM Current Water
Requirements
Future Water
Requirements
Current Supply Sources Future Supply Sources Significant Aquifers
The City of
Johannesburg
(CoJ).
Current demand 600
million m3/a (DWAF,
2009b).
The CoJ requirement from
VRS: 700 million m3/a in
2030, high growth projection
(DWAF, 2009b).
The CoJ is currently importing
almost all of its water from the
different storage and inter-basin
transfer schemes (DWAF,
2009b). The bulk water supply is
abstracted from the Vaal River
System and Rand Water is the
main water services provider for
water supply and wastewater
(DWAF, 2009b).
Future planned sources for the CoJ
are as follows (DWAF, 2009b):
Conservation and Water
Demand Management to reduce
losses and reduce the urban
demand by at least 20% by 2030,
Re-use of water (priority being
water from gold mines),
Vaal River Integrated Water
Quality Management Strategy,
and
Lesotho Highlands Water
Project.
The aquifers in the CoJ are all based
on the Johannesburg Hydrogeological
Map published by Barnard (2000)
that shows the high-yielding karstic
aquifers, intergranular (alluvial),
fractured and intergranular and
fractured aquifers.
Tshwane
(CTMM). 300 million m
3/a (2015,
based on high growth
projection) (DWAF,
2009b).
Water requirement from
VRS: 360 million m3/a in
2030, high growth projection
(DWAF, 2009b).
81.3%: Rand Water supplies
water from the Vaal River System
(VRS) and Magalies Water
provides water from Roodeplaat
Dam
18.7%: supplied from the
CTMMs own Rietvlei Dam,
springs and boreholes (DWA,
2010).
Future planned sources for the
CTMM are as follows:
Increasing shift towards surface
water supply through WSPs,
such as Rand Water and
Magalies Water,
Increase in water mix especially
groundwater utilization, which
could include rainwater
harvesting,
Re-use of water and Water
Conservation and Demand
Management.
Groundwater is abstracted from the
Fountains Upper and Lower Springs,
the Rietvlei Spring, the Grootfontein
Spring Rietvlei borehole, and the
Valhalla borehole, all of which
emanate from boreholes targeting the
karstic aquifer formed by the
dolomites of the Malmani Subgroup
of the Chuniespoort Group (Transvaal
Supergroup).

- 38 -
MM Current Water
Requirements
Future Water
Requirements
Current Supply Sources Future Supply Sources Significant Aquifers
Ekurhuleni
(EMM).
410 million m3/a
(DWAF, 2009b).
Water requirement from the
VRS: 480 million m3/a, in
2030, high growth projection
(DWAF, 2009b).
Rand Water, East Rand Water
Care, and Johannesburg Water
supply water to Ekurhuleni, all
ultimately from the VRS.
Future planned sources for the EMM
are as follows (DWAF, 2009b):
Conservation and Water
Demand Management to reduce
losses and reduce the urban
demand by at least 20 % by
2030,
Re-use of water (priority being
water from gold mines),
Vaal River Integrated Water
Quality Management Strategy,
and
Lesotho Highlands Water
Project.
Significant groundwater resources
occur in the EMM, which is
dominated by dolomite of the
Malmani Subgroup of the
Chuniespoort Group (Transvaal
Supergroup) and tillites of the Dwyka
Group.
eThekwini
(eTMM).
450 million m3/a in 2015
(For Mgeni WSS, which
includes areas northwest
of the eTMM, but
excluding an area beyond
Umhlanga supplied by
the Mdloti-Mvoti WSS,
and the area south of
Amanzimtoti supplied by
the South Coast Water
Supply System (WSS).
Approximately 550 million
m3/a in 2030 (DWAF, 2009a)
for Mgeni WSS.
The current supply is 100%
derived from surface water, from
several dams on the Mgeni
System originating in the
Southern Drakensberg and
supported by transfer from Mooi
River (98%), and from the local
Hazelmere Dam on the Mdloti
and Mvoti River systems (2%)
(DWA, 2009).
Reconciliation scenarios involve the
following options:
Use of treated effluent,
Desalination of seawater, and
The uMkhomazi Water Project
(transferring surface water
resources from a new dam on
uMkhomazi to Mgeni System).
Natal Group sandstone forms a
secondary/fractured aquifer,
unconformably overlain by the
secondary (intergranular and
fractured) Dwyka Group and the Ecca
Group rocks of the Karoo
Supergroup.

- 39 -
Table 2-4 Integration of groundwater to municipal planning, protection, and management mechanisms.
MM
Urban GW impacts (Water Sensitive) Development and spatial
planning
Groundwater protection
The City of
Johannes-
burg MM
(CoJ)
There are problems regarding AMD in the CoJ and
heavily contaminated water from old mining areas
in the Johannesburg region, and its potential impact
on the quality of groundwater in the area.
Groundwater use is listed in the IDP as a water demand
management measure to meet the five (5) year plan
towards environmental sustainability. No other details
regarding planned groundwater use are provided (CoJ,
2017a). There are also other current uses of groundwater
(from un-impacted aquifers) other than bulk supply,
namely; hockey fields and golf courses. There are no
measures within the SDF that specifically target protection
of the recharge area for the current and proposed future
groundwater resources.
The CoJ references Water Sensitive Design principles as a
means to promote water security, reduce environmental
degradation, mitigate flood risks, and build resilience in
the face of climate change. Groundwater‟s role in WSD is
not specifically considered.
The CoJ‟s water services by-laws do not provide for groundwater
protection nor require the registration of boreholes (CoJ, 2008).
The CoJ has Dolomite risk by-laws in place, which are a
prerequisite for the establishment of a Dolomite Risk
Management Section within the City and the responsibility for the
mitigation of land subsidence issues. The by-law controls the
CoJ‟s emergency response to sinkhole formation and the necessity
for dolomite risk assessments at site developments on dolomite
land. Extensive measures requiring the CoJ to monitor dolomite
groundwater levels, and enabling control of dolomite abstraction,
are provided with the aim of maintaining safety (CoJ, 2015).
Tshwane
(CTMM).
There is a limited discussion within documents
regarding pollution threats to urban groundwater.
As groundwater is abstracted from dolomitic
aquifers, structural instability is a risk, and due to
mining in the wider area, AMD will pose a risk.
Pollution is also likely a threat from typical urban
sources (industrial areas, leaking effluent
infrastructure, cemeteries, and waste sites).
The CTMM has incorporated groundwater into its WSDP
and acknowledges groundwater as a valuable resource that
that is currently used for bulk water supply and which
requires protection for future use. However, groundwater
use doesn‟t yet translate to planned projects in the IDP or
other bulk supply augmentation schemes. There are also
no measures in the SDF that specifically target
groundwater protection. WSD is included in the vision
2055 for promotion wastewater re-use.
Various groundwater management measures are included in the
by-laws and are as follows:
The CTMM can request notification for all existing and
planned boreholes by public notice,
The CTMM can require owners who intend to drill a
borehole to conduct an EIA,
The CTMM can require owners with boreholes to obtain
approval from the MM for use of borehole for potable
supply, and
The CTMM can impose conditions for potable use of
borehole water.

- 40 -
MM
Urban GW impacts (Water Sensitive) Development and spatial
planning
Groundwater protection
Ekurhuleni
(EMM)
The most significant urban influence on
groundwater in the region is from mining, via
dewatering and AMD. Contamination sources
within the MM threaten to impact the dolomitic
aquifers beyond the MM. Furthermore, industrial
areas, informal settlements and insufficient
stormwater management, and WWTW effluent all
pose a risk to groundwater.
The EMM has not incorporated groundwater into its
WSDP or IDP and doesn‟t acknowledge groundwater as a
valuable resource that could potentially be used for bulk
water supply and which requires protection if it is to be
available for future use. Groundwater is not included in the
IDP. There are no other uses of groundwater planned
other than bulk supply. There are no measures within the
SDF that specifically target protection of the recharge area
for the current and proposed future groundwater resources.
However, the City explicitly embraces WSDP within its
IDP. Linked to the plan are a range of issues i.e. water
supply, quality and water services infrastructure.
Various groundwater management measures are included in the
by-laws and include the following:
The owner of an existing borehole prior to the promulgation
of the by-laws has 90 days to notify the EMM of its
existence, and provide required details,
Prior approval is required to drill, deepen or replace a
borehole.
Allowance is made for the EMM to enter the property to
monitor private boreholes and determine the maximum
abstraction allowable from a borehole.
eThekwini
(eTMM)
There is a limited discussion within documents
relating to pollution threats of urban groundwater.
However, pollution is likely a threat from typical
sources (industrial areas, leaking effluent
infrastructure, cemeteries, and waste sites).
The WSDP for the eTMM (which includes Durban) shows
no evidence of plans for the inclusion of groundwater
management. Groundwater is not included in the IDP.
There are also no other uses of groundwater planned other
than bulk supply. There are no measures within the SDF
that specifically target protection of the recharge area for
the current and proposed future groundwater resources.
By-laws state that the eTMM can, by public notice, request
notification for all existing and planned boreholes (eTMM,
2017b).

- 41 -
CHAPTER 3: STUDY AREA
This chapter focuses on the Gautrain Tunnel as a case study whereby it is described in terms of
locality, geological setting, geohydrology, groundwater potential, groundwater use, and structural
geology. The authorizations that had to be complied with during the construction phase of the Gautrain
Tunnel alignment, the employed construction methods, the operation of the tunnel drainage system,
groundwater level trends, and impacts associated with the construction will be presented. Monitoring
points, discharge points and volumes, as well as qualities, will be presented and discussed in relation
to the existing Integrated Water Use License for Bombela Concession Company (Pty) Ltd.
3.1 GENERAL SETTING
The Gautrain Tunnel alignment falls under quaternary catchments A21A, A21B, A21C, A23A, A23D,
C21D and C22A within the Crocodile (West) Marico Water Management Area (WMA). The Gautrain
tunnel runs through areas, which are under the jurisdiction of the City of Tshwane, the City of
Ekurhuleni, and the City of Johannesburg Metropolitan Municipalities (Figure 3-1). The WMA
comprises of various large streams such as the Sandspruit, Jukskei River, Modderfontein Spruit,
Rietspruit, Hennops River and Apies River. Moreover, there are several small tributaries, which
ultimately form part of the wider Crocodile River catchment that flows north and out of Gauteng. The
Gautrain tunnel alignment extends predominantly in the south-north direction except for the 1 km
section between Sandton and Marlboro where the tunnel alignment stretches in the north-east
direction. The tunnel alignment comprises of two main routes, namely; the south-north route linking
Pretoria and Johannesburg, and east-west route linking the Sandton and the East Rand at Rhodesfield
in Kempton Park, including a dedicated service that links Sandton and OR Tambo International
Airport (hereafter referred to as ORTIA). The rail link also consists of both-below and above-ground
sections. The Gautrain tunnel alignment is approximately 80 km in length and consists of eight (8)
stations.
3.2 GEOLOGICAL SETTING
The geology along the Gautrain route is depicted in Figure 3-1 and is dominated by the Karoo,
Transvaal, Ventersdorp Witwatersrand Supergroup and the Basement Complex. Based on the
lithostratigraphic considerations, the geology encountered along the tunnel length is composed mainly
of rocks overlain by soil. The south-north route is situated within the Hospital Hill Supergroup
(Witwatersrand Supergroup) and stretches over granitic rocks of the Halfway House granites (Iliso
Consulting, 2010). The Witwatersrand Supergroup is characterized by a number of large intrusive
dykes in the granitic and metasediments and the lithologies are further altered locally by the presence

- 42 -
of faults (Iliso Consulting, 2010). The tunnel is generally underlain by mainly topographic divide,
except where the tunnel passes beneath the Sandspruit Valley and where it crosses the channel of the
Jukskei River. The geology closer to Pretoria is dolomitic in nature and the portion of the route crosses
syenite. Centurion, through Midrand, to Sandton comprise of geology that is underlain by granodiorite
consisting of deep residual and unconsolidated soils. The east-west route geology is characterized by
lavas, agglomerates, and tuffs of the Ventersdorp Group. There are also weathered lavas consisting of
weathered residual soils with depths ranging from 9 to 12 m and extremely weak lavas and
agglomerates underlying the soil (Iliso Consulting, 2011). The tunnel alignment passes four (4) main
geological units as summarized in Table 3-1 and depicted in Figure 3-1 between Pretoria and
Johannesburg and can be broadly summarised after Iliso Consulting (2011), as follows:
a. Basement Granite / Gneiss,
b. Witwatersrand Supergroup,
c. Malmani Dolomites, and
d. Pretoria Group with smaller outcrops of Karoo and Ventersdorp are evident along the route.
Table 3-1 Summary of the Regional Geology, in the form of a Stratigraphic Succession (after Iliso
Consulting, 2011).
SuperGroup Group Formation Lithology
Karoo
Ecca Vryheid Sandstone, shale
Dwyka Diamictite, shale
Transvaal
Pretoria
Timeball Hill Shale, siltstone, conglomerate, quartzite
Hekpoort Volcanic rocks
Chuniespoort Malmani Dolomite, chert
Blackreef Quartzite
Klipriviersberg Lava, agglomerate, porphyry, lava, turf
Witwatersrand
Central Rand
Turffontein Quartzite, conglomerate, shale
Johannesburg Quartzite, conglomerate
West Rand
Jeppestown Shale, quartzite, conglomerate, lava
Government Quartzite, greywacke, conglomerate, shale
Hospital Hill Shale, quartzite, banded ironstone
Orange grove Quartzite, shale, conglomerate
Basement Complex
Granite-gneiss, granite, gneiss
Mafic and ultramafic rocks

- 43 -
The Gautrain Tunnel alignment is characterized by a number of geological structures (dykes, faults,
lineaments and shear zones), which are associated with groundwater occurrence and clearly depicted
in Figure 3-2. The structural geology of the tunnel alignment is summarised after the Integrated Water
Use License Application Report prepared by Iliso Consulting in 2011 as follows:
Diabase dykes
There are numerous diabase dyke intrusions present along the tunnel alignment and the following are
of importance:
a. The Sandton to Johannesburg route intersects two north-south trending diabase dykes, which
have been partially exploited by the Sandspruit, between Grayston Drive and North Road in
Sandton,
b. A north-west to south-east diabase dyke is present between the N3 Highway and Linbro Park
on the Sandton - ORTIA section, and
c. The Hatfield to Pretoria route passes over a diabase dyke near the Pretoria Station.
Syenite dykes
A number of syenite dykes are encountered along tunnel alignment and the following was noted:
a. A northwest-southeast syenite dyke is crossed near Allandale Road in Midrand,
b. A number of east-west trending syenite dykes and sills in the Centurion Area, and
c. A syenite dyke intrudes both the Pretoria Group rocks and dolomites. The Apies River as it
passes through the Fountains Valley, exploits the weakness created by the dyke.
Faults
Several faults are crossed along the various sections of the tunnel alignment and are noted as follows:
a. Northeast-southwest faults were reported to be mapped in the Killarney Area and were found
to have displaced the quartzites and shales of the Orange Grove and Hospital Hill formations
of the Witwatersrand Supergroup,
b. A northeast-southwest trending regional fault is present on the contact between the granites
and the Ventersdorp lavas, in the Spartan Area on the Sandton-ORTIA section of the route,
and
c. North west-south east, north-northwest, south-southeast, and east-west trending faults are
evident towards the south of the Dolomites, from just south of Nelmapius Road, near
Rooihuiskraal to the intersection of the N1 and R28 highways.
Lineaments
Several lineaments were encountered and mapped along the tunnel alignment. These are noted and
summarized as follows:

- 44 -
a. A regional, east-west trending lineament was found to be a possible dyke in close vicinity to
the Sandton Station, mapped as a possible dyke, and
b. A regional lineament, possibly a dyke, was found between Allandale Road in Midrand and the
N1 - N3 intersection in Buccleuch.
Shear Zone
The following shear zone of interest was noted and summarized as follows:
a. The north-south shear zone was reported to be mapped, beneath, or in close proximity to the
Modderfontein industrial complex.
3.3 GEOHYDROLOGY
Based on the 1:500 000 Hydrogeological Map (2526) compiled by Barnard (2000) and from available
information, obtained from the Department of Water and Sanitation (DWS), the tunnel alignment
passes over three main groundwater aquifer types, namely; the karstic, high-yielding aquifers of the
dolomites in the Pretoria/Centurion region used as a strategic water resource for domestic water supply
in Tshwane, the lower-yielding, fractured rock aquifers associated with the Pretoria Group and the
Witwatersrand Supergroup, and the intergranular and fractured granitic aquifers used largely for
limited agricultural smallholdings and the watering of gardens and parks. The geohydrology along the
tunnel alignment is presented in Figure 3-1.
3.3.1 Groundwater Use and Groundwater Potential
The dolomites in the Centurion and Fountain Valley Area (Upper and Lower Fountain) are a strategic
water resource for the domestic supply of Pretoria. Four (4) production boreholes in the Centurion
Area are abstracting and pumping groundwater into the domestic water reticulation system. Moreover,
groundwater from the Fountains valley springs is utilized to supplement domestic water supplies for
Pretoria. The fractured granitic aquifers associated with the Pretoria Group and the Witwatersrand
Supergroup have lower groundwater potential and groundwater use from these aquifers is essentially
limited to agricultural smallholding use and watering of gardens. Nineteen (19) groundwater users
were identified during a hydrocensus study conducted across the Gautrain Tunnel alignment and it was
noted that the use of the boreholes is essentially limited to the watering of gardens, parks and school
fields (Iliso Consulting, 2011).
The groundwater potential of the Basement Granite/Gneiss, Witwatersrand Supergroup, Malmani
Dolomites, and the Pretoria Group is summarised after Illiso Consulting (2011) in Table 3-2.

- 45 -
Table 3-2 Groundwater potential along the Gautrain Tunnel alignment (after Iliso Consulting, 2011).
Aquifer Type Median
Borehole
Yield
(l/s)
Harvest
Potential
(m3/km
2/a)
Base
Flow
(mm
mean
annual
flow)
Borehole Prospects
Accessibility Exploitability
Pretoria Group
Fractured
0.5-2.0
6,000-10,000
10-25
40-60%
30-40%
Malmani
Dolomites
Karstic
>0.5
50,000-
100,000
10-25
>60%
>50%
Witwatersrand
Group
Fractured
0.5-2.0
10,000-15,000
0-10
40-60%
10-20%
Basement
Granites/Gneiss
Intergranular
& Fractured
0.5-2.0
10,000-15,000
25-50
≤ 40%
20-30%

- 46 -
Figure 3-1 Locality, Geological and Geohydrological setting of the study area.

- 47 -
Figure 3-2 Structural Geology of the study area.

- 48 -
3.4 TUNNEL CONSTRUCTION AND DRAINAGE SYSTEM
This section discusses the methodologies that were used for the construction of the Gautrain Tunnel.
The section further delves into the legal requirements that had to be complied with during the
construction of the Gautrain Tunnel alignment, the operation of the tunnel drainage systems,
groundwater level trends, and impacts associated with the construction.
3.4.1 Authorization Granted
The Gautrain Tunnel alignment was designed and constructed under tremendous time constraints,
which led to the changes of designs and alignments during the construction phase. The Gauteng
Department of Roads and Transport (GDRT) initiated the construction of the tunnel in 2006 on behalf
of Bombela Concession Company (Pty) Ltd (hereafter referred to as BCC) and completed mid-2012
(BCC, 2017). The additional information pertaining to the construction became available while the
construction was in progress and amendments had to be made to incorporate specific conditions. This
resulted in the below water uses that had to be authorized in terms of the National Water Act (NWA),
Act 36 of 1998 by the Department of Water and Sanitation (DWS) in 2007 (BCC, 2014):
Section 21 (a) of the Act: taking water from a water resource,
Section 21 (b) of the Act: storing of water,
Section 21 (c) of the Act: impeding or diverting the flow of water in the watercourse,
Section 21 (f) of the Act: discharging waste or water containing waste into a water resource
through a pipe, canal, sewer, sea outfall or other conduit,
Section 21 (i) of the Act: altering the bed, banks, courses or characteristics of a watercourse,
and
Section 21 (j) of the Act: removing, discharging or disposing of water found underground for
the efficient continuation of an activity or for the safety of people.
The Integrated Water Use License Application (IWULA) for the Gautrain Tunnel alignment was
lodged in 2006 with the preliminary designs and available information. The Integrated Water Use
License (IWUL) including the aligned Record of Decision of 2004 was issued on 17 January 2007.
Due to additional Environmental Impact Assessment (EIA) conducted, an amendment had to be
effected on the previously issued IWUL in terms of Section 50 of the NWA for partial destruction of
wetlands, construction of a bridge across the Modderfontein Spruit and the construction of culverts
along the alignment. The amended IWUL was issued on 12 September 2008 (Reference number:
260618877). It must be noted that the recent and current IWUL is dated 1 December 2014 (License
No: 03/A21C/CI/2658) and comprised of the final site layout of the permanent water uses remaining

- 49 -
post-construction. The dewatering, discharge, and stormwater management that were performed
during the construction phase of the tunnel alignment are considered as water uses in terms of the
NWA. These water uses were required for an application for a Water Use Licence (WUL) in terms of
the NWA.
3.4.2 Tunnel Construction
Approximately 16 km of the Gautrain Tunnel alignment is located below-ground (Figure 3-3) and
extends from Sandton and Rosebank through Johannesburg Central Business District (CBD) until it
reaches the Park Station. The tunnel alignment consists of about 13 km of a drained tunnel in
crystalline and metamorphic rocks (Iliso Consulting, 2011). This suggests that groundwater ingress
into the tunnel had to be continually discharged for safe continuation of construction operations. The
tunnel crossed various geological and hydrogeological conditions that required the application of
different excavation and support methodologies depicted (Figure 3-4).
The preferred method was the drill and blast method because the tunnel was designed to allow
groundwater flows to be drained via a drainage system at the base (inert) through four low area sumps
where water was pumped and discharged to the surface in order to withstand the external hydrostatic
pressure (Iliso Consulting, 2011). This is also a popular method used in South Africa, specifically at
the deep level gold mines. The following are the different construction methodologies employed for
various sections along the tunnel alignment summarised after Iliso Consulting (2011) as follows:
a. The majority of the tunnel was constructed by means of conventional drilling and blast
method that is better suited for the hard rock conditions. This method was reported to be
efficient when used in conjunction with rock bolts or anchors and concrete lining to provide
reinforcement,
b. During construction using drill and blast, probe holes were drilled in advance of the
excavation to determine the groundwater to be encountered ahead. In the event that substantial
water was detected, grouting material was employed to seal off the fissure,
c. The drill and blast method was particularly used between Shaft E2 and Park Station
(underground tunnel) through the Hospital Hill Quartzite, Parktown Shales and Orange Grove
Quartzite and constructed as a drained tunnel. This construction method was also used for the
tunnel stretching from Rosebank to Marlboro,
d. Tunnel Boring Machine (TBM) was used for about 3 km to excavate the tunnel between Shaft
E2 and Rosebank Station. This section was lined and watertight, and
e. Between Shaft E4 and E5 and at Park Station, the cut and cover method was employed. Post-
excavation of the tunnel, the stripped rock was covered with shotcrete lining. Grouting was

- 50 -
also employed in sections where there was substantial ingress of water and this was followed
by the installation of the drainage systems.
Figure 3-3 Schematic illustration of a cross-sectional view of the tunnel (adapted after, BCC, 2012).

- 51 -
Figure 3-4 Cross Section depicting different construction methods employed along the tunnel (modified after Iliso Consulting, 2010).

- 52 -
3.4.3 Tunnel Drainage System
Groundwater ingressing into the tunnel was drained through the tunnel drainage systems into the
sumps and pumped to the surface or discharged through the Shafts6 to ensure the safe continuation of
construction operations. The drainage systems were divided into two (2) components, namely; the
localized seepage, and diffuse seepage depicted in Figure 3-5 and Figure 3-6 respectively. The
localized seepage was fitted with a drain, while a lining was installed at the diffuse seepage (egg box
membrane) that made drainage over a larger area possible (Iliso Consulting, 2010). The groundwater
ingressing into the tunnel was channelled to the collection drain and then to the sump from where it
was pumped to the surface, passed through an oil separator (effectively removed oil and grease) before
it reached the stormwater system. An underfloor membrane was installed to ensure the conveyance of
water to the same drainage pipe and the sidewall drains.
Figure 3-5 Schematic illustration of localized tunnel drainage (Iliso Consulting, 2010).
6 Shafts refer to Groundwater Discharge Points located along the Gautrain Tunnel. This is an in-house term used by Bombela
Concession Company (Pty) Ltd for these discharge points.

- 53 -
Figure 3-6 Schematic illustration of diffuse tunnel drainage (Iliso Consulting, 2010).
3.4.4 Groundwater Levels
The Annual Environmental Status Report compiled by Bombela Concession Company (BCC) and
dated 2016/2017 confirmed that no groundwater levels were monitored during the initial operation and
maintenance period. The monitoring only commenced formally in 2016. The groundwater levels since
the commencement of monitoring are adapted from the Annual Reports and presented in Figure 3-7.
Based on Figure 3-7, there is a notable groundwater level decline between August 2015 to March 2016
and recovery between April 2016 to May 2017. Since Figure 3-7 reflects groundwater levels that were
measured from August 2015 to May 2017, this is noted as a limiting factor in providing comments on
the groundwater level trends since the inception phase of the Gautrain Project to present. However, the
groundwater level trends and the impacts associated with the construction phase will be inferred
mainly from studies undertaken by Arup in 2009 and Iliso Consulting in 2010 and 2011.

- 54 -
In an effort to get a better understanding of the regional groundwater regime in the study area,
groundwater level monitoring data was requested and acquired on 27 September 2018 via Georequest
from the National Groundwater Archive through the DWS. It is noteworthy that the data received and
available was only on the monitoring stations targeting the dolomitic groundwater resources on
various compartments such as the Rietvlei, Elandsfontein, and Bapsfontein. Statistical analyses were
not performed on this data as these compartments are located far in relation to the current monitoring
boreholes along the tunnel alignment. This implies that DWS boreholes could not provide a
representative and comprehensive groundwater levels trends desired for this study due to their
localities.
Figure 3-7 Groundwater levels (BCC, 2017).
Pre-Construction Groundwater Regime
Arup (2009) construed that the Gautrain Tunnel is located along a mound of groundwater. Arup
(2009) further proved that there is a correlation between the topographic elevation and static water
level, which suggested that the groundwater regime generally mimics the topography as depicted in
Figure 3-8. Arup (2009) also maintained that on a regional level, groundwater flow is parallel to and
away from the tunnel, and not towards the tunnel. The zone around the tunnel where groundwater
levels would be affected was predicted to be fair in extent (Arup, 2009). Figure 3-9 presents a cross-
section developed by Arup (2009) of the Gautrain Tunnel alignment between the Marlboro portal and
Park Station illustrating the relationship between the vertical tunnel alignment and groundwater levels.
A comparison is made on the groundwater elevation, initial groundwater levels and the groundwater
levels for May 2009. The Tunnel crown and the section whereby TBM was used for construction are
clearly delineated.

- 55 -
Figure 3-8 Contour Map showing the groundwater regime during the construction phase of the tunnel
alignment (Arup, 2009).
Construction Groundwater Regime
The construction groundwater regime is based on the Hydrogeological desktop study conducted by
Arup (2009) on the groundwater inflows measured in the Gautrain Tunnel in comparison to the
impacts on the local groundwater users. The results of the study indicated that the inflow rates into the
tunnels were in the order of 4.36 Ml/day (based on inflow data dated May 2009) followed by 5.011
Ml/day in March 2010 and 7.32 Ml/day with further monitoring of the volumes once all the tunnels
were completed. Arup (2009) deduced the following regarding the groundwater levels during the
construction of the tunnel:
a. Groundwater levels in some areas were drawn down significantly and this depicted in Figure
3-10. The drawdown of the water levels was notably high at much-localized areas where the
tunnel section passed through streams and close to the surface (Figure 3-10),

- 56 -
b. The tunnel crown was the only section along the tunnel alignment that was below the
groundwater level as shown in Figure 3-9.
c. Arup (2009) was also of the opinion that the significant drawdown was attributed with
instances where the tunnel intersected the hydraulic connectivity (such as a fault) on which the
piezometer or boreholes are located, and
d. Arup (2009) justified that since the completion of the tunnel construction (end of the
2009/2010 summer rainfall season), groundwater levels, which are dependent on recharge, did
not recover due to low rainfall.
The 2010 report prepared by Iliso Consulting affirmed that the groundwater levels in the study area are
not static over time, even in instances where there is groundwater abstraction. Groundwater levels rise
after a period of continuous rain and drop again during the dry period. In the case where there was
continuous drainage during the construction phase, the prevalent groundwater level trends encountered
were a rise in levels associated with recharge during and shortly after the summer rainfall season,
followed by a drop during the winter months. The report concluded that the average groundwater level
in the study area was the issue and not the instantaneous level. In general, Iliso Consulting (2010)
report highlighted the following key points:
a. There was a general drop in groundwater levels during the construction phase except in
sections constructed using TBM and this is confirmed in Figure 3-9 (between Rosebank and
Shaft E2 where there was no change in the initial groundwater level),
b. A seasonal pattern of drawdown and recovery was observed, specifically between Sandton
station and Marlboro. In general, the groundwater levels were in the order of 10 to 15 m below
ground level except for areas in close proximity to the Mushroom Farm Park (MFP) where
groundwater levels were approximately 5 m below the ground,
c. The report also acknowledged that the long-term effects of the construction of the tunnel and
drainage system on the groundwater levels would require monitoring for several years (5-20
years) in order to determine the average groundwater level and any deviation from this
average. The report concluded by confirming that the groundwater levels subsequently
stabilized and showed a slight recovery in some instances.
Post-Construction Groundwater Regime
It was highlighted at the beginning of section 3.4.4 that according to the Annual Environmental Report
issued for 2016/2017, no groundwater levels were monitored during the initial operation and
maintenance period and monitoring only commenced in June 2016. It is also evident from sections
above that the investigations related to groundwater levels were conducted only to quantify the

- 57 -
impacts and the baseline measurements for the Gautrain Project. Post-construction groundwater level
trends, therefore, require long-term monitoring in order to draw definite conclusions on groundwater
level trends. The fact that comprehensive groundwater monitoring commenced during 2016 is seen as
a major limitation for the current study.
3.4.5 Cone of Dewatering
The cone of dewatering can be explained as the areas around the tunnel where groundwater levels
were affected by the tunnel drainage (dewatering). The impacts on the groundwater users are based on
the findings made by Iliso Consulting (2010; 2011) from the monitoring of the groundwater levels that
were conducted in the form of piezometric readings. The groundwater level responses in the
piezometers installed by Bombela Concession Joint Venture (BCJV) were reported to be highly
variable with respect to tunnel development. The reports confirmed that the flow towards the tunnel
alignment was attributed to water-level declines in certain/specific (not all) BCC piezometers and
probably represent a localized impact (i.e. free drainage of the piezometer based on the magnitude of
hydraulic connectivity between the specific piezometer and tunnel development). In general, the
reports used the principle of groundwater contours (Figure 3-8 and Figure 3-10) and reported the
following groundwater level impacts:
a. To the west of Park Station where the tunnel is located on an elevation of 1730 m,
groundwater contours declined rapidly, and the contribution from this area was limited to
about 200 m. To the east, the area of contribution was in the order of 2 km,
b. At Shaft E2, the tunnel is situated at an elevation of 1670 m, and the cone of dewatering
extended to about 1 km to the west, and 3 km to the east,
c. At Rosebank Station with an elevation of 1660 m, the cone of dewatering narrowed to about
200 m on either side of the tunnel,
d. At Sandton, the tunnel is at an elevation of approximately 1580 m and the cone of dewatering
was about 1 km on either side of the tunnel, and
e. At Sandspruit, the tunnel is at an elevation of 1510 m and the cone of dewatering stretched for
about 0.5 km on either side of the tunnel.
Both reports (Iliso Consulting 2010; 2011) made mention of the inconsistency in pattern pertaining to
the impacts of the tunnel on water levels in the piezometers. In some instances, there were no
significant impacts reported during construction while in other cases the tunnel had significant
impacts. This can be elucidated with aquifer characteristics.

- 58 -
Figure 3-9 Cross-Sectional schematic depicting the relationship between groundwater levels and vertical tunnel alignment (Arup, 2009).
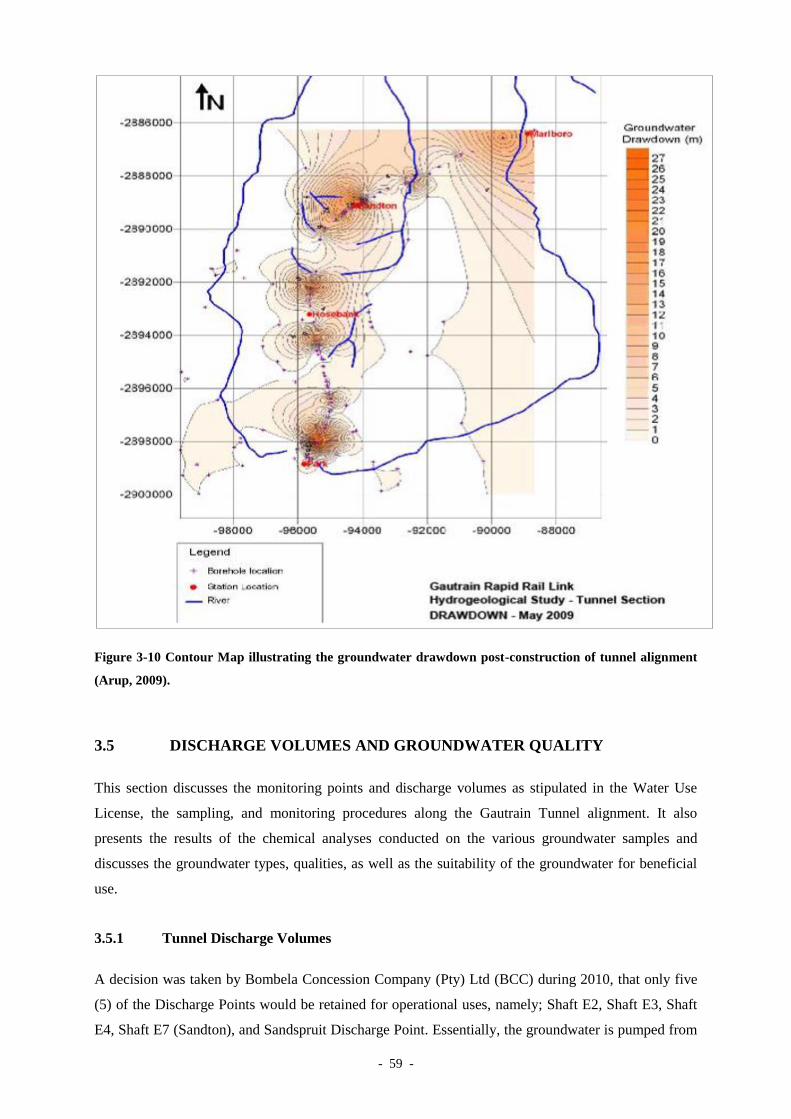
- 59 -
Figure 3-10 Contour Map illustrating the groundwater drawdown post-construction of tunnel alignment
(Arup, 2009).
3.5 DISCHARGE VOLUMES AND GROUNDWATER QUALITY
This section discusses the monitoring points and discharge volumes as stipulated in the Water Use
License, the sampling, and monitoring procedures along the Gautrain Tunnel alignment. It also
presents the results of the chemical analyses conducted on the various groundwater samples and
discusses the groundwater types, qualities, as well as the suitability of the groundwater for beneficial
use.
3.5.1 Tunnel Discharge Volumes
A decision was taken by Bombela Concession Company (Pty) Ltd (BCC) during 2010, that only five
(5) of the Discharge Points would be retained for operational uses, namely; Shaft E2, Shaft E3, Shaft
E4, Shaft E7 (Sandton), and Sandspruit Discharge Point. Essentially, the groundwater is pumped from

- 60 -
the Gautrain Tunnel System sections to the surface and released into the formal municipal stormwater
systems, and Sandspruit River to ensure safe train operations along the tunnel alignment. The
Integrated Water Use License (IWUL) that was issued by DWS on 1 December 2014 (License No:
03/A21C/CI/2658) clearly specified the tunnel water discharge volumes for the various water
Discharge Points.
The methodology used by DWS to allocate individual volumes for each Discharge Point was simply
dividing the overall discharge volume of 8500 m3/day (with a maximum of 10 000 m
3 on any given
day) by the number of Discharge Points (five (5) points). This implies that an average volume of 1700
m3/day is allocated for each Discharge Point as per the IWUL 2014. It is critical to mention that the
DWS did not calculate the individual values as each of the Discharge Points, which do not discharge
the same volumes. According to the Annual Environmental Status Report for 2016/2017, an
amendment application was submitted to the DWS in December 2015 to rectify the individual
discharge volumes of each Discharge Point. It was reported that BCC is still awaiting the issuance of
the amendment application.
The overall total volume of groundwater discharged from the tunnels to the surface is 8500 m3/day
(3 101 500 m3/year), and this is the volume approved on the IWUL for discharge (BCC, 2017). Figure
3-11 depicts the discharge volumes from July 2016 to April 2017 for the three (3) main Discharge
Points. Based on the graphic representation (Figure 5-1), the discharge at Shaft E2, which is located
between Rosebank and Part Station is exceeding the specified individual discharge volume stipulated
in the IWUL. Discharge volumes at Shafts E3 and E4 have not been measured due to the volumes that
have been continuously low.
Figure 3-11 Tunnel discharge volumes along the Gautrain Tunnel alignment (BCC, 2016).

- 61 -
3.5.2 Monitoring Network
The surface and groundwater monitoring for the Gautrain Tunnel is conducted on behalf of BCC by
Environamic Environmental Consultants (hereafter referred to as Environamic CC) and Greenworx
(Pty) Ltd in order to fulfil the requirements of the 2014 IWUL. Monitoring reports for the period of
January 2017 to July 2017 were obtained from Environamic CC and used in this study to further
quantify the water quality of the study area. The 2014 IWUL stipulates the requirement of a Water
Monitoring Program in order to ensure the Operations and Maintenance activities are managed in a
manner that does not pose detrimental impacts on the water resources. Based on the Groundwater
Monitoring reports received, Environamic CC performed water monitoring for the period of January
2017 to May 2017 and Greenworx (Pty) Ltd for the period June 2017 to July 2017. The below
monitoring points are both for groundwater points, and surface water discharges that are sampled,
analysed monthly, and reported on a quarterly basis as per the IWUL, Annexure III - Condition 2.6,
Section B 3.2.2, Annexure III - Condition 2.5:
Groundwater Monitoring Points - The groundwater Monitoring points along the Gautrain Tunnel
alignment are adapted from the Monitoring Report dated July 2017, and depicted in Table 3-3. The
monitoring points are as follows:
a. Tunnel Discharge Points, which consists of five discharge positions, namely; Shaft E2, Shaft
E3, Shaft E4, Shaft E7 (Sandton) and Sandspruit, and
b. Borehole Points, which are the Marlboro North Borehole 1 situated on the southern side of the
Marlboro Drive, Oxford North Borehole (Borehole 7) and Shaft E1, which is located at the
entrance of the emergency Shaft E1.
Table 3-3 Tunnel Discharge Points and monitoring boreholes along the Gautrain Tunnel alignment.
Tunnel
Discharge
Points and
Boreholes
Name/Description
Coordinates
Tunnel
Discharge
Points
Shaft E2 Discharge position S 260 10.455‟ E 280 03.106‟
Shaft E3 Discharge position S 260 9.844‟ E 280 02.855‟
Shaft E4 Discharge position S 260 09.317‟ E 280 02.775‟
Sandton E7 Discharge position S 260 06.531‟ E 280 03.373‟
Sandspruit Discharge position S 260 05.961‟ E 280 04.549‟
Borehole
Points
Marlboro BH 1 (Borehole on the southern side of
Marlboro Drive)
S 260 5.481‟ E 280 5.307‟
Oxford North BH 7 (Borehole at NE Corner of
Oxford and North Road)
S 250 57.137‟ E 280 82.843‟
Shaft E1 (Borehole at the entrance to the
Emergency Shaft E1)
S 260 11.006‟ E 280 2.875‟

- 62 -
Surface Water Monitoring Points - The surface water monitoring points along the Gautrain Tunnel
alignment are adapted from the Monitoring Report dated July 2017 and also depicted in Table 3-4.
The monitoring points are as follows:
a. Sandspruit Tunnel Discharge Points, which comprises of one point 100 m upstream and
downstream of the Sandspruit, and
b. Midrand Depot Points, which include one Northern and Southern attenuation ponds.
Table 3-4 Surface Monitoring Points along the Gautrain Tunnel alignment.
Tunnel Discharge Points&
Depot Points
Name/Description Coordinates
Sandspruit Tunnel Discharge
Points
100 m upstream of the Sandspruit Discharge
position
S 260 06.043‟ E 280 04.519
100 m downstream of the Sandspruit
Discharge position
S 260 05.872‟ E 280 04.508
Midrand Depot Points
Midrand Depot- Northern attenuation pond S 260 03.640‟ E 28011.914‟
Midrand Depot- Southern attenuation pond S 260 23.428‟ E 280 74.33‟
3.5.3 Observed Groundwater Quality
The groundwater chemistry data was requested and received (in the form of reports) through Bombela
Concession Company (BCC) from an Independent Consultant- Environamic CC that has been
contracted to conduct quarterly monitoring for BCC. It is important to note that it is indicated in the
Monitoring Reports (January 2017-July 2017) that no samples and levels were taken at borehole 3
(Rivonia Street- between Mushroom Farm Park and Sandton Station), and borehole 5 (Corner of 5th
and Rivonia Road) due to external construction work that was undertaken at the time of sampling.
Furthermore, there was no discharge at Shaft E3. The data (in the form of reports) dated January 2017
to July 2017 was prepared into Excel spreadsheets, and the data quality analysis was done to check
whether the data had any discrepancies. The results of Tunnel Discharge Points and boreholes are
contained in Appendix A. From Appendix A, a number of observations were made regarding the
groundwater quality:
a. The chemical analyses were compared to the IWUL Limits - Drinking Water Quality
Guidelines for domestic use (DWAF, 1996). These standards were reviewed as the water
discharged is not intended for domestic use and appropriate standards were used. There is no
mention of which alternative standards were opted for,
b. Near neutral values of pH (6.1-7.5) are observed in the boreholes and also in the tunnel
Discharge Points, and
- 63 -
c. The parameters that were analysed are all within the IWUL limits except for Iron and
Manganese in the following boreholes: Marlboro BH 1, Oxford North BH7 and Shaft E1. It is
confirmed from the Monitoring Reports that the sources of exceedances are unknown, and are
not emanating from the Gautrain activities since the depth of the boreholes is generally
shallower than that of the Gautrain alignment.
Hydrochemical diagrams are used to depict the absolute or relative abundance of anions and cations
whilst water quality indexes are used to depict the suitability of water for agricultural irrigation use.
The software, WISH (Windows Interpretation System for Hydrogeologist) was used to quantify the
data received, and plot the hydro-facies plots and water quality indexes such as Piper and Sodium
Absorption Rate (SAR). The Piper and Sodium Absorption Rate diagrams that were plotted will be
discussed in terms of what they each represent and the results interpreted respectively from each.
A Piper diagram was used to characterize the water types in a graphical manner and also distinguish
any specific water types in the study area. A Piper diagram typically consists of two triangles, one
showing the proportions of the cations and the other showing proportions of anions. Both triangles
have mg/l as units. The triangle representing the cation has 100% Calcium on the left corner and 100%
Magnesium at the top of the triangle whilst 100% Na+K lies at the furthest left-hand corner of the
triangle. The 100% HCO3 lies at the furthest left-hand corner of the anion triangle and 100% Cl at the
left-hand corner while 100% SO4 falls at the top-most corner of the anion triangle (Appelo and
Postma, 2005).
The Piper diagram for the groundwater samples is depicted in Figure 3-12. The water samples for
Shaft E2, Shaft E4, Sandspruit, and Oxford North shows groundwater that is of the Calcium-
Bicarbonate type, indicative of shallow, freshly recharged groundwater. However, Shafts E1 and E7
(Sandton) both plot at positions slightly different from the previous points. Groundwater samples from
Shaft E2, Shaft E4, Sandspruit, Oxford North and Sandton E7 have similar characteristics, except for
Shaft E1 that plot in a slightly different position. This slight displacement is associated with higher
relative concentrations of sodium and potassium.

- 64 -
Figure 3-12 Piper Diagram of groundwater samples along the Gautrain Tunnel alignment.
Sodium Absorption Rate (SAR) can be defined as the potential of irrigation water to influence sodic
conditions in the irrigation soil whereby the sodicity is the percentage of the soil cations exchange
capacity occupied by sodium (DWAF, 1996). SAR is calculated using concentrations of sodium,
magnesium, and calcium ions in the water. The SAR diagram is therefore utilized to determine the
suitability of water for potential irrigation use.
A SAR diagram is depicted in Figure 3-13 and classifies groundwater samples as C2S1. C2S1 water
exhibits moderate salinity ranging between 25 and 75 mS/m (C2-Medium salinity hazard) except for
Shaft E1 that is located in the C1 class and indicative of low salinity. This water is suitable for
irrigation, and will not constitute salinity problems that will affect the nutrients absorbed by plants.
Moreover, water with low sodium content can be utilized for irrigation due to low brackish danger.

- 65 -
Figure 3-13 Sodium Absorption Rate (SAR) Diagram of the groundwater samples along the Gautrain
Tunnel alignment.

- 66 -
CHAPTER 4: METHODOLOGY OF DATA COLLATION
This chapter details the site for the case study and procedures undertaken to collect data to conduct a
Pre-Feasibility Analysis for excess groundwater discharging from the Gautrain Tunnel. The data was
collected and collated to assist in conceptualizing the various possible scenarios for alternative uses of
groundwater emanating from the various Gautrain Tunnel Discharge Points.
4.1 DATA COLLECTION SITE
There is currently an estimated volume of approximately 8500 m3/day of groundwater ingressing into
the Gautrain Tunnel. This groundwater is dewatered and discharged to the surface through five
Discharge Points (Shafts E2, E3, E4, E7, and Sandspruit Discharge Point) as depicted in Figure 4-1.
The discharge at Shafts E3 and E4 is unknown as it is not measured due to continuously low discharge
rates, while, based on average discharge values between 2013-2017 inferred from the Annual
Environmental Status Reports, around 68% of the total groundwater is discharged from Shaft E2, 17%
from Shaft E7 (Sandton), and 15% from the Sandspruit Discharge Point (Figure 4-2 and Figure 4-3).
Of these points, only the Sandspruit point discharges directly into the Sandspruit River, and the
remainder discharges into the stormwater systems. The average discharge volumes per day for these
points were calculated as 4302.881 m3/day for Shaft E2, 1059.767 m
3/day for Shaft E7 (Sandton) and
921.442 m3/day for Sandspruit point (see Appendix B).
Figure 4-1 Gautrain Tunnel alignment route and tunnel ingress and water Discharge Points.

- 67 -
Figure 4-2 Sandspruit Discharge Point (BCC, 2017).
Figure 4-3 One hundred metres (100m) upstream and 100m downstream of the Sandspruit Discharge
Point (BCC, 2017).
4.2 DATA COLLECTION PROCEDURE
The alternative beneficial uses (in form of scenarios) of tunnel water discharging from the Gautrain
Tunnel will be informed by the hydrocensus that will be conducted around the discharge points to
identify the potential users in close proximity to the discharge points as well as the existing municipal
water supply infrastructure. Based on the hydrocensus information collected, theoretical calculations
for various scenarios will be performed in terms of the flow rates, pipeline diameters, friction losses,
and energy costs for pumping. This data will further be used to investigate the viability, cost, and
benefits associated with each alternative use before financial resources are allocated for development.
The methodology of data and information collection entails the following:
a. To conduct a hydrocensus within a 1 km radius of Shaft E2, E7 and the Sandspruit Discharge
Point to identify potential users of tunnel water based on i) proximity of the users and ii) the
presence of existing municipal water supply infrastructure in relation to the discharge points.
The hydrocensus information collected will be presented in the next chapter,
b. To use Google Earth satellite images based on the hydrocensus data collected, to determine
elevations and distances of the potential users in relation to the discharge points. The elevation
and distance information is important to deduce whether it is feasible to pump water from the

- 68 -
source to the users. The schematic diagrams developed with the information collected will be
presented in the next chapter.
c. Identify users who meet the criteria of proximity to the source and existing infrastructure. The
users that were identified are Bombela Concession Company, Rand Water, Johannesburg
Water, St. John‟s College, Roedean Senior School, and Johannesburg City Parks (Innesfree
Park and the Wilds Nature Reserve),
d. Arrange appointments to conduct personal engagements with the identified users in the form
of interviews and questionnaires. The interview and questionnaires are attached in Appendix
C and the below is information that was requested in the forms. An example of the questions
or information requested is inferred from St. John‟s College and includes the following:
The total number of learners in the school,
Source of water used by the school i.e municipal water supply,
Sports facilities on school premises i.e. soccer pitch,
If there are facilities present, find out whether the facilities are irrigated and how often,
The sources and volumes of water used to irrigate the different facilities,
If the source of irrigation is boreholes, determine the volumes of water and whether
these volumes are utilized only for irrigation purposes or any other,
Determine whether there are any metering devices in place for the different sources of
water supply,
Find out whether there is a boarding school on the school premises and determine how
much water is used in the boarding school and for which uses,
Request a municipal water bill, in the case the information on volumes is not readily
available. The Technical Guidelines for Human Settlements (CSIR, 2010) were also
consulted to make use of suitable Engineering principles and standards,
Determine from the municipal bill the current amount of money used for water supply
on a monthly basis,
Based on all the information collated, specifically the volumes and billing amounts,
determine whether the current source(s) of supply is sufficient and whether it is feasible
to consider alternative augmentation sources i.e. water from the discharging points.
Detailed calculations for each scenario will be performed in the next chapter,
The costs of the scenarios will be solely based on the preliminary theoretical
calculations, and quotations obtained from a Professional Service Provider (Xylem
Water Solutions). The following factors were not considered for the purpose of costing:

- 69 -
i) Existing infrastructure and servitudes such as streets, concrete pavements, buildings,
pipe and sewer networks, stormwater pipes, and channels, which are often a limitation
to construction costs, and ii) Population growth rate and Operation and Maintenance
costs,
e. In order to calculate the pumping cost, various factors such as the head losses, friction losses,
roughness of the internal surfaces of the pipe, changes in the elevation within the system, and
the length of the pipeline will be considered. All equations that will be used for calculations in
chapter 5 are after Featherstone and Nalluri (2016), Civil Engineering Hydraulics,
f. An assumption is also made that the Electricity supply to be used for pumping the water from
the source to the user is via the Municipal Power Distribution Network. The cost of the
municipal water supply and electricity for pumping groundwater from various shafts were
calculated with the use of Microsoft Excel (see Appendix D) using the 2018/19 residential
tariffs7 for the CoJ and contained in Table 4-1 and Table 4-2 below,
Table 4-1 Water Tariffs (2018/19) for the City of Johannesburg.
Kl/month Tariff for single phase Volume/month Total/month Sum of Total/month (0-50 kl)
0 to 6 R8.28 6 R49.68 R49.68
6 to 10 R8.79 4 R35.16 R84.84
10 to 15 R15.00 5 R75.00 R159.84
15 to 20 R21.83 5 R109.15 R268.99
20 to 30 R29.98 10 R299.80 R568.79
30 to 40 R33.22 10 R332.20 R901.008
40 to 50 R42.429 10 R424.20 R1325.19
Above 50 R45.19 - R38 411.50 -
Table 4-2 Electricity Tariffs (2018/19) for the City of Johannesburg.
kWh c/kWh kWh Total R/kWh
<500 118.58 500 R592.90 R1.1858
501<1000 136.08 500 R680.40 -
1001<2000 146.12 1000 R1461.20 -
2001<3000 154.17 1000 R1541.70 -
>3001 161.73 - - R1.6173
- - - R4276.20 -
7 The 2018/19 residential tariffs for water supply and electricity were used for this chapter since the 2019/2020 tariffs were
not yet published at the time this thesis was undertaken and finalised. 8 Water tariff rate of R901.00 which will be used in Scenario 4 in the next chapter to calculate the cost of water per
household per month for the first 40 kl. 9 Water tariff rate of R42.42 which will be used in Scenario 4 in the next chapter to calculate the cost of water per household
per month for the remaining 3 kl.

- 70 -
g. A detailed Cost-Benefit Analysis (CBA) will be presented in the next chapter to assess the
value, plausibility, costs, and benefits involved with the development of each scenario. The
CBA will also assist in identifying scenarios that are economically feasible with return on
investments.
4.3 CALCULATIONS AND COST-BENEFIT ANALYSIS APPROACH
Prior to calculating the pumping cost, various factors such as the head losses, friction losses, the
roughness of the internal surfaces of the pipe, changes in the elevation within the system, and the
length of the pipeline will be considered. Furthermore, pumping efficiency will be assumed to be 90%.
The detailed calculations will be performed in the next chapter using all the data collated.
A detailed Cost-Benefit Analysis (CBA) will also be presented in the next chapter to assess the value,
plausibility, costs, and benefits involved with the development of each scenario. The CBA will assist
in identifying scenarios that are economically feasible with return on investments. The CBA will also
consider the water quality discharged from the three main shafts (Shafts E2, E7, and Sandspruit
Discharge Point) in order to determine the necessary treatment options and facilities required. The
groundwater quality of Shaft E2 is ideal to good with no exceedance of limits stipulated in the
Integrated Water Use License that was issued to Bombela Concession Company (BCC) in 2014.
Lastly, legal requirements for the use of tunnel water will also be assessed against the National Water
Act, Water Services, and the Municipal By-laws.

- 71 -
CHAPTER 5: PRE-FEASIBILITY ANALYSIS
This chapter provides an account of a Pre-Feasibility Analysis based solely on desktop information
collected in the previous chapter. This chapter further explores and conceptualizes the various possible
scenarios for alternative uses of excess groundwater emanating from the various Gautrain Tunnel
Discharge Points, and proposes beneficial uses thereof. Furthermore, it assesses the value, plausibility,
costs, and benefits involved with the development of each scenario.
5.1 RATIONAL OF ANALYSIS
Water is a scarce resource for the majority of Metropolitan Municipalities (MMs) in the country.
The City of Johannesburg (CoJ) imports water from the Tugela River and Lesotho, which are located
far away. The recent (2017/2018) water restrictions, intermittent municipal water supply, and
prohibition of municipal water for outdoor purposes such as irrigation and garden watering during
prolonged periods of drought informed the consideration to expand the available urban groundwater
resources in the CoJ for alternative uses (i.e. beneficial use of groundwater discharging from the
tunnel). The groundwater will be used to supplement the existing municipal water supply systems to
maximize the benefits and improve the water supply security.
5.2 LIMITATIONS AND ASSUMPTIONS OF THE ANALYSIS
The Pre-Feasibility Analysis presents the viability of implementing alternative uses of groundwater
emanating from the Gautrain Tunnel Discharge Points in broad terms. The analysis is limited to
fieldwork that comprised of a limited hydrocensus, the use of Google Earth satellite images, and
personal engagements with Technical Managers of the parties or stakeholders concerned. In each
scenario comprising of the limited information available, the Technical Guidelines for Human
Settlements (CSIR, 2010) were consulted to make use of suitable Engineering principles and
standards.
The calculations presented in this analysis are theoretical and assumed the conventional design
standards used in the Engineering fraternity. Scenario 5 involves a start-up of a bottling company with
a start-up capital in place and further capital investment assumptions are made under Section 5.3.5.
The costs of the scenarios are solely based on the preliminary theoretical calculations, and quotations
obtained from a Professional Service Provider (Xylem Water Solutions). Once the recommendations
of the Pre-Feasibility Analysis are accepted by the various stakeholders, a qualified Civil Engineer and
Geohydrologist must be appointed for the detailed Feasibility studies and costing.

- 72 -
5.3 DETAILED SCENARIO CALCULATIONS
Based on the hydrocensus information collected in the previous chapter, theoretical calculations for all
scenarios will be performed in terms of the flow rates, pipeline diameters, friction losses, and energy
costs for pumping. Scenario 1 to 4 follows similar calculation steps whilst Scenario 5 is different in the
sense that it is a business opportunity. Therefore, the detailed calculations in this thesis are provided
for only Scenarios 1 and 5 whilst the calculations for Scenarios 2-4 are summarised in Tables 5-3, 5-5,
and 5-6. Scenarios 2-4 are presented in detail with accompanying schematic diagrams in the attached
Appendix E. The cost of infrastructure for the development of each scenario is also provided. Lastly,
an indication is given on whether the proposed scenarios will be economically feasible with return on
investments.
Following a limited hydrocensus conducted in the vicinity of the Discharge Points, it was deduced that
the existing municipal water supply infrastructure is in close proximity to Shaft E2, Shaft E7, and the
Sandspruit Discharge Point. The following beneficial uses were identified pertaining to the available
water emanating from Shaft E2, Shaft E7, and the Sandspruit Discharge Point:
a. Scenario 1: Decentralised Supply to local communities or schools to reduce pressure upon the
municipal water supply system i.e. irrigation of sports fields, garden watering,
b. Scenario 2: Aquatic and Groundwater-dependent Ecosystem Augmentation,
c. Scenario 3: In-House use i.e. water to be used for toilet flushing at the stations,
d. Scenario 4: Augmenting Existing Bulk Water Systems i.e. water can be augmented for
drought alleviation, and
e. Scenario 5: Bottling of the Water to Generate Revenue.
5.3.1 Scenario 1: Decentralized Supply
A number of studies on decentralized supply have been conducted by various authors. Jacob et al.
(2011) and Wright (2013) revealed that using groundwater for outdoor use, such as garden irrigation
instead of potable water, reduces the water demand by up to 50%. In instances where there are
intensive industrial activities located within the MMs, the use of groundwater resources may be more
cost-effective than the use of municipal supply. Decentralized groundwater use has the following
benefits summarised after Foster and Tyson (2015): improves access, and reduces cost; highly
appropriate for non-quality sensitive users i.e. garden irrigation, laundry, cleaning, cooling systems,
etc; and recovers major water leakages and reduces pressure on municipal water supply.

- 73 -
St. John‟s College and Roedean Senior School are two (2) schools considered due to their proximity to
Shaft E2. Both these schools are situated in Houghton and Parktown in Johannesburg respectively.
The College is located approximately 600 m south-west of Shaft E2 whilst Roedean is about 800 m
south-east of Shaft E2. The elevation across the study area varies from approximately 1480 meters
above mean sea level (mamsl) to 1726 mamsl between Shaft E2, and the St. John‟s College as well as
1710 and 1740 mamsl between Shaft E2 and Roedean. The schematic illustration contained in Figure
5-1 below is based on information such as elevation and distances in relation to the Shaft E2 derived
from Google Earth satellite images.
Figure 5-1 Schematic diagram of St. John’s College in relation to the Shaft E2.
A hydrocensus was conducted in the vicinity of the College and Roedean and only St. John‟s College
provided additional information. There are currently a total of 1400 pupils at the College and
municipal water supply is used mainly for domestic purposes. Furthermore, the College has two (2)
boreholes that are mainly used for the irrigation of sports fields. Groundwater from these boreholes is
pumped and routed to storage facilities (two Jojo tanks) where it is temporarily stored prior to use. The
volumes of the boreholes are variable and are not metered. The College has the following sports
facilities: three (3) rugby fields, one (1) hockey pitch (astroturf), three (3) cricket pitches, five (5)
tennis courts, a gym, squash courts, indoor bowling, and one (1) Olympic size swimming pool.
The municipal bill was requested from the College and it is inferred from the billing period for
February 2019 that a total of 900 kl of municipal water is used on a monthly basis. It is calculated
using Microsoft Excel and the 2018/19 residential tariffs for the CoJ contained in Table 4-1 of the

- 74 -
previous chapter, that the College is currently spending approximately R477 000.00 per annum for
municipal water supply. Table 5-1 is the calculated results extracted from an Excel Spreadsheet.
Table 5-1 Cost of the current municipal water supply per annum for St. John’s College.
St. John’s College
Kl/month Tariff for single phase Volume/month Total/month
0 to 6 R 8.28 6 R49.68
6 to 10 R 8.79 4 R35.16
10 to 15 R 15.00 5 R75.00
15 to 20 R 21.83 5 R109.15
20 to 30 R 29.98 10 R299.80
30 to 40 R 33.22 10 R332.20
40 to 50 R 42.42 10 R424.20
Above 50 R 45.19 850 R38 411.50
- - 900 kl R39 736.69
- - - R476 840.28
- - - R477 000.00
There is currently a groundwater volume of 4300 m3/day that is available for use from Shaft E2. This
scenario will investigate the feasibility to supply the College with 900 kl/month from Shaft E2.
Flow Rate:
The flow rate ( ) is calculated in m3/s where conversion of 900 kl to 900 m
3 applies. Thus, Water
Usage was calculated using Equation 1 below as:
(1)
The usage of water was calculated using Equation 1 as 30 m3/day, and since this volume was based on
a full day, it was assumed that the pumping of groundwater from Shaft E2 to St. John‟s College would
be for the duration of 12 hours per day. Therefore, the flow rate( ) over this duration is calculated as
0.7 l/s using Equation 2 below.
(2)

- 75 -
Pipeline Diameter:
Since the maximum Velocity (V) in the pipeline should not exceed about 2.0 m/s, which is according
to the Guidelines for Human Settlement and Design, the pipeline diameter was calculated using
Equation 3.1 and 3.2 below as:
(3.1)
Since Area ( was calculated, the diameter of the pipeline was calculated using Equation 3.2 as:
(3.2)
Substituting Diameter (D) and making it the subject of Equation: (3.3)
√
√
The diameter of the pipeline was calculated as 21 mm but the smallest pipe diameter on the market is
25 mm. Therefore, a 25 mm diameter pipeline was considered for the scenario. (Note the total cost
inferred from the quotation presented in Table 5-8 considered a 50 mm HDPE pipeline and 600m in
length correlates to the above-calculated diameter).
Friction Losses:
The Darcy-Weisbach Equation (Equation 4) is used to determine the head losses based on the
roughness of the internal surface of the pipe, the length of the pipeline, flow velocity, and pipe
diameter. This Equation is given as:

- 76 -
(
)
(4)
Where represents the head loss (m), f is the friction factor (see Appendix F for calculations of
friction factor for all Scenarios), L is the length of the pipeline (m), V is the flow velocity (m/s), D is
the pipe diameter, and is the acceleration due to gravity (9.81 m/s2). Since the Velocity (V) of 2 m/s
is based on the Guidelines for Human Settlement and Design, the true flow velocity was calculated
using a combination of Equation 3.1 and 3.2 as:
Thus, using the true flow velocity calculated, friction losses ( ) were calculated with Equation 4
below as:
Therefore, the total pumping head required to pump groundwater to St. John‟s College is the sum
of the static head, and the friction losses as per the below Equation 5:
(5)
Where is the static head deduced from elevation information on Google Earth and that was
previously calculated above using Equation 4:
Energy cost for Pumping:
The energy cost to pump the groundwater (taking into cognizance the factors such as head losses) was
calculated using Equation 6 below as:

- 77 -
(6)
Where is the density of water (1000kg/m3), is the power required for pumping in (Watts), is the
calculated total pumping head (m) and is the calculated flow rate of 0.0007 m3/s, is the
gravitational acceleration (9.81 m/s2) and is the pumping efficiency that is assumed to be 90 percent
(thus = 90% = 0.90). Power was therefore calculated as:
The power calculated above is required for 12 hours of pumping duty cycle per day (hours of pumping
per day). Consideration was given to the electricity cost of R1.1858 kWh (this tariff considered due to
electricity consumption of less than 500 kWh per month used by the College) contained in Table 4-2
of the previous chapter and derived from the 2018/19 residential tariffs (single phase) for the CoJ.
Therefore,
5.3.2 Scenario 2: Aquatic and Ecological Augmentation and Sustainability
Murray et al. (2006) defined the groundwater-dependent ecosystems and species as the ecological
structure and function of the ecosystems that depend on access to groundwater. Groundwater forms an
integral part of a variety of biodiversity. Bergkamp and Cross (2006) affirmed that groundwater
comprises of important nutrients to sustain invertebrate life. In essence, groundwater is a regulating
service that benefits ecosystem processes (MEA, 2005).
The Wilds Nature Reserve is 16 hectares in size and was considered for this scenario due to its
proximity to Shaft E2. No information10
was, however, received for the Innesfree Park that could
potentially receive water from the Sandspruit Discharge Point. The Wilds is a Municipal Nature
Reserve in the suburb of Houghton and is located approximately 260 m to the east of Shaft E2. The
elevation varies from 1431 to 1448 mamsl between Shaft E2 and The Wilds Nature Reserve
respectively. The schematic illustration is contained in Appendix E and was based on information
such as elevation and distances in relation to the Shaft E2 derived from Google Earth satellite images.
10 No analyses were performed for Innesfree Park due to no availability of information.

- 78 -
A hydrocensus was conducted and additional information was received from the Technical Manager.
Municipal water is the main source of water supply used for domestic purposes (i.e. drinking water)
and for water features shown in Figure 5-2 below. The water from the Municipal Supply System is
pumped into the main water feature, which is then fed into the other smaller water features
downgradient. Due to the current water restrictions, the Wilds currently utilize groundwater that is
pumped out from the Gautrain Tunnel water as shown in Figure 5-2.
Figure 5-2 Images illustrating the pumping of groundwater from the Gautrain Tunnel for the water
features.
The municipal bill for the billing period of January 2019 revealed that the Wilds consume about 1000
kl per month. It was calculated using Microsoft Excel and the 2018/19 residential tariffs for the CoJ
presented in Table 4-1 of the previous chapter, that the Wilds is currently spending approximately
R532 000.00 per annum for municipal water supply. Table 5-2 below is the calculated results
extracted from the Excel Spreadsheet.
Table 5-2 Cost of the current municipal water supply per annum for the Wilds Nature Reserve.
The Wilds Nature Reserve
Kl/month Tariff for single
phase
Volume/month Total/month
0 to 6 R 8.28 6 R49.68
6 to 10 R 8.79 4 R35.16
10 to 15 R 15.00 5 R75.00
15 to 20 R 21.83 5 R109.15
20 to 30 R 29.98 10 R299.80
30 to 40 R 33.22 10 R332.20
40 to 50 R 42.42 10 R424.20
Above 50 R 45.19 950 R42 930.50
- - 1000 kl R44 225.69
- - - R531 068.28
- - - R532 000.00

- 79 -
Since only 900 kl/month of the available water from Shaft E2 was used for the previous scenario, there
was still sufficient water to use for Scenario 2. Scenario 2 assessed the feasibility to supply the Wilds
with 1000 kl/month of water and similar calculations steps to Scenario 1 were followed for Scenario 2.
The calculations results for Scenario 2 are summarised in Table 5-3 below and also presented in detail
with accompanying schematic diagrams in the attached Appendix E.
Table 5-3 Calculation summary results for Scenario 2 for the Wild Nature Reserve.
Water consumption
based on 12
hours/day
(m3/
d)
Flow
rate
(l/s)
Pipeline
diameter
(mm)
True flow
velocity
(m/s)
Friction
losses Hf
(m)
Total
pumping
head HT
(m)
Cost of power
for pumping
(R/kWh/
annum)
33.33
0.8
22 25
1.6
16.28
33.28
R1486.60
5.3.3 Scenario 3: In-House Use11
Scenario 3 is likened to greywater re-use for toilet flushing even though the water from Shaft E7 to be
used in this instance is of good to ideal quality as opposed to greywater. Greywater re-use for toilet
flushing has been investigated by Ilemobade et al. (2012) as part of the Water Research Commission
Project and reported that greywater re-use was successfully implemented in Palma Beach hotel, Spain
and Florianopolis, Southern Brazil.
The Sandton Gautrain Station is located approximately 170 m south-west of Shaft E7. The proximity
of Shaft E2 makes it an ideal water source for supply to the station for toilet flushing in order to
replace/reduce the current municipal supply for this purpose. The billing information was not provided
after several requests were made to the Bombela Concession Company (BCC), which was a limitation
to the current scenario. The schematic illustration is presented in Appendix E and was based on
information such as elevation and distances in relation to the Shaft E2 derived from Google Earth
satellite images. No hydrocensus was conducted for this scenario; however, The Guidelines for
Human Settlement and Design were used to make the following informed Engineering standards
assumptions: (i) the water consumption of the station for planning purposes is 400 liters per day for a
stand with an area of 100 m2
(Appendix G) and (ii) assuming that the station covers an area of 10 000
m2, the water requirement for the station is 40 m
3/day (1200 kl/month). In monetary terms, this volume
translated to R640 000.00 per annum for water calculated using Microsoft Excel and the 2018/19
residential tariffs for the CoJ contained in Table 4-1 of the previous chapter. Table 5-4 is the
calculated results extracted from the Excel Spreadsheet.
11 In-House use in the scenario refers to the use of groundwater discharged from Shaft E7 for toilet flushing at Sandton
Gautrain Station.

- 80 -
Table 5-4 Cost of the current municipal water supply per annum for Sandton Station.
Kl/month Tariff for single phase Volume/month Total/month
0 to 6 R 8.28 6 R49.68
6 to 10 R 8.79 4 R35.16
10 to 15 R 15.00 5 R75.00
15 to 20 R 21.83 5 R109.15
20 to 30 R 29.98 10 R299.80
30 to 40 R 33.22 10 R332.20
40 to 50 R 42.42 10 R424.20
Above 50 R 45.19 1150 R51 968.50
- - 1200 kl R53 293.69
- - - R639 524.28
- - - R640 000.00
Scenario 3 assessed the feasibility to supply Sandton Station with 1200 kl/month of water and similar
calculations steps to Scenario 1 and 2 were followed for Scenario 3. The calculations results for
Scenario 3 are summarised in Table 5-5 below and also presented in detail with accompanying
schematic diagrams in the attached Appendix E.
Table 5-5 Calculation summary results for Scenario 3 for Sandton Station.
Water consumption
based on 12
hours/day
(m3/
d)
Flow
rate
(l/s)
Pipeline
diameter
(mm)
True flow
velocity
(m/s)
Friction
losses Hf
(m)
Total
pumping
head HT
(m)
Cost of power
for pumping
(R/kWh/
annum)
40
0.93
24 25
1.86
15.24
23.24
R1086.00
5.3.4 Scenario 4: Augmenting Existing Bulk Water Systems
Two alternatives were considered for Scenario 4, namely; Augmenting Supply into the Rand Water
System and Augmenting Supply into the Johannesburg Water System. The two alternatives are aptly
described below:
Scenario 4(A): Augmenting Supply into the Rand Water System
Rand Water is one of the largest bulk water utilities in Africa and provides bulk potable water to
approximately 11 million people in Gauteng, Mpumalanga, the Free State, and North West. Rand
Water abstracts water from the Vaal River Catchment augmented by the Tugela-Vaal Scheme and the
Lesotho Highland Water Project respectively. The abstracted raw water is purified at two main Water
Treatment Works (WTWs) and supplied (sold) to the various Metropolitan Municipalities, Local
Municipalities, Mines and Industries.

- 81 -
Rand Water is in the process of undertaking several studies to secure additional water sources to
augment its water supply. It endeavours to expand its current scope of surface water abstraction and
treatment by maximizing all groundwater, return flows (re-use of treated wastewater) and ultimately
collate as well as strengthen the Gauteng Master Plan for (potable) Water Infrastructure Development.
Moreover, Rand Water seeks existing information and data resources through planned conferences to
explore interfaces and collaborations with academic institutions that have an interest. Rand Water is in
support of the current study (scenario) aimed at determining the possibility of augmenting their current
water supply with excess available ingress groundwater from the Gautrain Tunnel. The only challenge
with this alternative is that the nearest Rand Water pipeline is located about 5 km (direction not
disclosed by Rand Water) from Shaft E2 and this implies that significant water supply infrastructure
would be required to pump 4300 m3/day of groundwater from Shaft E2. This informed the researcher
to consider the second alternative below.
Scenario 4(B): Augmenting supply into the Johannesburg Water System
Johannesburg Water (JW) (Pty) Ltd is a municipal entity that supplies approximately 1.4 million
domestic, commercial and industrial customers. JW (Pty) Ltd also serves an estimated consumer base
of 5.1 million people with approximately 1574 Ml/day of potable water, procured from Rand Water
(the bulk supplier) through a distribution network of 11 896 km, 122 storage reservoirs and water
towers as well as 35 water pump stations. The advantage of the current alternative is that the nearest
Johannesburg Water pipeline is located approximately 600 m from Shaft E2 (direction not disclosed
by JW (Pty) Ltd). JW (Pty) Ltd was consulted and permission was granted to investigate the viability
of pumping 4300 m3/day of water from Shaft E2 into their nearest pipeline.
Based on the aforementioned two alternatives, namely; Scenario 4(A) and 4(B), the following
assumptions were applied to fully recognize the benefits of augmenting supply to the existing systems:
The development levels in the surrounding areas are considered to be high to very high. According to
Table 9.10 of the Guidelines for Human Settlement and Design (Appendix G), the typical daily
consumptions per capita per day for these development levels are approximately 250 and 450 l/c/d
respectively. For the purpose of Scenario 4(B), the average of 250 and 450 l/c/d was assumed, which
is 350 l/c/d. The average household size was assumed as four (4) people per household and the
calculated average monthly consumption is approximately 43 kl/month, which was calculated as
follows:

- 82 -
Therefore, a total of 3042 households can be supplied throughout the year with a total volume of
4300 m3/day of groundwater, which was calculated as follows:
12
Using the CoJ 2018/19 residential water tariffs inferred from Table 4-1 of the previous chapter, the
total cost of water used for 3042 households was calculated as:
From the above calculations, it is noted that if Rand Water pipelines were in favourable proximity to
Shaft E2, Rand Water would benefit and nearly make 100% profit from augmenting additional water
from Shaft E2 into its existing system (but a minimal raw water tariff would, however, be applicable).
However, due to the favourable proximity of Shaft E2 to the pipelines of Johannesburg Water System,
the researcher had to consider Scenario 4(B) for further calculations: Augmenting Supply into the
Johannesburg Water System.
Scenario 4(B) therefore assessed the feasibility augmenting supply to Johannesburg Water with
volume of 130 792 kl/month of water and similar calculations steps to Scenario 1, 2 and 3 were
followed for Scenario 4(B). The calculations results for Scenario 4(B) are summarised in Table 5-6
and presented in detail with accompanying schematic diagrams in the attached Appendix E.
12 The water tariff rates of R901.00 and R42.42 were used to calculate the cost of water per household per month for the first
40 kl and for the remaining 3 kl respectively. The tariff rates were calculated and inferred from Table 4-1 of the previous
chapter.

- 83 -
Table 5-6 Calculation summary results for Scenario 4 for Augmenting Supply to Johannesburg Water.
Water consumption
based on 18
hours/day
(m3/d)
Flow
rate
(l/s)
Pipeline
diameter
(mm)
True flow
velocity
(m/s)
Friction
losses Hf
(m)
Total
pumping
head HT
(m)
Total Cost of
power for
pumping
(R/kWh/
annum)
4300
66.40
206 225
1.67
31.08
81.08
R608 098.92
5.3.5 Scenario 5: Bottling of Water to Generate Revenue
The market growth for local bottled water has increased significantly over the past few years and
Figure 5-3 depicts the trends between 2001 to 2005. The Global consumption of bottled water is
reported to have doubled in the last decade with a share of 11.8% of the world market (Waterwheel,
2006). More than 50% of the bottled water consumed is purified water whilst the remaining 40% is
spring or mineral water. This demand for bottled water is associated with urbanization and an
increasing quest for convenience and health consciousness. The South African National Bottled Water
Association (SANBWA) has approximately a total of 80% bottled water sector members. The
association revealed that Gauteng and Cape Town are the two largest markets for natural bottled
water. South Africa‟s health and lifestyle industry have its largest footprint in Gauteng whilst tourists
have a direct and semi-seasonal impact on the sale of natural bottled water in Cape Town.
Figure 5-3 Growth rate in the bottled water market (Waterwheel, 2006).
Scenario Context:
In view of the markets showing a positive growth trend over the years and a predicted significant
growth in the future, Scenario 5 investigated the returns on investments on establishing a bottled water
company. This particular scenario was for the bottling of purified drinking water on a commercial
basis and primarily presented an opportunity for investment. The investment opportunity will

- 84 -
comprise of an establishment of a bottled water plant (preferably at Shaft E2) for providing purified
drinking water. The assumption made was that the initial phase of the business would commence with
bottles of 0.5 and 1.5 liters. Subsequent to the successful introduction of the new brand to the local
market, the business could expand to larger bottles. The Pre-Feasibility Analysis that was developed
for this scenario was based on a water purification plant with a capacity of 100 m3/month. The water to
be purified is to be sourced from Shaft E2 and entail treatment to meet the South African Standards for
Bottled Water. The water quality parameters that were analysed for Shaft E2 were compared against
the ‘South African National Standard (SANS) 241:2015’ and met all the relevant standards (see
Appendix A).
Investment Assumptions:
Investment is the first step of any successful business and the following are the key capital investment
assumptions and associated costs for this scenario (see Table 5-7):
a. Pre-Feasibility to be developed for this scenario was based on a water purification plant with a
capacity of 100 m3/month (equivalent 1 200 000 litres per annum), which is operational for
240 days in a year (5 days x 4 weeks x 12 months) and 8 hours per day,
b. Pricing to be in line with the current market prices of the different local brands assuming that
the price for 0.5 L and 1.5 L bottles would be R5.00 and R10.00 respectively. The 0.5 and 1.5
water bottles were divided into a ratio of 20:80 percent in order to calculate the revenue as
contained in Table 5-7,
c. The water purification plant would be installed in close proximity to the source (Shaft E2),
and therefore no significant water supply infrastructure is required. The only cost involved
would be an assumed R80 000.00 labour cost for the plant layout,
d. It was assumed that the land requirements for the finished product were approved. Moreover,
200 m2
of land would be purchased at the price of R1 000 000.00 for development.
Construction cost for development (building and storage facility) was assumed to be an
additional R1 000 000.00,
e. Human resources are a very important aspect of any business and it was assumed that a total
of R1 398 000.00 per annum (Cost to Company - CTC) would be used to pay the Supervisor
(R30 000.00), Plant Operator (R18 000.00) Driver (R15 000.00), Sales Representative
(R13 500.00), Washer and Filler (R10 000.00), and Loader (R10 000.00),
f. Furniture and equipment costs were also considered and the purchasing thereof was assumed
to be R250 000.00, which would include office furniture, computers, and printers, and,
g. Two company vehicles (preferably light delivery vehicles) would also be required and it was
assumed that these vehicles would be purchased at a cash price of R100 000.00 each (criteria

- 85 -
used: www.carfind.co.za website and searched light delivery vehicles, < 5 years and <
60 000 km).
Proposed Status of Business and Process Flow:
A Sole Proprietorship, Partnership or Company are the three main business forms that were suitable
for this scenario. The selection of the business form would totally depend on the entrepreneur willing
to invest in this opportunity. The feasibility of this scenario was based on a Private Company and the
first step of the business process would be to set up a water purification plant based on the analysis of
the water from Shaft E2. The chemical analysis of the water would inform the specifications of the
purification plant to be set up. The process of purifying water would consist of collecting abstracted
groundwater from Shaft E2, primary filtration, chlorination, reverse osmosis, ultraviolet treatment,
washing, filling and capping. A simple process flow diagram illustrating the various components of a
water purification plant is depicted in Figure 5-4.
Table 5-7 Summary of Assumed Business Investment Costs and Revenue.
Assumed Capital Expenditure and Costs
Investment Cost
Land Acquisition cost R1 000 000.00
Construction cost R1 000 000.00
Furniture and Equipment R250 000.00
Company Vehicles (2) R1 000 000.00
Sub-Total Cost R3 250 000.00
Human Resources
Description Cost
1 Supervisor @ R30 000.00/month (CTC) R360 000.00
1 Plant Operator @ R18 000.00/month (CTC) R216 000.00
1 Driver @ R15 000.00/month (CTC) R180 000.00
1 Sales Representative @ R13 500.00/month (CTC) R162 000.00
1 Filler and 1 Filler @ R10 000.00/month (CTC) R240 000.00
2 x Loaders @ R10 000.00/month R240 000.00
Sub-Total Cost R1 398 000.00
Total Expenses in Year 1 R4 648 000.00
Revenue Assumptions
(Plant Capacity @ 5000 Litre/month @ 1 200 000.00 Litres/annum)
Using ratio of 0.5 Litres:1.5 Litres = (20:80)
240 000:960 000 (Bottles per annum)
Assumptions Projected Income per annum
240 000 Bottles @ R5.00 (0.5 L) R1 200 000.00
960 000 Bottles @ R10.00 (1.5 L) R9 600 000.00
Total Income for Year 1
R10 800 000.00

- 86 -
Figure 5-4 Simplified process flow diagram for a Water Purification Plant.
5.4 COST-BENEFIT ANALYSIS OF THE SCENARIOS
The projected cost of infrastructure was based on quotations received from the Professional Service
Provider (Xylem Water Solutions). The cost of water (R2.87 cents per m3) used to for each scenario is
derived from the DWS 2018/2019 tariffs as per the Raw Water Pricing Strategy for water use charges
in terms of Section 56(1) of the NWA, which was published in the relevant Government Gazette (see
Appendix H). The following factors were not considered for the purpose of costing:
a. Existing infrastructure and servitudes such as streets, concrete pavements, buildings, pipe and
sewer networks, stormwater pipes, and channels, which are often a limitation to construction
costs, and
b. Population growth rate and Operation and Maintenance costs.
Scenario 1 investigated the feasibility of using groundwater at the St. John‟s College from Shaft E2 in
order to reduce the reliance on municipal water supply. The College is currently using a volume of
900 kl/month of municipal water, which translates to R477 000 per annum. To implement this
alternative successfully, a booster pump with pressure control to pump groundwater from the shaft to
the College was recommended. At the College, the water would be collected in a 15000L tank. From
the tank, there would be a final booster pump pumping through cartridge filters and an Ultra Violet
(UV) unit in series and pressurize the main line for usage. The estimated total cost for the development
of the scheme was calculated to R1 339 423.80 (Table 5-8). The capital investment would be
recovered within three (3) years with annual savings of approximately R400 000.00 per annum
thereafter.

- 87 -
Scenario 2 focused on The Wilds Nature Reserve, which uses municipal water to maintain water
features. The total water requirement at the Wilds is 1000 kl/month (which equates to a cost of
R532 000.00 per annum) and similarly to the previous Scenario 1, the viability of using groundwater
from Shaft E2 was investigated. In Scenario 2, a booster pump with pressure control to pump water to
the Wilds was recommended. At the Wilds, the water would be collected in a 15000L tank. From the
tank, a final booster pump would be installed pumping through cartridge filters and a UV unit in series
and pressurize the main line for usage. The estimated total cost for the development of the scheme was
R714 526.00 (Table 5-9). The capital investment would be recovered within less than 1.5 years with
annual savings of approximately R500 000.00 per annum thereafter.
Scenario 3 investigated the potential of using groundwater from Shaft E7 to reduce a volume of 1200
kl/month (R640 000 per annum in monetary terms) of municipal water supply that is currently used for
toilet flushing at Sandton Station. In this application, a booster pump with pressure control to pump
water from Shaft E7 to the station was proposed. At the station, the water would be collected in a
15000L tank. From the tank, there would be a final booster pump pumping through cartridge filters
and a UV unit in series and pressurize the main line for usage. The estimated cost of the scheme for
the scenario was R666 014.00 (Table 5-10) and would be recovered with one (1) year of investment
with about 96 % annual savings thereafter.
Two alternatives were considered for Scenario 4, namely; Scenario 4(A) - Augmenting Supply into
the Rand Water System and Scenario 4(B) - Augmenting Supply into the Johannesburg Water
System. The latter (Scenario 4B) was considered for further analysis and calculations due to the
favourable proximity of Shaft E2 to the pipelines of the Johannesburg Water System. Scenario 4(B)
assessed the plausibility of pumping a total of 4300 m3/day of groundwater from Shaft E2 into the
Johannesburg Water‟s pipeline network for augmentation. In this application, a booster pump with
pressure control to pump a volume of 130 792 kl/month of water from Shaft E2 through cartridge
filters and a UV unit in series directly into the pipeline network was proposed. The booster pump
would be fitted with an on-board Variable Speed Drive (VSD) to maintain constant pressure.
Assuming that one household comprising of four (4) people use 43 kl of water per month according to
the Guidelines for Human Settlement and Design, a total of 3042 households could benefit from this
water. The estimated total cost for the scheme was R5 419 933.00 (Table 5-11). The capital
investment would be recovered within 1 year of investment with about 95% annual savings and 5%
being allocated to minor maintenance costs. The benefit of the scenario is to strengthen the Gauteng
Master Plan for Potable Water Infrastructure Development.
Scenario 5 is essentially a business opportunity whereby the production of purified bottled water on a
commercial basis with a return of investments was investigated. The cost of the application was based

- 88 -
on a water purification plant with a capacity of 1200 m3/year and various financial assumptions were
made to determine the projected revenue. The investment, infrastructure and human resources were
calculated at a value of R8 440 244.00 for the first year of operation with projected revenue of
R10 800 000.00 (Table 5-12) to be made within year 1 of operating. This implies that during the first
year a profit of R2 359 756.00 is expected. In year 2, the business would make a net profit of
approximately R9 500 000.00 (calculated as total profit less human resources cost and cost of water)
and onwards.
Table 5-8 Total Estimated Costs for Scenario 1.
Scenario 1: Decentralised Supply Item Description Quantity Unit Cost (Rs.) Total Cost (Rs.)
Cost of 900 kl/month of water (BCC to
sell/pass/provide water to St. John‟s
College)
10 800 m3/annum 10 800 m3/annum @ 2.87
cents/m3
R30 996.00
Cost of electricity calculated as per CoJ
tariffs
0.6106 KW @ assumed
12 hours R1.1858 kWh
R3127.80 R3127.80
GRRSF 3HM13S011M, 1.1KW, single-
phase booster pump with pressure control
and foot valve
1 R 15 500.00 R15 500.00
700m x 50mm class 10 HDPE pipe with
fittings and valves
1 R 30 000.00 R30 000.00
15000L Jojo tank, Cartridge filter, and
UV unit
1 R 56 000.00 R56 000.00
Booster pump
1 R 3800.00 R3800.00
Civil construction works
- R1 200 000.00 R1 200 000.00
Total Cost of Scheme (Excl. VAT)
-
-
R1 339 423.80
Table 5-9 Total Estimated Costs for Scenario 2.
Scenario 2: Aquatic and Groundwater-dependent Ecosystem Augmentation Item Description Quantity Unit Cost (Rs.) Total Cost (Rs.)
Cost of 1000 kl/month of water (BCC to
sell/pass/provide water to the Wilds)
12 000 m3/annum 12 000m3/annum@ 2.87
cents/m3
R34 440.00
Cost of electricity calculated as per the CoJ
tariffs
0.2902 KW @ assumed
12 hours R1.1858 kWh
R1486.60 R1486.60
GRRSF BGM7, 0.75KW, single-phase
booster pump with pressure control and foot
valve
1 R3800.00 R3800.00
300m x 50mm class 10 HDPE pipe with
fittings and valves
1 R15 000.00 R15 000.00
15000L Jojo tank, Cartridge filter, and UV
unit
1 R56 000.00 R56 000.00
Booster Pump
1 R3800.00 R3800.00
Total Cost of Scheme (Excl. VAT
-
-
R714 526.00

- 89 -
Table 5-10 Total Estimated Costs for Scenario 3.
Scenario 3: In-House Use13
Item Description Quantity Unit Cost (Rs.) Total Cost (Rs.)
Cost of 1200 kl/month of water (BCC to
sell/pass/provide water to Sandton
Station)
14 400 m3/annum 14 400 m3/annum @
2.87 cents/m3
R41 328.00
Cost of electricity calculated as per the
CoJ tariffs
0.212 KW @ assumed
12 hours R1.1858 kWh
R1086.00 R1086.00
GRRSF BGM7, 0.75KW, single-phase
booster pump with pressure control and
foot valve
1 R3800.00 R3800.00
200m x 50mm class 10 HDPE pipe with
fittings and valves
1 R10 000.00 R10 000.00
15000L Jojo tank, Cartridge filter, and
UV unit
1 R56 000.00 R56 000.00
Booster Pump
1 R 3800.00 R3800.00
Total Cost of Scheme (Excl. VAT)
-
-
R666 014.00
Table 5-11 Total Estimated Costs for Scenario 4.
Scenario 4(B): Augmenting Supply into the Johannesburg Water System14
Item Description Quantity Unit Cost (Rs.) Total Cost (Rs.)
Cost of 130 793 kl/month of water (BCC
to sell/pass/provide water to JHB Water)
1 569 516 m3/annum 1 569 516 m3/annum
@ 2.87 cents/m3 R4 504 510.92
Cost of electricity calculated as per the
CoJ tariffs
58.7 KW @ assumed
18 hours R1.1858 kWh
R608 098.92 R608 098.92
22SV08F110T vertical multistage pump
fitted with hydrovar VSD controller and
foot valve
1 R76 324.00 R76 324.00
600m x 50mm class 10 HDPE pipe with
fittings and valves
1 R26 000.00 R26 000.00
Cartridge filter and UV unit
1 R205 000.00 R205 000.00
Total Cost of Scheme (Excl. VAT)
-
-
R5 419 933.00
13 In-House use refers to the use of groundwater discharged from Shaft E7 for toilet flushing at Sandton Gautrain Station. 14 Scenario 4(B) was the chosen alternative due to the close proximity of the pipelines to the source (Shaft E2) as opposed to
Scenario 4(A) with the location of the pipelines approximately 5km from the source – Scenario 4(A) would require
significant water supply infrastructure.

- 90 -
Table 5-12 Total Estimated Costs for Scenario 5.
Scenario 5: Bottling of the Water to Generate Revenue
Item Description Quantity Unit Cost (Rs.) Total Cost (Rs.)
Cost of 1200 kl/month of water (BCC to
sell/pass/provide water to Sandton Station
1200m3/annum 1200 m3/annum @ 2.87
cents/m3
R3444.00
Reverse Osmosis Purification Plant
including ozonation unit in the plant
1 R1 500 000.00 R1 500 000.00
Cartridge Filter and UltraViolet unit
1 R205 000.00 R205 000.00
Booster Pump
1 R3800.00 R3800.00
Washing, Filling & Capping unit
1 R2 000 000.00 R2 000 000.00
Plant Layout
1 R80 000.00 R80 000.00
Total Cost of Plant (Excl. VAT) - - R3 792 244.00
Total Expenses (Year 1): (From Table 6-9)
Investment Total Cost (Once-off)
-
-
R3 250 000.00
Human Resource Total Cost
-
-
R1 398 000.00
Grand Total of Scenario 5
-
-
R 8 440 244.00
5.5 OVERARCHING LEGAL REQUIREMENTS
The Bombela Concession Company (BCC) hereafter referred to as the Licensee, is the current holder
of an Integrated Water Use License (IWUL) that was issued by the Department of Water and
Sanitation (DWS) on 1 December 2014 (License No: 03/A21C/CI/2658). The Licensee is authorized
under Section 2(f) and 21(j) water uses of the National Water Act (Act 36 of 1998) with the following
license conditions:
a. Remove a total of 3 101 500 m3
per annum of water found underground based on an average
of 8500 m3 per day from the tunnel with a maximum of 10 000 m
3 per day on any given day,
b. Dispose or discharge water found underground into the receiving environment at the following
locations shown in Table 5-13,
c. The License amendment is subject to all applicable procedural requirements and other
applicable provisions of the Act, as amended from time to time,
d. Continuously investigate and put into practice water-saving devices or apply techniques for re-
use of water in an endeavour to conserve water at all times on the entire Gautrain System, and

- 91 -
e. Identify activities and/or actions that can reduce usage and waste generation following the
DWS Hierarchy of preventing/no use, minimize, recycle, and treatment with disposal as the
last option.
Table 5-13 Discharge Points authorized to Bombela Concession Company (Pty) Ltd.
Discharge Point Coordinates on surface Average volume per day
(m3/day)
Shaft E2 S 260 10.455‟
E 280 03.106‟
1700
Shaft E3 S 260 9.844‟
E 280 02.855‟
1700
Shaft E4 S 260 09.317‟
E 280 02.775‟
1700
Shaft E7 (Sandton) S 260 06.531‟
E 280 03.373‟
1700
Sandspruit S 260 05.961‟
E 280 04.549‟
1700
Total
- 8500
Since the Licensee is authorized to dewater water from a resource and discharge it into the receiving
environment, the License conditions make provision for the investigation of water-saving practices.
Therefore, any other use of water other than supplied by the CoJ for potable or non-potable use
triggers the National Water Act (DWS’s Regulation No. R267 on Regulations Regarding the
Procedural Requirements for Water Use Licence Applications and Appeals), Water Services Act and
Municipal By-laws. The following are the legal requirements that must be met prior to use of the
water:
a. Amendment of the conditions of the existing 2014 Integrated Water Use License (IWUL)
License No: (03/A21C/CI/2658), authorizing BCC to dewater groundwater from various
shafts and discharge points for alternative uses (see Figure 5-5 for the process),
b. Permission from the WSA (CoJ) for connection of alternative supply to a distribution system,
c. The BCC who is the current holder of the IWUL must enter into a contractual agreement with
the CoJ (with the CoJ sub-contracting the responsibility to Rand Water) to allow the BCC to
sell/pass/provide water to the third party (i.e. private water bottling company) allowing the
company to operate as a Water Service Intermediary,
d. The contract will comprise of the following standards to be upheld by the private company:
Water quality specifications as per the Department of Health‟s Regulation GNR.718 of
28 July 2006 on „Regulations relating to all packaged water’. The regulation considers
the physical, chemical and microbiological requirements and limits of toxic substances.
Packaging, labelling, and transportation requirements are also included,
Water quality monitoring requirements,

- 92 -
Exemption of the CoJ from liability of sub-standard water provided leading to health
implications (the water must be free of all chemical and bacteriological substances,
which are hazardous to health).
e. Municipal By-laws would apply to the private company receiving the water, granting the
company permission for alternative use of water.
Figure 5-5 Schematic illustrating Water Use Licence Application Process.
5.6 COMPARATIVE ASSESSMENT OF SCENARIOS
This chapter identified five (5) potential uses for groundwater discharged from the three (3) main
Discharge Points of the Gautrain Tunnel, namely; Shaft E2, Shaft E7 (Sandton), and the Sandspruit
Discharge Point. A Pre-Feasibility Analysis was presented in the form of scenarios to demonstrate the
economic feasibility of using the groundwater that is currently disposed of for more beneficial use.
Each scenario entailed fieldwork that comprised of a limited hydrocensus, which further assisted in
performing theoretical calculations relating to flow rates, pipeline diameters, friction losses, and
energy costs for pumping. The calculations for Scenarios 1 to 4 were similar in terms of the relevant
equations and methodology. Scenario 5 was, however, different in the sense that it was a business
opportunity. The following are the key highlights from each scenario:
a. Scenario 1 investigated the feasibility of using a volume of 900 kl/month of groundwater
emanating from Shaft E2 for use at St. John‟s College. The estimated total cost for the
development of the scheme was calculated to R1 339 423.80 and the capital invested would be
recovered within three (3) years with annual savings of approximately R400 000.00 per
annum thereafter.

- 93 -
b. Scenario 2 investigated the feasibility of pumping a volume of 1000 kl/month of groundwater
from Shaft E2 for use at The Wilds Nature Reserve. The estimated total cost for the
development of the scheme was R714 526.00 whilst the capital investment would be
recovered within less than 1.5 years with annual savings of approximately R500 000.00 per
annum thereafter.
c. Scenario 3 investigated the potential of using 1200 kl/month of groundwater from Shaft E7 for
toilet flushing at Sandton Station. The estimated total cost of the scheme was calculated as
R666 014.00 and would be recovered with 1 year of investment with about 96% annual
savings thereafter.
d. Two alternatives were considered for Scenario 4, namely; Scenario 4(A) - Augmenting
Supply into the Rand Water System and Scenario 4(B) - Augmenting Supply into the
Johannesburg Water System. Scenario 4(B) was the preferred alternative given the proximity
of Shaft E2 to the pipelines of the JW System. Scenario 4(B) assessed the plausibility of
pumping a total of 4300 m3/day (130 792 kl/month) of groundwater from Shaft E2 into the JW
pipeline for augmentation. The estimated total cost for the development of the scheme was
calculated to R5 419 933.00. The capital investment would be recovered within one (1) year of
investment with about 95% annual savings and 5% being allocated to minor maintenance costs
in the following years.
e. Scenario 5 investigated the return on investments on the production of bottled water on a
commercial basis. The investment, infrastructure and human resources were calculated to a
total cost of R8 440 244.00 for the first year of operation with projected revenue of
R10 800 000.00 to be made within the first year of operation. This scenario demonstrated that
a net profit of approximately R9 500 000.00 (calculated as less human resources cost and cost
of water from Shaft E2) could be expected.
The Cost-Benefit Analysis (CBA) determined the costs and benefits associated with each scenario
prior to any financial allocation. The CBA revealed that all the proposed scenarios would be
economically feasible with return on investments. Each scenario has proven to offer innovative
technical solutions that would lead to sustainable alternative uses of urban groundwater. Therefore, it
is concluded that the groundwater emanating from the Gautrain Tunnel, which is currently discharge
and simply disposed of, can be used much more beneficially in the immediate surrounding
environment. Furthermore, it is also concluded that the beneficial use of this groundwater could result
in significant cost savings and benefits for both the water users as well as the Water Services Providers
such as JW (Pty) Ltd.
Further investigations and/or studies into other potential beneficial uses of this valuable groundwater
resource are strongly recommended given the significant volumes and depleting surface water resources
that need to be augmented by groundwater.

- 94 -
CHAPTER 6: DISCUSSIONS AND CONCLUSIONS
This chapter includes a synthesis of some of the main findings and a discussion on the results
obtained. The final concluding remarks of this chapter will relate to the objectives of this study.
This chapter also further provides the limitations as well as recommendations relating to gaps
identified in dealing with urban groundwater management in Metropolitan Municipalities. Lastly,
recommendations are also provided on future research and investigations based on the identified gaps.
6.1 DISCUSSIONS AND CONCLUSIONS
The study entailed the assessment of the status quo of urban groundwater use, management, and
planning in four MMs, with a focus on (i) current and future municipal water use requirements, and
current and future supply sources, existing groundwater development and management plans,
(ii) aquifer characteristics, and the urban influences on groundwater availability and quality and
(iii) the degree to which groundwater planning, management, and protection are mainstreamed within
municipal development planning and spatial planning (IDPs, SDFs), groundwater resource protection
mechanisms such as by-laws, and any existing Water Sensitive Design (WSD) measures of the
municipality.
Currently, the CTMM is using groundwater resources to varying degrees. However, groundwater
makes up an insignificant percentage of the total supply, reaching 6% in Tshwane. Additionally,
treated acid mine drainage (i.e. rebounding groundwater) from the gold mines is added to the Vaal
River System (VRS), making up to 3% of the current supply to the MMs in Gauteng. The CoJ and
eTMM plan on expanding or initiating groundwater resource development as part of future
reconciliation plans. Groundwater (from treated acid mine drainage) will also make up an increased
portion in Gauteng by 2020 (Engineering News, 2016). However, in some cases, groundwater has
received little attention, and the potential for groundwater resources to augment bulk supply is
insufficiently understood, especially in the EMM. In almost all cases, very little recognition is placed
on alternative uses of groundwater, for example, dispersed use for non-potable purposes, to alleviate
demand on the VRS and WSD measures, to promote the protection of groundwater resources for use
such as avoiding the hardening of surfaces in the recharge area, limiting infiltration. WSD measures
are promoted by some MMs such as the CTMM and CoJ, but the main focus is primarily on
stormwater management and the potential impact or benefit of WSD measures on groundwater is not
generally acknowledged. Water services or water supply by-laws provide another mechanism through
which the MMs can manage and protect groundwater resources. Most MMs incorporate the necessity
for owner or occupier to notify the MM of the existence of boreholes on the properties, and some
enable the MM to impose conditions on the use of private boreholes (CTMM); a measure that can
- 95 -
enable the MM to manage resource competition should this be a potential risk. At some MMs, some of
the aforementioned ways in which groundwater should be represented in the MMs key planning
processes are met. However, there is no single MM that achieves the ideal representation of
groundwater in all relevant planning documents.
The overarching deductions from the assessment are that groundwater use and management are poorly
integrated into the key planning processes at the MMs. In no cases is there a coherent plan for
groundwater development and management evident from the MMs and integrated across each of the
necessary and available planning documents.
The review of the international best practices highlighted that a number of increasing cities around the
world are beginning to implement alternative water management approaches such as wastewater re-
use, conjunctive use of surface water and groundwater, linking water management to spatial planning,
protection of groundwater through Environmental Acts. For example, in the Netherlands, no one has
ownership of groundwater resources and a license or permit is a prerequisite for any groundwater
extraction.
The status quo assessment and compendium of papers on best practices underpinned gaps that led to
the identification of excess ingress groundwater into the Gautrain Tunnel as a potential challenge that
can be solved. There is currently 8500 m3/day of groundwater that is dewatered from the Gautrain
Tunnel to maintain the dry conditions for mostly the drill and blast sections (excluding the TBM
sections). Ingress groundwater is discharged to the surface through five Discharge Points (Shafts E2,
E3, E4, E7, and Sandspruit Discharge Point). Around 68% of the total water is discharged from E2,
17% from Sandton Station and 15% from Sandspruit Discharge Point (BCC, 2017). Of these points,
only the Sandspruit Discharge Point discharges directly into the Sandspruit River and the remainder
discharges into the municipal stormwater systems. There were numerous gaps noted in the
groundwater level data for the pre-construction, construction and operational phases on the Gautrain
Project and inference was made from the studies conducted by Arup (2009) and Iliso Consulting
(2010; 2011). The findings from the studies confirmed that the surrounding groundwater flow is
assumed to still be in a transient state in response to the dewatering activities that lowered the regional
groundwater table and over time the total yields will continue to decrease until a steady state is
achieved (i.e. dewatering losses balance by capture). The final yields and time scales until a steady
state is achieved are unknown and may take several decades.
Based on the generally good to excellent groundwater quality results revealed by the hydrochemical
characterization (with a few instances of elevated salt concentrations requiring minimal treatment),
five (5) opportunities or alternative uses were identified regarding the use of groundwater discharged

- 96 -
and were presented in the form of scenarios to demonstrate the potential value and economic
feasibility of using groundwater that is currently disposed of for more beneficial use. The Cost-Benefit
Analysis was also investigated to determine the viability, costs, and benefits associated with each
scenario before financial allocation could be made.
Scenario 1 investigated the feasibility of using groundwater at the St. John‟s College from Shaft E2 to
reduce pressure upon municipal water supply. The College is currently using 900 kl/month of
municipal water, which translated to a cost of R477 000 per annum as per the 2018/2019 CoJ tariffs.
The estimated total cost for the development of the scheme was R1 339 423.80. The capital investment
could be recovered within three (3) years with annual savings of approximately R400 000.00 per
annum thereafter.
Scenario 2 focused on The Wilds Nature Reserve, which uses 1000 kl/month (which equated to a cost
of R532 000.00 per annum as per the CoJ 2018/2019 tariffs) municipal water to maintain water
features. Similarly to Scenario 1, the viability of using groundwater from Shaft E2 to reduce reliance
upon municipal supply was investigated. The estimated total cost for the development of the scheme
was calculated to R714 526.00 whilst the capital investment could be recovered within less than 1.5
years with annual savings of approximately R500 000.00 per annum thereafter.
Scenario 3 investigated the potential of using groundwater from Shaft E7 (Sandton) to reduce a
volume of 1200 kl/month (R640 000 per annum in monetary terms) of municipal water currently used
for toilet flushing at Sandton Station. The estimated total cost of the scheme for the scenario was
calculated as R666 014.00 and could be recovered with 1 year of investment with about 96% annual
savings thereafter.
Two alternatives were considered for Scenario 4, namely; Scenario 4(A) - Augmenting Supply into
the Rand Water System and Scenario 4(B) - Augmenting Supply into the Johannesburg Water
System. The latter (Scenario 4B) was considered for further analysis and detailed calculations due to
favourable proximity of Shaft E2 to the pipelines of Johannesburg Water System. Scenario 4(B)
assessed the plausibility of pumping a total of 4300 m3/day (130 792 kl/month) of groundwater from
Shaft E2 into the Johannesburg Water pipeline for augmentation. Assuming that one household with a
size of four (4) people uses a volume of 43 kl of water per month according to the Guidelines for
Human Settlement and Design, a total of 3042 households could benefit from this water. The
estimated total cost for the scheme was calculated to R5 419 933.00. The capital investment could be
recovered within 1 year of investment with about 95% annual savings and 5% being allocated to minor
maintenance costs in the following years. This scenario would also strengthen the Gauteng Master
Plan for potable water infrastructure development.

- 97 -
Scenario 5 was essentially a business opportunity whereby the production of bottled water on a
commercial basis with a return of investments was investigated. The cost of the application was based
on a water purification plant with a capacity of 1200 m3/year and various financial assumptions were
made to determine the projected revenue. The investment, infrastructure and human resources were
calculated to a total cost of R8 440 244.00 for the first year of operation with projected revenue of
R10 800 000.00 to be made within year 1 of operating. This suggests that a net profit of approximately
R9 500 000.00 (calculated as less human resources cost and cost of water from Shaft E2) could be
expected. The Cost-Benefit Analysis conducted regarding the use of excess groundwater emanating
from the various shafts confirmed all the proposed scenarios to be economically feasible with return
on investments. Each scenario has proven to offer innovative technical solutions that would lead to
sustainable alternative uses of urban groundwater. The results of the Pre-Feasibility Analysis have
contributed to a shift from inadequate management of groundwater resources in urban areas to active
management leading to the potential for bulk water supply.
The main objectives of the study were as follows: Objective 1: Review the municipal current and
planned groundwater use, Objective 2: Review the status of urban influences on groundwater
resources, Objective 3: Review the status of groundwater planning, Objective 4: Review a
compendium of papers on the best practices, Objective 5: To identify an urban groundwater
management problem and suggest innovative technical solutions.
Objective 1 has been met, as the literature has been reviewed and it was found that the MMs are
meeting their current water requirements but will go into deficit in 2030. Future planned groundwater
use includes among others Conservation and Water Demand Management measures to reduce losses
and reduce the urban demand by at least 20% by 2030, re-use of water and desalination. Objective 2
has been met as the sources of pollution for groundwater resources have been identified amongst
others as acid mine drainage, industrial areas, and leaking effluent. Objective 3 has been met as the
review revealed that there is no single MM that achieves the ideal representation of groundwater in all
relevant planning documents. Groundwater use and management are poorly integrated into the key
planning processes at the MMs and there is also no coherent plan for groundwater development and
management evident from the MMs and integrated across each of the necessary and available planning
documentation. Objective 4 has been met as the review of the international best practices has shown
that a number of various cities around the world are implementing alternative water management
approaches and linking water management to spatial planning and using various environmental acts
for the protection of groundwater resources. Objective 5 has been met as the Cost-Benefit Analysis
conducted yielded favourable results and confirmed that each scenario is economically feasible with
return on investments. The CBA also proved that this groundwater could result in significant cost
savings and benefits for both the water users as well as the Water Services Providers such as JW (Pty)

- 98 -
Ltd. Innovative technical solutions were successfully identified and developed for the excess
groundwater ingressing into the Gautrain Tunnel.
6.1.1 Limitations of the study
The current study was limited by various factors that were beyond the control of the researcher. The
main limitation of this study is lack of groundwater monitoring data, particularly groundwater levels,
since the inception of the Gautrain Project to ascertain and understand the groundwater regime during
the pre-construction, construction, and operational phases. The 2016/2017 Environmental Status
Report issued annually by Bombela Concession Company (Pty) Ltd, confirmed that no groundwater
levels were monitored during the initial operation and maintenance period of the Gautrain Project and
formal monitoring commenced only during 2016. As a result, groundwater level trends and the
impacts associated with the construction phase are inferred mainly from studies undertaken by Arup (a
multinational professional services firm) in 2009 and Iliso Consulting (Pty) Ltd in 2010 and 2011.
6.2 RECOMMENDATIONS
The following are the overarching recommendations that have arisen from this study relating to gaps
that have been identified in dealing with urban groundwater management:
a. The CoJ is predicted to experience a water supply deficit by 2030 and is currently dependent
on surface water imported from inter-basin transfer schemes. Alternative sources of supply are
strongly recommended,
b. The current Dolomite risk by-laws in place for the CoJ do not suffice as far as aquifer
protection is concerned as these by-laws focus only on issues related to stability. It is
recommended that groundwater quality monitoring must be strengthened in the CoJ,
c. Water services or water supply by-laws provide mechanisms through which the MMs can
manage and protect groundwater but it is noted that by-laws are not applied uniformly across
the MMs. It is recommended that the by-laws must be applied uniformly across all the MMs,
d. The potential of groundwater to augment bulk supply in the EMM is currently not understood.
The EMM must conduct assessments for a better understanding of groundwater quantity in the
karst dolomites that can potentially be used to reduce the dependency on the water imported
from the VRS. This water can potentially be used for non-potable uses and during periods of
prolonged drought,
e. The CTMM acknowledges groundwater as a valuable resource and relies more on
groundwater than the other three (3) MMs that were reviewed but does not have the necessary
groundwater protection measures in place. The CTTM must strengthen its aquifer protections

- 99 -
by-laws and ensure guidelines are in place to protect the vulnerable karst aquifer system from
pollution,
f. The CoJ and eTMM plan on expanding or initiating groundwater resource development as part
of future reconciliation plans. It is therefore recommended that groundwater development be
planned and budgeted for in the IDPs of the respective MMs and,
g. The WSDP for the eTMM shows no inclusion of groundwater in the future. Studies are
recommended to determine the existing groundwater resources available in the City for
exploitation. The protection of groundwater must be strengthened within the SDF.
6.2.1 Future recommended research
The following are the recommended future actions and investigations:
a. Investigation of major aquifers across all the MMs to acquire a better understanding of
potentially available resources to augment the currently strained bulk supply,
b. Investigate and finance the restoration of the monitoring boreholes and the expansion of the
monitoring networks in the densely populated MMs to improve urban groundwater
management,
c. Groundwater Data Information Systems must be established and financed across all the MMs
to provide detailed and reliable groundwater data to be shared amongst groundwater
managers,
d. Conduct Pre-Feasibility investigations for other MMs (other than the CoJ) on the identified
available resources and propose other innovative technical solutions,
e. Introduction of a by-law prohibiting the discharge of dewatered/disposed groundwater from
the tunnels into the stormwater systems with no beneficial use. This by-law could bring about
significant cost savings and benefits as demonstrated in Chapter 5 of this study,
f. Ongoing monitoring along the Gautrain Tunnel for groundwater points and surface water
discharges as per the Integrated Water Use Licence (Annexure III - Condition 2.6,
Section B 3.2.2, and Annexure III - Condition 2.5) to detect any deviations in the groundwater
quality that may indicate impacts from contaminants. Long-term groundwater monitoring is
critical to draw definite deductions on the final yields and time that the Gautrain Tunnel will
reach a steady state. It is also recommended that samples and levels be collected at borehole 3
(Rivonia Street- between Mushroom Farm Park and Sandton Station) and borehole 5 (Corner
of 5th and Rivonia Road), which were not sampled due to external construction work at the
time of sampling.

- 100 -
g. Continuous monitoring is also recommended for Shafts E3 and E4 (discharge volumes always
low). Alternative water uses must be developed in the event the discharge volumes are found
to be significant in the future, and
h. DWS must finalize and issue an Amendment License in terms of the individual Discharge
Points (including the amendment referred to in Section 5.5 for the proposed alternative uses).
DWS must calculate the individual values as each of the Discharge Points do not discharge the
same volumes. The discharge at Shaft E2 is exceeding the specified individual discharge
volumes stipulated in the IWUL.

- 101 -
REFERENCE LIST
Abate, E.Y. (2010). Anthropogenic Impacts on Groundwater Resources in the urban Environment of
Dire Dawa, Ethiopia. Master‟s Thesis, University of Oslo, Faculty of Mathematics and
Natural Sciences. Available via www.duo.uio.no, [Accessed 20 June 2018].
Abiye, T.A., Mengistu., H. and Demlie, M.B. (2011). Groundwater Resource in the Crystalline Rocks
of the Johannesburg Area, South Africa. Journal of Water Resource and Protection, 2011.
Volume 3, pp. 199-212. Available via doi:10.4236/jwarp.2011.34026, [Accessed 25 June
2018].
Anhaeusser, C.R. (2006). Ultramafic and Mafic Intrusions of the Kaapvaal Craton. Economic Geology
Research Institute, School of Geosciences, University of the Witwatersrand, Johannesburg.
The Geology of South Africa, Council for Geosciences, 2006, pp. 95-125.
Anabella, F., Martin, S., Eugenia., A. and Alberto. F. (2014). Assessment, Monitoring, and Protection
of Groundwater Pollution in Urban Areas-Cordoba City-Argentina. European Scientific
Journal. Volume 3, pp. 13-21. Available via
Eujornal.prg/index.php/esj/article/view/2910/2738, [Accessed 18 November 2017].
Appello, C.A.J. and Postma, D. (2005). Geochemistry, Groundwater, and Pollution, 2nd
Edition.
Published on January 2015 by: A.A. Balkema Publishers, Leiden, The Netherlands a member
of Taylor & Francis Group plc. ISBN 04 1536 421 3.
Arup, O. (2009). Hydrogeological Study - Tunnel Section for Gautrain Rapid Rail Link. Technical
Report submitted to Bombela Civils Joint Venture (Pty) Ltd, Johannesburg.
Barnard, H.C. (2000). An Explanation of the 1:500 000 General Hydrogeological Map. Johannesburg
2526. Department of Water Affairs and Forestry of South Africa.
Barton, J.M. and Kroner, A. (1999). Age and Isotopic Evidence for the Origin of the Archaean
Granitoid Intrusive of the Johannesburg Dome, South Africa. Journal of African Earth
Sciences, Volume 28, No. 3, 1999.
Bell, F.G. and Maud, R.R. (2000). A groundwater survey of the greater Durban area and environs,
Natal, South Africa. Environmental Geology, Springer link Journal 39 (8). Department of
Geology and Applied Geology, University of Natal, King George V Avenue, Durban 4041,

- 102 -
South Africa. Available via https://link.springer.com/article/10.1007/s002549900076,
[Accessed 21 April 2018].
Bergkamp, G. and Cross, K. (2006). Groundwater and Ecosystem Services. Towards their sustainable
use. International Symposium on Groundwater Sustainability (ISGWAS)-The World
Conservation Union, Rue Mauverney 28, 1196 Gland, Switzerland.
Blacet, D. and Parker, T. (2011). Sustainability from Groundwater Management in California: A
framework: Sacramento, California, Association of California Water Agencies.
BCC [Bombela Concession Company]. (2012). Integrated Water Use License Application,
Presentation given to the Department of Water Affairs, 01 February 2012.
BCC [Bombela Concession Company]. (2014). Integrated Water Use License for Bombela
Concession Company (Pty) Ltd (License No: 03/A21C/CI/2658). Issued by Department of
Water Affairs on 01 December 2014.
BCC [Bombela Concession Company]. (2016). Annual Environmental Status Report for Reporting
period 2015-2016: Report prepared by Environamic CC for Bombela Concession Company
(Pty) Ltd.
BCC [Bombela Concession Company]. (2017). Monthly Water Monitoring Reports: Reports compiled
on behalf of Bombela Concession Company (Pty) Ltd by Environamic CC and GreenWorx
(Pty) Ltd.
California Water Foundation. (2014). Recommendations for Sustainable Groundwater Management:
Developed through a stakeholder dialogue, May 2014.
CoJ. [City of Johannesburg]. (2008). Dolomite Risk By-Laws (assumed promulgated in 2015).
Available via https://joburg.org.za/index.php?option=comconte=view&id=647&Itemid=114,
[Accessed 19 February 2019].
CoJ [City of Johannesburg]. (2009). Water Services Development Plan. City of Johannesburg
Metropolitan Municipality, South Africa.
CoJ [City of Johannesburg]. (2011). 2011/12 Integrated Development Plan (IDP): Focusing on the
basics and preparing for long term.
CoJ [City of Johannesburg]. (2012a). 2012/13 Integrated Development Plan (IDP).
- 103 -
CoJ [City of Johannesburg]. (2012b). Status of Water Sensitive Urban Design Systems, Presentation
given at WRC Project K5/2071 Reference Group Workshop, 10 May 2012.
CoJ [City of Johannesburg]. (2015). Dolomite Risk By-Laws (assumed promulgated in 2015).
Available via https://joburg.org.za/index.php?option=comconte=view&id=647&Itemid=114,
[Accessed 21 February 2019].
CoJ [City of Johannesburg]. (2017a). 2017/2018 Integrated Development Plan Review.
CoJ [City of Johannesburg]. (2017b). 2040 Growth and Development Strategy.
Coetzee, H., Chirenje, E., Hobbs, P. and Cole, J. (2009). Ground and Airborne Geophysical Surveys
Identify Potential Subsurface Acid Mine Drainage Pathways in the Krugersdorp Game
Reserve, Gauteng.
CSIR [Council for Scientific and Industrial Research]. (2000). Guidelines for Human Settlement
Planning and Design compiled by CSIR patronage of the Department of Housing by CSIR
Building and Construction Technology.
CSIR [Council for Scientific and Industrial Research]. (2010). A CSIR Perspective on Water in South
Africa – 2010: Report compiled by Suzan Oelofse and Wilma Strydom. Published by Council
for Scientific Industrial Research. CSIR Report No. CSIR/NRE/PW/IR/2011/0012/A.
Demlie, M., Titus, R. and Moodely, K. (2012). A preliminary hydrogeological investigation of the
Natal Group Sandstone, South Africa.
DWA [Department of Water Affairs]. (2009). Dolomite Guideline. A short guideline to available
documents on procedures for developing dolomitic land. Department of Water Affairs and
Forestry of South Africa.
DWA [Department of Water Affairs]. (2010). Water Reconciliation Strategy Study for the KwaZulu-
Natal Coastal Metropolitan areas: Second Stage Reconciliation Strategy Report: Prepared by
WRP Consulting Engineers(Pty) Ltd, in association with DMM Development Consultants cc,
Golder Associates Africa Kwezi V3 Engineers and Zitholele Consulting. Report No. PWMA
11/000/00/1007.
DWAF [Department of Water Affairs and Forestry]. (1996). South African Water Quality Guidelines
(second edition). Volume 1: Domestic Use.

- 104 -
DWAF [Department of Water Affairs and Forestry]. (1996). South African Water Quality Guidelines
(second edition). Volume 4: Agricultural Use: Irrigation.
DWAF [Department of Water Affairs and Forestry]. (2004). Crocodile River (West) and Marico
Water Management Area: Internal Strategic Perspective of the Crocodile River (West)
Catchment: Prepared by Goba Moahloli Keeve Steyn (Pty) Ltd, Tlou & Matji (Pty) Ltd, and
Golder Associates (Pty) Ltd, on behalf of the Directorate: National Water Resource Planning.
February 2004. Report No. P WMA 03/000/00/0303.
DWAF [Department of Water Affairs and Forestry]. (2006). A Guideline for the Assessment,
Planning, and Management of the Groundwater Resources within the Dolomitic Areas of
South Africa – Process and related Activities. Volume 2, Pretoria.
DWAF [Department of Water Affairs and Forestry]. (2008). Groundwater Plan for KwaZulu-Natal.
KZN - Groundwater Master Plan. 09 January 2008.
DWAF [Department of Water Affairs and Forestry]. (2009a). Water Reconciliation Strategy Study for
the KwaZulu-Natal Coastal Metropolitan Areas: First Stage Reconciliation Strategy Report
(January 2009). Prepared by: DMM Development Consultants, Golder Associates Africa,
Kwezi V3 Engineers, WRP Consulting Engineers, and Zitholele Consulting. Report No.
PWMA 11/000/00/0907.
DWAF [Department of Water Affairs and Forestry]. (2009b). Vaal River System: Large Bulk Water
Supply Reconciliation Strategy: Second Stage Reconciliation Strategy (March 2009).
Prepared by: DMM Development Consultants, Golder Associates Africa, SRK, WRP
Consulting Engineers and Zitholele Consulting. DWAF Report Number: P RSA
C000/00/4406/08.
Engineering News. (2016). Article: Minister launches long-term acid mine water solution, published
18th May 2016. Available via http://www.engineeringnews.co.za/article/water-minister-
launches-long-term-acid-mine-drainage-solution-2016-05, [Accessed 21 November 2017].
Enslin, J.L. (2019)15
. Personal Engagements. Department of Water and Sanitation, Directorate: Option
Analysis.
EMF [Environmental Management Framework] for Gauteng Report. (2014). Gauteng Provincial
Environmental Management Framework (GPEMF) Produced by the Environomics Project
15 Enslin, J.L, Pr. Eng.: Chief Engineer, DWS, D: OA (North).

- 105 -
Team, including: Environomics CC MetroGIS (Pty) Ltd. EnviroGIS (Pty) Ltd. David Hoare
Consulting CC NRM Consulting.
Eriksson, P. G., Altermann, W., and Hartzer, F. J. (2006). The Transvaal Supergroup and its
Precursors. In: Johnson, M. R., Anhaeusser, C. R. and Thomas, R. J. (Eds.). The Geology of
South Africa. Geological Society of South Africa, Johannesburg/ Council for Geoscience,
Pretoria.
eTMM [eThekwini Municipality]. (2011). Water Services Development Plan. Available via,
http://www.durban.gov.za/CityServices/watersanitation/PoliciesPlansGuidelines/Documents/
WSDP2012, [Accessed 13 July 2018].
eTMM [eThekwini Municipality]. (2017b). Water Supply By-laws (promulgation date unknown).
Availableviahttp://www.durban.gov.za/CityServices/watersanitation/BylawsTariffs/Bylaws/P
ages/WaterSupplyBylaws.aspx, [Accessed 15 April 2019].
European Commission. (2008). Groundwater Protection in Europe. A new Groundwater Directive-
Consolidating the EU Regulatory Framework. Luxembourg. ISBN 978-92-79-09817-8.
Featherstone, R.E. and Nalluri, C. (2016). Civil Engeering Hydraulics. Essential Theory with Worked
Examples, Third Edition.
Foster, S., Lawrence, A. and Morris B. (1998). Groundwater in Urban Development: Assessing
Management Needs and Formulation Policy Strategies. World Bank Technical Paper No.390,
Washington DC, United States of America.
Foster, S., Tovey, C. and Tyson, G. (2010). Appropriate Groundwater Management Policy for Sub-
Saharan Africa in the face of demographic pressure and climatic variability. GW-MATE,
Strategic Overview Series No. 5. World Bank, Washington, Washington DC, USA.
Foster, S., Tuinhof, F. and van Steenbergen, F. (2012) Managed groundwater development for water-
supply in Sub-Saharan Africa: Investment Priorities. Water S.A. Volume 38 No. 3, pp 359-
366. International Conference on Groundwater Special Edition. Available via
http://dx.doi.org/10.4314/wsa.v38i3.1, [Accessed 3 November 2017].
Foster, S. and Vairavamoorthy, K. (2013). Urban Groundwater - Policies and Institutions for
Integrated Management. A Global Water Partnership Perspective Paper, Stockholm,
SWEDEN, August 2013. Technical Perspective Paper No.5, pp. 3-17.

- 106 -
Foster, S. and Tyson, G. (2015). Resilient Cities and Groundwater. International Association of
Hydrogeologists (IAH) Strategic Overview Series, pp. 1-6.
GDC [Groundwater Development Services]. (1995). Hydrogeological Characterisation of the
KwaZulu-Natal Province. Mapping Unit-3, Department of Water Affairs and Forestry of
South Africa.
Harrington, N. and Cook, P. (2014). Groundwater in Australia. The National Centre for Groundwater
Research and Training, Australia, C/Flinders University.
Hillier, J.R. (1993). Management of saltwater intrusion in the coastal aquifers in Queensland,
Australia. AGSO Journal of Australian Geology & Geophysics, Volume. 14 (2/3), pp. 213-
217.
Hobbs, P.J. (2004). Intermediate Groundwater Reserve Determination for Quaternary Catchments
A21A and A21. DWAF project no. 2002-316. Hobbs Khulani Joint Venture, Pretoria.
Holland, M. (2007). Groundwater resource directed measures in Karst terrain with emphasis on
aquifer characterization in the Cradle of Humankind near Krugersdorp, South Africa.
Unpublished MSc thesis. The University of Pretoria, Pretoria, South Africa.
Ilemobade, A.A., Olanrenwaju, O.O. and Griffioen, M.L. (2012). Greywater re-use for toilet flushing
in high-density urban buildings in South Africa: A pilot study. Report (WRC Report No.
1821/1/11) prepared for Water Research Commission by the School of Civil and
Environmental Engineering Science, University of Witswaterand, January 2012.
Iliso [Iliso Consulting (Pty) Ltd]. (2010). Report on the Assessment of the Tunnel Drainage Water
Discharge to the Storm Water System: Report prepared by Iliso Consulting (Pty) Ltd for
Bombela Civils Joint Venture. Report No. DD3, 17 November 2010.
Iliso [Iliso Consulting (Pty) Ltd]. (2011). Final Technical Report - Integrated Water Use License
Application for Gautrain Rapid Rail Link: Report prepared by Iliso Consulting (Pty) Ltd for
Bombela Concession Company (Pty) Ltd), December 2011.
Jacob, H.E., Wright, T., Loubser, C.M, Du Plessis, J.A. and Kock, J. (2011). Strategic Assessment of
household on-site water as a supplementary resource to potable municipal supply-current
trends and future needs. WRC Report No. 1819/1/10, Water Research Commission, Pretoria.

- 107 -
Jacobsen, M., Webster, M. and Vairavamoorthy, K. (2013). The Future of Water in African Cities:
Why Waste Water? Directions in Development. Washington, DC: World Bank. Report
prepared for the International Bank for Reconstruction and Development/The World Bank,
2013.
Johnson, M.R., Anhaeuser, C.R. and Thomas, R.J. (2006). The Geology of South Africa. Geological
Society of South Africa, Johannesburg/Council for Geoscience, Pretoria, pp 691.
Lund, J.R. and Harter, T. (2013). California‟s groundwater problems and prospects. Center for
Watershed Sciences. Available via http://californiawaterblog.com/2013/01/30/californias-
groundwater-problems-and-prospects/ [Accessed 13 June 2018].
Marshall, C.G.A. (2006). The Natal Group. In: Anhaeusser, C.R., Johnson, M.R., and Thomas, R.J.
(Eds), The Geology of South Africa. The Geological Society of South Africa, Johannesburg.
MEA [Millennium Ecosystem Assessment]. (2005). Ecosystems and Human well-being: Wetland and
Water-Synthesis. World Resources Institute, Washington, D.C.
Mengesha Wolde, Y.M. (2014). Issues and Problems of Groundwater Resources in Dire Dawa
Administration: A case study from Dire Dawa Administration. Ground Water Resource
Management Working Paper Series No.1, pp. 1-8, May 2014.
Meyer, R. (2014). Hydrogeology of Groundwater Region 10: The Karst Belt. Report to the Water
Research Commission. WRC Report No. TT 553/14. March 2014.
Murray, B.R., Hose, G.G., Eamus, D. and Licari, D. (2006). Valuation of groundwater-dependent
ecosystems: a functional methodology incorporating ecosystems services. Australian Journal
of Botany, 2006, 54, 221–229.
Naidoo, V. (2014). Hydrogeological characterization of the fountains east and fountains west karst
aquifer compartments. A thesis submitted in partial fulfilment of M.Sc. Engineering and
Environmental Geology (option: Hydrogeology). Department Geology, School of Physical
Sciences, University of Pretoria.
Ndlovu, M.S. and Demlie, M. (2018). Statistical analysis of the groundwater level variability across
KwaZulu-Natal Province, South Africa. Environmental Earth Sciences (2018) 77:739.
Available via https://doi.org/10.1007/s12665-018-7929-x [Accessed 12 July 2019].

- 108 -
Pellenbarg, N.P. (1998). Groundwater Management in the Netherlands: Background and Legislation,
pp 137-148.
Pietersen, K., Beekman, Hans E. and Holland, M. (2011). South African Groundwater Governance
Case Study. Report (WRC Report No. KV 273/11) prepared for the WorldBank in partnership
with the South African Department of Water Affairs and the Water Research Commission,
June 2011.
SWRCB [State Water Resources Control Board]. (2012). California communities that rely on
contaminated groundwater, Draft Report to the Legislature. California Water Boards. January
2012.
Van der Gun, J. (2012). Trends, Opportunities, and Challenges. Published in 2012 by the United
Nations Educational, Scientific and Cultural Organization 7, Place de Fontenoy, 75352 Paris
07 SP, France.
Waterwheel. (2006). Bottle Water Sector: Bottled Water Sector Bubbling Over. November/December
2006. Available via http://www.wrc.org.za/c/WaterWheelWW20Nov-Dec2006.pdf,
[Accessed 9 July 2019].
WRC [Water Research Commission]. (2016). Enhancement of the method to identify and delineate
South Africa. Water Source Areas (K5/2431). Deliverable 4, Benefit Flows Report, June
2016.
WRC. (2018). Urban Groundwater Development and Management (K5/2741). Progress
Report/Deliverable 5, Draft Final Project Report, November 2018.
WSDP [Water Service Development Plan]. (2010). City of Tshwane Water Service Development
Plan report. 2010.
Wright, T. (2013). Water demand for selected residential properties with access to groundwater in
serviced areas of the Cape Peninsula. A thesis presented in partial fulfilment of the
requirements for the degree Masters of Science in Engineering, University of Stellenbosch.
Yitayew, E. (2005). Groundwater Resource Management on Urban Environment.

- 109 -
Zekster, I.S. and Everett, L.G. (2004). Groundwater Resources of the World and their uses. IHP-VI,
series on Groundwater No. 6. Published in 2004 by the United Nations Educational,
Scientific, and Cultural Organization 7, place de Fontenoy, 75352 Paris 07 SP.
Zhao, C. (2010). Groundwater problems and solutions in the provinces of Zuid-Holland (The
Netherlands) and Hebei (China): A comparison in order to improve cooperation between the
two provinces. A thesis presented in partial fulfillment of Bachelor degree in Land and Water
Management, University of Applied Sciences, Van Hall Larenstein.
Internet Source: https://www.carfind.co.za/default.aspx, [Accessed 23 August 2019].

- 110 -
LIST OF APPENDICES
The below-listed Appendices are available on electronic CD and can be provided upon request:
1. APPENDIX A: Water Quality Results.
2. APPENDIX B: Discharge Volumes.
3. APPENDIX C: Interviews and Questionnaires.
4. APPENDIX D: Detailed Calculations.
5. APPENDIX E: Calculations for the Cost of Current Municipal Water Use.
5.1 APPENDIX E: Calculations for the Cost of Electricity for Pumping Groundwater.
6. APPENDIX F: Calculations of Friction Factor used for Scenarios.
7. APPENDIX G: Water Demand for Developed Areas (Domestic & Non-Domestic).
8. APPENDIX H: DWS 2019/2020 Water Tariffs