Groundwater potential zoning of a peri-urban wetland of south Bengal Basin, India
16
Environ Monit Assess (2011) 174:119–134 DOI 10.1007/s10661-010-1443-2 Groundwater potential zoning of a peri-urban wetland of south Bengal Basin, India Paulami Sahu · Pradip K. Sikdar Received: 26 October 2009 / Accepted: 30 March 2010 / Published online: 2 May 2010 © Springer Science+Business Media B.V. 2010 Abstract Demand for groundwater for drinking, agricultural, and industrial purposes has increased due to rapid increase in population. Therefore, it is imperative to assess the groundwater potential of different areas, especially in a fragile wetland ecosystem to select appropriate sites for devel- oping well fields to minimize adverse environ- mental impacts of groundwater development. This study considers East Calcutta Wetlands (ECW)— a freshwater peri-urban inland wetland ecosystem located at the lower part of the deltaic alluvial plain of South Bengal Basin and east of Kolkata city. This wetland is well known over the world for its resource recovery systems developed by local people through ages, using wastewater of the city. The subsurface geology is completely blanketed by the Quaternary sediments comprising a suc- cession of silty clay, sand of various grades, and sand mixed with occasional gravels and thin inter- calations of silty clay. Groundwater occurs mostly under confined condition except in those places where the top aquitard has been obliterated due to scouring action of past channels. The groundwater in the study area is being over-extracted at the P. Sahu (B ) · P. K. Sikdar Department of Environment Management, Indian Institute of Social Welfare and Business Management, Management House, College Square (West), Kolkata 700 073, India e-mail: [email protected] rate of 65 × 10 3 m 3 /day. Overlay analysis in Geo- graphic Information System platform using multi- ple criteria such as water quality index, hydraulic conductivity, groundwater velocity, and depth to piezometric surface reveals that in and around ECW, there are five groundwater potential zones. About 74% of the aquifer of this area shows very poor to medium groundwater potential. Manage- ment options such as minimization of ground- water abstraction by introducing the treated surface water supply system and the implementa- tion of rainwater harvesting and artificial recharge in high-rise buildings and industries are suggested for different potential zones. Keywords East Calcutta Wetlands · Hydraulic conductivity · Multi-criteria analysis · GIS · Groundwater potential zoning Introduction Freshwater wetlands are characterized by a hy- drological cycle in which the groundwater within the wetland may be recycled from local and/or distant areas and will comprise varying quantities of water derived from precipitation, surface water bodies, and return flow of groundwater used for irrigation in nearby irrigated land. Many wetland hydrology studies have described the wetland wa- ter table or developed an annual water budget
-
Upload
ucentralgujaratgandhinagar -
Category
Documents
-
view
0 -
download
0
Transcript of Groundwater potential zoning of a peri-urban wetland of south Bengal Basin, India

Environ Monit Assess (2011) 174:119–134DOI 10.1007/s10661-010-1443-2
Groundwater potential zoning of a peri-urban wetlandof south Bengal Basin, India
Paulami Sahu · Pradip K. Sikdar
Received: 26 October 2009 / Accepted: 30 March 2010 / Published online: 2 May 2010© Springer Science+Business Media B.V. 2010
Abstract Demand for groundwater for drinking,agricultural, and industrial purposes has increaseddue to rapid increase in population. Therefore, itis imperative to assess the groundwater potentialof different areas, especially in a fragile wetlandecosystem to select appropriate sites for devel-oping well fields to minimize adverse environ-mental impacts of groundwater development. Thisstudy considers East Calcutta Wetlands (ECW)—a freshwater peri-urban inland wetland ecosystemlocated at the lower part of the deltaic alluvialplain of South Bengal Basin and east of Kolkatacity. This wetland is well known over the world forits resource recovery systems developed by localpeople through ages, using wastewater of the city.The subsurface geology is completely blanketedby the Quaternary sediments comprising a suc-cession of silty clay, sand of various grades, andsand mixed with occasional gravels and thin inter-calations of silty clay. Groundwater occurs mostlyunder confined condition except in those placeswhere the top aquitard has been obliterated due toscouring action of past channels. The groundwaterin the study area is being over-extracted at the
P. Sahu (B) · P. K. SikdarDepartment of Environment Management, IndianInstitute of Social Welfare and Business Management,Management House, College Square (West),Kolkata 700 073, Indiae-mail: [email protected]
rate of 65 × 103 m3/day. Overlay analysis in Geo-graphic Information System platform using multi-ple criteria such as water quality index, hydraulicconductivity, groundwater velocity, and depth topiezometric surface reveals that in and aroundECW, there are five groundwater potential zones.About 74% of the aquifer of this area shows verypoor to medium groundwater potential. Manage-ment options such as minimization of ground-water abstraction by introducing the treatedsurface water supply system and the implementa-tion of rainwater harvesting and artificial rechargein high-rise buildings and industries are suggestedfor different potential zones.
Keywords East Calcutta Wetlands ·Hydraulic conductivity · Multi-criteria analysis ·GIS · Groundwater potential zoning
Introduction
Freshwater wetlands are characterized by a hy-drological cycle in which the groundwater withinthe wetland may be recycled from local and/ordistant areas and will comprise varying quantitiesof water derived from precipitation, surface waterbodies, and return flow of groundwater used forirrigation in nearby irrigated land. Many wetlandhydrology studies have described the wetland wa-ter table or developed an annual water budget

120 Environ Monit Assess (2011) 174:119–134
(Owen 1995; Cooper et al. 1998) to illustratethe link between wetland hydrology and ecology(Drexler et al. 1999) or have utilized hydrogeologyand isotope composition of groundwater to un-derstand the hydrological processes prevalent inthe wetland (Sikdar and Sahu 2009). These studiesoften fail to represent the ever-increasing human-induced pressure on groundwater for drinking,agricultural, and industrial purposes due to rapidincrease in population. Abstraction of groundwa-ter from low potential areas may cause adverseenvironmental impact on wetland’s ecosystem.Appropriate site selection for well fields of newlyplanned urban centers and industrial estateswithin close vicinity of any major wetland is astrong pollution preventive instrument that en-sures environmental soundness of any develop-mental program. Therefore, it is imperative toidentify different groundwater potential zones inand around the wetland ecosystem.
Multiple criteria controlling groundwater hy-drology of the area such as geology, hydrogeomor-phology, drainage density, slope, aquifer thick-ness, and depth to water table with appropriateweights may be integrated on a Geographic In-formation System (GIS) platform to classify anarea into different groundwater potential zones(Al-Hadithi et al. 2003; Sikdar and Bhattacharya2003; Sikdar et al. 2004; Sreedevi et al. 2005). Theoutput will be useful to the law-makers, develop-ers, and decision-makers to chalk out strategiesfor various development programs and to supplywater for drinking, irrigation and industrial pur-poses.
Methodology
The present study was undertaken in and aroundan inland freshwater wetland of India, knownas East Calcutta Wetlands (ECW). The ECWis a complex of natural and human-made wet-lands lying east of the city of Kolkata (previouslyknown as Calcutta) in Eastern India. ECW cov-ers an area of 125 km2 and comprises intertidalmarshes such as salt marshes and salt meadowswith significant wastewater treatment areas in-cluding sewage farms, settling ponds, and oxida-tion basins. This wetland is well known over the
world for its multiple uses. This wetland act as anatural sewage water treatment plant and treatsabout 800 × 103 m3 of wastewater flowing outdaily from Kolkata. It has saved the city from con-structing and maintaining a wastewater treatmentplant. ECW is a perfect example of wise-use ofwetland ecosystem where city sewage is used fortraditional practices of fisheries and agriculture.This wetland ecosystem is one of the rare exam-ples of combination of environmental protectionand development management where a complexecological process has been adopted by the localfarmers by mastering the resource recovery ac-tivities. Therefore, ECW has been declared as aRamsar site on 19 August 2002 (Ramsar site no.1208; Sahu and Sikdar 2008) and has acquired aninternational status.
The study area covers an area of about 334 km2.It is bounded by latitudes 22◦25′ N to 22◦40′ N andlongitudes 88◦20′ E to 88◦35′ E and lies betweenthe River Hugli in the northwest and the RiverBidyadhari in the east. The area consists of SaltLake and parts of Rajarhat block in the north,parts of Bhangar-I and Bhangar-II blocks in theeast, parts of Sonarpur block in the south, andparts of Kolkata City in the west (Fig. 1). An im-portant location within the study area is the ECWthat occupies about a 125 km2 of area (Fig. 1).The area is a part of the mature delta of the RiverHugli. The elevation of the land varies between3 and 6.5 m above the mean sea level and slopesgradually towards south and south-east.
Wastewater of the city is a mixture of domes-tic and industrial effluents, carrying high amountof heavy metals. The wastewater from parts ofKolkata is collected at different pumping sta-tions and led in two channels—the dry weatherflow (DWF) and the storm water flow (SWF)—toBantala, where the inflow and outflow from theECW are controlled. From Bantala, the influentis diverted into several ditches, which distributethe wastewater in ECW. Close to the ditch, thereare several fish farms. Each fish farm is connectedto the ditch from where about 2 ft (60 cm) ofwastewater is led to the fish farm. The fish farmis emptied every 2 to 5 years. The water in thefish farm is led to the channel and thereafter tothe DWF and SWF again and emanates in theRiver Kulti. The outlet water from the fish farm

Environ Monit Assess (2011) 174:119–134 121
Fig. 1 Location and drainage pattern of the area in and around the ECW. The thick black line within the map is the boundaryof the East Calcutta Wetland, and the thin black line is the study area boundary
contains insignificant amount of these heavy met-als. Scientists have also shown that there is a verylow flux of metals from the sewage water to thefish. Therefore, the heavy metals remain withinthe wetland system. These heavy metals can pos-sibly leach from the soil and the bottom sedimentsof the fish farm to the underlying groundwaterbody. The solid waste dumping ground of Kolkata
city is on the western fringe of ECW at Dhapa(Fig. 1). Solid waste dumping started in 1870, andat present, more than 95% of the total wastegenerated in Kolkata city is disposed here. Thisarea may also act as an important source of con-tamination of groundwater of the area. Leachingof pollutants may be accelerated due to overwith-drawal of groundwater for domestic, irrigation,

122 Environ Monit Assess (2011) 174:119–134
industrial, and commercial needs. The aquifer,therefore, might get contaminated, and the east-to-west groundwater flow might transport heavymetals from the wetland aquifer to the Kolkataaquifer. Apart from quality, heavy withdrawal ofgroundwater for drinking, industrial, and irriga-tion purposes in the area in and around the ECWmay have an adverse impact on the groundwaterregime.
The subsurface geology of the area is com-pletely blanketed by the Quaternary fluviatilesediments comprising a succession of silty clay,sand, and sand mixed with occasional gravel. Insome places along with silty clay, sticky clay isalso present at the top of the lithological column.Deeper exploratory boreholes, drilled by various
agencies, suggest the existence of underlying Ter-tiary clay/silty clay at an average depth of 296 m(Sikdar 2000). This formation continues up to adepth of at least 614 m below the ground surface.The Quaternary aquifer of the study area is sand-wiched between the silty clay/clay sequences andmore or less continuous in nature. The thick siltyclay bed at the top of the stratigraphic columnhelps to hold water in the deeper sand sequenceunder pressure. Groundwater generally occurs un-der confined condition (Fig. 2a). However, sub-surface distribution of the top confining litho unitsoccurring in and around ECW indicates that inthe northern part of the study area, the thick-ness of the top confining bed is less than 10 m,and at places, the top confining bed is absent,
Fig. 2 Sections of thestudy area showing (a)the confined nature ofthe aquifer and (b) theunconfined nature ofthe aquifer
Environ Monit Assess (2011) 174:119–134 123
and a thick column of sand occurs from the topof the geological succession, indicating channeldeposition (Fig. 2b). Through these areas, directinfiltration of precipitation takes place into theaquifer. These pockets where groundwater occursunder unconfined condition act as recharge area.
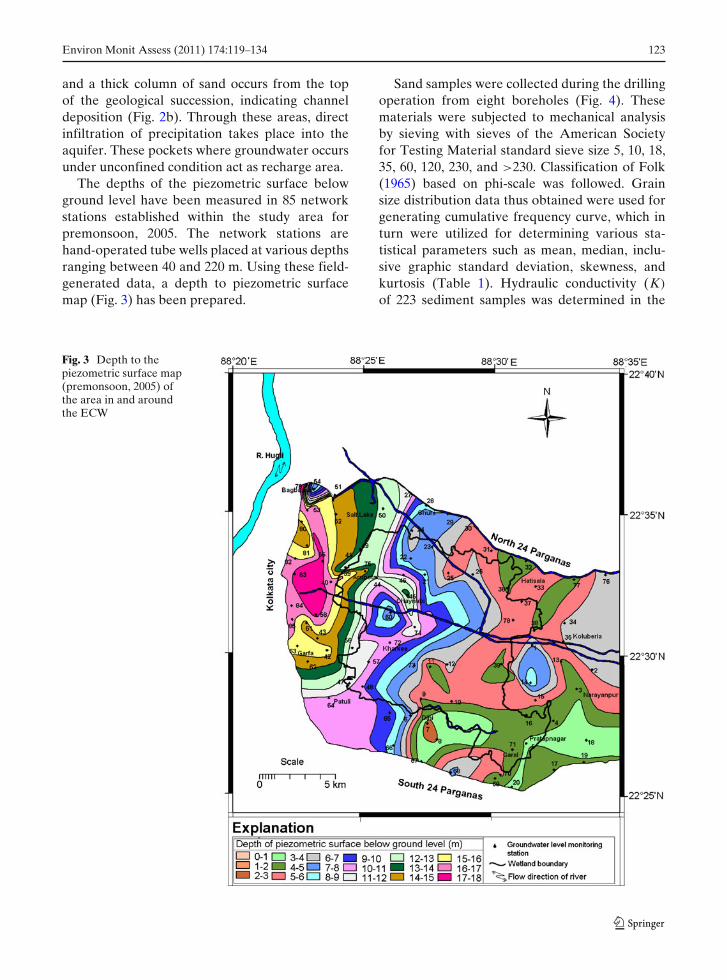
The depths of the piezometric surface belowground level have been measured in 85 networkstations established within the study area forpremonsoon, 2005. The network stations arehand-operated tube wells placed at various depthsranging between 40 and 220 m. Using these field-generated data, a depth to piezometric surfacemap (Fig. 3) has been prepared.
Sand samples were collected during the drillingoperation from eight boreholes (Fig. 4). Thesematerials were subjected to mechanical analysisby sieving with sieves of the American Societyfor Testing Material standard sieve size 5, 10, 18,35, 60, 120, 230, and >230. Classification of Folk(1965) based on phi-scale was followed. Grainsize distribution data thus obtained were used forgenerating cumulative frequency curve, which inturn were utilized for determining various sta-tistical parameters such as mean, median, inclu-sive graphic standard deviation, skewness, andkurtosis (Table 1). Hydraulic conductivity (K)
of 223 sediment samples was determined in the
Fig. 3 Depth to thepiezometric surface map(premonsoon, 2005) ofthe area in and aroundthe ECW

124 Environ Monit Assess (2011) 174:119–134
Fig. 4 Spatial distributionof hydraulic conductivityof the area in and aroundthe ECW
laboratory using the predictive method of Maschand Denny (1966). Two cardinal grain size pa-rameters that are median diameter and inclu-sive graphic standard deviation have been used
to determine the average hydraulic conductivity(Table 1). Apart from the calculated average Kvalues, hydraulic conductivity data obtained fromfield pumping tests carried out by the Geological
Table 1 Summary of statistical parameters computed from mechanical analysis of the aquifer material
Location Depth range Mean Median Inclusive graphic Inclusive graphic Graphic kurtosis, Average K(m) Mz (phi) ϕ50 (phi) SD, σ I (phi) skewness (phi) KG (phi) (m/day)
Narayanpur 168–234 0.98 0.84 0.83 0.23 1.44 40.19Andulgari 168–234 1.32 1.36 0.11 0.16 1.10 11.52Shaksaharpukur 168–234 0.85 0.76 0.78 0.20 1.21 35.69Binarite 168–234 0.95 0.76 0.90 0.33 1.83 32.55Barjuli 168–234 0.73 0.68 0.80 0.41 1.56 35.91Ballypur 168–234 0.68 0.64 0.61 0.14 1.81 54.78Borali 168–234 0.90 0.87 0.80 0.89 1.16 28.17Erenda 168–234 0.96 0.65 1.26 0.48 2.12 41.07Average (phi) 1.13 1.07 1.01 0.19 1.50 –Remarks Medium Medium Poorly sorted, Fine-skewed Leptokurtic –
sand sand indicates riversediments

Environ Monit Assess (2011) 174:119–134 125
Survey of India (GSI) and the Central GroundWater Board (CGWB) at 12 locations in andaround the study area (Chaterji et al. 1964;Banerjee and Khan 1982; CGWB 1994, 2004)were also being used (Table 2) to prepare a spatialdistribution map (Fig. 4) of hydraulic conductivityof the aquifer using ILWIS 3.3 Academic VersionGIS software.
The groundwater velocity was worked out us-ing the premonsoon, 2005 head data of 85 networkstations. The values of hydraulic conductivity andhydraulic gradient for each of the 85 network sta-tions were worked out, and groundwater velocitywas calculated using Darcy’s equation:
v = Ki/θd,
where
v groundwater velocity (m/day)K hydraulic conductivity (m/day)
i hydraulic gradient (dimensionless)θd Dynamic porosity (dimensionless)
Since θd values are not available, the storagecoefficient value of the aquifer (3.3 × 10⁻³) hasbeen used as a good approximation of dynamicporosity (Sikdar and Bhattacharya 2003). Thevalues obtained have been used to prepare thegroundwater velocity map of the area (Fig. 5).
In order to get a comprehensive picture of thequality of groundwater from the point of viewof the suitability for human consumption, thewater quality index (WQI) method has beenutilized. WQI is defined as a rating reflectingthe composite influence of different water qual-ity parameters on the overall quality of water(Tiwari and Mishra 1985; Mishra and Patel 2001;Naik and Purohit 2001; Sahu and Sikdar 2008).Forty groundwater samples were collected frommanually operated tube wells. The samples werecollected in clean polyethylene bottles. Samplingbottles were soaked in 1:1 diluted HCl solu-tion for 24 h, washed three times with deionizedwaters, and washed again prior to each sam-pling with the sample water. During collection,the samples were filtered using the Whatman 40filter paper. Each of the groundwater sampleswere analyzed for 26 parameters such as pH,specific conductivity, total dissolved solids (TDS),total hardness (TH), bicarbonate, carbonate, chlo-ride, sulfate, phosphate, nitrate, fluoride, calcium,magnesium, sodium, potassium, iron, manganese,copper, arsenic, zinc, lead, total chromium, hexa-valent chromium, cadmium, nickel, and selenium.Immediately after sampling, the electrical conduc-tivity (EC), pH, carbonate, and bicarbonate ofthe groundwater samples were measured in thefield. EC and pH were measured using a 712Conductometer Metrohm (Swiss made) and 702
Table 2 Hydraulicparameters of the aquiferin and around ECW
Chaterji et al. (1964),Niyogi et al. (1966),Ghosh and Roy (1996),Banerjee and Khan(1982), Misra (2001), andBaksi and Associates(1996)
Sl no. Location Hydraulic Transmissivity Storativityconductivity (m2/day)(m/day)
1 Algaria, North 24-Parganas 209 5228 –(outside the study area)
2 Bidhannagar, Sector III – 3447 –3 Santoshpur – 2064 3.3 × 10⁻³
4 Harinabhi, South 24-Parganas – 640 –(outside the study area)
5 Rajpur, South 24-Parganas 20 900 –(outside the study area)
6 Jagulgachi, Bhangar I – 9935 –7 Kashipur, Bhangar II – 6514 –8 Benebook, Sonarpur – 2318 –
(outside the study area)9 Jadavpur – 2064 –10 Kasba – 2065 –11 Karaidanga 11.6 – –12 Khurigachi, Sonarpur 44.7 1912 3.78 × 10⁻⁵

126 Environ Monit Assess (2011) 174:119–134
Fig. 5 Spatial distributionof groundwater velocitymap of the area in andaround the ECW
SM Titrino pH meter (Swiss made), respectively,and carbonate and bicarbonate contents weredetermined titrimetrically against standard hy-drochloric acid (0.01 N).
The samples were taken to the laboratory with-in 3 h of collection, and during transportation,due care was taken to protect the water sam-ples from direct sunlight. In the laboratory, thesamples were filtered using a 0.45-μm Milliporefilter paper and acidified with ultrapure nitricacid for cation analyses. For anion analyses, thesesamples were refrigerated at 4◦C and analyzedwithin 24 h to 3 days. The anions and cations inthe groundwater samples were determined as perthe standard procedures (APHA 1995). Sodiumand potassium were analyzed using the Flamepho-
tometer (Systronics FPM digital model). Cal-cium and magnesium were estimated by the eth-ylenediaminetetraacetic acid (0.01 M) titrimetricmethod, whereas chloride was determined by ar-gentometric titration using standard silver nitrateas reagent. Sulfate content was determined bythe turbidity method using a spectrophotometer.Phosphate content was measured by a Milton-RaySpectronic 20 DC ultraviolet-visible spectropho-tometer. Nitrate was determined by the phenoldisulfonic acid method. Arsenic and iron wasmeasured using inductively coupled plasma-massspectrometer (ICP/MS). Manganese, copper, zinc,chromium, and cadmium were determined byPG STAT Autolab-30 along with 663 VA TraceAnalyser (Metrohm made in The Netherlands).

Environ Monit Assess (2011) 174:119–134 127
Fluoride was measured using fluoride ion elec-trode (ORION 720 AC). The analytical precisionfor the measurements of ions was determined bycalculating the ionic balance error, which is gener-ally within 5%.
The chemical analyses of the groundwater andthe percent compliance with the Indian (BIS10500 1991) and WHO (1993) standards aresummarized in Table 3. For assessment of wa-ter quality, 19 parameters were selected for 40groundwater samples. The nineteen parametersare pH, TDS, TH, bicarbonate, chloride, sulfate,nitrate, fluoride, calcium, magnesium, iron, man-ganese, copper, arsenic, zinc, lead, chromium, cad-mium, and selenium. An exhaustive discussion onWQI of the area in and around ECW can be foundin Sahu and Sikdar (2008).
The computed WQI values are classified intofive categories as follows:
<50 Excellent water50–100 Good water
100–200 Poor water200–300 Very poor water
>300 Water unsuitable for drinking
The spatial distribution of different groundwatertypes are illustrated in Fig. 6.
For proper assessment of the groundwater po-tential of the study area, it is important to estimatethe input and output components of groundwaterand changes in groundwater storage to draw upthe water balance for a selected period of time.
Table 3 Comparison of groundwater quality of the area with Indian and WHO drinking water standards
Parameters Concentration range Indian Percent WHO Percent
Maximum Minimum standard compliance limits compliance
pH 8.1 6.5 6.5–8.5 100 7.0–8.0 85Sp. conductivity (micromhs/cm at 25◦C) 4500 670 – – – –Total dissolved solids 2565 515 500 100 1000 75Total hardness as CaCO3 (mg/l) 820 220 300 12.5 – –Bicarbonate (mg/l) 555 280 – – – –Carbonate (mg/l) BDL BDL – – – –Chloride (mg/l) 1550 50 250 30 250 30Sulfate (mg/l) 118 <1.0 200 100 250 100Nitrate (mg/l) 0.74 0.28 45 100 50 100Phosphate (mg/l) 2.71 BDL – – – –Fluoride (mg/l) 1.19 BDL 1 95 – –Arsenic (mg/l) 0.07 BDL 0.05 97.5 0.01 92.5Sodium (mg/l) 132 49 – – 200 100Potassium (mg/l) 35 12 – – – –Calcium (mg/l) 416 71 75 15 75 15Magnesium (mg/l) 174 31 30 0 30 0Manganese (mg/l) 2.13 0.01 0.1 17.5 0.1 17.5Iron (mg/l) 20.20 0.20 0.3 7.5 0.3 7.5Copper (mg/l) BDL BDL 0.05 100 1.0 100Zinc (mg/l) 7.11 0.004 5 97.5 3.0 95Lead (mg/l) 0.28 BDL 0.05 97.5 0.01 97.5Hexavalent Chromium (mg/l) BDL BDL 0.05 100 0.05 100Total Chromium (mg/l) 0.04 BDL – – – –Cadmium (mg/l) BDL BDL 0.01 100 0.003 100Selenium (mg/l) BDL BDL 0.01 100 0.01 100Nickel (mg/l) BDL BDL – – 0.02 100
BDL Below detection limitDetection limit for copper, 0.002; arsenic, 0.003; lead, 0.01; chromium, 0.008; cadmium, 0.001; phosphate, 0.005; and selenium,0.001

128 Environ Monit Assess (2011) 174:119–134
Fig. 6 Spatial distributionof the water types basedon the WQI of the area inand around the ECW
The total quantity of groundwater flowing into theaquifer of the study area has been estimated byapplying the following Darcy’s equation of flow offluids through porous media:
Q = T.i.L,
where
Q Quantity of water flowing through a section ofaquifer (m3/day)
T Transmissivity (m2/day)i Hydraulic gradient (dimensionless) based on
premonsoon, 2005L Length of groundwater flow path in the sec-
tion of the aquifer under consideration andperpendicular to the flow path (m).
Through each section along the boundary of thestudy area, either recharge or discharge of ground-
water takes place, and it depends on the na-ture of local groundwater flow. Thirteen rechargesections and six discharge sections (Fig. 7) sur-rounding the study area have been consideredfor computation of groundwater recharge anddischarge, and the amount of recharge/dischargethrough each section is given in Table 4.
The groundwater potential zoning was carriedout under GIS environment using the ILWIS 3.3Academic Version. The choice among a set ofzones for future development of groundwater isbased on multiple criteria such as depth of piezo-metric surface with respect to ground surface,hydraulic conductivity of the aquifer, groundwa-ter velocity within the aquifer, and the WaterQuality Index (WQI). This process is most com-monly known as multi-criteria evaluation (MCE)(Voogd 1983). Of several methods available fordetermining interclass/intermap dependency, a

Environ Monit Assess (2011) 174:119–134 129
Fig. 7 Sections showingnatural groundwaterrecharge and outflow ofthe area in and aroundthe ECW
probability-weighted approach has been adoptedin the present study. This approach allows a lin-ear combination of probability weights of eachthematic map (W) with the individual impactvalue (IV) (Sarkar and Deota 2000; Sikdar et al.2004). The thematic maps have been ranked in ascale of 0 to 5, depending upon their suitabilityto hold groundwater. Different parameters havedifferent nature of control on groundwater poten-tial. For example, areas with higher conductivityvalues will have more water flowing through aunit cross-sectional area of the aquifer in unittime under unit hydraulic gradient and hence wereassigned higher rank (Table 5). On the contrary,higher value of groundwater velocity (v) is givena lower rating (Table 5) since high velocity re-duces the residence time of groundwater in a par-ticular location. Presence of piezometric surface
near the ground surface indicates high availabil-ity of groundwater. Hence, lower value of depthto piezometric surface is given a higher rating(Table 5). As far as qualitative aspect of ground-water is concerned, less value of WQI indicatesgood water quality; therefore, a higher rating isgiven to a lower WQI (Table 5). The rank of eachhas been converted to a probability weight usingBayesian statistics. These scores are again con-verted to impact values using Bayesian statistics.Similarly, different categories of derived thematicmaps have been assigned scores in a numeric scale0 to 5, depending on their capability to store andtransmit water. These scores are again convertedto impact values using Bayesian statistics. Thesecapability values (CVi) are then multiplied withthe respective probability weight of each thematicmap (Table 5) to arrive at the final weight map

130 Environ Monit Assess (2011) 174:119–134
Table 4 Groundwater recharge and discharge of the studyarea
Section Rate (m3/day)
RechargeR1 6.5 × 10³
R2 9.9 × 10³
R3 9.9 × 10³
R4 9.9 × 10³
R5 11.6 × 10³
R6 4.1 × 10³
R7 13.3 × 10³
R8 13.3 × 10³
R9 10.9 × 10³
R10 26.2 × 10³
R11 26.2 × 10³
R12 73.0 × 10³
R13 13.0 × 10³
Total recharge 227.8 × 10³
DischargeD1 9.9 × 10³
D2 9.3 × 10³
D3 8.3 × 10³
D4 7.3 × 10³
D5 8.2 × 10³
D6 21.9 × 10³
Total discharge 64.9 × 10³
(Fig. 8). This procedure of weighted linear com-bination dominates in raster-based GIS softwaresystems (Eastman et al. 1995; Eastman 1996).
Mathematically, this can be defined as
GW = f (K, v, Ps, WQI) ,
where
GW GroundwaterK Hydraulic conductivity of the aquiferv Groundwater velocityPs Depth to piezometric surfaceWQI Water Quality Index
Now, groundwater potential map values can beexpressed as
GWP = � Wi ∗ CVi,
where
GWP Groundwater PotentialWi Map weightCVi Capability valuei Parameter
Results
The subsurface geology of the area is completelyblanketed by the Quaternary fluviatile sediments,comprising a succession of silty clay, sand, and
Table 5 Thematic mapweights and capabilityvalues for groundwaterpotential zoning
Thematic layer Rank Map weight Category Rank Capability(Wi) value (CVi)
Depth to the 4 4/17 = 0.24 <5 5 0.33piezometric 5–9 4 0.27surface 9–13 3 0.20
13–17 2 0.13>17 1 0.07
Hydraulic 5 5/17 = 0.29 >40 5 0.33conductivity 30–40 4 0.27
20–30 3 0.2010–20 2 0.13<10 1 0.07
Groundwater 3 3/17 = 0.18 <5 5 0.33velocity 5–10 4 0.27
10–15 3 0.2015–20 2 0.13>20 1 0.07
Water quality 5 5/17 = 0.29 0–50 5 0.33index 50–100 4 0.27
100–200 3 0.20200–300 2 0.13>300 1 0.07

Environ Monit Assess (2011) 174:119–134 131
Fig. 8 Spatial distributionof groundwater potentialof the area in and aroundthe ECW
sand mixed with occasional gravel. In some places,along with silty clay, sticky clay is also presentat the top of the lithological column (Sikdar andSahu 2009). Lithologs of deep exploratory bore-holes, drilled by various agencies suggests the ex-istence of underlying Tertiary clay/silty clay at anaverage depth of 296 m (Sikdar 2000; Mukherjeeet al. 2007). This formation continues up to adepth of at least 614 m below the ground sur-face. These two fine-grained beds are dark gray incolor, sticky, and plastic to semiplastic in characterand also contain stringers of silt or fine sand. Inthe western part of the area in Kolkata city, thetop silty clay bed is very thick, generally 40 mand above. But the silty clay layer is conspicuouslyabsent at few places in the east, north, south,and central parts of the area due to the scouringaction of past channels of the River Bidyadhari. In
these areas, sands of various grades are observedthroughout the geological column. The Quater-nary aquifer of the area is sandwiched betweenthese two aquitards and comprises a sequenceof fine to coarse sand horizon mixed occasion-ally with gravel. The continuity of the sand layerthat forms the aquifer is broken by occasionalclay lenses of limited lateral extent (Sikdar 2000;Sikdar and Sahu 2009). An exhaustive discussionon the subsurface geological setup of Kolkata andECW can be found in Sikdar (2000), and Sikdarand Sahu (2009), respectively.
The subsurface geological set up indicates thatthe groundwater occurs under confined to semi-confined condition. Depth to piezometric surfacemap (Fig. 3) prepared using field-generated data,reveals that the piezometric surface rests at amuch deeper depths (17–18 m) in the western part

132 Environ Monit Assess (2011) 174:119–134
Table 6 Area covered by different groundwater potentialzone
Category Weight Area covered Percentage ofrange (sq km) the total area
Very poor 0.13–0.16 2.4 0.72Poor 0.16–0.20 104.0 31.14Medium 0.20–0.23 140.0 41.92Good 0.23–0.26 61.0 18.26Excellent 0.26–0.29 26.6 7.96Total 334.0 100.00
of the study area in Kolkata city compared tothat of the eastern part (3–4 m). This indicatesthat there is a huge groundwater withdrawal inKolkata city to the tune of 32 × 104 m3/day. Thehydraulic conductivity varies from 11 to 55 m/day(Table 1). The hydraulic conductivity map (Fig. 4)of the area indicates that the aquifer in thenorth-eastern part has higher conductivity values(30–40 m/day) than the south-western part wherethe hydraulic conductivity ranges in general be-tween 20 and 30 m/day with some pockets ofhigher and lower values. The groundwater ve-locity map of the area (Fig. 5) indicates thatthe western and central part of the area haslower velocity (5–10 m/day) compared to the east-ern part (>20 m/day). In the present study, thecomputed WQI values range from 48.7 to 605.9;therefore, groundwater of the area can be catego-rized into five types: “excellent water” to “waterunsuitable for drinking.” The spatial distributionmap of different groundwater types (Fig. 6) showsthat “excellent water” covers only 1.8 km2 ofthe total study area. Majority of the area is oc-
cupied by “good water,” and it covers about153.5 km2. The area covered by “poor water”and “very poor water” is 132.0 and 28.0 km2,respectively. In about a 18.2 km2 area, the wa-ter is unsuitable for drinking. The total quantityof groundwater flowing into the study area is227.8 × 103 m3/day. The total groundwater dis-charge (natural outflow, 64.9 × 10³ m3/day andthe anthropogenic groundwater withdrawal for ir-rigation purpose, 124.3 × 10³ m3/day; for drinkingpurpose, 97.8 × 10³ m3/day; and for industrialpurpose, 5.8 × 10³ m3/day) is 292.8 × 10³ m3/day.Therefore, the groundwater in the study area isbeing overextracted to the tune of 65 × 103 m3/daydue to huge withdrawal of groundwater in thewestern part of the study area in Kolkata city,where the rate of fall of piezometric surface isabout 0.4 m/year. Due to this overwithdrawal ofgroundwater, a major trough has developed inthis area. On the contrary, in the eastern part ofthe study area, the rate of fall of the piezometricsurface is only 0.06 m/year. This indicates that it isessential to carry out groundwater potential zon-ing so that areas suitable for future groundwaterabstraction are clearly defined.
The groundwater potential map of the studyarea (Fig. 8) is classified into five categories,namely, very poor, poor, medium, good, andexcellent. The weight range, area in square kilo-meters, and the percentage of the total area cov-ered by each category is given in Table 6. Thestudy of the groundwater potential map (Fig. 8)reveals that in the northwestern and western partsof the study area, the potential is poor due to the
Table 7 Hydrogeological and hydrodynamic characteristics of different groundwater potential zone
Category Depth to piezometric Hydraulic conductivity Groundwater velocity Water quality indexsurface (m) (m/day) (m/day)Range Average Range Average Range Average Range Average
Very poor 7–17 13.15 15.3–16.9 16.82 4.2–13.0 7.12 Good to unsuitable Veryfor drinking poor
Poor 4–17 11.70 15–27.9 17.85 2.5–16.2 7.58 Good to unsuitable Poorfor drinking water
Medium 3–15 7.41 15.2–33.1 21.53 2–11 5.68 Excellent to Goodvery poor water
Good 5–11 6.78 12.5–38.3 26.2 3–13 7.24 Excellent to poor Goodwater
Excellent 4–8 5.08 22–41 30.74 5.4–8.8 7.52 Good to poor Goodwater

Environ Monit Assess (2011) 174:119–134 133
present heavy withdrawal of groundwater. On thecontrary, good to very good groundwater poten-tial is observed in the southeastern part of thestudy area due to less groundwater withdrawal. Inthe west-central region (the Dhapa Manpur area),although groundwater withdrawal is not very high,groundwater potential is poor due to presence ofgroundwater with unsuitable-for-drinking quality.Due to the presence of poor quality water, thegroundwater potential of the northeastern part ofthe study area (in and around Hatisala) is alsopoor. In the northern part of the study area (atRajarhat), where a new township is coming up,the groundwater potential appears to be good.In the eastern part (at Karaidanga) where thenew leather complex has come up recently, thegroundwater potential is very good. The hydroge-ological and hydrochemical characteristics of eachcategory of groundwater potential zones are givenin Table 7.
Conclusions
The results described here demonstrates the de-gree to which the groundwater potential may varyover comparatively short distances in an appar-ently small homogeneous wetland due to bothgeologic and anthropogenic causes, illustratingthe importance of groundwater potential zoningof inland freshwater wetlands. In general, thegroundwater potential for future development inareas in and around ECW is medium, althougha few very small zones with very poor ground-water potential are present along a stretch ofwest to northeast. Apart from small pockets scat-tered throughout the area, there are three majorpockets having poor groundwater potential, andthey are present in the northwestern, central, andnortheastern parts of the area. In the southernand central parts, the groundwater potential isgood to excellent. In the zones with very poor topoor groundwater potential, occupying an area ofabout 106 km2, construction of new groundwaterabstraction structure should be prohibited. It isalso recommended that in these areas, groundwa-ter abstraction should be minimized and treatedsurface water supply system may be introduced.In urban areas with very poor to poor ground-
water potential, rooftop rainwater harvesting andartificial recharge may be made mandatory forhigh-rise buildings and industries. The areas withmedium potential (140 km2) groundwater abstrac-tion should be minimized by regulating tube welloperation time. Introduction of treated surfacewater supply is also recommended in these areas.It is also recommended that in the urban areas,falling under the medium groundwater poten-tial zone, rooftop rainwater harvesting should bemade mandatory for high-rise buildings and indus-tries. Zones with good to excellent groundwaterpotential covering about 87 km2 areas, groundwa-ter may be withdrawn for agricultural, drinking,domestic, and industrial purposes.
In general, the results described in this pa-per illustrate the importance of determining thegroundwater potential of inland freshwater wet-lands, which may vary over short distances. Suchunderstanding would be useful to the lawmak-ers, developers, and decision makers to chalk outstrategies for various development programs andto supply water for drinking, irrigation, and indus-trial purposes in and around a peri-urban wetlandecosystem.
Acknowledgements The authors convey thanks to theDirector of the Indian Institute of Social Welfare andBusiness Management for providing necessary infrastruc-ture and encouragement for the research work. The firstauthor is thankful to the Council of Scientific and IndustrialResearch (CSIR), India, for their financial assistance.
References
Al-Hadithi, M., Singhal, D. C., Israil, M., et al. (2003). Eval-uation of groundwater resources potential in Ratmau-Pathri Rao Watershed Haridwar District, Uttaranchal,India, using geoelectrical, remote sensing and GIStechniques. In: V. P. Singh & R. N. Yadava (Eds.),Ground water pollution (pp. 9–17). New Delhi: AlliedPublishers.
APHA (American Public Health Association) (1995).Standard methods for the examination of water andwaste water (16th ed.). Washington: American PublicHealth Association, American Water Works Associa-tion, and Water Pollution Control Federation.
Baksi and Associates (1996). A report on the geo-hydrological investigation work for the proposedCalcutta Leather Complex at Karaidanga, North 24-Parganas, West Bengal (pp. 1–164). UnpublishedProject Report.

134 Environ Monit Assess (2011) 174:119–134
BIS (Bureau of Indian Standards) 10500 (1991). Indianstandard drinking water-specification, 1st revision(pp. 1–8).
Banerjee, I., & Khan, D. K. (1982). Hydrogeology andgroundwater development potential of 24-Parganasdistrict, West Bengal. CGWB Technical Report, Series.D, 24, 1–31.
CGWB (Central Ground Water Board) (1994). Hydro-geology and ground water resources of South 24Parganas District, West Bengal. Technical Report,Series D, CGWB, Eastern Region, Calcutta, Govern-ment of India.
CGWB (Central Ground Water Board) (2004). Hydro-geology and ground water development of North 24Parganas District, West Bengal. Technical Report,series D, CGWB, Eastern Region, Kolkata, Govern-ment of India.
Chaterji, G. C., Biswas, A. B., Basu, S., Niyogi, B. N.,et al. (1964). Geology and groundwater resourcesof the Greater Calcutta Metropolitan Area, WestBengal. Bulletin Geological Survey of India Sr., B21,1–150.
Cooper, D. J., MacDonald, L. H., Wenger, S. K., Woods,S. W., et al. (1998). Hydrologic restoration of a fenin Rocky Mountain National Park, Colorado, USA.Wetlands, 18, 335–345.
Drexler, J. Z., Bedford, B. L., DeGaetano, A. T.,Seigal, D. I., et al. (1999). Quantification of wa-ter budget and nutrient loading in a small peatland.Journal of American Water Resource Association, 35,753–769.
Eastman, J. R. (1996). Multi-criteria evaluation and GIS.In P. A. Longley, M. F. Goodchild, D. J. Magurie, &D. W. Rhind (Eds.), Geographical information systems(2nd ed., Vol. 1, pp. 493–502). New York: Wiley.
Eastman, J. R., Jin, W., Kyemi, P. A. K., Toledano, J.,et al. (1995). Raster procedure for multi-criteria/multi-objective decisions. Photogrammetric Engineering andRemote Sensing, 61, 539–547.
Folk, R. L. (1965). Petrology of sedimentary rocks (pp. 190).Austin, Texas: Hemphill Publishing Company.
Ghosh, A., & Roy, A. (1996). Aquifer characteristicsand development of groundwater at Sonarpur Dist.24-Parganas (South). In Proceedings of Seminar onAquifer characteristics and groundwater managementin Eastern India (pp. 27–39). Calcutta: Department ofGeological Sciences, Jadavpur University.
Masch, F. D., & Denny, K. J. (1966). Grain size distributionand its effect on permeability of unconsolidated sand.Water Resources Research, 2, 665–672.
Mishra, P. C., & Patel, R. K. (2001). Study of the pollutionload in the drinking water of Rairangpur, a small tribaldominated town of North Orissa. Indian Journal ofEnvironment and Ecoplan, 5(2), 293–298.
Misra, A. K. (2001). Hydrogeology and groundwater re-source management in South 24 Parganas District andCalcutta Municipal Corporation area, West Bengal.
Unpublished Ph.D. thesis, Jadavpur University, India.Mukherjee, A., Fryar, A. E., Howell, P. D., et al. (2007).
Regional hydrostratigraphy and groundwater flowmodeling in the arsenic-affected areas of the west-ern Bengal basin, West Bengal, India. HydrogeologyJournal, 15, 1397–1418.
Naik, S., & Purohit, K. M. (2001). Studies on water qual-ity of river Brahmani in Sundargarh district, Orissa.Indian Journal of Environment and Ecoplan, 5(2),397–402.
Niyogi, B. N., Das Gupta, A. V., Gangopadhyay, M. K.,et al. (1966). A preliminary report of the explo-ration of groundwater resources of the CalcuttaMetropolitan District. Unpublished report, GeologicalSurvey of India.
Owen, C. R. (1995). Water budget and flow pattern inan urban wetland. Journal of Hydrology, 169, 171–187.
Sahu, P., & Sikdar, P. K. (2008). Hydrochemical frameworkof the aquifer in and around East Calcutta Wetlands,West Bengal, India. Environmental Geology, 55(4),823–835.
Sarkar, B. C., & Deota, B. S. (2000). A geographic infor-mation system approach to groundwater potential ofShamri microwatershed in the Shimla Taluk, HimachalPradesh. Unpublished Project Report GeoinformaticsDivision, IIRS, NRSA, Dehradun.
Sikdar, P. K. (2000). Geology of the Quaternary aquifersof the twin city of Calcutta-Howrah. Journal of theGeological Society of India, 56(8), 169–186.
Sikdar, P. K., & Bhattacharya, P. (2003). Groundwater riskanalysis and development plan of Calcutta. In S. P.Das Gupta (Ed.), Environmental issues for the 21stcentury (pp. 83–119). New Delhi: Mittal Publishers.
Sikdar, P. K., Chakraborty, S., Adhya, E., Paul, P. K., et al.(2004). Landuse/landcover changes and groundwaterpotential zoning in and around Raniganj Coal MiningArea, Bardhaman district. W.B.—A GIS and remotesensing approach. Journal of Spatial Hydrology, 4(2),1–24.
Sikdar, P. K., & Sahu, P. (2009). Understanding wetlandsub-surface hydrology using geologic and isotopic sig-natures. Hydrology and Earth System Sciences, 13,1313–1323.
Sreedevi, P. D., Subrahmanyam, K., Ahmed, S., et al.(2005). Integrated approach for delineating potentialzones to explore for groundwater in the Pageru Riverbasin, Cuddapah District, Andhra Pradesh, India.Hydrogeology Journal, 13(3), 534–543.
Tiwari, T. N., & Mishra, M. A. (1985). A preliminary as-signment of water quality index of major Indian rivers.Indian Journal of Environmental Protection, 5, 276–279.
Voogd, H. (1983). Multi-criteria evaluation for urban andregional planning. London: Pion.
WHO (World Health Organization) (1993). Guideline fordrinking water quality (2nd ed., pp. 188).