Review of Urban Wastewater Management and Clean Water Act
37
DISCUSSION PAPER SERIES NO. 2021-46 DECEMBER 2021 Review of Urban Wastewater Management and Clean Water Act Sonny N. Domingo and Arvie Joy A. Manejar The PIDS Discussion Paper Series constitutes studies that are preliminary and subject to further revisions. They are being circulated in a limited number of copies only for purposes of soliciting comments and suggestions for further refinements. The studies under the Series are unedited and unreviewed. The views and opinions expressed are those of the author(s) and do not necessarily reflect those of the Institute. Not for quotation without permission from the author(s) and the Institute. CONTACT US: RESEARCH INFORMATION DEPARTMENT Philippine Institute for Development Studies 18th Floor, Three Cyberpod Centris - North Tower EDSA corner Quezon Avenue, Quezon City, Philippines [email protected] (+632) 8877-4000 https://www.pids.gov.ph
-
Upload
khangminh22 -
Category
Documents
-
view
0 -
download
0
Transcript of Review of Urban Wastewater Management and Clean Water Act

DISCUSSION PAPER SERIES NO. 2021-46
DECEMBER 2021
Review of Urban Wastewater Management and Clean Water Act
Sonny N. Domingo and Arvie Joy A. Manejar
The PIDS Discussion Paper Series constitutes studies that are preliminary and subject to further revisions. They are being circulated in a limited number of copies only for purposes of soliciting comments and suggestions for further refinements. The studies under the Series are unedited and unreviewed. The views and opinions expressed are those of the author(s) and do not necessarily reflect those of the Institute. Not for quotation without permission from the author(s) and the Institute.
CONTACT US:RESEARCH INFORMATION DEPARTMENTPhilippine Institute for Development Studies
18th Floor, Three Cyberpod Centris - North Tower EDSA corner Quezon Avenue, Quezon City, Philippines
[email protected](+632) 8877-4000 https://www.pids.gov.ph

Review of Urban Wastewater Management and Clean Water Act
Sonny N. Domingo Arvie Joy A. Manejar
PHILIPPINE INSTITUTE FOR DEVELOPMENT STUDIES
December 2021

i
Abstract Wastewater and pollution management issues are usual negative externalities in the pursuit of economic development. This is true in the Philippines where industrial and domestic refuse often end up in tributaries and major water ways, sometimes even contaminating ground water due to improper septage and sewerage design. The passage of the Clean Water Act (Republic Act No. 9275), and the subsequent launching of the National Sewerage and Septage Management Plan (NSSMP) were expected to facilitate the accomplishment of water sectoral targets. While acknowledged to be an integral component of the country’s development agenda, wastewater management’s requirements for large scale investments and resources were often overlooked and underfunded, adding to target shortfalls. The sector also remained plagued with institutional fragmentation and disjointed efforts in the absence of an overarching framework and master plan. In view of these challenges, the study echoes the call to rationalize the sector’s institutional governance, and development direction. Improved septage coverage and standardization guidelines are viable short run intervention, while the national government orchestrates and the local government units muster interest in investing on sewerage facilities. Keywords: clean water act, wastewater management, sewage, septage, sanitation, effluent

ii
Table of Contents 1. Introduction ........................................................................................................... 1
1.1. Background of the Study...................................................................................... 1 1.2. Objectives ............................................................................................................ 1 1.3. Policy questions ................................................................................................... 2 1.4. Methodology ........................................................................................................ 2
2. National landscape ................................................................................................ 4 2.1. Water supply ........................................................................................................ 4 2.2. Wastewater management .................................................................................... 6 2.3. Prevailing policies ................................................................................................ 9 2.4. Sector goals and commitments .......................................................................... 11 2.5. Institutional arrangements .................................................................................. 13 2.6. Infrastructure Financing and Tariffs ................................................................... 13
3. Urban focus: Metro Manila.................................................................................. 15 3.1. Background and caveats ................................................................................... 15 3.2. Wastewater management .................................................................................. 18
4. Challenges ........................................................................................................... 23 5. Conclusion ........................................................................................................... 24 6. Recommendations .............................................................................................. 25
6.1. Revamping institutions: Lessons from Singapore .............................................. 25 6.2. Regulations and standards ................................................................................ 26 6.3. Ramping up investments ................................................................................... 27 6.4. Research and development ............................................................................... 28 6.5. Private sector participation ................................................................................. 28
7. References ........................................................................................................... 29 8. Annexes ............................................................................................................... 30
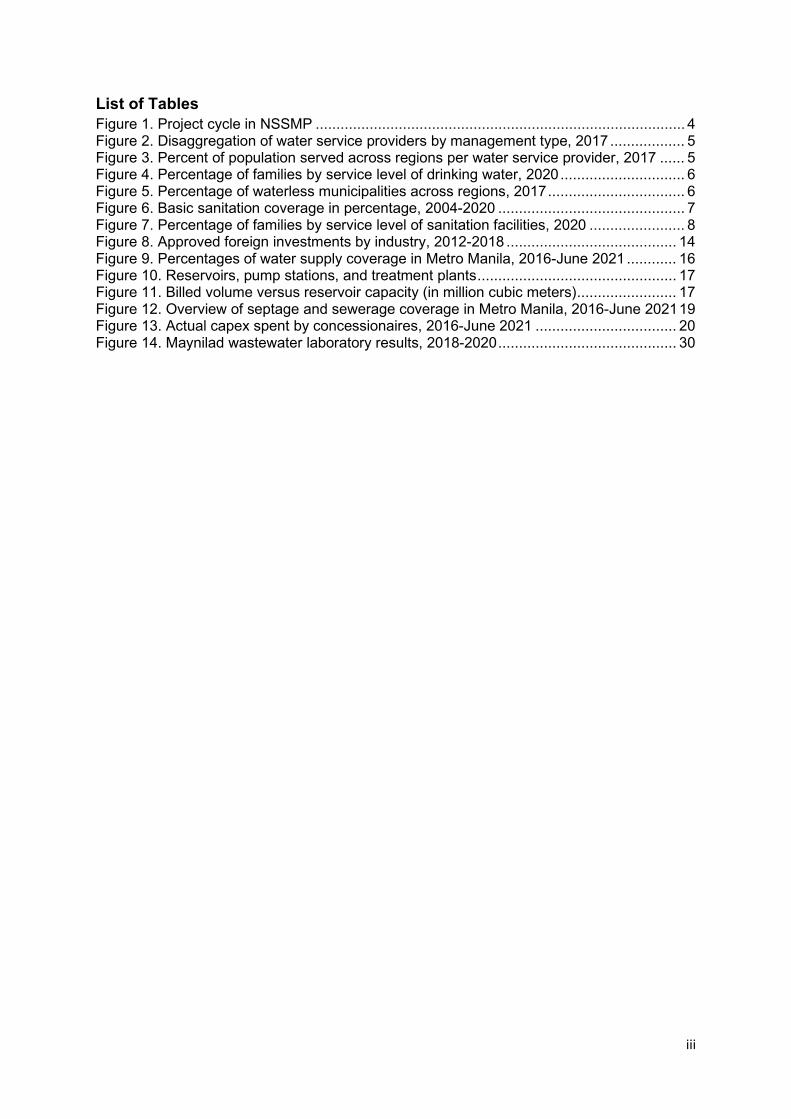
List of Figures Figure 1. Project cycle in NSSMP ......................................................................................... 4 Figure 2. Disaggregation of water service providers by management type, 2017 .................. 5 Figure 3. Percent of population served across regions per water service provider, 2017 ...... 5 Figure 4. Percentage of families by service level of drinking water, 2020 .............................. 6 Figure 5. Percentage of waterless municipalities across regions, 2017 ................................. 6 Figure 6. Basic sanitation coverage in percentage, 2004-2020 ............................................. 7 Figure 7. Percentage of families by service level of sanitation facilities, 2020 ....................... 8 Figure 8. Approved foreign investments by industry, 2012-2018 ......................................... 14 Figure 9. Percentages of water supply coverage in Metro Manila, 2016-June 2021 ............ 16 Figure 10. Reservoirs, pump stations, and treatment plants ................................................ 17 Figure 11. Billed volume versus reservoir capacity (in million cubic meters) ........................ 17 Figure 12. Overview of septage and sewerage coverage in Metro Manila, 2016-June 2021 19 Figure 13. Actual capex spent by concessionaires, 2016-June 2021 .................................. 20 Figure 14. Maynilad wastewater laboratory results, 2018-2020 ........................................... 30
iii
List of Tables Figure 1. Project cycle in NSSMP ......................................................................................... 4 Figure 2. Disaggregation of water service providers by management type, 2017 .................. 5 Figure 3. Percent of population served across regions per water service provider, 2017 ...... 5 Figure 4. Percentage of families by service level of drinking water, 2020 .............................. 6 Figure 5. Percentage of waterless municipalities across regions, 2017 ................................. 6 Figure 6. Basic sanitation coverage in percentage, 2004-2020 ............................................. 7 Figure 7. Percentage of families by service level of sanitation facilities, 2020 ....................... 8 Figure 8. Approved foreign investments by industry, 2012-2018 ......................................... 14 Figure 9. Percentages of water supply coverage in Metro Manila, 2016-June 2021 ............ 16 Figure 10. Reservoirs, pump stations, and treatment plants ................................................ 17 Figure 11. Billed volume versus reservoir capacity (in million cubic meters) ........................ 17 Figure 12. Overview of septage and sewerage coverage in Metro Manila, 2016-June 2021 19 Figure 13. Actual capex spent by concessionaires, 2016-June 2021 .................................. 20 Figure 14. Maynilad wastewater laboratory results, 2018-2020 ........................................... 30
1
Review of Urban Wastewater Management and Clean Water Act
Sonny N. Domingo and Arvie Joy A. Manejar1
1. Introduction
1.1. Background of the Study Sanitation and waste-water management are often correlated with issues on public health, economic progression, environmental integrity, and climate change. Such makes this discourse critically relevant to the country’s evolving development agenda.
OECD’s observation and projection of increasing water stress, including the complications from climate change, raise the stakes for at-risk and disadvantaged communities2. In Metro Manila alone, approximately 2,000 cubic meters of solvent wastes, 22,000 tons of heavy metals, infectious wastes, biological sludge, lubricants, intractable wastes, as well as 25 million cubic meters of acid/alkaline liquid wastes are improperly disposed of annually. However, only five percent3 of the population is connected to sewerage networks and treatment facilities, equivalent to only around 440,000 households being serviced.
The compounding problems of open defecation, inadequate sanitation facilities, and unmanaged discharge of wastewater into water bodies subject communities to health hazards and contribute to unmitigated environmental damage (Agcaoili et al. 2015; Buonocore et al. 2018). Annual losses are conservatively estimated at about PHP 67 billion, the biggest for tourism at PHP 47 billion, and fisheries at PHP 3 billion (Bergkamp & Lim 2018).
The passage of Philippine Clean Water Act of 2004 (Republic Act No. 9275) and the eventual rollout of the National Sewerage and Septage Management Program (NSSMP) both aimed to address the above situational concerns and emerging threats. The study looked into relevant policy provisions and grounding, while bringing to light the current priorities and concerns of select case study sites, including insights from the biggest water concessionaires in the National Capital Region, and the local government initiatives of the City of Baguio in the northern Philippines.
1.2. Objectives The study generally reviewed waste-water related policy and implementation, particularly in select urban case study sites. Specifically, the study (a) assessed the National Sewerage and Septage Management Program (NSSMP) vis-à-vis policy declarations under the Clean Water Act; (b) identified existing wastewater management arrangements and corresponding sewerage and treatment coverage in both national and subnational levels; (c) Reviewed institutional structures and financing mechanisms vital to implementation of the policy; and, (d) mapped persistent and emerging concerns across case studies and the bigger literature landscape and identification of areas for intervention.
1 Senior Research Fellow and Research Specialist respectively, Philippine Institute for Development Studies 2 “At least 1.8 million children under 5 years old die every year or one every 20 seconds because of water and sanitation-related diseases” (Pham & Kuyama 2013; OECD 2012). 3 Philippine Development Plan 2017-2022

2
1.3. Policy questions Wastewater management in the Philippines started way back in the 1970s, but the problem remained unabated, and the quality of water bodies and watersheds continued to degrade over the years. The passage of Clean Water Act sought to jointly address the problem of water pollution and sewerage provision, protecting natural resources and human health.
The study sought to answer the following policy questions:
• What is the status of implementation of policy provisions on wastewater management?
• How has the NSSMP bridged compliance to the provisions of the Clean Water Act?
• What policy augmentations can be made to facilitate the implementation of NSSMP and RA 9275?
1.4. Methodology
1.4.1. Conceptual framework The Clean Water Act and NSSMP were assessed within the process evaluation framework; the concept allowed to pinpoint the services provided, the recipients, and the extent given. Through this method, one could identify strengths and weaknesses of the program during the implementation process and where improvements could come in.
The following table was adapted from the studies of Capodaglio (2017) in assessing decentralized water management systems and Robinson (2003) using Methodology for Participatory Assessments (MPA) on sanitation services.
Table 1. Process evaluation indicators Activities Sub-activities Immediate Outcomes Indicators Streamline procedures in water pollution abatement
Domestic sewage collection, treatment, and disposal Industrial sewage systems within PEZA
Increased sewerage access and coverage
Number of households with access Number of economic zones with water management systems
Promote environmental strategies
Establishment of wastewater treatment plants Use of technology for reuse
Increased service coverage of WWTPs Available by-products for reuse
Number of treatment plants Number of septic tanks connected to treatment plants Valuation of reused by-products (energy, biosolids) BOD diverted, amount of sludge reused and effluents treated

3
Formulate holistic national program of water quality management
Clear functional delineations among institutions and entities
Increased coordination among institutions and entities
No overlaps and conflicts in functions and policy objectives Data on water-related diseases Accrued and mitigated loss from water bodies (fishing income, other ecosystem services, flood and typhoon damage)
Enforce accountability systems on adverse impacts
Functional and appropriate charge systems Functional liability mechanisms Available incentives and rewards
Commensurate to cover costs of water management Fines and penalties go to national and area funds Incentive mechanisms are accessed
Cost of infrastructure related to wastewater management Cost effectiveness on discharge fees Expenditure list of fines and penalties vis-à-vis existing funds Amount of cash incentives availed; number of entities included in the priority list since 2004
Indicators followed the project cycle detailed in the NSSMP, allowing for triangulation of results from literature and policy, data outputs, and case studies.

4
Figure 1. Project cycle in NSSMP
1.4.2. Data collection and analysis The data gathering followed the case study approach of Gamaralalage, Gilby, & Lee (2015). Primary data were collected through key informant interviews (KII) and focus group discussions (FGD) with key implementers and concessionaires while secondary data were generated from various databases.
Table 2. List of data sources Primary data Secondary data Maynilad OpenStat Manila Water Listahang Tubig Baguio City NEDA PH Water Supply and Sanitation Master
Plan DENR – Water Quality Management Division Annual Poverty Indicators Survey National Demographics and Health Survey
2. National landscape
2.1. Water supply Unnamed water service providers4 dominated the number of suppliers with 31.74 percent share in composition. Following next were Barangay Waterworks and Sanitation Association
4 They serve a minimum of 15 households but do not have formal registration with the government. Definition from Philippine Water Supply and Sanitation Master Plan 2019-2030
Sanitation planning
Sewerage / septage
design
Feasibility
Technical & financial
application and selection
Procurement
Construction
Operation and
maintenance
Monitoring and
evaluation

5
(BWSA), LGU-run utilities, private operators, and Rural Waterworks and Sanitation Association (RWSA).
Figure 2. Disaggregation of water service providers by management type, 2017
Source: Listahang Tubig 2017
In terms of percent of population served however, water districts dominated the landscape in all regions, followed by private/others and LGU-led utilities. Region VII had 102 percent of its population served with various providers while ARMM had a concerning figure of only 12.40 percent.
Figure 3. Percent of population served across regions per water service provider, 2017
Source: Listahang Tubig, 2017 Figures for basic service level in terms of drinking water were relatively high. NCR was highest in coverage with 99.39 percent, followed by Ilocos Region, Central Luzon, and CALABARZON. BARMM, aside from being the only region below 80 percent, also had 8.34 percent limited service, 15.18 percentage unimproved, and 3.16 percent surface water.
0.02%
0.18%
0.43%
0.85%
1.52%
1.62%
2.56%
4.68%
5.71%
7.17%
16.85%
26.67%
31.74%
Ship Chandler
Industrial Locator
Real Estate Developer
Peddles
Home Owners' Association
Cooperative
Water District
Refilling Stations
RWSA
Other Private Operators
LGU-Run Utility
BWSA
Unnamed Water Service Provider
76.50
51.1142.00
73.04 70.00
51.90
66.36
47.95
102.00
81.12
59.00
81.94
48.1953.30
83.14
12.40
0
20
40
60
80
100
120
in p
erce
ntag
e
WDs LGU-led BWSA RWSA Private/Others Total % of pop served

6
Figure 4. Percentage of families by service level of drinking water, 2020
Consistent with the observations above, ARMM had the highest waterless municipalities. This strongly indicated the need to catch up with the other regions’ water service coverage and access.
Figure 5. Percentage of waterless municipalities across regions, 2017
Source: Listahang Tubig 2017
2.2. Wastewater management National coverage of toilet facilities showed slight fluctuations across the years, suggesting household movements from improved to unimproved sanitation. PSA defined basic sanitation services as presence of non-shared, improved sanitation facility with hygienic separation of human excreta from human contact.
99.39 98.4 97.41 96.98 95.53 94.48 94.28 94.04 92.31 91.71 91.06 90.91 90.46 89.14 88.78 85.96
73.32
0102030405060708090
100
perc
enta
ge
Basic Limited Unimproved Surface Water
0.00%
1.54%
9.60%
10.49%
11.11%
11.83%
11.96%
12.68%
14.86%
15.58%
15.91%
18.37%
21.93%
26.00%
30.08%
73.73%
Region IV-B
Region III
Region I
Region VIII
Region IX
Region X
Region II
Region IV-A
Region XIII
CAR
Region VII
Region XI
Region V
Region XII
Region VI
ARMM

7
In Figure 6, the highest coverage was recorded in 2016 followed by an immediate fluctuation to 75.60 in 2017. Most recent figure pegged the percentage at 80.31 in 2020.
Figure 6. Basic sanitation coverage in percentage, 2004-2020
Source: Compiled from various sources (APIS, FIES, Philippine Water Supply and Sanitation Master Plan 2021) More than three fourths of the population have access to improved and not shared sanitation facilities, but open defecation persisted in three to four percent of the population (Table 3). The latter condition was aimed to be eradicated in several commitments and development goals.
Table 3. Breakdown of sanitation facilities in the Philippines, 2016-2020 Type of sanitation facilities 2020 2019 2018 2017 2016
Improved, not shared facility5 80.39 81.57 75.60 87.20 Flush to piped sewer system 7.44 9.93 5.90 Flush to septic tank 61.04 55.18 67.10 84.50 Flush to pit latrine 9.97 14.30 2.30 Ventilated improved pit latrine 0.92 0.96 0.00 Pit latrine with slab 0.98 1.11 0.20 2.70 Composting toilet * 0.10 0.00 Unimproved sanitation 16.09 14.68 24.40 Shared facility 13.49 10.93 19.60 Flush to piped sewer system 1.06 1.05 1.10 Flush to septic tank 10.31 7.57 17.50 Flush to pit latrine 1.56 1.94 0.70
5 “Improved sanitation facilities are designed to hygienically separate excreta from human contact. These include wet sanitation technologies (flush and pour flush toilets connecting to sewers, septic tanks or pit latrines) and dry sanitation technologies (ventilated improved pit latrines; pit latrines with slabs; or composting toilets)” (PSA 2019, p.17).
68.9075.80
72.80 74.1077.90 78.10 76.50 75.10 76.60 73.80
87.20
75.6081.57 80.31
0.00
10.00
20.00
30.00
40.00
50.00
60.00
70.00
80.00
90.00
100.00
2004 2006 2007 2008 2009 2010 2011 2013 2014 2015 2016 2017 2019 2020
perc
enta
ge

8
Ventilated improved pit latrine 0.17 0.10 0.00 Pit latrine with slab 0.32 0.23 0.10 Composting toilet * - 0.00 Unimproved facility 2.60 3.75 1.90 Flush to open drain 1.14 1.29 0.90 Flush to don't know where 0.26 0.55 Pit latrine without slab/open pit 0.24 0.44 0.50 2.70 Bucket * * 0.10 0.30 Hanging toilet/hanging latrine 0.49 0.68 0.30 0.80 Public Toilet 0.40 0.51 0.10 Other * 0.15 0.10 4.20 No facility/bush/field 3.53 3.75 3.00
Source: NDHS 2017, APIS 2016, 2019 and 2020 Notes: (1) Classifications based on WHO/UNICEF JMP Report 2017; (2) An asterisk indicates that a figure is based on fewer than 25 unweighted cases and has been suppressed. BARMM (formerly ARMM) also exhibited low figures for the sanitation sector; it only recorded 39.26 percent coverage, but the region has high percentage of open defecation and unimproved sanitation. The highest coverage figures were recorded in Region II, Region IV-A, and Region III while the capital region with most HUCs, NCR, ranked only 12th.
Figure 7. Percentage of families by service level of sanitation facilities, 2020
Source: APIS 2020 Urban areas have higher basic service level coverage than rural areas, the latter having higher open defecation incidence. Communal facilities with septic tanks were commonly set in these areas, but desludging and transport costs to remote places have been noted to be expensive for lower quintile users.
Basic coverage decreased in both urban and rural areas compared to 2019 figures, but limited coverage grew. This supported the observation of movements in sanitation access which can
0102030405060708090
100
Caga
yan
Valle
y
CALA
BARZ
ON
Cent
ral L
uzon
Cara
ga
CAR
Iloco
s Reg
ion
Nor
ther
n M
inda
nao
East
ern
Visa
yas
MIM
ARO
PA
Wes
tern
Visa
yas
Zam
boan
ga P
enin
sula
NCR
Bico
l
Cent
ral V
isaya
s
SOCC
SKSA
RGEN
Dava
o
BARM
M
perc
enta
ge
Basic Limited Unimproved Open Defecation

9
be attributed to several things: population growth, migration, and economic performances, among others.
Table 4. Comparison of sanitation facilities between urban and rural, 2019-2020 Service level 2019 2020
Urban Rural Urban Rural No. of families (in ‘000) 13,041 12,269 13,332 12,516 Basic6 82.8 80.2 80.9 79.9 Limited7 12.2 9.6 15.7 11.2 Unimproved8 2.9 4.6 1.8 3.4 Open defecation9 2.1 5.5 1.6 5.6
Source: APIS 2019 and 2020s
2.3. Prevailing policies Clean Water Act (RA 9275, 2004)10 informed subsequent policies and regulations in the sector. It had the primary goal of protecting water bodies from domestic, commercial, and industrial discharges, all land-based sources of pollution. The policy, at the moment of its inception and during its first years of implementation, did not consider uncontrolled and unmitigated sewage as a contributing factor yet but focused instead on ensuring the connectivity of all sewage lines to sewerage systems five years within its passage.
To achieve this, the IRR spotlighted key actions: designation of the water quality management areas (WQMAs), development of the National Sewerage and Septage Management Plan (NSSMP), provision of water supply and sewerage to highly urbanized cities, and prescription of wastewater discharge fees. The preparation of NSSMP, in particular, was aligned with the frameworks of the National Sustainable Sanitation Plan (NSSP) and the Philippine Sustainable Sanitation Roadmap in addressing the full spectrum of sanitation challenges (DPWH 2013).
NEDA and DPWH11 jointly headed the Technical Working Group (TWG) and Inter-agency Steering Committee in charge of the implementation of NSSMP. The general goal of NSSMP to improve water quality and public health in urban centers by 2020 fit well with the combined perspective of economic development and infrastructure. This was further supplemented with the more specific objectives namely, to enhance the capacity of local implementers to construct, maintain, and operate wastewater treatment systems; foster an enabling environment for effective and sustainable systems, and encourage bottom-up relationships by providing national support in resources and incentives (DPWH 2013).
Launched in 2010, the program’s initial coverage was intended only for highly urbanized cities and first-class municipalities. It offered a 40 percent national government subsidy for sewerage projects with the following partnership options: (a) LGU and water district, (b) LGU only, (c) LGU and private partners, and (d) tripartite agreement among LGU, WD, and private partners.
6 Use of improved facilities not shared with neighbors or other households 7 Use of improved facilities shared between two or more households 8 Includes pit latrines without a slab or platform, hanging latrines or bucket latrines 9 Disposal of human feces in the surrounding environment, any open space, or with solid waste 10 Its IRR was released in 2005 through DENR Administrative Order 2005-10 11 Local Water Utilities Authority, DENR, DOH, and MWSS and its concessionaires are also active members of the steering committee and TWG.
10
An influx of interest and inclusion concerns led to amendments12 in 2017, including the extension of coverage to non-HUCs and an increase of assistance to 50 percent across sewerage, septage, and combined sewerage and septage projects.
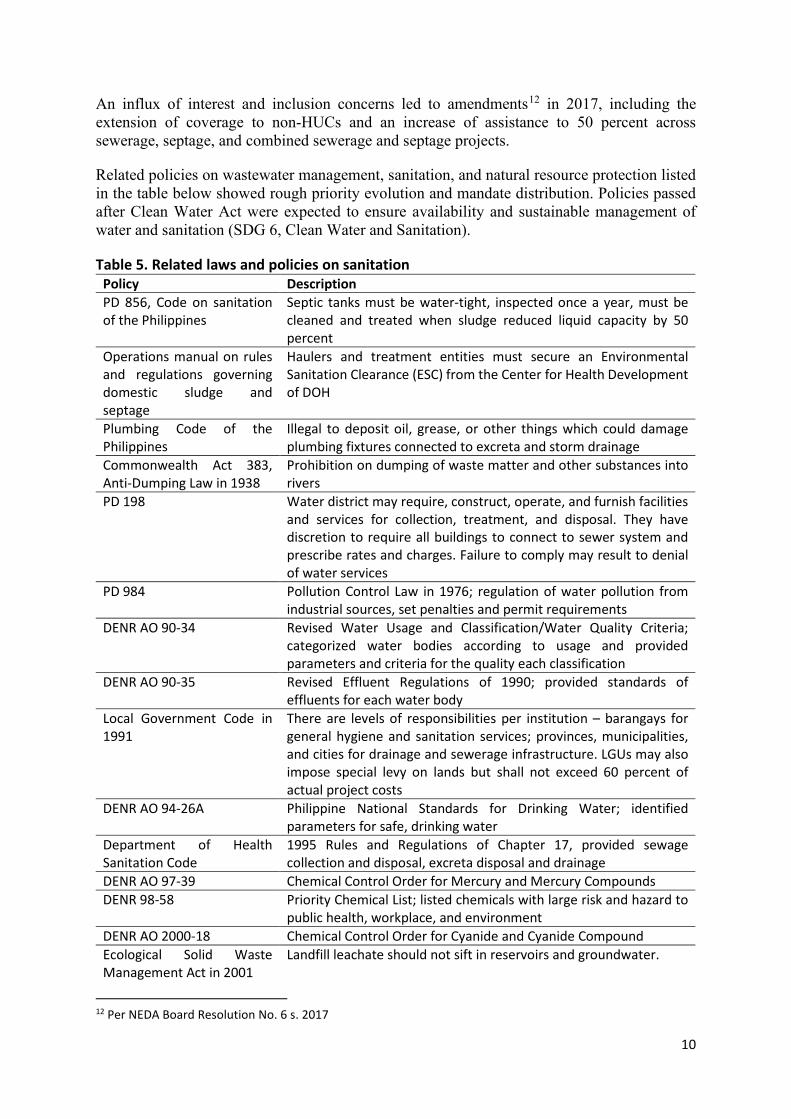
Related policies on wastewater management, sanitation, and natural resource protection listed in the table below showed rough priority evolution and mandate distribution. Policies passed after Clean Water Act were expected to ensure availability and sustainable management of water and sanitation (SDG 6, Clean Water and Sanitation).
Table 5. Related laws and policies on sanitation Policy Description PD 856, Code on sanitation of the Philippines
Septic tanks must be water-tight, inspected once a year, must be cleaned and treated when sludge reduced liquid capacity by 50 percent
Operations manual on rules and regulations governing domestic sludge and septage
Haulers and treatment entities must secure an Environmental Sanitation Clearance (ESC) from the Center for Health Development of DOH
Plumbing Code of the Philippines
Illegal to deposit oil, grease, or other things which could damage plumbing fixtures connected to excreta and storm drainage
Commonwealth Act 383, Anti-Dumping Law in 1938
Prohibition on dumping of waste matter and other substances into rivers
PD 198 Water district may require, construct, operate, and furnish facilities and services for collection, treatment, and disposal. They have discretion to require all buildings to connect to sewer system and prescribe rates and charges. Failure to comply may result to denial of water services
PD 984 Pollution Control Law in 1976; regulation of water pollution from industrial sources, set penalties and permit requirements
DENR AO 90-34 Revised Water Usage and Classification/Water Quality Criteria; categorized water bodies according to usage and provided parameters and criteria for the quality each classification
DENR AO 90-35 Revised Effluent Regulations of 1990; provided standards of effluents for each water body
Local Government Code in 1991
There are levels of responsibilities per institution – barangays for general hygiene and sanitation services; provinces, municipalities, and cities for drainage and sewerage infrastructure. LGUs may also impose special levy on lands but shall not exceed 60 percent of actual project costs
DENR AO 94-26A Philippine National Standards for Drinking Water; identified parameters for safe, drinking water
Department of Health Sanitation Code
1995 Rules and Regulations of Chapter 17, provided sewage collection and disposal, excreta disposal and drainage
DENR AO 97-39 Chemical Control Order for Mercury and Mercury Compounds DENR 98-58 Priority Chemical List; listed chemicals with large risk and hazard to
public health, workplace, and environment DENR AO 2000-18 Chemical Control Order for Cyanide and Cyanide Compound Ecological Solid Waste Management Act in 2001
Landfill leachate should not sift in reservoirs and groundwater.
12 Per NEDA Board Resolution No. 6 s. 2017

11
DA AO 2007-26 Guidelines on the Procedures and Technical Requirements for the Issuance of a Certification, Allowing the Safe Re-Use of Wastewater for Purposes of Irrigation and other Agricultural Uses.
PEZA 2009-19 Guidelines on Wastewater Management; requires all economic zones to have a centralized wastewater treatment facility. Monitoring will be done by an accredited pollution control officer or environmental management officer.
PNS/BAFS 183:2016 Philippine National Standard on Organic Soil Amendments; regulation of sludge, biosolids, and biochar sold to the market
DENR AO 2016-08 Water Quality Guidelines and General Effluent Standards (GES); provides additional 16 parameters to monitor the industry with. Industries were given a grace period of five years to comply.
Source: DPWH 2013; Bergkamp & Lim 2018
2.4. Sector goals and commitments Despite the initial high interest, uptake for NSSMP eventually dwindled down due to preference for sewerage systems. These entailed capital expenses, and costs of operating and maintenance were considered heavy13 for a non-HUC and non-first class LGU. Since the subsidy was capped at 50 percent, an alternative route offered by DPWH was assistance in feasibility studies. Only Zamboanga City availed of the program as of October 2021 with a subsidy worth PHP 79.3 million, seconded by Cotabato City’s application under review14.
Table 6. Status of NSSMP applications, 2012-2020 Fiscal year LGU Status 2012 Puerto Galera (non-HUC) Letter of intent 2013 Baguio City Requested for other documents 2013 Isabela City Water District (non-HUC) Requested for other documents 2013 Metropolitan Naga WD Awaiting other documents 2013 Zamboanga City Approved as of 2020 2014 Roxas, Palawan Awaiting other documents 2014 General Santos City WD Requested grant for feasibility study 2014 Olongapo City Requested for 100% subsidy; does not
conform to 40% NG Cost Share 2014 Cotobato City (non-HUC) Pending amendments to NSSMP scope 2016 Butuan City
Cagayan de Oro City Submitted final FS reports on October 2018
2018 Bacolod City Iloilo City
Awaiting submission of final reports
2019 General Santos City Puerto Princesa City
Ongoing
2020 Iligan City Olongapo City
Ongoing
Source: PPP for 2012-2014; DPWH for 2016-2020
The maximum targets set by pertinent policies reflected the importance of sanitation in international development agenda. While a noble effort, the progress remained non-
13 Per Baguio City, the subsidy does not cover maintenance costs which may not be feasible for low income LGUs. 14 From DPWH’s email response to data request dated October 25

12
commensurate to the expectations. All numbers fell short for 2020 except for access coverage for sewerage treatment facilities. The combined serviced population from the concessionaires exceeded the target of 3.20 million people. Septage had a lower accomplishment due to its five-year cycle and dependence on household request for treatment assistance.
Table 7. Status and accomplishments of Clean Water Act and NSSMP on sanitation TARGET BASELINE YEAR SOURCE LATEST DATA YEAR SOURCE 2020 TARGET
By 2020, all LGUs (1,634) will have developed septage management systems
3 percent (52 of 1,634)
2015 PWSSMP Inventory
71.35% households have on-site septic tanks
2020 APIS 100 percent
By 2020, all 17 HUCs have sewerage systems
6 percent (1 of 17)
2015 PWSSMP Inventory
8.5% households have access to sewerage (national) 5% population connected to sewer network
2020 2019
APIS DENR
100 percent
By 2020, approximately 43.60 million people will have had access to septage treatment facilities
41 percent 2015 PWSSMP Inventory
Only 10% of wastewater is treated (national) 454,806 cubic meters treated, 9,398,944 people
2019 2020
DENR MWSS
43.60 million
By 2020, approximately 3.20 million people will have had access to sewerage treatment facilities
24.7 percent 2015 PWSSMP Inventory
127,838,190 cubic meters treated 4,227,274 people
2020 MWSS 3.20 million
Source: Authors’ compilation from various sources Table 8 focused on environmental indicators of the policies. An overview of the progress identified room for improvement for industry compliance to wastewater discharge. The extent of oversight agencies ranged from cease-and-desist orders to administrative cases with the pollution adjudication board. However, no establishment has been convicted yet.
Table 8. Status and accomplishments on environment COMMITMENT TARGET STATUS SOURCE Water quality of rivers preserved 421 rivers 180 rivers polluted DENR Report to WEPA
Improvement of priority rivers’ water quality
42 rivers (only 37 monitored)
30 (81%) passed BOD 31 (84%) passed DO
EMB 2018
Industries comply with DENR Standards and have wastewater discharge permit
100% 45.41% (Manila Bay) 50% (national level)
DENR Report to WEPA

13
Volume of BOD diverted 346 million kgs (against 7,465 million cubic meters of annual wastewater)
37.6 million kgs removed (Metro Manila)
2016-2020 DENR Report to WEPA
Investment for sanitation improvement
PHP 26.3 billion PHP 3.16 billion (programmed spending)
2020 ADB WDDSP, LWUA
Notes: Biological Oxygen Demand (BOD) is a measure of oxygen needed to remove waste organic matter from water in the process of decomposition. It indicates the degree of organic pollution in the water body. Dissolved oxygen (DO), on the other hand, is the amount of oxygen found in the water body which decreases as organic materials increase. Source: Authors’ compilation from various sources.
2.5. Institutional arrangements The Clean Water Act designated the Department of Environment and Natural Resources (DENR) as the oversight agency for the implementation on water quality guidelines, effluent standards, and environmental regulatory compliance, but this did not consolidate mandates of institutions across specific aspects on sanitation.
On establishment compliance alone, supplemental efforts came from Laguna Lake Development Authority (LLDA) as its water body jurisdiction spanned local governments and livelihood sectors15; Philippine Economic Zone Authority (PEZA) for industry sector; and Bureau of Agriculture and Fisheries Standards for agricultural reuse guidelines (Bergkamp & Lim 2018).
Metropolitan Waterworks and Sewerage System (MWSS) and Local Water Utilities Authority (LWUA) regulated the concessionaires while the Department of Health (DOH) provided the standards for drinking water as well as health guidelines for collection, treatment, and disposal of sewage (Claudio 2013). The latter has a separate Sanitation and Wastewater Management Division focused on disposal of hospital wastes as a mandate from PD 856.
In the subnational level, Local Government Code (RA 7160) required local governments to establish sanitation systems however, few have managed to comply due to limited capacity and weak incentives. These services were typically carried by water districts and/or private service providers.
2.6. Infrastructure Financing and Tariffs Fines, permit fees, endowments, donations, and grants mainly comprised national water quality management fund while discharge fees16 financed some subnational level activities which include maintenance of wastewater facilities and water body upkeep, among others (Claudio 2013). Fines for non-compliance of any provision in the Clean Water Act ranged from Php 10,000 to 200,000 per day of violation, and contamination of coastal and marine waters were higher at Php 500,000. As cushion, program and projects related to the policy were required
15 Existing lake uses included fisheries (capture, aquaculture), flood reservoir, power generation, recreation, irrigation, industrial cooling, waste sink, source of potable water (https://llda.gov.ph/existing-lake-uses/). 16 This should reflect level of cost for polluters to modify production or management process; should also cover water quality programs, rehabilitation, type of pollutant, classification and attributes of water body.

14
by DENR to have environmental guarantee fund (EGF) for the conservation of watersheds and aquifers and a conduct of programmatic environmental impact assessment (EIA).
On the other hand, the National Water Regulatory Board (NWRB) regulated the tariff for small water and wastewater utilities in the Philippines in which local water service operators were allowed a maximum rate of return of 12 percent. Costs of wastewater treatment, divided into personnel, chemical treatment, sludge disposal, and maintenance fees, were already lodged in the national average tariff of USD 0.36 per cubic meter (Bergkamp & Lim 2018).
As the landscape leaned more towards more sustainable forms of wastewater reuse, monetary institutions picked up green financing mechanisms. Several of these were DBP’s Green Financing Program17; LBP and World Bank Group – International Bank of Reconstruction and Development (IBRD)’s lending stream called CLEECP Program18; Sustainable Energy Finance of BPI, BDO, China Banking Corporation, and International Finance Corporation19.
Foreign infusion for similar mechanisms on water supply, sewerage and waste management was provided by Asian Development Bank, Japan International Cooperation Agency (JICA), Japan Bank of International Cooperation (JBIC), and USAID, but these were comparatively lower than other sectors and have since declined from 2012. Investments for the sector last peaked in 2016 when investments reached PHP 1.75 billion and immediately fell to PHP 43 million the next year.
Figure 8. Approved foreign investments by industry, 2012-2018
Source: ASPBI The national government hoped NSSMP would address the limitations in fiscal resource, given the instrumental role of infrastructure requirements in achieving sanitation targets. An urban focus explored how city LGUs navigated the narrow room of implementation.
17 Can be availed by both private corporations and local governments with loan rates up to 80-90 percent of total project capital outlay and can be repaid up to 15 years inclusive of grace period. 18 Institutions/groups can ask for assistance in establishing renewable energy. As of mid-2017, LBP was able to finance 17 biogas projects worth PHP 264 million. 19 Loans targeted to serve small- and medium-sized firms
1,087.4
132.2 135.2 60.5
1,754.7
43.5 -
289,544.4274,013.5
186,960.0
245,215.8219,091.0
105,745.5
178,967.3
0.0
50,000.0
100,000.0
150,000.0
200,000.0
250,000.0
300,000.0
350,000.0
0.0200.0400.0600.0800.0
1,000.01,200.01,400.01,600.01,800.02,000.0
2012 2013 2014 2015 2016 2017 2018
tota
l inv
estm
ent
wat
er su
pply
and
was
te w
ater
mgm
t in
vest
men
t
Foreign investments
Water supply; sewerage, waste management and remediation activities Total

15
3. Urban focus: Metro Manila
3.1. Background and caveats The private sector was actively involved in urban sanitation as early as the 1970s; the National Water Crisis Act of 1995 (RA 8041) triggered the case of privatization in Metro Manila under the management of MWSS. The service area was divided into East20 and West21 Zones, the former under Manila Water Company, Inc. (MWCI) and the latter under Maynilad Water Services, Inc.
While Manila Water has gained a headstart in its operations, Maynilad experienced a standstill in in its earlier years, primarily due to the effects of the Asian Crisis. Ninety percent (90%) of MWSS loans were allocated to Maynilad, most of which were foreign-exchange dominated, and used to service higher concession fees. As a result, no capex was spent in Maynilad from 1997 to 2006. When the West Zone concessionaire was reprivatized, water supply was given prioritization for the first 10 years and wastewater only in the last seven years. This led up to big adjustments in contract service obligations. As of writing, both concessionaires have been granted renewal of their franchise contract until 2037.
Meanwhile, the Baguio City case study implied institutional fragmentation on water supply and sanitation; the water district was responsible for the former and LGU for the latter, but neither agreed on an overarching framework to inform a harmonized and streamlined approach. The case aimed to present a particular arrangement on upland areas as watersheds and major water reservoirs were in Cordillera Administrative Region (CAR).
Environmental protection and conservation of water sources were supported by concessionaire programs; a close example of which was their inclusion in Manila Bay rehabilitation. Major efforts addressed reduction of untreated discharges through increasing treatment facilities. Complementing these were partnership programs with LGUs, private sector, and international organizations.
3.1.1. Supply and demand Bulk of water supply for Metro Manila and some parts of Bulacan came from Angat Dam, augmented by La Mesa Dam during summer season (only for Manila Water). However, due to the latter’s small size and unsustainable water precipitation levels, the latter was considered more as a storage facility or reservoir rather than a primary source. Treatment of water supply followed parameters and guidelines set by various agencies like MWSS, DOH, and DENR prior to customer distribution.
All 46 cubic meters of water from Angat Dam were shared between the concessionaires, and Laguna Lake eventually supplemented the supply in light of increasing water demand. The move to tap the latter as an immediate water source started around 2009 from Maynilad and more recently in 2020 for Manila Water. Treatment costs rose ten times higher due to a higher concentration of feed residue and industrial wastes, but it relatively reduced reliance on Angat by 90 percent.
20 Covers Mandaluyong, Marikina, Pasig, Pateros, San Juan, Taguig, Makati and parts of Quezon City and Manila. Also provides services to Antipolo City and some Rizal towns which are part of the coverage expansion once renewed. 21 Includes Caloocan, Malabon, Navotas, Valenzuela, parts of Quezon City, parts of Manila, parts of Makati, and South areas - Pasay, Parañaque, Las Piñas, Muntinlupa, Bacoor, Imus, Kawit, Rosario, Noveleta, Cavite City.

16
Manila Water’s service connections numbered around one million connections22 and seven million accounts23 in both commercial and residential types with an average household consumption of 30 cubic meters per month. Water access coverage for the East Zone was at 93.65 percent with whole NCR looped within the Central Distribution System.
The concessionaire’s next targets were identified as Antipolo, San Mateo, and Montalban, Rizal, resettlement near landfills, and areas adjacent to Laguna Lake. Growth was projected to increase by 100,000 connections annually, particularly among vertical structures (e.g. condominiums).
Both concessionaires were mostly successful in meeting their contract obligations, reaching almost 100 percent for the coverage. In the 24-hour coverage and 7psi24 coverage, a decrease in figures were noted for 2019, particularly for Maynilad. Taking in the caveats mentioned earlier and the condition of pipe networks, the same concessionaire has a greater share of nonrevenue water losses or leaks in connection.
Figure 9. Percentages of water supply coverage in Metro Manila, 2016-June 2021
Source: MWSS 2021
The higher number of reservoirs and facilities in Manila Water contributed to bigger and faster reach. It almost reached the saturation level in terms of reservoir capacities vis-à-vis billed volume. On the other hand, Laguna Lake’s augmentation increased Maynilad’s share.
22 One connection may cover multiple households, depending on area and building. Standard arrangement limited one title to one account until the launching of Tubig Para sa Barangay program where a meter is placed on a barangay street to service multiple households. 23 Estimates of individuals covered, KII 24 7psi=7 pounds per square inch. Average pressure required for the water to reach the second floor.

17
Figure 10. Reservoirs, pump stations, and treatment plants
Source: MWSS 2021
Figure 11. Billed volume versus reservoir capacity (in million cubic meters)
3.1.2. Pandemic shifts Use patterns changed at the onset of the pandemic. Residential accounts increased and took over commercial ones, which had the bigger share prior, and consumption was evidently higher during daytime, the last observation a side effect of lockdowns. Overall, the demand dampened

18
because of low usage from commercial, manufacturing, and industrial sectors, and slower economic activities.
The crisis and resulting shifts also exposed emerging concerns such as varying consumption, overloading of north to south pipes, increasing demand due to population growth and growing export processing zones. To address these, Maynilad planned to establish local reservoirs in south area (e.g. Cavite) and to utilize excess water from NIA’s smaller dams. Kaliwa Dam will also augment the supply with its initial allocation by 2025.
3.2. Wastewater management 3.2.1. Current arrangements
The concessionaires both used the separate and combined sewage systems. The former separated domestic and storm water in two pipes. The sanitary sewer system would collect wastewater from household sewer line and transport the load to treatment plants while the latter placed domestic and storm water in the same pipe. Combined system, the prevailing setup in Metro Manila, tended to overflow into water bodies during heavy rains.
As for sanitation, both sewerage network and non-sewer activities (i.e. desludging) were conducted. The service obligation of the concessionaires is only limited to domestic coverage, but the use of combined systems over drainages and sewer networks allowed extension to commercial areas. Septage coverage remained greater than sewerage, hastened by the convenience and feasibility of vacuum truck units and capital costs.
Table 9. Comparison of coverage and facilities between the concessionaires
Concessionaire Sewerage Septage Investment System Coverage Facilities Coverage Facilities Manila Water Combined 31% 41 facilities
400 km of sewer network
63% + 15 WWTPs and 600 km of network
Maynilad Combined 21.3% 22 treatment plants 203 lift stations
992,000 septic tanks cleaned
110 vacuum truck units25
PHP 37 billion for 100% coverage by 2037 PHP 1 billion /WWTP
Source: Authors’ compilation from KII
Sewerage and septage figures exhibited increasing trends, but the former’s coverage values dwarfed in comparison to the latter. Sewerage barely reached a 40-percent mark for both concessionaires, highlighting the gap in this kind of arrangement. A focus on full septage access and treatment coverage can work in the short term to allow key players on how to best meet the commitments for full sewerage systems.
25 Offers both sanitation and desludging services. Initially started with 32 units.

19
Figure 12. Overview of septage and sewerage coverage in Metro Manila, 2016-June 2021
Note: The septage coverage follows a five-year cycle26; upon reaching the fifth year, the coverage will revert to zero. Source: MWSS 2021
Volume of treated water were also higher for septage than sewerage. Interestingly, Maynilad has a higher treated volume for sewerage compared to Manila Water while the opposite was observed for septage. This can be attributed to Maynilad’s longer pipeline distance of 607 km (Manila Water only has 432.91 km of laid pipelines). However, in terms of number of treatment plants, the latter has double the count. The numbers have not changed more or less in the last five years; construction of another treatment plant would need an additional PHP 1 billion investment.
Table 10. Relevant variables on wastewater management Year Maynilad Manila Water
Treated sewage (𝐦𝐦𝟑𝟑)
Treated septage (𝐦𝐦𝟑𝟑)
No. of WWTP
Pipelines (km)
Treated sewage (𝐦𝐦𝟑𝟑)
Treated septage (𝐦𝐦𝟑𝟑)
No. of WWTP
Pipelines (km)
2016 57,981,304 20 586 36,994,838 222,737 40 359.47 2017 59,490,425 20 588 40,419,040 310,668 40 369.53 2018 63,420,692 170,684 22 633 44,390,251 329,325 40 392.79 2019 74,470,149 283,402 22 637 44,592,574 321,026 40 396.81 2020 71,919,760 214,910 22 638 55,918,430 239,896 40 428.73 June 2021 35,545,438 109,703 22 607 25,452,699 149,762 41 432.91
Notes: WWTP=Wastewater Treatment Plants; Pipelines=cumulative laid pipelines since privatization Source: MWSS 2021
26 Desludging of septic tanks is conducted once every five years.
20
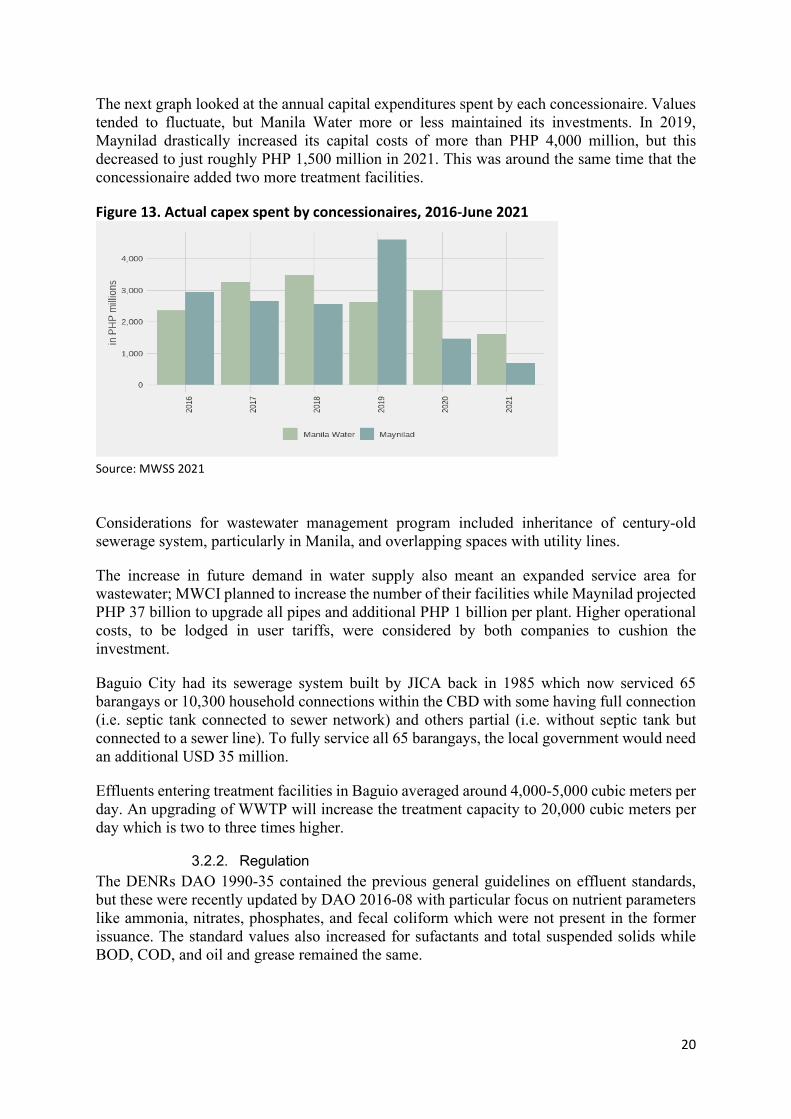
The next graph looked at the annual capital expenditures spent by each concessionaire. Values tended to fluctuate, but Manila Water more or less maintained its investments. In 2019, Maynilad drastically increased its capital costs of more than PHP 4,000 million, but this decreased to just roughly PHP 1,500 million in 2021. This was around the same time that the concessionaire added two more treatment facilities.
Figure 13. Actual capex spent by concessionaires, 2016-June 2021
Source: MWSS 2021
Considerations for wastewater management program included inheritance of century-old sewerage system, particularly in Manila, and overlapping spaces with utility lines.
The increase in future demand in water supply also meant an expanded service area for wastewater; MWCI planned to increase the number of their facilities while Maynilad projected PHP 37 billion to upgrade all pipes and additional PHP 1 billion per plant. Higher operational costs, to be lodged in user tariffs, were considered by both companies to cushion the investment.
Baguio City had its sewerage system built by JICA back in 1985 which now serviced 65 barangays or 10,300 household connections within the CBD with some having full connection (i.e. septic tank connected to sewer network) and others partial (i.e. without septic tank but connected to a sewer line). To fully service all 65 barangays, the local government would need an additional USD 35 million.
Effluents entering treatment facilities in Baguio averaged around 4,000-5,000 cubic meters per day. An upgrading of WWTP will increase the treatment capacity to 20,000 cubic meters per day which is two to three times higher.
3.2.2. Regulation The DENRs DAO 1990-35 contained the previous general guidelines on effluent standards, but these were recently updated by DAO 2016-08 with particular focus on nutrient parameters like ammonia, nitrates, phosphates, and fecal coliform which were not present in the former issuance. The standard values also increased for sufactants and total suspended solids while BOD, COD, and oil and grease remained the same.

21
Table 11. Comparison of parameters between DAO 1990-35 and DAO 2016-08 Significant parameters Unit DAO 1990-35 Class C DAO 2016-08 Class C
Biochemical Oxygen Demand (BOD)
mg/L 50 50
Fecal coliform MPN/100mL - 400 Ammonia mg/L - 0.5 Nitrate mg/L - 14 Phosphates mg/L - 1 Oil and grease mg/L 5 5 Surfactants mg/L 5 15 Chemical oxygen demand
mg/L 100 100
Total suspended solids mg/L 70 100 Source: Maynilad Position Paper 2020
The newly provided parameters were also more stringent than other countries; the strictest among which was ammonia with only 0.5 mg/L whereas India allowed up to 50 mg/L (for Asia) and Chile up to 80 mg/L (for non-Asia). Concessionaires suggested following US EPA’s watershed-based national pollutant discharge elimination system (NPDES), dependent on the water quality of a catchment basin and accounts for the assimilative capacity of the receiving bodies of water (RBW) that the regulation did not consider (Maynilad Position Paper 2020).
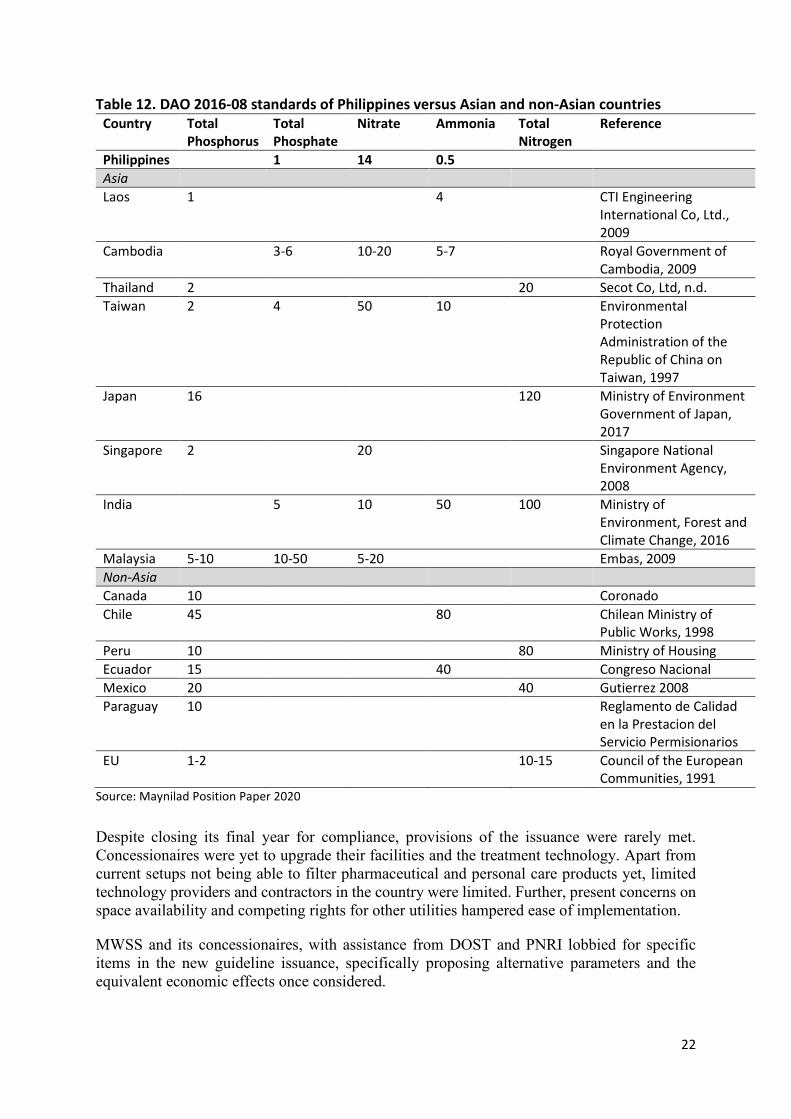
22
Table 12. DAO 2016-08 standards of Philippines versus Asian and non-Asian countries Country Total
Phosphorus Total Phosphate
Nitrate Ammonia Total Nitrogen
Reference
Philippines 1 14 0.5 Asia Laos 1 4 CTI Engineering
International Co, Ltd., 2009
Cambodia 3-6 10-20 5-7 Royal Government of Cambodia, 2009
Thailand 2 20 Secot Co, Ltd, n.d. Taiwan 2 4 50 10 Environmental
Protection Administration of the Republic of China on Taiwan, 1997
Japan 16 120 Ministry of Environment Government of Japan, 2017
Singapore 2 20 Singapore National Environment Agency, 2008
India 5 10 50 100 Ministry of Environment, Forest and Climate Change, 2016
Malaysia 5-10 10-50 5-20 Embas, 2009 Non-Asia Canada 10 Coronado Chile 45 80 Chilean Ministry of
Public Works, 1998 Peru 10 80 Ministry of Housing Ecuador 15 40 Congreso Nacional Mexico 20 40 Gutierrez 2008 Paraguay 10 Reglamento de Calidad
en la Prestacion del Servicio Permisionarios
EU 1-2 10-15 Council of the European Communities, 1991
Source: Maynilad Position Paper 2020 Despite closing its final year for compliance, provisions of the issuance were rarely met. Concessionaires were yet to upgrade their facilities and the treatment technology. Apart from current setups not being able to filter pharmaceutical and personal care products yet, limited technology providers and contractors in the country were limited. Further, present concerns on space availability and competing rights for other utilities hampered ease of implementation.
MWSS and its concessionaires, with assistance from DOST and PNRI lobbied for specific items in the new guideline issuance, specifically proposing alternative parameters and the equivalent economic effects once considered.

23
Combined operating expenses would exceed 500 percent if concessionaires were to follow the DAO 2016-08 parameters. The projected cost included facility and pipe upgrading as well as construction of new treatment plants. If this was considered expensive by large, private concessionaires, the financial burden would be heavier for LGU-led utilities and smaller service providers. An adjustment to the proposed limits would give a 100 percent reduction in the presumed OPEX increase. This would curb a spike in user tariff as well.
Table 13. Recommended changes to DAO 2016-08 DAO 2016-08 parameters
OPEX increase due to DAO 2016 (%)
Proposed parameter
Proposed limits (ppm27)
OPEX increase due to proposed limits (baseline from DAO 1990-35) (%)
OPEX Reduction from DAO 2016 (%)
Ammonia 265 Total Nitrogen 20 47 94 Nitrates Phosphates 370 Total
Phosphate 5 115 58
Fecal coliform 54 Geometric mean 0-45 17-100 Note: Values given by Maynilad are projected from a facility using CAS-MLE technology Source: Maynilad Position Paper 2020
4. Challenges
a. Institutional and implementation fragmentation
Fragmentation riddled the landscape of supply and sanitation. While agencies have been given respective mandates corresponding to particular aspects (supply, quality, servicing, wastewater), overarching framework and direction were absent. Broad provisions albeit encompassing in their scope induced mandate overlaps thus resulting to disaggregated efforts in the sector.
One manifestation of this was among national policies, local governments, and indigenous peoples in provisioning priorities. COA’s 2020 audit report flagged the continuation of Kaliwa Dam Project despite the absence of permits for the National Integrated Protected Areas System (NIPAS) and indigenous peoples’ consent. The project was said to displace the Dumagat-Remontado IP groups from their ancestral domain (Sarao 2021; Chavez 2019).
b. Weak regulatory teeth
WQMAs and watersheds were managed by the National Water Resources Board, but they have no regional offices and thus have no capacity to go after polluters of primary water sources. Tributaries and other water bodies have easier and more grounded regulation, but the cease and desist orders for discharge violators were yet to translate to lower pollution load.
27 parts per million

24
c. Unfeasible regulatory standards
As seen in the comparison of parameter limits via older guidelines and cross-country levels, it was evident that current concessionaires and implementers will not be able to comply given the state of facilities, the amount of investment needed, and the limited technology options. Effluent standards were designed more after drinking water quality, not treated wastewater. Non-compliance to DAO 2016-08 will reportedly result to PHP 20,000 per day of violation.
d. Lack of national guidance
The absence of national plan and roadmap compounded the fragmentation on the sector. Without a cohesive direction, most burdens fell on local implementers while investment became highly dependent on private sector extension. The urgency for accomplishing supply and sanitation targets did reflect in the infusion of foreign investment in contrast with other sectors.
e. Issues on NSSMP
Given the current landscape in the country, total sewerage coverage would not be possible for 2030. It should be treated as a large-scale project crosscutting local governments and administrations. As there had been low interest on sewerage investments from incumbents, septage standardization would be a feasible and practical entry point in the short run. Sewerage systems ranged from PHP 5,000 to PHP 10,000 per capita whereas septage only estimated costs of PHP 230 to PHP 445 per capita.
Interest revival in septage systems should be encouraged for the uptake of NSSMP with the amended coverage and increased subsidy share. In the case of Baguio City, the program was not pursued as it will not be able to cover maintenance and operating costs which are the bulkiest and most difficult to sustain. On the other hand, DPWH reasoned that the low uptake was due to ineligibility of most LGUs.
Additional expenses from permitting, right of way, and clearances should also be taken into account. Political boundaries often hindered the proposal of multi-city treatment plants, considering difficulties on land availability and contesting spaces for utilities. These compounding matters all pointed to a need of proper urban planning where institutions, concessionaires, and service providers have access to comprehensive maps of drainages and utilities to avoid overlapping and disruptions.
Future challenges would involve continued deforestation and depletion of watersheds which would, in turn, increase turbidities beyond the capacities of treatment plants and introduce more frequent delays in water delivery. A concentrated effort in conserving these resources must be imminent.
5. Conclusion
Wastewater and pollution management issues are usual negative externalities in the pursuit of economic development. This is true in the Philippines where industrial and domestic refuse often end up being released in tributaries and major water ways, sometimes even contaminating ground water due to improper septage and sewerage design. But this does not mean that there is no apt policy prodding to exact waste management and sanitary compliance. Weaknesses lie in policy grounding and central and subnational guidance.
25
Sewerage systems are often less preferred to individual septages due to its large investment requirement and necessity for complex, large scale and coordinated implementation. Development initiatives also operate within the confines of a fragmented sector where there are a multitude of stakeholders engaged in scattered efforts through mostly independent decision-making processes. Although some low-income regions such as BARMM suffer from both water supply and sanitation issues, a majority of LGUs show relatively good current standing in terms of water supply, but with compromised sanitation and environmental integrity compliances.
The Clean Water Act frames the standards and enjoins compliance to environmental integrity provisions. It also launched the NSSMP to address the shortfalls on fiscal resource, and to ramp up initiatives on the ground for septage and sewerage projects. But even these interventions remained largely untapped due to the inability of subnational counterparts to cover counterpart funds and maintenance costs. Both short and long-term gains are difficult to pursue when there is failure in most LGUs to mainstream wastewater management in local development plans and thematic documents.
The country is prone to imposing regulations within a sector with fragmented institutions and policy backgrounds, and priorities. This dissonance between vision and structure ultimately led to contesting strategies, and parameters with differing approaches and accomplishments. The current framework depends largely on political will, instead of a functioning long term plan under a supposedly organized water management regime.
Among highly urbanized cities, the challenges on water management and sewerage establishment were on space availability and right of way. Another articulated concern is the infeasibility of needed compliance with new water quality standards and parameters. Albeit consistent with environmental integrity targets, water concessionaires and other stakeholders were apprehensive about complying with standards given present facilities, technology, and investment. Further sector performance benchmarking, and thorough consultations with implementers, are required to enjoin compliance to regulatory issuances and guidelines.
An empowered regulatory body with a well-crafted master plan should inform the direction and strategic approach in water supply and waste water management both at the national and subnational levels. Large scale capital investments were often overlooked in wastewater management hence policies should not cram compliance, especially if not accompanied with fiscal assistance or any sort of facilitation. Local government politics are also not conducive to big public investment projects like sewerage networks and waste water treatment facilities, hence the need for a well-endowed central institution.
A feasible intervention in the short run would be to focus on septage access, coverage, and standardization while exploring other green technology, financing mechanisms, and investment strategies for the long haul. These discussions are further expounded in the next section.
6. Recommendations
6.1. Revamping institutions: Lessons from Singapore The harmonization of the country’s fragmented approach to water and waste water management can be patterned over learnings from neighboring countries. Inter- and intra- institutional machinations have evolved among both public and private stakeholders over the
26
years, even at the subnational levels, but it may require a bureaucratic body in the mold of Singapore’s Public Utility Board to effect needed reforms.
Singapore’s inherent limitations and problems on both land and aquifer caused numerous water crises in the past28 and heavy reliance to water importation from Malaysia. To augment natural water supply, they took advantage of local water catchments, desalination facilities, and NEWater or reclaimed-water use, to the extent that reclaimed water served 70 percent of their local water demand. Although the Philippines cannot compare with Singapore’s technical acumen and facility for huge public investments, the country can capitalize on a similar institutional set-up for water and waste-water management.
The institutional aspect, Public Utilities Board (PUB) Singapore handles the oversight and integrates management of the country’s water supply up to the water provisioning networks where the private sector contributes service29. The same agency handles research and development and numerous collaborations with domestic and international experts and study centers. The arrangement allows for greater retention of in-house experts and personnel (e.g. development of membrane bioreactor technology30, reservoir monitoring31, electrochemical desalination32 among others) (PwC 2018), sustaiing institutional capacity in the long run. Singapore’s approach encompasses the full water management cycle, unlike in the Philippines where water supply and waste water management/sanitation are treated differently.
Unified utility layouts or maps are most useful in trying to work out sewerage systems especially in highly urbanized domains like Metro Manila. Drainage systems, water lines, and interconnectivity cables all need to be accounted for to facilitate sewerage system planning and establishment. Although admittedly not suitable for all cities and municipalities, sewerage systems if viable, must be given priority in local development formulations. While Metro Manila’s convoluted subterranean networks of cables and pipes may curtail sewerage expansion plans, this long-term thinking can still be pursued and applied in provinces and local areas, including in big private real estate development projects.
The septage option also needs to be rationalized. Appropriate standards should be applied in septage construction and rehabilitation, taking into consideration the possible contamination of ground water reservoirs. Old houses or establishments may also need structural augmentation and retrofitting to pass environmental integrity compliance. Capacity building on wastewater treatment from national to subnational levels should accompany that perspective. Information and awareness alone on wastewater and its relation to health and economy could help customer acceptance and negate the not-in-my-backyard mindset. Repercussions on not meeting even the barest of septage standards should be communicated clearly to the general public.
6.2. Regulations and standards Benchmarking of technology and facilities in the sector should be reviewed prior to imposition of standards and guidelines. Unless funded, assisted with grants or loans, or funneled with an
28 Singapore went through 10-month water rationing exercises during April 1963-February 1964. 29 Meter reading, billing, and collection of charges 30 Alternative to the current microfiltration/ultrafiltration-reverse osmosis (MF/UF-RO system) in an effort to reduce costs of water reclamation efforts. 31 One monitoring tool is eutrophication warning tool with set triggers for algal blooms in catchments and reservoirs. Another is a tracker for gradient changes and spikes from drastic land use changes. The last is the development of SingScore Index which uses insects and invertebrates as long term indicators of waterways health in addition to the water quality index in place. This better informs long-term strategies of the country. 32 Uses less water than the current high-pressure desalination.

27
investment, the urgency of implementation should consider the feasibility. As the compliance remain unmet from concessionaires, DENR and other oversight and regulatory agencies should reconsider the alternative parameters listed in the position paper.
A more workable request would be for DPWH to provide technical inputs or reference notes on standard designs of WWTPs or any waste-related infrastructure33 in the context of the country’s topography and use patterns. It could be a fitting function for a department familiar with horizontal linkages and facilities and a viable intervention point for streamlining water supply and sanitation master plans and utility maps.
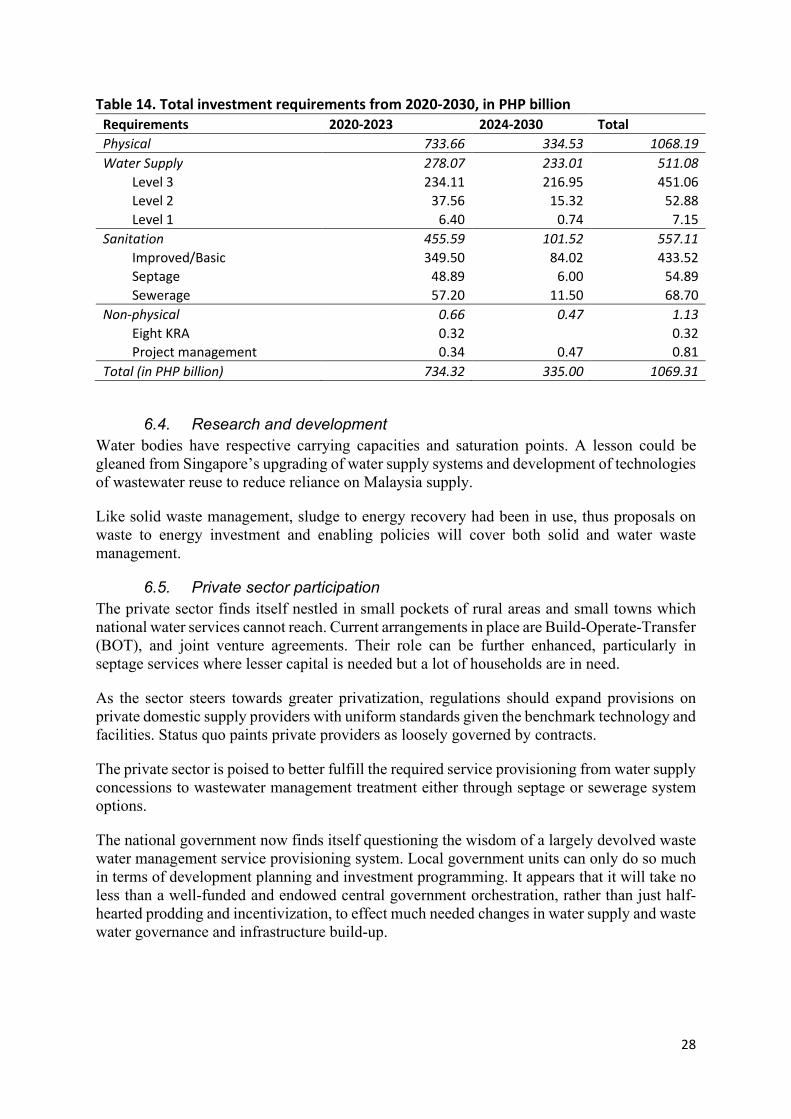
6.3. Ramping up investments The Philippine Water Supply and Sanitation Master Plan (PWSSMP) provided an investment breakdown for the water sector to bridge the gap in sectoral and policy goals namely, 95 percent access to water supply and 97 percent access to basic sanitation by 2022, and universal access by 2030.
Proposed investments were categorized into two. Physical requirements were projected to reach Php 1.07 trillion to meet targets set by PDP and SDG. Non-physical requirements in this case referred to key reform agenda34 and program management, eventually amounting to PHP 1.13 billion.
The estimated investment figures are already huge as indicated, but one can’t help think that such are still massive underestimates of what is truly required down the line.
33 Per KII with DENR-EMB, no standards are given for waste pollution facilities, only minimum requirements since they need to be retrofitted to the type of pollutants, geography, and other needs (reuse, graywater, etc.) 34 KRA: establishing effective WSS sector institutions; strengthening regulatory environment; creating and ensuring effective WSS services; balancing water supply and demand; building climate resiliency; enabling access to funding and financing; managing data and information; and driving research and development.
28
Table 14. Total investment requirements from 2020-2030, in PHP billion Requirements 2020-2023 2024-2030 Total Physical 733.66 334.53 1068.19 Water Supply 278.07 233.01 511.08
Level 3 234.11 216.95 451.06 Level 2 37.56 15.32 52.88 Level 1 6.40 0.74 7.15
Sanitation 455.59 101.52 557.11 Improved/Basic 349.50 84.02 433.52 Septage 48.89 6.00 54.89 Sewerage 57.20 11.50 68.70
Non-physical 0.66 0.47 1.13 Eight KRA 0.32 0.32 Project management 0.34 0.47 0.81
Total (in PHP billion) 734.32 335.00 1069.31
6.4. Research and development Water bodies have respective carrying capacities and saturation points. A lesson could be gleaned from Singapore’s upgrading of water supply systems and development of technologies of wastewater reuse to reduce reliance on Malaysia supply.
Like solid waste management, sludge to energy recovery had been in use, thus proposals on waste to energy investment and enabling policies will cover both solid and water waste management.
6.5. Private sector participation The private sector finds itself nestled in small pockets of rural areas and small towns which national water services cannot reach. Current arrangements in place are Build-Operate-Transfer (BOT), and joint venture agreements. Their role can be further enhanced, particularly in septage services where lesser capital is needed but a lot of households are in need.
As the sector steers towards greater privatization, regulations should expand provisions on private domestic supply providers with uniform standards given the benchmark technology and facilities. Status quo paints private providers as loosely governed by contracts.
The private sector is poised to better fulfill the required service provisioning from water supply concessions to wastewater management treatment either through septage or sewerage system options.
The national government now finds itself questioning the wisdom of a largely devolved waste water management service provisioning system. Local government units can only do so much in terms of development planning and investment programming. It appears that it will take no less than a well-funded and endowed central government orchestration, rather than just half-hearted prodding and incentivization, to effect much needed changes in water supply and waste water governance and infrastructure build-up.

29
7. References
Agcaoili, Aurelio S., Elizabeth A. Calinawagan, Miriam Edulian Pascua, Nakem Conferences Philippines (Organization), and Undertow Books, eds. 2015. Aro Ken Sirmata: Language, Culture, Education, and the Pursuit of Diversity. Batac City, Philippines? Nakem Conferences Philippines.
Asian Development Bank (ADB). 2014. From toilets to rivers: Experiences, new opportunities, and innovative solutions. Mandaluyong City: ADB.
Bergkamp, G., & Lim, J. 2018. Wastewater management and resource recovery in the Philippines: Current status and opportunities. Switzerland: ARCOWA.
Buonocore, Elvira, Salvatore Mellino, Giuseppe De Angelis, Gengyuan Liu, and Sergio Ulgiati. 2018. “Life Cycle Assessment Indicators of Urban Wastewater and Sewage Sludge Treatment.” Ecological Indicators 94 (November): 13–23. https://doi.org/10.1016/j.ecolind.2016.04.047.
Capodaglio, Andrea. 2017. “Integrated, Decentralized Wastewater Management for Resource Recovery in Rural and Peri-Urban Areas.” Resources 6 (2): 22. https://doi.org/10.3390/resources6020022.
Capodaglio, Andrea, and Gustaf Olsson. 2019. “Energy Issues in Sustainable Urban Wastewater Management: Use, Demand Reduction and Recovery in the Urban Water Cycle.” Sustainability 12 (1): 266. https://doi.org/10.3390/su12010266.
Chavez, L. 2019, November 5. A Philippine tribe that defeated a dam prepares to fight its reincarnation.
Claudio, L. E. 2015, April 23. Wastewater management in the Philippines. Environmental Management Bureau Region 3.
Department of Public Works and Highways (DPWH). 2013. Support for the Nationwide Roll-out of the National Sewerage and Septage Management Program: Program Operations Manual. Manila, Philippines: DPWH.
Gamaralalage, P. J. D., Gilby, S., Lee, K. 2015. The Republic Act (RA) 9003 in the Philippines: Factors for Successful Policy Implementation. The 26th Annual Conference of JSMCWM, 560-61.
Maynilad. 2020, September 21. Position paper on the review of Department Administrative Order 2016-08, otherwise known as the Water Quality Guidelines and General Effluent Standards of 2016 (“DAO 2016-08”). Quezon City, Philippines: MWSS.
OECD. 2012. Water quality and agriculture: Meeting the policy challenge. In: OECD Studies on Water. OECD Publishing.
Pham, N. B., & Kuyama, T. 2013. Decentralised Domestic Wastewater Management in Asia – Challenges and Opportunities. Policy Brief Series 1. Water Environment Partnership in Asia (WEPA): Japan.
Robinson, A. 2003. Urban Sewerage and Sanitation: Lessons learned from case studies in the Philippines. World bank Water and Sanitation program – East Asia and the Pacific.
Sarao, Z. 2021, September 16. Construction of Kaliwa Dam pushed through even without permits. Philippine Daily Inquirer. https://newsinfo.inquirer.net/1488470/implementation-of-kaliwa-dam-project-pushed-through-even-without-permits-coa (accessed on November 16, 2021).
30
8. Annexes
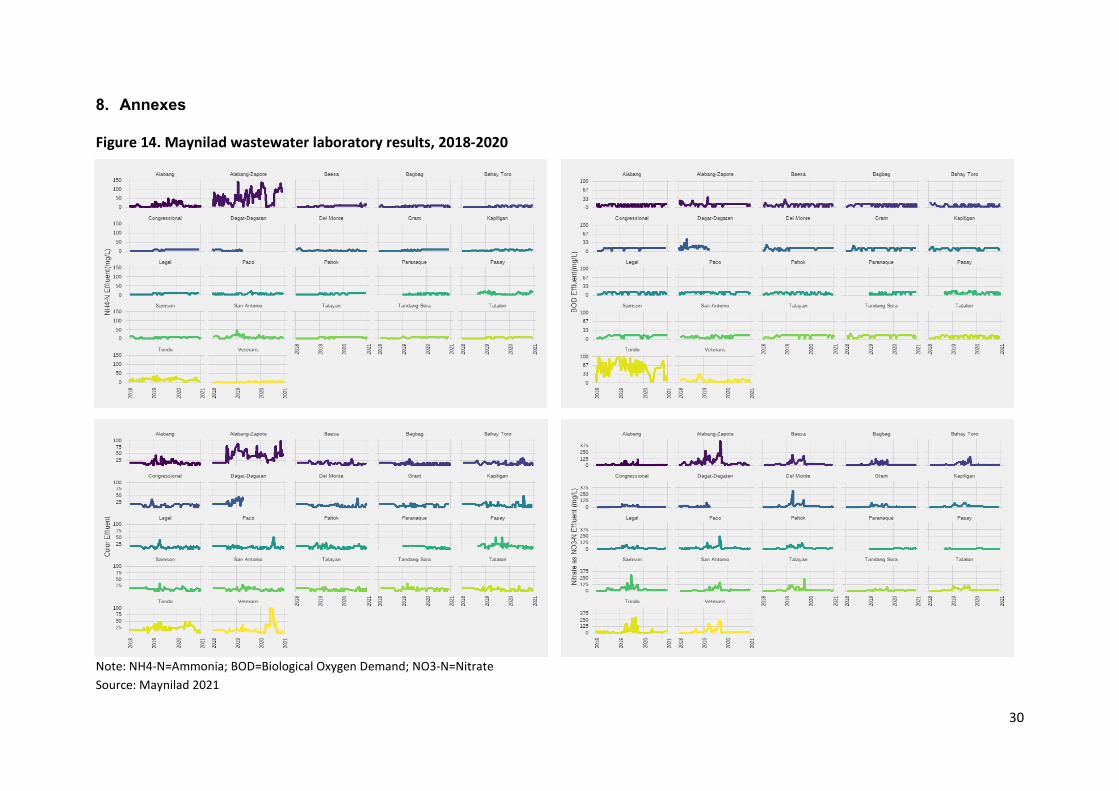
Figure 14. Maynilad wastewater laboratory results, 2018-2020
Note: NH4-N=Ammonia; BOD=Biological Oxygen Demand; NO3-N=Nitrate Source: Maynilad 2021

31
Notes: PO4=Phosphate; TSS=Total Suspended Solids Source: Maynilad 2021

32
Note: COD=Chemical Oxygen Demand Source: Maynilad 2021