UPDATED STATUS OF THE CONTINUOUSLY REINFORCED CONCRETE PAVEMENT DATABASE IN TEXAS: IMPROVEMENTS AND...
74
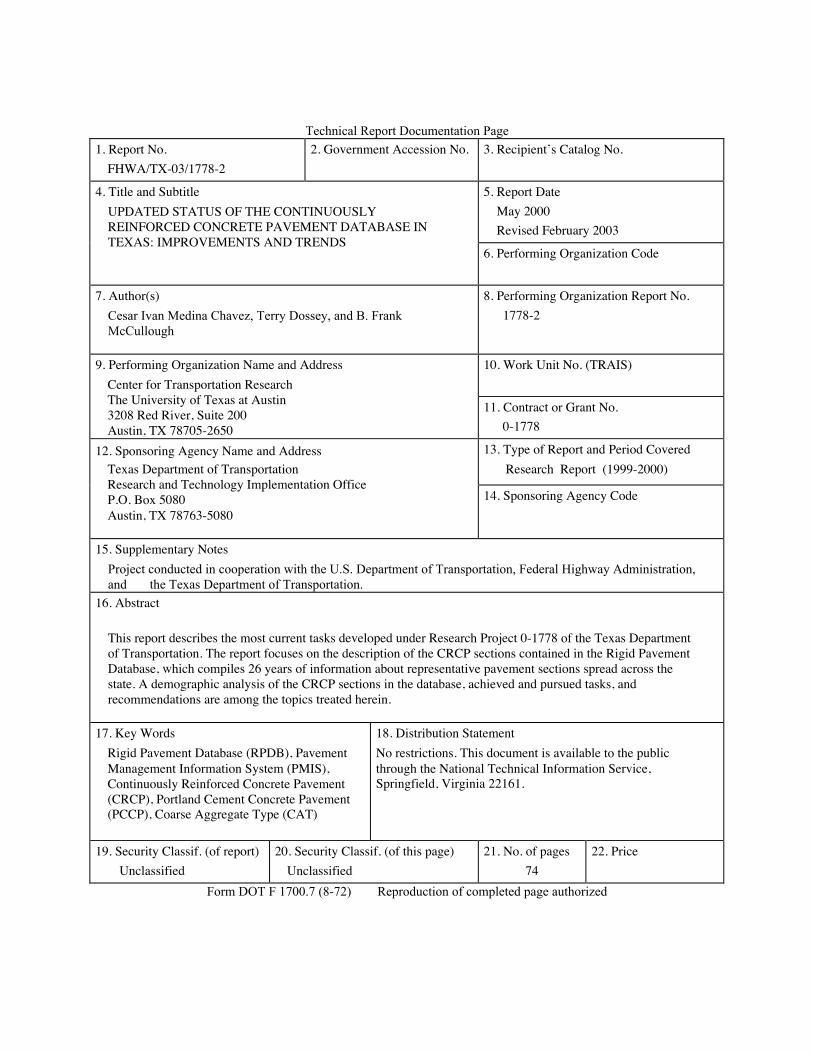
Technical Report Documentation Page 1. Report No. FHWA/TX-03/1778-2 2. Government Accession No. 3. Recipient’s Catalog No. 5. Report Date May 2000 Revised February 2003 4. Title and Subtitle UPDATED STATUS OF THE CONTINUOUSLY REINFORCED CONCRETE PAVEMENT DATABASE IN TEXAS: IMPROVEMENTS AND TRENDS 6. Performing Organization Code 7. Author(s) Cesar Ivan Medina Chavez, Terry Dossey, and B. Frank McCullough 8. Performing Organization Report No. 1778-2 10. Work Unit No. (TRAIS) 9. Performing Organization Name and Address Center for Transportation Research The University of Texas at Austin 3208 Red River, Suite 200 Austin, TX 78705-2650 11. Contract or Grant No. 0-1778 13. Type of Report and Period Covered Research Report (1999-2000) 12. Sponsoring Agency Name and Address Texas Department of Transportation Research and Technology Implementation Office P.O. Box 5080 Austin, TX 78763-5080 14. Sponsoring Agency Code 15. Supplementary Notes Project conducted in cooperation with the U.S. Department of Transportation, Federal Highway Administration, and the Texas Department of Transportation. 16. Abstract This report describes the most current tasks developed under Research Project 0-1778 of the Texas Department of Transportation. The report focuses on the description of the CRCP sections contained in the Rigid Pavement Database, which compiles 26 years of information about representative pavement sections spread across the state. A demographic analysis of the CRCP sections in the database, achieved and pursued tasks, and recommendations are among the topics treated herein. 17. Key Words Rigid Pavement Database (RPDB), Pavement Management Information System (PMIS), Continuously Reinforced Concrete Pavement (CRCP), Portland Cement Concrete Pavement (PCCP), Coarse Aggregate Type (CAT) 18. Distribution Statement No restrictions. This document is available to the public through the National Technical Information Service, Springfield, Virginia 22161. 19. Security Classif. (of report) Unclassified 20. Security Classif. (of this page) Unclassified 21. No. of pages 74 22. Price Form DOT F 1700.7 (8-72) Reproduction of completed page authorized
-
Upload
independent -
Category
Documents
-
view
2 -
download
0
Transcript of UPDATED STATUS OF THE CONTINUOUSLY REINFORCED CONCRETE PAVEMENT DATABASE IN TEXAS: IMPROVEMENTS AND...
Technical Report Documentation Page
1. Report No.FHWA/TX-03/1778-2
2. Government Accession No. 3. Recipient’s Catalog No.
5. Report DateMay 2000Revised February 2003
4. Title and SubtitleUPDATED STATUS OF THE CONTINUOUSLYREINFORCED CONCRETE PAVEMENT DATABASE INTEXAS: IMPROVEMENTS AND TRENDS
6. Performing Organization Code
7. Author(s)Cesar Ivan Medina Chavez, Terry Dossey, and B. FrankMcCullough
8. Performing Organization Report No. 1778-2
10. Work Unit No. (TRAIS)9. Performing Organization Name and AddressCenter for Transportation ResearchThe University of Texas at Austin3208 Red River, Suite 200Austin, TX 78705-2650
11. Contract or Grant No.0-1778
13. Type of Report and Period Covered Research Report (1999-2000)
12. Sponsoring Agency Name and AddressTexas Department of TransportationResearch and Technology Implementation OfficeP.O. Box 5080Austin, TX 78763-5080
14. Sponsoring Agency Code
15. Supplementary NotesProject conducted in cooperation with the U.S. Department of Transportation, Federal Highway Administration,and the Texas Department of Transportation.
16. Abstract
This report describes the most current tasks developed under Research Project 0-1778 of the Texas Departmentof Transportation. The report focuses on the description of the CRCP sections contained in the Rigid PavementDatabase, which compiles 26 years of information about representative pavement sections spread across thestate. A demographic analysis of the CRCP sections in the database, achieved and pursued tasks, andrecommendations are among the topics treated herein.
17. Key WordsRigid Pavement Database (RPDB), PavementManagement Information System (PMIS),Continuously Reinforced Concrete Pavement(CRCP), Portland Cement Concrete Pavement(PCCP), Coarse Aggregate Type (CAT)
18. Distribution StatementNo restrictions. This document is available to the publicthrough the National Technical Information Service,Springfield, Virginia 22161.
19. Security Classif. (of report)Unclassified
20. Security Classif. (of this page)Unclassified
21. No. of pages74
22. Price
Form DOT F 1700.7 (8-72) Reproduction of completed page authorized


Updated Status of the Continuously Reinforced Concrete Pavement Database in Texas:
Improvements and Trends
Cesar Ivan Medina Chavez Terry Dossey
B. Frank McCullough
Research Report 1778-2
Research Project 0-1778 TxDOT Rigid Pavement Database
Conducted for the
Texas Department of Transportation by the
Center for Transportation Research Bureau of Engineering Research
The University of Texas at Austin
May 2000 Revised February 2003

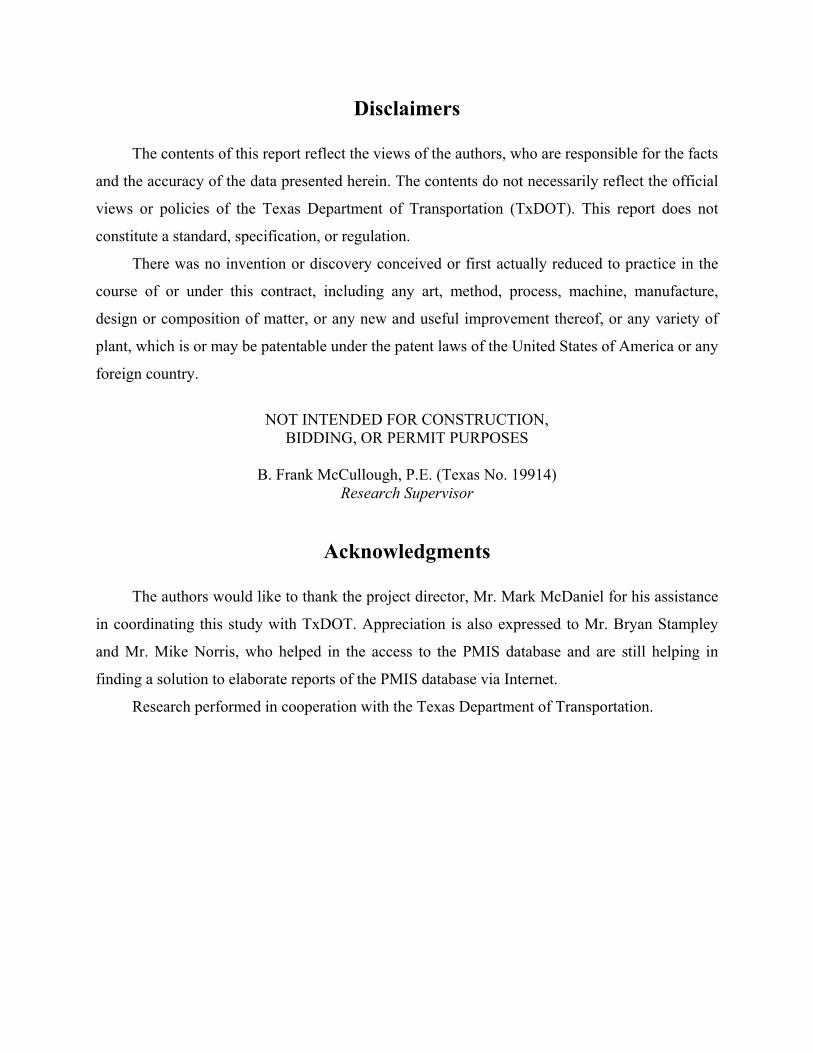
Disclaimers
The contents of this report reflect the views of the authors, who are responsible for the facts
and the accuracy of the data presented herein. The contents do not necessarily reflect the official
views or policies of the Texas Department of Transportation (TxDOT). This report does not
constitute a standard, specification, or regulation.
There was no invention or discovery conceived or first actually reduced to practice in the
course of or under this contract, including any art, method, process, machine, manufacture,
design or composition of matter, or any new and useful improvement thereof, or any variety of
plant, which is or may be patentable under the patent laws of the United States of America or any
foreign country.
NOT INTENDED FOR CONSTRUCTION,
BIDDING, OR PERMIT PURPOSES
B. Frank McCullough, P.E. (Texas No. 19914) Research Supervisor
Acknowledgments
The authors would like to thank the project director, Mr. Mark McDaniel for his assistance
in coordinating this study with TxDOT. Appreciation is also expressed to Mr. Bryan Stampley
and Mr. Mike Norris, who helped in the access to the PMIS database and are still helping in
finding a solution to elaborate reports of the PMIS database via Internet.
Research performed in cooperation with the Texas Department of Transportation.

vii
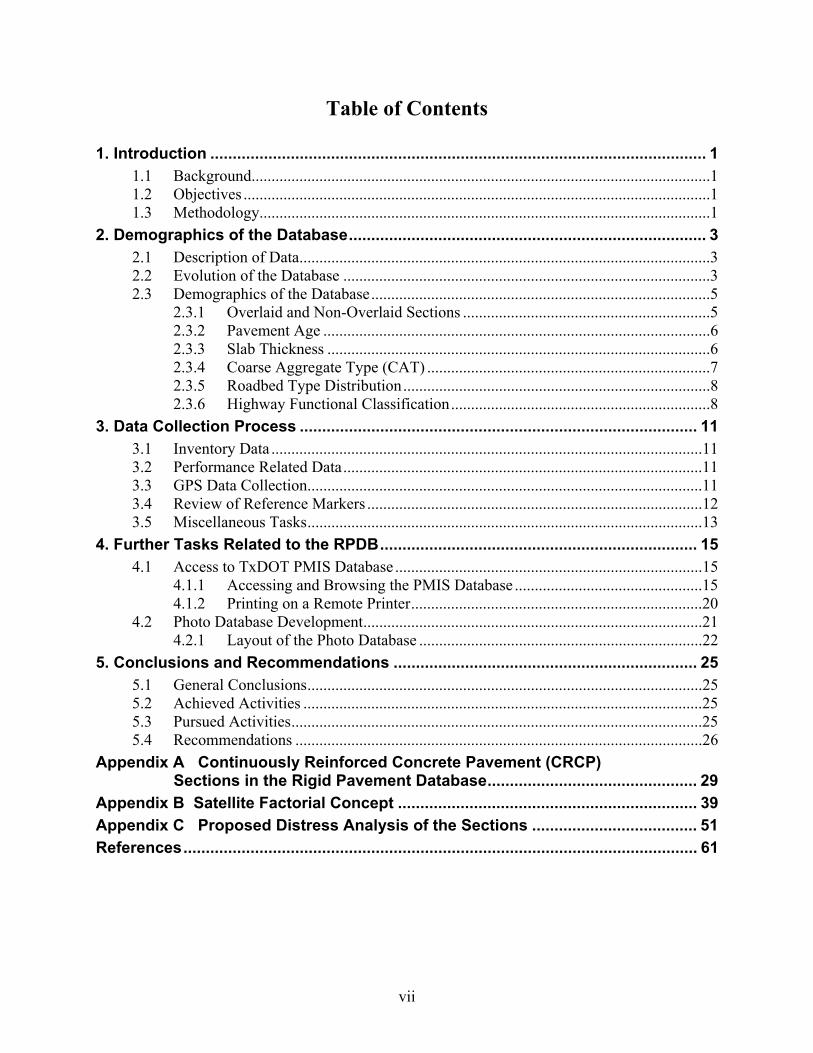
Table of Contents
1. Introduction ............................................................................................................... 1 1.1 Background...................................................................................................................1 1.2 Objectives .....................................................................................................................1 1.3 Methodology.................................................................................................................1
2. Demographics of the Database................................................................................ 3 2.1 Description of Data.......................................................................................................3 2.2 Evolution of the Database ............................................................................................3 2.3 Demographics of the Database.....................................................................................5
2.3.1 Overlaid and Non-Overlaid Sections ..............................................................5 2.3.2 Pavement Age .................................................................................................6 2.3.3 Slab Thickness ................................................................................................6 2.3.4 Coarse Aggregate Type (CAT) .......................................................................7 2.3.5 Roadbed Type Distribution.............................................................................8 2.3.6 Highway Functional Classification.................................................................8
3. Data Collection Process ......................................................................................... 11 3.1 Inventory Data ............................................................................................................11 3.2 Performance Related Data..........................................................................................11 3.3 GPS Data Collection...................................................................................................11 3.4 Review of Reference Markers ....................................................................................12 3.5 Miscellaneous Tasks...................................................................................................13
4. Further Tasks Related to the RPDB....................................................................... 15 4.1 Access to TxDOT PMIS Database .............................................................................15
4.1.1 Accessing and Browsing the PMIS Database ...............................................15 4.1.2 Printing on a Remote Printer.........................................................................20
4.2 Photo Database Development.....................................................................................21 4.2.1 Layout of the Photo Database .......................................................................22
5. Conclusions and Recommendations .................................................................... 25 5.1 General Conclusions...................................................................................................25 5.2 Achieved Activities ....................................................................................................25 5.3 Pursued Activities.......................................................................................................25 5.4 Recommendations ......................................................................................................26
Appendix A Continuously Reinforced Concrete Pavement (CRCP) Sections in the Rigid Pavement Database............................................... 29
Appendix B Satellite Factorial Concept ................................................................... 39 Appendix C Proposed Distress Analysis of the Sections ..................................... 51 References................................................................................................................... 61


ix
List of Figures
Figure 2.1 Condition surveys conducted from 1974 to 2000...........................................................5
Figure 2.2 Overlaid and non-overlaid sections ................................................................................6
Figure 2.3 Age distribution of CRCP sections (overlaid and non-overlaid)....................................6
Figure 2.4 Slab thickness distribution (overlaid and non-overlaid).................................................7
Figure 2.5 Coarse aggregate type (CAT) distribution (overlaid and non-overlaid) ........................8
Figure 2.6 Roadbed classification distribution (overlaid and non-overlaid) ...................................8
Figure 2.7 Highway functional classification and sections location (overlaid and non-overlaid) ......................................................................................................................9
Figure 4.1 Layout of initial PMIS log-in window .........................................................................16
Figure 4.2 Window providing access to the CICS platform..........................................................17
Figure 4.3 Access to the mainframe secured by providing a user name and a password..............17
Figure 4.4 Final window to access the PMIS system ....................................................................18
Figure 4.5 Window showing command to access the PMIS database...........................................19
Figure 4.6 Main menu of the PMIS database ................................................................................19
Figure 4.7 Layout of the photo database........................................................................................24


xi
List of Tables
Table 2.1 Data collection history for CRCP sections ......................................................................4

1
1. Introduction
1.1 Background This report is an update on Research Project 01778 “The Rigid Pavement Database”,
conducted by the Center for Transportation Research (CTR) of the University of Texas at
Austin and funded by the Texas Department of Transportation (TxDOT). As is well
known, this Rigid Pavement Database (RPDB) project contains vast information of a
selected group of test sections that represent the Portland Cement Concrete Pavement
(PCCP) network in the state of Texas. Condition surveys have been regularly conducted for
the last 26 years, and this invaluable information has facilitated the understanding of
pavements’ performance and the effect of different variables on them. Additionally, as a
result of this research project, some special studies have emerged focusing on different
variables like aggregate type and placement season of concrete pavement. This report
briefly documents some of those studies that have been and are still conducted by the
Center for Transportation Research. For previous information or data related to this project,
CTR’s series reports 1908, 1342, 1244, and 472 might be reviewed for details.
1.2 Objectives The goal of this report is to document and provide information about activities
connected with the RPDB. Ongoing activities that need to be tracked are cited and
highlighted throughout the different chapters. Particular attention has been paid to special
research studies that either have emerged from this RPDB project or have been
incorporated into this project because of their relevance and have enriched the contents of
the RPDB itself.
1.3 Methodology To accomplish the goal of this report, the chapters contained herein report or describe
different tasks as follows:
Chapter 2 describes the demographics of the data collected up to date. This
demographics description is carried out through the display of charts that summarize the
status of the database. This chapter also explains if changes were made in the population of
sections conforming the database and the reasons for those changes.

2
Chapter 3 briefly describes the two main components of the RPDB, the Inventory
Data and Performance Data. It explains the evolution of these data and reports any relevant
information related to data collection. Additions to the RPDB, are briefly included and
details are covered in the appendices.
Chapter 4 describes the tasks that have been pursued to complete full access to
TxDOT’s Pavement Management Information System (PMIS) database and generation of
reports.
Chapter 5 contains conclusions and recommendations.
3
2. Demographics of the Database
2.1 Description of Data This section displays the evolution of the data contained in the RPDB. This
information is known as inventory data and it changes only when sections are surveyed and
added to the database. It contains basic information of the pavement sections and is
considered valuable information because it provides with a broad idea of the pavement
sections population.
Among the inventory data included in the database are: district number, county name,
highway name, reference markers, global positioning system coordinates (GPS), number of
lanes per surveyed roadbed, surveyed lane, highway geometric characteristics (alignment
and roadbed), coarse aggregate type, construction date, pavement thickness, and climatic
information. All these data are contained in the database for all the CRCP sections
surveyed so far and are included in Appendix A.
2.2 Evolution of the Database The history of the RPDB goes back to 1974. Since then, different condition surveys
have been conducted every year. Table 2.1 summarizes the evolution of condition surveys
of Continuously Reinforced Concrete Pavements (CRCP) conducted and it also displays
what type of data was collected every year.
4
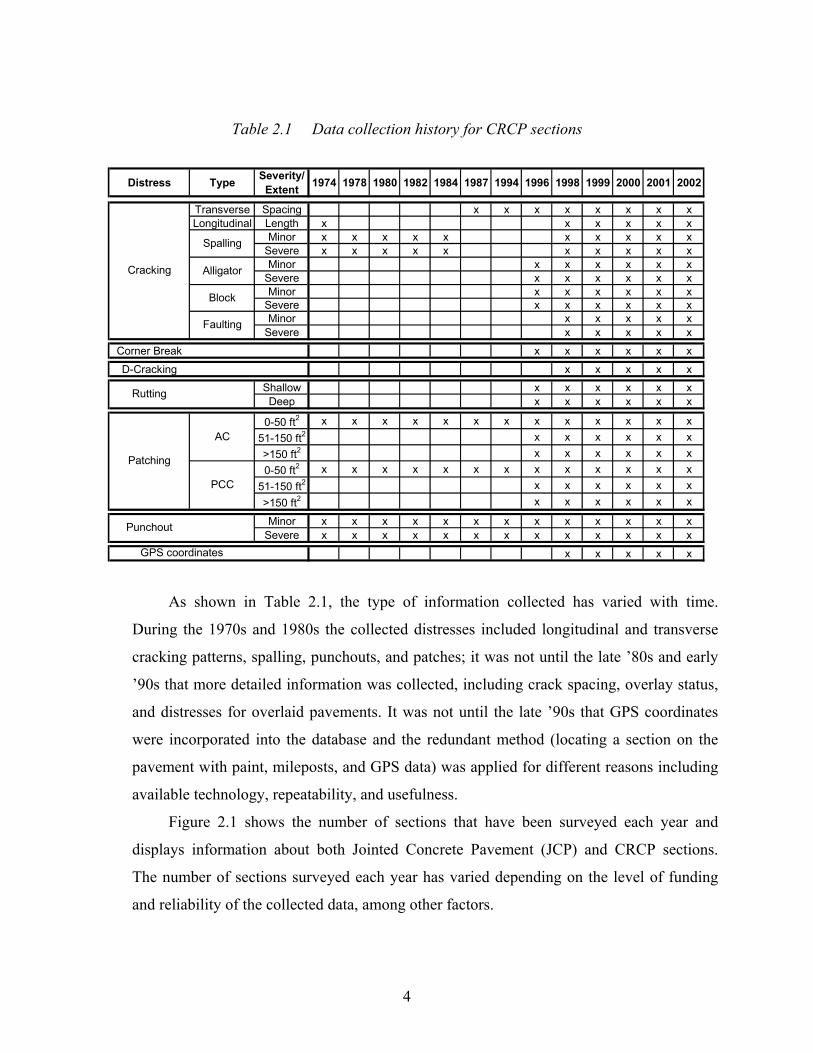
Table 2.1 Data collection history for CRCP sections
Distress Type Severity/Extent 1974 1978 1980 1982 1984 1987 1994 1996 1998 1999 2000 2001 2002
Transverse Spacing x x x x x x x xLongitudinal Length x x x x x x
Minor x x x x x x x x x xSevere x x x x x x x x x xMinor x x x x x x
Severe x x x x x xMinor x x x x x x
Severe x x x x x xMinor x x x x x
Severe x x x x xCorner Break x x x x x xD-Cracking x x x x x
Shallow x x x x x xDeep x x x x x x
0-50 ft2 x x x x x x x x x x x x x51-150 ft2 x x x x x x>150 ft2 x x x x x x0-50 ft2 x x x x x x x x x x x x x
51-150 ft2 x x x x x x>150 ft2 x x x x x x
Minor x x x x x x x x x x x x xSevere x x x x x x x x x x x x x
x x x x x
Punchout
GPS coordinates
Rutting
Patching
AC
PCC
Cracking
Spalling
Alligator
Block
Faulting
As shown in Table 2.1, the type of information collected has varied with time.
During the 1970s and 1980s the collected distresses included longitudinal and transverse
cracking patterns, spalling, punchouts, and patches; it was not until the late ’80s and early
’90s that more detailed information was collected, including crack spacing, overlay status,
and distresses for overlaid pavements. It was not until the late ’90s that GPS coordinates
were incorporated into the database and the redundant method (locating a section on the
pavement with paint, mileposts, and GPS data) was applied for different reasons including
available technology, repeatability, and usefulness.
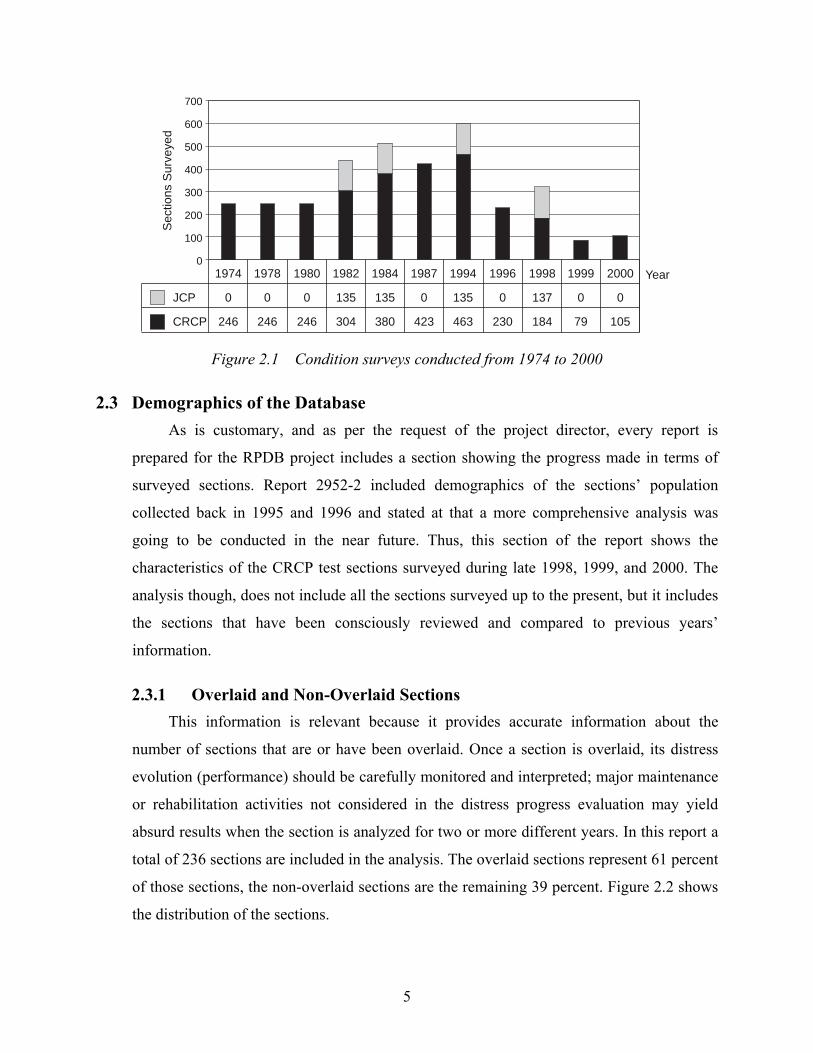
Figure 2.1 shows the number of sections that have been surveyed each year and
displays information about both Jointed Concrete Pavement (JCP) and CRCP sections.
The number of sections surveyed each year has varied depending on the level of funding
and reliability of the collected data, among other factors.
5
700
600
500
400
300
200
100
0
Sec
tions
Sur
veye
d
Year1974 1978 1980 1982 1984 1987 1994 1996 1998 1999 2000
JCP 0 0 0 135 135 0 135 0 137 0 0
CRCP 246 246 246 304 380 423 463 230 184 79 105
Figure 2.1 Condition surveys conducted from 1974 to 2000
2.3 Demographics of the Database As is customary, and as per the request of the project director, every report is
prepared for the RPDB project includes a section showing the progress made in terms of
surveyed sections. Report 2952-2 included demographics of the sections’ population
collected back in 1995 and 1996 and stated at that a more comprehensive analysis was
going to be conducted in the near future. Thus, this section of the report shows the
characteristics of the CRCP test sections surveyed during late 1998, 1999, and 2000. The
analysis though, does not include all the sections surveyed up to the present, but it includes
the sections that have been consciously reviewed and compared to previous years’
information.
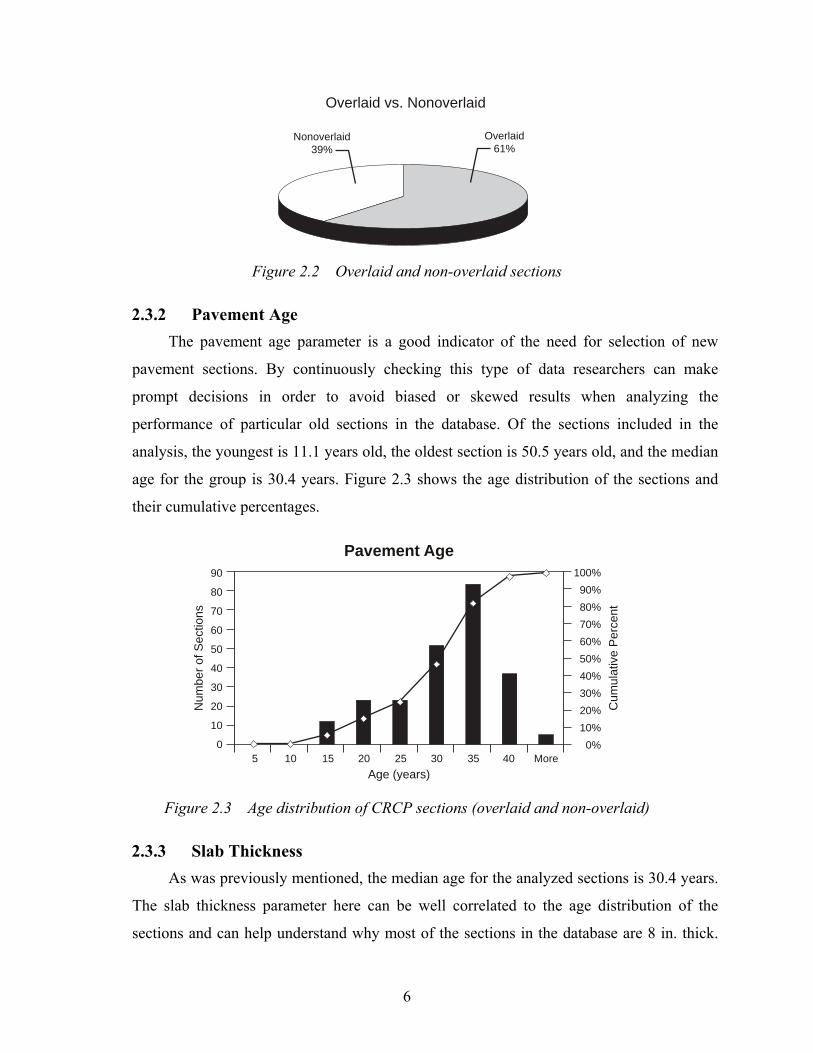
2.3.1 Overlaid and Non-Overlaid Sections This information is relevant because it provides accurate information about the
number of sections that are or have been overlaid. Once a section is overlaid, its distress
evolution (performance) should be carefully monitored and interpreted; major maintenance
or rehabilitation activities not considered in the distress progress evaluation may yield
absurd results when the section is analyzed for two or more different years. In this report a
total of 236 sections are included in the analysis. The overlaid sections represent 61 percent
of those sections, the non-overlaid sections are the remaining 39 percent. Figure 2.2 shows
the distribution of the sections.
6
Overlaid61%
Nonoverlaid39%
Overlaid vs. Nonoverlaid
Figure 2.2 Overlaid and non-overlaid sections
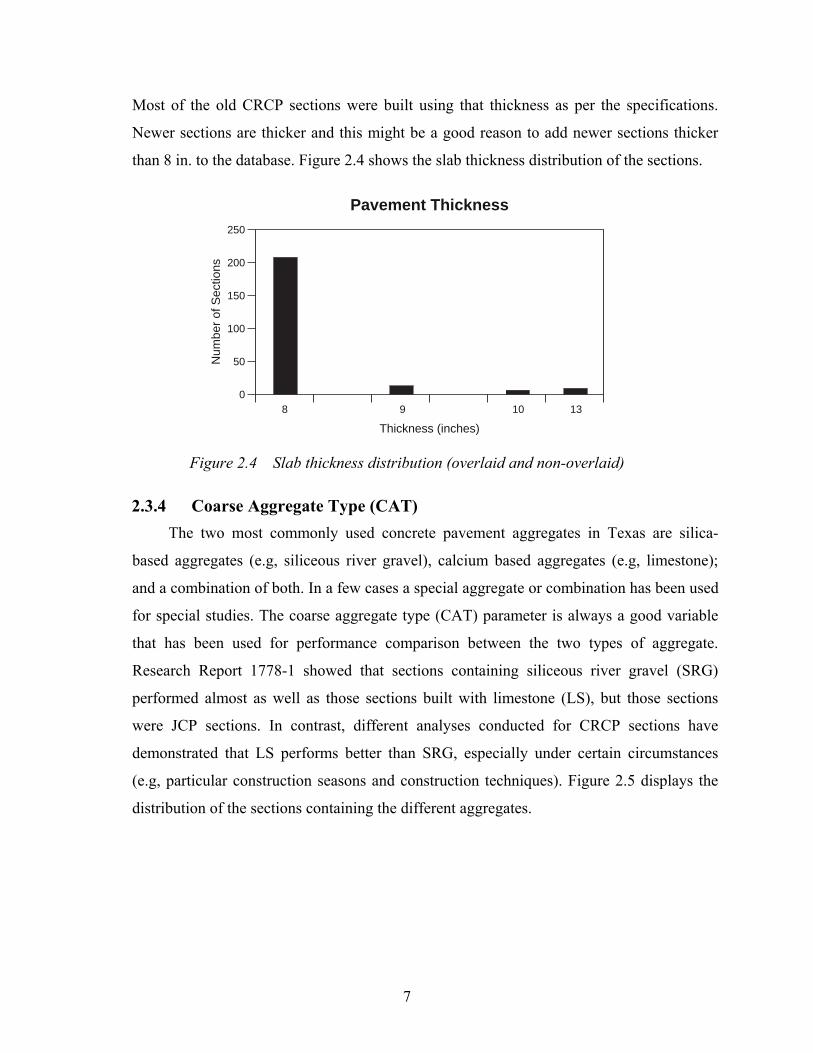
2.3.2 Pavement Age The pavement age parameter is a good indicator of the need for selection of new
pavement sections. By continuously checking this type of data researchers can make
prompt decisions in order to avoid biased or skewed results when analyzing the
performance of particular old sections in the database. Of the sections included in the
analysis, the youngest is 11.1 years old, the oldest section is 50.5 years old, and the median
age for the group is 30.4 years. Figure 2.3 shows the age distribution of the sections and
their cumulative percentages.
Num
ber
of S
ectio
ns
Pavement Age90
80
70
60
50
40
30
20
10
05 10 15 20 25 30 35 40 More
Age (years)
Cum
ulat
ive
Per
cent
100%
90%
80%
70%
60%
50%
40%
30%
20%
10%
0%
Figure 2.3 Age distribution of CRCP sections (overlaid and non-overlaid)
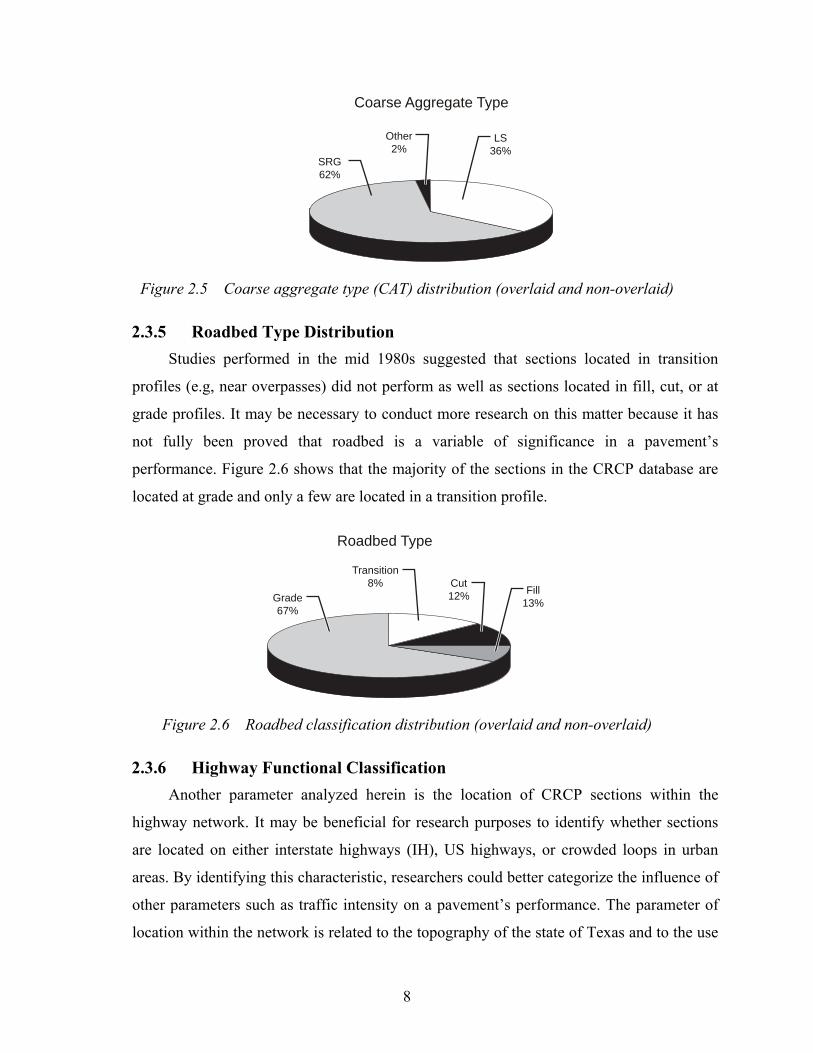
2.3.3 Slab Thickness As was previously mentioned, the median age for the analyzed sections is 30.4 years.
The slab thickness parameter here can be well correlated to the age distribution of the
sections and can help understand why most of the sections in the database are 8 in. thick.
7
Most of the old CRCP sections were built using that thickness as per the specifications.
Newer sections are thicker and this might be a good reason to add newer sections thicker
than 8 in. to the database. Figure 2.4 shows the slab thickness distribution of the sections.
Num
ber
of S
ectio
nsPavement Thickness
250
200
150
100
50
08 9 10 13
Thickness (inches)
Figure 2.4 Slab thickness distribution (overlaid and non-overlaid)
2.3.4 Coarse Aggregate Type (CAT) The two most commonly used concrete pavement aggregates in Texas are silica-
based aggregates (e.g, siliceous river gravel), calcium based aggregates (e.g, limestone);
and a combination of both. In a few cases a special aggregate or combination has been used
for special studies. The coarse aggregate type (CAT) parameter is always a good variable
that has been used for performance comparison between the two types of aggregate.
Research Report 1778-1 showed that sections containing siliceous river gravel (SRG)
performed almost as well as those sections built with limestone (LS), but those sections
were JCP sections. In contrast, different analyses conducted for CRCP sections have
demonstrated that LS performs better than SRG, especially under certain circumstances
(e.g, particular construction seasons and construction techniques). Figure 2.5 displays the
distribution of the sections containing the different aggregates.
8
SRG62%
Other2%
LS36%
Coarse Aggregate Type
Figure 2.5 Coarse aggregate type (CAT) distribution (overlaid and non-overlaid)
2.3.5 Roadbed Type Distribution Studies performed in the mid 1980s suggested that sections located in transition
profiles (e.g, near overpasses) did not perform as well as sections located in fill, cut, or at
grade profiles. It may be necessary to conduct more research on this matter because it has
not fully been proved that roadbed is a variable of significance in a pavement’s
performance. Figure 2.6 shows that the majority of the sections in the CRCP database are
located at grade and only a few are located in a transition profile.
Roadbed Type
Grade67%
Cut12%
Transition8%
Fill13%
Figure 2.6 Roadbed classification distribution (overlaid and non-overlaid)
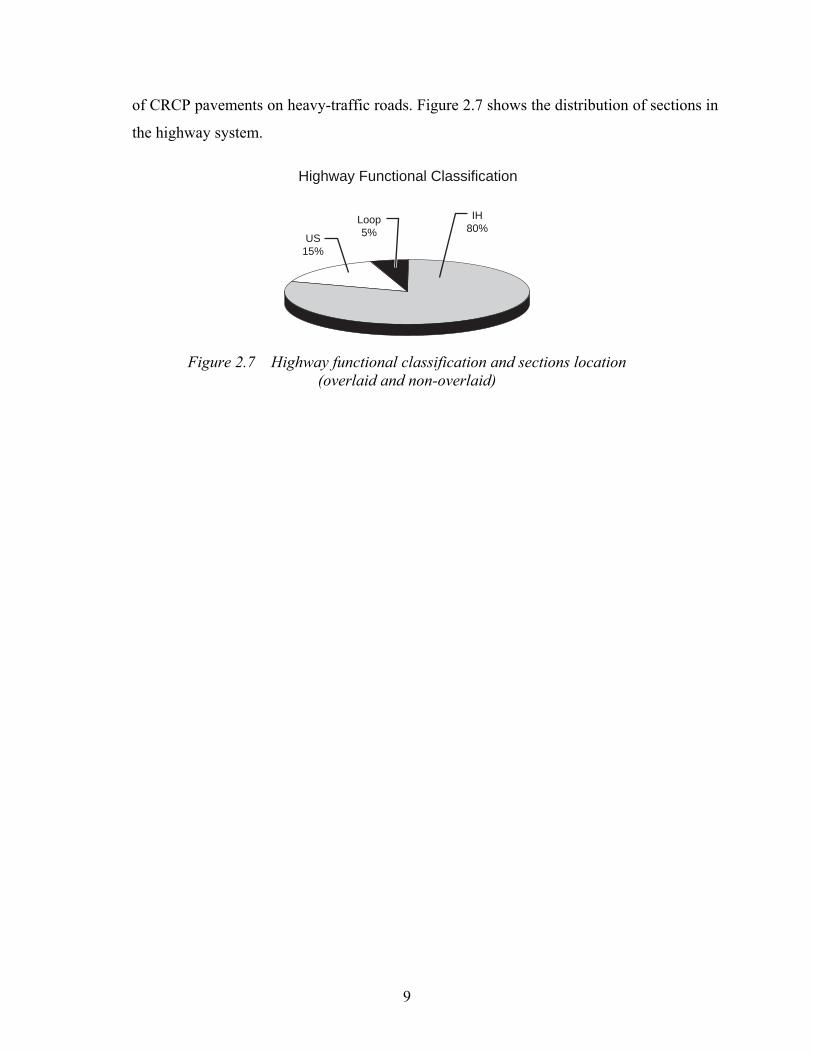
2.3.6 Highway Functional Classification Another parameter analyzed herein is the location of CRCP sections within the
highway network. It may be beneficial for research purposes to identify whether sections
are located on either interstate highways (IH), US highways, or crowded loops in urban
areas. By identifying this characteristic, researchers could better categorize the influence of
other parameters such as traffic intensity on a pavement’s performance. The parameter of
location within the network is related to the topography of the state of Texas and to the use
9
of CRCP pavements on heavy-traffic roads. Figure 2.7 shows the distribution of sections in
the highway system.
US15%
Loop5%
IH80%
Highway Functional Classification
Figure 2.7 Highway functional classification and sections location (overlaid and non-overlaid)

11
3. Data Collection Process
3.1 Inventory Data As it was mentioned in Chapter 2, the inventory data included in the RPDB are:
district number, county name, highway name, reference markers, global positioning system
(GPS) coordinates, number of lanes, surveyed lane, geometric characteristics (alignment
and roadbed), coarse aggregate type (CAT), construction date, pavement thickness, and
climatic information. All this information is stored in the database for all the sections
surveyed each year. Appendix A contains a list of the CRCP sections surveyed. This data
can be accessed via file transfer protocol (FTP) providing a username and a password.
3.2 Performance Related Data Performance related data of the sections is collected in the field according to the
project’s field plan schedule and using condition survey forms. The parameters recorded
might vary for two different years, and that depends on the amount or type of information
that needs to be collected. The amount of collected information often depends on available
budget, time to conduct surveys, and especial recommendations from researchers regarding
specific distresses of the sections. Among the distress data collected every year are asphalt
concrete or Portland cement concrete patches, punchouts, potholes, spalling, D-cracking
and corner breaks (for JCP’s), and also longitudinal cracking and transverse cracking. As
in the case of the inventory data, this data can also be accessed via FTP.
3.3 GPS Data Collection Since 1998, the implementation of a global positioning system (GPS) technology has
been successfully used in this research project to locate the pavement sections in the field.
Even though the equipment used in this project has limitations, the relocation of the
sections has been much easier than it used to be, when GPS technology was not used. The
continuation of use of the GPS equipment is advisable and acquisition of a better device is
justifiable, given that the current equipment presents occasional problems while operating.
At the time of writing this document the Jointed Concrete Pavement (JCP) sections of
the RPDB have been completely surveyed and more than 95 percent of the 137 sections
have been assigned with GPS coordinates (latitude and longitude). Likewise, of the existing
12
488 Continuously Reinforced Concrete Pavement (CRCP) sections, nearly 90 percent have
been surveyed and almost the totality have been assigned GPS coordinates.
GPS coordinates are not assigned only when for some unknown reason, the currently
available device displays no reading. A reconfiguration of the device is necessary when this
problem arises. Additionally, it is necessary to displace the device from one point to
another in the van or vehicle so that it will better receive the satellites’ signal. In summary,
the main problem that the malfunction of the device is causing is a time delay while in the
field, but the positive side is that the failure happens only occasionally.
3.4 Review of Reference Markers All the surveyed sections since 1998 have updated information about reference
markers. The procedure described in the PMIS Rater’s Manual (Reference 3) has been used
as a guideline and reference markers have been assigned with that recommendation. In the
past, many sections used to be referenced to bridges, streets, and even traffic signs, which
in reality did not give an accurate and compatible location of the sections to the PMIS grid
system. As mentioned above, nearly 90 percent of the existing CRCP sections have been
surveyed, and all the sections have been checked or reassigned reference markers
according to the PMIS criteria. The redundant method of assigning a GPS location and a
reference marker has been found to be a reliable procedure that provides an accurate
location of the sections during condition surveys. Nowadays, every time a survey is
performed the time savings and the confidence level that a section is really located at some
point on the highway are remarkable.
Among the performed tasks related to reference marker location, the elimination of
some sections from the database has been carefully managed. There are different reasons
for which a section can or should be eliminated from the database, but probably the most
important reason involves a safety issue. Districts or highway routes with outstanding
traffic volumes have been candidates for this determination. The Dallas and Fort Worth
districts where some of the removed sections were located are good examples. In almost all
the cases, sections have been removed from the database because they are located close to
either an exit ramp or merging ramp, where the traffic volumes are usually high. Another
reason why sections have been removed from the database is the out-of-range discrepancy
between already available data related to the section and the found field conditions. As an

13
example, three sections were removed from the San Antonio district because, according to
the existing data, the sections were located in a tangent span of the highway and a roadbed
classified as at-grade, but in reality the sections were found in an area of overpasses on IH-
37.
Another common reason for which some sections were removed from the database
was the fact that the previously available information about some sections’ reference
markers was completely different from the reference markers found on the highway. A
particular route that presented this problem is US-287, where the sections were never found
in the northern counties of Texas, including Childress and Wichita Falls.
3.5 Miscellaneous Tasks This section summarizes some of the tasks that reflect the progress achieved in the
management of RPDB. Most of these tasks were fully described in References 1 and 2.
Among the tasks that have been pursued in this project, is the accurate evaluation of
the sections and their location in the field. This task has been achieved by several means,
including the preparation of a new condition survey form that can be used to survey any
type of pavement, whether it is overlaid, JCP, CRCP, or any other type. The form has a
layout that rates the pavement section and distresses in a very easy and readable way.
Another task that has been improved is the planning of the field trips. In the prior
past, the field trips usually were conducted in a more disorganized way. Sections were
surveyed without any previously elaborated plan. Nowadays, the field trips are planned
ahead in such a way that the time spent on the highway is used in the best way possible.
Surveyors compile district plans and sections information and then carry out a well
scheduled field plan in order to avoid driving back while on the highway or forgetting to
survey specific test sections. The accurate reference marker availability is a major factor
that avoids problems in the field and helps optimize time.
As an additional effort that began with the interaction of information available from
the database and other special studies, satellite factorials have been created and now are
now part of the RPDB. A detailed description of the satellite factorials and their content are
given in Appendix B of this report. The included satellite factorials are:

14
1. The sections from Project 1244 in Houston
2. The sections from Project 3925 in Houston
3. The sections of the quality control and quality assurance (QC/QA) projects
spread throughout Texas
4. The sections of the 70 ksi reinforcement steel projects in Houston
Finally, Chapter 4 of this report focuses on other activities that are being conducted
under this study. The activities include the creation and maintenance of a photodatabase
that show visual conditions and description of distresses commonly found in pavements.
Likewise, access to TxDOT Pavement Management Information System (PMIS) database
via the Internet is described.
15
4. Further Tasks Related to the RPDB
4.1 Access to TxDOT PMIS Database Among the tasks that have been strongly pursued in this project, gaining access to the
TxDOT PMIS database is one that has taken more time than expected. At press time,
Internet access has been gained, but for several reasons, it is still not possible to print
reports.
According to the original plan, access to the PMIS database would help accomplish
the following goals:
1. Compare the information contained in the PMIS database to that in RPDB to
trace, complement, and prevent potential incompatibilities of the two sources
of information.
2. Analyze the available information and decide which sections may need to be
monitored more closely.
3. Generate reports that would provide vast information about construction
projects or test sections. That information would be essential to potential
special research studies.
4.1.1 Accessing and Browsing the PMIS Database TxDOT PMIS management staff have provided access to the PMIS database via
Internet through a secure mode. However, the printing capabilities in a remote printer (one
not located at TxDOT facilities) are still presenting some problems at press time.
One may gain access to the PMIS database and generate reports by following the next
procedure:
Using an Internet browser (Internet Explorer 3.0/Netscape 3.0 or newer versions), one
should visit the site http://oc.dot.state.tx.us:2080/. Once in that location, the user should
select the mode “3270-Mod 2” to start a new session. That is the default mode that should
be used when one accesses the mainframe from a PC. Then the start button should be
clicked. This will allow the user to begin with the session.
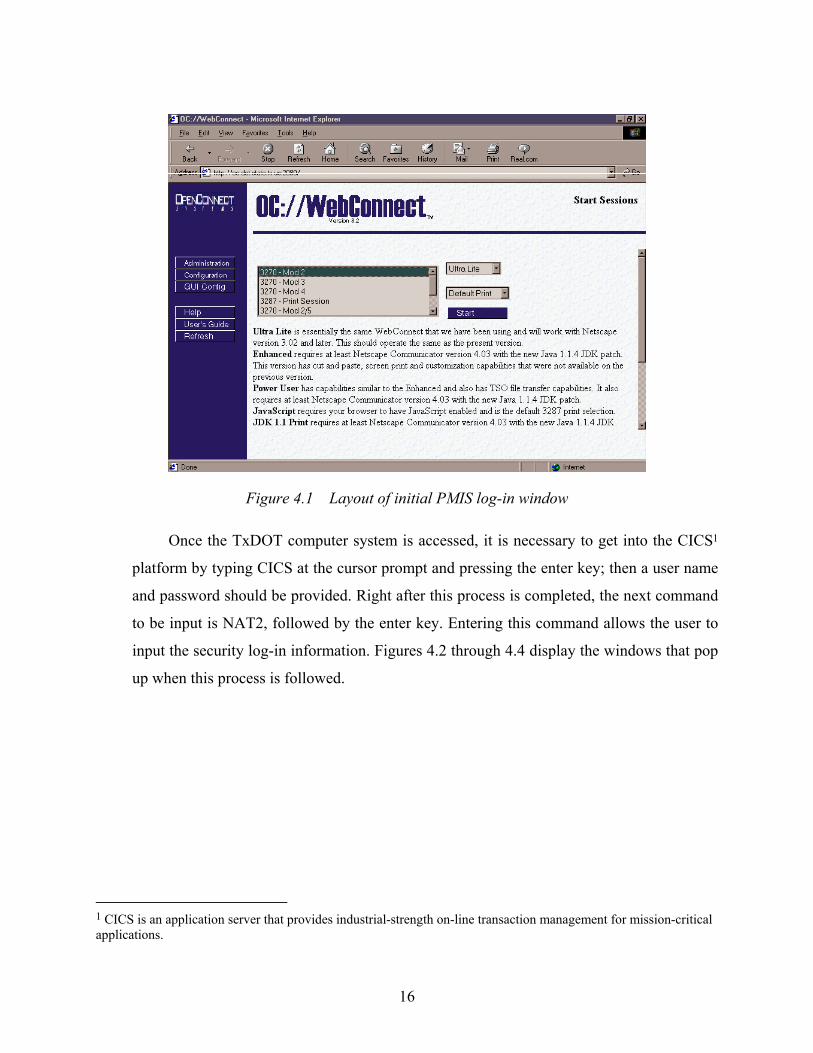
Figure 4.1 shows the layout of the window that appears when a user logs in to this
site.
16
Figure 4.1 Layout of initial PMIS log-in window
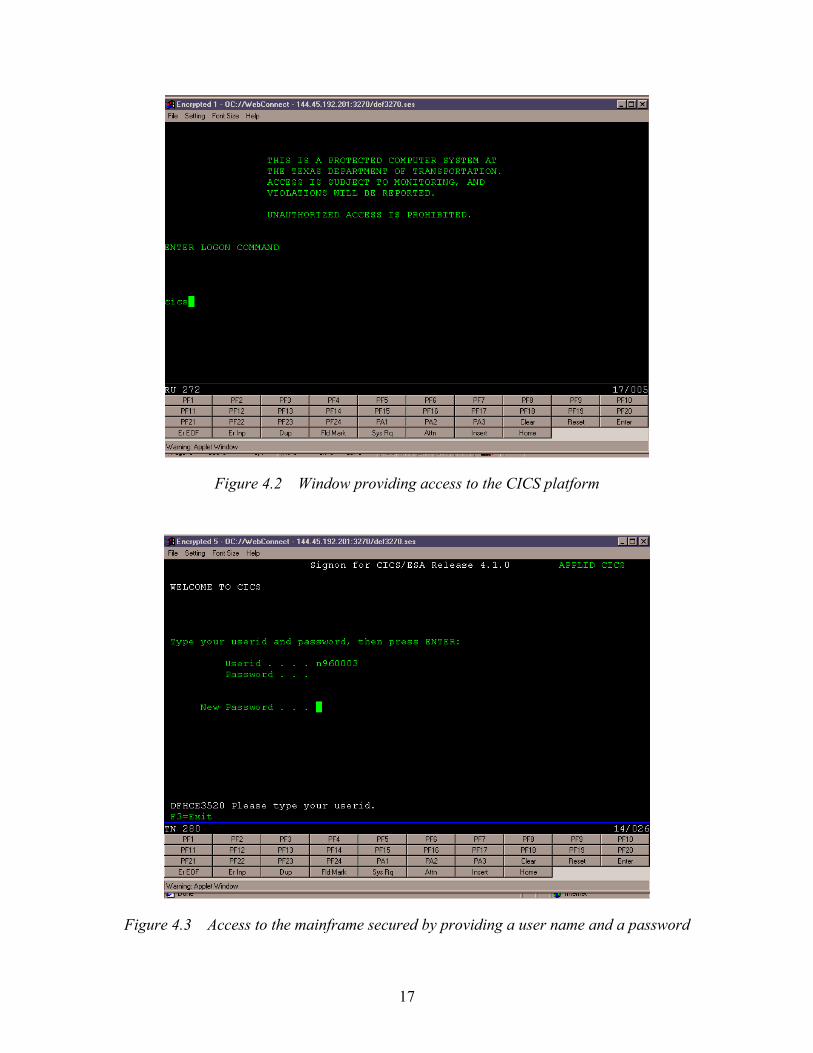
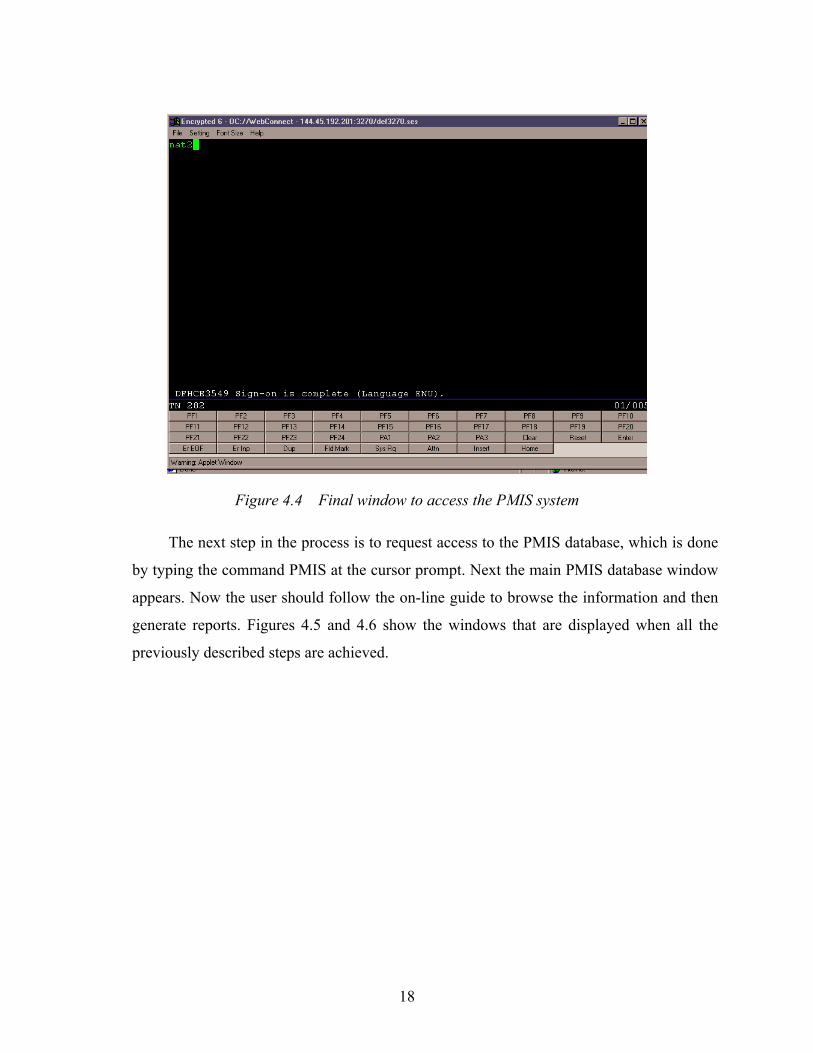
Once the TxDOT computer system is accessed, it is necessary to get into the CICS1
platform by typing CICS at the cursor prompt and pressing the enter key; then a user name
and password should be provided. Right after this process is completed, the next command
to be input is NAT2, followed by the enter key. Entering this command allows the user to
input the security log-in information. Figures 4.2 through 4.4 display the windows that pop
up when this process is followed.
1 CICS is an application server that provides industrial-strength on-line transaction management for mission-critical applications.
17
Figure 4.2 Window providing access to the CICS platform
Figure 4.3 Access to the mainframe secured by providing a user name and a password
18
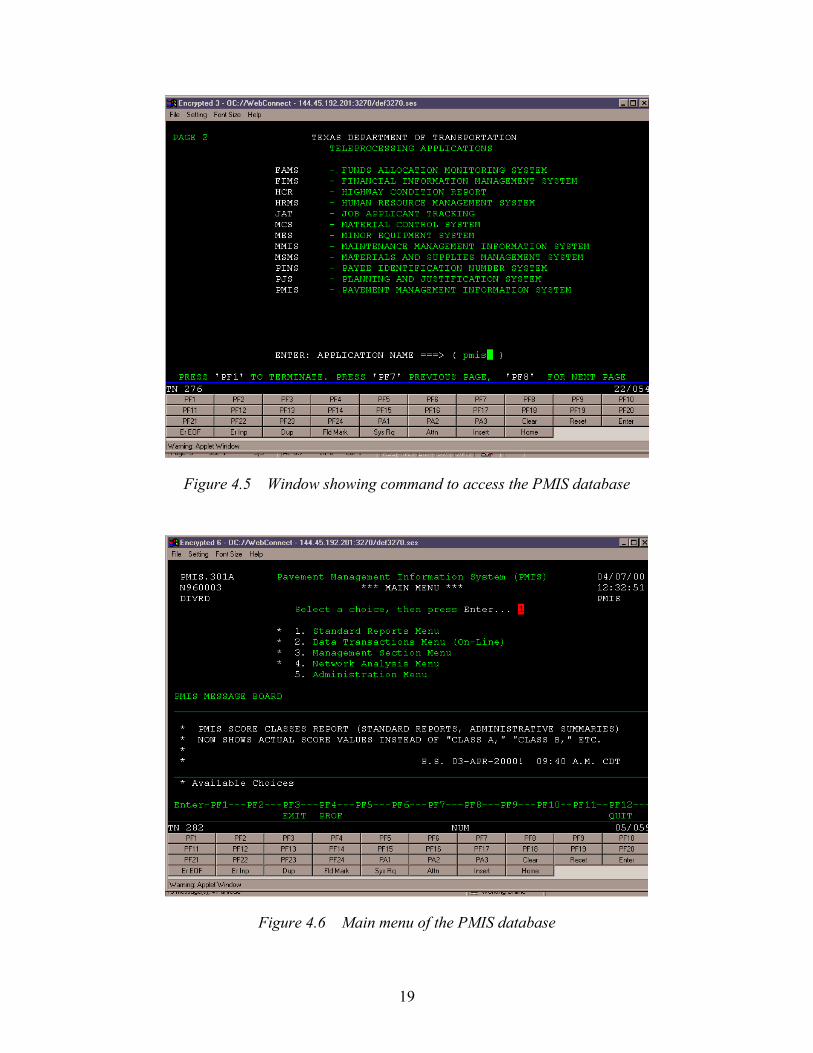
Figure 4.4 Final window to access the PMIS system
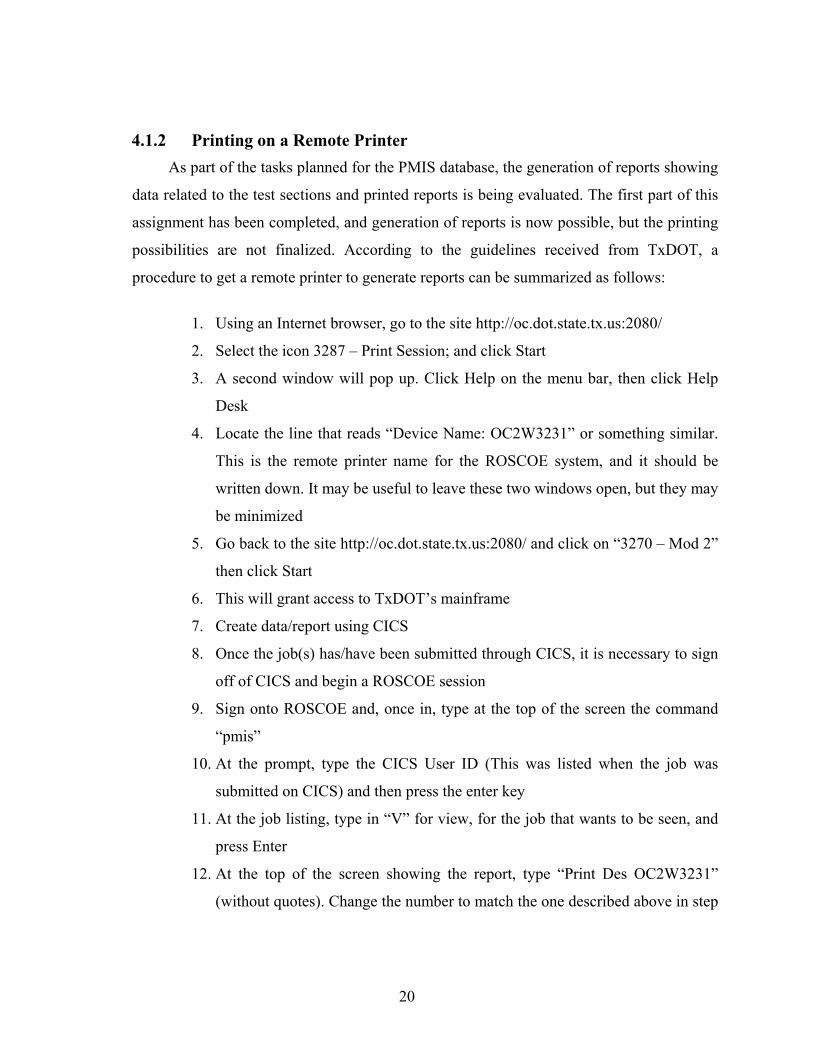
The next step in the process is to request access to the PMIS database, which is done
by typing the command PMIS at the cursor prompt. Next the main PMIS database window
appears. Now the user should follow the on-line guide to browse the information and then
generate reports. Figures 4.5 and 4.6 show the windows that are displayed when all the
previously described steps are achieved.
19
Figure 4.5 Window showing command to access the PMIS database
Figure 4.6 Main menu of the PMIS database
20
4.1.2 Printing on a Remote Printer As part of the tasks planned for the PMIS database, the generation of reports showing
data related to the test sections and printed reports is being evaluated. The first part of this
assignment has been completed, and generation of reports is now possible, but the printing
possibilities are not finalized. According to the guidelines received from TxDOT, a
procedure to get a remote printer to generate reports can be summarized as follows:
1. Using an Internet browser, go to the site http://oc.dot.state.tx.us:2080/
2. Select the icon 3287 – Print Session; and click Start
3. A second window will pop up. Click Help on the menu bar, then click Help
Desk
4. Locate the line that reads “Device Name: OC2W3231” or something similar.
This is the remote printer name for the ROSCOE system, and it should be
written down. It may be useful to leave these two windows open, but they may
be minimized
5. Go back to the site http://oc.dot.state.tx.us:2080/ and click on “3270 – Mod 2”
then click Start
6. This will grant access to TxDOT’s mainframe
7. Create data/report using CICS
8. Once the job(s) has/have been submitted through CICS, it is necessary to sign
off of CICS and begin a ROSCOE session
9. Sign onto ROSCOE and, once in, type at the top of the screen the command
“pmis”
10. At the prompt, type the CICS User ID (This was listed when the job was
submitted on CICS) and then press the enter key
11. At the job listing, type in “V” for view, for the job that wants to be seen, and
press Enter
12. At the top of the screen showing the report, type “Print Des OC2W3231”
(without quotes). Change the number to match the one described above in step

21
4. Press Enter. This will bring up a blank OC://WebConnect screen. Keep
pressing the enter key until the whole job is on the screen
13. Once the complete job is on the screen, on the menu bar click File then Print
14. The job should be sent to the default printer in the PC, or another printer may
be selected
Even though these steps have been followed so that previously generated reports
could be printed, there are still some software or hardware related problems in getting a
remote printer to print the reports.
4.2 Photo Database Development An interesting and valuable endeavor that has been continuously updated is the
compilation of photographs showing different characteristics of PCC pavements; this effort
has resulted in the creation of a photo database that is linked to the RPDB. The photo
database compiles a series of digital images that have been captured during condition
surveys. The filed images contain different features of PCC pavements and can be
categorized into two main groups: panoramic photographs, and photographs showing
concrete pavement distresses.
Even though there are presently no guidelines for the field crew to follow when
taking pictures in the field, this section of the report provides with some instructions for
gathering useful photo images for the database. Photographs should be taken in the
following cases:
1. Every time a field crew goes to the highway to collect information about a
construction project or any sort of maintenance or rehabilitation activities.
2. Every time sections included in the RPDB are surveyed. It may not be
necessary to take photos of every single section, but sections in which one or
more characteristics are relevant (such as the number and types of distresses,
and good or bad crack spacing) should definitely be included in the photo
database.

22
3. In cases where distresses are beginning to develop (e.g, punchouts, and
spalling) it is important to document and link the photograph to the condition
survey information.
4. When a concrete pavement section is in very good or very bad condition,
panoramic and localized photos should be taken. In these cases, it is very
important to make some comments about the aggregate type that was used in
the concrete mix (either LS or SRG, or another type of aggregate if it is the
case). Any other information that may be known about the section must be
documented.
5. The use of special equipment used to measure some properties of concrete or
pavement should also be captured in images. Crack width data collection,
coring of the pavement, deflection measurement with Falling Weight
Deflectometer (FWD) or Rolling Dynamic Deflection (RDD) vehicle, and
other laboratory tests are good examples.
6. Any other conditions in which useful images could be obtained are left to the
experience of the field crew that is in charge of the data collection.
The photo database has been created using Microsoft Access, which is believed to be
the most appropriate format and can be linked easily to the existing RPDB.
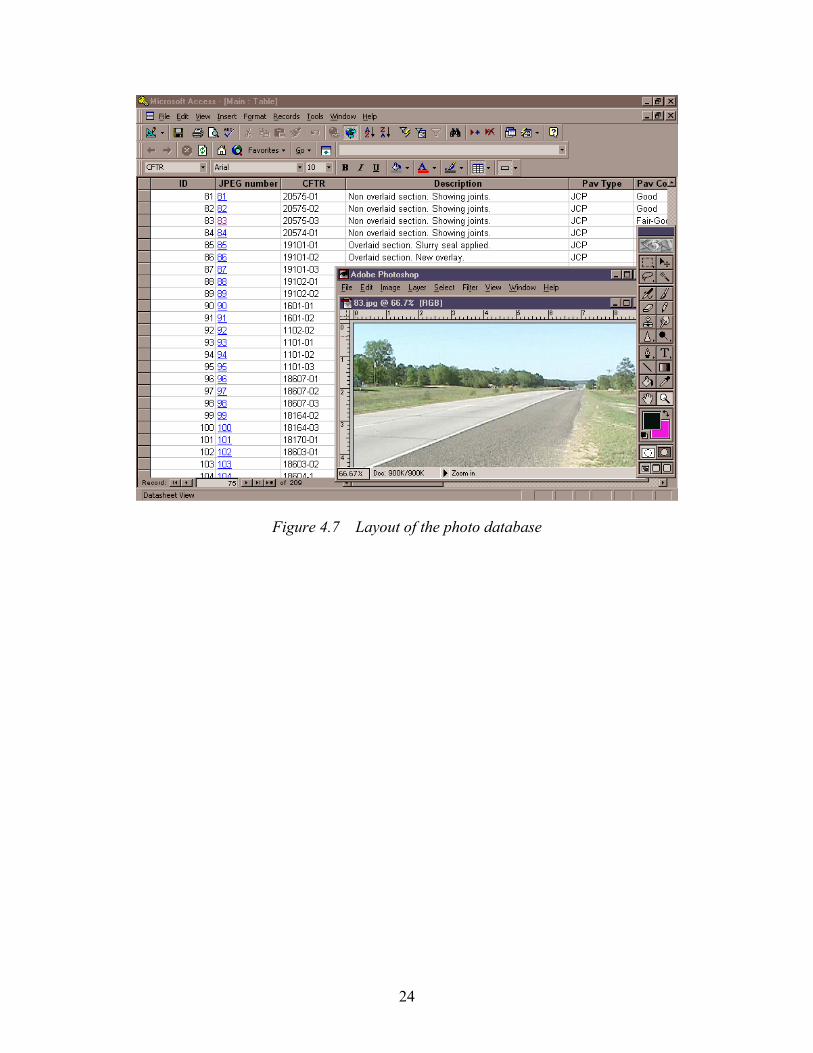
4.2.1 Layout of the Photo Database Although this photo database has a very simple format, it contains browsable
information about many sections. The existing fields include:
1. Identification number (ID) - this is a progressive list of numbers that is used
by Microsoft Access as a primary key and is used to link the different tables
that have been created for the RPDB.
2. JPEG number - this number corresponds to the image number (JPEG format)
or photo number that is filed in the database. As more photos are incorporated
into the database, this list of numbers increases. Additionally, this specific
column has a hyperlink, and when a number is clicked with the computer’s

23
mouse, the image that corresponds to that selected number opens in a new
window, showing the stored photograph.
3. CFTR number - the number shown in this field corresponds to the RPDB
identification number of the section. Usually, the first one or two digits of this
number correspond to the Texas district number. When the photo does not
correspond to a section included in the RPDB, then the words NO CFTR are
typed.
4. Description - this column gives a brief report of what is shown in the image.
Usually it mentions the highway, the city, or another feature of the photo.
5. Pav Type - this field classifies the pavement section in the photo as a JCP or
CRCP.
6. Pav Condition - this field subjectively describes the condition of the pavement
when the photo was taken. Typical conditions include Very Good, Good, Fair,
Poor, Very Poor, and Not Shown when the photo is not showing the condition
of the pavement.
7. Distress Highlighted - this field describes the distress shown in the photo.
Figure 4.7 displays a layout of the screen of the Microsoft Access photo database and
its different fields.
24
Figure 4.7 Layout of the photo database
25
5. Conclusions and Recommendations
5.1 General Conclusions This report has discussed most of the activities that have been and are being
conducted for the RPDB project. Many of the planned activities have been successfully
completed, and some other tasks are still pending and require special attention. It is not an
easy task to manage the RPDB, it requires a comprehensive knowledge of the information
that the database contains, which has changed in format in the 26 years of its existence.
5.2 Achieved Activities Among the tasks that have been a continuous workload for this project and that have
been fully completed or implemented are the following:
A cleaning process of the inventory data for all sections has been established. This
includes the JCP sections and the up-to-date surveyed CRCP sections (around 90 percent).
All the data for these sections has been checked and typed into electronic files so that it is
ready to be used for any purpose (e.g, demographic analysis, distress analysis, or special
research studies). The information is readily available in different formats including
Microsoft Excel, Access, and SAS.
Climatic data for all the sections has also been retrieved and processed by different
means (References 1 and 2). This climatic information has been incorporated into the
electronic database and is linked to the inventory and performance-related data. This task is
relevant because the climatic variables have a major impact on the early and long-term
performance of concrete pavement and may be used in special research studies.
A photo database has been created and linked to the existing RPDB. This photo
database provides with invaluable graphic data that allows for easy identification of
pavement distresses and their evolution with time, traffic, and other variables.
5.3 Pursued Activities Even though a number of tasks have been completed in the last few years, there are
still some activities that need to be pursued. Among the most relevant activities are the
following:

26
The continuation of the organization of the information gathered for some special
studies like the ones described in Chapter 4. The information collected for those special
studies is quite vast and requires continuous reorganization in order to be user-friendly.
This information should still be merged into the existing RPDB, and all the additional
information available for the projects (e.g, concrete strengths) should be managed in such a
way that it could be easily retrieved from the Access database.
At press time, nearly 90 percent of the overall CRCP sections have been completely
surveyed. The sections that need to be surveyed to complete the whole CRCP database are
located in the districts of Paris, Atlanta, and Beaumont. Because some changes in the field
crew for this project have taken place, the field tasks are going to take more time than was
previously planned.
Another pair of tasks that are being tracked for this project are the processes of
gaining access to TxDOT’s mainframe system PMIS and Design and Construction
Information System (DCIS) databases. In the case of the PMIS, access and generation of
reports have been successfully gained, but the report-printing capabilities are still having
problems due to unknown causes. The whole process of requesting access to TxDOT is still
required for the DCIS, but it has not been done yet because it would be better and easier to
secure full capabilities on the PMIS first.
5.4 Recommendations According to the contents of this report and the previous conclusions, a considerable
amount of information has been processed through different activities in the project. Report
1778-1 (Reference 1) of this same project is the only one in which a distress analysis has
been performed for all non-overlaid sections surveyed in the Dallas district (JCP sections).
Thus a first general recommendation here would be to begin thinking about the possibility
of conducting a broad analysis of the distresses on the sections for different years and
obtaining performance-related characteristics of the sections for selected projects. It would
be necessary to formulate a plan of attack for this extensive analysis.
Some other specific recommendations that will stress the usefulness of the RPDB
include the following:

27
1. Identification and incorporation of new projects into the database should be
pursued. It would be useful to pick projects that have characteristics different
from the majority of the sections in the actual CRCP database (e.g, pavements
with thickness greater than 8 in., CRCP sections where double steel mat is
used, and sections in highways other than interstates). This inclusion of new
sections in the database would give it a wider application.
2. As mentioned in the conclusions above, a good plan to conclude the CRCP’s
condition surveys should be formulated. Then a plan for the initiation of the
JCP’s surveys could be established.
3. Printing capabilities and access to TxDOT’s PMIS and DCIS, respectively
should be strongly pursued.
4. An effort to update the existing photo database, which currently has more than
200 photos capturing different types of images, should continue.
5. A plan to collect crack width data should be developed. It would be ambitious
to try to collect crack width information for the entire database, but as is
explained and proposed in Appendix C, at least some of the sections should be
considered to execute this plan. It is well understood that crack width data and
analysis are intrinsically complex, but the information provided may have
still-unknown links to other characteristics of concrete pavements.
6. One last activity that should be revisited is the collection of traffic data. This
is probably the task that has presented problems in the RPDB the most
because the only traffic information currently available is from 1985.
This report compiles all the activities that have been conducted for the update of the
RPDB and focuses on CRCP sections, in the same way Report 1778-1 focused on JCP
sections. Most of the recommendations given here should be accomplished or pursued
within the next few months, although some activities such as the continuous update of the
database, which should be an endless endeavor, will require much more time.


29
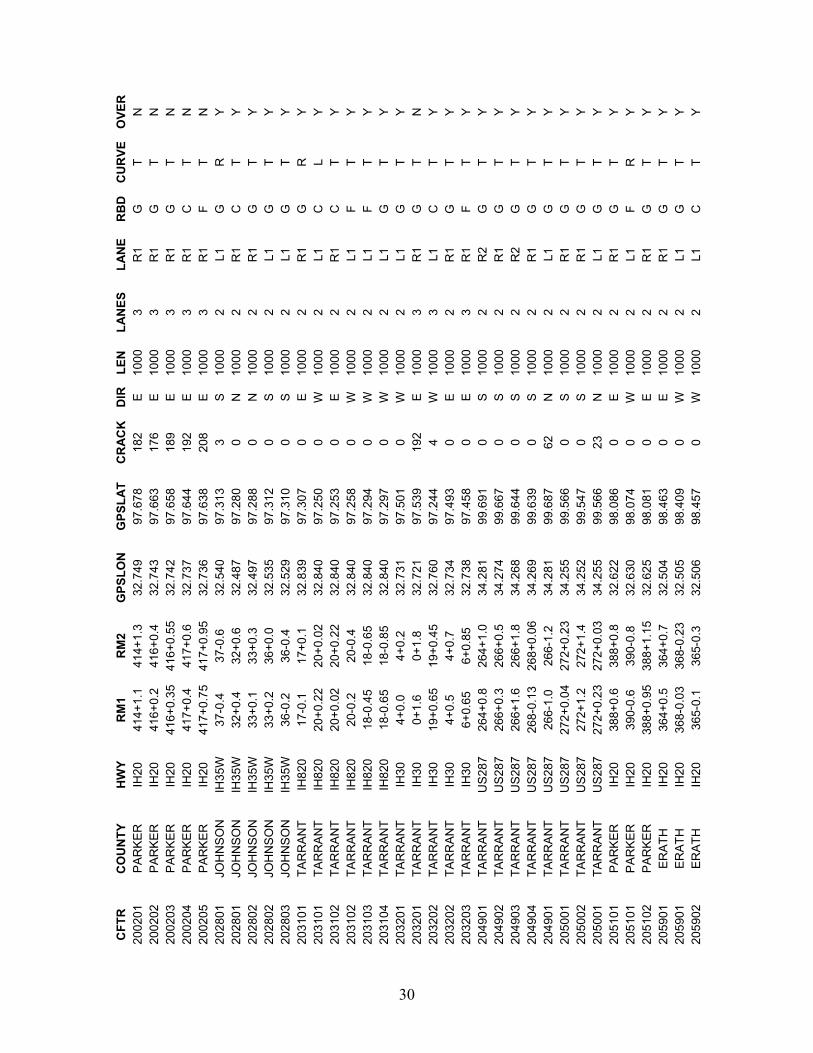
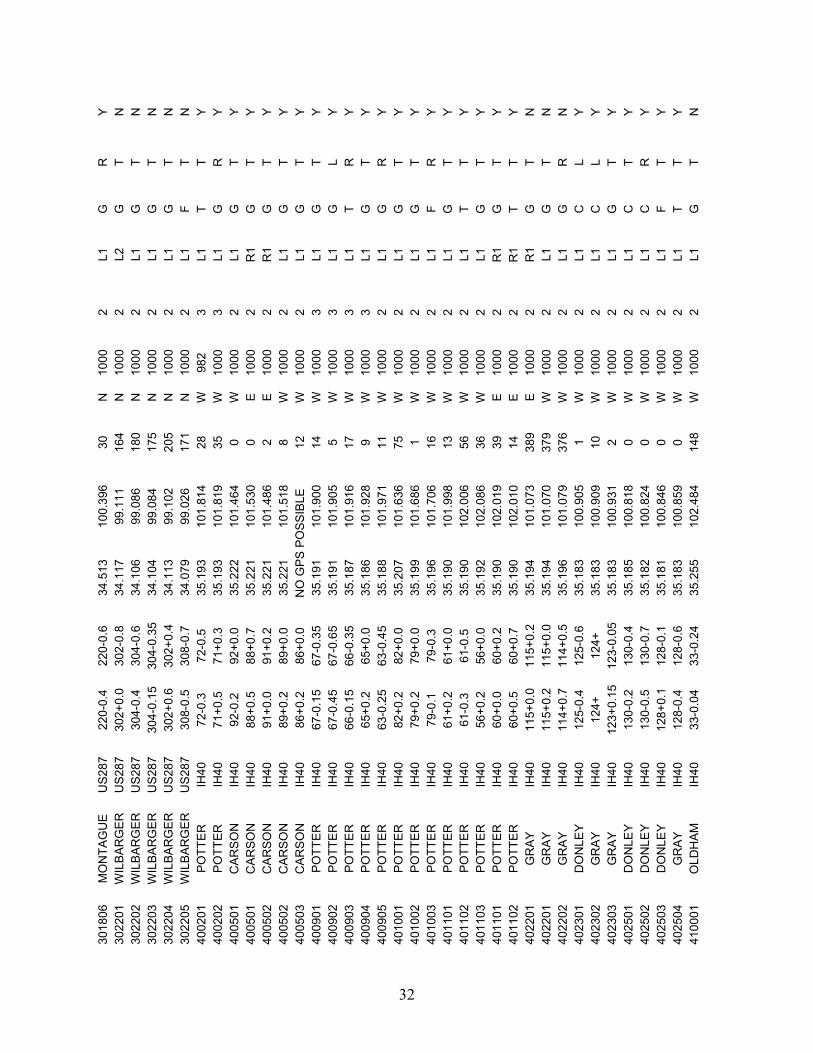
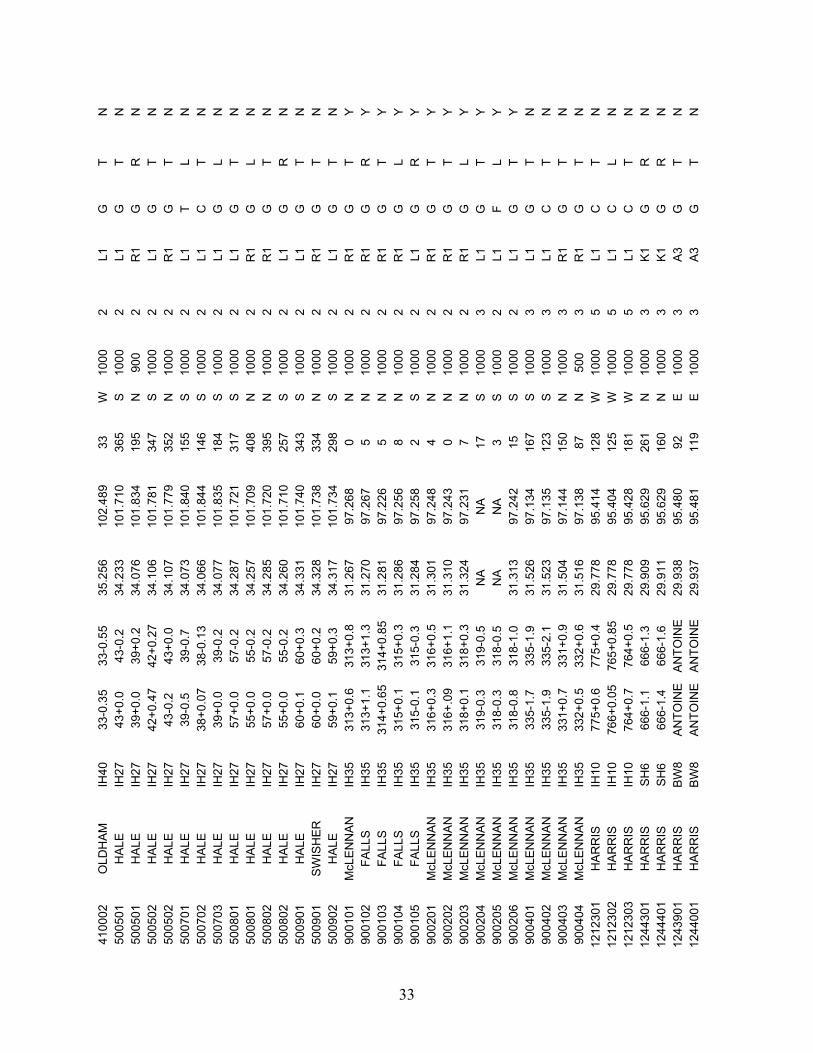
Appendix A
Continuously Reinforced Concrete Pavement (CRCP) Sections in the Rigid Pavement Database
30
C
FTR
C
OU
NTY
H
WY
RM
1 R
M2
GPS
LON
G
PSLA
T C
RAC
K
DIR
LE
N
LAN
ES
LAN
E R
BD
C
UR
VE
OVE
R
2002
01
PAR
KER
IH
20
414+
1.1
414+
1.3
32.7
49
97.6
78
182
E 10
00
3 R
1 G
T
N
2002
02
PAR
KER
IH
20
416+
0.2
416+
0.4
32.7
43
97.6
63
176
E 10
00
3 R
1 G
T
N
2002
03
PAR
KER
IH
20
416+
0.35
41
6+0.
55
32.7
42
97.6
58
189
E 10
00
3 R
1 G
T
N
2002
04
PAR
KER
IH
20
417+
0.4
417+
0.6
32.7
37
97.6
44
192
E 10
00
3 R
1 C
T
N
2002
05
PAR
KER
IH
20
417+
0.75
41
7+0.
95
32.7
36
97.6
38
208
E 10
00
3 R
1 F
T N
20
2801
JO
HN
SON
IH
35W
37
-0.4
37
-0.6
32
.540
97
.313
3
S 10
00
2 L1
G
R
Y
2028
01
JOH
NSO
N
IH35
W
32+0
.4
32+0
.6
32.4
87
97.2
80
0 N
10
00
2 R
1 C
T
Y 20
2802
JO
HN
SON
IH
35W
33
+0.1
33
+0.3
32
.497
97
.288
0
N
1000
2
R1
G
T Y
2028
02
JOH
NSO
N
IH35
W
33+0
.2
36+0
.0
32.5
35
97.3
12
0 S
1000
2
L1
G
T Y
2028
03
JOH
NSO
N
IH35
W
36-0
.2
36-0
.4
32.5
29
97.3
10
0 S
1000
2
L1
G
T Y
2031
01
TAR
RAN
T IH
820
17-0
.1
17+0
.1
32.8
39
97.3
07
0 E
1000
2
R1
G
R
Y 20
3101
TA
RR
ANT
IH82
0 20
+0.2
2 20
+0.0
2 32
.840
97
.250
0
W
1000
2
L1
C
L Y
2031
02
TAR
RAN
T IH
820
20+0
.02
20+0
.22
32.8
40
97.2
53
0 E
1000
2
R1
C
T Y
2031
02
TAR
RAN
T IH
820
20-0
.2
20-0
.4
32.8
40
97.2
58
0 W
10
00
2 L1
F
T Y
2031
03
TAR
RAN
T IH
820
18-0
.45
18-0
.65
32.8
40
97.2
94
0 W
10
00
2 L1
F
T Y
2031
04
TAR
RAN
T IH
820
18-0
.65
18-0
.85
32.8
40
97.2
97
0 W
10
00
2 L1
G
T
Y 20
3201
TA
RR
ANT
IH30
4+
0.0
4+0.
2 32
.731
97
.501
0
W
1000
2
L1
G
T Y
2032
01
TAR
RAN
T IH
30
0+1.
6 0+
1.8
32.7
21
97.5
39
192
E 10
00
3 R
1 G
T
N
2032
02
TAR
RAN
T IH
30
19+0
.65
19+0
.45
32.7
60
97.2
44
4 W
10
00
3 L1
C
T
Y 20
3202
TA
RR
ANT
IH30
4+
0.5
4+0.
7 32
.734
97
.493
0
E 10
00
2 R
1 G
T
Y 20
3203
TA
RR
ANT
IH30
6+
0.65
6+
0.85
32
.738
97
.458
0
E 10
00
3 R
1 F
T Y
2049
01
TAR
RAN
T U
S287
26
4+0.
8 26
4+1.
0 34
.281
99
.691
0
S 10
00
2 R
2 G
T
Y 20
4902
TA
RR
ANT
US2
87
266+
0.3
266+
0.5
34.2
74
99.6
67
0 S
1000
2
R1
G
T Y
2049
03
TAR
RAN
T U
S287
26
6+1.
6 26
6+1.
8 34
.268
99
.644
0
S 10
00
2 R
2 G
T
Y 20
4904
TA
RR
ANT
US2
87
268-
0.13
26
8+0.
06
34.2
69
99.6
39
0 S
1000
2
R1
G
T Y
2049
01
TAR
RAN
T U
S287
26
6-1.
0 26
6-1.
2 34
.281
99
.687
62
N
10
00
2 L1
G
T
Y 20
5001
TA
RR
ANT
US2
87
272+
0.04
27
2+0.
23
34.2
55
99.5
66
0 S
1000
2
R1
G
T Y
2050
02
TAR
RAN
T U
S287
27
2+1.
2 27
2+1.
4 34
.252
99
.547
0
S 10
00
2 R
1 G
T
Y 20
5001
TA
RR
ANT
US2
87
272+
0.23
27
2+0.
03
34.2
55
99.5
66
23
N
1000
2
L1
G
T Y
2051
01
PAR
KER
IH
20
388+
0.6
388+
0.8
32.6
22
98.0
86
0 E
1000
2
R1
G
T Y
2051
01
PAR
KER
IH
20
390-
0.6
390-
0.8
32.6
30
98.0
74
0 W
10
00
2 L1
F
R
Y 20
5102
PA
RKE
R
IH20
38
8+0.
95
388+
1.15
32
.625
98
.081
0
E 10
00
2 R
1 G
T
Y 20
5901
ER
ATH
IH
20
364+
0.5
364+
0.7
32.5
04
98.4
63
0 E
1000
2
R1
G
T Y
2059
01
ERAT
H
IH20
36
8-0.
03
368-
0.23
32
.505
98
.409
0
W
1000
2
L1
G
T Y
2059
02
ERAT
H
IH20
36
5-0.
1 36
5-0.
3 32
.506
98
.457
0
W
1000
2
L1
C
T Y

31
2059
02
ERAT
H
IH20
36
6+0.
85
367+
0.05
32
.507
98
.424
0
E 10
00
2 R
1 C
T
Y 20
6001
TA
RR
ANT
IH20
44
5+0.
7 44
5+0.
9 32
.675
97
.193
26
2 E
1000
4
R1
F R
N
20
6001
TA
RR
ANT
IH20
44
5-0.
04
445+
0.0
32.6
72
97.2
05
139
W
1000
4
L1
F T
N
2060
02
TAR
RAN
T IH
20
445-
0.4
445-
0.6
32.6
71
97.2
10
148
W
1000
4
L1
G
T N
20
7501
TA
RR
ANT
IH35
W
42+0
.4
42+0
.6
32.6
23
97.3
21
136
N
1000
3
R1
F T
Y 20
7501
TA
RR
ANT
IH35
W
45+0
.02
45-0
.22
32.6
48
97.3
22
148
S 10
00
3 L1
G
T
N
2075
02
TAR
RAN
T IH
35W
43
-0.1
43
-0.3
32
.631
97
.322
14
1 S
1000
3
L1
G
T N
20
7503
TA
RR
ANT
IH35
W
41-0
.13
41-0
.33
32.6
02
97.3
20
142
S 10
00
3 L1
C
R
N
20
7504
TA
RR
ANT
IH35
W
41-0
.45
41-0
.65
32.5
97
97.3
20
132
S 10
00
3 L1
C
T
N
2098
01
TAR
RAN
T IH
820
11+0
.15
11+0
.35
32.8
21
97.3
97
178
N
1000
3
R1
G
T N
20
9801
TA
RR
ANT
IH82
0 13
-0.5
13
-0.7
32
.829
97
.381
21
6 S
1000
3
L1
G
L
N
2098
02
TAR
RAN
T IH
820
12+0
.1
12+0
.3
32.8
27
97.3
85
175
E 10
00
3 R
1 G
T
N
2098
02
TAR
RAN
T IH
820
11+0
.0
11-0
.2
32.8
19
97.4
02
156
S 10
00
3 L1
F
T N
30
0101
W
ICH
ITA
IH44
4+
0.45
4+
0.25
33
.964
98
.531
0
W
1000
2
L1
G
L
Y 30
0101
W
ICH
ITA
IH44
4+
0.2
4+0.
4 33
.960
98
.530
21
5 E
1000
2
R1
G
R
N
3001
03
WIC
HIT
A IH
44
14-0
.25
14-0
.45
34.0
95
98.5
55
211
W
1000
2
L1
F L
N
30
0102
W
ICH
ITA
IH44
5+
0.0
5+0.
2 33
.975
98
.534
0
W
600
2 L1
G
R
Y
3001
02
WIC
HIT
A IH
44
5+0.
0 5+
0.2
33.9
73
98.5
33
195
E 10
00
2 R
1 G
L
N
30
0401
W
ICH
ITA
IH44
12
-0.3
5 12
-0.1
5 34
.066
98
.557
22
0 E
1000
2
R1
G
T Y
3004
03
WIC
HIT
A IH
44
12+0
.15
12-0
.05
34.0
72
98.5
58
220
W
1000
2
L1
G
T N
30
0404
W
ICH
ITA
IH44
11
+0.5
11
+0.3
5 34
.063
98
.558
8
W
800
2 L1
G
T
Y 30
0405
W
ICH
ITA
IH44
11
+0.2
5 11
+0.4
5 34
.060
98
.557
0
E 10
00
2 R
1 G
T
Y 30
1001
W
ICH
ITA
US2
87
314+
1.0
314+
1.2
34.0
44
98.9
36
180
S 10
00
2 R
1 G
T
N
3010
02
WIC
HIT
A U
S287
31
6-0.
2 31
6+0.
0 34
.044
98
.917
18
2 S
1000
2
R1
F T
N
3010
03
WIC
HIT
A U
S287
31
6+0.
9 31
6+1.
1 34
.041
98
.902
16
0 S
1000
2
R1
G
T N
30
1004
W
ICH
ITA
US2
87
322+
0.3
322+
0.5
33.9
93
98.8
30
187
S 10
00
2 R
1 G
L
N
3010
05
WIC
HIT
A U
S287
31
6+0.
2 31
6+0.
05
34.0
45
98.9
18
150
N
760
2 L1
F
T N
30
1006
W
ICH
ITA
US2
87
317+
0.2
317+
0.0
34.0
39
98.8
83
169
N
1000
2
L1
C
T N
30
1101
W
ILBA
RG
ER
US2
87
312-
0.1
312-
0.3
34.0
49
98.9
59
160
N
1000
2
L1
G
T N
30
1102
W
ILBA
RG
ER
US2
87
312-
0.5
312-
0.7
34.0
51
98.9
65
120
N
1000
2
L1
T R
N
30
1103
W
ILBA
RG
ER
US2
87
312-
0.7
312-
0.9
34.0
56
98.9
69
9 N
10
00
2 L1
T
T Y
3011
04
WIL
BAR
GER
U
S287
31
2-0.
1 31
2+0.
1 34
.048
98
.958
73
S
1000
2
R1
G
T Y
3018
01
MO
NTA
GU
E U
S287
39
0+0.
4 39
0+0.
6 33
.568
97
.887
0
S 10
00
2 R
1 F
T Y
3018
02
MO
NTA
GU
E U
S287
39
2+0.
1 39
2+0.
3 33
.554
97
.865
0
S 10
00
2 R
1 C
T
Y 30
1803
M
ON
TAG
UE
US2
87
394+
1.4
394+
1.6
33.5
23
97.8
23
165
S 10
00
2 R
1 T
T N
30
1804
M
ON
TAG
UE
US2
87
394+
1.6
394+
1.8
33.5
20
97.8
21
177
S 10
00
2 R
1 G
T
N
3018
05
MO
NTA
GU
E U
S287
22
2+0.
4 22
2+0.
2 34
.496
10
0.35
6 12
7 N
10
00
2 L1
G
T
Y
32
3018
06
MO
NTA
GU
E U
S287
22
0-0.
4 22
0-0.
6 34
.513
10
0.39
6 30
N
10
00
2 L1
G
R
Y
3022
01
WIL
BAR
GER
U
S287
30
2+0.
0 30
2-0.
8 34
.117
99
.111
16
4 N
10
00
2 L2
G
T
N
3022
02
WIL
BAR
GER
U
S287
30
4-0.
4 30
4-0.
6 34
.106
99
.086
18
0 N
10
00
2 L1
G
T
N
3022
03
WIL
BAR
GER
U
S287
30
4-0.
15
304-
0.35
34
.104
99
.084
17
5 N
10
00
2 L1
G
T
N
3022
04
WIL
BAR
GER
U
S287
30
2+0.
6 30
2+0.
4 34
.113
99
.102
20
5 N
10
00
2 L1
G
T
N
3022
05
WIL
BAR
GER
U
S287
30
8-0.
5 30
8-0.
7 34
.079
99
.026
17
1 N
10
00
2 L1
F
T N
40
0201
PO
TTER
IH
40
72-0
.3
72-0
.5
35.1
93
101.
814
28
W
982
3 L1
T
T Y
4002
02
POTT
ER
IH40
71
+0.5
71
+0.3
35
.193
10
1.81
9 35
W
10
00
3 L1
G
R
Y
4005
01
CAR
SON
IH
40
92-0
.2
92+0
.0
35.2
22
101.
464
0 W
10
00
2 L1
G
T
Y 40
0501
C
ARSO
N
IH40
88
+0.5
88
+0.7
35
.221
10
1.53
0 0
E 10
00
2 R
1 G
T
Y 40
0502
C
ARSO
N
IH40
91
+0.0
91
+0.2
35
.221
10
1.48
6 2
E 10
00
2 R
1 G
T
Y 40
0502
C
ARSO
N
IH40
89
+0.2
89
+0.0
35
.221
10
1.51
8 8
W
1000
2
L1
G
T Y
4005
03
CAR
SON
IH
40
86+0
.2
86+0
.0
NO
GPS
PO
SSIB
LE
12
W
1000
2
L1
G
T Y
4009
01
POTT
ER
IH40
67
-0.1
5 67
-0.3
5 35
.191
10
1.90
0 14
W
10
00
3 L1
G
T
Y 40
0902
PO
TTER
IH
40
67-0
.45
67-0
.65
35.1
91
101.
905
5 W
10
00
3 L1
G
L
Y
4009
03
POTT
ER
IH40
66
-0.1
5 66
-0.3
5 35
.187
10
1.91
6 17
W
10
00
3 L1
T
R
Y 40
0904
PO
TTER
IH
40
65+0
.2
65+0
.0
35.1
86
101.
928
9 W
10
00
3 L1
G
T
Y 40
0905
PO
TTER
IH
40
63-0
.25
63-0
.45
35.1
88
101.
971
11
W
1000
2
L1
G
R
Y 40
1001
PO
TTER
IH
40
82+0
.2
82+0
.0
35.2
07
101.
636
75
W
1000
2
L1
G
T Y
4010
02
POTT
ER
IH40
79
+0.2
79
+0.0
35
.199
10
1.68
6 1
W
1000
2
L1
G
T Y
4010
03
POTT
ER
IH40
79
-0.1
79
-0.3
35
.196
10
1.70
6 16
W
10
00
2 L1
F
R
Y 40
1101
PO
TTER
IH
40
61+0
.2
61+0
.0
35.1
90
101.
998
13
W
1000
2
L1
G
T Y
4011
02
POTT
ER
IH40
61
-0.3
61
-0.5
35
.190
10
2.00
6 56
W
10
00
2 L1
T
T Y
4011
03
POTT
ER
IH40
56
+0.2
56
+0.0
35
.192
10
2.08
6 36
W
10
00
2 L1
G
T
Y 40
1101
PO
TTER
IH
40
60+0
.0
60+0
.2
35.1
90
102.
019
39
E 10
00
2 R
1 G
T
Y 40
1102
PO
TTER
IH
40
60+0
.5
60+0
.7
35.1
90
102.
010
14
E 10
00
2 R
1 T
T Y
4022
01
GR
AY
IH40
11
5+0.
0 11
5+0.
2 35
.194
10
1.07
3 38
9 E
1000
2
R1
G
T N
40
2201
G
RAY
IH
40
115+
0.2
115+
0.0
35.1
94
101.
070
379
W
1000
2
L1
G
T N
40
2202
G
RAY
IH
40
114+
0.7
114+
0.5
35.1
96
101.
079
376
W
1000
2
L1
G
R
N
4023
01
DO
NLE
Y IH
40
125-
0.4
125-
0.6
35.1
83
100.
905
1 W
10
00
2 L1
C
L
Y
4023
02
GR
AY
IH40
12
4+
124+
35
.183
10
0.90
9 10
W
10
00
2 L1
C
L
Y
4023
03
GR
AY
IH40
12
3+0.
15
123-
0.05
35
.183
10
0.93
1 2
W
1000
2
L1
G
T Y
4025
01
DO
NLE
Y IH
40
130-
0.2
130-
0.4
35.1
85
100.
818
0 W
10
00
2 L1
C
T
Y 40
2502
D
ON
LEY
IH40
13
0-0.
5 13
0-0.
7 35
.182
10
0.82
4 0
W
1000
2
L1
C
R
Y 40
2503
D
ON
LEY
IH40
12
8+0.
1 12
8-0.
1 35
.181
10
0.84
6 0
W
1000
2
L1
F T
Y 40
2504
G
RAY
IH
40
128-
0.4
128-
0.6
35.1
83
100.
859
0 W
10
00
2 L1
T
T Y
4100
01
OLD
HAM
IH
40
33-0
.04
33-0
.24
35.2
55
102.
484
148
W
1000
2
L1
G
T N
33
4100
02
OLD
HAM
IH
40
33-0
.35
33-0
.55
35.2
56
102.
489
33
W
1000
2
L1
G
T N
50
0501
H
ALE
IH27
43
+0.0
43
-0.2
34
.233
10
1.71
0 36
5 S
1000
2
L1
G
T N
50
0501
H
ALE
IH27
39
+0.0
39
+0.2
34
.076
10
1.83
4 19
5 N
90
0 2
R1
G
R
N
5005
02
HAL
E IH
27
42+0
.47
42+0
.27
34.1
06
101.
781
347
S 10
00
2 L1
G
T
N
5005
02
HAL
E IH
27
43-0
.2
43+0
.0
34.1
07
101.
779
352
N
1000
2
R1
G
T N
50
0701
H
ALE
IH27
39
-0.5
39
-0.7
34
.073
10
1.84
0 15
5 S
1000
2
L1
T L
N
50
0702
H
ALE
IH27
38
+0.0
7 38
-0.1
3 34
.066
10
1.84
4 14
6 S
1000
2
L1
C
T N
50
0703
H
ALE
IH27
39
+0.0
39
-0.2
34
.077
10
1.83
5 18
4 S
1000
2
L1
G
L
N
5008
01
HAL
E IH
27
57+0
.0
57-0
.2
34.2
87
101.
721
317
S 10
00
2 L1
G
T
N
5008
01
HAL
E IH
27
55+0
.0
55-0
.2
34.2
57
101.
709
408
N
1000
2
R1
G
L
N
5008
02
HAL
E IH
27
57+0
.0
57-0
.2
34.2
85
101.
720
395
N
1000
2
R1
G
T N
50
0802
H
ALE
IH27
55
+0.0
55
-0.2
34
.260
10
1.71
0 25
7 S
1000
2
L1
G
R
N
5009
01
HAL
E IH
27
60+0
.1
60+0
.3
34.3
31
101.
740
343
S 10
00
2 L1
G
T
N
5009
01
SWIS
HER
IH
27
60+0
.0
60+0
.2
34.3
28
101.
738
334
N
1000
2
R1
G
T N
50
0902
H
ALE
IH27
59
+0.1
59
+0.3
34
.317
10
1.73
4 29
8 S
1000
2
L1
G
T N
90
0101
M
cLEN
NAN
IH
35
313+
0.6
313+
0.8
31.2
67
97.2
68
0 N
10
00
2 R
1 G
T
Y 90
0102
FA
LLS
IH35
31
3+1.
1 31
3+1.
3 31
.270
97
.267
5
N
1000
2
R1
G
R
Y 90
0103
FA
LLS
IH35
31
4+0.
65
314+
0.85
31
.281
97
.226
5
N
1000
2
R1
G
T Y
9001
04
FALL
S IH
35
315+
0.1
315+
0.3
31.2
86
97.2
56
8 N
10
00
2 R
1 G
L
Y 90
0105
FA
LLS
IH35
31
5-0.
1 31
5-0.
3 31
.284
97
.258
2
S 10
00
2 L1
G
R
Y
9002
01
McL
ENN
AN
IH35
31
6+0.
3 31
6+0.
5 31
.301
97
.248
4
N
1000
2
R1
G
T Y
9002
02
McL
ENN
AN
IH35
31
6+.0
9 31
6+1.
1 31
.310
97
.243
0
N
1000
2
R1
G
T Y
9002
03
McL
ENN
AN
IH35
31
8+0.
1 31
8+0.
3 31
.324
97
.231
7
N
1000
2
R1
G
L Y
9002
04
McL
ENN
AN
IH35
31
9-0.
3 31
9-0.
5 N
A N
A 17
S
1000
3
L1
G
T Y
9002
05
McL
ENN
AN
IH35
31
8-0.
3 31
8-0.
5 N
A N
A 3
S 10
00
2 L1
F
L Y
9002
06
McL
ENN
AN
IH35
31
8-0.
8 31
8-1.
0 31
.313
97
.242
15
S
1000
2
L1
G
T Y
9004
01
McL
ENN
AN
IH35
33
5-1.
7 33
5-1.
9 31
.526
97
.134
16
7 S
1000
3
L1
G
T N
90
0402
M
cLEN
NAN
IH
35
335-
1.9
335-
2.1
31.5
23
97.1
35
123
S 10
00
3 L1
C
T
N
9004
03
McL
ENN
AN
IH35
33
1+0.
7 33
1+0.
9 31
.504
97
.144
15
0 N
10
00
3 R
1 G
T
N
9004
04
McL
ENN
AN
IH35
33
2+0.
5 33
2+0.
6 31
.516
97
.138
87
N
50
0 3
R1
G
T N
12
1230
1 H
ARR
IS
IH10
77
5+0.
6 77
5+0.
4 29
.778
95
.414
12
8 W
10
00
5 L1
C
T
N
1212
302
HAR
RIS
IH
10
766+
0.05
76
5+0.
85
29.7
78
95.4
04
125
W
1000
5
L1
C
L
N
1212
303
HAR
RIS
IH
10
764+
0.7
764+
0.5
29.7
78
95.4
28
181
W
1000
5
L1
C
T N
12
4430
1 H
ARR
IS
SH6
666-
1.1
666-
1.3
29.9
09
95.6
29
261
N
1000
3
K1
G
R
N
1244
401
HAR
RIS
SH
6 66
6-1.
4 66
6-1.
6 29
.911
95
.629
16
0 N
10
00
3 K1
G
R
N
12
4390
1 H
ARR
IS
BW8
ANTO
INE
ANTO
INE
29.9
38
95.4
80
92
E 10
00
3 A3
G
T
N
1244
001
HAR
RIS
BW
8 AN
TOIN
E AN
TOIN
E 29
.937
95
.481
11
9 E
1000
3
A3
G
T N
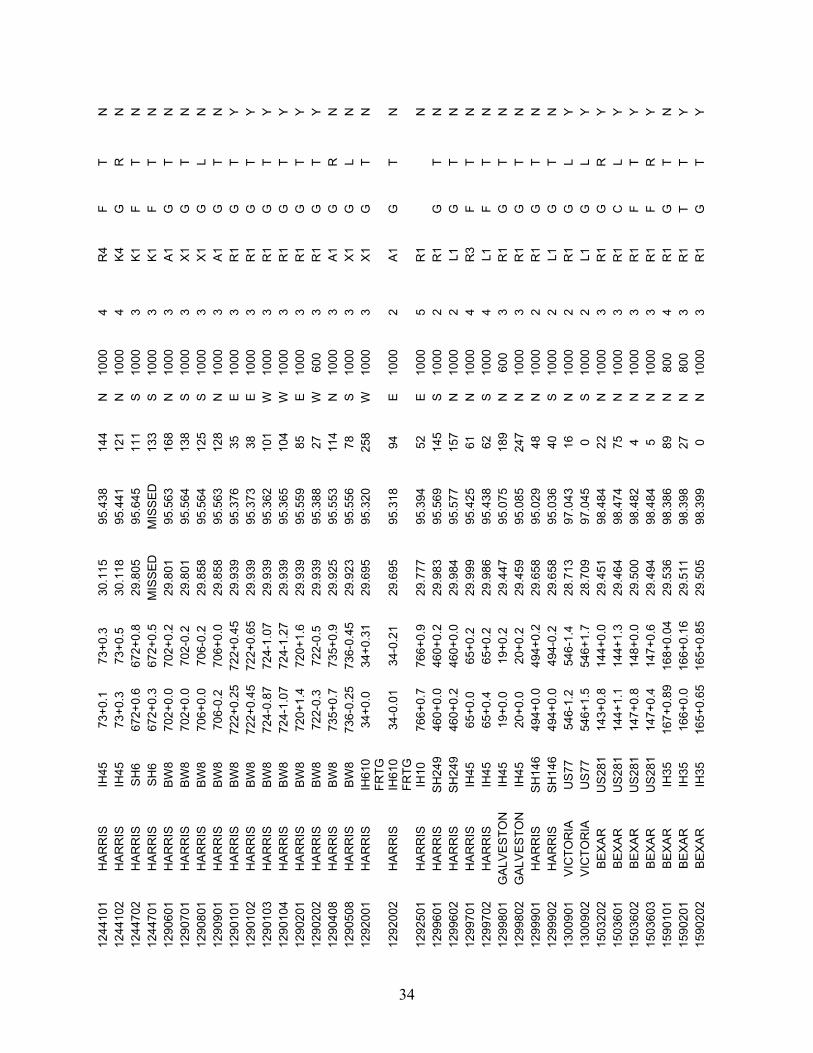
34
1244
101
HAR
RIS
IH
45
73+0
.1
73+0
.3
30.1
15
95.4
38
144
N
1000
4
R4
F T
N
1244
102
HAR
RIS
IH
45
73+0
.3
73+0
.5
30.1
18
95.4
41
121
N
1000
4
K4
G
R
N
1244
702
HAR
RIS
SH
6 67
2+0.
6 67
2+0.
8 29
.805
95
.645
11
1 S
1000
3
K1
F T
N
1244
701
HAR
RIS
SH
6 67
2+0.
3 67
2+0.
5 M
ISSE
D
MIS
SED
13
3 S
1000
3
K1
F T
N
1290
601
HAR
RIS
BW
8 70
2+0.
0 70
2+0.
2 29
.801
95
.563
16
8 N
10
00
3 A1
G
T
N
1290
701
HAR
RIS
BW
8 70
2+0.
0 70
2-0.
2 29
.801
95
.564
13
8 S
1000
3
X1
G
T N
12
9080
1 H
ARR
IS
BW8
706+
0.0
706-
0.2
29.8
58
95.5
64
125
S 10
00
3 X1
G
L
N
12
9090
1 H
ARR
IS
BW8
706-
0.2
706+
0.0
29.8
58
95.5
63
128
N
1000
3
A1
G
T N
12
9010
1 H
ARR
IS
BW8
722+
0.25
72
2+0.
45
29.9
39
95.3
76
35
E 10
00
3 R
1 G
T
Y 12
9010
2 H
ARR
IS
BW8
722+
0.45
72
2+0.
65
29.9
39
95.3
73
38
E 10
00
3 R
1 G
T
Y 12
9010
3 H
ARR
IS
BW8
724-
0.87
72
4-1.
07
29.9
39
95.3
62
101
W
1000
3
R1
G
T Y
1290
104
HAR
RIS
BW
8 72
4-1.
07
724-
1.27
29
.939
95
.365
10
4 W
10
00
3 R
1 G
T
Y 12
9020
1 H
ARR
IS
BW8
720+
1.4
720+
1.6
29.9
39
95.5
59
85
E 10
00
3 R
1 G
T
Y 12
9020
2 H
ARR
IS
BW8
722-
0.3
722-
0.5
29.9
39
95.3
88
27
W
600
3 R
1 G
T
Y 12
9040
8 H
ARR
IS
BW8
735+
0.7
735+
0.9
29.9
25
95.5
53
114
N
1000
3
A1
G
R
N
1290
508
HAR
RIS
BW
8 73
6-0.
25
736-
0.45
29
.923
95
.556
78
S
1000
3
X1
G
L
N
1292
001
HAR
RIS
IH
610
FRTG
34
+0.0
34
+0.3
1 29
.695
95
.320
25
8 W
10
00
3 X1
G
T
N
1292
002
HAR
RIS
IH
610
FRTG
34
-0.0
1 34
-0.2
1 29
.695
95
.318
94
E
1000
2
A1
G
T N
1292
501
HAR
RIS
IH
10
766+
0.7
766+
0.9
29.7
77
95.3
94
52
E 10
00
5 R
1
N
12
9960
1 H
ARR
IS
SH24
9 46
0+0.
0 46
0+0.
2 29
.983
95
.569
14
5 S
1000
2
R1
G
T N
12
9960
2 H
ARR
IS
SH24
9 46
0+0.
2 46
0+0.
0 29
.984
95
.577
15
7 N
10
00
2 L1
G
T
N
1299
701
HAR
RIS
IH
45
65+0
.0
65+0
.2
29.9
99
95.4
25
61
N
1000
4
R3
F T
N
1299
702
HAR
RIS
IH
45
65+0
.4
65+0
.2
29.9
86
95.4
38
62
S 10
00
4 L1
F
T N
12
9980
1 G
ALVE
STO
N
IH45
19
+0.0
19
+0.2
29
.447
95
.075
18
9 N
60
0 3
R1
G
T N
12
9980
2 G
ALVE
STO
N
IH45
20
+0.0
20
+0.2
29
.459
95
.085
24
7 N
10
00
3 R
1 G
T
N
1299
901
HAR
RIS
SH
146
494+
0.0
494+
0.2
29.6
58
95.0
29
48
N
1000
2
R1
G
T N
12
9990
2 H
ARR
IS
SH14
6 49
4+0.
0 49
4-0.
2 29
.658
95
.036
40
S
1000
2
L1
G
T N
13
0090
1 VI
CTO
RIA
U
S77
546-
1.2
546-
1.4
28.7
13
97.0
43
16
N
1000
2
R1
G
L
Y 13
0090
2 VI
CTO
RIA
U
S77
546+
1.5
546+
1.7
28.7
09
97.0
45
0 S
1000
2
L1
G
L
Y 15
0320
2 BE
XAR
U
S281
14
3+0.
8 14
4+0.
0 29
.451
98
.484
22
N
10
00
3 R
1 G
R
Y
1503
601
BEXA
R
US2
81
144+
1.1
144+
1.3
29.4
64
98.4
74
75
N
1000
3
R1
C
L Y
1503
602
BEXA
R
US2
81
147+
0.8
148+
0.0
29.5
00
98.4
82
4 N
10
00
3 R
1 F
T Y
1503
603
BEXA
R
US2
81
147+
0.4
147+
0.6
29.4
94
98.4
84
5 N
10
00
3 R
1 F
R
Y 15
9010
1 BE
XAR
IH
35
167+
0.89
16
8+0.
04
29.5
36
98.3
86
89
N
800
4 R
1 G
T
N
1590
201
BEXA
R
IH35
16
6+0.
0 16
6+0.
16
29.5
11
98.3
98
27
N
800
3 R
1 T
T Y
1590
202
BEXA
R
IH35
16
5+0.
65
165+
0.85
29
.505
98
.399
0
N
1000
3
R1
G
T Y

35
1700
701
LEO
N
IH45
17
3+0.
0 17
3-0.
2 31
.367
96
.018
30
9 S
1000
2
L1
G
T N
17
0070
2 LE
ON
IH
45
172+
0.2
172+
0.0
31.3
67
96.0
18
307
S 10
00
2 L1
G
T
N
1700
703
LEO
N
IH45
17
1+0.
9 17
1+0.
7 31
.367
96
.018
32
8 S
1000
2
L1
G
T N
17
0070
4 LE
ON
IH
45
171+
0.6
171+
0.4
31.3
63
96.0
16
317
S 10
00
2 L1
G
T
N
1700
705
LEO
N
IH45
17
1-0.
2 17
1-0.
4 31
.351
96
.014
40
8 S
1000
2
L1
G
T N
17
0070
6 LE
ON
IH
45
170+
0.2
170+
0.0
31.3
43
96.0
12
396
S 10
00
2 L1
G
T
N
1700
201
WAL
KER
IH
45
124+
0.0
124+
0.2
31.0
37
95.9
39
0 N
10
00
2 R
1 G
T
Y 17
0020
2 W
ALKE
R
IH45
13
2-0.
1 13
2-0.
3 30
.866
95
.756
0
S 10
00
2 L1
G
T
Y 17
0020
3 W
ALKE
R
IH45
13
1-0.
6 13
1-0.
8 30
.849
95
.736
0
S 10
00
2 L1
G
T
Y 17
0020
4 W
ALKE
R
IH45
13
0+0.
0 13
0-0.
2 30
.847
95
.733
0
S 10
00
2 L1
G
T
Y 17
0020
5 W
ALKE
R
IH45
13
0-0.
5 13
0-0.
7 30
.841
95
.725
0
S 10
00
2 L1
G
T
Y 17
0020
6 W
ALKE
R
IH45
12
9-0.
5 12
9-0.
7 30
.832
95
.714
0
S 10
00
2 L1
G
T
Y 17
0020
7 W
ALKE
R
IH45
12
8-0.
7 12
8-0.
9 30
.832
95
.713
0
S 10
00
2 L1
G
T
Y 17
0030
1 LE
ON
IH
45
152+
0.8
153+
0.0
30.8
32
95.7
13
0 N
10
00
2 R
1 G
T
Y 17
0030
2 LE
ON
IH
45
153+
0.5
153+
0.7
31.0
99
95.9
63
4 N
10
00
2 R
1 G
T
Y 17
0030
3 LE
ON
IH
45
153+
0.9
154+
0.1
31.0
99
95.9
63
0 N
10
00
2 R
1 G
T
Y 17
0030
4 LE
ON
IH
45
157+
0.2
157+
0.4
31.1
60
95.9
85
0 N
10
00
2 R
1 G
T
Y 17
0030
5 LE
ON
IH
45
157+
0.5
157+
0.7
31.1
66
95.9
86
0 N
10
00
2 R
1 G
T
Y 17
0030
6 LE
ON
IH
45
158+
0.0
158+
0.2
31.1
71
95.9
89
0 N
10
00
2 R
1 G
T
Y 17
0040
1 M
ADIS
ON
IH
45
152-
0.2
152-
0.4
31.2
84
96.2
32
2 S
1000
2
L1
G
T Y
1700
402
MAD
ISO
N
IH45
15
0+0.
0 15
0-0.
2 31
.060
95
.950
0
S 10
00
2 L1
G
T
Y 17
0040
3 M
ADIS
ON
IH
45
150-
0.3
150-
0.5
31.0
56
95.9
49
0 S
1000
2
L1
G
T Y
1700
404
MAD
ISO
N
IH45
14
9+0.
2 14
9+0.
0 31
.048
95
.947
0
S 10
00
2 L1
G
T
Y 17
0040
5 M
ADIS
ON
IH
45
149-
0.1
149-
0.3
31.0
45
95.9
45
1 S
1000
2
L1
G
T Y
1700
406
MAD
ISO
N
IH45
14
8-0.
5 14
8-0.
7 31
.028
95
.933
0
S 10
00
2 L1
G
T
Y 18
0540
1 D
ALLA
S IH
30
50-0
.1
50+0
.1
32.7
91
96.7
39
0 E
1000
4
R1
C
T Y
1805
401
DAL
LAS
IH30
50
+0.1
50
-0.1
32
.792
96
.735
0
W
1000
4
R1
C
T Y
1805
402
DAL
LAS
IH30
49
+0.2
49
+0.0
32
.791
96
.752
0
W
1000
3
R1
T T
Y 18
0620
1 D
ALLA
S IH
30
46-0
.15
46+0
.05
32.7
72
96.8
00
149
E 10
00
3 R
1 C
R
N
18
0660
1 D
ALLA
S IH
35E
422+
0.2
422+
0.4
32.6
93
96.8
23
183
N
1000
3
R1
F T
N
1806
602
DAL
LAS
IH35
E 42
3+0.
3 42
3+0.
5 32
.701
96
.880
17
5 S
1000
3
L1
C
R
N
1807
203
DAL
LAS
IH63
5 25
+0.4
25
+0.2
32
.915
96
.864
22
8 E
1000
5
L1
G
T N
18
0720
3 D
ALLA
S IH
635
25-0
.06
25-0
.26
32.9
17
96.8
57
193
W
1000
5
L1
C
T N
18
0720
4 D
ALLA
S IH
635
24+0
.4
24+0
.2
32.9
22
96.8
47
170
E 10
00
5 L1
T
T N
18
0730
1 D
ALLA
S IH
635
23+0
.7
23+0
.5
32.9
26
96.8
38
152
E 10
00
5 L1
F
R
N
1807
901
DAL
LAS
IH63
5 19
-0.7
6 19
-0.9
6 32
.918
96
.746
22
1 E
1000
5
L1
C
R
N
1807
903
DAL
LAS
IH63
5 31
+0.7
31
+0.9
32
.918
96
.970
92
W
10
00
3 R
1 G
T
N
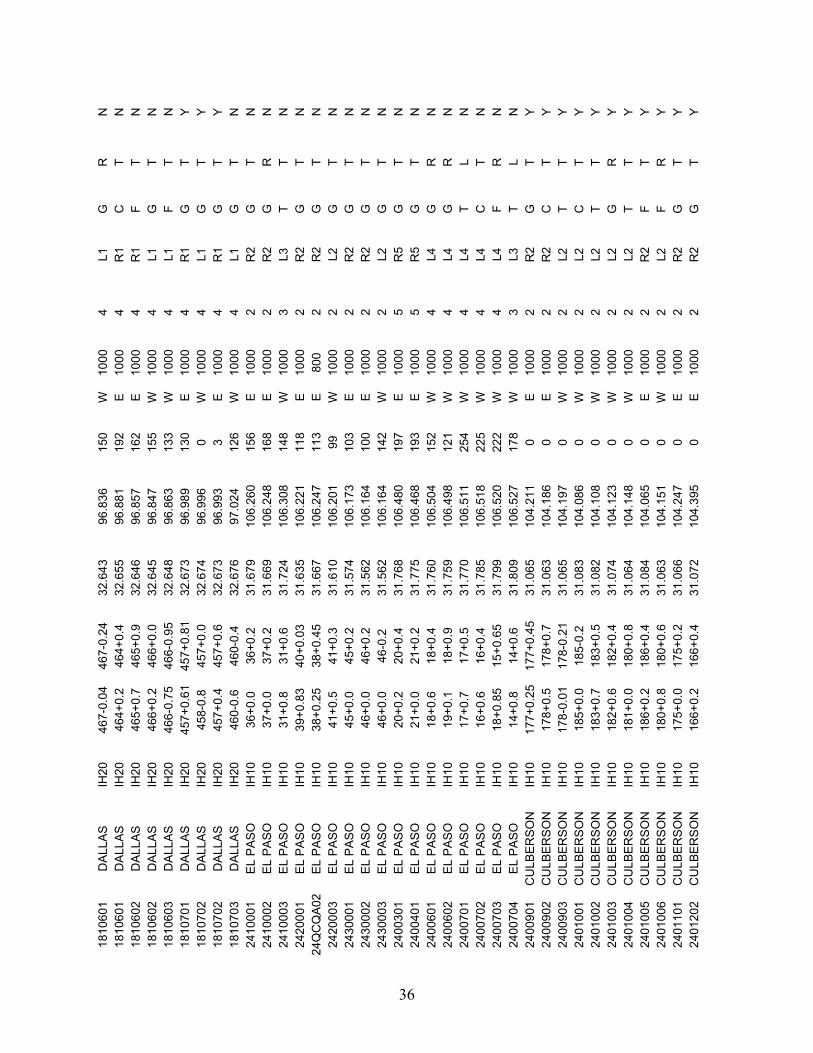
36
1810
601
DAL
LAS
IH20
46
7-0.
04
467-
0.24
32
.643
96
.836
15
0 W
10
00
4 L1
G
R
N
18
1060
1 D
ALLA
S IH
20
464+
0.2
464+
0.4
32.6
55
96.8
81
192
E 10
00
4 R
1 C
T
N
1810
602
DAL
LAS
IH20
46
5+0.
7 46
5+0.
9 32
.646
96
.857
16
2 E
1000
4
R1
F T
N
1810
602
DAL
LAS
IH20
46
6+0.
2 46
6+0.
0 32
.645
96
.847
15
5 W
10
00
4 L1
G
T
N
1810
603
DAL
LAS
IH20
46
6-0.
75
466-
0.95
32
.648
96
.863
13
3 W
10
00
4 L1
F
T N
18
1070
1 D
ALLA
S IH
20
457+
0.61
45
7+0.
81
32.6
73
96.9
89
130
E 10
00
4 R
1 G
T
Y 18
1070
2 D
ALLA
S IH
20
458-
0.8
457+
0.0
32.6
74
96.9
96
0 W
10
00
4 L1
G
T
Y 18
1070
2 D
ALLA
S IH
20
457+
0.4
457+
0.6
32.6
73
96.9
93
3 E
1000
4
R1
G
T Y
1810
703
DAL
LAS
IH20
46
0-0.
6 46
0-0.
4 32
.676
97
.024
12
6 W
10
00
4 L1
G
T
N
2410
001
EL P
ASO
IH
10
36+0
.0
36+0
.2
31.6
79
106.
260
156
E 10
00
2 R
2 G
T
N
2410
002
EL P
ASO
IH
10
37+0
.0
37+0
.2
31.6
69
106.
248
168
E 10
00
2 R
2 G
R
N
24
1000
3 EL
PAS
O
IH10
31
+0.8
31
+0.6
31
.724
10
6.30
8 14
8 W
10
00
3 L3
T
T N
24
2000
1 EL
PAS
O
IH10
39
+0.8
3 40
+0.0
3 31
.635
10
6.22
1 11
8 E
1000
2
R2
G
T N
24
QC
QA0
2 EL
PAS
O
IH10
38
+0.2
5 38
+0.4
5 31
.667
10
6.24
7 11
3 E
800
2 R
2 G
T
N
2420
003
EL P
ASO
IH
10
41+0
.5
41+0
.3
31.6
10
106.
201
99
W
1000
2
L2
G
T N
24
3000
1 EL
PAS
O
IH10
45
+0.0
45
+0.2
31
.574
10
6.17
3 10
3 E
1000
2
R2
G
T N
24
3000
2 EL
PAS
O
IH10
46
+0.0
46
+0.2
31
.562
10
6.16
4 10
0 E
1000
2
R2
G
T N
24
3000
3 EL
PAS
O
IH10
46
+0.0
46
-0.2
31
.562
10
6.16
4 14
2 W
10
00
2 L2
G
T
N
2400
301
EL P
ASO
IH
10
20+0
.2
20+0
.4
31.7
68
106.
480
197
E 10
00
5 R
5 G
T
N
2400
401
EL P
ASO
IH
10
21+0
.0
21+0
.2
31.7
75
106.
468
193
E 10
00
5 R
5 G
T
N
2400
601
EL P
ASO
IH
10
18+0
.6
18+0
.4
31.7
60
106.
504
152
W
1000
4
L4
G
R
N
2400
602
EL P
ASO
IH
10
19+0
.1
18+0
.9
31.7
59
106.
498
121
W
1000
4
L4
G
R
N
2400
701
EL P
ASO
IH
10
17+0
.7
17+0
.5
31.7
70
106.
511
254
W
1000
4
L4
T L
N
24
0070
2 EL
PAS
O
IH10
16
+0.6
16
+0.4
31
.785
10
6.51
8 22
5 W
10
00
4 L4
C
T
N
2400
703
EL P
ASO
IH
10
18+0
.85
15+0
.65
31.7
99
106.
520
222
W
1000
4
L4
F R
N
24
0070
4 EL
PAS
O
IH10
14
+0.8
14
+0.6
31
.809
10
6.52
7 17
8 W
10
00
3 L3
T
L
N
2400
901
CU
LBER
SON
IH
10
177+
0.25
17
7+0.
45
31.0
65
104.
211
0 E
1000
2
R2
G
T Y
2400
902
CU
LBER
SON
IH
10
178+
0.5
178+
0.7
31.0
63
104.
186
0 E
1000
2
R2
C
T Y
2400
903
CU
LBER
SON
IH
10
178-
0.01
17
8-0.
21
31.0
65
104.
197
0 W
10
00
2 L2
T
T Y
2401
001
CU
LBER
SON
IH
10
185+
0.0
185-
0.2
31.0
83
104.
086
0 W
10
00
2 L2
C
T
Y 24
0100
2 C
ULB
ERSO
N
IH10
18
3+0.
7 18
3+0.
5 31
.082
10
4.10
8 0
W
1000
2
L2
T T
Y 24
0100
3 C
ULB
ERSO
N
IH10
18
2+0.
6 18
2+0.
4 31
.074
10
4.12
3 0
W
1000
2
L2
G
R
Y 24
0100
4 C
ULB
ERSO
N
IH10
18
1+0.
0 18
0+0.
8 31
.064
10
4.14
8 0
W
1000
2
L2
T T
Y 24
0100
5 C
ULB
ERSO
N
IH10
18
6+0.
2 18
6+0.
4 31
.084
10
4.06
5 0
E 10
00
2 R
2 F
T Y
2401
006
CU
LBER
SON
IH
10
180+
0.8
180+
0.6
31.0
63
104.
151
0 W
10
00
2 L2
F
R
Y 24
0110
1 C
ULB
ERSO
N
IH10
17
5+0.
0 17
5+0.
2 31
.066
10
4.24
7 0
E 10
00
2 R
2 G
T
Y 24
0120
2 C
ULB
ERSO
N
IH10
16
6+0.
2 16
6+0.
4 31
.072
10
4.39
5 0
E 10
00
2 R
2 G
T
Y
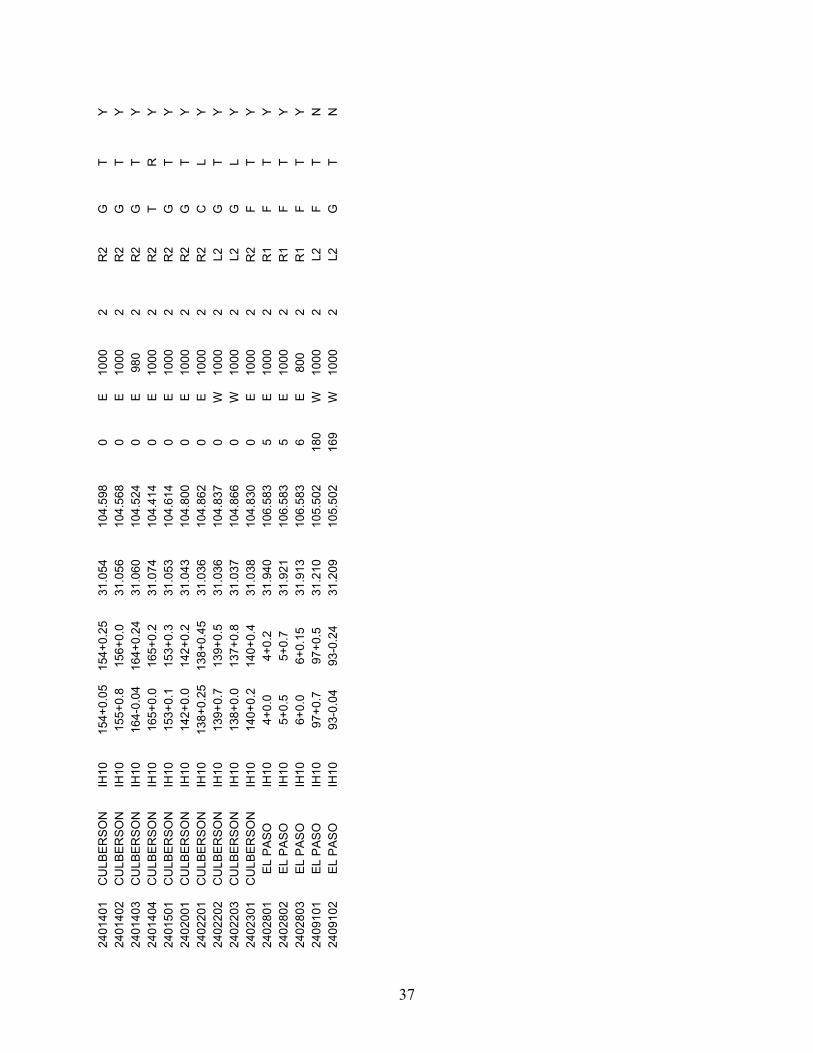
37
2401
401
CU
LBER
SON
IH
10
154+
0.05
15
4+0.
25
31.0
54
104.
598
0 E
1000
2
R2
G
T Y
2401
402
CU
LBER
SON
IH
10
155+
0.8
156+
0.0
31.0
56
104.
568
0 E
1000
2
R2
G
T Y
2401
403
CU
LBER
SON
IH
10
164-
0.04
16
4+0.
24
31.0
60
104.
524
0 E
980
2 R
2 G
T
Y 24
0140
4 C
ULB
ERSO
N
IH10
16
5+0.
0 16
5+0.
2 31
.074
10
4.41
4 0
E 10
00
2 R
2 T
R
Y 24
0150
1 C
ULB
ERSO
N
IH10
15
3+0.
1 15
3+0.
3 31
.053
10
4.61
4 0
E 10
00
2 R
2 G
T
Y 24
0200
1 C
ULB
ERSO
N
IH10
14
2+0.
0 14
2+0.
2 31
.043
10
4.80
0 0
E 10
00
2 R
2 G
T
Y 24
0220
1 C
ULB
ERSO
N
IH10
13
8+0.
25
138+
0.45
31
.036
10
4.86
2 0
E 10
00
2 R
2 C
L
Y
2402
202
CU
LBER
SON
IH
10
139+
0.7
139+
0.5
31.0
36
104.
837
0 W
10
00
2 L2
G
T
Y 24
0220
3 C
ULB
ERSO
N
IH10
13
8+0.
0 13
7+0.
8 31
.037
10
4.86
6 0
W
1000
2
L2
G
L
Y 24
0230
1 C
ULB
ERSO
N
IH10
14
0+0.
2 14
0+0.
4 31
.038
10
4.83
0 0
E 10
00
2 R
2 F
T Y
2402
801
EL P
ASO
IH
10
4+0.
0 4+
0.2
31.9
40
106.
583
5 E
1000
2
R1
F T
Y 24
0280
2 EL
PAS
O
IH10
5+
0.5
5+0.
7 31
.921
10
6.58
3 5
E 10
00
2 R
1 F
T Y
2402
803
EL P
ASO
IH
10
6+0.
0 6+
0.15
31
.913
10
6.58
3 6
E 80
0 2
R1
F T
Y 24
0910
1 EL
PAS
O
IH10
97
+0.7
97
+0.5
31
.210
10
5.50
2 18
0 W
10
00
2 L2
F
T N
24
0910
2 EL
PAS
O
IH10
93
-0.0
4 93
-0.2
4 31
.209
10
5.50
2 16
9 W
10
00
2 L2
G
T
N


39
Appendix B
Satellite Factorial Concept


41
Satellite Factorial Concept
The RPDB provides detailed information about hundreds of pavement sections that
fairly represent the PCCP network and its conditions in terms of pavement types (JCP or
CRCP), climate, and CAT used in concrete pavement. All that information has been
compiled for a period of 26 years and has served as a basic tool to provide key information
for updating design and construction specifications and about the feasibility of the use of
aggregates according to placement season. Analysis of the database has provided
invaluable information about the performance of concrete pavements.
Because of the nature of the RPDB and its extensive information, the need for further
analysis of particular construction projects has resulted in the development of special
research studies. These specific research studies are of special interest because of the
potential information they could provide that would determine the path to be followed in
the design and construction of future projects. Detailed information collection of specific
construction projects has included:
1. extraction of information from the database by collecting data about projects
selected from the rigid pavement database (RPDB).
2. incorporation of information into the database by collecting data from projects
that, because of their relevance, have been incorporated into the database.
For identification purposes of the RPDB, the special research studies are part of
satellite factorials and contain more detailed information than the rest of the sections in the
RPDB. Figure A.1 shows how the satellite factorials are included in the RPDB.
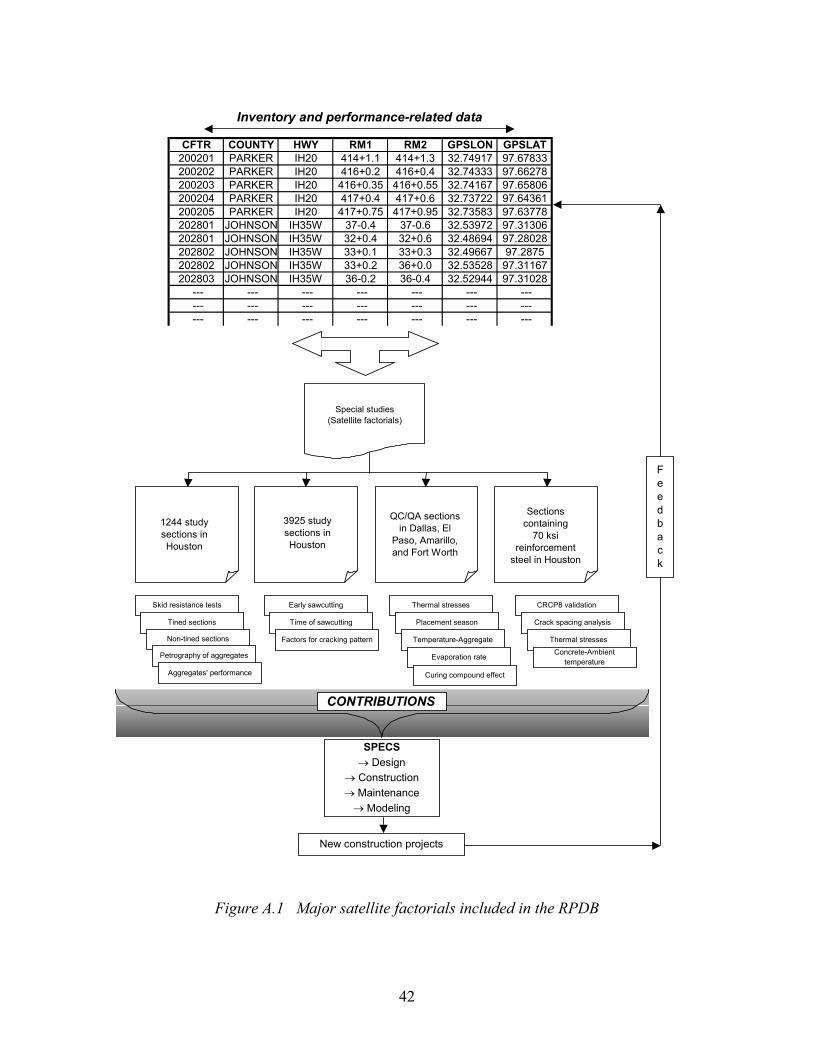
42
Figure A.1 Major satellite factorials included in the RPDB
CFTR COUNTY HWY RM1 RM2 GPSLON GPSLAT200201 PARKER IH20 414+1.1 414+1.3 32.74917 97.67833200202 PARKER IH20 416+0.2 416+0.4 32.74333 97.66278200203 PARKER IH20 416+0.35 416+0.55 32.74167 97.65806200204 PARKER IH20 417+0.4 417+0.6 32.73722 97.64361200205 PARKER IH20 417+0.75 417+0.95 32.73583 97.63778202801 JOHNSON IH35W 37-0.4 37-0.6 32.53972 97.31306202801 JOHNSON IH35W 32+0.4 32+0.6 32.48694 97.28028202802 JOHNSON IH35W 33+0.1 33+0.3 32.49667 97.2875202802 JOHNSON IH35W 33+0.2 36+0.0 32.53528 97.31167202803 JOHNSON IH35W 36-0.2 36-0.4 32.52944 97.31028
--- --- --- --- --- --- --- --- --- --- --- --- --- --- --- --- --- --- --- --- ---
Inventory and performance-related data
Special studies(Satellite factorials)
1244 study sections in Houston
3925 study sections in Houston
QC/QA sections in Dallas, El
Paso, Amarillo, and Fort Worth
Sections containing
70 ksi reinforcement
steel in Houston
Skid resistance tests
Tined sections
Non-tined sections
Petrography of aggregates
Aggregates' performance
Early sawcutting
Time of sawcutting
Factors for cracking pattern
Thermal stresses
Placement season
Temperature-Aggregate
Evaporation rate
Curing compound effect
CRCP8 validation
Crack spacing analysis
Thermal stressesConcrete-Ambient
temperature
CONTRIBUTIONS
SPECS→ Design
→ Construction→ Maintenance→ Modeling
New construction projects
Feedback
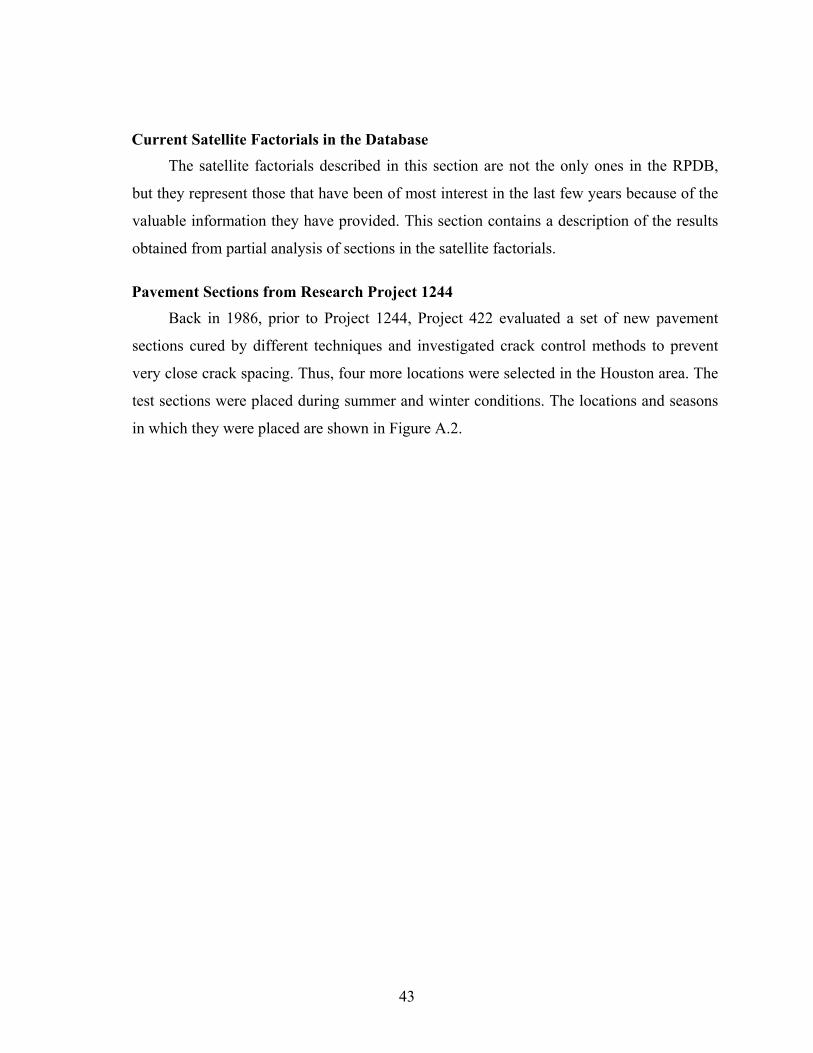
43
Current Satellite Factorials in the Database The satellite factorials described in this section are not the only ones in the RPDB,
but they represent those that have been of most interest in the last few years because of the
valuable information they have provided. This section contains a description of the results
obtained from partial analysis of sections in the satellite factorials.
Pavement Sections from Research Project 1244 Back in 1986, prior to Project 1244, Project 422 evaluated a set of new pavement
sections cured by different techniques and investigated crack control methods to prevent
very close crack spacing. Thus, four more locations were selected in the Houston area. The
test sections were placed during summer and winter conditions. The locations and seasons
in which they were placed are shown in Figure A.2.
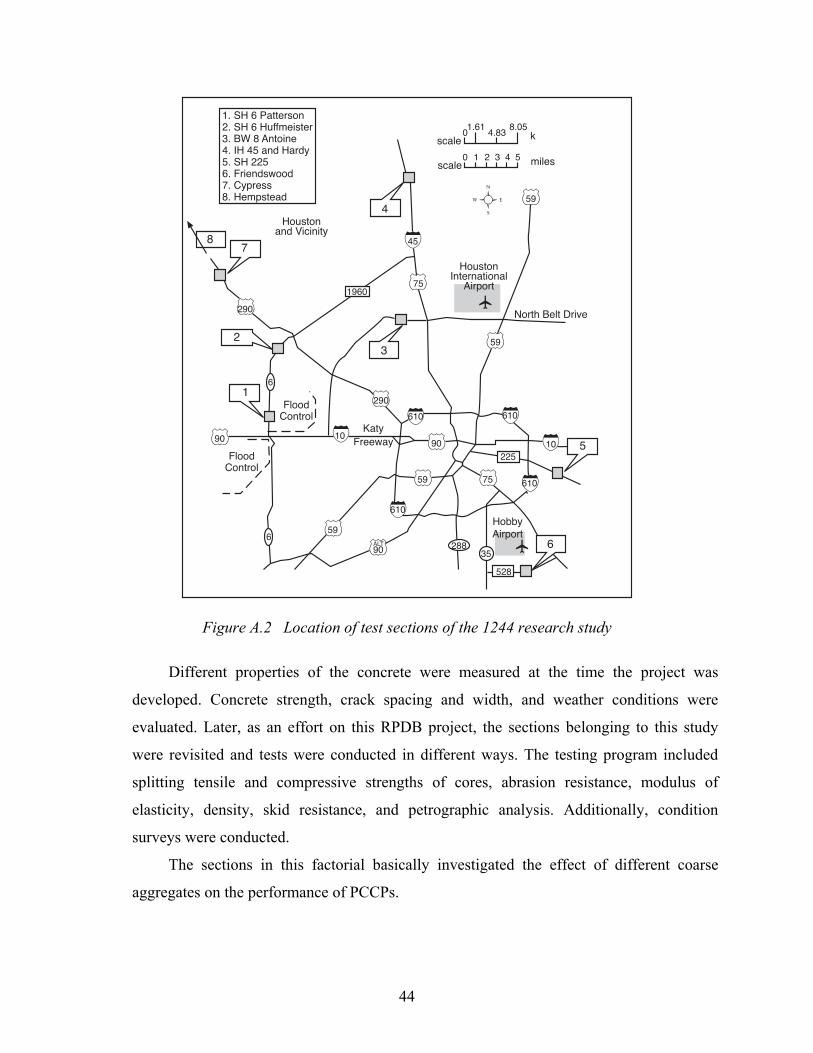
44
Figure A.2 Location of test sections of the 1244 research study
Different properties of the concrete were measured at the time the project was
developed. Concrete strength, crack spacing and width, and weather conditions were
evaluated. Later, as an effort on this RPDB project, the sections belonging to this study
were revisited and tests were conducted in different ways. The testing program included
splitting tensile and compressive strengths of cores, abrasion resistance, modulus of
elasticity, density, skid resistance, and petrographic analysis. Additionally, condition
surveys were conducted.
The sections in this factorial basically investigated the effect of different coarse
aggregates on the performance of PCCPs.
45
Summary of Results of the 1244 Research Study The following points provide with a summary of the results of the study:
1. There were significant differences in both crack spacing and crack width
between SRG and LS sections. LS sections presented larger crack spacing and
smaller crack widths than the SRG sections.
2. All the test sections presented a skid resistance number that complied with
TxDOT’s minimum specifications.
3. The lowest skid resistance numbers were found in the recycled pavement,
which was the most recently built section in the project.
4. The highest skid resistance numbers were found on the tined sections placed
during the winter.
5. The relationship between skid resistance and placement season is not well
understood yet because of a variety of factors that should be analyzed. Further
research is necessary.
6. Tined sections consistently presented higher skid resistance numbers than
non-tined sections.
7. SRG sections presented a higher strength and density than LS sections.
8. The overall condition of the sections containing SRG was poorer than that of
the rest of the sections.
Pavement sections from research study 3925
According to the literature available from this project (Reference 4), the results
obtained from Projects 6 and 7 in Friendswood (FM 528) and Cypress (US 290),
respectively, were not reported as part of Study 1244. The results were instead shown on
Study 3925 along with the results from the sections located in Hempstead, which were the
core of the study. Figure A.2 shows the general location of these test sections (Projects 6
and 7) in relation to the rest of the sections. Figure A.3, shows the location of the sections
in Hempstead.
From the results obtained from the analysis of these sections, the following
conclusions were made:
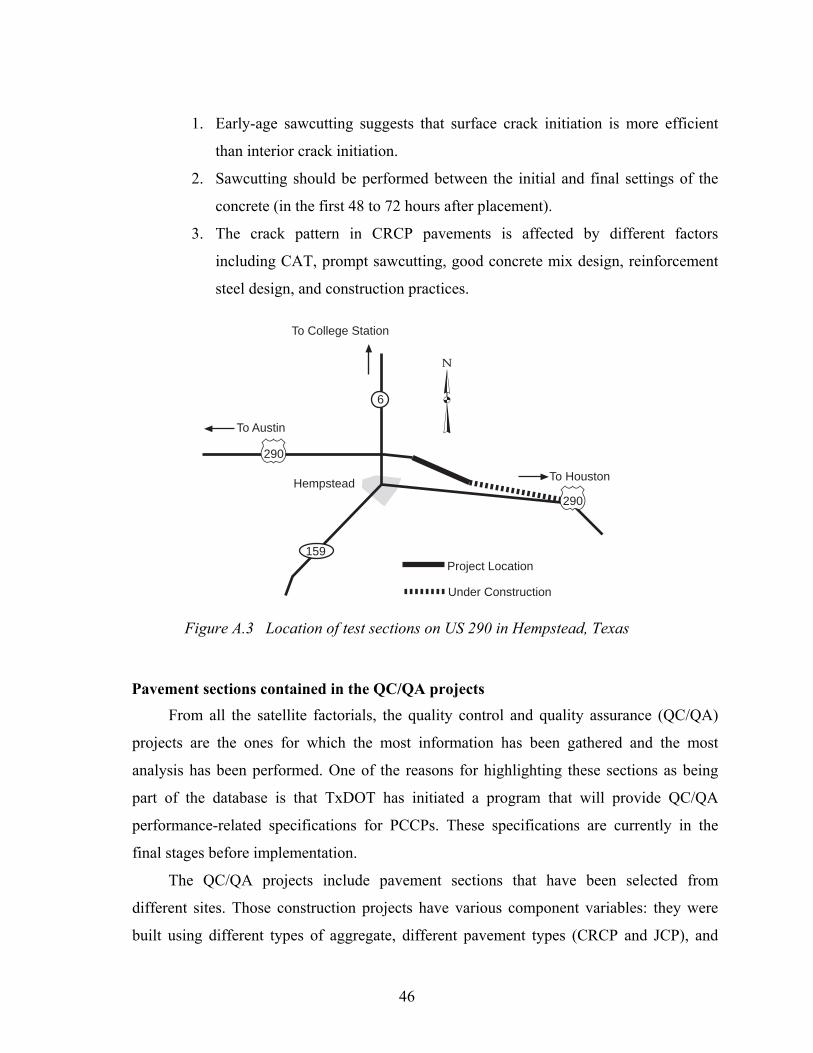
46
1. Early-age sawcutting suggests that surface crack initiation is more efficient
than interior crack initiation.
2. Sawcutting should be performed between the initial and final settings of the
concrete (in the first 48 to 72 hours after placement).
3. The crack pattern in CRCP pavements is affected by different factors
including CAT, prompt sawcutting, good concrete mix design, reinforcement
steel design, and construction practices.
To College Station
To Austin
To HoustonHempstead
6
159Project Location
Under Construction
290
290
Figure A.3 Location of test sections on US 290 in Hempstead, Texas
Pavement sections contained in the QC/QA projects From all the satellite factorials, the quality control and quality assurance (QC/QA)
projects are the ones for which the most information has been gathered and the most
analysis has been performed. One of the reasons for highlighting these sections as being
part of the database is that TxDOT has initiated a program that will provide QC/QA
performance-related specifications for PCCPs. These specifications are currently in the
final stages before implementation.
The QC/QA projects include pavement sections that have been selected from
different sites. Those construction projects have various component variables: they were
built using different types of aggregate, different pavement types (CRCP and JCP), and

47
different thicknesses, and were they were placed in different seasons (winter and summer).
All of this information has served to evaluate the response of pavements under the
influence of a combination of some of those factors, and to differentiate between desirable
and undesirable conditions regarding construction practices and use of materials.
The construction projects included in this study are spread throughout Texas. There
are three construction projects in El Paso (El Paso 1, El Paso 2, and El Paso 3); one in
Garland (north of Dallas), one in Amarillo, and one in Fort Worth. Dallas, El Paso 1, and
El Paso 2 provided vast information about climatic conditions and concrete strength. The
other projects only provided partial information about concrete strength.
The following results from the analysis of the QC/QA projects are considered
important:
1. CAT is a major factor that should be carefully supervised during pavement
construction. The greater the coefficient of thermal expansion (COTE) of the
aggregate, the more volumetric changes the concrete mass will experience.
Consequently, the higher the detrimental tensile stresses will be.
2. The season in which pavements are placed plays an important role in the early
and long-term performance of the structure.
3. Combinations of high ambient temperatures (summer conditions) and the
utilization of aggregates containing silicates should be avoided as possible.
4. A good correlation was found between splitting tensile strength and flexural
strength of concrete samples.
5. Evaporation rates above 0.2 lb/ft2/hr are considered undesirable and thus
should be avoided.
6. Prompt curing of the concrete pavement should always be pursued to avoid a
negative impact on concrete durability.
Projects in Houston containing 70 ksi reinforcement steel Other construction projects that have been considered for further study and that are
part of a satellite factorial are the ones built in Houston in 1996 and 1997 that contain 70
ksi reinforcement steel. These construction projects were selected for inclusion in a new

48
special study because there was an interest from TxDOT in analyzing the results of the
introduction of the use of Grade 70 steel in the Houston district.
In all the projects being studied, the use of Grade 70 steel was recommended by
contractors, and TxDOT officials analyzed and accepted the requested change based on
their previous experiences. Thus, using construction plans, the contractors prepared
proposals suggesting the use of Grade 70 steel instead of Grade 60 steel. The change,
according to the proposals, would yield lower construction costs per square yard of
constructed pavement without compromising the performance of the structure.
The projects included in the study and incorporated into the RPDB are located on IH-
45, SH-249, and SH-146. There are two test sections in every construction project, yielding
a total of eight sections included in a factorial. Considerable analysis has been conducted in
the past to evaluate the behavior of the different sections, and it is believed that new
information should be collected to clarify a few concerns that resulted from the previous
analysis.
A summary of the results of the analysis produced from these sections includes the
following points:
1. All the sections were investigated with the objective of evaluating their
performance under certain conditions.
2. The construction conditions of the sections were collected from plans and
construction specifications, then with that information, environmental
conditions at the time of construction were obtained from the National
Oceanic and Atmospheric Administration (NOAA) website.
3. The CRCP8 software was successfully run for every single section to predict
the crack spacing occurrence.
4. The sections located on IH-45 already presented 25 percent to 45 percent of
the transverse cracks spaced under 3 ft, as was predicted by the CRCP8
software.
5. The use of coarse aggregates with a high COTE should be considered
carefully because of potential development of undesired thermal stresses in
the pavement.

49
6. The concrete setting temperature should be observed, and values above 90 ºF
should be avoided. The ambient temperature at which the concrete is placed
should never be greater than that value.
The concrete set temperature should be observed and values above 90 degrees
Fahrenheit should be avoided. It means that the ambient temperature at which the concrete
is placed should be never above that value.


51
Appendix C
Proposed Distress Analysis of the Sections

53
Proposed Distress Analysis of the Sections
Proposed Distress Analysis for the Sections In the summer of 1999, as part of research study 01778, a qualitative and quantitative
analysis of some sections contained in the RPDB was conducted. A total of 28 JCP sections
located in the Dallas district were analyzed. The sections analyzed presented different
distresses such as ACPs, portland cement concrete patches (PCP), punchouts, D-cracking,
and corner breaks. The study also computed and analyzed crack and joint spacing
distributions.
This time, as a complement to the previous analysis made for the JCP sections, a
similar study will be conducted exclusively for CRCP sections. This analysis will show the
existence of different distress types and crack spacing distributions for sections containing
different aggregates. The study will compare sections showing poor crack spacing
distributions with those showing good cracking distributions.
The analysis of the CRCPs will differ a bit from the one performed for the JCPs
because in this case, no joint spacings are present. Likewise, some distresses that are
specific to JCP pavements will not be considered (e.g, corner breaks and D-cracking).
Structure of the Analysis Plan Figure C.1 shows the proposed analysis plan to be conducted. The first step consists
of revising the entire CRCP database district by district; the analysis will be conducted for
some of the districts that contain enough non-overlaid test sections. Having selected the
districts to be analyzed, the next step will be to separate those test sections containing LS
from those containing SRG.
The distresses to be included in the analysis are spalled cracks, punchouts, ACPs, and
PCPs. Transverse crack spacing will be analyzed in a separate form and this information
could be validated by running the CRCP8 software.
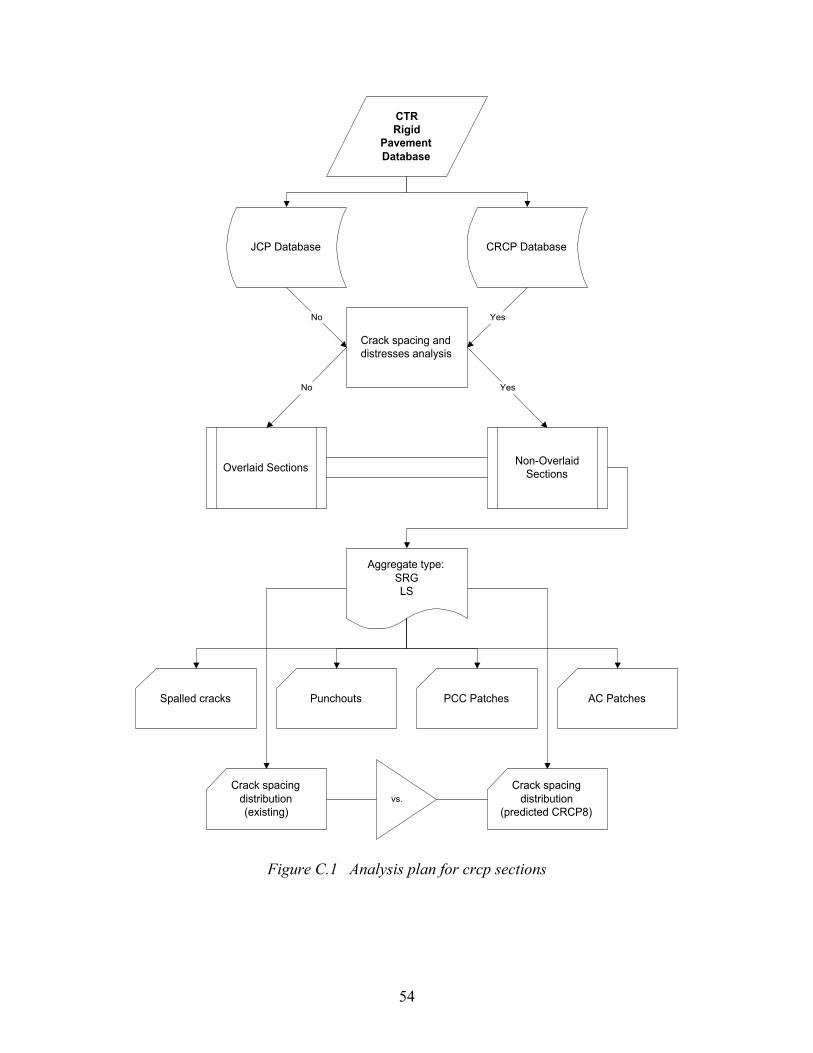
54
CTRRigid
PavementDatabase
JCP Database CRCP Database
Crack spacing anddistresses analysis
No Yes
Overlaid Sections Non-OverlaidSections
No Yes
Aggregate type:SRGLS
Spalled cracks Punchouts PCC Patches AC Patches
Crack spacingdistribution(existing)
Crack spacingdistribution
(predicted CRCP8)vs.
Figure C.1 Analysis plan for crcp sections
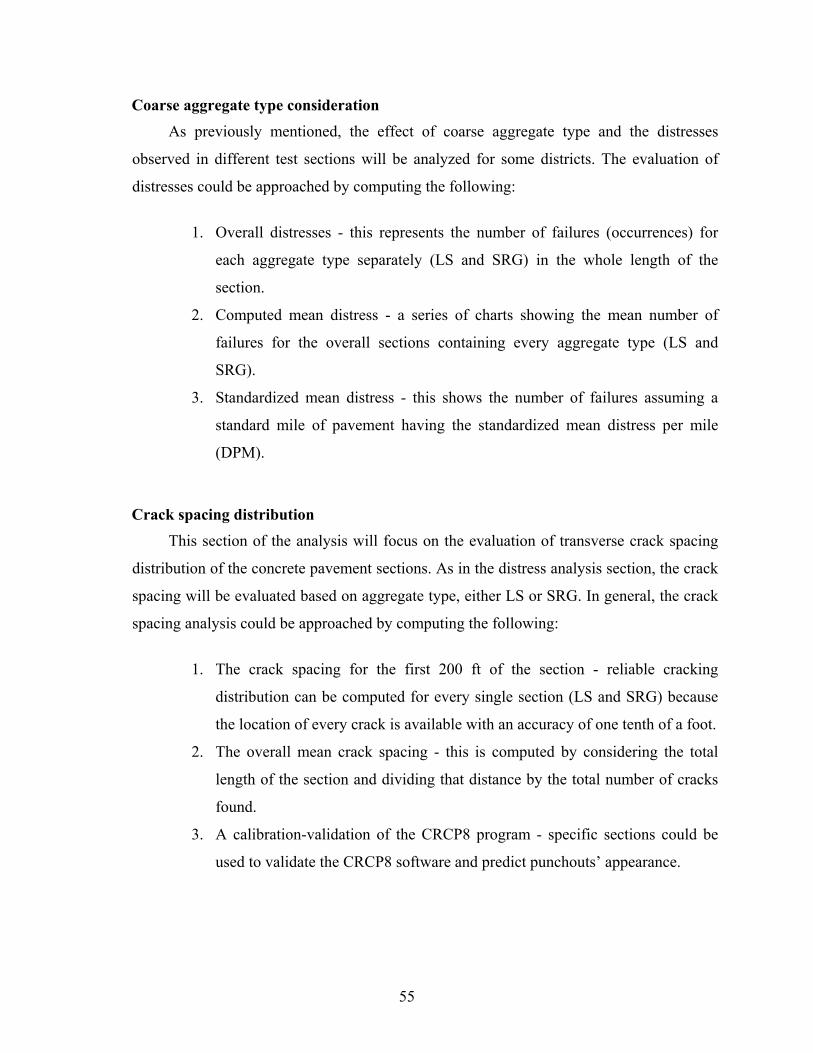
55
Coarse aggregate type consideration As previously mentioned, the effect of coarse aggregate type and the distresses
observed in different test sections will be analyzed for some districts. The evaluation of
distresses could be approached by computing the following:
1. Overall distresses - this represents the number of failures (occurrences) for
each aggregate type separately (LS and SRG) in the whole length of the
section.
2. Computed mean distress - a series of charts showing the mean number of
failures for the overall sections containing every aggregate type (LS and
SRG).
3. Standardized mean distress - this shows the number of failures assuming a
standard mile of pavement having the standardized mean distress per mile
(DPM).
Crack spacing distribution This section of the analysis will focus on the evaluation of transverse crack spacing
distribution of the concrete pavement sections. As in the distress analysis section, the crack
spacing will be evaluated based on aggregate type, either LS or SRG. In general, the crack
spacing analysis could be approached by computing the following:
1. The crack spacing for the first 200 ft of the section - reliable cracking
distribution can be computed for every single section (LS and SRG) because
the location of every crack is available with an accuracy of one tenth of a foot.
2. The overall mean crack spacing - this is computed by considering the total
length of the section and dividing that distance by the total number of cracks
found.
3. A calibration-validation of the CRCP8 program - specific sections could be
used to validate the CRCP8 software and predict punchouts’ appearance.
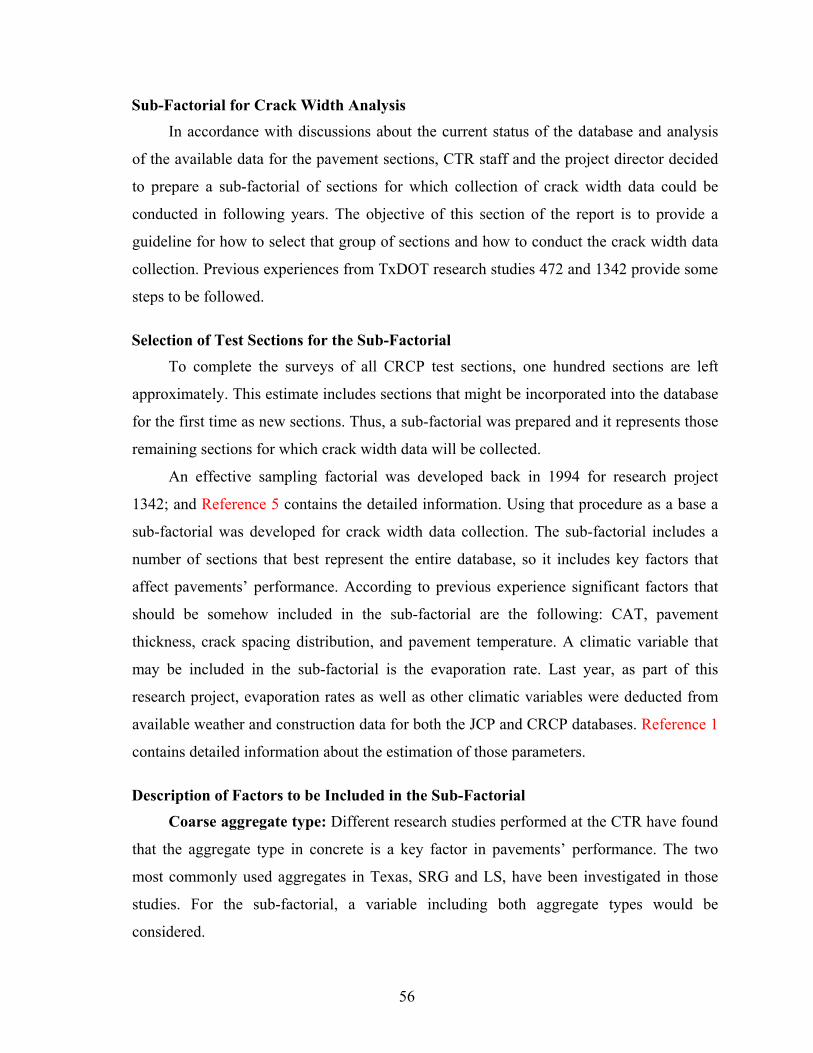
56
Sub-Factorial for Crack Width Analysis In accordance with discussions about the current status of the database and analysis
of the available data for the pavement sections, CTR staff and the project director decided
to prepare a sub-factorial of sections for which collection of crack width data could be
conducted in following years. The objective of this section of the report is to provide a
guideline for how to select that group of sections and how to conduct the crack width data
collection. Previous experiences from TxDOT research studies 472 and 1342 provide some
steps to be followed.
Selection of Test Sections for the Sub-Factorial To complete the surveys of all CRCP test sections, one hundred sections are left
approximately. This estimate includes sections that might be incorporated into the database
for the first time as new sections. Thus, a sub-factorial was prepared and it represents those
remaining sections for which crack width data will be collected.
An effective sampling factorial was developed back in 1994 for research project
1342; and Reference 5 contains the detailed information. Using that procedure as a base a
sub-factorial was developed for crack width data collection. The sub-factorial includes a
number of sections that best represent the entire database, so it includes key factors that
affect pavements’ performance. According to previous experience significant factors that
should be somehow included in the sub-factorial are the following: CAT, pavement
thickness, crack spacing distribution, and pavement temperature. A climatic variable that
may be included in the sub-factorial is the evaporation rate. Last year, as part of this
research project, evaporation rates as well as other climatic variables were deducted from
available weather and construction data for both the JCP and CRCP databases. Reference 1
contains detailed information about the estimation of those parameters.
Description of Factors to be Included in the Sub-Factorial
Coarse aggregate type: Different research studies performed at the CTR have found
that the aggregate type in concrete is a key factor in pavements’ performance. The two
most commonly used aggregates in Texas, SRG and LS, have been investigated in those
studies. For the sub-factorial, a variable including both aggregate types would be
considered.
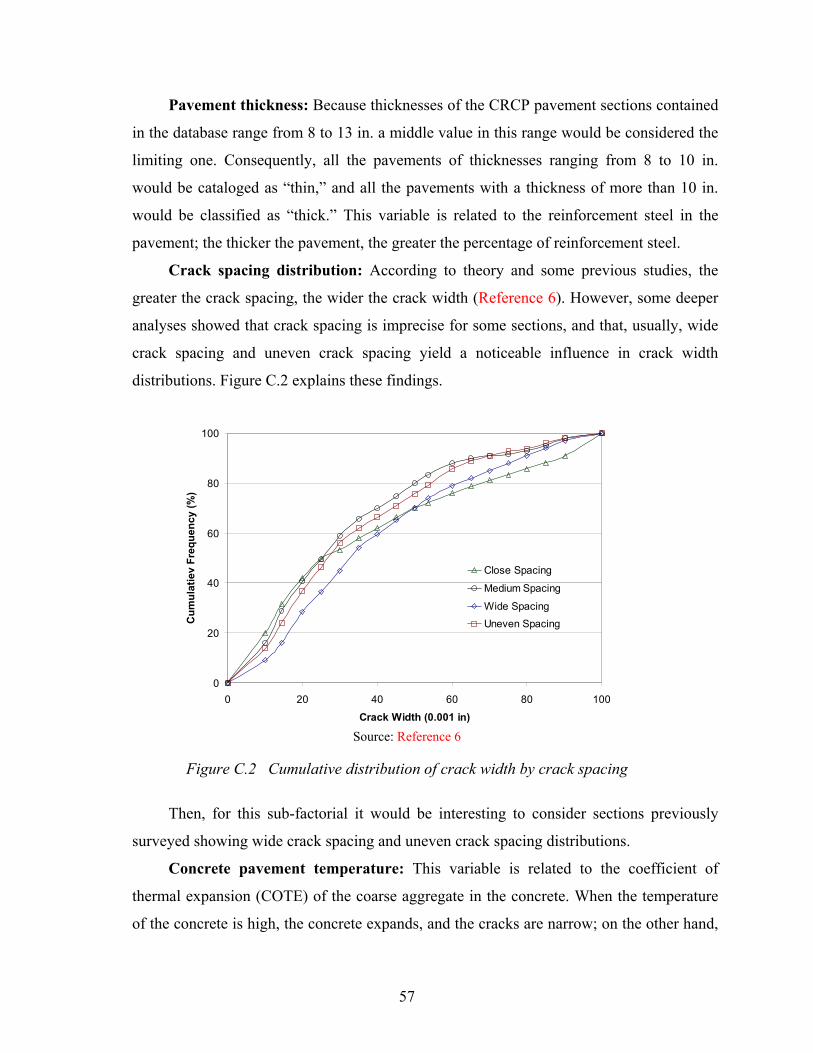
57
Pavement thickness: Because thicknesses of the CRCP pavement sections contained
in the database range from 8 to 13 in. a middle value in this range would be considered the
limiting one. Consequently, all the pavements of thicknesses ranging from 8 to 10 in.
would be cataloged as “thin,” and all the pavements with a thickness of more than 10 in.
would be classified as “thick.” This variable is related to the reinforcement steel in the
pavement; the thicker the pavement, the greater the percentage of reinforcement steel.
Crack spacing distribution: According to theory and some previous studies, the
greater the crack spacing, the wider the crack width (Reference 6). However, some deeper
analyses showed that crack spacing is imprecise for some sections, and that, usually, wide
crack spacing and uneven crack spacing yield a noticeable influence in crack width
distributions. Figure C.2 explains these findings.
0
20
40
60
80
100
0 20 40 60 80 100Crack Width (0.001 in)
Cum
ulat
iev
Freq
uenc
y (%
)
Close Spacing
Medium Spacing
Wide SpacingUneven Spacing
Source: Reference 6
Figure C.2 Cumulative distribution of crack width by crack spacing
Then, for this sub-factorial it would be interesting to consider sections previously
surveyed showing wide crack spacing and uneven crack spacing distributions.
Concrete pavement temperature: This variable is related to the coefficient of
thermal expansion (COTE) of the coarse aggregate in the concrete. When the temperature
of the concrete is high, the concrete expands, and the cracks are narrow; on the other hand,
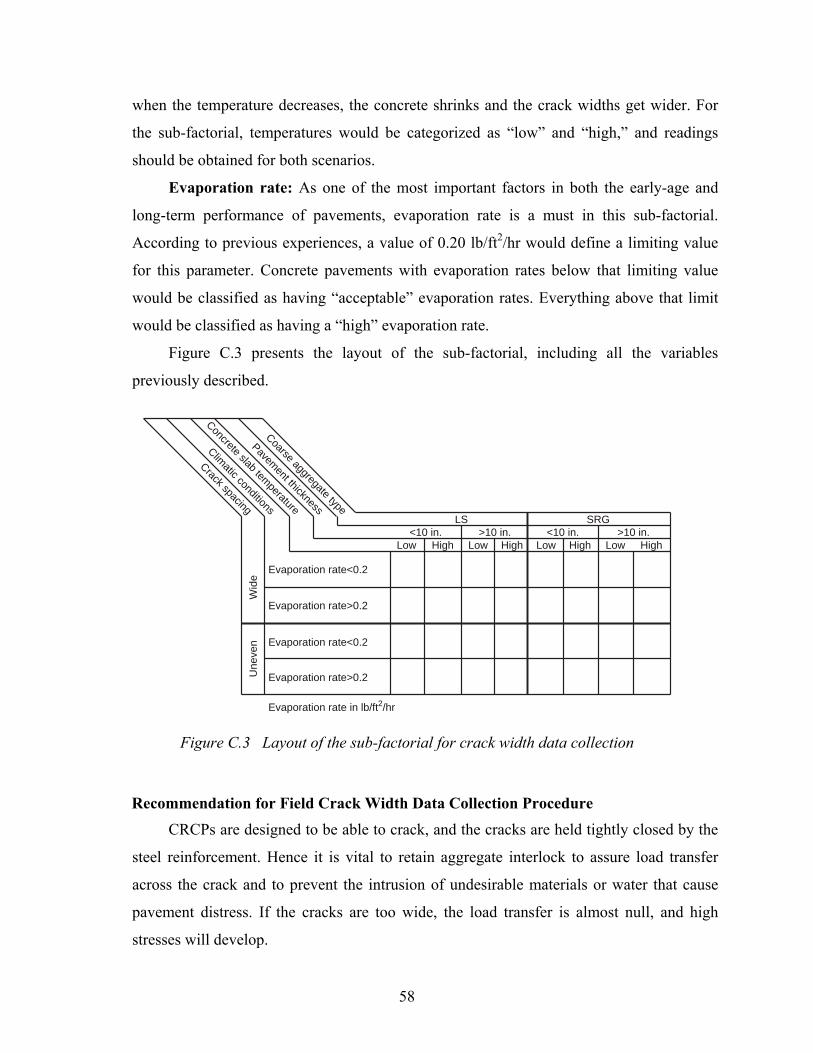
58
when the temperature decreases, the concrete shrinks and the crack widths get wider. For
the sub-factorial, temperatures would be categorized as “low” and “high,” and readings
should be obtained for both scenarios.
Evaporation rate: As one of the most important factors in both the early-age and
long-term performance of pavements, evaporation rate is a must in this sub-factorial.
According to previous experiences, a value of 0.20 lb/ft2/hr would define a limiting value
for this parameter. Concrete pavements with evaporation rates below that limiting value
would be classified as having “acceptable” evaporation rates. Everything above that limit
would be classified as having a “high” evaporation rate.
Figure C.3 presents the layout of the sub-factorial, including all the variables
previously described.
Crack spacing
Climatic conditions
Concrete slab temperature
Pavement thickness
Coarse aggregate type
Low High Low High Low High Low High
Evaporation rate in lb/ft2/hr
Une
ven
Wid
e
Evaporation rate<0.2
Evaporation rate>0.2
Evaporation rate<0.2
Evaporation rate>0.2
LS SRG<10 in. >10 in. <10 in. >10 in.
Figure C.3 Layout of the sub-factorial for crack width data collection
Recommendation for Field Crack Width Data Collection Procedure CRCPs are designed to be able to crack, and the cracks are held tightly closed by the
steel reinforcement. Hence it is vital to retain aggregate interlock to assure load transfer
across the crack and to prevent the intrusion of undesirable materials or water that cause
pavement distress. If the cracks are too wide, the load transfer is almost null, and high
stresses will develop.

59
When measuring crack width, and for the purposes of this project, it may be
necessary to measure crack movements at different temperature rates. It has been debated
whether changes in slab temperature affect crack opening in a detectable way, but studies
conducted in the last few months have demonstrated that there is definitely some
correlation between slab temperature and crack width. Based on these findings, it is
suggested that a minimum reliable number of crack width measurements should be taken to
achieve a reasonable standard error.
A final decision should be made about the field procedure to measure the crack
width. During research projects 472 and 1244, a microscope was used to obtain accurate
readings, and an experimental design was conducted to determine the dependability of the
measurements when taken by different operators, ranging from an unskilled operator to an
expert engineer with high skills in field data collection. From the investigations, it was
concluded that no significant difference existed between the measurements taken by
different people, except that the measurements taken by an unskilled operator had a higher
variance than those taken by the other operators.
Field Data Collection Procedure Based on the preliminary considerations above, it may be worthwhile to collect crack
width data at different points in the pavement section. Because of budgetary and time
constraints for this project, a microscope would not be used. Instead, a crack comparator
that could give an acceptable and comparable crack width value could be used.
Additionally, the measurement of the cracks should be conducted at different times during
a given day when a section is surveyed. Figure C.4 shows a crack comparator that is used
for concrete and masonry crack width measurements.
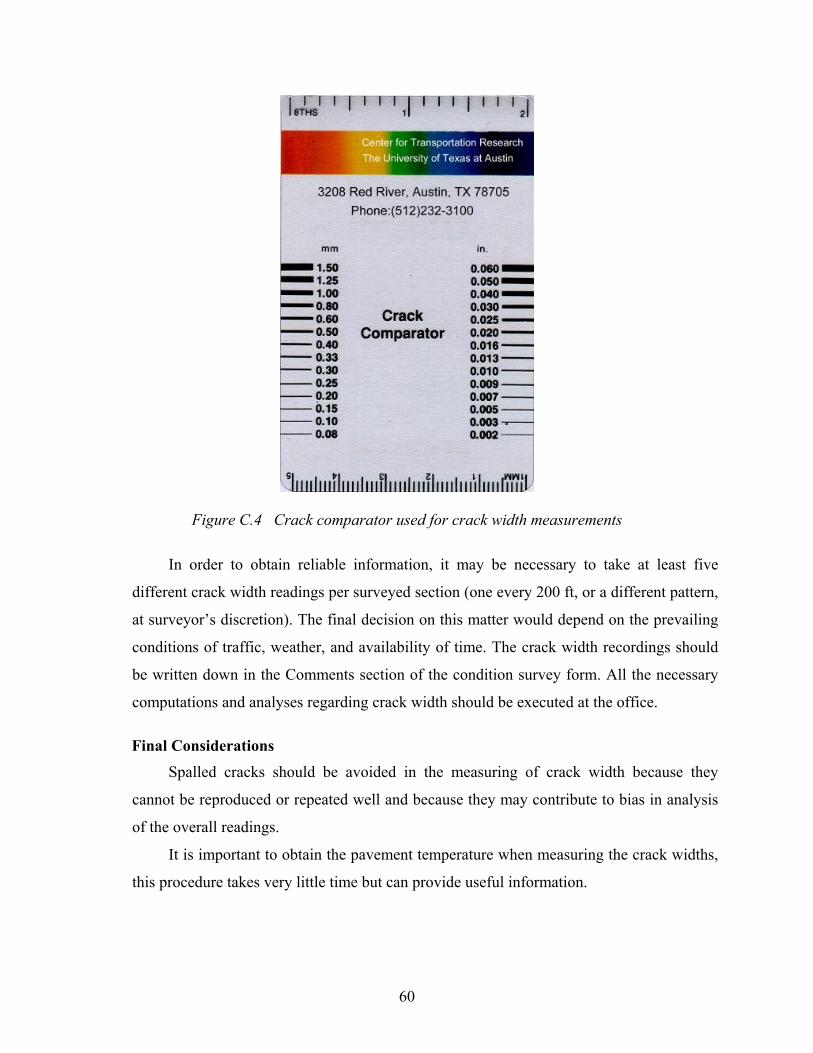
60
Figure C.4 Crack comparator used for crack width measurements
In order to obtain reliable information, it may be necessary to take at least five
different crack width readings per surveyed section (one every 200 ft, or a different pattern,
at surveyor’s discretion). The final decision on this matter would depend on the prevailing
conditions of traffic, weather, and availability of time. The crack width recordings should
be written down in the Comments section of the condition survey form. All the necessary
computations and analyses regarding crack width should be executed at the office.
Final Considerations Spalled cracks should be avoided in the measuring of crack width because they
cannot be reproduced or repeated well and because they may contribute to bias in analysis
of the overall readings.
It is important to obtain the pavement temperature when measuring the crack widths,
this procedure takes very little time but can provide useful information.

61
References
1. Medina, Cesar, Terry Dossey, and B. Frank McCullough. “Analysis, Description, Evaluation, and
Achieved Improvements for the Texas Jointed Concrete Pavement Database.” Research Report
1778-1. Center for Transportation Research. The University of Texas at Austin. August 1999.
2. Dossey, Terry, Cesar Medina, David Merritt, and B. Frank McCullough. “Updating the Rigid
Pavement Database: The 1996 CRCP Condition Survey and Improvements to the Inventory Data.”
Research Report 2952-2. Center for Transportation Research. The University of Texas at Austin.
August 1999.
3. Texas Department of Transportation (TxDOT). “Pavement Management Information System Rater’s
Manual for Fiscal Year 2000.” Austin, Texas. June 1999.
4. McCullough, B. Frank, Dan Zollinger, and Terry Dossey. “Evaluation of the Performance of Texas
Pavements Made with Different Coarse Aggregates.” Research Report 3925-1. Center for
Transportation Research. The University of Texas at Austin. September 1998.
5. Ruiz-Huerta, J. Mauricio, B. Frank McCullough. “Development of a Jointed Concrete Pavement
Database for the State of Texas.” Research Report 1342-2. Center for Transportation Research. The
University of Texas at Austin. September 1994.
6. Dossey, Terry, and Angela Weissmann. “A Continuously Reinforced Concrete Database.” Research
Report 472-6. Center for Transportation Research. The University of Texas at Austin. November
1989.
7. Dossey, Terry, Tracy Turen, and B. Frank McCullough. “The Rigid Pavement Database: Overview
and Data Collection Plan.” Research Report 2952-1. Center for Transportation Research. The
University of Texas at Austin. June 1998.
8. McCullough, B. Frank, Dan Zollinger, and Brent Allison. “Preliminary Research Findings on the
Effect of Coarse Aggregate on the Performance of Portland Cement Concrete Paving.” Research
Report 1244-5. Center for Transportation Research. The University of Texas at Austin. October
1993.
62
9. Chou, Chia-Pei, B. Frank McCullough, W. Ronald Hudson, and C. L. Saraf. “Development of a
Long-Term Monitoring System for Texas CRC Pavement Network.” Research Report 472-2. Center
for Transportation Research. The University of Texas at Austin. October 1988.
10. Mooncheol, Won, Kenneth Hankins, and B. Frank McCullough. “A Twenty-Four Year Performance
Review of Concrete Pavements Sections Made with Siliceous and Lightweight Coarse Aggregates.”
Research Report 472-3. Center for Transportation Research. The University of Texas at Austin.
April 1989.
11. Weissmann, Angela, and Kenneth Hankins. “Development of Procedures for a Statewide Diagnostic
Survey on Continuously Reinforced Concrete Pavements.” Research Report 472-4. Center for
Transportation Research. The University of Texas at Austin. November 1989.