Untitled - MDPI
17
-
Upload
khangminh22 -
Category
Documents
-
view
0 -
download
0
Transcript of Untitled - MDPI

genesG C A T
T A C G
G C A T
Article
Ancient DNA from Giant Panda(Ailuropoda melanoleuca) of South-Western ChinaReveals Genetic Diversity Loss during the Holocene
Gui-Lian Sheng 1 ID , Axel Barlow 2, Alan Cooper 3, Xin-Dong Hou 1, Xue-Ping Ji 4,Nina G. Jablonski 5 ID , Bo-Jian Zhong 6, Hong Liu 7, Lawrence J. Flynn 8, Jun-Xia Yuan 1,Li-Rui Wang 9, Nikolas Basler 2, Michael V. Westbury 2,10, Michael Hofreiter 2,*and Xu-Long Lai 1,*
1 State Key Laboratory of Biogeology and Environmental Geology, China University of Geosciences,Wuhan 430074, China; [email protected] (G.-L.S.); [email protected] (X.-D.H.);[email protected] (J.-X.Y.)
2 Institute for Biochemistry and Biology, University of Potsdam, Karl-Liebknecht-Strasse 24-25,14476 Potsdam, Germany; [email protected] (A.B.); [email protected] (N.B.);[email protected] (M.V.W.)
3 Australian Centre for Ancient DNA, School of Earth & Environmental Sciences, University of Adelaide,Adelaide, SA 5000, Australia; [email protected]
4 Yunnan Cultural Relics and Archaeology Institute, 15-1, Chunmingli, Chunyuanxiaoqu,Kunming 650118, China; [email protected]
5 Department of Anthropology, 409 Carpenter Building, The Pennsylvania State University, University Park,PA 16802, USA; [email protected]
6 Jiangsu Key Laboratory for Biodiversity and Biotechnology, College of Life Sciences, Nanjing NormalUniversity, Nanjing 210023, China; [email protected]
7 International Joint Research Center for Karstology, Yunnan University, Kunming 650223, China;[email protected]
8 Department of Human Evolutionary Biology, Harvard University, 11 Divinity Avenue,Cambridge, MA 02138, USA; [email protected]
9 Baoshan Museum, Baoshan 678000, China; [email protected] Natural History Museum of Denmark, University of Copenhagen, Øster Voldgade 5-7,
DK-1350 Copenhagen K, Denmark* Correspondence: [email protected] (M.H.); [email protected] (X.-L.L.);
Tel.: 49-331-977-6321 (M.H.); +86-27-6788-3996 (X.-L.L.)
Received: 24 February 2018; Accepted: 27 March 2018; Published: 6 April 2018�����������������
Abstract: The giant panda was widely distributed in China and south-eastern Asia during the middleto late Pleistocene, prior to its habitat becoming rapidly reduced in the Holocene. While conservationreserves have been established and population numbers of the giant panda have recently increased,the interpretation of its genetic diversity remains controversial. Previous analyses, surprisingly,have indicated relatively high levels of genetic diversity raising issues concerning the efficiencyand usefulness of reintroducing individuals from captive populations. However, due to a lack ofDNA data from fossil specimens, it is unknown whether genetic diversity was even higher prior tothe most recent population decline. We amplified complete cytb and 12s rRNA, partial 16s rRNAand ND1, and control region sequences from the mitochondrial genomes of two Holocene pandaspecimens. We estimated genetic diversity and population demography by analyzing the ancientmitochondrial DNA sequences alongside those from modern giant pandas, as well as from othermembers of the bear family (Ursidae). Phylogenetic analyses show that one of the ancient haplotypesis sister to all sampled modern pandas and the second ancient individual is nested among themodern haplotypes, suggesting that genetic diversity may indeed have been higher earlier during theHolocene. Bayesian skyline plot analysis supports this view and indicates a slight decline in female
Genes 2018, 9, 198; doi:10.3390/genes9040198 www.mdpi.com/journal/genes

Genes 2018, 9, 198 2 of 16
effective population size starting around 6000 years B.P., followed by a recovery around 2000 yearsago. Therefore, while the genetic diversity of the giant panda has been affected by recent habitatcontraction, it still harbors substantial genetic diversity. Moreover, while its still low populationnumbers require continued conservation efforts, there seem to be no immediate threats from theperspective of genetic evolutionary potential.
Keywords: ancient DNA; giant panda; evolution; genetic diversity; Ailuropoda melanoleuca
1. Introduction
The giant panda (Ailuropoda melanoleuca) is an iconic species for world wildlife conservation.Fossil findings indicate that the ancestors of this species probably originated in the late Miocene in thesouth-west of China, expanded their habitat range during the early Pleistocene, and began to contract inhabitat range during the late Pleistocene [1–4]. Fossil remains have been excavated from Zhoukoudianin northern China (near Beijing), vast areas of southern China, northern Myanmar, Vietnam, Laos,and Thailand, showing that it was a widely distributed species during the Pleistocene [5–8]. However,it is currently restricted to only a number of fragmented populations in six different mountain ranges(Qinling, Minshan, Qionglai, Daxiangling, Xiaoxiangling and Liangshan) on the eastern margin of theTibetan plateau [9]. The dramatic population reduction of this threatened species has attracted concernby conservation biologists and, together with its unique biological attributes such as its coloration orits strictly herbivorous diet (despite being a member of the order Carnivora), it has sparked the interestof evolutionary biologists and population geneticists [10–16].
Both climate change (Quaternary glacial cycles) and human activities (habitat modification andfragmentation, and hunting) have played important roles in decreasing the genetic diversity andpopulation size of megafauna [17–22]. Panda conservation has had a high priority in China since the1950s and, since 1999, the census in the wild has increased from 1596 to 1864 individuals. Moreover,71% of wild pandas are now living within the reserve system [9,11]. As a consequence, the InternationalUnion for Conservation of Nature (IUCN) has changed the status of giant panda from “endangered”to “vulnerable” [23]. However, the latest national survey (2011–2014) of adult giant panda populationshas been improved not only in terms of data collection and analytical methods, but also by increasingthe survey area from 49 to 62 counties [24]. Therefore, important questions remain about the benefitsof reintroducing more individuals from captive populations versus protecting additional areas ofpotential habitat. With regard to additional protection zones, it is important to consider habitat quality,the potential for local adaptation of populations, and further climate change [25,26]. In this context,further investigation of past population dynamics and changes in genetic diversity offer the possibilityto strengthen and inform management strategies.
Several previous studies have examined the genetic diversity and relationships of extant giantpanda populations using both mitochondrial and nuclear data. Early studies using proteins [27],the mitochondrial (mt) DNA control region [28], and DNA fingerprinting [29] have suggested that thegenetic variability in giant panda populations is low. In contrast, more recent studies of the mtDNAcontrol region and microsatellite loci suggest that the giant panda has high or at least medium-levelgenetic variability compared with the other bear species [13,30,31]. This is further supported bygenome-wide levels of heterozygosity [14,26].
Although a recent study confirmed the potential for genetic data recovery from ancient giantpanda remains [32], ancient DNA sequences that would allow assessment of changes in geneticdiversity are yet to be reported. This may reveal additional diversity or entire clades that werelost during the Pleistocene or Holocene [33], as well as contribute to an understanding of changesin population size and genetic diversity over time. In this study, we report mitochondrial DNAsequences comparing the complete cytochrome b (cytb) and 12s rRNA genes, partial 16s rRNA and

Genes 2018, 9, 198 3 of 16
ND1 genes, and the control region (CR) from two middle Holocene giant panda specimens collectedfrom south-western China. We use these data to investigate the genetic diversity and demographichistory of giant panda populations, and discuss the mechanisms behind the giant panda’s rangecontraction and population size reduction.
2. Materials and Methods
2.1. Samples
Two samples of Holocene sub-fossil giant pandas (Specimens Nos.: 05001, 97001) were collectedfrom a natural sinkhole, 41–60 m deep from the surface, at Jiangdong Hill, Tengchong County inYunnan Province, south-western China (Figure 1). The samples were associated with Elephas maximus,Bos gaurus, Dicerorhinus sumatraensis, Equus yunnanesis, Cervus unicolor, and several other species [34–37].They were accelerator mass spectrometry (AMS)-radiocarbon dated at the Quaternary Geology andArchaeological Chronology Laboratory at Peking University at 5025 ± 35 (No. 05001) and 8470 ± 45(No. 97001) years B.P. respectively [37]. These dates are the latest record of the giant panda before itdisappeared from Yunnan Province.
Figure 1. Geographic distribution of the giant panda. The samples in this study are indicated by thered dot. The historical geographic distribution is indicated by light green shading. Different extantpopulations are shown by different colors, as indicated by the key at the top left of the figure [7,9].
2.2. DNA Extraction and Amplification
Ancient DNA extractions and polymerase chain reactions (PCRs) were set up in an ancient DNAfacility at China University of Geosciences (Wuhan), in a building physically separated from post-PCRfacilities. Ancient DNA was extracted from approximately 250 mg bone powder following a silicamethod optimized for ancient DNA extraction [38]. Extraction and PCR blanks were performedto monitor for potential contamination. Overlapping primer pairs were newly designed based onthe mitochondrial genome of an extant giant panda (GenBank accession number of EF212882.1) [39]using Primer 5.0 (Figure S1 and Table S1). Amplifications were performed using a two-step multiplexapproach [40]. The annealing temperatures were set at 50 ◦C in both steps. PCR products were purifiedusing the QIAquick Gel Extraction Kit (Qiagen, Hilden, Germany) and cloned into the pMD18-Tvector (Takara, Tokyo, Japan) following the supplier’s instructions. Plasmids were transformed into
Genes 2018, 9, 198 4 of 16
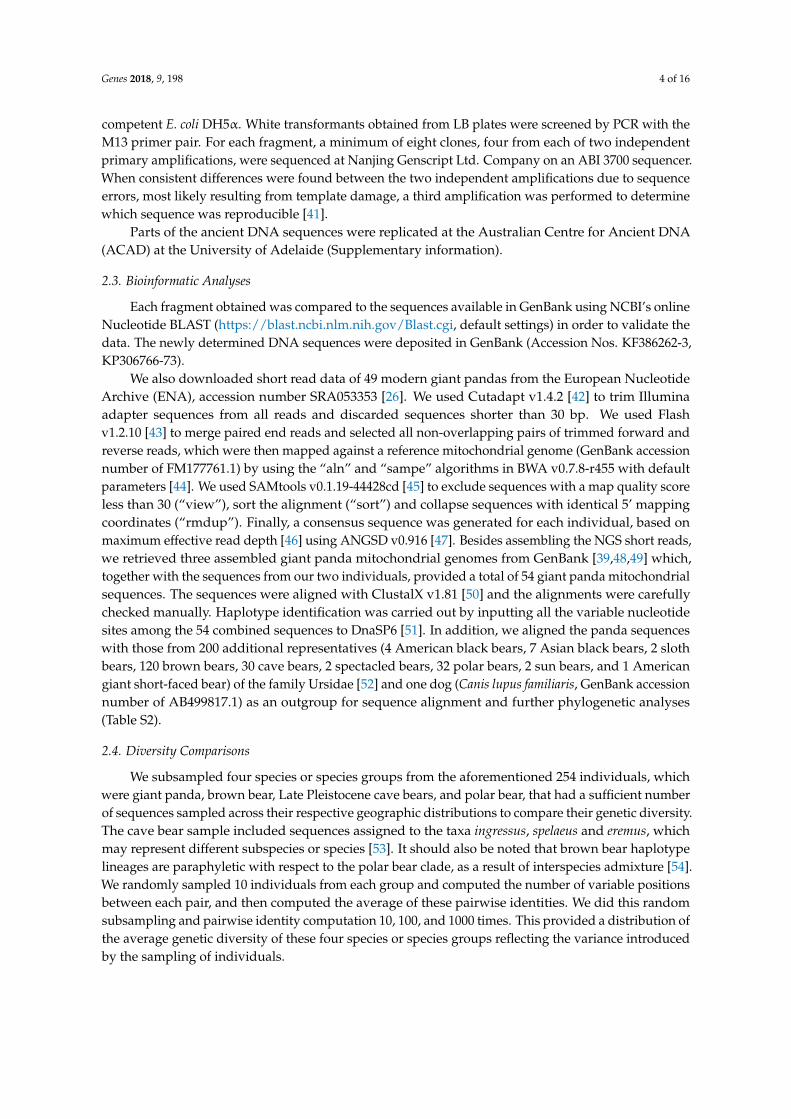
competent E. coli DH5α. White transformants obtained from LB plates were screened by PCR with theM13 primer pair. For each fragment, a minimum of eight clones, four from each of two independentprimary amplifications, were sequenced at Nanjing Genscript Ltd. Company on an ABI 3700 sequencer.When consistent differences were found between the two independent amplifications due to sequenceerrors, most likely resulting from template damage, a third amplification was performed to determinewhich sequence was reproducible [41].
Parts of the ancient DNA sequences were replicated at the Australian Centre for Ancient DNA(ACAD) at the University of Adelaide (Supplementary information).
2.3. Bioinformatic Analyses
Each fragment obtained was compared to the sequences available in GenBank using NCBI’s onlineNucleotide BLAST (https://blast.ncbi.nlm.nih.gov/Blast.cgi, default settings) in order to validate thedata. The newly determined DNA sequences were deposited in GenBank (Accession Nos. KF386262-3,KP306766-73).
We also downloaded short read data of 49 modern giant pandas from the European NucleotideArchive (ENA), accession number SRA053353 [26]. We used Cutadapt v1.4.2 [42] to trim Illuminaadapter sequences from all reads and discarded sequences shorter than 30 bp. We used Flashv1.2.10 [43] to merge paired end reads and selected all non-overlapping pairs of trimmed forward andreverse reads, which were then mapped against a reference mitochondrial genome (GenBank accessionnumber of FM177761.1) by using the “aln” and “sampe” algorithms in BWA v0.7.8-r455 with defaultparameters [44]. We used SAMtools v0.1.19-44428cd [45] to exclude sequences with a map quality scoreless than 30 (“view”), sort the alignment (“sort”) and collapse sequences with identical 5’ mappingcoordinates (“rmdup”). Finally, a consensus sequence was generated for each individual, based onmaximum effective read depth [46] using ANGSD v0.916 [47]. Besides assembling the NGS short reads,we retrieved three assembled giant panda mitochondrial genomes from GenBank [39,48,49] which,together with the sequences from our two individuals, provided a total of 54 giant panda mitochondrialsequences. The sequences were aligned with ClustalX v1.81 [50] and the alignments were carefullychecked manually. Haplotype identification was carried out by inputting all the variable nucleotidesites among the 54 combined sequences to DnaSP6 [51]. In addition, we aligned the panda sequenceswith those from 200 additional representatives (4 American black bears, 7 Asian black bears, 2 slothbears, 120 brown bears, 30 cave bears, 2 spectacled bears, 32 polar bears, 2 sun bears, and 1 Americangiant short-faced bear) of the family Ursidae [52] and one dog (Canis lupus familiaris, GenBank accessionnumber of AB499817.1) as an outgroup for sequence alignment and further phylogenetic analyses(Table S2).
2.4. Diversity Comparisons
We subsampled four species or species groups from the aforementioned 254 individuals, whichwere giant panda, brown bear, Late Pleistocene cave bears, and polar bear, that had a sufficient numberof sequences sampled across their respective geographic distributions to compare their genetic diversity.The cave bear sample included sequences assigned to the taxa ingressus, spelaeus and eremus, whichmay represent different subspecies or species [53]. It should also be noted that brown bear haplotypelineages are paraphyletic with respect to the polar bear clade, as a result of interspecies admixture [54].We randomly sampled 10 individuals from each group and computed the number of variable positionsbetween each pair, and then computed the average of these pairwise identities. We did this randomsubsampling and pairwise identity computation 10, 100, and 1000 times. This provided a distribution ofthe average genetic diversity of these four species or species groups reflecting the variance introducedby the sampling of individuals.

Genes 2018, 9, 198 5 of 16
2.5. Phylogenetic and Network Analysis
Phylogenetic relationships among the 54 sampled giant panda sequences, as well as their positionwithin the larger Ursid phylogeny, were inferred by maximum likelihood in RAxML-HPC v.8 [55]on the CIPRES portal [56]. Canis lupus familiaris served as an outgroup to root the tree. The D-loopsequences were not used for this analysis due to the possibility of saturation and ambiguous alignmentof divergent intergeneric sequences. Optimal alignment partitions were selected from all possiblecombinations of 12s, 16s and the individual codon positions of the protein coding cytb and ND1genes under the Bayesian Information Criterion using PartitionFinder v1.1.1 [57] with the greedysearch algorithm and linked branch lengths. Only the GTR + G substitution model was considered.Five hundred rapid maximum likelihood bootstrap replicates were carried out using the GTR + CATsubstitution model for each partition, which approximates the GTR + G substitution model, with afinal maximum likelihood search for the best scoring tree (-f a option).
To further compare ancient giant panda and previously analyzed extant giant panda haplotypes,we aligned our newly obtained D-loop sequences against the 655 bp D-loop data set from previousstudies [13,30]. We used this alignment to reconstruct a median-joining network and thus to investigatethe phylogeographical relationship among haplotypes based on maximum-parsimony as implementedin NETWORK v4.6.1.0 [58].
2.6. Demographic Inference
Changes in female effective population size over the timespan of the mitochondrial phylogenywere inferred by Bayesian skyline plot analysis [59] in BEAST 1.8.2 [60]. The skyline plot wastime-calibrated using the calibrated radiocarbon dates of the two ancient sequences and by applyingan informative prior on the per-lineage substitution rate.
The substitution rate for the panda lineage averaged across the 12s, 16s, cytb and ND1 genesequences was estimated by aligning sequences from seven living and two extinct representatives ofthe Ursidae to the sequence of a modern giant panda and computing a time-calibrated phylogeny. Fournode calibration priors based on fossils and other evidence were applied, following the approach usedin a recent investigation of the Ursidae [61]. The monophyly of each descendent clade was enforcedfor the analysis. These node calibrations comprised (see [61] and references therein):
1. A uniform prior on the basal divergence of the Ursidae with an upper limit of 12 million years,representing the age of a well-documented fossil representative of the Ailuropodinae, and a lowerlimit of 20 million years based on a previous molecular dating study.
2. A uniform prior on the divergence of the Tremarctinae and Ursinae clades of 7 to 14 million years,based on the fossil Tremarctine bear Plionarctos.
3. A uniform prior on the basal divergence of the Ursinae of 4.3 to 6 million years, based on reportedages of Ursus minimus.
4. A uniform prior on the divergence of brown and polar bears of 0.48 to 1.1 million years, based onprevious studies. This prior was applied to the common ancestor of a polar bear and a Finnishbrown bear, likely representing the initial divergence of these respective species, rather than morerecent gene flow events.
Optimal partitions and substitution models were selected as described for the maximumlikelihood phylogenetic analysis, considering all substitution models available in BEAUti v.1.8.2(part of the BEAST v1.8.2 distribution [60]). A lognormal relaxed-clock model was utilized, with anuninformative uniform prior on the mean substitution rate of 0 to 100 percent per million years, bothrepresenting implausibly extreme values. The default exponential prior was retained for the ucld.stdevparameter. A speciation birth-death process was used for the tree prior. The Markov Chain MonteCarlo (MCMC) ran for sufficient length to achieve convergence and adequate sampling (ESS > 200)of all parameters as determined using the program Tracer v1.6 [62]. The posterior sample of the

Genes 2018, 9, 198 6 of 16
lineage-specific substitution rate for the Ailuropoda lineage was extracted from the posterior sample oftrees using TreeStat v1.8.2 and assessed in Tracer.
Demographic analysis of the 54 sampled giant panda sequences was carried out using a piecewiseconstant coalescent Bayesian Skyline model with 10 groups. The giant panda D-loop sequences wereincluded in this analysis as they could be aligned unambiguously and substantial saturation is unlikelyat the population level. As we failed to recover several sections of the D-loop from the ancient samples,all homologous positions of the D-loop alignment containing missing data were removed. To facilitatethe application of the substitution rate for the Ailuropoda lineage estimated by the calibrated Ursidaeanalysis, optimal substitution models were selected for the partitions selected for that analysis withthe addition of the D-loop as a separate partition. A single relaxed-clock model was then used forthe 12s, 16s, cytb and ND1 partitions, with a normal prior applied to the per lineage substitutionrate approximating the posterior estimate generated by the calibrated Ursidae analysis. A separate,unlinked relaxed-clock model was specified for the D-loop, with the substitution rate estimated withinan uninformative, uniform prior between 0 and 2 × 10⁻⁷ substitutions per site per year. Defaultexponential priors were used for the ucld.stdev parameters of both relaxed-clock models. The MCMCchain was run as described previously, and the maximum clade credibility tree was extracted andannotated with relevant summary statistics using TreeAnnotator, with node heights scaled to themedian of the posterior sample. The Bayesian skyline reconstruction was generated in Tracer.
3. Results
3.1. Sequence Data Recovery
We amplified 67 overlapping fragments (size range was 53–159 bp excluding primers) from thetwo Holocene samples. The fragments were used to build the complete cytb (1140 bp) and 12s rRNA(966 bp) genes, partial 16s rRNA (1126 bp for 05001, 1103 bp for 97001), and partial ND1 (905 bp for05001, 923 bp for 97001) genes, and D-loop sequences (1052 bp for both specimens) (Figure S1 andTable S2). Identical sequences were obtained when experiments were independently replicated at theState Key Laboratory for Biogeology and Environmental Geology at China University of Geosciences(Wuhan) and the Australian Centre for Ancient DNA at the University of Adelaide, Australia.
3.2. Diversity Comparisons
Average pairwise substitutions for brown bear haplotypes were highly variable and includedby far the highest diversity values observed for any group. Late Pleistocene European cave bears,despite covering several tens of thousands of years, showed less variance in mean substitutions acrossreplicates, with values falling within those observed for brown bears. Polar bear haplotypes werehighly similar with little apparent variation introduced by sampling. Diversity estimates for giantpanda haplotypes were generally lower than observed for brown bears, always lower than observedfor Late Pleistocene European cave bears, but always higher than observed for polar bears (Figure 2and Figure S3).
3.3. Phylogenetic and Network Analysis
A total number of 71 variable nucleotide positions (Figure S2), corresponding to 20 haplotypes(Table S3), were identified in the 54 giant panda data set that included 12s, 16s, cytb, and ND1 sequences.The optimal data partitions selected by PartitionFinder are shown in Supplementary Tables S4 andS5. Maximum likelihood analysis placed the Ailuropoda mitochondrial lineage as sister to all othersampled ursid lineages with strong bootstrap support (100% of replicates, Figure 3). The ancientindividual 97001 is sister to the clade containing all modern panda haplotypes and the second ancientindividual, sample 05001. Although this relationship received strong bootstrap support (83% ofreplicates), relationships within the latter clade were largely unresolved by this analysis (occurring in<70% of bootstrap replicates for many clades).

Genes 2018, 9, 198 7 of 16
Figure 2. Genetic diversity distribution of four ursid species or species groups. Boxplots summarize themean pairwise number of variable positions (Y axis) from 100 random subsamples of 10 individuals.
Figure 3. Phylogenetic relationships of the extant bear family based on mitochondrial DNA sequences.(a) Maximum likelihood phylogenetic tree inferred from four aligned bear mitochondrial genes.The giant panda clade is expanded while other clades are collapsed. Red branches in the giantpanda clade indicate the two ancient panda individuals. Bootstrap proportions for major clades areindicated (b) Time-calibrated phylogeny of giant panda clade, based on the same four genes plus themitochondrial control region, using the same color codes as in Figure 1. Double color-filled circlesnext to individual names indicate haplotypes recovered from different populations. Question marksindicate individuals for which geographic information is not available. The lower scale shows yearsbefore present. Branch labels indicate posterior clade probabilities, except for some terminal tips wherelabels have been removed for simplicity. Nodes are centered on median estimated coalescence timesfrom the posterior sample, with bars indicating the 95% credibility interval.
A network analysis of the two Holocene giant panda D-loop sequences with 40 homologouspublished extant panda sequences (from 169 individuals, 655 bp) retrieved a network profile of

Genes 2018, 9, 198 8 of 16
42 haplotypes (GH 1–42, Figure 4, Table S2), with the two Holocene samples forming two newdifferent haplotypes GH41 (05001, GenBank accession #KF386262) and GH42 (97001, GenBankaccession #KF386263). A total number of 18 variable sites in the Holocene giant pandas have beenidentified among the 655 bp data set (Table S6). Two out of 18 variable sites in GH42 were unique,while 18 variable sites in GH41 and 16 out of 18 variable sites in GH42 were shared with those ofmodern giant pandas. The rest of the network shows the same configuration as previous studies,with haplotypes GH32 and GH33 as the central sequences in the two-star like network profiles [13,30].High haplotype (Hd = 0.9572 ± 0.0171) but relatively low nucleotide diversity (π = 0.0054 ± 0.0003)mark the mitochondrial DNA diversity of the giant panda.
Figure 4. Median-joining network of the 655 bp mitochondrial DNA control region haplotypes basedon the combined data of the Holocene sub-fossil giant pandas and extant populations presented byHu et al. [30]. Different color codes represent different populations in terms of mountain ranges. Circlesare sized relative to haplotype frequency. Tick marks along lines indicate the number of nucleotidesubstitutions between haplotypes. The definition of the haplotype names follows Hu et al.
3.4. Demographic Analysis
Partitions and substitution models used in the BEAST analyses are shown in SupplementaryTables S4 and S5. The calibrated Ursidae analysis returned a unimodal skewed approximatelynormal posterior distribution for the lineage specific Ailuropoda substitution rate averaged acrossthe 12s, 16s, cytb and ND1 genes, with a median value of 3.3954 × 10⁻⁸ substitutions/site/year.Based on this result we applied a normal prior on the per lineage substitution with a mean value of3.3954 × 10−8 substitutions/site/year and standard deviation of 7.705 × 10⁻⁹ substitutions/site/yearto the corresponding partitions in order to calibrate the Bayesian skyline analysis.
Congruent with the maximum likelihood analysis, the maximum clade credibility tree generatedby Bayesian skyline analysis returned the sequence of the ancient sample 97001 as sister to all other

Genes 2018, 9, 198 9 of 16
sampled panda haplotypes with a posterior clade probability 0.72 (Figure 3). Many relationshipswithin the giant panda clade were better resolved (posterior clade probabilities >0.95) than in themaximum likelihood analysis. This included the position of the ancient sample 05001, placed withinthe diversity of modern lineages as sister to a clade comprised of three haplotypes sampled in ShaanxiProvince (posterior clade probability 0.99).
The applied tip and substitution-rate calibrations returned a median coalescence time for allsampled haplotypes of ~62,000 years (95% credibility interval ~23,000 to ~131,000 years). The medianestimated coalescence time for sampled modern haplotypes is ~39,000 years (95% confidence interval21,000 to 73,000 years). The Bayesian skyline reconstruction showed a decline in female effectivepopulation size around 6000 years ago, followed by population recovery during the last 2000 years(Figure 5).
Figure 5. Bayesian skyline demographic reconstruction of female effective population size (Ne, y axis,note log scale) through time (x axis), assuming a generation time of 12 years [26]. Black line indicatesmedian female Ne, and the shaded blue area indicates the 95% credibility interval.
4. Discussion
4.1. Genetic Diversity and Demographic History of Giant Pandas
Large-scale environmental alteration due to influences such as climate change or human activitieshas caused many formerly widespread species to survive in small fractions of their original range.These range contractions have often been accompanied by a loss of intraspecific genetic diversitydue to the reduction of effective population size and the extinction of regional genetic lineages [63].Giant pandas are now restricted to fragmented habitats in Sichuan, Gansu, and Shaanxi Provinces [8].However, previous studies have suggested that the two largest populations of giant panda, the Minshanand Qionglai populations, as well as a smaller Liangshan population, nevertheless have retainedrelatively high levels of genetic diversity despite a trend of recent population decline [13,30].These previous studies also showed that the haplotypes of the Minshan, Qionglai, and Liangshanpopulations are distributed broadly while the Xiangling and Qinling populations are more localized.
The mid-Holocene giant panda analysed in this study represent two new haplotypes in thenetwork profile based on a 655 bp D-loop dataset (Figure 4). While one haplotype is, in phylogenetic

Genes 2018, 9, 198 10 of 16
reconstructions, nested within the genetic diversity of modern panda haplotypes, the other haplotypeis sister to all other sequenced pandas (Figure 3). The probability that the deepest divergence in apanmictic population has been sampled can be estimated as (n − 1)/(n + 1), where n represents thenumber of individuals [64]. For 52 modern individuals, this probability is 0.96, meaning that, underthe assumption that the fossil giant panda belongs to the modern population, it is highly unlikelythat a sequence such as the one from sample No. 97001 in our analysis can be retrieved. Moreover,the sequence from this sample is quite divergent from all other sequences included in this study. Whenexcluding individual No. 97001, we find the number of polymorphic positions in the combined dataset (includes 12s, 16s, cytb, and ND1 fragments (4054 bp)) to be 36. However, this increases to 71when individual No. 97001 is also included. The giant panda probably disappeared from YunnanProvince approximately 5000 years ago as the dates of our samples represent the latest record of itsappearance in this area. The extinction of this population appears to have resulted in a loss of distinctmitochondrial lineages as seen in other species [21,33]. A loss or turnover of mitochondrial haplotypesover time has been observed in several carnivore species. For example, in North America, the northernbrown bear population, representing a separate haplogroup, disappeared before 35 ka B.P. and wasreplaced after 21 ka B.P. by one of the modern haplogroups [65]. A more immediate replacementwas observed for cave bears in southern Germany (in the Ach valley), where the original haplogroupoverlapped temporally with the incoming haplogroup that eventually replaced the initial one around30,000 years ago [66,67]. In contrast to the Holocene loss of the divergent haplotype in the giantpanda, both of these replacements took place during the Pleistocene. This is also true for the loss ofhaplogroup 2 in North American wolves at the end of the Pleistocene [68]. However, further analysesshowed that in Eurasia, haplogroup 1 continued to displace haplogroup 2 during the Holocene [69],but without a concomitant loss of geographical distribution. The example most similar to our resultsfrom the giant panda—a loss of a divergent haplotype or group co-occuring with the disappearanceof a local population—stems from European brown bears. This was found in brown bears fromsouthern France, where three distinct and related haplotypes disappeared with the loss of the southernFrance brown bear population between 1570 to 6525 years B.P. [70,71]. However, in contrast to ourfindings from the giant panda, these haplotypes did not represent the deepest diverging lineageswithin the mitochondrial DNA tree. Thus, even though the giant panda is a successful species highlyadapted to its specialized diet via morphological, ecological, and genetic adaptations [32], one shouldkeep in mind that the local extinction in geographic locations such as Yunnan Province may not onlyhave led to a reduction of overall population size but also to a vanishing of distinct and divergentmitochondrial clades.
However, despite the deep divergence of one of the fossil individuals and although neither ofthe two ancient haplotypes have been found in modern giant panda populations, the high haplotypediversity observed suggests that the range losses for giant pandas, such as the local extinction at thesampling site in this study, and recent reduction in wild population size have not resulted in geneticimpoverishment during the past 8000 years. Historical distribution data show that as recent as thesixteenth to nineteenth centuries, giant pandas were still widely distributed in south-western China,including Hunan, Hubei, Sichuan, Shaanxi, and Gansu Provinces [6,72]. This historical habitat statusindicates that the range contractions and decrease in population size may have been too recent to showmarked genetic impacts. Therefore, the giant panda appears to be an example of a species showingtemporal lag between a pronounced reduction in population size and the genetic impacts of thatreduction in terms of mitochondrial DNA diversity.
4.2. Impacts of Human Activities and Climate Change
Although modern giant panda populations display moderate genetic diversity, a previous studysuggested that the giant panda population experienced two recent bottlenecks at ~0.2 million years and~20,000 years ago, respectively [24]. However, the more recent panda demographic history youngerthan 20,000 years could not be evaluated by the pairwise sequentially Markovian coalescent (PSMC)
Genes 2018, 9, 198 11 of 16
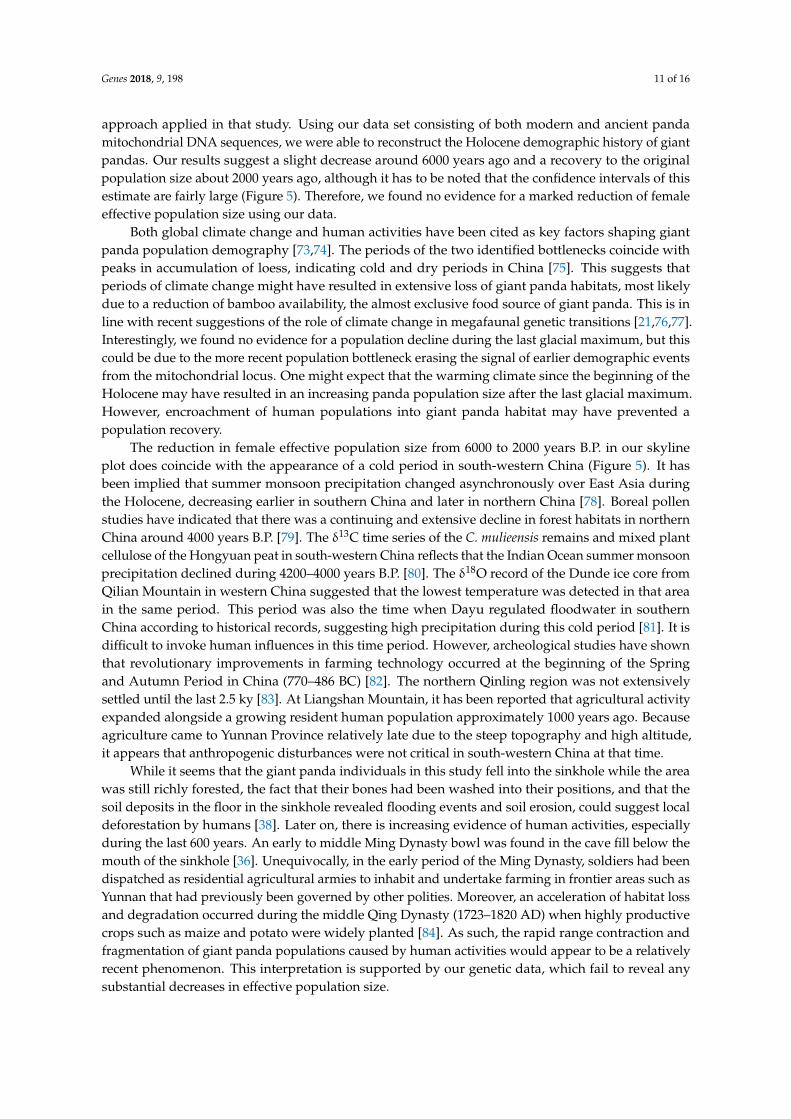
approach applied in that study. Using our data set consisting of both modern and ancient pandamitochondrial DNA sequences, we were able to reconstruct the Holocene demographic history of giantpandas. Our results suggest a slight decrease around 6000 years ago and a recovery to the originalpopulation size about 2000 years ago, although it has to be noted that the confidence intervals of thisestimate are fairly large (Figure 5). Therefore, we found no evidence for a marked reduction of femaleeffective population size using our data.
Both global climate change and human activities have been cited as key factors shaping giantpanda population demography [73,74]. The periods of the two identified bottlenecks coincide withpeaks in accumulation of loess, indicating cold and dry periods in China [75]. This suggests thatperiods of climate change might have resulted in extensive loss of giant panda habitats, most likelydue to a reduction of bamboo availability, the almost exclusive food source of giant panda. This is inline with recent suggestions of the role of climate change in megafaunal genetic transitions [21,76,77].Interestingly, we found no evidence for a population decline during the last glacial maximum, but thiscould be due to the more recent population bottleneck erasing the signal of earlier demographic eventsfrom the mitochondrial locus. One might expect that the warming climate since the beginning of theHolocene may have resulted in an increasing panda population size after the last glacial maximum.However, encroachment of human populations into giant panda habitat may have prevented apopulation recovery.
The reduction in female effective population size from 6000 to 2000 years B.P. in our skylineplot does coincide with the appearance of a cold period in south-western China (Figure 5). It hasbeen implied that summer monsoon precipitation changed asynchronously over East Asia duringthe Holocene, decreasing earlier in southern China and later in northern China [78]. Boreal pollenstudies have indicated that there was a continuing and extensive decline in forest habitats in northernChina around 4000 years B.P. [79]. The δ13C time series of the C. mulieensis remains and mixed plantcellulose of the Hongyuan peat in south-western China reflects that the Indian Ocean summer monsoonprecipitation declined during 4200–4000 years B.P. [80]. The δ18O record of the Dunde ice core fromQilian Mountain in western China suggested that the lowest temperature was detected in that areain the same period. This period was also the time when Dayu regulated floodwater in southernChina according to historical records, suggesting high precipitation during this cold period [81]. It isdifficult to invoke human influences in this time period. However, archeological studies have shownthat revolutionary improvements in farming technology occurred at the beginning of the Springand Autumn Period in China (770–486 BC) [82]. The northern Qinling region was not extensivelysettled until the last 2.5 ky [83]. At Liangshan Mountain, it has been reported that agricultural activityexpanded alongside a growing resident human population approximately 1000 years ago. Becauseagriculture came to Yunnan Province relatively late due to the steep topography and high altitude,it appears that anthropogenic disturbances were not critical in south-western China at that time.
While it seems that the giant panda individuals in this study fell into the sinkhole while the areawas still richly forested, the fact that their bones had been washed into their positions, and that thesoil deposits in the floor in the sinkhole revealed flooding events and soil erosion, could suggest localdeforestation by humans [38]. Later on, there is increasing evidence of human activities, especiallyduring the last 600 years. An early to middle Ming Dynasty bowl was found in the cave fill below themouth of the sinkhole [36]. Unequivocally, in the early period of the Ming Dynasty, soldiers had beendispatched as residential agricultural armies to inhabit and undertake farming in frontier areas such asYunnan that had previously been governed by other polities. Moreover, an acceleration of habitat lossand degradation occurred during the middle Qing Dynasty (1723–1820 AD) when highly productivecrops such as maize and potato were widely planted [84]. As such, the rapid range contraction andfragmentation of giant panda populations caused by human activities would appear to be a relativelyrecent phenomenon. This interpretation is supported by our genetic data, which fail to reveal anysubstantial decreases in effective population size.
Genes 2018, 9, 198 12 of 16
The mitochondrial sequence data set used here has already provided clues with regard topopulation size and genetic diversity through time. Larger sequence datasets, such as the wholegenome sequencing of Holocene giant panda individuals, will likely allow further identification of theextent of genetic diversity loss and hopefully reveal key factors involved in the contraction of giantpanda population and range sizes.
Supplementary Materials: The following are available online at http://www.mdpi.com/2073-4425/9/4/198/s1,Figure S1: Schematic view of the complete or partial mitochondrial genes for the Holocene giant panda specimensusing overlapping PCR fragments. Figure S2: Variable nucleotide positions in the 4054 bp data set of 12s, 16s,cytb, and ND1 fragments from 54 giant panda individuals. Figure S3: Genetic diversity distribution of thefour subsampled species when random subsampling and pairwise identity computation have been performed10, 100, and 1000 times, respectively. Table S1: PCR primers for giant panda mitochondrial genes. Table S2:Sequence information used in this study. Table S3: Haplotypes identification of 54 giant panda individuals usedfor phylogenetic analyses in Figure 3. Table S4: Optimal data partitions and substitution models selected bypartitionfinder for the BEAST analyses. Table S5: Optimal data partitions selected by partitionfinder for maximumlikelihood phylogenetic analysis. Table S6: Variable sites in the aligned 655 bp D-loop data set.
Acknowledgments: This research was financially supported by the National Natural Science Foundation ofChina (Nos. 41672017; 40972013; 41202013), the Priority Academic Program Development of Jiangsu HigherEducation Institutions, and the US National Science Foundation (DEB-0103795). We thank the “PPP” projectjointly funded by CSC and DAAD (No. 2016-2041). We appreciate Dr. Stefanie Hartmann at University of Potsdamfor assistance with the subsampling on comparing the genetic diversity. We thank Dr. Jeremy Austin at ACADfor his help with DNA sequencing replication. We are grateful for the comments of Shu-Cheng Xie at BGEG,which significantly helped to improve the manuscript. Zheng Li and Zhi-Cai Li helped to collect samples from thenatural sinkhole. Sincere thanks go to the two reviewers who kindly provided valuable comments to improvethe analysis. The funders had no role in research design, data collection and analyses, decision to publish orpreparation of the manuscript.
Author Contributions: X.L. conceived and designed the study; X.-D.H., G.-L.S., and J.-X.Y. performed theexperiments; G.-L.S., A.B., X.-D.H., and B.-J.Z. analyzed the data; X.-P.J. and N.G.J. designed and lead fieldsurveying and undertook specimen identification; X.-P.J., N.G.J., H.L., L.J.F., L.-R.W. contributed specimencollection; M.V.W. helped in bioinformatics analyses; G.-L.S., A.B., A.C., N.B., M.H., and X.-L.L. wrote the paper.All authors read and gave comments to the final version of the manuscript.
Conflicts of Interest: The authors declare no conflict of interest.
References
1. Wang, J. On the taxonomic status of species, geological distribution and evolutionary history of Ailuropoda.Acta Zool. Sin. 1974, 20, 191–201.
2. Qiu, Z.; Qi, G. Ailuropod found from the late miocene deposits in Lufeng, Yunnan. Vertebr. Palasiat. 1989, 27,153–169.
3. Pei, W. A brief history of the development of giant panda. Acta Zool. Sin. 1974, 20, 188–190.4. Jin, C.; Ciochon, R.L.; Dong, W.; Hunt, R.M., Jr.; Liu, J.; Jaeger, M.; Zhu, Q. The first skull of the earliest giant
panda. Proc. Natl. Acad. Sci. USA 2007, 104, 10932–10937. [CrossRef] [PubMed]5. Zhu, J.; Long, Z. The vicissitudes of the giant panda. Acta Zool. Sin. 1983, 29, 93–104.6. Wen, H.; He, Y. The distribution of giant panda in Henan, Hubei, Hunan and Sichuan in last five thousands
years. J. Southwest Teach. Coll. 1981, 1, 87–93.7. Li, T.; Lai, X.; Wang, W.; Zhou, X. Taxonomy and evolution of giant panda. Geol. Sci. Technol. Inf. 2004, 23,
40–46.8. Hu, J.C. Research on the Giant Panda; Shanghai Science and Technology Publishing House: Shanghai, China,
2001.9. Guo, J. Wildlife conservation. Giant panda numbers are surging—Or are they? Science 2007, 316, 974–975.
[CrossRef] [PubMed]10. Lu, Z.; Johnson, W.E.; Menotti-Raymond, M.; Yuhki, N.; Martenson, J.S.; Mainka, S.; Shi-Qiang, H.; Zhihe, Z.;
Li, G.; Pan, W.; et al. Patterns of genetic diversity in remaining giant panda populations. Conserv. Biol. 2001,15, 1596–1607. [CrossRef]
11. Zhan, X.; Li, M.; Zhang, Z.; Goossens, B.; Chen, Y.; Wang, H.; Bruford, M.W.; Wei, F. Molecular censusingdoubles giant panda population estimate in a key nature reserve. Curr. Biol. 2006, 16, R451–R452. [CrossRef][PubMed]
Genes 2018, 9, 198 13 of 16
12. Zhan, X.J.; Zhang, Z.J.; Wu, H.; Goossens, B.; Li, M.; Jiang, S.W.; Bruford, M.W.; Wei, F.W. Molecular analysisof dispersal in giant pandas. Mol. Ecol. 2007, 16, 3792–3800. [CrossRef] [PubMed]
13. Zhang, B.; Li, M.; Zhang, Z.; Goossens, B.; Zhu, L.; Zhang, S.; Hu, J.; Bruford, M.W.; Wei, F. Genetic viabilityand population history of the giant panda, putting an end to the “evolutionary dead end”? Mol. Biol. Evolut.2007, 24, 1801–1810. [CrossRef] [PubMed]
14. Li, R.; Fan, W.; Tian, G.; Zhu, H.; He, L.; Cai, J.; Huang, Q.; Cai, Q.; Li, B.; Bai, Y.; et al. The sequence and denovo assembly of the giant panda genome. Nature 2010, 463, 311–317. [CrossRef] [PubMed]
15. Hu, Y.; Wu, Q.; Ma, S.; Ma, T.; Shan, L.; Wang, X.; Nie, Y.; Ning, Z.; Yan, L.; Xiu, Y.; et al. Comparativegenomics reveals convergent evolution between the bamboo-eating giant and red pandas. Proc. Natl. Acad.Sci. USA 2017, 114, 1081–1086. [CrossRef] [PubMed]
16. Han, H.; Wei, W.; Nie, Y.; Zhou, W.; Hu, Y.; Wu, Q.; Wei, F. Distinctive diet-tissue isotopic discriminationfactors derived from the exclusive bamboo-eating giant panda. Integr. Zool. 2016, 11, 447–456. [CrossRef][PubMed]
17. Hoffmann, A.A.; Sgro, C.M. Climate change and evolutionary adaptation. Nature 2011, 470, 479–485.[CrossRef] [PubMed]
18. Koch, P.L.; Barnosky, A.D. Late quaternary extinctions: State of the debate. Ann. Rev. Ecol. Evolut. Syst. 2006,37, 215–250. [CrossRef]
19. Stuart, A.J.; Kosintsev, P.A.; Higham, T.F.; Lister, A.M. Pleistocene to holocene extinction dynamics in giantdeer and woolly mammoth. Nature 2004, 431, 684–689. [CrossRef] [PubMed]
20. Alroy, J. A multispecies overkill simulation of the end-pleistocene megafaunal mass extinction. Science 2001,292, 1893–1896. [CrossRef] [PubMed]
21. Metcalf, J.L.; Turney, C.; Barnett, R.; Martin, F.; Bray, S.C.; Vilstrup, J.T.; Orlando, L.; Salas-Gismondi, R.;Loponte, D.; Medina, M.; et al. Synergistic roles of climate warming and human occupation in patagonianmegafaunal extinctions during the last deglaciation. Sci. Adv. 2016, 2, e1501682. [CrossRef] [PubMed]
22. Johnson, C.N.; Alroy, J.; Beeton, N.J.; Bird, M.I.; Brook, B.W.; Cooper, A.; Gillespie, R.; Herrando-Perez, S.;Jacobs, Z.; Miller, G.H.; et al. What caused extinction of the pleistocene megafauna of sahul? Proc. Biol. Sci.Royal. Soc. 2016, 283, 20152399. [CrossRef] [PubMed]
23. Swaisgood, R.; Wang, D.; Wei, F. Ailuropoda melanoleuca, giant panda. In IUCN Red List of Threatened Species;International Union for Conservation of Nature and Natural Resources: Gland, Switzerland, 2016.
24. Xu, W.; Vina, A.; Kong, L.; Pimm, S.L.; Zhang, J.; Yang, W.; Xiao, Y.; Zhang, L.; Chen, X.; Liu, J.; et al.Reassessing the conservation status of the giant panda using remote sensing. Nat. Ecol. Evol. 2017, 1, 1635.[CrossRef] [PubMed]
25. Wang, F.; McShea, W.J.; Wang, D.; Li, S.; Zhao, Q.; Wang, H.; Lu, Z. Evaluating landscape options for corridorrestoration between giant panda reserves. PLoS ONE 2014, 9, e105086. [CrossRef] [PubMed]
26. Zhao, S.; Zheng, P.; Dong, S.; Zhan, X.; Wu, Q.; Guo, X.; Hu, Y.; He, W.; Zhang, S.; Fan, W.; et al.Whole-genome sequencing of giant pandas provides insights into demographic history and local adaptation.Nat. Genet. 2013, 45, 67–71. [CrossRef] [PubMed]
27. Su, B.; Shi, L.; He, G.; Zhang, A.; Song, Y.; Zhong, S.; Fei, L. Genetic diversity in the giant panda: Evidencefrom protein electrophoresis. Chin. Sci. Bull. 1994, 39, 742–745.
28. Zhang, Y.; Ryder, O.A.; Fan, Z.; Zhang, H.; He, T.; He, G.; Zhang, A.; Fei, L.; Zhong, S.; Chen, H.; et al.Sequence variation and genetic diversity in the giant panda. Sci. China Ser. C Life Sci. 1997, 40, 210–216.[CrossRef] [PubMed]
29. Fang, S.; Feng, W.; Zhang, A.; Li, S.; Yu, J.; Huang, X.; He, G.; Fei, L. The comparative analysis on the geneticdiversity of giant pandas between Liangshan and Xiaoxiangling Mountains. Acta Theriol. Sin. 1997, 17,248–252.
30. Hu, Y.; Qi, D.; Wang, H.; Wei, F. Genetic evidence of recent population contraction in the southernmostpopulation of giant pandas. Genetica 2010, 138, 1297–1306. [CrossRef] [PubMed]
31. Wei, F.; Hu, Y.; Yan, L.; Nie, Y.; Wu, Q.; Zhang, Z. Giant pandas are not an evolutionary cul-de-sac: Evidencefrom multidisciplinary research. Mol. Biol. Evolut. 2015, 32, 4–12. [CrossRef] [PubMed]
32. Basler, N.; Xenikoudakis, G.; Westbury, M.V.; Song, L.; Sheng, G.; Barlow, A. Reduction of the contaminantfraction of DNA obtained from an ancient giant panda bone. BMC Res. Notes 2017, 10, 754. [CrossRef][PubMed]

Genes 2018, 9, 198 14 of 16
33. Hofreiter, M. Long DNA sequences and large data sets: Investigating the quaternary via ancient DNA.Quat. Sci. Rev. 2008, 27, 2586–2592. [CrossRef]
34. Ji, X.; Jablonski, N.G.; Liu, H.; Lawrence, J.F.; Li, Z.; Li, Z.; Liu, J. The discovery of the holocene giantpanda skeletons from a sinkhole of Jiangdongshan, Tengchong, Yunnan province and its significances.In Proceedings of the Eleventh Annual Meeting of the Chinese Society of Vertebrate Paleontology;Dong, W., Ed.; China Ocean Press: Beijing, China, 2008; pp. 119–125.
35. Jin, J.J.H.; Jablonski, N.G.; Flynn, L.J.; Chaplin, G.; Xueping, J.; Zhicai, L.; Xiaoxue, S.; Guihua, L.Micromammals from an early holocene archaeological site in Southwest China: Paleoenvironmental andtaphonomic perspectives. Quat. Int. 2012, 281, 58–65. [CrossRef]
36. Jablonski, N.G.; Ji, X.; Chaplin, G.; Wang, L.; Yang, S.; Li, G.; Li, Z. A preliminary report on new andpreviously known vertebrate paleontological sites in baoshan prefecture, Yunnan province, China. Proc. Calif.Acad. Sci. 2003, 54, 209–224.
37. Jablonski, N.G.; Ji, X.; Liu, H.; Li, Z.; Flynn, L.J.; Li, Z. Remains of holocene giant pandas from jiangdongmountain (Yunnan, China) and their relevance to the evolution of quaternary environments in south-WesternChina. Hist. Biol. 2012, 24, 527–536. [CrossRef]
38. Rohland, N.; Hofreiter, M. Ancient DNA extraction from bones and teeth. Nat. Protoc. 2007, 2, 1756–1762.[CrossRef] [PubMed]
39. Peng, R.; Zeng, B.; Meng, X.; Yue, B.; Zhang, Z.; Zou, F. The complete mitochondrial genome and phylogeneticanalysis of the giant panda (Ailuropoda melanoleuca). Gene 2007, 397, 76–83. [CrossRef] [PubMed]
40. Römpler, H.; Dear, P.H.; Krause, J.; Meyer, M.; Rohland, N.; Schoneberg, T.; Spriggs, H.; Stiller, M.;Hofreiter, M. Multiplex amplification of ancient DNA. Nat. Protoc. 2006, 1, 720–728. [CrossRef] [PubMed]
41. Hofreiter, M.; Jaenicke, V.; Serre, D.; von Haeseler, A.; Paabo, S. DNA sequences from multiple amplificationsreveal artifacts induced by cytosine deamination in ancient DNA. Nucleic Acids Res. 2001, 29, 4793–4799.[CrossRef] [PubMed]
42. Martin, M. Cutadapt removes adapter sequences from high-throughput sequencing reads. EMBnet J. 2011,17, 10. [CrossRef]
43. Magoc, T.; Salzberg, S.L. Flash: Fast length adjustment of short reads to improve genome assemblies.Bioinformatics 2011, 27, 2957–2963. [CrossRef] [PubMed]
44. Li, H.; Durbin, R. Fast and accurate long-read alignment with burrows-wheeler transform. Bioinformatics2010, 26, 589–595. [CrossRef] [PubMed]
45. Li, H.; Handsaker, B.; Wysoker, A.; Fennell, T.; Ruan, J.; Homer, N.; Marth, G.; Abecasis, G.; Durbin, R.;Genome Project Data Processing Subgroup. The sequence alignment/map format and samtools.Bioinformatics 2009, 25, 2078–2079. [CrossRef] [PubMed]
46. Wang, Y.; Lu, J.; Yu, J.; Gibbs, R.A.; Yu, F. An integrative variant analysis pipeline for accurategenotype/haplotype inference in population NGS data. Genome Res. 2013, 23, 833–842. [CrossRef] [PubMed]
47. Korneliussen, T.S.; Albrechtsen, A.; Nielsen, R. Angsd: Analysis of next generation sequencing data.BMC Bioinform. 2014, 15, 356. [CrossRef] [PubMed]
48. Arnason, U.; Gullberg, A.; Janke, A.; Kullberg, M. Mitogenomic analyses of caniform relationships.Mol. Phylogenet. Evolut. 2007, 45, 863–874. [CrossRef] [PubMed]
49. Krause, J.; Unger, T.; Nocon, A.; Malaspinas, A.S.; Kolokotronis, S.O.; Stiller, M.; Soibelzon, L.; Spriggs, H.;Dear, P.H.; Briggs, A.W.; et al. Mitochondrial genomes reveal an explosive radiation of extinct and extantbears near the miocene-pliocene boundary. BMC Evolut. Biol. 2008, 8, 220. [CrossRef] [PubMed]
50. Thompson, J.D.; Gilbson, T.J.; Plewnlak, F.; Jeanmougin, F.; Higgins, D.G. The clustal_x windows interface:Flexible strategies for multiple sequence alignment aided by quality analysis tools. Nucleic Acids Res. 1997,25, 4876–4882. [CrossRef] [PubMed]
51. Rozas, J.; Ferrer-Mata, A.; Sánchez-DelBarrio, J.C.; Guirao-Rico, S.; Librado, P.; Ramos-Onsins, S.E.;Sánchez-Gracia, A. DnaSP 6: DNA sequence polymorphism analysis of large data sets. Mol. Biol. Evolut.2017, 34, 3299–3302. [CrossRef] [PubMed]
52. Fortes, G.G.; Grandal-d’Anglade, A.; Kolbe, B.; Fernandes, D.; Meleg, I.N.; Garcia-Vazquez, A.;Pinto-Llona, A.C.; Constantin, S.; de Torres, T.J.; Ortiz, J.E.; et al. Ancient DNA reveals differences inbehaviour and sociality between brown bears and extinct cave bears. Mol. Ecol. 2016, 25, 4907–4918.[CrossRef] [PubMed]

Genes 2018, 9, 198 15 of 16
53. Stiller, M.; Baryshnikov, G.; Bocherens, H.; Grandal d’Anglade, A.; Hilpert, B.; Munzel, S.C.; Pinhasi, R.;Rabeder, G.; Rosendahl, W.; Trinkaus, E.; et al. Withering away—25,000 years of genetic decline precededcave bear extinction. Mol. Biol. Evolut. 2010, 27, 975–978. [CrossRef] [PubMed]
54. Cahill, J.A.; Stirling, I.; Kistler, L.; Salamzade, R.; Ersmark, E.; Fulton, T.L.; Stiller, M.; Green, R.E.; Shapiro, B.Genomic evidence of geographically widespread effect of gene flow from polar bears into brown bears.Mol. Ecol. 2015, 24, 1205–1217. [CrossRef] [PubMed]
55. Stamatakis, A.; Hoover, P.; Rougemont, J. A rapid bootstrap algorithm for the raxml web servers. Syst. Biol.2008, 57, 758–771. [CrossRef] [PubMed]
56. Miller, M.A.; Pfeiffer, W.; Schwartz, T. Creating the cipres science gateway for inference of large phylogenetictrees. In Proceedings of the 2010 Gateway Computing Environments Workshop (GCE), New Orleans, LA,USA, 14 November 2010; pp. 1–8.
57. Lanfear, R.; Calcott, B.; Ho, S.Y.W.; Guindon, S. Partitionfinder: Combined selection of partitioning schemesand substitution models for phylogenetic analyses. Mol. Biol. Evolut. 2012, 29, 1695–1701. [CrossRef][PubMed]
58. Bandelt, H.-J.; Forster, P.; Rohl, A. Median-joining network for inferring intraspecific phylogenies.Mol. Biol. Evolut. 1999, 16, 37–48. [CrossRef] [PubMed]
59. Drummond, A.J.; Rambaut, A.; Shapiro, B.; Pybus, O.G. Bayesian coalescent inference of past populationdynamics from molecular sequences. Mol. Biol. Evolut. 2005, 22, 1185–1192. [CrossRef] [PubMed]
60. Drummond, A.J.; Suchard, M.A.; Xie, D.; Rambaut, A. Bayesian phylogenetics with beauti and the beast 1.7.Mol. Biol. Evolut. 2012, 29, 1969–1973. [CrossRef] [PubMed]
61. Kumar, V.; Lammers, F.; Bidon, T.; Pfenninger, M.; Kolter, L.; Nilsson, M.; Janke, A. The evolutionary historyof bears is characterized by gene flow across species. Sci. Rep. 2017, 7, 46487. [CrossRef] [PubMed]
62. Rambaut, A.; Suchard, M.A.; Xie, D.; Drummond, A.J. Tracer v1.6. Available online: http://tree.bio.ed.ac.uk/software/tracer/2014 (accessed on 11 December 2013).
63. Balint, M.; Malnas, K.; Nowak, C.; Geismar, J.; Vancsa, E.; Polyak, L.; Lengyel, S.; Haase, P. Species historymasks the effects of human-induced range loss—Unexpected genetic diversity in the endangered giantmayfly Palingenia longicauda. PLoS ONE 2012, 7, e31872. [CrossRef] [PubMed]
64. Saunders, I.W.; Tavaré, S.; Watterson, G.A. On the genealogy of nested subsamples from a haploid population.Adv. Appl. Probab. 1984, 16, 471–491. [CrossRef]
65. Barnes, I.; Matheus, P.; Shapiro, B.; Jensen, D.; Cooper, A. Dynamics of Pleistocene population extinction inBeringian brown bears. Science 2002, 295, 2267–2270. [CrossRef] [PubMed]
66. Hofreiter, M.; Muenzel, S.; Conard, N.J.; Pollack, J.; Slatkin, M.; Weiss, G.; Paabo, S. Sudden replacement ofcave bear mitochondrial DNA in the late Pleistocene. Curr. Biol. 2007, 17, 122–123. [CrossRef] [PubMed]
67. Münzel, S.C.; Stiller, M.; Hofreiter, M.; Mittnik, A.; Conard, N.; Bocherens, H. Pleistocene bears in theSwabian Jura (Germany): Genetic replacement, ecological displacement, extinctions and survival. Quant. Int.2011, 245, 225–237. [CrossRef]
68. Leonard, J.; Vila, C.; Fox-Dobbs, K.; Koch, P.L.; Wayne, R.K.; Valkenburgh, B.V. Megafaunal extinctions andthe disappearance of a specialized wolf ecomorph. Curr. Biol. 2007, 17, 1146–1150. [CrossRef] [PubMed]
69. Pilot, M.; Branicki, W.; Jedrzejewski, W.; Goszczynski, J.; Jedrzejewska, B.; Dykyy, I.; Shkvyrya, M.;Tsingarska, E. Phylogeographic history of grey wolves in Europe. BMC Evolut. Biol. 2010, 10, 104. [CrossRef][PubMed]
70. Valdiosera, C.E.; Garcia, N.; Anderung, C.; Dalen, L.; Cregut-Bonnoure, E.; Kahlke, R.D.; Stiller, M.;Brandstrom, M.; Thomas, M.G.; Arsuaga, J.L.; et al. Staying out in the cold: Glacial refugia and mitochondrialDNA phylogeography in ancient European brown bears. Mol. Ecol. 2007, 16, 5140–5148. [CrossRef] [PubMed]
71. Valdiosera, C.E.; Garcia-Garitagoitia, J.L.; Garcia, N.; Doadrio, I.; Thomas, M.G.; Hanni, C.; Arsuaga, J.L.;Barnes, I.; Hofreiter, M.; Orlando, L.; et al. Surprising migration and population size dynamics in ancientIberian brown bears (Ursus arctos). Proc. Natl. Acad. Sci. USA 2008, 105, 5123–5128. [CrossRef] [PubMed]
72. Zhang, W.; Tang, Z.; Qi, D.; Hu, J. Habitat assessment for giant pandas (Ailuropoda melanoleuca) on thenorthern slope of the Daxiangling Mountains. Acta Theriol. Sin. 2007, 27, 146–152.
73. Li, X.; Jiang, G.; Tian, H.; Xu, L.; Yan, C.; Wang, Z.; Wei, F.; Zhang, Z. Human impact and climate coolingcaused range contraction of large mammals in China over the past two millennia. Ecography 2015, 38, 74–82.[CrossRef]

Genes 2018, 9, 198 16 of 16
74. Turvey, S.T.; Tong, H.; Stuart, A.J.; Lister, A.M. Holocene survival of Late pleistocene megafauna in China:A critical review of the evidence. Quat. Sci. Rev. 2013, 76, 156–166. [CrossRef]
75. Sun, Y.; An, Z. Late pliocene-pleistocene changes in mass accumulation rates of eolian deposits on the centralChinese Loess plateau. J. Geophys. Res. 2005, 110, d23. [CrossRef]
76. Cooper, A.; Turney, c.; Hughen, K.A.; Brook, B.W.; Mcdonald, H.G.; Bradshaw, C.J. paleoecology. abruptwarming events drove late Pleistocene holarctic megafaunal turnover. Science 2015, 349, 602–606. [CrossRef][PubMed]
77. Rabanus-Wallace, M.T.; Wooller, M.J.; Zazula, G.D.; Shute, E.; Jahren, A.H.; Kosintsev, P.; Burns, J.A.; Breen, J.;Llamas, B.; Cooper, A. Megafaunal isotopes reveal role of increased moisture on rangeland during latePleistocene extinctions. Nat. Ecol. Evol. 2017, 1, 125. [CrossRef] [PubMed]
78. Cai, Y.; Tan, L.; Cheng, H.; An, Z.; Edwards, R.L.; Kelly, M.J.; Kong, X.; Wang, X. The variation of summermonsoon precipitation in Central China since the last deglaciation. Earth Planet. Sci. Lett. 2010, 291, 21–31.[CrossRef]
79. Ren, G.; Beug, H.-J. Mapping holocene pollen data and vegetation of China. Quat.Sci. Rev. 2002, 21,1395–1422. [CrossRef]
80. Hong, Y.T.; Hong, B.; Lin, Q.H.; Zhu, Y.X.; Shibata, Y.; Hirota, M.; Uchida, M.; Leng, X.T.; Jiang, H.B.; Xu, H.;et al. Correlation between Indian Ocean summer monsoon and North Atlantic climate during the Holocene.Earth Planet. Sci. Lett. 2003, 211, 371–380. [CrossRef]
81. Yao, T.; Thompson, L.G. Trend and features of climatic changes in the past 5000 years recorded by the Dundeicecore. Ann. Glaciol. 1992, 16, 21–24.
82. Needham, J. Science and Civilisation in China: Civil Engineering and Nautics; Cambridge University Press:Cambridge, UK, 1971; Volume 4.
83. Ren, G. Decline of the mid- to late holocene forests in china: Climatic change or human impact? J. Quat. Sci.2000, 15, 273–281. [CrossRef]
84. Zhu, S. Historic forest changes of the Liangshan Mountains in Sichuan Province. J. Chin. Hist. Geogr. 2007,22, 43–52.
© 2018 by the authors. Licensee MDPI, Basel, Switzerland. This article is an open accessarticle distributed under the terms and conditions of the Creative Commons Attribution(CC BY) license (http://creativecommons.org/licenses/by/4.0/).