Untitled - FUUAST Journal of Biology
122
-
Upload
khangminh22 -
Category
Documents
-
view
2 -
download
0
Transcript of Untitled - FUUAST Journal of Biology


Ophthalmology Update Vol. 16 No.4, Oct - Dec 2018 ii
CONTENTS
EDITORIAL
Rising Incidence of Diabetes & Hypertension, A worrying trend – Prevention through Awareness. 822
OPHTHALMIC SECTION - ORIGINAL ARTICLES
1. Frequency of Dry Eyes after Cataract Surgery
Irfan ullah Shah ----------------------------------------------------------------------------------------------------------------- 823
2. A Comparative Study of Dry Eye Syndrome in Diabetic & Non-diabetic Patients
Jahanzeb Durrani------------------------------------------------------------------------------------------------------------------826
3. Incidence of Environmental & Metabolic Factors Causing Congenital Cataract in Children of Lahore
Sana Rafaqat-------------------------------------------------------------------------------------------------------------------------832
4. Factors Responsible for Delayed Presentation of Strabismus in Patients aging up to 16 Years
Hikmatullah------------------------------------------------------------------------------------------------------------------------835
5. Effect of Anterior Sub-Capsular Polishing during a Standard Phacoemulsification on Anterior Capsular
Opacification (A randomized control study)
Inam ul Haq------------------------------------------------------------------------------------------------------------------------838
6. Comparative Evaluation of IOP with an Air-Puff Tonometer vs Goldmann Applanation Tonometer
Nesr Farooq-------------------------------------------------------------------------------------------------------------------------842
7. Prevalence of Counseling Effect to Promote Spectacle use in Shujabad (Multan)
Sehar Ijaz---------------------------------------------------------------------------------------------------------------------------846
8. Incidence, Risk factors & Correlation of Early Rise of IOP with Visual Outcome in Post Diabetic Vitrectomy
Umer Khan Orakzai---------------------------------------------------------------------------------------------------------------850
9. Short Term Efficacy of Intra-Vitreal Bevacizumab (Avastin) in Macular Oedema
Asma Aftab-------------------------------------------------------------------------------------------------------------------------854
10. Prevalence of Hypermetropia in Presbyopic age of 40-60 years
Usman Siddique--------------------------------------------------------------------------------------------------------------------858
11. Prevalence of Strabismus in Low Vision Department of King Edward Medical College Lahore
Abubakar Rizwan------------------------------------------------------------------------------------------------------------------862
12. Manual Small Incision Cataract Surgery in Phacomorphic Glaucoma Complications and Challenges
Umer Khan Orakzai---------------------------------------------------------------------------------------------------------------866
13. Prevalence of Congenital & Acquired Strabismus in Low Vision Department
Ahmed Ali --------------------------------------------------------------------------------------------------------------------------870
GENERAL SECTION - ORIGINAL ARTICLES
14. Outcome of Late Fixation of Fracture Neck of Femur in Young Adults by Multiple Cannulated Screws.
Haziq Dad Khan-------------------------------------------------------------------------------------------------------------------873

Ophthalmology Update Vol. 16 No.4, Oct - Dec 2018 iii
15. Frequency of Most Common Presenting GI Symptoms & Signs of Dengue in Tertiary Care Hospital, Peshawar
(KPK) during Dengue Epidemic in 2017
Awais Naeem-----------------------------------------------------------------------------------------------------------------------877
16. Prevalence of Depression in Epilepsy
Saeed Akhtar------------------------------------------------------------------------------------------------------------------------881
17. Knowledge, Attitudes and Practice Regarding the Oral Health
Zain-ul-Abideen---------------------------------------------------------------------------------------------------------------------885
18. Functional Outcome of Neglected Club Foot Using Ilizarov External Fixator
Awal Hakeem-----------------------------------------------------------------------------------------------------------------------890
19. Frequency of Delirium in Patients with underlying Urinary Tract Infection
Fatima Aamir Khan---------------------------------------------------------------------------------------------------------------894
20. Frequency and Severity of Depression in Adolescents at Tertiary Care Psychiatric Facility
Fahim Qasim------------------------------------------------------------------------------------------------------------------------897
21. Bowel Preparation Vs No Preparation before Colostomy Closure in Pediatric Patients:
(A Randomized Prospective Trial in a Tertiary Care Hospital)
Waheed Akhtar---------------------------------------------------------------------------------------------------------------------900
22. Frequency of Urethro-cutaneous Fistula & Meatal Stenosis Post-Snodgross Repair with
Dartos Flap for Hypospadias in Children
Farooq Abdullah--------------------------------------------------------------------------------------------------------------------904
23. Evaluation of Vertical Skeletal Changes Consequent to Maxillary Molars Distalization with
Distal Jet Appliance
Zain-ul-Abideen------------------------------------------------------------------------------------------------------------------- 908
24. Management of Tibial Plateau Fracture
Awal Hakeem-----------------------------------------------------------------------------------------------------------------------912
25. Exploring Gender Differences in Academic Motivation among Adolescents
Shakeel Asif ------------------------------------------------------------------------------------------------------------------------918
26. Evaluation of Vertical Skeletal Changes Consequent to Maxillary Molars Distalization with ............................
Jahanzaib Khan ----------------------------------------------------------------------------------------------------------------- 923
27. Comparison of Post-operative Pain Scores after using 0.2% glyceryl trinitrate (GTN) Ointment
& Placebo in Patients with Open Hemorrhoidectomy.
Kaleem Ullah ---------------------------------------------------------------------------------------------------------------------- 927
28. Comparison of Conventional Pyodine Dressing with Hydrocolloid (Duoderm)
in Diabetic Foot Ulcers in Wound Healing.
Shehryar Noor--------------------------------------------------------------------------------------------------------------------- 931
29. Assessment of the Frequency & Factors Leading to Amblyopia in School Children aging 5 to 15 years
Jahanzaib Khan-------------------------------------------------------------------------------------------------------------------- 935

Ophthalmology Update Vol. 16 No.4, Oct - Dec 2018822
According to a recent National Diabetic Survey of Pakistan (2016-17) conducted by the Pakistan Health Research Council in collaboration with Baqai Institute of Diabetology and Endocrinology for 18 months, 27.4 million people over the age of 20 are suffering from Type-2 Diabetes, out of them 14.47% are at the risk of developing Diabetes which is more than 26% of the country’s population. A total of 10834 people were ex-amined from all the provinces and were found to be suffering from Diabetes , out of which 43.9 % were men 56.15% were women. Amongst them 30.2 % had a pos-itive family history of Diabetes. The number of diabetics are increasing dra-matically from 8.7% in 1994-98 to 26.3% in 2016-17 as more younger people are getting involved in Diabetes, which is a worrying trend. There are one million peo-ple with diabetic foot and out of them 100,000 are on the verge of losing their limb within one year. In fact, Pakistan is the 4th country in the world which harbors highest number of Diabetics and the number is likely to grow if the state of affairs continues. In the past, the incidence of Diabetes was rare in the rural population due to more physical activities and least stress of modern life. With the changing life style of the modern age, longevity of life, increased econom-ic stress with reduced physical activity, the difference of diabetic incidence is almost equal to urban as well as rural areas. According to International Diabetic Federation the old concept of increased frequency of urination, thirst and weight loss is no longer a neces-sary indicator for Diabetes. If not diagnosed and treated within time, the sufferer may develop serious complications leading to blind-ness within 20 years. South-Asian communities needs more diabetic screening and prevention programs to reduce the risk of eye complications like development of Diabetic Retinopathy, maculopathy, proliferative ret-inopathy, cataract, Glaucoma and age-related macular degeneration. However, 70% of eye complications are treatable if diagnosed during the early stages. The im-portance of the support of health professionals , family and friends always benefit the patient. Learning along with exercise, medication and management with reg-ular check-ups are important parameters to control its complications leading to blindness. According to the survey, it was detected that
there was an overall 52.6% prevalence of Hyperten-sion including 27.9% known cases and 24.6% as newly diagnosed. It is very amazing that the result of blood sugar level in all provinces were similar but in terms of Hypertension Baluchistan had the highest incidence of raised blood pressure and it was lowest in KPK, with 90% of the people had cholesterol abnormalities. In Asian population over the age of 40 years and waste width more than 35 inches they are probable candi-dates for both Diabetes and Hypertension. There was another important findings of the survey that amongst the affected population 14.5% were tobacco users, both in the form of smoking an chewing. According to another report published in North England Journal of Medicine, more than 1 in 10 people are obese worldwide and suffer from weight-related health problems. In 2015 there were 107.7 million chil-dren and 603.7 million adults were obese. We must do something meaningful to combat these multi-or-gan killers. The only solution appears to strictly follow these golden principals 1. Change of complicated life style to simpler living.2. Low cholesterol diet.3. Increase the physical activity by regular walking
or exercise to avoid obesity.4. Eat half and walk double to avoid obesity.5. Reduce mental and physical stress through educa-
tion, awareness and motivation.6. Avoid smoking.7. Have early and good sleep.Summary: Since higher number of people with Diabe-tes and Hypertension do not take their prescribed med-ication due to lack of knowledge, education, awareness, its complications, cost , appointment schedule with the health professionals, exercise and diet regime. There should be some motivation at community level, one to one guidance on complications of Diabetes and Hy-pertension, importance of retinopathies, diet and exer-cise programs.
Dr. Madiha Durrani. FRCSSehar Ijaz. M.Phil.,Prof. M. Yasin Khan Durrani. [email protected]
Rising Incidence of Diabetes & HypertensionA worrying trend – Prevention through Awareness.
Editorial
Ophthalmology Update Vol. 16 No.4, Oct - Dec 2018 823
Frequency of Dry Eyes after Cataract Surgery
OPHTHALMIC SECTION
ORIGINAL ARTICLE
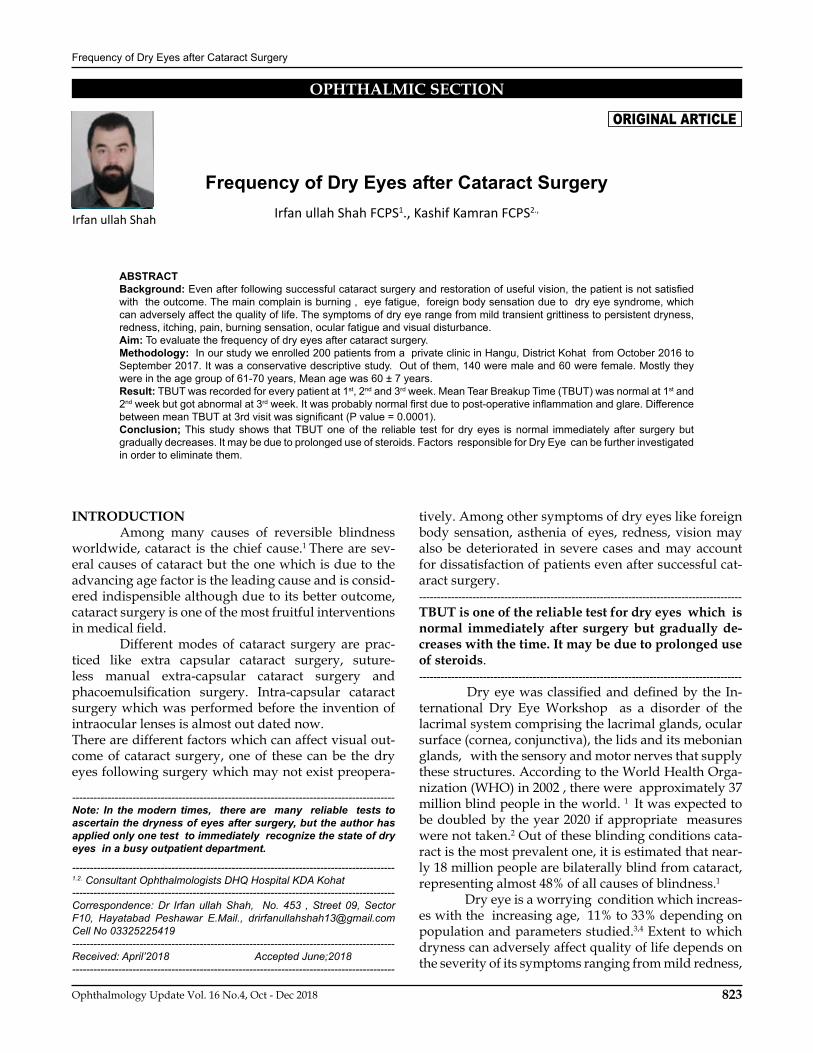
ABSTRACTBackground: Even after following successful cataract surgery and restoration of useful vision, the patient is not satisfied with the outcome. The main complain is burning , eye fatigue, foreign body sensation due to dry eye syndrome, which can adversely affect the quality of life. The symptoms of dry eye range from mild transient grittiness to persistent dryness, redness, itching, pain, burning sensation, ocular fatigue and visual disturbance.Aim: To evaluate the frequency of dry eyes after cataract surgery.Methodology: In our study we enrolled 200 patients from a private clinic in Hangu, District Kohat from October 2016 to September 2017. It was a conservative descriptive study. Out of them, 140 were male and 60 were female. Mostly they were in the age group of 61-70 years, Mean age was 60 ± 7 years. Result: TBUT was recorded for every patient at 1st, 2nd and 3rd week. Mean Tear Breakup Time (TBUT) was normal at 1st and 2nd week but got abnormal at 3rd week. It was probably normal first due to post-operative inflammation and glare. Difference between mean TBUT at 3rd visit was significant (P value = 0.0001).Conclusion; This study shows that TBUT one of the reliable test for dry eyes is normal immediately after surgery but gradually decreases. It may be due to prolonged use of steroids. Factors responsible for Dry Eye can be further investigated in order to eliminate them.
Irfan ullah Shah FCPS1., Kashif Kamran FCPS2.,
Frequency of Dry Eyes after Cataract Surgery
Irfan ullah Shah
INTRODUCTION Among many causes of reversible blindness worldwide, cataract is the chief cause.1 There are sev-eral causes of cataract but the one which is due to the advancing age factor is the leading cause and is consid-ered indispensible although due to its better outcome, cataract surgery is one of the most fruitful interventions in medical field. Different modes of cataract surgery are prac-ticed like extra capsular cataract surgery, suture-less manual extra-capsular cataract surgery and phacoemulsification surgery. Intra-capsular cataract surgery which was performed before the invention of intraocular lenses is almost out dated now.There are different factors which can affect visual out-come of cataract surgery, one of these can be the dry eyes following surgery which may not exist preopera-
tively. Among other symptoms of dry eyes like foreign body sensation, asthenia of eyes, redness, vision may also be deteriorated in severe cases and may account for dissatisfaction of patients even after successful cat-aract surgery.-------------------------------------------------------------------------------------------TBUT is one of the reliable test for dry eyes which is normal immediately after surgery but gradually de-creases with the time. It may be due to prolonged use of steroids. ------------------------------------------------------------------------------------------- Dry eye was classified and defined by the In-ternational Dry Eye Workshop as a disorder of the lacrimal system comprising the lacrimal glands, ocular surface (cornea, conjunctiva), the lids and its mebonian glands, with the sensory and motor nerves that supply these structures. According to the World Health Orga-nization (WHO) in 2002 , there were approximately 37 million blind people in the world. 1 It was expected to be doubled by the year 2020 if appropriate measures were not taken.2 Out of these blinding conditions cata-ract is the most prevalent one, it is estimated that near-ly 18 million people are bilaterally blind from cataract, representing almost 48% of all causes of blindness.1
Dry eye is a worrying condition which increas-es with the increasing age, 11% to 33% depending on population and parameters studied.3,4 Extent to which dryness can adversely affect quality of life depends on the severity of its symptoms ranging from mild redness,
-------------------------------------------------------------------------------------------Note: In the modern times, there are many reliable tests to ascertain the dryness of eyes after surgery, but the author has applied only one test to immediately recognize the state of dry eyes in a busy outpatient department.
-------------------------------------------------------------------------------------------1.2. Consultant Ophthalmologists DHQ Hospital KDA Kohat-------------------------------------------------------------------------------------------Correspondence: Dr Irfan ullah Shah, No. 453 , Street 09, Sector F10, Hayatabad Peshawar E.Mail., [email protected] Cell No 03325225419-------------------------------------------------------------------------------------------Received: April’2018 Accepted June;2018-------------------------------------------------------------------------------------------

Ophthalmology Update Vol. 16 No.4, Oct - Dec 2018824
Frequency of Dry Eyes after Cataract Surgery
irritation and burning to severe pain, decreased vision and eye fatigue. In severe cases dryness can profoundly impair the patients work productivity, influence mood, behavior and confidence.5
In this study we aimed to seek the factors responsible for dry eyes after cataract surgery, so that its load in a community could be quantitatively found out. After this study we would be able to find out the frequency of this annoting condition in patients who have undergone cataract surgery and it would help us in better managing this condition post operatively.
MATERIALS & METHODS. Inclusion criteria: Patients from 40 years to > 70 years with un-complicated cataract.Exclusion criteria; Patients with no previous history of dry eyes before cataract surgery.Diseases like diabetes and other ocular surface disease like pemphigoid and ocular burns.Patients having previous complicated surgery. Patients’ biodata were recorded on a proforma after taking informed consent.After surgery patients were called for follow-up at 1st week, 2nd week and at 3rd week. At each visit patients tear film breakup time was noted on proforma. The technique involved a commercially available fluores-cein-impregnated strip wet with non-preserved saline was used and placed in the inferior fornix. The patient is then asked to blink 3 times and then to look straight ahead without any blink. The tear film is observed us-ing a cobalt blue filter under wide beam illumination at the slit-lamp. The interval between the last blink and the appearance of the first randomly appeared corneal dry spot is measured as TBUT. A value less than 10 sec-onds is regarded as abnormal. Qualitative data was analyzed for frequency and percentages while quantitative data as age and TBUT were analyzed for mean and SD in SPSS version 20. Chi square test was used for qualitative and T test was used for quantitative data to see the statistical dif-ference.
RESULTS In our study total patients were 200, out of these 140 were male and 60 were female. More patients were in age group 61-70 years, which is 100. Mean age was 60 ± 7 years. Mean TBUT was 6 second ± 2 second. TBUT was recorded for every patient at 1st, 2nd and 3rd week. Mean TBUT was normal at 1st and 2nd week but got abnormal at 3rd week. It was normal it was normal in the first due to post-operative inflammation and glare. Difference between mean TBUT at 3rd visits was significant (P value = 0.0001). Mean TBUT was less in male as compared to female, it may be because of more number of patients in male category as compared to fe-male.
Table No1. Gender distributionGender Frequency Percentage
Male 140 70%
Female 60 30%
Total 200 100%
Table No 2. Age distributionAge groups Frequency Percentage40-50 years 10 5%51-60 years 50 25%61-70 years 100 50%> 70 years 40 20%Total 200 100%
Table No 3. Age wise gender distributionAge groups Male Female Total 40-50 years 7 3 1051-60 years 40 10 5061-70 years 63 37 100> 70 years 30 10 40Total 140 60 200
Table No 4. Mean TBUT at follow-upsFollow-up visits Mean TBUT P value 1st week 15 ± 3 sec
0.00012nd week 10 ± 2 sec3rd week 6 sec ± 2 sec
Table No 5. Age wise 3rd week mean TBUTAge group Mean TBUT P value40-50 years 10 sec ± 3 sec
0.000151-60 years 9 ± 2 sec61-70 years 5 ± 1 sec> 70 years 7 ± 3 sec
Table No 6. Gender wise 3rd week mean TBUTGender Mean TBUT P valueMale 5 ± 3 sec
0.00Female 9 ± 2 sec
DISCUSSION This study was performed at private setting in Hangu District Kohat. Two hundred patients were in-

Ophthalmology Update Vol. 16 No.4, Oct - Dec 2018 825
Frequency of Dry Eyes after Cataract Surgery
cluded in the study. Male patients were more than fe-male. This study was done due to abundant complaints of post-operative patients for dry eyes symptoms and with complain of foreign body sensation, itching and occasional blurred vision. Severe dry eye affects the patient’s ocular and general health and quality of life,6
Since the dry eye syndrome is common worldwide, it can be caused by many factors, which contribute to decrease in tear film breakup time such as pre-surgical corneal surface disease, type of incision, size of incision, complicated surgery, post-operative medications. All can lead to make tear film abnormal. This dryness can lead to decrease in tear film breakup time. It was noted that in first few weeks’ patient have normal tear film break-up time (TBUT), but grad-ually it is decreased to mean 6 seconds at 3rd week. The difference between mean TBUT at three visits was sta-tistically significant (P value = 0.0001). A study by Cet-inkaya et al. mean postoperative 1st day, 1st week and 1st month Break-up Time (BUT) values were signifi-cantly lower than preoperative BUT value (P < 0.001, P < 0.001, P < 0.001), however 1st year and 2nd year val-ues were not significantly different from preoperative value (P = 0.441, P = 0.078, P = 0.145, P = 0.125).7
Chung, et al shows that mean TBUT decrease from 11.8 ± 2.2 sec to 7.7 ± 2 sec postoperatively.8 In the dry eye group, there were significant aggravations in 6 weeks to 2 months postoperatively and in TMH at 3 days, 10 days, 1 month, and 2 months postoperative-ly, compared with preoperative values. All dry eye test values were significantly worse after cataract surgery in the dry eye group.9
The difference between mean TBUT against
age groups and gender was also statistically significant. It was significant because of more patients in age group 61-70 years and male gender, which is 0.0001 and 0.00 respectively.
CONCLUSION This study shows that TBUT is one of the reli-able test for dry eyes is normal immediately after sur-gery but gradually decreases. It may be due to prolong use of steroids and ointments. Further study should be done on factors that contribute to dry eyes after sur-gery, so that these factors could be controlled.
REFERENCES 1. Resnikoff S, Pascolini D, Etya’ale D et al. Global data on visual
impairment in the year 2002. Bulletin of the World Health Organization. 2004; 82 (11): 844-51.
2. Frick KD, Foster A. The magnitude and cost of global blindness: an increasing problem that can be alleviated. Am J Ophthalmol. 2003 Apr;135(4):471-6.
3. Brewitt H, Sistani F. Dry eye disease: the scale of the problem. Surv Ophthalmol. 2001; 2:199-202.SCHEIN OD, MUÑOz B, TIELSCH JM, BANDEEN-Roche K, WEST S. Prevalence of Dry Eye Among the Elderly. Am J Ophth. 1997; 124(6): 723-28.
4. Friedman, Neil J. Impact of dry eye disease and treatment on quality of life. Current Opinion in Ophthalmology. 2010; 21(4): 310–6.
5. Garcia-Catalan MR, Jerez-Olivera E, Benitez-Del-Castillo-Sanchez JM. Dry eye and quality of life. Arch SocEspOftalmol. 2009; 84: 451–8.
6. Cetinkaya S, Mestan E, Acir NO, Cetinkaya YF, et al. The course of dry eye after phacoemulsification surgery. BMC Ophthalmology. 2015; 15: 68.
7. Chung YW, Oh TH, Chung SK. The Effect of Topical Cyclosporine 0.05% on Dry Eye after Cataract Surgery. Korean J Ophthalmol. 2013;27(3):167-171.
8. Cho YK, Kim MS. Dry Eye After Cataract Surgery and Associated Intra-operative Risk Factors. Korean J Ophthalmol. 2009; 23: 65-73.

Ophthalmology Update Vol. 16 No.4, Oct - Dec 2018826
A Comparative Study of Dry Eye Syndrome in Diabetic & Non-diabetic Patients
ABSTRACT Objective. To compare the prevalence of dry eye syndrome (DES) in diabetic and non-diabetics patients, knowing the basic Patho-physiology of dry eyeMethodology: 100 diabetics and 100 non-diabetics (total 200) patients were enrolled for this study. A cross-sectional study at HBS Medical College & Hospital, Islamabad was carried out from May’2015 to July’2016. Approval of the Ethical Bord was obtained and written consent was obtained from all the participants, ranging from 50-80 years of age.Results.100 each patients were kept in group-A (with mean age of 60.4±4.0 and group-B of non-diabetics (with mean age of 60.9±4.0. Gender distribution showed males diabetics 44.0% in group-A and 58.0% in group-B, while females were 56.0% in group-A and 42.0% in group-B. Majority of the symptoms were significantly higher in diabetics group-A as compared to non-diabetics in group B (p<0.001). 40% of the men and 62% of the women classified as having dry eye. Women were found more frequently than men, with (P<0.0001). Conclusion: Diabetic patients had an elevated prevalence of Dry Eye Syndrome. Key Words: Menopause, Questionnaire, Schirmer test, Fluoresceine test.
Jahanzeb Durrani, DOMS.M.S(Ophth)1. Inam ul Haq Khan FCPS, MHPE 2.
A Comparative Study ofDry Eye Syndrome in Diabetic & Non-diabetic PatientsJahanzeb
Durrani
INTRODUCTION Diabetes mellitus (DM) has become a major public health problem in the world as a result of lon-gevity of life with stress of modern age. The global prevalence of diabetes was 246 million in 2007 which could reach 380 million by 2025,1. The incidence has proportionally increased to 10% in the developing countries (Diabetic Association of Pakistan),2 especial-ly in many African countries where malnutrition and diet deficient in vitamin–A exist.3 DES increas-es by 4% in age group of 10-20 years and 33% in 51-60 years.4,5 Pakistan is a country where population com-prises different ethnic groups and life styles due to varied weather conditions.7 Dry Eye (DES) is a progressive dysfunction of the lacrimal and meibomian glands characterized by insufficient lubrication of the ocular surface. A de-ficiency of one or more of the tear-film layers (aque-ous, mucin or lipid) is involved either due to low tear production (aqueous deficiency) or poor tear quality (evaporative loss)8 Diabetes Mellitus changes the tear composition by damaging the microvasculature of the lacrimal gland causing sensory neuropathy of the cor-
nea disturbing the presence of messenger RNAs for steroidogenic enzymes, such as 17 β-HSD, aromatase and 5 α-reductase.9
There is a preponderance of DES in females (60%) as compared to males (40%).6 In post-menopausal women, the tear production decreases due to low an-drogen level which promotes secretion of meibomian gland and increases osmolarity of tears. Androgens regulate the immune system and secretary functions of lacrimal glands. 10,11
-------------------------------------------------------------------------------------------Special investigations were carried out i.e. Schirmer Test (annex-2) Tear breakup time (TBUT-Annex-3), Ocular Surface Disease Index (OSDI- Annex-4) on all patients. ------------------------------------------------------------------------------------------- DES is diagnosed by symptoms of discomfort, visual disturbance and ocular surface inflammation. The tear film consist of outer lipid layer 0.1-0.2 µm se-creted by meibomian glands, middle aqueous layer 0.7-0.8 µm secreted by lacrimal and 20 accessory glands and the innermost mucous layer 0.3 µm produced by the goblet cells in the conjunctiva. The tear film facili-tates exchange of gases like oxygen and maintains the glossy nature of the cornea with the help of an enzyme retinol. The electrolytes present in the tear film include sodium, potassium, magnesium, calcium, chloride, bi-carbonate, phosphate ions and proteins i.e.,lysozyme, lactoferrin, and lipocalin, serum albumin, IgG, ceru-loplasmin, transferrin, and monomeric IgA.12,13
There is a strong association of DES with the systemic use of drugs like antihistamines, beta block-
-------------------------------------------------------------------------------------------1.Assistant Professor, Hazrat Bari Sarkar Medical College& Hospital, Islamabad2.Associate Professor of Ophtalmology, Al-Shifa Trust Eye Hospital, Rawalpindi-------------------------------------------------------------------------------------------Correspondence: Dr.Jahanzeb Durrani, No. 267-A, St: 53,F-10/4, Islamabad. E.Mail> [email protected] Cell: 0333 5158885, 0333 5102222-------------------------------------------------------------------------------------------Received: July’2018 Accepted: Sep’2018-------------------------------------------------------------------------------------------
ORIGINAL ARTICLE

Ophthalmology Update Vol. 16 No.4, Oct - Dec 2018 827
A Comparative Study of Dry Eye Syndrome in Diabetic & Non-diabetic Patients
ers, diuretics, steroids, oral contraceptives; and psy-cho-tropic drugs used in many conditions such as au-to-immune disorders, trachoma, burns, post LASIK refractive surgery, insulin-dependent diabetics, blepharitis, and Steven Johnson syndrome, nutritional deficiency in omega-3, Vitamin-A.14,15,16,17
According to American Optometric Associa-tion 45% of the total world’s population use computers for many hours and approximately 60 million people suffer from symptoms of dry eye. A reduction in cor-neal sensitivity occurs in wearers of contact lenses 2,3, due to increased tear osmolarity of tears.
There are two categories of Dry Eye Syndrome: (i)aqueous tear-deficient dry eye (ADDE) and (ii) evap-orative dry eye (EDE). The category ADDE is further subdivided: Sjogren syndrome 18 (b) Non-Sjogren. ADDE affects 5-6% of the population which rises to 6-9.8% in postmenopausal women and as high as 34% in the elderly with the ratio of females to male: 9:1. Smokers, computer users and those using systemic medications are significantly associated with a higher risk of DED with a p-value = <0.05. by using Chi-square test13.66
Figure-1: Glands involved with lipid secretion Mei-bomian glands (thick arrow), Glands of Moll and Zeis (thin arrow).After permission from the publisher.
Figure-2: Glands involved with Aqueous tears secre-tion Lacrimal Gland (thick arrow), Glands of Krause and Wolfring (thin arrow). After permission from the
publisher.METHODOLOGY. It is a cross-sectional study of 200 patients (100 diabetics in group-A and 100 non-diabetics in group-B) with both genders.. The aim of the study was to com-pare the incidence of basic patho-physiology of dry eye. Regarding age distribution, 48 patients (48.0%) in group-A and 52 patients (52%) in group-B, were be-tween 50-60 years. 33 patients (33.0%) in group-A and 31(31%) in group-B, were between the ages of 61-70 years. 19 patients (19.0%)in group A and 17 patients (17.0%) were in the age group of 71-80 years. Mean ages were 60.4±4.3 and 60.9±4.6 in group-A and B, re-spectively. Before starting the study, a detailed histo-ry of diabetics was taken regarding the age, period of onset, medication and control of diabetes in a proper questionnaire. ‘The McMonnies & Ho Dry Eye Ques-tionnaire’ (Annex-1) which is very close to our prevail-ing conditions and is often used in clinical studies, with slight modification. All standard tests, as per in-ternational protocol, were undertaken in these patients. Sampling of known diabetics and equal number of non-diabetic patients of same age group with a his-tory of hypertension, consuming drugs for various dis-eases, use of lubricants, steroids, contraceptives were included after written consent. Patients suffering from known external ocular diseases like chronic viral and fungal Keratitis, eye injuries, glaucoma, previous eye surgeries and ocular burns were excluded. To find the level of glycemic control, fresh blood from cubital vein was tested for (i) fasting (ii) random and (iii) level of HbA1c in the hospital lab. Special investigations were carried out i.e. Schirmer Test (annex-2) Tear breakup time (TBUT-An-nex-3), Ocular Surface Disease Index (OSDI- Annex-4) on all patients. Computer software SPSS version 12 was used for data entry and analysis. Chi square test was applied on qualitative variables like gender, symptoms, arthri-tis, dryness of nose, mouth, throat, sensitivity of eyes, irritation and dry eye. P value < 0.05 was taken as sig-nificant. This study was undertaken for the first time in Pakistani population and has not been reported in the literature.
RESULTS. Data Collection Procedure: The result showed that 40% of the men and 62% of the women were clas-sified as having dry eye. (P<0.0001).The distribution in age groups was statistically significant (p<0.005). Male patients (n=16) with dry eye disease suffered diabetes for 13 years whereas female (n=56) patients suffered for 15 years. The diabetic duration of highest mean was found in 65-75 year old patients. However the duration of diabetes was not statistically significant in gender and age (p= 0.712 and p=0.719

Ophthalmology Update Vol. 16 No.4, Oct - Dec 2018828
A Comparative Study of Dry Eye Syndrome in Diabetic & Non-diabetic Patients
respectively). Highest fasting glycaemia was found in men of between 45-55 year of age, not statistically sig-nificant amongst age and sex (p= 0.277 and p=0.456 respectively). Ocular discomfort was defined as having one or more traditional dry eye symptoms, and all patients were graded as “3” or “4”. The Schirmer test was eval-uated with median and amplitude and ranged from “2” to “4”, the latter was found in the 56.6-67.4 age group; there was no statistical significant difference between men and women (p=0.236). Results from other parame-ters, including conjunctival congestion, corneal staining with fluorescein, reduced tear meniscus, meibomian gland changes, break-up time (BUT), visual acuity and comparing them for age and sex, showed no statistical significance (Tables 1 and 2)of age. Mean age of the pa-tients was 60.4±4.3 and 60.9±4.6 in group-A and B, re-spectively as in Table-1
Table-1Distribution of patients by age (n=200)
Age (Year)
Group-A (Diabetic) n=100
Group-B (Non-diabetic) n=100
Number % Number %
50-60 48 48.0 52 52.0
61-70 33 33.0 31 31.0
71-80 19 19.0 17 17.0
Total 100 100.0 100 100.0
Mean±SD 60.4±4.3 60.9±4.6Gender distribution shows, 44 patients (44.0%) in group-A and 58 patients (58.0%) in group-B were male while 56 patients (56.0%) in group-A and 42 patients (42.0%) in group-B were female (Table-2).
Table-2Distribution of patients by gender (n=200)
Gender
Group-A (Diabetic) n=100
Group-B (Non-diabetic) n=100
Number % Number %
Male 44 44.0 58 58.0
Female 56 56.0 42 42.0
Total 100 100.0 100 100.0Chi Square=3.92df =1 P value=0.047
Graph:1 Incidence of Dry Eye in Diabetics & Non-di-abetic
Table-3 Distribution of signs (n=200)
Signs
Group-A (Diabetic) n=100
Group-B (Non-diabetic) n=100
P value
No. % No. %
Inferior punctate erosions
22 22.0 10 10.0 0.020
Altered state of tear meniscus
13 13.0 07 07.0 0.157
Mucus debris 17 17.0 05 05.0 0.006
Foamy presence on lower lid
19 19.0 11 11.0 0.113
Mucus filaments, plaques
25 25.0 06 06.0 0.0002
Dry eye syndrome rate was significantly high-er in group-A when compared with group-B. (p<0.001).
Table-4 Distribution of Diabetic and non-diabetic pa-tients with dry eye syndrome (n=200)
Dry eye syndrome
Group-A (Diabetic) n=100
Group-B (Non-diabetic) n=100
Number % Number %
Yes 34 34 % 12 12 %
No 66 66 % 88 88 %
Total 100 100 % 100 100 %Chi Square=13.66df=1 P value=< 0.001
Our study also included to assess proportion of Dry Eye in patients of Computer Vision Syndrome. Data was composed from 100 (55 male and 45 femalestudents) having age group 1830 years. All were diagnosed with Dry Eye due to Computer usage (Minimum 3-4 hours) and data was collected using a proforma.
Table No. 5 Frequency of dry eye in Computer Vision Syndrome.(CVS)-------------------------------------------------------------------------Gender: Yes. No Total.

Ophthalmology Update Vol. 16 No.4, Oct - Dec 2018 829
A Comparative Study of Dry Eye Syndrome in Diabetic & Non-diabetic Patients
-------------------------------------------------------------------------Male: 10 30 40-------------------------------------------------------------------------Female: 3 57 60-------------------------------------------------------------------------Total: 13 87 100-------------------------------------------------------------------------Table: 6 Schirmer test.
Tear film Frequency Schirmertest Value
Defective 82 9.52
Normal 18 15.4418 patients had normal values and 82 patients had ab-normal values in Schirmer test. Mean value of abnor-mal is 9.52 and normal 15.44. Table No. 7 Stages of Dry eye on Schirmertest show-ing dry eye in diabetics
Stages of Dry eyes Frequency Schirmer Test Value
Mild 40 12.33
Moderate 32 8.22
Normal 18 15.44
Severe 10 4.10 The result concluded that patient with mild dry eye were 40% having (minimum value of 10mm and maximum value of 14mm), moderate are 32% hav-ing (min value 6mm and max 10mm) normal are 18% having (min value 15mm and max 16mm), severe are 10%,having (min value 3mm and and max 5mm). DISCUSSION Our study observed that 40% of the men (aver-age age 63 years) and 62% of the women (average age 64 years) suffered from dry eyes. (P<0.0001). Most of the patients were in the 75-85 year-old, while the 65-75 year-old group were fewer, being statistically signifi-cant (p<0.005). In post-menopausal women, the tear production decreases due to low androgen level and high estrogen level, as androgen promotes secretion of meibomian gland. In diabetes with the advancing age there is a damage to the lacrimal gland, microvas-culature with autonomic neuropathy responsible for impaired gland function. In our study, patients older than 50 years with diabetes suffer more dry eye problems as compared to non-diabetics. Gender distribution shows 44 patients (44%) in group A and 58 patients (58%) in group B were male while 56 patients (56%) in group A and 42 patients (42%) in group B were females as seen in the study of Stephen Foster.24
Kaiserman I et.al. 19. suggested that about 7.8% of American women and 4.7% of men both aged 50 years and above suffered DES. In another study by him, the prevalence of dry eye was 18.1% in diabetics
compared to 14.1% in non-diabetics, in which the diag-nosis and dry eye symptoms were self-reported. A sim-ilar prevalence (diabetics 20.6%, non-diabetics 13.8%) was also reported in his study based on frequency of use of ocular lubricants. This study also noted an asso-ciation between poor glycemic control (as indicated by serum HbA1C 19. Lemp M.A. et al, found diversity of DES, rang-ing from 7.8 % to 93.2% in the West and Asia, respec-tively is believed to be due to the regional location of the study in randomly selected population for the di-agnosis of dry eye1.20,21 In our study, dry eye prevalence increased with age, which is similar with findings in other studies. Nevertheless, Meadows M. al22. reported some contradictory results. Those different results may be at-tributed to different regional variations, genetic traits and environmental conditions. Liu N.N. et al 23 from China reported that both males and females are equally affected by DED. Further, in our study in urban and non-urban patients, we have found that 70% of the Pakistani pop-ulation living in non-urban area are mostly illiterate with meager or no medical facilities hence diabetics are becoming more dependent on ocular lubricants, mostly advised by the quacks. A significantly higher percentage of diabetic patients (20.6% as seen in our studies) received ocular lubrication compared with non-diabetic patients (13.8%, p<0.001)., We did not find any reference in literature as such studies were never carried out in urban and on urban population especially in Pakistan. In our study, we found about 17% of the Diabetic patients with DED had decreased Schirmer test, equally observed by Van Bijsterveld OP et al 25. According to Versura P,et al 26 Tear film instabil-ity was the main cause in these cases. According to ‘Management Study Research Group 2018, reported in North England Journal of Med-icine, published on line Aril’2018, 27 nutritional deficien-cy of omega-3, vitamin C, low humidity, high wind velocity may act as risk factors . Other risk factors are Trachoma: Cicatricial pemphigoid, Chemical, thermal Burns and contact lens wearers, use of antihistamines, beta blockers, antispasmodics, diuretics, and other psy-cho-tropic drugs,, post LASIK (refractive surgery) as observed by Sambursky R 28. Goebbels M., found a reduction in reflex tearing (Schirmer test) in insu-lin-dependent diabetics, but no difference in tear film breakup time (TBUT) was noted. This study also noted an association between poor glycemic control (as indicated by serum HbA1C). 29 Symptoms increase in dusty atmosphere in male diabetics who are engaged in out-door activities as in farmers, smokers, working in rooms with fan heaters and long distance drivers. However, symp-

Ophthalmology Update Vol. 16 No.4, Oct - Dec 2018830
A Comparative Study of Dry Eye Syndrome in Diabetic & Non-diabetic Patients
toms are less in cold and rainy weather as observed by Mathers WD et al 14 in 400 patients both in diabetics and non-diabetics. Our study have strongly supported these findings in 88% of our diabetic cases. Non diabet-ics tolerate better these conditions. In a study by Health Maintenance Organiza-tion (HMO), members older than 50 years found 20.6% of diabetic and 13.8% of non-diabetic using ocular lu-brication. They concluded close monitoring of blood sugar for the prevention of dry eye syndrome. But in our study the results were consistent with HMO.27
Kaiserman I 19et al concluded close monitoring of blood sugar is required in Diabetics with Diabetic Ret-inopathy (DR), but we did not find any such study in the literature to co-relate our findings. However, in our studies we noticed 40 patients (40%) had proliferative DR whereas 10 patients had Non-proliferative Diabetic Retinopathy (NPDR) out of 100 diabetic patients. Current Opinion highlighted by Sambursky R., that topical cyclosporine 0.05% ophthalmic solution (marketed by Sante as Ristasis eye drops 0.1% )used twice daily for a longer period have successfully been tried as an immunosuppressant. The drug had signifi-cantly decreased the corneal surface inflammation 29. We also observed increased tear production in 15% of diabetics as compared to 5% with non-diabetics.30 Sys-temic and topical Omega–3 fatty acids and Omega–6 fatty acids have been used recently by Allison L. Rand, MD et al 30 as an adjunctive treatment for patients with dry eye disease. They appear to have an efficacy against the symptoms of dry eye. The use of essential fatty ac-ids as a nutritional supplement is a novel treatment for patients with DES.
CONCLUSION Our findings have supported the impression that the diabetic patients have an elevated prevalence of DES. It is suggested that the examination for dry eyes should be an integral part of the assessment of dia-betic eye disease. Further studies need to be undertaken in Pakistan comprising different ethnic groups with different life styles under different weather conditions.
PROFORMADemographics:- Male/Female- Age: 50-60, 61-70, 71-80Group: Diabetic/Non-diabetic- Blood sugar: Fasting _______ random ________-Level of HbA1C ____________________________History of use of ocular lubricants Yes NoPresence of ophthalmic signs .-Inferior punctate erosions Yes No-Altered state of tear meniscus Yes No-Mucus debris Yes No
-Foamy presence on lower lid Yes No-Mucus filaments and plaques Yes No(Annex:1)The McMonnies questionnaire: Please answer the fol-lowing.Age: 25 years, 25-45 years over 45 years.,
1. Whether using contact lenses, ever used eye drops for dry eye or any other treatment.(Underline)
2. Do you ever experience any of the symptoms sore-ness, scratchiness, dryness, grittiness, burning (Un-derline)
3. How often do your eyes have these symptoms? (Underline) Never, Sometimes, Often, Con-stantly,(Underline)
4. Do you regard your eyes as being unusually sen-sitive to smoking, smog, air conditioning,central heating.(Underline)
5. Do your eyes easily become very red and irritated while using computers for more than 4 Hours. Do you get neck pains or back ache. Yes.No(Underline)
6. Do you take (underline) antihistamine tablets, an-tihistamine eye drops, diuretics) sleeping tablets, tranquilizers, oral contraceptives, anti-diabetics and anti-hypertensive drugs.
7. Do you suffer from arthritis? (Underline)8. Do you experience dryness of the nose, mouth,
throat or vagina? Yes, No, (Underline)9. Do you suffer from thyroid abnormality? Yes No
(Underline)10. Do you know while sleeping with your eyes partly
open? Yes No (Underline)
Annex-2Schirmer Test was performed on each patient after instilling one or two eye drops of Alcaine 0.5%, as lo-cal anesthetic. A special Schirmer strip was inserted in the lower fornicsin both the eyes while the eye are closed. After five minutes the mount of moisture pres-ent on the strip was measured. Normally it should be more than 10 mm if it is less than 10 mm, the patient may suffer from DED and if it is less than 5mm the DED is positively confirmed.Annex-3Tear breakup time (TBUT) is used to assess the evap-orative dry eye disease. Fluorescein 1% is instilled into each eye and the patient is seated at the slit lamp and he is asked not to blink while the tear film is observed under the beam of cobalt blue illumination. The TBUT is recorded as the number of seconds that elapses be-tween the last blink and the appearance of the first dry spot in the corneal tear film. If the is dry spot (punctate epithelial erosions–PEE and or stained with Fluoresce-in) appears under 10 seconds, it is considered a sign of ocular surface dryness.

Ophthalmology Update Vol. 16 No.4, Oct - Dec 2018 831
A Comparative Study of Dry Eye Syndrome in Diabetic & Non-diabetic Patients
Annex-4C-Ocular Surface Disease Index (OSDI). We ask our patients few questions, whether eyes are sensitive to light, feels gritty, blurred, difficulty in reading, driving at night, working in windy conditions, low humidity and painful eyes. Than we turn over to the question-naire to calculate the patient’s final OSDI score. If the score is 33 or above, it is a sign of ocular surface dry-ness.
REFERENCES.(Endnotes)1. Smith JA, Albeitz J, Begley C, Caffery B, Nichols K, Schaumberg
D, et al. The epidemiology of dry eye disease: Report of the Epidemiology Subcommittee of the international Dry Eye Workshop. Ocul Surf. 2007; 5(2):93-107.
2. Brewitt H, Sistani F. Dry eye disease: the scale of the problem. Surv Ophthalmol 2001;45Suppl 2:S199-202.
3. Paschides CA, Petroutsos G, Psilas K. Correlation of conjunctival impression cytology results: ActaOphthalmol 1991; 69:422-5.
4. Ramos-Remus C, Suarez-Almazor M, Russell AS. Low tear production in patients with diabetes mellitus is not due to Sjogren’s syndrome. ClinExpRheumatol 1994;12:375-80.with lacrimal function and age.
5. Mathers WD, Lane JA, Zimmerman MB. Tear film changes associated with normal aging. Cornea 1996;15:229-34.
6. Jain S. Dry eyes in diabetes. Diabetes Care 1998; 21:1364-82.7. Paschides CA, Stefaniotou M, Papageorgiou J. Ocular
surface and environmental changes. ActaOphthalmolScand 1998;876:74-7.
8. Moss SE, Klein R and Klein BE. Prevalence of and risk factors for dry eye syndrome.Arch Ophthalmol.2000; 118: 1264-1268
9. Bachman WG, Wilson G. Essential ions for maintenance of the corneal epithelial surface. Invest Ophthalmol Vis Sci 1985;26:1484-8.
10. Cavanagh HD, Colley AM. The molecular basis of neurotrophic keratitis.ActaOphthalmolSuppl 1989;192:115-34.
11. Seifart U, Strempel I. The dry eye syndrome and diabetes mellitus.Ophthalmologe 1994;91:235-9.
12. Peral A, Carracedo G, Acosta MC, Gallar J, PintorJ.Increased levels of diadenosine polyphosphates in dry eye. Invest
Ophthalmol Vis Sci 2006;47: 4053-8.13. Magdum R., Pradhan AK, Evaluation of various risk factors of
dry eye. NEJM. 2013; 3(2): 181-18314. Mathers WD, Lane JA. Meibomian gland lipids, evaporation, and
tear film stability. AdvExp Med Biol 1998;438:349-60.15. Mathers WD, Daley TE. Tear flow and evaporation in patients
with and without dry eye. Ophthalmology 1996;103:664-9.16. Goebbels M. Tear secretion and tear film function in insulin
dependent diabetics. Br J Ophthalmol 2000;84:19-21.17. Power WJ, Ghoraishi M, Merayo-Lloves J, Neves RA, Foster
CS. Analysis of the acute ophthalmic manifestations of the erythema multiforme/ Stevensjohnson syndrome/toxic epidermal necrolysis disease spectrum.Ophthalmology 1995; 102:1669-76.
18. Riordan-Eva, Asbury T, Whitcher JP. Vaughan and Asbury’s general ophthalmology. 16th ed. USA: McGraw-Hill Medical; 2003. p. 308-10
19. Kaiserman I et.al., Riordan-Eva, Asbury T, Whitcher JP. Vaughan and Asbury’s general ophthalmology. 16th ed. USA: McGraw-Hill Medical; 2003. p. 308-1021.Dry eyes. [Online] [cited 2012 August 18]; Available from: http://www.nlm.nih.gov/medlineplus/ ency/ article/003087.htm
20. Meadows M. Dealing with dry eye. [Online] [cited 2012 October 13]; Available from: http://www. focusondryeye.com/_articles/Dealing_with_Dry_Eye.pdf
21. Liu NN, Liu L, Li J, Sun YZ. Prevalence of and risk factors for dry eye symptom in mainland China: a systematic review and meta-analysis. J Ophthalmol. 2014;2014 748654. doi: 10.1155/2014/748654. Epub 2014 Oct 15.
22. C Stephen Foster. Dry Eye Syndrome. WebMD (20 Feb.2014).Retrieved September 12,2014. (Eng.)
23. Van Bijsterveld OP. Diagnostic tests in the Sicca syndrome. Arch Ophthalmol. 1969;82:10-1
24. Versura P, Profazio V, Campos EC. Performance of tear osmolarity compared to previous diagnostic tests for dry eye diseases. Curr Eye Res. 2010;35:553–564. 4
25. The Dry Eye Assessment and Management Study Research Group. 2018. Omega-3 fatty acid supplementation for treatment of dry eye disease. N Engl J Med. Published online April 13.
26. Sambursky R, O’Brien TP. MMP-9 and the perioperative management of LASIK surgery.CurrOpinOphthalmol. 2011;22:294–303.
27. Allison L. Rand, W (212) 241-7977, c.liamg@dmdnarnosill Mount Sinai School of Medicine New York, NY 10029

Ophthalmology Update Vol. 16 No.4, Oct - Dec 2018832
Incidence of Environmental & Metabolic Factors Causing Congenital Cataract in Children of Lahore
ABSTRACTObjective: To check the incidence of environmental and metabolic factors causing congenital cataract in infants. Methods: The descriptive study was conducted at General Hospital Lahore , Pakistan which comprised children under 5 years of age with a history of mothers who had suffered rubella, Diabetes, herpes simplex, birth trauma etc. Data was collected through convenient sampling and analyzed through SPSS 20.00. Results: Out of the 300 cases examined, 20 patients were diagnosed with congenital cataract . In these cases 5 were effected from birth injury, 2 from rubella, 3 from herpes simplex virus, 1 due to maternal torch infection, 5 due to metabolic disorders like diabetes. Conclusion: Congenital cataract predominated in boys compared to girls. Some major factors like birth injury, metabolic disorders and diabetes had greater impact in this regard. Early diagnosis , maternal care regular check up of mothers during pregnancy and adequate therapy requires specific treatment for long-term and permanent care. Keywords: Congenital cataract, Analytical study, Syndromes, Lens of eye, Slit lamp examination.
Sana Rafaqat MBBS1, Abubakar Rizwan MBBS2,Usman Siddique MBBS3
Incidence of Environmental & Metabolic Factors Causing Congenital Cataract in Children of Lahore
Sana Rafaqat
INTRODUCTION: Congenital cataract is a leading cause of child-hood blindness. Untreated cataracts in children lead to tremendous social, economical, and emotional burden to the, family, and society. [1]Blindness related to pediat-ric cataract can be treated with early identification and appropriate management.[2] Most cases are diagnosed on routine screening whereas some may be diagnosed after the parents have noticed leukocoria or strabismus. [3]Etiology of pediatric cataract is varied and diagno-sis of specific etiology aids in prognosis and effective management. Pediatric cataract surgery has evolved over the years, and with improving knowledge of my-opic shift and axial length growth, outcomes of these patients have become more predictable. Favorable out-comes depend not only on effective surgery, but also on meticulous postoperative care and visual rehabilitation. Hence, it is the combined effort of parents, surgeons, anesthesiologists, pediatricians, and optometrists that can make all the difference.[4]
Pediatric cataract is a leading cause and a treatable condition. It accounts for 7.4%–15.3% of pedi-atric blindness and a significant avertable disability of life.[4],[5] The incidence ranges from 1.8 to 3.6/10,000 per year and the median prevalence is about 1.03/10,000 children (0.32–22.9/10,000). The prevalence of child-
hood cataract is higher in low-income economies (0.63–13.6/10,000) compared to that of high-income economies (0.42–2.05/10,000). There is no difference in the prevalence based on gender or laterality.[6] It has been found that during pregnancy, 67% of the mothers had a history of illness like Diabetes and 22% had taken medications during pregnancy.[7],[8] Congenital cataract is associated with ocular abnormalities in 27% of cases and with systemic abnormalities in 22% of cases. The diagnosis of cataract is incidentally made on routine screening in 41% of cases whereas-------------------------------------------------------------------------------------------Congenital cataract predominated in boys as compared to girls. Some major factors like birth injury, meta-bolic disorders and diabetes had greater impact. Early diagnosis , maternal care regular check up of moth-ers during pregnancy and adequate therapy requires specific treatment for long-term and permanent care. -------------------------------------------------------------------------------------------
MATERIAL AND METHOD: The cross sectional study was conducted at General Hospital Lahore from July-December 2017. Children aging 5-15 were included in this study who had rubella syndrome, herpes simplex, Birth trauma, trisomy 21, Nance-Horan syndrome. Snellen chart, light perception, ophthalmology and slit lamp exam-ination were used to diagnosed CC factors like rubella, toxoplasmosis, herpex simplex etc. SPSS version 20.00 was used for analysis in which chi square test was used to assess the association of genetic and environmental factors with congenital cataract. Variables were age, gender infection and genetic syndromes. Convenient
-------------------------------------------------------------------------------------------1.Medical Officer, Shalamar Hospital Lahore 2. Medical Officer Basic Health Unit Goleki 3. Medical Officer Akhtar Saeed Hospital Lahore -------------------------------------------------------------------------------------------Correspondence: Dr. Sana Rafaqat Medical Officer, Shalamar Hospital Lahore Email [email protected] Phone: 0333 55592817-------------------------------------------------------------------------------------------Received: April’2018 Accepted June.2018-------------------------------------------------------------------------------------------
ORIGINAL ARTICLE

Ophthalmology Update Vol. 16 No.4, Oct - Dec 2018 833
Incidence of Environmental & Metabolic Factors Causing Congenital Cataract in Children of Lahore
sampling was used for data collection the patients (congenital cataract) who came in study period were included in this study. Children of age more that 15 having cataract were excluded from study. Congenital cataract is hereditary in 8.3%–25% of cases, with 75% being autosomal dominant in inher-itance.[13] Autosomal-dominant cataracts have varying amounts of penetrance. Autosomal-dominant cata-ract includes hyper-ferritinemia cataract syndrome, Coppock-like, Volkmann-type congenital, zonular with sutural, posterior polar, anterior polar, cerule-an, zonular pulverulent, crystalline aculeiform, and myotonic dystrophy like cataracts. Autosomal-re-cessive cataract includes Warburg micro syndrome, Hallermann–Streiff syndrome, Martsolf syndrome, Smith–Lemli-–Opitz syndrome, Rothmund–Thom-son syndrome, Marinesco–Sjogren syndrome, Wilsons disease, Facial dysmorphism and neu-ropathy. X-linked recessive cataract includes Nance–Horan syndrome (NHS) and Norrie’s disease.[14],[15] Crystallin and Connexin gene mutations are the most commonly described non-syndromic inherited cataracts. Alpha-crystallin gene mutation results in nu-clear, lamellar, zonular, and posterior polar cataracts.[16] β-crystallin gene mutation presents with variable phe-notypic presentations. Anterior polar cataracts are seen with PAX6 mutations whereas PITX3 mutations mainly cause posterior polar cataracts.[17] Other genes responsi-ble for major syndromic cataracts include OCRL (Lowe syndrome),[18]GALK117q (galactosemia),[19]GLA (Fab-ry’s disease),[20] and NHS (Nance–Horan cataract–den-tal syndrome).[21] Congenital cataracts with more than 40 genes and loci have been isolated.[22]
RESULT: The result shows that total 300 participants were included in this study. In which 20 patients were diagnosed with congenital cataract. Of them 15 were boys and 5 were girls. In these cases 5 were effected from birth injury , 2 from rubella, 3 from herpes sim-plex virus, 1 due to maternal torch infection, 5 due to metabolic disorders, 4 due to diabetes.Table:1 Association of environmental factors (herpes simplex) with congenital cataract Age group Environmental factors
( herpes simplex ) frequency
BilateralCataract
1-2 1 03-4 2 05-6 0 07-8 0 010-11 0 0
Interpretation: In these 3 cases 2 were 3-4 year old and no body had bilateral cataract.
Table :2 Metabolic factor association with cataract Age group Environmental
factors(Diabetes )frequency
Bilateral Cataract
1-2 2 13-4 1 05-6 1 17-8 0 0
10-11 0 0Interpretation: The result shows that in 20 cases 4 had cataract due to diabetes and two patients of age group of 1-2 year and 5-6 year respectively had bilateral cat-aract.
Table:3 Association of environmental factors (birth
trauma) with cataractAge group Environmental factors
( birth trauma ) frequency
Bilateral Cataract
1-2 3 03-4 1 05-6 0 07-8 0 010-11 0 0Interpretation: The result shows that in between 20 cas-es 3 patients of age group of 1-2 year had birth trauma history. No body had bilateral cataract.
DISCUSSION: Out of the 300 cases examined, 20 patients were diagnosed with congenital cataract .In these cas-es 5 were effected from birth injury , 2 from rubella, 3 from herpes simplex virus, 1 due to maternal torch in-fection,5 due to metabolic disorders, 4 due to diabetes. Similarly another study was conducted by Shagufta. N in Karachi in which Of the 38,000 cas-es examined, 120(0.3%) patients were diagnosed with congenital cataract. Of them, 52(43.33%)were aged be-tween 2 and 5 years,22(18.33%) <11 years and 10(8.33%) 15 years. Bilateral congenital cataract was observed in 91(75.83%) patients and unilateral congenital cataract in 29(24.17%). Environmental factors caused 72(62.07%) cases and genetic factors caused 44(37.93%).[17] A study was conducted by Brigitte. H in Den-mark in which In a cohort of 2.9 million children, 1027 cases of congenital/infantile cataract were identified. Of the children in those cases, 629 were born in Den-mark and had ICI. Bilateral isolated cataract cases were male dominated (62%; 95% confidence interval [CI], 56%–69%) but not unilateral isolated cases (40%; 95% CI, 34%–47%). Older age (≥40 years) of mothers at de-livery and caesarean section increased the risk of ICI

Ophthalmology Update Vol. 16 No.4, Oct - Dec 2018834
Incidence of Environmental & Metabolic Factors Causing Congenital Cataract in Children of Lahore
cataract. Low birth weight (<2000 g) was associated with a 10.6-fold (95% CI, 6.99–16.10) increased risk of bilateral, but not unilateral, ICI cataract. No significant associations were found with birth order, month/place of birth, or cigarette smoking during pregnancy.[18] A study was conducted by Jugnoo.S in 2012 in US in which Of 243 children with newly diagnosed congenital or infantile cataract, 160 (66%) had bilateral disease. Isolated cataract was more common in bilater-al than unilateral cases (61% versus 47%, P = 0.05) as was cataract associated with a systemic disorder (25% versus 6%, P < 0.001). Conversely, cataract with associ-ated ocular anomalies was more common in unilateral than bilateral cases (47% versus 14%, P < 0.001). No un-derlying or associated risk factors for cataract could be identified in 92% of unilateral and 38% of bilateral cas-es, although putative prenatal and perinatal risk factors were reported in a proportion of these idiopathic cases. Hereditary disease was associated with 56% of bilateral but only 6% of unilateral cases. Prenatal infections and other systemic factors were reported in only 6% of bi-lateral and 2% of unilateral cases.[19]
CONCLUSION: Congenital cataract predominated in boys compared to girls. Some major factors like birth in-jury, metabolic disorders and diabetes had great-er impact in this regard. Early diagnosis, ma-ternal care regular check up of mothers during pregnancy and adequate therapy requires specif-ic treatment and long-term and permanent care.
REFERENCES:1. Thylefors B. A global initiative for the elimination of avoidable
blindness. Am J Ophthalmol. 1998;125:90–93. 2. Taylor D. Congenital cataract: the history, the nature and the
practice. The Doyne Lecture. Eye. 1998;12:9–36. 3. Foster A, Gilbert C. Epidemiology of visual impairment in
children. Taylor D eds. Paediatric Ophthalmology. 1997; 2nd ed. 3–12. Blackwell Science London.
4. Pike MG, Jan JE, Wong PKH. Neurological and developmental findings in children with cataracts. Am J Dis Child. 1989;143:706–710.
5. Phillips CI, Levy AM, Newton M, Stokoe NL. Blindness in schoolchildren: importance of heredity, congenital cataract, and prematurity. Br J Ophthalmol. 1987;71:578–584.
6. Bryars JH, Archer DB. Aetiological survey of visually handicapped children in Northern Ireland. Trans Ophthalmol Soc UK. 1977;97:26–29.
7. Merin S, Crawford JS. The etiology of congenital cataracts. Can J Ophthalmol. 1971;6:178–182.
8. Angra SK. Etiology and management of congenital cataract. Indian J Pediatr. 1987;54:673–677.
9. Eckstein M, Vijayalakshmi P, Killedar M, Gilbert C, Foster A. Aetiology of childhood cataract in southIndia. Br J Ophthalmol. 1996;80:628–632.
10. Harley JD, Hertzberg R. Aetiology of cataracts in childhood. Lancet. 1965;1:1084–1086.
11. Office of Population Censuses and Surveys. Congenital malformations statistics: notifications 1991. Series MB3 No. 7. London: Her Majesty’s Stationery Office; 1993.
12. Evans J. Causes of blindness and partial sight in England and Wales 1990–91: Studies on Medical and Population Subjects No 57. London: Her Majesty’s Stationery Office; 1995.
13. Hall DM. Health for All Children. 1996; 3rd ed. Oxford University Press Oxford, UK. Report of the Third Joint Working Party on Child Health Surveillance
14. British Paediatric Surveillance Unit. British Paediatric Surveillance Unit 11th Annual Report 1996–1997. London: Royal College of Paediatrics and Child Health; 1997.
15. Godward S, Dezateux C. Validation of the reporting bases of the orthopaedic and paediatric surveillance schemes. Arch Dis Child. 1996;75:232–236.
16. Rahi JS, Dezateux C, for the British Congenital Cataract Interest Group. Capture–recapture analysis of ascertainment by active surveillance in the British Congenital Cataract Study. Invest Ophthalmol Vis Sci. 1999;40:236–239. [PubMed]
17. World Health Organisation (WHO). International Statistical Classification of Diseases and Health Related Problems. 1992; World Health Organisation Geneva. 10th Revision
18. Lambert SR, Drack AV. Infantile cataracts. Surv Ophthalmol. 1996;40:427–458.
19. Lloyd IC, Goss–Sampson M, Jeffrey BG, Kriss A, Russell–Eggitt I, Taylor D. Neonatal cataract: aetiology, pathogenesis and management. Eye. 1992;6:184–196.
20. Kirkwood BR. Essentials of Medical Statistics. 1988; 1st ed. Blackwell Scientific Oxford, UK

Ophthalmology Update Vol. 16 No.4, Oct - Dec 2018 835
Factors Responsible for Delayed Presentation of Strabismus in Patients aging up to 16 Years
ABSTRACTObjective: To determine the factors responsible for delayed presentation of strabismus in patient’s age group up to 16 years. It was a hospital based cross sectional studyMaterials and Methods: A comprehensive pre designed questionnaire was used to collect data from parents of affected children. Questionnaire enlisted different factors/reasons which can be assumed to be responsible for the delayed presentation of squint in children. Patients from both the genders were included in our study i.e <16 years age. The delayed presentation defined for our study is i-e a child presenting with ocular deviation of more than 3 months. All patients with delayed presentation of squint whose age is equal or less than 16 years presenting to pediatric ophthalmology OPD were included in our study after the verbal consent from the parents/guardians.Results: Total patients were 12 out of which 8 (66.6%) were male and 4(33.3%) were female. Between age 1-5 there were 25% patients.16.6% were with the age of 6-10 years. 58.33% patients were with the age of 10-16 years. In primary causes unawareness contributed 50%. Poverty contributed 25%. Unavailability of health care services in hometown contributed 8.3% and fear of surgery contributed 16.6%.In secondary causes unavailability of healthcare services contributed 41.8%. Poverty contributed 16.6%. fear of surgery contributed 16.6% and ignorance contributed 25%. Conclusion: Strabismus not only affects the outlook of a person cosmetically but also produces negative effect on patient visual acuity. Untreated squint is the leading cause of Amblyopia in childhood. It is concluded that primary cause of delayed presentation is unawareness and the secondary cause is lack of health care facilities.
Hikmatullah BVS., M. Phil
Factors Responsible for Delayed Presentation of Strabismus in Patients aging up to 16 Years
Hikmatullah
INTRODUCTION: Strabismus is a disorder in which the eyes do not line up in the same direction when focusing. The condition is more commonly known as Crossed Eyes. Childhood squint is a common ophthalmic disorder, if untreated; the squint can cause amblyopia and perma-nent loss of useful vision. Studies have reported the prevalence of amblyopia to be as high as 50% in chil-dren with esoptropia and 20% in children with exotro-pia. In most cases the treatment of squint involves the correction of refractive error and occlusion therapy to improve vision and squint surgery if required. Despite the importance of early detection and intervention, child with squint in developing countries present late. Strabismus is common ophthalmic disorder affecting 3-4% of children1
Gohney G.B1 had listed accommodative esotro-pia (27.9 %) and intermittent exotropia (16.9%) as the common form of squint in children. Squint can have
physiological and visual morbidity related due to cos-metic effect and ultimate amblyopia respectively. Wil-liam Cetal concluded in the study that amblyopia and squint remain common causes of vision problems in children2. Amblyopia reported prevalence is 1.6-3.6, 3 lower socioeconomic status is reported to be a risk fac-tor having amblyopia and convergent squint 2. .Simons K also reported higher incidence of amblyopia in the underserved (medically) population of the community 3.at the time he related early detection of the amblyopia to the ultimate visual outcome in amblyopia 3.
-------------------------------------------------------------------------------------------The primary cause of delayed presentation squint is unawareness and lack of health care Ophthalmic fa-cilities.------------------------------------------------------------------------------------------- However negative effect related to squint can only be prevented if squint management is initiated early by timely intervention for treating amblyopia and cosmetic correction. Early management can only be possible if the patient presentation is not delayed. WUC and Hunter DG also concluded that early detec-tion and outcome4. At the same time early detection can prevent squint related amblyopia and so ultimately de-crease the work load faced by eye care professionals. Factors which can cause delayed presentation of squint may be related socio- economic and cultural values. Our society is underprivileged, poorly served (medi-
-------------------------------------------------------------------------------------------Lecturer Optometry, Pakistan Institute of Community Ophthalmology H,M,C Peshawar. -------------------------------------------------------------------------------------------Correspondence: Hikmatullah. Optometerist, Lecturer Optometry, Pakistan Institute of Community Ophthalmology H,M,C Peshawar. [email protected] Cell: 03149231432. Address: Pakistan institute of community Ophthalmology (PICO) hayatabad Medical Complex HMC Phase 4 hayatabad Peshawar.-------------------------------------------------------------------------------------------Received: July’2018 Accepted: Sep’2018-------------------------------------------------------------------------------------------
ORIGINAL ARTICLE
Ophthalmology Update Vol. 16 No.4, Oct - Dec 2018836
Factors Responsible for Delayed Presentation of Strabismus in Patients aging up to 16 Years
cally), with higher illiteracy and expected to have poor health awareness or lack of health education compared to developed countries. Cultural and social values also vary versus developed nations. Social disadvantage is important cause of ill health in the world.
METHODOLOGY: It was a hospital based cross sectional survey. A comprehensive pre-designed questionnaire was used to collect data from parents of affected children. Ques-tionnaire enlisted different factors/reasons which can be assumed to be responsible for the delayed presen-tation in children. Patients from both the gender were included in our study i.e <16 years age. The delayed presentation defined for our study is i.e a child pre-senting with ocular deviation of more than 3 months. All patients with delayed presentation of squint whose age is equal or less than 16 years presenting to pediatric ophthalmology OPD were included in our study after the verbal consent from the parents/guardians.Inclusion criteria: All the children with delayed pre-sentation of squint of age group equal or less than 16 years were included in the study.Exclusion criteria: All mental and retarded patients were excluded from this study.Data was collected from 2nd September 2013 to 21st Oc-tober 2015 and analyzed by EPI info.RESULTS:
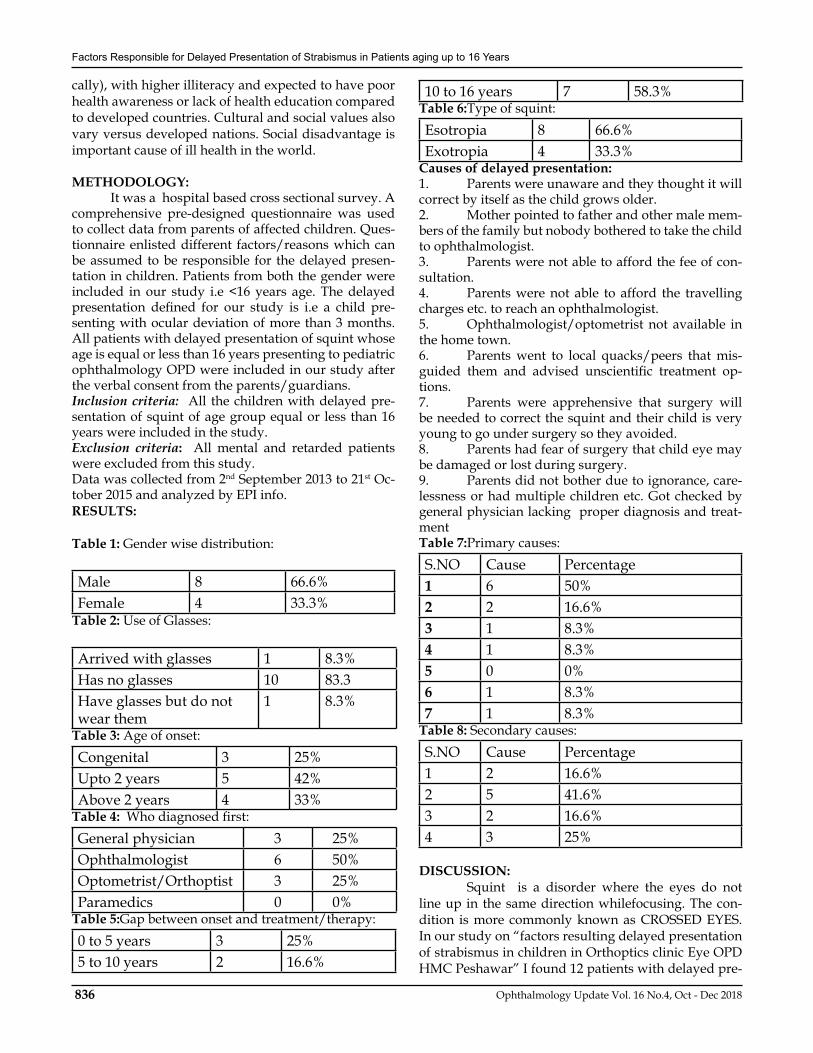
Table 1: Gender wise distribution:
Male 8 66.6%Female 4 33.3%
Table 2: Use of Glasses:
Arrived with glasses 1 8.3%Has no glasses 10 83.3Have glasses but do not wear them
1 8.3%
Table 3: Age of onset:Congenital 3 25%Upto 2 years 5 42%Above 2 years 4 33%
Table 4: Who diagnosed first:General physician 3 25%Ophthalmologist 6 50%Optometrist/Orthoptist 3 25%Paramedics 0 0%
Table 5:Gap between onset and treatment/therapy:0 to 5 years 3 25%5 to 10 years 2 16.6%
10 to 16 years 7 58.3%Table 6:Type of squint:Esotropia 8 66.6%Exotropia 4 33.3%
Causes of delayed presentation:1. Parents were unaware and they thought it will correct by itself as the child grows older.2. Mother pointed to father and other male mem-bers of the family but nobody bothered to take the child to ophthalmologist.3. Parents were not able to afford the fee of con-sultation.4. Parents were not able to afford the travelling charges etc. to reach an ophthalmologist.5. Ophthalmologist/optometrist not available in the home town.6. Parents went to local quacks/peers that mis-guided them and advised unscientific treatment op-tions.7. Parents were apprehensive that surgery will be needed to correct the squint and their child is very young to go under surgery so they avoided.8. Parents had fear of surgery that child eye may be damaged or lost during surgery.9. Parents did not bother due to ignorance, care-lessness or had multiple children etc. Got checked by general physician lacking proper diagnosis and treat-mentTable 7:Primary causes:S.NO Cause Percentage 1 6 50%2 2 16.6%3 1 8.3%4 1 8.3%5 0 0%6 1 8.3%7 1 8.3%
Table 8: Secondary causes:S.NO Cause Percentage 1 2 16.6%2 5 41.6%3 2 16.6%4 3 25%
DISCUSSION: Squint is a disorder where the eyes do not line up in the same direction whilefocusing. The con-dition is more commonly known as CROSSED EYES. In our study on “factors resulting delayed presentation of strabismus in children in Orthoptics clinic Eye OPD HMC Peshawar” I found 12 patients with delayed pre-

Ophthalmology Update Vol. 16 No.4, Oct - Dec 2018 837
Factors Responsible for Delayed Presentation of Strabismus in Patients aging up to 16 Years
sentation of squint. Out of these 12 patients 8 (66.6%) presented Esotropia and 4 (33.3%) patients presented Exotropia. So the ratio of Exotropia and Esotropia was 1:2. Study at Agha Khan University Karachi Paki-stan observed 107children with squint presented be-tween 2000and 2007; of these 52 (48.6%) were boys and 55 (51.4) were girls. Convergent squint was the most common type of squint, and it presented in 63.6% (68/107) cases. 15 children had pseudo squint , the re-maining 92 (76.1%) had alternating squint, while 23.9 % had unilateral or constant squint. 84 (91.3%) children had tropia while 8 (9.7%)had phoria. Overall alternat-ing esotropia was the most common type of squint fol-lowed by alternating esotropia4
Secondary causes of delayed presentation were such that 5 (41.8%) patients were presented late be-cause of unavailability of health services in the home town.2(16.6%) patients were presented late because of poverty.2 (16.6%)patients were delayed because of fear of surgery and 3 (25%) were presented late because their parents had multiple children and the parents were careless and ignorant. This shows that unawareness and lack of health care facilities are the main factors resulting the delayed presentation of strabismic children.Males are more affected than females and Esotropia is more common than Exotropia and the age in which the patients are more affected is 10-16 years.
CONCLUSION: Strabismus not only affects the aesthetic out-look of a person cosmetically but also produces neg-ative effect on visual acuity. Untreated squint is the leading cause of Amblyopia in childhood. The primary cause of delayed presentation is unawareness and the secondary cause is lack of health care facilities.
REFERENCES:1. Williams C, Northstone K, Howard M, Harvey I, Harvard RA,
Sparrow JM. Prevalence and risk factors for common vision
problems in children: Data from ALSPAC study.Br J opthalmology 2008, 92:959-964.
2. Simons K. Amblyopia characterization, treatment and prophylaxis. Survopthalmology 2005, 50(2):123-166.
3. WUC, Hunter DG Amblyopia: Diagnostic and therapeutic options.AM J opthalmology 2006, 141:175-184.
4. Abbasoglu OE, Sener EC, sanac S AS, factors influencing the successful outcome in strabismus surgery. Eye 1996, 10:316.
5. Sen DK, Strabiscope (India) 1995, 2(3):21.6. Alchair-H et al. Randomized field study of the etiology of
strabismus concomitants. Wein-klin-wochanschr (obtained from midline (R). Jan decv1993), 1992, 104(19):600.
7. Smith LK, Thomson JR ,woodruff G and Hiscox F. Social deprivation and eye at presentation in amblyopia. J-Public-Health-Med 1994, 16(3):348.
8. Abrahamson M, Fabian G, Sjostrand J. Refracting changes in children developing convergent or divergent strabismus. Brjopthalmology 1992, 76(12):723.
9. Chan-oy, Edwards –M, refraction referral criteria for Hong Kong Chinese preschool children, ophthalmic-physio-opt. 1994, 14(3):249.
10. Duke elders, Wybar K. Abnormal ocular motility in duke elder S.W Wybar K, eds. Ocular motility strabismus, system of ophthalmology. London, Kimpton 1973, 6:577.
11. Chia A, Roy L, Senyen L, Comitant horizontal an Asian perspective Br J Opthalmology 2007 ,91:1337-40.
12. Robari D, kifley A, Miotchell P. factors associated with a previous diagnosis of strabismus in a population based sample of 12 years old Australian children Am J opthalmology 2006;142:1085-8.
13. Donahue sp. Clinical practice. Pediatric strabismus. N Eng. J med 2007, 356:1040-7.
14. Robaei D, Huynh SC, Kifley A, Mitchell. Correctable and non-correctable visual impairment in a population based sample of2 years old Australian children AM j opthalmology 2006, 142:112-118.
15. Robaei D, Rose KA, Kifley A. factors associated with childhood strabismus, finding from a population based study ophthalmology 2006, 113:114:-1153.
16. Mittleman D. Amblyopia pediatric edition North Am 2003, 50: 189-196.
17. Varma R, Deneen J, cotter S, the multi ethnic pediatric eye disease study design and methods, ophthalmic epidemiology 2006, 142:495-497.
18. Tollefson MM, Gohney BG, Diehk NN, Burke JP, Incidence and types of childhood hypertropia population based study. Ophthalmology 2006, 113:1142-1144.
19. Robari D, kifley A, Miotchell P. factors associated with a previous diagnosis of strabismus in a population based sample of 12 years old Australian children Am J opthalmol 2006;142:1085-8
Ophthalmology Update Vol. 16 No.4, Oct - Dec 2018838
Effect of Anterior Sub-Capsular Polishing during a Standard Phacoemulsification on Anterior Capsular Opacification
ABSTRACTObjective: This study was carried out to assess the effect of anterior sub-capsular polishing on Anterior Capsular Opacification(ACO), which can cause anterior capsular phimosis, decentration of IOL and visual deterioration.Method: This prospective randomized control study compared in 100 eyes of 50 consecutive patients with bilateral age related cataract who underwent phacoemulsification. One eye had anterior capsular polishing (group 1) and second eye (controlled group) comprised without anterior capsular polishing (group 2, control group) ACO was evaluated at 01 week, 01months and 06 months.Results: After 01 week there was no difference in the development of ACO in the two groups. At 04 weeks follow up 2 patients in group 1 had ACO as compared to 20 in control group( P<0.001) and at 06 months follow up group 1 had 5 cases of PCO as compared to 24 cases in control group (P<0.001)Conclusion: Anterior capsular Opacification is significantly lower in patients in whom anterior sub-capsular polishing was done.Key words: Age related cataract, Anterior capsular polishing, Anterior capsular Opacification, Phacoemulsification.
Inam ul Haq FCPS, MHPE1, Misbah Durrani MCPS,FCPS2, Jahanzeb Durrani DO.,MS3
Effect of Anterior Sub-Capsular Polishing during a Standard Phacoemulsification on Anterior
Capsular Opacification(A randomized control study)
Inam ul Haq
INTRODUCTION: Phacoemulsification is the standard cataract extraction technique1 performed all over the world. Ad-vances in IOL designs coupled with surgical techniques has significantly reduced posterior capsular opacifica-tion. Despite the reduction in PCO, anterior capsular opacification is still seen after phacoemulsification2,3,4 especially in comparative younger age group. Fibrosis of anterior capsule cause contraction of capsulorhexis opening and capsular retraction. This leads to reduc-tion in free optic zone and de-centration of IOL5 and IOL induced astigmatism. Chances of PCO are also increased. Therefore removal of anterior lens capsular epithelial cells during phacoemulsification is becoming increasingly important to reduce the chances of ACO and Yag capsulotomies.
-------------------------------------------------------------------------------------------Anterior capsular opacification is significantly low-er in patients after anterior sub-capsular polishing of A.C., opacification can lead to de-centration of IOL. It is considered to be more important in multifocal/trifocal IOL’s implantation as de-centration affects the surgical outcome.-------------------------------------------------------------------------------------------MATERIAL AND METHODS: This randomized control study was carried out at the eye department of CMH Okara. 100 eyes of 50 patients with bilateral age related cataract who went uncomplicated phacoemulsification in both eyes, were selected for this study. Informed consent was obtained from all patients. Inclusion Criteria: Patients older than 45 years with bilateral age related uncomplicated cataract and pupil dilating more than 7 mm, underwent uncomplicated/standard phacoemulsification with aspheric hydrophil-ic acrylic IOL, in the bag implantation were included for this study.Exclusion Criteria: Patients with pseudo-exfoliation, shallow anterior chambers, secondary cataracts, glau-coma, diabetes mellitus, posterior polar cataracts, high myopias( axial length 27mm or more), previous ocular surgeries, sub-luxated lens, non dilating pupils and corneal opacities resulting in visual disturbance during
-------------------------------------------------------------------------------------------1.Associate Professor of Ophthalmology, Al-Shafa Trust Eye Hospital, Rawalpindi 2. Assistant Professor, Diagnostic Radiology, BB Hospital, Rawalpindi 3. Assistant Professor of Ophthalmolgy,HBS Medical & Dental College, Islamabad-------------------------------------------------------------------------------------------Correspondence: Dr Inam ul Haq. Associate Professor of Ophthalmology, Al-Shafa Trust Eye Hospital, Rawalpindiinamkhan98@gmail.com.03009661066-------------------------------------------------------------------------------------------Received: June’2018 Accepted Sept’2018-------------------------------------------------------------------------------------------
ORIGINAL ARTICLE

Ophthalmology Update Vol. 16 No.4, Oct - Dec 2018 839
Effect of Anterior Sub-Capsular Polishing during a Standard Phacoemulsification on Anterior Capsular Opacification
surgery. . Patients not willing for cataract surgery in both eyes were excluded from the study. During sur-gery those patients in whom IOL edge was not covered by capularhexis edge in both the eyes and either eye in which there was intra-operative complication like P.C. tear were also excluded from the study. After uncomplicated standard Phacoemulsi-fication and implantation of IOL, all enrolled patients were randomly assigned to group 1, anterior capsular polishing beneath the capsularhexis edge in one eye and within one month phacoemulsification on the oth-er eye with no capsular polishing were in control group 2. Anterior capsular polishing of the capsular-rhexis edge was done beneath the capsule in nasal, temporal and lower quadrants and superiorly as much as pos-sible. A single experienced surgeon performed all the surgeries. Emulsification was performed with OERTLI, Catarhex Easy phacoemulsifier using standard surgical technique6,7,8, this was followed by irrigation and aspi-ration to ensure complete removal of cortex. Aspheric hydrophilic acrylic IOL was implanted in the bag. In the polish mode parameters vacuum 150 mmHg, flow rate 12ml/min the undersurface of anterior capsule was polished in nasal, inferior, temporal and as far as possible in superior quadrants. The probe of the irriga-tion/aspiration hand piece was mechanically touched to the capsular edge and dislodged cortical fibers were removed. Post operatively standard postoperative re-gime comprising of Moxifloxacin with Dexamethasone combination eye drops were given to all patients. ACO was evaluated on slit lamp examination with oblique illumination at x12 magnification at 01 week, 04 weeks and 06 months using Werner et al9 criteria. ACO was graded on a scale 0-4 in the area where rhexis edge was in contact with IOL optic. Grade 0, no opacifica-tion; grade 1, only minor opacification of capsular edge; grade 2, diffuse opacification with folds; grade 3, in-tense opacification with folds; grade 4, constriction of opacified rhexis edge.
RESULTS: The mean age of the patients was 58±3 years. Edge of the IOL optic remained covered by the rhex-is edge at 06 months in all the patients. At one week there was no significant difference in ACO between the two groups. At one month follow up irrespective of the grade of ACO 02 (4%) patients in group 1 had ACO and 20 patients (40%) in group 2 i.e. control group had ACO ( P value <0.001), significant P value. After 06 months, irrespective of the grade of ACO 05 (10 %) patients in group 1 had ACO and 24 patients (48 %) in group 2 i.e. control group had ACO (P value <0.001), significant P value, Table 1.Table 1
Anterior Capsular Opacification
ACO Present ACO Absent
01 week Group 1 0 50 Group 2 0 50
04 weeks Group 1 02 (4%) 48 (96%) Group 2 20 (40%) 30 (60%)
06 months Group 1 05(10%) 45(90%) Group 2 24 (48%) 26 (52%)
As far as grading of ACO is concerned, over-all 90% of patients in group 1 had no opacification as compared to 52% in group 2, i.e. control group. Grade 1 opacification was seen in 4% of patients in group 1 as compared to 20% in group 2(control group).
Figure1
Group 2 patient afer 04 weeks of surgery.Grade 2 opacification was noted in 4% of patients in group 1 as compared to 20% in group 2. Grade 3 opaci-fication was noted in 2% of patients in group 1 as com-pared to 6% in group 2 and in no patient in group 1, grade 4 opacification was noted as compared to 2% pa-tients in group 2. Extent of opacification in majority of patients (40%) in group 2 was in grade 1 and 2, Table 2. The difference in extent of opacification between the two groups is significant, P value < 0.001, highlighting the polishing of anterior sub-capsular area during a standard phacoemulsification procedure.Table 2
Grades of ACO Group 1 Group 2
0 45 (90%) 26 (52%)
1 02 (4%) 10 (20%)
2 02 (4%) 10 (20%)
3 01 (2%) 03 (6%)
4 01 (2%)
Total 50 50

Ophthalmology Update Vol. 16 No.4, Oct - Dec 2018840
Effect of Anterior Sub-Capsular Polishing during a Standard Phacoemulsification on Anterior Capsular Opacification
DISCUSSION: Anterior capsular opacification is the opacifi-cation of residual anterior capsule after center curvi-linear capsularhexis. It starts in the first postoperative month and continues for 6 months10. IOL material and designs are important factors in causingACO11,12. It is more pronounced with silicone IOL with sharp edges or plate haptic silicone design. It is lowest with acryl-ic IOL13. The incidence of ACO is high with retinitis pigmentosa14 and diabetic patients15. Capsular opacifi-cation occurs due to migration, proliferation and dif-ferentiation of remaining epithelial cells (LECs)16. Re-maining LECs tend to go under normal differentiation and consequently form heterogeneous group of cells in the anterior and posterior capsular opacification. These myofibroblast type of cells cause fibrosis and contrac-tion of the capsule17. If there are remaining LECs, their contact with IOL optic cause their fibrosis leading to fi-brotic type of capsular opacification3,4,10,13. 18
Figure 2Fibrosis of anterior capsule cause contraction of the cap-sularhexis opening leading to buttonholing of the IOL optic therefore free optic zone is reduced. In extreme cases there would be de-centration of IOL and induced astigmatism. It can also extend on to posterior capsule leading to PCO4,12. It is more important when we use multifocal IOL, as their centration is more important19 and capsular traction can decenter IOL. In the modern spotless phacoemulsification intra-operative remov-al of LECs has gained more importance than before. Several methods has been used, e.g. use of scratchers, use of vacuum to suck out the LECs, cryo coagulation, ultrasound techniques, chemical application14,20 , and polishing with the help of I/A hand piece, which com-bines mechanical as well as vacuum cleaning of under surface of anterior capsule. There are several factors which influence the development of AC &PCO. However age and gender has no influence on the development of opacification. It is seen mostly in diabetic patients21, although the severity of diabetes has no influence on it22. Incidence of opacification is high in uveitis patients23,24, in these patients use of hydrophobic acrylic IOL has better vi-
sual outcome than silicone, PMMA or heparin coated IOLs25. Incidence of ACO & PCO is highest in patients with myotonic dystrophy26 and retinitis pigmentosa27. In traumatic cataract the incidence of ACO& PCO is as high as 92% at three years follow up, as quoted in some studies28. Polishing of anterior sub-capsule is effective in reducing the incidence of fibrotic capsular opacification but is shown to have minimal effect in reducing regen-eratory capsular opacification29. However it is assumed if regeneratory epithelium is removed there are less minimal chances of their proliferation and henceforth opacification. ACO occurs earlier than PCO. It can occur as early as 01 month after phacoemulsification30. It has been seen that shrinkage of anterior capsule during first 04 weeks is followed by a slower progressive reduction of opacification in the next 06 months31. ACO develops in spite of polishing due to proliferation and migration of residual LECs at the equatorial region, which are dif-ficult to remove with our present techniques. Howev-er it is suggested that these cells have minimal role in opacification of anterior capsule. LECs that proliferate to cause opacification are those close to the capsular-hexis. Kruger et al 32 suggest in their study that the polished LECs are not removed immediately by aspi-ration, remain dispersed in the OVD and are liable to adhere to capsule and later on proliferate and migrate. Menapace et al3 have found in their study that ACO rates are significantly lower in polished eyes as com-pared to unpolished eyes in subsequent follow up ex-aminations.
CONCLUSION: Anterior capsular Opacification is significantly lower in patients in whom anterior sub-capsular pol-ishing is done. Anterior capsular opacification can lead to de-centration of IOL. Therefore Anterior capsular polishing is considered to be even more important in multifocal or trifocal IOL implantation as decentra-tion of IOL affects the result of surgery.
REFERENCES:1. Park TK, Chung SK, Baek NH. Changes in the area of the
anterior capsule opening after intraocular lens implantation. J Cataract Refract Surg 2002; 28: 1613–1617.
2. Sacu S, Menapace R, et al. Influence of optic edge design and anterior capsule polishing on posterior capsule fibrosis. J Cataract Refract Surg 2004; 30: 658–662.
3. Bolz M, Menapace R, et al. Effect of anterior capsule polishing on the posterior capsule opacification-inhibiting properties of a sharp edged, 3-piece, silicone intraocular lens: three- and 5-year results of a randomized trial. J Cataract Refract Surg 2006; 32: 1513–1520.
4. Sacu S, Findl O, Menapace R. Assessment of anterior capsule opacification: photographic technique and quantification. J Cataract Refract Surg 2002; 28: 271–275.

Ophthalmology Update Vol. 16 No.4, Oct - Dec 2018 841
Effect of Anterior Sub-Capsular Polishing during a Standard Phacoemulsification on Anterior Capsular Opacification
5. Marcantonio JM, Vrensen GF. Cell biology of posterior capsular opacification. Eye 1999; 13: 484–488.
6. Meucci G, Esente S, Esente I. Anterior capsule cleaning with an ultrasound irrigating scratcher. J Cataract Refract Surg 1991; 17: 75–79.
7. Arshinoff SA. Dispersive-cohesive viscoelastic soft shell technique. J Cataract Refract Surg 1999; 25(2): 167–173.
8. Vasavada AR, Raj S. Step-down technique. J Cataract Refract Surg 2003; 29(6): 1077–1079.
9. Vasavada A, Singh R. Step-by-step chop in situ and separation of very dense cataracts. J Cataract Refract Surg 1998; 24(2): 156–159.
10. Werner L, et al. Anterior capsule opacification: correlation of pathologic findings with clinical sequelae. Ophthalmology 2001; 108: 1675–1681.
11. Kimura W, Yamanishi S, Kimura T, Sawada T, et al. Measuring the anterior capsule opening after cataract surgery to assess capsule shrinkage. J. Cataract Refract Surg. 1998 Sep; 24 (9): 1235.
12. Saika S, Miyamoto T, Ohnishi Y. Histology of anterior capsule opacification with a polyHEMA/HOHEXMA hydrophilic hydrogel intraocular lens compared to poly(methyl methacrylate), silicone, and acrylic lenses. J. Cataract Refract Surg. 2003 Jun; 29 (6): 1198.
13. Sacu S, Menapace R, Buehl W, Rainer G F, et al. Effect of intraocular lens optic edge design and material on fibrotic capsule opacification and capsulorhexis contraction. J. Cataract Refract Surg. 2004 Sep; 30 (9): 1875.
14. Werner L, et al. Anterior capsule opacification: correlation of pathologic findings with clinical sequelae. Ophthalmology. 2001 Sep; 108 (9): 1675.
15. Jackson H, Garway-Heath D, Rosen P, Bird AC, et al. Outcome of cataract surgery in patients with retinitis pigmentosa. Br. J. Ophthalmol. 2001 Aug; 85 (8): 936.
16. Elgohary MA, Hollick EJ, Bender LE, Heatley CJ, et al. Hydrophobic acrylic and plate-haptic silicone intraocular lens implantation in diabetic patients: pilot randomized clinical trial. J. Cataract Refract Surg. 2006 Jul; 32 (7): 1188.
17. Marcantonio JM, Vrensen GF. Cell biology of posterior capsular opacification. Eye 1999; 13: 484–488.
18. Azuma N, Hara T, Hara T. Extracellular matrix of opacified anterior capsuleafter endocapsular cataract surgery. Graefes Arch Clin Exp Ophthalmol 1998; 236(7): 531–536.
19. Shetal M, et al, Post-Operative Capsular Opacification: A Review. I J B S, vol. 3 no. 4. Dec 2007, 238
20. Baumeister M, et al.Tilt and decentration of three-piece foldable high-refractive silicone and hydrophobic acrylic intraocular lenses with 6-mm optics in an intra-individual comparison. Am. J. Ophthalmol. 2005 Dec; 140 (6): 1051.
21. Miyake K. Proposal for an ideal surface modification of IOLs. Eur J Implant Refract Surg 1990; 2: 209–212
22. Ebihara Y, et al. Posterior capsule opacification after cataract surgery in patients with diabetes mellitus. J. Cataract Refract Surg. 2006 Jul; 32 (7): 1184.
23. Hayashi K, Hayashi H, Nakao F, Hayashi F. Posterior capsule opacification after cataract surgery in patients with diabetes mellitus. Am. J.Ophthalmol. 2002 Jul; 134 (1): 10.
24. Hayashi K, Yoshida M, Hayashi H. Posterior capsule opacification in myopic eyes. J. Cataract Refract Surg. 2006 Apr; 32 (4): 634
25. Rahman I, Jones NP. Long-term results of cataract extraction with intraocular lens implantation in patients with uveitis. Eye. 2005 Feb; 19 (2): 191.
26. Alio JL, et al; International Ocular Inflammation Society, Study Group of Uveitic Cataract Surgery. Comparative performance of intraocular lenses in eyes with cataract and uveitis. J. Cataract Refract Surg. 2002 Dec; 28 (12): 2096
27. Garrott HM, Walland MJ, O’Day J. Recurrent posterior capsular opacification and capsulorhexis contracture after cataract surgery in myotonic dystrophy. Clin. Experiment Ophthalmol. 2004 Dec; 32 (6):653.
28. Auffarth GU, Nimsgern C, Tetz MR, Krastel H, et al. [Increased cataract rate and characteristics of Nd: YAG laser capsulotomy in retinitis pigmentosa. Ophthalmologe. 1997 Nov; 94 (11): 791.
29. Krishnamachary M, Rathi V, Gupta S. Management of traumatic cataract in children. J. Cataract Refract Surg. 1997; 23 Suppl 1: 681.
30. Menapace R, Wirtitsch M, Findl O, Buehl W, et al. Effect of anterior capsule polishing on posterior capsule opacification and neodymium:YAG capsulotomy rates: three-year randomized trial. J. Cataract Refract Surg. 2005 Nov; 31 (11): 2067.
31. Hara T, Azuma N, Chiba K, Ueda Y, Hara T. Anterior capsular opacification after endocapsular cataract surgery. Ophthalmic Surg 1992; 23: 94–98.
32. Hansen SO, Crandall AS, Olson RJ. Progressive constriction of the anterior capsular opening following intact capsulorhexis. J Cataract Refract Surg 1993; 19: 77–82.
33. Kruger AJ, Amon M, Schauersberger J, Abela-Formanek C, Schild G, Kolodjaschna J et al. Anterior capsule opacification and lens epithelial outgrowth on the intraocular lens surface after curettage. J Cataract Refract Surg 2001; 27: 1987–1991.

Ophthalmology Update Vol. 16 No.4, Oct - Dec 2018842
Comparative Evaluation of IOP with an Air-Puff Tonometer vs Goldmann Applanation Tonometer
Nesr Farooq
ABSTRACT:Purpose: Intraocular pressure (IOP) measurement is an integral part of routine ocular examination and one of the important diagnostic criteria for glaucoma. Since the diagnosis of glaucoma involves lifestyle modifications and financial implications for the individual as well as the health system. So we felt a need to develop a standardized system before labeling the patient as glaucoma patient keeping in view the wide variety of gadgetry available to measure IOP.Patients and Methods: The study involved 200 eyes from 100 patients. All of whom were attending an ophthalmic outpatient clinic. Topcon air puff tonometer CT-800 and Goldmann applanation tonometer (GAT) were used in our study and the difference between the readings were recorded.Results: A comparison was made between IOP measured by GAT vs AP tonometer. The mean IOP measured by GAT was 13.26+4.114 while that measured by AP tonometer was 16.123+6.421 mean difference between the two methods was 2.864+2.436. We observed that the reading by AP tonometer were significantly higher as compared to those obtained by GAT in 76% of patients and this was most significant when IOP exceeded 21 mmHg there was no significant statistic difference of IOP with reference of patient age, sex, and laterality. Conclusion: We reached the conclusion that IOP measured with GAT and AP tonometer is statistically significant. GAT still remains the most suitable method of measuring IOP, regardless of patient’s age, sex and laterality of eye. Since measurements by AP tonometer was higher than GAP. It is more suitable for IOP screening in large communities.Key words: Tonometry, comparison, glaucoma, goldmann applanation tonometery, Air puff tonometer.
Nesr Farooq FCPS1, Assad Zaman Khan FCPS2, Mohammad Azeem Ansari FCPS3.
Comparative Evaluation of IOP with an Air-Puff Tonometer vs Goldmann Applanation Tonometer
INTRODUCTION Measurement of intraocular pressure (IOP), is one of the essential procedures in ophthalmic clinics, it is essential parameter in glaucoma diagnosis. IOP varies among individuals with diurnal variations.1 IOP is maintained by the equilibrium between aqueous hu-mor formation and outflow, and by episcleral venous pressure.2It is essential to maintain optimum IOP.3The aqueous humor nourishes cornea and lens as well as tra-becular meshwork.4 The shape of eyeball is maintained by the IOP.5 The aqueous humor provides a transparent medium between the cornea and lens and also contrib-utes to the refractive apparatus of the eye.6The non pig-mented ciliary epithelium secretes aqueous humor at a rate of 2-3 uL per minute.3 In humans the anterior cham-ber has a volume of 250-300uL. Aqueous humor turn-over is 2.5 uL per minute that is about 1% of anterior
chamber volume.7Epidemiologic studies indicate that mean IOP is approximately 16mmHg however these pooled data have a non-Gaussian distribution with a skew tendency towards higher pressure especially in the above 40 population the value of 22mmHg has been considered in the past as the line behavior normal and abnormal pressure to determine which patients require hypotensive agents. This division is based on the fact that glaucomatous damage caused by pressure higher than normal and normal pressure do not cause dam-age.8
-------------------------------------------------------------------------------------------IOP measured with Goldmann Applanation Tonom-eter (GAT) and Air-puff tonometer (AP) tonometer is statistically significant. GAT still remains the most suitable method of measuring IOP, regardless of pa-tient’s age, sex and laterality of eye. Since measure-ments by AP tonometer was higher than GAT. It is more suitable for IOP screening in large communities.-------------------------------------------------------------------------------------------Screening method based exclusively on IOP reading may miss a significant number of people in the screen-ing group. It is a general consensus that no clear line exists between safe and unsafe IOP. Some eyes under-go damage at an IOP of 18mmHg or less, on the other hand other eyes tolerate IOP in the 30s. Amongst all the risk factors IOP is the only factor that can be altered at
------------------------------------------------------------------------------------------1. Assistant Professor, Shalamar Medical & Dental College, Lahore2. postgraduate trainee, Children hospital and institute of child health, Lahore3. Senior Registrar , Shalamar Medical & Dental College, -------------------------------------------------------------------------------------------Correspondence: Dr. Nesr Farooq, Assistant Professor, Shalamar Medical And Dental College, Shalamar Medical & Dental College, Lahore Lahore E.Mail>[email protected] 0321 4845759-------------------------------------------------------------------------------------------Received: April’2018 Accepted. June ‘2018-------------------------------------------------------------------------------------------
ORIGINAL ARTICLE

Ophthalmology Update Vol. 16 No.4, Oct - Dec 2018 843
Comparative Evaluation of IOP with an Air-Puff Tonometer vs Goldmann Applanation Tonometer
this time.8
The IOP varies by 2-6 mmHg in the course of a day over 24 hours as aqueous humor production-changes. Greater fluctuations occur with a higher IOP and a diurnal fluctuation of 10 mm or more is highly suggestive of glaucoma. Most individuals reach their peak IOP in the morning hours while other do so in afternoon, evening or even while sleeping. In some in-dividuals there is no reproducible pattern.8
IOP is one of the most important risk factor for devel-opment and progression of glaucoma.9 Pharmacologic and surgical intervention is the only evidence based treatment modality which may slow progression of vi-sual field of an already established glaucoma.10There-fore IOP measurement by tonometer is essential in oph-thalmological assessment but despite IOP reduction glaucoma may continue to progress, therefore indicat-ing other factors may play an important role in patho-genesis of glaucoma.11
Applanation tonometer is based on inbertfick principle, which states that perfect sphere has its inter-nal pressure equally distributed and that external force needed to flatten a known area of sphere is directly pro-portional to the internal pressure of sphere.12 The most commonly used tonometer for glaucoma assessment is goldmann applanation tonometer (GAT). It consist of double prism mounted on standard slit lamp 2. With GAT the force required to applanate a constant area of cornea is measured and related to IOP. The GAT uses an applanation diameter of 3.06 mm and is performed with patient seated at the slit lamp. Air-puff tonometer is an applanation method using standardized puff of air to flatten the cornea. This method does not require any topical anaesthetic and also reduces the risk of corneal perforation.14 This system comprises of central air plenum flanked on both sides by light emitter and light detector. When the pres-sure of air pulse on the cornea increases it tries to de-form the corneal surface, the corneal surface behaves like a plane surface reflecting light to the light detector. The corneal applanation is measured by collecting light reflected from the central cornea. The parallel beam of light is directed on the central cornea at an angle of 300 and reflected light is measured by photo detector at an angle of reflection of 300.The reflected beam of light will be strongest at this angle when the cornea is flat and acting as a plane mirror rather than a curved mirror. This instrument records the amount of force of air to flatten cornea and displace IOP that corresponds to the force. The AP tonometer is used at a fix distance from the cornea.8The instrument has an optical alignment system to facilitate this.16An AP tonometer can be por-table or non portable17and also minimizes the risk of trans infection by the tonometer tip. However the force of air puff can aerosolize the tear film and may theoreti-cally transfer virus by airborne route.13 The primary ob-
jective of study was to identify the difference between IOP reading taken by AP and Applanation tonometer. Keeping in view the increasing trend of recording IOP by air puff method.
MATERIAL AND METHODS This was a comparative study using a conve-nience sample. Study population comprise 200 eyes from 100 patients who reported to an ophthalmic eye patient clinic for various eye conditions. The patients (35 males, 65 females) had an age range of 17 to 80 years, and mean age was 41+16.16 years. All the individuals were free from corneal diseases. Following were the ex-clusion criteria: uncooperative patients who were not willing for IOP measurement by either method, those with severe visual loss unable to maintain fixation, those with severe visual loss, history of intraocular sur-gery, known case of glaucoma, history of anti-glauco-ma medication, patients with astigmatism of more than 3 diopters were excluded from the study.18 Informed consent was taken from each patient to participate in the study.Technique: IOP was measured in all patients using both types of tonometers AP and GAP and difference was recorded. The AP tonometer used was Topcon CT-800 noncontact tonometer and Goldmann tonometer used was Haag-Streit. An average of 3 readings was taken to get the IOP value. IOP assessment with GAP was taken soon after AP tonometer reading to prevent bias due to reduced IOP caused by applanation. Prior to measure-ment by GAP local anaesthetic 0.5% eye drops were in-stilled to anaesthetized the eyes. A fluorescence strip was also applied to the inferior conjunctival fornix for a few seconds. The contact time with applanation probe was kept below 5 seconds to minimize lowering effect of ocular message by repeated applanation. All read-ings were taken between 9AM to 1PM and the same clinician took both the readings by both instruments. The collected data was classified in to 3 groups according to the IOP measurements. Group I consist-ed of IOP less than 12mmHg Group II consisted of IOP 12-24 mmHgand Group III IOP greater than 24 mmHg. The difference in readings between the two devices was calculated for each patient in each group. Classification of data was based on patient’s age, sex and laterality. The data was analyzed using statistical software (SPSS v17). The paired t-test was used and P value of less than 0.05 was considered as statistically significant.
RESULTS The data obtained from 200 eyes in this study achieved the following results. The mean IOP value for all patients when measured by GAT was 13.26+4.114, with a range of 7-29 mmHg. While that measured by AP tonometer was 16.123+6.421 with a range of 8-30 mmHg. The mean difference between the two methods

Ophthalmology Update Vol. 16 No.4, Oct - Dec 2018844
Comparative Evaluation of IOP with an Air-Puff Tonometer vs Goldmann Applanation Tonometer
was 2.864+2.436.The difference of IOP reading taken by two devices was statistically significant (P0.001)(Ta-ble1). In 76% of patients the IOP measured by AP to-nometer was higher than that measured by GAT (Table 2).
Table I Mean intraocular pressure (IOP) values for study participants, as measured by Goldmann appla-nation tonometer (GAT) and air-puff tonometer
Measure IOP
GAT (mmHg)* 13.26+4.114
Air –puff tonometer (mmHg) * 16.123+6.421
p-value 0.001 Note:* Data presented as mean plus or minus standard deviation.
Table 2 Intraocular pressure (IOP) values measured by air-puff tonometer as related to those measured by Goldmann applanation tonometer (GAT)
IOP measurement by air-puff tonometer
Patients (%)
Right eyes
Left eyes
Below GAT measurement 4% 5% 6%
Equal to GAT measurement 20% 18% 19%
Above GAT measurement 76% 77% 75% This study reached a conclusion that IOP mea-surement by AP tonometer was higher than that mea-sured by GAT. It showed that IOP values measured with AP tonometer were higher as compared with a GAT, more so when the GAT IOP measurement ex-ceeded 21mmHg and this difference was statistically significant (P less than 0.0001).
Table: 3 Right eye in study: mean intraocular pressure (IOP) as measured by Goldmann applanation tonom-eter (GAT), mean IOP as measured by air-puff to-nometer (APT), and the difference (DIFF) between the two readings according to three groups of IOP values (Group I [GI],<12 mmHg; Group 2 [G2], 12-21 mmHg; and Group 3 [G3], >21 mmHg).
G1 G2 G3 P- value
GAT 16.22 11.87 19.47 0.03
APT 12.11 13.83 26.15 0.37
DIFF 4.11 1.96 6.68 0.0001
Table 4 Left eye in study: mean intraocular pressure (IOP) as measured by Goldmann applanation tonom-eter (GAT), mean IOP as measured by air-puff to-nometer (APT), and the difference (DIFF) between the two readings according to three groups of IOP values (Group I [GI],<12 mmHg; Group 2 [G2], 12-21 mmHg; and Group 3 [G3], >21 mmHg).
G1 G2 G3 P- value
GAT 14.20 13.88 17.93 0.004
APT 10.51 14.10 23.76 0.19
DIFF 3.69 1.84 5.84 0.0001
DISCUSSION: GATs and AP tonometers are the most frequently used devices to measure IOP in routine practice. AP to-nometers are comparatively easy and less cumbersome to use for the patients as well as the examiners as com-pared to GAT. It is felt that the tendency to take IOP by AP tonometer is on the rise. The study shows that there is significant difference in measurements of IOP be-tween GAT and AP tonometer. The readings obtained by AP tonometer were higher than those obtained by GAT in 76% of patients in this study. There was an in-crease in difference between the two instruments when GAT measurement increased above 21mmHg Several studies have compared IOP measure-ments obtained with GAT and those by noncontact tonometers.19-23Lagerlof23showed that noncontact to-nometer readings were found to be unreliable between 20 and 30mmHg.Martinez-de-la-Casa et al20 compared IOP measurement taken by noncontact tonometer with GATs and concluded that mean measurement with GAT was lower than mean noncontact tonome-ter measurement. Firat etal’s19 study reached conclu-sion that noncontact tonometer measurements were higher as compared to GAT measurement. Tonnuet al21showed that 0.7mmHg was the mean difference in IOP between the GAT and AP tonometer measure-ments.The mean difference between the two devices was 2.864+2.436mmHg as shown by the present study. Rao22 showed that when IOP was <20 mmHg the non-contact tonometer gave more accurate readings. There was no statistical difference between IOP measured by GATs and AP tonometer in terms of pa-tient sex or laterality of eye. Some studies have found out that IOP is equal irrespective of gender.24,25Howev-er some studies have found greater IOP reading in fe-males as compared to males with difference increasing after 40 years. 26
AP tonometers are easier to use and some models are automatic as well, that means without the need of operator. They are also noninvasive without the need of topical anesthetic or fluorescence with minimal risk of infection or risk of corneal abrasion. Repeated mea-surements do not reduce IOP unlike the message effect that happens with applanation tonometer. IOP mea-surement may be performed by an ophthalmic assistant under ophthalmologist supervision however if AP to-nometer reading is abnormally high, reading should be checked and repeated by another device before giving final opinion.

Ophthalmology Update Vol. 16 No.4, Oct - Dec 2018 845
Comparative Evaluation of IOP with an Air-Puff Tonometer vs Goldmann Applanation Tonometer
CONCLUSION The GAT remains more suitable and reliable device for IOP measurement it is the international gold standard for measuring IOP. IOP measurement by AP tonometer is usually higher than GAT readings. Irre-spective of Age, Sex or laterality of the eye, therefore AP tonometer is suitable for mass screening of the eyes. Considering this difference in IOP measurement be-tween AP and GAT. The rising trend of using AP to-nometer in outpatient clinics is of concern. One should be aware that AP tonometer can produce significantly higher readings and all medical personals using this equipment should be aware of this.
REFERENCES1. Parker JN, Parker PM, editors. Ophthalmology: A Medical
Dictionary, Bibliography and Annotated Research Guide to Internet References. San Diego, CA: ICON Health Publications; 2004:210.
2. Khurana AJ, Khurana I. Anatomy and Physiology of the Eye, 2nd ed. New Delhi, India: CBS; 2006:71–80.
3. American Academy of Ophthalmology.2007–2008 Basic and Clinical Science Course Section 2: Fundamentals and Principles of Ophthalmology. San Francisco, CA: American Academy of Ophthalmology; 2007:315–322.
4. Kaufman PL, Alm A, editors. Adler’s Physiology of the Eye: Clinical Application, 10th ed. St Louis, MO: Mosby; 2009:237.
5. Northrop RB. Noninvasive Instrumentation and Measurement in Medical Diagnosis. Boca Raton, FL: CRC Press; 2002:271–272.
6. Goel M, Picciani RG, Lee RK, Bhattacharya SK. Aqueous humor dynamics: a review. Open Ophthalmol J. 2010;4:52–59.
7. Mitra AK, editor. Ophthalmic Drug Delivery Systems, 2nd ed. New York, NY: Marcel Dekker; 2003:224–225.
8. American Academy of Ophthalmology.Practicing Ophthalmologists Curriculum: Glaucoma, basic and clinical science course; 2007–2008. San Francisco, CA: American Academy of Ophthalmology; 2007:22–25.
9. Nucci C, Osborne NN, Bagetta G, Cerulli L, editors. Glaucoma: An Open Window to Neurodegeneration and Neuroprotection. Progress in Brain Research. Philadelphia: Elsevier; 2008;173:25.
10. Nakamura Y, Ishikawa S, Nakamura Y, Sakai H, Henzan I, Sawaguchi S. 24-hour intraocular pressure in glaucoma
patients randomized to receive dorzolamide or brinzolamide in combination with latanoprost. ClinOphthalmol. 2009;3:395–400.
11. Topouzis F, Founti P. Weighing in ocular perfusion pressure in managing glaucoma. Open Ophthalmol J. 2009;3:43–45.
12. Benjamin WJ, editor. Borish’s Clinical Refraction, 2nd ed. Butterworth- Heinemann; 2006:501–503.
13. Morrison JC, Pollack IP, editors.Glaucoma Science and Practice. New York, NY: Thieme Medical Publishers; 2003:60–64.
14. Crick RP, Khaw PT. A Textbook of Clinical Ophthalmology: A Practical Guide to Disorders of the Eyes and Their Management, 3rd ed. Singapore: World Scientific; 2003:557.
15. Weinreb RN, Brandt JD, Garway-Heath DF, Medeiros FA, editors. World Glaucoma Association: Intraocular Pressure; Consensus Series 4. The Hague, The Netherlands: Kugler Publications; 2007:22–23.
16. Elkington AR, Frank HJ, Greaney MJ. Clinical Optics, 3rd ed. Oxford: Blackwell Science; 1999:205–207.
17. Kanski JJ, Bowling B. Clinical Ophthalmology: A Systematic Approach, 7th ed. Philadelphia: Elsevier; 2011:315–644.
18. Whitacre MM, Stein R. Sources of error with use of Goldmann-type tonometers. SurvOphthalmol. 1993;38(1):1–30.
19. Firat PG, Cankaya C, Doganay S, et al. The influence of soft contact lenses on the intraocular pressure measurement.Eye (Lond). 2012; 26(2):278–282.
20. Martinez-de-la-Casa JM, Jimenez-Santos M, Saenz-Frances F, et al. Performance of the rebound, noncontact and Goldmannapplanationtonometers in routine clinical practice. ActaOphthalmol. 2011;89(7):676–680.
21. Tonnu PA, Ho T, Sharma K, White E, Bunce C, Garway-Heath D. A comparison of four methods of tonometry: method agreement and interobserver variability. Br J Ophthalmol. 2005;89(7):847–850.
22. Rao BS. Clinical evaluation of the non-contact tonometer and comparison with Goldmannapplanation tonometer.Indian J Ophthalmol. 1984;32(5):432–434.
23. Lagerlöf O. Airpuff tonometry versus applanation tonometry. ActaOphthalmol (Copenh). 1990;68(2):221–224.
24. Krieger N, Ketcher G, Fulk GW. Physiological variables affecting intraocular pressure in a population study. Am J OptomPhysiol Opt. 1988;65(9):739–744.
25. Shields MB, editor. Intraocular Pressure and Tonometry: Textbook of Glaucoma, 3rd ed. Baltimore, MD: Williams and Wilkins; 1992:53–83.
26. Qureshi IA. Intraocular pressure: a comparative analysis in two sexes. Clin Physiol. 1997;17(3):247–255.

Ophthalmology Update Vol. 16 No.4, Oct - Dec 2018846
Prevalence of Counseling Effect to Promote Spectacle use in Shujabad (Multan)
ABSTRACTBackground: Refractive error is a state in which parallel rays of light are not being focused at retina while accommodation is at rest. Spectacles and contact lenses are used to correct refractive errors. Uncorrected refractive errors cause asthenopic symptoms, strabismus, amblyopia and even blindness.Purpose: The purpose of this study is to check effects of counseling on spectacles use. We create awareness about importance of spectacles and complications of uncorrected refractive errors. Method: This study was conducted from October 2017 to May 2018 at THQ (Tehsil Head Quarter) Hospital, Shujabad. Visual acuity was checked by using snellens’ chart and objective refraction using autorefractometer and retinoscope. Subjective refraction was performed with 1% tropicamide eye drops to dilate the pupils to check detail of fundus examination . A total of 50 subjects whose visual acuity was below 6/6, with normal fundus, previously not using spectacles, were included in the study. Then 25 subjects were counseled with their spectacles. Second group consist of those 25 participants in which counseling was not performed.. Follow up of these patients after 15 days to check the effect of counseling comparing the follow up results in counselor and non counselor groups .Results: Out of 50 participants 31 (62%) are males and 19 (38%) are females, 18 (36%) are above 40 years of age which have visual impairement did not use spectacles. 17 individual ((34%) are between 7 to 25 years of age, 15 individuals (30 %) are between 25 to 40 years of age. Out of 25 counselor group 14 (56%) participants came on follow up with their spectacles. Out of 25 non counselor group 3 (12% ) participants came on follow up with their spectacles. Conclusion: The results of this study shows counseling had better affect on spectacles utilization. Counseling create knowledge and awareness in non spectacle users , and motivate them to use spectacles to relieve from asthenopic symptoms .Keywords: Refractive error , Asthenoptic symptoms ,Strabismus , Amblyopia , Snellen chart, Auto refractometer , Retinoscope .
Sehar Ijaz M.Phil (Optometry) 1, Prof. Ijaz Latif FCPS2 ,Mahlab Ijaz. Mphil (Public Health),3 Amir Ali Choudary FCPS4 ,
Mehmood Hussain FCPS5
Prevalence of Counseling Effect to Promote Spectacle use in Shujabad (Multan)
Sehar Ijaz
INTRODUCTION: A refractive error is a very common eye dis-order. It occurs when the eye cannot clearly focus the images from the outside world. The result is blurred vision, which is sometimes so severe that it causes visu-al impairment (WHO.int, 2018). Millions of people de-prived of facility to avail basic and necessory diagnosis of refractive errors. By counseling to promote the use of spectacles in their lives and routine work, we can save
a lot of population being blind. Our sole responsibility is to give our maximum output to these people.-------------------------------------------------------------------------------------------There is a strong effect of counseling on spectacles utilization which can be increased by creating aware-ness .------------------------------------------------------------------------------------------- Common cause of preventable blindness is un-corrected refractive errors. Most of people don’t have a lot of information regarding the benefits of spectacles use. By correcting refractive errors and counseling to use spectacles vision can be rescued. In Pakistan, there is huge number of population which have uncorrect-ed refractive errors in a large number of population belonging to different age gender and ethnicities. (Jag-gernath and Naidoo, 2012) , Hashemi et al., 2017. There is high prevalence of uncorrected refractive errors in rural areas, there is less health care facilities (Hashemi et al., 2017) Globally 153 million of people above age of 5 years are visually impaired because of uncorrected re-
-------------------------------------------------------------------------------------------1.Optometrist THQ Hospital Shujabad 2. Prof and Head of Ophthalmology, BVH.,Q.A.Medical College, Bahawalpur3. Optometrist, Sight Centre Bahawalpur 4.Head, School of Optometry/Ophthalmology in Madinah Teaching Hospital, Faisalabad.5. Assistant Professor in Ophthalmology Department. Madinah Teaching Hospital Faisalabad.-------------------------------------------------------------------------------------------Correspondence: Ms. Sehar Ijaz, THQ Hospital Shujabad Disst. Multan, 5-A, Medical Colony,Bahawalpur E.Mail. [email protected], Cell: 03054494858, 03028680788-------------------------------------------------------------------------------------------Received July’2018 Accepted: August’2018-------------------------------------------------------------------------------------------
ORIGINAL ARTICLE

Ophthalmology Update Vol. 16 No.4, Oct - Dec 2018 847
Prevalence of Counseling Effect to Promote Spectacle use in Shujabad (Multan)
fractive errors, out of 153 million people, 8 million are blind due to uncorrected refractive error( Resnikoff et al, 2008). Uncorrected refractive error have impact on their quality of life, affected individuals impose heavy burden on their family and society due to loss of man-power. uncorrected refractive errors can cause ambly-opia, also affect their educational , occupational and physcal performance. (Jaggernath and Naidoo, 2012 , Hashemi et al., 2017).
METHODOLOGY: This study was conducted from October 2017 to May 2018 at THQ (Tehsil Head Quarter) Hospital, Shujabad. Visual acuity was checked by using snellens’ chart and objective refraction using autorefractometer and retinoscope. Subjective refraction was performed with 1% tropicamide eye drops to dilate the pupils to check detail of fundus examination . A total of 50 subjects whose visual acuity was below 6/6, with normal fundus, previously not using spectacles, were included in the study. Then 25 subjects were counseled with their spectacles. Second group consist of those 25 participants in which counseling was not performed.. Follow up of these patients after 15 days to check the effect of counseling comparing the follow up results in counselor and non counselor groups .
Vision is important for daily activities and one of the major serious disabilities is visual impairment . Visual impairment at birth and during childhood can influence communication, learning, employment, phys-ical condition and the quality of life . Their effects are frequently lifelong (Pi et al., 2012, Brown et al., 2003). There are several factors for uncorrected refractive er-rors like lack of awareness and acknowledgment of problem at individual, society level and public health level; non-availability or inability to afford refractive services for checking; improper availability of correc-tive lenses; and cultural taboo which are barrier for ef-fective compliance ( Resnikoff et al, 2008). Broman et al.,( 2002) defined the association of visual impairment and eye disorder on vision linked quality of life. Subjective refraction was completed by autorefractometer. ETDRS use is to measure distance visual acuity. Individuals were questioned by means of using normal feedback form to measure standard of life. Uncorrected refractive error were demarcated to have difference of more than two lines among person’s visual acuity and best corrected visual acuity. 4774 members were involved in normal age for sample was 56.9 years . Individuals having uncorrected refractive error, cataract, diabetic retinopathy and glaucoma had reduced quality of life . Chia et al., (2003) resolute the effect of unilat-eral visual impairment on health associated quality of life, a population centered survey were completed in the city in the age group of 49 years or older. Individu-als reported for complete eye checkup as well as visual
acuity measurement. Normal quality of life question-naire were sent to them before checkup. Complete data of 3108 members was available. 7.3% individuals have unilateral visual impairment and had lesser score on quality of life questionnaire as compared to those who were unimpaired. Shah et al.,( 2008) showed first reliable estimat-ed spectacle coverage in Pakistan (visual acuity around 6/12) was 15.1%. which indicate refractive services are not covering the greater part of the population Hubley ( 2018)effective eye health promotion involves a com-bination of three components: health education direct-ed at behavior change to increase adoption of preven-tion behaviors and uptake of services; improvements in health services such as the strengthening of patient education and increased accessibility and acceptability; and advocacy for improved political support for blind-ness prevention policies. Moreover no studies have been conducted on prevalence of refractive errors, visual impairment and ocular services given in Shujabad, Punjab. There is an economic and health disparities in Shujabad and also known little knowledge on eye health disorders. Re-sults from this study will help to fill the gap of aware-ness and guide the program designers to make sure equally access of eye care facility to people of Shujabad. In order to increase utilization of spectacles, we can give awareness by counseling in Shujabad. Uncor-rected refractive error is of major public health issue and quick measures are needed to address the problem. In this study we see prevalence of counseling effect to promote spectacles use. Patients coming in eye OPD of THQ Shujabad were included in the study .First we took brief patient history and VA was recorded us-ing Snellen chart and refractive status was checked using auto-refractometer and retinoscope. Subjective Refraction will be done to correct the refractive error at 6 meter of distance and recorded in Snellens’ nota-tion for fundoscopy, patient will be dilated using 1% tropicamide and will be examined by Ophthalmologist . Counsel the patient to use of spectacles and follow up the patient to check the effect of counseling. In previous studies it shows that the percentage of refractive error was 55.56. In this total percentage of emmetropia, myopia , high myopia and hypermetropia values were 53.1%, 27.4%, 2.6%, and 16.9%, respectively (Natung et al., 2017). Another studies showed that out of total, 89.06% was hyperopic, 6.61% was myopic and 4.33% was emmetropic (Popov I, 2018). Another studies showed that simple Myopia was present in 35.1% of this study sample, simple hyperopia in 31.8%, astigma-tism in 32.3% and anisometropia in 13.5%. The preva-lence of myopia decreased, while the prevalence of hyperopia, astigmatism and anisometropia increased with age (Wolfram et al., 2014). In another study it was showed that the prev-alence of uncorrected refractive errors was found to be 23.97% among males and 20% among females.

Ophthalmology Update Vol. 16 No.4, Oct - Dec 2018848
Prevalence of Counseling Effect to Promote Spectacle use in Shujabad (Multan)
The prevalence of visually disabling refractive errors was 6.89% in males and 5.71% in females. The prevalence was seen to increase with age, with maximum prevalence in 51-60 years of age group. Simple hypermetropia (10.14%) was found to be the commonest refractive error followed by simple Myo-pia (6.00%) and Astigmatism (5.6%). The prevalence of presbyopia was 57.5% (60.45% in males and 55.23% in females)-(Abdullah et al., 2018). Shah et al.,( 2008) described the limit of inci-dence of refractive error (RE) and spectacle wear and to find out the need for spectacle correction in adults (30 years or older) in Pakistan. Multi-stage, cluster random sampling national survey was used. Every subject had their medical history of occupation, visual acuity mea-sured, and go through auto refraction, biometry and fundus examination. Those presenting visual acuity of less than 6/12 in either eye go through more detailed examination, containing corrected distance visual acu-ity measurement, those that improved from un aided VA with glasses correction along with the spectacle treatment, defined as the part of need that was met by the participant’s own spectacles. Yabumoto et al., in (2009) revealed that Ed-ucation about the need to use spectacles, continuous technical support assistance, and even psychological assistance could enhance spectacle-use compliance in children from low-income population .RESULTS:Table. Effect of uncorrected refractive error on daily activities distribution
Frequency Percent Valid Percent
Cumulative Percent
Valid
A lot 22 44.0 44.0 44.0
Little bit 21 42.0 42.0 86.0
not at all 7 14.0 14.0 100.0
Total 50 100.0 100.0 Above table revealed that 22 participants (44%) have effect of uncorrected refractive error on daily routine activities ( driving , sewing , cooking etc). 21 participants ( 42%) have little effect of uncorrected refractive error on their daily activities , this may be due to the fact that they did not need sharp vision for their tasks. Un corrected vision of 7 participants ( 14%) had no effect on their daily task , may be these person require less vision for execution of their daily activities . Chi square test between effect of counsel-ing on follow up
Chi-Square TestsValue df Asymp.
Sig. (2-sided)
Exact Sig. (2-sided)
Exact Sig. (1-sided)
Pearson Chi-Square 10.784a 1 .001
Continuity Correction 8.913 1 .003
Likelihood Ratio 11.461 1 .001
Fisher’s Exact Test .002 .001
Linear-by-Linear Association
10.569 1 .001
N of Valid Cases 50
In above table reveals effect of counseling of fol-low up cases is evaluated by Chi Square method value is .001 , which has highly significant results conclude that there is strong association between counseling and spectacles utilization. Above table contains effect of counseling on follow up case which were previously not using spectacles for uncorrected refractive errors effect their educational , professional performance.
DISCUSSION: Shah et al.,( 2008) described limit, the inci-dence of refractive error (RE) and spectacle wear and to find out the need for spectacle correction in adults (30 years or older) in Pakistan. Multi-stage, cluster random sampling national survey was used. Every subject had their medical history, visual acuity mea-sured, and go through auto refraction, biometry and fundus examination. Those that existing with visual acuity of less than 6/12 in either eye go through more detailed examination, containing corrected distance visual acuity measurement (auto refraction results located in a trial lens frame). those that improved from un aided VA with glasses, correction was determined along with the spectacle treatment, defined as the part of need that was met by the participant’s own specta-cles. The prevalence of spectacle wear in phakic participants was 4.0%, significantly lower than for those who were pseudo /aphakic (41.7%). Just over a quarter (25.8%) of spectacle wearers presenting with visual impairment (< 6/12) were capable to promote their vision when retested with their auto refraction prescription. The overall spectacle treatment(6/12 cutoff) was 15.1%.poor affordability and unawareness is the most common barrier to utilization of spectacles. In Niagara Counseling Services (2018) stated that Counseling improves your self-knowledge, well being, health, and clarity of mind. Counseling also offers the opportunity to improve your life and comes with an overall feeling of positive change that manifests into a more fulfilling and productive life. Counseling will make you feel more inspired, motivated, and orga-nized. Counseling will make you to feel ready to tackle almost anything. Another study by Hubley ( 2018) explained effective eye health promotion involves a combination

Ophthalmology Update Vol. 16 No.4, Oct - Dec 2018 849
Prevalence of Counseling Effect to Promote Spectacle use in Shujabad (Multan)
of three components: health education directed at be-havior change to increase adoption of prevention be-haviors and uptake of services; improvements in health services such as the strengthening of patient education and increased accessibility and acceptability; and advo-cacy for improved socio-political support for blindness prevention policies. Yabumoto et al., in (2009) revealed that ed-ucation about the need to use spectacles, continuous technical support, and even psychological assistance could enhance spectacle-use compliance in children from low-income population. Above discussion re-vealed that Pakistan has low spectacle coverage round about 15% ( VA=6/12) .In periphery where there is insufficient services and lack of awareness, which can be improved by creating awareness by counseling , by providing eye care services . Results of my article showed that there is strong effect of counseling on spec-tacles utilization ,P< 0.05 , which is highly significant.CONCLUSION : Above data also shows that there is strong effect of counseling on spectacles utilization, there-fore spectacles utilization can be increased by creating awareness through counseling.Recommendation. In rural areas there is much more laxity in field of eye health care and there is poor con-dition of eye health of resident in urban area . there is more population in urban area then rural area in Paki-stan . so health policy makers should take interest in eye health care of urban area of Pakistan. There should be a proper eye care service including ophthalmolo-gist, optometrist, refractionist , ophthalmic technicians , so that detailed examination of patients should be strengthened There should be a regular awareness and screening programs to create awareness and knowl-edge about their eye health and about preventable blindness through spectacle usage.
REFERENCES:1. Abdullah, A., Jadoon, M., Akram, M., Awan, Z., Azam, M., Safdar,
M. and Nigar, M. (2018). prevalence of uncorrected refractive errors in adults aged 30 years and above in a rural population in pakistan. Journal of Ayub Medical College Abbotabad-Pakistan, 27(1).
2. Broman, A.T., Munoz, B., Rodriguez, J., Sanchez, R., Quigley, H.A., Klein, R., Synder, R., West, S.K. 2002. The impact of visual impairment and eye disease on Vision-related quality of life in a Mexican-American population: Proyecto VER. IOVS. 43: 3393-3398
3. Brown, M., Brown, G., Sharma, S. and Busbee, B. (2003). Quality of life associated with visual loss. Ophthalmology, 110(6):1076-1081.
4. Chia, E.M., Mitchell, P., Rochtchina, E., Foran, S., Wang, J.J.
2003. Unilateral visual impairment and health related quality of life: the Blue Mountains eye study. Br J Ophthalmol . 87(4) : 392-395.
5. En.wikipedia.org. (2018). Refractive error. [online] Available at: https://en.wikipedia.org/wiki/Refractive_error [Accessed 26 Aug. 2018].
6. Hashemi, H., Abbastabar, H., Yekta, A., Heydarian, S. and Khabazkhoob, M. (2017). The prevalence of uncorrected refractive errors in underserved rural areas. Journal of Current Ophthalmology, 29(4):305-309.
7. Hubley, J. (2018). Eye health promotion and the prevention of blindness in developing countries: critical issues.
8. Ilardi, V. (2007). Renaissance vision from spectacles to telescopes. Philadelphia: American philosophical Society.
9. Medlineplus.gov. (2018). Refractive Errors | Astigmatism | Myopia | MedlinePlus. [online] Available at: https://medlineplus.gov/refractiveerrors.html [Accessed 26 Aug. 2018].
10. Naidoo , K.S., Jaggernath, J. 2012. Uncorrected refractive errors. Indian J Ophthalmol. 60: 432-437.
11. Niagara Counselling Services 9059885748. (2018). Benefits of Counselling. [online] Available at: http://www.niagaracounselling.org/benefits-of-counselling.html [Accessed 22 Jul. 2018].
12. Natung, T., Taye, T., Lyngdoh, L., Dkhar, B. and Hajong, R. (2017). Refractive errors among patients attending the ophthalmology department of a medical college in North-East India. Journal of Family Medicine and Primary Care, 6(3):543.
13. Nei.nih.gov. (2018). Facts About Refractive Errors | National Eye Institute. [online] Available at: https://nei.nih.gov/health/errors/errors [Accessed 26 Aug. 2018].
14. Popov, I., Valašková, J., Štefaničková, J., Krásnik, V,. (2017). Prevalence of refractive errors in the Slovak population calculated using the Gullstrand schematic eye model. Cesk Slov Oftalmo, 73(3):113-117
15. Pi, L., Chen, L., Liu, Q., Ke, N., Fang, J., Zhang, S., Xiao, J., Ye, W., Xiong, Y., Shi, H., Zhou, X. and Yin, Z. (2012). Prevalence of Eye Diseases and Causes of Visual Impairment in School-Aged Children in Western China. Journal of Epidemiology, 22(1):37-44.
16. Resnikoff ,S ., Pascolini, D., Mariotti.P .S., Pokharel.G.P. (2008). Global magnitude of visual impairment caused by uncorrected refractive errors in 2004. Bulletin of the World Health Organization, 86(1):63-70.
17. Shah, S.P., Jadoon, M.Z., Dineen, B., Bourne, R.R.A., Johnson, GJ., Gilbert, C.E., and Khan, M.D. 2008. Refractive Errors in the Adults Pakistani Population: The National Blindness and Visual Impairment Survey . Ophthalmic Epidemiology . 15: 183-190.
18. Umkelloggeye.org. (2018). Refractive Errors | Kellogg Eye Center | Michigan Medicine. [online] Available at: https://www.umkelloggeye.org/conditions-treatments/refractive-errors [Accessed 26 Aug. 2018].
19. Verywell Health. (2018). 4 Common Kinds of Refractive Error. [online] Available at: https://www.verywellhealth.com/what-is-refractive-error-3421977 [Accessed 26 Aug. 2018].
20. Wolfram, C., Höhn, R., Kottler, U., Wild, P., Blettner, M., Bühren, J., Pfeiffer, N. and Mirshahi, A. (2014). Prevalence of refractive errors in the European adult population: the Gutenberg Health Study (GHS). British Journal of Ophthalmology, 98(7):857-861.
21. WHO.int. (2018). WHO | What is a refractive error?. [online] Available at: http://www.who.int/features/qa/45/en/ [Accessed 26 Aug. 2018].

Ophthalmology Update Vol. 16 No.4, Oct - Dec 2018850
Incidence, Risk factors & Correlation of Early Rise of IOP with Visual Outcome in Post Diabetic Vitrectomy
ABSTRACT:Objective: To determine incidence, risk factors and the correlation of early rise of intraocular pressure (IOP) and visual outcome following pars plana vitrectomy (PPV) for proliferative diabetic retinopathy (PDR). Materials and Methods: A prospective longitudinal study conducted in Khyber Medical Center Dabgari Garden Peshawar carried from 1st July to 30 December 2017.The sample size was 74, they were having proliferative diabetic retinopathy and underwent Pars Plana Viterctomy (52 males and 22 females) The intraocular pressure and the best corrected visual acuity (BCVA) were recorded on day 1, week 1 and months 1, 3 and 6. The cross-tabulation and the t-test were used to evaluate the risk factors for early increase in IOP, defined as IOP ≥ 30 mmHg on day 1. The results were analyzed by different statistical tests using SPSS version 20.Results: The mean IOP on day 1 was 21.9 ± 9.9 mmHg with 15 cases (20.6%) with an early increase in IOP. The risk factors showed a significant association of the early increase of the IOP and the intra-operative elimination of the fibro-vascular frond (P = 0.004), the removal of the lens (P = 0.044) and intra-operative vitreous bleeding (P = 0.009). In the first three consecutive follow-up visits, the early increase in IOP was also associated with a consistently high IOP (P = 0.04), defined as an IOP> 21 mmHg. In addition, the difference in BCVA at 6 months between the two groups, that is, with and without an early increase in IOP was statistically significant (3.12 ± 1.53 logMAR vs. 2.12 ± 1.50 logMAR). , p = 0.026).Conclusion: The visual outcome is significantly compromised with an early increase in IOP of patients undergoing diabetic vitrectomy.Key words: diabetic retinopathy, intraocular pressure, vitrectomy
Umer Khan Orakzai FCPS1, Nazullah FCPS2 Fahad Ghayyour BVS, MPH3.
Incidence, Risk factors & Correlation of Early Rise of IOP with Visual Outcome in Post Diabetic Vitrectomy
Umer Khan Orakzai
INTRODUCTION: Many complications can occur after vitreoretinal surgery, among which an early increase in intraocular pressure (IOP) is more common, comprising in 13-40% of cases. [1-3] Several factors may be involved in the early increase in IOP. This may occur either because of the underlying predisposition to the development of glau-coma or it may be a secondary complication of vitre-oretinal surgery.[4-6] However, it remains controversial that diabetes itself may increase intraocular pressure.[7,8] Although there are still many studies showing that glaucoma exists in patients with Proliferative Diabetic Retinopathy (PDR) who underwent pars plana vitrec-
tomy (PPV),[3,9] however, to our knowledge, there is no available literature that can show the risk factors that lead to an early postoperative increase in IOP in pa-tients with PDR after PPV. The present study was de-signed to determine the incidence, risk factors and cor-relation of early increase in intraocular pressure (IOP) and visual outcome after pars plana vitrectomy (PPV) for proliferative diabetic retinopathy (PDR).-------------------------------------------------------------------------------------------Early increase in intraocular pressure (IOP) of diabet-ic viterectomies are observed more in cases with pro-longed and complex intra-operative involvement, and these cases were also significantly associated with a worse visual outcome.-------------------------------------------------------------------------------------------MATERIALS AND METHODS: It was a longitudinal prospective designed study. Adequate informed consent was obtained from all participants before the start of the study. The demo-graphic and clinical data of the patients were collected and recorded through a questionnaire. The study in-cluded PDR patients admitted in Khyber Medical Cen-ter Dabgari Garden, who underwent a standard 3-port 20-gauge PPV. Those patients were excluded from the study who had rubeosis iridis, those with “no light percep-
-------------------------------------------------------------------------------------------1 Assistant Professor Department of Ophthalmology Hayatabad Medical Complex Peshawar, Clinical Consultant Khyber Medical Center Dabgari Garden Peshawar2.. Assistant Professor Department of Ophthalmology Hayat Abad Medical Complex Peshawar 3. Senior Lecturer Department of Optometry PEF Post Graduate College Peshawar.-------------------------------------------------------------------------------------------Correspondence Dr. Umer Khan Orakzai FCPS Assistant Professor Department of Ophthalmology Hayatabad Medical Complex Peshawar, Email <[email protected] Cell: 0321 9040506 address: 3rd Floor, C15,16 Khyber Medical Center Dabgari Garden Peshawar.-------------------------------------------------------------------------------------------Received: June’2018 Accepted Sep’2018-------------------------------------------------------------------------------------------
ORIGINAL ARTICLE

Ophthalmology Update Vol. 16 No.4, Oct - Dec 2018 851
Incidence, Risk factors & Correlation of Early Rise of IOP with Visual Outcome in Post Diabetic Vitrectomy
tion” of vision, primary or secondary rhegmatogenous retinal detachment, preoperative glaucoma (defined as IOP greater than 21 mmHg) and those patients who had already had previously submitted to ocular sur-gery, including cataract surgery. A complete examination was performed and data were collected on the patient’s demographic pro-file, medical and ophthalmological history, initial inves-tigations, clinic-pathological findings, ophthalmic find-ings that included best corrected visual acuity (BCVA), biomicroscopy with slit lamp, indirect ophthalmoscopy and Goldmann applanation tonometry. Data was col-lected and registered in the pre-op questionnaire and in the follow-up. Operational notes, findings and com-plications were also completed in the questionnaire. Additional procedures that were performed during surgeries were also recorded, such as lens removal if visibility was poor, membrane segmentation and de-lamination, fibrovascular removal of the frond, silicone oil infusion (SOI). ). With the use of endocautery and temporarily raising the height of the irrigation bottle, intra-operative vitreous hemorrhage was controlled. All patients were followed for 6 months after the operation. The postoperative evaluation included follow-up on day 1, week 1 and months 1, 3 and 6 (final follow-up). The result variable IOP and BCVA were re-corded in the Goldman tonometer and the logMAR ta-ble, respectively. An early increase in IOP was defined as IOP ≥ 30 mmHg on day 1. [1,2,13] if patients who had an IOP consistently elevated any postoperative IOP> 21 mm Hg during the first three visits of consecutive fol-low-up were defined as consistent IOP. To control IOP, adequate medical or surgical intervention was neces-sary. For the sake of statistical analysis, the appropriate intervention was defined as successful if an IOP ≤ 21 mmHg was obtained. The elevated IOP was controlled by the administration of topical β-blockers, α-agonists and oral and topical carbonic anhydrase inhibitors. All possible risk factors (preoperative, intraoperative and postoperative) were recorded and included in the sta-tistical spreadsheet. The results were analyzed by dif-ferent statistical tests using SPSS version 20. All data were expressed as mean +SE. The t test was applied to calculate the X2 value of, the value of p, the relative risk and the 95% confidence interval. A p-value less than 0.05 were considered significant.
RESULTS: Total of 74 cases eyes including 52 males and 22 females were analyzed.
Table 1. Demographic and clinical parameters of all the cases enrolled in the study
Variables Mean (M) Standard Deviation (SD)
Age (years) 53 10.50
Age at manifestation of diabetes (years)
39.29 10.14
Duration of diabetes mellitus (years) 13.63 6.54
Glycosylated hemoglobin, HbA1c (%)
8 1.49
Pre-operative BCVA (logMAR) 2.43 0.88
Pre-operative IOP (mmHg) 15.72 3.10On post op at day 1, it was analyzed that the mean IOP was 21.9 ± 9.8 mmHg and 16 out of 74 cases (20.1%) were found to have an early rise in IOP, i.e., IOP ≥ 30 mmHg at day 1. On consecutive follow-up at week 1, month 1, month 3, and month 6, the mean IOP was 18.4 ± 8.1 mmHg, 18 ± 9.9 mmHg, 16.3 ±7.8 mmHg, and 16.8 ± 6.0 mmHg, respectively [Table 2]. Five out of 15 cas-es with an early rise in IOP developed a consistently raised IOP. There was a statistically significant associ-ation between early rise in IOP and consistently raised IOP (P = 0.03).
Table 2 Details of intra-operative events and postop-erative intraocular pressure of the cases enrolled in the study
VariablesIntra-operative details
N Percentage
Fibrovascular frond removal 38 52.2
Intra-operative iatrogenic breaks 15 20.6
Intra-operative vitreous bleed 27 38
Lensectomy 3 4.2
Silicon oil infusion 37 50.8
Postoperative intraocularpressure (mmHg)
Mean SD
Day 1 21.9 9.9
Week 1 18.4 8.2
Month 1 18.0 10.0
Month 3 16.3 7.9
Month 6 16.8 6.12In our study, the cases were grouped into two: group A – with an early rise in IOP, i.e., IOP ≥ 30 mmHg at day 1 (16 cases) and group B – those without any early rise in IOP, i.e., IOP < 30 mmHg at day 1 postoperative-ly (58 cases). Various preoperative and intra-operative risk factors were evaluated for any association with this early elevation in IOP [Table 3].
Table 3 Chi-square analysis of preoperative and in-tra-operative variables predicting the early elevation in intraocular pressure
Intraocular pressure ≥ 30 mmHg
P Value
Yes No
Sex MaleFemale
132
4118
0.414

Ophthalmology Update Vol. 16 No.4, Oct - Dec 2018852
Incidence, Risk factors & Correlation of Early Rise of IOP with Visual Outcome in Post Diabetic Vitrectomy
Eye Lids ODOS
88
3919
0.152
Pre Op Vit Hemorrhage
YesNo
124
509
0.461
Tractional RD YesNo
123
2435
0.072
Previous PRP YesNo
106
3523
0.662
DM T1T2
412
652
0.136
HbA1C Not Control >8Control <8
106
2236
0.010
Fibrovascularfrond removal
YesNo
142
2632
0.001
Membranedissection overmacula
YesNo
124
3820
0.942
Intra-operativeiatrogenic breaks
YesNo
511
1147
0.522
Intra-operativevitreous bleed
YesNo
115
1741
0.001
Lens removal YesNo
412
157
0.052
Silicon Oil Infusion
Yes No
115
2830
0.017
Even though the preoperative BCVA values between groups A and B were comparable (2.58 ± 0.93 logMAR vs. 2.30 ± 0.85 logMAR, respectively; P = 0.49), there ex-isted a statistically significant difference on comparing the final BCVA values between the two groups (3.12 ± 1.52 logMAR vs. 2.12 ± 1.49 logMAR, respectively; P = 0.025). Further analysis also confirmed that there was a positive correlation between IOP on the first postop-erative day and logMAR BCVA at the final (6 months) follow-up (P = 0.04, r = +0.24) [Fig. 1].
Figure 1
On sub-grouping cases into those with Silicone Oil In-fusion SOI (37 cases, 50.7%) and those without Silicone Oil Infusion SOI (36 cases, 49.3%), the mean of IOP (day 1) was 23 ± 10.5 mmHg and 21 ± 9.10 mmHg, respec-tively. However it was not statistically significant (P = 0.367). Similar was true for IOP recordings over rest of the follow-up periods, except for IOP at the week 1 fol-
low-up where this difference was found to be statisti-cally significant (P = 0.042)
Table 4 Comparison of values of intraocular pressure among the cases with and without silicone oil tampon-ade (t-test)
Mean intraocular pressure (mmHg) P Value
With Without silicone Oil Silicon Oil
Preoperative 15.56 ± 3.00 15.87 ± 3.42 0.680
Postoperative
Day 1 22.88 ± 10.45 20.77 ± 9.10 0.367
Week 1 20.17 ± 9.60 16.29 ± 5.71 0.042
Month 1 18.36 ± 10.92 17.43 ± 8.90 0.602
Month 3 16.01 ± 8.36 16.32 ± 7.34 0.87
Month 6 16.98 ± 5.54 16.37 ± 6.59 0.68
DISCUSSION: The common complication of post retinal surgery is the early increase in intraocular pressure (IOP),(10-12) The current study was performed to deter-mine the risk factors that attribute to the early increase of the IOP and its impact on visual outcome, mainly in Pars Plana Vitrectomy (PPV) in PDR patients.(13) Controversial statement by de Corral et al. shows that diabetes mellitus is not related to the in-crease in IOP, (14) while Ando found that diabetic pa-tients are more likely to elevate intraocular pressure after surgery, especially those who are aphakic. (15) The present study also confirms that the constant elevated IOP of> 21 mmHg during the first three consecutive follow-up visits (visits on day 1, week 1 and month 1). Some studies show that those patients who have ele-vated IOP postoperatively on day 1 are more likely to consistently elevate IOP, ie, IOP> 21 mmHg beyond 3 weeks of follow-up, (13) In addition, contradictory find-ings of mention studies, changes in clinical practice and development in instrumentation and skills make it dif-ficult to extrapolate information from previous studies to current clinical practice. The present study emphasizes the postopera-tive elevation of IOP in series of cases, particularly an early increase in IOP in patients undergoing PPV due to various complications of proliferative diabetic reti-nopathy. The findings of the present study show that 20.6% of the cases had an early increase in IOP. These statistics are comparable to previous studies that have findings of 14.8-35.6% of cases that develop an early in-crease in IOP after PPV. (10-12) The present study reveals that cases that had an early increase in IOP have a per-sistently elevated IOP (p = 0.03), these findings were also reported in a previous study.(13) The findings were proven that 6 of 16 cases with an early increase in IOP developed a persistent increase in IOP that required

Ophthalmology Update Vol. 16 No.4, Oct - Dec 2018 853
Incidence, Risk factors & Correlation of Early Rise of IOP with Visual Outcome in Post Diabetic Vitrectomy
medical or surgical treatment. Although no preoperative risk factors were found that could contribute to the early increase in IOP, it was observed that 11 out of 16 patients who had Trac-tional Retinal Detachment (TRD) had an early increase in IOP with very little importance of (P = 0.007). Some factors during vitrectomy surgery that were associated with an early increase in IOP included lens extraction (P = 0.044), fibrovascular removal of the frond (P = 0.004), and intra-operative vitreous bleeding (P = 0.009). The detailed statistical analysis of intra-operative variables shows that 39 of 74 cases (52.2%) underwent intra-oper-ative fibrovascular resection of the frond. Intra-opera-tive vitreous hemorrhage was found in 25 cases (63.3%) of these 39 cases, 12 cases (29%) had intra-operative rupture and 3 cases (5.4%) required intra-operative lens removal due to intra-operative visualization problems. These procedures in themselves suggest a complicated diabetic vitrectomy that involves more intra-operative manipulations and prolonged surgery can compromise the functioning of the ciliary body and the trabecular meshwork. Based on the above findings, it is more reasonable that an early increase in intraocu-lar pressure IOP in post diabetic vitrectomies is inflam-mation and an impairment of the erythroblastic trabec-ular meshwork and edema of the ciliary body leading to relative pupillary block. It is important that one be aware of the com-promise of the visual result due to a high IOP. The study shows that it is likely that cases with an early increase in IOP have a worse visual outcome result, which shows a significant positive correlation between logMAR final BCVA and IOP on day 1 (P = 0.05, r = +0.25). This phenomenon was previously discussed that an early increase in IOP is more likely to have per-sistently increased IOP that requires medical or surgi-cal treatment, leading to poorer BCVA at 6 months of follow-up. One of the outstanding findings of the present study is that silicone oil was not significantly associat-ed with the early increase in IOP (p = 0.18). This may be because none of the cases was found overfilled with silicone oil. Adequate precaution was taken during the exchange of silicone oil to maintain the closing pressure in each case below 10 mmHg. However, when compar-ing the mean IOP of cases with silicone oil buffer and without plugging with silicone oil, it was found that the mean values of IOP in week 1 postoperatively were found to be significantly higher in the previous case. (P = 0.05). Cases with silicone oil temponade showed more gradual decrease in IOP than cases without sili-
cone temponade post operative.
CONCLUSION. It is observed that the early increase in intraocu-lar pressure (IOP) of diabetic viterectomies is observed more in cases with prolonged and complex intraoper-ative exercises, and these cases were also significantly associated with a worse visual outcome result.
REFERENCES:1. Anderson NG, Fineman MS, Brown GC. Incidence of intraocular
pressure spike and other adverse events after vitreoretinal surgery. Ophthalmology 2006;113:42-7.
2. Desai UR, Alhalel AA, Schiffman RM, Campen TJ, Sundar G, Muhich A. Intraocular pressure elevation after simple pars plana vitrectomy. Ophthalmology. 1997;104:781-6.
3. Honavar SG, Goyal M, Majji AB, Sen PK, Naduvilath T, Dandona L. Glaucoma after pars plana vitrectomy and silicone oil injection for complicated retinal detachments. Ophthalmology 1999;106:169 76.
4. Graemiger RA, Niemeyer G, Schneeberger SA, Messmer EP. Wagner vitreoretinal degeneration. Follow-up of the original pedigree. Ophthalmology 1995;102:1830-9.
5. Badeeb O, Trope G, Musarella M. Primary angle closure glaucoma and retinitis pigmentosa. Acta Ophthalmol (Copenh) 1993;71: 727-32.
6. Han DP, Lewis H, Lambrwiou FH Jr, Mieler WF, Hartz A. Mechanisms of intraocular pressure elevation after pars plana vitrectomy. Ophthalmology 1989;96:1357-62.
7. Mitchell P, Smith W, Chey T, Healey PR. Open-angle glaucoma and diabetes: the Blue Mountains Eye Study. Ophthalmology 1997;104:712-18.
8. Tielsch JM, Katz J, Quigley HA, Javitt JC, Sommer A. Diabetes, intraocular pressure, and primary open-angle glaucoma in the Baltimore Eye Survey. Ophthalmology 1995;102:48-3.
9. Tranos P, Asaria R, Aylward W, Sullivan P, Franks W. Long term outcome of secondary glaucoma following vitreoretinal surgery. Br J Ophthalmol 2004;88:341-3.
10. Mittra RA, Pollack JS, Dev S, Han DP, Mieler WF, Connor TB. The use of topical aqueous suppressants in the prevention of postoperative intraocular pressure elevation following pars plana vitrectomy with long-acting gas tamponade. Trans Am Ophthalmol Soc 1998;96:143-51.
11. Anderson NG, Fineman MS, Brown GC. Incidence of intraocular pressure spike and other adverse events after vitreoretinal surgery. Ophthalmology 2006;113:42-7
12. Ruby AJ, Grand MG, Williams D, Thomas MA. Intraoperative acetazolamide in the prevention of intraocular pressure rise after pars plana vitrectomy with fluidgas exchange. Retina 1999;19:185-7.
13. Henderer JD, Budenz DL, Flynn HW Jr, Schiffman JC, Feuer WJ, Murray TG. Elevated intraocular pressure and hypotony following silicone oil retinal tamponade for complex retinal detachment: Incidence and risk factors. Arch Ophthalmol 1999;117:189-95.
14. de Corral LR, Cohen SB, Peyman GA. Effect of intravitreal silicone oil on intraocular pressure. Ophthalmic Surg 1987;18:446-9.
15. Ando F. Usefulness and limit of silicone in management of complicated retinal detachment. Jpn J Ophthalmol 1987;31:138-46.
Ophthalmology Update Vol. 16 No.4, Oct - Dec 2018854
Short Term Efficacy of Intra-Vitreal Bevacizumab (Avastin) in Macular Oedema
ABSTRACT:Background: Worldwide, macular edema is leading cause loss of central vision. Untreated cases result in blurring vision to blindness and substantially affects an individual’s quality of lifeObjective: To determine short term efficacy of Bevacizumab (Avastin) in terms of macular thickness and visual acuity among patients diagnosed with macular edemaMaterial & Methods: A randomized controlled trial was conducted in Department of Ophthalmology, POF hospital, Wah Cantt for 6 months from June 2017-December 2017. Sample size of 80 patients were takenusing WHO indicator. Non probability consecutive sampling was used for recruitment of these participants. Patients were randomly divided into two groups. Group A was provided with intravitreal injection of 0.05 ml, containing 1.25 mg Bevacizumab while Group B was given topical NSAIDs 0.1 ml TDS. Patients were followed for 2 months to determine change in macular thickness and visual acuity from baseline. Ethical approval was obtained and data was analyzed using SPSS version 22.0. Post stratification t test and chi square tests were applied. P value <0.05 was considered significant.Results: Total 80 patients were included in study with 1:1 randomization (40 patients in each group). Mean age of patients was 57.4±2.1 SD. There were 30 (38%) females and 50(62%) males. Group A (Bevacizumab) had significant reduction in macular thickness (540.6µm±113.4SD) from baseline (604.61µm±123.7SD) (p=0.03) as compared to group B - NSAIDs. Group A had 75% patients with visual acuity improvement more than 2 lines from baseline measurements on snellen’s chart as compared to Group B (P=0.01). Significant association between interventional group and gender (p=0.00), age (p=0.02) was found. However, an insignificant association was found between interventional groups and disease duration (P=0.165), diabetes mellitus (p=0.143) and hypertension (p=0.123)Conclusion: Intravitreal Bevacizumab is a promising therapeutic method to improve visual acuity and to reduce macular edema. Key words: Visual acuity, Intravitreal Bevacizumab, Macular thickness
Asma Aftab FCPS1, Mirza Masood Anwar MCPS (Fam. Med)2,Prof. Afzal Khan Niazi FCPS3
Short Term Efficacy of Intra-Vitreal Bevacizumab (Avastin) in Macular Oedema
Asma Aftab
INTRODUCTION: Worldwide macular edema is leading cause of central vision loss1. Untreated macular edema results in visual loss from slight blurring of vision to blindness and substantially affects an individual’s quality of life2. Overall weighted prevalence of macular edema in Unit-ed States is 3.8% in age group above 40 years3. Howev-er, prevalence of diabetic macular edema in Pakistan (Karachi) is 45%4. Early Diagnosis and management of macular edema leads to better visual prognosis. Macular edema is defined as abnormal thick-
ening of macula as a result of excessive fluid accumula-tion in extracellular spaces of central retina5. Most com-mon types of macular edema are diabetic and cystoid macular edema6. Other conditions include retinal vein occlusion, central serous chronic retinopathy (CSCR), ocular inflammations like posterior uveitis and com-plications of cataract surgery leading towards macular edema7. In present century, Optical Coherence Tomog-raphy (OCT) and fluorescein angiography (FA) are used as latest diagnostic and monitoring techniques for macular edema8. -------------------------------------------------------------------------------------------Intravitreal Bevacizumab is a promising therapeu-tic method to improve visual acuity and to reduce macular edema. Early detection and management of macular edema is essential for better prognosis. ------------------------------------------------------------------------------------------- Several treatment options are available (de-pending upon type of macular edema) including NSAIDS (Non steroid anti inflammatory drugs), immu-nomodulators, carbonic anhydrase inhibitors, steroids,
------------------------------------------------------------------------------------------- 1.Assistant Professor, Wah Medical College Wah Cantt, National Uni-versity of Medical Sciences (NUMS)2. Medical specialist, POF Hos-pital Wah Cantt 3. Head of Ophthalmology Department Wah Medical College, Wah Cantt National University of Medical Sciences (NUMS)Islamabad-------------------------------------------------------------------------------------------Correspondence: Dr. Asma Aftab Assistant Professor, Wah Medical College Wah Cantt National University of Medical Sciences (NUMS) Email: [email protected], Phone no. 0304-1470564-------------------------------------------------------------------------------------------Received: June’2018 Accepted: Sep’2018-------------------------------------------------------------------------------------------
ORIGINAL ARTICLE

Ophthalmology Update Vol. 16 No.4, Oct - Dec 2018 855
Short Term Efficacy of Intra-Vitreal Bevacizumab (Avastin) in Macular Oedema
hyperbaric oxygen and vitreous surgical interventions9. Bevacizumab (Avastin) is a recombinant monoclonal antibody that is approved for metastatic colorectal and breast cancer along with 5-fluorouracil combination10. Bevacizumab is very effective for macular edema as an intravitreal injection11. However use of Bevacizumab in Ophthalmology is off labeled12. Bevacizumab mech-anism of action demonstrated that it binds directly to vascular endothelial growth factors (VEGF) to inhib-it angiogenesis and decrease vascular permeability13. However, literature showed that improvement in mac-ular edema with NSAIDS is due to reduction in vascu-lar permeability by blocking cycloxygenase pathway 14. Astam et al reported that short term efficacy of intravitreal bevacizuamab is better in macular edema as a result of retinal vein occlusion (RVO) as compared to diabetic macular edema. A statistically significant difference in logMAR visual acuity of RVO and diabet-ic macular edema (p<0.05) was reported15. Nagasawa et al reported that mean retinal thickness at baseline was 441+/-170 µm while after 4 weeks a significant change in mean retinal thickness 380+/-159 µm (p<0.05) was observed16. Limited data is available on short term ef-ficacy of Avastin in Pakistan. Present study will con-tribute knowledge in understanding efficacy level of Avastin in macular edema management. Present study aim to determine short term efficacy of Bevacizumab (Avastin) in terms of macular thickness and visual acu-ity among patients diagnosed with macular edema.
MATERIAL & METHODS: A Randomized Controlled Trial (RCT) was conducted in the Department of Ophthalmology, POF Hospital Wah Cantt, Pakistan. Study duration was 6 months (June 2017 to December -2017). A sample size of 80 patients was taken using WHO indicator; 5% sig-nificance level p1= 34% and p2=10%. Non probability consecutive sampling was used for recruitment of par-ticipants. Patients with age > 18 years, diagnosed with macular edema due to diabetic retinopathy, retinal vein occlusion, central serous chorioretinopathy and pos-terior uveitis, Best Corrected Visual Acuity (BCVA)> 1/60 both genders were included in study. Exclusion criteria was based upon BCVA <1/60, history of laser photocoagulation, photodynamic therapy or IVB in the eye being considered for treatment with in the last 6 months, ocular/periocular infection, Intractable glau-coma with optic disc pathology, other ocular diseases causing permanent visual damage, pregnant and lac-tating mothers, ischemic heart disease and chronic re-nal failure. Ethical Approval was taken from Ethical Re-view Board of POF Hospital. Patients were randomly
divided into two groups using simple random sampling (lottery method). Each patient underwent ophthalmic assessment before treatment and during follow up vis-its. Assessment included best corrected visual acuity (baseline) using Snellen’s chart, anterior segment ex-amination using slit lamp and slit lamp biomicroscopy with fundus non-contact +78D lens. Baseline macular thickness was measured using spectral domain Optical Coherence Tomography (OCT). Group A was given in-travitreal injection of 0.05 ml, containing 1.25 mg Bev-acizumab, using a sharp 30 gauge needle while Group B was provided with topical non-steroid anti inflam-matory drugs (NSAIDS). Macular thickness and visu-al acuity was measured after every 4 weeks. Patients were followed for 2 months with an interval of 4 weeks. Data was analyzed using SPSS version 22.0. Mean and standard deviation was calculated for age and dura-tion of disease and macular thickness. Frequency and percentages was calculated for gender, marital status, occupation, visual acuity, cause of macular edema i.e., diabetes mellitus (DM) and hypertension (HTN). Post stratification t test and chi square test was applied. P value <0.05 was considered significant.
RESULTS: Total 80 patients were included with 40 pa-tients in each group. Mean age of patients was 57.4±2.1 SD. There were 30 (38%) females and 50(62%) males. Among all the patients, 20 were single (25%) and 60(75%) were married. Diabetes mellitus was found in 45(56%) patients while 35(44%) were non diabetic. Mean duration of disease was 5.4 years± 1.5 SD. Among all the patients 80(100%), 25(31%) patients had hyper-tension while 55(69%) were non hypertensive. Out of all patients, 37(46%) had public sector jobs, 43(56%) had private sector jobs. Statistically significant difference in macular thickness of Group A (Bevacizumab) patients from base-line 604.61µm±123.7SD to 4 weeks 599.6µm±112.2SD was found (p=0.05) as compared to NSAIDs (p=0.181) Group A (Bevacizumab) patients had mean macular thickness 604.61µm±123.7SD at baseline while after 8 weeks mean macular thickness was 540.6µm±113.4SD (P=0.03).Group B (NSAIDs) patients had mean macular thickness 611.5µm±127.8SD at base-line while after 8 weeks mean macular thickness was 612.4µm±126.1SD (P=0.176). Statistically significant difference(p<0.05) in macular thickness after 4 and 8 weeks was found in Group A (Bevacizumab) as com-pared to Group B as shown in table 1.Table 1: Comparison of Macular thickness in Bevaci-zumab and NSAID

Ophthalmology Update Vol. 16 No.4, Oct - Dec 2018856
Short Term Efficacy of Intra-Vitreal Bevacizumab (Avastin) in Macular Oedema
Interventional Groups
N=80 Macular thickness P value
At baseline After 4 weeks
Group A (Bevacizumab)
40 604.61µm±123.7SD
599.6µm±112.2SD
0.05
Group B(NSAIDs)
40 611.5µm±127.8SD
613.3µm±125.1SD
0.181
At baseline After 8 weeks
Group A (Bevacizumab)
40 604.61µm±123.7SD
540.6µm±113.4SD
0.03
Group B(NSAIDs)
40 611.5µm±127.8SD
612.4µm±126.1SD
0.176
Among all those patients who were in Group A (Bevacizumab) 40(50%), 5(12%) had visual acuity improvement of ≤2 lines from baseline while 35(88%) had visual acuity improvement >2 lines from base-line. Similarly among all those who were in Group B 40(50%), 40(50%) had no improvement in visual acuity. (x2 =33.789, p=0.01, df =3) Table 2: Association between Visual acuity and Inter-ventional GroupsVisual acuitymprovement(Snellen’s Chart)
Interventional Groups
Total P value
Group A(Bevaci-zumab)
Group B(NSAIDs)
No improvement
0(0%) 40(50%) 40 (50%)
≤2 lines from baseline
5(12%) 0(0%) 5(12%)0.01
>2 lines from baseline
35(88%) 0(0%) 35(88%)
Total 40 (50%) 40(50%) 80(100%)
Among all those patients who were in Group A 40(50%), had 10(25%) males and 30(75%) females. similarly among all those patients who were in Group B 40(50%), 30(75%) males and 10(25%) females (x2
=32.668, p=0.00, df =2). Among all those who were in Group A 40(50%), 5(6%) were in age group 18-40 years and 35(94%) were in age group >40 years. similarly among all those who were in Group B 40(50%), 5(6%) were in age group 18-40 years while 35(94%) were in age group >40 years (x2 =28.906, p=0.02, df =2). An in-significant association was found between interven-tional groups and disease duration (P=0.165), diabe-tes mellitus (p=0.143) and hypertension (p=0.123) as shown in Table 3.
Table 3: Association between Interventional groups and Independent VariablesGender Interventional
Groups Total Chi-
Square Value
P value
Group A(Bevaci-zumab)
Group B(NSAIDs)
Male 10(25%) 30(75%) 40(50%)32.668 0.00
Female 30(75%) 10(25%) 40(50%)
Age 28.906 0.0218-40years 5(6%) 5(6%) 10(13%)
>40 years 35(94%) 35(94%) 70(87%)
Duration of disease
9.452
0.165<5 years 15(38%) 5(13%) 20(25%)
>5 years 25(62%) 35(87%) 60(75%)
Diabetes Mellitus
6.552 0.143Yes 30(75%) 15(38%) 45(56%)
No 10(25%) 25(62%) 35(44%)
Hyperten-sion
3.254 0.123Yes 8(20%) 17(43%) 25(31%)
NO 32(60%) 23(57%) 55(69%)
Total 4 0 (50%)
40(50%) 80(100%)
DISCUSSION: Macular edema is the leading cause of visual disabilityworlwde. In present study, a significant re-duction in macular thickness was noted among patients treated with bevacizumab as compared to NSAIDs after 2 months (p<0.05). Bokhari et al reported mean central macular thickness was decreased after 3 months and BCVA was improved in 68% patients up to 2 snellen lines after Avastin. No adverse affects were reported17. Hung et al. reported that mean central macular thickness decreased from baseline (422µm) to 263 µm after one month, 333µm after 3 months and 239µm after 6 months. Moreover, they reported that recurrent mac-ular edema was observed after 2nd follow up but repeat-ed bevacizumab injection improved macular thickness substantially18. HE et al reported that a statistically signifi-cant reduction in central macular thickness was found from baseline (374 µm to 240 µm, p-0.001). However, a significant increase in visual acuity after bevacizum-

Ophthalmology Update Vol. 16 No.4, Oct - Dec 2018 857
Short Term Efficacy of Intra-Vitreal Bevacizumab (Avastin) in Macular Oedema
ab injection was also reported (-0.24 to -0.19 LogMAR, p=0.03)19. Present study proved that among patients of Group A (Bevacizumab) 40(50%), 5(6%) had visual acu-ity improvement ≤2 lines from baseline while 35(94%) had visual acuity >2 lines from baseline. Similarly among all those who were in Group B 40(50%), 40(50%) had no improvement in visual acuity (x2 =33.789, p=0.01, df =2). Astam et al reported that mean baseline visual acuity was 0.82 LogMAR ±0.27 SD while after 3 months 0.66 Log MAR±0.57 SD in retinal vein occlusion patients (p<0.05)15. A systematic review reported that intravitreal bevacizumab injection (IVB) had a significant improve-ment regarding macular thickness and visual acuity af-ter 6 weeks of diabetic macular edema while benefits of intravitreal injection of methotrexate (IVM) were no longer significant after 12 weeks20. Limitation: High cost of OCT leads researcher towards small sample selection and short duration of follow up. Study conduction at single center limits generalization of study.
CONCLUSION: Intravitreal bevacizumab is a promising thera-peutic method to improve visual acuity and to reduce macular edema. Early detection and management of macular edema is essential for better prognosis. Further evidence is required on effective frequency and long term outcome of intravitreal bevacizumab injection.
REFERENCES:1. Wild S, Roglic G, Green A, King H. Global prevalence of Macular
edema, estimates for the year 2014 and projections for 2030. Di-abetes Care 2014;27(2):1047-53.
2. Jonas JB, Kamppeter BA, Harder B, Vossmerbaeumer U, Saud-er G, Spandau UH. Intravitreal triamcinolone acetonide for dia-betic macular edema: A prospective, randomized study.J Ocul Pharmacol Ther 2015;22(2):200-7.
3. Konstantopoulos A, Williams CP, Newsom RS, Luff AJ. Ocu-lar morbidity associated with intravitreal triamcinolone aceton-ide. Eye 2015;21(3):317-20
4. Syeda Aisha Bokhari, Zeeshan Kamil, Fawad Rizvi. To Compare the Effect of Intravitreal Bevacizumab on the Resolution of Mac-ular Edema Secondary to Diabetic Retinopathy and Branch Ret-inal Vein Occlusion. Pak J Ophthalmol 2012;8 (2):60-5.
5. Aiello LP, Avery RL, Arrigg PG, Keyt BA, Jampel HD, Shah ST, et al . Short term outcome of bevacizumab in patients with diabetic retinopathy and other retinal disorders. NEn-glMed 2015;331(3):1480-7.
6. Adamis AP, Miller JW, Bernal MT, D’Amico DJ, Folkman J, Yeo TK, et al . Macular edema in proliferative diabetic retinopathy. Am J Ophthalmol 2014;118(4):445-50
7. Joussen AM, Poulaki V, Mitsiades N, et al. Nonsteroidal anti-in-flammatory drugs in treatment of macular edema. The FASEB Journal. 2014;16(3):438–440.
8. Liazos E, Broadbent DM, Beare N, Kumar N. Spontaneous resolution of diabetic macular oedema after discontinuation of thiazolidenediones. Diabet Med. 2008;25(5):860–862.
9. Moss SE, Klein R, Klein BE. The 14-year incidence macular edema. Ophthalmology. 2015;105(3):998–1003.
10. Bandello F, Lanzetta P, Menchini U. When and how to do a grid laser for diabetic macular edema. Doc Ophthalmol. 2014;97(4):415–419.
11. Adamis AP, Miller JW, Bernal MT, et al. Increased vascular endothelial growth factor levels in the vitreous of eyes with proliferative diabetic retinopathy. Am J Ophthalmol. 2016;118(4):445–450.
12. Brooks HL, Jr, Caballero S, Jr, Newell CK, et al. Vitreous levels of vascular endothelial growth factor and stromal-derived factor 1 in patients with diabetic retinopathy and cystoid macular edema before and after intraocular injection of triamcinolone. Arch Ophthalmol. 2014;122(2):1801–1807.
13. Lam DS, Chan CK, Mohamed S, et al. Intravitreal triamcinolone plus sequential grid laser versus triamcinolone or laser alone for treating diabetic macular edema: six-month outcomes. Ophthalmology. 2017;114(6):2162–2167.
14. Cellini M, Pazzaglia A, Zamparini E, Leonetti P, Campos EC. Intravitreal vs subtenon triamcinolone acetonide for the treatment of diabetic cystoid macular edema. BMC Ophthalmol. 2008;8(3):5-10
15. Astam N, Batioğlu F, Ozmert E. Short-term efficacy of intrav-itreal bevacizumab for the treatment of macular edema due to diabetic retinopathy and retinal vein occlusion. Int Ophthal-mol. 2014;29(5):343-8
16. Toshihiko Nagasawa, Takeshi Naito, Shingo Matsushita, Hiroyu-ki Sato, Takashi Katome, & Hiroshi Shiota. Efficacy of intravitreal bevacizumab (AvastinTM) for shortterm treatment of diabetic macular edema. Jour. Medic Inv. 2015;56(2):111-15.
17. Bukhari DW, Heier JS, Topping TM, Duker JS, Bankert JM. A pilot study of multiple intravitreal injections of ranibizumab in pa-tients with center-involving clinically significant diabetic macular edema. Ophthalmology 2015;113(2):1706-12.
18. Hung D, Spaide RF, Meyerle CB, Klancnik JM, Yannuzzi LA, Fisher YL, et al . Intravitreal bevacizumab (Avastin) treatment of macular edema in central retinal vein occlusion: A short term study study. Retina 2014;26(5):279-84
19. HE UH, Ihloff AK, Jonas JB. Intravitreal bevacizumab treatment of macular oedema due to central retinal vein occlusion. Acta Ophthalmol Scand 2016;84(3):555-6.
20. Rich RM, Rosenfeld PJ, Puliafito CA, Dubovy SR, Davis JL, Fly-nn HW Jr, et al . Short-term safety and efficacy of intravitreal bevacizumab (Avastin) for neovascular age-related macular de-generation. Retina 2014;26(5):495-511.

Ophthalmology Update Vol. 16 No.4, Oct - Dec 2018858
Prevalence of Hypermetropia in Presbyopic age of 40-60 years
ABSTRACTBackground: The aim of this study was to find out the magnitude and pattern of presentation of refractive error in presbyopic patients within the age group of 40-60.Methods: A cross sectional study was done. After assessing patient’s distant visual acuity through Snellen’s chart, refractive state was observed through autorefractor. By performing objective refraction through retinoscopy and then after subjective verification, patient was corrected for distant vision. Near vision was then assessed and patients with decreased near acuity, the age-group 40-60years were diagnosed as presbyopes and corrected according to age-method and amplitude of accommodation.Results: Total 100 patients were screened mostly female (62%) and male (38%). Gender wise distribution shows that Hypermetropia in males (61.53%) was higher than females (38.46 %).While Astigmatism also prevails more in males (60.60 %) than females (39.40 %).Myopia was the 3rd top reason causing distance decreased vision which accounts (60%) in males and 40 % in females counterpart.Conclusion: Gender wise distribution shows that Hypermetropia in males was higher than females .While Astigmatism also prevails more in males than females . Myopia was the 3rd top reason causing distance decreased vision which accounts in males and in females counterpart.Keywords: Astigmatism, hypermetropia, myopia, snellen,autorefractometer.
Usman Siddique MBBS1, Fahad Abid MBBS2. Syed Noor Hashim Ali MBBS3
Prevalence of Hypermetropia in Presbyopic age of 40-60 years
Usman Siddique
INTRODUCTION: Hyperopia is also known as “farsightedness” or “Hypermetropia”. It is an ocular condition in which the refracting power of the eye causes light rays enter-ing the eye to have a focal point that is posterior to the retina while accommodation is maintained in a state of relaxation. Visual acuity is better at far distances (e.g. 6 meters) than at near (e.g. 0.33 meters) distances”.[1]
Significant hyperopia is defined as any degree of hyperopia sufficient to cause symptoms prompt-ing clinical attention. Hyperopia may be classified by structure and function of the eye. Simple hyperopia is due to decreased axial length or decreased converging power of cornea, lens, and/or media (flattened cornea/decreased curvature, increased thickness of lens, etc.
[2] Pathologic hyperopia is due to atypical development, trauma, or disease of the eye (i.e. cataract, microphthal-mia, an-ophthalmia, aniridia, etc. Functional hyperopia is due to paralysis of accommodation. If affected, func-tional hyperopia is usually present at birth. Drugs, such as cycloplegics, can also cause a transient hyperopia.[3]
-------------------------------------------------------------------------------------------In Hypermetropia the refractive index changes takes place in cortex of the lens during presbyopic age, while astigmatism results as difference of refractive indexes of lens in its different parts. Myopia was the least and 3rd reason of refractive error caused by in-crease of refractive index of nucleus of the lens. Gen-der wise distribution shows that Hypermetropia and Astigmatism prevails more in males than females. ------------------------------------------------------------------------------------------- Hyperopia may also be categorized by the de-gree of refractive error: Low hyperopia is +2.00D or less, Moderate hyperopia ranges from +2.25 to +5.00D, and High hyperopia is +5.25D or more. High hypero-pia may be associated with blurring of the optic disc margin, known as pseudo-papilledema. It can be dif-ferentiated from true papilledema by the presence of normal caliber of vasculature and normal appearing juxtaposed retina.[4] Hyperopia may also be classified by the role of accommodation to visual functioning, which hyperopia can be overcomed by accommoda-tion whereas absolute hyperopia cannot be overcome by accommodation. Total hyperopia is the sum of fac-ultative and absolute hyperopia.[5]
Hyperopia may also be categorized based upon the outcome of noncycloplegic and cycloplegic refractions. Manifest hyperopia is determined with non-cycloplegic refraction whereas latent hyperopia is determined with cycloplegic refraction. The magnitude
-------------------------------------------------------------------------------------------1.Medical Officer Akhtar Saeed Hospital Lahore2. Medical officer RHC Maghian Attock 3.Medical Officer at THQ Talagang District Chakwal -------------------------------------------------------------------------------------------Correspondence: Dr. Usman Siddique Medical Officer Akhtar Saeed Hospital Lahore Email: usman122gmail.com cell. 033355592817-------------------------------------------------------------------------------------------Received: June’2018 Accepted: Sep’2018-------------------------------------------------------------------------------------------
ORIGINAL ARTICLE

Ophthalmology Update Vol. 16 No.4, Oct - Dec 2018 859
Prevalence of Hypermetropia in Presbyopic age of 40-60 years
of hyperopia is the sum of manifest and latent hypero-pia.[6]
Physiologic (simple and functional) hyperopia is much more common than pathologic hyperopia. [7]
Decreased axial length is the most common etiology for hyperopia. Overall prevalence of hyperopia is around 10%, approximately 14 million people, in the United States.[8] Most full-term infants are mildly hyperopic. By age 6-9 months approximately 4-9% of infants are hyperopic and by age 12 months the prevalence is ap-proximately 3.6%. Infants with moderate to high hy-peropia (greater than +3.50D) are up to 13 times more likely to develop strabismus by age 4 if left uncorrected.
[8] In Australia prevalence is 13% at age 6 and 5% at age 12 Prevalence of hyperopia at age 40 and above is 9.9% in 2010 in the United States. Prevalence of hyperopia is higher relative to myopia between ages 45-65.[9]
MATERIAL AND METHODS: A cross sectional study was done between July -October 2017 in eye care Hospital Lahore, in which 200 patients were included and data was collection through convenient sampling method technique. First of all un-aided and aided visual acuity of patient’s both eyes was assessed, with the help of Snellen’s Visual Acuity chart, trail frame and trial box were used for this pur-pose. Then gross torch light examination was done to examine anterior eye structures i.e. cornea, limbus iris and pupil. The patient was tested wearing his habit-ual distance correction. Patient is asked to focus on a row of letters one or two lines larger than his near VA. Asked the patient to keep the letters clear. Then slowly move the chart closer to the patient and ask the patient to report when the letters become and remain blurry. Note the distance from the chart to the patient’s specta-cle plane in centimeters. The linear measurement is re-ferred to as the near point of accommodation. Diopteric value represents the patient’s amplitude of accommo-dation. Autorefractometer gives objective assessment of patient’s refractive error at distance. and in case pa-tients distance visual acuity is less than 6\6 he or she was given correction till he or she is able to read the desired standard line 6\6.Cross cylinder was used to refine the axis and power of given cylinder in prescrip-tion, sphere was refined with +1.00 blur test. After ob-taining the accurate distance prescription patient was given optimum near correction. The near correction was based on need of the patient and also depends on amplitude of accommodation he or she is having. Sometimes it was given on age approximate methods, like it was initially with +1.00 at the age of 40 years and power was increased as the age increased maximum +3.00 D was given at 60 years and more. Dynamic retinoscopy was also used for near correction, Dynamic which is useful to assess accom-modation in real-life situations and it can help to cor-rect hyperopia. Data was analyzed through SPSS ver-
sion 20.00.
RESULTS:Chart:1. A total no. of 100 (n = 100) subjects were stud-ied consisting of 62(62%) females and 38(38%) males.
Chart :2 Presentation of refractive error in presbyopic patients:
The study statics shows that patients in presby-opic age having refractive error as well needs near vi-sual correction. In this particular study Hypermetropia (52 %) was the leading cause of decreased vision at dis-tance and presence of hypermetropia in presbyopic age increases the need for wearing for reading glasses as he or she requires more power for near task as compared to emotropic patient. Astigmatism was the second rea-son of refractive error in this age group which accounts almost 33%; the condition also makes difficulty in read-ing and at distance. Myopia was the least cause of dis-tance decreased vision and was responsible in 15 % pa-tients. However presence of myopia may postpone or delay the need for reading correction. Chart:3 Gender wise distribution:
Gender wise distribution shows that Hyper-metropia in males (61.53%) was higher than females (38.46 %).While astigmatism also prevails more in males (60.60 %) than females (39.40 %).Myopia was the 3rd top reason causing distance decreased vision which accounts (60%) in males and 40 % in females counter-part. Mean age of all subjects was 52.74 years (range, 40 to 60 years). Table 1 shows the descriptive statistics of the age in years for all subjects under study.

Ophthalmology Update Vol. 16 No.4, Oct - Dec 2018860
Prevalence of Hypermetropia in Presbyopic age of 40-60 years
Table:1
N Minimum Maximum Mean
Total 100 40.00 60.00 52.74
Males 62 40.00 60.00 53.74
Females 38 40.00 60.00 51.10
Age Groups: The total sample was divided in to 2 groups according to age. These groups are:Group 1 = Contain subjects of age from 40 to 50 YearsGroup 2 = Contain subjects of age from 51 to 60 Years Surprisingly the presentation of females in group 1 (40-50) 70% as compared to group 2 (51-60) 30 %.which indicates that females tend to more con-scious for early detection on the other hand males in group 1 (40-50) presented were 30% and group 2 (51-60) showed 70 % which is comparatively late presentation as compared to females. Females have other sort of near tasks other than reading and writing like stitching, sew-ing, food particles etc.DISCUSSION: The result shows that 100 patients were screened female (62%) and male (38%). Gender wise distribution shows that Hypermetropia in males (61.53%) was higher than females (38.46 %).While Astigmatism also prevails more in males (60.60 %) than females (39.40 %). Myopia was the 3rd top reason caus-ing distance decreased vision which accounts (60%) in males and 40 % in females counterpart. A study on relevant topic was conducted in Nigeria by Obajolowo. N in 2015 according to him 335 subjects were included while 24 subjects were not avail-able for examination and 45 subjects excluded based on the visual acuity cut off point. The age range was 35 to 100 years, with a mean age of 57±12.1years. The prev-alence of presbyopia was 59.7%. Presbyopia correction coverage was 46.5%. Increasing age was found to be significantly associated with presbyopia, while gen-der, occupation and educational level were not. Skilled workers, retired persons and those with at least a sec-ondary education were more likely to have glasses than others. The commonest barrier to obtaining near vision glasses was lack of financial resources.[15]
Similarly another study was conducted in rural Tanzania by Abrahamsum. O in 2017 that determines the prevalence of Presbyopia in a rural African pop-ulation. A total of 61.7% of eligible participants were presbyopic. A higher prevalence of Presbyopia was associated with increasing age, female gender, higher educational level, and residence in urban areastown (odds ratio _ 3.09;95% confidence interval: 2.46–3.90). The odds of developing Presbyopia increased 16% per year of age from age 40 to 50, but the increase was non-significant at 1% per year after age 50. More severe Presbyopia was associated with female gender and less
with education. This study provides the first popula-tion-based data on prevalence of Presbyopia in a large, random sample of older Africans and suggests a high rate of Presbyopia. Presbyopia plateaus after age 50, is more common in females. In addition, the 3-fold in-creased odds in town versus village dwellers was un-expected and suggests that research of other factors, including environmental factors, is warranted.[18]
In a study conducted on the magnitude and pattern of Presbyopia among the patients seen on out-reach in Pakistan in lions sight first eye hospital by Mukkari.M in 2012 in which total 442 patients were examined of which 177 (40%) were male and 265 (60%) female. Males were found to be older than females p<0.001. Refractive errors were found in 15.4% of those examined. Presbyopia was found in 388(87.8%) of those examined, males= 151(85.3%) and females= 237(89.4%).[19]
CONCLUSION: It is concluded that the hypermetropia was the top most reason as refractive index changes takes place in cortex of the lens after presbyopic age and re-sults in hyperopia, while astigmatism results as differ-ence of refractive indexes of lens different parts. Myopia was the least and 3rd reason of refractive error caused by increase of refractive index of nucleus of the lens. Gender wise distribution shows that Hypermetropia in males was higher than females, while Astigmatism also prevails more in males than females.
REFERENCES:1. Xu Y. Prevalence and control of diabetes in Chinese adults. The
Journal of the American Medical Association. 2013;310(9):948–959. doi: 10.1001/jama.2013.168118.
2. Manaviat M. R., Rashidi M., Afkhami-Ardekani M., Shoja M. R. Prevalence of dry eye syndrome and diabetic retinopathy in type 2 diabetic patients. BMC Ophthalmology. 2008;8, article 10 doi: 10.1186/1471-2415-8-10.
3. Dry eye syndrome, NICE CKS, September 2012 (UK access only)
4. Seifart U., Strempel I. The dry eye and diabetes mellitus. Ophthalmologe. 1994;91(2):235–239.
5. Hom M., De Land P. Self-reported dry eyes and diabetic history. Optometry. 2006;77(11):554–558. doi: 10.1016/j.optm.2006.08.002.
6. Nepp J., Abela C., Polzer I., Derbolav A., Wedrich A. Is there a correlation between the severity of diabetic retinopathy and keratoconjunctivitis sicca? Cornea. 2000;19(4):487–491. doi: 10.1097/00003226-200007000-00017.
7. McKown R. L., Wang N., Raab R. W., et al. Lacritin and other new proteins of the lacrimal functional unit. Experimental Eye Research. 2009;88(5):848–858. doi: 10.1016/j.exer.2008.09.002.
8. Rieger G. The importance of the precorneal tear film for the quality of optical imaging. British Journal of Ophthalmology. 1992;76(3):157–158. doi: 10.1136/bjo.76.3.157.]
9. Lemp M. A. Advances in understanding and managing dry eye disease. American Journal of Ophthalmology. 2008;146(3):350.e1–356.e1. doi: 10.1016/j.ajo.2008.05.016.
10. Research in dry eye: report of the Research Subcommittee of the International Dry Eye WorkShop (2007) The Ocular Surface. 2007;5(2):179–193.

Ophthalmology Update Vol. 16 No.4, Oct - Dec 2018 861
Prevalence of Hypermetropia in Presbyopic age of 40-60 years
11. Gekka M., Miyata K., Nagai Y., et al. Corneal epithelial barrier function in diabetic patients. Cornea. 2004;23(1):35–37. doi: 10.1097/00003226-200401000-00006.
12. Friend J., Kiorpes T. C., Thoft R. A. Diabetes mellitus and the rabbit corneal epithelium. Investigative Ophthalmology and Visual Science. 1981;21(2):317–321.
13. Vaughan and Asbury’s general ophthalmology, 17th edition. Clinical and Experimental Optometry. 2008;91(6):577–577. doi: 10.1111/j.1444-0938.2008.00309.x.
14. Liu H., Sheng M., Liu Y., et al. Expression of SIRT1 and oxidative stress in diabetic dry eye. International Journal of Clinical and Experimental Pathology. 2015;8(6):7644–7653.
15. Beckman K. A. Characterization of dry eye disease in diabetic patients versus nondiabetic patients. Cornea. 2014;33(8):851–854. doi: 10.1097/ico.0000000000000163.
16. Imam S., Elagin R. B., Jaume J. C. Diabetes-associated dry eye syndrome in a new humanized transgenic model of type 1 diabetes. Molecular Vision. 2013;19:1259–1267.
17. Ramos-Remus C., Suarez-Almazor M., Russell A. S. Low tear production in patients with diabetes mellitus is not due to Sjogren’s syndrome. Clinical and Experimental Rheumatology. 1994;12(4):375–380.
18. Tseng S. C. G., Hirst L. W., Maumenee A. E. Possible mechanisms for the loss of goblet cells in mucin-deficient disorders. Ophthalmology. 1984;91(6):545–552. doi: 10.1016/S0161-6420(84)34251-8.
19. Nakata M., Okada Y., Kobata H., et al. Diabetes mellitus suppresseshemodialysis-induced increases in tear fluid secretion. BMC Research Notes. 2014;7(1, article 78) doi:
10.1186/1756-0500-7-78. 20. Hyndiuk R. A., Kazarian E. L., Schultz R. O., Seideman S.
Neurotrophic corneal ulcers in diabetes mellitus. Archives of Ophthalmology. 1977;95(12):2193–2196. doi: 10.1001/archopht.1977.04450120099012.
21. Achtsidis V., Eleftheriadou I., Kozanidou E., et al. Dry eye syndrome in subjects with diabetes and association with neuropathy. Diabetes Care. 2014;37(10):e210–e211. doi: 10.2337/dc14-0860.
22. Rolando M., Zierhut M. The ocular surface and tear film and their dysfunction in dry eye disease. Survey of Ophthalmology. 2001;45(supplement 2):S203–S210. doi: 10.1016/s0039-6257(00)00203-4
23. Goebbels M. Tear secretion and tear film function in insulin dependent diabetics. British Journal of Ophthalmology. 2000;84(1):19–21. doi: 10.1136/bjo.84.1.19.
24. Dogru M., Katakami C., Inoue M. Tear function and ocular surface changes in noninsulin-dependent diabetes mellitus. Ophthalmology. 2001;108(3):586–592. doi: 10.1016/S0161-6420(00)00599-6.
25. Misra S. L., Patel D. V., McGhee C. N. J., et al. Peripheral neuropathy and tear film dysfunction in type 1 diabetes mellitus. Journal of Diabetes Research. 2014;2014:6. doi: 10.1155/2014/848659.848659
26. Dias A. C., Batista T. M., Roma L. P., et al. Insulin replacement restores the vesicular secretory apparatus in the diabetic rat lacrimal gland. Arquivos Brasileiros de Oftalmologia. 2015;78(3):158–163. doi: 10.5935/0004-2749.20150041.
**************************************Cystoid Macular Edema (CME) Cystoid macular edema (CME) is commonly seen after cataract surgery. It may occur with vascular disease like uveitis, and with usage of certain medications. CME arises from the accumulation of fluid within the retina when there is disruption of the normal blood-retinal barrier and abnormal permeability of the perifoveal retinal capillaries.Curtsey: George J. Ko, Stacy J. Bang, William B. Phillips, Andreas K. Lauer, NEJM UK

Ophthalmology Update Vol. 16 No.4, Oct - Dec 2018862
Prevalence of Strabismus in Low Vision Department of King Edward Medical College Lahore
ABSTRACT:Aim: To get to know about the prevalence of strabismus in low vision patients.Methodology: A cross sectional study was done in which 200 patients with decreased contrast were taken through convenient sampling . Visual acuity of all the patients was measured using ETDRS chart at a distance of 4 meters. All patients were already diagnosed by the senior ophthalmologists and were referred to the low vision department. Then cover test was performed at both short and long distance to access strabismus. At long distance fixation target was ETDRS chart at 4 meters and for short distance fixation target was held at 33cm. Results: Among 200 patients 74.8% patients had acquired while remaining had strabismus since birth. The exotropia-esotropia ratio was 7:1, with mostly 38% had esotropia. Conclusion: It is concluded that the prevalence of strabismus in low vision patients was high which mostly had acquired strabismus.Key words: strabismus, acquired, congenital, prevalence, esophoria
Abubakar Rizwan MBBS1. Sumaira Rafaqat MBBS2 Bilal Afzal MBBS3
Prevalence of Strabismus in Low Vision Department of K.E Medical University Lahore
Abubakar Rizwan
INTRODUCTION: A patient with low vision is one who has vi-sual impairment even after best available treatment (medical, surgical, optical) and who has visual acu-ity of <6/18 to no perception of light or visual field of 10 degree from center of fixation or 20 degree in largest diameter in better eye but who have poten-tial to do activities of daily life1. Globally, 32.4 million people were blind in 2010, and 191 million had moderate to severe visual impairment (MSVI). The MSVI prevalence in older adults was highest in South Asia (23.6%; 95%CI, 19.4-29.4%), Oceania (18.9%; 95%CI, 11.8%-23.7%). And Eastern and Western Sub-Sa-haran Africa and north Africa and Middle East (95%CL, 15.9%-16.8%)2. In Pakistan standardized prevalence of FLV were 1.7% (95% CL: 1.5-1.9%) and total blind-ness were 0.2% (95%CL: 0.1%-0.2%). An estimated
727,000 (586,000-891,000) adults in Pakistan had FLV. Retinal conditions were the commonest cause in urban populations (39.8%vs. 26.5%rural) com-pared with corneal opacity in rural areas (38.0% vs. 25.55 urban) . It was estimated that 565,000 adults require assessment for optical services, 735,000 for non-optical interventions, and 424,000 for rehabil-itations.3
-------------------------------------------------------------------------------------------
The prevalence of strabismus in low vision pa-tients was high which mostly had acquired stra-bismus.-------------------------------------------------------------------------------------------
Globally the principal causes of visual im-pairment are uncorrected refractive errors and cataracts, 43% and 33 % respectively. Other causes are glaucoma, 2% age related macular degenera-tion (AMD), Diabetic retinopathy, Trachoma and corneal opacities, All about 1 %. A large portion of causes, 18%, are undetermined4. These diseases cause not only pathological complications, such as retinal detachment, macular degeneration and optic disc abnormalities but also functional problems, such as misalignment of eye position. Horizontal and/or vertical strabismus is
-------------------------------------------------------------------------------------------1.Medical Officer Basic Health Unit Goleki 2. Officer Ganga Ram Hospital Lahore 3. Medical Officer BHU, Haji Muhammad-------------------------------------------------------------------------------------------Correspondence: Dr. Abubakar Rizwan Medical Officer Basic Health Unit Goleki, Email: [email protected] Cell: 0333 55592817-------------------------------------------------------------------------------------------Received: July’2018 Accepted: August 2018-------------------------------------------------------------------------------------------
ORIGINAL ARTICLE

Ophthalmology Update Vol. 16 No.4, Oct - Dec 2018 863
Prevalence of Strabismus in Low Vision Department of King Edward Medical College Lahore
often observed in patients with diseases.5
Study in Japan have been confirmed the relatively high prevalence of horizontal and verti-cal strabismus with pathological myopia. Among 636 patients with pathological myopia, 520(81.8%) had orthophoria, 85(13.4%) had exotropia and 31(4.9%) had esotropia at near distance. At long distance, 499(86.5) had orthophoria, 51(8.8) had exotropia and 27(4.7%) had esotropia. Verti-cal heterotropia was seen in 103 patients (16.2%).6
It has been concluded the risk osf strabis-mus in patients having congenital nystagmus and can predicted from the nature of underlying visu-al disorder.7 Strabismus was found in 50% of chil-dren with congenital nystagmus. The prevalence of strabismus was 82% in children with bilateral optic nerve hypoplasia, 53% in patients with albinisim, 3 % in children with congenital retinal dystrophies, and 17% in children with idiopathic congenital nystagmus.8 Cylic exotropia is an unusual associa-tion with retinitis pigmentosa.9 Strabismus causes double vision and/or eye strain. To avoid double vision, the brain may adopt by ignoring one eye. Strabismus also causes loss of depth perception. A constant unilateral strabismus causing suppression, fatigue when reading, and unstable vision.10strabis-mus also affect the cosmetical appearance of pa-tient.
MATERIALS AND METHODS: A cross-sectional study was done between Jan-Oct 2015 king Edward medical college Lahore. Study was carried out in Low vision department. All patients presented in low vision department were included in this study. Non probability conve-nient sampling technique was used. The inclusion criteria of our study were as follows. Age between 6 and 55. Patients with low vision diseases. Visual acuity between 6/10 and a maximum of 10/10 (via the Snellen optotype). Both genders were included Data was collected using proformas including clin-ical findings. All patients were already diagnosed by senior ophthalmologist and were referred to low vision department. Equipments used to collect data were ETDRS CHART to access visual acuity .Occluder and target to perform cover test. Assessment was
start by taking written informed consent. Then his-tory was taken. After that visual acuity and cover test were performed. There were 2 parts to the Cov-er Test (CT), which include the cover and uncov-er component and the alternate cover test. It was ensured that there is sufficient light in the room so that the examiner could clearly see the patient’s eyes. The purpose of the test was explained to the patient” [3] The cover/ uncover part includes 1 eye being covered. Instructions were given to the pa-tient to look at the near target and snellen chart for distance fixation.[3]
Observations: The movement of the uncovered eye taking up fixation The movement as well as po-sition of the eye under the cover when the paddle is removed (repeated until movement was observed/no movement to confirm a diagnosis) Cover/un-cover method for heterotropia The alternate CT had to ensure that one eye is dissociated at all times: The movement of the covered eye is recorded as the paddle is changed from one eye to the other every 3 seconds while allowing the eye to take up fixation .The cover was placed before the first eye in a man-ner that prevent the patient from viewing the target but allow examiner to continue seeing the covered eye. Observed the response of the first eye tested behind the occluder when it was first covered .Results:200 patients of age 15-55 were included in this study. In which mostly 55% were male and 45% were female. Visual profile of the patients:Vision was measured by ETDRS chart. As the par-ticipants were from the department of low vision, the visual acuity of all the participants was 6/18 or below 6/18. Visual acuity of each eye was recorded with and without glasses which is as follow:Table:1VA Frequency Percent6/18 – 6/24<6/24-6/30<6/30-6/38<6/38-6/48<6/48-6/60<6/60-cfTotal
561417121654170
32.98.210.07.19.431.8100.0
Cover test was performed for the objective deter-

Ophthalmology Update Vol. 16 No.4, Oct - Dec 2018864
Prevalence of Strabismus in Low Vision Department of King Edward Medical College Lahore
mination of the presence of ocular deviation. Cover test was performed in distance and near with glass-es without glasses.Table:2Most commonly found horizontal deviation with glasses in distance was esotropia Type of deviation Frequency Valid Percent Orthophoria
Esotropia
Exotropia
Esophoria
10
74
47
52
5.3
38
26.5
31.2Table:3Most commonly found horizontal deviation with-out glasses in distance was esotropia.Type of deviation Frequency Valid Percent Orthophoria
Esotropia
Esophoria
Esotropia
8
75
45
53
4.7
37.6
26.5
31.2
DISCUSSION: Among 200 patients 74.8% patients had acquired while remaining had strabismus since birth. The exotropia-esotropia ratio was 7:1, with mostly 38% had esotropia. A study was done in Canada by Patrick et al in which he evaluated 52% strabismus.[17]Another study was done by Katherine.A in US in which Strabismus was detected in 9 Head Start children (1.5%) and 3 K/1 children (1.0%). Ratio of esotropia to exotropia was 1:3 in Head Start and 1:2 in K/1 n low vision department. The percentage of patients presenting with acquired deviation was high that was 48.80%. 34.7% were presented with-out history of deviation and 16.50% were having strabismus since birth. Similarly another study was done in India by sanjeet.T in which total 57 patients with RP were participated in the study out of which 31 pa-tients had exotropia 18 patients had phoria and 5 patients had esotropia. The results of present study were similar to previous studies.20 patients with myopic degeneration participated in this study out
of which 17 patients had esotropia 1 patient had ex-otropia and 2 patients had phoria.17 patients with congenital cataract were participated out of which 14 patients had esotropia 1 patient had exotropia and 2 patients had phoria.11 patients with Albi-nism participated in study and 7 patients had es-otropia 2 patients had exotropia and 2 patients had phoria.[18] Other diseases were also considered and strabismus was also noticed. Yokota et al in his study in Saudi Arabia concluded the association between cong. Nystagmus and strabismus in low vision depertment. [19] Virginia Wong et al in US concluded 20% strabismus associated with Down syndrome.[20] The strength of the study was that all diseas-es of low vision were considered. The results were different in different pathologies. The study is done by the chief researcher herself. The limitations in this study were that the numbers of subjects were low due to limited time duration. The sample size was not selected ran-domly and the study was done only in single clini-cal setup.
CONCLUSION: It is concluded that the prevalence of stra-bismus in low vision patients was high with mostly had acquired strabismus. So it should recommend that eye positions be repeatedly assessed over time and that surgical procedures be performed as ap-propriate.
REFERENCES:1. Robaei D, Rose KA, Kifley A, et al. Factors associated with
childhood strabismus: findings from a population-based study. Ophthalmology 2006; 113:1146-53.
2. Tomilla V, Tarkkanen A. Incidence of loss of vision in the healthy eye in amblyopia. Br J Ophthalmol 1981; 65:575-7.
3. van Leeuwen R, Eijkemins MJ, Vingerling JR, et al. Risk of bilateral visual impairment in individuals with amblyopia: the Rotterdam study. Br J Ophthalmol 2007; 91:1450-1.
4. Jones RK, Lee DN. Why two eyes are better than one. J Exp Psychol Hum Percept Perform 1981; 7:30-40.
5. Sheedy JE, Bailey IL, Buri M, Bass E. Binocular vs. monocular task performance. Am J Optom Physiol Opt 1986; 63:839-46.
6. Weissberg E, Suckow M, Thorn F. Minimal angle horizontal strabismus detectable by lay observers. Optom Vis Sci 2004; 81:506-9.
7. Akay AP, Cakaloz B, Berk AT, Pasa E. Psychosocial aspects of mothers of children with strabismus. J AAPOS 2005; 9:268-73.
8. Prosser PC. Infantile development: strabismic and normal children compared. Ophthalmic Optician 1979; 19:681-3.

Ophthalmology Update Vol. 16 No.4, Oct - Dec 2018 865
Prevalence of Strabismus in Low Vision Department of King Edward Medical College Lahore
9. Tonge BJ, Lipton GL, Crawford G. Psychological and educational correlates of strabismus in school children. Aust N Z J Psychiatry 1984; 18:71-7.
10. Dobson V, Sebris SL. Longitudinal study of acuity and stereopsis in infants with or at risk for esotropia. Invest Ophthalmol Vis Sci 1989; 30:1146-58References 49
11. Vision in Preschoolers Study Group. Does assessing eye alignment along with refractive error or visual acuity increase sensitivity for detection of strabismus in preschool vision screening? Invest Ophthalmol Vis Sci 2007; 48:3115-25.
12. Duckman RH, Meyer B. Use of photoretinoscopy as a screening technique in the assessment of anisometropia and significant refractive error in infants/toddlers/children and special populations. Am J Optom Physiol Opt 1987; 64:604-10.
13. Rutstein RP, Daum KM. Anomalies of binocular vision: diagnosis and management. St. Louis: CV Mosby, 1998:192-5.
14. Sondhi N, Archer SM, Helveston EM. Development of normal
ocular alignment. J Pediatr Ophthalmol Strabismus 1988; 25:210-1.
15. Liang SL, Fricke TR. Diagnosis and management of accommodative esotropia. Clin ExpOptom 2006; 89:325-31.
16. Rutstein RP. Update on accommodative esotropia. Optometry 2008; 79:422-31.
17. Rutstein RP, Daum KM. Anomalies of binocular vision: diagnosis and management. St. Louis: Mosby, 1998: 234-7, 288-95, 300-3, 314-6.
18. Sidikaro Y, von Noorden GK. Observations in sensory heterotropia. J Pediatr Ophthalmol Strabismus 1982; 19:12-9.
19. Mohney BG. Common forms of childhood strabismus in an incidence cohort. Am J Ophthalmol 2007; 144:465-7.
20. Wick B, Cotter SA, Scharre J, et al. Characteristics and prevalence of exotropia in clinic.
**************************************Diro-filaria Repens Infection (Nodulocystic acne) A young patient reported to an ophthalmologist with a 2-week history of nodules that moved around her face. She had first noted a nodule below her left eye. Five days later, it had moved to above her left eye, and 10 days after that to the upper lip. The nodules occasionally caused a localized itching and burning sensation. She had recently traveled to a rural area outside Moscow and recalled being frequently bitten by mosquitoes. D.D. Human papillomavirus warts, Pyogenic granuloma, Relapsing malaria, Diro-filaria-Repens infection, Nodulocystic acne

Ophthalmology Update Vol. 16 No.4, Oct - Dec 2018866
Manual Small Incision Cataract Surgery in Phacomorphic Glaucoma Complications and Challenges
ABSTRACT:Objective: To evaluate the visual outcome, the control of the intraocular pressure (IOP) and the complications in patients with phacomorphic glaucoma undergoing manual small incision cataract surgery. Materials and Methods: This was prospective, non-randomized interventional consecutive case series carried out in Khyber Medical Center Dabgari Garden Peshawar from 1st January to 30th June 2017. The study included all patients with phacomorphic glaucoma that presented in the center. A complete examination, medical and ophthalmological history, initial investigations, clinic-pathological findings, ophthalmic findings that included the best corrected visual acuity (BCVA), biomicroscopy with slit lamp, indirect ophthalmoscopy and Goldmann applanation tonometry were performed. Cataract extraction was performed on all affected eyes with the manual small incision cataract surgery procedure (MSICS).Results: A sample of 84 eyes with phacomorphic glaucoma underwent the manual small incision cataract surgery. Mean intraocular pressure (IOP) before surgery was 39.5 ± 14.3 mmHg and the mean IOP at the last follow-up was 13.8 ± 2.4 mmHg. A significant fall in IOP was observed and no long-term anti-glaucoma medication was required. A better visual outcome result was reported since the best corrected visual acuity (BCVA) was 20/40 or better in 61 patients. Fifteen eyes had corneal edema and 38 eyes had inflammation of the anterior chamber. Both conditions were resolved with standard medical therapy.Conclusion: To achieve a good visual outcome, manage IOP and the least complication in the treatment of phacomorphic glaucoma, manual small incision cataract surgery is safe and effective.Keywords: Phacomorphic glaucoma, intraocular pressure, manual small incision cataract surgery.
Umer Khan Orakzai FCPS1, Mohammad Rafique Afridi FCPS2., Nazullah FCPS3 , Hassan Yaqoob FCPS4
Manual Small Incision Cataract Surgery in Phacomorphic Glaucoma Complications and Challenges
Umer Khan Orakzai
INTRODUCTION: Cataract is the leading cause of avoidable blind-ness in Pakistan and other developing countries. (1-4) Sta-tistics shows that 6.5 million blind people in Pakistan, with 50 to 80% of this group due to the cataract. (2-5) The proportion of blindness per cataract among all eye dis-eases ranges from 5% in developed countries to 50% or more in poor coutries or remote regions. According to the National Survey of Pakistan (2003), it is estimated that approximately 570,000 adults are blind (<3/60) as a
result of a cataract in Pakistan, and 3,560,000 eyes have a visual acuity <6/60 due to cataract. Due to scares re-sources, lack of knowledge about cataract services and delayed surgical intervention, phacomorphic glaucoma is a common clinical presentation in Pakistan and other developing countries. Somehow, different factors are responsible for late surgical intervention, such as the lack of better vision, concurrent systemic disease, old age and economic limitations, among other reasons, for patients who do not receive treatment, but in Paki-stan this is mainly due to the concept that the cataract should be eliminated only when it matures. (6) The de-lay of the surgical intervention leads to many complica-tions such as phacomorphic glaucoma. The statistics of the intumescent cataract that leads to pharmacological glaucoma are more in developing countries than devel-oped countries. (7)
-------------------------------------------------------------------------------------------Good visual outcome depends on the management of IOP and least complication in the treatment of phacomorphic glaucoma. Manual small incision cat-aract surgery is safe and effective.------------------------------------------------------------------------------------------- The only best possible treatment for intumes-
-------------------------------------------------------------------------------------------1 Assistant Professor Department of Ophthalmology Hayatabad Medical Complex Peshawar, Clinical Consultant Khyber Medical Center Dabgari Garden Peshawar2. Associate Professor Department of Ophthalmology Rehaman Medical Institute Peshawar3. Assistant Professor Department of Ophthalmology Hayat Abad Medical Complex Peshawar 4. Assistant Professor Department of Ophthalmology North West General Hospital Peshawar-------------------------------------------------------------------------------------------Correspondence Dr. Umer Khan Orakzai FCPS Assistant Professor Department of Ophthalmology Hayatabad Medical Complex Peshawar, Email :[email protected] Cell: 0321 9040506 address: 3rd Floor, C15,16 Khyber Medical Center Dabgari Garden Peshawar.-------------------------------------------------------------------------------------------Received: June’2018 Accepted Sep’2018-------------------------------------------------------------------------------------------
ORIGINAL ARTICLE

Ophthalmology Update Vol. 16 No.4, Oct - Dec 2018 867
Manual Small Incision Cataract Surgery in Phacomorphic Glaucoma Complications and Challenges
cent cataract is cataract extraction. [8] In the management of phacomorphic cataract, the clinicians faces serious challenges, such as high intraocular pressure (IOP), which increases the risk of expulsive hemorrhage, pos-itive pressure and, often, zonular dialysis is performed, which makes it difficult surgery. Due to limited re-sources and the manual economic image, small inci-sion cataract surgery (MSICS) is popular in developing countries without compromising medical standards.
(9-12) The present study aims to evaluate the visual out-come result, the control of intraocular pressure (IOP) and the complications in patients who have phacomor-phic glaucoma undergoing manual small incision cata-ract surgery.
MATERIALS AND METHODS: It was a prospective, non-randomized inter-ventional consecutive case series. Adequate informed consent was obtained from all participants before the start of the study. The demographic and clinical data of the patients were collected and recorded through a questionnaire. The patients diagnosed with phacomorphic glaucoma between January 2017 and June 2017 was included in the study. Those patients were diagnosed with phacomorphic glaucoma, which had complaints of acute pain and redness associated with objective signs such as the presence of corneal edema, an intumescent cataract lens and an IOP greater than 21 mmHg. (13) All patients in whom the other eye had a narrow angle and high IOP were excluded from the study. A complete examination and data on the demographic profile of the patient, previous medical and ophthalmic history, initial investigations, clinic-pathological findings, oph-thalmic findings including the best corrected visual acu-ity (BCVA), biomicroscopy with slit lamp, indirect oph-thalmoscopy, were made. B-scan ultrasound to exclude pathology of the posterior segment and Goldmann ap-planation tonometry were collected and recorded in a predesigned questionnaire preoperatively and during follow-up. Operational notes, findings and compli-cations were also completed in the questionnaire. All patients with phacomorphic glaucoma were treated with topical beta-blockers, drops of steroid antibiotics and oral acetazolamide. If the IOP was greater than 45 mmHg, mannitol was administered intravenously. All surgeries were performed by a single doctor.Before the start of surgery, 20% intravenous mannitol (1-2 g / kg of body weight) was administered to all patients. Peri bulbar anesthesia was administered to patients under-going surgeries. After an upper conjunctival fornix flap, a scleral incision of 6.0, 5.0 mm partial thickness was made 2 mm behind the limbus and 1 mm scleral tunnel was extended to the transparent cornea. An additional paracentesis was performed at the 10 o’clock position. The anterior cham-
ber was filled with an air bubble and 0.1 ml of 0.06% trypan blue was injected under the air bubble. After several seconds, viscoelastic was used to displace the air bubble. The anterior chamber was introduced with a 3.2 mm keratome. Viscoelastic was used to deepen the anterior chamber. Continuous curvilinear capsulorhex-is (CCC) was performed with a 26G needle. A Sinskey hook was used to hook a core pole out of the capsu-lar bag in the AC. The nucleus was extracted from the eye with visco elastic. After aspiration of the remaining cortex, the intraocular hard lens was implanted in the capsular bag. Hydration was performed with balanced salt solution. The conjunctival flap was opposed using a forceps adjusted to bipolar diathermy. Post op medications including topical antibiot-ics and steroids and oral analgesic were prescribed to patients for 2 months. The patients were again exam-ined at the follow-up visit after 2 months. All the col-lected data were analyzed by different statistical tests using SPSS version 20. All the data were expressed as mean +SE. t test was applied to calculate the X2 value of, the value of p, the relative risk and the 95% confi-dence interval. A p-value less than 0.05 were consid-ered significant.
RESULTS: The demographic details of the patients includ-ed in the study are presented in Table 1. A total of 84 patients of mean age 67.71±9.2 years with phacomor-phic glaucoma were analyzed during the study period of 6 months.
Table 1: Pre-operative demographic characteristics of the study population
Demographics No. of Patients
Age (Years)Mean 67.6 (+10.3)
Range 41.99
GenderFemale 32 (40%)
Male 52 (60%)
Status of fellow eye
Imature Cataract 42 (50%)
Mature cataract 5 (7%)
Aphakic 3 (3%)
Pseudophakic 27 (30%)
Clear lens 7 (10%)
Duration of Symptoms (Days)0-10 61 (72%)
11-20 22 (27%)
21-30 1 (1%)
Pre operative IOP25-40mmHg 44 (48%)
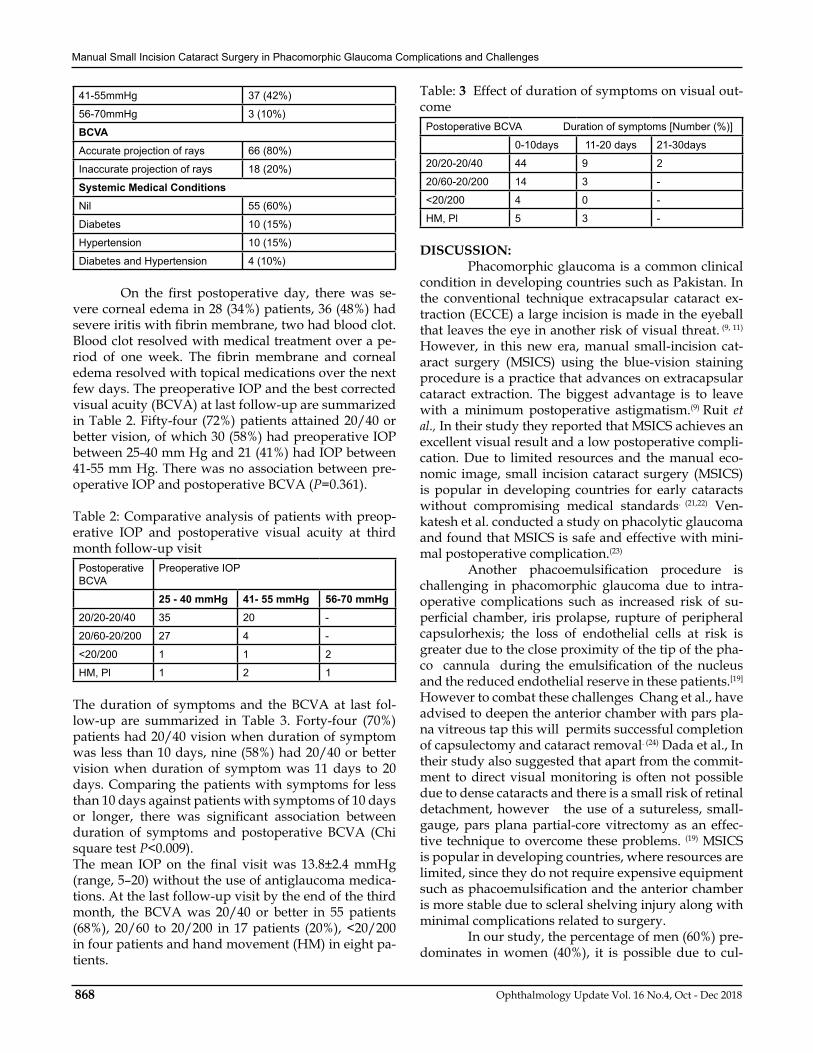
Ophthalmology Update Vol. 16 No.4, Oct - Dec 2018868
Manual Small Incision Cataract Surgery in Phacomorphic Glaucoma Complications and Challenges
41-55mmHg 37 (42%)
56-70mmHg 3 (10%)
BCVAAccurate projection of rays 66 (80%)
Inaccurate projection of rays 18 (20%)
Systemic Medical ConditionsNil 55 (60%)
Diabetes 10 (15%)
Hypertension 10 (15%)
Diabetes and Hypertension 4 (10%) On the first postoperative day, there was se-vere corneal edema in 28 (34%) patients, 36 (48%) had severe iritis with fibrin membrane, two had blood clot. Blood clot resolved with medical treatment over a pe-riod of one week. The fibrin membrane and corneal edema resolved with topical medications over the next few days. The preoperative IOP and the best corrected visual acuity (BCVA) at last follow-up are summarized in Table 2. Fifty-four (72%) patients attained 20/40 or better vision, of which 30 (58%) had preoperative IOP between 25-40 mm Hg and 21 (41%) had IOP between 41-55 mm Hg. There was no association between pre-operative IOP and postoperative BCVA (P=0.361).
Table 2: Comparative analysis of patients with preop-erative IOP and postoperative visual acuity at third month follow-up visit
Postoperative BCVA
Preoperative IOP
25 - 40 mmHg 41- 55 mmHg 56-70 mmHg20/20-20/40 35 20 -
20/60-20/200 27 4 -
<20/200 1 1 2
HM, Pl 1 2 1
The duration of symptoms and the BCVA at last fol-low-up are summarized in Table 3. Forty-four (70%) patients had 20/40 vision when duration of symptom was less than 10 days, nine (58%) had 20/40 or better vision when duration of symptom was 11 days to 20 days. Comparing the patients with symptoms for less than 10 days against patients with symptoms of 10 days or longer, there was significant association between duration of symptoms and postoperative BCVA (Chi square test P<0.009).The mean IOP on the final visit was 13.8±2.4 mmHg (range, 5–20) without the use of antiglaucoma medica-tions. At the last follow-up visit by the end of the third month, the BCVA was 20/40 or better in 55 patients (68%), 20/60 to 20/200 in 17 patients (20%), <20/200 in four patients and hand movement (HM) in eight pa-tients.
Table: 3 Effect of duration of symptoms on visual out-come
Postoperative BCVA Duration of symptoms [Number (%)]
0-10days 11-20 days 21-30days
20/20-20/40 44 9 2
20/60-20/200 14 3 -
<20/200 4 0 -
HM, Pl 5 3 -
DISCUSSION: Phacomorphic glaucoma is a common clinical condition in developing countries such as Pakistan. In the conventional technique extracapsular cataract ex-traction (ECCE) a large incision is made in the eyeball that leaves the eye in another risk of visual threat. (9, 11) However, in this new era, manual small-incision cat-aract surgery (MSICS) using the blue-vision staining procedure is a practice that advances on extracapsular cataract extraction. The biggest advantage is to leave with a minimum postoperative astigmatism.(9) Ruit et al., In their study they reported that MSICS achieves an excellent visual result and a low postoperative compli-cation. Due to limited resources and the manual eco-nomic image, small incision cataract surgery (MSICS) is popular in developing countries for early cataracts without compromising medical standards. (21,22) Ven-katesh et al. conducted a study on phacolytic glaucoma and found that MSICS is safe and effective with mini-mal postoperative complication.(23) Another phacoemulsification procedure is challenging in phacomorphic glaucoma due to intra-operative complications such as increased risk of su-perficial chamber, iris prolapse, rupture of peripheral capsulorhexis; the loss of endothelial cells at risk is greater due to the close proximity of the tip of the pha-co cannula during the emulsification of the nucleus and the reduced endothelial reserve in these patients.[19] However to combat these challenges Chang et al., have advised to deepen the anterior chamber with pars pla-na vitreous tap this will permits successful completion of capsulectomy and cataract removal. (24) Dada et al., In their study also suggested that apart from the commit-ment to direct visual monitoring is often not possible due to dense cataracts and there is a small risk of retinal detachment, however the use of a sutureless, small-gauge, pars plana partial-core vitrectomy as an effec-tive technique to overcome these problems. (19) MSICS is popular in developing countries, where resources are limited, since they do not require expensive equipment such as phacoemulsification and the anterior chamber is more stable due to scleral shelving injury along with minimal complications related to surgery. In our study, the percentage of men (60%) pre-dominates in women (40%), it is possible due to cul-

Ophthalmology Update Vol. 16 No.4, Oct - Dec 2018 869
Manual Small Incision Cataract Surgery in Phacomorphic Glaucoma Complications and Challenges
tural socioeconomic limitations. Three months after the operation, 54 (70%) of our patients had a good visual result with an BCVA of 20/40 or better and 20/60 to 20/200 in 13 (19%) patients. These results of visual out-come are similar to other ECCE studies conducted in phacomorphic glaucoma.(14,17). There was a significant association between the duration of symptoms and postoperative BCVA. Fifty-four patients had better visual acuity than 20/40, of which significantly more patients had a symptom onset duration of less than 10 days (82%; 43 of 54) compared to those with more than 10 days (14 %; 8 of 54). A better visual outcome was ob-served in those patients who had a shorter duration of onset of symptoms. The mean IOP at the final visit was 13.8 ± 2.4 mmHg and was less than 20 mmHg in the 84 patients and did not require long-term antiglaucoma medication. These results of our study on the control of IOP may be comparable with other studies on ECCE performed for phacomorphic glaucoma.(14-17) The t test was P <0.0001) between the IOP in the presentation and the IOP at the last follow-up, which is significant. Due to the elevated IOP associated with phacomorphic glaucoma and BCVA HM, 3 had pallor of the optic disc and 3 had glaucomatous atrophy. Two other patients who had BCVA <20/200 had pre-existing diabetic retinopathy with macular ede-ma. Considering the intense inflammation associated with phacomorphic glaucoma, corneal edema and AC inflammation was common in the majority of patients. (19) Due to limited resources and the manual economic image, manual small incision cataract surgery (MSICS) is popular in developing countries without compro-mising medical standards and allows high-volume cat-aract surgery compared to phacoemulsification. Due to scarce resources, lack of knowledge about cataract ser-vices and delayed surgical intervention, phacomorphic glaucoma is a common clinical presentation in Pakistan and other developing countries.
CONCLUSION. Our study has some limitations such as design-ing a non-randomized study and having a short fol-low-up period; however, we wish to show that MSICS could be safe and effective to control IOP and achieve good functional visual recovery in the management of phacomorphic glaucoma with minimal complications in the developing world.
REFERENCES:1. Thylefors B, Négrel AD, Pararajasegaram R, Dadzie KY. Global
data on blindness. Bull World Health Organ 1995;73:115-21.2. Murthy GV, Gupta SK, Bachani D, Jose R, John N. Current
estimates of blindness in India. Br J Ophthalmol 2005;89:257-60.
3. Thulasiraj RD, Nirmalan PK, Ramakrishnan R, Krishnadas R, Manimekalai TK, Baburajan NP, et al. Blindness and vision impairment in a rural south Indian population: The Aravind Comprehensive Eye Survey. Ophthalmology 2003;110:1491-8.
4. Thulasiraj RD, Rahamathulla R, Saraswati A, Selvaraj S, Ellwein LB. The Sivaganga eye survey: I. Blindness and cataract surgery. Ophthalmic Epidemiol 2002;9:299-312.
5. Nirmalan PK, Thulasiraj RD, Maneksha V, Rahmathullah R, Ramakrishnan R, Padmavathi A, et al. A population based eye survey of older adults in Tirunelveli district of south India: Blindness, cataract surgery and visual outcomes. Br J Ophthalmol 2002;86:505-12.
6. Tomey KF, al-Rajhi AA. Neodymium: YAG laser iridotomy in the initial management of phacomorphic glaucoma. Ophthalmology 1992;99:660-5.
7. Lowe RF. Angle closure glaucoma and cataract East. Arch Ophthalmol 1973;1:80-3.
8. Gressel MG. Lens-induced glaucoma. In: Tasman W, Jaeger E, editors. Duane’s Clinical Ophthalmology. 5th ed. Philadelphia: Lippincott Williams and Wilkins; 1998. p. 554.
9. Gogate PM, Deshpande M, Wormald RP, Deshpande R, Kulkarni SR. Extracapsular cataract surgery compared with manual small incision cataract surgery in community eye caresetting in western India: A randomised controlled trial. Br J Ophthalmol 2003;87:667-72.
10. Venkatesh R, Muralikrishnan R, Balent LC, Prakash SK, Prajna NV. Outcomes of high volume cataract surgeries in a developing country. Br J Ophthalmol 2005;89:1079-83.
11. Natchiar G, Dabralkar T. Manual small incision suture less cataract surgery: An alternative technique to instrumental phacoemulsification. Oper Tech Cataract Refract Surg 2000;3:161-70.
12. Muralikrishnan R, Venkatesh R, Prajna NV, Frick KD. Economic cost of cataract surgery procedures in an established eye care centre in southern India. Ophthalmic Epidemiol 2004;11:369-80.
13. Prajna NV, Ramakrishnan R, Krishnadas R, Manoharan N. Lens induced glaucomas– visual results and risk factors for final visual acuity. Indian J Ophthalmol 1996;44:149-55.
14. Jain IS, Gupta A, Dogra MR, Gangwar DN, Dhir SP. Phacomorphic glaucoma– management and visual prognosis. Indian J Ophthalmol 1983;31:648-53.
15. Pradhan D, Hennig A, Kumar J, Foster A. A prospective study of 413 cases of lens-induced glaucoma in Nepal. Indian J Ophthalmol 2001;49:103-7.
16. Venkatesh R, Das M, Prashanth S, Muralikrishnan R. Manual small incision cataract surgery in white cataracts. Indian J Ophthalmol2005;53:181-4.
17. McKibbin M, Gupta A, Atkins AD. Cataract extraction and intraocular lens implantation in eyes with phacomorphic or phacolytic glaucoma. J Cataract Refract Surg 1996;22:6303.
18. iverchia LL, Balent A. Intraocular lens implantation in acute angle closure glaucoma associated with cataract. J Am Intraocul Implant Soc 1985;11:171-3.
19. Abdohali A, Naimi MT, Shams H. Effect of low–molecular weight Heparin on postoperative inflammation in phacomorphic glaucoma. Arch Iranian Med 2002;5:225-9.
20. Dada T, Kumar S, Gadia R, Aggarwal A, Gupta V, Sihota R. Sutureless single-port transconjunctival pars plana limited vitrectomy combined with phacoemulsification for management of phacomorphic glaucoma. J Cataract Refract Surg 2007;33:951-4.
21. Ruit S, Tabin G, Chang D, Bajracharya L, Kline DC, Richheimer W, et al. A prospective randomized clinical trial of phacoemulsification vs manual sutureless small-incision extracapsular cataract surgery in Nepal. Am J Ophthalmol 2007;143:32-8.
22. Richard P. Wormald phacoemulsification vs small-incision manual cataract surgery: An expert trial. Am J Ophthalmol 2007;143:143-5.
23. Venkatesh R, Tan CS, Kumar TT, Ravindran RD. Safety and efficacy of manual small incision cataract surgery for phacolytic glaucoma. Br J Ophthalmol 2007;91:279-81.
24. Chang DF. Pars plana vitreous tap for phacoemulsification in the crowded eye. J Cataract Refract Surg 2001;27:1911-4.

Ophthalmology Update Vol. 16 No.4, Oct - Dec 2018870
Prevalence of Congenital & Acquired Strabismus in Low Vision Department
ABSTRACTObjectives: The objective of his study was to estimate the proportion of congenital and acquired strabismus in patients with low vision.Methodology: A cross sectional study was done 170 patients with decreased contrast were taken through convenient sampling who fit the inclusion criteria. Visual acuity of all the patients was measured using ETDRS chart at a distance of 4 meters. Then cover test was performed at both short and long distance to access strabismus. Results: In 170 patients 48.8% were having acquired strabismus while remaining 27 patients (16.5%) had strabismus since birth. 64.7% strabismus in patients presenting in low vision department were very high.Conclusion: This study concluded that strabismus in patients presenting in low vision department was very high, mostly had acquired strabismus. Key words: Strabismus, acquired, prevalence, ETDR, low vision, congenital
Ahmed Ali MBBS1. Syed M. Noor Hashim Ali MBBS2., Fahad Abid MBBS3
Prevalence of Congenital & Acquired Strabismus in Low Vision Department
Ahmed Ali
INTRODUCTION: A patient with low vision is the one who has visual impairment even after best available treatment (medical, surgical, optical) and who has visual acuity of <6/18 to no perception of light (NPL) or visual field of 10 degree from center of fixation or 20 degree in largest diameter in better eye but who have potential to do ac-tivities of daily life1. Globally, 32.4 million people were blind in 2010, and 191 million had moderate to severe visual im-pairment (MSVI). The MSVI prevalence in older adults was highest in South Asia (23.6%; 95%CI, 19.4-29.4%), Oceania (18.9%; 95%CI, 11.8%-23.7%) and Eastern and Western Sub-Sahara Africa and North Africa and Mid-dle East (95%CL, 15.9%-16.8%)2. In Pakistan standardized prevalence of FLV were 1.7% (95% CL: 1.5-1.9%) and total blindness were 0.2% (95%CL: 0.1%-0.2%). An estimated 727,000 (586,000-891,000) adults in Pakistan had FLV. Retinal conditions were the commonest cause in urban popu-lations (39.8%vs. 26.5%rural) compared with corneal opacity in rural areas (38.0% vs. 25.55 urban) . It was
estimated that 565,000 adults require assessment for optical services, 735,000 for non-optical interventions, and 424,000 for rehabilitations.3
-------------------------------------------------------------------------------------------The incidence of strabismus in patients presenting in Low Vision Department was very high. It is mostly acquired strabismus. ------------------------------------------------------------------------------------------- Globally the principal causes of visual impair-ment are uncorrected refractive errors and cataracts, 43% and 33 % respectively. Other causes are glaucoma, 2% age related macular degeneration (AMD), Diabetic retinopathy, Trachoma and corneal opacities, All about 1 %. in larger portion of 18% the etiology have remaied undetermined4. These diseases cause not only pathological complications, such as retinal detachment, macular de-generation and optic disc abnormalities but also func-tional problems, such as misalignment of eye position. Horizontal and/or vertical strabismus is often observed in patients with diseases.5
Study in Japan have been confirmed the rela-tively high prevalence of horizontal and vertical stra-bismus with pathological myopia. Among 636 patients with pathological myopia, 520(81.8%) had orthophoria, 85(13.4%) had exotropia and 31(4.9%) had esotropia at near distance. At long distance, 499(86.5) had orthopho-ria, 51(8.8) had exotropia and 27(4.7%) had esotropia. Vertical heterotropia was seen in 103 patients (16.2%).6
It has been concluded the risk of strabismus in patients having congenital nystagmus and can predict-
-------------------------------------------------------------------------------------------1. House Officer, DHQ Teaching Hospital Sahiwal 2. Medical Officer THQ Hospital, Talagang District Chakwal 3. Medical Officer RHC Maghian Attock-------------------------------------------------------------------------------------------Correspondence: Dr. Ahmed Ali, House Officer, DHQ Teaching Hospital Sahiwal Email : [email protected] Cell. 0333 555 92817-------------------------------------------------------------------------------------------Received: June’2018 Accepted Sep’2018-------------------------------------------------------------------------------------------
ORIGINAL ARTICLE

Ophthalmology Update Vol. 16 No.4, Oct - Dec 2018 871
Prevalence of Congenital & Acquired Strabismus in Low Vision Department
ed from the nature of underlying visual disorder.7Stra-bismus was found in 50% of children with congenital nystagmus. The prevalence of strabismus was 82% in children with bilateral optic nerve hypoplasia, 53% in patients with albinisim, 3 % in children with congenital retinal dystrophies, and 17% in children with idiopath-ic congenital nystagmus.8
Cyclic exotropia is an unusual association with retinitis pigmentosa.9 Strabismus causes double vision and/or eye strain. To avoid double vision, the brain may adopt by ignoring one eye. Strabismus also causes loss of depth perception. A constant unilateral strabis-mus causing suppression, fatigue when reading, and unstable vision.10Strabismus also affect the cosmetical appearance of patient.
MATERIALS AND METHODS: It was a cross-sectional study which was car-ried out from 17 April-25 July 2016 in LRBT, Hospital Lahore. Study was carried out in Low vision depart-ment of LRBT which is a tertiary eye care hospital. The patients from all over the Pakistan came here. As the patients presenting in low vision department were al-ready referred and screened, all the patients present-ing in low vision department in this time period were included as participants. Sample size was consisted on 170 patients. Non probability convenient sampling technique was used. Data was collected using questionnaire in-cluding clinical findings. Equipments used to collect data were ETDRS Chart to access visual acuity with-occluder and target to perform cover test Assessment was start by taking written informed consent. If the eye was exotropic, when fixating eye was covered , caused an inwards movement; and esotropic, when fixating eye was covered , caused an outwards movement. The alternating cover test, or cross cover test was used to detect total deviation (tropia + phoria). Fixation targets are required for both the near (33 cm) and far (6m) com-ponents of the cover test. Near Targets (33 cm). In those patients with poor vision a spotlight was used. (Same as near targets).[1] Snellen’s chart was used as target when assessing a patient’s far compo-nent of a cover test.[1] while performing the cover test it was made sure that the patient was clearly seeing the fixation targets to confirm their accommodating eye is controlled.[1]
Data analysis was done by using SPSS. Confi-dence level was set at 5 %. Data was summarized upon the nature of data. Descriptive data was analyze by us-ing percentages and frequencies and summarized in tables. All preliminary analysis was done to check the data for fulfillment of assumptions.
RESULTS: Total 170 participated in this study. Majority of the patients were males (93, 54.7%) and remaining (77,
45.30%) were females.
Figure no. 1 showing gender of the patients:Age of the participants: There were 5 age groups in this study and most of the participants belonged to age group >5-15 years (31.2%) and the participants belong-ing to age group from >35-45 were lesser (8.8%)
Figure no. 2 showing age of the patients:History of deviation: History of deviation in eyes was taken from patients. Mostly of the participants were presented with acquired deviation (48.80%). (34.7%) were presented with no history of deviation and (16.50%) gave the history of deviation since birth
Figure no. 3 showing history of deviation: Strabismus:Total percentage of presence of strabismus in patients presenting in low vision department was very high that was (64.7%).
Figure no. 4 showing percentage of strabismus:
DISCUSSION: In 170 patients 48.8% were having acquired strabismus while remaining 27 patients (16.5%) had strabismus since birth. 64.7% strabismus in patients presenting in low vision department that was very

Ophthalmology Update Vol. 16 No.4, Oct - Dec 2018872
Prevalence of Congenital & Acquired Strabismus in Low Vision Department
high. Similarly a study was conducted in Nigeria by Dirani et al in 2016 he concluded in a study that the most frequent causes of amblyopia were refractive er-ror (85%) and strabismus (15%); anisometropic astigma-tism >1.50 D (42%) and isometropic astigmatism >2.50 D (29%) were frequent refractive errors. The prevalence of strabismus in children aged 6 to 72 months was 0.80% (95% CI, 0.51–1.19), with no sex (P = 0.52) or age (P = 0.08) effects. The exotropia-esotropia ratio was 7:1, with most exotropia being intermittent (63%). Of chil-dren with amblyopia, 15.0% had strabismus, whereas 12.5% of children with strabismus had amblyopia.[17]
A study was conducted in US by Virginia Wong et al in 2012 concluded 20% strabismus asso-ciated with congenital causes. [18] While Stephan et al I Ethiopia concluded in a study that Prevalence of oth-er ocular disorders included strabismus (34/72, 47%), nasolacrimal duct obstruction (26/73, 35.6%), cataracts (5/64, 7.8%), and nystagmus (12/72, 16%) and acquired strabismus is 35% in this. While congenital is just 10%.[19]
Thomas et al in Turkey concluded that the prevalence of nystagmus in the general population was estimated to be 24.0 per 10,000 population (95% confi-dence interval [CI], ±5.3). The most common forms of strabismus were acquired (6.8 per 10,000 population; 95% CI, ±4.6), associated with low vision such as con-genital cataracts (4.2 per 10,000; 95% CI, ±1.2), and nys-tagmus associated with retinal diseases such as achro-matopsia (3.4 per 10,000 population; 95% CI, ±2.1).[20]
CONCLUSION: This study concluded 64.7% strabismus in pa-tients presenting in low vision de-partment that was very high. Out of 170 patients 83 patients (48.80%) had acquired deviations and 28 pa-tients (16.50%) were having strabismus since birth and remaining 59 patients (34.5%) were presented without history of deviation. It was recommended to low vision practi-tioners to prescribe patching therapy to prevent them from amblyopia and for adults with better visual status it was recommended to prescribe prisms to them and for those whose visual acuity improved with optical aids, surgery should be advised to them.
REFERENCES:1. Robaei D, Rose KA, Kifley A, et al. Factors associated with
childhood strabismus: findings from a population-based study. Ophthalmology 2006; 113:1146-53.
2. Tomilla V, Tarkkanen A. Incidence of loss of vision in the healthy eye in amblyopia. Br J Ophthalmol 1981; 65:575-7.
3. van Leeuwen R, Eijkemins MJ, Vingerling JR, et al. Risk of bilateral visual impairment in individuals with amblyopia: the Rotterdam study. Br J Ophthalmol 2007; 91:1450-1.
4. Jones RK, Lee DN. Why two eyes are better than one. J Exp Psychol Hum Percept Perform 1981; 7:30-40.
5. Sheedy JE, Bailey IL, Buri M, Bass E. Binocular vs. monocular task performance. Am J Optom Physiol Opt 1986; 63:839-46.
6. Weissberg E, Suckow M, Thorn F. Minimal angle horizontal strabismus detectable by lay observers. Optom Vis Sci 2004; 81:506-9.
7. Akay AP, Cakaloz B, Berk AT, Pasa E. Psychosocial aspects of mothers of children with strabismus. J AAPOS 2005; 9:268-73.
8. Prosser PC. Infantile development: strabismic and normal children compared. Ophthalmic Optician 1979; 19:681-3.
9. Tonge BJ, Lipton GL, Crawford G. Psychological and educational correlates of strabismus in school children. Aust N Z J Psychiatry 1984; 18:71-7.
10. Dobson V, Sebris SL. Longitudinal study of acuity and stereopsis in infants with or at risk for esotropia. Invest Ophthalmol Vis Sci 1989; 30:1146-58References 49
11. Vision in Preschoolers Study Group. Does assessing eye alignment along with refractive error or visual acuity increase sensitivity for detection of strabismus in preschool vision screening? Invest Ophthalmol Vis Sci 2007; 48:3115-25.
12. Duckman RH, Meyer B. Use of photoretinoscopy as a screening technique in the assessment of anisometropia and significant refractive error in infants/toddlers/children and special populations. Am J Optom Physiol Opt 1987; 64:604-10.
13. Rutstein RP, Daum KM. Anomalies of binocular vision: diagnosis and management. St. Louis: CV Mosby, 1998:192-5.
14. ondhi N, Archer SM, Helveston EM. Development of normal ocular alignment. J Pediatr Ophthalmol Strabismus 1988; 25:210-1.
15. Liang SL, Fricke TR. Diagnosis and management of accommodative esotropia. Clin ExpOptom 2006; 89:325-31.
16. Rutstein RP. Update on accommodative esotropia. Optometry 2008; 79:422-31.
17. Rutstein RP, Daum KM. Anomalies of binocular vision: diagnosis and management. St. Louis: Mosby, 1998: 234-7, 288-95, 300-3, 314-6.
18. Sidikaro Y, von Noorden GK. Observations in sensory heterotropia. J Pediatr Ophthalmol Strabismus 1982; 19:12-9.
19. Mohney BG. Common forms of childhood strabismus in an incidence cohort. Am J Ophthalmol 2007; 144:465-7.
20. Wick B, Cotter SA, Scharre J, et al. Characteristics and prevalence of exotropia in clinic

Ophthalmology Update Vol. 16 No.4, Oct - Dec 2018 873
Outcome of Late Fixation of Fracture Neck of Femur in Young Adults by Multiple Cannulated Screws
GENERAL SECTION
ABSTRACTObjective: To analyze the results of multiple cannulated screws in patients with fracture neck of femur in young adults with age less than 60 years.Methods: It was descriptive case study in which 54 patients were selected with fracture neck of femur from January 2013 to December 2016 at Mardan medical complex Mardan.35 patients were male and 19 were female. Patients were operated 3-4 days after trauma due to late arrival and preparation for surgery. Patients were followed for one year after surgery. Patients were classified according to Garden Classification. The anatomical reduction was assessed by Garden Anatomical Index on Hip X rays performed in antero-posterior and Lateral views. Post-operative results were analyzed during follow up period.Results: In 54 patients Garden 1(G1) cases were 4, Garden 2 (G2) cases were 19. Garden 3 (G3) group cases were 24 while 7 cases were in Garden 4(G4) group. Avascular necrosis and nonunion was observed in 11 cases. These patients were having displaced fracture and were in G3 and G4 groups. In these patients 2 cases were re operated by using fibular Graft. While 4 patient were selected for total Hip replacement. AVN was in 19% cases and Nonunion was in 3% case. Patients in G1 and G2 groups had good and excellent results. Innon-displaced group 100% union was observed.Conclusion: In young Adults with displaced fracture neck of femur, early fixation with multiple cannulated screws and proper anatomical reduction can save patients from lifelong limb disabilities. Key words: femoral neck fractures, multiple screw fixations, avascular necrosis, non-union.
Haziq Dad KhanFCPS1, Tariq AhmadFCPS2, Zahir Khan.FCPS3
Deptt. of Orthopaedics Bacha Khan Medical College Mardan
INTRODUCTION Fracture neck of femur is common in any age group. High energy is required for fracture in young whiletrivial trauma is needed for fractures in elderly due to osteoporosis.1 Incidence of hip fracture in el-derly population is 150/10000 2. Billions of rupees are spend on treating and preventing the fractures. 340000 hip fractures are treated in US.3Fractured neck of femur bears a high risk of mortality within the first 6 months after surgery.4,5,6 Most fractures of the femoral neck are intra-capsular and may compromise the tenuousblood
supply to the femoral head. Basic cervical femoral neck fractures are extra-capsular femoral neck fractures and often are considered with intertrochantericfemoral fractures.7
Two main complication of the fracture neck of femur are osteonecrosis and non-union of fractures. The fracture non- union and avascular necrosis ranges from 8-80 % respectively 8,9,10.The aim of surgery is to restore patients’ mobility.Fracture neck of femur can be treated conservatively by endoprosthesis (arthroplasty) and osteosynthesis (internal fixation). Trauma-induced avascular necrosis of the femoral head, either with or without bony fracture, represents the most common femoral head aseptic osteonecrosis.11,12. In young pa-tients with fractured neck of femur osteosynthesis should always be the preferred option, whereas in old-er patients, endoprosthesis should be favored13. For middle aged patients (55–65 years), the indication is the subject of much controversial discussion and has to be
-------------------------------------------------------------------------------------------Associate Professor.2 3.Assistant Professors-------------------------------------------------------------------------------------------Correspondence; Dr.Haziq Dad Khan, Associate Professor Orthopaedic, Bacha Khan Medical College Mardan. [email protected] 03335015008 Flat. No: 7, Mardan Medical Complex: Mardan KPK-------------------------------------------------------------------------------------------Received: July’2018 Accepted Sep’2018-------------------------------------------------------------------------------------------
Outcome of Late Fixation of Fracture Neck of Femur in Young Adults by
Multiple Cannulated Screws.Haziq Dad
Khan
ORIGINAL ARTICLE

Ophthalmology Update Vol. 16 No.4, Oct - Dec 2018874
Outcome of Late Fixation of Fracture Neck of Femur in Young Adults by Multiple Cannulated Screws
defined for each patient individually.14.-------------------------------------------------------------------------------------------In young Adults with displaced fracture neck of fe-mur, early fixation with multiple cannulated screws and proper anatomical reduction can save patients from lifelong limb disabilities-------------------------------------------------------------------------------------------
MATERIAL AND METHODS In this descriptive case study 54 patients with fracture neck of femur were selected with the age less than 60 years. The patients were treated in Mardan Medical Complex Mardan Orthopaedic department from January 2013 to December 2016. This study was approved by the hospital ethical committee. Patients selection was intracapsular fractures presented to the accident and Emergency department and then referred to the Orthopaedic department. The exclusion criteria were patient younger than 18 years, older than 65 years and hepatitis B and C positive patients. 35 patients were male and 19 were female. Pa-tients were operated 3-4 days after trauma. Patients were followed for one year after surgery. Patients were classified according to Garden Classification. The an-atomical reduction was assessed by Garden Anatomi-cal Index on Hip X rays performed in antero-posterior and lateral views. Post-operative results were analyzed during follow up period for one year. Patients with frac-ture neck of femur were treated as emergency but most of the patients surgery was two to three days late due to late arrival of the patients to the hospital and preparing them for surgery as no facility of immediate orthopedic emergency surgery was available in the hospital. 6.5 mm cannulated screws were used for fixa-tion of the fractures under image intensifier machine. Three screws were used in reverse triangle fashion after proper reduction of the fracture.Most fractures (36/54 fractures) were reduced by closed technique on a trac-tion table, but the reminder required open reduction. We used a simple lateral approach if closed reduc-tion was satisfactory, but a Watson-Jones lateral ap-proach was used if open reduction of the fracture was required. The joint was opened in the middle of the anterior capsule by a mid-longitudinal incision, stop-ping 1 cm short of the intertrochanteric line. A guide wire was passed in the center of the femoral neck from 2 to 3 cm below the greater trochanter to the acetabu-lar floor. Two more guide wires were passed parallel to the central wire (so one was above and one below).Three 6.5-mm cannulated screws of sufficient thread length for compression were placed over the two Pa-tients were followed in the outpatient department with regular checkups on 1, 3, 6 and 12 months. Patient clin-ical and radiological union, range of motion, avascular necrosis and nonunion of the fracture was assessed. No plaster was applied postoperatively. Straight leg raising and exercises of the ankle and knee were started the next day. The patients were allowed to
walk after 7 to 10 days with crutches (non-weightbear-ing), and were sent home 2 to 6 weeks postoperatively. At 8 weeks postoperatively, patients were examined ra-dio graphically in an outpatient clinic and were allowed partial weightbearing. At 12 weeks postoperatively, full weight- bearing was commenced depending on the progress of fracture union. Outpatient radiographic re-views were performed at 4-week intervals until union was achieved. Garden classification of fracture neck of femurStage I: incomplete fracture line (valgus impacted)Stage II: complete fracture line; non-displacedStage III: complete fracture line; partially displacedStage IV: complete fracture line; completely displaced
RESULTS In 54 patients Garden 1(G1) cases were 4, Gar-den 2 (G2) cases were 19. Garden 3 (G3) group cas-es were 24 while 7 cases were in Garden 4(G4) group. Avascular necrosis and nonunion was observed in 11 cases. These patients were having displaced fracture and were in G3 and G4 groups. In these patients 2 cas-es were re operated by using fibular Graft. 4 patients were selected for total Hip replacement. AVN was in 19% cases and Nonunion was in 3% case. Patients in G1 and G2 groups had good and ex-cellent results. In non-displaced group 100% union was observed.TABLE 1
classification Garden1 Garden2 Garden3 Garden4
No. of patients 4 19 24 7
Union achieved 100% 94% 75% 43%
Nonunion/avascular necrosis
Nil 1 ( 5%) 6 (25%) 4 ( 57%)
The overall incidence of complication i.e. non-union and avascular necrosis for all patients was 20%. Fracture nonunion was less common (p < 0.0001) for undisplaced fractures than for displaced fractures (11 of 54 [20%] (Table 1). At the final followup, surgical treat-ment generally with an arthroplasty was performed for

Ophthalmology Update Vol. 16 No.4, Oct - Dec 2018 875
4 out of 11 patients with avascular necrosis and fibular grafting for treatment of non-union of the displaced fractures.Table 1. Demographic dataData on patients (overall)Number of fractures 54
Mean age (y) 53.5 (18–65)
Mean duration of follow up (months) 12 monthsFracture typeUn-displaced (Garden I, II), n (%) 23 (42%)Displaced (Garden III, IV), n (%) 31 (57.4)Fracture reductionExcellent, n (%) 43 (67.2)Union rate after one operation, n (%) 62 (96.9)Rate of osteonecrosis, n (%) 8 (14.5)Rate of conversion to total hip arthroplasty, n (%)
3 (4.49)
DISCUSSION The aim of the study is to find the outcome of neck of femur fracture fixation who presented late or surgery was performed late. Two main complications were found in the series i.e. nonunion and avascular necrosis were found. The main complication of inter-nal fixation of intracapsular fractures is nonunion of the fracture.14,15. This term is used for fractures in which the fixation fails to hold and the fracture is displaced before union has occurred or the more unusual situation of the fracture failing to heal with the fixation intact. Numerous other factors that may influence lat-er development of fracture-healing complications have been studied. These include patient factors such as the
presence of rheumatoid arthritis and metabolic bone disease and surgical factors such as timing of surgery, quality of the reduction and fixation, and positioning of the implant16,17,18. These factors, although relevant in determining the best treatment method or outcome for a patient with an intracapsular fracture, are outside the scope of this study. In the study by Parker M.I et19 al the incidence of nonunion was 19.3%. Fracture nonunion was less common for un-displaced fractures than for displaced fractures (48 of 565 [8.5%] versus 171 of 568 [30.1%]) and in men than in women (35 of 271 [12.9%] versus 184 of 862 [21.3%]). The incidence of nonunion progressive-ly increased with age from one of 17 (5.9%) in patients younger than 40 years to 84 of 337 (24.9%) in patients in their 70s. In our study the nonunion was 11% which was ingarden type 3 and 4 fractures. Seyedet al.20.reported the complication in 11% patients but their study was not in patients with late presented patients while in our study the complications were associated only in displaced fractures i.e. Garden 3 and Garden 4 groups.CONCLUSION: In young Adults with displaced fracture neck of femur, early fixation with multiple cannulated screws after proper anatomical reduction can save patients from lifelonglimb disabilities. REFERENCES.1. Cserháti P, Kazár G, Manninger J, et al. Non operative or
operative treatment for undisplaced femoral neck fractures: a comparative study of 122 non operatively and 125 operatively treated cases. Injury 1996;27:383–92.CrossRefGoogle Scholar
2. Fekete K, Kazár G, Manninger J. Die Bedeutung der Bruchformfür die Behandlung der Schenkelhalsfraktur. Unfallchirurg 1989;92:229–33.PubMedGoogle Scholar
3. Fekete K, Salacz T, Manninger J, et al. A c o m b n y k t ö r é s o s t e o s y n t h e s i s k é t c a n n u l a l t (furatos) csavarral. [Die Osteosynthese von S c h e n k e l h a l s b r ü c h e n m i t k a n ü l i e r t e n S c h r a u b e n . ] MagyTraumatolOrthopHelyreallitoSebesz 1992;35:141–8.Google Scholar
4. Garden RS. Low-angle fixation in fractures of the femoral neck. J Bone Joint Surg [Br] 1961;43:647–63.Google Scholar
5. Garden RS. Stability and union in subcapital fractures of the femur. J Bone Joint Surg [Br] 1964;46:630–47.Google Scholar
6. Harty M. The significance of the calcarfemoris in femoral neck fractures. SurgGynecolObstet 1965;120:341–3.Google ScholarKyle RF, Cabanela NE, Russel TA, et al. Fractures of the proximal part of the femur. Instruction course lecture. J Bone Joint Surg [Am] 1994;76:924–52.Google Scholar
7. Manninger J, Kazár G, Fekete G, et al. Avoidance of avascular necrosis of the femoral head, following fractures of the femoral neck, by early reduction and internal fixation. Injury 1985;16:437–48.CrossRefPubMedGoogle Scholar
8. Manninger J, Kazár G, Fekete G, et al. Significance of urgent (within 6 h) internal fixation in the management of fractures of the neck of the femur. Injury 1989;20:101–5.CrossRefPubMedGoogle Scholar
9. Manninger J, Kazár G, Nagy E, Zolczer L. Die Phlebographie des Schenkelkopfes. AkadémiaKiadó, 1979.Google Scholar
10. Müller ME, Nazarian S, Koch P, Schatzker J. The comprehensive classification of fractures of long bones. Berlin-Heidelberg-New York: Springer, 1990.Google Scholar
11. Pannike A. Die Reposition: richtungsweisende Grundlage für
Outcome of Late Fixation of Fracture Neck of Femur in Young Adults by Multiple Cannulated Screws
http://www.ncbi.nlm.nih.gov/entrez/query.fcgi?cmd=Retrieve&db=PubMed&dopt=Abstract&list_uids=2740920
http://www.ncbi.nlm.nih.gov/entrez/query.fcgi?cmd=Retrieve&db=PubMed&dopt=Abstract&list_uids=4030066

Ophthalmology Update Vol. 16 No.4, Oct - Dec 2018876
Outcome of Late Fixation of Fracture Neck of Femur in Young Adults by Multiple Cannulated Screws
Erfolgoder Misserfolg der Stabilisierung der hüftkopfnahen Schenkelhalsfraktur. Unfallchirurgie 1996;22:239–47.PubMedGoogle Scholar
12. Pauwels F. Der Schenkelhalsbruch, einmechanisches Problem. Grundlagen des Heilvorganges: Prognose und kausaleTherapie. Z OrthopChir 1935;63:Beilageheft.Google Scholar
13. Rehnberg L, Olerud C. Subchondral screw fixation for femoral neck fractures. J Bone Joint Surg [Br] 1989;71:178–80.Google Scholar Top of Form
14. F Liporace, R Gaines, C Collinge, GJ Haidukewych - JBJS, 2008 - journals.lww.comRoder F, Schwab M, Aleker T, Morike K, Thon KP, Klotz U. Proximal femur fracture in older patient’s rehabilitation and clinical outcome. Age Ageing 2003; 32: 74-80.
15. Solomon L, Warwick D, Nayagam S. Apley’s system of orthopaedics’ and fractures, 9th ed. London: WB Saunders, 2007; 681-704.
16. Sipila J, Hyvonen P, Partanen J, Ristiniemi J, Jalovaara P. Early revision after hemiarthroplasty and osteosynthesis of cerivical hip fracture. ActaOrthopScand 2004 Aug;75(4): 402-7.
17. Liporace F, Gaines R, Collinge C, Haidukewych GJ. Results of internal fixation of Pauwels type-3 vertical femoral neck fractures. J Bone Joint Surg Am. 2008 Aug;90(8):1654–1659. doi: 10.2106/JBJS.G.01353.
18. Damany DS, Parker MJ, Chojnowski A. Complications after intracapsular hip fractures in young adults: A meta-analysis of 18 published studies involving 564 fractures. Injury. 2005 Jan;36(1):131–141. doi: 10.1016/j.injury.2004.05.023
19. Syed DilBagh Ali Shah, Jamil Khan, Sikandar Hayat, M. Ayaz Khan, Aqil Khan. Outcome of AO Screw Fixation for Intra-Capsular Neck of Femur Fracture JPOA,38 Vol. 29 (4) December, 2017
**************************************Vitamin A deficiency A 4-year-old boy with a 1-year history of enlarging white deposits in both eyes and decreasing night vision. On examination, the conjunctivae of both eyes appeared dry and wrinkled, with foamy, cream-colored deposits near the outer corners. The corneas were clear, the fundi were normal, and the visual acuity was 20/30 in both eyes. The child was anaemic with hypopigmented hair, a weight of 10.5 kg and a height of 92 cm. D.D. Sjögren’s syndrome, Pyridoxine deficiency, Vitamin A deficiency, Loaisis, Type 1 diabetes

Ophthalmology Update Vol. 16 No.4, Oct - Dec 2018 877
Frequency of Most Common Presenting GI Symptoms & Signs of Dengue in Tertiary Care Hospital, Peshawar
ABSTRACT Objective: The aim of this study was to determine the frequency of gastrointestinal symptoms and signs in patients admitted with Dengue fever.Materials and Methods: A descriptive study was conducted in Dengue isolation unit,Lady Reading Hospital, Peshawar from 01/09/2017 to 30/09/2017. In this study complete medical record of 407 Patients with confirmed Dengue was reviewed for presence of gastrointestinal symptoms and signs.Results: In Patients admitted with Dengue, nausea and vomiting were the most common Gastrointestinal symptoms in 69.7% of cases, followed by abdominal pain in 41.3% and diarrhea in 13.7%.Hepatomegaly or splenomegaly were present in 2.9% while hematemesis was present in 1.3% of cases.Conclusion: Our study concludes that gastrointestinal symptoms and signs are very common in patients with Dengue fever.Key words: Dengue fever, Gastrointestinal symptoms and signs, alarm features, Dengue shock syndrome
Awais Naeem MRCP. FCPS1, Fahad Naeem MRCP. FCPS2, M. Bilal Awan FCPS3, M. Talha Khan MBBS4 Aamer Ubaid MBBS5, Farishta Waheed MBBS6
Frequency of Most Common Presenting GI Symptoms & Signs in Dengue in a Tertiary Care
Hospital, Peshawar (KPK)during Dengue Epidemic in 2017
INTRODUCTION The female Aedesaegypti and Aedesalbopictus mosquito is the vector that transmits Dengue virus which is a RNA Flavivirus.1-3 It is a significant cause of morbidity and mortality in developing countries, including Pakistan with millions of people at risk. Till 2016 almost 71649 Dengue cases were reported with 757 deaths.4,5 Currently the disease is endemic in 112 coun-tries in Africa, America, the Eastern Mediterranean, Southeast Asia and the Western Pacific. It is estimated that approximately 250 million people living in tropical and subtropical areas are at risk to the disease.6 After the initial 1997 WHO classification of Dengue, WHO reclassified Dengue into two groups in 2009, uncompli-
cated and severe.7 Severe Dengue is defined as infection associated with bleeding, severe organ dysfunction or severe plasma leakage while all other cases are uncom-plicated.-------------------------------------------------------------------------------------------Gastrointestinal are presenting and most common symptoms in patients who are admitted with Dengue fever. It might be the first or single presentation of Dengue fever. If overlooked or delayed, misdiagno-sis is possible. It is wise to include Dengue in differ-ential diagnosis in any patients, in the tropical area, if it presets with gastrointestinal disorder.------------------------------------------------------------------------------------------- Dengue classification schemes support a range of activities from clinical triage and treatment to epi-demiologic, vaccine and drug studies. Each guideline has been evaluated by a number of groups and the 2009 classification has superseded the 1997 classification for all aspects of Dengue virus infection.8-12 The WHO is-sued additional documents on Dengue management in 2011 and 2012.13-14 Dengue fever can present with a wide range of clinical presentation ranging from asymptom-atic infection to severe disease .The acute phase of the disease (4 to 7 days) usually begins with a fever and can be indistinguishable in the initial stages from acute fe-brile illnesses from other infectious diseases.15 Reports suggest that Dengue can cause fatality with multiorgan dysfunction. In the areas where more than one serotype
------------------------------------------------------------------------------------------1.Assistant Professor of Medicine. Khyber Teaching Hospital, Peshawar.2. Assistant Professor Medicine, Kohat Institute of Medical Sciences, Kohat,3. Assistant Professor, Lady Reading Hospital, Peshawar. House Officer,, MTI/Lady Reading Hospital, Peshawar4.5. Trainee Medical Officers, Medical D Unit, Khyber Teaching Hospital, Peshawar-------------------------------------------------------------------------------------------Correspondence. Dr. Fahad Naim, AP, General Medicine, KIMS ,KMU, Peshawar.E.Mail., [email protected] Cell: 03101991400 Dr. Awais naeem. Assistant Professor Medicine, Khyber Teaching Hospital, Peshawar, KPK [email protected]+923239713171Post Address: Naeem Dental Clinic, Mohallah Darwaish, Sayein Saheli Road, Haripur, KPK -------------------------------------------------------------------------------------------Received. June’2018 Accepted: Sep’2018-------------------------------------------------------------------------------------------
ORIGINAL ARTICLE
Awais Naeem
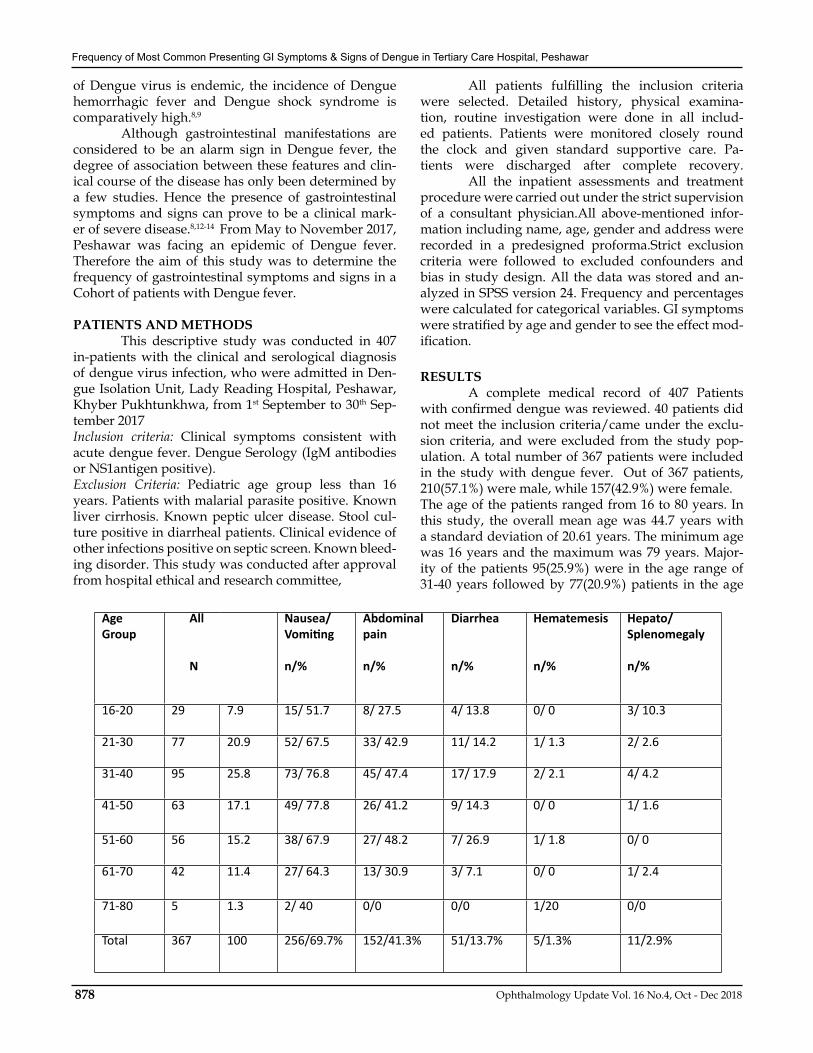
Ophthalmology Update Vol. 16 No.4, Oct - Dec 2018878
Frequency of Most Common Presenting GI Symptoms & Signs of Dengue in Tertiary Care Hospital, Peshawar
of Dengue virus is endemic, the incidence of Dengue hemorrhagic fever and Dengue shock syndrome is comparatively high.8,9
Although gastrointestinal manifestations are considered to be an alarm sign in Dengue fever, the degree of association between these features and clin-ical course of the disease has only been determined by a few studies. Hence the presence of gastrointestinal symptoms and signs can prove to be a clinical mark-er of severe disease.8,12-14 From May to November 2017, Peshawar was facing an epidemic of Dengue fever. Therefore the aim of this study was to determine the frequency of gastrointestinal symptoms and signs in a Cohort of patients with Dengue fever.
PATIENTS AND METHODS This descriptive study was conducted in 407 in-patients with the clinical and serological diagnosis of dengue virus infection, who were admitted in Den-gue Isolation Unit, Lady Reading Hospital, Peshawar, Khyber Pukhtunkhwa, from 1st September to 30th Sep-tember 2017Inclusion criteria: Clinical symptoms consistent with acute dengue fever. Dengue Serology (IgM antibodies or NS1antigen positive).Exclusion Criteria: Pediatric age group less than 16 years. Patients with malarial parasite positive. Known liver cirrhosis. Known peptic ulcer disease. Stool cul-ture positive in diarrheal patients. Clinical evidence of other infections positive on septic screen. Known bleed-ing disorder. This study was conducted after approval from hospital ethical and research committee,
All patients fulfilling the inclusion criteria were selected. Detailed history, physical examina-tion, routine investigation were done in all includ-ed patients. Patients were monitored closely round the clock and given standard supportive care. Pa-tients were discharged after complete recovery. All the inpatient assessments and treatment procedure were carried out under the strict supervision of a consultant physician.All above-mentioned infor-mation including name, age, gender and address were recorded in a predesigned proforma.Strict exclusion criteria were followed to excluded confounders and bias in study design. All the data was stored and an-alyzed in SPSS version 24. Frequency and percentages were calculated for categorical variables. GI symptoms were stratified by age and gender to see the effect mod-ification.
RESULTS A complete medical record of 407 Patients with confirmed dengue was reviewed. 40 patients did not meet the inclusion criteria/came under the exclu-sion criteria, and were excluded from the study pop-ulation. A total number of 367 patients were included in the study with dengue fever. Out of 367 patients, 210(57.1%) were male, while 157(42.9%) were female. The age of the patients ranged from 16 to 80 years. In this study, the overall mean age was 44.7 years with a standard deviation of 20.61 years. The minimum age was 16 years and the maximum was 79 years. Major-ity of the patients 95(25.9%) were in the age range of 31-40 years followed by 77(20.9%) patients in the age
Age Group
All
N
Nausea/Vomiting
n/%
Abdominalpain
n/%
Diarrhea
n/%
Hematemesis
n/%
Hepato/Splenomegaly
n/%
16-20 29 7.9 15/ 51.7 8/ 27.5 4/ 13.8 0/ 0 3/ 10.3
21-30 77 20.9 52/ 67.5 33/ 42.9 11/ 14.2 1/ 1.3 2/ 2.6
31-40 95 25.8 73/ 76.8 45/ 47.4 17/ 17.9 2/ 2.1 4/ 4.2
41-50 63 17.1 49/ 77.8 26/ 41.2 9/ 14.3 0/ 0 1/ 1.6
51-60 56 15.2 38/ 67.9 27/ 48.2 7/ 26.9 1/ 1.8 0/ 0
61-70 42 11.4 27/ 64.3 13/ 30.9 3/ 7.1 0/ 0 1/ 2.4
71-80 5 1.3 2/ 40 0/0 0/0 1/20 0/0
Total 367 100 256/69.7% 152/41.3% 51/13.7% 5/1.3% 11/2.9%

Ophthalmology Update Vol. 16 No.4, Oct - Dec 2018 879
Frequency of Most Common Presenting GI Symptoms & Signs of Dengue in Tertiary Care Hospital, Peshawar
group between 21-30. 63(17.1%) of the patients were between 41-50 years age, 56(15.2%) were in age group 51-60 years, 42(11.4%) were between the age group 61-70 years, 29(7.9%) between age group 16-20 and 5(1.3%) were between 71-80 years age group. The frequency of symptoms in the analyzed cohort showed that nausea/vomiting ranked first, reg-istering 256 (69.7%) of the patients studied. Incidence was highest among the age group 41-50 at 77.8%.Ab-dominal pain was the other important manifestation with 152(41.3%) patients complaining of this symptom. The incidence of abdominal pain was highest in the age group 51-60 at 48.2%. The frequency of other gastrointestinal manifestations was diarrhea 51(13.7%), hepatomegaly or splenomegaly 11(2.9%) and hematemesis 5(1.3%).
DISCUSSION: These results showed a high frequency of gas-trointestinal symptoms that range between 70 to 80% of patients suffering from Dengue virus infection which was consistent with studies done in other parts of the world.16 Nausea and vomiting were the most common gastrointestinal complaints in our study with an inci-dence of 69.7% affecting all age groups. These findings are consistent with the results showed by Fiestas et al in 2011, which reported the incidence of nausea/vomiting at 70.7%.17 Research suggests that one of the most com-mon causes of vomiting are multiple petechial hemor-rhages that occur at the level of the gastrointestinal mu-cosa, which triggers its irritation leading the patients to experience this symptom. Another frequent gastrointestinal symptom was abdominal pain, which was present in 41.3% of patients studied and represented the second most frequent complaint. Abdominal pain was found in other researches to be a significant cause of morbidi-ty, who reported a percentage ranging between 13 to75.6%.16,17The various mechanisms of abdominal pain were hypothesized by Khanna et al. to be hepatitis, pancreatitis, cholecystitis (acalculous) and acid peptic disease in patients suffering from Dengue fever.18 The other explanations for the abdominal pain includes stretching of the liver capsule, stimulation of the nerve plexus by distension of the retroperitoneal space due to edema or decreased mesenteric perfusion or pain of biliary or pancreatic origin. plasma leakage induced as-cites can sometimes manifest as abdominal pain which can be confused with acute abdomen. It has also been proposed that small hemorrhages in the peritoneal cav-ity could bepotential cause of the pain.17-18
This study ranked diarrhea as the third most common gastrointestinal complaint that was present in 13.7% of the patients, which was lower than found in other studies where the frequency of diarrhea ranged from 24% to 32%.19
Hematemesis and hepatomegaly occurred in 1.3% and 2.9% of patients respectively thatwas recorded similar to those reported in other studies.19 Regarding hepato-megaly, various possible explanations have been pro-posed for the emergence ofthis sign in patients with Dengue such as necrosis of hepatocytes and Kupffer cells and formation of Councilman bodies. Some cases detected physical displacement of the liver due to the accumulation of extravasated fluids by increased cap-illary permeability which is associated with the most severe presentation of Dengue fever. In some countries, the presence of hepatomegaly varies from one epidem-ic to another, suggesting that the strain and/or sero-type may influence hepatic involvement.20
CONCLUSION:We conclude that gastrointestinal symptoms are very common in patients who are admitted with Dengue fe-ver. Presence of gastrointestinal symptoms at the pre-sentation can be used to triage the patient as high risk, requiring inpatient care. For the general practitioner, it should be noted that gastrointestinal presentation might be the first and single presentation of Dengue fever. It is overlooked and delayed or misdiagnosis is possible. Since up to two-third of the patients might have gastrointestinal disorder, it is wise to include Den-gue as a differential diagnosis in any patients, in the tropical area, presenting with gastrointestinal disorder.
REFERENCES
1. Simmons CP, Farrar JJ, Nguyen vV, Wills B. Dengue. N Engl J Med 2012; 366:1423
2. Guzman MG, Harris E. Dengue. Lancet 2015; 385:453.3. Kularatne SA. Dengue fever. BMJ 2015; 351:h4661.4. World Health Organization. Dengue: Guidelines for diagnosis,
treatment, prevention and control, New edition. WHO: Geneva 2009. http://www.who.int/tdr/publications/documents/dengue-diagnosis.pdf?ua=1 (Accessed on December 07, 2016).
5. An evaluation of the World Health Organization’s 1997 and 2009 dengue classifications in hospitalized dengue patients in Malaysia.Zakaria Z, Zainordin NA, Sim BL, Zaid M, HaridanUS, Aziz AT, Shueb RH, Mustafa M, Yusoff NK, Malik AS, Lee CK, Abubakar S, Hoh BP J Infect DevCtries. 2014 Jul;8(7):869-75.
6. Comparing the usefulness of the 1997 and 2009 WHO dengue case classification: a systematic literature review.Horstick O, Jaenisch T, Martinez E, Kroeger A, See LL, Farrar J, Ranzinger SR Am J Trop Med Hyg. 2014 Sep;91(3):621-34.
7. Comparative performance of the probable case definitions of dengue by WHO (2009) and the WHO-SEAR expert group (2011).Nujum ZT, Thomas A, Vijayakumar K, Nair RR, Pillai MR, Indu PS, Sundar S, Gopakumar S, Mohan D, Sudheeshkumar TK Pathog Glob Health. 2014 Mar;108(2):103-10.
8. mplications of discordance in world health organization 1997 and 2009 dengue classifications in adult dengue.Gan VC, Lye DC, Thein TL, Dimatatac F, Tan AS, Leo YS PLoS One. 2013;8(4):e60946. Epub 2013 Apr 1
9. Dengue in travellers: applicability of the 1975-1997 and the 2009 WHO classification system of dengue fever.Wieten RW, Vlietstra W, Goorhuis A, van Vugt M, Hodiamont CJ, Leenstra T, de Vries PJ, Janssen S, van Thiel PP, Stijnis K, Grobusch MP Trop Med Int Health. 2012 Aug;17(8):1023-30.

Ophthalmology Update Vol. 16 No.4, Oct - Dec 2018880
Frequency of Most Common Presenting GI Symptoms & Signs of Dengue in Tertiary Care Hospital, Peshawar
10. World Health Organization Regional Office for Southeast Asia. Comprehensive guidelines for prevention and control of dengue and dengue haemorrhagicfever.Revised and expanded version.SEARO Technical Publication Series, New Delhi, India 2011.
11. World Health Organization. Handbook for clinical management of dengue.WHO, Geneva 2012. http://www.wpro.who.int/mvp/documents/handbook_for_clinical_management_of_dengue.pdf (Accessed on September 13, 2016).
12. Ramos A, Remes-Troche J, González-Medyne M, Anitúa-Valdovinos M, Cerón T, C Zamudio,A. Diaz-Vega abdominal and gastrointestinal dengue symptoms. Analysis of a cohort of 8,559 patients.GastroenterolHepatol 2011; 34 (4): 243-247.
13. Clinical characteristics of patients hospitalized at the support hospital of Iquitos “César GarayarGarcía” during the dengue epidemic, January-March, February 2011. Rev Peru Med Exp Public Health 2011; 28 (1): 78-82
14. Khanna S, Vij J, Kumar A, D Singal,R. Tandon Etiology of abdominal pain in dengue fever. Dengue Bull 2005; 29: 85-89.
15. SirivichayakulC, Limkittikul K, Chanthavanich P, Jiwariyavej V, Chokejindachai W, Pengsaa K, Suvannadabba S, Dulyachai W, W Letson, A. Sabchareon Dengue Infection in Children in Ratchaburi, Thailand: ACohort Study. II. Clinical Manifestations.
PLoSnegl Trop Dis2012; 6 (2): E1520. [Doi: 10. 1371 / journal.pntd.0001520].
16. Khanna S, Vij J, Kumar A, D Singal,R. Tandon Etiology of abdominal pain in dengue fever. Dengue Bull 2005; 29: 85-89.
17. SirivichayakulC, Limkittikul K, Chanthavanich P, Jiwariyavej V, Chokejindachai W, Pengsaa K, Suvannadabba S, Dulyachai W, W Letson, A. Sabchareon Dengue Infection in Children in Ratchaburi, Thailand: ACohort Study. II. Clinical Manifestations. PLoSnegl Trop Dis2012; 6 (2): E1520. [Doi: 10. 1371 / journal.pntd.0001520].
18. Eram S, Setyabudi Y, Sadono T I, Sutrisno D S, Gubler D J, Sulianti-Saroso J. Epidemic dengue hemorrhagic fever in rural Indonesia: clinical studies. Am J Trop Med Hyg. 1979; 28:711–716. [PubMed]
19. 19.Anonymous. Dengue hemorrhagic fever, diagnosis, treatment and control. Geneva, Switzerland: World Health Organization; 1986.
20. World health organization South East Asia Regional Office, Neglected Tropical diseases, Dengue.
21. http://www.searo.who.int/entity/vector_borne_tropical_diseases/data/data_factsheet/en/index2.html
Important Notice for Readers
List of Representatives of Ophthalmology Update. Readers of the respective areas can have their copy of the journal from Schazoo Pharmaceutical Laboratories (Pvt)Ltd Office:
Sr. Name Areas Contact No.1 M.A.Shah Swat 030255516452 Amir Zaib Peshawar 030255516593 Waqas Majeed Rawalpindi 030255518174 M. Akram Ghauri Gujrat , Gujranwala ,Sialkot 030255519185 M. Nasir Lahore 030255519856 M. Waseem Ijaz LHR DIV (Shekhiupra+Kasur+Sahiwal+Okara) 03008494327
7 M. Saleem Faislabad 030255520318 Sajjid Abbas Sargodha 030255520269 Maqsood Ahmed Jhang 03025552035
10 M. Usman Bhutta Multan 0302555204211 M. Imran Bahawalpur 0302555205412 Agha Sagheer Ahmad Sukkur 0303777015213 Sajid Ali Shah Quetta 303777173814 Khalid Mehmood Karachi 0303777067015 Abdul Farhan Karachi 3037770674

Ophthalmology Update Vol. 16 No.4, Oct - Dec 2018 881
Prevalence of Depression in Epilepsy
Prevalence of Depression in Epilepsy
ABSTRACT Objective: The objective of the present study was to determine the prevalence of depression among epileptic patients at tertiary care hospital at Bahawalpur.Material and Methods: This was a cross sectional study involving epileptic patients aged 18 years and above who were attending the psychiatry and medical outdoor of the Bahawal Victoria Hospital. Demographic data including age, gender, education, marital status and seizure type was obtained. For assessment of depression we used Hamilton Rating Scale for depression. The data was entered in SPSS version 16 and analyzed. Mild, moderate, sever and very severe types of depression were assessed in the form of frequencies. Results :Depression was diagnosed in 28% of the patients. Out of them 9 were females and 19 were males. In females depression was diagnosed in 25% of the patients and in males depression diagnosed in 29.68% of the patients of epilepsy. Depression was more common in age group of 18-35 years of age. There was no association found in epilepsy and depression.Conclusion: Depression is common in epileptic patients. If undiagnosed, it could significantly affect the quality of life of these patients. As effective treatment is available, there is need for clinicians treating epilepsy patients to routinely screen for depression.Key words: epilepsy, depression, SPSS, frequencies, analysis
Saeed Akhtar FCPS (Psy) ,1 Ahmed Nawaz MBBS2 , Hajira Khan MBBS3
Saeed Akhtar
INTRODUCTION: Epilepsy is amongst the most common seri-ous neurological conditions. The global prevalence of epilepsy is generally taken as between 5 and 10 cases per 1000 persons.2,3 Studies have shown various differences in epidemiological patterns of epilepsy around the world. I
Few epidemiological studies of epilepsy are available from Pakistan.3,10. This subject has not been thoroughly investigated. The recent estimates of population of Pa-kistan exceed 140 million, whereas the total number of trained neurologists in Pakistan is estimated to be less than 30 (verbal communication at the annual meeting of Pakistan International Neuroscience Society (PINS) 2001. There are approximately 350 neurologists of Paki-stani origin in North America (Data collected by PINS from various directories of neurologists 2001). Based on the available data, it is estimated that 1.38 million
people are suffering from epilepsy in Pakistan, which makes it one neurologist available for every 46200 suf-ferers of epilepsy Almost 30-50% of epileptic patients have clin-ical depression as well.1,2 Incidence of suicide and de-liberate self-harm is believed to be at least five times higher in epileptic patients than in general population. Patients with temporal lobe epilepsy are even more vulnerable to commit suicide.3 Also in children it has shown to be strongly associated with suicidal behavior.4Depression has also been found to be the most import-ant factor associated with reduced quality of life (QOL) in epilepsy rather than epilepsy itself.5
-------------------------------------------------------------------------------------------Depression is common in epileptic patients. If un-diagnosed, it could significantly affect the quality of life. Since effective treatment is available, there is need for clinicians for treating epileptic patients to routinely screen for depression.------------------------------------------------------------------------------------------- Unfortunately depression remain unrecog-nized and untreated in large number of epileptic pa-tients and usually not given attention in the overall management of epilepsy.6
Few studies have been carried out to know the prevalence of epilepsy in Pakistan.7Depression is one of the most prevalent psychiatric disorders occurring
ORIGINAL ARTICLE
-------------------------------------------------------------------------------------------1.Associate professor Department of Psychiatry Quaid-e-Azam Medical College, Bahawalpur, 2Former House Officer, Aziz Bhatti Shaheed Teaching Hospital Gujrat 3. House Officer Teaching Hospital, Sahiwal Medical College Sahwal.-------------------------------------------------------------------------------------------Correspondence: Dr. Saeed Akhtar FCPS (Psy),Assistant Professor Department of Ppsychiatry Quaid-e-Azam Medical College, Bahawalpur Email: [email protected] 03355592817-------------------------------------------------------------------------------------------Received: June’2018 Accepted August’2018-------------------------------------------------------------------------------------------
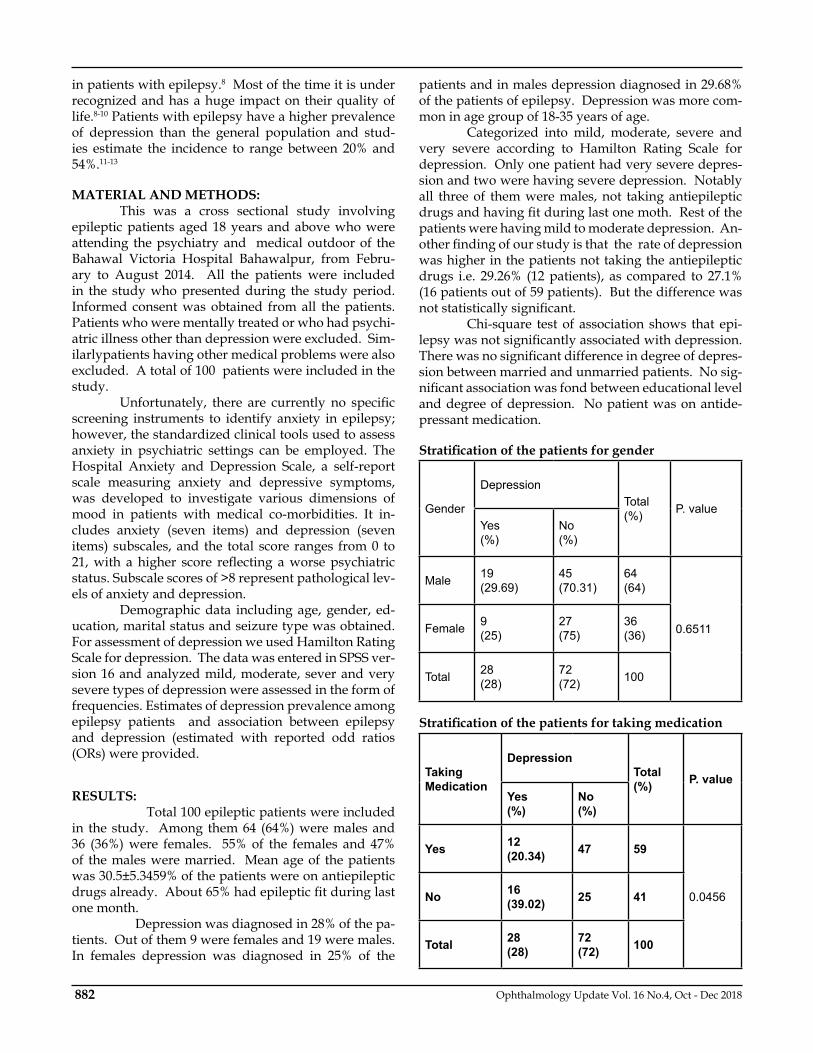
Ophthalmology Update Vol. 16 No.4, Oct - Dec 2018882
in patients with epilepsy.8 Most of the time it is under recognized and has a huge impact on their quality of life.8-10 Patients with epilepsy have a higher prevalence of depression than the general population and stud-ies estimate the incidence to range between 20% and 54%.11-13
MATERIAL AND METHODS: This was a cross sectional study involving epileptic patients aged 18 years and above who were attending the psychiatry and medical outdoor of the Bahawal Victoria Hospital Bahawalpur, from Febru-ary to August 2014. All the patients were included in the study who presented during the study period. Informed consent was obtained from all the patients. Patients who were mentally treated or who had psychi-atric illness other than depression were excluded. Sim-ilarlypatients having other medical problems were also excluded. A total of 100 patients were included in the study. Unfortunately, there are currently no specific screening instruments to identify anxiety in epilepsy; however, the standardized clinical tools used to assess anxiety in psychiatric settings can be employed. The Hospital Anxiety and Depression Scale, a self-report scale measuring anxiety and depressive symptoms, was developed to investigate various dimensions of mood in patients with medical co-morbidities. It in-cludes anxiety (seven items) and depression (seven items) subscales, and the total score ranges from 0 to 21, with a higher score reflecting a worse psychiatric status. Subscale scores of >8 represent pathological lev-els of anxiety and depression. Demographic data including age, gender, ed-ucation, marital status and seizure type was obtained. For assessment of depression we used Hamilton Rating Scale for depression. The data was entered in SPSS ver-sion 16 and analyzed mild, moderate, sever and very severe types of depression were assessed in the form of frequencies. Estimates of depression prevalence among epilepsy patients and association between epilepsy and depression (estimated with reported odd ratios (ORs) were provided.
RESULTS: Total 100 epileptic patients were included in the study. Among them 64 (64%) were males and 36 (36%) were females. 55% of the females and 47% of the males were married. Mean age of the patients was 30.5±5.3459% of the patients were on antiepileptic drugs already. About 65% had epileptic fit during last one month. Depression was diagnosed in 28% of the pa-tients. Out of them 9 were females and 19 were males. In females depression was diagnosed in 25% of the
patients and in males depression diagnosed in 29.68% of the patients of epilepsy. Depression was more com-mon in age group of 18-35 years of age. Categorized into mild, moderate, severe and very severe according to Hamilton Rating Scale for depression. Only one patient had very severe depres-sion and two were having severe depression. Notably all three of them were males, not taking antiepileptic drugs and having fit during last one moth. Rest of the patients were having mild to moderate depression. An-other finding of our study is that the rate of depression was higher in the patients not taking the antiepileptic drugs i.e. 29.26% (12 patients), as compared to 27.1% (16 patients out of 59 patients). But the difference was not statistically significant. Chi-square test of association shows that epi-lepsy was not significantly associated with depression. There was no significant difference in degree of depres-sion between married and unmarried patients. No sig-nificant association was fond between educational level and degree of depression. No patient was on antide-pressant medication.
Stratification of the patients for gender
Gender
DepressionTotal(%) P. value
Yes(%)
No(%)
Male 19(29.69)
45(70.31)
64(64)
0.6511Female 9(25)
27(75)
36(36)
Total 28(28)
72(72) 100
Stratification of the patients for taking medication
Taking Medication
DepressionTotal(%) P. value
Yes(%)
No(%)
Yes 12(20.34) 47 59
0.0456No 16(39.02) 25 41
Total 28(28)
72(72) 100

Ophthalmology Update Vol. 16 No.4, Oct - Dec 2018 883
Prevalence of Depression in Epilepsy
Stratification of the patients for Age
Age(Years)
DepressionTotal(%) P. value
Yes(%)
No(%)
18-35 35(66.04)
18(33.96)
53(53)
0.003
36-50 5(25)
15(75)
20(20)
51-65 11(40.74)
16(59.26)
27(27)
Total 28(28)
72(72) 100
Grade of depression
Mild to Moderate 25Severe 2Very Severe 1
DISCUSSION: This study found the frequency of depression among epilepsy patients to be 28% that is close to pre-vious studies. Despite its relatively high prevalence, no patient was on anti depressant medication. The reason of this phenomenon is that the patients in our society do not think that they need to report their symptoms of depression and clinician do not see a need to inquire about depression or to treat it, in epileptic patients. De-pression was more common in age group 18 to 35 years, accounting for 12 (42.8%) out of the total 28 patients de-pression. This is similar to a study from Nigeria14 the reason may be that this age group is searching for jobs and marriage partner. They may be having more social difficulties in this struggle due to epilepsy. Another finding of our study is that rate of de-pression was higher in the patient not taking the anti epileptic drugs although difference was not statistically significant. Our hypothesis is that antiepileptic drugs like sodium valproate and carbamazepine for example are also mood stabilizers and this difference is due to this effect. A study was done by Knoun.Y in US according to that many recent epidemiological studies have found the prevalence of depression and anxiety to be higher in people with epilepsy (PWE) than in people without epilepsy. Furthermore, people with depression or anx-iety have been more likely to suffer from epilepsy than those without depression or anxiety. Almost one-third of PWE suffer from depression and anxiety, which is
similar to the prevalence of drug-refractory epilepsy. A study was conducted in Pakistan by Khatri.A according that overall prevalence of epilepsy in Paki-stan is estimated to be 9.99 per 1000 population. High-est prevalence is seen in people younger than 30 years of age. A slight decrease in prevalence is noted between the ages of 40 and 59. Higher prevalence is observed in rural population. Etiology of epilepsy is more common-ly identified in pediatric population. Epilepsy was con-sidered idiopathic in 21 to 76% cases. Only 27.5% epi-leptic persons in urban areas and 1.9% in the rural areas were treated with AEDs. The burden of epilepsy is not fully evaluated and understood. Generalized seizures were the most common seizure type noted. Knowledge about epilepsy and its care is extremely low.[16]
Similarly another study was conducted in Pa-kistan by Aziz.H according to that Mean onset of epi-lepsy was 13·3 years, and 74·3% epileptic persons were aged <19 years at onset of the disorder. The most com-mon seizure type was tonic clonic in 77% (primary gen-eralized tonic-clonic (GTC) in 59% and secondarily gen-eralized in 18%), simple partial (SPS) in 5%, complex partial (CPS) in 6%, generalized absence in l%, tonic in 3%, and myoclonic in 3% cases. Multiple seizure types in the same person were evident in 9·6% of only the generalized group. A putative cause could be suggest-ed in 38·4% of cases: 32% had a positive family history of epilepsy, most common among siblings. Common perceived precipitants included fever in 29·2% and emotional disturbances in 16·6%. Only 3% of epileptic persons believed that their illness was due to supernat-ural causes. Treatment status was very poor, with only 2% rural and 27% urban epileptic persons receiving antiepileptic drugs (AEDs) at the time of the survey. We discuss the logistic and management problems of population-based epidemiologic studies in developing countries.[17]
In epilepsy patients, factors related to seizures, such as the type of seizure, frequency of seizures, age of onset, the duration of illness, whether the illness is controlled or not, the number of medications used, ad-ditional neurological deficits and psychosocial factors may be related to the development of psychopatholo-gy.15-17 we could not study these factors in relation to development of depression in epileptic patients. This study has shown that many of epileptic patients can have depression also Which is a treatable condition which patients a new life.
CONCLUSION: Depression is common in epileptic patients. If undiagnosed, itcould significantly affect the quality of life of these patients. As effective treatment is available, there is need for clinicians treating epilepsy patients to routinely screen for depression.

Ophthalmology Update Vol. 16 No.4, Oct - Dec 2018884
REFERENCES:1. Barrowclough B. Suicide and epilepsy. In: Reynolds FH, Trimble
MR. Editors. Epilepsy and psychiatry. Edinburgh:Churchill-Livingstone 1981:p72–6.
2. Kanner AM, Nieto JC. Depressive disorder in epilepsy. Neurology 1999;53:S26–32.
3. Goldstein LH. Effectiveness of psychological interventions for people with poorly controlled epilepsy. J NeurolNeurosurg Psychiatry 1997;63:137–42.
4. Blumer D. Postictal depression: significance for the neurobehavioral disorder of epilepsy. J Epilepsy 1992;5:214–9.
5. L.S Boylan, Flint, Labovitz, Jackson. Depression but not seizure frequency predicts quality of life in treatment resistant epilepsy. Neurology 2004;62:258–61.
6. Aziz H, Guvener A, Akhtar SW, Hasan KZ. Comparative epidemiology of epilepsy in Pakistan and Turkey population based studies using identical protocols. Epilepsia 1997;38(6):716–22.
7. Aziz H, Akhtar SW, Hasan KZ. Depression and epilepsy: how closely related are they? Neurology 2002;58:S27–39.
8. Seminario NA, Farias ST, Jorgensen J, Bourgeois JA, Seyal M. Determination of prevalence of depression in an epilepsy clinic using DSM-IV based self- report questionnaire. Epilepsy Behav 2009;15:362-6.
9. Kanner AM. Depression in epilepsy: A review of multiple facets of their close relation. NeurolClin 2009;27:865-80.
10. Adewuya AO, Oseni SB. Impact of psychiatric morbidity on parent rated quality of life in Nigerian adolescents with epilepsy. Epilepsy Behav 2005;7:497-501.
11. Kanner AM, Palac S. Depression in epilepsy: A common but often
unrecognized co-morbid malady. Epilepsy Behav 2000;1:37-51. 12. Okubadejo NU, Danesi MA, Aina OF, Ojini FI, Adeyemi JD,
Olorunshola DA. Prospective case – control study of interictal depression and suicidal ideation in Nigerians with epilepsy. Niger Postgrad Med J 2007;14:204-8.
13. Boylan LS, Flint LA, Labovitz DL, Jackson SC, Starner K, Devinsky O. Depression but not epilepsy predicts quality of life in treatment resistant epilepsy. Neurology 2004;62:258-61.
14. Onwuekwe I, Ekenze O, Bzeala-Adikaibe, Ejekwu J. Depression in Patients with Epilepsy: A Study from Enugu, South East Nigeria. Ann Med Health Sci Res. 2012;2(1):10–3.
15. Ayhan B, Savaş Y, Serap T, Gülhis D, Emine ZK. Depression and anxiety symptom severity in a group of children with epilepsy and related factors. Turk J Psych 2006;17:165-72.
16. Davies S, Heyman I, Goodman R. A Population survey of mental health problems in children with epilepsy. Dev Med Child Neurol 2003;45:292-5.
17. Mensah SA, Beavis JM, Thapar AK, Kerr M. The presence and clinical implications of depression in a community population of adults with epilepsy. Epilepsy Behav 2006;8:213-9.
18. Kwon OY, Park SP. Frequency of affective symptoms and their psychosocial impact in Korean people with epilepsy: a survey at two tertiary care hospitals. Epilepsy Behav. 2013;26:51–56.
19. Manchanda R, Schaefer B, McLachlan RS, Blume WT, Wiebe S, Girvin JP, et al. Psychiatric disorders in candidates for surgery for epilepsy. J Neurol Neurosurg Psychiatry. 1996;61:82–89.
20. Kobau R, Gilliam F, Thurman DJ. Prevalence of self-reported epilepsy or seizure disorder and its associations with self-reported depression and anxiety: results from the 2004 HealthStyles Survey. Epilepsia. 2006;47:1915–1921.
Prevalence of Depression in Epilepsy
**************************************Unpigmented Ocular Melanoma An un unusual number of ocular melanoma with visible blood vessels, a rare cancer of the eyes. Columbia University, is doing genetic testing of tissue samples to the fact why unpigmented Iris melanoma be occurring more than normal. Certain factors do increase the risk for ocular melanoma. Older age, light-colored (blue or green) iris, caucasian heritage, inherited skin conditions like dysplastic nevus syndrome, abnormal skin pigmentation involving the eyelids and increased pigmentation on the uvea and moles in the eye. Exposure to natural sunlight or artificial sunlight over long periods of time may also cause a melanoma on the surface of the eye (conjunctival melanoma).Curtesy: Nejm UK
Ophthalmology Update Vol. 16 No.4, Oct - Dec 2018 885
Knowledge, Attitudes and Practice Regarding the Oral Health
ABSTRACT: Objective: To assess the knowledge, attitude and practice regarding the oral health in our community. It was a cross sectional study from January 2018 to June 2018, in Nishtar Institute of dentistry MultanMaterial and methods: A total number of 378 patients were enrolled in this study. A questionnaire was developed to gather the information required for the determination of knowledge, attitudes and behavior of the patient towards oral health. The questionnaire comprised of thirty three questions regarding different aspects of oral health care. It involved questions regarding demographic information, knowledge, attitudes and behavior of the patients.Results: Regarding oral care, n=213 (56.3%) used tooth paste, n=260 (68.8%) patients brush once a day, n=178 (47.1%) used vertical technique for brushing. n=138 (36.5%) changed their brush every six months while n=60 (15.9%) changed their brush after one year. n=189 (50%) patients brush their teeth in morning, n=166 (43.9%) brush their teeth for cleaning purpose. n=144 (38.1%) visited to dentist when they felt pain. n=170 (45%) ignore, n=98 (25.9%) go to the dentist and n=110 (29.1%) use home remedies when they felt dental decay. n=239 (63.2%) patients’ family members brush their teeth regularly. Self-medication was observed as n=269 (71.2%).Conclusion: Although majority of the patients had good knowledge about health care but it was not associated with better attitudes, behavior and practicing of healthy habits. It can be suggested that poor socioeconomic conditions of majority of the public and lack of motivation for oral hygiene are the cause of poor behavior, attitude and practicing of dental care.Keywords:Knowledge, Attitudes, Behavior, Oral Health
M. Zain-ul-Abideen BDS 1, Bakhtawar Tahir BDS2, Fouzia Hussain BDS3
Nishtar Institute of Dentistry, Multan
Knowledge, Attitudes and Practice Regarding the Oral HealthZain-ul-
Abideen
INTRODUCTION: In recent years a considerable reduction in in-cidence and severity of oral diseases has been observed especially in developed countries1. A systemic and organized dental care has been employed to improve the oral health in children and young adults2, 3. As a re-sult of this systemically organized way of oral health care there has been significant decline in the frequen-cy of dental caries in patients4. Another advantage of this mode of health care is that, an increased number of adults are now able to keep their original denture for later stages of the life (5). But it has only improved overall dental health in developed countries unlike in developing countries where dental care is still one of the major health problems6. The reasons behind the improvement in overall dental health in developed and industrialized countries
are the life style modifications, improved self care prac-tices, changing living conditions and establishment of dental care programs. Moreover overall attitudes and behavior of general public have also grown7. On the contrary in developing countries incidence of dental caries has increased gradually8. It can be attributed to the fact that no dental or oral health care programs are performed in these communities. -------------------------------------------------------------------------------------------Poor socioeconomic conditions of majority of the public and lack of motivation for oral hygiene are the causes of poor behavior, attitude and practicing of dental care.------------------------------------------------------------------------------------------- Not many studies are there which could pro-vide sufficient data regarding the knowledge, attitudes and behavior of the general population towards oral health care especially in developing countries like Pa-kistan. Therefore there is dire need to perform a study which can show the general trends of human popula-tion in our community towards oral hygiene.
MATERIAL AND METHOD: A total number of 378 patients were enrolled
-------------------------------------------------------------------------------------------1.2.3. House Officers.-------------------------------------------------------------------------------------------Corresponding Author: Dr Muhammad Zain-ul-abideen, House Officer Nishtar Institute of Dentistry, Multan,Email: [email protected] No. 0316 8435789-------------------------------------------------------------------------------------------Received: June’2018 Accepted: August’2018-------------------------------------------------------------------------------------------
ORIGINAL ARTICLE

Ophthalmology Update Vol. 16 No.4, Oct - Dec 2018886
Knowledge, Attitudes and Practice Regarding the Oral Health
in this study. The study was performed in Nishtar In-stitute of Dentistry Multan from January 2018 to June 2018. All the patients aged 10 to 70 presenting to the out-patient department with the complaint of tooth ache were included in this study. Approval for the study was obtained from the Hospital Ethics Com-mittee. Sample size was calculated from the reference study by Muhammad K. Al-Omiri et al 10. Non prob-ability consecutive type of sampling technique was used to collect the sample size. A questionnaire was developed to gather the information required for the determination of knowledge, attitudes and behavior of the patient towards oral health. The questionnaire com-prised of thirty three questions regarding different as-pects of oral health care. It involved questions regard-ing demographic information, knowledge, attitudes and behavior of the patients. Demographic information included age, gen-der, education status, occupations, socio-economic status, type of family and religion. For knowledge re-garding dental pain, causes of the rapid dental decay, source of oral health knowledge and frequency of visit to dentist were asked. Similarly for attitude regarding dental pain treatment questions regarding, duration of pain, relieving factor, aggravating factor, type of pain, intensity, associated symptoms, time when pain start-ed, time period between 1st and 2nd incidence of pain. Practicing of oral care was judged by asking question about methods and frequency of cleaning teeth, tech-nique of brushing, change of brush, time of brushing, reason to brush the teeth, reason for last dental visit, approach if there is dental decay, brushing habits of family members, home remedies and medications. All the data thus calculated was subjected to statistical analysis. Computer software SPSS version 23 was used to analyze the data. Frequency and percentage was cal-culated for quantitative variables while mean and stan-dard deviation was calculated for qualitative variables.
RESULTS: 378 were included in this study, both gen-ders, revealed as n=257 (68%) males and n=121 (32%) females. The mean age of the patients was 26.14±3.15 years. There were n=196 (51.9%) patients literate and n=182 (48.1%) were illiterate. Occupations distribu-tion observed as n=47 (12.4%) employee, n=61 (16.1%) worker, n=121 (32%) student, and n=149 (39.4%) house wives. Socio-economic status noted as n=92 (24.3%) up-per class, n=125 (33.1%) middle class and n=161 (42.6%) lower class. n=250 (66.1%) were living in joint family and n=128 (33.9%) were nuclear family. Knowledge regarding dental pain was assessed from the patients from different questions. It was seen that majority of the patients were unfamiliar about the knowledge regarding dental pain table II. Attitude to-wards dental pain treatment of the patients were shown in table III. It was observed that majority of the patients did not take proper remedy for dental pain.
Regarding to oral care, n=213 (56.3%) used tooth paste, n=260 (68.8%) patients brush once a day, n=178 (47.1%) used vertical technique for brushing. n=138 (36.5%) changed their brush every six months while n=60 (15.9%) changed their brush after one year. n=189 (50%) patients brush their teeth in morning, n=166 (43.9%) brush their teeth for cleaning purpose. n=144 (38.1%) visited to dentist when they felt pain. n=170 (45%) ignore, n=98 (25.9%) go to the dentist and n=110 (29.1%) use home remedies when they felt dental decay. n=239 (63.2%) patients’ family members brush their teeth regularly. Self-medication was observed as n=269 (71.2%). Distribution of home remedies is shown in table IV. Table I Demographic variables
Variable Number PercentageAge (years)Mean±S.D 26.14±3.15GenderMale 257 68Female 121 32Education statusLiterate 196 51.9Illiterate 182 48.1OccupationsEmployee 47 12.4Worker 61 16.1Student 121 32House wife 149 39.4Socio-economic statusUpper class 92 24.3Middle class 125 33.1Lower class 161 42.6Type of familyJoint 250 66.1Nuclear 128 33.9
Table II Knowledge Regarding Dental PainVariable Number PercentageWhat causes the rapid dental decayDecreased brushing frequency 227 60.1Increased sugar intake 75 19.8Cold drink consumption 76 20.1Source of oral health knowledgeMedia source 42 11.1Family members 151 39.9Friends 57 15.1

Ophthalmology Update Vol. 16 No.4, Oct - Dec 2018 887
Knowledge, Attitudes and Practice Regarding the Oral Health
Teachers 105 27.8Others 23 6.1If gums bleed what you doStop brushing 140 37.0Increase brushing 76 20.1Go to dentist 36 9.5Nothing 126 33.3Is oral health related to systemic healthYes 292 77.2No 86 22.8Frequency of visit to dentistEvery 6 months 18 4.8After a year 95 25.1Never 265 70.1Is it essential to visit dentist every 6 monthsYes 245 64.8No 133 35.2
Table III Attitude Regarding Den-tal Pain Treatment
Variable Number PercentageDuration of pain5 minutes 45 11.9>5minutes 49 13.020 minutes 40 10.630 minutes 52 13.8Continuous pain 192 50.8Relieving factorCold water gargles 19 5.0Pain killers 206 54.5Salt water gargles 55 14.6Tooth paste 98 25.9Aggravating factorMastication 22 5.8Sweets 116 30.7Hot and cold things 151 39.9Food impaction 28 7.4Sour things 61 16.1Type of Pain wasSpontaneous 92 24.3Stimulated 70 18.5Referred 93 24.6Non-referred 123 32.5IntensityMild 90 23.8Moderate 133 35.2Severe 155 41.0
Associated withSwelling 163 43.1Fever 37 9.8Sinus 24 6.3Nothing 154 40.7Sensitivity toCold 216 57.1Hot 55 14.6Sweet 76 20.1Sour 31 8.2When did the pain started recentlyWithin one week 254 67.2Before one week 52 13.8Before 2 weeks 54 14.3Before 1 month 18 4.8Time period between 1st incidence of pain and 2nd incidence of pain1 week 53 14.02 weeks 95 25.1More than 2 weeks 113 29.91 month 117 31.0What was your approach in case of painGood doctor 11 2.9Private clinic 26 6.9Brushing regularly 128 33.9Hakeem 8 2.1Quack 112 29.6Home remedy 78 20.6Dam 4 1.1Homeopathy 11 2.9Why did you delay seeking consultationBusy life 19 5.0Mild tolerable pain 95 25.1Non availability of conveyance 58 15.3Costly treatment 71 18.8Pain is subsiding 38 10.1Hospital faraway 55 14.6Dental treatment fear 42 11.1Do you have habit ofPan\chaliya 51 13.5Niswar 26 6.9Smoking 76 20.1Carbonated drinks 144 38.1Milk 67 17.7None 14 3.7
Table IV Practicing of Oral Care

Ophthalmology Update Vol. 16 No.4, Oct - Dec 2018888
Knowledge, Attitudes and Practice Regarding the Oral Health
Variable Number PercentageMethods of cleaning teethTooth paste 213 56.3Dentonic powder 34 9.0Miswak 61 16.1Mouth wash 48 12.7Tooth picks 22 5.8Frequency of brushingTwice a day 46 12.2Thrice a day 5 1.3Once a day 260 68.8Do not brush 67 17.7Technique of brushingHorizontal 170 45.0Vertical 178 47.1Circular 30 7.9Change of brushEvery 3 months 115 30.4Every 6 months 138 36.5After a year 60 15.9When it gets rough 65 17.2Time of brushingIn morning 189 50.0Before breakfast 13 3.4In evening 22 5.8Before going to bed 27 7.1Both evening and morning 127 33.6Reason to brush the teethCleaning purpose 166 43.9Brightening of teeth 81 21.4To stop bleeding 24 6.3To stop cavity 107 28.3Reason for last dental visitExtraction 123 32.5Pain 144 38.1Filling of cavity 111 29.4On seeing dental decay what do you doIgnore 170 45.0Go to dentist 98 25.9Use home remedies 110 29.1Do your family members brush their teeth regularlyYes 239 63.2No 139 36.8What home remedies you useClove 22 5.8Salt water gargles 25 6.6
Honey 28 7.4Ice water 32 8.5Tooth paste 113 29.9Pain killers and antibiotics 72 19.0Inter-dental aid 21 5.6Antibiotics 33 8.7Pain killers 32 8.5MedicationSelf 269 71.2After consulting a doctor 109 28.8
DISCUSSION: Numerous factors are responsible for oral hy-giene and oral health behaviors in a population. Pos-itive reinforcement and proper informing about the health care regimen improves the compliance of the patients towards the treatment. Non compliance and non adherence to the oral hygiene practices is direct-ly associated with lack of information and motivation. The more the knowledge a patient has regarding the dental care the more will be the possibility of him to seek preventive health care. Knowledge regarding the seriousness of the dental problem and benefits of the treatment available are essential for seeking of health care 10, 11. The results of our study suggest that overall behavior and attitude of people regarding the practice of oral hygiene and seeking the preventive health care in case of any complaint is very unsatisfactory. A large number of the patients who presented at the out-pa-tient department were illiterate and belonged to poor socioeconomic class of the society. In previous studies poor attitudes and behavior have been attributed to the lack of oral health education programs 12, 13. The prob-lem in our community is not very different health ed-ucation programs are conducted. Previous studies also suggest that in order to improve the oral health con-ditions among the children and adults, dependency of patients on health personnel should be reduced and pa-tients should be encouraged to be responsible for their own dental care. Similarly preventive approach should be em-phasized over curative approach by improving the life-styles especially in those living in rural areas. Commu-nity oriented oral health programs must be conducted as also suggested by some previous studies by Zhu L et al 16, 17 and Varenne B et al 18. Studies in India by Mathur A et al19 and Garcha V et al20 indicated that overall be-havior, attitudes and knowledge of oral health care among children and their parents needs improvements. This requires health educations as well as improvement in socioeconomic conditions as these conditions have direct influence on the behavior and attitude of partici-pants of the study 19, 20.

Ophthalmology Update Vol. 16 No.4, Oct - Dec 2018 889
Knowledge, Attitudes and Practice Regarding the Oral Health
CONCLUSION: Although majority of the patients had good knowledge about health care but it was not associat-ed with better attitudes, behavior and practicing of healthy habits. It can be suggested that poor socioeco-nomic conditions of majority of the public and lack of motivation for oral hygiene are the cause of poor be-havior, attitude and practicing of dental care.Conflict of interest: There was no conflict of interest.Funding Source: No external funding source was used.
REFERENCES:1. Murray Thomson W. Epidemiology of oral health conditions in
older people. Gerodontol. 2014;31(s1):9-16.2. Gambhir RS, Brar P, Singh G, Sofat A, Kakar H. Utilization of
dental care: An Indian outlook. J natscibiol med. 2013;4(2):292.3. Vujicic M, Nasseh K, Wall T. Dental care utilization declined
for adults, increased for children during the past decade in the United States. Health Policy Resources Center Research Brief.Am Dent Assoc. 2013.
4. Lagerweij MD, van Loveren C. Declining caries trends: are we satisfied?.Curr oral health rep. 2015;2(4):212-7.
5. Takeuchi K, Aida J, Kondo K, Osaka K. Social participation and dental health status among older Japanese adults: a population-based cross-sectional study. PloS one. 2013;8(4):e61741.
6. Umer MF, Farooq U, Shabbir A, Zofeen S, Mujtaba H, Tahir M. PREVALENCE AND ASSOCIATED FACTORS OF DENTAL CARIES, GINGIVITIS, AND CALCULUS DEPOSITS IN SCHOOL CHILDREN OF SARGODHA DISTRICT, PAKISTAN. J Ayub Med CollAbbottabad. 2016;28(1):152-6.
7. Nakre PD, Harikiran AG. Effectiveness of oral health education programs: A systematic review. J Int Soc PrevCommun Dent. 2013;3(2):103.
8. Dixit LP, Shakya A, Shrestha M, Shrestha A. Dental caries prevalence, oral health knowledge and practice among indigenous Chepang school children of Nepal. BMC oral Health. 2013;13(1):20.
9. Al-Omiri MK, Al-Wahadni AM, Saeed KN. Oral health attitudes, knowledge, and behavior among school children in North Jordan. J dent educ. 2006;70(2):179-87.
10. Mirza KM, Khan AA, Ali MM, Chaudhry S. Oral health knowledge, attitude, and practices and sources of information for diabetic patients in Lahore, Pakistan. Diabetes Care. 2007;30(12):3046-7.
11. Kneckt M. Psychological features characterizing oral health behavior, diabetes self-care health status among IDDM patients. Oulu University Library 2000, 2011.
12. Priya M, Devdas K, Amarlal D, Venkatachalapathy A. Oral health attitudes, knowledge and practice among school children in Chennai, India. Jeduc Ethic Dent. 2013;3(1):26.
13. Smyth E, Caamaño F, Fernández-Riveiro P. Oral health knowledge, attitudes and practice in 12-year-old schoolchildren. Medicina Oral, Patología Oral y CirugíaBucal (Internet). 2007;12(8):614-20.
14. Lian CW, Phing TS, Chat CS, Shin BC, Baharuddin LH, Jalil ZB. Oral health knowledge, attitude and practice among secondary school students in Kuching, Sarawak. Arch orofac Sci. 2010;5(1):9-16.
15. Zhu L, Petersen PE, Wang HY, Bian JY, Zhang BX. Oral health knowledge, attitudes and behaviour of adults in China. Int dent j. 2005;55(4):231-41.
16. Zhu L, Petersen PE, Wang HY, Bian JY, Zhang BX. Oral health knowledge, attitudes and behaviour of children and adolescents in China. Int dent j. 2003;53(5):289-98.
17. Varenne B, Petersen PE, Ouattara S. Oral health behaviour of children and adults in urban and rural areas of Burkina Faso, Africa. Int dent j. 2006;56(2):61-70.
18. Varenne B, Petersen PE, Ouattara S. Oral health behaviour of children and adults in urban and rural areas of Burkina Faso, Africa. Int dent j. 2006;56(2):61-70.
19. Mathur A, Gupta T. Oral health attitude knowledge behavior and consent towards dental treatment among school children. J Orofac Res Vol. 2011;1(1).
20. Garcha V, Shetiya SH, Kakodkar P. Barriers to oral health care amongst different social classes in India. Commun dent health. 2010;27(3):158.

Ophthalmology Update Vol. 16 No.4, Oct - Dec 2018890
Functional Outcome of Neglected Club Foot Using Ilizarov External Fixator
Awal Hakeem
ABSTRACT:Background: Neglected clubfoot (NC) includes a variable range of complex deformities of the foot that are refractory to conventional treatments or are treated inappropriately. The Ilizarov method has become established as a tool for treating these deformitiesObjectives: The main objective of this study is to evaluate the functional outcome of neglected club foot using ilizarov external fixator in case series.Materials and Methods: This study was conducted in Department of Orthopedics and Trauma, Khyber Teaching Hospital, Peshawar from January 2017 till December 2017. Data including age, gender, functional outcome and complications of surgery were documented on a pre-formed proforma. A limited soft tissue dissection like percutaneous Achilles sheath tenotomy and plantar fasciotomy were done, where needed. Progressive correction of the deformities was achieved through the standard and simple Ilizarov frame construct setting. After removal of Ilizarov frame, a short leg walking cast was used for an additional 6 weeks, followed by an ankle foot orthrosis for 3 months. SPSS 18 was used for analysis.Results: 18 feet in 12 patients were treated, 9 (72%) were male and 3 (28%) female. The mean age was 15 years (range: 6 to 30 years). The mean follow up period was 18 months. The final functional outcome according to Reinker and Carpenter scale was excellent in 5 (28%) feet, good in 10 feet (55%), fair in 2 (12%) and poor in 1(5%) feet. The main complications were pin track infection and loose wires.Conclusion: It is concluded from analyzing this case series that treatment of neglected clubfoot using an external fixator has a high rate of excellent results, with low frequency of complications.Key words: neglected clubfoot, Ilizarov frame
Awal Hakeem FCPS1, Muhammad Siraj FCPS2Abid Ali MBBS3, Qaisar Azim MBBS3, Imran Ali4 MBBS, Asghar Essa MBBS5, Jawad Mufti MBBS6
Department of Orthopedics and Trauma, Khyber Teaching Hospital, Peshawar KPK
Functional Outcome of Neglected Club Foot Using Ilizarov External Fixator.
INTRODUCTION In developing or under developing countries, neglected clubfoot is a common problem.The ratio of children suffering from congenital club foot is 80% in developing countries. The main reason behind this is the limited or late access to the trained specialists for treatment and healthcare system1,2,3. Currently, non-surgical method is used to treat congenital club foot in newborn. Some feet cannot be adequately cor-rected with conservative treatment; though, majority of
patients achieve satisfactory deformity correction with weekly serial manipulations and casting during the first six weeks of life. If the initial deformity is rigid, the likelihood of surgical treatment is increased. Chil-dren up to one year of age having idiopathic club foot present satisfactory result after corrective surgery4,5. In approximately 20% of these patients due to recurrence of deformity, additional corrective surgery may be nec-essary. -------------------------------------------------------------------------------------------Neglected clubfoot using an external fixator has a high rate of excellent results, with low frequency of complications.------------------------------------------------------------------------------------------- Significant challenge is posed by the resistant and neglected clubfoot. With the goal to provide a pain free, plantigrade foot, several corrective procedures have been described. As an alternative to convention-
-------------------------------------------------------------------------------------------1.2.Assistant Professors 3.4,5,6, Postgraduate Trainees-------------------------------------------------------------------------------------------Correspondence: Dr Awal Hakeem House No 70-71, Street No 11, Sector: K3, Phase 3. Hayatabad Peshawar KPK.. [email protected] , 03339144432 Assistant Professor KTH, Peshawar [email protected] -------------------------------------------------------------------------------------------Received: June’2018 Accepted: Sep’2018-------------------------------------------------------------------------------------------
ORIGINAL ARTICLE

Ophthalmology Update Vol. 16 No.4, Oct - Dec 2018 891
Functional Outcome of Neglected Club Foot Using Ilizarov External Fixator
al techniques, the Ilizarov method of external fixation and gradual distraction has been reported. With this method encouraging results are reported6. The basis for the treatment is provided by the distraction osteogene-sis principles that have been described by Ilizarov and colleagues7. Simultaneous correction of all components of the clubfoot deformity is allowed by the progressive distraction offered by the external fixator7,8. Preserva-tion of foot size or lengthening of a baseline shortened foot is another advantage of Ilizarov external fixator over conventional methods9. All the severe foot deformities including neglect-ed clubfoot with minimal surgery, risks of cutaneous or neurovascular complications and excessive shorten-ing of the foot are corrected by the Ilizarov’s external fixator10. For future orthopedic surgeons, the external fixation remains an essential tool11. To correct many orthopedic deformities, the Ilizarov method is being used increasingly. Owing to the complexity of the de-formities which must be corrected, the frames required for ankle and foot deformity correction are among the most difficult to construct12. Ilizarov frame is applied in two parts, one to the leg and one to the foot. First, to the leg, a two-ring construct is applied. Two or one wire and one half pin is fixed with each ring. Foot construct is made of half ring on posterior side and half ring on anterior side13. Two crossed olive wires and a half ring is fixed to the fore foot. One traverses the five metatar-sals and the other fixed to the medial three metatarsals medially to laterally. Two crossed wires and a half ring was applied to the hind, though the calcaneus, with a Shanz pin is fixed to the calcaneus from posterior to an-terior. Medial rod on a hinge is used to fix the forefoot half ring with the hind foot half ring and connected to the distal tibial ring by a central dorsal rod on a univer-sal hinge. On each side of the central hole of the forefoot half ring, two dorsal rods were used in patients with forefoot supination14. We report a series of functional outcome of neglected club foot using Ilizarov external fixator.
METHODOLOGY: We evaluated as series of 18 feets in 12 patients with neglected CTEV treated with ilizarov external fix-ator at our department. All neglected club feet with common deformities like fore foot adduction or supina-tion, or both, mid foot caves ,short medial column and long lateral column, hind foot varus and equinus of the ankle were included in the study for treatment with Ilizarov. Patient unwilling for frame application or fol-low up and Resistant clubfeet with non healing ulcers over the callosities on the foot were excluded from the study. Dimeglio et al. classification was used to grade the severity
The limb was cleaned and draped from foot mid thigh. Ilizarov frame was preassembled according to the deformity of foot as well as radiographs to cor-rect without any stress over the related soft tissues. Two full rings connected by four rods and mounted over the tibia with one transverse wire and two oblique wires in each ring. One half ring was mounted to the calcaneus, using two wires. Another half ring with two plain crossed wires was applied to forefoot and connected with the rings applied over the tibia through the hinges, plates, and conical washers were also used wherever required. The calcaneal half ring had three connections to the lower ring of the tibia frame (posteriorly, medially, and laterally), while the forefoot half ring had two connections situated medi-ally and laterally and sometimes only one connection situated centrally to the long axis of the foot. One wire was passed in each toe and connected to forefoot half ring to prevent toe contracture. Half ring over the calcaneus was used as a dis-tractor or and compression was achieved through the

Ophthalmology Update Vol. 16 No.4, Oct - Dec 2018892
Functional Outcome of Neglected Club Foot Using Ilizarov External Fixator
half ring over dorsum of the fore foot. Varus deformi-ties of the heel were corrected through medial and later-al rods by compression and distraction method. These rods with hinges were applied in the rings fastened over the calcaneus and forefoot to increase or decrease the medial or lateral column according to the need of deformity correction. For correction of rotational like supination and pronation deformities, two frontal rods with hinges were applied in oblique directions connect-ed with the ring in the forefoot and assembly over the leg and corrected accordingly. The sequence of defor-mities’ correction was gradual distraction of medial column and compression of lateral column to correct the forefoot adduction, 1 mm/day, which was started on the 3rd to 5th postoperative day. After correction of forefoot adduction supination, hind foot varus and fi-nally equinus were corrected through the setting of the Ilizarov’s external fixator. During follow up while distraction soft tissues tension, neurovascular status, and improvement in the correction of the deformities were observed clinically as well as radiologically. All patients were motivated and weight bearing was allowed as tolerance of the pa-tients and their degree of correction. Required adjust-ments were done by the surgeon during stay in the hos-pital, and after discharge by either the patient himself/herself, or responsible family members were trained to move the nuts for compression, distraction, and lengthening through the markings. Patients and their attendants were trained to take care of pins by them-selves. All the pins were cleaned with normal saline and dressed with sterilized gauzes. Regularly patient were followed in Ilizarov clinic weekly up to deformity correction, then fortnightly up to removal of the fixa-tor. the decision to remove the fixator was made after correction of all required deformities. Even after com-plete correction, the distraction stopped and the Iliza-rov was retained for a period of 4–6 weeks more. After Fixator removal, all the pintract wounds were washed with saline, and aseptic dressings were done; a short leg plaster of Paris (POP) cast was applied for 2 weeks, the patients were reviewed at the outpatient clinic af-ter 2 weeks and 6 weeks. After 6 weeks POP cast was removed and ankle foot orthrosis (AFO) advised for 3 months.
RESULTS: 18 feet in 12 patients were treated in our study, 9 (72%) patients were male and 3 (28%) female. The mean age was 15 years (range: 6 to 30 years). The mean follow up period was 18 months. . The mean distraction time for deformity correction was 6 weeks (range 4-12 weeks). The mean duration of fixator application was 6 months (range 4–08 months). The correction of the deformity and function were assessed and the results were graded based on the Reinker and Carpenter scale as follows:
Excellent: Painless, plantigrade foot with no functional limitations; Good: Plantigrade foot in a patient able to ambulate long distances with mild pain; Fair: Mild residual deformity, required bracing, and/or some functional limitations, but the patient leading an active life; Poor: Significant residual deformity, pain, and activity limitations Of all 18 patients result was excellent in 5 (28%) feet, good in 10 feet (55%), fair in 2 (12%) and poor in 1(5%), feet . excellent and good results are labeled as satisfactory and fair and poor results considered as un-satisfactory. The main complication noted was pin tract infection seen in 6 feet which were treated with oral an-tibiotics and pin tract care. Other complications were loose wires which were tightened in Ilizrov clinic, toe contractures and kinking of skin
DISCUSSION Our study included 18 nelected clubfeet in 12 patients with ages ranging from 6 to 30 years (mean 15

Ophthalmology Update Vol. 16 No.4, Oct - Dec 2018 893
Functional Outcome of Neglected Club Foot Using Ilizarov External Fixator
years). Of the patients, 83% considered it as satisfactory excellent in 5 (28%) feet , good in 10 feet (55%), while 17 % considered it as unsatisfactory, fair in 2 (12%) and poor in 1(5%) feet.. Gradual soft tissue compression and distraction with the setting of Ilizarov frame was used for correction of the deformities in all patients. The same evaluation criteria were used in all patients as the same principle was used in them. Makhdoom A15 managed Twenty one patients with 27 feet having resistant clubfoot deformities by Ilizarov distraction histogenesis . At the time of remov-al of the fixator, a plantigrade foot was achieved in 25 feet and gait was improved in all patients. Out of 27 feet, 3 (11.11%) were rated as excellent, 17 (62.96%) as good, 5 (18.51%) as fair, and 2 (7.40%) as poor accord-ing to Reinker and Carpenter scale. Excellent and good results (74.07%) were considered satisfactory, while fair and poor results (25.92%) were considered unsatisfac-tory. Freedman in 20066 conducted a review of 21 resistant clubfeet in 17 patients, at an average fol-low-up of 6.64 years (range, 2.25-10.50 years), 9.5% (2) achieved an excellent result; 4.8% (1), good; 33.3% (7), fair; and 52.4% (11) poor. All 11 of the feet graded poor required revision surgery. Franke et al7treated 13 feet in 12 patients with clubfoot relapse using Ilizarov’s ap-paratus in children 8-15 years old. A plantigrade foot was achieved in all cases. All patients were able to wear ready-made shoes. El Barbary et al.16 achieved satisfactory correction using an Ilizarov fixator for treatment of 66 relapsed or neglected club feet (40 months follow up). Prem et al.17followed 19 feet managed by Ilizarov soft tissue distraction for 5–10 years postoperatively. They reported on 14 of 19 feet graded good or excellent and 13 of 14 children satisfied with the results of the treat-ment. Utukuri et al.18 treated 26 resistant clubfeet in 23 children using Ilizarov technique. They reported unsat-isfactory results of soft tissue and bony distraction with a recurrence rate of 70% for soft tissue distraction and 55% for bony distraction after a longer period of follow up (47 months), but found that functional results (pa-tient based outcomes) were better despite a poor surgi-cal outcome. Reinker and Carpenter19 achieved excellent and good results in 21 of 23 feet treated by Ilizarov’s external fixation. Nineteen feet had received one or more osteotomies at the time of Ilizarov’s external fix-ation application; additional procedures were required during the course of treatment, including four percuta-neous tendo Achilles lengthening, two first metatarso phalangeal joint fusions, and talectomy, ankle arthrod-esis, Achilles tenodesis, and plantar arthrodesis in one-case. Hosny20 used the bloodless technique in treating 23 foot deformities in 22 patients without any
real surgical incision; there was no need for soft tissue release or osteotomy, all patients had a plantigrade foot, and the results were rated as good in 20 and fair in 3 cases.
CONCLUSION: It is concluded from analyzing this case series that treatment of neglected clubfoot using an external fixator has a high rate of excellent results, with low frequency of complications.
REFERENCES Use of the Ilizarov Method in Management of Relapsed Club Foot. Orthopedics. 2010;33:881.1. Penny J.N. The neglected clubfoot. TechnOrthop.
2005;20(2):153–166.2. Ferreira R.C., Stefani K.C., Fonseca Filho F.F., Santin R.A.
Correção do pétortocongênitoiveterado e recidivadopelométodo de Ilizarov. Rev Bras Ortop. 1999;34(9/10):505–512.
3. de la Huerta F. Correction of the neglected clubfoot by the Ilizarov method. ClinOrthopRelat Res. 1994;(301):89–93.
4. Mckay DW. New concept of an approach to clubfoot treatment -evaluation and results.JPediatrOrthop 1983;3:141-8.
5. Turco VJ. Surgical correction of resistant clubfoot. One stage posteromedial release with internal fixation. J Bone Joint Surgery Am 1971;53-A:477-97.
6. Freedman JA, Watts H, Otsuka NY. The Ilizarov method for the treatment of resistant clubfoot: Is it an effective solution? J PediatrOrthop. 2006;26:432–7.
7. Grill F, FrankeJ.TheIlizarov distractor for the correction of relapsed or neglected clubfoot.J Bone Joint Surg Br 1987;69-B:593-7.
8. Ilizarov GA, Shevtsov VI, Kuzmin NV. Method of treating talipesequinocavus. ortopTravmatolProtez 1983;5:46-8.
9. Paley D. The correction of complex foot deformities using Ilizarov’s distraction osteotomies. ClinOrthop 1993;293:97-111.
10. Elomrani NF, Kasis AG, Tis JE, Saleh M. Outcome after foot and ankle deformity correction using circular external fixation. Foot Ankle Int. 2005;26:1027–32.
11. Greisberg J. Recent innovations and future directions in external fixation of the foot and ankle. Foot Ankle Clin. 2004;9:637–47.
12. Rosman M, Brown K. Preoperative Ilizarov frame construction for correction of ankle and foot deformities. J PediatrOrthop. 1991;11:238–40.
13. Catagni MA, Guerreschi F, Manzotti A, Knuth A. Treatment of foot deformities method using the Ilizarov. Foot Ankle Surg. 2000;6:207–37.
14. Ahmed AA. The Use of the Ilizarov Method in Management of Relapsed Club Foot. Orthopedics. 2010;33:881
15. Makhdoom A, Qureshi PAL, Jokhio MF, Siddiqui KA. Resistant clubfoot deformities managed by Ilizarov distraction histogenesis. Indian Journal of Orthopaedics. 2012;46(3):326-332.
16. El-Barbary H, Abdel Ghani H, Hegazy M. Correction of relapsed or neglected clubfoot using a simple Ilizarov frame. IntOrthop. 2004;28:183–6
17. Prem H, Zenios M, Farrell R, Day JB. Soft tissue Ilizarov correction of congenital talipes equinovarus-5 to 10 years post surgery. J PediatrOrthop. 2007;27:220–4.
18. Utukuri MM, Ramachandran M, Hartley J, Hill RA. Patient-based outcomes after Ilizarov surgery in resistant clubfeet. J PediatrOrthop B. 2006;15:278–84.
19. Reinker KA, Carpenter CT. Ilizarov application in the pediatric foot. J PediatrOrthop. 1997;17:796–802.
20. Hosny GA. Correction of foot deformities by the Ilizarov method without corrective osteotomies or soft tissue release. J PediatrOrthop B. 2002;11:121–8
Ophthalmology Update Vol. 16 No.4, Oct - Dec 2018894
Frequency of Delirium in Patients with underlying Urinary Tract Infection
ABSTRACT Introduction: Delirium is a common and serious disorder with high morbidity and mortality. A large proportion of patients with UTI suffer from delirium hence UTI is a common cause of delirium. The current study was aimed at determining the frequency of delirium in patients with underlying UTI.Methods: A total of 96 patients aged 16-80 years, admitted to the medical unit with Urinary Tract Infection, excluding those with coma, speech/sensory impairments, generalized cognitive deficits, were consecutively recruited for the study. Having obtained the socio-demographic details via proforma, Confusion Assessment Method was administered to the patients and results were interpreted accordingly. Data was analyzed using SPSS 10.0.Results: The mean age of the patients was 35.73(S.D±18.54), with an age range of 17-80 years. There was almost an equal gender distribution, with 50(52.08%) females and 46(47.92%) males. Among the patients with underlying UTI, 30(31.25%) had delirium, while 66 (68.75%) did not have any symptoms of delirium.Conclusion: A large proportion of patients with UTI suffered from delirium which might indicate that UTI is a common cause of delirium. There should be more focus on detecting, preventing and treating UTI to avoid unnecessary suffering thus reducing morbidity and mortality.Keywords: delirium, cognitive disorders, urinary tract infection
Fatima Aamir Khan, FCPS(Psych)1 M. Fahim Qasim, FCPS(Psych)2. Prof. Fareed Aslam Minhas FCPS (Psych)3. Asad Tamizuddin Nizami, FCPS (Psych)4.
Frequency of Delirium in Patients with underlying Urinary Tract Infection
Fatima Aamir Khan
INTRODUCTION Delirium is a major healthcare concern in de-veloping countries with poor outcome. Health service planners and practitioners have yet to systematically tackle the potential for delirium diagnosis and preven-tion. Few guidelines have been produced and delirium remains disproportionately ignored relative to its im-pact.1 Delirium is an important problem for all clinical service particularly general medical wards. It is a com-plex neuropsychiatric syndrome comprising a broad range of cognitive and non-cognitive symptoms, occur-ring in 11–42% of general medical inpatients and up to 50% of the hospitalized elderly with higher rates in pa-tients with terminal illness and Medical Intensive Care Unit.2 Patients with delirium have increased length of stay, increased mortality and increased risk of institu-tional placement. Hospital mortality rates of patients with delirium range from 6 to18 %.3
Delirium is highly heterogeneous in its causation. Moreover, existing studies do not adequate-
ly account for the multifactorial nature of delirium aeti-ology and are predominantly cross-sectional in nature. Moreover, in around 10% of cases, no clear aetiology is usually identified. 4 However a high index of suspicion relative to the presence of UTI especially in the elderly can precipitate delirium. In a study eighty-seven of 504 women (17.2%), were diagnosed as having a UTI with or without ongoing treatment when they were assessed, and almost half of them (44.8%) were diagnosed to be delirious or having had episodes of delirium during the past months. A large proportion of patients with UTI suffered from delirium which might indicate that UTI is a common cause of delirium. 5 There should be more focus on detecting, preventing and treating UTI to avoid unnecessary suffering especially amongst old-er patients.-------------------------------------------------------------------------------------------Patients with UTI suffer from delirium, a common cause. There should be more focus on detecting, pre-venting and treating UTI to avoid unnecessary suffer-ing thus reducing morbidity and mortality.------------------------------------------------------------------------------------------- Several diagnostic instruments have been de-veloped for detecting delirium. USA and UK guide-lines recommend the confusion assessment method for routine use. The diagnosis of delirium rests solely on clinical skills and no diagnostic test exists. This may partly explain why it is undiagnosed in over a half of patients with the condition. Delayed or missed diagno-sis is an important issue. Non-detection of delirium in
-------------------------------------------------------------------------------------------1.2.,3.Assistant Professors of Psychiatry, Wah Medical College, POF WahCantt.4. Professor of Psychiatry, Head, Institute of Psychiatry, Director, WHO Collaborating Centre, Dean Faculty of Psychiatry, CPSP, Benazir Bhutto Hospital, Rawalpindi Medical University.-------------------------------------------------------------------------------------------Correspondence: Dr. Fatima Aamir Khan, FCPS(Psych) Assistant Professor of Psychiatry, Wah Medical College, POF Wah Cantt. Email :[email protected] Phone No: 0300-5333266-------------------------------------------------------------------------------------------Received: July;2918 Accepted: Sep’2018-------------------------------------------------------------------------------------------
ORIGINAL ARTICLE

Ophthalmology Update Vol. 16 No.4, Oct - Dec 2018 895
Frequency of Delirium in Patients with underlying Urinary Tract Infection
emergency departments is associated with a sevenfold hazard for increased mortality.2 Unfortunately, very lit-tle is known about diagnosing delirium in clinical set-up in developing countries like Pakistan. The purpose of the current study was to address this overwhelming problem of delirium, and aims to determine the burden of delirium in patients with Urinary Tract Infections, in in-patients settings at Benazir Bhutto Hospital, which is a tertiary care setting. The prompt and early diagnosis should help improve the general health of the patients concerned also improving overall prognosis and pre-venting further deterioration.
PATIENTS AND METHODS: This was a descriptive, cross-sectional study, carried out at the inpatient department of Benazir Bhu-tto Hospital, Rawalpindi, a tertiary care setting, for a period of 6 months from August 26th 2011 till February 26th 2012. The study was commenced after obtaining Hospital Ethical Committee approval. A total of 96 pa-tients which included adults aged 18 years to 80 years, of both genders, admitted to Medical Unit, with Uri-nary Tract Infection. Patients with pre-existing gener-alized cognitive deficits, with speech or other sensory impairments or those who were comatose and were excluded. A written informed consent was obtained from the patients and a socio-demographic proforma was filled in to obtain the relevant socio-demographic details. Confusion Assessment Method (CAM) was ap-plied to the patients by the principal researcher. The Confusion Assessment Method (CAM)6 includes an instrument and diagnostic algorithm for identification of delirium. The CAM instrument as-sesses the presence, severity, and fluctuation of 9 delir-ium features i.e., acute onset, inattention, disorganized thinking, altered level of consciousness, disorientation, memory impairment, perceptual disturbances, psycho-motor agitation or retardation, altered sleep-wake cy-cle. The CAM diagnostic algorithm is based on four car-dinal features of delirium: i) acute onset and fluctuating courseii) Inattention(iii) disorganized thinking, and (iv) altered level of consciousness. A diagnosis of delirium according to the CAM requires the presence of features 1, 2, and either 3 or 4. The CAM demonstrated sensitiv-ities from 94–100%, specificities from 90–95%, positive predictive accuracy of 91– 94%, negative predictive ac-curacy of 90–100%, interrater reliability ranging from 81–1.00.
RESULTS: Table 1 showing the mean age of the participants (n=96).The mean age of the patients was 35.73(S.D±18.54), with an age range of 17-80 years.
Range Min Max Mean Std. Deviation
Age of patients
63 17 80 35.73 18.54
Table 2 There was almost an equal gender distribution, with 50(52.08%) females and 46(47.92%) males, show-ing the gender distribution of the participants (n=96) Among the patients with underlying UTI, 30(31.25%) had delirium, while 66 (68.75%) did not have delirium.Gender Frequency PercentageMale 46 47.92%
Female 50 52.08%
Table 3 showing the frequency of delirium with under-lying UTI amongst the participants (n=96)Delirium with underlying UTI Frequency Percentage
Present 30 31.25%
Absent 66 68.75%
There were 85 true positive cases and 11 false positive cases, 87 true negative and 9 false negative cas-es, as determined by the Confusion Assessment Meth-od( CAM). The Confusion Assessment Method( CAM) Questionnaire thus showed a Sensitivity of 90.43% ( de-termined by the formula ( True positive cases-TP/True positive + True Negative X 100), Specificity of 88.78% determined by the formula ( True Negative cases / False positive + True negative cases), positive predic-tive value of 88.54% determined by the formula ( True Positive cases / True positive + False positive cases) and Negative predictive value of 90.63% determined by the formula ( True Negative cases / True negative + False negative cases)Table 4. Showing the sensitivity, specificity, positive and negative predictive value of cam questionnaire
Test Present n Absent n Total
Positive True Positive
a=85 False Positive
c=11 a + c = 96
Negative False Negative
b=9 True Negative
d=87 b + d = 96
Statistic Formula Value
Sensitivity 90.43%
Specificity 88.78 %
Positive Predic-tive Value
88.54% (*)
Negative Pre-dictive Value
9 0 . 6 3 % (*)

Ophthalmology Update Vol. 16 No.4, Oct - Dec 2018896
Frequency of Delirium in Patients with underlying Urinary Tract Infection
DISCUSSION: The purpose of the study was to find out the frequency of delirium in patients with urinary tract infections presenting in medical unit, in-patient de-partment, at Benazir Bhutto Hospital, Rawalpindi. The study found that 30 out of 96 patients, i.e. 31.25% of the patients with underlying Urinary Tract Infection had been diagnosed with delirium. This is a significant finding and can be compared across different studies. A retrospective study by Manepalli J et al (1990)7 study involving 407 patients discharged over a 2-year period from a psychogeriatric unit found that 83 (20.4%) had urinary tract infection (UTI) and 54 (13.3%) had delirium diagnoses at admission. Of the 54 with delirium, 14 (25.9%) had UTI. We can compare this finding with the current study finding of delirium frequency of 31.25% which is significantly higher than the frequency of delirium i.e 13.3% found in the aforementioned study. Another interesting study5 is worth mentioning here. The aim of the study was to investigate whether urinary tract in-fection (UTI) in a representative sample of 85-, 90- and ≥95-year-old women was associated with delirium. Eighty-seven of 504 women (17.2%), were diag-nosed as having a UTI with or without ongoing treat-ment when they were assessed, and almost half of them (44.8%) were diagnosed to be delirious or having had episodes of delirium during the past month. One hun-dred and thirty-seven of the 504 women (27.2%) were delirious or had had episodes of delirium during the past month and 39 (28.5%) of them were diagnosed to have a UTI. Another study from India8 conducted on hospi-talized geriatric medical patients found an overall rate of delirium of 27% in the 100 patients. 19% was the rate of ‘prevalent’ delirium and 8% was the rate of ‘incident’ delirium. The implications of this study was delirium is a common complication seen in patients with under-lying Urinary Tract Infection, and its early detection
and effective management could help reduce morbid-ity and mortality associated with delirium. Also, Con-fusion Assessment Method (CAM) is a useful screening method with high sensitivity for diagnosis of delirium at the bedside. Limitations of the study include a small sample size with poor generalization of the results, a wide age range of 16-80 years, as it would have been better to focus only on the geriatric population, delirium being common in that age group, and lastly other risk factors like history of previous delirious episodes, dementia etc, remained unexplored.
CONCLUSIONA large proportion of patients with UTI suffered from delirium which might indicate that UTI is a common cause of delirium. There should be more focus on de-tecting, preventing and treating UTI to avoid unneces-sary suffering thus reducing morbidity and mortality.REFERENCES1. Young J, Inouye SK. Delirium in older people. BMJ 2007;334:842-
6 2. Exton C, Leonard M. Eye tracking technology: a fresh approach
in delirium assessment? Int Rev Psychiatry 2009;21:8-14.3. Potter J, George J; Guideline Development Group. The
prevention, diagnosis and management of delirium in older people: concise guidelines. Clin Med 2006;6:303-8
4. Meagher DJ, Maclullich AM, Laurila JV. Defining delirium for the International Classification of Diseases, 11th Revision. J Psychosom Res 2008;65:207-14.
5. Eriksson I, Gustafson Y, Fagerström L, Olofsson B. Urinary tract infection in very old women is associated with delirium. IntPsychogeriatr 2011;23(3):496-502.
6. Wei LA, Fearing MA, Sternberg EJ, Inouye SK. The Confusion Assessment Method: a systematic review of current usage. J Am GeriatrSoc 2008;56(5):823-30.
7. Manepalli J, Grossberg GT, Mueller C. Prevalence of delirium and urinary tract infection in a psychogeriatric unit. J Geriatr Psychiatry Neurol1990;3:198-202.
8. Khurana PS, Sharma PS, Avasthi A. Prevalence of delirium in geriatric hospitalized general medical population. Indian J Psychiatry 2002;44:41-6.

Ophthalmology Update Vol. 16 No.4, Oct - Dec 2018 897
Frequency and Severity of Depression in Adolescents at Tertiary Care Psychiatric Facility
ABSTRACTBackground: Depression is a common mental disorder that hinders ability of an individual to grow and develop to their full potential. Various studies showed that the prevalence of major depression during adolescence range from 14% to 20% and consequences could be substance misuse, high suicide rates, anxiety, impaired QOL. The current study was designed to determine the frequency and severity of depression in adolescents and long term pharmacological and psychological interventions for the affected population in terms of improving their quality of life.Objective: The objective of our study was to determine the frequency and severity of depression in adolescents presenting in outpatient department. It was a descriptive cross sectional study, conducted in outdoor of child psychiatry department Benazir Bhutto hospital Rawalpindi.Methods: 400 patients were enrolled and the study was conducted for 6 months from Jan to July 2015. Data was collected by cluster sampling using the systematic random sampling technique. KADS for depressive Illness was applied to the participants for diagnosing depression. The patients diagnosed as suffering from depressive illness were then assessed for the severity of depression using the ICD-10. Data was then analyzed using SPSS 18.Results: Study revealed that among participants (n=400) prevalence of depression is 12%, with 177 (44.3%) males and 223 (55.8%) female participants.23(5.8%) had mild depression, 20(5.0%) had moderate depression and 5(1.3%) had severe depression after using the ICD-10 criteria for depression and the KADS scale.Conclusion: The findings from this study indicated that the clinician should determine a treatment plan that not only addresses the depression but which identifies the contributing features. Studies should also evaluate the cost-effective models of treatment and other interventions for the affected population which can be easily used in the primary care setting to effectively treat depression thus improving their quality of life. Keywords: Children, childhood, frequency, severity, adolescent, Prevalence, depression, KADS
M. Fahim Qasim, FCPS(Psych)1. M. Shoab Irfan FCPS2. Fatima Aamer Khan FCPS3 ,Asad Tamiz uddin Nizami FCPS4.
Frequency and Severity of Depression in Adolescents at Tertiary Care Psychiatric Facility
Fahim Qasim
INTRODUCTION Depressive disorder is a common mental health problem in adolescents worldwide,1 with an estimated 1 year prevalence of 4–5% in mid to late adolescence.2,3 Depression in adolescents is a major risk factor for sui-cide, the second-to-third leading cause of death in this age group,4 with more than half of adolescent suicide victims reported to have a depressive disorder at time of death.5 Depression also leads to serious social and educational impairments,6,7 and an increased rate of smoking, substance misuse, and obesity.8,9 Thus, to rec-ognize and treat this disorder is important. Depression has been defined as a cluster of spe-cific symptoms with associated impairment. The clini-cal and diagnostic features of the disorder are broadly
similar in adolescents and adults (panel).10,11 The two main classification systems (international classification of diseases-10 (ICD-10) and the American diagnostic and statistical manual of mental disorders-IV (DSM-IV) define depression similarly, although DSM-IV makes one exception for children and adolescents, whereby ir-ritable rather than depressed mood is allowed as a core diagnostic symptom.12 Nevertheless, depression in ad-olescents is more often missed than it is in adults,13 pos-sibly because of the prominence of irritability, mood reactivity, and fluctuating symptoms in adolescents. Depression can also be missed if the primary present-ing problems are unexplained physical symptoms, eat-ing disorders, anxiety, refusal to attend school, decline in academic performance, sub stance misuse, or behav-ioral problems.-------------------------------------------------------------------------------------------The clinician should determine a treatment plan addressing the depression and contributing features. They should also evaluate the cost-effective treat-ment along with other interventions thus improving their quality of life.------------------------------------------------------------------------------------------- In some respects depression in adolescents can be viewed as an early-onset sub-form of the equivalent
-------------------------------------------------------------------------------------------1.3.,Assistant Professors of Psychiatry, Wah Medical College, POF Wah Cantt.2. Senior Regstrar.(Psych) Wah Medical College, POF Wah.4. Consultant Psychiatrist, Rawalpindi Medical Univesity & Allied Hospitals, Institute of Psychiatry, BB Hospital, Rawalpindi 03005559232-------------------------------------------------------------------------------------------Correspondence: Dr. Muhammad Fahim Qasim, Assistant Professor of Psychiatry, Wah Medical College, POF Wah Cantt. Email : [email protected] Cell: 0300 5559232-------------------------------------------------------------------------------------------Received: July’2018 Accepted: Sep’2018-------------------------------------------------------------------------------------------
ORIGINAL ARTICLE

Ophthalmology Update Vol. 16 No.4, Oct - Dec 2018898
Frequency and Severity of Depression in Adolescents at Tertiary Care Psychiatric Facility
adult disorder because of its strong links with recur-rence later in life.14 The illness has similar clinical fea-tures and patterns of neural activity to that in adults, and its occurrence is also associated with a family his-tory of the disorder.11 However, important differences exist between the two disorders, particularly in treat-ment response, with strongly divided opinions about best treatment practices.10
There is already paucity of research in this area in our country and very little is already known about the frequency and severity of depression in adoles-cence, therefore we carried out this study in our depart-ment, institute of Psychiatry, Benazir Bhutto Hospital, to furnish essential data regarding this and to create more awareness for early identification and effective treatment of depression in adolescence.
METHODOLOGY This cross sectional, descriptive, study was conducted in the outdoor of child Psychiatry depart-ment Benazir Bhutto Hospital Rawalpindi, for a period of 6 months from Jan 2015–July, 2017. The total sample was 400 adolescents, aged between 10-19 years of both genders having any or combination of followings; ir-ritability, poor school performance, behavioral distur-bances and disturbed sleep and appetite for one week duration, excluding patients with other psychiatric dis-orders like ADHD, Mental retardation etc. and those who were unable to communicate. After getting approval from hospital ethics committee, written informed consent was obtained from those subjects who fulfilled the inclusion criteria. A predesigned performa was given to the study partic-ipants and all the relevant details such as age, gender, educational status were obtained. The Kutcher Ado-lescent Depression Scale (KADS) was used to screen depression in adolescents. The patients suffering from depressive illness were then assessed for the severity of depression using the ICD 10 criterion for depres-sion. Data was analyzed with Statistical Program for Social Sciences (SPSS) version 18. For the quantitative variables i.e. age, KADS score, ICD10 criterion, Mean ± S.D was calculated. For the qualitative variables i.e. gender, educational status, depression and its severity, frequencies and percentages were presented.
RESULTS This study was conducted in the child psychia-try OPD of psychiatry unit of BBH Rawalpindi. Partic-ipants were children of 10-19 years of age. Period was 6 months. The total numbers (n) of participants were 400. The age distribution showed that 84 (21%) of the participants were in the age range of 10-12 years, 170 (42.5%) in 13-15 years, 114 (28.5%) in 16-18 years range while only 32 (8%) were >18years. The mean age of the participants was 14.64 ± S.D 2.585 with an age range
of 10-19 years. Among the participants, 178 (44.5%) were males where as 222 (55.5%) were females. Among the (n=400) participants, depression was present in 48(12%) while absent in 352 (88%). Among the partici-pants 352(88.0%) had no depression, 23(5.8%) had mild depression, 20(5.0%) had moderate depression and 5(1.3%) had severe depression. See table Table : Manova for Gender and Education on Intrin-sic Motivation, Extrinsic Motivation and A-motivation (N= 160)TABLE: Showing frequency of different grades of severity of depression (n=400)
Severity of Depression Frequency Percentagemild 23 5.8%moderate 20 5%severe 5 1.3%no depression 352 88%
In MANOVA the results concluded that inter-action among gender and education of the sample was significant on intrinsic motivation and extrinsic moti-vation. Gender and level of education when combined, significantly influence the rates of intrinsic motivation (MS= 149.74, p<.05) and extrinsic motivation (MS= 56.78, p<.05).
DISCUSSION: Depression in children and adolescents is a pre-vailing mental illness which carries a significant bur-den in terms of social, educational, interpersonal, eco-nomic and impaired future developmental outcomes. By age of 18, nearly a fourth of all children will experi-ence clinically significant depressive symptoms which remain problematic for many youngsters through-out childhood, adolescence and beyond. Among the (n=400) adolescents in our study, depression was diag-nosed in 48(12%) cases with 352(88.0%) had no depres-sion, 23(5.8%) had mild depression, 20(5.0%) had mod-erate depression and 5(1.3%) had severe depression. These findings are in line with other studies. Which estimates the prevalence of major depressive disorders in early adulthood range from 10%–17% (Moffitt et al., 2010), with women about twice as likely to be affected as men.11 Studies have shown that levels of depression begin to rise in the early teens. As a result, by the mid-teens, the median 12-month prevalence of unipolar de-pression is in the region of 4-5%. 10
The lifetime prevalence of Major Depression in adolescence is similar to what has been reported in adults, suggesting that a large proportion of adult epi-sodes could have precursors in adolescence. Estimates of lifetime Major Depressive Disorder prevalence in adolescents and young adults vary widely, ranging from less than 9% (Tanner et al., 2007)12 to more than 30% (MDD and/or the much less common dysthymia;

Ophthalmology Update Vol. 16 No.4, Oct - Dec 2018 899
Frequency and Severity of Depression in Adolescents at Tertiary Care Psychiatric Facility
Hankin et al., 1998).13
A number of studies14-16 have identified the prevalence of Major Depressive Disorder to be between 5 – 8% in adolescence and adulthood (e.g., Birmaher et al.14, 1996; Costello et al,15 2006; Kessler et al 16) Thus, we can draw a fair comparison with these studies and we can clearly see that adolescent depression becomes a major risk factor for developing depression in later adulthood with much greater severity. Therefore, prop-er screening and effective management of cases of Ma-jor Depressive Disorder during the adolescence is vital to the health related quality of life of the individuals concerned.
CONCLUSION: The findings from this study indicated that the clinician should determine a treatment plan that not only addresses the depression but which identifies and addresses the contributing features. Studies should also evaluate the cost-effective models of treatment and oth-er interventions for the affected population which can be easily used in the primary care setting to effectively treat depression thus improving their quality of life.
REFERENCES1. Lopez A, Mathers C, Ezzati M, Jamison D, Murray C. Global
burden of disease and risk factors. Washington: Oxford University Press and the World Bank; 2006.
2. Costello EJ, Egger H, Angold A. 10-year research update review: the epidemiology of child and adolescent psychiatric disorders: I. Methods and public health burden. J Am Acad Child Adolesc Psychiatry. 2005;44:972–86. [PubMed]
3. Costello EJ, Erkanli A, Angold A. Is there an epidemic of child or adolescent depression? J Child Psychol Psychiatry. 2006;47:1263–71. [PubMed]
4. Windfuhr K, While D, Hunt I, et al. National confidential inquiry into suicide and homicide by people with mental illness. Suicide in juveniles and adolescents in the United Kingdom. J Child Psychol Psychiatry. 2008;49:1155–65. [PubMed]
5. Hawton K, van Heeringen K. Suicide. Lancet. 2009;373:1372–81. [PubMed]
6. Lewinsohn PM, Rohde P, Seeley JR. Major depressive disorder in older adolescents: prevalence, risk factors and clinical
implications. Clin Psychol Rev. 1988;18:765–94. [PubMed]7. Fletcher JM. Adolescent depression and educational attainment:
results using sibling fixed effects. Health Econ. 2008;17:1215–35. [PubMed]
8. Keenan-Miller D, Hammen CL, Brennan PA. Health outcomes related to early adolescent depression. J Adolesc Health. 2007;41:256–62. [PMC free article] [PubMed]
9. Hasler G, Pine DS, Kleinbaum DG, et al. Depressive symptoms during childhood and adult obesity: the Zurich cohort study. Mol Psychiatry. 2005;10:842–50. [PubMed]
10. Thapar A, Collishaw S, Potter R, Thapar AK. Managing and preventing depression in adolescents. BMJ. 2010;340:c209
11. Moffitt TE, Caspi A, Taylor A, Kokaua J, Milne BJ, Polanczyk G, et al. How common are common mental disorders? Evidence that lifetime prevalence rates are doubled by prospective versus retrospective ascertainment. Psychol Med. 2010;40(6):899-909
12. Tanner JL, Reinherz HZ, Beardslee WR, Fitzmaurice GM, Leis JA, Berger SR. Change in prevalence of psychiatric disorders from ages 21 to 30 in a community sample. J Nerv Ment Dis. 2007;195(4):298-306.
13. Hankin BL, Abramson LY, Moffitt TE, Silva PA, McGee R, Angell KE. Development of depression from preadolescence to young adulthood: emerging gender differences in a 10-year longitudinal study. J Abnorm Psychol. 1998;107(1):128-40
14. Birmaher B, Ryan ND, Williamson DE, Brent DA, Kaufman J, Dahl RE, et al. Childhood and adolescent depression: a review of the past 10 years. Part I. J Am Acad Child Adolesc Psychiatry. 1996;35(11):1427-39.
15. Jane Costello E, Erkanli A, Angold A. Is there an epidemic of child or adolescent depression? J Child Psychol Psychiatry. 2006;47(12):1263-71.
16. Kessler RC, Berglund P, Demler O, Jin R, Merikangas KR, Walters EE. Lifetime prevalence and age-of-onset distributions of DSM-IV disorders in the National Comorbidity Survey Replication. Arch Gen Psychiatry. 2005;62(6):593-602.
17. Merikangas KR, He JP, Burstein M, Swanson SA, Avenevoli S, Cui L, et al. Lifetime prevalence of mental disorders in U.S. adolescents: results from the National Comorbidity Survey Replication--Adolescent Supplement (NCS-A). J Am Acad Child Adolesc Psychiatry. 2010 Oct; 49(10):980-9.
18. Karacetin G, Arman AR, Fis NP, Demirci E, Ozmen S, Hesapcioglu ST, et al. Prevalence of Childhood Affective disorders in Turkey: An epidemiological study. J Affect Disord. 2018 ;238:513-21.
19. Lamers F, Burstein M, He JP, Avenevoli S, Angst J, Merikangas KR. et al. Structure of major depressive disorder in adolescents and adults in the US general population. Br J Psychiatry. 2012 Aug;201:143-50.
20. Wesselhöft RT. Childhood depressive disorders. Dan Med J. 2016 Oct;63(10). pii: B5290.
Ophthalmology Update Vol. 16 No.4, Oct - Dec 2018900
Bowel Preparation Vs No Preparation before Colostomy Closure in Pediatric Patients
ABSTRACT Objectives: The aim of this study was to determine the difference in outcomes between pediatric patients undergoing preoperative bowel preparation and those with no bowel preparation before colostomy closure. Differences in morbidity and mortality were measured in this study between these two groups.Material and Methods: This is a prospective randomized study. Eighty-five patients undergoing a colostomy reversal were included in this study over the period of two years from August 2015 to July 2017. They were randomly divided into two groups No bowel preparation (NBP) 42 and bowel preparation (BP) 43. Parent’s refusal, any known allergy or contraindication to polyethylene glycol, hepatic, renal or cardiopulmonary abnormality, bleeding diathesis, local skin site infections were excluded from this study. Patients were admitted to the hospital two days before surgery and initiated on intravenous fluids at a weight based maintenance rate. Bowel preparation was started 2 days before surgery with normal saline distal loop wash and Movicol sachet per oral. Patients remained NPO overnight prior to surgery in accordance with anesthesia protocol. All patients received intravenous ceftriaxone and metronidazale – 1 h prior to incision and continued for 3 to 5days post operatively. Postoperatively, surgeon’s judgment dictated the removal of the Naso-gastric tube (NGT) and advancement of diet. Complications or morbidities were noted at the time of discharge. Initial follow up was scheduled in two weeks to OPD. At 4–6 weeks postoperatively the patients were evaluated in OPD to determine postoperative progress and to assess for any complications.Results: Total of 85 patients were included in the study, 42 in No Bowel Preparation group (NBP) and 43 in Bowel Preparation Group (BP). In NBP 10(23.80%) suffered skin infection, 3(7.10%) intra-abdominal abscesses and 2(4.7%) anastomotic leaks while in BP group there were 2(4.7%) patients with skin infection, no intra-abdominal abscess and 2(4.7%) anastomotic leaks. Conclusion: Preoperative bowel preparation is safer and effective before colostomy closure. Large multicentre prospective trials need to be done to establish the significant difference between BP versus NBP.Key words: Bowel preparation, Colostomy closure, Saline wash, Polyethylene glycol.
Waheed Akhtar FCPS1 , Farooq Abdullah MBBS 2, Mohammad Imran FCPS 3, Prof. Inayat ur Rehman FCPS ,4
Department of Paediatric Surgery, Khyber Teaching Hospital, Peshawar
Bowel Preparation Vs No Preparation before Colostomy Closure in Pediatric Patients:
(A Randomized Prospective Trial in a Tertiary Care Hospital)Waheed Akhtar
INTRODUCTION Most of the patients with Hirschsprung’s dis-ease and Anorectal malformations need colostomy at some stage, making colostomy and colostomy reversal one of the most common surgeries performed in pedi-atric patients. At times colostomy is inevitable and is lifesaving in some cases however it has its own associ-ated substantial morbidity and mortality. 1
According to pediatric literature, the data re-garding pre-op bowel preparation for colostomy re-versal is inadequate. 2 Some surgeons are in favor of bowel preparation while others are against it 3. Even significant variation exist in the use of bowel prepa-ration methods among pediatric surgeons. 4 Although
the use of mechanical bowel preparation (MBP) alone remains the preferred approach for most procedures, an increasing number of surgeons report abandoning this approach in favor of dietary modification alone or no preparation at all. 5 A bowel preparation agent con-sisting of polyethylene glycol (PEG) can be used safe-ly in pediatric patients. 6 But some authors argue that children have poor compliance, cannot tolerate PEG and sometimes it has to be given by NG tube which although discomforting 2 but is more safe. 7 -------------------------------------------------------------------------------------------Preoperative bowel preparation is safer and effective before colostomy closure.------------------------------------------------------------------------------------------- Preoperative bowel preparation is performed in stoma reversal with the aim to reduce fecal and bacte-rial load.8 Bowel cleansing is done either mechanically, chemically or by combination of both.9 We conducted this study in an attempt to address the issue by per-forming randomized prospective controlled study to see the effectiveness of preoperative bowel preparation in pediatric patients undergoing stoma closure to re-
-------------------------------------------------------------------------------------------1.Consultant Pediatric Surgeon 2. Resident 3. Assistant Professor 4. Professor. and Head of Dept-------------------------------------------------------------------------------------------Correspondence: Dr Waheed Akhtar Consultant Pediatric Surgeon Khyber Teaching Hospital, Peshawar 0333-938-8938 drwaheedakhtar1981@gmail.com-------------------------------------------------------------------------------------------Received June’2018 Accepted: Sep’2018-------------------------------------------------------------------------------------------
ORIGINAL ARTICLE

Ophthalmology Update Vol. 16 No.4, Oct - Dec 2018 901
Bowel Preparation Vs No Preparation before Colostomy Closure in Pediatric Patients
duce post-operative complications. In this study, we divided patients for colos-tomy closure into two groups on the basis of bowel preparation with one group undergoing preparation, which we believe plays an important role in achieving low morbidity rates. Reviewing the literature shows that there is varied incidence of different complications associated with colostomy closure. Skin infection ranges from 0.4-45%, while the frequency of anastomotic leaks differs from 0 to 12.5%. Abdominal abscess, sepsis, post-opera-tive ileus and death are other problems associated with colostomy reversal in children.
MATERIAL AND METHODS This randomized controlled trial study was conducted in Department of Pediatric Surgery, Khyber Teaching Hospital, Peshawar, Pakistan from August 2015 to July 2017. Eighty-five patients aged 6 months to 16 years were included in the study. They were di-vided randomly into two groups with one getting Bow-el preparation (BP) and the other did not receive any bowel preparation (NBP). All patients were admitted in our unit, and those with any known allergy or con-traindication to polyethylene glycol, hepatic, renal or cardiopulmonary abnormality, bleeding diathesis, lo-cal skin site infections were excluded from this study. Parents’ refusal was also considered. After randomiz-ing 43 patients were included in BP group and 42 in NBP group. The preoperative bowel preparation was done in a same way for all the patients included in this study. Normal saline was used for proximal colon and distal loop wash. It is used commonly for this purpose because it is readily available and low-priced. It is iso-tonic as well, so there are less chance of physiological disturbances and electrolyte imbalances. All patients were started on a clear liquid diet and BP group patients were given intravenous fluid at a weight based maintenance rate in addition. Bow-el preparation was started for BP group 2 days before surgery with normal saline distal loop wash (20ml/kg bd) and Movicol sachet (1 half strength sachet for chil-dren up to 5 years, 2 half strength sachets for children 5-11 years and 1 full strength sachet for greater than 11 years) per oral. If the patient was unable to take the prep orally, then it was given through the NG tube. The main disadvantage of PEG is its salty taste and occa-sional symptoms, vomiting, bloating and cramping. 10 Mannitol was not used for bowel preparation to avoid excessive diarrhea electrolyte imbalances and fear of cautery explosions during surgery.11 Hypertonic saline and other bowel preparatory solutions (Oral so-dium phosphate (OSP) Oral sodium phosphate tablets Magnesium citrate Bisacodyl) have limited use in pedi-atric population. 12
Preoperative anesthesia workup was done and
patients remained NPO overnight before surgery as per anesthesia protocol. Weight based maintenance fluids were continued on the day of surgery. All patients were given intravenous ceftriaxone (50mg/kg) and metroni-dazole (10mg/kg) – 1 h prior to incision and continued for 3 to 5days post operatively. NG tube was removed and patients were started orally on the return of bowel function. The original diagnoses of the patients were: anorectal malformation (67), Hirschsprung’s disease (07), and others (11). Any complications or morbidities were noted at the time of discharge. Initial follow up was scheduled in two weeks to OPD. At 4 to 6 weeks postoperatively the patients were evaluated in OPD to determine postoperative progress and to assess for any complications.
RESULTS A total of 85 patients were included in the study. Out of these, 51.8% (n=44) were males while 48.2% (n=41) were females. The age of the patients ranged from 06 months to 16 years (mean: 3.38 ± 2.84 years) mean length of stay was (5.58 ± 2.27 days) post-oper-atively. There was no mortality reported in this study with a mean follow up of (32.6 ± 3.24 days). The most common preoperative diagnosis was anorectal malformation total of 78.8% (n=67) including 41.9% (n=34) in the bowel prep group and 40.7% (n=33) in the no bowel prep group. Second most common disease was Hirschsprung’s disease total 7.2% (n=7) patients, 4.93% (n=04) in BP group and 3.7% (n=03) in NBP group.12.90% (n=11) had other diseases, 8.20% (n=07) in BP group and 4.7% (n=04) in the NBP group respec-tively. The quality of the bowel preparation was noted in each of the patients in the bowel prep group by ob-serving clear effluent per rectally and proximal stoma site, all with satisfactory preps.
TABLE.1 Overall complication rate in both groups
There was a significant difference in overall complica-tion rates between the bowel prep and no bowel prep groups, with no=15 (35.70%) post-operative compli-

Ophthalmology Update Vol. 16 No.4, Oct - Dec 2018902
Bowel Preparation Vs No Preparation before Colostomy Closure in Pediatric Patients
cations in the NBP group while n=04 (9.30%) in BP group (p<0.003). Two (4.7%) patients in the bowel prep group suffered from post-operative wound infections, compared to 10 (23.80%) in the no bowel prep group (p<0.01). There were no intra-abdominal abscesses in the bowel prep group, and 03 (7.10%) in the no bowel prep group, requiring percutaneous drainage (p<0.63). Both groups had no sepsis or death. Two anastomot-ic leaks were found in each group (4.80%) in NBP and (4.65%) in BP (p<0.98). There were no extra-abdominal complications in either of the groups.
TABLE.2 Individual complications in BP and NBP
Table-3: Comparison of complications between NBP and BP
Complication group N Mean Std. Deviation
Std. Error Mean
P value
intra-abdomi-nal abscess
NBP 42 1.9286 .26066 .04022 0.63
BP 43 1.9535 .21308 .03249
skin infectionNBP 42 1.7619 .43108 .06652 0.01
BP 43 1.9535 .21308 .03249
anastomotic leak
NBP 42 1.9524 .21554 .03326 0.98
BP 43 1.9535 .21308 .03249
Overall compli-cations
NBPBP
42 43
1.64291.9070
.48497
.29390.07483.04482
0.003
DISCUSSION Bowel preparation has been a common practice in adult patients undergoing stoma closure.13 Despite the fact that large number of adult population based studies14,15,16 and one small single institution based study done in children have questioned the use of MBP in colorectal surgeries, yet more than 90% surgeons uti-lize MBP for colorectal surgeries in children.17
On one hand, there are studies which show that there is no significance of MBP in terms of post operative complications when compared with no bow-el preparation.4,18,19 On the other hand, there are some studies which even have shown that after bowel prepa-ration, incidence of anastomotic leak and wound infec-
tion is rather increased. Serrurier K et al did a multi-centre, retrospective study in which they compared bowel preparation versus no bowel preparation. They found that utilization of MBP led to longer hospital stay, increased incidence of wound infection while chil-dren in this had not got any extra protection from other complications.3
The results of bowel preparation in our study were encouraging in a sense that the post-operative wound infections were reduced. There were lesser rates of intra-abdominal abscess formation. However, there was no difference in rates of anastomotic leak-age between the two groups, suggesting causes other than bowel preparation. Three cases were managed by re-exploration with re-anastomosis and proximal de-functioning stoma and one of them developed chronic fistula and was managed conservatively. Both groups had the same number of anastomotic leaks and none of them led to sepsis or death. One of the important point in our study was that cases were followed prospectively. Limitation of our study includes small number of patients from which significant difference between the two approach-es cannot be established. In children the research on this topic is lim-ited. Due to this fact, the question still remained unan-swered in pediatric age group whether to do a bowel preparation or not. Those in favor of bowel preparation are using different bowel preparation regimens for sto-ma closure.
CONCLUSION In conclusion, bowel preparation is an effective method to reduce post-operative infection related com-plications in pediatric patients undergoing colostomy reversal. Recommendations: Bowel preparation should be per-formed in pediatric patients undergoing stoma rever-sal. Large multicentre prospective trials need to be done to establish the fact that whether there exist significant difference between the two approaches
REFERENCES1. Bischoff A, Levitt MA, Lawal TA, Peña A. Colostomy closure: how
to avoid complications. Ped Sur Int. 2010 Nov; 26(11):1087–1092.
2. Mansi S, Ellis CT, Phillips MR, Marzinsky A, Adamson W; Weiner T et al. Preoperative Bowel Preparation before Elective Bowel Resection or Ostomy Closure in the Pediatric Patient Population Has No Impact on Outcomes: A Prospective Randomized Study. Am Surg. 2016 Sept;82(9):801-806
3. Serrurier K, Liu J, Breckler F, Khozeimeh N, Billmire D, Gingalewski C et al. A multicenter evaluation of the role of mechanical bowel preparation in pediatric colostomy takedown. J Ped Surg. 2012 Jan;47(1):190-3
4. Breckler FD1, Fuchs JR, Rescorla FJ. Survey of pediatric surgeons on current practices of bowel preparation for elective colorectal surgery in children. Am J Surg. 2007 Mar;193(3):315-8

Ophthalmology Update Vol. 16 No.4, Oct - Dec 2018 903
Bowel Preparation Vs No Preparation before Colostomy Closure in Pediatric Patients
5. Feng C, Sidhwa F, Anandalwar S, Pennington EC, Glass C, Cameron D et al. Contemporary practice among pediatric surgeons in the use of bowel preparation for elective colorectal surgery: A survey of the American Pediatric Surgical Association. J Ped Sur. 2015 Oct;50(10):1636-40
6. Kumar A, Hussain A. Preoperative bowel preparation in children: polyethylene glycol versus normal saline. Afr J Paed Sur. 2013 Nov;10(3):235-8.
7. Metheny NA, Meert KL. Administering Polyethylene Glycol Electrolyte Solution Via a Nasogastric Tube: Pulmonary Complications. Am J Crit Care. 2017 Mar;26(2):11-17.
8. Kumar AS, Kelleher DC , Sigle GW. Bowel Preparation before Elective Surgery. Clin Col Rect Surg. 2013 Sep; 26(3):146–152.
9. Morris MS, Graham LA, Chu DI, Cannon JA, Hawn MT. Oral Antibiotic Bowel Preparation Significantly Reduces Surgical Site Infection Rates and Readmission Rates in Elective Colorectal Surgery. Ann Surg. 2015 Jun;261(6):1034-40.
10. Heetun Z, Crowley R, Zeb F, Kearns D, Brennan MH, O’Connor C. Comparison of polyethylene glycol vs sodium picosulphate vs sodium biphosphonate by efficacy in bowel cleansing and patients’ tolerability: a randomised trial.. Ir J Med Sci. 2016 Aug;185(3):629-33.
11. Askarpour S, Peyvasteh M, Dastyar AA, Javaherizadeh H. Bowel preparation for colorectal surgery: with and without mannitol. Prz Gastroenterol. 2013; 8(5):305–307.
12. Pall H. Zacur GM, Kramer RE, Lirio RA,l Manfredi M, Shah M et al. Bowel Preparation for Pediatric Colonoscopy: Report of the NASPGHAN Endoscopy and Procedures Committee. JPGN. 2014 Sep;59(3): 409–416
13. Zmora O, Wexner SD, Hajjar L, et al. Trends in preparation for colorectal surgery: survey of the members of the American Society of Colon and Rectal Surgeons. Am Surg. 2003 Feb;69(2):150–4.
14. Bucher, P., Gervaz, P., Soravia, C. et al. Randomized clinical trial
of mechanical bowel preparation versus no preparation before elective left-side colorectal surgery. Br J Surg. 2005; 92: 409–414
15. Contant, C., Hop, W., van’t Sant, H.P. et al. Mechanical bowel preparation for elective colorectal surgery: a multicenter randomized trial. Lancet. 2007; 370: 2112–2117
16. Gravante, G., Andreani, S.M., and Giordano, P. Mechanical bowel preparation for colorectal surgery: a meta-analysis on abdominal and systemic complications on almost 5,000 patients. Int J Colorectal Dis. 2008; 23: 1145–1150
17. Breckler, F.D., Rescorla, F.J., and Billmire, D.F. Wound infection after colostomy closure for imperforate anus in children: utility of preoperative oral antibiotics. J Pediatr Surg. 2010; 45: 1509–1513
18. Guenaga, K.F., Matos, D., Castro, A.A. et al. Mechanical bowel preparation for elective colorectal surgery. Cochrane Database Syst Rev. 2005; 1: CD001544
19. Aldrink JH, McManaway C, Wang W, Nwomeh BC. Randomized Pilot Study of Mechanical Bowel Preparation for Children Undergoing Elective Colorectal Surgery. Journal of pediatric gastroenterology and nutrition. 2015 Apr;60(4):503.
20. Kiran RP, Murray AC, Chiuzan C, Estrada D, Forde K. Combined preoperative mechanical bowel preparation with oral antibiotics significantly reduces surgical site infection, anastomotic leak, and ileus after colorectal surgery. Ann Surg. 2015 Sep;262(3):416-25.
Authors contributionsAkhtar W: Main idea & concept. Abdullah F: Data collection and Follow up. Imran M: Bibliography. Rehman IU: Critical review & final approval.

Ophthalmology Update Vol. 16 No.4, Oct - Dec 2018904
Frequency of Urethro-cutaneous Fistula & Meatal Stenosis Post-Snodgross Repair with Dartos Flap for Hypospadias in Children
ABSTRACTObjective: The aim is to determine the frequency of Urethro-cutaneous fistula and Meatal Stenosis over a period of one year following Snodgrass Repair for Anterior Hypospadias in children. Methodology: This prospective study was conducted in Pediatric Surgery Unit, Khyber Teaching Hospital, Peshawar, over a period of one year from January 2017 to December 2017. Patients with Anterior hypospadias (distal penile, sub-coronal, coronal) aged between 18 months to 12 years were included. Patients with previous history of hypospadias surgery were excluded from the study. Procedure was performed under general anesthesia and modified Snodgrass repair was performed. The neourethra was tubularised over 6-8Fr feeding tube used as a catheter. Tube was removed on 7th post-operative day in all cases and presence of fistula or meatal stenosis, if any, was recorded. Initial follow up was done in OPD after 1 month. The patients were then re-evaluated after 3 months to assess any of the two complications under question.Results: TIP repair was performed in 63 patients during this study. Urethro-cutaneous fistula occurred in 7(11.11%) out of 63 patients while meatal stenosis was present in 4(6.3%). None of the patients had total disruption or wound infection.Conclusion: Despite occurrence of fistula and meatal stenosis, TIP repair is a suitable method of treating patients with anterior hypospadias with low rates of complications. It has good aesthetic results and can be done successfully in children who have already been circumcised. Key Words: Hypospadias, Snodgrass repair, Urethro-cutaneous fistula, Meatal stenosis.
Farooq Abdullah MBBS1, Waheed Akhtar FCPS
2, Muhammad Imran FCPS
3,
Prof. Inayatur Rahman FCPS4
Department of Paediatric Surgery, Khyber Teaching Hospital, Peshawar
Frequency of Urethro-cutaneous Fistula & Meatal Stenosis Post-Snodgross Repair with
Dartos Flap for Hypospadias in ChildrenFarooq
Abdullah
INTRODUCTION Hypospadias, the second most common con-genital defect after undescended testes, can be de-fined as an arrest in normal development of urethra, foreskin and ventral aspect of the penis, resulting in the anomalous location of external urethral meatus and deficient foreskin.1The meatus can be located anywhere from glans up to perineum along the ven-tral aspect of the penis. The incidence is 1 out of 125 to 250 live births.2 There is about 7% occurrence of familial hypospadias.3,4
Hypospadias is broadly divided into ante-rior, middle and posterior. Anterior hypospadias is further classified into Glanular, Coronal, sub-Coro-
nal and Distal Penile Hypospadias. Middle Hypospa-dias include Mid-penile and Posterior Hypospadias include Proximal penile, Penoscrotal and Perineal.5
-------------------------------------------------------------------------------------------Despite occurrence of fistula and meatal stenosis, TIP repair is a suitable method of treating patients with anterior hypospadias with low rates of complications. It has good aesthetic results and can be done successfully in children who have already been circumcised. ------------------------------------------------------------------------------------------- Management of hypospadias has been the most controversial topic in the past as more than 300 different procedures have been described for hypo-spadias repair.6 Procedures are broadly divided into Single-stage or Staged procedures.7 Anterior Hypo-spadias are usually managed by single stage proce-dures ( Snod Gross (TIP) repair, MAGPI, MATHIEW etc.) while Posterior Hypospadias are managed by Staged procedures (AVOR BRACKA etc.).8,9,10
Snod Gross (TIP) repair is one of the most commonly performed single-stage procedure for An-terior Hypospadias.11,12 It is an easy and simple proce-
-------------------------------------------------------------------------------------------1Postgraduate Trainee.2Trainee Regitrar3Assistant Prpfessor4Prof.& HOD-------------------------------------------------------------------------------------------Correspondence: Dr. Farooq Abdullah, Peads Surgery, Khyber Teaching Hospital Peshawar Cell:0 333 - 996 - 2213 E.Mail>[email protected], Room 28, Old Doctors’ Hostel, Khyber Teaching Hospital. Peshawar-------------------------------------------------------------------------------------------Received: June’2018 Accepted Sep’2018-------------------------------------------------------------------------------------------
ORIGINAL ARTICLE

Ophthalmology Update Vol. 16 No.4, Oct - Dec 2018 905
Frequency of Urethro-cutaneous Fistula & Meatal Stenosis Post-Snodgross Repair with Dartos Flap for Hypospadias in Children
dure with good results and relatively fewer compli-cations.13. Literature review shows complication rate of 0%-53% in past however in recent studies this rate has dropped to 9% and even less due to few techni-cal modifications like dartos flap technique.14,15,16,17,18 Success rate of up to 95% has been reported in some studies.19,20
The most common complication is ure-thro-cutaneous fistula constituting more than 60% of all complications.15 Fistula have reported incidence of 0.58%-16%21,22 while that of meatal stenosis ranges from 0%-17%.6 Other complications include total dis-ruption, wound infection, urethral stricture and are lesser in frequency.6,23,24
The purpose of this study is to determine the frequency of occurrence of Fistula and Meatal stenosis post TIP Repair in our centre. Snodgrass (TIP) repair with Dartos Flap can be performed in patients having anterior hypospadi-as as a single stage procedure with fewer complica-tions and good cosmetic results.
MATERIALS AND METHODS: This cross sectional study was conducted in Pediatric Surgery Unit, Khyber Teaching Hospital, Peshawar, Pakistan over a period of one year from January 2017 to December 2017. All Patients with An-terior hypospadias (distal penile, sub-coronal, coro-nal) aged between 18 months to 12 years undergoing TIP Repair were included. Patients with previous history of hypospadias surgery were excluded from the study. After obtaining informed consent from the parents regarding this study and procedure, the patients were admitted. A detailed history and thor-ough examination was performed. Patient were kept fasting over-night. All patients underwent general anesthesia and all patients were given cefperazone/sulbactum on induction. The procedure was carried out by same sur-geon as described by Snodgrass and in all cases the neourethra was covered by dartos flap. PDS 6/0 was used as a suture material in all cases. The neourethra was tubularised over 6-8Fr feeding tube used as a catheter.The chordae usually disappeared after de-gloving the penis while for residual chordae dorsal plication was performed. Patients were continued on iv Cefperazone/sulbactum for 2 days post-operative-ly and were switched to oral Anti-biotic Co-Amox-iclav on 3rd post-operative day and continued till 10th post-operative day. Tube was removed on 7th post-operative day in all cases and presence fistula or meatal stenosis, if any, was recorded. Initial follow up was done in opd after 1 month. The patients were then re-evaluated after 3 months to assess any of the two complications under question i.e. fistula forma-tion and meatal stenosis. These were documented in a
predesigned proforma for each patient. All data was analyzed by usingSPSS version 20.
RESULTS: Total of 63 patients underwent TIP Repair during this period. Patients were evaluated for Mean operating time and age as well as postop complications. Mean operative time in minutes was 41.82 ± 6.67 with the minimum time of 30 minutes and maximum of 55 minutes. Mean age was 4.17 ± 2.24 in years ranging from 18 months to 12 years. Urethro-cutaneous fistula occurred in 11.11% (n=7) out of 63 patients. 3 fistulae were present on the removal of stent. 4 patients presented with fistulae on the 1st follow up after 1 month. Meatal stenosis was present in 6.3% (n=4). None of the patients had total disruption or wound infection.Table.1 Age-wise distribution of urethro-cutaneous fis-tula.
Age Yes No Total 1.5-3 years 1 (3.3%) 29 (96.7%) 30 (47.6%)4-8 years 3 (11.11%) 24 (88.89%) 27 (42.8%)8-12 years 3 (50%) 3 (50%) 6 (9.5%)All age groups
7 (11.11%) 56 (88.89%) 63 (100%)
Table.2 Age-wise distribution of meatal stenosis.Age Yes No Total 1.5-3 years 1 (3.3%) 29 (96.6%) 30 (47.6%)4-8 years 2 (7.4%) 25 (92%) 27 (42.8%)
8-12 years 0 (0%) 6 (100%) 6 (9.5%)All age groups 4 (6.3%) 59 (93.7%) 63 (100%)
DISCUSSION: Post-operative complications is a possibil-ity after any sort of surgical procedure.24 In case of hypospadias repair, the existence of more than 300 different types of surgical procedures indicates that the complication rates are much higher after hypo-spadias repair.25 The overall complications rate rang-es from 6 to 30% in different types of hypospadias repair.24
Snod Gross repair is the most commonly per-formed surgery for Anterior hypospadias. It is a sim-ple, easily performed surgery with relatively good cosmetic results and can be performed in patients who have already been circumcised.26,27 The overall complication rate of this procedure ranges from 0 to 50%.14,15,16,17,18
The most common complication is Ure-thro-cutaneous fistula (UCF), with the reported in-cidence of 3-33%.6Several factors determine the oc-currence of this complication following hypospadias
Ophthalmology Update Vol. 16 No.4, Oct - Dec 2018906
Frequency of Urethro-cutaneous Fistula & Meatal Stenosis Post-Snodgross Repair with Dartos Flap for Hypospadias in Children
repair. These include type of hypospadias, surgical technique, penile size, age, experience of operating surgeon as well as the type of suture material used. Recently the types of operations used for hypospadi-as repair have been greatly reduced, due to increased understanding of these factors.28,29
Different factors as mentioned above plays a key role to prevent this complication. In our study we tried to standardize these factors using same suture material, same surgeon and same surgical technique i.e. Snodgrass repair with dartos flap. The use of dar-tos flap has been reported to reduce the rate of fistula occurrence. In some centres this frequency has dropped to 2.5% however most of the centres around the world still reports the incidence ranging from 0-16%.In our study the UCF rate is 11.11%. In similar study carried out by Uzair et al the fistula rate was 9.9%13 and AhmadK reported post Snodgrass repair fistula-rate of 11.8% which is almost the same as ours.36our study also shows that the rate of urethrocutaneous fistula increases with the age of the patient. The rate of fistula was higher in the age group 8-12 years. Meatal stenosis is the other complication we encountered in our study. the reported incidence ranges from 0-17% in different studies. Snodgrass re-ported the incidence of meatal stenosis of 0-1%.40Some studies reported meatal stenosis of up to 20%.41 In our study the rate of meatal stenosis is 6.3%. The increased incidence of meatal steno-sis results from stitching the neo-urethra beyond mid-glanular level and to secure neourethra with the glans to avoid retraction resulting over-maturation of the neo-meatus, hence meatal stenosis.42 The risk can be reduced by using well vascularised dartos flap and to secure the meatus to glans only at 5 and 7 o’clock position. Meatal stenosis can also be reduced further by avoiding stitching of the neo-urethra distal to the mid-glanular level.42Selection of proper candidate for the procedure may also be an important contributory factor. Overall the complications following the mod-ified Snodgrass repair are low as compared to stan-dard Snodgrass repair. These complications can be reduced further by strictly following the protocols, handling the tissues gently and getting trained in set-ups dedicated for hypospadias repair.
CONCLUSION: Snodgrass (TIP) repair with Dartos Flap can be performed in patients having anterior hypospadias as a single stage procedure with fewer complications and good cosmetic results.
REFERENCES1. Snodgrass W. “Chapter 130: Hypospadias”. Campbell-Walsh
Urology, Tenth Edition.2012, Elsevier. pp. 3503–3536.2. Baskin LS, Himes K, Colborn T. Hypospadias and endocrine
disruption: is there a connection? Env Hlth Per. 2001 Nov; 109(11): 1175–1183.
3. Van der Horst HJR, De Wall LL. Hypospadias, all there is to know. Eur J Pediatr. 2017 Feb; 176(4): 435–441.
4. van der Zanden LF, van Rooij IA, Feitz WF, Franke B, Knoers NV, Roeleveld N. Aetiology of hypospadias: a systematic review of genes and environment. Hum Reprod Update. 2012 May-Jun; 18(3):260-83.
5. Duckett JW, Gillenwater JY, Grayhack JT, Howards SS: Hypospadias. Adult and pediatric urology, 3rd edn. 1996, pp 2550.
6. Appeadu-Mensah W, Hesse AA, Glover-Addy H, Osei-Nketiah S, Etwire V, Sarpong PA. Complications of hypospadias surgery: Experience in a tertiary hospital of a developing country. Afr J Paediatr Surg. 2015 Oct-Dec; 12(4): 211–216.
7. Badaway H, Fahmy A. Single- vs. multi-stage repair of proximal hypospadias: The dilemma continues. Arab J Urol. 2013 Jun; 11(2): 174–181.
8. Elsayed T, Dawod, Abdalla M, Teleb A et al. One-stage lingual augmented urethroplasty in repair of distal penile hypospadias. Afr J Urol. 2015 Mar; 21(1):06-09.
9. Joshi RS, Bachani MK, Uttarwar AM, Ramji JI. The Bracka two-stage repair for severe proximal hypospadias: A single center experience. J Indian Assoc Pediatr Surg 2015; 20:72-76.
10. Shukla AK, Singh AP, Sharma P, Shukla J. Two stages repair of proximal hypospadias: Review of 700 cases. J Indian Assoc Pediatr Surg 2017; 22:158-162.
11. Snodgrass WT, Bush N, Cost N. J Pediatr Urol. Tubularized incised plate hypospadias repair for distal hypospadias. 2010 Aug; 6(4):408-413.
12. Ibrahim IA. Modified Tubularized incised plate urethroplasty for distal hypospadias without chordate. J Am Sci. 2013 Sept; 9(10):140-145.
13. Uzair M, Ahmad M, Hussain M, Younus M, Khan K. Frequency of urethrocutaneous fistula following Snodgrass hypospadias repair in children. J Postgrad Med Inst 2013; 27(1):74-77.
14. Snodgrass W, Yucel S. Tubularized incised plate for mid shaft and proximal hypospadias repair. J Urol. 2007 Feb; 177(2):698-702.
15. Basavaraju M, Balaji DK. Choosing an ideal vascular cover for Snodgrass repair. Urol Ann 2017 Oct; 9(4):348-352.
16. Abolyosr A. Snodgrass hypospadias repair with onlay overlapping double-layered dorsal dartos flap without urethrocutaneous fistula: experience of 156 cases. J Pediatr Urol. 2010 Aug; 6(4):403-407.
17. Snodgrass W, Bush N. Primary hypospadias repair techniques: A review of the evidence Urol Ann. 2016 Oct-Dec; 8(4): 403–408.
18. Aslam R, Campbell K, Wharton S, Bracka A. Medium to long term results following single stage Snodgrass hypospadias repair. J Plast Reconstr Aesthet Surg. 2013 Nov; 66(11):1591-1595.
19. Snodgrass WT, Khavari R. Prior circumcision does not complicate repair of hypospadias with an intact prepuce. J Urol. 2006 Jul; 176(1):296–298.
20. Snodgrass WT, Koyle MA, Baskin LS, Caldamone AA. Foreskin preservation in penile surgery. J Urol. 2006 Aug; 176(2):711–714.
21. Cheng EY, Vemulapalli SN, Kropp BP, Pope JC, Furness PD, Kaplan WJ, et al. Snodgrass hypospadias repair with vascularised dartos flap: the perfect repair for virgin case of hypospadias. J Urol 2002; 168:1723-1726.
22. Akmal M, Javed SH, Subhani GM, Jafari AA, Ashraf N, Hussain M, et al. Hypospadias Urologe A. 2007 Dec;46(12):1664-1669.
23. Pfistermuller KL, McArdle AJ, Cuckow PM. Meta-analysis of complication rates of the tubularized incised plate (TIP) repair. J Pediatr Urol. 2015 Apr;11(2):54-59.
24. Mandal AK, Amilal B. Acute postoperative complications of hypospadias repair. Indian J Urol. 2008 Apr-Jun; 24(2): 241–248.

Ophthalmology Update Vol. 16 No.4, Oct - Dec 2018 907
Frequency of Urethro-cutaneous Fistula & Meatal Stenosis Post-Snodgross Repair with Dartos Flap for Hypospadias in Children
25. Altarac S, Pape D, Bracka A. Surgery Illustrated – Surgical Atlas Two-stage hypospadias repair with inner preputial layer Wolfe graft (Aivar Bracka repair). BJU INTERNATIONAL. 2012: 110, 460–473.
26. Rashed FK, Gholizade R. Comparison of Distal Hypospadias Repair in Circumcised Patients and Uncircumcised Patients. ISRN Urol. 2013 Feb; 3 pages
27. Snodgrass WT, Khavari R. Prior circumcision does not complicate repair of hypospadias with an intact prepuce. J Urol. 2006 Jul; 176(1):296-298.
28. Jan IA, Mirza F, Yaqoot, Ali M, Arian A, Saleem N, Ahmad, Kumar D. Factors influencing the results of surgery for hypospadias: experience at NICH. J Pak Med Assoc. 2004 Nov; 54(11):577-579.
29. Viseshsindh W. Factors affecting results of hypospadias repair: single technique and surgeon. J Med Assoc Thai. 2014 Jul;97(7):694-698.
30. Yiğiter M, Yildiz A, Oral A, Salman AB. A comparative study to evaluate the effect of double dartos flaps in primary hypospadias repair: no fistula anymore. Int Urol Nephrol. 2010 Dec; 42(4):985-990.
31. Retik AB, Mandell J, Bauer SB, Atala A. Meatal Based Hypospadias Repair with the Use of a Dorsal Subcutaneous Flap to Prevent Urethrocutaneous Fistula. The J Urol. 1994 Oct; 152(4):1229-1231.
32. Imamoglu MA, Bakirtas H. Comparison of two methods -Mathieu and Snodgrass - in hypospadias repair. Urol Int. 2003; 71(3):251–254.
33. Anwar-ul-haq, Akhter N, Nilofer N, Samiullah, Javeria J. Comparative study of Mathieu and Snodgrass repair for anterior hypospadias. J Ayub Med Coll Abbottabad. 2006 Apr-Jun;
18(2):50–52.34. Guo Y, Ma G, Ge Z. Comparison of the Mathieu and the
Snodgrass urethroplasty in distal hypospadias repair. Nat J Androl. 2004 Dec; 10(12):916–918.
35. Oswald J, Korner I, Riccabona M. Comparison of the perimeatal-based flap (Mathieu) and the tubularized incised-plate urethroplasty (Snodgrass) in primary distal hypospadias. BJU Int. 2000 Apr; 85(6):725–727.
36. Khairi A. Snodgrass repair for distal hypospadias: a review of 75 cases. Ann Pediatr Surg 2012 Sept; 8(1):12-14.
37. Braga LH1, Lorenzo AJ, Salle JL. Tubularized incised plate urethroplasty for distal hypospadias: A literature review. Indian J Urol. 2008 Apr; 24(2):219-225.
38. Jayanthi VR. The modified Snodgrass hypospadias repair: reducing the risk of fistula and meatal stenosis. J Urol. 2003 Oct; 170(4):1603-1605.
39. Shoeib MA. Snodgrass Repair of Hypospadias (10 years experience of a Modified Technique). Anaplastology.2015 Nov; 5 (1):155-157.
40. Snodgrass W. Does tubularized incised plate hypospadias repair create neourethral strictures? J Urol. 1999 Sep; 162(3):1159-1161.
41. Tonvichien L, Niramis R. Tubularized, incised plate urethroplasty in hypospadias repair: experience at Queen Sirikit National Institute of Child Health. J Med Assoc Thai. 2003 Aug; 86(3):522-530.
42. Alsharbaini R, Almaramhy H. Snodgrass urethroplasty for hypospadias repair: A retrospective comparison of two variations of the technique.JrnlTbhUniv Med Sci. 2014 Mar;9(1):69-73
**************************************Anti-VEGF treatment may not stop diabetic retinopathySusan Bressler, MD, Johns Hopkins Medicine in Baltimore
Vascular endothelial growth-factor (VEGF) inhibitors do not necessarily stop the progression of diabetic retinopathy in people with macular edema, new research shows. some people who aren’t improved at all, and their level of retinopathy may worsen, aflibercept might be more effective for the proliferative form of the disease. Previous research has shown that retinopathy is less likely to worsen and is more likely to improve after treatment with ranibizumab (Lucentis, Genentech) or aflibercept (Eylea, Regeneron) than after treatment with laser photocoagulation. The same appears true for bevacizumab (Avastin, Genentech), but the data available are not as strong. Dr Bressler presented results from a preplanned secondary analysis of the Diabetic Retinopathy Clinical Research Network Protocol T trial, comparing the three drugs in patients with diabetic , macular edema, here at the American Society of Retina Specialists 2017 Annual Meeting. In their study, Dr Bressler and her colleagues assessed 650 eyes with diabetic macular edema and vision impairment. Patients were randomly assigned to one of three treatment regimens for 2 years: 174 patients received aflibercept 2 mg, 168 received ranibizumab 0.3 mg, and 153 received bevacizumab 1.25 mg up to 4 weeks. The team used clinical events and fundus photos to identify disease progression. The clinical events consisted of pan-retinal photocoagulation, vitrectomy or injections for proliferative diabetic retinopathy, vitreous hemorrhage, retinal detachment, neovascularization of the iris, neovascularization of the angle, and neovascular glaucoma. The fundus photo observations consisted of a worsening of two or more levels on the ETDRS retinopathy scale, progression from nonproliferative to proliferative diabetic retinopathy, and progression from low to high-risk proliferative diabetic retinopathy or to advanced proliferative diabetic retinopathy. The team defined improvement as the absence of these signs of worsening and improvement on fundus photos. If a patient had active proliferative diabetic retinopathy at baseline, it had to become inactive or nonproliferative. Other degrees of retinopathy had to improve by at least two levels. Over the 2-year period, the cumulative probability of diabetic retinopathy worsening in the three groups was less than 10%, and there was no significant difference among the drugs.
**************************************

Ophthalmology Update Vol. 16 No.4, Oct - Dec 2018908
Evaluation of Vertical Skeletal Changes Consequent to Maxillary Molars Distalization with Distal Jet Appliance
ABSTRACT:Objective: to evaluate the mean increase in vertical skeletal pattern that occurs after Distalization by using distal jet appliance in class-II malocclusion patients. It was a Quasi experimental trialAt the Department of Orthodontics, Nishtar Institute of Dentistry, de’Montmorency College of Dentistry and Punjab Dental Hospital. Study duration was from June 2014 to January 2017.Methodology: A total of 40 patients were enrolled in this study from multiple centers of Punjab. The recorded data was entered and analyzed using SPSS version 23. Quantitative data like age and baseline measurements (P1) of vertical skeletal pattern (i.e. FMAº , SN.Gnº , SN.MPº) and after Distalization measurements (P2) were presented in the form of mean ±S.D. qualitative variables like gender were presented in the form of frequency and percentage. A P-value of less than 0.05 will be considered significant. Results: A total of 40 patients with Angle’s class II malocclusion with mean age of 13.15±0.60 years were included in this study. The minimum age was 12 years while maximum age was 14 years. The mean decrease in PTVMax. 1st Molar Centroid was 3.63±0.81mm. The figure showing that maximum number of patients showed decreased at 38mm. The mean increase in PPMax. 1st Molar Centroid was 0.69±0.36mm. The figure showing that maximum number of patients showed an increase of 0.5- 0.75mm. The mean increase in FMA was 1.13±0.81o. The figure showing that maximum number of patients showed an increase of 0.5-1.5 degrees. Conclusion: Our study was focused only on the skeletal changes occurred in vertical pattern of patients who were with low to normal vertical proportions at the start of treatment.Keywords: Distalization, Distal Jet Appliance, Malocclusion, Skeletal Pattern.
M. Zain-ul-Abideen BDS1. Saba Habib.BDS2. Fizza Hafeez.BDS3 Sohail Fareed BDS, FCPSNishtar Institute of Dentistry, Multan
Evaluation of Vertical Skeletal Changes Consequent to Maxillary Molars Distalization
with Distal Jet Appliance
INTRODUCTION: The most common presentation for orthodon-tic treatment is class-II malocclusion frequently accom-panied by a class-II molar relationship. The primary goal of orthodontic treatment is to achieve an ideal oc-clusion that involves molars in class-I relationship.1
According to Moyers et. al. type A class-II malocclusion is characterized by absence of skeletal involvement, requiring Distalization of maxillary teeth for normal molar and incisor relationships without changing favorable skeletal relationship.2 Distalization of maxillary molars is a popular non-extraction treat-ment alternative in some patients with class-II maloc-clusion.3
There are numerous methods to move teeth distally; some require patient’s active compliance whereas others donot.3 Extra-oral traction with head-gears, removable appliances with springs, and class-II intermaxillary elastics are highly compliance depen-dent. Non-compliance methods include a variety of
intramaxillary appliances e.g. Jones jig, distal jet, pen-dulum appliance, frog appliance, Keles slider, repelling magnets, compressed coil springs, molar distalizing bows and currently orthodontic implant supported dis-talizing appliances.4-5 Non-compliance appliances are superior to those demanding co-operation. Distal jet is one of the most popular and effective distalizing appli-ance.3Clinical studies on distal jet have confirmed the mesial-inward rotation, distal tipping and Distalization of maxillary molars.6,1 Distal jet also leads to mild ex-trusions and distal tipping of molar crowns leading to backward rotation of the mandible.2
-------------------------------------------------------------------------------------------The skeletal changes occur in vertical pattern of pa-tients who had low to normal vertical proportions at the start of treatment.------------------------------------------------------------------------------------------- Molar Distalization is contraindicated in hy-perdivergent patients because when maxillary molars are distalized into the wedge of occlusion, they will prop open the bite. This effect along with backward ro-tation of mandible leads to increase in vertical dimen-sion, especially in high angle cases. A previous study has observed increase in vertical skeletal pattern with increase in measurements of FMA 0.99O ± 0.15 O, NS.Gn 0.46 O ± 0.24 O and SN.MP. 0.47 O ± 0.40 O.2
The rationale of this study is to evaluate the in-
-------------------------------------------------------------------------------------------1.2.3.House Officers. 4. Senior Registrar-------------------------------------------------------------------------------------------Corresponding Author: Dr Muhammad Zain-ul-Abideen, House Officer Nishtar Institute of Dentistry, Multan, Email: [email protected], Cell No. 0316 8435789-------------------------------------------------------------------------------------------Received: June’2018 Accepted: August’2018-------------------------------------------------------------------------------------------
Zain-ul-Abideen
ORIGINAL ARTICLE

Ophthalmology Update Vol. 16 No.4, Oct - Dec 2018 909
Evaluation of Vertical Skeletal Changes Consequent to Maxillary Molars Distalization with Distal Jet Appliance
crease in vertical skeletal pattern that occurs as a side effect of Distalization with distal jet appliance. We want to work on this project so that an efficient and better treatment planning can be devised in class-II malocclu-sion especially in patients with already increased verti-cal dimensions.
METHODOLOGY: This Quasi experimental trial was conducted and completed in department of Orthodontics, Nishtar Institute of Dentistry, de’Montmorency College of Den-tistry and Punjab Dental Hospital. Study was started after permission from ethical board of NID. Consent was obtained from patients after complete information and purpose of their inclusion in research. Sample size was calculated from online source openepi.com by us-ing 95% CI, 80% study power and increase in measure-ments of FMA 0.99O ± 0.15 O, NS.Gn 0.46 O ± 0.24 O and SN.MP. 0.47 O ± 0.40 .2 and the subjects with age range 12-14year. Bilateral angle class-II malocclusion (3mm/End-on C-II molars), and the cases with half cusp or end-on C-II molar relationship were selected clinically on intra-oral examination and also by confirming the molar relationship from diagnostic models after taking wax bite registration in centric occlusion fulfilling the C-II molar relationship criteria by angle. The sample in this study was considered Class-II if 3mm or more dis-crepancy existed between the mesio-buccal cusp of the maxillary first molar and buccal groove of the mandib-ular first molar. Mild skeletal class-II with ANB 4-5 degrees. A mandibular arch was planned for non–extraction treatment where there was no arch length discrepancy or mild crowding, maxillary arch length discrepancy ranged between 5-7 mm. Soft tissue profiles did not per-mit any extraction therapy. IMPA normal of 90 degrees with minor deviations and normal curve of Spee. Nor-mal or low angle vertical pattern with SN-mandibular angle 32 degrees or less. Class-II division I with mild or up to 5mm proclination Class-II division II with mild crowding. All second molars especially maxillary sec-ond molars fully erupted into the occlusion. No other orthodontic treatment or molar distalization procedure performed before or during the study. Good oral hy-giene and commitment to maintain proper oral health care were included. Patients with mixed dentition, ex-cessive proclination of anterior teeth, an end-on or full class II molar relationship due to retrognathic mandi-ble, TMJ problems,Cross bites, severe carious lesions, mobility of the maxillary deciduous second molars, flat palate, ectopic maxillary canines, anterior open bites, vertical growth pattern, parafunctional/tongue habits were excluded from the study. Based on selection criteria, a complete set of baseline pretreatment records including history, clin-ical examination, Lateral cephalometric radiograph, OPG, upper/ lower study casts, extra-oral and in-tra-oral photographs were taken for each patient and
same records were repeated after distalization. Lateral cephalograms (lateral Ceph) were used as diagnostic aid to evaluate changes in the vertical di-mensions with distalization. The predistalization later-al cephalograms (P1) were the part of base line record and were taken under standardized conditions at Ra-diology Department of Punjab Dental Hospital. The post-distalization lateral cephalograms (P2) were taken under same conditions after the achievement of desired distalization. The data were evaluated and in SPSS ver-sion 23.0. Quantitative data like age and baseline mea-surements (P1) of vertical skeletal pattern (i.e. FMAº , SN.Gnº , SN.MPº) and after distalization measurements (P2) were presented in the form of mean ±S.D. Qualita-tive variables like gender were presented in the form of frequency and percentage. Mean increase in vertical skeletal pattern was obtained by subtracting post dis-talization measurements from baseline. A p-value of less than 0.05 will be considered significant.
RESULTS A total of 40 patients with Angle’s class II malocclusion with mean age of 13.15±0.60 years were included in this study. The minimum age was 12 years while maximum age was 14 years 9.There were 17(42.5%) male patients while 23(57.5%) were females (Table-1). The patients were assessed clinically and ra-diographically and underwent distalization. Pre and post distalization lateral cephalometric analysis was done and values were calculated in millimeter and de-grees. The mean PTVMax. 1st Molar Centroid was 21.67±1.66mm at baseline which was decreased to 18.04±1.84mm after distalization. The mean decrease in this linear measurement was 3.63±0.81mm. There was significant decrease in PTV Max. 1st Molar Centroid after distalization (P<0.05) This reflects the mean mea-surement of distalization. The mean PPMax. 1st Molar Centroid was 17.03±1.22mm at baseline which was increased to 17.73±1.32mm after distalization. The mean increase in this linear measurement was 0.70±0.36mm. There was significant increase in PP Max. 1st Molar Centroid after distalization (P<0.05) (This reflects the mean measure-ment of vertical dental (extrusion of maxillary 1st mo-lar) change secondary to distalization. The mean FMA was 24.66±3.10o at baseline which was increased to 25.79±3.03o after distalization. The mean increase in FMA angle was 1.13±0.81o. There was significant increase in FMA after distalization (P<0.05) The mean NS-Gn was 65.37±2.39o at baseline which was increased to 66.51±2.24o after distalization. The mean increase in NS-Gn angle was 1.14±0.59o. There was significant increase in NS-Gn after distaliza-tion (P<0.05) The mean SN-MP was 32.70±3.96o at base-line which was increased to 33.83±3.85o after distaliza-tion. The mean increase in SN-MP angle was 1.13±0.66o. There was significant increase in SN-MP after distaliza-

Ophthalmology Update Vol. 16 No.4, Oct - Dec 2018910
Evaluation of Vertical Skeletal Changes Consequent to Maxillary Molars Distalization with Distal Jet Appliance
tion (P<0.05) All these values also represent an increase in vertical skeletal change consequent to maxillary mo-lar distalization. The mean decrease in PTVMax. 1st Molar Centroid was 3.63±0.81mm. The figure showing that maximum number of patients showed decreased at 38mm. The mean increase in PPMax. 1st Molar Centroid was 0.69±0.36mm. The figure showing that maximum number of patients showed an increase of 0.5- 0.75mm.The mean increase in FMA was 1.13±0.81o. The figure showing that maximum number of patients showed an increase of 0.5-1.5 degrees.The mean increase in NS-Gn was 1.14±0.59o.
DISCUSSION: The primary goal of orthodontic treatment is attainment of an “ideal occlusion”, this involves mo-lars placement in class I relationship, which was first defined by Angle and later redefined by Andrews. Studies regarding isolated vertical skeletal changes af-ter maxillary molar distalization with distal jet in our community are limited. Symptoms associated with An-gle’s. Class II malocclusion are the common complaints of patients which compel them to present to orthodon-tists for treatment and accounts for about in 15% to 40% of population.7
Our study was focused only on the skeletal changes occurred in vertical pattern of patients who were with low to normal vertical proportions at the start of treat-ment. These changes are similar but slightly differ from other studies carried out with same appliance. The findings of study conducted by Ngantung V et al. showed distalization of 2.12 ±1.84 and extrusion of mo-lars (PP-maxillary first molar centroid) 0.01 ±1.72, in-
crease in Lower anterior face height (%) 0.55 ± 1.10 and FMA angle 0.43 ± 1.59(°).8Bolla et al. study showed 3.2 mm maxillary first molar distalization with 1.3˚ distal tipping and 0.9mm molar extrusion.9 Maxillary molar distalization achieved by other distalizing devices such as pendulum appliance and intraoral bodily molar dis-talizer showed greater magnitude of molar distaliza-tion but with more tipping. The results of. Ghosh and Nanda, showed 5.7 mm molar distalization, 10.6˚ distal tipping and 0.7 mm extrusion.10 Keles and Sayinsu eval-uated the effects of intraoral bodily molar distalizer and concluded 5.23 mm maxillary first molar distalization without any tipping or extrusion.11
A study conducted with distal jet in the same center showed 3.88 mm distalization during 7.11 months with 0.20mm extrusion of maxillary first mo-lars.12 Another study has shown that the increase in vertical skeletal pattern with the mean increase in FMA of 0.99 ± 0.15o, NS.Gn of 0.46 ± 0.24o and SN.MP of 0.47 ± 0.40o.2 These findings are also compatible with our study showing that vertical change occurred as mean increase in vertical dimension by moving mandible downward and backwards. In a study by Chiu et al, upper first molars were extruded 0.5-1.0 mm which is greater extrusion than our study and also showed a significant mean increase in lower anterior facial height (ANS to Me) 2.4-2.5 mm and mean increase in FMA (FH to mandibular plane) was 0.7°-1.3° which is almost same as in our study.13
In a recent retrospective study, maxillary first molars were distalized 2.16 ± 0.84 mm and a significant clockwise rotation of the mandible i.e. 1.97° ± 1.32° and a significant increase in lower anterior facial height 3.35 ± 1.48 mm was observed but these changes in ver-
Table-1Demographic variablesCharacteristics M e a n ± S DAge 1 3 . 1 5 ± 0 . 6 0Male 17.15 (42.5%)Female 2 3 ( 5 7 . 5 % )
Table-2 Descriptive StatisticsP T V a t b a s e l i n e PTV after distalization P T V d e c r e a s e P - V a l u e2 1 . 6 7 ± 1 . 6 6 1 8 . 0 4 ± 1 . 8 4 3 . 6 3 ± 0 . 8 1 0 . 0 0 0P P a t b a s e l i n e PP after distalization P P i n c r e a s e P - V a l u e1 7 . 0 3 ± 1 . 2 2 1 7 . 7 3 ± 1 . 3 2 0 . 7 0 ± 0 . 3 6 0 . 0 0 0F M A a t b a s e l i n e FMA after distalization F M A i n c r e a s e P - V a l u e2 4 . 6 6 ± 3 . 1 0 2 5 . 7 9 ± 3 . 0 3 1 . 1 3 ± 0 . 8 1 0 . 0 0 0
Table-3 Descriptive StatisticsNS-Gn at baseline NS-Gn after distalization N S - G n i n c r e a s e P v a l u e6 5 . 3 7 ± 2 . 3 9 6 6 . 5 1 ± 2 . 2 4 1 . 1 4 ± 0 . 5 9 0 . 0 0 0SN-MP at baseline SN-MP after distalization S N - M P i n c r e a s e P v a l u e3 2 . 7 0 ± 3 . 9 6 3 3 . 8 3 ± 3 . 8 5 1 . 1 3 ± 0 . 6 6 0 . 0 0 0

Ophthalmology Update Vol. 16 No.4, Oct - Dec 2018 911
Evaluation of Vertical Skeletal Changes Consequent to Maxillary Molars Distalization with Distal Jet Appliance
tical dimensions had a negligible impact on clinical ap-pearance.14
Recently Cozzani M. et al. did a comparative study on distal jet by comparing skeletally anchored (DS) with convetional distal jet (DJ). The findings showed maxillary molar distalization 4.7 ± 1.6 mm with the skeletal anchored (DS) and 4.4 ± 2.5 mm with con-ventional distal jet (DJ) in full cusp class II patients. Mo-lar extrusion with respect to the palatal plane (PPU6), was similar almost between the two groups 0.7 ± 1.9 mm in the DS group and 0.4 ± 2.5 mm in the DJ group.15
Vertical skeletal variables included in our study are very important baseline angular cephalo-metric findings regarding diagnosis, treatment plan-ning and prognosis of an orthodontic treatment. Our study has shown a significant increase in these three measurements which results in increase in vertical skel-etal dimensions after distalization. Increase in vertical skeletal pattern results in increase in facial proportions which is esthetically unpleasant especially in those in-dividuals who are having tendency towards high angle and also worsen the class II malocclusion by rotating the mandible downwards and backwards.16
In our study mean age was 13.15 months, at this age boys are usually at their growing age so individuals who are growing at the start of treatment with vertical-ly low to normal angle can compensate the vertical skel-etal change which occurs as a result of distalization by increase in mandibular ramus height with growth and end up with no clinically significant vertical change.17
Our study was dependent on variable ana-tomical points like sella, nasion, porion and orbitale on cephalometrics. These points were the baseline for man-dibular plane and Frankford horizontal plane construc-tion which could result in incorrect conclusion from the analysis. These angular measurements directly de-pend on the orientation of the mandibular plane with reference to sella-nasion plane and Frankfort horizontal plane. There are many previous studies which include vertical skeletal linear measurements like lower anteri-or facial height which in most of the studies increased after distalization. When S point is positioned down-wards, the inclination of SN plane will be increased and appeared to be large SN-MP angle and Y-axis even than mandibular plane is at normal inclination, while lower anterior facial height is independent of SN plane.18
CONCLUSION: Our study was focused only on the skeletal changes occurred in vertical pattern of patients who were with low to normal vertical proportions at the start of treatment. Therefore, the results of this study provide guidance for selection of patients with class II malocclusion for distalization of molars. Moreover, cross comparative and randomized control trials with larger sample size are required to further explore this topic to develop final conclusion in this regard.
REFERENCES:1. Emina Čirgić, Heidrun Kjellberg, Ken Hansen. Treatment
of large overjet in Angle Class II: division 1 malocclusion with Andresen activators versus prefabricated functional appliances—a multicenter, randomized, controlled trial. Euro J Orthodont. 2016;38(5):516–524.
2. Heemanshu R, Vilas D, Samrit, Om Prakash Kharbanda. The extraction of maxillary lateral incisors for the treatment of a Class II crowded malocclusion: a case report. Aust Orthod J. 2015;31:107–115.
3. Chan E, Darendeliler. The Invisalign® appliance today: A thinking person’s orthodontic appliance. Semin in Orthodont. 2017;23(1):12-64.
4. Jacques L. Upper Arch Molar Distalization Appliances in Treatment of Class II Malocclusion: A Critical Analysis. IJO. 2016;27(3):1-8.
5. Ludwig B, Glasl B, Kinzinger GSM, Walde KC, Lisson JA. The Skeletal Frog Appliance for Maxillary Molar Distalization. J Clin Orthod 2011; XLV (2): 77-84.
6. Marure PS. Patil RU, Reddy S, Parakash A. The effectiveness f pendulum, K-loop, and distal jet distalization technique in growing children and its effects n anchor unit: A comparative study. J Indian Soc Pedod Prev Dent. 2016;34:331-40.
7. Caprioglio A, Cafagna A, Fontana M, Cozzani M. Comparative evaluation of molar distalization therapy using pendulum and distal screw appliances. Korean J Orthod. 2015;45(4):171-179.
8. Ngantung V. Nanda RS. Posttreatment evaluation of the distal jet appliance. Am J Orthod Dentofacial Orthop. 2001; 120: 178-85.
9. Bolla E, Muratore, F, Carano A, and Bowman S.J: Evaluation of maxillary molar distalization with the Distal jet: A comparison with other contemporary methods. Angle Orthod2002; 72: 481-94.
10. Ghosh J, Nanda RS. Class-II, division 1 malocclusion treated with molar distalization therapy. Am J Orthod Dentofac Orthop 1996; 110: 672- 7.
11. Keles A, Sayinsu K. A new approach in maxillary molar distalization: Intraoral bodily molar distlalizer. Am J Orthod Dentofac Orthop 2000; 117: 39-48.
12. Haq AU, Hamid MWU, Chaudhry NA, Latif R. Effects of distal jet appliance in class-ii molar correction. Pakistan Oral & Dent J 2010; 30: 146-53.
13. Chiu PP, McNamara JA, Franchic L. A comparison of two intraoral molar distalization appliances: Distal jet versus pendulum. Am J Orthod Dentofacial Orthop 2005; 128:353- 65.
14. Fontana M, Cozzani M, Caprioglio A. Soft tissue, skeletal and dentoalveolar changes following conventional anchorage molar distalization therapy in class II Non-growing subjects: a multicentric retrospective study. Progress in Orthodontics. 2012; 13: 30-41.
15. Cozzani M, Pasini M, Zallio F, Ritucci R, Mutinelli S, Mazzotta L, Giuca MR, et al. Comparison of Maxillary Molar Distalization with an Implant-Supported Distal Jet and a Traditional Tooth-Supported Distal Jet Appliance. Int J Dent. 2014; 2: 1-7.
16. Sfondrini MF, Cacciafesta V, Sfondrini G. Upper molar distalization: a critical analysis.Orthod Craniofacial Res 2002; 5: 114–26.
17. Samson GS, Hechtkopf MJ. Special Report: Supervision of Class II discrepancies. J Pediatr Dent 1988; 10: 338-41.
18. Steiner CC. The use of cephalometrics as an aid to planning and assessing orthodontic treatment. Am J Orthod 1960; 46: 721.
19. Samson GS, Hechtkopf MJ. Special Report: Supervision of Class II discrepancies. J Pediatr Dent 1988; 10: 338-41.
20. Steiner CC. The use of cephalometrics as an aid to planning and assessing orthodontic treatment. Am J Orthod 1960; 46: 721.

Ophthalmology Update Vol. 16 No.4, Oct - Dec 2018912
Management of Tibial Plateau Fracture
ABSTRACT:Background: Tibial plateau fractures are one of the most challenging problems in orthopaedic surgery. Fractures of the tibial plateau, intra-articular injuries of the knee joint are often complex, difficult to treat and have a high complication rate. The Ilizarov technique solves many problems encountered in management of such fractures and provides a method for closed reduction and fixation that does not necessitate excessive soft-tissue stripping, protecting vascularity, emphasize restoring both joint congruity and the mechanical axis of the limb.Objectives: The main objective of this study is to evaluate functional outcome of tibial plataeu fractures using Ilizarov external fixator .Materials and Methods: This study was conducted in Department of Orthopedics and Trauma, Hayatabad Medical Complex and Khyber Teaching hospital, Peshawar from January 2016 till December 2017.Results: 20 patients were treated, 12 (60%) were male and 8 (40%) female. The mean age was 33.6 years (range: 18 to 54 years). All patients were followed up was 9.6 months (range 7-12) months. Fractures healed with no occurrence of nonunion. Fracture healing time was 12-18 weeks with an average of 14.05 weeks. The time of external fixator removal on average was 17.9(range of 15-22 weeks). The complications which are observed in patients were pin track infection (k-wire and Shawn pin), knee stiffness, enquinus deformity of foot, quality of articular reduction, mal-union and poor compliance. Full weight-bearing was allowed at a mean of 5 months. Using the knee society clinical rating system, 9 knees were rated as excellent, 7 as good, one as fair, and 2 as poor. One patient was lost in follow up. Six patients achieved full extension and eight had an extension deficit of less than 6°. Two had an extension lag of 6° to 10° and three more than 10°. 14 patients achieved flexion of more than 110° and 5 of these were able to flex the knee to more than 130°. All knees were stable. Thigh atrophy of more than 1 cm was noted in only 3 patients.Conclusion: The method is well suited to the management of complex fractures of the tibial plateau when extensive dissection and internal fixation are contraindicated due to the comminuting and soft tissue compromise. Key words: illizarov frame,tibial plateau, knee stiffness.
Awal Hakeem FCPS1, Muhammad Siraj FCPS2, Qaisar Azim MBBS3
Department of Orthopedics & Trauma, Hayatabad Medical Complex, Khyber Teaching Hospital Peshawar
Management of Tibial Plateau Fracture
INTRODUCTION: Experienced trauma surgeon considers it diffi-cult to treat the high energy fractures of Ccomminut-ed Tibial plateau fractures1.With the advent of vari-ous surgical devices, however, there has been marked improvement in functional outcome. In order to treat these fractures, different methods of fixation are used. These include closed reduction and cast bracing2,3, open reduction and internal fixation4, circular frame/ Illiza-rov application5,6,7, percutaneous screw fixation8 wire guided cannulated screw and various other. There are
advantages and disadvantages of each technique. The ultimate goal of managing these fractures is to reload joint congruity, ensure joint stability, and alignment. Other goals include achieving full range of motion and to minimize the risk of post-traumatic osteoarthritis9.-------------------------------------------------------------------------------------------The method is well suited to the management of com-plex fractures of the tibial plateau when extensive dissection and internal fixation are contraindicated due to the comminuting and soft tissue compromise.------------------------------------------------------------------------------------------- The soft tissue damage must be considered, while treating these fractures in addition tofracture. Cases in which patients were treated with open reduc-tion and internal fixation of tibial plateau fractures with poor soft tissue envelope, there many authors have en-countered poor results in. there have been many com-plications in open reduction and internal fixation10. A high incidence of wound complications with possibil-
-------------------------------------------------------------------------------------------1.2.Assistant Professors 3., Postgraduate Trainees-------------------------------------------------------------------------------------------Correspondence: Dr Awal Hakeem [email protected] 03339144432 Assistant Professor KTH, Peshawar [email protected] , House No 70-71, Street No 11, Sector: K3, Phase 3. Hayatabad Peshawar KPK..-------------------------------------------------------------------------------------------Received: April2018 Accepted: July’2018-------------------------------------------------------------------------------------------
ORIGINAL ARTICLE
Awal Hakeem

Ophthalmology Update Vol. 16 No.4, Oct - Dec 2018 913
Management of Tibial Plateau Fracture
ities of deep sepsis and chronic osteomyelitis has been found in several reports. To overcome these complications with of suc-cess, different strategies have been developed. While providing stable fixation until union, the Illizarov cir-cular external fixatior has shown the ability to decrease soft tissue complications11,12. The Illizarov technique has benefits, since the reduction and fixation of the fracture fragments can be made with almost no soft-tissue expo-sure and blood. Both during and after surgery, the fixa-tor allows for the compression/distraction vg 7 and for adjustment of the alignment. Another advantage is the fixation is stable enough to allow early weight-bear-ing while using Illizarov technique. Outcome from the management of high energy tibial plateau fractures (Schatzker type VI) through circular Illizarov external fixation has been shown through this report/study.
MATERIAL AND METHODS: The retrospective study was conducted after approval from ethical committee of Hayatabad Medi-cal Complex and Khyber Teaching Hospital, Peshawar. The inpatient record of patients with Schatzker type VI tibial plateau fractures treated with Illizarov external fixator between January 2016 and December 2017 were searched from medical record section of the depart-ment of trauma and orthopaedics. More than 50 consecutive patients of tibial plateau fractures treated with different methods were identified. Patients excluded from the study were tibi-al plateau fractures of Schatzker types I, II, III, and IV, V, concomitant fractures (spine or pelvic fractures and ipsilateral femoral shaft fracture, as they could alter the functional outcome of patients) and those lost to follow-up and treated by open reduction and internal fixation. 24 patients were excluded from the study who did not meet the inclusion criteria. six patients could not be located or lost to follow-up. So, only 20 patients (12 males and 8 females) were included in this study. The mean age was 33.6 years (range: 18 to 54 years).The mechanism of injury was a road traffic accident (Motor vehicle and pedestrian accident) in 12 cases and a fall from a height in 8 cases. The fractures were closed in 15 cases and open in 5 cases. The open fractures were Gus-tilo–Anderson type I in two cases and type II in three cases. All patients were treated with fine-wire Ilizarov circular external fixators for definitive management. The hospital records included clinical history sheet and operative notes. They were studied to deter-mine the mode of injury, age, gender, delay in surgery, treatment given and associated complications of either the fracture or treatment. The data regarding comorbid conditions, associated limb injuries, and side of injury was also collected. The surgery was delayed in cases with soft tissue injury indicated by soft tissue edema
or blister formation. The patients were taken up for surgery even with soft tissue edema and blisters at the fracture site. All the fractures were Schatzker type VI. Ra-diology including digital X-rays (antero-posterior and lateral view) was carried out in all the patients where-as computed tomography (2D and 3D) was performed in 12 cases to assess the degree of comminution, the amount of depression and to detect the main fragments through which the beaded wires could be inserted to achieve maximum possible joint congruity and fracture reduction. The mean interval between admission and circular fixator application was 8 days (range 7–9). Surgical Technique: Because of high energy trauma and compromised condition of surrounding soft tissue, all the patients with Shatzker type VI tibial plateau were started on broad spectrum IV antibiotics (Cefazolin 1gm, TDS and gentacin in open fractures) since the time of admission to the surgery and then continued postop-eratively for 3 to 5 days. The operative procedures were performed in a standard operating room with traction table (foot fixed in a shoe) and image intensifier, under regional/ spinal anaesthesia under tourniquet control. The fracture reduction was visualized with an image intensifier. Antero-posterior and lateral view fluoroscopy was used during reduction, pin insertion and assem-bly of the frame. The axial reduction was achieved with traction. The joint surface was reconstructed if neces-sary, using closed pressure with percutaneously in-serted elevators, reduction forceps or/and wires with olives. Standard and appropriately sized three or four Ringsilizarov construct was used for tibial plateau frac-ture. First of all 3 to 4 wires (20mm) with olives along with the ring were placed at the level of or above the fibular head to reduce the fracture (joint line/surface and lengthwise) with an overall divergence of 30 de-grees at least. 2nd and 3rd ring along with the three sim-ple wires (16 to 18mm)and 3.5 to 4mm Shawnn pin one in each ring were placed below the fracture at mid-shaft and lower 1/3rd of tibia in safe zone. In two patients for much stability to the frame construct 4th ring with simple wires were fixed in tibia whereas in another one patient in distal femur. After that rings were connected by steel rods with each other and the wires were ten-sioned to at least 110 Kg to 130 Kg. No post-operative corrections were needed. The “Kurgan protocol” was used for postoperative pin site dressings. During the post operative period IV antibiotics (Cefazolin 1gm, TDS ) were continued for 3 to 5 days. Double IV analgesia including Inj. Tramol (TDS along the inj. Gravinate) and Inj. Toradol (SOS) were used for pain. Proton pump inhibitors were also administered on OD basis. Physiotherapy (quadricep exercise and passive dorsiflexion and plantar flexion at ankle) was started immediately after the operation to maintain

Ophthalmology Update Vol. 16 No.4, Oct - Dec 2018914
Management of Tibial Plateau Fracture
knee and ankle motion and the patients were allowed to start bearable weight-bearing. The patients were en-couraged to do active assisted knee bending from 14th postoperative day. Weight bearing was increased as tolerated. Patients with marked articular comminution were kept non-weight bearing for 6 weeks. The femoral ring and wires were used in 3 of the 20 type VI fractures and was removed at 8 weeks. The fractures were regarded as being healed when an-tero-posterior and lateral radiographs showed a bridg-ing callus and the patients were able to walk without pain. All the patients were followed up clinically at two or four weeks and then monthly till the exter-nal fixator removal at mean 17.9 weeks (range 15-22) up to mean 9.6months (range 7-12 months). Radiog-raphy (AP and Lat Digital X-rays) was performed at the same intervals. Radiography was studied to con-firm the correct classification of the fracture, treatment employed, articular reduction achieved, and any loss of articular reduction or mal-alignment. Radiographs were assessed by all the authors to assess the articular reduction. The joint reduction was considered to be sat-isfactory if articular depression was less than or equal to five millimeters and plateau widening was less than or equal to five millimeters compared to the width of the distal femoral condyle. Radiographic, clinical, and functional evaluation was done using the method the Knee Society clinical rating score.
RESULTS: All fractures united, except one with var-us-malunion. Fracture healing time was 14.05 weeks with an average of 12-18 weeks. Weight-bearing was al-lowed since the surgery and it is increased as tolerated. The fixators were removed under anesthesia (IV. ket-amine). The time of external fixator removal on average was 17.9 weeks(range of 15-22 weeks). All the patients were available for follow-up except one. The average follow-up was 9.6months (range 7-12) months. Clinical and radiographic outcome The radiograph-ic reduction of the fractures was rated as excellent in 12 and good in 7, according to Rasmussen’s criteria[18]. Using the Knee Society clinical rating system, 9 knees were rated as excellent, 7 as good, one as fair, and two as poor. One patient was lost in follow up. Six patients achieved full extension and eight had an extension defi-cit of less than 6°. Two had an extension lag of 6° to 10° and three more than 10°. 14 patients achieved flexion of more than 110° where as 5 of these were able to flex the knee to more than 130°. All knees were stable. Thigh atrophy of more than 1 cm was noted in only three pa-tients. The maximum range of motion at knee was 10 to 130° however minimum range of motion was 10° to 110°. All the patients were followed upwith Oxford
knee score questionnaire. The patients were asked twelve questions about the degree of pain in knee, any difficulty in toilet activities, ability to perform house-hold activities, climbing up or down stairs, ability to knee, night pains, any limp in the operated limb, abil-ity to kneel and stand again, and any discomfort in washing and drying oneself due to knee and various other questions mentioned in Oxford knee score. The maximum attainable score was 60. The patients were graded as poor (0 to 19), moderate (20 to 29), good (30 to 39), and excellent (40 to 48). Using the Knee Society clinical rating system, 9 knees were rated as excellent (43%), 7 as good (35%), one as fair (7.1%), and two as poor (14.2%). The patients who had scored more than 40 were considered as cases with satisfactory functional outcome and minimal disability.
The complications which are observed in patients were (i) Pin track infection i.e. at the fracture along the k-wires in 11 patients (57%) and Shawnn pin in 8 pa-tients (43%). Initially advised empirical antibiotic (tab. Cefixime 400mg, OD and tab. Augmentum 1gm, twice daily for 14 days) and local treatment of infected sites, out of eleven, 6 patients with infected k-wires site re-sponded but only two patients were oozing whereas only 1 patient out of 8 with infected Shawnn pins were oozing till the removal of Illizarov external fixator, (ii) Knee stiffness in 11 (57%), all improved with physio-therapy, (iii) Quality of articular reduction, at final fol-low-up, radiographs showed articular depression more than 3 mm in three (21%) cases and less than 3 mm in four (28%) cases, (iv)Malunion,in the form of varus de-formity 10° in 1 case, (V) Only one patient is lost in follow up.Fig: 1

Ophthalmology Update Vol. 16 No.4, Oct - Dec 2018 915
Management of Tibial Plateau Fracture
Fig: 2
A. Pro-OP
B. Post-OP
C. After Removal of Ilizarov
DISCUSSION: Treatment of high energy tibial plateau frac-tures remains challenging task in orthopaedics. Along the restoration of articular congruity, the soft tissue envelope of tibial plateau is also important for fracture healing. The final outcome depends on many factors: the extent of damage to soft tissues and articular carti-lage, the accuracy of reduction, the stability of the knee joint, the stability of fixation, and the overall alignment of the limb. All of these factors should be optimized in the care of tibial plateau fractures. Many options are available for the management of such fractures but ilizarov is the best option in the management of com-

Ophthalmology Update Vol. 16 No.4, Oct - Dec 2018916
Management of Tibial Plateau Fracture
munited tibial plateau fracture (schatzker type VI). The presence of fracture site blisters or extensive subcuta-neous haemorrhage and bruising does not hinder per-cutaneous placement of the wires which avoids addi-tional devitalization of the bone since the periosteal and endosteal blood supply are not further damaged. Small tensioned wires allow capture of small bone fragments and olive wires can compress the condylar fractures as would lag screws. Maintenance of the mechanical axis can be continually monitored by adjustment of the frame. Many options are available for the management of such fractures. Traditionally dual plating was considered to be the best mechanical method of stabilization for these fractures, as it addresses both the medial and lateral col-umns to achieve reduction and stability. The dual plate fixation has been associated with potentially devastat-ing complications such as fixation failure, malunion, nonunion, joint stiffness, secondary posttraumatic os-teoarthritis, infection, and most importantly severe soft tissue complications (i.e. wound infection and dehis-cence) as it requires soft tissue dissection. Moore et al. reported a 23 % rate of infection in association with communitedtibial plateau fractures after in-ternal fixation. They noted wound dehiscence in 8 out of 11 knees that had been treated with me-dial and lateral plates. Young et al. reported deep infection in 7 out of 8 fractures that had been treat-ed with both medial and lateral plates. However, recent biomechanical studies proved that Ilizarov circular external fixator provides adequate mechanical stability for the fixation of tibial plateau fractures as it allows for early joint mobilisation with-out risking loss of reduction. There are several studies which has shown the good functional outcome and decreased complication rate as compare to dual plate osteosynthesis.Kataria et al.[11] reported a series of 38 patients treated with small-wire external fixators and had no incidences of complications (i.e. non-union or septic arthritis). Ali AM et al. [12] reported 20 patients treated with Iliza-rov and all patients achieved bony union, good to ex-cellent functional outcome (i.e. ROM and stability) and no osteomyelitis or septic arthritis. Dendrinos GK etal.reported a series of 24 patients that were treated with the Ilizarov circular fixator. 13 achieved full extension, 7 less than 5 degrees of extension lag (>80% good to excellent result), 17 flexion >110 degrees of which 5 >130.22. All fractures united, and there was no inci-dence of osteomyelitis or septic arthritis.Watson et al. demonstrated that four olive wires combined with a lag screw provided the most stability, even when com-pared to dual plating13. Barbary et al treated 30 fractures with Lilzarov fixators, out of which 25 patients had excellent to good outcomes.14Khalily et al compared the external fixator
with hybrid fixators and found that the Ilizarov fixator had reduced fracture site movements as compared to hybrid configurations.15Egol etal had 95 percent union rate at 4 months after surgery and found that it allowed earlier range of motion at the knee16, while Mikulak et al had found that all fractures achieved union at 17.7 weeks17. In case of complications, Ali reported pin site infections in 20% patients, and skin gaping in only 1 case out of 25.18 Kumar et al had a similar rate of pin site infection (21 %) when using the ilizarov fixator.19The current study is comparable to these studies in that no cases of wound dehiscence, osteomyelitis or septic arthritis were seen.From these results it is concluded that an Ilizarov external fixator, succeeds in providing stable fixation for these complex injuries without im-parting added trauma to an already compromised soft tissue envelope, and provides good to excellent ROM. Ilizarov external fixator also provides advan-tage of early full weight-bearing. Closed Ilizarov does not necessitate extensive soft tissue dissection and stripping so avoids wound dehiscence and necrosis and has lesser chances of infection typically associated with traditional plating technique.Pin tract infection is a major complication and occurs almost in more than half of cases, but can be dealt with through aseptic mea-sures, proper cleansing, antibiotics and diligent care.
CONCLUSION: The technique is well suited to the management of complex fractures of the tibial plateau when extensive dissection and internal fixation are contraindicated due to the comminution and soft tissue compromise. Iliza-rov external fixator is an ideal method for communited tibial plateau fracture schatzker type VI, as it provides good functional outcome, however less complications rate.
REFERENCES:1. O. Lansinger, B. Bergman, L. Korner, and G. B. J. Andersson,
“Tibial condylar fractures. A twenty-year follow-up,” The Journal of Bone and Joint Surgery, vol. 68, no. 1, pp. 13–19, 1986.
2. M. J. Young and R. L. Barrack, “Complications of internal fixation of tibial plateau fractures,” Orthopaedic Review, vol. 23, no. 2, pp. 149–154, 1994.
3. T. A. DeCoster, J. V. Nepola, and G. Y. El-Khoury, “Cast brace treatment of proximal tibia fractures. A ten-year follow-up study,” Clinical Orthopaedics and Related Research, no. 231, pp. 196–204, 1988.
4. D. B. Jensen, C. Rude, B. Duus, and A. Bjerg-Nielsen, “Tibial plateau fractures. A comparison of conservative and surgical treatment,” Journal of Bone and Joint Surgery, vol. 72, no. 1, pp. 49–52, 1990
5. Canadian Orthopaedic Trauma Society, “Open reduction and internal fixation compared with circular fixator application for bicondylartibial plateau fractures. Results of a multicenter, prospective, randomized clinical trial,” The Journal of Bone and Joint Surgery, vol. 88, no. 12, pp. 2613–2623, 2006.
6. A. M. Ali, M. Burton, M. Hashmi, and M. Saleh, “Outcome of complex fractures of the tibial plateau treated with a beam-loading ring fixation system,” The Journal of Bone and Joint

Ophthalmology Update Vol. 16 No.4, Oct - Dec 2018 917
Management of Tibial Plateau Fracture
Surgery, British, vol. 85, no. 5, pp. 691–699, 2003.7. P. Whittle, “Treatment of complex (Schatzker Type VI) fractures of
the tibial plateau with circular wire external fixation: retrospective case review,” Journal of Orthopaedic Trauma, vol. 14, no. 5, pp. 339–344, 2000.
8. T. M. Moore, “Fracture-dislocation of the knee,” Clinical Orthopaedics and Related Research, vol. 156, pp. 128–140, 1981.
9. Barei DP, Nork SE, Mills WJ, Bradford Henley M, Benirschke SK. Complications associated with internal fixation of high-energy bicondylartibial plateau fractures utilizing a two-incision technique. J Orthop Trauma.
10. J. P. Waddell, D. W. C. Johnston, and A. Neidre, “Fractures of the tibial plateau: a review of ninety-five patients and comparison of treatment methods,” The Journal of Trauma-Injury, Infection, and Critical Care, vol. 21, no. 5, pp. 376–381, 1981.
11. Kataria H, Sharma N, Kanojia RK. Small wire external fixation for high-energy tibial plateau fractures. J Orthop Surg. 2007;15(2):137–143.
12. Ali AM, Burton M, Hashmi M, Saleh M. Outcome of complex fractures of the tibial plateau treated with beam-loading ring fixation system. J Bone JtSurg (Br) 2003;85-B:691–699.
13. Watson JT, Ripple S, Hoshaw SJ, Fyhrie D. Hybrid external fixation for tibial plateau fractures: Clinical and biomechanical
correlation. OrthopClin North Am 2002;33.14. El Barbary H, Ghani HA, Misbah H, Salem K. Complex tibial
plateau fractures treated with Ilizarov external fixator with or without minimal internal fixation. International orthopaedics. 2005 Jun 1;29(3):182-5.
15. Khalily C, Voor MJ, Seligson D. Fracture site motion with Ilizarov and” hybrid” external fixation.Journal of orthopaedic trauma. 1998 Jan 1;12(1):21-6.
16. Egol KA, Su E, Tejwani NC, Sims SH, Kummer FJ, Koval KJ. Treatment of complex tibial plateau fractures using the less invasive stabilization system plate: clinical experience and a laboratory comparison with double plating. Journal of Trauma and Acute Care Surgery. 2004 Aug 1;57(2):340-6.
17. Mikulak SA, Gold SM, Zinar DM. Small wire external fixation of high energy tibial plateau fractures. Clinical Orthopaedics and Related Research®. 1998 Nov 1;356:230-8.
18. Ali AM. Outcomes of open bicondylar tibial plateau fractures treated with Ilizarov external fixator with or without minimal internal fixation. European Journal of Orthopaedic Surgery & Traumatology. 2013 Apr 1;23(3):349-55.
19. Kumar P, Singh GK, Bajracharya S. Treatment of grade IIIB opens tibial fracture by Ilizarov hybrid external fixator. Kathmandu Univ Med J (KUMJ). 2007;5(2):177-80.
**************************************Rising Level of CO2 saps essential nutrients from diet.
(Journal of Nature Climate Change)
Researchers from Harvard University School of Public Health have recently warned in the journal of Nature Climate Change that rising level of Carbon Dioxide in the atmosphere threatens to weaken the presence of essential nutrients like iron, zinc and proteins by 17%, causing malnutrition especially in the growing children affecting their immune system and making more vulnerable to Malaria, Typhoid, lung infections and diarrheal diseases. These nutrients are essential for normal human growth and development. These nutrients are also essential part of 70% of our staple diet like wheat, rice and maize. Humans get three-fifth of dietary protein, four-fifth of iron and 70% of the zinc requirements from plant resources.
**************************************

Ophthalmology Update Vol. 16 No.4, Oct - Dec 2018918
Exploring Gender Differences in Academic Motivation among Adolescents
ABSTRACTAim. The present study was to explore relationship between intrinsic and extrinsic motivation on academic performance. Material & Method: Based on literature review following hypotheses were formulated 1)There will be significant relationship between Intrinsic Motivation, Extrinsic Motivation and A-motivation among adolescents.2). Male and female adolescents will be different in levels of Academic Motivation.3).There will be significant interaction among gender and education with Academic Motivation. Result: A sample of 160 college students (80males and 80 females) was selected from male and female colleges of Mirpur AJK. The age of the participants ranged from 16-20 years (with mean age of 17.56 years). Their educational level was at least intermediate and socioeconomic status was middle and high class. The Academic Motivation Scale was administered to assess academic intrinsic and extrinsic motivation and academic performance was measured through SPSS V 23. In order to interpret the results reliability analysis, Correlation, t-test and were calculated to assess relationship between academic motivation, Extrinsic Motivation and A-motivation among adolescents. Results suggest that male adolescents (M= 55.7, SD= 10) have significantly low rates of Intrinsic Motivation as compared to female adolescents (M= 60.7, SD= 12.1). Similarly, male adolescents (M= 56.3, SD= 10.6) are lower in Extrinsic Motivation as compared to female adolescents (M= 63.9, SD= 12.7). Whereas in A-motivation, male adolescents (M= 15.4, SD= 4.5) rate higher as compared to female adolescents (M= 10.4, SD= 5.1).Conclusion: Findings of the results illustrates that motivation improves academic performance of the students. In addition, there is gender difference in motivation type and academic performance.Key Words: Intrinsic Motivation, Extrinsic Motivation, Academic Performance
Shakeel Asif.FCPS(Psych)1. Asif Kamal. FCPS(Psych)2 M. Fahim,FCPS(Psych)3, Nadia NaveenMBBS4., Farah Yousaf MBBS 5.
Exploring Gender Differences in Academic Motivation among Adolescents
Shakeel Asif
INTRODUCTION Academic motivation is the corner stone for success amongst the student’s success is highly de-pendent on level of motivation they get. College time endows with the foundation to enter the professional education. Some college students are more motivated to learn than others, hence need arises to explore the reasons. Academic motivation is a student’s desire regarding academics when the student’s competence is judged against a standard of performance or excel-
lence. Psychologists noted that motivation should be taken into account in education because of its effective relationship with new learning, abilities, strategies and behaviors and motivation for academic achievement as one of the preliminary constructs for defining such type of motivation7. Self-determination theory is an ap-proach that focuses on self-determined or autonomous and controlled behaviors. It suggests that a person who is unmotivated feels no ambition and excitement to-wards accomplishing a task and self-determination has diverse theories such as intrinsic motivation, extrinsic motivation and academic motivation5, 6.-------------------------------------------------------------------------------------------Motivation improves the academic performance of the students, though there is gender difference in motivation type and academic performance.------------------------------------------------------------------------------------------- Intrinsic motivation is the self-desire to attempt to face new challenges. In this a person does a certain task because they enjoy doing it or have an interest in doing it, they don’t rely on external pressure or a desire
-------------------------------------------------------------------------------------------1. Assistant Prof. Psychiatry. Mohtarma Benazir Bhutto Shaheed Medical College,Mirpur AJK, 2. Assistant Prof. Psychiatry. GKMC Swabi.3. Assistant Prof. of Psychiatry, Wah Medical College, POF Wah Cantt.4 Scientific Officer NIH Islamabad5. Senior Scientific Officer NIH Islamabad-------------------------------------------------------------------------------------------Correspondence: Dr. Shakeel Asif.Assistant Prof. Psychiatry. Mohtarma Benazir Bhutto Shaheed Medical College, Mirpur AJK Email: [email protected] Cell: 0345 5513458-------------------------------------------------------------------------------------------Received: July’2018 Accepted: Sep’2018-------------------------------------------------------------------------------------------
ORIGINAL ARTICLE
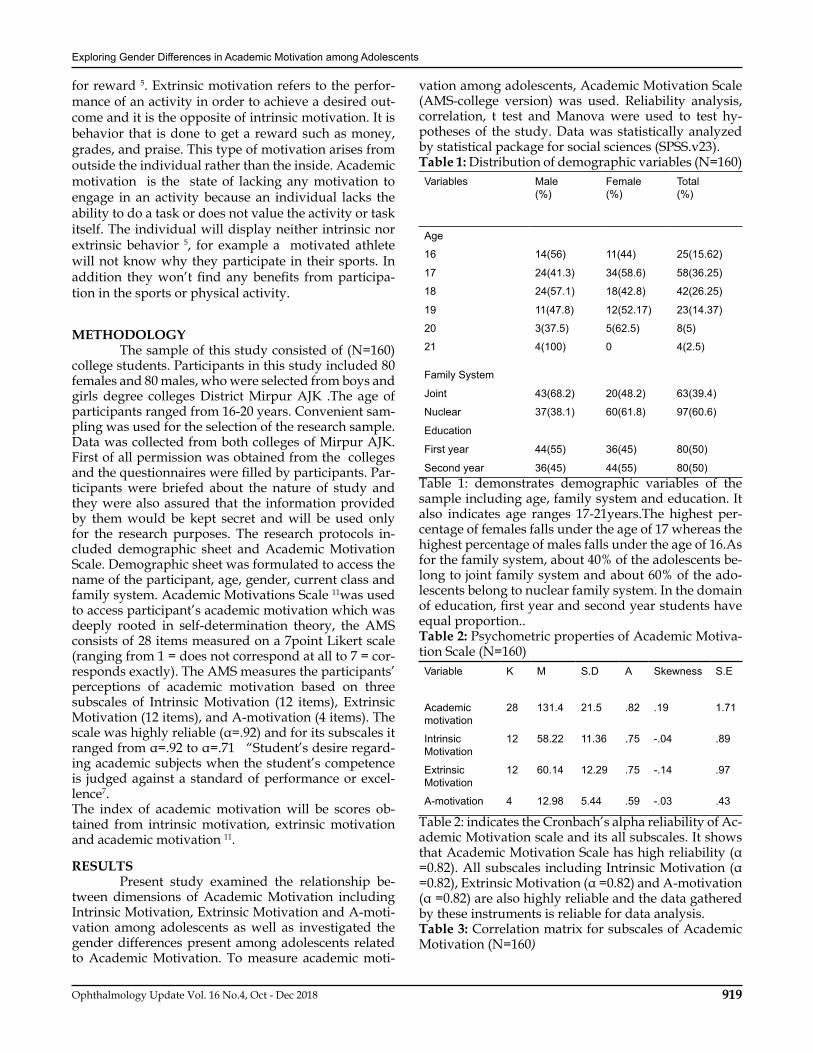
Ophthalmology Update Vol. 16 No.4, Oct - Dec 2018 919
Exploring Gender Differences in Academic Motivation among Adolescents
for reward 5. Extrinsic motivation refers to the perfor-mance of an activity in order to achieve a desired out-come and it is the opposite of intrinsic motivation. It is behavior that is done to get a reward such as money, grades, and praise. This type of motivation arises from outside the individual rather than the inside. Academic motivation is the state of lacking any motivation to engage in an activity because an individual lacks the ability to do a task or does not value the activity or task itself. The individual will display neither intrinsic nor extrinsic behavior 5, for example a motivated athlete will not know why they participate in their sports. In addition they won’t find any benefits from participa-tion in the sports or physical activity.
METHODOLOGY The sample of this study consisted of (N=160) college students. Participants in this study included 80 females and 80 males, who were selected from boys and girls degree colleges District Mirpur AJK .The age of participants ranged from 16-20 years. Convenient sam-pling was used for the selection of the research sample. Data was collected from both colleges of Mirpur AJK. First of all permission was obtained from the colleges and the questionnaires were filled by participants. Par-ticipants were briefed about the nature of study and they were also assured that the information provided by them would be kept secret and will be used only for the research purposes. The research protocols in-cluded demographic sheet and Academic Motivation Scale. Demographic sheet was formulated to access the name of the participant, age, gender, current class and family system. Academic Motivations Scale 11was used to access participant’s academic motivation which was deeply rooted in self-determination theory, the AMS consists of 28 items measured on a 7point Likert scale (ranging from 1 = does not correspond at all to 7 = cor-responds exactly). The AMS measures the participants’ perceptions of academic motivation based on three subscales of Intrinsic Motivation (12 items), Extrinsic Motivation (12 items), and A-motivation (4 items). The scale was highly reliable (α=.92) and for its subscales it ranged from α=.92 to α=.71 “Student’s desire regard-ing academic subjects when the student’s competence is judged against a standard of performance or excel-lence7.The index of academic motivation will be scores ob-tained from intrinsic motivation, extrinsic motivation and academic motivation 11.
RESULTS Present study examined the relationship be-tween dimensions of Academic Motivation including Intrinsic Motivation, Extrinsic Motivation and A-moti-vation among adolescents as well as investigated the gender differences present among adolescents related to Academic Motivation. To measure academic moti-
vation among adolescents, Academic Motivation Scale (AMS-college version) was used. Reliability analysis, correlation, t test and Manova were used to test hy-potheses of the study. Data was statistically analyzed by statistical package for social sciences (SPSS.v23).Table 1: Distribution of demographic variables (N=160)Variables Male
(%)Female(%)
Total(%)
Age
16 14(56) 11(44) 25(15.62)
17 24(41.3) 34(58.6) 58(36.25)
18 24(57.1) 18(42.8) 42(26.25)
19 11(47.8) 12(52.17) 23(14.37)
20 3(37.5) 5(62.5) 8(5)
21 4(100) 0 4(2.5)
Family System
Joint 43(68.2) 20(48.2) 63(39.4)
Nuclear 37(38.1) 60(61.8) 97(60.6)
Education
First year 44(55) 36(45) 80(50)
Second year 36(45) 44(55) 80(50)Table 1: demonstrates demographic variables of the sample including age, family system and education. It also indicates age ranges 17-21years.The highest per-centage of females falls under the age of 17 whereas the highest percentage of males falls under the age of 16.As for the family system, about 40% of the adolescents be-long to joint family system and about 60% of the ado-lescents belong to nuclear family system. In the domain of education, first year and second year students have equal proportion..Table 2: Psychometric properties of Academic Motiva-tion Scale (N=160)Variable K M S.D A Skewness S.E
Academic motivation
28 131.4 21.5 .82 .19 1.71
Intrinsic Motivation
12 58.22 11.36 .75 -.04 .89
ExtrinsicMotivation
12 60.14 12.29 .75 -.14 .97
A-motivation 4 12.98 5.44 .59 -.03 .43
Table 2: indicates the Cronbach’s alpha reliability of Ac-ademic Motivation scale and its all subscales. It shows that Academic Motivation Scale has high reliability (α =0.82). All subscales including Intrinsic Motivation (α =0.82), Extrinsic Motivation (α =0.82) and A-motivation (α =0.82) are also highly reliable and the data gathered by these instruments is reliable for data analysis.Table 3: Correlation matrix for subscales of Academic Motivation (N=160)

Ophthalmology Update Vol. 16 No.4, Oct - Dec 2018920
Exploring Gender Differences in Academic Motivation among Adolescents
Variables 1 2 3
Intrinsic motivation 1 .59 -.32
Extrinsic motivation - 1 -.48
A-motivation - - 1
p = <0.01Table 3 indicates correlation coefficients for subscales of academic motivation scale. The results show that Intrinsic Motivation and Extrinsic Motivation are pos-itively correlated (α=.59**, p<.001) with each other whereas A-motivation is negatively correlated with Intrinsic Motivation (α= -.32**, p<.001) as well as with Extrinsic Motivation (α= -.48**, p<.001).Note. IM=Intrinsic Motivation, EM= Extrinsic Motiva-tion, AM= A-motivationTable 4 showed the results of t-test for comparing mean differences on the basis of gender on Intrinsic Moti-vation (IM), Extrinsic Motivation (EM), and A-moti-vation(AM).Thus indicating that male adolescents (M= 55.7, SD= 10) have significantly low rates of In-trinsic Motivation as compared to female adolescents (M= 60.7, SD= 12.1). Similarly, male adolescents (M= 56.3, SD= 10.6) are lower in Extrinsic Motivation as compared to female adolescents (M= 63.9, SD= 12.7). Whereas in A-motivation, male adolescents (M= 15.4, SD= 4.5) rate higher as compared to female adolescents (M= 10.4, SD= 5.1).Table 5: Manova for Gender and Education on Intrin-sic Motivation, Extrinsic Motivation and A-motivation (N= 160)Source Dependent
variableSS Df MS F ᶯ2
gender*edu
Intrinsic 598.97 4 149.74 1.40* .04
Extrinsic 227.15 4 56.78 .49*** .01
A-motivation 79.271 4 19.818 .820 .02
Note: SS= Sum of Squares, df= Degree of Freedom, MS= Mean SquareIn MANOVA the results concluded that interaction among gender and education of the sample was signif-icant on intrinsic motivation and extrinsic motivation. Gender and level of education when combined, signifi-cantly influence the rates of intrinsic motivation (MS= 149.74, p<.05) and extrinsic motivation (MS= 56.78, p<.05).
DISCUSSION Present study examined the relationship be-tween dimensions of Academic Motivation including Intrinsic Motivation, Extrinsic Motivation and A-moti-vation among adolescents as well as investigated the gender differences present among adolescents related to Academic Motivation. Academic motivation is the corner stone for success in college students. Student’s triumph is highly dependent on level of motivation they hold. College time endows with the foundation to enter the professional education. Some college students are more motivated to learn than others, hence need arises to explore the reasons. Academic motivation is a student’s desire regarding academic subjects when the student’s competence is judged against a standard of performance or excellence. Psychologists noted that motivation should be taken into account in education
Table 4: Mean, Standard Deviation and t-values of Academic Motivation between Males (n=80) and Females (n=80). Males n= 80
Females n= 80
95% CI
Scales M SD M SD t Df P LL UL Cohen’s d
IM 55.7 10.0 60.7 12.1 2.8 158 .00 -8.4 -1.4 0.4
AM 15.4 4.5 10.4 5.1 6.5 158 .00 3.4 6.5 1.0
EM 56.3 10.6 63.9 12.7 4.0 158 .00 -11.2 -3.8 0.6

Ophthalmology Update Vol. 16 No.4, Oct - Dec 2018 921
Exploring Gender Differences in Academic Motivation among Adolescents
because of its effective relationship with new learning, abilities, strategies and behaviors and they have pre-sented motivation for academic achievement as one of the preliminary constructs for defining such type of motivation7.
While concluding results table 1 demon-strates that in the domain of education, first year and second year students have equal proportion. First year students have more number of males as compared to females where as in second year there is a larger popu-lation of female students. While in Table 2 indicates the Cronbach’s alpha reliability of Academic Motivation scale and its all subscales. It shows that Academic Moti-vation Scale has high reliability. All subscales including Intrinsic Motivation, Extrinsic Motivation and A-moti-vation are also highly reliable and the data gathered by these instruments is reliable for data analysis. The first hypothesis proposed that there will be significant relationship between Intrinsic Moti-vation, Extrinsic Motivation and A-motivation among adolescents. Table 3 findings are in line with previous research finding which indicated that a significant pos-itive relationship exists between intrinsic motivation and extrinsic motivation1. The aim of the study 1was to explore re-lationship between intrinsic and extrinsic motivation on academic performance. A sample of 200 students (100 males and 100 females) was selected from dif-ferent colleges of Karachi. The age of the participants ranged from 18-21 years (with mean age of 18.56 years). Their educational level was at least intermediate and socioeconomic status was middle and high class. Re-sults suggested that intrinsic and extrinsic motivation and academic performance were positively correlated (r=.563; n=200; sig=.000). Second hypothesis profess that male and fe-male adolescents will be different in levels of Academic Motivation. Table 4 showed the results of t-test for com-paring mean differences on the basis of gender on In-trinsic Motivation (IM), Extrinsic Motivation (EM), and A-motivation(AM). In a previous research done in Ka-rachi, gender difference was found (t=4.324, p <.05) on motivation and academic performance. To conclude, findings of the results illustrates that there is gender difference in motivation type and academic perfor-mance1.Female college students were more motivated as compared to males; the same hypothesis was proved in a previous research9. The results of our study are con-sistent with the previous research that says that female respondents are more motivated in studies 8. According to our study males are more a-motivated as compared to females towards their study, which is consistent with many previous research findings2, 10.Prior research has also shown consistent results regarding the differences of lack of motivation as stated in the study which in-vestigated gender differences in adolescents’ academic motivation and classroom behavior and gender differ-ences in the extent to which motivation was associated
with, and predicted, classroom behavior. Seven hun-dred and fifty students (384 boys and 366 girls) aged between eleven and sixteen completed a questionnaire examining academic motivation and teachers complet-ed assessments of their classroom behavior. The results stated that girls generally reported higher levels of aca-demic motivation, whilst boys were poorer in academic motivation, having high rates of lack of motivation 3. Third hypothesis suggested that there will be sig-nificant interaction among gender and education with Academic Motivation. MANOVA for gender and ed-ucation on academic motivation- Intrinsic Motivation, Extrinsic Motivation and A-motivation was done. The results concluded that interaction among gender and education of the sample was significant on intrinsic motivation and extrinsic motivation. Gender and lev-el of education when combined, significantly influence the rates of intrinsic motivation and extrinsic motiva-tion. Gender and level of education strongly influence extrinsic motivation. Males of first year have lower ex-trinsic motivation as compared to females of first year. Whereas, males of second year are higher in extrinsic motivation than females of second year. Findings of the present study concluded that an interaction among gender and education with intrinsic motivation as well as with extrinsic motivation is consistent with previous research stating that a per-son’s gender and his or her level of education strongly influence the rates of intrinsic motivation as well as ex-trinsic motivation.CONCLUSION Present study examined the relationship be-tween dimensions of Academic Motivation including Intrinsic Motivation, Extrinsic Motivation and A-moti-vation among adolescents as well as investigated the gender differences present among adolescents related to Academic Motivation. The results show that Intrin-sic Motivation and Extrinsic Motivation are positively correlated with each other whereas A-motivation is negatively correlated with Intrinsic Motivation as well as with Extrinsic Motivation. Results further indicated that male adolescents have significantly low rates of In-trinsic Motivation as compared to female adolescents. Similarly, male adolescents are lower in Extrinsic Mo-tivation as compared to female adolescents. Whereas male adolescents rate higher in A-motivation as com-pared to female adolescents. The results concluded that interaction among gender and education of the sample was significant on intrinsic motivation and extrinsic motivation. When Gender and level of education are interacted, they significantly influence the rates of in-trinsic and extrinsic motivation.Implications, limitations and suggestions: While pres-ent research relied more on quantitative and survey research, qualitative research may also be utilized to seek in-depth information on the topic through engag-ing faculty members and students in group discussions through focus group discussions and interviews.

Ophthalmology Update Vol. 16 No.4, Oct - Dec 2018922
Exploring Gender Differences in Academic Motivation among Adolescents
Further this study can be conducted using large pop-ulation as the sample of this study was small, it of-fered some insights, guidelines and caveats for future research. This study is an effective contribution to the understanding of the adaptation and integration of stu-dents as well as to study their well being.The sample taken in the study was taken only from private schools. For future studies, corporate evaluations among stu-dents of private higher education and public higher education can be conducted with a good sample size
REFERENCES1. A.Nadia.Effect of Intrinsic and Extrinsic Motivation on Academic
Performance. Pakistan Business Review. 12. 363-372.2. Bacon SM. The relationship between gender, comprehension,
processing strategies, and cognitive and affective response in second language learning. The modern language journal 1992.1540-4781.
3. Bugler, M., McGeown, S., Thompson, HSC.An investigation of gender and age differences in academic motivation and classroom behavior in adolescents. Educational Psychology.2015:36:7:1196-1218
4. Chung, L., Chang, R. The Effect of Gender on Motivation and Student Achievement in Digital Game-based Learning: A Case Study of a Contented-Based Classroom. Eurasia Journal of Mathematics, Science and Technology Education.2017:13; 6:2309-27.
5. Deci, E. L. Effects of externally mediated rewards on intrinsic motivation. Journal of Personality and Social Psychology.1971:18; 1:105–15.
6. Deci, E. L., Koestner, R.,Extrinsic Rewards and Intrinsic Motivation inEducation: Reconsidered Once Again.Review of Educational Research .2001:71;1:1-27
7. DiPerna, J. C., & Elliott, S. N. Development and validation of the academic competence evaluation scales. School Effectiveness and School Improvement, 1999:17:3; 207-25.
8. Gardner, R. C., & Lambert, W. E. Attitudes and motivation in second language learning.Encyclopedia of Language & Linguistics.2006:348-55
9. Narayanan, R., Rajasekaran N. N., &Iyyappan, S. Do female
students have higher motivation than male students in learning of English at the tertiary level?ERIC. Institute of educational sciences.2007.1-15:ED496970
10. SpolskyB.Conditions for second language learning: Oxford university press. 1989:vii: 272 ;24 cm.
11. Robert J. et al. The academic motivation scale: A measure of intrinsic, extrinsic, and a-motivation in education. Educational and Psychological Measurement. 1992:52:4; 1003-17.
12. Ramnarain U.Understanding the influence of intrinsic and extrinsic factors on inquiry based science education at township schools in South Africa. Journal of research in sciences teaching.2016; 53:4:598-619.
13. Fonseca Moura RG et al.Prevalence Of Intrinsic And Extrinsic Factors Of The Learning Process In Children With Epilepsy. Rev. CEFAC. 2014 Mar-Abr; 16(2):472-477.
14. Sizer P et al.Intrinsic and Extrinsic Factors Important to Manual Therapy Competency Development: A Delphi Investigation. The Journal of Manual & Manipulative Therapy.2008:16:1:9–19Hubenthal, W. (2004). Older Russian immigrants’ experiences in learning English: Motivation, methods, and barriers. Adult Basic Education, 14(2), 104-126.
15. Noels, K. A., Clément, R., & Pelletier, L. G. (2001). Intrinsic, extrinsic and integrative orientations of French Canadian learners of English. The Canadian Modern Language Review, 57(3), 424-442.
16. Noels, K. A, Pelletier, L. G., Clément, R., &Vallerand, R. J.. Why are you learning a second language? Motivational orientations and self-determination theory. Language Learning.2003: 53(1); 33-63.
17. Oxford, R., &Shearin, J. Language learning motivation: Expanding the theoretical framework. The Modern Language Journal.1994:78(1): 12-28.
18. Rice, C., Udagaway, C., Thompson, H., & McGregor, N.. Do hours matter? The relationship between motivation and study intensity in learners of English in Scotland. The Social Science Journal.2008: 44(3); 457-475.
19. Tremblay, P. F. Expanding the motivation construct in language learning. The Modern Language Journal.1995: 79(4):505-518.
20. Clément, R., &Kruidenier, B. G. Orientations in second language acquisition: I. the effects of ethnicity, milieu and target language on their emergence. Language Learning.1983:33, 272–291.

Ophthalmology Update Vol. 16 No.4, Oct - Dec 2018 923
Visual Outcome of Cataract Surgery at Tertiary Referral Centre of Khyber Pakhtunkhwa using WHO criteria
ABSTRACTObjective: To assess the visual outcome of cataract surgery at Hayatabad Medical Complex (HMC) Peshawar on 1st, 3rd and 15th post-operative day and to categorize its visual acuity by World Health Organization (WHO) criteria.Methodology: The study was conducted from September to November 2015. 120 patients were enrolled for the study were above the age of 40. All patients were admitted through the OPD. 117(97.53%) patients were considered to have a good vision, 2(0.016%) were having borderline and none of the patients were having poor vision. Data was collected on a validated predesigned performa pre operatively on 1st, 3rd and 15th post operation day, and complications were treated accordingly and recorded for those patients who had their V.A less than 6/18 on 15th post-operative day after refraction was done in such cases if patient was not improving due to previous complications, their finding was recorded after thorough examination. Vision was finally recorded. Results: In total 120 patients were operated, males 87(72.5%), females 33(27.5%). Age group, 40-50 was 5(4.1%), 51-60 were 36(30%), in 61-70 were 56(46.6%), in 71-80 were 21(17.5%) and in 81-90 were 2(1.6%). Good vision was 75(62.5%), 35(29.16%) of them were on borderline and 8(6.66%) of them were having poor vision. According to WHO definition on 15th post-operative day 117(97.53%) were having good vision, 97% were borderline, 2(1.66%) were NPL due to endophthalmitis.Conclusion: Blindness due to cataract is a significant problem among the developing countries. The visual outcome of cataract surgery was 97%, which can be improved with adequate skills, facilities and quality control. The monitoring of quality outcome needs to be built into the data collection. The use of these indicators facilitates adequate management and evaluation of the efficiency and effectiveness of the intervention and can help to ensure the maximum utilization of the available resources for the cataract surgery.Key words: visual outcome, cataract surgery, visual acuity.
Dr Jahanzaib Khan FCPS 1, Mohammad Idris FCPS 2,,Muhammad Haroon BVS 3 , Aftab U. Rehman FCPS 4 Prof. Lal Muhammad FCPS 5
Visual Outcome of Cataract Surgery at Tertiary Referral Centre of Khyber Pakhtunkhwa using WHO criteria
Jahanzaib Khan
INTRODUCTION Recent study estimates that blindness affects 45 million peoples globally with nine out of every ten
blind people living in the developing countries. 1World Health Organization (WHO) launched vision 2020, a global initiative for the elimination of avoidable blind-ness. The goals of this initiative is to address the major preventable or treatable causes of blindness, particu-larly in developing countries in order to stop further increase of the global burden of blindness’. Among the priority diseases signaled out in the vision 2020 initia-tives are cataract and trachoma 2 , 3.------------------------------------------------------------------------------------------- The outcome can be improved with adequate surgical skills, better with routine monitoring of quality. The use of these indicators facilitates adequate manage-ment.------------------------------------------------------------------------------------------- Cataract is the most frequent causes of visual losses worldwide. The most common form of cataract
-------------------------------------------------------------------------------------------1.Assistant Professor Ophthalmology, Institute of Medical Sciences, Khyber Medical University, Kohat.KPK2. Assistant Professor, Ophthalmology Department, Lady Reading Hospital/MTI Peshawar.
3. .. Senior Registrar, Khalifa Gul Nawaz Teaching Hospital, Bannu 4.
Principal/ Professor of Ophthalmology, Institute of Medical Sciences, Khyber Medical University, Kohat.5.
-------------------------------------------------------------------------------------------Correspondence: Dr Jahanzaib Khan Assistant Professor Ophthalmology, Institute of Medical Sciences, Khyber Medical University, Kohat.KPK Cell No: 0334-9001847 email: [email protected] 03349231832-------------------------------------------------------------------------------------------Received: July’2018 Accepted sep’2018-------------------------------------------------------------------------------------------
ORIGINAL ARTICLE

Ophthalmology Update Vol. 16 No.4, Oct - Dec 2018924
Visual Outcome of Cataract Surgery at Tertiary Referral Centre of Khyber Pakhtunkhwa using WHO criteria
are still not prone to effective prevention and great ef-forts are therefore being made to provide sight restor-ing surgery, over the last 10 years new technologies and techniques have improved the surgery, after the implantation of intraocular lenses(IOL). According to population census in 1998 the population of Pakistan stands 130. 5 million and an an-nual growth rate of 2.61 percent7. The number of blind is 2.3 million with an estimated 1.5 million blind due to cataract and assuming that the annual incidence of cataract blindness is 20 percent of the prevalence. There will be approximately 300,000 cases of blindness due to cataract annually.8
In KPK, annual cataract surgeries are 140,000 and the backlog is increasing. The eye care services below district level are poorly or completely not developed.12
This study was undertaken to assess the outcome of cataract surgery in terms of day 1 visual acuity and at final follow-up after 6 weeks and to identify factors that might affect poor cataract surgery outcome.
METHODOLOGY: A written permission was obtained from HMC authorities and all the patients who underwent cataract surgery, admitted through Out Patient Department (OPD). Their V.A, and history of systemic diseases was recorded, if the V.A of the persons was less than 6/18, then refraction was done, and the final vision was re-corded. Surgery was performed on the same day or the next day. Cataract operated patients were examined in the OPD, and their V.A was again recorded. Patients were followed at first post operative day, third post op-erative day and fifteenth post operative day.Inclusion criteria: All patients aged 40 and above with cataract.Exclusion criteria: All those patients below age 40 or with mental health issues, and no perception of light. 120 patients who had undergone cataract sur-gery at HMC Peshawar were registered on a prede-signed proforma, the hospital post-operative protocol was followed on 1st, 3rd and 15th post operative day and their visual acuity was recorded. They were examined on the slit lamp, if necessary fundoscopy was also done and If the person vision was less than 6/18, refraction was done and the final vision of the patient was record-ed. On the 15th post operated day best available correc-tion and V.A of the patient was done. If the patient was not improving up to 6/18 and if in the previous record he/she was not having any complication. Then person was examined thoroughly and the findings were re-corded. The study continued on all working days from September to November 2015.
RESULTSTable-1. Age and gender of patientsAGE GROUP MALE FEMALE TOTAL %
40-50 2 3 5 4.1%
51-60 28 8 36 30%
61-70 40 16 56 46.6%
71-80 16 5 21 17.5%
81-90 1 1 2 1.6%
Total 87(72.5%) 33(27.5%) 120(100%) 100 %
Table-2.Pre operative ocular condition.Pre operative condition Frequency %
normal 96 80%Corneal opacities 16 13.3%Glaucoma 4 3.3%Ant/post.seg pathology 4 3.3%Total 120 100%
Table-3: Systemic diseases of persons before surgery.Systemic diseases Frequency %
Normal 80 66.6%Hypertension 30 25%Diabetic 10 8.3%Total 120 100%
Table-4 Intra Operative Complications. Intra-operative complications Freq. %Normal 120 100%Post. cap. rupture/vit loss 0 0Loose suture 0 0Total 120 100%
There were no intra operative complications occur during my study time period.
Table-5. Post operative condition of the eyes.Post op Complications Frequency %Normal 118 98.3%Endophthalmitis 2 1.66%Hypopion 0 0Severe uveitis 0 0Others 0 0Total 120 100%
Table-6.Gender vs Occupation.Occupation Male Female TotalEmployed 24 8 32Unemployed 40 16 56Farmer 16 0 16House wife 0 16 16Total 80 40 120

Ophthalmology Update Vol. 16 No.4, Oct - Dec 2018 925
Visual Outcome of Cataract Surgery at Tertiary Referral Centre of Khyber Pakhtunkhwa using WHO criteria
Table-7: Visual Acuity of the persons before surgery and on 1st,3rd and 15th post op day.Visual Acuity Post op
V.A
Pre op V.A
1st post op day
3rd post op day
15th post op day
6/6-6/18 (Good) 0 16 24 80
<6/18-6/60
(Borderline)
24 56 80 38
<6/60-3/60(Poor) 96 46 14 0
NPL 0 2 2 2
Total 120 persons were included in the study. The visual acuity of the person at the time of admission were recorded. 24 persons (20%) were having visual acuity in borderline at the time of admission. 96 per-sons 80% were having poor visual acuity at the time of admission. No one was NPL. On 1st post operative day 16 were having good vision, 56 were having borderline, 46 were having poor and 2 were NPL due to endoph-thalmitis. On 3rd post operative day 97% were having good vision, 80 were borderline, 14 were having poor vision and 2 were NPL due to endophthalmitis. On 15th post operative day 80 were having good vision, 38 were borderline, no one has poor vision and 2 had endoph-thalmitis and NPL.
DISCUSSION: In this study, we have examined postoperative visual acuity as one measure of visual outcome for cat-aract surgeries at HMC Peshawar.18 The visual acuity of operated eye was assessed on the first, third and fif-teenth day. There was no loss to follow up during the study. The surgical results shows that 98.3% were hav-ing no complications, two had endophthalmitis were recorded. There were 80 persons who presented good vision on 15th post operative day, 38 were borderline, None with poor vision, IOL was used in all cases ex-cept where implantation was not indicated. The visu-al outcome while comparing to other studies done in the developing world is encouraging. Those with good outcome were 66.6 %. These results may be associat-ed with the ideal institutional setting. The controlled circumstances, in which anesthesia, pre operative as-sessment, intra operative and post operative care of the patient are important factors. Clinical trials in India and Nepal19 have shown that under optimal conditions more than 90% of eyes with cataract achieved best corrected visual acuity of 6/18 or better. The variation in visual outcome between various surgical techniques is minimal. Less than 3% of the operated patients had a best corrected vision of less than 6/60. These clinical trials results may reflects one end of the spectrum, suggesting what may be possible in an ideal setting under very controlled circumstances,
while setting general standards for hospital in a devel-oping country situation, this aspect would have to be taken into account. However population based surveys show that all patients operated for cataract, 21-53% had a presenting visual acuity of less than 6/60, with best correction, 11-21% still had acuity less than 6/60. These figures include patients operated on recently as well as those who had surgery decades earlier. According to Lalit Dendona 1994, his study outcome related to cataract surgery showed that the high rate of visual outcome, predominantly was a re-sult of surgery related to inadequate suggesting that the more attention was needed to improve the visual outcome of cataract surgery. They suggested that on cataract related visual impairment in India.21 The strongest association of very poor outcome was relat-ed to intra capsular cataract extraction which was nine times more likely than extra capsular cataract extraction to have very poor outcome from surgery. Surgeries are performed on many patients in the same room, often without gloves is another phenomenon that perhaps contributes to the high rate of very poor outcome is the trend of “cataract surgical camps” Recent data from Nepal22 and China23 have also shown quite high rate of adverse outcome after cataract surgery in similar cir-cumstances.
CONCLUSION: The outcome can be improved with adequate surgical skills with better facilities and better quality control and routine monitoring. The visual outcome of cataract surgery was good nearly 97%. The use of these indicators facilitates adequate management and evalu-ation of the efficiency and effectiveness of the interven-tion which can help to ensure the maximum utilization of the available resources for cataract surgery. Recommendations: Every patient should be thorough-ly examined before surgery and if the person is having other pathology, they should be informed about pos-sible poor visual outcome.. Wherever possible, careful postoperative follow up with early detection and treat-ment of postoperative complications will allow a fur-ther improvement in the outcome. Follow up on 3rd and 15th day will be very helpful.
REFERENCES1. Encarta encyclopedia: Pakistan, Microsoft Corporation 1998.2. Population and housing census of Pakistan, P-1 Census
bulletin-2. Population census organization statistical division, government of Pakistan. July 1998.
3. Bulletin of world health organization P1of2. The international journal of Public Health 1999.
4. Bulletin of world health organization p-1of2. The international journal of Public Health 1999.
5. Encarta encyclopedia: Pakistan Microsoft Corporation, 1998.6. Population and housing census of Pakistan, P-2 July 1998.
Census bulletin-1.7. Population and housing census of Pakistan, P-4 July 1998.
Census bulletin-1.8. M.SalehMemon, Survey report, Prevalence and causes of
blindness in Pakistan.P-196 J.P.M.A, August, 1992.

Ophthalmology Update Vol. 16 No.4, Oct - Dec 2018926
Visual Outcome of Cataract Surgery at Tertiary Referral Centre of Khyber Pakhtunkhwa using WHO criteria
9. Pakistan National Programme for the prevention of blindness. First five year plan, 1994-1998. Ministry of health, Islamabad, Pakistan.
10. Daud M Khan, Babar M Qureshi, Amman M Khan, facts about the status of blindness in Pakistan, Pakistan journal of ophthalmology, volume 10:39-42,April-July, 1994.
11. Tayyab Afghani, Workshop on community ophthalmology, Peshawar, Pakistan 8-10 September, 1997.P-11. Community Eye Health vol.11 issue no.25.1998.
12. District census report of Peshawar 1998. Population census organization, statistical division, government of Pakistan Islamabad.
13. Bjorn Thylefors A Global Initiative for the Elimination of Avoidable Blindness P-1. Community Eye Health vol.11 issue no.25.1998.
14. LalitDandona, What do we mean by cataract outcomes by p-35. Community Eye Health vol.13 issue no.35.2000.
15. LalitDandona, What do we mean by cataract outcomes, Community Eye Health vol.13 issue No.35.2000.
16. LalitDandona, Hans Limberg, what do we mean by cataract outcomes, P-35. Community Eye Health vol.13 issue No.35.2000.
17. Colin Cook, Hoe=w to improve the outcome of cataract surgery. P-37. Community Eye Health vol.13 issue, No.35.2000.
18. Leon B Ellwein, Cataract Surgery Outcomes: P-34. Community Eye Health vol.13 issue No.35.2000.
19. LalitDandona, Hans Limberg, what do we mean by cataract outcomes, P-35. Community Eye Health vol.13 issue No.35.2000.
20. LalitDandona, Hans Limberg, what do we mean by cataract outcomes, P-35. Community Eye Health vol.13 issue No.35.2000.
21. American Journal of ophthalmology 1999; 127:650-658.22. PokharelGP,SlevarajS,Ellwein LB. Visual functioning and quality
of life outcomes among cataract operated and un-operated blind population in Nepal. Br J Ophthalmology 1998; 82:606-610.
23. Zhao J,Sui R, Jia L Fletcher AE, Ellwein LB. Visual acuity and quality of life outcomes in patients with cataract in Shunyi country, China. Am J Ophthalmology 1998:126:515-523.
24. Lalit Dandona, Hans Limberg, what do we mean by cataract outcomes, P-35. Community Eye Health vol.13 issue No.35.2000.
**************************************GROWING MORTALITY & MORBIDITY WITH AIR & WATER POLLUTION
(Clean Air for Healthy Brain, Message on World Brain Day)
The latest annual estimation of air & water pollution are causing 9 million deaths worldwide. Most of the deaths are related to cardiac disorders, CCF, neurological strokes, lung and cancer as observed by the world Federation of Neurology on the occasion World Brain Day, as data collected from 188 countries. Air pollution, specifically, attributed to 30% of the brain strokes. The adverse effect of air-pollution is most important in low and medium income countries especially to seniors who are vulnerable with vascular diseases as risk factors. Moreover, environmental pollution has a potential risk for neurodevelopmental and neurodegenerative diseases.
**************************************

Ophthalmology Update Vol. 16 No.4, Oct - Dec 2018 927
Comparison of Post-operative Pain Scores after using 0.2% glyceryl trinitrate (GTN) Ointment & Placebo in Patients with .............
ABSTRACTObjectives: To compare the post-operative mean pain scores after using 0.2% GTN ointment and Placebo in patients with openhemorrhoidectomy.Material and Methods: This randomized control study was conducted in Surgical A unit of Khyber Teaching Hospital Peshawar, Pakistan from January 2016 to December 2016. Using non probability sampling technique, 92 patients with grade III and grade IV hemorrhoids were randomly selected through OPD and divided into two groups. Group A received 0.2% topical GTN and Group B received placebo (liquid paraffin) post-operatively after hemorrhoidectomy. The patients were followed up for mean pain scores at 7 post-operative day and data was collected.Results: A total of 92 patientswere divided in two equal groups. Male to female ratio was 1.49:1. The average age of the patients was38.97 years +13.23SD. Pain-wise distribution showed that placebo group have an average pain of 6.75+1.395SD while in GTN group it was 5.58+2.45SD with p-value = 0.032.Conclusion: Topical 0.2% GTN ointment was more effective than placebo in post- hemorrhoidectomy pain management.Key words: Mean pain, hemorrhoidectomy, GTN, Placebo
Kaleem Ullah FCPS.,MRCS,1, Shehryar Noor MBBS2 , Azam Shoaib MBBS3
Comparison of Post-operative Pain Scores after using 0.2% glyceryl trinitrate (GTN) Ointment &
Placebo in Patients with Open Hemorrhoidectomy.
Kaleem Ullah
INTRODUCTION Hemorrhoids are engorged veins in the anal canal, occurs in 3rd decade with equal prevalence in both sexes.1,2 It is the most common ano-rectal disorder that presents in surgical OPD.3,4 About 80% of the population has asymptomatic hemorrhoids and only 4.4% become symptomatic.3,5 Thus global population incidence is 4%.6 Milligan Morgan hemorrhoidectomy is most commonly practiced1,7,8 and is the gold standard for 3rd and 4th degree hemorrhoids4,9,10 but is often associated with significant postoperative complications.i.e. pain, bleeding, pruritus and anal stenosis.4,9
Most common complication of open hemorrhoidectomy is postoperative pain.5,7,8 Inadequate
pain control can cause urinary retention and requires increased opioids usage thus causing postoperative nausea and vomiting.8 Thus pain management is most bothersome complication for patients and doctors.11
-------------------------------------------------------------------------------------------Patients are advised to apply GTN ointment in post-haemorrhoidectomy cases in order to aid in pain-relief. Some patients may complain of headache which should be managed with simple analgesics. If patients complain remains with GTN ointment, still they will get benefit in pain reduction with quicker wound healing.------------------------------------------------------------------------------------------- Post hemorrhoidectomy pain is due to internal anal muscle spasm.5,8,9 Eisen hammer was the first who gave this idea.12 This spasm increases the anal pressure, and thus propagates the pain further.5,8 It is also believed that postoperative pain is due to poor and delayed wound healing.5,8,13 Internal anal sphincter (IAS) is innervated by neurons which releases nitric oxide (NO) caues relaxation of smooth muscle.5,8 Many surgical and pharmalogical interventions have been
ORIGINAL ARTICLE
-------------------------------------------------------------------------------------------1.Consultant Surgeon 2,3, Trainee Registrars-------------------------------------------------------------------------------------------Correspondence: Dr. Kaleem Ullah, Trainee Registrar, Surgical A ward Khyber Teaching Hospital Peshawar Contact: 03459451961drkaleempk@hotmail.com-------------------------------------------------------------------------------------------Received: July’2018 Accepted Sep’2018-------------------------------------------------------------------------------------------

Ophthalmology Update Vol. 16 No.4, Oct - Dec 2018928
Comparison of Post-operative Pain Scores after using 0.2% glyceryl trinitrate (GTN) Ointment & Placebo in Patients with .............
used to manage this problem.7,8,13Conceptual surgical approach i.e. internal sphincterotomy in reducing anal spasm is effective but increases the risk of incontinence, which is usually permanent.5,8,12,13 Chemical sphinterotomy is done by botulinum toxin(BTx), diltiazem, metronidazole, sucralfate and glyceryl trinitrate(GTN) ointment to alleviate postoperative pain and early wound healing.6,13 BTx is more effective but expensive.13 According to Sugimoto et al Diltiazem pain score didn’t reach statistical significance (p=0.09) and with significant side effects of itching, headache and dizziness.11 GTN temporarily paralyses the IAS thus causes decrease in anal resting pressure, increase in anodermal blood flow (an effect that has been translated from thechemical sphincterotomy done for the treatment of analfissure.13) and thus aiding in rapid wound healing which reduces postoperative pain.5,8GTN ointment is most easily available.8 It has systemic side effects like headache and dizziness.5 But low dose of 0.2% topical GTN ointment is unlikely to result in significant complications.5,8
According to Franceschilli. L et al pain after first week of surgery was significantly lower in GTN Group with mean VAS score of 4.1±1.8cm vs. 7.5±1.4cm (in untreated group)13 while by Sileri P et al GTN treated group had significantly lesspain during the first week after hemorrhoidectomy (3.9±2.1cm vs. 5.3±2cm expressed as mean VAS score).14
Over the last few years there is increasing attention on surgical procedures to treat hemorrhoids but none of them proved to reduce post operative pain . Pain management isconstantly under debate, fearful for the patient and challenging for the surgeons. The rationale of this study is to evaluate the exact efficacy of GTN ointment in postoperative pain management and to provide local data as much of the local data is not available. This will help us to improve our facts and figures and will also help surgeons to manage post hemorrhoidectomy pain effectively.Patients are advised to apply GTN ointment in post-haemorrhoidectomy cases in order to aid in pain-relief. Some patients may complain of headache which should be managed with simple analgesics. If patients complain remains with GTN ointment, still they will get benefit in pain reduction with quicker wound healing.
MATERIALS AND METHODS This randomized control study was conducted in surgical department of Khyber Teaching Hospital Peshawar, from January 2016 to December 2016., total duration of study was one year. Ninety two patients with grade III and grade IV hemorrhoids were randomly selected through OPD. These patients were divided into 2 groups by simple random sampling
technique into group A and B; to them 0.2% topical GTN or placebo (paraffin) was given post-operatively and respectively. All the patients aged 18-60 years of either gender who underwent open hemorrhoidectomy for 3rd(hemorrhoids that have to be reduced manually) and 4th degree (prolapsed hemorrhoids that cannot be reduced manually), hemorrhoids were included in the study. Patients with any concomitant peri-anal pathology like fissure, fistula, rectal prolapse and those with recurrent hemorrhoids were excluded. The study design was approved by the ethical committee of Khyber Teaching Hospital. All the patients with 3rd and 4th degree hemorrhoids diagnosed by per rectal examination and anoscopy, were admitted through OPD. Informed consent was taken from all the patients regarding his/her participation in the study and explaining the purpose that the study was done purely for research and data publication. All the patients were subjected to detailed history and clinical examination followed by routine pre-operative investigations. All patients were divided randomly into Group A (with 0.2% GTN) and Group B (placebo) by table of random numbers. All the patients were put on OT list and underwent open Milligan and Morgan hemorrhoidectomy. They were prescribed post operatively with metronidazole, stool softeners analgesics (diclofenac sodium 50 mg TDS), sitzbaths and 0.2% GTN/placebo (according to the assigned group to apply in anal region thricea day with the tip of index finger) and were called for followup after one week postoperatively. Patients were checked for pain according toVisual Analogue Scale from 0 to 10cm on 7th post-operative day. (A score of 1 to 3cmmeans mild pain, 4 to 7cmmeans moderate pain and more than 7cm means severe pain.) Data wascollected on a specifically designed proforma. It included biographical data of the patient and Visual Analogue Scale. Data obtained were analyzed using statistical package for Social Sciences version 20.0. Frequencies and percentages were calculated for categorical variables like gender. Numerical variables like age and pain were presented as mean±SD. Student t-test was used to compare the mean pain score on7th post- operative day between the two groups while keeping p - value<0.05 as significant. Mean post operative pain was stratified among age and gender to see the effect modification. All data were presented as tables and charts/graphs.
RESULTS Among 92 patientsundergoing open hemorrhoidectomy, there were 26(56.5%) male and 20(43.5%) female patients in placebo group. While there were 29(63%) male and 17(37%)female patients in GTN group. Overall male to female ratio was 1.49:1(Table 1). Average age was 38.58 years+124.68SD

Ophthalmology Update Vol. 16 No.4, Oct - Dec 2018 929
Comparison of Post-operative Pain Scores after using 0.2% glyceryl trinitrate (GTN) Ointment & Placebo in Patients with .............
in placebo. While 39.35 years +13.89 in GTN group The overall age of the patients was 38.97 years +13.23SD. Pain wise distribution showed that placebo group have average pain of 6.75+1.395SD while in GTN group it was 5.58+2.45SD which was significant with p-value = 0.0.032 (Table 2). Similarly when pain of the patients was stratified among gender it showed that pain was insignificant in male and female in both the groups(Table 3).Table 1.Gender wise distribution in both groups
Gender No of patients in Group A(GTN)
No of patients in Group B(Placebo)
Total
Male 2963.0%
2656.5%
5559.8%
Female 1737.0%
2043.5%
3740.2%
Total 46100%
46100%
92100%
Table 2. Comparison of Pain in both GroupsGroups Numbers Mean Std.
DeviationP-value
Group A (GTN) 46 5.5891 2.459830.032Group B
(Placebo)46 6.7543 2.67363
Table 3. Gender wise distribution of pain in both groups
Gen-der
Groups P- value
GTN Placebo
Male
No of pa-tients
Mean S t . Devi-ation
No of pa-tients
Mean St. Devia-tion
29 5.68 2.39 26 6.88 2.46 0.0723
Fe-male
17 5.44 2.65 20 6.59 2.99 0.2278
DISSCUSSION It has been estimated that in US around 10 million people suffer fromhaemorrhoids with a prevalence of around 4.4%and nearly 37 haemorrhoidectomies being performed per 100,000 people peryear.15Post-operative pain is a big problem,with studies presenting that patients need 4 to 16 days toreturn to normal daily activity. There are various surgical proceduressuch as the open haemorrhoidectomy of Milligan-Morgan orFerguson techniques for treating haemorrhoids. In addition there are also other procedureswhich are carried out with the aambition of having lowrecurrence, least post-operative pain and early return towork .16,17
Pain after hemorrhoidectomy is a common and distressingexperience for patients. It may result in late discharge, late recovery andreturn to work. Several invasive and noninvasive attemptshave been made to reduce or alleviate pain after hemorrhoidectomy.18,19,20 The origin of such pain is undetermined and seems to be multifactorial. Current theories propose that hypertonia of the internal anal sphincter isassociated with pathogenesis of anal fissure and painafter hemorrhoidectomy.18,21
Topical GTN has been shown to reduce postoperative pain and to improve wound healing.22,23 .Studies performed on the benefit oftreatment with GTN after hemorrhoidectomy have shownmixed results, with some reporting that GTN decreasedpain after open hemorrhoidectomy compared with placebo,whereas other investigators lacked power based on their lownumber of participants.24,25For example, GTN improved healingrates without improving pain in subjects in a small study of 40patients .23
These mixed results prompted a meta-analysis in 2010 thatreviewed 5 robust trials and found that the usage of GTN ointment in post–hemorrhoidectomy patients has a significant analgesic effect. It also showed that GTN ointment application significantly improve wound healing 3weeksaftersurgery.22
This meta-analysis has shown that the use ofGTN ointment in post- haemorrhoidectomy patients is statistically significant in reducing post-operative pain on days 3 and 7. It can be argued that GTNcauses relaxation of the internal anal sphincters and thus actas an analgesic. This was confirmed by Patti et alwhichshowed that Mean Resting Pressure (MRP) was initiallyelevated when measured at 5th postoperative day. This studyshowed a significantly reduced MRP on 5thpost-operative day with GTN ointment group (60 _ 20 mm Hg) whencompared to the placebo group (110 _ 10 mm Hg). 26 However, otherstudies such Khubchandani et al showed that thegroup of patients undergoing haemorrhoidectomy randomisedto lateral sphincterotomy did not have reduction in pain whencompared to those who did not have the sphincterotomy.27
Franceschilli L et al in his study of role of glyceryl trinitrate ointment after haemorrhoidectomy in 203 patients revealed that pain after first week ofsurgery was significantly lower in GTN Group with mean VASscore of 4.1±1.8cm vs. 7.5±1.4cm (in untreated group) 13 that was quite comparable to our study (5.58+2.45SD in treated group) vs (6.75+1.395SD in placebo group). Similarly in a prospective randomized study of 54 patients by Sileri P et al showed that patients treated with GTN had significantly lesspain during the first week after hemorrhoidectomy(3.9±2.1cm vs. 5.3±2cm

Ophthalmology Update Vol. 16 No.4, Oct - Dec 2018930
Comparison of Post-operative Pain Scores after using 0.2% glyceryl trinitrate (GTN) Ointment & Placebo in Patients with .............
expressed as mean VAS score).14 Like our study, this study also highlights the use of GTN in relieving post-operative pain in patients of hemorrhoidectomy
CONCLUSION It is concluded that patients can be advised to apply GTN ointment post-haemorrhoidectomy to aid in pain relief. Some patients may complain of headache which should be managed with simple analgesics. If patients remain compliant with GTN ointment, they will get benefit in post-operative pain reduction after quicker wound healing.
REFERENCES1. Khan SA, Aman Z. POST OPERATIVE OUTCOMES OF OPEN
VERSUS CLOSED HAEMORRHOIDECTOMY. Journal of Postgraduate Medical Institute (Peshawar-Pakistan). 2011 Oct 14;25(3).
2. Vysloužil K, Zbořil P, Skalický P, Vomáčková K. Effect of hemorrhoidectomy on anorectal physiology. International journal of colorectal disease. 2010 Feb 1;25(2):259-65.
3. Shanmugam V, Thaha MA, Rabindranath KS, Campbell KL, Steele RJ, Loudon MA. Systematic review of randomized trials comparing rubber band ligation with excisional haemorrhoidectomy. British journal of surgery. 2005 Dec 1;92(12):1481-7.
4. Huang HG, Re WN, Fan K, Chu H, Wang YR, Wen H. How we can improve patients’ comfort after Milligan-Morgan open haemorrhoidectomy. World Journal of Gastroenterology: WJG. 2011 Mar 21;17(11):1448.
5. Ratnasingham K, Uzzaman M, Andreani SM, Light D, Patel B. Meta-analysis of the use of glyceryltrinitrate ointment after haemorrhoidectomy as an analgesic and in promoting wound healing. International journal of surgery. 2010 Jan 1;8(8):606-11.
6. Arezzo A, Podzemny V, Pescatori M. Surgical management of hemorrhoids. State of the art. Ann ItalChir. 2011 Mar 1;82(2):163-72.
7. Joshi GP, Neugebauer EA. Evidence‐based management of pain after haemorrhoidectomy surgery. BJS. 2010 Aug 1;97(8):1155-68.
8. Uzzaman MM, Siddiqui MR. A brief literature review on the management of post-haemorrhoidectomy pain. Surgical Techniques Development. 2011 Oct 24;1(2):32.
9. De Luca S, Tomasello G, Damiano G, Palumbo V, Spinelli G, Gioviale M, Accardo F, Randazzo S, Ficarella S, LO MONTE A. The management of postoperative pain after hemorrhoidectomy: analysis of three methodics. ACTA MEDICA MEDITERRANEA. 2012;28:301-4.
10. Mukadam P, Masu S. Internal sphincterotomy as a postoperative pain relieving method in patients operated for open hemorrhoidectomy. Journal of Research in Medical and Dental Science. 2017 Mar 25;2(1):55-8.
11. Sugimoto T, Tsunoda A, Kano N, Kashiwagura Y, Hirose KI, Sasaki T. A randomized, prospective, double-blind, placebo-controlled trial of the effect of diltiazem gel on pain after hemorrhoidectomy. World journal of surgery. 2013 Oct 1;37(10):2454-7.
12. Raza MW. Haemorrhoidectomy with and without lateral internal sphinterotomy. Journal of Rawalpindi Medical College. 2013 Dec 30;17(2):189-91.
13. Franceschilli L, D’Ugo S, de Luca E, Cadeddu F, Milito G, Di Lorenzo N, Gaspari AL, Sileri P. Role of 0.4% glyceryltrinitrate
ointment after haemorrhoidectomy: results of a prospective randomised study. International journal of colorectal disease. 2013 Mar 1;28(3):365-9.
14. Sileri P, Stolfi VM, Franceschilli L, Benavoli D, Stefano D, Di Giorgio A, Angelucci GP, Gaspari A. T1628 The Role of GlycerylTrinitrate Ointment After Hemorrhoidectomy: Preliminary Results of a Prospective Randomized Study. Gastroenterology. 2010 May 1;138(5):S-882.
15. Johanson JF, Sonnenberg A. The prevalence of hemorrhoids and chronic constipation: an epidemiologic study. Gastroenterology. 1990 Feb 1;98(2):380-6.
16. Burch J, Epstein D, Baba‐Akbari Sari A, Weatherly H, Jayne D, Fox D, Woolacott N. Stapled haemorrhoidopexy for the treatment of haemorrhoids: a systematic review. Colorectal Disease. 2009 Mar 1;11(3):233-43.
17. Dal Monte PP, Tagariello C, Giordano P, Cudazzo E, Shafi A, Sarago M, Franzini M, Phillips RK. Transanalhaemorrhoidaldearterialisation: nonexcisional surgery for the treatment of haemorrhoidal disease. Techniques in coloproctology. 2007 Dec 1;11(4):333-9.
18. Carapeti EA, Kamm MA, McDonald PJ, Phillips RK. Double-blind randomised controlled trial of effect of metronidazole on pain after day-case haemorrhoidectomy. The Lancet. 1998 Jan 17;351(9097):169-72.
19. Wasvary HJ, Hain J, Mosed-Vogel M, Bendick P, Barkel DC, Klein SN. Randomized, prospective, double-blind, placebo-controlled trial of effect of nitroglycerin ointment on pain after hemorrhoidectomy. Diseases of the colon & rectum. 2001 Aug 1;44(8):1069-73.
20. Kanellos I, Zacharakis E, Christoforidis E, Angelopoulos S, Kanellos D, Pramateftakis MG, Betsis D. Usefulness of lateral internal sphincterotomy in reducing postoperative pain after open hemorrhoidectomy. World journal of surgery. 2005 Apr 1;29(4):464-8.
21. Roe AM, Bartolo DC, Vellacott KD, Locke‐Edmunds J, Mortensen NJ. Submucosal versus ligation excision haemorrhoidectomy: a comparison of anal sensation, anal sphincter manometry and postoperative pain and function. BJS. 1987 Oct 1;74(10):948-51.
22. Ratnasingham K, Uzzaman M, Andreani SM, Light D, Patel B. Meta-analysis of the use of glyceryltrinitrate ointment after haemorrhoidectomy as an analgesic and in promoting wound healing. International journal of surgery. 2010 Jan 1;8(8):606-11.
23. Tan KY, Sng KK, Tay KH, Lai JH, Eu KW. Randomized clinical trial of 0· 2 per cent glyceryltrinitrate ointment for wound healing and pain reduction after open diathermy haemorrhoidectomy. BJS. 2006 Dec 1;93(12):1464-8.
24. Karanlik H, Akturk R, Camlica H, Asoglu O. The effect of glyceryltrinitrate ointment on posthemorrhoidectomy pain and wound healing: results of a randomized, double-blind, placebo-controlled study. Diseases of the Colon & Rectum. 2009 Feb 1;52(2):280-5.
25. Hwang DY, Yoon SG, Kim HS, Lee JK, Kim KY. Effect of 0.2 percent glyceryltrinitrate ointment on wound healing after a hemorrhoidectomy. Diseases of the colon & rectum. 2003 Jul 1;46(7):950-4.
26. Patti R, Arcara M, Padronaggio D, Bonventre S, Angileri M, Salerno R, Romano P, Buscemi S, Di Vita G. Efficacy of topical use of 0.2% glyceryltrinitrate in reducing post-haemorrhoidectomy pain and improving wound healing. Chirurgiaitaliana. 2005;57(1):77-85.
27. Khubchandani IT. Internal sphincterotomy with hemorrhoidectomy does not relieve pain. Diseases of the colon & rectum. 2002 Nov 1;45(11):1452-7.

Ophthalmology Update Vol. 16 No.4, Oct - Dec 2018 931
Comparison of Conventional Pyodine Dressing with Hydrocolloid (Duoderm) in Diabetic Foot Ulcers in Wound Healing.
ABSTRACTObjective: To compare the efficacy of conventional pyodine dressing with duoderm dressing in diabetic foot ulcers in terms of wound healing.Methodology: This comparative study was conducted in the department of Surgery, Khyber Teaching Hospital Peshawar from January 2015 to December, 2015. Total of 179 diabetic foot ulcer patients were divided into two groups, group A having 90 patients and group B having 89 patients. The efficacy of conventional pyodine dressing (Group A) was compared with Duoderm dressing (Group B) in diabetic foot ulcer patients in terms of wound healing.Results: Among 179 patients with diabetic foot ulcer, healing rate was 74.44% in Group A (pyodine dressing) and in 80.89 % Group B (duoderm dressing) patients. Conclusion: In our population the efficacy of duoderm dressing in diabetic foot ulcer is high in terms of wound healing as compared to conventional pyodine dressing. Key words: Efficacy, pyodine, Duoderm dressing, Diabetic Foot Ulcer, Wound Healing
Shehryar Noor FCPS, MRCS1. Kaleem Ullah MBBS.,2 ZakaUllah Jan MBBSFCPS3 , Azam Shoaib MBBS4
Khyber Teaching Hospital, Peshawar
Comparison of Conventional Pyodine Dressing with Hydrocolloid (Duoderm) in Diabetic Foot Ulcers in Wound Healing.
Shehryar Noor
INTRODUCTION Diabetic foot is one of the most serious compli-cations of diabetes.1 it is also one of the preventable and curable complication. Lifetime incidence of foot ulcer in diabetes is 25%.2In United States, 60% of all lower limb amputations occurs amongst diabetics.3The term ‘Diabetic Foot’ consists of a mix of pathologies includ-ing neuropathy, microvascular disease, Charcot’s neu-ro-arthropathy, ulceration and osteomyelitis.4
Diabetic foot ultimately results in amputation if not treated properly and is associated with high mor-bidity and mortality.5 Despite prospective study of di-abetic patients admitted in efforts to control diabetes and to improve limb salvage, the number of amputa-tions performed in the united states continues to rise.6
Quality of life is poor for the patient with a chronic foot ulcer, but it is still worse after an amputation. Early recognition, Good diabetic control and modification of risk factors will reduce the number of major amputa-
tions in the diabetic foot patients.7, 8 All attempts should be made to prevent diabetic foot ulceration and to treat existing ulcers by multidisciplinary team in order to re-duce amputation rate. Even when healed, diabetic foot should be regarded as a life-long condition and should be treated accordingly to prevent recurrence.9 Gul A et all presented a study of diabetic foot disease with 200 patients with diabetic foot ulcers; 65% males and 35% females with average age of 53.40years.10
-------------------------------------------------------------------------------------------Hydrocolloid Duoderm dressing is effective in treat-ing diabetic foot ulcers and its efficacy is higher than conventional Pyodine dressing. ------------------------------------------------------------------------------------------- In a survey by WHO, it was shown that in 1995 Pakistan was 8th on the list of top ten countries with high prevalence of diabetes and there were 4.3 million people with Diabetes mellitus. However it is estimated that in the year 2025, Pakistan will be 4th on the list with 14.5 million people with this disease.11 People with diabetes are more likely to be admitted to the hospital with a foot ulcer than with any other complication and are more likely to have an amputation.12
The rationale of this study was to compare the efficacy of conventional pyodine dressing with hydro-colloid (duoderm) dressing in diabetic foot ulcers in
ORIGINAL ARTICLE
-------------------------------------------------------------------------------------------1.Consultant Surgeon,2.3,4. Trainee Registrars.-------------------------------------------------------------------------------------------Correspondence: Dr. Shehryar Noor Consultant Surgeon, Accident and emergency department Khyber Teaching Hospital Peshawar contact #03005844137Shehryar.md@gmail.com-------------------------------------------------------------------------------------------Received: August’2018 Accepted: Sep’2018-------------------------------------------------------------------------------------------

Ophthalmology Update Vol. 16 No.4, Oct - Dec 2018932
Comparison of Conventional Pyodine Dressing with Hydrocolloid (Duoderm) in Diabetic Foot Ulcers in Wound Healing.`
terms of wound healing. Studies are lacking to provide ample evidence that hydrocolloid dressing is more ef-fective dressing for diabetic foot ulcers and to provide local data as much of the local data is not available.
MATERIALS AND METHODS This randomized control study was conduct-ed over a period of one year in the department of Sur-gery, Khyber Teaching Hospital; Peshawar from Jan-uary 2015, to December, 2015. Total of 179 (122 male and 57 female ) patients were studied. Patients were divided into two groups with simple convenient meth-od. Group A having 90 patients and group B having 89 patients. All the patients with Type II diabetes mellitus having diabetic foot ulcer were included and those hav-ing osteomyelitis and gangrene of foot were excluded from this study. This study was conducted after approval from the ethical board and research committee of the Hospi-tal. All the patients meeting the inclusion criteria were admitted from out patients/emergency department and after taking informed consent for study, Patients were divided into two groups with simple convenient method. Detailed history was taken from each patient and clinical examination was performed. All baseline investigations along with HBA1c, X-ray foot, duplex ultrasound of lower limbs were done. All the patients were put on insulin peri-operatively. After surgical debridement, patients were treated with intravenous antibiotics for 3 days and were followed by oral an-tibiotics for a period of 2 weeks according to culture and sensitivity report, keeping blood sugar levels in control. Patients were advised regular wound dressing .In Group A patients wound’s dressing was done with pyodine soaked gauze and covered with a secondary dressing of dry gauze packs. Pyodine soaked dressing was changed once a day or when exudate was visible through secondary dressing. While in Group B patient’s duoderm dressing was applied and then repeated on every fifth day. Patients were followed on weekly basis for 8 weeks. Non healed patients were further subjected to dressing and debridement if needed. A final assess-ment for wound healing was made at 8 weeks or earlier if the patient’s wound healed before 8 weeks. Wounds having granulation tissue with no necrotic slough, ex-udative discharge and with negative wound culture were labeled as healed wounds. To collect the information for each patient, a study proforma was used. All the information includ-ing name, age, gender, wound healing and healing time was recorded. A strict exclusion criterion was fol-lowed. Data was analyzed by using SPSS version 20.0.
Frequency was computed for categorical variables like gender, age, healing rate and healing time.
RESULTS In total 179 patients, there were 57 (31.84%) females and 122(68.16%) male patients. Male to fe-male ratio was 2.14:1.Average age of the patients was 50.64years+9.24SD with range 35-65 years. Group A having 90 patients and group B having 89 patients. There were 64 male and 26 female patients in group A while 58 male and 31 female in group B. Healing rate was 74.44% (67) in Group A while 80.89%( 72 patients) in Group B patients.
Table 1: Gender wise distribution of the patientsGENDER MALE FEMALE TOTAL
No. of patients in group A
64(71.11%) 26(28.89%) 90(100%)
No. of patients in group B
58(65.17%) 31(34.83%) 89(100%)
Total no. of patients
122(68.16%) 57(31.84%) 179(100%)
Table 2: Age wise distribution of patients in both groups
Age In Years NO. of patients in Group A
NO. of patients in Group B
< 40 18(20%) 16(17.98%)
41-50 35(38.89%) 32(35.96%)
51-60 18(20%) 23(25.84%)
> 61 19(21.11%) 18(20.22%)
TOTAL 90(100%) 89(100%)
Table 3: Comparison of healing rate in both groups GROUP Number
of patient Healed patients
Number non-Healed patients
Total P-value
A 67(74.44%) 239(25.5%) 90(100%) 0.29
B 72(80.89%) 17(19.10%) 89(100%)
Total 139(77.65%) 40(22.34%) 179(100%)
Table.4 Comparison of healing time in both groups

Ophthalmology Update Vol. 16 No.4, Oct - Dec 2018 933
Comparison of Conventional Pyodine Dressing with Hydrocolloid (Duoderm) in Diabetic Foot Ulcers in Wound Healing.
Group Healing time Total
2-3 weeks 4-6 weeks 7-8 weeks
Group A
15(22.3%) 40(59.7%) 12(17.9%) 67(100%)
Group B
19(26.4%) 44(61.1%) 09(12.5%) 72(100%)
Total 34(24.47%) 84(60.43%) 21(15.10%) 139(100%)
DISCUSSION Foot ulcers and infections are the major sourc-es of morbidity in individuals with diabetes mellitus. Approximately 15% of individuals with diabetes de-velop foot ulcer and a significant subset will ultimately undergo amputation (14% to 24% risk with that ulcer or subsequent ulceration). It has been estimated world-wide that every 30 seconds a lower limb is lost because of diabetes and its incidence will increase due to the expected rise in type 2 diabetes in future.12
Wound dressing is an intervention with demonstrated efficacy in diabetic foot ulcers. The use of dressings reduces swelling, removes necrotic tis-sues, promotes granulation tissue and treats infections.
13 Many substances act as an antimicrobial agent and were utilized to cover wounds for thousands of years .14 In 19th century the discovery of chemical preservatives and disinfectants, gave better understanding about the nature of infection and inflammation and allowed in-creased control of wound infection.15 Pyodine is an el-ement that was discovered in 1811. It is a dark violet solid that dissolves in alcohol and potassium iodide. Its first reported use in treating wounds was by Davies in 1839.16
Duoderm is an occlusive hydrocolloid dress-ing. Hydocolloids form a gel, which provides moist environment at the wound site. The outer layer of duo-derm dressing is made of polyurethane foam which is impermeable to water, gases, vapor and bacteria.1 In current study the age of the study population ranged from 35-65 years with mean age of 50.64years+9.24SD which is younger than some reported age in literature.18 Male to female ratio was 2.14:1 in this study which is comparable with other published studies, may be due to male dominant society.10
Gul A et al presented a study of diabetic foot disease with 200 patients of diabetic foot ulcers; there were 65% males and 35% females with average age of 53.40 years. 10 In this study, males were 72.3% and 27.69% with average age 52 years. This also matches with this study regarding presentation of age and male
to female ratio.
CONCLUSION Today complications due to diabetes are not only the most prevalent, but are the most challenging issue in this era of diabetic management. In conclusion, duoderm dressing is effective in treating diabetic foot ulcers and its efficacy is higher than conventional pyo-dine dressing as concluded by our study. So, further studies are recommended.
REFERENCES1. Pendsey SP. Understanding diabetic foot. International journal
of diabetes in developing countries. 2010 Apr; 30(2):75.2. Singh N, Armstrong DG, Lipsky BA. Preventing foot ulcers in
patients with diabetes. Jama. 2005 Jan 12;293(2):217-28.3. Shabbier G, Amin S, Khattak I. Diabetic foot risk classification
in a tertiary care teaching hospital of Peshawar. Journal of Postgraduate Medical Institute (Peshawar-Pakistan). 2011 Aug 10;24(1).
4. Rathur HM, Boulton AJ. The neuropathic diabetic foot. Nature Reviews Endocrinology. 2007 Jan;3(1):14.
5. Bild DE, Selby JV, Sinnock P, Browner WS, Braveman P, Showstack JA. Lower-extremity amputation in people with diabetes: epidemiology and prevention. Diabetes care. 1989 Jan 1;12(1):24-31.
6. Memon MR, Abbasi SA, Shaikh AA. Limb salvage in diabetic foot. Rawal Medical Journal. 2012 Jul;37(3):300-3.
7. Shojaiefard A, Khorgami Z, Larijani B. Independent risk factors for amputation in diabetic foot. International journal of diabetes in developing countries. 2008 Apr;28(2):32.
8. Yusof MI, Sulaiman AR, Muslim DA. Diabetic foot complications: a two-year review of limb amputation in a Kelantanese population. Singapore medical journal. 2007 Aug;48(8):729-32.
9. Anderson JJ, Wallin KJ, Spencer L. Split thickness skin grafts for the treatment of non-healing foot and leg ulcers in patients with diabetes: a retrospective review. Diabetic foot & ankle. 2012 Jan 1;3(1):10204.
10. Gul A, Basit A, Ali SM, Ahmadani MY, Miyan Z. Role of wound classification in predicting the outcome of diabetic foot ulcer. JPMA. The Journal of the Pakistan Medical Association. 2006 Oct;56(10):444.
11. World Health Organization. The world health report 2003: shaping the future. World Health Organization; 2003.
12. Boulton AJ, Vileikyte L, Ragnarson-Tennvall G, Apelqvist J. The global burden of diabetic foot disease. The Lancet. 2005 Nov 12;366(9498):1719-24.
13. Alexiadou K, Doupis J. Management of diabetic foot ulcers. Diabetes Therapy. 2012 Dec 1;3(1):4.
14. Hugo WB. A brief history of heat and chemical preservation and disinfection. Journal of Applied Microbiology. 1991 Jul 1;71(1):9-18.
15. Cooper R. A review of the evidence for the use of topical antimicrobial agents in wound care. World wide wounds. 2004 Feb;1:1-8.
16. Lazarus GS, Cooper DM, Knighton DR, Margolis DJ, Percoraro RE, Rodeheaver G, Robson MC. Definitions and guidelines for assessment of wounds and evaluation of healing. Wound Repair and Regeneration. 1994 Jul 1;2(3):165-70.
17. Controlled R. Trial Comparing Hydrocolloid and Saline Gouze Dressings. Med J Malaysia. 1998 Dec;53(4).
18. Jan WA, Shah HU, Usman M, Khan SM, Shah NA, Sharif N. Management of diabetic foot according to Wagner’s classification and frequency of diabetic foot disease in other foot a study of 98 cases. Journal of Postgraduate Medical Institute (Peshawar-Pakistan). 2011 Aug 16;23(3).

Ophthalmology Update Vol. 16 No.4, Oct - Dec 2018934
*************************************************New Rules for Promotion of Teaching Faculty in
Medical Colleges in Pakistan.
Medical & Dental Council of Pakistan (PMDC) has announced new regulations based on research work and teaching experience for the fresh appointments as well as promotions in the medical
institutions. But for fresh appointments, the regulations will come into force from August’2018. In order to promote research , the number of mandatory original articles for various posts of Asstt. Prof.
Associate Prof and professors’ promotions have been increased. After December 31,2018, for Assistant Professors at least two original research papers in
relevant subjects will be required for initial appointment. For promotion from Assistant to Associate professor, 5 original research papers with 5 years teaching experience will be mandatory. For
promotion from Associate professor to Professor, at least 8 original research publications with 9 years of teaching experience will be required.
We need to be more focused on research work. Under the new rules , all the medical & dental institutions have been directed to establish Medical Education Department with a counseling cellwith
qualified and experienced faculty. It will play a pivotal role in steering the educational activities. The faculty of medical colleges have also been redefined with latest skills and techniques. Since the medical education is being upgraded across the globe due to which there is a need to
change the old discipline /subjects. It will also be ensured that holders of FCPS in clinical subjects will only be appointed for clinical faculty and in future, holders non-medical qualifications will not be
appointed against Basic Medical Subjects.*************************************************
*************************************************Ophthalmology Update cordially
welcomes the participants of Quetta Conference
*************************************************

Ophthalmology Update Vol. 16 No.4, Oct - Dec 2018 935
Assessment of the Frequency & Factors Leading to Amblyopia in School Children aging 5 to 15 years
ABSTRACT:Objective: To determine the frequency of amblyopia and factors leading to amblyopia in age 5 to 15 years old children in schools.Methods: A cross sectional study was conducted in different regions of Khyber Agency. The target population was school children age 5 to 15. Data were collected from September 2015 to Dec 2015. The total number of children was 1600, of whom 800 (50%) were males and 800(50%) were females. The eye examination included an assessment of eye health and presence of amblyopia noted. Results: The overall frequency of amblyopia was found 1.12%. In males it was 61.1% and in females was 38.9%. Also it was noticed that age 5 to 10 has 77.8% and age 11 to 15 has 22.2% amblyopia. Refractive error was 50%, strabismus amblyopia 50%. The frequency of mixed and stimulus deprivative amblyopia was not detected.Conclusion: Refractive errors and strabismus are commonly responsible for causing amblyopia. Key Words: Amblyopia , strabismus, refractive error, school children.
Dr Jahanzaib Khan FCPS 1, Mohammad Idris FCPS 2, Dr. Nizam M. Darwesh PhD 3,
Muhammad Haroon BVS 4 Aftab U. Rehman FCPS 5 Prof. Lal Muhammad FCPS 6
Assessment of the Frequency & Factors Leading to Amblyopia in School Children
aging 5 to 15 years.Jahanzaib
Khan
INTRODUCTION A blurred vision with normal fundi and clear optical media in both eyes called amblyopia, It is a major public health problem. Early detection of amblyogenic risk factors, such as strabismus, refractive error and anatomic obstruction can enhance early treatment and increase the chance for recovery of vision.According to a study1, amblyopia is a condition which the process of sending visual information to the visual cortex of the brain doesn’t function properly and hence a blurred image is perceived to the brain causing
blurring of vision even when all the structures of the eye are normal. In clinical practice it is defined as a difference of two lines in visual acuity between the two eyes when there is no ocular pathology and in the presence of amblyogenic factors such as strabismus, high refractive error, anisometropia2. Amblyopia usually occurs unilaterally but it can be bilateral i.e. in Case of congenital cataract3 Amblyopia is the main cause of visual defects in children .it was estimated that amblyopia effects between 2-5% of the world’s population1, It is develops during the sensitive period of visual maturation, which continues in approximately 8 years of age.4Before treating amblyopia it may be necessary to first treat the strabismus, surgery may be performed on the eye muscles to straighten the eyes. The NEI is supporting a one year follow up study to determine the percentage of amblyopia that recurs among the children who responded well to treatment as well as many other clinical studies of amblyopia at eye centers nationwide.5 Obstruction to visual axis such as cataract causes unequal clarity of the retinal images during the critical period in early childhood. -------------------------------------------------------------------------------------------
ORIGINAL ARTICLE
-------------------------------------------------------------------------------------------1.Assistant Professor ophthalmology, Institute of Medical Sciences, Khyber Medical University, Kohat.KPK2. Assistant Professor, Oph-thalmology Department, Lady Reading Hospital/MTI Peshawar. 3.
Ophthalmic Public Health Consultant Saphocare Institute of Health Research University of Bedfordshire 4.. Senior Registrar, Khalifa Gul Nawaz Teaching Hospital, Bannu 5. Principal/ Professor of Ophthal-mology, Institute of Medical Sciences, Khyber Medical University, Kohat. 6Professor of Ophthalmology & Principal, Khyber Medical University, Institute of Medical Sciences, Kohat-------------------------------------------------------------------------------------------Correspondence: Dr Jahanzaib Khan Assistant Professor Ophthalmology, Institute of Medical Sciences, Khyber Medical University, Kohat.KPK Cell No: 0334-9001847 email: [email protected] 03349231832-------------------------------------------------------------------------------------------Received: July’2018 Accepted sep’2018-------------------------------------------------------------------------------------------

Ophthalmology Update Vol. 16 No.4, Oct - Dec 2018936
The prevalence of amblyopia is higher in young age group as compare to older age children where males are more affected than females. Refractive error and strabismus is commonly responsible for causing amblyopia and adversely affects the mental and physical health as well as social outlook of amblyopes.-------------------------------------------------------------------------------------------
METHODOLOGY A cross sectional study was conducted in Tehsil Bara District Khyber Agency. The target population was school children age 5 to 15. A written request was sent to the principals of respected schools, seeking permission and selection for school based vision screening and after approval the data collections was started from September 2015 to Dec 2015. The total number of children was 1600, of whom 800 (50%) were males and 800(50%) were females. The eye examination included visual acuity, fixation pattern, refractive status, ocular alignment, motility, pupil examination, anterior and posterior segment examination, refraction and funduscopic examination were recorded. Monocular distance visual acuity (VA) was tested with and without correction with a snellen’s chart, pinhole acuity was assessed for any child with 6/18 or if there was more than 1line (5letter) difference between eyes and strabismus was defined with any child with tropia at distance or near, with or without spectacles. Unilateral amblyopia was defined, as a ≥2line difference in best VA, when <20/30 in the worse eye and with amblyogenic factors such as past or current strabismus, anisometropia (≥1.00 D difference in hyperopia, ≥3.00 difference in myopia, or ≥1.50 D difference in astigmatism), bilateral amblyopia was defined as best corrected VA (BCVA) in both eyes <20/40 in the presence of amblyogenic factors such as hyperopia >5D, myopia >8.00 D or astigmatism >2.50. Data was analysed by SPSS 17 info software.Inclusion Criteria: School children age 5 to 15 years old were included in this study.Exclusion criteria: Children below and above age (5 to 15 years), mentally retarded, uncooperative children and other pathologies were excluded. Amblyopia is a condition easily detectable by the eye examinations, requires no special tests or equipment’s, it may be unilateral or bilateral, the individual’s corrected visual acuity of 6/12 or less is marked as amblyopia. Amblyopia treatment involves the primary factors such as strabismus, refractive error or congenital cataract. The main target of research survey estimated the prevalence of amblyopia in association with refractive error, squint or visual
deprivation caused by media opacities or ptosis among school children’s at Bara Khyber agency in 4 different schools ranging from 15 to 15 years.
RESULTS The frequency of amblyopia in the selected age groups were obtained age wise, gender wise, the type of refractive error associated with amblyopia and in relation with its different types. The overall percentage of amblyopia was found 1.12% when the whole data was analysed. The frequency of amblyopia according to gender wise was found as i.e.in males it was 61.1% and females was 38.9%.
In age wise calculation it was categorised in two groups (age 5 to 10)77.8% and (age 11 to 15)22.2%.
`In relation with different types of amblyopia was found, the prevalence of refractive was 66.7%, strabismic amblyopia 33.3% and mixed and stimulus derivative amblyopia frequency were not detected.The gender wise distribution of amblyopia in age 5-15 years is 11 males(61.1%) and 7 females (38.9). The frequency of overall amblyopia is indicated in the following table is 1.25%.
Table 1.Visual acuity without assessment: (n=18)V.A-without assessment Frequency
6/6 to 6/12 26/18 to 6/36 12
6/60 and less 4Total 18
table 2.Frequency of amblyopia: (n=1600)NO Frequency PercentAMBLYOPIA YES 18 1.27
NO 1582
Total 1600 100.0
Table 3.Best Corrected Visual Acuity after assessment: (n=18) BCVA
Frequency
6/18 to 6/36Total
6/12 to 6/12 3
1518
Assessment of the Frequency & Factors Leading to Amblyopia in School Children aging 5 to 15 years

Ophthalmology Update Vol. 16 No.4, Oct - Dec 2018 937
Table 4.Laterality of Amblyopia: (n=18)Amblyopic Eye
FrequencyRight eye 5Left eye 12Both eyes 1Total 18
Table 5.Types of Amblyopia:Types Frequency
Defocused 9Deviated Amblyopia 9Total 18
Figure 1.Age distribution of Amblyopia:
A cross sectional study was conducted in Tehsil Bara District Khyber Agency. The target population was school children age 5 to 15. A written request was sent to the principals of respected schools, seeking permission and selection for school based vision screening and after approval the data collections was started from September 2015 to Dec 2015. The total number of children was 1600, of whom 800 (50%) were males and 800(50%) were females. The eye examination included visual acuity, fixation pattern, refractive status, ocular alignment, motility, pupil examination, anterior and posterior segment examination, refraction and funduscopic examination were recorded. Monocular distance visual acuity (VA) was tested with and without correction with a snellen’s chart, pinhole acuity was assessed for any child with 6/18 or if there was more than 1line (5letter) difference between eyes and strabismus was defined with any child with tropia at distance or near, with or without spectacles.
Unilateral amblyopia was defined, as a ≥2line difference in best VA, when <20/30 in the worse eye and with amblyogenic factors such as past or current strabismus, anisometropia (≥1.00 D difference in hyperopia, ≥3.00 difference in myopia, or ≥1.50 D difference in astigmatism), bilateral amblyopia was defined as best corrected VA (BCVA) in both eyes <20/40 in the presence of amblyogenic factors such as hyperopia >5D, myopia >8.00 D or astigmatism >2.50. Data was analysed by SPSS 17 info software.Inclusion Criteria: School children age 5 to 15 years old were included in this study.Exclusion criteria: Children below and above age (5 to 15 years), mentally retarded, uncooperative children and other pathologies were excluded. Amblyopia is a condition easily detectable by the eye examinations, requires no special tests or equipment’s, it may be unilateral or bilateral, the individual’s corrected visual acuity of 6/12 or less is marked as amblyopia. Amblyopia treatment involves the primary factors such as strabismus, refractive error or congenital cataract. The main target of research survey estimated the prevalence of amblyopia in association with refractive error, squint or visual deprivation caused by media opacities or ptosis among school children’s at Bara Khyber agency in 4 different schools ranging from 15 to 15 years.
DISCUSSION A global initiative for the elimination of avoidable blindness by the world health organisation(WHO), international agency or prevention of blindness (IAPB) and other partner organisation also including refractive errors among the five condition of immediate priority6
In this cross sectional study conducted in Bara Khyber Agency 18(1.12%) amblyopic patients were detected out of 1600 children through screening program. These children were assessed for distance vision with Snellen chart, those reduced visual vision, visual acuity was detected with pinhole testing but amblyopes got an improvement of no more than two lines, funduscopy and patient history was also carried out. Patients with reduced vision were prescribed spectacles and amblyopia therapy. Prevalence of amblyopia was determined at different ages with respect to its various types and according to the degree of amblyopia occurred, however it was found that most of the amblyopes were unaware of their reduced vision. Research showed that refractive error (e.g. astigmatism, spherical error and refractive error) with strabismus and amblyopia show that because of refractive changes during childhood,
Assessment of the Frequency & Factors Leading to Amblyopia in School Children aging 5 to 15 years
Ophthalmology Update Vol. 16 No.4, Oct - Dec 2018938
more than one measurement is required to determine a child’s risk of developing amblyopia or strabismus.7
this is due to the process of emmetropisation. The data was collected and analysed according to our research protocol which indicates that amblyopia is frequently found more in males (61.1%) are more pronounced with amblyopia than females (38.9%) which shows relevance with previous studies 8.9.10 conducted on amblyopia, most frequent age of amblyopia was found below 10 years, showing high prevalence.
CONCLUSION: The prevalence of amblyopia with respect to age and gender indicated that it is higher in young age group as compare to older age children and males are more affected than females. Refractive error and strabismus is commonly responsible for causing amblyopia and adversely affects the mental and physical health as well as social outlook. Recommendations: There should be a proper orthoptic clinic for the patient at eye OPD. People should be made aware of the vision importance and should be counselled about eye care services. Amblyopia Screening programs should conducted in different areas as to control and prevent the preventable diseases and In schools eye survey’s should be done to assess the visual functions in children, due to lack of health services peripheral areas should be given more importance.
REFERENCES1. Moseley Fielder A.Amblopia; A Multidisciplinary Approach
Chapter 5 Amblyopia; treatment and evaluation Author Merrick Moseley:Butterworth Heineman,2002
2. Snow don S, Stewart -Brown SL. Preschool vision screening: results of a systemic review. University of York,UK:NHS Centre for Reviews and Dissemination ;1997.(3) the eye patch club
3. Amblyopia:prevalence , natural history ,functional effects and treatment .Ann L WebbrBApp.Sc (hons) jwood PdD, School of optometry Queensland Clin Exp Optom2005:88:6:365-375
4. Adams G,Karas M, Effect of amblyopia on employment prospects .Br.J.Opthalmol.1999,83:378
5. McKee, SP., Levi, DM.,Movshon, JA. (2003). “The pattern of visual deficits in amblyopia”. J Vision 4 (5): 380–405. doi:10.1167/3.5.5. PMID 12875634.
6. Mian M. Shafique, NaeemUllah, Nadeem H. Butt, Muhammad Khalil, TayyabaGul Pak J Ophthalmol 2007, Vol. 23 No. 1
7. Wang Y, Liang YB, Sun LP, et al. Prevalence and causes of amblyopia in a rural adult population of Chinese the Handan Eye Study. Ophthalmology.2011; 118: 279-83.
8. Dandona R, Dandona L, Srinivas M, Sahare P, Narsaiah S, Munoz SR, et al. Refractive errors in children in a rural population. Invest Oph Vis Sci. 2002;43:615–22.
9. Wedner SH, Ross DA, Balera R, Kaji L, Foster A. Prevalence of eye diseases in primary school children in a rural area of Tanzania. Br J Ophthalmol. 2000;84:1291–97
10. Chia A, Lin XY, Dirani M, Gazzard G. Risk factors for strabismus and Amblyopia in young Singapore Chinese Children. Ophthalmic Epidemiology. 2013;20(3):138–47.
11. Khan SA, Shamanna B, Nuthethi R. Perceived barriers to the provision of low vision services among ophthalmologists in India. Indian J Ophthalmol. 2005;53:69–75.
12. Dandona R, Dandona L, Srinivas M, Giridhar P, Nutheti R, Rao GN. Planning Low Vision Services in India: A Population based perspective. Ophthalmology. 2002;109:1871–78.
13. Lee CE, Lee YC, Lee SY.Factors influencing the prevalence of amblyopia in children with anisometropia.Korean J Ophthalmol. 2010 Aug;24(4):225-9.
14. von Noorden GK, Campos EC, editors. Binocular vision and ocular motility: theory and management of strabismus. 6th ed. St. Louis: Mosby; 2001. pp. 246–247.
15. Leon A, Donahue SP, Morrison DG, Estes RL, Li C. The age-dependent effect of anisometropia magnitude on anisometropic amblyopia severity. J AAPOS. 2008 Apr; 12(2):150-6.
16. Lee CS, Shin MK, Paik HJ. Evaluation of factors affecting the outcome of occlusion treatment for amblyopia. J Korean Ophthalmol Soc. 2001;42:1740–1746.
17. Brendan T. Barrett, Arthur Bradley, T. Rowan CandyProg Retin Eye Res.The Relationship between Anisometropia and Amblyopia Prog Retin Eye Res. 2013 Sep; 36: 120–158.
Assessment of the Frequency & Factors Leading to Amblyopia in School Children aging 5 to 15 years

Ophthalmology Update Vol. 16 No.4, Oct - Dec 2018 939
INSTRUCTIONS TO AUTHORS
INSTRUCTIONS TO AUTHORS.
(According to PMDC rules/instructions, recently designed criteria/SOP of Higher Education Commis-sion, Islamabad and concurrent policy of Ophthalmology update, it should be strictly followed).
Aims & Scope of the Journal: The aims of the journal is to propagate the advancement of the original research work in the field of medical sciences and to encourage the young researchers/authors to embark on the latest developments in their respective fields under the strict supervision/guidance of a senior faculty/Head of the Department (preferably a full professor) in the particular subject. The journal covers the whole medical and allied professions especially Ophthalmology. All materials submitted for publication should be directly sent to Oph-thalmology Update by the principal author himself and not through any representative or any pharmaceutical organization. Please make sure that your article is originally researched and not a repetition of the documented facts already published or present in the text books. Otherwise you will be disappointed if the articles is rejected. Ethical Aspects. If articles, tables, illustrations or photographs, which have already been published are included in the articles, a letter of permission for republication ( or its excerpts) should be obtained from the author(s) as well as the editor of the journal where it was previously published. All illustrations or photographs should be sent in duplicate. Fake authorship or plagiarized research article will not be published. Articles from the genuine authorship will only be accepted. Short communications, excerpts, papers presented at a scientific meeting and not published anywhere else will not be considered as a breach of this rule. All the articles will be reviewed by external reviewers from the University/Institutions/R&D organization, other than the HEI institutions. Abstract of the original article should be in the structured form with the sub-headings i.e., objective, design, place and duration of the study, introduction, patients and methods , result, discussion/any recommen-dation and conclusion. Introduction should include the purpose and rationale of the study. The contribution of quality research articles from other universities/institutions and R&D organization pertaining to scientific and related disciplines will be accepted after due approval of the reviewers. Articles related to social sciences will not be entertained. In order to give wider readership, original research articles pertaining to most current and important topics /sub-jects will only be re-published after due permission from the editor of the respected journal and the principal author after being checked through Turnitin. Articles/research papers, already published or accepted elsewhere for publication should not be submitted for re-publication. Authors are strongly advised to submit only two research articles/papers in a year. All papers /articles are normally subjected to be examined by “Turnitin” to find any plagiarism. The similarity index of each article must be within HEC defined range of i.e.,<+19%. The processing and publication charges are Rs. 15,000/- for each article, which must be pre-paid along with the article, therefore, contributors are strongly advised After publication of the article, only one compli-mentary copy of the journal will be supplied freely to the principal author. Additional copies or co-authors can purchse te journal at the rate of Rs. 500/- each or on the exiting price. In case the article covers more than 4 pages, extra cost will be levied for printing and publication as indicated by the management from time to time. This amount caters the fee of two reviewers, cost of printing, TCS, postal and labor charges. The amount can be remitted through Bank draft, preferably on line/ bank transfer to A/C: No 145-20620- 714-126749 through Sind Bank (Code: 145, for other banks: code is 010405), Markaz F-10, Islamabad, Pakistan in the name of Ophthalmol-ogy Update and be forwarded at 267-A, St: 53, F-10/4, Islamabad. In case the articles are rejected by the reviewers, 50% of the processing charges will be refunded. The material submitted for publication should be in the form of original research, review article, short communica-tion, a case report, recent advances, new techniques, review on clinical/medical education, a letter to the editor, medical quiz, highlights, updates, news and views related to the fields of medical sciences. Author should keep one copy of the manuscript for reference and send 3 photo-copies/ or a CD of the article in MS word form to the managing editor of Ophthalmology update. Photocopies of the article are not accepted. Before submitting the article, instructions should be completely followed along with the processing fee which keeps on changing accordingly to the printing and publication cost. Since the journal is a quarterly publication, being published with utmost regularity on the 1st of the ensuing month of Jan, April, July and Octo-ber. It is, therefore, important to ensure that the article/manuscript is submitted well in time, at least a month before the publication date/last date, allowing the editorial board to get the article reviewed well in time at least a month before the publication date/last date, allowing the editorial board to get the article reviewed well

Ophthalmology Update Vol. 16 No.4, Oct - Dec 2018940
INSTRUCTIONS TO THE AUTHORS
in time. It has been noted with regret, that some authors pester the management to get the articles published within the shortest possible time which is technically not possible. Editorials are written by invitation through E. Mail>[email protected] only. Principal author should provide his photograph along with qualification, designation, place of posting of all the authors including correspondent, their fax with his E. Mail address and cell number including his post-al /corresponding address. All authors should declare the contributing role in preparing the article in terms of :1. proposed topic, basic study design, methodology, and manuscript writing2. Date collection, statistical analysis and interpretation of result.3. Literature review, referencing and quality insurer. It is extremely important to get permission from the Head of the Department of the Hospital/ or Ethical Committee, permitting the authors to conduct the study in an approved institution and under the supervision of a guide from the same institution A word for the new researchers/authors, it has been noticed that they just mail their articles soon after completing the manuscript. It is strongly advised that they should read the article repeatedly and get it checked up by his supervisor for any scientific/grammatical/computer mistakes. Improp-erly and unchecked articles will be returned to the author. All drugs and chemicals used should be identified precisely with generic names, doses and route of administration, the method and the apparatus used should be described in detail in order to establish co-relation with the results and method. The article based on dissertation be submitted as part of the requirement for fellowship, can be sent for publication after it has been approved by relevant authority for the grant of fellowship. Dissertation based article should be re-written in accordance with the instructions mentioned here. Only two tables/graphs are allowed to be incorporated in the articles if absolutely necessary. Every paper will be edited by two staff editors and finally will be reviewed by one or two senior pro-fessors /consultants /internal or external reviewers from other countries in the relevant subject. The Results should be presented in a logical sequence of the text, tables or illustrations . Only important observations should be emphasized or summarized. As for as the discussion is concerned the authors comments on the result, supported with contemporary references (in short), including arguments and analysis of identical work done by others should be mentioned briefly. A brief acknowledgement can be made at the end. Authors are strongly advised to avoid unnecessary repetitions of the subject material through tables, figures and graphs. Only two tables/graphs are allowed to be incorporated in the articles if absolutely necessary. Conclusions should be provided under separate heading, highlighting new aspects arising from the study. It should be in accordance with the study. Material printed in Ophthalmology Update is the copyright of the publisher ; no part of this publication may be reproduced without the permission of the editor/publisher and should not be published elsewhere or submitted for publication except the abstract. Material should not be stored in any retrieved system or transmitted by any other means i.e., electronic, mechanical, photo-copying , recording or otherwise without pri-or permission from the managing editor. The Editorial board makes every effort to ensure the accuracy and authenticity of the material printed in the journal. However conclusions and the statements expressed are the views of the authors and do not necessarily reflect the opinions of the Editorial Board. Publishing of advertising material does not imply any endorsement by Ophthalmology Update. It is a controlled circulation journal, en-tirely for the medical and allied professions. It does not guarantee directly or indirectly the quality and efficacy of any product or service described in the advertisement or other material, which is extremely commercial. All ideas forwarded completely reflect the individual views of the authors. A proper undertaking pertaining to the transfer of copy rights to Ophthalmology update should be signed by all the authors or at least by the corre-sponding author and be forwarded to the managing editor along with the article.
Address for correspondence: The Managing Editor , Ophthalmology Update267-A, Street: 53, Sector F-10.4, Islamabad 44000E. Mail>[email protected] website: www.Ophthalmologyupdate.com